UNITED STATES
SECURITIES AND EXCHANGE COMMISSION
Washington, D.C. 20549
FORM N-CSR
CERTIFIED SHAREHOLDER REPORT OF REGISTERED
MANAGEMENT INVESTMENT COMPANIES
Investment Company Act file number: 811-22903
J.P. Morgan Exchange-Traded Fund Trust
(Exact name of registrant as specified in charter)
277 Park Avenue
New York, NY 10172
(Address of principal executive offices) (Zip code)
Gregory S. Samuels
J.P. Morgan Investment Management Inc.
277 Park Avenue
New York, NY 10172
(Name and Address of Agent for Service)
With copies to:
| | |
Elizabeth A. Davin, Esq. JPMorgan Chase & Co. 1111 Polaris Parkway Columbus, OH 43240 | | Jon S. Rand, Esq. Dechert LLP 1095 Avenue of the Americas New York, NY 10036 |
Registrant’s telephone number, including area code: 1-844-457-6383
Date of fiscal year end: Last day of February
Date of reporting period: March 1, 2023 through February 29, 2024
Form N-CSR is to be used by management investment companies to file reports with the Commission not later than 10 days after the transmission to stockholders of any report that is required to be transmitted to stockholders under Rule 30e-1 under the Investment Company Act of 1940 (17 CFR 270.30e-1). The Commission may use the information provided on Form N-CSR in its regulatory, disclosure review, inspection, and policymaking roles.
A registrant is required to disclose the information specified by Form N-CSR, and the Commission will make this information public. A registrant is not required to respond to the collection of information contained in Form N-CSR unless the Form displays a currently valid Office of Management and Budget (“OMB”) control number. Please direct comments concerning the accuracy of the information collection burden estimate and any suggestions for reducing the burden to Secretary, Securities and Exchange Commission, 450 Fifth Street, NW, Washington, DC 20549-0609. The OMB has reviewed this collection of information under the clearance requirements of 44 U.S.C. Section 3507.
ITEM 1. REPORTS TO STOCKHOLDERS.
a.) The following is a copy of the report transmitted to shareholders pursuant to Rule 30e-1 under the Investment Company Act of 1940 (17 CFR 270.30e-1).
b.) A copy of the notice transmitted to shareholders in reliance on Rule 30e-3 under the 1940 Act that contains disclosures specified by paragraph (c)(3) of that rule is included in the Annual Reports. Not Applicable. Notices do not incorporate disclosures from the shareholder reports.
Annual Report
J.P. Morgan Exchange-Traded Funds
February 29, 2024
| | |
| | New York Stock Exchange LLC |
JPMorgan Core Plus Bond ETF | | |
| | |
JPMorgan International Bond Opportunities ETF | | |
| | |
JPMorgan Short Duration Core Plus ETF | | |
JPMorgan Ultra-Short Income ETF | | |
JPMorgan Ultra-Short Municipal Income ETF | | |
CONTENTS
Investments in a Fund are not deposits or obligations of, or guaranteed or endorsed by, any bank and are not insured or guaranteed by the FDIC, the Federal Reserve Board or any other government agency. You could lose money if you sell when a Fund’s share price is lower than when you invested.
Past performance is no guarantee of future performance. The general market views expressed in this report are opinions based on market and other conditions through the end of the reporting period and are subject to change without notice. These views are not intended to predict the future performance of a Fund or the securities markets.
Prospective investors should refer to the Funds’ prospectuses for a discussion of the Funds’ investment objectives, strategies and risks. Call J.P. Morgan Exchange-Traded Funds at (844) 457-6383 for a prospectus containing more complete information about a Fund, including management fees and other expenses. Please read it carefully before investing.
Shares are bought and sold throughout the day on an exchange at market price (not at net asset value) through a brokerage account, and are not individually subscribed and redeemed from a Fund. Shares may only be subscribed and redeemed directly from a Fund by Authorized Participants, in very large creation/redemption units. Brokerage commissions will reduce returns.
President's LetterApril 15, 2024 (Unaudited)
Dear Shareholder,
Financial markets largely rallied through the final months of 2023 and into the first quarter of 2024, as leading central banks refrained from implementing further interest rate increases. Equity markets generally outperformed bond markets for the twelve months ended February 29, 2024, led by four consecutive months of net gains in U.S. equity prices.
|
“The global economic outlook for the year ahead remains positive and financial markets appear more resilient than a year ago.” — Brian S. Shlissel
|
Economic data were stronger than many economists expected in the face of elevated interest rates throughout the year. Following weak but positive economic growth in the first half of 2023, U.S. gross domestic product increased to 4.9% in the third quarter and 3.4% growth in the final quarter of the year. While the U.S. unemployment rate rose slightly during the second half of the year, it remained below 4% for the entire 12 month period and monthly job growth data frequently surpassed the consensus forecasts of economists.
Meanwhile, the U.S. Federal Reserve (the “Fed”) continued to raise interest rates through the end of summer 2023, then settled on a benchmark lending rate range of 5.25 - 5.50% through the first quarter of 2024. The European Central Bank and the Bank of England followed similar trajectories, raising interest rates at regular intervals into the third quarter of 2023 and then holding rates at those elevated levels for the remainder of the period. Notably, the Bank of Japan raised interest rates for the first time in 17 years in mid-March 2024, ending eight years of negative interest rates and setting its benchmark rate range at 0.0 to 0.1%.
The Fed and certain other leading central banks fueled investor expectations for interest rate reductions in 2024 and growing optimism that developed market economies could enjoy a “soft landing” of positive growth coupled with relatively low unemployment.
However, there remain significant risks to the macroeconomic backdrop. Slower economic growth due to the impact of higher interest rates could leave the U.S. economy more vulnerable to potential shocks from geopolitical events, natural disasters or political turmoil, particularly taking into account the upcoming U.S. presidential election. Additionally, financial markets may also come under pressure should the Fed decide not to reduce interest rates to the extent anticipated by investors. Finally, the recent run-up in U.S. equity prices could lead to increased volatility in certain sectors of the market.
The global economic outlook for the year ahead remains positive and financial markets appear to be more resilient than a year ago. Global growth is estimated at 2.9% this year and 3.0% for 2025, with a continued decline in inflation, according to the Organization for Economic Cooperation and Development’s February 2024 forecast. However, across market cycles, we believe that those investors who hold a well-diversified portfolio and a long-term view are best positioned.
Our suite of investment solutions seeks to provide investors with the ability to build durable portfolios that meet their financial goals, regardless of macroeconomic and geopolitical uncertainties.
Sincerely,
Brian S. Shlissel
President, J.P. Morgan Exchange-Traded Funds
J.P. Morgan Asset Management
1-844-4JPM-ETF or jpmorgan.com/etfs for more information
| J.P. Morgan Exchange-Traded Funds | |
J.P. Morgan Exchange-Traded Funds
MARKET OVERVIEWTWELVE MONTHS ENDED February 29, 2024 (Unaudited)
While bond markets generally underperformed equity markets during the period, fixed income securities rallied in late 2023 as leading central banks signaled that they could begin to lower interest rates in 2024. Overall, U.S. high yield bonds (also known as junk bonds) and emerging markets debt outperformed other sectors of the bond market, and corporate debt generally outperformed U.S. Treasury bonds and other developed markets sovereign debt for the twelve months ended February 29, 2024.
Global economic growth was stronger than expected in the first quarter of 2023, but in late March, Silicon Valley Bank collapsed after management sold off the bank’s portfolio of U.S. Treasury bonds at a steep loss, which triggered a run on the bank’s deposits. While U.S. regulators moved swiftly to guarantee some deposits at the bank to prevent further contagion, depositors began withdrawing cash from First Republic Bank. At the end of April, U.S. regulators announced First Republic Bank had been closed and sold to J.P. Morgan Chase & Co. Meanwhile, the Swiss government brokered a takeover of troubled Credit Suisse by UBS Group AG. These events sharply elevated market volatility in the banking sector, particularly in U.S. regional bank stocks.
Throughout the first half of 2023, leading central banks continued to raise interest rates at regular intervals in an effort to ease inflationary pressures. By the end of summer 2023, inflation data in the U.S. and across Europe had shown significant reduction in core consumer prices. In response, the U.S. Federal Reserve, the European Central Bank and the Bank of England in separate decisions each declined to raise interest rates further during the final months of 2023.
By the start of the second half of 2023, the general consensus view of economists was that interest rates would remain elevated for an extended period, particularly in the U.S. where labor markets remained tight and economic growth was generally stronger than expected. However, at its December meeting, the U.S. Federal Reserve indicated that it was prepared to begin the process of cutting interest rates in 2024, given the trajectory of inflation data.
Global economic growth largely proved more resilient than economists’ forecasts during the period, led by expansions in the U.S., Japan, India and select emerging markets. Meanwhile, the Eurozone, U.K., China and Canada struggled with weaker growth. China’s economy faced low levels of consumer spending and business confidence, along with long-standing debt issues in the domestic property sector. Across Europe, weakness in consumer and business spending and ongoing stresses from the war in Ukraine weighed on economic growth. Notably, inflation data in the U.K. indicated that prices were declining at a somewhat slower pace than in other developed markets.
However, investor concerns about a potential economic recession receded during the period as data showed a general trend toward stability in labor markets amid declining inflation and the pivot in the policies of leading central banks. Global equity markets responded with a four-month rally through the end of February 2024. Notably, the outperformance of U.S. equity markets was led by a handful of large cap companies in the information technology and communications sectors; Apple Inc., Amazon.com Inc., Alphabet Inc., Meta Platforms Inc., Microsoft Corp., Nvidia Corp. and Tesla Inc.
For the twelve months ended February 29, 2024, the Bloomberg U.S. High Yield Corporate Index returned 11.03%; the Bloomberg Emerging Markets Index returned 7.92% and the Bloomberg U.S. Aggregate Index returned 3.33%.
| J.P. Morgan Exchange-Traded Funds | |
FUND COMMENTARYFOR THE PERIOD October 11, 2023 (FUND INCEPTION) THROUGH February 29, 2024 (Unaudited)
| |
| |
| |
Bloomberg U.S. Aggregate Index | |
Net Assets as of 2/29/2024 | |
| |
| |
INVESTMENT OBJECTIVE***
The JPMorgan Active Bond ETF (the “Fund”) seeks to deliver total return from a portfolio of investment grade intermediate- and long-term bonds.
INVESTMENT APPROACH
The Fund invests primarily in investment grade corporate bonds, U.S. Treasury obligations, including Treasury coupon strips and Treasury principal strips, other U.S. government and agency securities, and asset-backed and mortgage-backed securities. The Fund’s average weighted maturity will normally range between four and twelve years. As part of its investment approach, the adviser seeks to assess the impact of environmental, social and governance factors on many issuers in the universe in which the Fund invests.
HOW DID THE FUND PERFORM?
For the period from inception October 11, 2023 to February 29, 2024, the Fund outperformed the Bloomberg U.S. Aggregate Index (the “Index”).
Relative to the Index, the Fund’s overweight position in securitized credit, specifically non-agency mortgage-backed securities, commercial mortgage-backed securities and asset-backed securities, was a leading contributor to performance. The Fund’s underweight allocation to U.S. Treasury bonds and its security selection in corporate credit, specifically the industrials and financials sectors, also contributed to relative performance. The Fund’s longer overall duration and yield curve positioning also contributed to relative performance. Generally, bonds of longer duration will experience a greater increase in price compared with shorter duration bonds when interest rates fall.
HOW WAS THE FUND POSITIONED?
At the end of the period, the Fund’s largest allocations were to agency mortgage-backed securities and U.S. Treasury bonds,
and its smallest allocations were to commercial mortgage-backed securities and non-agency mortgage-backed securities. The Fund’s duration at the end of the period was 6.12 years.
PORTFOLIO COMPOSITION
AS OF February 29, 2024 | PERCENT OF
TOTAL
INVESTMENTS |
| |
Mortgage-Backed Securities | |
U.S. Treasury Obligations | |
| |
Collateralized Mortgage Obligations | |
Commercial Mortgage-Backed Securities | |
Others (each less than 1.0%) | |
| |
*
The return shown is based on net asset value and may differ from the return shown in the financial highlights, which reflects adjustments made to the net asset value in accordance with accounting principles generally accepted in the United States of America. The net asset value was $52.10 as of February 29, 2024.
**
Market price return was calculated assuming an initial investment made at the inception date net asset value, reinvestment of all dividends and distributions at the market price during the period, and sale at the market price on the last day of the period. The price used to calculate the market price return was the closing price on the New York Stock Exchange LLC. As of February 29, 2024, the closing price was $52.24.
***
The adviser seeks to achieve the Fund’s objective. There can be no guarantee it will be achieved.
| J.P. Morgan Exchange-Traded Funds | |
FUND COMMENTARYFOR THE PERIOD October 11, 2023 (FUND INCEPTION) THROUGH February 29, 2024 (Unaudited) (continued)
TOTAL RETURNS AS OF February 29, 2024 (Unaudited)
| | CUMULATIVE SINCE INCEPTION |
| | |
| | |
| | |
LIFE OF FUND PERFORMANCE (10/11/23 TO 2/29/24)
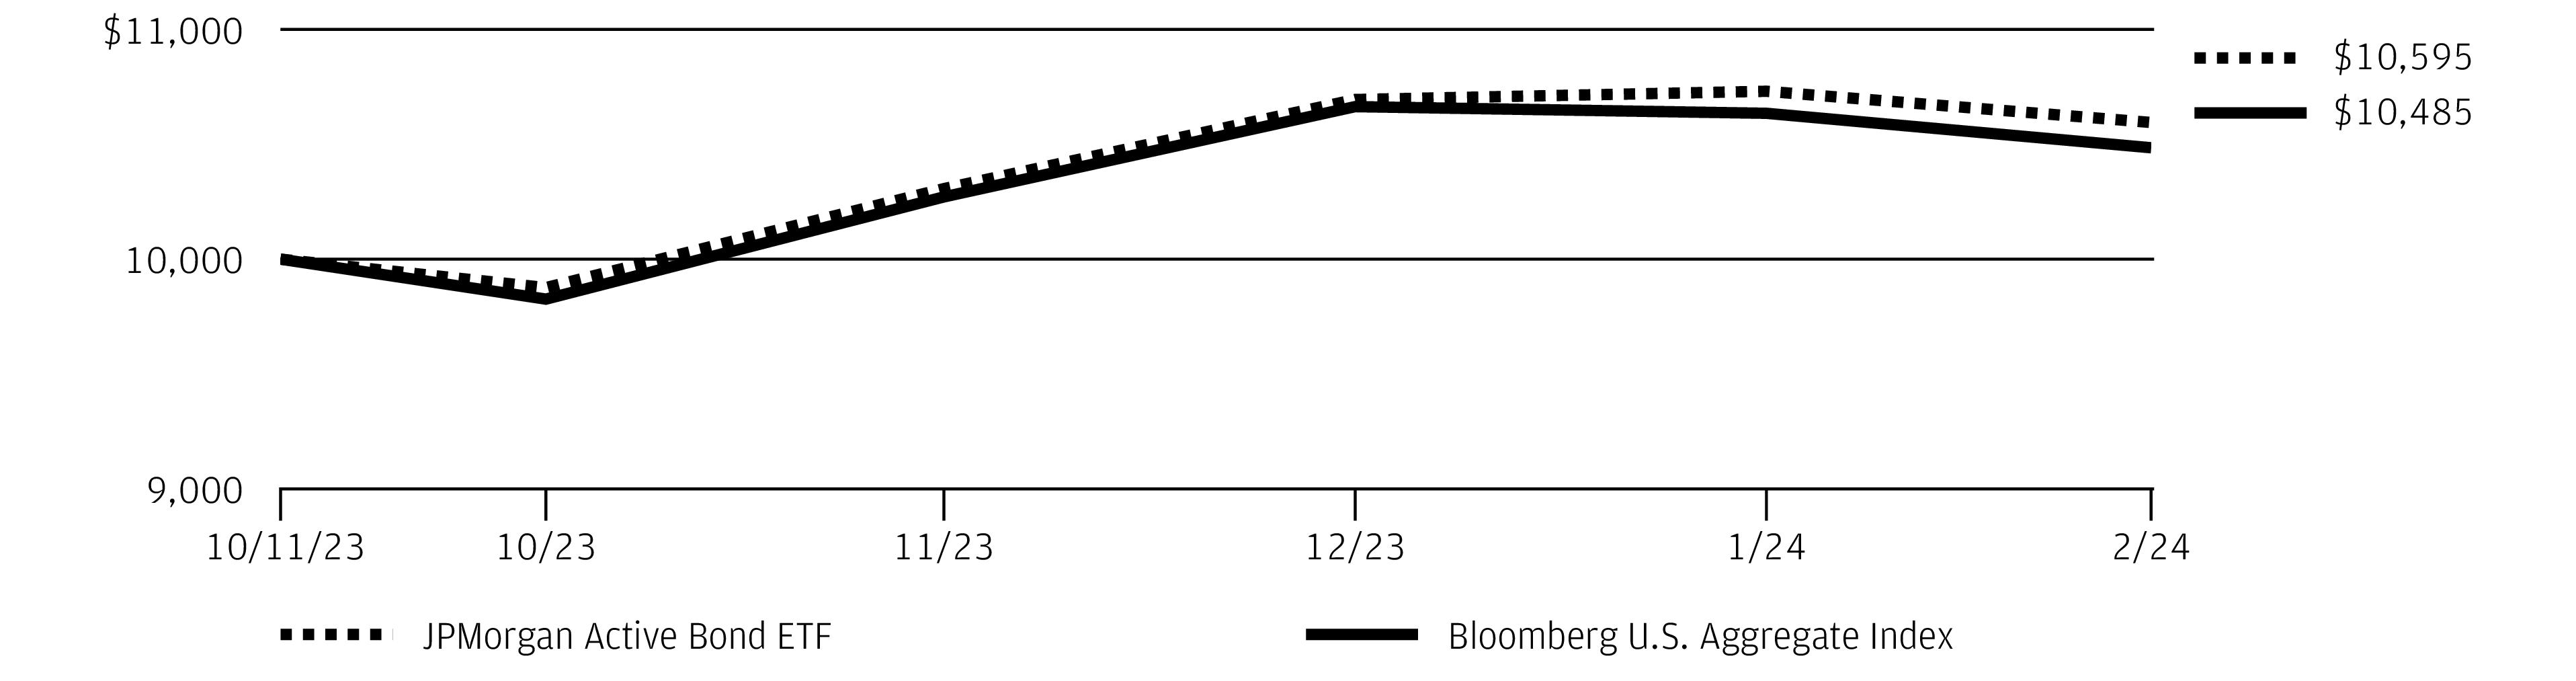
The performance quoted is past performance and is not a guarantee of future results. Exchange-traded funds are subject to certain market risks. Investment returns and principal value of an investment will fluctuate so that an investor’s shares, when sold or redeemed, may be worth more or less than their original cost. Current performance may be higher or lower than the performance data shown. Updated performance information is available by visiting www.jpmorganfunds.com or by calling 1-844-457-6383.
Fund commenced operations on October 11, 2023.
The graph illustrates comparative performance for $10,000 invested in shares of the JPMorgan Active Bond ETF and the Bloomberg U.S. Aggregate Index from October 11, 2023 to February 29, 2024. The performance of the Fund reflects the deduction of Fund expenses and assumes reinvestment of all dividends and capital gain distributions, if any. The performance of the Bloomberg U.S. Aggregate Index does not reflect the deduction of expenses associated with an exchange-traded fund and has been adjusted to reflect reinvestment of all dividends and capital gain distributions of the securities included in the Index, if applicable. The Bloomberg U.S. Aggregate Index is an unmanaged index that represents securities that are SEC-registered, taxable, and dollar denominated. The index covers the U.S. investment grade fixed rate bond market, with index components for government and corporate securities, mortgage pass-through securities, and asset-backed securities. Investors cannot invest directly in an index.
Fund performance reflects waiver of a portion of the Fund’s fees and reimbursement of expenses for certain periods from the Fund’s inception date and prior to implementation of a unitary fee structure on November 19, 2019. Without these waivers and reimbursements, performance would have been lower. Also, performance shown in this section does not reflect the deduction of taxes that a shareholder may pay on Fund distributions or on gains resulting from redemption or sale of Fund shares.
The returns shown are based on net asset values calculated for shareholder transactions and may differ from the returns shown in the financial highlights, which reflect adjustments made to the net asset values in accordance with accounting principles generally accepted in the United States of America.
Source: Bloomberg Index Services Limited. BLOOMBERG® is a trademark and service mark of Bloomberg Finance L.P. and its affiliates (collectively "Bloomberg"). Bloomberg or Bloomberg's licensors own all proprietary rights in the Bloomberg Indices. Bloomberg does not approve or endorse this material, or guarantee the accuracy or completeness of any information herein, or make any warranty, express or implied, as to the results to be obtained therefrom and, to the maximum extent allowed by law, shall have any liability or responsibility for injury or damages arising in connection therewith.
| J.P. Morgan Exchange-Traded Funds | |
JPMorgan Core Plus Bond ETF
FUND COMMENTARYTWELVE MONTHS ENDED February 29, 2024 (Unaudited)
| |
| |
| |
Bloomberg U.S. Aggregate Index | |
Net Assets as of 2/29/2024 | |
| |
| |
INVESTMENT OBJECTIVE***
The JPMorgan Core Plus Bond ETF (the “Fund”) seeks a high level of current income by investing primarily in a diversified portfolio of high-, medium- and low-grade debt securities.
WHAT WERE THE MAIN DRIVERS OF THE FUND’S PERFORMANCE?
For the twelve months ended February 29, 2024, the Fund outperformed the Bloomberg U.S. Aggregate Index (the “Benchmark”).
Relative to the Benchmark, the Fund’s overweight positions in securitized credit, including asset-backed securities, commercial mortgage-backed securities and non-agency mortgage-backed securities, and its out-of-Benchmark position in high yield corporate credit (also known as junk bonds) were leading contributors to performance. The Fund’s longer overall duration relative to the Benchmark also contributed to performance, particularly in March 2023 and December 2023 when the yields fell on 10-year US Treasury bonds. Generally, bonds of longer duration will experience a greater increase in price compared with shorter duration bonds when interest rates fall.
The Fund’s underweight position in investment grade corporate credit was a leading detractor from relative performance. The Fund’s positioning in emerging markets debt also detracted from relative performance.
HOW WAS THE FUND POSITIONED?
The Fund continued to focus on security selection and relative value, which seeks to take advantage of pricing discrepancies between individual securities or market sectors. The Fund’s portfolio managers used bottom-up research to construct, in their view, a portfolio of undervalued fixed income securities.
The managers employed a macro-economic analysis to determine asset allocation and positioning on the yield curve. The yield curve shows the relationship between yields and maturity dates for a set of similar bonds at a given point in time. During the period, the Fund’s managers decreased the Fund’s duration to 6.32 years at February 29, 2024 from 6.40 years at February 28, 2023.
PORTFOLIO COMPOSITION
AS OF February 29, 2024 | PERCENT OF
TOTAL
INVESTMENTS |
| |
Mortgage-Backed Securities | |
| |
U.S. Treasury Obligations | |
Commercial Mortgage-Backed Securities | |
Collateralized Mortgage Obligations | |
| |
Others (each less than 1.0%) | |
| |
*
The return shown is based on net asset value and may differ from the return shown in the financial highlights, which reflects adjustments made to the net asset value in accordance with accounting principles generally accepted in the United States of America. The net asset value was $46.22 as of February 29, 2024.
**
Market price return was calculated assuming an initial investment made at the market price at the beginning of the reporting period, reinvestment of all dividends and distributions at the market price during the period, and sale at the market price on the last day of the period. The price used to calculate the market price return was the closing price on the Cboe BZX Exchange, Inc. As of February 29, 2024, the closing price was $46.34.
***
The adviser seeks to achieve the Fund’s objective. There can be no guarantee it will be achieved.
| J.P. Morgan Exchange-Traded Funds | |
JPMorgan Core Plus Bond ETF
FUND COMMENTARYTWELVE MONTHS ENDED February 29, 2024 (Unaudited) (continued)
AVERAGE ANNUAL TOTAL RETURNS AS OF February 29, 2024 (Unaudited)
| | | | |
JPMorgan Core Plus Bond ETF | | | | |
| | | | |
| | | | |
LIFE OF FUND PERFORMANCE (1/28/19 TO 2/29/24)
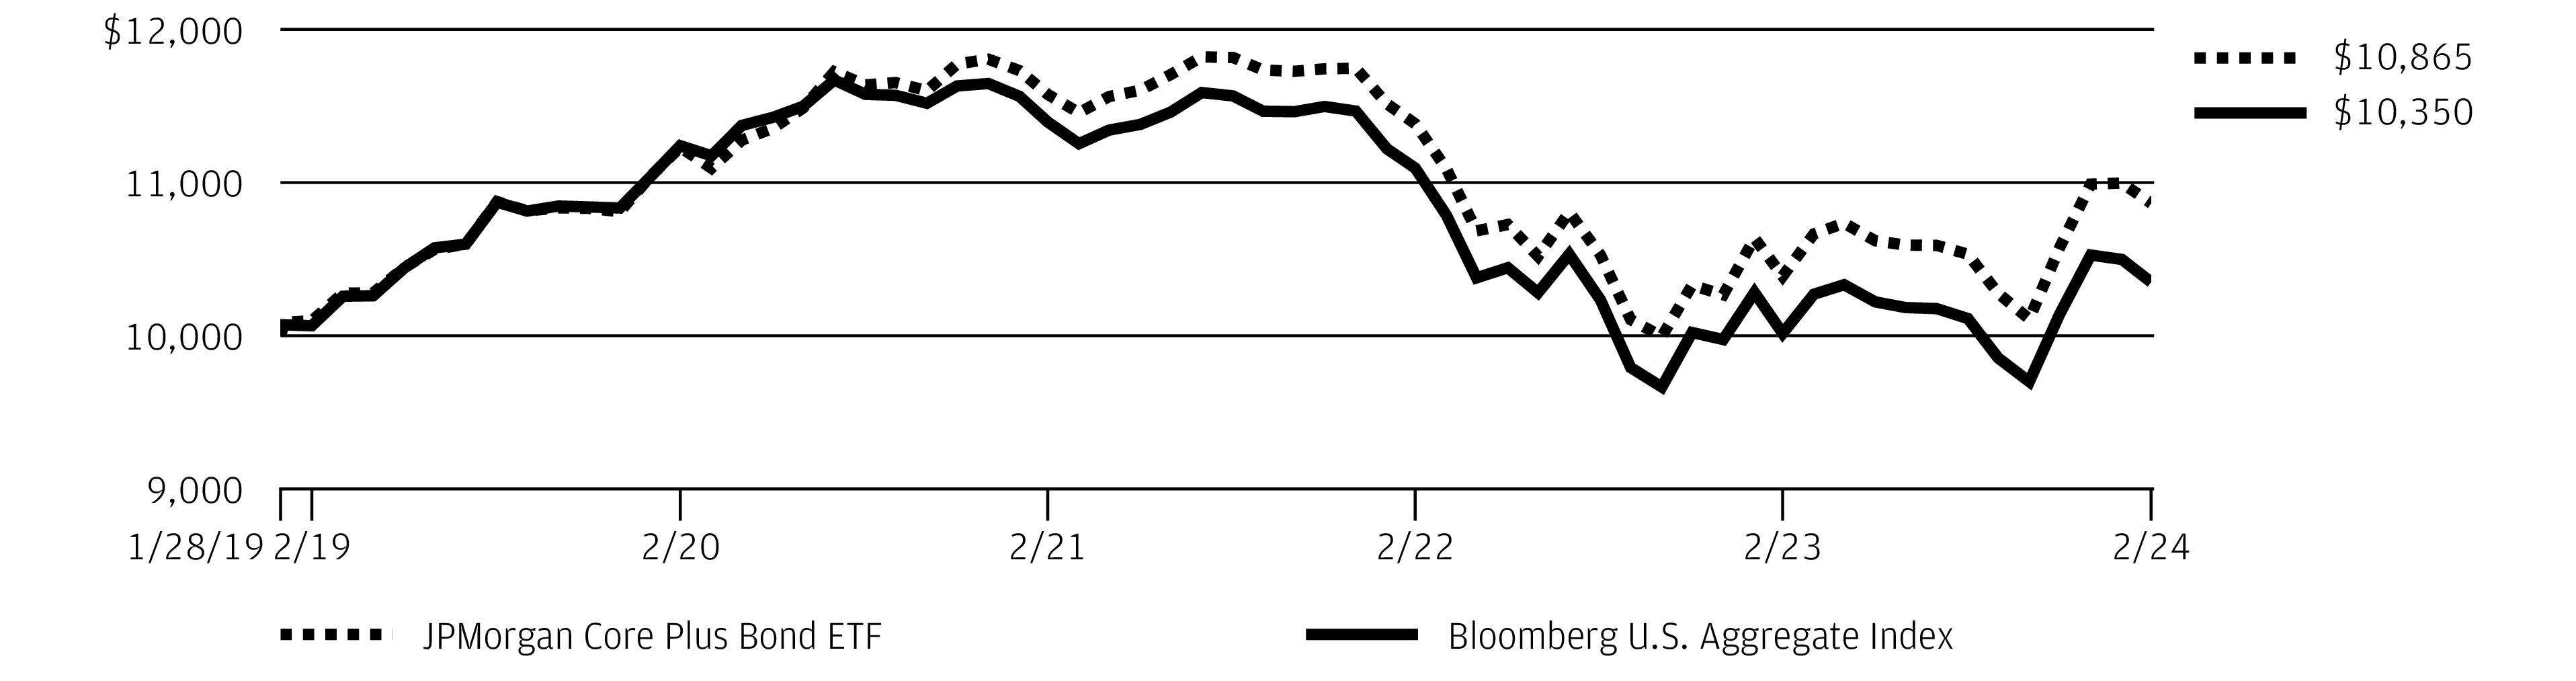
The performance quoted is past performance and is not a guarantee of future results. Exchange-traded funds are subject to certain market risks. Investment returns and principal value of an investment will fluctuate so that an investor’s shares, when sold or redeemed, may be worth more or less than their original cost. Current performance may be higher or lower than the performance data shown. Updated performance information is available by visiting www.jpmorganfunds.com or by calling 1-844-457-6383.
Fund commenced operations on January 28, 2019.
The graph illustrates comparative performance for $10,000 invested in shares of the JPMorgan Core Plus Bond ETF and the Bloomberg U.S. Aggregate Index from January 28, 2019 to February 29, 2024. The performance of the Fund reflects the deduction of Fund expenses and assumes reinvestment of all dividends and capital gain distributions, if any. The performance of the Bloomberg U.S. Aggregate Index does not reflect the deduction of expenses associated with an exchange-traded fund and has been adjusted to reflect reinvestment of all dividends and capital gain distributions of the securities included in the Index, if applicable. The Bloomberg U.S. Aggregate Index is an unmanaged index that represents securities that are SEC-registered, taxable, and dollar denominated. The index covers the U.S. investment grade fixed rate bond market, with index components for government and corporate securities, mortgage pass-through securities, and asset-backed securities. Investors cannot invest directly in an index.
Fund performance reflects waiver of a portion of the Fund’s fees and reimbursement of expenses for certain periods from the Fund’s inception date and prior to implementation of a unitary fee structure on November 19, 2019. Without these waivers and reimbursements, performance would have been lower. Also, performance shown in this section does not reflect the deduction of taxes that a shareholder may pay on Fund distributions or on gains resulting from redemption or sale of Fund shares.
The returns shown are based on net asset values calculated for shareholder transactions and may differ from the returns shown in the financial highlights, which reflect adjustments made to the net asset values in accordance with accounting principles generally accepted in the United States of America.
Source: Bloomberg Index Services Limited. BLOOMBERG® is a trademark and service mark of Bloomberg Finance L.P. and its affiliates (collectively "Bloomberg"). Bloomberg or Bloomberg's licensors own all proprietary rights in the Bloomberg Indices. Bloomberg does not approve or endorse this material, or guarantee the accuracy or completeness of any information herein, or make any warranty, express or implied, as to the results to be obtained therefrom and, to the maximum extent allowed by law, shall have any liability or responsibility for injury or damages arising in connection therewith.
| J.P. Morgan Exchange-Traded Funds | |
FUND COMMENTARYTWELVE MONTHS ENDED February 29, 2024 (Unaudited)
| |
| |
| |
Bloomberg U.S. Aggregate Index | |
Net Assets as of 2/29/2024 | |
| |
| |
INVESTMENT OBJECTIVE***
The JPMorgan Income ETF (the “Fund”) seeks to provide income with a secondary objective of capital appreciation.
INVESTMENT APPROACH
The Fund invests opportunistically in a wide variety of debt securities that have high potential to produce income and have low correlations to each other in order to manage risk. The Fund utilizes a flexible approach, shifting its allocations based on changing market conditions and seeks to manage distributions to reduce fluctuations in monthly dividends.
HOW DID THE FUND PERFORM?
For the twelve months ended February 29, 2024, the Fund generated a positive return and outperformed the Bloomberg U.S. Aggregate Index (the “Index”).
Relative to the Index, the Fund’s out-of-Index allocations to non-agency mortgage-backed securities, commercial mortgage-backed securities, emerging markets debt and high yield corporate bonds (also known as junk bonds) contributed to performance. The Fund’s U.S. Treasury securities allocation was the largest detractor from relative performance. The Fund’s underweight allocation to investment grade corporate bonds and its out-of-Index allocation to non-USD currency also detracted from relative performance.
HOW WAS THE FUND POSITIONED?
During the period, the Fund invested opportunistically among multiple debt markets and sectors that the adviser believed had a high potential to produce income. The Fund’s adviser sought to manage risk through exposure to debt markets that it believed to have low correlations to each other. During the period, the Fund’s adviser increased its allocations to agency
mortgage-backed securities and commercial mortgage-backed securities and decreased the Fund’s exposure to high yield bonds, investment grade corporate bonds and asset-backed securities.
The Fund's duration decreased to 2.91 years at February 29, 2024 from 4.11 years at February 28, 2023.
PORTFOLIO COMPOSITION
AS OF February 29, 2024 | PERCENT OF
TOTAL
INVESTMENTS |
| |
Commercial Mortgage-Backed Securities | |
Mortgage-Backed Securities | |
| |
Collateralized Mortgage Obligations | |
Foreign Government Securities | |
| |
Others (each less than 1.0%) | |
| |
*
The return shown is based on net asset value and may differ from the return shown in the financial highlights, which reflects adjustments made to the net asset value in accordance with accounting principles generally accepted in the United States of America. The net asset value was $45.17 as of February 29, 2024.
**
Market price return was calculated assuming an initial investment made at the market price at the beginning of the reporting period, reinvestment of all dividends and distributions at the market price during the period, and sale at the market price on the last day of the period. The price used to calculate the market price return was the closing price on the NYSE Arca, Inc. As of February 29, 2024, the closing price was $45.37.
***
The adviser seeks to achieve the Fund’s objective. There can be no guarantee it will be achieved.
| J.P. Morgan Exchange-Traded Funds | |
FUND COMMENTARYTWELVE MONTHS ENDED February 29, 2024 (Unaudited) (continued)
AVERAGE ANNUAL TOTAL RETURNS AS OF February 29, 2024 (Unaudited)
LIFE OF FUND PERFORMANCE (10/28/21 TO 2/29/24)
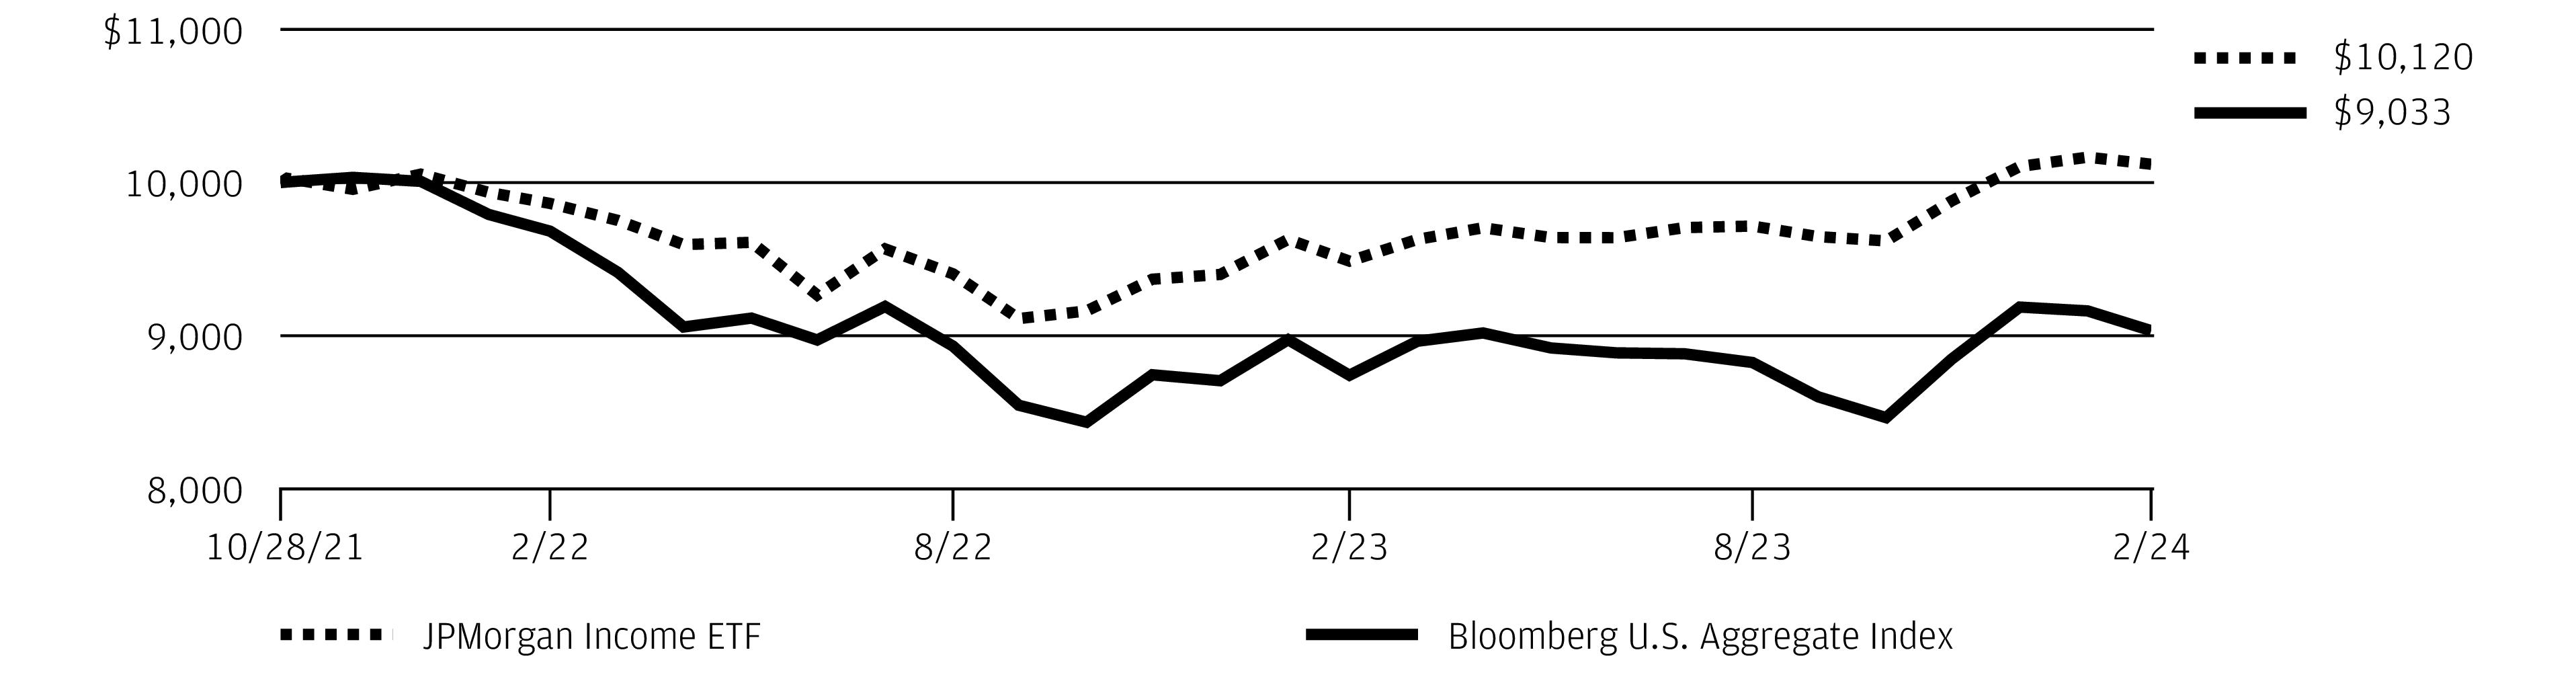
The performance quoted is past performance and is not a guarantee of future results. Exchange-traded funds are subject to certain market risks. Investment returns and principal value of an investment will fluctuate so that an investor’s shares, when sold or redeemed, may be worth more or less than their original cost. Current performance may be higher or lower than the performance data shown. Updated performance information is available by visiting www.jpmorganfunds.com or by calling 1-844-457-6383.
Fund commenced operations on October 28, 2021.
The graph illustrates comparative performance for $10,000 invested in shares of the JPMorgan Income ETF and the Bloomberg U.S. Aggregate Index from October 28, 2021 to February 29, 2024. The performance of the Fund reflects the deduction of Fund expenses and assumes reinvestment of all dividends and capital gain distributions, if any. The performance of the Bloomberg U.S. Aggregate Index does not reflect the deduction of expenses associated with an exchange-traded fund and has been adjusted to reflect reinvestment of all dividends and capital gain distributions of the securities included in the Index, if applicable. The Bloomberg U.S. Aggregate Index is an unmanaged index that represents securities that are taxable and dollar denominated. The index covers the U.S. investment grade fixed rate bond market, with index
components for government and corporate securities, mortgage pass-through
securities, and asset-backed securities. Investors cannot invest directly in an index.
Fund performance shown in this section does not reflect the deduction of taxes that a shareholder may pay on Fund distributions or on gains resulting from redemption or sale of Fund shares. The returns shown are based on net asset values calculated for shareholder transactions and may differ from the returns shown in the financial highlights, which reflect adjustments made to the net asset values in accordance with accounting principles generally accepted in the United States of America.
Source: Bloomberg Index Services Limited. BLOOMBERG® is a trademark and service mark of Bloomberg Finance L.P. and its affiliates (collectively "Bloomberg"). Bloomberg or Bloomberg's licensors own all proprietary rights in the Bloomberg Indices. Bloomberg does not approve or endorse this material, or guarantee the accuracy or completeness of any information herein, or make any warranty, express or implied, as to the results to be obtained therefrom and, to the maximum extent allowed by law, shall have any liability or responsibility for injury or damages arising in connection therewith.
| J.P. Morgan Exchange-Traded Funds | |
JPMorgan International Bond Opportunities ETF
FUND COMMENTARYTWELVE MONTHS ENDED February 29, 2024 (Unaudited)
| |
| |
| |
Bloomberg Multiverse ex-USA (USD Hedged) Index | |
Net Assets as of 2/29/2024 | |
| |
| |
INVESTMENT OBJECTIVE***
The JPMorgan International Bond Opportunities ETF (the “Fund”) seeks to provide total return.
INVESTMENT APPROACH
The Fund invests across sectors in developed and emerging markets and is without benchmark constraints. The Fund is flexible and opportunistic, and the Fund’s adviser has broad discretion to shift the Fund’s exposure to strategies, sectors, countries or currencies based on changing market conditions and its view of the best mix of investment opportunities.
HOW DID THE FUND PERFORM?
For the twelve months ended February 29, 2024, the Fund posted a positive return of 6.08%. The Fund is managed with an unconstrained orientation and is not managed relative to a benchmark index. The Fund’s benchmark is the Bloomberg Multiverse ex-USA (USD Hedged) Index, which had a return of 7.12% for the period.
In terms of absolute performance, the Fund’s allocations to securitized debt, corporate credit and emerging markets debt were leading contributors to performance. In particular, investment grade debt contributed the most to absolute performance. The Fund’s duration positioning detracted from performance as interest rates generally rose during the period. Generally, bonds of longer duration will experience a larger decrease in price compared with shorter duration bonds when interest rates rise.
HOW WAS THE FUND POSITIONED?
During the period, the Fund’s adviser increased the Fund’s exposure to emerging markets debt to 21% from 17% and increased the Fund’s exposure to investment grade credit to 38% from 37%. The Fund’s adviser decreased its allocation to high yield corporate bonds (also known as “junk bonds”) to 19% from 22% and securitized products to 2% from 5%.
The adviser increased the Fund’s overall duration to 3.80 years at February 28, 2024 from 3.49 years at February 28, 2023,
largely by moving the Fund’s short Germany government bond position to a long position and removing the short Japan government bond position.
PORTFOLIO COMPOSITION
AS OF February 29, 2024 | PERCENT OF
TOTAL
INVESTMENTS |
| |
Foreign Government Securities | |
U.S. Treasury Obligations | |
| |
Others (each less than 1.0%) | |
| |
PORTFOLIO COMPOSITION BY COUNTRY
AS OF February 29, 2024 | PERCENT OF
TOTAL
INVESTMENTS |
| |
| |
| |
| |
| |
| |
| |
| |
| |
| |
| |
| |
| |
| |
| |
| |
Others (each less than 1.0%) | |
| |
*
The return shown is based on net asset value and may differ from the return shown in the financial highlights, which reflects
| J.P. Morgan Exchange-Traded Funds | |
JPMorgan International Bond Opportunities ETF
FUND COMMENTARYTWELVE MONTHS ENDED February 29, 2024 (Unaudited) (continued)
adjustments made to the net asset value in accordance with accounting principles generally accepted in the United States of America. The net asset value was $47.23 as of February 29, 2024.
**
Market price return was calculated assuming an initial investment made at the market price at the beginning of the reporting period, reinvestment of all dividends and distributions at the market price during the period, and sale at the market price on the last day of the period. The price used to calculate the market price return was the closing price on the Cboe BZX Exchange, Inc. As of February 29, 2024, the closing price was $47.55.
***
The adviser seeks to achieve the Fund’s objective. There can be no guarantee it will be achieved.
| J.P. Morgan Exchange-Traded Funds | |
AVERAGE ANNUAL TOTAL RETURNS AS OF February 29, 2024 (Unaudited)
| | | | |
JPMorgan International Bond Opportunities ETF | | | | |
| | | | |
| | | | |
LIFE OF FUND PERFORMANCE (4/5/17 TO 2/29/24)
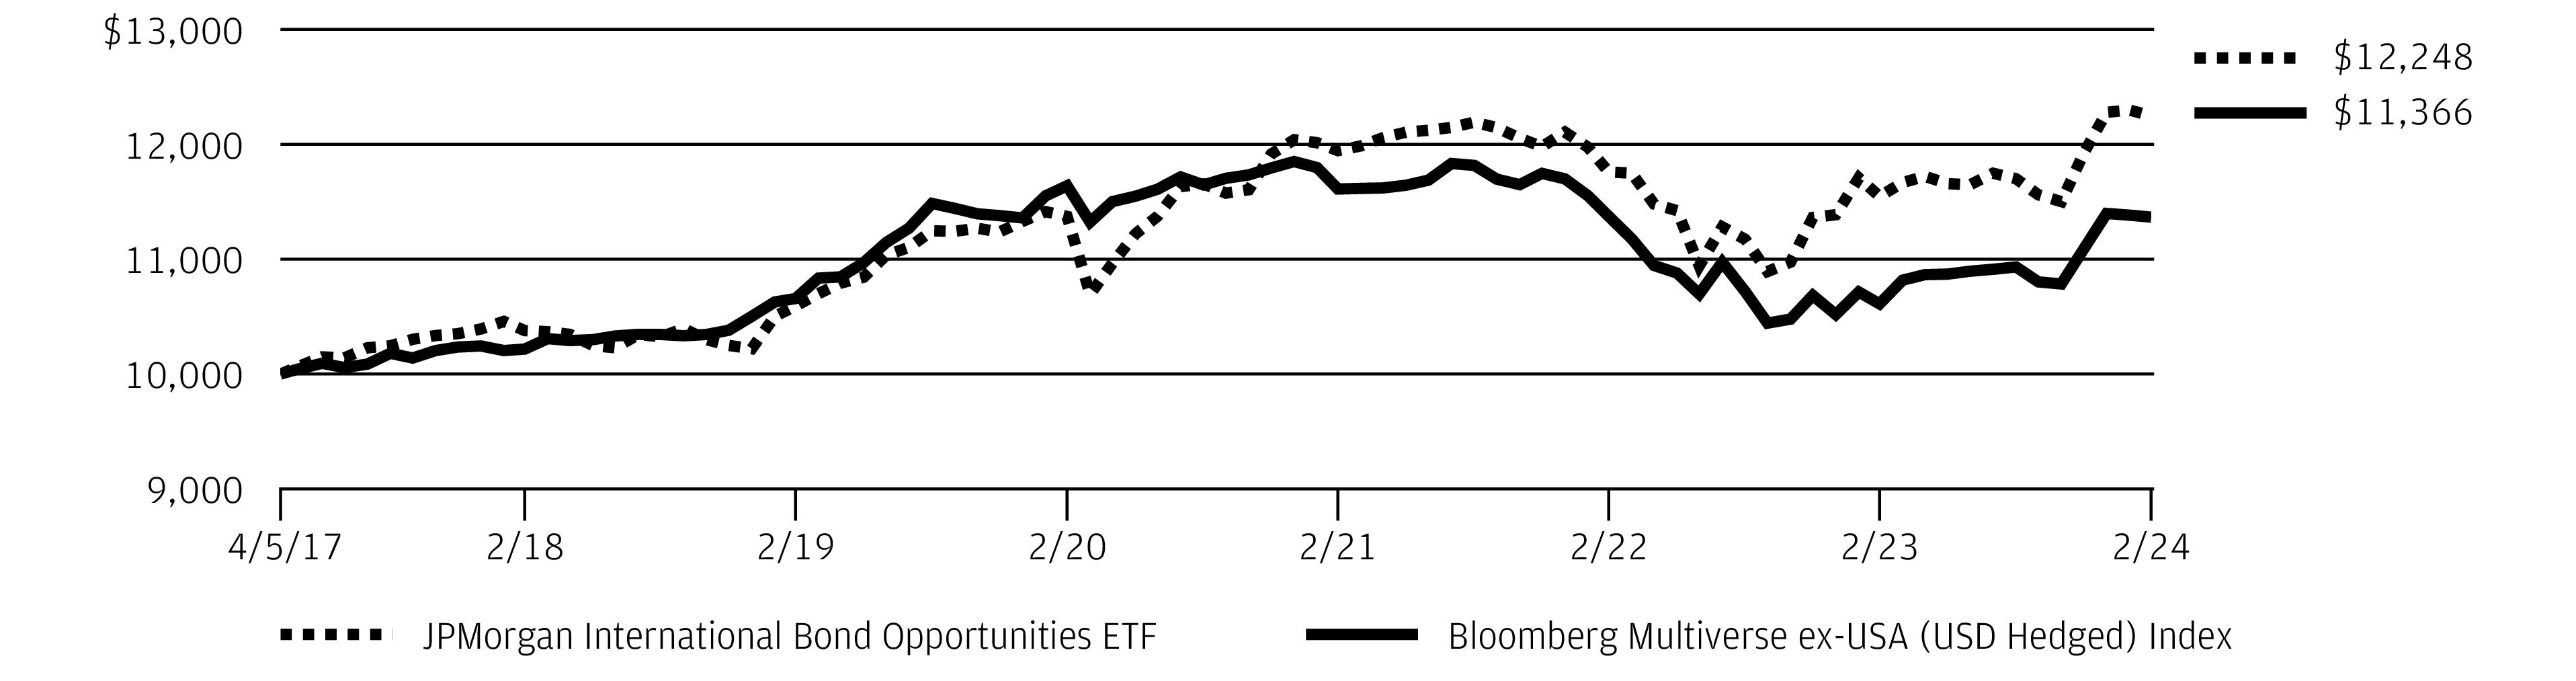
The performance quoted is past performance and is not a guarantee of future results. Exchange-traded funds are subject to certain market risks. Investment returns and principal value of an investment will fluctuate so that an investor’s shares, when sold or redeemed, may be worth more or less than their original cost. Current performance may be higher or lower than the performance data shown. Updated performance information is available by visiting www.jpmorganfunds.com or by calling 1-844-457-6383.
Fund commenced operations on April 5, 2017.
The graph illustrates comparative performance for $10,000 invested in shares of the JPMorgan International Bond Opportunities ETF and the Bloomberg Multiverse ex-USA (USD Hedged) Index from April 5, 2017 to February 29, 2024. The performance of the Fund reflects the deduction of Fund expenses and assumes reinvestment of all dividends and capital gain distributions, if any. The performance of the Bloomberg Multiverse ex-USA (USD Hedged) Index does not reflect the deduction of expenses associated with an exchange-traded fund and has been adjusted to reflect reinvestment of all dividends and capital gain distributions of the securities included in the respective Index, if applicable.
The Bloomberg Multiverse ex-USA (USD Hedged) Index is a measure of the global fixed income bond market that combines the Barclays Global Aggregate Index, which measures investment-grade debt from 24 different local currency markets, and the Barclays Global High Yield Index, which measures the global
high yield fixed income markets. It excludes U.S. securities and is hedged to the U.S. dollar. Investors cannot invest directly in an index.
Fund performance reflects waiver of a portion of the Fund’s fees and reimbursement of expenses for certain periods from the Fund’s inception date and prior to implementation of a unitary fee structure on November 19, 2019. Without these waivers and reimbursements, performance would have been lower. Also, performance shown in this section does not reflect the deduction of taxes that a shareholder may pay on Fund distributions or on gains resulting from redemption or sale of Fund shares.
The returns shown are based on net asset values calculated for shareholder transactions and may differ from the returns shown in the financial highlights, which reflect adjustments made to the net asset values in accordance with accounting principles generally accepted in the United States of America.
Source: Bloomberg Index Services Limited. BLOOMBERG® is a trademark and service mark of Bloomberg Finance L.P. and its affiliates (collectively "Bloomberg"). Bloomberg or Bloomberg's licensors own all proprietary rights in the Bloomberg Indices. Bloomberg does not approve or endorse this material, or guarantee the accuracy or completeness of any information herein, or make any warranty, express or implied, as to the results to be obtained therefrom and, to the maximum extent allowed by law, shall have any liability or responsibility for injury or damages arising in connection therewith.
| J.P. Morgan Exchange-Traded Funds | |
FUND COMMENTARYTWELVE MONTHS ENDED February 29, 2024 (Unaudited)
| |
| |
| |
Bloomberg U.S. 1-15 Year Blend (1-17) Municipal Bond Index | |
Net Assets as of 2/29/2024 | |
| |
| |
INVESTMENT OBJECTIVE***
The JPMorgan Municipal ETF (the “Fund”) seeks to provide monthly dividends, which are excluded from gross income, and to protect the value of your investment by investing primarily in municipal obligations. For purposes of the Fund’s investment objective, “gross income” means gross income for federal income tax purposes.
INVESTMENT APPROACH
The Fund invests primarily in a portfolio of municipal securities, the income from which is exempt from federal income tax. The Fund seeks to maintain an average dollar weighted maturity between three and twelve years.
HOW DID THE FUND PERFORM?
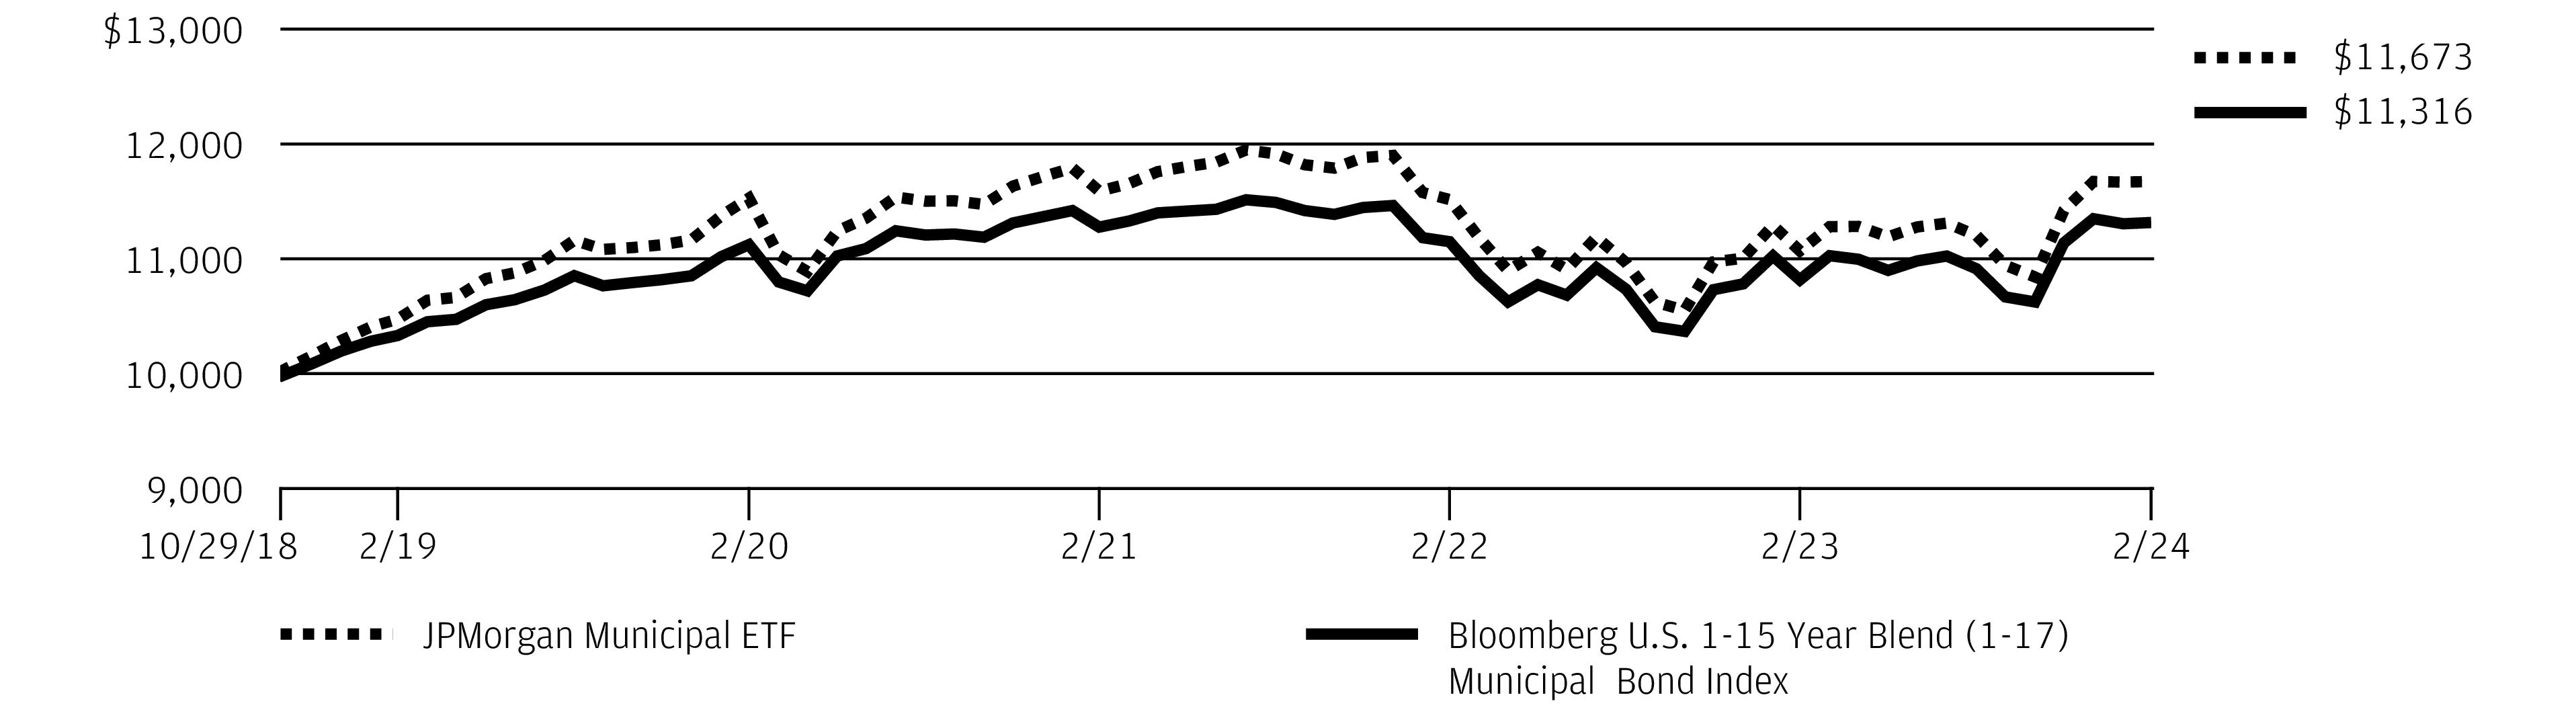
For the twelve months ended February 29, 2024, the Fund outperformed the Bloomberg U.S. 1-15 Year Blend (1-17) Municipal Bond Index (the “Index”).
Relative to the Index, the Fund’s overall longer duration was a leading contributor to performance as interest rates fell during the second half of the period. Generally, bonds of longer duration will experience a larger increase in price compared with shorter duration bonds when interest rates fall. The Fund’s overweight position in the industrial development revenue/pollution control revenue bonds sector and its overweight allocation to bonds rated single-A and BBB also contributed to relative performance as lower rated bonds generally outperformed higher rated bonds during the period.
The Fund’s underweight position in the leasing sector and its allocation to credit default swaps were leading detractors from performance relative to the Index.
HOW WAS THE FUND POSITIONED?
At the end of the period, the Fund was overweight in bonds rated BBB. The Fund’s duration was 5.6 years compared with 4.6 years for the Index.
CREDIT QUALITY ALLOCATIONS
AS OF FEBRUARY 29, 2024 | PERCENT OF
TOTAL
INVESTMENTS |
| |
| |
| |
| |
| |
| |
*
The return shown is based on net asset value and may differ from the return shown in the financial highlights, which reflects adjustments made to the net asset value in accordance with accounting principles generally accepted in the United States of America. The net asset value was $50.79 as of February 29, 2024.
**
Market price return was calculated assuming an initial investment made at the market price at the beginning of the reporting period, reinvestment of all dividends and distributions at the market price during the period, and sale at the market price on the last day of the period. The price used to calculate the market price return was the closing price on the Cboe BZX Exchange, Inc. As of February 29, 2024, the closing price was $50.84.
***
The adviser seeks to achieve the Fund’s objective. There can be no guarantee it will be achieved.
| J.P. Morgan Exchange-Traded Funds | |
AVERAGE ANNUAL TOTAL RETURNS AS OF February 29, 2024 (Unaudited)
LIFE OF FUND PERFORMANCE (10/29/18 TO 2/29/24)
The performance quoted is past performance and is not a guarantee of future results. Exchange-traded funds are subject to certain market risks. Investment returns and principal value of an investment will fluctuate so that an investor’s shares, when sold or redeemed, may be worth more or less than their original cost. Current performance may be higher or lower than the performance data shown. Updated performance information is available by visiting www.jpmorganfunds.com or by calling 1-844-457-6383.
Fund commenced operations on October 29, 2018.
The graph illustrates comparative performance for $10,000 invested in shares of the JPMorgan Municipal ETF and the Bloomberg U.S. 1-15 Year Blend (1-17) Municipal Bond Index from October 29, 2018 to February 29, 2024. The performance of the Fund reflects the deduction of Fund expenses and assumes reinvestment of all dividends and capital gain distributions, if any. The performance of the Bloomberg U.S. 1-15 Year Blend (1-17) Municipal Bond Index does not reflect the deduction of expenses associated with an exchange-traded fund and has been adjusted to reflect reinvestment of all dividends and capital gain distributions of the securities included in the Index, if applicable. The Bloomberg U.S. 1-15 Year Blend (1-17) Municipal Bond Index represents the performance of municipal bonds with maturities from 1 to 17 years.
Fund performance reflects waiver of a portion of the Fund’s fees and reimbursement of expenses for certain periods from the Fund’s inception date and prior to implementation of a unitary fee structure on November 19, 2019. Without these waivers and reimbursements, performance would have been lower. Also, performance shown in this section does not reflect the deduction of taxes that a shareholder may pay on Fund distributions or on gains resulting from redemption or sale of Fund shares.
The returns shown are based on net asset values calculated for shareholder transactions and may differ from the returns shown in the financial highlights, which reflect adjustments made to the net asset values in accordance with accounting principles generally accepted in the United States of America.
Source: Bloomberg Index Services Limited. BLOOMBERG® is a trademark and service mark of Bloomberg Finance L.P. and its affiliates (collectively "Bloomberg"). Bloomberg or Bloomberg's licensors own all proprietary rights in the Bloomberg Indices. Bloomberg does not approve or endorse this material, or guarantee the accuracy or completeness of any information herein, or make any warranty, express or implied, as to the results to be obtained therefrom and, to the maximum extent allowed by law, shall have any liability or responsibility for injury or damages arising in connection therewith.
| J.P. Morgan Exchange-Traded Funds | |
JPMorgan Short Duration Core Plus ETF
FUND COMMENTARYTWELVE MONTHS ENDED February 29, 2024 (Unaudited)
| |
| |
| |
Bloomberg 1-5 Year Government/Credit Index | |
Net Assets as of 2/29/2024 | |
| |
| |
INVESTMENT OBJECTIVE***
The JPMorgan Short Duration Core Plus ETF (the “Fund”) seeks total return, consistent with preservation of capital.
INVESTMENT APPROACH
The Fund invests primarily in traditional fixed income sectors, with the flexibility to invest up to 30% of its net assets in below investment grade securities (also known as high yield or “junk bonds”) and up to 25% of its net assets in foreign securities. The Fund’s adviser seeks to maintain a duration of three years or less. Duration is a measure of the price sensitivity of a debt security or a portfolio of debt securities to relative changes in interest rates. The adviser uses both a top down and bottom up research process as well as a combination of fundamental and quantitative inputs to allocate the Fund’s assets among a range of sectors. In buying and selling investments for the Fund, the adviser looks for market sectors and individual securities that it believes will perform well over time. The adviser selects individual securities after performing a risk/reward analysis to address the Fund’s dual objective of seeking total return and preservation of capital. Such analysis includes an evaluation of interest rate risk, credit risk, duration, liquidity, currency risk, legal provisions and the structure of the transaction.
HOW DID THE FUND PERFORM?
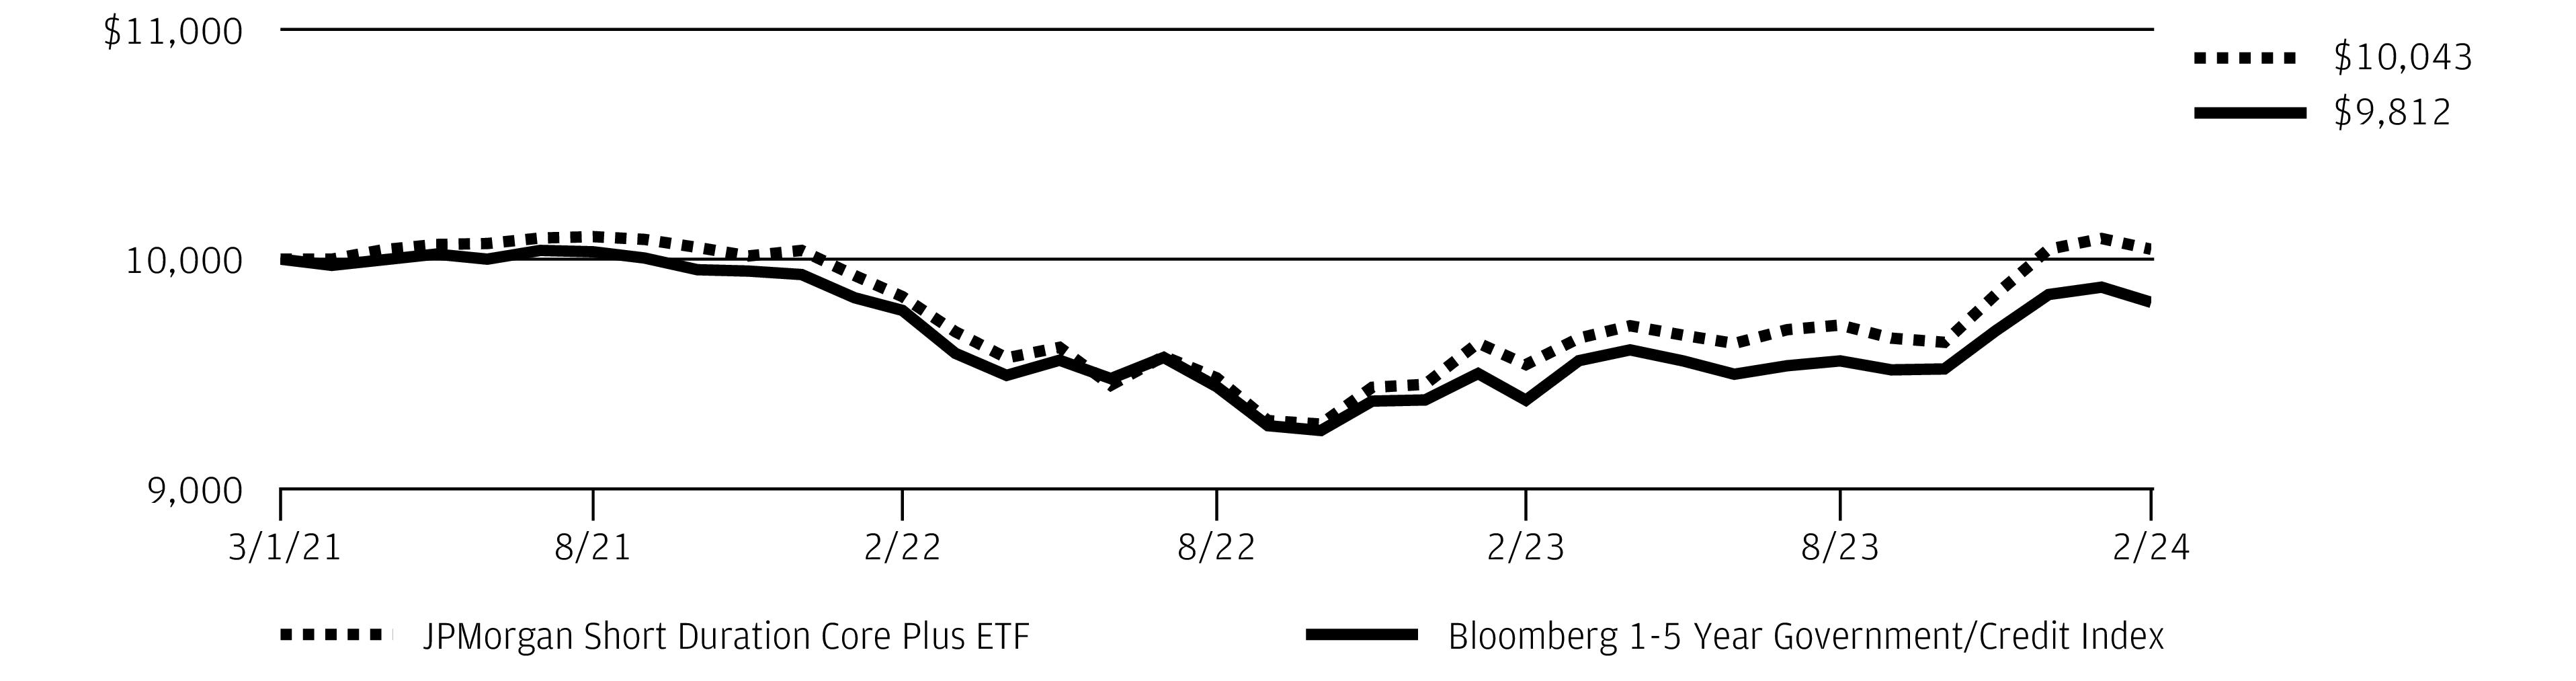
For the twelve months ended February 29, 2024, the Fund outperformed the Bloomberg 1-5 Year Government/Credit Index (the “Index”).
Relative to the Index, the Fund’s allocations to corporate bonds and asset-backed securities were leading contributors to performance. The Fund’s longer overall duration was a leading detractor from relative performance as interest rates rose during the period. Generally, bonds with longer duration will experience a larger decrease in price compared with shorter duration bonds when interest rates rise. The Fund’s allocations to mortgage-backed securities and commercial mortgage-backed securities also detracted from relative performance.
HOW WAS THE FUND POSITIONED?
The Fund’s adviser focused on security selection and relative value, which seeks to take advantage of pricing discrepancies among individual securities or market sectors. The adviser used bottom-up research to construct, in its view, a portfolio of undervalued fixed income securities. The adviser employs a macro-economic analysis to determine asset allocation and positioning on the yield curve. The yield curve shows the relationship between yields and maturity dates for a set of similar bonds at a given point in time.
Relative to the Index during the period, the Fund had an underweight position in U.S. Treasury bonds and out-of-Index allocations to mortgage-backed securities, asset-backed securities, high yield bonds (also known as junk bonds) and emerging markets debt. The Fund’s portfolio managers decreased the Fund’s duration to 2.61 years at February 29, 2024 from 2.62 years at February 28, 2023.
PORTFOLIO COMPOSITION
AS OF February 29, 2024 | PERCENT OF
TOTAL
INVESTMENTS |
| |
| |
U.S. Treasury Obligations | |
Mortgage-Backed Securities | |
Commercial Mortgage-Backed Securities | |
Collateralized Mortgage Obligations | |
Foreign Government Securities | |
Others (each less than 1.0%) | |
| |
*
The return shown is based on net asset value and may differ from the return shown in the financial highlights, which reflects adjustments made to the net asset value in accordance with accounting principles generally accepted in the United States of America. The net asset value was $46.29 as of February 29, 2024.
**
Market price return was calculated assuming an initial investment made at the market price at the beginning of the reporting period, reinvestment of all dividends and distributions at the
| J.P. Morgan Exchange-Traded Funds | |
market price during the period, and sale at the market price on the last day of the period. The price used to calculate the market price return was the closing price on the NYSE Arca, Inc. As of February 29, 2024, the closing price was $46.32.
***
The adviser seeks to achieve the Fund’s objective. There can be no guarantee it will be achieved.
****
Amount rounds to less than 0.1%.
| J.P. Morgan Exchange-Traded Funds | |
JPMorgan Short Duration Core Plus ETF
FUND COMMENTARYTWELVE MONTHS ENDED February 29, 2024 (Unaudited) (continued)
AVERAGE ANNUAL TOTAL RETURNS AS OF February 29, 2024 (Unaudited)
| | | |
JPMorgan Short Duration Core Plus ETF | | | |
| | | |
| | | |
LIFE OF FUND PERFORMANCE (3/1/21 TO 2/29/24)
The performance quoted is past performance and is not a guarantee of future results. Exchange-traded funds are subject to certain market risks. Investment returns and principal value of an investment will fluctuate so that an investor’s shares, when sold or redeemed, may be worth more or less than their original cost. Current performance may be higher or lower than the performance data shown. Updated performance information is available by visiting www.jpmorganfunds.com or by calling 1-844-457-6383.
Fund commenced operations on March 1, 2021.
The graph illustrates comparative performance for $10,000 invested in shares of the JPMorgan Short Duration Core Plus ETF and the Bloomberg 1-5 Year Government/Credit Index from March 1, 2021 to February 29, 2024. The performance of the Fund reflects the deduction of Fund expenses and assumes reinvestment of all dividends and capital gain distributions, if any. The performance of the Bloomberg 1-5 Year Government/Credit Index does not reflect the deduction of expenses associated with an exchange-traded fund and has been adjusted to reflect reinvestment of all dividends and capital gain distributions of the securities included in the Index, if applicable. The Bloomberg 1-5 Year Government/Credit Index includes the Government and Credit portions of the Barclays Aggregate for securities of 1-5 year maturities. The Government portion includes treasuries and agencies. The Credit portion
includes publicly issued U.S. corporate and foreign debentures and secured notes that meet specified maturity, liquidity, and quality requirements. Investors cannot invest directly in an index.
Fund performance shown in this section does not reflect the deduction of taxes that a shareholder may pay on Fund distributions or on gains resulting from redemption or sale of Fund shares.
The returns shown are based on net asset values calculated for shareholder transactions and may differ from the returns shown in the financial highlights, which reflect adjustments made to the net asset values in accordance with accounting principles generally accepted in the United States of America.
Source: Bloomberg Index Services Limited. BLOOMBERG® is a trademark and service mark of Bloomberg Finance L.P. and its affiliates (collectively "Bloomberg"). Bloomberg or Bloomberg's licensors own all proprietary rights in the Bloomberg Indices. Bloomberg does not approve or endorse this material, or guarantee the accuracy or completeness of any information herein, or make any warranty, express or implied, as to the results to be obtained therefrom and, to the maximum extent allowed by law, shall have any liability or responsibility for injury or damages arising in connection therewith.
| J.P. Morgan Exchange-Traded Funds | |
JPMorgan Ultra-Short Income ETF
FUND COMMENTARYTWELVE MONTHS ENDED February 29, 2024 (Unaudited)
| |
| |
| |
ICE BofA 3-Month US Treasury Bill Index | |
Net Assets as of 2/29/2024 | |
| |
| |
INVESTMENT OBJECTIVE***
The JPMorgan Ultra-Short Income ETF (the “Fund”) seeks to provide current income while seeking to maintain a low volatility of principal.
INVESTMENT APPROACH
The Fund primarily invests in investment grade, U.S. dollar-denominated short-term fixed, variable and floating-rate debt. The Fund seeks to maintain a duration of one year or less, although under certain market conditions, the Fund’s duration may be longer than one year. Duration measures the price sensitivity of a debt security or a portfolio of debt securities to relative changes in interest rates. The Fund’s adviser has broad discretion to shift the Fund’s exposure to strategies and sectors based on changing market conditions and its view of the best mix of investment opportunities.
HOW DID THE FUND PERFORM?
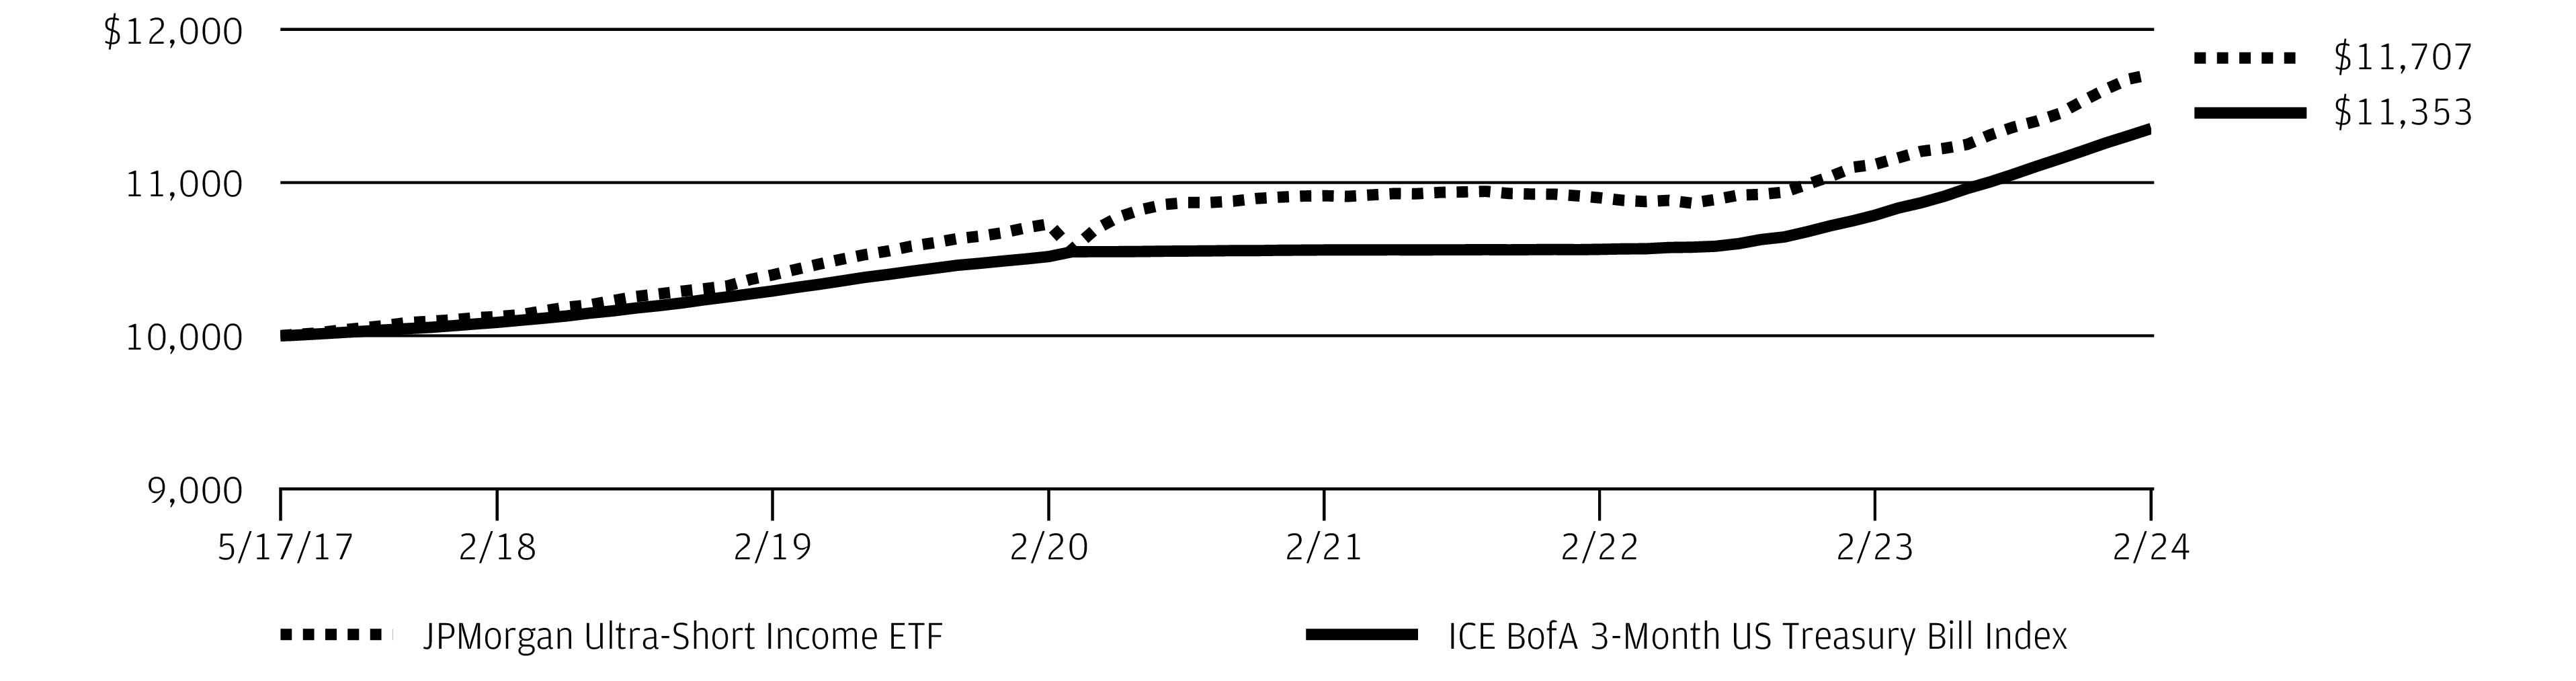
For the twelve months ended February 29, 2024, the Fund outperformed the ICE BofA 3-Month US Treasury Bill Index (the “Index”).
Relative to the Index, the Fund’s out-of-Index allocations to corporate debt, commercial paper, and certificates of deposit were leading contributors to performance amid resilience in the broader bond market and strong investor demand for investment grade credit.
The Fund’s longer duration position was a leading detractor from performance as interest rates rose and remained elevated during the period. Generally, bonds of longer duration will experience a greater decline in price compared with shorter duration bonds when interest rates rise.
HOW WAS THE FUND POSITIONED?
In descending order, the Fund’s largest allocations during the period were to corporate bonds, money market instruments,
collateralized loan obligations, asset-backed securities, U.S. Treasury securities and mortgage-backed securities.
PORTFOLIO COMPOSITION BY SECTOR
AS OF February 29, 2024 | PERCENT OF
TOTAL
INVESTMENTS |
| |
| |
| |
| |
| |
| |
| |
| |
U.S. Treasury Obligations | |
| |
| |
Others (each less than 1.0%) | |
Other Short-Term Investments | |
*
The return shown is based on net asset value and may differ from the return shown in the financial highlights, which reflects adjustments made to the net asset value in accordance with accounting principles generally accepted in the United States of America. The net asset value was $50.41 as of February 29, 2024.
**
Market price return was calculated assuming an initial investment made at the market price at the beginning of the reporting period, reinvestment of all dividends and distributions at the market price during the period, and sale at the market price on the last day of the period. The price used to calculate the market price return was the closing price on the NYSE Arca, Inc. As of February 29, 2024, the closing price was $50.44.
***
The adviser seeks to achieve the Fund’s objective. There can be no guarantee it will be achieved.
| J.P. Morgan Exchange-Traded Funds | |
JPMorgan Ultra-Short Income ETF
FUND COMMENTARYTWELVE MONTHS ENDED February 29, 2024 (Unaudited) (continued)
AVERAGE ANNUAL TOTAL RETURNS AS OF February 29, 2024 (Unaudited)
| | | | |
JPMorgan Ultra-Short Income ETF | | | | |
| | | | |
| | | | |
LIFE OF FUND PERFORMANCE (5/17/17 TO 2/29/24)
The performance quoted is past performance and is not a guarantee of future results. Exchange-traded funds are subject to certain market risks. Investment returns and principal value of an investment will fluctuate so that an investor’s shares, when sold or redeemed, may be worth more or less than their original cost. Current performance may be higher or lower than the performance data shown. Updated performance information is available by visiting www.jpmorganfunds.com or by calling 1-844-457-6383.
Fund commenced operations on May 17, 2017.
The graph illustrates comparative performance for $10,000 invested in shares of the JPMorgan Ultra-Short Income ETF and the ICE BofA 3-Month US Treasury Bill Index from May 17, 2017 to February 29, 2024. The performance of the Fund reflects the deduction of Fund expenses and assumes reinvestment of all dividends and capital gain distributions, if any. The performance of the ICE BofA 3-Month US Treasury Bill Index does not reflect the deduction of expenses associated with an exchange-traded fund and has been adjusted to reflect reinvestment of all dividends and capital gain distributions of the securities included in the Index, if applicable. The ICE BofA 3-Month US Treasury Bill Index is comprised of a single issue purchased at the beginning of the month and held for a full month. The index is rebalanced monthly and the issue selected is the outstanding Treasury Bill that matures closest to, but not beyond 3 months from the rebalancing date. Investors cannot invest directly in an index.
Fund performance reflects waiver of a portion of the Fund’s fees and reimbursement of expenses for certain periods from the Fund’s inception date and prior to implementation of a unitary fee structure on November 19, 2019. Without these waivers and reimbursements, performance would have been lower. Also, performance shown in this section does not reflect the deduction of taxes that a shareholder may pay on Fund distributions or on gains resulting from redemption or sale of Fund shares.
The returns shown are based on net asset values calculated for shareholder transactions and may differ from the returns shown in the financial highlights, which reflect adjustments made to the net asset values in accordance with accounting principles generally accepted in the United States of America.
Source ICE Data Indices, LLC is used with permission. ICE® is a registered trademark of ICE Data Indices, LLC or its affiliates and BofA® is a registered trademark of Bank of America Corporation licensed by Bank of America Corporation and its affiliates ("BofA"), and may not be used without BofA's prior written approval. The index data referenced herein is the property of ICE Data Indices, LLC, its affiliates (“ICE Data”) and/or its third party suppliers and has been licensed for use by J.P. Morgan Investment Management, Inc. ICE Data and its Third Party Suppliers accept no liability in connection with the use of such index data or marks. See prospectus for a full copy of the Disclaimer.
| J.P. Morgan Exchange-Traded Funds | |
JPMorgan Ultra-Short Municipal Income ETF
FUND COMMENTARYTWELVE MONTHS ENDED February 29, 2024 (Unaudited)
| |
| |
| |
Bloomberg 1-Year Municipal Bond Index | |
Net Assets as of 2/29/2024 | |
| |
| |
INVESTMENT OBJECTIVE***
The JPMorgan Ultra-Short Municipal Income ETF (the “Fund”) seeks as high a level of current income exempt from federal income tax as is consistent with relative stability of principal.
INVESTMENT APPROACH
The Fund primarily invests in investment grade fixed income securities or the unrated equivalent, variable and floating rate municipal securities, the income from which is exempt from federal income tax. The Fund invests in a portfolio of municipal securities with an average weighted maturity of two years or less.
HOW DID THE FUND PERFORM?
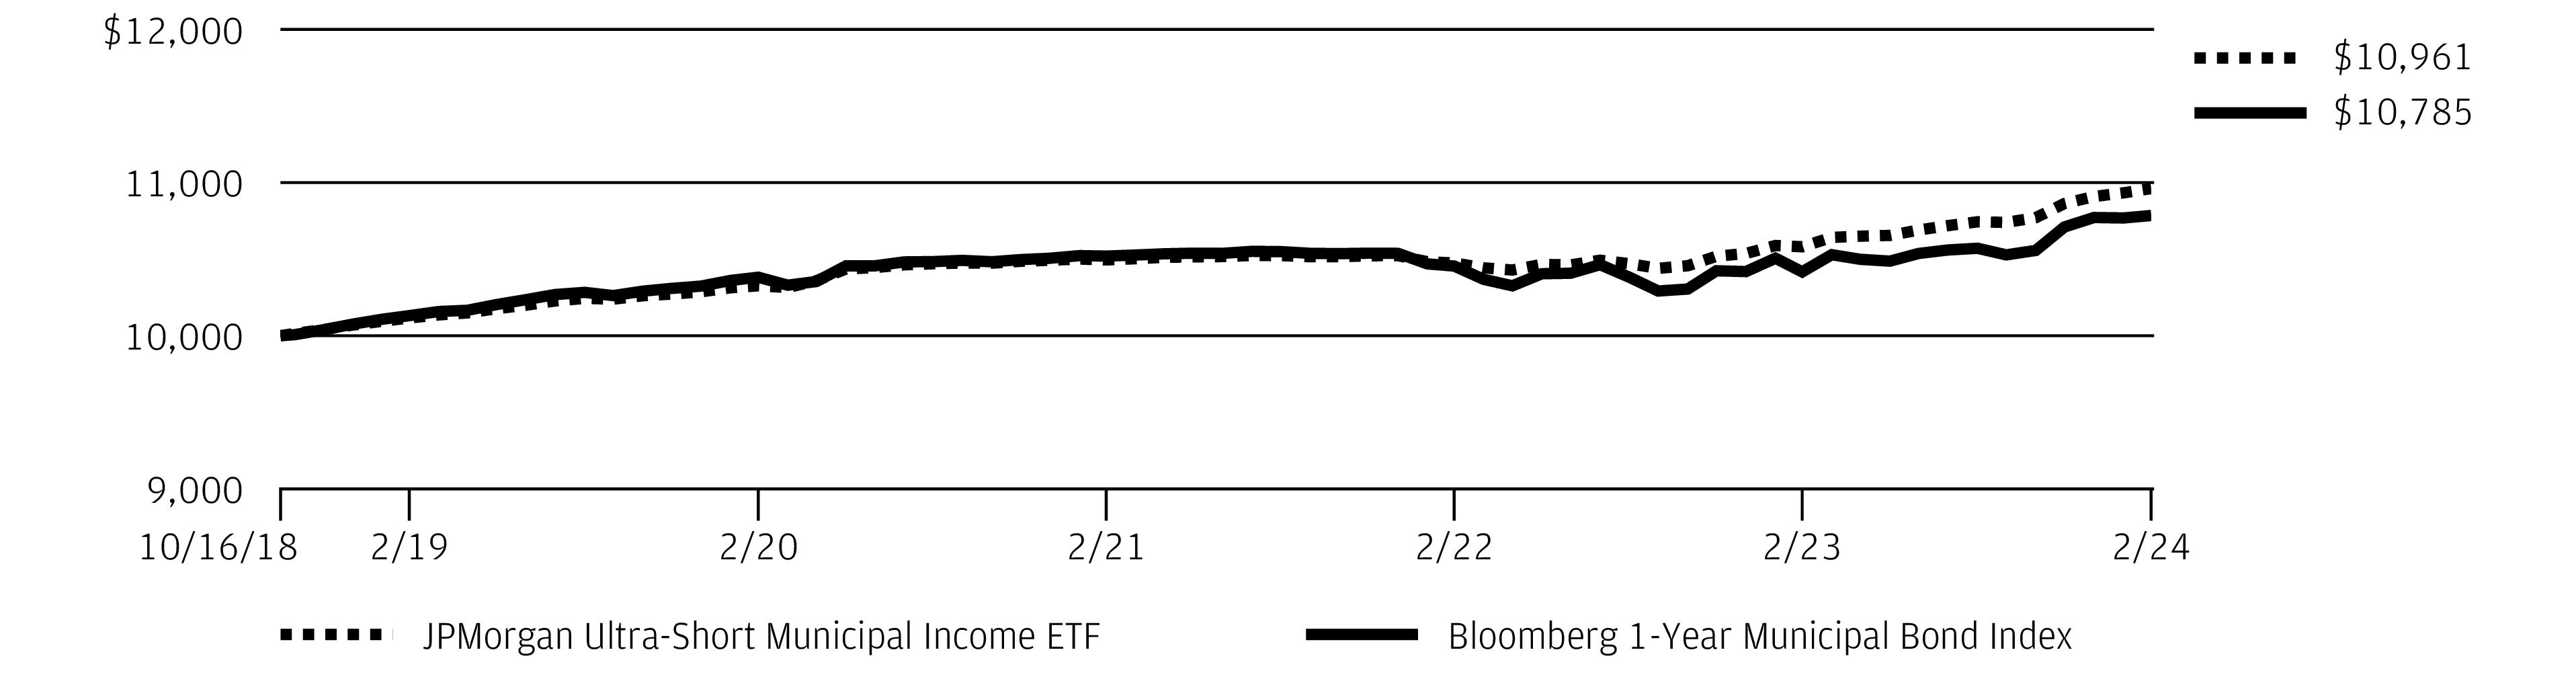
For the twelve months ended February 29, 2024, the Fund outperformed the Bloomberg 1-Year Municipal Bond Index (the “Index”).
Relative to the Index, the Fund’s overweight allocation to bonds of 1-to-2 year durations was a leading contributor to performance. Duration measures a bond’s price sensitivity relative to changes in interest rates. Generally, bonds of longer duration will experience a greater increase in price compared with shorter duration bonds when interest rates fall. The Fund’s overweight position in bonds rated single-A also contributed to relative performance as lower quality bonds generally underperformed higher quality bonds during the period.
The Fund’s out-of-Index allocation to variable rate notes, which were used to manage the Fund’s day-to-day liquidity and are an integral part of Fund strategy, was a leading detractor from
performance. The Fund’s overweight position in local general obligation bonds and its underweight position in the electric sector also detracted from performance.
HOW WAS THE FUND POSITIONED?
At the end of the period, the Fund’s duration was 0.5 years compared with 1.3 years for the Index.
CREDIT QUALITY ALLOCATIONS
AS OF FEBRUARY 29, 2024 | PERCENT OF
TOTAL
INVESTMENTS |
| |
| |
| |
| |
| |
*
The return shown is based on net asset value and may differ from the return shown in the financial highlights, which reflects adjustments made to the net asset value in accordance with accounting principles generally accepted in the United States of America. The net asset value was $50.80 as of February 29, 2024.
**
Market price return was calculated assuming an initial investment made at the market price at the beginning of the reporting period, reinvestment of all dividends and distributions at the market price during the period, and sale at the market price on the last day of the period. The price used to calculate the market price return was the closing price on the Cboe BZX Exchange, Inc. As of February 29, 2024, the closing price was $50.81.
***
The adviser seeks to achieve the Fund’s objective. There can be no guarantee it will be achieved.
| J.P. Morgan Exchange-Traded Funds | |
JPMorgan Ultra-Short Municipal Income ETF
FUND COMMENTARYTWELVE MONTHS ENDED February 29, 2024 (Unaudited) (continued)
AVERAGE ANNUAL TOTAL RETURNS AS OF February 29, 2024 (Unaudited)
| | | | |
JPMorgan Ultra-Short Municipal Income ETF | | | | |
| | | | |
| | | | |
LIFE OF FUND PERFORMANCE (10/16/18 TO 2/29/24)
The performance quoted is past performance and is not a guarantee of future results. Exchange-traded funds are subject to certain market risks. Investment returns and principal value of an investment will fluctuate so that an investor’s shares, when sold or redeemed, may be worth more or less than their original cost. Current performance may be higher or lower than the performance data shown. Updated performance information is available by visiting www.jpmorganfunds.com or by calling 1-844-457-6383.
Fund commenced operations on October 16, 2018.
The graph illustrates comparative performance for $10,000 invested in shares of the JPMorgan Ultra-Short Municipal Income ETF and the Bloomberg 1-Year Municipal Bond Index from October 16, 2018 to February 29, 2024. The performance of the Fund reflects the deduction of Fund expenses and assumes reinvestment of all dividends and capital gain distributions, if any. The performance of the Bloomberg 1-Year Municipal Bond Index does not reflect the deduction of expenses associated with an exchange-traded fund and has been adjusted to reflect reinvestment of all dividends and capital gain distributions of the securities included in the Index, if applicable. The Bloomberg 1-Year Municipal Bond Index is an unmanaged index that includes bonds with a minimum credit rating of BAA3, are issued as part of a deal of at least $50 million, have an amount outstanding of at least $5 million, and have maturities of 1 to 2 years. The performance of the index does not reflect the deduction of expenses associated with a mutual fund, such as investment management fees. By contrast, the performance of the Fund reflects the
deduction of the mutual fund expenses, including sales charges if applicable. An individual cannot invest directly in an index.
Fund performance reflects waiver of a portion of the Fund’s fees and reimbursement of expenses for certain periods from the Fund’s inception date and prior to implementation of a unitary fee structure on November 19, 2019. Without these waivers and reimbursements, performance would have been lower. Also, performance shown in this section does not reflect the deduction of taxes that a shareholder may pay on Fund distributions or redemption on gains resulting from or sale of Fund shares.
The returns shown are based on net asset values calculated for shareholder transactions and may differ from the returns shown in the financial highlights, which reflect adjustments made to the net asset values in accordance with accounting principles generally accepted in the United States of America.
Source: Bloomberg Index Services Limited. BLOOMBERG® is a trademark and service mark of Bloomberg Finance L.P. and its affiliates (collectively "Bloomberg"). Bloomberg or Bloomberg's licensors own all proprietary rights in the Bloomberg Indices. Bloomberg does not approve or endorse this material, or guarantee the accuracy or completeness of any information herein, or make any warranty, express or implied, as to the results to be obtained therefrom and, to the maximum extent allowed by law, shall have any liability or responsibility for injury or damages arising in connection therewith.
| J.P. Morgan Exchange-Traded Funds | |
SCHEDULE OF PORTFOLIO INVESTMENTSAS OF February 29, 2024
| | |
Asset-Backed Securities — 23.9% |
ACM Auto Trust Series 2023-2A, Class A, 7.97%, 6/20/2030 (a) | | |
American Credit Acceptance Receivables Trust Series 2023-4, Class C, 6.99%, 9/12/2030 (a) | | |
| | |
Series 2020-SFR2, Class E1, 4.03%, 7/17/2037 (a) | | |
Series 2020-SFR2, Class E2, 4.28%, 7/17/2037 (a) | | |
Series 2020-SFR4, Class D, 2.01%, 11/17/2037 (a) | | |
Series 2021-SFR1, Class D, 2.60%, 6/17/2038 (a) | | |
Series 2021-SFR2, Class A, 1.53%, 8/17/2038 (a) | | |
Series 2021-SFR3, Class C, 1.80%, 10/17/2038 (a) | | |
Series 2021-SFR3, Class E1, 2.33%, 10/17/2038 (a) | | |
Series 2023-SFR1, Class E1, 4.00%, 4/17/2040 (a) | | |
Series 2023-SFR2, Class E1, 3.95%, 6/17/2040 (a) | | |
Bridge Trust Series 2022-SFR1, Class A, 3.40%, 11/17/2037 (a) | | |
Bridgecrest Lending Auto Securitization Trust Series 2023-1, Class C, 7.10%, 8/15/2029 | | |
Business Jet Securities LLC Series 2021-1A, Class A, 2.16%, 4/15/2036 ‡ (a) | | |
BXG Receivables Note Trust Series 2022-A, Class C, 5.35%, 9/28/2037 (a) | | |
Carvana Auto Receivables Trust | | |
Series 2023-N1, Class B, 5.85%, 11/10/2027 (a) | | |
Series 2021-P4, Class A4, 1.64%, 12/10/2027 | | |
Series 2022-P1, Class A4, 3.52%, 2/10/2028 | | |
CPS Auto Receivables Trust Series 2023-D, Class C, 7.17%, 1/15/2030 (a) | | |
Credit Acceptance Auto Loan Trust | | |
Series 2021-2A, Class C, 1.64%, 6/17/2030 (a) | | |
Series 2021-4, Class A, 1.26%, 10/15/2030 (a) | | |
Series 2021-4, Class C, 1.94%, 2/18/2031 (a) | | |
| | |
|
Series 2023-2A, Class A, 5.92%, 5/16/2033 (a) | | |
DP Lion Holdco LLC Series 2023-1A, Class A, 8.24%, 11/30/2043 ‡ | | |
| | |
Series 2023-2A, Class B, 7.49%, 11/15/2029 (a) | | |
Series 2024-1A, Class B, 6.26%, 3/15/2030 (a) | | |
First Investors Auto Owner Trust Series 2023-1A, Class C, 6.81%, 12/17/2029 (a) | | |
| | |
Series 2020-SFR1, Class D, 2.24%, 8/17/2037 (a) | | |
Series 2020-SFR1, Class E, 2.79%, 8/17/2037 (a) | | |
Series 2020-SFR2, Class C, 1.67%, 10/19/2037 (a) | | |
Series 2020-SFR2, Class E, 2.67%, 10/19/2037 (a) | | |
Series 2021-SFR1, Class C, 1.89%, 8/17/2038 (a) | | |
Series 2022-SFRA, Class A, 3.10%, 3/17/2039 (a) | | |
| | |
Series 2020-GT1, Class A, 4.45%, 1/25/2026 (a) (b) | | |
Series 2021-GT1, Class A, 3.62%, 7/25/2026 (a) (b) | | |
Series 2021-GT1, Class B, 4.36%, 7/25/2026 (a) (b) | | |
Series 2021-GT2, Class A, 3.85%, 10/25/2026 (a) (b) | | |
Series 2022-GT1, Class B, 7.17%, 4/25/2027 (a) | | |
Foundation Finance Trust Series 2023-2A, Class D, 9.10%, 6/15/2049 (a) | | |
FRTKL Series 2021-SFR1, Class D, 2.17%, 9/17/2038 (a) | | |
GLS Auto Receivables Issuer Trust Series 2021-4A, Class D, 2.48%, 10/15/2027 (a) | | |
GLS Auto Select Receivables Trust | | |
Series 2023-2A, Class A3, 6.38%, 2/15/2029 (a) | | |
Series 2024-1A, Class C, 5.69%, 3/15/2030 (a) | | |
Series 2024-1A, Class D, 6.43%, 1/15/2031 (a) | | |
SEE NOTES TO FINANCIAL STATEMENTS.
| J.P. Morgan Exchange-Traded Funds | |
SCHEDULE OF PORTFOLIO INVESTMENTSAS OF February 29, 2024 (continued)
| | |
Asset-Backed Securities — continued |
| | |
Series 2024-1A, Class A, 6.29%, 7/15/2056 (a) | | |
Series 2024-1A, Class B, 8.12%, 7/15/2056 (a) | | |
Goodgreen Trust Series 2016-1A, Class A, 3.23%, 10/15/2052 ‡ (a) | | |
Granite Park Equipment Leasing LLC | | |
Series 2023-1A, Class A3, 6.46%, 9/20/2032 (a) | | |
Series 2023-1A, Class D, 7.00%, 8/22/2033 (a) | | |
HERO Funding (Cayman Islands) Series 2017-3A, Class A1, 3.19%, 9/20/2048 ‡ (a) | | |
HERO Funding Trust (Cayman Islands) Series 2020-1A, Class A, 2.59%, 9/20/2057 ‡ (a) | | |
Hilton Grand Vacations Trust Series 2022-2A, Class B, 4.74%, 1/25/2037 (a) | | |
HIN Timeshare Trust Series 2020-A, Class A, 1.39%, 10/9/2039 (a) | | |
Home Partners of America Trust Series 2020-2, Class E, 3.08%, 1/17/2041 (a) | | |
| | |
Series 2021-1A, Class B, 2.47%, 11/20/2031 (a) | | |
Series 2021-2A, Class B, 2.37%, 4/20/2032 (a) | | |
Series 2022-1A, Class E, 7.58%, 7/20/2032 ‡ (a) | | |
Mariner Finance Issuance Trust | | |
Series 2020-AA, Class A, 2.19%, 8/21/2034 (a) | | |
Series 2020-AA, Class B, 3.21%, 8/21/2034 (a) | | |
Series 2021-AA, Class B, 2.33%, 3/20/2036 (a) | | |
Series 2021-AA, Class C, 2.96%, 3/20/2036 (a) | | |
Series 2021-AA, Class D, 3.83%, 3/20/2036 (a) | | |
Series 2021-BA, Class C, 2.66%, 11/20/2036 (a) | | |
Merchants Fleet Funding LLC Series 2023-1A, Class A, 7.21%, 5/20/2036 (a) | | |
MNR ABS Issuer I LLC, 8.95%, 12/15/2038 ‡ | | |
New Residential Mortgage Loan Trust Series 2022-SFR1, Class B, 2.85%, 2/17/2039 (a) | | |
| | |
|
NRZ Excess Spread-Collateralized Notes | | |
Series 2021-FNT1, Class A, 2.98%, 3/25/2026 (a) | | |
Series 2021-FHT1, Class A, 3.10%, 7/25/2026 (a) | | |
Series 2021-GNT1, Class A, 3.47%, 11/25/2026 (a) | | |
NRZ FHT Excess LLC Series 2020-FHT1, Class A, 4.21%, 11/25/2025 (a) | | |
| | |
Series 2024-1A, Class B, 6.55%, 4/8/2031 (a) | | |
Series 2021-B, Class C, 3.65%, 5/8/2031 (a) | | |
Series 2021-C, Class A, 2.18%, 10/8/2031 (a) | | |
Series 2021-C, Class B, 2.67%, 10/8/2031 (a) | | |
Pagaya AI Technology in Housing Trust Series 2023-1, Class A, 3.60%, 10/25/2040 (a) | | |
Pretium Mortgage Credit Partners LLC | | |
Series 2022-NPL1, Class A1, 2.98%, 1/25/2052 (a) (c) | | |
Series 2021-RN1, Class A1, 1.99%, 2/25/2061 (a) (c) | | |
| | |
Series 2021-SFR3, Class A, 1.64%, 5/17/2026 (a) | | |
Series 2021-SFR1, Class C, 1.56%, 4/17/2038 (a) | | |
Progress Residential Trust | | |
Series 2022-SFR2, Class E1, 4.55%, 4/17/2027 (a) | | |
Series 2023-SFR2, Class D, 4.50%, 10/17/2028 (a) | | |
Series 2021-SFR6, Class A, 1.52%, 7/17/2038 (a) | | |
Series 2023-SFR1, Class E2, 6.60%, 3/17/2040 (a) | | |
Series 2021-SFR7, Class A, 1.69%, 8/17/2040 (a) | | |
Series 2021-SFR10, Class E1, 3.57%, 12/17/2040 (a) | | |
Series 2022-SFR1, Class E1, 3.93%, 2/17/2041 (a) | | |
Series 2022-SFR4, Class A, 4.44%, 5/17/2041 (a) | | |
PRPM LLC Series 2021-7, Class A1, 1.87%, 8/25/2026 (a) (c) | | |
SEE NOTES TO FINANCIAL STATEMENTS.
| J.P. Morgan Exchange-Traded Funds | |
| | |
Asset-Backed Securities — continued |
Regional Management Issuance Trust Series 2022-1, Class B, 3.71%, 3/15/2032 (a) | | |
| | |
Series 2023-1A, Class A, 5.90%, 11/20/2058 ‡ (a) | | |
Series 2024-1A, Class A, 6.21%, 11/20/2059 ‡ (a) | | |
Republic Finance Issuance Trust Series 2020-A, Class B, 3.54%, 11/20/2030 (a) | | |
Santander Drive Auto Receivables Trust | | |
Series 2022-4, Class C, 5.00%, 11/15/2029 | | |
Series 2022-5, Class D, 5.67%, 12/16/2030 | | |
Series 2022-6, Class D, 5.69%, 2/18/2031 | | |
SCF Equipment Leasing LLC | | |
Series 2022-2A, Class A3, 6.50%, 10/21/2030 (a) | | |
Series 2023-1A, Class A3, 6.17%, 5/20/2032 (a) | | |
Series 2022-2A, Class D, 6.50%, 10/20/2032 (a) | | |
Series 2023-1A, Class D, 7.00%, 8/22/2033 (a) | | |
Sierra Timeshare Receivables Funding LLC | | |
Series 2021-2A, Class A, 1.35%, 9/20/2038 (a) | | |
Series 2021-2A, Class C, 1.95%, 9/20/2038 (a) | | |
Series 2023-1A, Class C, 7.00%, 1/20/2040 (a) | | |
Series 2022-2A, Class C, 6.36%, 6/20/2040 (a) | | |
Tricolor Auto Securitization Trust Series 2022-1A, Class D, 5.38%, 1/15/2026 (a) | | |
Tricon American Homes Trust Series 2020-SFR2, Class E1, 2.73%, 11/17/2039 (a) | | |
| | |
Series 2022-SFR1, Class E1, 5.34%, 4/17/2039 (a) | | |
Series 2023-SFR2, Class C, 5.00%, 12/17/2040 (a) | | |
Vericrest Opportunity Loan Transferee Series 2021-NP11, Class A1, 1.87%, 8/25/2051 (a) (c) | | |
VOLT C LLC Series 2021-NPL9, Class A1, 1.99%, 5/25/2051 (a) (c) | | |
VOLT XCIII LLC Series 2021-NPL2, Class A1, 4.89%, 2/27/2051 (a) (c) | | |
| | |
|
VOLT XCIV LLC Series 2021-NPL3, Class A1, 2.24%, 2/27/2051 (a) (c) | | |
Westlake Automobile Receivables Trust Series 2023-4A, Class D, 7.19%, 7/16/2029 (a) | | |
Total Asset-Backed Securities
(Cost $45,968,768) | | |
Mortgage-Backed Securities — 23.7% |
FHLMC Gold Pools, Other Pool # RE0003, 4.00%, 7/1/2049 | | |
| | |
Pool # AL9058, 3.50%, 9/1/2046 | | |
Pool # AL9397, 3.00%, 10/1/2046 | | |
Pool # BE9590, 3.50%, 5/1/2047 | | |
Pool # BQ1367, 2.50%, 9/1/2050 (d) | | |
Pool # BQ3137, 2.50%, 10/1/2050 | | |
Pool # CA8021, 2.50%, 12/1/2050 | | |
Pool # CB0458, 2.50%, 5/1/2051 | | |
Pool # FM7293, 2.50%, 5/1/2051 | | |
Pool # CB0397, 3.00%, 5/1/2051 | | |
Pool # FM7910, 2.50%, 7/1/2051 | | |
Pool # FM7957, 2.50%, 7/1/2051 (d) | | |
Pool # CB1406, 3.00%, 8/1/2051 | | |
Pool # FS5389, 2.50%, 11/1/2051 | | |
Pool # BU3608, 3.00%, 11/1/2051 | | |
Pool # BU9885, 2.50%, 1/1/2052 | | |
Pool # CB2855, 2.50%, 2/1/2052 | | |
Pool # CB3384, 4.00%, 4/1/2052 | | |
Pool # CB3775, 4.00%, 6/1/2052 | | |
Pool # BY9849, 6.00%, 10/1/2053 | | |
| | |
Pool # BS2870, 1.27%, 8/1/2028 | | |
Pool # BL6257, 2.13%, 11/1/2028 | | |
Pool # BS5507, 3.23%, 11/1/2028 | | |
Pool # BS4928, 2.15%, 3/1/2029 | | |
Pool # BS5162, 2.73%, 9/1/2029 | | |
Pool # BL4429, 2.25%, 10/1/2029 | | |
Pool # AM6835, 3.58%, 10/1/2029 | | |
Pool # BL4333, 2.52%, 11/1/2029 | | |
Pool # AN8514, 3.27%, 2/1/2030 | | |
Pool # BS6161, 4.47%, 8/1/2030 | | |
Pool # BZ0392, 4.82%, 3/1/2031 | | |
Pool # BM6857, 1.83%, 12/1/2031 (b) | | |
Pool # BS5337, 3.01%, 4/1/2032 | | |
Pool # BS5581, 3.46%, 6/1/2032 | | |
Pool # BS5659, 3.66%, 6/1/2032 | | |
Pool # AN5759, 3.29%, 7/1/2032 | | |
SEE NOTES TO FINANCIAL STATEMENTS.
| J.P. Morgan Exchange-Traded Funds | |
SCHEDULE OF PORTFOLIO INVESTMENTSAS OF February 29, 2024 (continued)
| | |
Mortgage-Backed Securities — continued |
Pool # BS5530, 3.30%, 7/1/2032 | | |
Pool # BS6132, 3.86%, 7/1/2032 | | |
Pool # BS6276, 3.97%, 8/1/2032 | | |
Pool # BS5718, 3.46%, 9/1/2032 | | |
Pool # BS6689, 3.83%, 9/1/2032 | | |
Pool # BS6417, 3.83%, 10/1/2032 | | |
Pool # BS6951, 3.90%, 10/1/2032 | | |
Pool # BS6619, 3.91%, 10/1/2032 | | |
Pool # BS6731, 3.78%, 11/1/2032 | | |
Pool # BZ0159, 4.98%, 1/1/2033 | | |
Pool # BS1636, 2.25%, 4/1/2033 | | |
Pool # BS1899, 2.17%, 5/1/2033 | | |
Pool # BS9616, 4.79%, 9/1/2033 | | |
Pool # BZ0419, 4.25%, 1/1/2034 | | |
Pool # BZ0430, 4.32%, 2/1/2034 | | |
Pool # BL2213, 3.34%, 5/1/2034 | | |
Pool # BZ0565, 5.04%, 5/1/2034 | | |
Pool # BL3772, 2.92%, 10/1/2034 | | |
Pool # BL7071, 1.91%, 6/1/2035 | | |
Pool # AN4430, 3.61%, 1/1/2037 | | |
Pool # CA4632, 4.00%, 11/1/2043 (d) | | |
Pool # BF0189, 3.00%, 6/1/2057 | | |
FNMA/FHLMC UMBS, Single Family, 30 Year | | |
TBA, 2.50%, 3/25/2054 (d) | | |
TBA, 5.00%, 3/25/2054 (d) | | |
GNMA II Pool # CK7234 ARM, 6.44%, 2/20/2072 (b) | | |
| | |
Pool # AQ6679, 3.50%, 10/20/2045 | | |
Pool # AK8802, 3.75%, 3/20/2046 | | |
Pool # CO8957, 5.00%, 12/20/2052 | | |
Pool # CX2674, 6.00%, 10/20/2053 | | |
GNMA II, Other Pool # AD0019, 3.50%, 2/20/2033 | | |
Total Mortgage-Backed Securities
(Cost $45,270,400) | | |
U.S. Treasury Obligations — 22.0% |
| | |
| | |
| | |
| | |
| | |
| | |
| | |
| | |
| | |
|
| | |
| | |
| | |
| | |
| | |
| | |
| | |
| | |
| | |
| | |
| | |
| | |
| | |
| | |
| | |
| | |
U.S. Treasury STRIPS Bonds
5.51%, 2/15/2041 (e) | | |
Total U.S. Treasury Obligations
(Cost $42,154,819) | | |
|
Aerospace & Defense — 0.7% |
BAE Systems plc (United Kingdom) 5.80%, 10/11/2041 (a) | | |
|
| | |
| | |
| | |
L3Harris Technologies, Inc. |
| | |
| | |
Northrop Grumman Corp. 5.15%, 5/1/2040 | | |
RTX Corp. 3.03%, 3/15/2052 | | |
| | |
|
General Motors Co. 5.95%, 4/1/2049 | | |
|
ABN AMRO Bank NV (Netherlands) (US Treasury Yield Curve Rate T Note Constant Maturity 1 Year + 1.10%), 2.47%, 12/13/2029 (a) (f) | | |
|
(SOFR + 1.06%), 2.09%, 6/14/2029 (f) | | |
(SOFR + 1.21%), 2.57%, 10/20/2032 (f) | | |
(SOFR + 1.65%), 5.47%, 1/23/2035 (f) | | |
SEE NOTES TO FINANCIAL STATEMENTS.
| J.P. Morgan Exchange-Traded Funds | |
| | |
Corporate Bonds — continued |
|
Banque Federative du Credit Mutuel SA (France) 5.79%, 7/13/2028 (a) | | |
Barclays plc (United Kingdom) |
(SOFR + 2.98%), 6.22%, 5/9/2034 (f) | | |
(US Treasury Yield Curve Rate T Note Constant Maturity 1 Year + 1.30%), 3.33%, 11/24/2042 (f) | | |
BNP Paribas SA (France) (SOFR + 1.52%), 5.18%, 1/9/2030 (a) (f) | | |
|
(SOFR + 1.98%), 6.61%, 10/19/2027 (a) (f) | | |
(SOFR + 2.59%), 7.00%, 10/19/2034 (a) (f) | | |
|
(3-MONTH CME TERM SOFR + 1.45%), 4.08%, 4/23/2029 (f) | | |
(SOFR + 1.18%), 2.52%, 11/3/2032 (f) | | |
Credit Agricole SA (France) (SOFR + 1.86%), 6.32%, 10/3/2029 (a) (f) | | |
Danske Bank A/S (Denmark) (US Treasury Yield Curve Rate T Note Constant Maturity 1 Year + 1.40%), 5.71%, 3/1/2030 (a) (f) | | |
HSBC Holdings plc (United Kingdom) |
(SOFR + 1.29%), 2.21%, 8/17/2029 (f) | | |
(SOFR + 2.39%), 6.25%, 3/9/2034 (f) | | |
(SOFR + 2.65%), 6.33%, 3/9/2044 (f) | | |
Lloyds Banking Group plc (United Kingdom) (US Treasury Yield Curve Rate T Note Constant Maturity 1 Year + 1.70%), 5.87%, 3/6/2029 (f) | | |
Mizuho Financial Group, Inc. (Japan) (US Treasury Yield Curve Rate T Note Constant Maturity 1 Year + 1.90%), 5.75%, 7/6/2034 (f) | | |
National Australia Bank Ltd. (Australia) 2.33%, 8/21/2030 (a) (g) | | |
NatWest Group plc (United Kingdom) |
(US Treasury Yield Curve Rate T Note Constant Maturity 1 Year + 1.95%), 5.81%, 9/13/2029 (f) | | |
(US Treasury Yield Curve Rate T Note Constant Maturity 1 Year + 1.50%), 5.78%, 3/1/2035 (f) | | |
Skandinaviska Enskilda Banken AB (Sweden) 5.38%, 3/5/2029 (a) | | |
| | |
|
|
Societe Generale SA (France) |
(US Treasury Yield Curve Rate T Note Constant Maturity 1 Year + 1.30%), 2.89%, 6/9/2032 (a) (f) | | |
(US Treasury Yield Curve Rate T Note Constant Maturity 1 Year + 2.95%), 6.69%, 1/10/2034 (a) (f) | | |
(US Treasury Yield Curve Rate T Note Constant Maturity 1 Year + 2.10%), 6.07%, 1/19/2035 (a) (f) | | |
Standard Chartered plc (United Kingdom) (US Treasury Yield Curve Rate T Note Constant Maturity 1 Year + 2.10%), 6.10%, 1/11/2035 (a) (f) | | |
Truist Financial Corp. (SOFR + 1.92%), 5.71%, 1/24/2035 (f) | | |
US Bancorp (SOFR + 1.86%), 5.68%, 1/23/2035 (f) | | |
|
(SOFR + 1.79%), 6.30%, 10/23/2029 (f) | | |
(SOFR + 2.06%), 6.49%, 10/23/2034 (f) | | |
(SOFR + 1.78%), 5.50%, 1/23/2035 (f) | | |
| | |
|
Anheuser-Busch InBev Worldwide, Inc. (Belgium) 5.80%, 1/23/2059 | | |
Molson Coors Beverage Co. 4.20%, 7/15/2046 | | |
| | |
|
|
| | |
| | |
| | |
Amgen, Inc. 5.75%, 3/2/2063 | | |
Gilead Sciences, Inc. 2.60%, 10/1/2040 | | |
| | |
|
Amazon.com, Inc. 3.25%, 5/12/2061 | | |
|
Masco Corp. 6.50%, 8/15/2032 | | |
|
Bank of New York Mellon Corp. (The) |
(SOFR + 1.60%), 6.32%, 10/25/2029 (f) | | |
(SOFR + 1.85%), 6.47%, 10/25/2034 (f) | | |
SEE NOTES TO FINANCIAL STATEMENTS.
| J.P. Morgan Exchange-Traded Funds | |
SCHEDULE OF PORTFOLIO INVESTMENTSAS OF February 29, 2024 (continued)
| | |
Corporate Bonds — continued |
Capital Markets — continued |
Goldman Sachs Group, Inc. (The) |
(SOFR + 1.25%), 2.38%, 7/21/2032 (f) | | |
(3-MONTH CME TERM SOFR + 1.69%), 4.41%, 4/23/2039 (f) | | |
|
(SOFR + 1.59%), 5.16%, 4/20/2029 (f) | | |
(SOFR + 1.87%), 5.25%, 4/21/2034 (f) | | |
(SOFR + 1.73%), 5.47%, 1/18/2035 (f) | | |
UBS Group AG (Switzerland) |
(US Treasury Yield Curve Rate T Note Constant Maturity 1 Year + 2.00%), 6.30%, 9/22/2034 (a) (f) | | |
(US Treasury Yield Curve Rate T Note Constant Maturity 1 Year + 1.10%), 3.18%, 2/11/2043 (a) (f) | | |
| | |
|
CF Industries, Inc. 5.15%, 3/15/2034 | | |
DuPont de Nemours, Inc. 5.32%, 11/15/2038 | | |
LYB International Finance III LLC 4.20%, 10/15/2049 | | |
Nutrien Ltd. (Canada) 5.00%, 4/1/2049 | | |
| | |
Commercial Services & Supplies — 0.0% ^ |
Element Fleet Management Corp. (Canada) 6.32%, 12/4/2028 (a) | | |
Construction Materials — 0.0% ^ |
Martin Marietta Materials, Inc. 3.20%, 7/15/2051 | | |
|
AerCap Ireland Capital DAC (Ireland) 3.00%, 10/29/2028 | | |
Avolon Holdings Funding Ltd. (Ireland) |
| | |
| | |
| | |
Consumer Staples Distribution & Retail — 0.2% |
7-Eleven, Inc. 1.80%, 2/10/2031 (a) | | |
Alimentation Couche-Tard, Inc. (Canada) |
| | |
| | |
Kroger Co. (The) 5.00%, 4/15/2042 | | |
| | |
| | |
|
|
Goodman US Finance Three LLC (Australia) 3.70%, 3/15/2028 (a) | | |
Simon Property Group LP 3.25%, 9/13/2049 | | |
WP Carey, Inc. 2.25%, 4/1/2033 | | |
| | |
Diversified Telecommunication Services — 0.2% |
|
| | |
| | |
Verizon Communications, Inc. |
| | |
| | |
| | |
Electric Utilities — 1.9% |
DTE Electric Co. 5.40%, 4/1/2053 | | |
Duke Energy Corp. 3.75%, 9/1/2046 | | |
Duquesne Light Holdings, Inc. 2.78%, 1/7/2032 (a) | | |
Emera US Finance LP (Canada) 4.75%, 6/15/2046 | | |
Entergy Texas, Inc. 5.80%, 9/1/2053 | | |
Evergy Metro, Inc. 5.30%, 10/1/2041 | | |
FirstEnergy Transmission LLC 5.45%, 7/15/2044 (a) | | |
Fortis, Inc. (Canada) 3.06%, 10/4/2026 | | |
|
| | |
| | |
Massachusetts Electric Co. 4.00%, 8/15/2046 (a) | | |
Monongahela Power Co. 5.85%, 2/15/2034 (a) | | |
NextEra Energy Capital Holdings, Inc. |
| | |
| | |
Niagara Mohawk Power Corp. 5.66%, 1/17/2054 (a) | | |
Oncor Electric Delivery Co. LLC 4.95%, 9/15/2052 | | |
Pacific Gas and Electric Co. |
| | |
| | |
| | |
PPL Electric Utilities Corp. 5.25%, 5/15/2053 | | |
SEE NOTES TO FINANCIAL STATEMENTS.
| J.P. Morgan Exchange-Traded Funds | |
| | |
Corporate Bonds — continued |
Electric Utilities — continued |
Public Service Co. of Oklahoma |
| | |
Series K, 3.15%, 8/15/2051 | | |
Public Service Electric and Gas Co. 5.45%, 3/1/2054 | | |
Sierra Pacific Power Co. 5.90%, 3/15/2054 (a) | | |
Southern California Edison Co. |
| | |
| | |
| | |
Union Electric Co. 4.00%, 4/1/2048 | | |
Xcel Energy, Inc. 4.80%, 9/15/2041 | | |
| | |
Electronic Equipment, Instruments & Components — 0.0% ^ |
Corning, Inc. 5.35%, 11/15/2048 | | |
Financial Services — 0.2% |
Fiserv, Inc. 4.40%, 7/1/2049 | | |
Global Payments, Inc. 5.30%, 8/15/2029 | | |
Nationwide Building Society (United Kingdom) (3-MONTH SOFR + 1.45%), 4.30%, 3/8/2029 (a) (f) | | |
| | |
|
Bunge Ltd. Finance Corp. 2.75%, 5/14/2031 | | |
Campbell Soup Co. 3.13%, 4/24/2050 | | |
|
| | |
| | |
JBS USA LUX SA 6.75%, 3/15/2034 (a) | | |
Kraft Heinz Foods Co. 4.38%, 6/1/2046 | | |
Tyson Foods, Inc. 5.70%, 3/15/2034 (d) | | |
| | |
|
Atmos Energy Corp. 4.13%, 3/15/2049 | | |
Boston Gas Co. 4.49%, 2/15/2042 (a) | | |
Piedmont Natural Gas Co., Inc. 5.05%, 5/15/2052 | | |
Southwest Gas Corp. 3.80%, 9/29/2046 | | |
| | |
Ground Transportation — 0.2% |
Burlington Northern Santa Fe LLC 3.55%, 2/15/2050 | | |
CSX Corp. 3.35%, 9/15/2049 | | |
| | |
|
Ground Transportation — continued |
Norfolk Southern Corp. 4.05%, 8/15/2052 | | |
Penske Truck Leasing Co. LP 6.05%, 8/1/2028 (a) | | |
Union Pacific Corp. 4.10%, 9/15/2067 | | |
| | |
Health Care Providers & Services — 0.6% |
Aetna, Inc. 4.50%, 5/15/2042 | | |
|
| | |
| | |
Elevance Health, Inc. 4.65%, 1/15/2043 | | |
|
| | |
| | |
UnitedHealth Group, Inc. 3.25%, 5/15/2051 | | |
| | |
|
|
| | |
| | |
| | |
Independent Power and Renewable Electricity Producers — 0.4% |
Constellation Energy Generation LLC |
| | |
| | |
| | |
Southern Power Co. 5.15%, 9/15/2041 | | |
| | |
Industrial Conglomerates — 0.1% |
Honeywell International, Inc. 5.25%, 3/1/2054 | | |
Industrial REITs — 0.0% ^ |
Prologis LP 2.25%, 4/15/2030 | | |
|
Aon North America, Inc. 5.75%, 3/1/2054 | | |
Arthur J Gallagher & Co. 5.75%, 7/15/2054 | | |
Berkshire Hathaway Finance Corp. 3.85%, 3/15/2052 | | |
CNA Financial Corp. 5.13%, 2/15/2034 | | |
Liberty Mutual Group, Inc. 3.95%, 10/15/2050 (a) | | |
Mutual of Omaha Cos. Global Funding 5.45%, 12/12/2028 (a) | | |
SEE NOTES TO FINANCIAL STATEMENTS.
| J.P. Morgan Exchange-Traded Funds | |
SCHEDULE OF PORTFOLIO INVESTMENTSAS OF February 29, 2024 (continued)
| | |
Corporate Bonds — continued |
|
New York Life Insurance Co. 3.75%, 5/15/2050 (a) | | |
Prudential Funding Asia plc (Hong Kong) 3.13%, 4/14/2030 | | |
Teachers Insurance & Annuity Association of America 4.27%, 5/15/2047 (a) | | |
| | |
Interactive Media & Services — 0.1% |
Meta Platforms, Inc. 5.60%, 5/15/2053 | | |
|
Charter Communications Operating LLC |
| | |
| | |
| | |
|
| | |
| | |
| | |
Discovery Communications LLC 3.63%, 5/15/2030 | | |
Paramount Global 5.85%, 9/1/2043 | | |
| | |
|
|
| | |
| | |
Nucor Corp. 2.98%, 12/15/2055 | | |
Steel Dynamics, Inc. 3.25%, 10/15/2050 | | |
| | |
|
Consolidated Edison Co. of New York, Inc. 5.70%, 6/15/2040 | | |
Consumers Energy Co. 3.25%, 8/15/2046 | | |
Dominion Energy, Inc. Series C, 4.90%, 8/1/2041 | | |
Puget Energy, Inc. 2.38%, 6/15/2028 | | |
San Diego Gas & Electric Co. 3.95%, 11/15/2041 | | |
Southern Co. Gas Capital Corp. 4.40%, 6/1/2043 | | |
| | |
|
Alexandria Real Estate Equities, Inc. 5.25%, 5/15/2036 | | |
| | |
|
Oil, Gas & Consumable Fuels — 1.1% |
APA Infrastructure Ltd. (Australia) 4.25%, 7/15/2027 (a) | | |
Columbia Pipelines Operating Co. LLC 5.93%, 8/15/2030 (a) | | |
ConocoPhillips Co. 5.30%, 5/15/2053 | | |
|
| | |
| | |
|
| | |
| | |
Flex Intermediate Holdco LLC 3.36%, 6/30/2031 (a) | | |
Kinder Morgan, Inc. 5.00%, 2/1/2029 | | |
Marathon Petroleum Corp. 6.50%, 3/1/2041 | | |
| | |
|
| | |
| | |
Northern Natural Gas Co. 5.63%, 2/1/2054 (a) | | |
Phillips 66 Co. 4.90%, 10/1/2046 | | |
Plains All American Pipeline LP 4.90%, 2/15/2045 | | |
Sabine Pass Liquefaction LLC 4.50%, 5/15/2030 | | |
TotalEnergies Capital International SA (France) 3.13%, 5/29/2050 | | |
| | |
|
Astrazeneca Finance LLC (United Kingdom) 5.00%, 2/26/2034 | | |
|
| | |
| | |
Eli Lilly & Co. 5.00%, 2/9/2054 | | |
Merck & Co., Inc. 5.15%, 5/17/2063 | | |
Takeda Pharmaceutical Co. Ltd. (Japan) 3.03%, 7/9/2040 | | |
| | |
|
Essex Portfolio LP 1.65%, 1/15/2031 | | |
UDR, Inc. 3.10%, 11/1/2034 | | |
| | |
SEE NOTES TO FINANCIAL STATEMENTS.
| J.P. Morgan Exchange-Traded Funds | |
| | |
Corporate Bonds — continued |
|
NNN REIT, Inc. 5.60%, 10/15/2033 | | |
Realty Income Corp. 4.85%, 3/15/2030 | | |
| | |
Semiconductors & Semiconductor Equipment — 0.4% |
Broadcom, Inc. 2.45%, 2/15/2031 (a) | | |
Intel Corp. 5.70%, 2/10/2053 | | |
KLA Corp. 3.30%, 3/1/2050 | | |
|
| | |
| | |
QUALCOMM, Inc. 4.50%, 5/20/2052 | | |
Texas Instruments, Inc. 5.05%, 5/18/2063 | | |
| | |
|
Intuit, Inc. 5.50%, 9/15/2053 | | |
|
| | |
| | |
| | |
|
Crown Castle, Inc. 4.00%, 3/1/2027 | | |
Extra Space Storage LP 5.90%, 1/15/2031 | | |
| | |
|
|
| | |
| | |
| | |
Technology Hardware, Storage & Peripherals — 0.1% |
Apple, Inc. 4.10%, 8/8/2062 | | |
|
BAT Capital Corp. (United Kingdom) |
| | |
| | |
| | |
|
American Water Capital Corp. 5.45%, 3/1/2054 | | |
Wireless Telecommunication Services — 0.3% |
|
| | |
| | |
|
Wireless Telecommunication Services — continued |
| | |
| | |
Vodafone Group plc (United Kingdom) 4.88%, 6/19/2049 | | |
| | |
Total Corporate Bonds
(Cost $30,234,199) | | |
Collateralized Mortgage Obligations — 6.1% |
| | |
Series 4016, Class KZ, 4.00%, 3/15/2042 | | |
Series 5027, Class JA, 2.00%, 10/25/2044 | | |
Series 4487, Class TL, 3.00%, 5/15/2045 | | |
Series 4585, Class DA, 3.00%, 6/15/2045 | | |
Series 4710, Class JE, 2.75%, 6/15/2047 | | |
Series 4994, Class LI, IO, 4.00%, 12/25/2048 | | |
Series 4896, Class CG, 3.50%, 4/15/2049 | | |
Series 5141, Class PA, 1.00%, 4/25/2050 | | |
| | |
Series 276, Class 20, 2.00%, 9/15/2042 | | |
Series 326, Class 350, 3.50%, 3/15/2044 | | |
| | |
| | |
Series 2012-4, Class NB, 4.00%, 2/25/2042 | | |
Series 2012-124, Class PA, 2.50%, 7/25/2042 | | |
Series 2012-130, Class DC, 3.00%, 12/25/2042 | | |
Series 2017-87, Class EA, 3.00%, 4/25/2044 | | |
Series 2019-60, Class DA, 2.50%, 3/25/2049 | | |
Series 2019-12, Class BA, 3.00%, 4/25/2049 | | |
Series 2020-54, Class UB, 5.00%, 7/25/2050 | | |
Series 2021-27, Class EC, 1.50%, 5/25/2051 | | |
| | |
Series 2012-13, Class FQ, 5.75%, 1/20/2038 (b) | | |
Series 2019-83, Class YA, 4.77%, 6/20/2040 (b) | | |
Series 2013-91, Class WA, 4.43%, 4/20/2043 (b) | | |
SEE NOTES TO FINANCIAL STATEMENTS.
| J.P. Morgan Exchange-Traded Funds | |
SCHEDULE OF PORTFOLIO INVESTMENTSAS OF February 29, 2024 (continued)
| | |
Collateralized Mortgage Obligations — continued |
| | |
Series 2020-4, Class A1, 5.61%, 10/25/2025 (a) (c) | | |
Series 2023-RCF2, Class A1, 4.00%, 11/25/2053 (a) (c) | | |
Series 2024-RCF1, Class A1, 4.00%, 1/25/2054 (a) (c) | | |
Series 2024-RPL1, Class A1, 4.20%, 12/25/2064 (a) (b) | | |
Seasoned Credit Risk Transfer Trust | | |
Series 2017-4, Class M60C, 3.50%, 6/25/2057 | | |
Series 2019-1, Class MA, 3.50%, 7/25/2058 | | |
Series 2019-1, Class MT, 3.50%, 7/25/2058 | | |
Series 2019-2, Class HT, 3.00%, 8/25/2058 | | |
| | |
Series 2010-1, Class DZ, 4.25%, 4/15/2040 | | |
Series 2011-1, Class DZ, 3.75%, 9/15/2046 | | |
Total Collateralized Mortgage Obligations
(Cost $11,493,849) | | |
Commercial Mortgage-Backed Securities — 5.7% |
Banc of America Re-Remic Trust Series 2024-FRR1, Class B, 0.00%, 4/27/2049 ‡ (a) | | |
BB-UBS Trust Series 2012-SHOW, Class B, 3.88%, 11/5/2036 (a) | | |
| | |
Series 2014-USA, Class A2, 3.95%, 9/15/2037 (a) | | |
Series 2014-USA, Class B, 4.18%, 9/15/2037 (a) | | |
FHLMC, Multi-Family Structured Pass-Through Certificates | | |
Series KL06, Class XFX, IO, 1.36%, 12/25/2029 (b) | | |
Series KJ40, Class A2, 3.69%, 11/25/2030 (b) | | |
Series K135, Class AM, 1.91%, 10/25/2031 (b) | | |
Series KJ44, Class A2, 4.61%, 2/25/2033 | | |
| | |
Series 2020-M53, Class A2, 1.69%, 11/25/2032 (b) | | |
Series 2023-M8, Class A1, 4.47%, 11/25/2032 (b) | | |
Series 2024-M2, Class A1, 4.62%, 4/25/2033 (b) | | |
| | |
|
| | |
Series 2017-KGX1, Class BFX, 3.59%, 10/25/2027 (a) (b) | | |
Series 2018-K154, Class B, 4.02%, 11/25/2032 (a) (b) | | |
Series 2018-K155, Class B, 4.17%, 4/25/2033 (a) (b) | | |
Series 2015-K46, Class C, 3.70%, 4/25/2048 (a) (b) | | |
Series 2018-K80, Class B, 4.23%, 8/25/2050 (a) (b) | | |
Series 2017-K71, Class B, 3.75%, 11/25/2050 (a) (b) | | |
Series 2018-K79, Class C, 4.21%, 7/25/2051 (a) (b) | | |
| | |
Series 2022-FRR3, Class BK41, PO, 10/27/2047 ‡ (a) | | |
Series 2022-FRR3, Class CK41, PO, 10/27/2047 ‡ (a) | | |
Series 2022-FRR3, Class AK47, 0.70%, 5/27/2048 ‡ (a) (b) | | |
Series 2021-FRR1, Class 2A, PO, 11/29/2050 ‡ (a) | | |
GAM Re-REMIC TRUST Series 2021-FRR2, Class BK49, 2.30%, 9/27/2051 ‡ (a) (b) | | |
| | |
Series 2017-76, Class B, 2.60%, 12/16/2056 | | |
Series 2017-191, Class B, 2.50%, 7/16/2059 (b) | | |
JPMCC Re-REMIC Trust Series 2015-FRR2, Class AK39, 2.50%, 8/27/2047 (a) (b) | | |
MRCD MARK Mortgage Trust Series 2019-PARK, Class A, 2.72%, 12/15/2036 (a) | | |
Total Commercial Mortgage-Backed Securities
(Cost $10,803,986) | | |
Foreign Government Securities — 0.1% |
United Mexican States 6.34%, 5/4/2053
(Cost $217,337) | | |
SEE NOTES TO FINANCIAL STATEMENTS.
| J.P. Morgan Exchange-Traded Funds | |
| | |
Short-Term Investments — 10.5% |
Investment Companies — 10.5% |
JPMorgan U.S. Government Money Market Fund Class IM Shares, 5.25% (h) (i)
(Cost $20,630,652) | | |
Total Investments — 108.1%
(Cost $206,774,010) | | |
Liabilities in Excess of Other Assets — (8.1)% | | |
| | |
Percentages indicated are based on net assets. |
| |
| |
| Alternative Credit Enhancement Securities |
| Adjustable Rate Mortgage. The interest rate shown is the rate in effect as of February 29, 2024. |
| Chicago Mercantile Exchange |
| Credit Suisse Mortgage Trust |
| Federal Home Loan Mortgage Corp. |
| Federal National Mortgage Association |
| Government National Mortgage Association |
| Interest Only represents the right to receive the monthly interest payments on an underlying pool of mortgage loans. The principal amount shown represents the par value on the underlying pool. The yields on these securities are subject to accelerated principal paydowns as a result of prepayment or refinancing of the underlying pool of mortgage instruments. As a result, interest income may be reduced considerably. |
| Principal Only represents the right to receive the principal portion only on an underlying pool of mortgage loans. The market value of these securities is extremely volatile in response to changes in market interest rates. As prepayments on the underlying mortgages of these securities increase, the yield on these securities increases. |
| Real Estate Investment Trust |
| Real Estate Mortgage Investment Conduit |
| Combined Real Estate Mortgage Investment Conduit |
| Secured Overnight Financing Rate |
| Separate Trading of Registered Interest and Principal of Securities. The STRIPS Program lets investors hold and trade individual interest and principal components of eligible notes and bonds as separate securities. |
| To Be Announced; Security is subject to delayed delivery. |
| Uniform Mortgage-Backed Securities |
| Amount rounds to less than 0.1% of net assets. |
| Value determined using significant unobservable inputs. | |
| Securities exempt from registration under Rule 144A or section 4(a)(2), of the Securities Act of 1933, as amended. | |
| Variable or floating rate security, the interest rate of which adjusts periodically based on changes in current interest rates and prepayments on the underlying pool of assets. The interest rate shown is the current rate as of February 29, 2024. | |
| Step bond. Interest rate is a fixed rate for an initial period that either resets at a specific date or may reset in the future contingent upon a predetermined trigger. The interest rate shown is the current rate as of February 29, 2024. | |
| All or a portion of the security is a when-issued security, delayed delivery security, or forward commitment. | |
| The rate shown is the effective yield as of February 29, 2024. | |
| Variable or floating rate security, linked to the referenced benchmark. The interest rate shown is the current rate as of February 29, 2024. | |
| Contingent Capital security (“CoCo”). CoCos are hybrid debt securities that may be convertible into equity or may be written down if a pre-specified trigger event occurs. The total value of aggregate CoCo holdings at February 29, 2024 is $204,526 or 0.10% of the Fund’s net assets as of February 29, 2024. | |
| Investment in an affiliated fund, which is registered under the Investment Company Act of 1940, as amended, and is advised by J.P. Morgan Investment Management Inc. | |
| The rate shown is the current yield as of February 29, 2024. | |
Futures contracts outstanding as of February 29, 2024:
| | | | | VALUE AND
UNREALIZED
APPRECIATION
(DEPRECIATION) ($) |
| | | | | |
| | | | | |
U.S. Treasury 2 Year Note | | | | | |
| | | | | |
SEE NOTES TO FINANCIAL STATEMENTS.
| J.P. Morgan Exchange-Traded Funds | |
SCHEDULE OF PORTFOLIO INVESTMENTSAS OF February 29, 2024 (continued)
SEE NOTES TO FINANCIAL STATEMENTS.
| J.P. Morgan Exchange-Traded Funds | |
JPMorgan Core Plus Bond ETF
SCHEDULE OF PORTFOLIO INVESTMENTSAS OF February 29, 2024
| | |
|
Aerospace & Defense — 0.3% |
|
| | |
| | |
| | |
| | |
| | |
| | |
Bombardier, Inc. (Canada) 6.00%, 2/15/2028 (a) | | |
BWX Technologies, Inc. 4.13%, 4/15/2029 (a) | | |
|
| | |
| | |
L3Harris Technologies, Inc. 5.60%, 7/31/2053 | | |
|
| | |
| | |
Precision Castparts Corp. 4.38%, 6/15/2045 | | |
|
| | |
| | |
| | |
| | |
| | |
| | |
| | |
Spirit AeroSystems, Inc. 9.38%, 11/30/2029 (a) | | |
|
| | |
| | |
| | |
Triumph Group, Inc. 7.75%, 8/15/2025 | | |
Wesco Aircraft Holdings, Inc. 9.00%, 11/15/2026 (a) (b) | | |
| | |
Automobile Components — 0.3% |
Adient Global Holdings Ltd. |
| | |
| | |
Allison Transmission, Inc. |
| | |
| | |
|
Automobile Components — continued |
| | |
American Axle & Manufacturing, Inc. |
| | |
| | |
| | |
Aptiv plc 5.40%, 3/15/2049 | | |
|
| | |
| | |
Cooper-Standard Automotive, Inc. |
13.50% (Blend (Cash 9.00% + PIK 4.50%)), 3/31/2027 (a) (c) | | |
10.63% (PIK), 5/15/2027 (a) (c) | | |
|
| | |
| | |
| | |
Goodyear Tire & Rubber Co. (The) |
| | |
| | |
| | |
|
| | |
| | |
Lear Corp. 2.60%, 1/15/2032 | | |
| | |
|
|
| | |
| | |
General Motors Co. 5.95%, 4/1/2049 | | |
|
| | |
| | |
Nissan Motor Acceptance Co. LLC 2.00%, 3/9/2026 (a) | | |
| | |
|
ABN AMRO Bank NV (Netherlands) |
(US Treasury Yield Curve Rate T Note Constant Maturity 1 Year + 1.55%), 6.58%, 10/13/2026 (a) (d) | | |
SEE NOTES TO FINANCIAL STATEMENTS.
| J.P. Morgan Exchange-Traded Funds | |
JPMorgan Core Plus Bond ETF
SCHEDULE OF PORTFOLIO INVESTMENTSAS OF February 29, 2024 (continued)
| | |
Corporate Bonds — continued |
|
(US Treasury Yield Curve Rate T Note Constant Maturity 1 Year + 1.65%), 6.34%, 9/18/2027 (a) (d) | | |
(US Treasury Yield Curve Rate T Note Constant Maturity 1 Year + 1.10%), 2.47%, 12/13/2029 (a) (d) | | |
(US Treasury Yield Curve Rate T Note Constant Maturity 5 Year + 1.90%), 3.32%, 3/13/2037 (a) (d) | | |
AIB Group plc (Ireland) (SOFR + 2.33%), 6.61%, 9/13/2029 (a) (d) | | |
ANZ New Zealand Int'l Ltd. (New Zealand) 5.36%, 8/14/2028 (a) | | |
ASB Bank Ltd. (New Zealand) 2.38%, 10/22/2031 (a) | | |
Banco Bilbao Vizcaya Argentaria SA (Spain) (US Treasury Yield Curve Rate T Note Constant Maturity 5 Year + 5.10%), 9.38%, 3/19/2029 (d) (e) (f) (g) | | |
Banco Santander SA (Spain) |
| | |
| | |
| | |
(US Treasury Yield Curve Rate T Note Constant Maturity 5 Year + 5.31%), 9.63%, 11/21/2028 (d) (e) (f) (g) | | |
|
(SOFR + 1.01%), 1.20%, 10/24/2026 (d) | | |
(3-MONTH CME TERM SOFR + 1.84%), 3.82%, 1/20/2028 (d) | | |
(3-MONTH CME TERM SOFR + 1.77%), 3.71%, 4/24/2028 (d) | | |
(3-MONTH CME TERM SOFR + 1.63%), 3.59%, 7/21/2028 (d) | | |
(SOFR + 2.04%), 4.95%, 7/22/2028 (d) | | |
(3-MONTH CME TERM SOFR + 1.30%), 3.42%, 12/20/2028 (d) | | |
(SOFR + 1.63%), 5.20%, 4/25/2029 (d) | | |
(SOFR + 1.06%), 2.09%, 6/14/2029 (d) | | |
(SOFR + 1.57%), 5.82%, 9/15/2029 (d) | | |
(SOFR + 1.53%), 1.90%, 7/23/2031 (d) | | |
Series N, (SOFR + 1.22%), 2.65%, 3/11/2032 (d) | | |
(SOFR + 1.22%), 2.30%, 7/21/2032 (d) | | |
(SOFR + 1.21%), 2.57%, 10/20/2032 (d) | | |
| | |
|
|
(SOFR + 1.91%), 5.29%, 4/25/2034 (d) | | |
(SOFR + 1.84%), 5.87%, 9/15/2034 (d) | | |
(SOFR + 1.65%), 5.47%, 1/23/2035 (d) | | |
(3-MONTH CME TERM SOFR + 1.58%), 4.08%, 4/23/2040 (d) | | |
Bank of Ireland Group plc (Ireland) |
(EUR Swap Annual 5 Year + 7.92%), 7.50%, 5/19/2025 (d) (e) (f) (g) (h) | | |
(US Treasury Yield Curve Rate T Note Constant Maturity 1 Year + 2.65%), 6.25%, 9/16/2026 (a) (d) | | |
Bank of Montreal (Canada) |
| | |
| | |
Bank of Nova Scotia (The) (Canada) |
| | |
| | |
Banque Federative du Credit Mutuel SA (France) |
| | |
| | |
| | |
| | |
Barclays plc (United Kingdom) (US Treasury Yield Curve Rate T Note Constant Maturity 1 Year + 3.30%), 7.39%, 11/2/2028 (d) | | |
|
(SOFR + 1.61%), 1.90%, 9/30/2028 (a) (d) | | |
(SOFR + 1.22%), 2.16%, 9/15/2029 (a) (d) | | |
(SOFR + 1.52%), 5.18%, 1/9/2030 (a) (d) | | |
(SOFR + 1.59%), 5.50%, 5/20/2030 (a) (d) | | |
(SOFR + 1.87%), 5.89%, 12/5/2034 (a) (d) | | |
(SOFR + 1.88%), 5.74%, 2/20/2035 (a) (d) | | |
|
| | |
(SOFR + 1.98%), 6.61%, 10/19/2027 (a) (d) | | |
| | |
(SOFR + 2.27%), 6.71%, 10/19/2029 (a) (d) | | |
(SOFR + 1.31%), 2.28%, 1/20/2032 (a) (d) | | |
SEE NOTES TO FINANCIAL STATEMENTS.
| J.P. Morgan Exchange-Traded Funds | |
| | |
Corporate Bonds — continued |
|
(SOFR + 1.73%), 3.12%, 10/19/2032 (a) (d) | | |
(SOFR + 2.59%), 7.00%, 10/19/2034 (a) (d) | | |
|
(SOFR + 2.08%), 6.68%, 9/13/2027 (a) (d) | | |
(EUR Swap Annual 5 Year + 6.35%), 5.88%, 10/9/2027 (d) (e) (f) (g) (h) | | |
(EUR Swap Annual 5 Year + 3.55%), 6.25%, 2/23/2033 (d) (h) | | |
Canadian Imperial Bank of Commerce (Canada) 5.99%, 10/3/2028 | | |
Citibank NA 5.80%, 9/29/2028 | | |
|
Series W, (US Treasury Yield Curve Rate T Note Constant Maturity 5 Year + 3.60%), 4.00%, 12/10/2025 (d) (f) (g) | | |
(SOFR + 0.77%), 1.46%, 6/9/2027 (d) | | |
(3-MONTH CME TERM SOFR + 1.82%), 3.89%, 1/10/2028 (d) | | |
(SOFR + 1.28%), 3.07%, 2/24/2028 (d) | | |
(3-MONTH CME TERM SOFR + 1.65%), 3.67%, 7/24/2028 (d) | | |
(3-MONTH CME TERM SOFR + 1.45%), 4.08%, 4/23/2029 (d) | | |
(3-MONTH CME TERM SOFR + 1.60%), 3.98%, 3/20/2030 (d) | | |
(SOFR + 1.15%), 2.67%, 1/29/2031 (d) | | |
(SOFR + 3.91%), 4.41%, 3/31/2031 (d) | | |
(SOFR + 2.11%), 2.57%, 6/3/2031 (d) | | |
(SOFR + 1.17%), 2.56%, 5/1/2032 (d) | | |
(SOFR + 1.18%), 2.52%, 11/3/2032 (d) | | |
(SOFR + 2.34%), 6.27%, 11/17/2033 (d) | | |
(SOFR + 1.38%), 2.90%, 11/3/2042 (d) | | |
Cooperatieve Rabobank UA (Netherlands) (US Treasury Yield Curve Rate T Note Constant Maturity 1 Year + 1.22%), 3.65%, 4/6/2028 (a) (d) | | |
Credit Agricole SA (France) |
(SOFR + 1.68%), 1.91%, 6/16/2026 (a) (d) | | |
| | |
(SOFR + 0.89%), 1.25%, 1/26/2027 (a) (d) | | |
| | |
| | |
|
|
(SOFR + 1.86%), 6.32%, 10/3/2029 (a) (d) | | |
(SOFR + 1.69%), 5.34%, 1/10/2030 (a) (d) | | |
Danske Bank A/S (Denmark) |
(US Treasury Yield Curve Rate T Note Constant Maturity 1 Year + 1.45%), 3.77%, 3/28/2025 (a) (d) | | |
(3-MONTH SOFR + 1.59%), 3.24%, 12/20/2025 (a) (d) | | |
(US Treasury Yield Curve Rate T Note Constant Maturity 1 Year + 1.40%), 5.71%, 3/1/2030 (a) (d) | | |
DNB Bank ASA (Norway) (US Treasury Yield Curve Rate T Note Constant Maturity 1 Year + 0.85%), 1.13%, 9/16/2026 (a) (d) | | |
HSBC Holdings plc (United Kingdom) |
(SOFR + 1.29%), 1.59%, 5/24/2027 (d) | | |
(SOFR + 1.57%), 5.89%, 8/14/2027 (d) | | |
(SOFR + 1.10%), 2.25%, 11/22/2027 (d) | | |
(3-MONTH CME TERM SOFR + 1.81%), 4.04%, 3/13/2028 (d) | | |
(SOFR + 2.61%), 5.21%, 8/11/2028 (d) | | |
(SOFR + 1.73%), 2.01%, 9/22/2028 (d) | | |
(SOFR + 3.35%), 7.39%, 11/3/2028 (d) | | |
(SOFR + 1.29%), 2.21%, 8/17/2029 (d) | | |
(3-MONTH CME TERM SOFR + 1.87%), 3.97%, 5/22/2030 (d) | | |
(SOFR + 1.19%), 2.80%, 5/24/2032 (d) | | |
(SOFR + 1.41%), 2.87%, 11/22/2032 (d) | | |
(SOFR + 2.39%), 6.25%, 3/9/2034 (d) | | |
| | |
ING Groep NV (Netherlands) (SOFR + 1.56%), 6.08%, 9/11/2027 (d) | | |
Intesa Sanpaolo SpA (Italy) |
(EUR Swap Annual 5 Year + 7.19%), 7.75%, 1/11/2027 (d) (e) (f) (g) (h) | | |
| | |
(US Treasury Yield Curve Rate T Note Constant Maturity 1 Year + 2.75%), 4.95%, 6/1/2042 (a) (d) | | |
KBC Group NV (Belgium) (EURIBOR ICE Swap Rate 5 Year + 4.93%), 8.00%, 9/5/2028 (d) (e) (f) (g) (h) | | |
SEE NOTES TO FINANCIAL STATEMENTS.
| J.P. Morgan Exchange-Traded Funds | |
JPMorgan Core Plus Bond ETF
SCHEDULE OF PORTFOLIO INVESTMENTSAS OF February 29, 2024 (continued)
| | |
Corporate Bonds — continued |
|
KeyCorp (SOFR + 2.42%), 6.40%, 3/6/2035 (d) | | |
Lloyds Banking Group plc (United Kingdom) |
(US Treasury Yield Curve Rate T Note Constant Maturity 1 Year + 1.60%), 3.51%, 3/18/2026 (d) | | |
(US Treasury Yield Curve Rate T Note Constant Maturity 1 Year + 1.38%), 5.46%, 1/5/2028 (d) | | |
(US Treasury Yield Curve Rate T Note Constant Maturity 1 Year + 2.30%), 4.98%, 8/11/2033 (d) | | |
(US Treasury Yield Curve Rate T Note Constant Maturity 1 Year + 1.75%), 5.68%, 1/5/2035 (d) | | |
Mitsubishi UFJ Financial Group, Inc. (Japan) |
| | |
(US Treasury Yield Curve Rate T Note Constant Maturity 1 Year + 0.75%), 1.54%, 7/20/2027 (d) | | |
Series 8NC7, (US Treasury Yield Curve Rate T Note Constant Maturity 1 Year + 1.53%), 5.48%, 2/22/2031 (d) | | |
Mizuho Financial Group, Inc. (Japan) (US Treasury Yield Curve Rate T Note Constant Maturity 1 Year + 1.65%), 5.78%, 7/6/2029 (d) | | |
Morgan Stanley Bank NA 4.75%, 4/21/2026 | | |
National Australia Bank Ltd. (Australia) 4.90%, 6/13/2028 | | |
NatWest Group plc (United Kingdom) |
(US Treasury Yield Curve Rate T Note Constant Maturity 1 Year + 2.85%), 7.47%, 11/10/2026 (d) | | |
(US Treasury Yield Curve Rate T Note Constant Maturity 1 Year + 1.35%), 5.85%, 3/2/2027 (d) | | |
(US Treasury Yield Curve Rate T Note Constant Maturity 1 Year + 2.55%), 3.07%, 5/22/2028 (d) | | |
(3-MONTH SOFR + 1.91%), 5.08%, 1/27/2030 (d) | | |
(US Treasury Yield Curve Rate T Note Constant Maturity 1 Year + 1.50%), 5.78%, 3/1/2035 (d) | | |
Nordea Bank Abp (Finland) 5.38%, 9/22/2027 (a) | | |
| | |
|
|
PNC Financial Services Group, Inc. (The) |
| | |
(SOFR + 0.98%), 2.31%, 4/23/2032 (d) | | |
(SOFR + 1.95%), 5.94%, 8/18/2034 (d) | | |
(SOFR + 2.28%), 6.88%, 10/20/2034 (d) | | |
(SOFR + 1.90%), 5.68%, 1/22/2035 (d) | | |
Royal Bank of Canada (Canada) |
| | |
| | |
Santander Holdings USA, Inc. (SOFR + 2.50%), 6.17%, 1/9/2030 (d) | | |
Santander UK Group Holdings plc (United Kingdom) |
(SOFR + 2.75%), 6.83%, 11/21/2026 (d) | | |
(SOFR + 0.99%), 1.67%, 6/14/2027 (d) | | |
(SOFR + 2.60%), 6.53%, 1/10/2029 (d) | | |
Skandinaviska Enskilda Banken AB (Sweden) 5.38%, 3/5/2029 (a) | | |
Societe Generale SA (France) |
| | |
(US Treasury Yield Curve Rate T Note Constant Maturity 1 Year + 1.10%), 1.49%, 12/14/2026 (a) (d) | | |
(US Treasury Yield Curve Rate T Note Constant Maturity 1 Year + 2.30%), 6.45%, 1/12/2027 (a) (d) | | |
(US Treasury Yield Curve Rate T Note Constant Maturity 1 Year + 1.00%), 1.79%, 6/9/2027 (a) (d) | | |
(US Treasury Yield Curve Rate T Note Constant Maturity 1 Year + 1.30%), 2.80%, 1/19/2028 (a) (d) | | |
(US Treasury Yield Curve Rate T Note Constant Maturity 1 Year + 2.55%), 6.45%, 1/10/2029 (a) (d) | | |
(US Treasury Yield Curve Rate T Note Constant Maturity 1 Year + 1.75%), 5.63%, 1/19/2030 (a) (d) | | |
(US Treasury Yield Curve Rate T Note Constant Maturity 1 Year + 2.10%), 6.07%, 1/19/2035 (a) (d) | | |
Standard Chartered plc (United Kingdom) |
(US Treasury Yield Curve Rate T Note Constant Maturity 1 Year + 1.00%), 1.46%, 1/14/2027 (a) (d) | | |
SEE NOTES TO FINANCIAL STATEMENTS.
| J.P. Morgan Exchange-Traded Funds | |
| | |
Corporate Bonds — continued |
|
(US Treasury Yield Curve Rate T Note Constant Maturity 1 Year + 3.45%), 7.77%, 11/16/2028 (a) (d) | | |
(US Treasury Yield Curve Rate T Note Constant Maturity 1 Year + 2.45%), 6.30%, 1/9/2029 (a) | | |
(US Treasury Yield Curve Rate T Note Constant Maturity 1 Year + 2.20%), 7.02%, 2/8/2030 (a) (d) | | |
(US Treasury Yield Curve Rate T Note Constant Maturity 1 Year + 2.10%), 6.10%, 1/11/2035 (a) (d) | | |
Sumitomo Mitsui Financial Group, Inc. (Japan) |
| | |
| | |
| | |
| | |
Sumitomo Mitsui Trust Bank Ltd. (Japan) |
| | |
| | |
Svenska Handelsbanken AB (Sweden) 5.50%, 6/15/2028 (a) | | |
|
| | |
| | |
Toronto-Dominion Bank (The) (Canada) |
| | |
| | |
| | |
| | |
| | |
Truist Bank 4.05%, 11/3/2025 | | |
|
(SOFR + 2.05%), 6.05%, 6/8/2027 (d) | | |
(SOFR + 1.85%), 5.12%, 1/26/2034 (d) | | |
(SOFR + 2.36%), 5.87%, 6/8/2034 (d) | | |
(SOFR + 1.92%), 5.71%, 1/24/2035 (d) | | |
UniCredit SpA (Italy) (US Treasury Yield Curve Rate T Note Constant Maturity 1 Year + 1.20%), 1.98%, 6/3/2027 (a) (d) | | |
|
(SOFR + 0.73%), 2.22%, 1/27/2028 (d) | | |
(SOFR + 1.56%), 5.38%, 1/23/2030 (d) | | |
(SOFR + 1.86%), 5.68%, 1/23/2035 (d) | | |
| | |
|
|
|
| | |
(3-MONTH CME TERM SOFR + 1.01%), 2.16%, 2/11/2026 (d) | | |
(SOFR + 1.32%), 3.91%, 4/25/2026 (d) | | |
| | |
(3-MONTH CME TERM SOFR + 1.57%), 3.58%, 5/22/2028 (d) | | |
(SOFR + 1.98%), 4.81%, 7/25/2028 (d) | | |
(SOFR + 1.74%), 5.57%, 7/25/2029 (d) | | |
(SOFR + 1.79%), 6.30%, 10/23/2029 (d) | | |
(SOFR + 1.50%), 5.20%, 1/23/2030 (d) | | |
(3-MONTH CME TERM SOFR + 1.26%), 2.57%, 2/11/2031 (d) | | |
(SOFR + 1.50%), 3.35%, 3/2/2033 (d) | | |
(SOFR + 2.02%), 5.39%, 4/24/2034 (d) | | |
(SOFR + 1.99%), 5.56%, 7/25/2034 (d) | | |
(SOFR + 2.06%), 6.49%, 10/23/2034 (d) | | |
Westpac Banking Corp. (Australia) |
| | |
| | |
(USD SOFR Spread-Adjusted ICE Swap Rate 5 Year + 2.24%), 4.32%, 11/23/2031 (d) (e) | | |
Westpac New Zealand Ltd. (New Zealand) 5.20%, 2/28/2029 (a) | | |
| | |
|
Anheuser-Busch Cos. LLC (Belgium) 4.70%, 2/1/2036 | | |
Anheuser-Busch InBev Worldwide, Inc. (Belgium) 4.38%, 4/15/2038 | | |
Coca-Cola Femsa SAB de CV (Mexico) 2.75%, 1/22/2030 | | |
Constellation Brands, Inc. |
| | |
| | |
Diageo Capital plc (United Kingdom) 3.88%, 4/29/2043 | | |
Keurig Dr. Pepper, Inc. 3.40%, 11/15/2025 | | |
Molson Coors Beverage Co. 4.20%, 7/15/2046 | | |
PepsiCo, Inc. 2.75%, 10/21/2051 | | |
| | |
SEE NOTES TO FINANCIAL STATEMENTS.
| J.P. Morgan Exchange-Traded Funds | |
JPMorgan Core Plus Bond ETF
SCHEDULE OF PORTFOLIO INVESTMENTSAS OF February 29, 2024 (continued)
| | |
Corporate Bonds — continued |
|
|
| | |
| | |
| | |
| | |
| | |
|
| | |
| | |
| | |
Biogen, Inc. 2.25%, 5/1/2030 | | |
Emergent BioSolutions, Inc. 3.88%, 8/15/2028 (a) | | |
|
| | |
| | |
| | |
| | |
| | |
Grifols SA (Spain) 4.75%, 10/15/2028 (a) | | |
Regeneron Pharmaceuticals, Inc. 1.75%, 9/15/2030 | | |
| | |
|
Amazon.com, Inc. 3.95%, 4/13/2052 | | |
Go Daddy Operating Co. LLC |
| | |
| | |
Macy's Retail Holdings LLC 5.88%, 4/1/2029 (a) | | |
NMG Holding Co., Inc. 7.13%, 4/1/2026 (a) | | |
|
| | |
| | |
Shutterfly Finance LLC 8.50% (Blend (Cash 4.25% + PIK 4.25%)), 10/1/2027 (a) (c) | | |
| | |
|
Builders FirstSource, Inc. |
| | |
| | |
EMRLD Borrower LP 6.63%, 12/15/2030 (a) | | |
| | |
|
Building Products — continued |
Griffon Corp. 5.75%, 3/1/2028 | | |
James Hardie International Finance DAC 5.00%, 1/15/2028 (a) | | |
JELD-WEN, Inc. 4.88%, 12/15/2027 (a) | | |
Masco Corp. 1.50%, 2/15/2028 | | |
PGT Innovations, Inc. 4.38%, 10/1/2029 (a) | | |
Smyrna Ready Mix Concrete LLC 8.88%, 11/15/2031 (a) | | |
Standard Industries, Inc. |
| | |
| | |
| | |
|
| | |
| | |
| | |
|
Bank of New York Mellon Corp. (The) |
| | |
(SOFR + 1.60%), 6.32%, 10/25/2029 (d) | | |
(SOFR + 1.42%), 4.29%, 6/13/2033 (d) | | |
(SOFR + 1.85%), 6.47%, 10/25/2034 (d) | | |
Credit Suisse USA, Inc. (Switzerland) 7.13%, 7/15/2032 | | |
Deutsche Bank AG (Germany) |
(SOFR + 2.52%), 7.15%, 7/13/2027 (d) | | |
(SOFR + 1.59%), 5.71%, 2/8/2028 (d) | | |
(SOFR + 2.51%), 6.82%, 11/20/2029 (d) | | |
Goldman Sachs Group, Inc. (The) |
(3-MONTH CME TERM SOFR + 1.46%), 3.27%, 9/29/2025 (d) | | |
(SOFR + 1.08%), 5.80%, 8/10/2026 (d) | | |
| | |
(SOFR + 0.80%), 1.43%, 3/9/2027 (d) | | |
(SOFR + 1.51%), 4.39%, 6/15/2027 (d) | | |
(SOFR + 1.11%), 2.64%, 2/24/2028 (d) | | |
(3-MONTH CME TERM SOFR + 1.77%), 3.69%, 6/5/2028 (d) | | |
(3-MONTH CME TERM SOFR + 1.42%), 3.81%, 4/23/2029 (d) | | |
(3-MONTH CME TERM SOFR + 1.56%), 4.22%, 5/1/2029 (d) | | |
SEE NOTES TO FINANCIAL STATEMENTS.
| J.P. Morgan Exchange-Traded Funds | |
| | |
Corporate Bonds — continued |
Capital Markets — continued |
(SOFR + 1.77%), 6.48%, 10/24/2029 (d) | | |
(SOFR + 1.28%), 2.62%, 4/22/2032 (d) | | |
(SOFR + 1.41%), 3.10%, 2/24/2033 (d) | | |
(SOFR + 1.51%), 3.21%, 4/22/2042 (d) | | |
(SOFR + 1.63%), 3.44%, 2/24/2043 (d) | | |
LPL Holdings, Inc. 4.00%, 3/15/2029 (a) | | |
Macquarie Group Ltd. (Australia) (3-MONTH SOFR + 1.75%), 5.03%, 1/15/2030 (a) (d) | | |
|
| | |
| | |
(SOFR + 0.88%), 1.59%, 5/4/2027 (d) | | |
(SOFR + 1.00%), 2.48%, 1/21/2028 (d) | | |
| | |
(SOFR + 1.73%), 5.12%, 2/1/2029 (d) | | |
(SOFR + 1.59%), 5.16%, 4/20/2029 (d) | | |
(SOFR + 1.63%), 5.45%, 7/20/2029 (d) | | |
(SOFR + 1.83%), 6.41%, 11/1/2029 (d) | | |
(SOFR + 1.45%), 5.17%, 1/16/2030 (d) | | |
(3-MONTH CME TERM SOFR + 1.89%), 4.43%, 1/23/2030 (d) | | |
(SOFR + 1.03%), 1.79%, 2/13/2032 (d) | | |
(SOFR + 1.29%), 2.94%, 1/21/2033 (d) | | |
(SOFR + 1.88%), 5.42%, 7/21/2034 (d) | | |
(SOFR + 2.05%), 6.63%, 11/1/2034 (d) | | |
(SOFR + 1.73%), 5.47%, 1/18/2035 (d) | | |
(US Treasury Yield Curve Rate T Note Constant Maturity 5 Year + 2.43%), 5.95%, 1/19/2038 (d) | | |
(SOFR + 1.49%), 3.22%, 4/22/2042 (d) | | |
MSCI, Inc. 4.00%, 11/15/2029 (a) | | |
Nuveen LLC 4.00%, 11/1/2028 (a) | | |
|
| | |
| | |
| | |
|
(SOFR + 1.72%), 5.82%, 11/4/2028 (d) | | |
Series I, (US Treasury Yield Curve Rate T Note Constant Maturity 5 Year + 2.61%), 6.70%, 3/15/2029 (d) (f) (g) | | |
(SOFR + 1.48%), 5.68%, 11/21/2029 (d) | | |
| | |
|
Capital Markets — continued |
UBS Group AG (Switzerland) |
(SOFRINDX + 0.98%), 1.31%, 2/2/2027 (a) (d) | | |
(US Treasury Yield Curve Rate T Note Constant Maturity 1 Year + 0.85%), 1.49%, 8/10/2027 (a) (d) | | |
(US Treasury Yield Curve Rate T Note Constant Maturity 1 Year + 1.75%), 4.75%, 5/12/2028 (a) (d) | | |
(US Treasury Yield Curve Rate T Note Constant Maturity 5 Year + 4.75%), 9.25%, 11/13/2028 (a) (d) (e) (f) (g) | | |
(US Treasury Yield Curve Rate T Note Constant Maturity 1 Year + 1.52%), 5.43%, 2/8/2030 (a) (d) | | |
(3-MONTH SOFR + 1.47%), 3.13%, 8/13/2030 (a) (d) | | |
(US Treasury Yield Curve Rate T Note Constant Maturity 1 Year + 2.40%), 4.99%, 8/5/2033 (a) (d) | | |
(SOFR + 3.92%), 6.54%, 8/12/2033 (a) (d) | | |
(US Treasury Yield Curve Rate T Note Constant Maturity 5 Year + 4.76%), 9.25%, 11/13/2033 (a) (d) (e) (f) (g) | | |
(SOFR + 5.02%), 9.02%, 11/15/2033 (a) (d) | | |
(US Treasury Yield Curve Rate T Note Constant Maturity 1 Year + 1.77%), 5.70%, 2/8/2035 (a) (d) | | |
| | |
| | |
|
Avient Corp. 7.13%, 8/1/2030 (a) | | |
Axalta Coating Systems LLC 4.75%, 6/15/2027 (a) | | |
CF Industries, Inc. 5.15%, 3/15/2034 | | |
|
| | |
| | |
CVR Partners LP 6.13%, 6/15/2028 (a) | | |
Ecolab, Inc. 2.13%, 2/1/2032 | | |
EIDP, Inc. 4.80%, 5/15/2033 | | |
Element Solutions, Inc. 3.88%, 9/1/2028 (a) | | |
SEE NOTES TO FINANCIAL STATEMENTS.
| J.P. Morgan Exchange-Traded Funds | |
JPMorgan Core Plus Bond ETF
SCHEDULE OF PORTFOLIO INVESTMENTSAS OF February 29, 2024 (continued)
| | |
Corporate Bonds — continued |
|
LYB International Finance III LLC 3.38%, 10/1/2040 | | |
NOVA Chemicals Corp. (Canada) |
| | |
| | |
| | |
|
| | |
| | |
| | |
Olin Corp. 5.13%, 9/15/2027 | | |
Scotts Miracle-Gro Co. (The) 4.50%, 10/15/2029 | | |
Sherwin-Williams Co. (The) 4.50%, 6/1/2047 | | |
Trinseo Materials Operating SCA 5.38%, 9/1/2025 (a) | | |
|
| | |
| | |
| | |
Commercial Services & Supplies — 0.3% |
ACCO Brands Corp. 4.25%, 3/15/2029 (a) | | |
|
| | |
| | |
Allied Universal Holdco LLC 4.63%, 6/1/2028 (a) | | |
Aramark Services, Inc. 5.00%, 2/1/2028 (a) | | |
Brink's Co. (The) 4.63%, 10/15/2027 (a) | | |
Clean Harbors, Inc. 4.88%, 7/15/2027 (a) | | |
Garda World Security Corp. (Canada) 4.63%, 2/15/2027 (a) | | |
GFL Environmental, Inc. (Canada) |
| | |
| | |
| | |
| | |
| | |
Interface, Inc. 5.50%, 12/1/2028 (a) | | |
Madison IAQ LLC 4.13%, 6/30/2028 (a) | | |
Prime Security Services Borrower LLC |
| | |
| | |
| | |
|
Commercial Services & Supplies — continued |
|
| | |
| | |
Waste Management, Inc. 1.50%, 3/15/2031 | | |
Williams Scotsman, Inc. 7.38%, 10/1/2031 (a) | | |
| | |
Communications Equipment — 0.1% |
Ciena Corp. 4.00%, 1/31/2030 (a) | | |
|
| | |
| | |
CommScope Technologies LLC 6.00%, 6/15/2025 (a) | | |
CommScope, Inc. 6.00%, 3/1/2026 (a) | | |
| | |
Construction & Engineering — 0.1% |
Bioceanico Sovereign Certificate Ltd. (Paraguay) Zero Coupon, 6/5/2034 (a) | | |
Dycom Industries, Inc. 4.50%, 4/15/2029 (a) | | |
Global Infrastructure Solutions, Inc. 5.63%, 6/1/2029 (a) | | |
MasTec, Inc. 4.50%, 8/15/2028 (a) | | |
Weekley Homes LLC 4.88%, 9/15/2028 (a) | | |
| | |
Construction Materials — 0.0% ^ |
Knife River Corp. 7.75%, 5/1/2031 (a) | | |
Martin Marietta Materials, Inc. 2.40%, 7/15/2031 | | |
| | |
|
AerCap Ireland Capital DAC (Ireland) |
| | |
| | |
| | |
|
| | |
| | |
|
| | |
| | |
| | |
SEE NOTES TO FINANCIAL STATEMENTS.
| J.P. Morgan Exchange-Traded Funds | |
| | |
Corporate Bonds — continued |
Consumer Finance — continued |
(SOFRINDX + 1.28%), 5.28%, 7/27/2029 (d) | | |
Avolon Holdings Funding Ltd. (Ireland) |
| | |
| | |
| | |
| | |
| | |
| | |
| | |
Capital One Financial Corp. (SOFR + 1.27%), 2.62%, 11/2/2032 (d) | | |
Ford Motor Credit Co. LLC |
| | |
| | |
| | |
| | |
| | |
| | |
| | |
General Motors Financial Co., Inc. |
| | |
| | |
| | |
| | |
| | |
John Deere Capital Corp. 4.70%, 6/10/2030 | | |
Navient Corp. 5.88%, 10/25/2024 | | |
|
| | |
| | |
| | |
Volkswagen International Finance NV (Germany) (EUR Swap Annual 10 Year + 3.37%), 3.88%, 6/14/2027 (d) (f) (g) (h) | | |
| | |
Consumer Staples Distribution & Retail — 0.3% |
|
| | |
| | |
| | |
|
| | |
| | |
|
Consumer Staples Distribution & Retail — continued |
| | |
| | |
| | |
Alimentation Couche-Tard, Inc. (Canada) |
| | |
| | |
| | |
| | |
Performance Food Group, Inc. 5.50%, 10/15/2027 (a) | | |
Rite Aid Corp. 8.00%, 11/15/2026 (a) (b) | | |
Sysco Corp. 2.40%, 2/15/2030 | | |
|
| | |
| | |
| | |
Containers & Packaging — 0.3% |
Ardagh Packaging Finance plc 4.13%, 8/15/2026 (a) | | |
|
| | |
| | |
Canpack SA (Poland) 3.88%, 11/15/2029 (a) | | |
|
| | |
| | |
Graphic Packaging International LLC |
| | |
| | |
LABL, Inc. 6.75%, 7/15/2026 (a) | | |
Mauser Packaging Solutions Holding Co. 7.88%, 8/15/2026 (a) | | |
Owens-Brockway Glass Container, Inc. 6.63%, 5/13/2027 (a) | | |
Packaging Corp. of America |
| | |
| | |
Pactiv Evergreen Group Issuer, Inc. 4.00%, 10/15/2027 (a) | | |
|
| | |
| | |
TriMas Corp. 4.13%, 4/15/2029 (a) | | |
SEE NOTES TO FINANCIAL STATEMENTS.
| J.P. Morgan Exchange-Traded Funds | |
JPMorgan Core Plus Bond ETF
SCHEDULE OF PORTFOLIO INVESTMENTSAS OF February 29, 2024 (continued)
| | |
Corporate Bonds — continued |
Containers & Packaging — continued |
Trivium Packaging Finance BV (Netherlands) 5.50%, 8/15/2026 (a) (j) | | |
WRKCo, Inc. 4.65%, 3/15/2026 | | |
| | |
|
American Builders & Contractors Supply Co., Inc. |
| | |
| | |
Ritchie Bros Holdings, Inc. (Canada) |
| | |
| | |
| | |
Diversified Consumer Services — 0.1% |
Service Corp. International 5.13%, 6/1/2029 | | |
Wand NewCo 3, Inc. 7.63%, 1/30/2032 (a) | | |
| | |
|
Goodman US Finance Three LLC (Australia) 3.70%, 3/15/2028 (a) | | |
|
| | |
| | |
|
| | |
| | |
| | |
WP Carey, Inc. 2.25%, 4/1/2033 | | |
| | |
Diversified Telecommunication Services — 0.6% |
Altice France SA (France) 5.13%, 7/15/2029 (a) | | |
|
| | |
| | |
| | |
| | |
| | |
|
| | |
| | |
| | |
| | |
| | |
|
Diversified Telecommunication Services — continued |
| | |
| | |
| | |
| | |
Embarq Corp. 8.00%, 6/1/2036 | | |
Frontier Communications Holdings LLC 5.88%, 10/15/2027 (a) | | |
Intelsat Jackson Holdings SA (Luxembourg) 6.50%, 3/15/2030 (a) | | |
|
| | |
| | |
NBN Co. Ltd. (Australia) 5.75%, 10/6/2028 (a) | | |
Sprint Capital Corp. 6.88%, 11/15/2028 | | |
Telecom Italia Capital SA (Italy) 6.00%, 9/30/2034 | | |
Telecom Italia SpA (Italy) 5.30%, 5/30/2024 (a) | | |
Verizon Communications, Inc. |
| | |
| | |
| | |
| | |
| | |
| | |
| | |
Electric Utilities — 2.0% |
|
| | |
| | |
Baltimore Gas and Electric Co. |
| | |
| | |
| | |
Comision Federal de Electricidad (Mexico) |
| | |
| | |
Commonwealth Edison Co. 5.30%, 2/1/2053 | | |
Connecticut Light and Power Co. (The) 4.00%, 4/1/2048 | | |
Consumers 2023 Securitization Funding LLC Series A2, 5.21%, 9/1/2030 | | |
SEE NOTES TO FINANCIAL STATEMENTS.
| J.P. Morgan Exchange-Traded Funds | |
| | |
Corporate Bonds — continued |
Electric Utilities — continued |
|
| | |
| | |
DTE Electric Securitization Funding II LLC Series A-2, 6.09%, 9/1/2037 | | |
Duke Energy Carolinas LLC 3.20%, 8/15/2049 | | |
|
| | |
| | |
|
Series YYY, 3.25%, 10/1/2049 | | |
| | |
| | |
Duke Energy Ohio, Inc. 5.25%, 4/1/2033 | | |
Duquesne Light Holdings, Inc. 2.53%, 10/1/2030 (a) | | |
|
| | |
| | |
Electricite de France SA (France) 6.90%, 5/23/2053 (a) | | |
Emera US Finance LP (Canada) |
| | |
| | |
Enel Finance International NV (Italy) 2.25%, 7/12/2031 (a) | | |
Enel SpA (Italy) Series 6.5Y, (EUR Swap Annual 5 Year + 1.72%), 1.38%, 6/8/2027 (d) (f) (g) (h) | | |
|
| | |
| | |
|
| | |
| | |
| | |
|
| | |
| | |
Entergy Texas Restoration Funding LLC Series A-2, 3.70%, 12/15/2035 | | |
Entergy Texas, Inc. 1.75%, 3/15/2031 | | |
Evergy Kansas Central, Inc. 4.13%, 3/1/2042 | | |
| | |
|
Electric Utilities — continued |
|
| | |
| | |
| | |
Fells Point Funding Trust 3.05%, 1/31/2027 (a) | | |
FirstEnergy Transmission LLC 2.87%, 9/15/2028 (a) | | |
Florida Power & Light Co. |
| | |
| | |
Georgia Power Co. 5.25%, 3/15/2034 | | |
Indiana Michigan Power Co. |
Series K, 4.55%, 3/15/2046 | | |
| | |
Interchile SA (Chile) 4.50%, 6/30/2056 (a) | | |
|
| | |
| | |
| | |
Kentucky Utilities Co. 5.13%, 11/1/2040 | | |
|
| | |
| | |
Mid-Atlantic Interstate Transmission LLC 4.10%, 5/15/2028 (a) | | |
Mississippi Power Co. Series 12-A, 4.25%, 3/15/2042 | | |
Monongahela Power Co. 5.85%, 2/15/2034 (a) | | |
Nevada Power Co. 6.00%, 3/15/2054 | | |
NextEra Energy Capital Holdings, Inc. |
| | |
| | |
| | |
Northern States Power Co. 2.60%, 6/1/2051 | | |
|
| | |
| | |
| | |
| | |
| | |
|
Series P, 2.60%, 4/1/2030 | | |
SEE NOTES TO FINANCIAL STATEMENTS.
| J.P. Morgan Exchange-Traded Funds | |
JPMorgan Core Plus Bond ETF
SCHEDULE OF PORTFOLIO INVESTMENTSAS OF February 29, 2024 (continued)
| | |
Corporate Bonds — continued |
Electric Utilities — continued |
Series R, 2.90%, 10/1/2051 | | |
Oklahoma Gas and Electric Co. 5.40%, 1/15/2033 | | |
Oncor Electric Delivery Co. LLC |
| | |
| | |
Pacific Gas and Electric Co. |
| | |
| | |
| | |
| | |
| | |
| | |
| | |
| | |
| | |
| | |
| | |
|
| | |
| | |
PG&E Recovery Funding LLC Series A-3, 5.54%, 7/15/2047 | | |
PG&E Wildfire Recovery Funding LLC |
Series A-2, 4.26%, 6/1/2036 | | |
Series A-4, 5.21%, 12/1/2047 | | |
Series A-5, 5.10%, 6/1/2052 | | |
PPL Electric Utilities Corp. |
| | |
| | |
Public Service Co. of Oklahoma |
| | |
Series G, 6.63%, 11/15/2037 | | |
Series K, 3.15%, 8/15/2051 | | |
Public Service Electric and Gas Co. 4.65%, 3/15/2033 | | |
SCE Recovery Funding LLC Series A-1, 4.70%, 6/15/2040 | | |
Sigeco Securitization I LLC |
Series A1, 5.03%, 11/15/2036 | | |
Series A2, 5.17%, 5/15/2041 | | |
Southern California Edison Co. |
| | |
| | |
Series G, 2.50%, 6/1/2031 | | |
| | |
|
Electric Utilities — continued |
| | |
Series C, 4.13%, 3/1/2048 | | |
Series 20A, 2.95%, 2/1/2051 | | |
| | |
| | |
|
| | |
| | |
Southwestern Electric Power Co. |
Series N, 1.65%, 3/15/2026 | | |
| | |
| | |
Southwestern Public Service Co. 4.50%, 8/15/2041 | | |
Tierra Mojada Luxembourg II SARL (Mexico) 5.75%, 12/1/2040 (a) | | |
Tucson Electric Power Co. |
| | |
| | |
| | |
|
| | |
| | |
Virginia Electric and Power Co. 5.70%, 8/15/2053 | | |
Vistra Operations Co. LLC |
| | |
| | |
| | |
| | |
| | |
Wisconsin Public Service Corp. 4.75%, 11/1/2044 | | |
| | |
Electrical Equipment — 0.1% |
Eaton Corp. 4.15%, 3/15/2033 | | |
EnerSys 4.38%, 12/15/2027 (a) | | |
|
| | |
| | |
| | |
| | |
|
| | |
SEE NOTES TO FINANCIAL STATEMENTS.
| J.P. Morgan Exchange-Traded Funds | |
| | |
Corporate Bonds — continued |
Electrical Equipment — continued |
| | |
Vertiv Group Corp. 4.13%, 11/15/2028 (a) | | |
| | |
Electronic Equipment, Instruments & Components — 0.1% |
Arrow Electronics, Inc. 2.95%, 2/15/2032 | | |
Coherent Corp. 5.00%, 12/15/2029 (a) | | |
Corning, Inc. 3.90%, 11/15/2049 | | |
Sensata Technologies, Inc. 4.38%, 2/15/2030 (a) | | |
| | |
Energy Equipment & Services — 0.2% |
Archrock Partners LP 6.88%, 4/1/2027 (a) | | |
Baker Hughes Holdings LLC 2.06%, 12/15/2026 | | |
Diamond Foreign Asset Co. 8.50%, 10/1/2030 (a) | | |
Guara Norte SARL (Brazil) 5.20%, 6/15/2034 (a) | | |
Nabors Industries, Inc. 7.38%, 5/15/2027 (a) | | |
Noble Finance II LLC 8.00%, 4/15/2030 (a) | | |
Precision Drilling Corp. (Canada) 7.13%, 1/15/2026 (a) | | |
Schlumberger Holdings Corp. 3.90%, 5/17/2028 (a) | | |
Transocean, Inc. 8.75%, 2/15/2030 (a) | | |
USA Compression Partners LP 6.88%, 4/1/2026 | | |
Valaris Ltd. 8.38%, 4/30/2030 (a) | | |
| | |
|
|
| | |
| | |
| | |
Live Nation Entertainment, Inc. |
| | |
| | |
| | |
Take-Two Interactive Software, Inc. 3.70%, 4/14/2027 | | |
Walt Disney Co. (The) 6.65%, 11/15/2037 | | |
Warnermedia Holdings, Inc. |
| | |
| | |
|
Entertainment — continued |
| | |
| | |
| | |
WMG Acquisition Corp. 3.88%, 7/15/2030 (a) | | |
| | |
Financial Services — 0.3% |
|
| | |
| | |
Fiserv, Inc. 3.20%, 7/1/2026 | | |
Global Payments, Inc. 3.20%, 8/15/2029 | | |
GTCR W-2 Merger Sub LLC 7.50%, 1/15/2031 (a) | | |
LSEGA Financing plc (United Kingdom) 2.00%, 4/6/2028 (a) | | |
Nationstar Mortgage Holdings, Inc. 6.00%, 1/15/2027 (a) | | |
Nationwide Building Society (United Kingdom) (3-MONTH SOFR + 1.45%), 4.30%, 3/8/2029 (a) (d) | | |
NCR Atleos Corp. 9.50%, 4/1/2029 (a) | | |
PayPal Holdings, Inc. 5.05%, 6/1/2052 | | |
|
| | |
| | |
Shell International Finance BV (Netherlands) |
| | |
| | |
| | |
| | |
Siemens Financieringsmaatschappij NV (Germany) 3.30%, 9/15/2046 (a) | | |
Visa, Inc. 2.70%, 4/15/2040 | | |
| | |
|
Bunge Ltd. Finance Corp. 2.75%, 5/14/2031 | | |
Campbell Soup Co. 4.15%, 3/15/2028 | | |
Cargill, Inc. 4.38%, 4/22/2052 (a) | | |
Darling Ingredients, Inc. |
| | |
| | |
General Mills, Inc. 4.15%, 2/15/2043 | | |
JBS USA LUX SA 6.75%, 3/15/2034 (a) | | |
SEE NOTES TO FINANCIAL STATEMENTS.
| J.P. Morgan Exchange-Traded Funds | |
JPMorgan Core Plus Bond ETF
SCHEDULE OF PORTFOLIO INVESTMENTSAS OF February 29, 2024 (continued)
| | |
Corporate Bonds — continued |
Food Products — continued |
Lamb Weston Holdings, Inc. 4.13%, 1/31/2030 (a) | | |
|
| | |
| | |
| | |
Viterra Finance BV (Netherlands) 3.20%, 4/21/2031 (a) | | |
| | |
|
|
| | |
| | |
| | |
|
| | |
| | |
| | |
Boston Gas Co. 3.00%, 8/1/2029 (a) | | |
Piedmont Natural Gas Co., Inc. 5.05%, 5/15/2052 | | |
Southern California Gas Co. Series XX, 2.55%, 2/1/2030 | | |
Superior Plus LP (Canada) 4.50%, 3/15/2029 (a) | | |
| | |
Ground Transportation — 0.3% |
Avis Budget Car Rental LLC |
| | |
| | |
| | |
| | |
Burlington Northern Santa Fe LLC |
| | |
| | |
Canadian Pacific Railway Co. (Canada) |
| | |
| | |
CSX Corp. 4.50%, 11/15/2052 | | |
EquipmentShare.com, Inc. 9.00%, 5/15/2028 (a) | | |
|
| | |
| | |
| | |
|
Ground Transportation — continued |
First Student Bidco, Inc. 4.00%, 7/31/2029 (a) | | |
Hertz Corp. (The) 4.63%, 12/1/2026 (a) | | |
Norfolk Southern Corp. 3.95%, 10/1/2042 | | |
Penske Truck Leasing Co. LP 1.20%, 11/15/2025 (a) | | |
RXO, Inc. 7.50%, 11/15/2027 (a) | | |
Triton Container International Ltd. (Bermuda) 1.15%, 6/7/2024 (a) | | |
Uber Technologies, Inc. 7.50%, 9/15/2027 (a) | | |
|
| | |
| | |
|
| | |
| | |
| | |
Health Care Equipment & Supplies — 0.2% |
Abbott Laboratories 4.75%, 11/30/2036 | | |
Avantor Funding, Inc. 4.63%, 7/15/2028 (a) | | |
Baxter International, Inc. 1.73%, 4/1/2031 | | |
Becton Dickinson & Co. 3.70%, 6/6/2027 | | |
Boston Scientific Corp. 6.50%, 11/15/2035 (j) | | |
DH Europe Finance II SARL 3.25%, 11/15/2039 | | |
Hologic, Inc. 3.25%, 2/15/2029 (a) | | |
|
| | |
| | |
Teleflex, Inc. 4.25%, 6/1/2028 (a) | | |
| | |
Health Care Providers & Services — 1.2% |
Acadia Healthcare Co., Inc. |
| | |
| | |
AdaptHealth LLC 4.63%, 8/1/2029 (a) | | |
|
| | |
| | |
| | |
Cencora, Inc. 5.13%, 2/15/2034 | | |
Centene Corp. 4.63%, 12/15/2029 | | |
SEE NOTES TO FINANCIAL STATEMENTS.
| J.P. Morgan Exchange-Traded Funds | |
| | |
Corporate Bonds — continued |
Health Care Providers & Services — continued |
|
| | |
| | |
|
| | |
| | |
| | |
Community Health Network, Inc. Series 20-A, 3.10%, 5/1/2050 | | |
Community Health Systems, Inc. |
| | |
| | |
| | |
|
| | |
| | |
| | |
| | |
DaVita, Inc. 4.63%, 6/1/2030 (a) | | |
|
| | |
| | |
| | |
Hackensack Meridian Health, Inc. Series 2020, 2.68%, 9/1/2041 | | |
|
| | |
| | |
| | |
| | |
| | |
| | |
| | |
| | |
| | |
| | |
Memorial Health Services 3.45%, 11/1/2049 | | |
MultiCare Health System 2.80%, 8/15/2050 | | |
MyMichigan Health Series 2020, 3.41%, 6/1/2050 | | |
New York and Presbyterian Hospital (The) 2.61%, 8/1/2060 | | |
Northwell Healthcare, Inc. 4.26%, 11/1/2047 | | |
| | |
|
Health Care Providers & Services — continued |
Northwestern Memorial Healthcare Obligated Group Series 2021, 2.63%, 7/15/2051 | | |
Owens & Minor, Inc. 4.50%, 3/31/2029 (a) | | |
|
| | |
| | |
Sutter Health 5.55%, 8/15/2053 | | |
|
| | |
| | |
| | |
| | |
| | |
| | |
|
| | |
| | |
| | |
| | |
| | |
Health Care REITs — 0.0% ^ |
|
| | |
| | |
Sabra Health Care LP 3.20%, 12/1/2031 | | |
| | |
Health Care Technology — 0.0% ^ |
|
| | |
| | |
| | |
Hotel & Resort REITs — 0.0% ^ |
|
| | |
| | |
| | |
Hotels, Restaurants & Leisure — 0.9% |
|
| | |
| | |
| | |
Acushnet Co. 7.38%, 10/15/2028 (a) | | |
SEE NOTES TO FINANCIAL STATEMENTS.
| J.P. Morgan Exchange-Traded Funds | |
JPMorgan Core Plus Bond ETF
SCHEDULE OF PORTFOLIO INVESTMENTSAS OF February 29, 2024 (continued)
| | |
Corporate Bonds — continued |
Hotels, Restaurants & Leisure — continued |
Boyd Gaming Corp. 4.75%, 12/1/2027 | | |
Boyne USA, Inc. 4.75%, 5/15/2029 (a) | | |
Caesars Entertainment, Inc. |
| | |
| | |
| | |
|
| | |
| | |
| | |
Carnival Holdings Bermuda Ltd. 10.38%, 5/1/2028 (a) | | |
|
| | |
| | |
Hilton Domestic Operating Co., Inc. |
| | |
| | |
| | |
| | |
International Game Technology plc 6.25%, 1/15/2027 (a) | | |
Las Vegas Sands Corp. 2.90%, 6/25/2025 | | |
Marriott Ownership Resorts, Inc. 4.50%, 6/15/2029 (a) | | |
McDonald's Corp. 5.45%, 8/14/2053 | | |
MGM Resorts International |
| | |
| | |
| | |
Royal Caribbean Cruises Ltd. |
| | |
| | |
| | |
| | |
|
| | |
| | |
| | |
Six Flags Entertainment Corp. 7.25%, 5/15/2031 (a) | | |
Six Flags Theme Parks, Inc. 7.00%, 7/1/2025 (a) | | |
|
| | |
| | |
|
Hotels, Restaurants & Leisure — continued |
| | |
| | |
Station Casinos LLC 4.50%, 2/15/2028 (a) | | |
Travel + Leisure Co. 5.65%, 4/1/2024 (j) | | |
Vail Resorts, Inc. 6.25%, 5/15/2025 (a) | | |
Wynn Las Vegas LLC 5.25%, 5/15/2027 (a) | | |
|
| | |
| | |
|
| | |
| | |
|
| | |
| | |
| | |
Household Durables — 0.2% |
CD&R Smokey Buyer, Inc. 6.75%, 7/15/2025 (a) | | |
|
| | |
| | |
| | |
Tempur Sealy International, Inc. 4.00%, 4/15/2029 (a) | | |
| | |
Household Products — 0.1% |
|
| | |
| | |
|
| | |
| | |
Spectrum Brands, Inc. 5.00%, 10/1/2029 (a) | | |
| | |
Independent Power and Renewable Electricity Producers — 0.2% |
|
| | |
| | |
| | |
Constellation Energy Generation LLC |
| | |
SEE NOTES TO FINANCIAL STATEMENTS.
| J.P. Morgan Exchange-Traded Funds | |
| | |
Corporate Bonds — continued |
Independent Power and Renewable Electricity Producers — continued |
| | |
| | |
| | |
| | |
| | |
| | |
Industrial Conglomerates — 0.0% ^ |
Honeywell International, Inc. 5.25%, 3/1/2054 | | |
Industrial REITs — 0.0% ^ |
|
| | |
| | |
| | |
|
Alleghany Corp. 3.25%, 8/15/2051 | | |
Aon Corp. 5.35%, 2/28/2033 | | |
Aon North America, Inc. 5.75%, 3/1/2054 | | |
|
| | |
| | |
Berkshire Hathaway Finance Corp. |
| | |
| | |
Cincinnati Financial Corp. 6.13%, 11/1/2034 | | |
CNA Financial Corp. 5.13%, 2/15/2034 | | |
Corebridge Global Funding 5.90%, 9/19/2028 (a) | | |
Equitable Financial Life Global Funding 1.70%, 11/12/2026 (a) | | |
F&G Global Funding 1.75%, 6/30/2026 (a) | | |
Fidelity & Guaranty Life Holdings, Inc. 5.50%, 5/1/2025 (a) | | |
Great-West Lifeco Finance 2018 LP (Canada) 4.58%, 5/17/2048 (a) | | |
Guardian Life Global Funding 5.74%, 10/2/2028 (a) | | |
High Street Funding Trust I 4.11%, 2/15/2028 (a) | | |
Manulife Financial Corp. (Canada) 4.15%, 3/4/2026 | | |
Marsh & McLennan Cos., Inc. 5.45%, 3/15/2053 | | |
| | |
|
|
|
| | |
| | |
Metropolitan Life Global Funding I 5.15%, 3/28/2033 (a) | | |
Mutual of Omaha Cos. Global Funding 5.45%, 12/12/2028 (a) | | |
New York Life Global Funding 3.00%, 1/10/2028 (a) | | |
New York Life Insurance Co. 4.45%, 5/15/2069 (a) | | |
Pacific Life Global Funding II 5.50%, 8/28/2026 (a) | | |
Pacific Life Insurance Co. (3-MONTH SOFR + 2.80%), 4.30%, 10/24/2067 (a) (d) | | |
Pricoa Global Funding I 5.55%, 8/28/2026 (a) | | |
Principal Financial Group, Inc. 3.70%, 5/15/2029 | | |
Principal Life Global Funding II 5.10%, 1/25/2029 (a) | | |
|
| | |
| | |
Protective Life Global Funding 5.47%, 12/8/2028 (a) | | |
Prudential Financial, Inc. |
| | |
| | |
Prudential Funding Asia plc (Hong Kong) 3.13%, 4/14/2030 | | |
Teachers Insurance & Annuity Association of America 4.27%, 5/15/2047 (a) | | |
Travelers Cos., Inc. (The) 5.35%, 11/1/2040 | | |
W R Berkley Corp. 3.55%, 3/30/2052 | | |
| | |
Interactive Media & Services — 0.0% ^ |
|
| | |
| | |
TripAdvisor, Inc. 7.00%, 7/15/2025 (a) | | |
| | |
|
Arches Buyer, Inc. 4.25%, 6/1/2028 (a) | | |
CGI, Inc. (Canada) 1.45%, 9/14/2026 | | |
SEE NOTES TO FINANCIAL STATEMENTS.
| J.P. Morgan Exchange-Traded Funds | |
JPMorgan Core Plus Bond ETF
SCHEDULE OF PORTFOLIO INVESTMENTSAS OF February 29, 2024 (continued)
| | |
Corporate Bonds — continued |
|
Presidio Holdings, Inc. 4.88%, 2/1/2027 (a) | | |
Twilio, Inc. 3.63%, 3/15/2029 | | |
| | |
Leisure Products — 0.0% ^ |
Hasbro, Inc. 3.90%, 11/19/2029 | | |
Life Sciences Tools & Services — 0.1% |
Charles River Laboratories International, Inc. 3.75%, 3/15/2029 (a) | | |
Danaher Corp. 2.80%, 12/10/2051 | | |
Thermo Fisher Scientific, Inc. |
| | |
| | |
| | |
|
Chart Industries, Inc. 7.50%, 1/1/2030 (a) | | |
Hillenbrand, Inc. 3.75%, 3/1/2031 | | |
Illinois Tool Works, Inc. 3.90%, 9/1/2042 | | |
Otis Worldwide Corp. 5.25%, 8/16/2028 | | |
|
| | |
| | |
Stanley Black & Decker, Inc. 2.75%, 11/15/2050 | | |
Terex Corp. 5.00%, 5/15/2029 (a) | | |
|
| | |
| | |
Wabash National Corp. 4.50%, 10/15/2028 (a) | | |
Xylem, Inc. 1.95%, 1/30/2028 | | |
| | |
Marine Transportation — 0.0% ^ |
MV24 Capital BV (Brazil) 6.75%, 6/1/2034 (a) | | |
|
Altice Financing SA (Luxembourg) 5.00%, 1/15/2028 (a) | | |
Charter Communications Operating LLC |
| | |
| | |
| | |
| | |
| | |
|
|
| | |
| | |
Clear Channel Outdoor Holdings, Inc. 5.13%, 8/15/2027 (a) | | |
|
| | |
| | |
| | |
| | |
| | |
| | |
| | |
| | |
| | |
| | |
|
| | |
| | |
| | |
Directv Financing LLC 5.88%, 8/15/2027 (a) | | |
Discovery Communications LLC 4.00%, 9/15/2055 | | |
|
| | |
| | |
DISH Network Corp. 11.75%, 11/15/2027 (a) | | |
Gannett Holdings LLC 6.00%, 11/1/2026 (a) | | |
|
| | |
| | |
| | |
iHeartCommunications, Inc. |
| | |
| | |
| | |
|
| | |
| | |
News Corp. 3.88%, 5/15/2029 (a) | | |
|
| | |
| | |
SEE NOTES TO FINANCIAL STATEMENTS.
| J.P. Morgan Exchange-Traded Funds | |
| | |
Corporate Bonds — continued |
|
Outfront Media Capital LLC |
| | |
| | |
Scripps Escrow II, Inc. 3.88%, 1/15/2029 (a) | | |
Scripps Escrow, Inc. 5.88%, 7/15/2027 (a) | | |
Sinclair Television Group, Inc. 4.13%, 12/1/2030 (a) | | |
|
| | |
| | |
| | |
| | |
Stagwell Global LLC 5.63%, 8/15/2029 (a) | | |
|
| | |
| | |
Univision Communications, Inc. |
| | |
| | |
Videotron Ltd. (Canada) 5.38%, 6/15/2024 (a) | | |
| | |
|
Alcoa Nederland Holding BV |
| | |
| | |
|
| | |
| | |
BHP Billiton Finance USA Ltd. (Australia) |
| | |
| | |
| | |
Big River Steel LLC 6.63%, 1/31/2029 (a) | | |
Carpenter Technology Corp. 6.38%, 7/15/2028 | | |
|
| | |
| | |
| | |
| | |
Corp. Nacional del Cobre de Chile (Chile) |
| | |
| | |
| | |
|
Metals & Mining — continued |
FMG Resources August 2006 Pty. Ltd. (Australia) |
| | |
| | |
|
| | |
| | |
Glencore Funding LLC (Australia) |
| | |
| | |
| | |
| | |
Kaiser Aluminum Corp. 4.63%, 3/1/2028 (a) | | |
Newmont Corp. 5.75%, 11/15/2041 (a) | | |
Novelis Corp. 4.75%, 1/30/2030 (a) | | |
Nucor Corp. 2.98%, 12/15/2055 | | |
Rio Tinto Finance USA Ltd. (Australia) 5.20%, 11/2/2040 | | |
Rio Tinto Finance USA plc (Australia) 4.13%, 8/21/2042 | | |
Teck Resources Ltd. (Canada) 5.40%, 2/1/2043 | | |
United States Steel Corp. 6.88%, 3/1/2029 | | |
Vale Overseas Ltd. (Brazil) 3.75%, 7/8/2030 | | |
| | |
Mortgage Real Estate Investment Trusts (REITs) — 0.0% ^ |
Great Ajax Operating Partnership LP Series QIB, 8.88%, 9/1/2027 (a) | | |
|
|
| | |
| | |
Ameren Illinois Co. 4.95%, 6/1/2033 | | |
Berkshire Hathaway Energy Co. 5.15%, 11/15/2043 | | |
Consolidated Edison Co. of New York, Inc. |
Series E, 4.65%, 12/1/2048 | | |
Series A, 4.13%, 5/15/2049 | | |
Consumers Energy Co. 4.63%, 5/15/2033 | | |
DTE Energy Co. 4.88%, 6/1/2028 | | |
NiSource, Inc. 5.25%, 3/30/2028 | | |
PG&E Energy Recovery Funding LLC Series A-3, 2.82%, 7/15/2046 | | |
SEE NOTES TO FINANCIAL STATEMENTS.
| J.P. Morgan Exchange-Traded Funds | |
JPMorgan Core Plus Bond ETF
SCHEDULE OF PORTFOLIO INVESTMENTSAS OF February 29, 2024 (continued)
| | |
Corporate Bonds — continued |
Multi-Utilities — continued |
|
| | |
| | |
San Diego Gas & Electric Co. |
| | |
| | |
| | |
Southern Co. Gas Capital Corp. |
| | |
| | |
Series 21A, 3.15%, 9/30/2051 | | |
WEC Energy Group, Inc. 5.60%, 9/12/2026 | | |
| | |
|
Alexandria Real Estate Equities, Inc. |
| | |
| | |
COPT Defense Properties LP 2.25%, 3/15/2026 | | |
| | |
Oil, Gas & Consumable Fuels — 2.7% |
Aker BP ASA (Norway) 3.10%, 7/15/2031 (a) | | |
Antero Midstream Partners LP |
| | |
| | |
| | |
|
| | |
| | |
Apache Corp. 4.38%, 10/15/2028 | | |
Baytex Energy Corp. (Canada) |
| | |
| | |
Blue Racer Midstream LLC 6.63%, 7/15/2026 (a) | | |
BP Capital Markets America, Inc. |
| | |
| | |
| | |
| | |
| | |
| | |
| | |
|
Oil, Gas & Consumable Fuels — continued |
BP Capital Markets plc (United Kingdom) |
(US Treasury Yield Curve Rate T Note Constant Maturity 5 Year + 4.40%), 4.88%, 3/22/2030 (d) (f) (g) | | |
(US Treasury Yield Curve Rate T Note Constant Maturity 5 Year + 2.15%), 6.45%, 12/1/2033 (d) (f) (g) | | |
|
| | |
| | |
California Resources Corp. 7.13%, 2/1/2026 (a) | | |
Cameron LNG LLC 3.70%, 1/15/2039 (a) | | |
Cheniere Energy Partners LP |
| | |
| | |
| | |
|
| | |
| | |
Chord Energy Corp. 6.38%, 6/1/2026 (a) | | |
|
| | |
| | |
| | |
CNX Resources Corp. 7.25%, 3/14/2027 (a) | | |
Columbia Pipelines Operating Co. LLC |
| | |
| | |
|
| | |
| | |
|
| | |
| | |
| | |
| | |
Coterra Energy, Inc. 3.90%, 5/15/2027 | | |
Crescent Energy Finance LLC |
| | |
| | |
|
| | |
SEE NOTES TO FINANCIAL STATEMENTS.
| J.P. Morgan Exchange-Traded Funds | |
| | |
Corporate Bonds — continued |
Oil, Gas & Consumable Fuels — continued |
| | |
| | |
Ecopetrol SA (Colombia) 8.38%, 1/19/2036 | | |
Empresa Nacional del Petroleo (Chile) 3.75%, 8/5/2026 (h) | | |
Enbridge, Inc. (Canada) (US Treasury Yield Curve Rate T Note Constant Maturity 5 Year + 4.43%), 8.50%, 1/15/2084 (d) | | |
Encino Acquisition Partners Holdings LLC 8.50%, 5/1/2028 (a) | | |
|
| | |
| | |
| | |
| | |
| | |
| | |
| | |
Eni USA, Inc. (Italy) 7.30%, 11/15/2027 | | |
EnLink Midstream LLC 5.38%, 6/1/2029 | | |
EnLink Midstream Partners LP |
| | |
| | |
Enterprise Products Operating LLC Series H, 6.65%, 10/15/2034 | | |
EQM Midstream Partners LP |
| | |
| | |
| | |
| | |
| | |
| | |
|
| | |
| | |
Flex Intermediate Holdco LLC |
| | |
| | |
|
| | |
| | |
Gray Oak Pipeline LLC 2.60%, 10/15/2025 (a) | | |
Greenko Dutch BV (India) 3.85%, 3/29/2026 (a) | | |
| | |
|
Oil, Gas & Consumable Fuels — continued |
Greensaif Pipelines Bidco SARL (Saudi Arabia) 6.51%, 2/23/2042 (a) | | |
Gulfport Energy Corp. 8.00%, 5/17/2026 (a) | | |
Hess Corp. 4.30%, 4/1/2027 | | |
Hess Midstream Operations LP |
| | |
| | |
Hilcorp Energy I LP 5.75%, 2/1/2029 (a) | | |
KazMunayGas National Co. JSC (Kazakhstan) 5.38%, 4/24/2030 (h) | | |
Kinetik Holdings LP 5.88%, 6/15/2030 (a) | | |
MEG Energy Corp. (Canada) 5.88%, 2/1/2029 (a) | | |
|
| | |
| | |
|
| | |
| | |
NGPL PipeCo LLC 3.25%, 7/15/2031 (a) | | |
|
| | |
| | |
Permian Resources Operating LLC |
| | |
| | |
| | |
| | |
Petroleos Mexicanos (Mexico) |
| | |
| | |
| | |
| | |
Phillips 66 4.65%, 11/15/2034 | | |
Pioneer Natural Resources Co. |
| | |
| | |
Raizen Fuels Finance SA (Brazil) 6.45%, 3/5/2034 (a) | | |
|
| | |
| | |
Rockies Express Pipeline LLC |
| | |
SEE NOTES TO FINANCIAL STATEMENTS.
| J.P. Morgan Exchange-Traded Funds | |
JPMorgan Core Plus Bond ETF
SCHEDULE OF PORTFOLIO INVESTMENTSAS OF February 29, 2024 (continued)
| | |
Corporate Bonds — continued |
Oil, Gas & Consumable Fuels — continued |
| | |
| | |
Sabine Pass Liquefaction LLC |
| | |
| | |
| | |
| | |
|
| | |
| | |
|
| | |
| | |
| | |
| | |
Summit Midstream Holdings LLC 9.00%, 10/15/2026 (a) (j) | | |
Suncor Energy, Inc. (Canada) 6.80%, 5/15/2038 | | |
|
| | |
| | |
| | |
| | |
Tallgrass Energy Partners LP |
| | |
| | |
| | |
| | |
| | |
TotalEnergies Capital International SA (France) |
| | |
| | |
TransCanada PipeLines Ltd. (Canada) 5.10%, 3/15/2049 | | |
Valero Energy Corp. 2.15%, 9/15/2027 | | |
Venture Global Calcasieu Pass LLC 3.88%, 8/15/2029 (a) | | |
|
| | |
| | |
| | |
Vital Energy, Inc. 10.13%, 1/15/2028 | | |
| | |
| | |
|
Passenger Airlines — 0.2% |
|
| | |
| | |
| | |
Continental Airlines Pass-Through Trust Series 2012-2, Class A Shares, 4.00%, 10/29/2024 | | |
|
| | |
| | |
Mileage Plus Holdings LLC 6.50%, 6/20/2027 (a) | | |
United Airlines Holdings, Inc. 4.88%, 1/15/2025 | | |
United Airlines Pass-Through Trust Series 2016-2, Class A Shares, 3.10%, 10/7/2028 | | |
United Airlines, Inc. 4.63%, 4/15/2029 (a) | | |
VistaJet Malta Finance plc (Switzerland) 9.50%, 6/1/2028 (a) | | |
| | |
Personal Care Products — 0.1% |
Edgewell Personal Care Co. |
| | |
| | |
Estee Lauder Cos., Inc. (The) 2.60%, 4/15/2030 | | |
Kenvue, Inc. 5.10%, 3/22/2043 | | |
Prestige Brands, Inc. 5.13%, 1/15/2028 (a) | | |
| | |
|
Astrazeneca Finance LLC (United Kingdom) |
| | |
| | |
AstraZeneca plc (United Kingdom) 1.38%, 8/6/2030 | | |
Bausch Health Americas, Inc. |
| | |
| | |
|
| | |
| | |
| | |
SEE NOTES TO FINANCIAL STATEMENTS.
| J.P. Morgan Exchange-Traded Funds | |
| | |
Corporate Bonds — continued |
Pharmaceuticals — continued |
|
| | |
| | |
| | |
| | |
| | |
| | |
| | |
| | |
| | |
Catalent Pharma Solutions, Inc. 3.13%, 2/15/2029 (a) | | |
Elanco Animal Health, Inc. 6.65%, 8/28/2028 (j) | | |
Eli Lilly & Co. 4.95%, 2/27/2063 | | |
Jazz Securities DAC 4.38%, 1/15/2029 (a) | | |
|
| | |
| | |
|
| | |
| | |
Pfizer Investment Enterprises Pte. Ltd. |
| | |
| | |
| | |
Pfizer, Inc. 4.40%, 5/15/2044 | | |
Roche Holdings, Inc. 5.49%, 11/13/2030 (a) | | |
Royalty Pharma plc 1.20%, 9/2/2025 | | |
Shire Acquisitions Investments Ireland DAC 3.20%, 9/23/2026 | | |
Takeda Pharmaceutical Co. Ltd. (Japan) |
| | |
| | |
|
| | |
| | |
| | |
Real Estate Management & Development — 0.0% ^ |
Kennedy-Wilson, Inc. 4.75%, 3/1/2029 | | |
| | |
|
Real Estate Management & Development — continued |
Ontario Teachers' Cadillac Fairview Properties Trust (Canada) 3.88%, 3/20/2027 (a) | | |
Realogy Group LLC 5.75%, 1/15/2029 (a) | | |
| | |
|
AvalonBay Communities, Inc. 3.35%, 5/15/2027 | | |
|
| | |
| | |
ERP Operating LP 3.25%, 8/1/2027 | | |
Essex Portfolio LP 2.65%, 3/15/2032 | | |
Mid-America Apartments LP 4.20%, 6/15/2028 | | |
UDR, Inc. 2.10%, 8/1/2032 | | |
| | |
|
|
| | |
| | |
|
| | |
| | |
Regency Centers LP 3.70%, 6/15/2030 | | |
Scentre Group Trust 1 (Australia) |
| | |
| | |
| | |
Semiconductors & Semiconductor Equipment — 0.5% |
Amkor Technology, Inc. 6.63%, 9/15/2027 (a) | | |
ams-OSRAM AG (Austria) 12.25%, 3/30/2029 (a) | | |
Broadcom, Inc. 3.14%, 11/15/2035 (a) | | |
|
| | |
| | |
| | |
|
| | |
| | |
| | |
SEE NOTES TO FINANCIAL STATEMENTS.
| J.P. Morgan Exchange-Traded Funds | |
JPMorgan Core Plus Bond ETF
SCHEDULE OF PORTFOLIO INVESTMENTSAS OF February 29, 2024 (continued)
| | |
Corporate Bonds — continued |
Semiconductors & Semiconductor Equipment — continued |
|
| | |
| | |
| | |
|
| | |
| | |
NVIDIA Corp. 3.50%, 4/1/2040 | | |
|
| | |
| | |
ON Semiconductor Corp. 3.88%, 9/1/2028 (a) | | |
|
| | |
| | |
Synaptics, Inc. 4.00%, 6/15/2029 (a) | | |
Texas Instruments, Inc. 5.05%, 5/18/2063 | | |
TSMC Arizona Corp. (Taiwan) 2.50%, 10/25/2031 | | |
TSMC Global Ltd. (Taiwan) 1.00%, 9/28/2027 (a) | | |
| | |
|
Black Knight InfoServ LLC 3.63%, 9/1/2028 (a) | | |
Clarivate Science Holdings Corp. 3.88%, 7/1/2028 (a) | | |
Elastic NV 4.13%, 7/15/2029 (a) | | |
|
| | |
| | |
|
| | |
| | |
|
| | |
| | |
|
| | |
| | |
| | |
| | |
| | |
| | |
| | |
|
|
| | |
| | |
RingCentral, Inc. 8.50%, 8/15/2030 (a) | | |
Roper Technologies, Inc. 1.75%, 2/15/2031 | | |
SS&C Technologies, Inc. 5.50%, 9/30/2027 (a) | | |
VMware LLC 4.65%, 5/15/2027 | | |
Workday, Inc. 3.70%, 4/1/2029 | | |
| | |
|
|
| | |
| | |
| | |
|
| | |
| | |
Equinix, Inc. 3.90%, 4/15/2032 | | |
Extra Space Storage LP 2.20%, 10/15/2030 | | |
|
| | |
| | |
Public Storage Operating Co. |
| | |
| | |
SBA Communications Corp. 3.13%, 2/1/2029 | | |
| | |
|
Asbury Automotive Group, Inc. |
| | |
| | |
AutoZone, Inc. 1.65%, 1/15/2031 | | |
|
| | |
| | |
| | |
Gap, Inc. (The) 3.63%, 10/1/2029 (a) | | |
Group 1 Automotive, Inc. 4.00%, 8/15/2028 (a) | | |
|
| | |
SEE NOTES TO FINANCIAL STATEMENTS.
| J.P. Morgan Exchange-Traded Funds | |
| | |
Corporate Bonds — continued |
Specialty Retail — continued |
| | |
| | |
| | |
Lithia Motors, Inc. 3.88%, 6/1/2029 (a) | | |
|
| | |
| | |
| | |
O'Reilly Automotive, Inc. |
| | |
| | |
Penske Automotive Group, Inc. 3.75%, 6/15/2029 | | |
PetSmart, Inc. 4.75%, 2/15/2028 (a) | | |
Sonic Automotive, Inc. 4.63%, 11/15/2029 (a) | | |
SRS Distribution, Inc. 4.63%, 7/1/2028 (a) | | |
|
| | |
| | |
TJX Cos., Inc. (The) 3.88%, 4/15/2030 | | |
| | |
Technology Hardware, Storage & Peripherals — 0.2% |
|
| | |
| | |
| | |
| | |
|
| | |
| | |
| | |
| | |
| | |
| | |
| | |
Textiles, Apparel & Luxury Goods — 0.0% ^ |
Hanesbrands, Inc. 4.88%, 5/15/2026 (a) | | |
William Carter Co. (The) 5.63%, 3/15/2027 (a) | | |
| | |
|
Altria Group, Inc. 2.45%, 2/4/2032 | | |
| | |
|
|
BAT Capital Corp. (United Kingdom) |
| | |
| | |
| | |
| | |
| | |
Philip Morris International, Inc. |
| | |
| | |
| | |
| | |
| | |
| | |
| | |
Trading Companies & Distributors — 0.3% |
|
| | |
| | |
Aviation Capital Group LLC 4.13%, 8/1/2025 (a) | | |
Herc Holdings, Inc. 5.50%, 7/15/2027 (a) | | |
Imola Merger Corp. 4.75%, 5/15/2029 (a) | | |
United Rentals North America, Inc. |
| | |
| | |
| | |
|
| | |
| | |
| | |
| | |
| | |
Transportation Infrastructure — 0.0% ^ |
Transurban Finance Co. Pty. Ltd. (Australia) 2.45%, 3/16/2031 (a) | | |
|
American Water Capital Corp. |
| | |
| | |
| | |
Wireless Telecommunication Services — 0.4% |
Altice France Holding SA (Luxembourg) 10.50%, 5/15/2027 (a) | | |
SEE NOTES TO FINANCIAL STATEMENTS.
| J.P. Morgan Exchange-Traded Funds | |
JPMorgan Core Plus Bond ETF
SCHEDULE OF PORTFOLIO INVESTMENTSAS OF February 29, 2024 (continued)
| | |
Corporate Bonds — continued |
Wireless Telecommunication Services — continued |
Hughes Satellite Systems Corp. |
| | |
| | |
Rogers Communications, Inc. (Canada) 4.55%, 3/15/2052 | | |
Sprint LLC 7.63%, 3/1/2026 | | |
|
| | |
| | |
| | |
| | |
| | |
| | |
| | |
| | |
Total Corporate Bonds
(Cost $782,682,405) | | |
Mortgage-Backed Securities — 25.8% |
FHLMC Gold Pools, 30 Year Pool # G60855, 4.50%, 12/1/2045 | | |
| | |
Pool # WN1158, 1.80%, 11/1/2028 | | |
Pool # WN2203, 3.75%, 8/1/2032 | | |
Pool # WN3233, 3.19%, 7/1/2033 | | |
Pool # N31271, 4.50%, 1/1/2036 | | |
Pool # RE0003, 4.00%, 7/1/2049 | | |
Pool # RE6055, 2.50%, 8/1/2050 | | |
FHLMC UMBS, 20 Year Pool # SC0310, 2.00%, 8/1/2042 | | |
| | |
Pool # QA5045, 4.00%, 11/1/2049 | | |
Pool # RA1983, 3.00%, 2/1/2050 | | |
Pool # QB1397, 2.50%, 7/1/2050 | | |
Pool # SD8089, 2.50%, 7/1/2050 | | |
Pool # RA5422, 3.00%, 6/1/2051 | | |
Pool # QC7968, 2.50%, 10/1/2051 | | |
Pool # RA6228, 2.50%, 11/1/2051 | | |
Pool # RA6222, 3.00%, 11/1/2051 | | |
Pool # SD3770, 2.50%, 3/1/2052 (k) | | |
Pool # SD2301, 3.50%, 3/1/2052 | | |
Pool # SD7554, 2.50%, 4/1/2052 | | |
Pool # SD1464, 3.00%, 5/1/2052 | | |
Pool # SD3781, 4.00%, 7/1/2052 | | |
Pool # SD1303, 4.50%, 7/1/2052 | | |
| | |
|
Pool # SD4181, 3.50%, 8/1/2052 | | |
Pool # QE8091, 4.00%, 8/1/2052 | | |
Pool # SD1725, 4.00%, 10/1/2052 | | |
Pool # QF3433, 5.00%, 11/1/2052 | | |
Pool # RA8766, 5.00%, 3/1/2053 | | |
Pool # SD3567, 4.50%, 5/1/2053 | | |
Pool # RA9669, 5.00%, 8/1/2053 | | |
FNMA UMBS, 15 Year Pool # FM8445, 3.00%, 4/1/2033 | | |
FNMA UMBS, 20 Year Pool # MA3004, 4.00%, 5/1/2037 | | |
| | |
Pool # AL2374, 4.00%, 12/1/2041 | | |
Pool # AL4244, 4.00%, 7/1/2042 | | |
Pool # BM1164, 3.50%, 12/1/2045 | | |
Pool # MA3073, 4.50%, 7/1/2047 | | |
Pool # BK4769, 5.00%, 8/1/2048 | | |
Pool # BN5013, 5.00%, 1/1/2049 | | |
Pool # BO1073, 4.50%, 6/1/2049 | | |
Pool # BO3039, 3.00%, 7/1/2049 | | |
Pool # BN6475, 4.00%, 7/1/2049 | | |
Pool # BO2562, 4.00%, 7/1/2049 | | |
Pool # BO4519, 4.00%, 8/1/2049 | | |
Pool # BO2203, 3.50%, 9/1/2049 | | |
Pool # FS1186, 3.50%, 1/1/2050 | | |
Pool # FM3365, 3.00%, 3/1/2050 | | |
Pool # CA5702, 2.50%, 5/1/2050 | | |
Pool # CA6587, 2.00%, 8/1/2050 (k) | | |
Pool # CA6989, 2.50%, 9/1/2050 | | |
Pool # BQ4516, 2.00%, 2/1/2051 | | |
Pool # CB0397, 3.00%, 5/1/2051 | | |
Pool # FS5384, 2.50%, 6/1/2051 | | |
Pool # FM7957, 2.50%, 7/1/2051 (k) | | |
Pool # CB1406, 3.00%, 8/1/2051 | | |
Pool # CB1411, 3.00%, 8/1/2051 | | |
Pool # BU0070, 2.50%, 10/1/2051 | | |
Pool # FM9198, 2.50%, 11/1/2051 (k) | | |
Pool # FS5389, 2.50%, 11/1/2051 | | |
Pool # FS0009, 3.50%, 11/1/2051 | | |
Pool # FM9961, 3.00%, 12/1/2051 | | |
Pool # MA4494, 3.00%, 12/1/2051 | | |
Pool # FS4108, 4.00%, 12/1/2051 | | |
Pool # CB2637, 2.50%, 1/1/2052 | | |
Pool # BV0273, 3.00%, 1/1/2052 | | |
Pool # CB2670, 3.00%, 1/1/2052 | | |
Pool # MA4548, 2.50%, 2/1/2052 | | |
SEE NOTES TO FINANCIAL STATEMENTS.
| J.P. Morgan Exchange-Traded Funds | |
| | |
Mortgage-Backed Securities — continued |
Pool # BV3930, 3.00%, 2/1/2052 | | |
Pool # BV0295, 3.50%, 2/1/2052 | | |
Pool # FS0957, 3.00%, 3/1/2052 | | |
Pool # FS1954, 3.00%, 3/1/2052 | | |
Pool # FS4393, 3.00%, 3/1/2052 | | |
Pool # CB3132, 3.50%, 3/1/2052 | | |
Pool # FS1538, 3.00%, 4/1/2052 | | |
Pool # CB3378, 4.00%, 4/1/2052 | | |
Pool # CB3384, 4.00%, 4/1/2052 | | |
Pool # BW6017, 3.50%, 5/1/2052 | | |
Pool # CB3608, 3.50%, 5/1/2052 | | |
Pool # FS2588, 4.50%, 8/1/2052 | | |
Pool # FS3536, 4.50%, 8/1/2052 | | |
Pool # CB4830, 4.50%, 9/1/2052 | | |
Pool # FS3829, 4.50%, 9/1/2052 | | |
Pool # CB4628, 5.00%, 9/1/2052 | | |
Pool # FS2982, 5.00%, 9/1/2052 | | |
Pool # CB4837, 5.00%, 10/1/2052 | | |
Pool # BX0627, 5.00%, 11/1/2052 | | |
Pool # CB5413, 4.00%, 12/1/2052 | | |
Pool # CB5428, 4.50%, 12/1/2052 | | |
Pool # BX3808, 5.00%, 3/1/2053 | | |
Pool # BX3811, 5.00%, 3/1/2053 | | |
Pool # CB5896, 5.00%, 3/1/2053 | | |
Pool # BX3824, 5.50%, 3/1/2053 | | |
Pool # CB5907, 5.50%, 3/1/2053 | | |
Pool # BY4714, 5.00%, 6/1/2053 | | |
Pool # BY4776, 5.00%, 7/1/2053 | | |
Pool # BY4736, 5.50%, 7/1/2053 | | |
Pool # BY7218, 5.00%, 9/1/2053 | | |
| | |
Pool # AM8846, 2.68%, 5/1/2025 | | |
Pool # AM0414, 2.87%, 9/1/2027 | | |
Pool # AN7560, 2.90%, 12/1/2027 | | |
Pool # BS8981, 5.04%, 2/1/2029 | | |
Pool # BL2367, 3.48%, 5/1/2029 | | |
Pool # BS6079, 3.52%, 7/1/2029 | | |
Pool # AN6730, 3.01%, 9/1/2029 | | |
Pool # BS6621, 3.50%, 9/1/2029 | | |
Pool # BS7011, 4.81%, 9/1/2029 | | |
Pool # BS8075, 5.00%, 9/1/2029 | | |
Pool # BS1577, 1.82%, 2/1/2030 | | |
Pool # BS6827, 4.19%, 5/1/2030 | | |
Pool # BS4878, 2.44%, 6/1/2030 | | |
Pool # BS8846, 4.09%, 7/1/2030 | | |
| | |
|
Pool # BS9022, 4.46%, 7/1/2030 | | |
Pool # 387898, 3.71%, 8/1/2030 | | |
Pool # BS6088, 4.04%, 8/1/2030 | | |
Pool # BS5171, 2.51%, 10/1/2030 | | |
Pool # BS5985, 3.99%, 11/1/2030 | | |
Pool # BS8033, 4.43%, 11/1/2030 | | |
Pool # BS8306, 4.52%, 12/1/2030 | | |
Pool # BS9296, 4.80%, 12/1/2030 | | |
Pool # BL9645, 1.50%, 1/1/2031 | | |
Pool # BL9627, 1.56%, 1/1/2031 | | |
Pool # BS1731, 1.82%, 1/1/2031 | | |
Pool # BS1304, 1.54%, 3/1/2031 | | |
Pool # BS2422, 1.67%, 7/1/2031 | | |
Pool # BS2898, 1.56%, 9/1/2031 | | |
Pool # BS4116, 2.28%, 10/1/2031 | | |
Pool # BS3612, 1.93%, 11/1/2031 | | |
Pool # BM6857, 1.83%, 12/1/2031 (i) | | |
Pool # BS4505, 1.93%, 1/1/2032 | | |
Pool # BS4563, 2.01%, 1/1/2032 | | |
Pool # BS3464, 2.03%, 1/1/2032 | | |
Pool # BS4709, 2.22%, 2/1/2032 | | |
Pool # BM7037, 1.75%, 3/1/2032 (i) | | |
Pool # BS4654, 2.39%, 3/1/2032 | | |
Pool # BL6367, 1.82%, 4/1/2032 | | |
Pool # BS5130, 2.55%, 4/1/2032 | | |
Pool # BS5463, 3.34%, 5/1/2032 | | |
Pool # BS5597, 3.59%, 5/1/2032 | | |
Pool # BS5195, 2.80%, 6/1/2032 | | |
Pool # BS5875, 3.66%, 6/1/2032 | | |
Pool # BS6301, 3.67%, 8/1/2032 | | |
Pool # BS6385, 3.89%, 8/1/2032 | | |
Pool # BS6448, 3.93%, 8/1/2032 | | |
Pool # BS6502, 3.41%, 9/1/2032 | | |
Pool # BS6335, 3.75%, 9/1/2032 | | |
Pool # BS6339, 3.80%, 9/1/2032 | | |
Pool # BS6347, 4.03%, 9/1/2032 | | |
Pool # BS6417, 3.83%, 10/1/2032 | | |
Pool # BS6951, 3.90%, 10/1/2032 | | |
Pool # BS6759, 3.97%, 10/1/2032 | | |
Pool # BL8708, 1.40%, 11/1/2032 | | |
Pool # BS6995, 4.18%, 11/1/2032 | | |
Pool # BS6849, 4.23%, 11/1/2032 | | |
Pool # BS6815, 4.71%, 11/1/2032 | | |
Pool # BS6994, 4.85%, 11/1/2032 | | |
Pool # BS7203, 4.98%, 11/1/2032 | | |
SEE NOTES TO FINANCIAL STATEMENTS.
| J.P. Morgan Exchange-Traded Funds | |
JPMorgan Core Plus Bond ETF
SCHEDULE OF PORTFOLIO INVESTMENTSAS OF February 29, 2024 (continued)
| | |
Mortgage-Backed Securities — continued |
Pool # BS7095, 4.80%, 12/1/2032 | | |
Pool # BS7663, 4.71%, 1/1/2033 | | |
Pool # AN8257, 3.26%, 2/1/2033 | | |
Pool # BS7671, 4.76%, 2/1/2033 | | |
Pool # BS8334, 4.71%, 3/1/2033 | | |
Pool # BS1636, 2.25%, 4/1/2033 | | |
Pool # BS7740, 4.11%, 4/1/2033 | | |
Pool # BS8277, 4.39%, 4/1/2033 | | |
Pool # BS8157, 4.51%, 4/1/2033 | | |
Pool # BS8256, 4.53%, 4/1/2033 | | |
Pool # BS8055, 4.71%, 4/1/2033 | | |
Pool # BS8250, 4.51%, 5/1/2033 | | |
Pool # BS8152, 4.55%, 5/1/2033 | | |
Pool # BS8703, 4.48%, 6/1/2033 | | |
Pool # AN6000, 3.21%, 7/1/2033 | | |
Pool # AN9725, 3.76%, 7/1/2033 | | |
Pool # BS8883, 4.58%, 7/1/2033 | | |
Pool # BS9146, 4.35%, 8/1/2033 | | |
Pool # BS6038, 3.98%, 9/1/2033 | | |
Pool # BS8897, 4.55%, 9/1/2033 | | |
Pool # BS9616, 4.79%, 9/1/2033 | | |
Pool # BS9470, 4.45%, 10/1/2033 | | |
Pool # BS9182, 4.52%, 10/1/2033 | | |
Pool # BS9310, 4.64%, 10/1/2033 | | |
Pool # BS4197, 2.14%, 12/1/2033 | | |
Pool # BZ0419, 4.25%, 1/1/2034 | | |
Pool # BZ0410, 4.52%, 1/1/2034 | | |
Pool # BZ0430, 4.32%, 2/1/2034 | | |
Pool # BZ0420, 4.60%, 2/1/2034 | | |
Pool # BL3625, 2.89%, 9/1/2034 | | |
Pool # BL3756, 2.92%, 9/1/2034 | | |
Pool # BS6427, 3.75%, 9/1/2034 | | |
Pool # BL3772, 2.92%, 10/1/2034 | | |
Pool # BS5018, 2.88%, 10/1/2035 | | |
Pool # AN7345, 3.21%, 11/1/2037 | | |
Pool # MA1072, 3.50%, 5/1/2042 | | |
Pool # BF0533, 2.50%, 11/1/2050 | | |
Pool # BF0230, 5.50%, 1/1/2058 | | |
Pool # BF0300, 4.00%, 8/1/2058 | | |
Pool # BF0400, 4.00%, 8/1/2059 | | |
Pool # BF0497, 3.00%, 7/1/2060 | | |
Pool # BF0520, 3.00%, 1/1/2061 | | |
Pool # BF0560, 2.50%, 9/1/2061 | | |
Pool # BF0562, 3.50%, 9/1/2061 | | |
Pool # BF0583, 4.00%, 12/1/2061 | | |
| | |
|
Pool # BF0586, 5.00%, 12/1/2061 | | |
Pool # BF0617, 2.50%, 3/1/2062 | | |
Pool # BF0677, 4.00%, 9/1/2062 | | |
FNMA/FHLMC UMBS, Single Family, 30 Year | | |
TBA, 2.50%, 3/25/2054 (k) | | |
TBA, 3.00%, 3/25/2054 (k) | | |
TBA, 4.00%, 3/25/2054 (k) | | |
TBA, 5.00%, 3/25/2054 (k) | | |
TBA, 5.50%, 3/25/2054 (k) | | |
TBA, 6.00%, 3/25/2054 (k) | | |
| | |
Pool # 783473, 3.50%, 11/15/2041 | | |
Pool # CO1928, 5.50%, 10/15/2052 | | |
Pool # CR2369, 6.00%, 1/15/2053 | | |
| | |
Pool # CE9366, ARM, 6.27%, 10/20/2071 (i) | | |
Pool # CH4945, ARM, 6.38%, 10/20/2071 (i) | | |
Pool # CH7776, ARM, 6.48%, 10/20/2071 (i) | | |
Pool # CJ7125, ARM, 6.51%, 10/20/2071 (i) | | |
Pool # CE9384, ARM, 6.40%, 11/20/2071 (i) | | |
Pool # CJ7141, ARM, 6.45%, 11/20/2071 (i) | | |
Pool # CE5557, ARM, 6.63%, 11/20/2071 (i) | | |
Pool # CK7234, ARM, 6.44%, 2/20/2072 (i) | | |
Pool # CK2792, ARM, 6.62%, 3/20/2072 (i) | | |
Pool # CO0363, ARM, 6.78%, 7/20/2072 (i) | | |
| | |
Pool # AJ9020, 4.50%, 10/20/2044 | | |
Pool # BB3525, 4.00%, 9/20/2047 | | |
Pool # AY2413, 4.25%, 10/20/2048 | | |
Pool # BJ9820, 4.20%, 1/20/2049 | | |
Pool # BM2418, 4.00%, 8/20/2049 | | |
Pool # BN7049, 4.50%, 8/20/2049 | | |
Pool # BP7160, 4.50%, 9/20/2049 | | |
Pool # CH1162, 3.50%, 6/20/2050 | | |
Pool # CB8492, 3.50%, 1/20/2051 | | |
Pool # CB8531, 3.50%, 2/20/2051 | | |
Pool # CC9803, 4.00%, 4/20/2051 | | |
SEE NOTES TO FINANCIAL STATEMENTS.
| J.P. Morgan Exchange-Traded Funds | |
| | |
Mortgage-Backed Securities — continued |
Pool # MA7534, 2.50%, 8/20/2051 | | |
Pool # CH1291, 3.50%, 9/20/2051 | | |
Pool # CH1293, 3.50%, 9/20/2051 | | |
Pool # CH1292, 3.50%, 10/20/2051 | | |
Pool # MA7705, 2.50%, 11/20/2051 | | |
Pool # CH7863, 3.50%, 12/20/2051 | | |
Pool # CI2080, 3.50%, 12/20/2051 | | |
Pool # CH0876, 3.00%, 1/20/2052 | | |
Pool # CH0877, 3.00%, 1/20/2052 | | |
Pool # CH0878, 3.00%, 1/20/2052 | | |
Pool # CJ3916, 3.00%, 1/20/2052 | | |
Pool # CK2608, 3.00%, 1/20/2052 | | |
Pool # CK4909, 3.00%, 1/20/2052 | | |
Pool # CK4916, 3.00%, 1/20/2052 | | |
Pool # CJ8184, 3.50%, 1/20/2052 | | |
Pool # CK4918, 3.50%, 1/20/2052 | | |
Pool # CK7137, 4.00%, 1/20/2052 | | |
Pool # CK2667, 3.00%, 2/20/2052 | | |
Pool # CK2672, 3.50%, 2/20/2052 | | |
Pool # CM2154, 3.00%, 3/20/2052 | | |
Pool # CM2278, 3.50%, 4/20/2052 | | |
Pool # CO4826, 5.00%, 6/20/2052 | | |
Pool # CO4847, 5.00%, 7/20/2052 | | |
Pool # MA8200, 4.00%, 8/20/2052 | | |
Pool # CO1924, 4.50%, 10/20/2052 | | |
Pool # CP8517, 4.50%, 10/20/2052 | | |
Pool # CO1925, 5.00%, 10/20/2052 | | |
Pool # CO8957, 5.00%, 12/20/2052 | | |
Pool # CS4305, 5.50%, 6/20/2053 | | |
Pool # CV0175, 6.50%, 6/20/2053 | | |
Pool # CS4391, 5.50%, 7/20/2053 | | |
Pool # CW7288, 6.50%, 9/20/2053 | | |
GNMA II, Single Family, 30 Year | | |
TBA, 5.00%, 3/15/2054 (k) | | |
TBA, 5.50%, 3/15/2054 (k) | | |
Total Mortgage-Backed Securities
(Cost $685,895,957) | | |
Asset-Backed Securities — 17.0% |
ACC Trust Series 2022-1, Class C, 3.24%, 10/20/2025 (a) | | |
| | |
Series 2023-1PL, Class C, 7.42%, 3/18/2030 (a) | | |
Series 2023-2PL, Class C, 7.27%, 5/20/2030 (a) | | |
| | |
|
Series 2023-3PL, Class C, 7.35%, 8/19/2030 (a) | | |
ACM Auto Trust Series 2023-2A, Class A, 7.97%, 6/20/2030 (a) | | |
ACRE Commercial Mortgage Ltd. Series 2021-FL4, Class B, 6.83%, 12/18/2037 (a) (i) | | |
Air Canada Pass-Through Trust (Canada) Series 2017-1, Class AA, 3.30%, 1/15/2030 (a) | | |
| | |
Series 2021-G, Class A, 1.87%, 6/25/2061 (a) (i) | | |
Series 2021-B, Class A, 2.24%, 6/25/2066 (a) (j) | | |
American Airlines Pass-Through Trust Series 2015-2, Class A, 4.00%, 9/22/2027 | | |
American Credit Acceptance Receivables Trust | | |
Series 2023-3, Class A, 6.00%, 3/12/2027 (a) | | |
Series 2022-2, Class E, 6.57%, 6/13/2028 (a) | | |
Series 2022-3, Class D, 5.83%, 10/13/2028 (a) | | |
Series 2023-3, Class D, 6.82%, 10/12/2029 (a) | | |
American Homes 4 Rent Trust | | |
Series 2014-SFR3, Class B, 4.20%, 12/17/2036 (a) | | |
Series 2015-SFR1, Class E, 5.64%, 4/17/2052 (a) | | |
Series 2015-SFR1, Class F, 5.89%, 4/17/2052 (a) | | |
Series 2015-SFR2, Class A, 3.73%, 10/17/2052 (a) | | |
| | |
Series 2020-SFR1, Class E, 3.22%, 4/17/2037 (a) | | |
Series 2020-SFR2, Class E2, 4.28%, 7/17/2037 (a) | | |
Series 2020-SFR3, Class E1, 2.56%, 9/17/2037 (a) | | |
Series 2020-SFR3, Class E2, 2.76%, 9/17/2037 (a) | | |
Series 2020-SFR4, Class A, 1.36%, 11/17/2037 (a) | | |
Series 2020-SFR5, Class D, 2.18%, 11/17/2037 (a) | | |
SEE NOTES TO FINANCIAL STATEMENTS.
| J.P. Morgan Exchange-Traded Funds | |
JPMorgan Core Plus Bond ETF
SCHEDULE OF PORTFOLIO INVESTMENTSAS OF February 29, 2024 (continued)
| | |
Asset-Backed Securities — continued |
Series 2020-SFR4, Class E2, 2.46%, 11/17/2037 (a) | | |
Series 2020-SFR5, Class F, 2.69%, 11/17/2037 (a) | | |
Series 2021-SFR3, Class C, 1.80%, 10/17/2038 (a) | | |
Series 2022-SFR1, Class F, 6.02%, 3/17/2039 (a) | | |
Series 2022-SFR3, Class D, 4.00%, 10/17/2039 (a) | | |
Series 2022-SFR3, Class E1, 4.00%, 10/17/2039 (a) | | |
Series 2022-SFR3, Class E2, 4.00%, 10/17/2039 (a) | | |
Series 2023-SFR1, Class E2, 4.00%, 4/17/2040 (a) | | |
Series 2023-SFR1, Class F, 4.00%, 4/17/2040 (a) | | |
Series 2023-SFR2, Class E1, 3.95%, 6/17/2040 (a) | | |
| | |
Series 2019-A, Class B, 3.47%, 7/16/2040 (a) | | |
Series 2019-A, Class D, 6.07%, 7/16/2040 (a) | | |
Avis Budget Rental Car Funding AESOP LLC Series 2020-1A, Class D, 3.34%, 8/20/2026 (a) | | |
Bastion Funding I LLC Series 2023-1A, Class A2, 7.12%, 4/25/2038 ‡ (a) | | |
Bridge Trust Series 2022-SFR1, Class A, 3.40%, 11/17/2037 (a) | | |
Bridgecrest Lending Auto Securitization Trust Series 2023-1, Class C, 7.10%, 8/15/2029 | | |
British Airways Pass-Through Trust (United Kingdom) Series 2013-1, Class A, 4.63%, 6/20/2024 (a) | | |
Business Jet Securities LLC | | |
Series 2020-1A, Class A, 2.98%, 11/15/2035 ‡ (a) | | |
Series 2020-1A, Class B, 3.97%, 11/15/2035 ‡ (a) | | |
Series 2021-1A, Class A, 2.16%, 4/15/2036 ‡ (a) | | |
Series 2021-1A, Class B, 2.92%, 4/15/2036 ‡ (a) | | |
Series 2021-1A, Class C, 5.07%, 4/15/2036 ‡ (a) | | |
| | |
|
BXG Receivables Note Trust | | |
Series 2020-A, Class C, 4.22%, 2/28/2036 (a) | | |
Series 2022-A, Class A, 4.12%, 9/28/2037 (a) | | |
Series 2023-A, Class C, 7.38%, 11/15/2038 (a) | | |
CarMax Auto Owner Trust Series 2023-4, Class A3, 6.00%, 7/17/2028 | | |
Carvana Auto Receivables Trust | | |
Series 2022-P1, Class A4, 3.52%, 2/10/2028 | | |
Series 2023-P2, Class A4, 5.38%, 3/12/2029 (a) | | |
Series 2023-P3, Class A4, 5.71%, 7/10/2029 (a) | | |
Series 2023-N3, Class C, 6.55%, 12/10/2029 (a) | | |
| | |
Series 2019-MH1, Class B, 5.00%, 11/25/2044 ‡ (a) (i) | | |
Series 2021-MH1, Class A1, 1.75%, 2/25/2046 (a) | | |
Series 2022-MH1, Class M, 4.25%, 8/25/2054 ‡ (a) (j) | | |
Continental Finance Credit Card ABS Master Trust Series 2022-A, Class A, 6.19%, 10/15/2030 (a) | | |
CoreVest American Finance Trust | | |
Series 2019-1, Class E, 5.59%, 3/15/2052 (a) (i) | | |
Series 2019-2, Class E, 5.22%, 6/15/2052 (a) (i) | | |
Series 2019-3, Class E, 4.72%, 10/15/2052 (a) (i) | | |
CPS Auto Receivables Trust | | |
Series 2022-D, Class D, 8.73%, 1/16/2029 (a) | | |
Series 2023-A, Class D, 6.44%, 4/16/2029 (a) | | |
Series 2023-D, Class C, 7.17%, 1/15/2030 (a) | | |
Series 2022-C, Class C, 5.28%, 4/15/2030 (a) | | |
Credit Acceptance Auto Loan Trust | | |
Series 2021-3A, Class C, 1.63%, 9/16/2030 (a) | | |
Series 2021-4, Class A, 1.26%, 10/15/2030 (a) | | |
SEE NOTES TO FINANCIAL STATEMENTS.
| J.P. Morgan Exchange-Traded Funds | |
| | |
Asset-Backed Securities — continued |
Series 2022-3A, Class D, 9.00%, 4/18/2033 (a) | | |
Series 2023-1A, Class C, 7.71%, 7/15/2033 (a) | | |
Series 2023-2A, Class C, 7.15%, 9/15/2033 (a) | | |
Series 2023-3A, Class C, 7.62%, 12/15/2033 (a) | | |
Series 2023-5A, Class C, 7.30%, 4/17/2034 (a) | | |
| | |
DataBank Issuer Series 2021-1A, Class A2, 2.06%, 2/27/2051 (a) | | |
Diamond Resorts Owner Trust | | |
Series 2021-1A, Class A, 1.51%, 11/21/2033 (a) | | |
Series 2021-1A, Class D, 3.83%, 11/21/2033 (a) | | |
DLLAA LLC Series 2023-1A, Class A3, 5.64%, 2/22/2028 (a) | | |
DP Lion Holdco LLC Series 2023-1A, Class B, 12.73%, 11/30/2043 ‡ | | |
Drive Auto Receivables Trust Series 2020-2, Class D, 3.05%, 5/15/2028 | | |
| | |
Series 2020-2A, Class D, 4.73%, 3/16/2026 (a) | | |
Series 2022-3A, Class C, 7.69%, 7/17/2028 (a) | | |
Series 2023-1A, Class D, 6.44%, 11/15/2028 (a) | | |
Series 2023-2A, Class D, 6.62%, 2/15/2029 (a) | | |
Elara HGV Timeshare Issuer LLC | | |
Series 2021-A, Class C, 2.09%, 8/27/2035 (a) | | |
Series 2021-A, Class D, 3.32%, 8/27/2035 (a) | | |
Exeter Automobile Receivables Trust | | |
Series 2020-2A, Class D, 4.73%, 4/15/2026 (a) | | |
Series 2023-2A, Class C, 5.75%, 7/17/2028 | | |
Series 2022-3A, Class D, 6.76%, 9/15/2028 | | |
Series 2022-5A, Class D, 7.40%, 2/15/2029 | | |
Series 2022-6A, Class D, 8.03%, 4/6/2029 | | |
| | |
|
Series 2023-4A, Class D, 6.95%, 12/17/2029 | | |
Series 2022-4A, Class E, 8.23%, 3/15/2030 (a) | | |
Series 2024-1A, Class D, 5.84%, 6/17/2030 | | |
Series 2023-4A, Class E, 9.57%, 2/18/2031 (a) | | |
| | |
Series 2023-2A, Class B, 7.49%, 11/15/2029 (a) | | |
Series 2024-1A, Class B, 6.26%, 3/15/2030 (a) | | |
| | |
Series 2021-1A, Class A, 1.27%, 3/15/2027 (a) | | |
Series 2022-2A, Class A, 6.14%, 12/15/2027 (a) | | |
First Investors Auto Owner Trust | | |
Series 2021-2A, Class C, 1.47%, 11/15/2027 (a) | | |
Series 2023-1A, Class C, 6.81%, 12/17/2029 (a) | | |
| | |
Series 2020-SFR1, Class E, 2.79%, 8/17/2037 (a) | | |
Series 2020-SFR1, Class F1, 3.64%, 8/17/2037 (a) | | |
Series 2020-SFR2, Class E, 2.67%, 10/19/2037 (a) | | |
Series 2020-SFR2, Class F1, 3.02%, 10/19/2037 (a) | | |
Series 2020-SFR2, Class F2, 3.12%, 10/19/2037 (a) | | |
Series 2022-SFR3, Class D, 3.50%, 7/17/2038 (a) | | |
Series 2022-SFR3, Class E1, 3.50%, 7/17/2038 (a) | | |
Series 2021-SFR1, Class E1, 2.39%, 8/17/2038 (a) | | |
Series 2021-SFR1, Class F1, 3.24%, 8/17/2038 (a) | | |
Series 2021-SFR1, Class F2, 3.45%, 8/17/2038 (a) | | |
Series 2021-SFR2, Class E1, 2.26%, 9/17/2038 (a) | | |
Series 2021-SFR2, Class E2, 2.36%, 9/17/2038 (a) | | |
SEE NOTES TO FINANCIAL STATEMENTS.
| J.P. Morgan Exchange-Traded Funds | |
JPMorgan Core Plus Bond ETF
SCHEDULE OF PORTFOLIO INVESTMENTSAS OF February 29, 2024 (continued)
| | |
Asset-Backed Securities — continued |
Series 2022-SFR1, Class E1, 5.00%, 5/19/2039 (a) | | |
Series 2022-SFR1, Class E2, 5.00%, 5/19/2039 (a) | | |
Series 2022-SFR2, Class E2, 4.50%, 7/17/2039 (a) | | |
Flagship Credit Auto Trust | | |
Series 2020-4, Class D, 2.18%, 2/16/2027 (a) | | |
Series 2021-4, Class C, 1.96%, 12/15/2027 (a) | | |
Series 2023-2, Class C, 5.81%, 5/15/2029 (a) | | |
| | |
Series 2021-GT1, Class B, 4.36%, 7/25/2026 (a) (i) | | |
Series 2022-GT1, Class A, 6.19%, 4/25/2027 (a) | | |
Series 2022-GT1, Class B, 7.17%, 4/25/2027 (a) | | |
Series 2022-GT2, Class B, 10.07%, 7/25/2027 (a) | | |
| | |
Series 2020-1A, Class B, 4.62%, 7/16/2040 (a) | | |
Series 2020-1A, Class C, 5.75%, 7/16/2040 (a) | | |
Series 2021-1A, Class C, 2.99%, 5/15/2041 (a) | | |
Series 2023-1A, Class D, 9.18%, 12/15/2043 (a) | | |
| | |
Series 2021-2, Class C, 1.94%, 6/19/2028 (a) | | |
Series 2022-1FP, Class D, 3.35%, 3/19/2029 (a) | | |
Series 2022-3FP, Class C, 7.05%, 8/20/2029 (a) | | |
Series 2022-4FP, Class C, 8.59%, 12/18/2029 (a) | | |
FRTKL Series 2021-SFR1, Class D, 2.17%, 9/17/2038 (a) | | |
GLS Auto Receivables Issuer Trust | | |
Series 2022-1A, Class D, 3.97%, 1/18/2028 (a) | | |
Series 2021-2A, Class E, 2.87%, 5/15/2028 (a) | | |
Series 2022-3A, Class E, 8.35%, 10/15/2029 (a) | | |
| | |
|
Series 2023-2A, Class E, 9.37%, 1/15/2030 (a) | | |
Series 2023-1A, Class E, 11.42%, 3/15/2030 (a) | | |
GLS Auto Select Receivables Trust | | |
Series 2023-1A, Class A2, 6.27%, 8/16/2027 (a) | | |
Series 2024-1A, Class B, 5.32%, 3/15/2030 (a) | | |
Series 2024-1A, Class C, 5.69%, 3/15/2030 (a) | | |
Series 2024-1A, Class D, 6.43%, 1/15/2031 (a) | | |
Hertz Vehicle Financing LLC Series 2023-3A, Class A, 5.94%, 2/25/2028 (a) | | |
HGI CRE CLO Ltd. (Cayman Islands) | | |
Series 2022-FL3, Class B, 7.92%, 4/20/2037 (a) (i) | | |
Series 2022-FL3, Class E, 9.62%, 4/20/2037 (a) (i) | | |
Hilton Grand Vacations Trust | | |
Series 2022-1D, Class D, 6.79%, 6/20/2034 (a) | | |
Series 2022-2A, Class D, 8.73%, 1/25/2037 (a) | | |
Series 2020-AA, Class C, 6.42%, 2/25/2039 (a) | | |
| | |
Series 2020-A, Class D, 5.50%, 10/9/2039 (a) | | |
Series 2020-A, Class E, 6.50%, 10/9/2039 (a) | | |
| | |
Series 2022-A, Class D, 6.50%, 5/15/2041 (a) | | |
Series 2022-A, Class E, 8.00%, 5/15/2041 (a) | | |
Home Partners of America Trust | | |
Series 2022-1, Class D, 4.73%, 4/17/2039 (a) | | |
Series 2019-2, Class A, 2.70%, 10/19/2039 (a) | | |
Series 2021-3, Class D, 3.00%, 1/17/2041 (a) | | |
John Deere Owner Trust Series 2023-B, Class A4, 5.11%, 5/15/2030 | | |
SEE NOTES TO FINANCIAL STATEMENTS.
| J.P. Morgan Exchange-Traded Funds | |
| | |
Asset-Backed Securities — continued |
| | |
Series 2020-2A, Class A, 2.32%, 4/21/2031 (a) | | |
Series 2020-2A, Class D, 6.77%, 4/21/2031 (a) | | |
Lendingpoint Asset Securitization Trust Series 2022-A, Class D, 4.54%, 6/15/2029 (a) | | |
| | |
Series 2021-1A, Class A, 1.90%, 11/20/2031 (a) | | |
Series 2021-1A, Class D, 5.05%, 11/20/2031 (a) | | |
Series 2021-2A, Class B, 2.37%, 4/20/2032 (a) | | |
Series 2021-2A, Class D, 4.46%, 4/20/2032 (a) | | |
Series 2022-1A, Class E, 7.58%, 7/20/2032 ‡ (a) | | |
Series 2023-1A, Class D, 8.69%, 5/20/2033 (a) | | |
LP LMS Asset Securitization Trust | | |
| | |
Series 2023-1A, Class B, 7.48%, 10/17/2033 (a) | | |
Series 2023-1A, Class A, 8.18%, 10/17/2033 (a) | | |
Mariner Finance Issuance Trust | | |
Series 2019-AA, Class D, 5.44%, 7/20/2032 (a) | | |
Series 2020-AA, Class D, 5.75%, 8/21/2034 (a) | | |
Series 2023-AA, Class E, 11.12%, 10/22/2035 (a) | | |
Series 2021-AA, Class B, 2.33%, 3/20/2036 (a) | | |
Series 2021-AA, Class C, 2.96%, 3/20/2036 (a) | | |
Series 2021-AA, Class D, 3.83%, 3/20/2036 (a) | | |
Series 2021-AA, Class E, 5.40%, 3/20/2036 (a) | | |
Series 2021-BA, Class E, 4.68%, 11/20/2036 (a) | | |
Series 2022-AA, Class D, 9.10%, 10/20/2037 (a) | | |
Series 2022-AA, Class E, 10.98%, 10/20/2037 ‡ (a) | | |
| | |
|
| | |
Series 2023-1A, Class C, 7.20%, 4/15/2033 (a) | | |
Series 2023-2A, Class C, 6.96%, 6/15/2033 (a) | | |
Merchants Fleet Funding LLC Series 2023-1A, Class A, 7.21%, 5/20/2036 (a) | | |
Mercury Financial Credit Card Master Trust Series 2023-1A, Class A, 8.04%, 9/20/2027 (a) | | |
MNR ABS Issuer I LLC, 12.44%, 12/15/2038 ‡ | | |
| | |
Series 2020-1A, Class C, 4.21%, 10/20/2037 (a) | | |
Series 2020-1A, Class D, 7.14%, 10/20/2037 (a) | | |
Series 2019-2A, Class B, 2.44%, 10/20/2038 (a) | | |
Series 2023-1A, Class C, 6.54%, 10/20/2040 (a) | | |
Series 2022-2A, Class C, 7.62%, 10/21/2041 (a) | | |
Series 2022-2A, Class D, 9.00%, 10/21/2041 (a) | | |
MVW Owner Trust Series 2019-1A, Class C, 3.33%, 11/20/2036 (a) | | |
New Residential Mortgage LLC Series 2020-FNT1, Class A, 5.44%, 6/25/2025 (a) | | |
New Residential Mortgage Loan Trust | | |
Series 2022-SFR1, Class D, 3.30%, 2/17/2039 (a) | | |
Series 2022-SFR1, Class E1, 3.55%, 2/17/2039 (a) | | |
Nissan Auto Lease Trust Series 2023-B, Class A4, 5.61%, 11/15/2027 | | |
NMEF Funding LLC Series 2021-A, Class C, 2.58%, 12/15/2027 (a) | | |
NRZ Excess Spread-Collateralized Notes | | |
Series 2020-PLS1, Class A, 3.84%, 12/25/2025 (a) | | |
Series 2021-FNT1, Class A, 2.98%, 3/25/2026 (a) | | |
Series 2021-FNT2, Class A, 3.23%, 5/25/2026 (a) | | |
Series 2021-GNT1, Class A, 3.47%, 11/25/2026 (a) | | |
SEE NOTES TO FINANCIAL STATEMENTS.
| J.P. Morgan Exchange-Traded Funds | |
JPMorgan Core Plus Bond ETF
SCHEDULE OF PORTFOLIO INVESTMENTSAS OF February 29, 2024 (continued)
| | |
Asset-Backed Securities — continued |
NRZ FHT Excess LLC Series 2020-FHT1, Class A, 4.21%, 11/25/2025 (a) | | |
| | |
Series 2020-1A, Class C, 2.89%, 3/20/2026 (a) | | |
Series 2022-2A, Class C, 6.29%, 7/20/2028 (a) | | |
Series 2022-2A, Class D, 7.70%, 2/20/2030 (a) | | |
Series 2024-1A, Class D, 6.43%, 10/21/2030 (a) | | |
OneMain Direct Auto Receivables Trust Series 2019-1A, Class B, 3.95%, 11/14/2028 (a) | | |
| | |
Series 2021-A, Class A, 1.21%, 3/8/2028 (a) | | |
Series 2021-A, Class C, 3.44%, 3/8/2028 (a) | | |
| | |
Series 2022-2, Class C, 9.36%, 10/9/2029 (a) | | |
Series 2022-3, Class C, 10.15%, 1/8/2030 (a) | | |
Series 2024-1A, Class C, 7.42%, 4/8/2031 (a) | | |
Series 2021-B, Class B, 1.96%, 5/8/2031 (a) | | |
Series 2021-B, Class C, 3.65%, 5/8/2031 (a) | | |
Series 2022-A, Class C, 7.40%, 6/9/2031 (a) | | |
Series 2021-C, Class A, 2.18%, 10/8/2031 (a) | | |
Pagaya AI Debt Selection Trust Series 2021-1, Class B, 2.13%, 11/15/2027 (a) | | |
PFP Ltd. (Cayman Islands) | | |
Series 2021-7, Class C, 7.09%, 4/14/2038 (a) (i) | | |
Series 2021-7, Class D, 7.84%, 4/14/2038 (a) (i) | | |
Porsche Financial Auto Securitization Trust | | |
Series 2023-1A, Class A3, 4.81%, 9/22/2028 (a) | | |
Series 2023-2A, Class A3, 5.79%, 1/22/2029 (a) | | |
| | |
|
Prestige Auto Receivables Trust Series 2022-1A, Class C, 7.09%, 8/15/2028 (a) | | |
| | |
Series 2021-NPL6, Class A1, 2.49%, 7/25/2051 (a) (j) | | |
Series 2021-RN3, Class A1, 1.84%, 9/25/2051 (a) (j) | | |
Pretium Mortgage Credit Partners I LLC Series 2021-NPL1, Class A1, 2.24%, 9/27/2060 (a) (j) | | |
Pretium Mortgage Credit Partners LLC Series 2022-NPL1, Class A1, 2.98%, 1/25/2052 (a) (j) | | |
| | |
Series 2021-SFR3, Class E1, 2.54%, 5/17/2026 (a) | | |
Series 2021-SFR3, Class E2, 2.69%, 5/17/2026 (a) | | |
Progress Residential Trust | | |
Series 2022-SFR2, Class E2, 4.80%, 4/17/2027 (a) | | |
Series 2020-SFR3, Class E, 2.30%, 10/17/2027 (a) | | |
Series 2020-SFR3, Class G, 4.11%, 10/17/2027 (a) | | |
Series 2023-SFR2, Class E1, 4.75%, 10/17/2028 (a) | | |
Series 2020-SFR1, Class C, 2.18%, 4/17/2037 (a) | | |
Series 2020-SFR1, Class E, 3.03%, 4/17/2037 (a) | | |
Series 2020-SFR1, Class F, 3.43%, 4/17/2037 (a) | | |
Series 2020-SFR1, Class G, 4.03%, 4/17/2037 (a) | | |
Series 2020-SFR2, Class D, 3.87%, 6/17/2037 (a) | | |
Series 2021-SFR2, Class E2, 2.65%, 4/19/2038 (a) | | |
Series 2021-SFR5, Class E1, 2.21%, 7/17/2038 (a) | | |
Series 2021-SFR5, Class E2, 2.36%, 7/17/2038 (a) | | |
Series 2021-SFR8, Class E1, 2.38%, 10/17/2038 (a) | | |
Series 2022-SFR3, Class D, 4.45%, 4/17/2039 (a) | | |
Series 2022-SFR3, Class E2, 5.60%, 4/17/2039 (a) | | |
SEE NOTES TO FINANCIAL STATEMENTS.
| J.P. Morgan Exchange-Traded Funds | |
| | |
Asset-Backed Securities — continued |
Series 2022-SFR3, Class F, 6.60%, 4/17/2039 (a) | | |
Series 2022-SFR5, Class E2, 6.86%, 6/17/2039 (a) | | |
Series 2023-SFR1, Class E2, 6.60%, 3/17/2040 (a) | | |
Series 2021-SFR7, Class E1, 2.59%, 8/17/2040 (a) | | |
Series 2022-SFR1, Class E2, 3.99%, 2/17/2041 (a) | | |
PRPM LLC Series 2021-2, Class A1, 2.12%, 3/25/2026 (a) (i) | | |
RCO VI Mortgage LLC Series 2022-1, Class A1, 3.00%, 1/25/2027 (a) (j) | | |
ReadyCap Lending Small Business Loan Trust Series 2019-2, Class A, 8.00%, 12/27/2044 (a) (i) | | |
Regional Management Issuance Trust | | |
Series 2020-1, Class C, 3.80%, 10/15/2030 (a) | | |
Series 2021-1, Class D, 5.07%, 3/17/2031 (a) | | |
Series 2022-1, Class B, 3.71%, 3/15/2032 (a) | | |
Series 2022-2B, Class B, 8.51%, 11/17/2032 (a) | | |
Renew Series 2023-1A, Class A, 5.90%, 11/20/2058 ‡ (a) | | |
RT Fin LLC, 7.85%, 10/15/2043 ‡ | | |
Santander Drive Auto Receivables Trust | | |
Series 2022-4, Class C, 5.00%, 11/15/2029 | | |
Series 2023-2, Class C, 5.47%, 12/16/2030 | | |
Series 2022-5, Class D, 5.67%, 12/16/2030 | | |
Series 2022-6, Class D, 5.69%, 2/18/2031 | | |
Santander Revolving Auto Loan Trust Series 2019-A, Class D, 3.45%, 1/26/2032 (a) | | |
SCF Equipment Leasing LLC | | |
Series 2022-2A, Class A3, 6.50%, 10/21/2030 (a) | | |
Series 2023-1A, Class B, 6.37%, 5/20/2032 (a) | | |
Series 2022-2A, Class E, 6.50%, 6/20/2035 (a) | | |
| | |
|
Sierra Timeshare Receivables Funding LLC | | |
Series 2020-2A, Class D, 6.59%, 7/20/2037 (a) | | |
Series 2021-1A, Class D, 3.17%, 11/20/2037 (a) | | |
Series 2022-1A, Class D, 6.00%, 10/20/2038 (a) | | |
Series 2022-3A, Class D, 10.52%, 7/20/2039 (a) | | |
Series 2023-1A, Class D, 9.80%, 1/20/2040 (a) | | |
Series 2023-2A, Class D, 9.72%, 4/20/2040 (a) | | |
Series 2022-2A, Class D, 9.22%, 6/20/2040 (a) | | |
SpringCastle America Funding LLC Series 2020-AA, Class A, 1.97%, 9/25/2037 (a) | | |
Tesla Auto Lease Trust Series 2023-B, Class A4, 6.22%, 3/22/2027 (a) | | |
Theorem Funding Trust Series 2022-2A, Class A, 6.06%, 12/15/2028 (a) | | |
Tricolor Auto Securitization Trust Series 2022-1A, Class D, 5.38%, 1/15/2026 (a) | | |
Tricon American Homes Series 2020-SFR1, Class E, 3.54%, 7/17/2038 (a) | | |
United Airlines Pass-Through Trust | | |
Series 2014-1, Class A, 4.00%, 4/11/2026 | | |
Series 2018-1, Class A, 3.70%, 3/1/2030 | | |
United Auto Credit Securitization Trust | | |
Series 2022-2, Class C, 5.81%, 5/10/2027 (a) | | |
Series 2022-2, Class E, 10.00%, 4/10/2029 ‡ (a) | | |
UOG ABS Issuer I LLC Series 2023-1, Class A1, 8.35%, 6/5/2040 ‡ (a) | | |
Upstart Securitization Trust Series 2022-4, Class A, 5.98%, 8/20/2032 (a) | | |
Upstart Structured Pass-Through Trust Series 2022-4A, Class A, 7.01%, 11/15/2030 (a) | | |
| | |
Series 2022-1A, Class B, 5.13%, 12/15/2025 (a) | | |
Series 2022-1A, Class D, 9.14%, 7/15/2027 ‡ (a) | | |
SEE NOTES TO FINANCIAL STATEMENTS.
| J.P. Morgan Exchange-Traded Funds | |
JPMorgan Core Plus Bond ETF
SCHEDULE OF PORTFOLIO INVESTMENTSAS OF February 29, 2024 (continued)
| | |
Asset-Backed Securities — continued |
USASF Receivables LLC Series 2020-1A, Class D, 9.35%, 3/15/2027 (a) | | |
| | |
Series 2021-NPL1, Class A1, 5.29%, 12/26/2050 (a) (j) | | |
Series 2021-NPL5, Class A1, 1.87%, 8/25/2051 (a) (j) | | |
Vericrest Opportunity Loan Transferee Series 2021-NP11, Class A1, 1.87%, 8/25/2051 (a) (j) | | |
Veros Auto Receivables Trust Series 2021-1, Class B, 1.49%, 10/15/2026 (a) | | |
VOLT CV LLC Series 2021-CF2, Class A1, 2.49%, 11/27/2051 (a) (j) | | |
VOLT XCII LLC Series 2021-NPL1, Class A1, 4.89%, 2/27/2051 (a) (j) | | |
VOLT XCIII LLC Series 2021-NPL2, Class A1, 4.89%, 2/27/2051 (a) (j) | | |
VOLT XCIV LLC Series 2021-NPL3, Class A1, 2.24%, 2/27/2051 (a) (j) | | |
| | |
Series 2020-1A, Class C, 6.21%, 3/20/2034 (a) | | |
Series 2022-1A, Class B, 2.29%, 8/20/2036 (a) | | |
Series 2022-1A, Class D, 3.84%, 8/20/2036 (a) | | |
Series 2023-1A, Class C, 7.49%, 12/20/2037 (a) | | |
Westlake Automobile Receivables Trust | | |
Series 2021-3A, Class D, 2.12%, 1/15/2027 (a) | | |
Series 2021-3A, Class E, 3.42%, 4/15/2027 (a) | | |
Series 2022-2A, Class D, 5.48%, 9/15/2027 (a) | | |
Series 2023-3A, Class C, 6.02%, 9/15/2028 (a) | | |
Series 2023-1A, Class D, 6.79%, 11/15/2028 (a) | | |
Series 2023-2A, Class D, 7.01%, 11/15/2028 (a) | | |
Series 2023-4A, Class D, 7.19%, 7/16/2029 (a) | | |
Total Asset-Backed Securities
(Cost $443,268,180) | | |
U.S. Treasury Obligations — 10.3% |
| | |
| | |
| | |
|
| | |
| | |
| | |
| | |
| | |
| | |
| | |
| | |
| | |
| | |
| | |
| | |
| | |
| | |
| | |
| | |
| | |
| | |
| | |
| | |
| | |
| | |
| | |
| | |
| | |
U.S. Treasury STRIPS Bonds | | |
| | |
| | |
| | |
| | |
| | |
| | |
Total U.S. Treasury Obligations
(Cost $282,574,856) | | |
Commercial Mortgage-Backed Securities — 5.9% |
BAMLL RE-Remic Trust Series 2014-FRR8, Class C, 0.00%, 11/26/2047 ‡ (a) (i) | | |
Banc of America Re-Remic Trust | | |
Series 2024-FRR1, Class B, 0.00%, 4/27/2049 ‡ (a) | | |
Series 2024-FRR1, Class C, 0.00%, 4/27/2049 ‡ (a) | | |
Series 2024-FRR1, Class A, 2.14%, 4/27/2049 ‡ (a) (i) | | |
BBCMS Mortgage Trust Series 2016-ETC, Class E, 3.61%, 8/14/2036 (a) (i) | | |
SEE NOTES TO FINANCIAL STATEMENTS.
| J.P. Morgan Exchange-Traded Funds | |
| | |
Commercial Mortgage-Backed Securities — continued |
BB-UBS Trust Series 2012-SHOW, Class E, 4.03%, 11/5/2036 (a) (i) | | |
BMD2 Re-Remic Trust Series 2019-FRR1, Class 5B13, 2.20%, 5/25/2052 ‡ (a) (i) | | |
BXP Trust Series 2017-GM, Class A, 3.38%, 6/13/2039 (a) | | |
Cascade Funding Mortgage Trust | | |
Series 2021-FRR1, Class DK45, 0.00%, 2/28/2025 (a) | | |
Series 2021-FRR1, Class CK45, 1.34%, 2/28/2025 (a) (i) | | |
Series 2021-FRR1, Class BK45, 2.05%, 2/28/2025 (a) (i) | | |
Series 2021-FRR1, Class CK54, 0.00%, 2/28/2026 (a) | | |
Series 2021-FRR1, Class DKW1, 0.00%, 2/28/2026 (a) | | |
Series 2021-FRR1, Class BK98, 0.00%, 8/29/2029 (a) | | |
Series 2021-FRR1, Class AK99, 0.00%, 9/29/2029 (a) | | |
Series 2021-FRR1, Class BK99, 0.00%, 9/29/2029 (a) | | |
CSMC OA LLC Series 2014-USA, Class D, 4.37%, 9/15/2037 (a) | | |
| | |
Series K753, Class A2, 4.40%, 10/25/2030 | | |
Series 19K-1510, Class C, 0.00%, 1/25/2034 ‡ (a) | | |
Series 2023-MN7, Class M2, 11.02%, 9/25/2043 (a) (i) | | |
FHLMC, Multi-Family Structured Credit Risk | | |
Series 2021-MN1, Class M1, 7.32%, 1/25/2051 (a) (i) | | |
Series 2021-MN1, Class M2, 9.07%, 1/25/2051 (a) (i) | | |
Series 2021-MN3, Class M1, 7.62%, 11/25/2051 (a) (i) | | |
Series 2021-MN3, Class M2, 9.32%, 11/25/2051 (a) (i) | | |
Series 2022-MN4, Class M1, 9.57%, 5/25/2052 (a) (i) | | |
Series 2022-MN4, Class M2, 11.82%, 5/25/2052 (a) (i) | | |
FHLMC, Multi-Family Structured Pass-Through Certificates | | |
Series KW06, Class A2, 3.80%, 6/25/2028 (i) | | |
| | |
|
Series K088, Class A2, 3.69%, 1/25/2029 | | |
Series K128, Class X3, IO, 2.78%, 4/25/2031 (i) | | |
Series KJ48, Class A2, 5.03%, 10/25/2031 | | |
Series K136, Class A2, 2.13%, 11/25/2031 | | |
Series K142, Class A2, 2.40%, 3/25/2032 | | |
Series K-151, Class A2, 3.80%, 10/25/2032 (i) | | |
Series K-153, Class A2, 3.82%, 12/25/2032 (i) | | |
Series KJ44, Class A2, 4.61%, 2/25/2033 | | |
Series K-160, Class A2, 4.50%, 8/25/2033 (i) | | |
Series K-1520, Class X1, IO, 0.47%, 2/25/2036 (i) | | |
Series K-1520, Class X3, IO, 3.09%, 4/25/2039 (i) | | |
Series K145, Class AM, 2.58%, 6/25/2055 | | |
Series Q014, Class X, IO, 2.79%, 10/25/2055 (i) | | |
| | |
Series 2017-M3, Class A2, 2.47%, 12/25/2026 (i) | | |
Series 2021-M11, Class A2, 1.46%, 3/25/2031 (i) | | |
Series 2023-M2, Class PT, 3.24%, 4/25/2031 (i) | | |
Series 2022-M1G, Class A2, 1.53%, 9/25/2031 (i) | | |
Series 2022-M1, Class A1, 1.67%, 10/25/2031 (i) | | |
Series 2022-M3, Class A2, 1.71%, 11/25/2031 (i) | | |
Series 2021-M15, Class A2, 2.00%, 11/25/2031 | | |
Series 2022-M8, Class A2, 1.94%, 12/25/2031 (i) | | |
Series 2022-M2S, Class A1, 3.75%, 5/25/2032 (i) | | |
Series 2022-M13, Class A2, 2.59%, 6/25/2032 (i) | | |
Series 2020-M53, Class A2, 1.69%, 11/25/2032 (i) | | |
SEE NOTES TO FINANCIAL STATEMENTS.
| J.P. Morgan Exchange-Traded Funds | |
JPMorgan Core Plus Bond ETF
SCHEDULE OF PORTFOLIO INVESTMENTSAS OF February 29, 2024 (continued)
| | |
Commercial Mortgage-Backed Securities — continued |
Series 2023-M8, Class A2, 4.47%, 3/25/2033 (i) | | |
Series 2021-M3, Class 1A1, 1.00%, 11/25/2033 | | |
Series 2021-M3, Class X1, IO, 1.92%, 11/25/2033 (i) | | |
| | |
Series 2018-KL3W, Class CW, 4.23%, 8/25/2025 (a) (i) | | |
Series 2018-KBX1, Class B, 3.61%, 1/25/2026 (a) (i) | | |
Series 2021-KHG3, Class BFX, 2.40%, 9/25/2028 (a) (i) | | |
Series 2018-K157, Class C, PO, 9/25/2033 (a) | | |
Series 2015-K44, Class B, 3.72%, 1/25/2048 (a) (i) | | |
Series 2015-K45, Class B, 3.60%, 4/25/2048 (a) (i) | | |
Series 2015-K48, Class B, 3.65%, 8/25/2048 (a) (i) | | |
Series 2015-K50, Class B, 3.78%, 10/25/2048 (a) (i) | | |
Series 2015-K51, Class B, 3.95%, 10/25/2048 (a) (i) | | |
Series 2016-K52, Class B, 3.93%, 1/25/2049 (a) (i) | | |
Series 2016-K53, Class C, 4.02%, 3/25/2049 (a) (i) | | |
Series 2016-K57, Class B, 3.92%, 8/25/2049 (a) (i) | | |
Series 2017-K69, Class D, PO, 10/25/2049 (a) | | |
Series 2017-K69, Class X2B, IO, 0.10%, 10/25/2049 (a) | | |
Series 2017-K729, Class B, 3.67%, 11/25/2049 (a) (i) | | |
Series 2018-K80, Class B, 4.23%, 8/25/2050 (a) (i) | | |
Series 2019-K88, Class C, 4.38%, 2/25/2052 (a) (i) | | |
Series 2020-K116, Class D, PO, 9/25/2052 (a) | | |
Series 2020-K116, Class X2A, IO, 0.10%, 9/25/2052 (a) | | |
Series 2020-K116, Class X2B, IO, 0.10%, 9/25/2052 (a) | | |
Series 2020-K122, Class D, PO, 1/25/2054 (a) | | |
| | |
|
Series 2020-K122, Class X2B, IO, 0.10%, 1/25/2054 (a) | | |
FRR Re-REMIC Trust Series 2018-C1, Class CK43, PO, 2/27/2048 (a) | | |
| | |
Series 2021-FRR1, Class 1B, PO, 11/29/2050 ‡ (a) | | |
Series 2022-FRR3, Class BK89, PO, 1/27/2052 ‡ (a) | | |
GS Mortgage Securities Corp. II Series 2023-SHIP, Class A, 4.32%, 9/10/2038 (a) (i) | | |
Hudson Yards Mortgage Trust Series 2019-30HY, Class A, 3.23%, 7/10/2039 (a) | | |
JPMCC Re-REMIC Trust Series 2015-FRR2, Class AK39, 2.50%, 8/27/2047 (a) (i) | | |
MHC Commercial Mortgage Trust Series 2021-MHC, Class F, 8.03%, 4/15/2038 (a) (i) | | |
Multi-Family Connecticut Avenue Securities Trust | | |
Series 2019-01, Class M10, 8.69%, 10/25/2049 (a) (i) | | |
Series 2020-01, Class M10, 9.19%, 3/25/2050 (a) (i) | | |
Series 2023-01, Class M10, 11.82%, 11/25/2053 (a) (i) | | |
RFM Reremic Trust Series 2022-FRR1, Class BK64, 1.71%, 3/1/2050 (a) (i) | | |
Total Commercial Mortgage-Backed Securities
(Cost $155,485,628) | | |
Collateralized Mortgage Obligations — 3.4% |
Anchor Mortgage Trust Series 2021-1, Class A2, 3.65%, 10/25/2026 (a) (j) | | |
Connecticut Avenue Securities Trust Series 2023-R06, Class 1M2, 8.02%, 7/25/2043 (a) (i) | | |
Credit One, 6.47%, 2/25/2029 ‡ | | |
| | |
Series 2021-JR1, Class A1, 2.46%, 9/27/2066 (a) (i) | | |
Series 2022-JR1, Class A1, 4.27%, 10/25/2066 (a) (j) | | |
| | |
Series 5200, Class YV, 2.50%, 7/25/2033 | | |
SEE NOTES TO FINANCIAL STATEMENTS.
| J.P. Morgan Exchange-Traded Funds | |
| | |
Collateralized Mortgage Obligations — continued |
Series 2708, Class ZD, 5.50%, 11/15/2033 | | |
Series 4302, Class PA, 4.00%, 12/15/2043 | | |
Series 4281, Class BC, 4.50%, 12/15/2043 (i) | | |
Series 5141, Class AH, 2.25%, 11/25/2047 | | |
Series 5200, Class MA, 2.50%, 8/25/2048 | | |
Series 5028, Class JG, 1.50%, 8/25/2050 | | |
Series 5155, Class JD, 1.25%, 10/25/2051 | | |
Series 5347, PO, 10/25/2053 | | |
FHLMC, STRIPS Series 406, PO, 10/25/2053 | | |
| | |
FNMA, Grantor Trust Series 2017-T1, Class A, 2.90%, 6/25/2027 | | |
| | |
Series 2003-7, Class FA, 6.19%, 2/25/2033 (i) | | |
Series 2013-108, Class GU, 3.00%, 10/25/2033 | | |
Series 2005-110, Class TY, 5.50%, 12/25/2035 | | |
Series 2007-89, Class F, 6.02%, 9/25/2037 (i) | | |
Series 2011-112, Class PB, 4.00%, 11/25/2041 | | |
Series 2014-57, Class PE, 3.00%, 9/25/2044 | | |
Series 2021-14, Class CB, 1.00%, 11/25/2049 | | |
| | |
Series 2012-13, Class FQ, 5.75%, 1/20/2038 (i) | | |
Series 2010-14, Class FH, 5.94%, 2/16/2040 (i) | | |
Series 2010-61, Class FK, 5.94%, 5/16/2040 (i) | | |
Series 2012-61, Class FM, 5.84%, 5/16/2042 (i) | | |
Series 2020-165, Class UD, 1.50%, 11/20/2050 | | |
Series 2010-H24, Class FA, 5.81%, 10/20/2060 (i) | | |
| | |
|
Series 2014-H03, Class FA, 6.06%, 1/20/2064 (i) | | |
Series 2015-H02, Class FA, 6.11%, 1/20/2065 (i) | | |
Series 2015-H05, Class FC, 5.94%, 2/20/2065 (i) | | |
Series 2021-H14, Class CF, 6.72%, 9/20/2071 (i) | | |
GS Mortgage-Backed Securities Corp. Trust Series 2021-RPL1, Class A1, 1.75%, 12/25/2060 (a) (i) | | |
Home RE Ltd. (Bermuda) Series 2022-1, Class M1C, 10.82%, 10/25/2034 (a) (i) | | |
| | |
Series 2023-RTL1, Class A1, 7.87%, 1/25/2028 (a) (j) | | |
Series 2023-RTL2, Class A1, 8.00%, 6/25/2028 (a) (j) | | |
Series 2023-RTL4, Class A1, 7.63%, 11/25/2028 (a) (j) | | |
Radnor RE Ltd. (Bermuda) Series 2022-1, Class M1B, 12.07%, 9/25/2032 (a) (i) | | |
Seasoned Credit Risk Transfer Trust | | |
Series 2018-1, Class MA, 3.00%, 5/25/2057 | | |
Series 2018-1, Class M60C, 3.50%, 5/25/2057 | | |
Series 2018-3, Class MA, 3.50%, 8/25/2057 (i) | | |
Series 2018-3, Class M55D, 4.00%, 8/25/2057 (i) | | |
Series 2018-2, Class MT, 3.50%, 11/25/2057 | | |
Series 2018-2, Class M55D, 4.00%, 11/25/2057 | | |
Series 2019-1, Class MA, 3.50%, 7/25/2058 | | |
Series 2019-2, Class MA, 3.50%, 8/25/2058 | | |
Series 2019-3, Class MT, 3.50%, 10/25/2058 | | |
Series 2020-1, Class MA, 2.50%, 8/25/2059 | | |
Series 2020-3, Class M5TW, 3.00%, 5/25/2060 | | |
Series 2020-3, Class TTW, 3.00%, 5/25/2060 | | |
Series 2021-1, Class BXS, 14.35%, 9/25/2060 (a) (i) | | |
SEE NOTES TO FINANCIAL STATEMENTS.
| J.P. Morgan Exchange-Traded Funds | |
JPMorgan Core Plus Bond ETF
SCHEDULE OF PORTFOLIO INVESTMENTSAS OF February 29, 2024 (continued)
| | |
Collateralized Mortgage Obligations — continued |
Series 2022-1, Class MTU, 3.25%, 11/25/2061 | | |
Series 2023-1, Class MT, 3.00%, 10/25/2062 | | |
Towd Point Mortgage Trust Series 2021-R1, Class A2C, 3.31%, 11/30/2060 (a) | | |
Two Harbors Msr Frn, 7.55%, 10/25/2024 ‡ (a) | | |
VM Master Issuer LLC Series 2022-1, Class B, 6.88%, 5/24/2025 ‡ (a) (i) | | |
Total Collateralized Mortgage Obligations
(Cost $90,894,792) | | |
Loan Assignments — 1.1% (d) (m) |
|
Triton Water Holdings, Inc., 1st Lien Term Loan B (3-MONTH CME TERM SOFR + 3.25%), 8.86%, 3/31/2028 | | |
|
Emerson Climate Technologies, Inc., 1st Lien Term Loan B (3-MONTH CME TERM SOFR + 2.50%), 7.79%, 5/31/2030 | | |
QUIKRETE Holdings, Inc., 1st Lien Term Loan B (1-MONTH CME TERM SOFR + 2.75%), 8.19%, 3/19/2029 | | |
| | |
|
DuPont Performance, 1st Lien Term Loan B-4 (3-MONTH CME TERM SOFR + 2.50%), 7.85%, 12/20/2029 | | |
Ineos US Finance LLC, 1st Lien Term Loan B (Luxembourg) (1-MONTH CME TERM SOFR + 3.50%), 8.93%, 2/18/2030 | | |
| | |
Commercial Services & Supplies — 0.0% ^ |
Madison IAQ LLC, 1st Lien Term Loan (1-MONTH CME TERM SOFR + 3.25%), 8.68%, 6/21/2028 | | |
Electronic Equipment, Instruments & Components — 0.0% ^ |
NCR Atleos LLC, 1st Lien Term Loan B (1-MONTH CME TERM SOFR + 4.75%; 3-MONTH CME TERM SOFR + 4.75%), 10.16%, 3/27/2029 | | |
Ground Transportation — 0.0% ^ |
Genesee & Wyoming, Inc., 1st Lien Term Loan (3-MONTH CME TERM SOFR + 2.00%), 7.45%, 12/30/2026 | | |
| | |
|
Health Care Equipment & Supplies — 0.0% ^ |
Medline Borrower LP, 1st Lien Term Loan B (1-MONTH CME TERM SOFR + 3.00%), 8.44%, 10/23/2028 | | |
Health Care Providers & Services — 0.1% |
DaVita, Inc., 1st Lien Term Loan B (1-MONTH CME TERM SOFR + 1.75%), 7.19%, 8/12/2026 | | |
Parexel International Corp., 1st Lien Term Loan (1-MONTH CME TERM SOFR + 3.25%), 8.69%, 11/15/2028 | | |
Syneos Health,Inc., 1st Lien Term Loan B (1-MONTH CME TERM SOFR + 4.00%; 3-MONTH CME TERM SOFR + 4.00%), 9.35%, 9/27/2030 | | |
| | |
Hotels, Restaurants & Leisure — 0.0% ^ |
Carnival Corp., 1st Lien Term Loan B (1-MONTH CME TERM SOFR + 3.00%), 8.32%, 8/9/2027 | | |
Household Durables — 0.0% ^ |
KDC US Holdings, Inc., 1st Lien Term Loan B (1-MONTH CME TERM SOFR + 5.00%), 10.33%, 8/15/2028 | | |
|
Asurion LLC, 1st Lien Term Loan B-11 (1-MONTH CME TERM SOFR + 4.25%), 9.68%, 8/19/2028 | | |
Hub International Ltd., 1st Lien Term Loan B (3-MONTH CME TERM SOFR + 3.50%), 8.57%, 6/20/2030 | | |
| | |
|
MH Sub I LLC, 1st Lien Term Loan B (1-MONTH CME TERM SOFR + 4.25%), 9.58%, 5/3/2028 | | |
Leisure Products — 0.0% ^ |
Hercules Achievement, Inc., 1st Lien Term Loan B (1-MONTH CME TERM SOFR + 5.00%), 10.44%, 12/15/2026 | | |
Topgolf Callaway, 1st Lien Term Loan B (1-MONTH CME TERM SOFR + 3.50%), 8.93%, 3/15/2030 (n) | | |
| | |
SEE NOTES TO FINANCIAL STATEMENTS.
| J.P. Morgan Exchange-Traded Funds | |
| | |
Loan Assignments — continued |
|
Alliance Laundry Systems LLC, 1st Lien Term Loan B (1-MONTH CME TERM SOFR + 3.50%; 3-MONTH CME TERM SOFR + 3.50%), 8.93%, 10/8/2027 | | |
SPX Flow, Inc., 1st Lien Term Loan B (1-MONTH CME TERM SOFR + 4.50%), 9.93%, 4/5/2029 | | |
| | |
|
Charter Communications Operating LLC, 1st Lien Term Loan B-4 (3-MONTH SOFR + 2.00%), 7.33%, 12/7/2030 | | |
Clear Channel Outdoor Holdings, Inc., 1st Lien Term Loan B (3-MONTH CME TERM SOFR + 3.50%), 9.07%, 8/21/2026 | | |
CSC Holdings LLC, Term Loan B-6 (1-MONTH CME TERM SOFR + 4.50%), 9.82%, 1/18/2028 | | |
| | |
Oil, Gas & Consumable Fuels — 0.0% ^ |
Buckeye Partners, 1st Lien Term Loan B (1-MONTH CME TERM SOFR + 2.50%), 7.83%, 11/22/2030 | | |
Passenger Airlines — 0.1% |
AAdvantage Loyality IP Ltd., 1st Lien Term Loan B (3-MONTH CME TERM SOFR + 4.75%), 10.33%, 4/20/2028 | | |
United Airlines, Inc., 1st Lien Term Loan B (3-MONTH CME TERM SOFR + 5.25%), 10.77%, 6/21/2027 | | |
| | |
Personal Care Products — 0.1% |
Conair Holdings LLC, 1st Lien Term Loan B (1-MONTH CME TERM SOFR + 3.75%), 9.19%, 5/17/2028 | | |
Nestle Skin Health SA, Term Loan B (Luxembourg) (3-MONTH CME TERM SOFR + 3.50%), 8.95%, 10/1/2026 | | |
| | |
|
Elanco Animal Health, Inc., 1st Lien Term Loan B (1-MONTH CME TERM SOFR + 1.75%), 7.18%, 8/1/2027 | | |
| | |
|
Professional Services — 0.1% |
Brookfield WEC Holdings Inc., 1st Lien Term Loan B (3-MONTH CME TERM SOFR + 3.00%), 8.08%, 1/27/2031 | | |
Dun & Bradstreet Corp., 1st Lien Term Loan B-2 (1-MONTH CME TERM SOFR + 2.75%), 8.07%, 1/18/2029 | | |
KBR, Inc., 1st Lien Term Loan B (3-MONTH CME TERM SOFR + 2.25%), 7.58%, 1/17/2031 | | |
| | |
Semiconductors & Semiconductor Equipment — 0.1% |
Brooks Automation, 1st Lien Term Loan B (12-MONTH CME TERM SOFR + 3.10%), 7.95%, 2/1/2029 | | |
Vertiv Group Corp., 1st Lien Term Loan B (1-MONTH CME TERM SOFR + 2.50%), 7.94%, 3/2/2027 | | |
| | |
|
AthenaHealth, Inc., 1st Lien Term Loan (1-MONTH CME TERM SOFR + 3.25%), 8.58%, 2/15/2029 | | |
Genesys Telecom Holdings US, Inc., 1st Lien Term Loan B (1-MONTH CME TERM SOFR + 4.00%), 9.44%, 12/1/2027 | | |
| | |
|
AppleCaramel Buyer LLC, 1st Lien Term Loan B (1-MONTH CME TERM SOFR + 3.75%), 9.08%, 10/19/2027 | | |
Petco Health & Wellness Co., Inc., Term Loan B (3-MONTH CME TERM SOFR + 3.25%), 8.86%, 3/3/2028 | | |
| | |
Wireless Telecommunication Services — 0.0% ^ |
Iridium Communications, Inc., 1st Lien Term Loan B (1-MONTH CME TERM SOFR + 2.50%), 7.83%, 9/20/2030 | | |
Total Loan Assignments
(Cost $29,191,844) | | |
Foreign Government Securities — 1.0% |
Benin Government Bond 7.96%, 2/13/2038 (a) | | |
Dominican Republic Government Bond | | |
| | |
| | |
SEE NOTES TO FINANCIAL STATEMENTS.
| J.P. Morgan Exchange-Traded Funds | |
JPMorgan Core Plus Bond ETF
SCHEDULE OF PORTFOLIO INVESTMENTSAS OF February 29, 2024 (continued)
| | |
Foreign Government Securities — continued |
| | |
Federal Republic of Nigeria | | |
| | |
| | |
| | |
| | |
Federative Republic of Brazil | | |
| | |
| | |
Finance Department Government of Sharjah 6.13%, 3/6/2036 (a) | | |
Gabonese Republic 6.95%, 6/16/2025 (h) | | |
Hashemite Kingdom of Jordan 7.38%, 10/10/2047 (h) | | |
| | |
| | |
| | |
Istanbul Metropolitan Municipality 10.50%, 12/6/2028 (a) | | |
Kingdom of Bahrain 5.45%, 9/16/2032 (a) | | |
Kingdom of Morocco 6.50%, 9/8/2033 (h) | | |
Kingdom of Saudi Arabia 5.75%, 1/16/2054 (a) | | |
Republic of Angola 8.25%, 5/9/2028 (a) | | |
| | |
| | |
| | |
| | |
| | |
| | |
Republic of Cote d'Ivoire | | |
| | |
| | |
Republic of Guatemala 6.60%, 6/13/2036 (a) | | |
Republic of Iraq 5.80%, 1/15/2028 (h) | | |
Republic of Panama 7.88%, 3/1/2057 | | |
| | |
| | |
| | |
| | |
| | |
Republic of Senegal 6.75%, 3/13/2048 (h) | | |
Republic of South Africa 7.30%, 4/20/2052 | | |
| | |
| | |
| | |
|
| | |
| | |
| | |
| | |
State of Mongolia 8.65%, 1/19/2028 (h) | | |
Sultanate of Oman Government Bond 7.00%, 1/25/2051 (a) | | |
Turkiye Ihracat Kredi Bankasi A/S 9.38%, 1/31/2026 (a) | | |
United Mexican States 6.34%, 5/4/2053 | | |
Total Foreign Government Securities
(Cost $25,883,010) | | |
Municipal Bonds — 0.0% (o) ^ |
|
Ohio University, General Receipts, Federally Taxable Rev., 5.59%, 12/1/2114 | | |
|
Texas Natural Gas Securitization Finance Corp., Customer Rate Relief Bonds Series 2023A-2, Rev., 5.17%, 4/1/2041 | | |
Total Municipal Bonds
(Cost $77,767) | | |
| | |
|
Diversified Telecommunication Services — 0.0% ^ |
Windstream Holdings, Inc. ‡ * | | |
Health Care Providers & Services — 0.0% ^ |
Envision Healthcare Corp. ‡ * | | |
Oil, Gas & Consumable Fuels — 0.0% ^ |
| | |
Specialty Retail — 0.0% ^ |
| | |
Wireless Telecommunication Services — 0.0% ^ |
Intelsat SA (Luxembourg) ‡ * | | |
Total Common Stocks
(Cost $10,351) | | |
Preferred Stocks — 0.0% ^ |
Broadline Retail — 0.0% ^ |
MYT Holding LLC Series A, 10.00%, 6/6/2029 ‡
(Cost $2,753) | | |
SEE NOTES TO FINANCIAL STATEMENTS.
| J.P. Morgan Exchange-Traded Funds | |
| | |
|
|
Nmg Research Ltd. expiring 9/24/2027, price 1.00 USD (United Kingdom) ‡ *
(Cost $1) | | |
| | |
Short-Term Investments — 11.6% |
Investment Companies — 11.6% |
JPMorgan U.S. Government Money Market Fund Class IM Shares, 5.25% (p) (q)
(Cost $304,836,673) | | |
Total Investments — 105.9%
(Cost $2,800,804,217) | | |
Liabilities in Excess of Other Assets — (5.9)% | | |
| | |
Percentages indicated are based on net assets. |
| |
| |
| Alternative Credit Enhancement Securities |
| Adjustable Rate Mortgage. The interest rate shown is the rate in effect as of February 29, 2024. |
| Chicago Mercantile Exchange |
| Credit Suisse Mortgage Trust |
| Euro Interbank Offered Rate |
| Federal Home Loan Mortgage Corp. |
| Federal National Mortgage Association |
| |
| Government National Mortgage Association |
| Intercontinental Exchange |
| Interest Only represents the right to receive the monthly interest payments on an underlying pool of mortgage loans. The principal amount shown represents the par value on the underlying pool. The yields on these securities are subject to accelerated principal paydowns as a result of prepayment or refinancing of the underlying pool of mortgage instruments. As a result, interest income may be reduced considerably. |
| |
| |
| Principal Only represents the right to receive the principal portion only on an underlying pool of mortgage loans. The market value of these securities is extremely volatile in response to changes in market interest rates. As prepayments on the underlying mortgages of these securities increase, the yield on these securities increases. |
| Limited liability company |
| |
| Real Estate Investment Trust |
| Real Estate Mortgage Investment Conduit |
| Combined Real Estate Mortgage Investment Conduit |
| |
| Limited partnership with share capital |
| Secured Overnight Financing Rate |
| Compounding index of the Secured Overnight Financing Rate |
| Separate Trading of Registered Interest and Principal of Securities. The STRIPS Program lets investors hold and trade individual interest and principal components of eligible notes and bonds as separate securities. |
| To Be Announced; Security is subject to delayed delivery. |
| Uniform Mortgage-Backed Securities |
| |
| Amount rounds to less than 0.1% of net assets. |
| Value determined using significant unobservable inputs. | |
| Non-income producing security. | |
| Securities exempt from registration under Rule 144A or section 4(a)(2), of the Securities Act of 1933, as amended. | |
| | |
| Security has the ability to pay in kind (“PIK”) or pay income in cash. When applicable, separate rates of such payments are disclosed. | |
| Variable or floating rate security, linked to the referenced benchmark. The interest rate shown is the current rate as of February 29, 2024. | |
| Contingent Capital security (“CoCo”). CoCos are hybrid debt securities that may be convertible into equity or may be written down if a pre-specified trigger event occurs. The total value of aggregate CoCo holdings at February 29, 2024 is $9,413,600 or 0.36% of the Fund’s net assets as of February 29, 2024. | |
| Security is an interest bearing note with preferred security characteristics. | |
| Security is perpetual and thus, does not have a predetermined maturity date. The coupon rate for this security is fixed for a period of time and may be structured to adjust thereafter. The date shown, if applicable, reflects the next call date. The coupon rate shown is the rate in effect as of February 29, 2024. | |
| Security exempt from registration pursuant to Regulation S under the Securities Act of 1933, as amended. Regulation S applies to securities offerings that are made outside of the United States and do not involve direct selling efforts in the United States and as such may have restrictions on resale. | |
| Variable or floating rate security, the interest rate of which adjusts periodically based on changes in current interest rates and prepayments on the underlying pool of assets. The interest rate shown is the current rate as of February 29, 2024. | |
SEE NOTES TO FINANCIAL STATEMENTS.
| J.P. Morgan Exchange-Traded Funds | |
JPMorgan Core Plus Bond ETF
SCHEDULE OF PORTFOLIO INVESTMENTSAS OF February 29, 2024 (continued)
| Step bond. Interest rate is a fixed rate for an initial period that either resets at a specific date or may reset in the future contingent upon a predetermined trigger. The interest rate shown is the current rate as of February 29, 2024. | |
| All or a portion of the security is a when-issued security, delayed delivery security, or forward commitment. | |
| The rate shown is the effective yield as of February 29, 2024. | |
| Loan assignments are presented by obligor. Each series or loan tranche underlying each obligor may have varying terms. | |
| All or a portion of this security is unsettled as of February 29, 2024. Unless otherwise indicated, the coupon rate is undetermined. The coupon rate shown may not be accrued for the entire position. | |
| The date shown represents the earliest of the prerefunded date, next put date or final maturity date. | |
| Investment in an affiliated fund, which is registered under the Investment Company Act of 1940, as amended, and is advised by J.P. Morgan Investment Management Inc. | |
| The rate shown is the current yield as of February 29, 2024. | |
Futures contracts outstanding as of February 29, 2024:
| | | | | VALUE AND
UNREALIZED
APPRECIATION
(DEPRECIATION) ($) |
| | | | | |
U.S. Treasury 10 Year Note | | | | | |
U.S. Treasury 10 Year Ultra Note | | | | | |
| | | | | |
| | | | | |
U.S. Treasury 2 Year Note | | | | | |
U.S. Treasury 5 Year Note | | | | | |
| | | | | |
| | | | | |
U.S. Treasury 10 Year Note | | | | | |
U.S. Treasury 10 Year Ultra Note | | | | | |
U.S. Treasury 5 Year Note | | | | | |
| | | | | |
| | | | | |
Forward foreign currency exchange contracts outstanding as of February 29, 2024:
| | | | UNREALIZED
APPRECIATION
(DEPRECIATION) ($) |
| | | | | | |
| | | | | | |
Total unrealized appreciation | |
| | | | | | |
Total unrealized depreciation | |
Net unrealized appreciation | |
SEE NOTES TO FINANCIAL STATEMENTS.
| J.P. Morgan Exchange-Traded Funds | |
Over-the-Counter ("OTC") Credit default swap contracts outstanding — buy protection (*) as of February 29, 2024:
REFERENCE
OBLIGATION/INDEX | FINANCING
RATE PAID
BY THE FUND
(%) | | | | | | UPFRONT
PAYMENTS
(RECEIPTS)
| UNREALIZED
APPRECIATION
(DEPRECIATION)
($) | |
Bank of America Corp., 3.50%, 4/19/2026 | | | | | | | | | |
Bank of America Corp., 3.50%, 4/19/2026 | | | | | | | | | |
Bank of America Corp., 3.50%, 4/19/2026 | | | | | | | | | |
Bank of America Corp., 3.50%, 4/19/2026 | | | | | | | | | |
| | | | | | | | | |
| The Fund, as a buyer of credit protection, is generally obligated to make periodic payments and may also pay or receive an upfront premium to or from the protection seller, in exchange for the right to receive a contingent payment, upon occurrence of a credit event with respect to an underlying reference obligation, as defined under the terms of individual swap contracts. | |
| Implied credit spreads are an indication of the seller's performance risk, related to the likelihood of a credit event occurring that would require a seller to make payment to a buyer. Implied credit spreads are used to determine the value of swap contracts and reflect the cost of buying/selling protection, which may include upfront payments made to enter into the contract. Therefore, higher spreads would indicate a greater likelihood that a seller will be obligated to perform (i.e. make payment) under the swap contract. Increasing values, in absolute terms and relative to notional amounts, are also indicative of greater performance risk. Implied credit spreads for credit default swaps on credit indices are linked to the weighted average spread across the underlying reference obligations included in a particular index. |
| The notional amount is the maximum amount that a seller of credit protection would be obligated to pay and a buyer of credit protection would receive, upon occurrence of a credit event. |
| Upfront payments and receipts generally represent premiums paid or received at the initiation of the agreement to compensate the differences between the stated terms of the swap agreement and current market conditions (credit spreads, interest rates and other relevant factors). |
| | | | | | | | | |
| | | | | | | | | |
Centrally Cleared Credit default swap contracts outstanding — sell protection(**) as of February 29, 2024:
REFERENCE
OBLIGATION/INDEX | FINANCING
RATE PAID
BY THE FUND
(%) | | | | | UPFRONT
PAYMENTS
(RECEIPTS)
| UNREALIZED
APPRECIATION
(DEPRECIATION)
($) | |
| | | | | | | | |
| | | | | | | | |
| | | | | | | | |
| The Fund, as a seller of credit protection, receives periodic payments and may also receive or pay an upfront premium from or to the protection buyer, and is obligated to make a contingent payment, upon occurrence of a credit event with respect to an underlying reference obligation, as defined under the terms of individual swap contracts. |
SEE NOTES TO FINANCIAL STATEMENTS.
| J.P. Morgan Exchange-Traded Funds | |
JPMorgan Core Plus Bond ETF
SCHEDULE OF PORTFOLIO INVESTMENTSAS OF February 29, 2024 (continued)
| Implied credit spreads are an indication of the seller's performance risk, related to the likelihood of a credit event occurring that would require a seller to make payment to a buyer. Implied credit spreads are used to determine the value of swap contracts and reflect the cost of buying/selling protection, which may include upfront payments made to enter into the contract. Therefore, higher spreads would indicate a greater likelihood that a seller will be obligated to perform (i.e. make payment) under the swap contract.Increasing values, in absolute terms and relative to notional amounts, are also indicative of greater performance risk. Implied credit spreads for credit default swaps on credit indices are linked to the weighted average spread across the underlying reference obligations included in a particular index. |
| The notional amount is the maximum amount that a seller of credit protection would be obligated to pay and a buyer of credit protection would receive, upon occurrence of a credit event. |
| Upfront payments and receipts generally represent premiums paid or received at the initiation of the agreement to compensate the differences between the stated terms of the swap agreement and current market conditions (credit spreads, interest rates and other relevant factors). |
| |
| Credit Default Swap Index |
| |
Summary of total OTC swap contracts outstanding as of February 29, 2024:
| NET UPFRONT
PAYMENTS
(RECEIPTS)
($) | |
| | |
OTC Credit default swap contracts outstanding - buy protection | | |
SEE NOTES TO FINANCIAL STATEMENTS.
| J.P. Morgan Exchange-Traded Funds | |
SCHEDULE OF PORTFOLIO INVESTMENTSAS OF February 29, 2024
| | |
|
Aerospace & Defense — 0.3% |
Bombardier, Inc. (Canada) |
| | |
| | |
BWX Technologies, Inc. 4.13%, 6/30/2028 (a) | | |
Spirit AeroSystems, Inc. 9.38%, 11/30/2029 (a) | | |
|
| | |
| | |
Triumph Group, Inc. 9.00%, 3/15/2028 (a) | | |
| | |
Automobile Components — 1.0% |
Adient Global Holdings Ltd. |
| | |
| | |
| | |
Allison Transmission, Inc. |
| | |
| | |
| | |
American Axle & Manufacturing, Inc. |
| | |
| | |
| | |
|
| | |
| | |
| | |
Cooper-Standard Automotive, Inc. 13.50% (Blend (Cash 9.00% + PIK 4.50%)), 3/31/2027 (a) (b) | | |
|
| | |
| | |
| | |
Dornoch Debt Merger Sub, Inc. 6.63%, 10/15/2029 (a) | | |
Goodyear Tire & Rubber Co. (The) |
| | |
| | |
Icahn Enterprises LP 6.25%, 5/15/2026 | | |
| | |
| | |
|
|
Banco Mercantil del Norte SA (Mexico) (US Treasury Yield Curve Rate T Note Constant Maturity 10 Year + 5.47%), 7.50%, 6/27/2029 (c) (d) (e) (f) (g) | | |
Bank of Nova Scotia (The) (Canada) (US Treasury Yield Curve Rate T Note Constant Maturity 5 Year + 4.39%), 8.63%, 10/27/2082 (c) (g) | | |
BBVA Bancomer SA (Mexico) (US Treasury Yield Curve Rate T Note Constant Maturity 5 Year + 2.65%), 5.13%, 1/18/2033 (c) (f) (g) | | |
BNP Paribas SA (France) (SOFR + 1.59%), 5.50%, 5/20/2030 (a) (g) | | |
|
(SOFR + 2.10%), 5.98%, 1/18/2027 (a) (g) | | |
| | |
|
Series U, (SOFR + 3.81%), 5.00%, 9/12/2024 (d) (e) (g) | | |
Series X, (US Treasury Yield Curve Rate T Note Constant Maturity 5 Year + 3.42%), 3.88%, 2/18/2026 (d) (e) (g) | | |
Danske Bank A/S (Denmark) (US Treasury Yield Curve Rate T Note Constant Maturity 1 Year + 2.10%), 6.47%, 1/9/2026 (a) (g) | | |
HSBC Holdings plc (United Kingdom) |
(SOFR + 3.35%), 7.39%, 11/3/2028 (g) | | |
(US Treasury Yield Curve Rate T Note Constant Maturity 5 Year + 3.65%), 4.60%, 12/17/2030 (c) (d) (e) (g) | | |
ING Groep NV (Netherlands) (USD ICE Swap Rate 5 Year + 4.20%), 6.75%, 4/16/2024 (c) (d) (e) (f) (g) | | |
Nordea Bank Abp (Finland) (US Treasury Yield Curve Rate T Note Constant Maturity 5 Year + 4.11%), 6.63%, 3/26/2026 (a) (c) (d) (e) (g) | | |
Santander UK Group Holdings plc (United Kingdom) (SOFR + 2.60%), 6.53%, 1/10/2029 (g) | | |
Societe Generale SA (France) (US Treasury Yield Curve Rate T Note Constant Maturity 1 Year + 2.30%), 6.45%, 1/12/2027 (a) (g) | | |
SEE NOTES TO FINANCIAL STATEMENTS.
SCHEDULE OF PORTFOLIO INVESTMENTSAS OF February 29, 2024 (continued)
| | |
Corporate Bonds — continued |
|
Toronto-Dominion Bank (The) (Canada) (US Treasury Yield Curve Rate T Note Constant Maturity 5 Year + 4.08%), 8.13%, 10/31/2082 (c) (g) | | |
Wells Fargo & Co. Series BB, (US Treasury Yield Curve Rate T Note Constant Maturity 5 Year + 3.45%), 3.90%, 3/15/2026 (d) (e) (g) | | |
| | |
|
Grifols SA (Spain) 4.75%, 10/15/2028 (a) | | |
|
NMG Holding Co., Inc. 7.13%, 4/1/2026 (a) | | |
Nordstrom, Inc. 4.25%, 8/1/2031 | | |
|
8.50% (Blend (Cash 4.25% + PIK 4.25%)), 10/1/2027 (a) (b) | | |
| | |
| | |
|
Advanced Drainage Systems, Inc. 5.00%, 9/30/2027 (a) | | |
Builders FirstSource, Inc. |
| | |
| | |
| | |
EMRLD Borrower LP 6.63%, 12/15/2030 (a) | | |
Griffon Corp. 5.75%, 3/1/2028 | | |
JELD-WEN, Inc. 4.88%, 12/15/2027 (a) | | |
Masonite International Corp. 5.38%, 2/1/2028 (a) | | |
MIWD Holdco II LLC 5.50%, 2/1/2030 (a) | | |
Standard Industries, Inc. |
| | |
| | |
Summit Materials LLC 7.25%, 1/15/2031 (a) | | |
| | |
|
Coinbase Global, Inc. 3.38%, 10/1/2028 (a) | | |
| | |
|
Capital Markets — continued |
Goldman Sachs Group, Inc. (The) |
Series R, (US Treasury Yield Curve Rate T Note Constant Maturity 5 Year + 3.22%), 4.95%, 2/10/2025 (d) (e) (g) | | |
(SOFR + 1.08%), 5.80%, 8/10/2026 (g) | | |
Series W, (US Treasury Yield Curve Rate T Note Constant Maturity 5 Year + 3.16%), 7.50%, 2/10/2029 (d) (e) (g) | | |
Nasdaq, Inc. 5.35%, 6/28/2028 | | |
State Street Corp. Series I, (US Treasury Yield Curve Rate T Note Constant Maturity 5 Year + 2.61%), 6.70%, 3/15/2029 (d) (e) (g) | | |
| | |
|
Axalta Coating Systems LLC |
| | |
| | |
Braskem Idesa SAPI (Mexico) 6.99%, 2/20/2032 (a) | | |
Braskem Netherlands Finance BV (Brazil) 7.25%, 2/13/2033 (a) | | |
Celanese US Holdings LLC 1.40%, 8/5/2026 | | |
|
| | |
| | |
Element Solutions, Inc. 3.88%, 9/1/2028 (a) | | |
INEOS Finance plc (Luxembourg) |
| | |
| | |
INEOS Quattro Finance 2 plc (United Kingdom) 9.63%, 3/15/2029 (a) | | |
NOVA Chemicals Corp. (Canada) |
| | |
| | |
| | |
| | |
Scotts Miracle-Gro Co. (The) |
| | |
| | |
| | |
SEE NOTES TO FINANCIAL STATEMENTS.
| | |
Corporate Bonds — continued |
|
Trinseo Materials Operating SCA |
| | |
| | |
|
| | |
| | |
| | |
Commercial Services & Supplies — 1.1% |
ACCO Brands Corp. 4.25%, 3/15/2029 (a) | | |
|
| | |
| | |
Allied Universal Holdco LLC 6.63%, 7/15/2026 (a) | | |
Aramark Services, Inc. 5.00%, 2/1/2028 (a) | | |
Brink's Co. (The) 4.63%, 10/15/2027 (a) | | |
Garda World Security Corp. 4.63%, 2/15/2027 (a) | | |
GFL Environmental, Inc. (Canada) |
| | |
| | |
| | |
| | |
| | |
Madison IAQ LLC 4.13%, 6/30/2028 (a) | | |
Prime Security Services Borrower LLC |
| | |
| | |
Stericycle, Inc. 3.88%, 1/15/2029 (a) | | |
Williams Scotsman, Inc. 7.38%, 10/1/2031 (a) | | |
| | |
Communications Equipment — 0.2% |
Ciena Corp. 4.00%, 1/31/2030 (a) | | |
|
| | |
| | |
| | |
| | |
Construction & Engineering — 0.2% |
Bioceanico Sovereign Certificate Ltd. (Paraguay) Zero Coupon, 6/5/2034 (f) | | |
| | |
|
Construction & Engineering — continued |
Dycom Industries, Inc. 4.50%, 4/15/2029 (a) | | |
International Airport Finance SA (Ecuador) 12.00%, 3/15/2033 (f) | | |
MasTec, Inc. 4.50%, 8/15/2028 (a) | | |
Mexico City Airport Trust (Mexico) 5.50%, 10/31/2046 (f) | | |
Pike Corp. 8.63%, 1/31/2031 (a) | | |
Weekley Homes LLC 4.88%, 9/15/2028 (a) | | |
| | |
Construction Materials — 0.0% ^ |
Knife River Corp. 7.75%, 5/1/2031 (a) | | |
|
AerCap Ireland Capital DAC (Ireland) |
| | |
| | |
Avolon Holdings Funding Ltd. (Ireland) |
| | |
| | |
| | |
Ford Motor Credit Co. LLC |
| | |
| | |
| | |
| | |
| | |
| | |
| | |
| | |
| | |
| | |
| | |
| | |
|
| | |
| | |
| | |
Consumer Staples Distribution & Retail — 0.9% |
|
| | |
| | |
| | |
| | |
Performance Food Group, Inc. |
SEE NOTES TO FINANCIAL STATEMENTS.
SCHEDULE OF PORTFOLIO INVESTMENTSAS OF February 29, 2024 (continued)
| | |
Corporate Bonds — continued |
Consumer Staples Distribution & Retail — continued |
| | |
| | |
|
| | |
8.00%, 11/15/2026 (a) (h) | | |
|
| | |
| | |
| | |
| | |
Containers & Packaging — 1.0% |
Ardagh Packaging Finance plc |
| | |
| | |
LABL, Inc. 6.75%, 7/15/2026 (a) | | |
Mauser Packaging Solutions Holding Co. |
| | |
| | |
Owens-Brockway Glass Container, Inc. 6.63%, 5/13/2027 (a) | | |
Pactiv Evergreen Group Issuer, Inc. 4.00%, 10/15/2027 (a) | | |
TriMas Corp. 4.13%, 4/15/2029 (a) | | |
Trivium Packaging Finance BV (Netherlands) |
| | |
| | |
| | |
|
Ritchie Bros Holdings, Inc. 6.75%, 3/15/2028 (a) | | |
Diversified Consumer Services — 0.2% |
Service Corp. International 3.38%, 8/15/2030 | | |
Wand NewCo 3, Inc. 7.63%, 1/30/2032 (a) | | |
| | |
|
|
| | |
| | |
| | |
| | |
| | |
| | |
| | |
|
Diversified Telecommunication Services — 2.1% |
Altice France SA (France) |
| | |
| | |
| | |
|
| | |
| | |
| | |
| | |
| | |
| | |
Frontier Communications Holdings LLC |
| | |
| | |
Intelsat Jackson Holdings SA 6.50%, 3/15/2030 (a) | | |
|
| | |
| | |
|
| | |
| | |
Telecom Italia Capital SA (Italy) 6.38%, 11/15/2033 | | |
| | |
Electric Utilities — 0.8% |
Comision Federal de Electricidad (Mexico) 4.68%, 2/9/2051 (f) | | |
Electricidad Firme de Mexico Holdings SA de CV (Mexico) 4.90%, 11/20/2026 (a) | | |
Energuate Trust (Guatemala) 5.88%, 5/3/2027 (f) | | |
Eskom Holdings SOC Ltd. (South Africa) 7.13%, 2/11/2025 (f) | | |
Instituto Costarricense de Electricidad (Costa Rica) |
| | |
| | |
Minejesa Capital BV (Indonesia) 4.63%, 8/10/2030 (f) | | |
|
| | |
| | |
| | |
| | |
SEE NOTES TO FINANCIAL STATEMENTS.
| | |
Corporate Bonds — continued |
Electric Utilities — continued |
Tierra Mojada Luxembourg II SARL (Mexico) 5.75%, 12/1/2040 (f) | | |
Trinidad Generation UnLtd (Trinidad And Tobago) 5.25%, 11/4/2027 (f) | | |
Vistra Operations Co. LLC |
| | |
| | |
| | |
| | |
Electrical Equipment — 0.1% |
|
| | |
| | |
| | |
| | |
Electronic Equipment, Instruments & Components — 0.3% |
Coherent Corp. 5.00%, 12/15/2029 (a) | | |
Sensata Technologies, Inc. 3.75%, 2/15/2031 (a) | | |
| | |
Energy Equipment & Services — 0.1% |
Archrock Partners LP 6.88%, 4/1/2027 (a) | | |
Guara Norte SARL (Brazil) 5.20%, 6/15/2034 (f) | | |
Nabors Industries, Inc. 7.38%, 5/15/2027 (a) | | |
Precision Drilling Corp. (Canada) |
| | |
| | |
Transocean, Inc. 8.75%, 2/15/2030 (a) | | |
| | |
|
Live Nation Entertainment, Inc. |
| | |
| | |
| | |
| | |
Warnermedia Holdings, Inc. 3.76%, 3/15/2027 | | |
|
| | |
| | |
| | |
| | |
|
Financial Services — 0.4% |
Block, Inc. 3.50%, 6/1/2031 | | |
Corebridge Financial, Inc. (US Treasury Yield Curve Rate T Note Constant Maturity 5 Year + 3.85%), 6.88%, 12/15/2052 (g) | | |
Nationstar Mortgage Holdings, Inc. 5.50%, 8/15/2028 (a) | | |
NCR Atleos Corp. 9.50%, 4/1/2029 (a) | | |
|
| | |
| | |
| | |
|
Lamb Weston Holdings, Inc. 4.13%, 1/31/2030 (a) | | |
Minerva Luxembourg SA (Brazil) 8.88%, 9/13/2033 (a) | | |
|
| | |
| | |
| | |
| | |
Sigma Holdco BV (Netherlands) 7.88%, 5/15/2026 (a) | | |
| | |
|
|
| | |
| | |
| | |
Superior Plus LP (Canada) 4.50%, 3/15/2029 (a) | | |
| | |
Ground Transportation — 0.8% |
Avis Budget Car Rental LLC |
| | |
| | |
| | |
EquipmentShare.com, Inc. 9.00%, 5/15/2028 (a) | | |
First Student Bidco, Inc. 4.00%, 7/31/2029 (a) | | |
|
| | |
| | |
SEE NOTES TO FINANCIAL STATEMENTS.
SCHEDULE OF PORTFOLIO INVESTMENTSAS OF February 29, 2024 (continued)
| | |
Corporate Bonds — continued |
Ground Transportation — continued |
NESCO Holdings II, Inc. 5.50%, 4/15/2029 (a) | | |
RXO, Inc. 7.50%, 11/15/2027 (a) | | |
Transnet SOC Ltd. (South Africa) 8.25%, 2/6/2028 (a) | | |
|
| | |
| | |
XPO, Inc. 6.25%, 6/1/2028 (a) | | |
| | |
Health Care Equipment & Supplies — 0.7% |
Avantor Funding, Inc. 4.63%, 7/15/2028 (a) | | |
|
| | |
| | |
|
| | |
| | |
| | |
Health Care Providers & Services — 1.6% |
180 Medical, Inc. (United Kingdom) 3.88%, 10/15/2029 (a) | | |
Acadia Healthcare Co., Inc. |
| | |
| | |
Community Health Systems, Inc. |
| | |
| | |
| | |
| | |
|
| | |
| | |
|
| | |
| | |
| | |
McKesson Corp. 5.25%, 2/15/2026 | | |
Owens & Minor, Inc. 4.50%, 3/31/2029 (a) | | |
|
| | |
| | |
| | |
| | |
|
Health Care Providers & Services — continued |
| | |
| | |
| | |
| | |
Health Care Technology — 0.1% |
IQVIA, Inc. 5.00%, 5/15/2027 (a) | | |
Hotel & Resort REITs — 0.3% |
|
| | |
| | |
| | |
Hotels, Restaurants & Leisure — 1.8% |
|
| | |
| | |
Boyne USA, Inc. 4.75%, 5/15/2029 (a) | | |
Caesars Entertainment, Inc. |
| | |
| | |
| | |
Carnival Corp. 5.75%, 3/1/2027 (a) | | |
Carnival Holdings Bermuda Ltd. 10.38%, 5/1/2028 (a) | | |
|
| | |
| | |
Hilton Domestic Operating Co., Inc. 3.75%, 5/1/2029 (a) | | |
Hilton Worldwide Finance LLC 4.88%, 4/1/2027 | | |
Marriott Ownership Resorts, Inc. 4.50%, 6/15/2029 (a) | | |
MGM Resorts International |
| | |
| | |
| | |
| | |
Royal Caribbean Cruises Ltd. |
| | |
| | |
| | |
| | |
Six Flags Entertainment Corp. 5.50%, 4/15/2027 (a) | | |
SEE NOTES TO FINANCIAL STATEMENTS.
| | |
Corporate Bonds — continued |
Hotels, Restaurants & Leisure — continued |
Six Flags Theme Parks, Inc. 7.00%, 7/1/2025 (a) | | |
Station Casinos LLC 4.50%, 2/15/2028 (a) | | |
Studio City Finance Ltd. (Macau) |
| | |
| | |
Vail Resorts, Inc. 6.25%, 5/15/2025 (a) | | |
Wynn Macau Ltd. (Macau) 5.63%, 8/26/2028 (f) | | |
Wynn Resorts Finance LLC 5.13%, 10/1/2029 (a) | | |
Yum! Brands, Inc. 4.75%, 1/15/2030 (a) | | |
| | |
Household Durables — 0.5% |
CD&R Smokey Buyer, Inc. 6.75%, 7/15/2025 (a) | | |
|
| | |
| | |
| | |
Tempur Sealy International, Inc. 4.00%, 4/15/2029 (a) | | |
| | |
Household Products — 0.3% |
|
| | |
| | |
|
| | |
| | |
|
| | |
| | |
| | |
Independent Power and Renewable Electricity Producers — 0.1% |
Calpine Corp. 4.63%, 2/1/2029 (a) | | |
Termocandelaria Power Ltd. (Colombia) 7.88%, 1/30/2029 (f) | | |
| | |
|
Presidio Holdings, Inc. 4.88%, 2/1/2027 (a) | | |
| | |
|
|
Mattel, Inc. 5.88%, 12/15/2027 (a) | | |
Vista Outdoor, Inc. 4.50%, 3/15/2029 (a) | | |
| | |
|
ATS Corp. (Canada) 4.13%, 12/15/2028 (a) | | |
Chart Industries, Inc. 7.50%, 1/1/2030 (a) | | |
Hillenbrand, Inc. 3.75%, 3/1/2031 | | |
Terex Corp. 5.00%, 5/15/2029 (a) | | |
TK Elevator US Newco, Inc. (Germany) 5.25%, 7/15/2027 (a) | | |
Trinity Industries, Inc. 7.75%, 7/15/2028 (a) | | |
Wabash National Corp. 4.50%, 10/15/2028 (a) | | |
| | |
Marine Transportation — 0.0% ^ |
MV24 Capital BV (Brazil) 6.75%, 6/1/2034 (f) | | |
|
Charter Communications Operating LLC |
| | |
| | |
Clear Channel Outdoor Holdings, Inc. |
| | |
| | |
| | |
|
| | |
| | |
Directv Financing LLC 5.88%, 8/15/2027 (a) | | |
Discovery Communications LLC 4.95%, 5/15/2042 | | |
|
| | |
| | |
| | |
DISH Network Corp. 11.75%, 11/15/2027 (a) | | |
GCI LLC 4.75%, 10/15/2028 (a) | | |
|
| | |
| | |
SEE NOTES TO FINANCIAL STATEMENTS.
SCHEDULE OF PORTFOLIO INVESTMENTSAS OF February 29, 2024 (continued)
| | |
Corporate Bonds — continued |
|
| | |
iHeartCommunications, Inc. |
| | |
| | |
Lamar Media Corp. 4.88%, 1/15/2029 | | |
Midcontinent Communications 5.38%, 8/15/2027 (a) | | |
|
| | |
| | |
|
| | |
| | |
Outfront Media Capital LLC |
| | |
| | |
Paramount Global (US Treasury Yield Curve Rate T Note Constant Maturity 5 Year + 4.00%), 6.38%, 3/30/2062 (g) | | |
Sinclair Television Group, Inc. 4.13%, 12/1/2030 (a) | | |
|
| | |
| | |
| | |
Stagwell Global LLC 5.63%, 8/15/2029 (a) | | |
|
| | |
| | |
Univision Communications, Inc. |
| | |
| | |
|
| | |
| | |
| | |
|
Alcoa Nederland Holding BV |
| | |
| | |
|
| | |
| | |
| | |
Big River Steel LLC 6.63%, 1/31/2029 (a) | | |
| | |
|
Metals & Mining — continued |
Cleveland-Cliffs, Inc. 4.63%, 3/1/2029 (a) | | |
CSN Inova Ventures (Brazil) 6.75%, 1/28/2028 (f) | | |
FMG Resources August 2006 Pty. Ltd. (Australia) 4.38%, 4/1/2031 (a) | | |
Nexa Resources SA (Brazil) 5.38%, 5/4/2027 (f) | | |
|
| | |
| | |
| | |
Oil, Gas & Consumable Fuels — 4.5% |
AI Candelaria Spain SA (Colombia) |
| | |
| | |
Antero Midstream Partners LP |
| | |
| | |
| | |
| | |
|
| | |
| | |
| | |
Ascent Resources Utica Holdings LLC 7.00%, 11/1/2026 (a) | | |
Bapco Energies BSCC (Bahrain) 7.50%, 10/25/2027 (f) | | |
Baytex Energy Corp. (Canada) |
| | |
| | |
Blue Racer Midstream LLC 7.63%, 12/15/2025 (a) | | |
BP Capital Markets plc (United Kingdom) (US Treasury Yield Curve Rate T Note Constant Maturity 5 Year + 4.40%), 4.88%, 3/22/2030 (d) (e) (g) | | |
|
| | |
| | |
| | |
California Resources Corp. 7.13%, 2/1/2026 (a) | | |
Chesapeake Energy Corp. 6.75%, 4/15/2029 (a) | | |
Chord Energy Corp. 6.38%, 6/1/2026 (a) | | |
SEE NOTES TO FINANCIAL STATEMENTS.
| | |
Corporate Bonds — continued |
Oil, Gas & Consumable Fuels — continued |
|
| | |
| | |
| | |
Columbia Pipelines Holding Co. LLC 6.04%, 8/15/2028 (a) | | |
|
| | |
| | |
Crescent Energy Finance LLC 9.25%, 2/15/2028 (a) | | |
DT Midstream, Inc. 4.13%, 6/15/2029 (a) | | |
|
| | |
| | |
| | |
| | |
Enbridge, Inc. (Canada) Series NC5, (US Treasury Yield Curve Rate T Note Constant Maturity 5 Year + 3.79%), 8.25%, 1/15/2084 (g) | | |
Encino Acquisition Partners Holdings LLC 8.50%, 5/1/2028 (a) | | |
Energian Israel Finance Ltd. (Israel) |
| | |
| | |
|
| | |
| | |
| | |
| | |
(US Treasury Yield Curve Rate T Note Constant Maturity 5 Year + 4.02%), 8.00%, 5/15/2054 (g) | | |
EQM Midstream Partners LP |
| | |
| | |
| | |
| | |
| | |
|
| | |
| | |
Greenko Solar Mauritius Ltd. (India) 5.55%, 1/29/2025 (f) | | |
| | |
|
Oil, Gas & Consumable Fuels — continued |
Greenko Wind Projects Mauritius Ltd. (India) 5.50%, 4/6/2025 (f) | | |
Gulfport Energy Corp. 8.00%, 5/17/2026 (a) | | |
Hess Midstream Operations LP |
| | |
| | |
| | |
Howard Midstream Energy Partners LLC |
| | |
| | |
Kinetik Holdings LP 5.88%, 6/15/2030 (a) | | |
Leviathan Bond Ltd. (Israel) |
| | |
| | |
| | |
Medco Bell Pte. Ltd. (Indonesia) 6.38%, 1/30/2027 (f) | | |
|
| | |
| | |
|
| | |
| | |
| | |
Permian Resources Operating LLC |
| | |
| | |
Peru LNG Srl (Peru) 5.38%, 3/22/2030 (f) | | |
Petroleos Mexicanos (Mexico) |
| | |
| | |
| | |
| | |
| | |
| | |
| | |
| | |
| | |
| | |
|
| | |
| | |
Rockies Express Pipeline LLC |
| | |
SEE NOTES TO FINANCIAL STATEMENTS.
SCHEDULE OF PORTFOLIO INVESTMENTSAS OF February 29, 2024 (continued)
| | |
Corporate Bonds — continued |
Oil, Gas & Consumable Fuels — continued |
| | |
|
| | |
| | |
|
| | |
| | |
| | |
|
| | |
| | |
Tallgrass Energy Partners LP |
| | |
| | |
| | |
| | |
Targa Resources Partners LP 6.50%, 7/15/2027 | | |
Transcanada Trust (Canada) (SOFR + 4.42%), 5.50%, 9/15/2079 (g) | | |
|
| | |
| | |
| | |
Vital Energy, Inc. 10.13%, 1/15/2028 | | |
| | |
Paper & Forest Products — 0.0% ^ |
Suzano Austria GmbH (Brazil) 7.00%, 3/16/2047 (f) | | |
Passenger Airlines — 0.4% |
|
| | |
| | |
Mileage Plus Holdings LLC 6.50%, 6/20/2027 (a) | | |
United Airlines, Inc. 4.38%, 4/15/2026 (a) | | |
| | |
Personal Care Products — 0.3% |
|
| | |
| | |
| | |
|
Personal Care Products — continued |
Edgewell Personal Care Co. 5.50%, 6/1/2028 (a) | | |
Prestige Brands, Inc. 5.13%, 1/15/2028 (a) | | |
| | |
|
Bausch Health Americas, Inc. 9.25%, 4/1/2026 (a) | | |
|
| | |
| | |
| | |
| | |
| | |
Catalent Pharma Solutions, Inc. |
| | |
| | |
Cheplapharm Arzneimittel GmbH (Germany) 5.50%, 1/15/2028 (a) | | |
Elanco Animal Health, Inc. 6.65%, 8/28/2028 (i) | | |
Jazz Securities DAC 4.38%, 1/15/2029 (a) | | |
|
| | |
| | |
| | |
Professional Services — 0.0% ^ |
TriNet Group, Inc. 7.13%, 8/15/2031 (a) | | |
Real Estate Management & Development — 0.0% ^ |
|
| | |
| | |
| | |
Semiconductors & Semiconductor Equipment — 0.3% |
Amkor Technology, Inc. 6.63%, 9/15/2027 (a) | | |
|
| | |
| | |
| | |
| | |
SEE NOTES TO FINANCIAL STATEMENTS.
| | |
Corporate Bonds — continued |
Semiconductors & Semiconductor Equipment — continued |
ON Semiconductor Corp. 3.88%, 9/1/2028 (a) | | |
Synaptics, Inc. 4.00%, 6/15/2029 (a) | | |
| | |
|
ACI Worldwide, Inc. 5.75%, 8/15/2026 (a) | | |
AthenaHealth Group, Inc. 6.50%, 2/15/2030 (a) | | |
Clarivate Science Holdings Corp. 3.88%, 7/1/2028 (a) | | |
NCR Voyix Corp. 5.13%, 4/15/2029 (a) | | |
RingCentral, Inc. 8.50%, 8/15/2030 (a) | | |
SS&C Technologies, Inc. 5.50%, 9/30/2027 (a) | | |
| | |
|
Iron Mountain, Inc. 5.00%, 7/15/2028 (a) | | |
SBA Communications Corp. 3.88%, 2/15/2027 | | |
| | |
|
Asbury Automotive Group, Inc. |
| | |
| | |
| | |
|
| | |
| | |
Gap, Inc. (The) 3.63%, 10/1/2029 (a) | | |
Group 1 Automotive, Inc. 4.00%, 8/15/2028 (a) | | |
|
| | |
| | |
Penske Automotive Group, Inc. 3.75%, 6/15/2029 | | |
PetSmart, Inc. 4.75%, 2/15/2028 (a) | | |
Sonic Automotive, Inc. 4.63%, 11/15/2029 (a) | | |
|
| | |
| | |
| | |
|
Specialty Retail — continued |
| | |
Staples, Inc. 7.50%, 4/15/2026 (a) | | |
| | |
Technology Hardware, Storage & Peripherals — 0.1% |
|
| | |
| | |
| | |
| | |
Textiles, Apparel & Luxury Goods — 0.0% ^ |
William Carter Co. (The) 5.63%, 3/15/2027 (a) | | |
|
BAT International Finance plc (United Kingdom) 4.45%, 3/16/2028 | | |
Trading Companies & Distributors — 0.9% |
Air Lease Corp. 5.85%, 12/15/2027 | | |
Herc Holdings, Inc. 5.50%, 7/15/2027 (a) | | |
Imola Merger Corp. 4.75%, 5/15/2029 (a) | | |
United Rentals North America, Inc. 4.88%, 1/15/2028 | | |
|
| | |
| | |
| | |
| | |
| | |
Wireless Telecommunication Services — 0.1% |
Altice France Holding SA 10.50%, 5/15/2027 (a) | | |
Millicom International Cellular SA (Guatemala) 5.13%, 1/15/2028 (f) | | |
Sprint LLC 7.13%, 6/15/2024 | | |
United States Cellular Corp. 6.70%, 12/15/2033 | | |
Vodafone Group plc (United Kingdom) (US Treasury Yield Curve Rate T Note Constant Maturity 5 Year + 2.77%), 4.13%, 6/4/2081 (g) | | |
| | |
Total Corporate Bonds
(Cost $385,083,128) | | |
SEE NOTES TO FINANCIAL STATEMENTS.
SCHEDULE OF PORTFOLIO INVESTMENTSAS OF February 29, 2024 (continued)
| | |
Commercial Mortgage-Backed Securities — 21.8% |
1211 Avenue of the Americas Trust Series 2015-1211, Class C, 4.14%, 8/10/2035 (a) (k) | | |
BAMLL Commercial Mortgage Securities Trust | | |
Series 2015-200P, Class A, 3.22%, 4/14/2033 (a) | | |
Series 2015-200P, Class C, 3.60%, 4/14/2033 (a) (k) | | |
Series 2015-200P, Class D, 3.60%, 4/14/2033 (a) (k) | | |
Banc of America Re-Remic Trust Series 2024-FRR1, Class C, 0.00%, 4/27/2049 ‡ (a) | | |
| | |
Series 2022-BNK39, Class XA, IO, 0.42%, 2/15/2055 (k) | | |
Series 2019-BN20, Class D, 2.50%, 9/15/2062 (a) | | |
Series 2020-BN28, Class XA, IO, 1.76%, 3/15/2063 (k) | | |
Series 2020-BN26, Class E, 2.50%, 3/15/2063 (a) | | |
BANK5 Series 2023-5YR3, Class A2, 6.26%, 9/15/2056 | | |
| | |
Series 2021-C11, Class XB, IO, 0.96%, 9/15/2054 (k) | | |
Series 2023-C20, Class XA, IO, 0.85%, 7/15/2056 (k) | | |
Series 2023-C21, Class A5, 6.00%, 9/15/2056 (k) | | |
Series 2023-C22, Class A5, 6.80%, 11/15/2056 (k) | | |
Series 2023-5C23, Class A3, 6.68%, 12/15/2056 (k) | | |
| | |
Series 2021-B26, Class ASB, 2.26%, 6/15/2054 | | |
Series 2022-B33, Class A5, 3.46%, 3/15/2055 | | |
Series 2022-B36, Class A5, 4.47%, 7/15/2055 (k) | | |
Series 2022-B37, Class A5, 5.75%, 11/15/2055 (k) | | |
Series 2023-V3, Class A3, 6.36%, 7/15/2056 (k) | | |
Series 2024-V5, Class A3, 5.81%, 1/10/2057 | | |
| | |
|
Series 2024-V5, Class C, 6.97%, 1/10/2057 (k) | | |
BHMS Series 2018-ATLS, Class A, 6.86%, 7/15/2035 (a) (k) | | |
| | |
Series 2024-5C3, Class A3, 5.74%, 2/15/2057 | | |
Series 2024-5C3, Class C, 6.86%, 2/15/2057 (k) | | |
BX Series 2021-MFM1, Class A, 6.13%, 1/15/2034 (a) (k) | | |
BX Commercial Mortgage Trust | | |
Series 2021-21M, Class A, 6.16%, 10/15/2036 (a) (k) | | |
Series 2021-VINO, Class A, 6.08%, 5/1/2038 (a) (k) | | |
Series 2021-ACNT, Class A, 6.28%, 11/15/2038 (a) (k) | | |
| | |
Series 2022-LBA6, Class A, 6.32%, 1/15/2039 (a) (k) | | |
Series 2024-MF, Class A, 6.74%, 2/15/2039 (a) (k) | | |
Series 2024-MF, Class B, 6.99%, 2/15/2039 (a) (k) | | |
| | |
Series 2018-CD7, Class C, 4.84%, 8/15/2051 (k) | | |
Series 2019-CD8, Class E, 3.00%, 8/15/2057 (a) | | |
Citigroup Commercial Mortgage Trust | | |
Series 2014-GC25, Class B, 4.34%, 10/10/2047 (k) | | |
Series 2018-C5, Class XA, IO, 0.67%, 6/10/2051 (k) | | |
Series 2018-C6, Class XA, IO, 0.75%, 11/10/2051 (k) | | |
Series 2015-GC33, Class D, 3.17%, 9/10/2058 | | |
Series 2015-GC33, Class B, 4.57%, 9/10/2058 (k) | | |
Commercial Mortgage Trust | | |
Series 2014-CR14, Class C, 3.74%, 2/10/2047 (k) | | |
Series 2014-CR15, Class C, 4.14%, 2/10/2047 (k) | | |
Series 2014-UBS5, Class C, 4.60%, 9/10/2047 (k) | | |
SEE NOTES TO FINANCIAL STATEMENTS.
| | |
Commercial Mortgage-Backed Securities — continued |
Series 2015-CR22, Class D, 4.07%, 3/10/2048 (a) (k) | | |
Series 2015-LC23, Class E, 3.55%, 10/10/2048 (a) (k) | | |
Series 2015-PC1, Class B, 4.28%, 7/10/2050 (k) | | |
Credit Suisse Mortgage Capital Certificates Series 2019-ICE4, Class A, 6.35%, 5/15/2036 (a) (k) | | |
CSAIL Commercial Mortgage Trust Series 2015-C2, Class C, 4.17%, 6/15/2057 (k) | | |
| | |
Series K-153, Class X1, IO, 0.44%, 12/25/2032 (k) | | |
Series 2023-MN7, Class M1, 8.92%, 9/25/2043 (a) (k) | | |
Series 2023-MN7, Class M2, 11.02%, 9/25/2043 (a) (k) | | |
Series 2023-MN7, Class B1, 14.17%, 9/25/2043 (a) (k) | | |
FHLMC Multiclass Certificates | | |
Series 2020-RR12, Class X, IO, 2.10%, 10/27/2027 (k) | | |
Series 2020-RR06, Class AX, IO, 1.88%, 10/27/2028 (k) | | |
Series 2020-RR14, Class X, IO, 2.13%, 3/27/2034 (k) | | |
Series 2021-RR16, Class X, IO, 0.96%, 10/27/2034 (k) | | |
Series 2023-RR21, Class X, IO, 3.39%, 4/27/2036 (k) | | |
FHLMC, Multi-Family Structured Credit Risk | | |
Series 2021-MN2, Class B1, 10.82%, 7/25/2041 (a) (k) | | |
Series 2021-MN1, Class M2, 9.07%, 1/25/2051 (a) (k) | | |
Series 2021-MN3, Class M2, 9.32%, 11/25/2051 (a) (k) | | |
Series 2021-MN3, Class B1, 12.17%, 11/25/2051 (a) (k) | | |
FHLMC, Multifamily Structured Pass-Through Certificates | | |
Series K107, Class X1, IO, 1.59%, 1/25/2030 (k) | | |
Series K-1513, Class X3, IO, 2.93%, 12/25/2037 (k) | | |
| | |
|
FHLMC, Multi-Family Structured Pass-Through Certificates | | |
Series K038, Class X1, IO, 0.92%, 3/25/2024 (k) | | |
Series KC06, Class X1, IO, 0.88%, 6/25/2026 (k) | | |
Series K738, Class X1, IO, 1.51%, 1/25/2027 (k) | | |
Series K063, Class X3, IO, 2.08%, 2/25/2027 (k) | | |
Series K740, Class X1, IO, 0.74%, 9/25/2027 (k) | | |
Series K072, Class X1, IO, 0.36%, 12/25/2027 (k) | | |
Series K742, Class X1, IO, 0.78%, 3/25/2028 (k) | | |
Series K742, Class X3, IO, 2.59%, 4/25/2028 (k) | | |
Series K743, Class X1, IO, 0.92%, 5/25/2028 (k) | | |
Series K078, Class X1, IO, 0.08%, 6/25/2028 (k) | | |
Series K745, Class X1, IO, 0.67%, 8/25/2028 (k) | | |
Series K082, Class X1, IO, 0.01%, 9/25/2028 (k) | | |
Series K083, Class X1, IO, 0.04%, 9/25/2028 (k) | | |
Series K086, Class X1, IO, 0.24%, 11/25/2028 (k) | | |
Series K084, Class X3, IO, 2.24%, 11/25/2028 (k) | | |
Series K091, Class X1, IO, 0.56%, 3/25/2029 (k) | | |
Series K096, Class X3, IO, 2.04%, 7/25/2029 (k) | | |
Series K100, Class X1, IO, 0.65%, 9/25/2029 (k) | | |
Series K090, Class X3, IO, 2.31%, 10/25/2029 (k) | | |
Series K104, Class X1, IO, 1.12%, 1/25/2030 (k) | | |
Series K109, Class X1, IO, 1.58%, 4/25/2030 (k) | | |
Series K110, Class X1, IO, 1.70%, 4/25/2030 (k) | | |
Series K115, Class X1, IO, 1.32%, 6/25/2030 (k) | | |
Series K119, Class X1, IO, 0.93%, 9/25/2030 (k) | | |
SEE NOTES TO FINANCIAL STATEMENTS.
SCHEDULE OF PORTFOLIO INVESTMENTSAS OF February 29, 2024 (continued)
| | |
Commercial Mortgage-Backed Securities — continued |
Series K120, Class X1, IO, 1.04%, 10/25/2030 (k) | | |
Series K123, Class X1, IO, 0.77%, 12/25/2030 (k) | | |
Series K129, Class X3, IO, 3.16%, 5/25/2031 (k) | | |
Series K131, Class X1, IO, 0.73%, 7/25/2031 (k) | | |
Series K133, Class X1, IO, 0.35%, 9/25/2031 (k) | | |
Series K-152, Class A1, 3.78%, 1/25/2032 | | |
Series K-161, Class A1, 5.08%, 7/25/2032 | | |
Series K-1514, Class X1, IO, 0.58%, 10/25/2034 (k) | | |
Series Q012, Class X, IO, 4.07%, 9/25/2035 (k) | | |
Series K-1518, Class X1, IO, 0.86%, 10/25/2035 (k) | | |
Series K-1520, Class X1, IO, 0.47%, 2/25/2036 (k) | | |
Series K067, Class X3, IO, 2.11%, 9/25/2044 (k) | | |
Series K068, Class X3, IO, 2.06%, 10/25/2044 (k) | | |
Series K060, Class X3, IO, 1.90%, 12/25/2044 (k) | | |
Series K062, Class X3, IO, 2.08%, 1/25/2045 (k) | | |
Series K730, Class X3, IO, 2.03%, 2/25/2045 (k) | | |
Series K065, Class X3, IO, 2.19%, 7/25/2045 (k) | | |
Series K066, Class X3, IO, 2.16%, 8/25/2045 (k) | | |
Series K071, Class X3, IO, 2.01%, 11/25/2045 (k) | | |
Series K085, Class X3, IO, 2.31%, 12/25/2045 (k) | | |
Series K097, Class X3, IO, 2.02%, 9/25/2046 (k) | | |
Series K082, Class X3, IO, 2.21%, 10/25/2046 (k) | | |
Series K083, Class X3, IO, 2.29%, 11/25/2046 (k) | | |
Series K092, Class X3, IO, 2.25%, 5/25/2047 (k) | | |
Series K737, Class X3, IO, 1.77%, 1/25/2048 (k) | | |
| | |
|
Series K109, Class X3, IO, 3.39%, 5/25/2048 (k) | | |
Series K121, Class X3, IO, 2.77%, 11/25/2048 (k) | | |
Series K126, Class X3, IO, 2.63%, 1/25/2049 (k) | | |
Series K124, Class X3, IO, 2.62%, 2/25/2049 (k) | | |
Series K125, Class X3, IO, 2.65%, 2/25/2049 (k) | | |
Series K741, Class X3, IO, 2.45%, 3/25/2049 (k) | | |
Series K127, Class X3, IO, 2.65%, 3/25/2049 (k) | | |
Series K743, Class X3, IO, 2.95%, 6/25/2049 (k) | | |
FIVE Mortgage Trust Series 2023-V1, Class XA, IO, 0.68%, 2/10/2056 (k) | | |
| | |
Series 2020-M3, Class X1, IO, 0.35%, 2/25/2030 (k) | | |
Series 2022-M2, Class X2, IO, 0.21%, 1/25/2032 (k) | | |
Series 2020-M31, Class AB, 0.50%, 10/25/2032 | | |
Series 2023-M8, Class A2, 4.47%, 3/25/2033 (k) | | |
| | |
Series 2017-KF31, Class B, 8.35%, 4/25/2024 (a) (k) | | |
Series 2017-KF38, Class B, 7.95%, 9/25/2024 (a) (k) | | |
Series 2018-KF45, Class B, 7.40%, 3/25/2025 (a) (k) | | |
Series 2018-KF47, Class B, 7.45%, 5/25/2025 (a) (k) | | |
Series 2018-KC02, Class B, 4.10%, 7/25/2025 (a) (k) | | |
Series 2018-KF53, Class B, 7.50%, 10/25/2025 (k) | | |
Series 2019-KF60, Class B, 7.80%, 2/25/2026 (a) (k) | | |
Series 2019-KF62, Class B, 7.50%, 4/25/2026 (a) (k) | | |
Series 2019-K735, Class B, 4.02%, 5/25/2026 (a) (k) | | |
Series 2019-KF72, Class B, 7.55%, 11/25/2026 (a) (k) | | |
SEE NOTES TO FINANCIAL STATEMENTS.
| | |
Commercial Mortgage-Backed Securities — continued |
Series 2017-KF40, Class B, 8.15%, 11/25/2027 (a) (k) | | |
Series 2018-KF43, Class B, 7.60%, 1/25/2028 (a) (k) | | |
Series 2018-KF50, Class B, 7.35%, 7/25/2028 (a) (k) | | |
Series 2018-KF54, Class B, 7.65%, 11/25/2028 (k) | | |
Series 2019-KF59, Class B, 7.80%, 2/25/2029 (a) (k) | | |
Series 2019-KW09, Class X2A, IO, 0.10%, 5/25/2029 (a) | | |
Series 2019-KW09, Class C, PO, 6/25/2029 (a) | | |
Series 2019-KW09, Class X2B, IO, 0.10%, 6/25/2029 (a) | | |
Series 2019-KF67, Class C, 11.45%, 8/25/2029 (a) (k) | | |
Series 2020-KF76, Class B, 8.20%, 1/25/2030 (a) (k) | | |
Series 2018-KW07, Class B, 4.08%, 10/25/2031 (a) (k) | | |
Series 2023-KF149, Class CS, 11.48%, 12/25/2032 (a) (k) | | |
Series 19K-1513, Class X2A, IO, 0.10%, 8/25/2034 (a) | | |
Series 2014-K38, Class B, 4.07%, 6/25/2047 (a) (k) | | |
Series 2015-K46, Class C, 3.70%, 4/25/2048 (a) (k) | | |
Series 2017-K69, Class D, PO, 10/25/2049 (a) | | |
Series 2017-K724, Class D, PO, 12/25/2049 (a) | | |
Series 2017-K62, Class B, 3.88%, 1/25/2050 (a) (k) | | |
Series 2018-K730, Class B, 3.79%, 2/25/2050 (a) (k) | | |
Series 2019-K91, Class C, 4.26%, 4/25/2051 (a) (k) | | |
Series 2020-K116, Class D, PO, 9/25/2052 (a) | | |
Series 2020-K116, Class X2A, IO, 0.10%, 9/25/2052 (a) | | |
Series 2020-K116, Class X2B, IO, 0.10%, 9/25/2052 (a) | | |
Series 2020-K122, Class D, PO, 1/25/2054 (a) | | |
Series 2020-K122, Class X2B, IO, 0.10%, 1/25/2054 (a) | | |
| | |
|
| | |
Series 2015-93, IO, 0.24%, 11/16/2054 (k) | | |
Series 2014-88, Class AJ, 2.99%, 3/16/2055 (k) | | |
Series 2015-33, IO, 0.25%, 2/16/2056 (k) | | |
Series 2017-53, IO, 0.53%, 11/16/2056 (k) | | |
Series 2023-127, IO, 0.42%, 7/16/2057 (k) | | |
Series 2017-158, IO, 0.45%, 9/16/2057 (k) | | |
Series 2018-45, IO, 0.54%, 3/16/2059 (k) | | |
Series 2023-108, IO, 0.70%, 8/16/2059 (k) | | |
Series 2018-9, IO, 0.44%, 1/16/2060 (k) | | |
Series 2019-109, IO, 0.80%, 4/16/2060 (k) | | |
Series 2020-184, IO, 0.91%, 11/16/2060 (k) | | |
Series 2021-17, IO, 1.05%, 1/16/2061 (k) | | |
Series 2021-82, Class TA, IF, IO, 3.64%, 4/16/2061 (k) | | |
Series 2021-90, IO, 0.83%, 5/16/2061 (k) | | |
Series 2021-147, IO, 0.99%, 6/16/2061 (k) | | |
Series 2021-153, Class SA, IF, IO, 3.60%, 8/16/2061 (k) | | |
Series 2019-154, IO, 0.58%, 9/16/2061 (k) | | |
Series 2021-218, IO, 0.96%, 10/16/2061 (k) | | |
Series 2020-2, IO, 0.59%, 3/16/2062 (k) | | |
Series 2020-110, IO, 0.98%, 3/16/2062 (k) | | |
Series 2020-38, IO, 0.82%, 4/16/2062 (k) | | |
Series 2020-120, IO, 0.76%, 5/16/2062 (k) | | |
Series 2020-100, IO, 0.78%, 5/16/2062 (k) | | |
Series 2020-91, Class IU, IO, 0.99%, 5/16/2062 (k) | | |
SEE NOTES TO FINANCIAL STATEMENTS.
SCHEDULE OF PORTFOLIO INVESTMENTSAS OF February 29, 2024 (continued)
| | |
Commercial Mortgage-Backed Securities — continued |
Series 2020-118, IO, 0.88%, 6/16/2062 (k) | | |
Series 2020-194, IO, 1.08%, 6/16/2062 (k) | | |
Series 2020-169, IO, 0.85%, 7/16/2062 (k) | | |
Series 2020-64, IO, 1.17%, 7/16/2062 (k) | | |
Series 2020-161, IO, 1.05%, 8/16/2062 (k) | | |
Series 2021-71, IO, 0.87%, 10/16/2062 (k) | | |
Series 2021-28, IO, 1.04%, 10/16/2062 (k) | | |
Series 2020-190, IO, 1.05%, 11/16/2062 (k) | | |
Series 2021-35, IO, 1.03%, 12/16/2062 (k) | | |
Series 2021-11, Class IX, IO, 1.16%, 12/16/2062 (k) | | |
Series 2021-40, IO, 0.82%, 2/16/2063 (k) | | |
Series 2021-120, IO, 0.99%, 2/16/2063 (k) | | |
Series 2021-62, Class SA, IF, IO, 3.37%, 2/16/2063 (k) | | |
Series 2021-106, IO, 0.86%, 4/16/2063 (k) | | |
Series 2021-151, IO, 0.92%, 4/16/2063 (k) | | |
Series 2021-60, IO, 0.83%, 5/16/2063 (k) | | |
Series 2021-126, IO, 0.85%, 5/16/2063 (k) | | |
Series 2021-22, IO, 0.98%, 5/16/2063 (k) | | |
Series 2021-10, IO, 0.99%, 5/16/2063 (k) | | |
Series 2021-170, IO, 0.99%, 5/16/2063 (k) | | |
Series 2024-32, IO, 0.71%, 6/16/2063 (k) | | |
Series 2021-141, Class SA, IF, IO, 3.65%, 6/16/2063 (k) | | |
Series 2021-133, IO, 0.88%, 7/16/2063 (k) | | |
Series 2021-61, IO, 1.04%, 8/16/2063 (k) | | |
Series 2023-15, Class AB, 4.00%, 8/16/2063 (k) | | |
| | |
|
Series 2023-179, IO, 0.61%, 9/16/2063 (k) | | |
Series 2021-110, IO, 0.87%, 11/16/2063 (k) | | |
Series 2021-200, IO, 0.88%, 11/16/2063 (k) | | |
Series 2021-180, IO, 0.91%, 11/16/2063 (k) | | |
Series 2021-185, IO, 1.10%, 11/16/2063 (k) | | |
Series 2021-220, IO, 0.83%, 12/16/2063 (k) | | |
Series 2021-224, IO, 0.78%, 4/16/2064 (k) | | |
Series 2022-149, IO, 0.45%, 6/16/2064 (k) | | |
Series 2022-134, IO, 0.51%, 6/16/2064 (k) | | |
Series 2022-165, IO, 0.59%, 6/16/2064 (k) | | |
Series 2022-80, IO, 0.59%, 6/16/2064 (k) | | |
Series 2022-62, IO, 0.62%, 6/16/2064 (k) | | |
Series 2022-52, IO, 0.77%, 6/16/2064 (k) | | |
Series 2022-141, IO, 0.78%, 6/16/2064 (k) | | |
Series 2022-210, IO, 0.70%, 7/16/2064 (k) | | |
Series 2022-199, IO, 0.76%, 7/16/2064 (k) | | |
Series 2023-15, IO, 0.92%, 8/16/2064 (k) | | |
Series 2023-36, IO, 0.93%, 10/16/2064 (k) | | |
Series 2023-144, Class IB, IO, 0.75%, 12/16/2064 (k) | | |
Series 2023-26, IO, 0.97%, 4/16/2065 (k) | | |
Series 2023-51, IO, 1.12%, 5/16/2065 (k) | | |
Series 2024-17, IO, 1.06%, 6/16/2065 (k) | | |
Series 2023-126, IO, 0.88%, 7/16/2065 (k) | | |
Series 2023-46, IO, 1.16%, 7/16/2065 (k) | | |
SEE NOTES TO FINANCIAL STATEMENTS.
| | |
Commercial Mortgage-Backed Securities — continued |
GS Mortgage Securities Corp. II Series 2023-SHIP, Class A, 4.32%, 9/10/2038 (a) (k) | | |
GS Mortgage Securities Trust | | |
Series 2016-GS2, Class D, 2.75%, 5/10/2049 (a) | | |
Series 2019-GC40, Class E, 3.00%, 7/10/2052 (a) | | |
ILPT Commercial Mortgage Trust | | |
Series 2022-LPF2, Class A, 7.56%, 10/15/2039 (a) (k) | | |
Series 2022-LPF2, Class E, 11.26%, 10/15/2039 (a) (k) | | |
JPMBB Commercial Mortgage Securities Trust | | |
Series 2015-C30, Class C, 4.23%, 7/15/2048 (k) | | |
Series 2015-C31, Class B, 4.62%, 8/15/2048 (k) | | |
Series 2015-C33, Class C, 4.64%, 12/15/2048 (k) | | |
JPMCC Commercial Mortgage Securities Trust | | |
Series 2017-JP5, Class C, 3.75%, 3/15/2050 (k) | | |
Series 2017-JP5, Class B, 4.08%, 3/15/2050 (k) | | |
JPMorgan Chase Commercial Mortgage Securities Trust | | |
Series 2013-C16, Class D, 4.94%, 12/15/2046 (a) (k) | | |
Series 2015-JP1, Class C, 4.72%, 1/15/2049 (k) | | |
Series 2016-JP3, Class C, 3.42%, 8/15/2049 (k) | | |
Morgan Stanley Bank of America Merrill Lynch Trust | | |
Series 2014-C15, Class D, 4.90%, 4/15/2047 (a) (k) | | |
Series 2014-C16, Class AS, 4.09%, 6/15/2047 | | |
Series 2014-C18, Class B, 4.41%, 10/15/2047 (k) | | |
Series 2016-C31, Class C, 4.26%, 11/15/2049 (k) | | |
Series 2015-C23, Class B, 4.14%, 7/15/2050 (k) | | |
Morgan Stanley Capital I Trust Series 2020-L4, Class D, 2.50%, 2/15/2053 (a) | | |
| | |
|
MRCD MARK Mortgage Trust Series 2019-PARK, Class E, 2.72%, 12/15/2036 (a) | | |
MSC Trust Series 2021-ILP, Class A, 6.21%, 11/15/2036 (a) (k) | | |
MSWF Commercial Mortgage Trust Series 2023-2, Class A5, 6.01%, 12/15/2056 (k) | | |
Multi-Family Connecticut Avenue Securities Trust | | |
Series 2019-01, Class M10, 8.69%, 10/25/2049 (a) (k) | | |
Series 2020-01, Class M10, 9.19%, 3/25/2050 (a) (k) | | |
Series 2023-01, Class M7, 9.32%, 11/25/2053 (a) (k) | | |
Series 2023-01, Class M10, 11.82%, 11/25/2053 (a) (k) | | |
UBS Commercial Mortgage Trust Series 2018-C10, Class D, 3.00%, 5/15/2051 (a) | | |
Velocity Commercial Capital Loan Trust | | |
Series 2018-1, Class A, 3.59%, 4/25/2048 (a) | | |
Series 2022-3, Class A, 5.22%, 6/25/2052 (a) (k) | | |
Series 2022-4, Class A, 5.63%, 8/25/2052 (a) (k) | | |
Wells Fargo Commercial Mortgage Trust | | |
Series 2018-C44, Class D, 3.00%, 5/15/2051 (a) | | |
Series 2022-C62, Class C, 4.35%, 4/15/2055 (k) | | |
WFRBS Commercial Mortgage Trust | | |
Series 2014-C21, Class C, 4.23%, 8/15/2047 (k) | | |
Series 2014-C22, Class C, 3.75%, 9/15/2057 (k) | | |
Series 2014-C22, Class B, 4.37%, 9/15/2057 (k) | | |
Total Commercial Mortgage-Backed Securities
(Cost $234,732,633) | | |
Mortgage-Backed Securities — 19.9% |
| | |
Pool # WN1250, 4.40%, 5/1/2028 | | |
Pool # WN2453, 4.62%, 5/1/2028 | | |
Pool # WN2492, 4.93%, 6/1/2028 | | |
Pool # WN2493, 4.94%, 9/1/2028 | | |
SEE NOTES TO FINANCIAL STATEMENTS.
SCHEDULE OF PORTFOLIO INVESTMENTSAS OF February 29, 2024 (continued)
| | |
Mortgage-Backed Securities — continued |
Pool # WN2435, 3.99%, 7/1/2030 | | |
Pool # WN2184, 2.50%, 4/1/2032 | | |
Pool # WN2266, 3.55%, 10/1/2032 | | |
Pool # WN2270, 3.95%, 10/1/2032 | | |
Pool # WN2271, 3.95%, 10/1/2032 | | |
Pool # WN2290, 3.80%, 11/1/2032 | | |
Pool # WN2298, 4.35%, 11/1/2032 | | |
Pool # WA3236, 4.75%, 11/1/2032 | | |
Pool # WN2326, 4.45%, 12/1/2032 | | |
Pool # WN1205, 4.60%, 1/1/2033 | | |
Pool # WN1206, 4.60%, 1/1/2033 | | |
Pool # WN2308, 4.90%, 1/1/2033 | | |
| | |
Pool # MA4894, 6.00%, 1/1/2053 | | |
Pool # MA5167, 6.50%, 10/1/2053 | | |
Pool # MA5192, 6.50%, 11/1/2053 | | |
| | |
Pool # BS9065, 4.62%, 7/1/2028 | | |
Pool # BS9617, 4.79%, 10/1/2028 | | |
Pool # BS7094, 4.78%, 11/1/2029 | | |
Pool # BS9607, 5.06%, 9/1/2030 | | |
Pool # BS9738, 4.97%, 10/1/2030 | | |
Pool # BS3390, 1.69%, 10/1/2031 | | |
Pool # BS3377, 1.72%, 10/1/2031 | | |
Pool # BS4789, 2.17%, 2/1/2032 | | |
Pool # BS8929, 4.52%, 7/1/2033 | | |
Pool # BS4294, 1.97%, 1/1/2034 | | |
| | |
Pool # MA8151, 4.50%, 7/20/2052 | | |
Pool # MA8649, 6.00%, 2/20/2053 | | |
Pool # MA8651, 7.00%, 2/20/2053 | | |
Pool # MA9109, 7.00%, 8/20/2053 | | |
Pool # MA9110, 7.50%, 8/20/2053 | | |
Pool # MA9173, 6.50%, 9/20/2053 | | |
Pool # MA9174, 7.00%, 9/20/2053 | | |
Pool # MA9243, 6.50%, 10/20/2053 | | |
Pool # MA9425, 6.50%, 1/20/2054 | | |
| | |
Pool # CW7529, 7.00%, 9/20/2063 | | |
Pool # CX4071, 7.00%, 10/20/2063 | | |
Pool # CX4083, 7.00%, 10/20/2063 | | |
Pool # CY0090, 7.00%, 10/20/2063 | | |
Pool # CY0120, 7.00%, 10/20/2063 | | |
| | |
|
GNMA II, Single Family, 30 Year | | |
TBA, 5.50%, 3/15/2054 (j) | | |
TBA, 6.00%, 3/15/2054 (j) | | |
Total Mortgage-Backed Securities
(Cost $212,345,497) | | |
Asset-Backed Securities — 17.2% |
ACHV ABS TRUST Series 2023-2PL, Class B, 6.88%, 5/20/2030 (a) | | |
Affirm Asset Securitization Trust | | |
Series 2022-A, Class 1D, 5.53%, 5/17/2027 (a) | | |
Series 2023-A, Class 1A, 6.61%, 1/18/2028 (a) | | |
Series 2023-A, Class A, 6.61%, 1/18/2028 (a) | | |
Series 2023-B, Class A, 6.82%, 9/15/2028 (a) | | |
AIMCO CLO (Cayman Islands) Series 2015-AA, Class BR2, 7.18%, 10/17/2034 (a) (k) | | |
Air Canada Pass-Through Trust (Canada) Series 2020-2, Class B, 9.00%, 10/1/2025 (a) | | |
American Airlines Pass-Through Trust Series 2021-1, Class B, 3.95%, 7/11/2030 | | |
American Credit Acceptance Receivables Trust | | |
Series 2023-1, Class A, 5.45%, 9/14/2026 (a) | | |
Series 2022-3, Class B, 4.55%, 10/13/2026 (a) | | |
Series 2022-4, Class B, 6.75%, 10/13/2026 (a) | | |
Series 2024-1, Class B, 5.60%, 11/12/2027 (a) | | |
Series 2021-3, Class E, 2.56%, 11/15/2027 (a) | | |
Series 2023-4, Class B, 6.63%, 2/14/2028 (a) | | |
Series 2022-2, Class E, 6.57%, 6/13/2028 (a) | | |
Series 2022-3, Class D, 5.83%, 10/13/2028 (a) | | |
Series 2022-4, Class C, 7.86%, 2/15/2029 (a) | | |
Series 2023-1, Class C, 5.59%, 4/12/2029 (a) | | |
Series 2023-1, Class D, 6.35%, 4/12/2029 (a) | | |
SEE NOTES TO FINANCIAL STATEMENTS.
| | |
Asset-Backed Securities — continued |
Series 2023-2, Class C, 5.96%, 8/13/2029 (a) | | |
Series 2023-3, Class C, 6.44%, 10/12/2029 (a) | | |
Series 2023-3, Class D, 6.82%, 10/12/2029 (a) | | |
Series 2024-1, Class C, 5.63%, 1/14/2030 (a) | | |
Series 2024-1, Class D, 5.86%, 5/13/2030 (a) | | |
Series 2023-4, Class D, 7.65%, 9/12/2030 (a) | | |
| | |
Series 2020-SFR1, Class H, 5.30%, 4/17/2037 (a) | | |
Series 2020-SFR3, Class G, 4.99%, 9/17/2037 (a) | | |
Series 2020-SFR5, Class F, 2.69%, 11/17/2037 (a) | | |
Apidos CLO (Cayman Islands) | | |
Series 2018-29A, Class A2, 7.14%, 7/25/2030 (a) (k) | | |
Series 2019-31A, Class A1R, 6.68%, 4/15/2031 (a) (k) | | |
Series 2020-33A, Class BR, 7.18%, 10/24/2034 (a) (k) | | |
Ares CLO Ltd. (Cayman Islands) Series 2016-40A, Class A1RR, 6.45%, 1/15/2029 (a) (k) | | |
ARES CLO Ltd. (Cayman Islands) Series 2018-47A, Class B, 7.03%, 4/15/2030 (a) (k) | | |
Avis Budget Rental Car Funding AESOP LLC | | |
Series 2020-1A, Class C, 3.02%, 8/20/2026 (a) | | |
Series 2022-3A, Class A, 4.62%, 2/20/2027 (a) | | |
Series 2023-1A, Class C, 6.23%, 4/20/2029 (a) | | |
Series 2023-4A, Class A, 5.49%, 6/20/2029 (a) | | |
Bain Capital Credit CLO (Cayman Islands) Series 2020-1A, Class A1, 6.75%, 4/18/2033 (a) (k) | | |
Ballyrock CLO Ltd. (Cayman Islands) Series 2020-2A, Class A2R, 7.13%, 10/20/2031 (a) (k) | | |
Benefit Street Partners CLO Ltd. (Cayman Islands) Series 2019-18A, Class A1R, 6.75%, 10/15/2034 (a) (k) | | |
| | |
|
Bridgecrest Lending Auto Securitization Trust Series 2023-1, Class B, 6.80%, 8/15/2029 | | |
British Airways Pass-Through Trust (United Kingdom) Series 2020-1, Class B, 8.38%, 11/15/2028 (a) | | |
BSPRT Issuer Ltd. (Cayman Islands) | | |
Series 2021-FL7, Class D, 8.18%, 12/15/2038 (a) (k) | | |
Series 2021-FL7, Class E, 8.83%, 12/15/2038 (a) (k) | | |
Business Jet Securities LLC Series 2020-1A, Class A, 2.98%, 11/15/2035 ‡ (a) | | |
Carlyle Global Market Strategies CLO Ltd. (Cayman Islands) Series 2014-1A, Class A1R2, 6.55%, 4/17/2031 (a) (k) | | |
CIFC Funding Ltd. (Cayman Islands) | | |
Series 2014-1A, Class BR2, 6.96%, 1/18/2031 (a) (k) | | |
Series 2018-1A, Class B, 6.96%, 4/18/2031 (a) (k) | | |
Series 2014-5A, Class A1R2, 6.78%, 10/17/2031 (a) (k) | | |
Series 2021-4A, Class A, 6.63%, 7/15/2033 (a) (k) | | |
Conn's Receivables Funding LLC | | |
Series 2022-A, Class B, 9.52%, 12/15/2026 (a) | | |
Series 2023-A, Class A, 8.01%, 1/17/2028 (a) | | |
Series 2023-A, Class B, 10.00%, 1/17/2028 (a) | | |
CoreVest American Finance Trust | | |
Series 2019-1, Class E, 5.59%, 3/15/2052 (a) (k) | | |
Series 2019-2, Class E, 5.22%, 6/15/2052 (a) (k) | | |
Series 2019-3, Class E, 4.72%, 10/15/2052 (a) (k) | | |
Credit Acceptance Auto Loan Trust | | |
Series 2022-3A, Class A, 6.57%, 10/15/2032 (a) | | |
Series 2023-1A, Class A, 6.48%, 3/15/2033 (a) | | |
Series 2022-3A, Class D, 9.00%, 4/18/2033 (a) | | |
Series 2023-2A, Class A, 5.92%, 5/16/2033 (a) | | |
SEE NOTES TO FINANCIAL STATEMENTS.
SCHEDULE OF PORTFOLIO INVESTMENTSAS OF February 29, 2024 (continued)
| | |
Asset-Backed Securities — continued |
Series 2023-3A, Class B, 7.09%, 10/17/2033 (a) | | |
Series 2023-5A, Class A, 6.13%, 12/15/2033 (a) | | |
Series 2023-5A, Class B, 6.71%, 2/15/2034 (a) | | |
DB Master Finance LLC Series 2021-1A, Class A23, 2.79%, 11/20/2051 (a) | | |
Dewolf Park CLO Ltd. Series 2017-1A, Class AR, 6.50%, 10/15/2030 (a) (k) | | |
Domino's Pizza Master Issuer LLC Series 2015-1A, Class A2II, 4.47%, 10/25/2045 (a) | | |
Driven Brands Funding LLC | | |
Series 2019-1A, Class A2, 4.64%, 4/20/2049 (a) | | |
Series 2021-1A, Class A2, 2.79%, 10/20/2051 (a) | | |
Series 2022-1A, Class A2, 7.39%, 10/20/2052 (a) | | |
Dryden CLO Ltd. (Cayman Islands) | | |
Series 2018-64A, Class A, 6.53%, 4/18/2031 (a) (k) | | |
Series 2018-58A, Class B, 7.08%, 7/17/2031 (a) (k) | | |
Series 2019-68A, Class AR, 6.75%, 7/15/2035 (a) (k) | | |
Series 2019-68A, Class BR, 7.28%, 7/15/2035 (a) (k) | | |
Dryden Senior Loan Fund (Cayman Islands) | | |
Series 2017-47A, Class A1R, 6.56%, 4/15/2028 (a) (k) | | |
Series 2015-41A, Class AR, 6.55%, 4/15/2031 (a) (k) | | |
| | |
Series 2021-4A, Class D, 1.99%, 9/15/2027 (a) | | |
Series 2021-4A, Class E, 3.34%, 7/17/2028 (a) | | |
Series 2022-3A, Class C, 7.69%, 7/17/2028 (a) | | |
Series 2023-1A, Class B, 5.19%, 10/16/2028 (a) | | |
Series 2023-1A, Class C, 5.55%, 10/16/2028 (a) | | |
Series 2022-1A, Class E, 5.53%, 3/15/2029 (a) | | |
Series 2023-3A, Class C, 6.40%, 5/15/2029 (a) | | |
| | |
|
Elmwood CLO Ltd. (Cayman Islands) | | |
Series 2020-1A, Class A, 6.82%, 4/15/2033 (a) (k) | | |
Series 2021-4A, Class B, 7.18%, 10/20/2034 (a) (k) | | |
Exeter Automobile Receivables Trust | | |
Series 2020-3A, Class E, 3.44%, 8/17/2026 (a) | | |
Series 2021-2A, Class D, 1.40%, 4/15/2027 | | |
Series 2023-1A, Class B, 5.72%, 4/15/2027 | | |
Series 2021-3A, Class D, 1.55%, 6/15/2027 | | |
Series 2020-3A, Class F, 5.56%, 6/15/2027 (a) | | |
Series 2023-1A, Class C, 5.82%, 2/15/2028 | | |
Series 2023-3A, Class C, 6.21%, 6/15/2028 | | |
Series 2021-2A, Class E, 2.90%, 7/17/2028 (a) | | |
Series 2023-2A, Class C, 5.75%, 7/17/2028 | | |
Series 2023-4A, Class C, 6.51%, 8/15/2028 | | |
Series 2022-3A, Class D, 6.76%, 9/15/2028 | | |
Series 2021-3A, Class E, 3.04%, 12/15/2028 (a) | | |
Series 2022-4A, Class D, 5.98%, 12/15/2028 | | |
Series 2022-6A, Class D, 8.03%, 4/6/2029 | | |
Series 2023-3A, Class D, 6.68%, 4/16/2029 | | |
Series 2023-1A, Class D, 6.69%, 6/15/2029 | | |
Series 2023-2A, Class D, 6.32%, 8/15/2029 | | |
Series 2022-1A, Class E, 5.02%, 10/15/2029 (a) | | |
Series 2023-1A, Class E, 12.07%, 9/16/2030 (a) | | |
FirstKey Homes Trust Series 2020-SFR1, Class F1, 3.64%, 8/17/2037 (a) | | |
Flagship Credit Auto Trust | | |
Series 2019-3, Class E, 3.84%, 12/15/2026 (a) | | |
SEE NOTES TO FINANCIAL STATEMENTS.
| | |
Asset-Backed Securities — continued |
Series 2023-1, Class A3, 5.01%, 8/16/2027 (a) | | |
Series 2023-1, Class B, 5.05%, 1/18/2028 (a) | | |
FMC GMSR Issuer Trust Series 2022-GT1, Class B, 7.17%, 4/25/2027 (a) | | |
Foundation Finance Trust Series 2023-1A, Class D, 9.18%, 12/15/2043 (a) | | |
| | |
Series 2022-1FP, Class D, 3.35%, 3/19/2029 (a) | | |
Series 2022-3FP, Class C, 7.05%, 8/20/2029 (a) | | |
Series 2022-4FP, Class B, 7.58%, 12/18/2029 (a) | | |
Galaxy CLO Ltd. (Cayman Islands) | | |
Series 2018-25A, Class C, 7.59%, 10/25/2031 (a) (k) | | |
Series 2016-22A, Class ARR, 6.78%, 4/16/2034 (a) (k) | | |
GLS Auto Receivables Issuer Trust | | |
Series 2023-1A, Class A2, 5.98%, 8/17/2026 (a) | | |
Series 2023-1A, Class B, 6.19%, 6/15/2027 (a) | | |
Series 2021-1A, Class E, 3.14%, 1/18/2028 (a) | | |
Series 2022-2A, Class D, 6.15%, 4/17/2028 (a) | | |
Series 2023-1A, Class C, 6.38%, 12/15/2028 (a) | | |
Series 2023-1A, Class D, 7.01%, 1/16/2029 (a) | | |
Series 2022-2A, Class E, 5.50%, 6/15/2029 (a) | | |
Goldentree Loan Management US CLO Ltd. (Cayman Islands) Series 2017-2A, Class AR, 6.49%, 11/20/2030 (a) (k) | | |
GoldenTree Loan Opportunities XII Ltd. (Cayman Islands) Series 2016-12A, Class CR, 7.53%, 7/21/2030 (a) (k) | | |
Hertz Vehicle Financing III LLC Series 2023-4A, Class D, 9.44%, 3/25/2030 (a) | | |
Hertz Vehicle Financing LLC | | |
Series 2022-3A, Class B, 3.86%, 3/25/2025 (a) | | |
Series 2022-4A, Class D, 6.56%, 9/25/2026 (a) | | |
| | |
|
Series 2023-1A, Class A, 5.49%, 6/25/2027 (a) | | |
Series 2023-1A, Class C, 6.91%, 6/25/2027 (a) | | |
Series 2023-3A, Class A, 5.94%, 2/25/2028 (a) | | |
Series 2023-3A, Class D, 9.43%, 2/25/2028 (a) | | |
Series 2023-2A, Class D, 9.40%, 9/25/2029 (a) | | |
HGI CRE CLO Ltd. (Cayman Islands) Series 2022-FL3, Class E, 9.62%, 4/20/2037 (a) (k) | | |
Hilton Grand Vacations Trust Series 2022-1D, Class D, 6.79%, 6/20/2034 (a) | | |
HINNT LLC Series 2022-A, Class D, 6.50%, 5/15/2041 (a) | | |
KKR CLO Ltd. (Cayman Islands) Series 22A, Class B, 7.18%, 7/20/2031 (a) (k) | | |
KKR CLO Trust (Cayman Islands) Series 39A, Class B1, 7.28%, 10/15/2034 (a) (k) | | |
LCM Ltd. (Cayman Islands) Series 26A, Class A1, 6.65%, 1/20/2031 (a) (k) | | |
LendingClub Loan Certificate Issuer Trust | | |
Series 2022-NP1, Class CERT, 0.00%, 3/16/2037 ‡ (a) | | |
Series 2022-P1, Class CERT, 0.00%, 3/16/2037 ‡ (a) | | |
Series 2022-P2, Class CERT, 0.00%, 4/15/2037 ‡ (a) | | |
Lendingpoint Asset Securitization Trust | | |
Series 2022-A, Class D, 4.54%, 6/15/2029 (a) | | |
Series 2022-B, Class A, 4.77%, 10/15/2029 (a) | | |
Series 2022-C, Class C, 8.68%, 2/15/2030 (a) | | |
Lendmark Funding Trust Series 2024-1A, Class A, 5.53%, 6/21/2032 (a) | | |
Madison Park Funding Ltd. (Cayman Islands) | | |
Series 2016-20A, Class BR, 7.13%, 7/27/2030 (a) (k) | | |
Series 2017-26A, Class CR, 7.63%, 7/29/2030 (a) (k) | | |
Series 2018-32A, Class A1R, 6.58%, 1/22/2031 (a) (k) | | |
Series 2017-23A, Class AR, 6.55%, 7/27/2031 (a) (k) | | |
SEE NOTES TO FINANCIAL STATEMENTS.
SCHEDULE OF PORTFOLIO INVESTMENTSAS OF February 29, 2024 (continued)
| | |
Asset-Backed Securities — continued |
Series 2019-34A, Class AR, 6.71%, 4/25/2032 (a) (k) | | |
Series 2019-33A, Class AR, 6.60%, 10/15/2032 (a) (k) | | |
Series 2019-37A, Class AR, 6.65%, 7/15/2033 (a) (k) | | |
Magnetite Ltd. (Cayman Islands) | | |
Series 2019-22A, Class AR, 6.64%, 4/15/2031 (a) (k) | | |
Series 2015-12A, Class ARR, 6.68%, 10/15/2031 (a) (k) | | |
Mariner Finance Issuance Trust Series 2023-AA, Class E, 11.12%, 10/22/2035 (a) | | |
| | |
Series 2023-1A, Class A, 6.07%, 4/15/2033 (a) | | |
Series 2023-1A, Class B, 6.50%, 4/15/2033 (a) | | |
Series 2023-1A, Class C, 7.20%, 4/15/2033 (a) | | |
Neuberger Berman CLO (Cayman Islands) Series 2013-15A, Class A1R2, 6.50%, 10/15/2029 (a) (k) | | |
Neuberger Berman Loan Advisers CLO Ltd. (Cayman Islands) Series 2017-26A, Class AR, 6.48%, 10/18/2030 (a) (k) | | |
New Residential Mortgage LLC Series 2020-FNT2, Class A, 5.44%, 7/25/2025 (a) | | |
New Residential Mortgage Loan Trust Series 2022-SFR1, Class E1, 3.55%, 2/17/2039 (a) | | |
NRZ Excess Spread-Collateralized Notes | | |
Series 2021-FNT1, Class A, 2.98%, 3/25/2026 (a) | | |
Series 2021-FNT2, Class A, 3.23%, 5/25/2026 (a) | | |
Series 2021-FHT1, Class A, 3.10%, 7/25/2026 (a) | | |
Series 2021-GNT1, Class A, 3.47%, 11/25/2026 (a) | | |
OCP CLO Ltd. (Cayman Islands) | | |
Series 2018-15A, Class A1, 6.68%, 7/20/2031 (a) (k) | | |
Series 2015-9A, Class A1R2, 6.57%, 1/15/2033 (a) (k) | | |
| | |
|
Octagon Investment Partners Ltd. (Cayman Islands) | | |
Series 2018-2A, Class A1B, 6.84%, 7/25/2030 (a) (k) | | |
Series 2018-1A, Class A1A, 6.64%, 1/20/2031 (a) (k) | | |
OnDeck Asset Securitization Trust IV LLC Series 2023-1A, Class A, 7.00%, 8/19/2030 (a) | | |
OneMain Financial Issuance Trust | | |
Series 2018-2A, Class A, 3.57%, 3/14/2033 (a) | | |
Series 2023-2A, Class A2, 6.82%, 9/15/2036 (a) (k) | | |
| | |
Series 2022-2, Class A, 5.94%, 10/9/2029 (a) | | |
Series 2022-2, Class D, 11.34%, 10/9/2029 | | |
Series 2022-3, Class A, 7.45%, 1/8/2030 (a) | | |
Pagaya AI Debt Selection Trust Series 2021-3, Class C, 3.27%, 5/15/2029 (a) | | |
Palmer Square CLO Ltd. (Cayman Islands) Series 2015-1A, Class A1A4, 6.71%, 5/21/2034 (a) (k) | | |
Palmer Square Loan Funding Ltd. (Cayman Islands) Series 2022-1A, Class A1, 6.37%, 4/15/2030 (a) (k) | | |
| | |
Series 2021-FT1, Class A, 8.44%, 3/25/2026 (a) (k) | | |
Series 2022-FT1, Class A, 9.51%, 6/25/2027 (a) (k) | | |
PNMAC GMSR ISSUER TRUST Series 2022-GT1, Class A, 9.57%, 5/25/2027 (a) (k) | | |
Progress Residential Trust Series 2023-SFR1, Class E1, 6.15%, 3/17/2040 (a) | | |
PRPM LLC Series 2021-11, Class A2, 4.58%, 11/25/2026 (a) (i) | | |
RCO VI Mortgage LLC Series 2022-1, Class A1, 3.00%, 1/25/2027 (a) (i) | | |
Republic Finance Issuance Trust Series 2021-A, Class D, 5.23%, 12/22/2031 (a) | | |
Santander Bank Auto Credit-Linked Notes | | |
Series 2022-C, Class B, 6.45%, 12/15/2032 (a) | | |
SEE NOTES TO FINANCIAL STATEMENTS.
| | |
Asset-Backed Securities — continued |
Series 2022-C, Class C, 6.99%, 12/15/2032 (a) | | |
Series 2022-C, Class D, 8.20%, 12/15/2032 (a) | | |
Series 2022-C, Class E, 11.37%, 12/15/2032 (a) | | |
Santander Drive Auto Receivables Trust | | |
Series 2021-3, Class D, 1.33%, 9/15/2027 | | |
Series 2024-1, Class B, 5.23%, 12/15/2028 | | |
Series 2023-4, Class B, 5.77%, 12/15/2028 | | |
Series 2022-4, Class C, 5.00%, 11/15/2029 | | |
Series 2024-1, Class C, 5.45%, 3/15/2030 | | |
Series 2023-3, Class C, 5.77%, 11/15/2030 | | |
Series 2022-6, Class D, 5.69%, 2/18/2031 | | |
Series 2023-5, Class C, 6.43%, 2/18/2031 | | |
Series 2023-6, Class C, 6.40%, 3/17/2031 | | |
Series 2022-7, Class C, 6.69%, 3/17/2031 | | |
SBA Small Business Investment Cos. | | |
Series 2023-10A, Class 1, 5.17%, 3/10/2033 | | |
Series 2023-10B, Class 1, 5.69%, 9/10/2033 | | |
SoFi Consumer Loan Program Trust Series 2023-1S, Class A, 5.81%, 5/15/2031 (a) | | |
Symphony CLO Ltd. (Cayman Islands) | | |
Series 2018-19A, Class B, 6.93%, 4/16/2031 (a) (k) | | |
Series 2020-23A, Class AR, 6.60%, 1/15/2034 (a) (k) | | |
| | |
Series 2022-2A, Class B, 9.27%, 12/15/2028 (a) | | |
Series 2022-3A, Class A, 7.60%, 4/15/2029 (a) | | |
Tricon Residential Trust Series 2022-SFR1, Class E2, 5.74%, 4/17/2039 (a) | | |
| | |
|
United Airlines Pass-Through Trust | | |
Series 2016-2, Class B, 3.65%, 10/7/2025 | | |
Series 2016-1, Class B, 3.65%, 1/7/2026 | | |
Upstart Pass-Through Trust | | |
Series 2022-PT2, Class A, HB, 21.85%, 2/20/2030 ‡ (a) (k) | | |
Series 2022-PT3, Class A, HB, 25.11%, 4/20/2030 ‡ (a) (k) | | |
Upstart Securitization Trust | | |
Series 2021-2, Class C, 3.61%, 6/20/2031 (a) | | |
Series 2022-2, Class B, 6.10%, 5/20/2032 (a) | | |
Voya CLO Ltd. (Cayman Islands) Series 2020-2A, Class A1R, 6.73%, 7/19/2034 (a) (k) | | |
Westlake Automobile Receivables Trust | | |
Series 2022-2A, Class D, 5.48%, 9/15/2027 (a) | | |
Series 2023-1A, Class B, 5.41%, 1/18/2028 (a) | | |
Series 2021-3A, Class F, 4.25%, 6/15/2028 (a) | | |
Series 2023-1A, Class C, 5.74%, 8/15/2028 (a) | | |
Series 2023-3A, Class C, 6.02%, 9/15/2028 (a) | | |
Series 2023-1A, Class D, 6.79%, 11/15/2028 (a) | | |
Series 2023-3A, Class D, 6.47%, 3/15/2029 (a) | | |
Total Asset-Backed Securities
(Cost $183,303,006) | | |
Collateralized Mortgage Obligations — 5.9% |
Angel Oak Mortgage Trust I LLC Series 2019-4, Class B2, 5.66%, 7/26/2049 (a) (k) | | |
CHL Mortgage Pass-Through Trust Series 2006-OA5, Class 2A1, 5.84%, 4/25/2046 (k) | | |
COLT Mortgage Loan Trust Series 2023-2, Class A1, 6.60%, 7/25/2068 (a) (i) | | |
Connecticut Avenue Securities Trust | | |
Series 2019-R01, Class 2B1, 9.79%, 7/25/2031 (a) (k) | | |
Series 2019-R04, Class 2B1, 10.69%, 6/25/2039 (a) (k) | | |
SEE NOTES TO FINANCIAL STATEMENTS.
SCHEDULE OF PORTFOLIO INVESTMENTSAS OF February 29, 2024 (continued)
| | |
Collateralized Mortgage Obligations — continued |
Series 2019-R07, Class 1B1, 8.84%, 10/25/2039 (a) (k) | | |
Series 2020-R01, Class 1B1, 8.69%, 1/25/2040 (a) (k) | | |
Series 2022-R06, Class 1M2, 9.17%, 5/25/2042 (a) (k) | | |
Series 2023-R01, Class 1M1, 7.72%, 12/25/2042 (a) (k) | | |
Series 2023-R02, Class 1M1, 7.62%, 1/25/2043 (a) (k) | | |
Series 2023-R02, Class 1M2, 8.67%, 1/25/2043 (a) (k) | | |
Series 2023-R02, Class 1B1, 10.87%, 1/25/2043 (a) (k) | | |
Series 2023-R04, Class 1M1, 7.62%, 5/25/2043 (a) (k) | | |
Series 2023-R04, Class 1M2, 8.87%, 5/25/2043 (a) (k) | | |
Series 2023-R06, Class 1M2, 8.02%, 7/25/2043 (a) (k) | | |
Series 2023-R07, Class 2M2, 8.57%, 9/25/2043 (a) (k) | | |
Series 2024-R01, Class 1B1, 8.02%, 1/25/2044 (a) (k) | | |
Deephaven Residential Mortgage Trust Series 2022-2, Class A1, 4.30%, 3/25/2067 (a) (k) | | |
| | |
Series 2021-HQA1, Class M2, 7.57%, 8/25/2033 (a) (k) | | |
Series 2022-DNA3, Class M1B, 8.22%, 4/25/2042 (a) (k) | | |
Series 2023-DNA1, Class M1A, 7.42%, 3/25/2043 (a) (k) | | |
Series 2023-DNA2, Class M1A, 7.42%, 4/25/2043 (a) (k) | | |
| | |
Series 2018-DNA3, Class B1, 9.34%, 9/25/2048 (a) (k) | | |
Series 2019-HQA1, Class B1, 9.84%, 2/25/2049 (a) (k) | | |
| | |
Series 2017-DNA2, Class B1, 10.59%, 10/25/2029 (k) | | |
Series 2017-DNA3, Class B1, 9.89%, 3/25/2030 (k) | | |
| | |
Series 5164, Class J, 2.50%, 5/25/2049 | | |
| | |
|
Series 5387, Class KB, 6.00%, 3/25/2054 | | |
FNMA, Connecticut Avenue Securities | | |
Series 2017-C01, Class 1B1, 11.19%, 7/25/2029 (k) | | |
Series 2017-C02, Class 2B1, 10.94%, 9/25/2029 (k) | | |
Series 2017-C03, Class 1B1, 10.29%, 10/25/2029 (k) | | |
Series 2017-C05, Class 1B1, 9.04%, 1/25/2030 (k) | | |
Series 2017-C06, Class 1B1, 9.59%, 2/25/2030 (k) | | |
Series 2017-C07, Class 1B1, 9.44%, 5/25/2030 (k) | | |
Series 2018-C01, Class 1B1, 8.99%, 7/25/2030 (k) | | |
Series 2018-C03, Class 1B1, 9.19%, 10/25/2030 (k) | | |
Series 2021-R02, Class 2B1, 8.62%, 11/25/2041 (a) (k) | | |
Series 2021-R02, Class 2B2, 11.52%, 11/25/2041 (a) (k) | | |
FNMA, REMIC Series 2021-86, Class T, 2.50%, 9/25/2048 | | |
FWD Securitization Trust Series 2020-INV1, Class A1, 2.24%, 1/25/2050 (a) (k) | | |
| | |
Series 2014-181, Class SL, IF, IO, 0.17%, 12/20/2044 (k) | | |
Series 2021-78, Class IB, IO, 3.00%, 5/20/2051 | | |
Series 2021-107, Class XI, IO, 3.00%, 6/20/2051 | | |
Series 2021-117, Class ES, IF, IO, 0.87%, 7/20/2051 (k) | | |
Series 2021-142, Class XI, IO, 3.00%, 8/20/2051 | | |
Series 2021-188, Class IJ, IO, 3.00%, 10/20/2051 | | |
| | |
Series 2023-RTL1, Class A1, 7.87%, 1/25/2028 (a) (i) | | |
Series 2023-RTL2, Class A1, 8.00%, 6/25/2028 (a) (i) | | |
Series 2023-RTL3, Class A1, 8.00%, 8/25/2028 (a) (i) | | |
Series 2024-RTL1, Class A1, 7.02%, 1/25/2029 (a) (i) | | |
SEE NOTES TO FINANCIAL STATEMENTS.
| | |
Collateralized Mortgage Obligations — continued |
| | |
Series 2022-RTL1, Class A1, 5.07%, 4/26/2027 (a) (i) | | |
Series 2023-RTL1, Class A1, 7.58%, 8/25/2027 (a) (i) | | |
Series 2021-NQM1, Class A1, 1.15%, 4/25/2065 (a) (k) | | |
New Residential Mortgage Loan Trust | | |
Series 2018-3A, Class A1C, 3.00%, 5/25/2058 (a) (k) | | |
Series 2019-NQM5, Class A1, 2.71%, 11/25/2059 (a) (k) | | |
| | |
Series 2023-NQM3, Class A1, 5.95%, 2/25/2063 (a) (i) | | |
Series 2023-NQM7, Class A1, 6.84%, 4/25/2063 (a) (i) | | |
Series 2023-NQM6, Class A1, 6.52%, 7/25/2063 (a) (i) | | |
PNMAC GMSR Issuer Trust Series 2018-GT2, Class A, 8.84%, 8/25/2025 (a) (k) | | |
PRET LLC Series 2024-NPL2, Class A1, 7.02%, 2/25/2054 ‡ (a) (i) | | |
| | |
Series 2020-6, Class A1, 5.36%, 11/25/2025 (a) (i) | | |
Series 2024-1, Class A1, 6.96%, 2/25/2029 ‡ (a) (k) | | |
STACR Trust Series 2018-HRP2, Class B1, 9.64%, 2/25/2047 (a) (k) | | |
Starwood Mortgage Residential Trust Series 2020-INV1, Class B2, 4.26%, 11/25/2055 (a) | | |
Verus Securitization Trust | | |
Series 2023-1, Class A1, 5.85%, 12/25/2067 (a) (i) | | |
Series 2023-2, Class A1, 6.19%, 3/25/2068 (a) (i) | | |
Series 2023-4, Class A1, 5.81%, 5/25/2068 (a) (i) | | |
VM Master Issuer LLC Series 2022-1, Class B, 6.88%, 5/24/2025 ‡ (a) (k) | | |
Total Collateralized Mortgage Obligations
(Cost $61,866,037) | | |
Foreign Government Securities — 3.3% |
Banque Centrale de Tunisie 5.75%, 1/30/2025 (f) | | |
Benin Government Bond 7.96%, 2/13/2038 (a) | | |
| | |
|
Dominican Republic Government Bond | | |
| | |
| | |
| | |
| | |
| | |
| | |
| | |
Federal Republic of Nigeria | | |
| | |
| | |
| | |
| | |
| | |
| | |
| | |
| | |
Federative Republic of Brazil 7.13%, 5/13/2054 | | |
Gabonese Republic 6.95%, 6/16/2025 (f) | | |
Hashemite Kingdom of Jordan | | |
| | |
| | |
| | |
Islamic Republic of Pakistan | | |
| | |
| | |
| | |
Istanbul Metropolitan Municipality 10.50%, 12/6/2028 (a) | | |
| | |
| | |
| | |
| | |
Kingdom of Morocco 6.50%, 9/8/2033 (f) | | |
| | |
| | |
| | |
| | |
| | |
| | |
Republic of Armenia 3.60%, 2/2/2031 (f) | | |
| | |
| | |
| | |
| | |
SEE NOTES TO FINANCIAL STATEMENTS.
SCHEDULE OF PORTFOLIO INVESTMENTSAS OF February 29, 2024 (continued)
| | |
Foreign Government Securities — continued |
| | |
| | |
| | |
| | |
| | |
Republic of Cote d'Ivoire | | |
| | |
5.75%, 12/31/2032 (f) (i) | | |
| | |
| | |
| | |
| | |
| | |
| | |
| | |
| | |
| | |
| | |
Republic of Guatemala 6.60%, 6/13/2036 (a) | | |
Republic of Honduras 6.25%, 1/19/2027 (f) | | |
Republic of Iraq 5.80%, 1/15/2028 (f) | | |
| | |
| | |
| | |
| | |
Republic of Namibia 5.25%, 10/29/2025 (f) | | |
Republic of Panama 6.40%, 2/14/2035 | | |
| | |
| | |
| | |
| | |
Republic of Rwanda 5.50%, 8/9/2031 (a) | | |
| | |
| | |
| | |
Republic of Serbia 6.50%, 9/26/2033 (a) | | |
| | |
| | |
| | |
| | |
| | |
| | |
| | |
| | |
|
| | |
| | |
Republic of Uzbekistan 5.38%, 2/20/2029 (f) | | |
Republic of Uzbekistan International Bond 7.85%, 10/12/2028 (a) | | |
Romania Government Bond 6.38%, 1/30/2034 (a) | | |
| | |
| | |
| | |
| | |
Sultanate of Oman Government Bond | | |
| | |
| | |
| | |
Turkiye Ihracat Kredi Bankasi A/S | | |
| | |
| | |
Total Foreign Government Securities
(Cost $35,717,250) | | |
| | |
Exchange-Traded Funds — 1.5% |
|
Invesco Senior Loan ETF
(Cost $15,961,915) | | |
| | |
Municipal Bonds — 0.1% (a) (k) (l) |
|
California Infrastructure and Economic Development Bank, Brightline West Passenger Rail Project Series 2020A-3, Rev., AMT, 8.00%, 8/15/2024 (Cost $600,000) | | |
Convertible Bonds — 0.0% ^ |
|
DISH Network Corp. 2.38%, 3/15/2024
(Cost $150,000) | | |
SEE NOTES TO FINANCIAL STATEMENTS.
| | |
Short-Term Investments — 0.1% |
Investment Companies — 0.1% |
JPMorgan Prime Money Market Fund Class IM Shares, 5.44% (m) (n)
(Cost $1,443,320) | | |
Total Investments — 105.7%
(Cost $1,131,202,786) | | |
Liabilities in Excess of Other Assets — (5.7)% | | |
| | |
Percentages indicated are based on net assets. |
| |
| |
| Alternative Credit Enhancement Securities |
| |
| Commercial Industrial Finance Corp. |
| |
| |
| Federal Home Loan Mortgage Corp. |
| Federal National Mortgage Association |
| Government National Mortgage Association |
| High Coupon Bonds (a.k.a. "IOettes") represent the right to receive interest payments on an underlying pool of mortgages with similar features as those associated with IO securities. Unlike IO's the owner also has a right to receive a very small portion of principal. The high interest rates result from taking interest payments from other classes in the Real Estate Mortgage Investment Conduit trust and allocating them to the small principal of the HB class. |
| Intercontinental Exchange |
| Inverse Floaters represent securities that pay interest at a rate that increases (decreases) with a decline (incline) in a specified index or have an interest rate that adjusts periodically based on changes in current interest rates and prepayments on the underlying pool of assets. The interest rate shown is the rate in effect as of February 29, 2024. The rate may be subject to a cap and floor. |
| Interest Only represents the right to receive the monthly interest payments on an underlying pool of mortgage loans. The principal amount shown represents the par value on the underlying pool. The yields on these securities are subject to accelerated principal paydowns as a result of prepayment or refinancing of the underlying pool of mortgage instruments. As a result, interest income may be reduced considerably. |
| |
| Principal Only represents the right to receive the principal portion only on an underlying pool of mortgage loans. The market value of these securities is extremely volatile in response to changes in market interest rates. As prepayments on the underlying mortgages of these securities increase, the yield on these securities increases. |
| Real Estate Investment Trust |
| Real Estate Mortgage Investment Conduit |
| Combined Real Estate Mortgage Investment Conduit |
| |
| Limited partnership with share capital |
| Secured Overnight Financing Rate |
| To Be Announced; Security is subject to delayed delivery. |
| Uniform Mortgage-Backed Securities |
| |
| Amount rounds to less than 0.1% of net assets. |
| Value determined using significant unobservable inputs. | |
| Securities exempt from registration under Rule 144A or section 4(a)(2), of the Securities Act of 1933, as amended. | |
| Security has the ability to pay in kind (“PIK”) or pay income in cash. When applicable, separate rates of such payments are disclosed. | |
| Contingent Capital security (“CoCo”). CoCos are hybrid debt securities that may be convertible into equity or may be written down if a pre-specified trigger event occurs. The total value of aggregate CoCo holdings at February 29, 2024 is $2,925,934 or 0.27% of the Fund’s net assets as of February 29, 2024. | |
| Security is an interest bearing note with preferred security characteristics. | |
| Security is perpetual and thus, does not have a predetermined maturity date. The coupon rate for this security is fixed for a period of time and may be structured to adjust thereafter. The date shown, if applicable, reflects the next call date. The coupon rate shown is the rate in effect as of February 29, 2024. | |
| Security exempt from registration pursuant to Regulation S under the Securities Act of 1933, as amended. Regulation S applies to securities offerings that are made outside of the United States and do not involve direct selling efforts in the United States and as such may have restrictions on resale. | |
| Variable or floating rate security, linked to the referenced benchmark. The interest rate shown is the current rate as of February 29, 2024. | |
| | |
| Step bond. Interest rate is a fixed rate for an initial period that either resets at a specific date or may reset in the future contingent upon a predetermined trigger. The interest rate shown is the current rate as of February 29, 2024. | |
| All or a portion of the security is a when-issued security, delayed delivery security, or forward commitment. | |
| Variable or floating rate security, the interest rate of which adjusts periodically based on changes in current interest rates and prepayments on the underlying pool of assets. The interest rate shown is the current rate as of February 29, 2024. | |
| The date shown represents the earliest of the prerefunded date, next put date or final maturity date. | |
SEE NOTES TO FINANCIAL STATEMENTS.
SCHEDULE OF PORTFOLIO INVESTMENTSAS OF February 29, 2024 (continued)
| Investment in an affiliated fund, which is registered under the Investment Company Act of 1940, as amended, and is advised by J.P. Morgan Investment Management Inc. | |
| The rate shown is the current yield as of February 29, 2024. | |
| | |
FNMA / FHLMC UMBS, Single Family, 30 Year TBA, 4.00%, 3/25/2054(a) | | |
GNMA II, Single Family, 30 Year | | |
| | |
| | |
(Proceeds received of $63,342,176) | | |
| |
| Federal Home Loan Mortgage Corp. |
| Federal National Mortgage Association |
| Government National Mortgage Association |
| To Be Announced; Security is subject to delayed delivery. |
| Uniform Mortgage-Backed Securities |
| All or a portion of the security is a when-issued security, delayed delivery security, or forward commitment. |
Futures contracts outstanding as of February 29, 2024:
| | | | | VALUE AND
UNREALIZED
APPRECIATION
(DEPRECIATION) ($) |
| | | | | |
U.S. Treasury 10 Year Ultra Note | | | | | |
| | | | | |
U.S. Treasury 2 Year Note | | | | | |
U.S. Treasury 5 Year Note | | | | | |
| | | | | |
| | | | | |
U.S. Treasury 10 Year Note | | | | | |
U.S. Treasury 10 Year Ultra Note | | | | | |
| | | | | |
| | | | | |
| | | | | |
| | | | | |
SEE NOTES TO FINANCIAL STATEMENTS.
Forward foreign currency exchange contracts outstanding as of February 29, 2024:
| | | | UNREALIZED
APPRECIATION
(DEPRECIATION) ($) |
| | | | | | |
Total unrealized appreciation | |
| | | | | | |
Total unrealized depreciation | |
Net unrealized depreciation | |
Over-the-Counter ("OTC") Credit default swap contracts outstanding — buy protection (*) as of February 29, 2024:
REFERENCE
OBLIGATION/INDEX | FINANCING
RATE PAID
BY THE FUND
(%) | | | | | | UPFRONT
PAYMENTS
(RECEIPTS)
| UNREALIZED
APPRECIATION
(DEPRECIATION)
($) | |
Bank of America Corp., 3.50%, 4/19/2026 | | | | | | | | | |
Bank of America Corp., 3.50%, 4/19/2026 | | | | | | | | | |
| | | | | | | | | |
| The Fund, as a buyer of credit protection, is generally obligated to make periodic payments and may also pay or receive an upfront premium to or from the protection seller, in exchange for the right to receive a contingent payment, upon occurrence of a credit event with respect to an underlying reference obligation, as defined under the terms of individual swap contracts. | |
| Implied credit spreads are an indication of the seller's performance risk, related to the likelihood of a credit event occurring that would require a seller to make payment to a buyer. Implied credit spreads are used to determine the value of swap contracts and reflect the cost of buying/selling protection, which may include upfront payments made to enter into the contract. Therefore, higher spreads would indicate a greater likelihood that a seller will be obligated to perform (i.e. make payment) under the swap contract. Increasing values, in absolute terms and relative to notional amounts, are also indicative of greater performance risk. Implied credit spreads for credit default swaps on credit indices are linked to the weighted average spread across the underlying reference obligations included in a particular index. |
| The notional amount is the maximum amount that a seller of credit protection would be obligated to pay and a buyer of credit protection would receive, upon occurrence of a credit event. |
| Upfront payments and receipts generally represent premiums paid or received at the initiation of the agreement to compensate the differences between the stated terms of the swap agreement and current market conditions (credit spreads, interest rates and other relevant factors). |
| | | | | | | | | |
| | | | | | | | | |
SEE NOTES TO FINANCIAL STATEMENTS.
SCHEDULE OF PORTFOLIO INVESTMENTSAS OF February 29, 2024 (continued)
Centrally Cleared Credit default swap contracts outstanding - buy protection(*) as of February 29, 2024:
REFERENCE
OBLIGATION/INDEX | FINANCING
RATE PAID
BY THE FUND
(%) | | | | | UPFRONT
PAYMENTS
(RECEIPTS)
| UNREALIZED
APPRECIATION
(DEPRECIATION)
($) | |
| | | | | | | | |
| | | | | | | | |
| | | | | | | | |
| The Fund, as a buyer of credit protection, is generally obligated to make periodic payments and may also pay or receive an upfront premium to or from the protection seller, in exchange for the right to receive a contingent payment, upon occurrence of a credit event with respect to an underlying reference obligation, as defined under the terms of individual swap contracts. |
| Implied credit spreads are an indication of the seller's performance risk, related to the likelihood of a credit event occurring that would require a seller to make payment to a buyer. Implied credit spreads are used to determine the value of swap contracts and reflect the cost of buying/selling protection, which may include upfront payments made to enter into the contract. Therefore, higher spreads would indicate a greater likelihood that a seller will be obligated to perform (i.e. make payment) under the swap contract. Increasing values, in absolute terms and relative to notional amounts, are also indicative of greater performance risk. Implied credit spreads for credit default swaps on credit indices are linked to the weighted average spread across the underlying reference obligations included in a particular index. |
| The notional amount is the maximum amount that a seller of credit protection would be obligated to pay and a buyer of credit protection would receive, upon occurrence of a credit event. |
| Upfront payments and receipts generally represent premiums paid or received at the initiation of the agreement to compensate the differences between the stated terms of the swap agreement and current market conditions (credit spreads, interest rates and other relevant factors). |
| |
| Credit Default Swap Index |
| |
Summary of total OTC swap contracts outstanding as of February 29, 2024:
| NET UPFRONT
PAYMENTS
(RECEIPTS)
($) | |
| | |
OTC Credit default swap contracts outstanding - buy protection | | |
SEE NOTES TO FINANCIAL STATEMENTS.
JPMorgan International Bond Opportunities ETF
SCHEDULE OF PORTFOLIO INVESTMENTSAS OF February 29, 2024
| | |
|
|
APA Infrastructure Ltd. 2.00%, 7/15/2030 (a) | | |
Commonwealth Bank of Australia 2.69%, 3/11/2031 (b) (c) | | |
| | |
| | |
| | |
| | |
| | |
| | |
|
Benteler International AG | | |
| | |
| | |
| | |
|
Azelis Finance NV 5.75%, 3/15/2028 (a) | | |
| | |
(EUR Swap Annual 5 Year + 3.59%), 4.25%, 10/24/2025 (a) (c) (d) (e) (f) | | |
(EURIBOR ICE Swap Rate 5 Year + 4.93%), 8.00%, 9/5/2028 (a) (c) (d) (e) (f) | | |
(US Treasury Yield Curve Rate T Note Constant Maturity 1 Year + 2.10%), 5.80%, 1/19/2029 (b) (f) | | |
(EUR Swap Annual 5 Year + 1.25%), 1.63%, 9/18/2029 (a) (f) | | |
Ontex Group NV 3.50%, 7/15/2026 (a) | | |
Telenet Finance Luxembourg Notes SARL 3.50%, 3/1/2028 (a) | | |
| | |
|
Braskem Netherlands Finance BV 7.25%, 2/13/2033 (a) | | |
Guara Norte SARL 5.20%, 6/15/2034 (b) | | |
Klabin Austria GmbH 7.00%, 4/3/2049 (a) | | |
| | |
|
|
| | |
| | |
| | |
Vale Overseas Ltd. 6.13%, 6/12/2033 | | |
| | |
|
Bank of Nova Scotia (The) | | |
| | |
(US Treasury Yield Curve Rate T Note Constant Maturity 5 Year + 2.05%), 4.59%, 5/4/2037 (c) (f) | | |
Canadian Pacific Railway Co. 3.50%, 5/1/2050 | | |
Emera US Finance LP 2.64%, 6/15/2031 | | |
Emera, Inc. Series 16-A, (3-MONTH SOFR + 5.44%), 6.75%, 6/15/2076 (f) | | |
Enbridge, Inc. Series NC5, (US Treasury Yield Curve Rate T Note Constant Maturity 5 Year + 3.79%), 8.25%, 1/15/2084 (f) | | |
Federation des Caisses Desjardins du Quebec (SOFRINDX + 1.09%), 5.28%, 1/23/2026 (b) (f) | | |
Transcanada Trust Series 16-A, (3-MONTH SOFR + 4.64%), 5.88%, 8/15/2076 (f) | | |
| | |
|
Alfa Desarrollo SpA 4.55%, 9/27/2051 (b) | | |
|
Country Garden Holdings Co. Ltd. 3.13%, 10/22/2025 (a) (g) | | |
Huarong Finance 2017 Co. Ltd. 4.25%, 11/7/2027 (a) | | |
Longfor Group Holdings Ltd. 4.50%, 1/16/2028 (a) | | |
| | |
| | |
| | |
SEE NOTES TO FINANCIAL STATEMENTS.
| J.P. Morgan Exchange-Traded Funds | |
JPMorgan International Bond Opportunities ETF
SCHEDULE OF PORTFOLIO INVESTMENTSAS OF February 29, 2024 (continued)
| | |
Corporate Bonds — continued |
|
| | |
TI Automotive Finance plc 3.75%, 4/15/2029 (a) | | |
| | |
|
AI Candelaria Spain SA 5.75%, 6/15/2033 (b) | | |
|
| | |
(US Treasury Yield Curve Rate T Note Constant Maturity 1 Year + 2.10%), 6.47%, 1/9/2026 (b) (f) | | |
(US Treasury Yield Curve Rate T Note Constant Maturity 1 Year + 1.35%), 1.62%, 9/11/2026 (b) (f) | | |
(EURIBOR ICE Swap Rate 1 Year + 0.88%), 0.75%, 6/9/2029 (a) (f) | | |
(EURIBOR ICE Swap Rate 1 Year + 1.70%), 4.75%, 6/21/2030 (a) (f) | | |
| | |
|
Accor SA 1.75%, 2/4/2026 (a) (h) | | |
| | |
| | |
| | |
Altice France SA 3.38%, 1/15/2028 (a) | | |
Autoroutes du Sud de la France SA | | |
| | |
| | |
AXA SA (EURIBOR 3 Month + 3.75%), 3.38%, 7/6/2047 (a) (f) | | |
Banijay Entertainment SASU | | |
| | |
| | |
| | |
|
|
| | |
(US Treasury Yield Curve Rate T Note Constant Maturity 5 Year + 4.35%), 8.50%, 8/14/2028 (b) (c) (d) (e) (f) | | |
(EURIBOR ICE Swap Rate 5 Year + 4.63%), 7.38%, 6/11/2030 (a) (c) (d) (e) (f) | | |
| | |
| | |
| | |
(SOFR + 2.10%), 5.98%, 1/18/2027 (b) (f) | | |
(EURIBOR 3 Month + 1.00%), 0.50%, 9/15/2027 (a) (f) | | |
| | |
(SOFR + 1.31%), 2.28%, 1/20/2032 (b) (f) | | |
(SOFR + 1.73%), 3.12%, 10/19/2032 (b) (f) | | |
Burger King France SAS (EURIBOR 3 Month + 4.75%), 8.65%, 11/1/2026 (a) (f) | | |
Cerba Healthcare SACA 3.50%, 5/31/2028 (a) | | |
CGG SA 7.75%, 4/1/2027 (a) | | |
Chrome Holdco SAS 5.00%, 5/31/2029 (a) | | |
| | |
(SOFR + 0.89%), 1.25%, 1/26/2027 (b) (f) | | |
(U.K. Government Bonds 1 Year Note Generic Bid Yield + 2.60%), 5.75%, 11/29/2027 (a) (f) | | |
| | |
(SOFR + 1.86%), 6.32%, 10/3/2029 (b) (f) | | |
Credit Mutuel Arkea SA (EURIBOR ICE Swap Rate 5 Year + 1.45%), 1.88%, 10/25/2029 (a) (f) | | |
| | |
(EUR Swap Annual 6 Year + 3.44%), 4.00%, 7/4/2024 (a) (d) (e) (f) | | |
SEE NOTES TO FINANCIAL STATEMENTS.
| J.P. Morgan Exchange-Traded Funds | |
| | |
Corporate Bonds — continued |
|
(EUR Swap Annual 5 Year + 3.97%), 3.38%, 6/15/2030 (a) (d) (e) (f) | | |
| | |
Elis SA 1.63%, 4/3/2028 (a) | | |
| | |
| | |
| | |
| | |
| | |
| | |
| | |
| | |
| | |
| | |
| | |
| | |
Lune Holdings SARL 5.63%, 11/15/2028 (a) | | |
Orange SA (EUR Swap Annual 5 Year + 2.10%), 1.75%, 7/15/2028 (a) (d) (e) (f) | | |
| | |
| | |
| | |
| | |
| | |
| | |
| | |
Rexel SA 2.13%, 6/15/2028 (a) | | |
| | |
(US Treasury Yield Curve Rate T Note Constant Maturity 5 Year + 3.93%), 4.75%, 5/26/2026 (b) (c) (d) (e) (f) | | |
(US Treasury Yield Curve Rate T Note Constant Maturity 5 Year + 4.51%), 5.38%, 11/18/2030 (b) (c) (d) (e) (f) | | |
(US Treasury Yield Curve Rate T Note Constant Maturity 1 Year + 1.30%), 2.89%, 6/9/2032 (b) (f) | | |
| | |
|
|
(US Treasury Yield Curve Rate T Note Constant Maturity 1 Year + 1.60%), 3.34%, 1/21/2033 (b) (f) | | |
(US Treasury Yield Curve Rate T Note Constant Maturity 1 Year + 2.95%), 6.69%, 1/10/2034 (b) (f) | | |
SPIE SA 2.63%, 6/18/2026 (a) | | |
TotalEnergies Capital International SA 3.13%, 5/29/2050 | | |
TotalEnergies SE (EUR Swap Annual 5 Year + 1.77%), 1.75%, 4/4/2024 (a) (d) (e) (f) | | |
Vallourec SA 8.50%, 6/30/2026 (a) | | |
Veolia Environnement SA (EURIBOR ICE Swap Rate 5 Year + 2.15%), 1.63%, 6/1/2026 (a) (d) (e) (f) | | |
Vinci SA 1.75%, 9/26/2030 (a) | | |
| | |
|
Adler Pelzer Holding GmbH | | |
| | |
| | |
Birkenstock Financing SARL 5.25%, 4/30/2029 (a) | | |
Cheplapharm Arzneimittel GmbH | | |
| | |
| | |
Commerzbank AG (EUR Swap Annual 5 Year + 4.35%), 4.00%, 12/5/2030 (a) (f) | | |
CT Investment GmbH 5.50%, 4/15/2026 (a) | | |
Deutsche Bank AG (SOFR + 2.26%), 3.74%, 1/7/2033 (f) | | |
| | |
| | |
| | |
Douglas GmbH 6.00%, 4/8/2026 (a) | | |
SEE NOTES TO FINANCIAL STATEMENTS.
| J.P. Morgan Exchange-Traded Funds | |
JPMorgan International Bond Opportunities ETF
SCHEDULE OF PORTFOLIO INVESTMENTSAS OF February 29, 2024 (continued)
| | |
Corporate Bonds — continued |
|
Evonik Industries AG (EUR Swap Annual 5 Year + 1.84%), 1.38%, 9/2/2081 (a) (f) | | |
Heidelberg Materials Finance Luxembourg SA 4.88%, 11/21/2033 (a) | | |
| | |
3.75% (Cash), 9/15/2026 (a) (i) | | |
3.88% (Cash), 5/15/2027 (a) (i) (j) | | |
8.75% (Cash), 5/15/2028 (b) (i) | | |
8.75% (Cash), 5/15/2028 (a) (i) (j) | | |
Kirk Beauty SUN GmbH 8.25% (Cash), 10/1/2026 (a) (i) | | |
Nidda Healthcare Holding GmbH 7.50%, 8/21/2026 (a) | | |
| | |
| | |
| | |
Techem Verwaltungsgesellschaft 674 mbH 6.00%, 7/30/2026 (a) | | |
Techem Verwaltungsgesellschaft 675 mbH 2.00%, 7/15/2025 (a) | | |
thyssenkrupp AG 2.50%, 2/25/2025 (a) | | |
TK Elevator Midco GmbH 4.38%, 7/15/2027 (a) | | |
TUI Cruises GmbH 6.50%, 5/15/2026 (a) | | |
Volkswagen International Finance NV | | |
(EUR Swap Annual 5 Year + 3.75%), 3.50%, 6/17/2025 (a) (d) (e) (f) | | |
(EUR Swap Annual 10 Year + 3.98%), 4.63%, 6/27/2028 (a) (d) (e) (f) | | |
| | |
| | |
| | |
| | |
| | |
|
|
| | |
| | |
| | |
| | |
|
Greenko Dutch BV 3.85%, 3/29/2026 (b) | | |
Greenko Power II Ltd. 4.30%, 12/13/2028 (b) | | |
NTPC Ltd. 3.75%, 4/3/2024 (a) | | |
| | |
|
Indonesia Asahan Aluminium PT 5.45%, 5/15/2030 (b) | | |
Pertamina Persero PT 3.65%, 7/30/2029 (b) | | |
Perusahaan Perseroan Persero PT Perusahaan Listrik Negara 4.13%, 5/15/2027 (a) | | |
| | |
|
AerCap Ireland Capital DAC | | |
| | |
| | |
| | |
| | |
| | |
(EUR Swap Annual 5 Year + 6.63%), 6.25%, 6/23/2025 (a) (c) (d) (e) (f) | | |
(EUR Swap Annual 1 Year + 1.95%), 4.63%, 7/23/2029 (a) (f) | | |
(EUR Swap Annual 5 Year + 2.15%), 1.88%, 11/19/2029 (a) (f) | | |
Avolon Holdings Funding Ltd. | | |
| | |
| | |
| | |
| | |
| | |
| | |
| | |
SEE NOTES TO FINANCIAL STATEMENTS.
| J.P. Morgan Exchange-Traded Funds | |
| | |
Corporate Bonds — continued |
|
| | |
| | |
Bank of Ireland Group plc | | |
(EUR Swap Annual 5 Year + 7.92%), 7.50%, 5/19/2025 (a) (c) (d) (e) (f) | | |
(EUR Swap Annual 5 Year + 6.43%), 6.00%, 9/1/2025 (a) (c) (d) (e) (f) | | |
eircom Finance DAC 3.50%, 5/15/2026 (a) | | |
| | |
|
Energian Israel Finance Ltd. | | |
| | |
| | |
| | |
| | |
| | |
| | |
|
Assicurazioni Generali SpA | | |
| | |
(EURIBOR 3 Month + 5.35%), 5.50%, 10/27/2047 (a) (f) | | |
Autostrade per l'Italia SpA | | |
| | |
| | |
Enel Finance International NV | | |
| | |
| | |
| | |
| | |
| | |
| | |
| | |
| | |
Series 63.5, (EUR Swap Annual 5 Year + 2.58%), 3.38%, 8/24/2026 (a) (d) (e) (f) | | |
Series 9.5Y, (EUR Swap Annual 5 Year + 2.01%), 1.88%, 6/8/2030 (a) (d) (e) (f) | | |
| | |
|
|
Eni SpA 4.25%, 5/9/2029 (b) | | |
Guala Closures SpA 3.25%, 6/15/2028 (a) | | |
Infrastrutture Wireless Italiane SpA | | |
| | |
| | |
| | |
(EUR Swap Annual 5 Year + 7.19%), 7.75%, 1/11/2027 (a) (c) (d) (e) (f) | | |
| | |
| | |
(US Treasury Yield Curve Rate T Note Constant Maturity 1 Year + 2.75%), 4.95%, 6/1/2042 (b) (f) | | |
| | |
| | |
| | |
| | |
| | |
| | |
| | |
Pro-Gest SpA 3.25%, 12/15/2024 (a) | | |
Rossini SARL 6.75%, 10/30/2025 (a) | | |
Saipem Finance International BV 2.63%, 1/7/2025 (a) | | |
Shiba Bidco SpA 4.50%, 10/31/2028 (a) | | |
TeamSystem SpA 3.50%, 2/15/2028 (a) | | |
Telecom Italia Finance SA 7.75%, 1/24/2033 | | |
| | |
| | |
| | |
| | |
| | |
| | |
| | |
(EUR Swap Annual 5 Year + 4.93%), 5.38%, 6/3/2025 (a) (c) (d) (e) (f) | | |
SEE NOTES TO FINANCIAL STATEMENTS.
| J.P. Morgan Exchange-Traded Funds | |
JPMorgan International Bond Opportunities ETF
SCHEDULE OF PORTFOLIO INVESTMENTSAS OF February 29, 2024 (continued)
| | |
Corporate Bonds — continued |
|
(EURIBOR ICE Swap Rate 5 Year + 7.33%), 7.50%, 6/3/2026 (a) (c) (d) (e) (f) | | |
(US Treasury Yield Curve Rate T Note Constant Maturity 1 Year + 1.20%), 1.98%, 6/3/2027 (b) (f) | | |
(EURIBOR 3 Month + 0.85%), 0.93%, 1/18/2028 (a) (f) | | |
(EURIBOR 3 Month + 1.90%), 4.80%, 1/17/2029 (a) (f) | | |
(US Treasury Yield Curve Rate T Note Constant Maturity 1 Year + 1.55%), 3.13%, 6/3/2032 (b) (f) | | |
| | |
|
Mitsubishi UFJ Financial Group, Inc. (US Treasury Yield Curve Rate T Note Constant Maturity 1 Year + 0.83%), 2.34%, 1/19/2028 (f) | | |
Takeda Pharmaceutical Co. Ltd. | | |
| | |
| | |
| | |
| | |
| | |
|
KazMunayGas National Co. JSC | | |
| | |
| | |
| | |
|
MEGlobal Canada ULC 5.00%, 5/18/2025 (b) | | |
|
Altice Finco SA 4.75%, 1/15/2028 (a) | | |
| | |
| | |
| | |
| | |
ARD Finance SA 5.00% (Cash), 6/30/2027 (a) (i) (j) | | |
| | |
|
|
Herens Midco SARL 5.25%, 5/15/2029 (a) | | |
| | |
| | |
| | |
| | |
| | |
| | |
| | |
Monitchem HoldCo 3 SA 8.75%, 5/1/2028 (a) | | |
PLT VII Finance SARL 4.63%, 1/5/2026 (a) | | |
SELP Finance SARL, REIT 0.88%, 5/27/2029 (a) | | |
| | |
(EUR Swap Annual 5 Year + 3.19%), 2.88%, 5/27/2026 (a) (d) (e) (f) | | |
| | |
Summer BC Holdco A SARL 9.25%, 10/31/2027 (a) | | |
Summer BC Holdco B SARL 5.75%, 10/31/2026 (a) | | |
| | |
|
Petronas Capital Ltd. 3.40%, 4/28/2061 (b) | | |
|
BBVA Bancomer SA (US Treasury Yield Curve Rate T Note Constant Maturity 5 Year + 2.65%), 5.13%, 1/18/2033 (b) (c) (f) | | |
Cemex SAB de CV (US Treasury Yield Curve Rate T Note Constant Maturity 5 Year + 4.53%), 5.13%, 6/8/2026 (b) (d) (e) (f) | | |
Fomento Economico Mexicano SAB de CV 3.50%, 1/16/2050 | | |
Petroleos Mexicanos 6.88%, 8/4/2026 | | |
Southern Copper Corp. 5.88%, 4/23/2045 | | |
| | |
SEE NOTES TO FINANCIAL STATEMENTS.
| J.P. Morgan Exchange-Traded Funds | |
| | |
Corporate Bonds — continued |
|
OCP SA 6.88%, 4/25/2044 (a) | | |
|
| | |
| | |
(EUR Swap Annual 5 Year + 4.67%), 4.38%, 9/22/2025 (a) (c) (d) (e) (f) | | |
| | |
(EUR Swap Annual 5 Year + 3.90%), 4.75%, 9/22/2027 (a) (c) (d) (e) (f) | | |
| | |
(US Treasury Yield Curve Rate T Note Constant Maturity 1 Year + 0.73%), 1.00%, 9/24/2026 (b) (f) | | |
(EUR Swap Annual 5 Year + 3.70%), 3.25%, 12/29/2026 (a) (c) (d) (e) (f) | | |
(EUR Swap Annual 5 Year + 4.68%), 4.38%, 6/29/2027 (a) (c) (d) (e) (f) | | |
(US Treasury Yield Curve Rate T Note Constant Maturity 1 Year + 1.22%), 3.65%, 4/6/2028 (b) (f) | | |
ING Groep NV (US Treasury Yield Curve Rate T Note Constant Maturity 5 Year + 4.34%), 5.75%, 11/16/2026 (c) (d) (e) (f) | | |
| | |
| | |
| | |
Sigma Holdco BV 5.75%, 5/15/2026 (a) | | |
Sunrise HoldCo IV BV 3.88%, 6/15/2029 (a) | | |
Titan Holdings II BV 5.13%, 7/15/2029 (a) | | |
Trivium Packaging Finance BV 3.75%, 8/15/2026 (a) (h) | | |
VZ Vendor Financing II BV 2.88%, 1/15/2029 (a) | | |
| | |
|
|
Wolters Kluwer NV 3.75%, 4/3/2031 (a) | | |
Ziggo Bond Co. BV 3.38%, 2/28/2030 (a) | | |
| | |
|
ANZ New Zealand Int'l Ltd. 2.55%, 2/13/2030 (b) | | |
|
Aker BP ASA 6.00%, 6/13/2033 (b) | | |
| | |
(U.K. Government Bonds 1 Year Note Generic Bid Yield + 1.35%), 2.63%, 6/10/2026 (a) (f) | | |
(US Treasury Yield Curve Rate T Note Constant Maturity 1 Year + 0.85%), 1.13%, 9/16/2026 (b) (f) | | |
| | |
|
EDP - Energias de Portugal SA | | |
(EUR Swap Annual 5 Year + 1.84%), 1.70%, 7/20/2080 (a) (f) | | |
Series NC5., (EUR Swap Annual 5 Year + 1.89%), 1.50%, 3/14/2082 (a) (f) | | |
(EUR Swap Annual 5 Year + 3.18%), 5.94%, 4/23/2083 (a) (f) | | |
| | |
| | |
| | |
| | |
|
Anglo American Capital plc | | |
| | |
| | |
| | |
|
Abertis Infraestructuras Finance BV | | |
SEE NOTES TO FINANCIAL STATEMENTS.
| J.P. Morgan Exchange-Traded Funds | |
JPMorgan International Bond Opportunities ETF
SCHEDULE OF PORTFOLIO INVESTMENTSAS OF February 29, 2024 (continued)
| | |
Corporate Bonds — continued |
|
(EUR Swap Annual 5 Year + 3.69%), 3.25%, 11/24/2025 (a) (d) (e) (f) | | |
(EUR Swap Annual 5 Year + 3.27%), 2.63%, 1/26/2027 (a) (d) (e) (f) | | |
Banco Bilbao Vizcaya Argentaria SA | | |
Series 9, (US Treasury Yield Curve Rate T Note Constant Maturity 5 Year + 5.19%), 6.50%, 3/5/2025 (c) (d) (e) (f) | | |
(US Treasury Yield Curve Rate T Note Constant Maturity 5 Year + 5.10%), 9.38%, 3/19/2029 (c) (d) (e) (f) | | |
Banco de Sabadell SA (EUR Swap Annual 1 Year + 0.97%), 0.63%, 11/7/2025 (a) (f) | | |
| | |
| | |
(US Treasury Yield Curve Rate T Note Constant Maturity 1 Year + 0.90%), 1.72%, 9/14/2027 (f) | | |
(US Treasury Yield Curve Rate T Note Constant Maturity 5 Year + 5.31%), 9.63%, 11/21/2028 (c) (d) (e) (f) | | |
(US Treasury Yield Curve Rate T Note Constant Maturity 5 Year + 5.30%), 9.63%, 5/21/2033 (c) (d) (e) (f) | | |
| | |
| | |
(EUR Swap Annual 5 Year + 6.35%), 5.88%, 10/9/2027 (a) (c) (d) (e) (f) | | |
(EUR Swap Annual 5 Year + 3.86%), 3.63%, 9/14/2028 (a) (c) (d) (e) (f) | | |
(SOFR + 2.77%), 6.84%, 9/13/2034 (b) (f) | | |
Cellnex Finance Co. SA 2.25%, 4/12/2026 (a) | | |
| | |
| | |
| | |
|
|
| | |
| | |
Cirsa Finance International Sarl | | |
| | |
| | |
| | |
| | |
| | |
| | |
| | |
| | |
| | |
| | |
| | |
| | |
| | |
Iberdrola International BV | | |
(EUR Swap Annual 5 Year + 2.06%), 2.63%, 3/22/2024 (a) (d) (e) (f) | | |
Series NC5, (EUR Swap Annual 5 Year + 2.32%), 1.87%, 1/28/2026 (a) (d) (e) (f) | | |
Kaixo Bondco Telecom SA 5.13%, 9/30/2029 (a) | | |
Lorca Telecom Bondco SA 4.00%, 9/18/2027 (a) | | |
Naturgy Finance BV (EUR Swap Annual 9 Year + 3.08%), 3.38%, 4/24/2024 (a) (d) (e) (f) | | |
Repsol International Finance BV (EUR Swap Annual 10 Year + 4.20%), 4.50%, 3/25/2075 (a) (f) | | |
Telefonica Emisiones SA 5.21%, 3/8/2047 | | |
| | |
(EUR Swap Annual 8 Year + 2.97%), 3.88%, 6/22/2026 (a) (d) (e) (f) | | |
SEE NOTES TO FINANCIAL STATEMENTS.
| J.P. Morgan Exchange-Traded Funds | |
| | |
Corporate Bonds — continued |
|
(EUR Swap Annual 6 Year + 2.87%), 2.88%, 2/24/2028 (a) (d) (e) (f) | | |
(EUR Swap Annual 7 Year + 3.35%), 6.14%, 2/3/2030 (a) (d) (e) (f) | | |
| | |
|
Svenska Handelsbanken AB (US Treasury Yield Curve Rate T Note Constant Maturity 5 Year + 4.05%), 4.75%, 3/1/2031 (a) (c) (d) (e) (f) | | |
| | |
| | |
| | |
Verisure Midholding AB 5.25%, 2/15/2029 (a) | | |
| | |
| | |
| | |
| | |
|
| | |
| | |
| | |
Holcim Finance Luxembourg SA 0.50%, 4/23/2031 (a) | | |
Holcim Sterling Finance Netherlands BV 2.25%, 4/4/2034 (a) | | |
Swiss Re Finance Luxembourg SA (US Treasury Yield Curve Rate T Note Constant Maturity 5 Year + 3.58%), 5.00%, 4/2/2049 (b) (f) | | |
| | |
(SOFR + 3.34%), 6.37%, 7/15/2026 (b) (f) | | |
(US Treasury Yield Curve Rate T Note Constant Maturity 1 Year + 2.05%), 4.70%, 8/5/2027 (b) (f) | | |
| | |
| | |
|
|
(US Treasury Yield Curve Rate T Note Constant Maturity 5 Year + 4.75%), 9.25%, 11/13/2028 (b) (c) (d) (e) (f) | | |
(SOFR + 3.73%), 4.19%, 4/1/2031 (b) (f) | | |
(US Treasury Yield Curve Rate T Note Constant Maturity 1 Year + 1.00%), 2.10%, 2/11/2032 (b) (f) | | |
(SOFR + 1.73%), 3.09%, 5/14/2032 (b) (f) | | |
(US Treasury Yield Curve Rate T Note Constant Maturity 1 Year + 1.10%), 2.75%, 2/11/2033 (b) (f) | | |
(US Treasury Yield Curve Rate T Note Constant Maturity 1 Year + 2.40%), 4.99%, 8/5/2033 (b) (f) | | |
(US Treasury Yield Curve Rate T Note Constant Maturity 5 Year + 4.76%), 9.25%, 11/13/2033 (b) (c) (d) (e) (f) | | |
Zurich Insurance Co. Ltd. (EURIBOR 3 Month + 3.95%), 3.50%, 10/1/2046 (a) (f) | | |
| | |
|
TSMC Arizona Corp. 4.25%, 4/22/2032 | | |
| | |
| | |
| | |
| | |
|
| | |
| | |
| | |
| | |
| | |
| | |
Barclays plc (SOFR + 2.22%), 6.49%, 9/13/2029 (f) | | |
SEE NOTES TO FINANCIAL STATEMENTS.
| J.P. Morgan Exchange-Traded Funds | |
JPMorgan International Bond Opportunities ETF
SCHEDULE OF PORTFOLIO INVESTMENTSAS OF February 29, 2024 (continued)
| | |
Corporate Bonds — continued |
United Kingdom — continued |
| | |
| | |
| | |
Bellis Acquisition Co. plc | | |
| | |
| | |
| | |
(US Treasury Yield Curve Rate T Note Constant Maturity 5 Year + 4.04%), 4.38%, 6/22/2025 (d) (e) (f) | | |
(EUR Swap Annual 5 Year + 3.52%), 3.25%, 3/22/2026 (a) (d) (e) (f) | | |
(EUR Swap Annual 5 Year + 3.78%), 3.63%, 3/22/2029 (a) (d) (e) (f) | | |
(US Treasury Yield Curve Rate T Note Constant Maturity 5 Year + 4.40%), 4.88%, 3/22/2030 (d) (e) (f) | | |
(US Treasury Yield Curve Rate T Note Constant Maturity 5 Year + 2.15%), 6.45%, 12/1/2033 (d) (e) (f) | | |
Cadent Finance plc 0.63%, 3/19/2030 (a) | | |
Centrica plc 4.38%, 3/13/2029 (a) | | |
CPUK Finance Ltd. 4.50%, 8/28/2027 (a) | | |
EC Finance plc 3.00%, 10/15/2026 (a) | | |
Eversholt Funding plc 2.74%, 6/30/2040 (a) | | |
Gatwick Funding Ltd. 2.50%, 4/15/2030 (a) | | |
| | |
| | |
| | |
| | |
| | |
| | |
| | |
| | |
(SOFR + 1.54%), 1.65%, 4/18/2026 (f) | | |
| | |
|
United Kingdom — continued |
(SOFR + 3.03%), 7.34%, 11/3/2026 (f) | | |
| | |
(SOFR + 2.61%), 5.21%, 8/11/2028 (f) | | |
(SOFR + 1.73%), 2.01%, 9/22/2028 (f) | | |
(SOFR + 1.29%), 2.21%, 8/17/2029 (f) | | |
(3-MONTH CME TERM SOFR + 1.87%), 3.97%, 5/22/2030 (f) | | |
(US Treasury Yield Curve Rate T Note Constant Maturity 5 Year + 3.65%), 4.60%, 12/17/2030 (c) (d) (e) (f) | | |
(SOFR + 1.41%), 2.87%, 11/22/2032 (f) | | |
Iceland Bondco plc 10.88%, 12/15/2027 (b) | | |
INEOS Quattro Finance 1 plc 3.75%, 7/15/2026 (a) | | |
INEOS Quattro Finance 2 plc 8.50%, 3/15/2029 (b) | | |
INEOS Styrolution Ludwigshafen GmbH 2.25%, 1/16/2027 (a) | | |
International Consolidated Airlines Group SA | | |
| | |
| | |
Jaguar Land Rover Automotive plc | | |
| | |
| | |
| | |
| | |
(US Treasury Yield Curve Rate T Note Constant Maturity 1 Year + 1.48%), 5.99%, 8/7/2027 (f) | | |
| | |
| | |
| | |
| | |
(3-MONTH SOFR + 1.76%), 4.27%, 3/22/2025 (f) | | |
SEE NOTES TO FINANCIAL STATEMENTS.
| J.P. Morgan Exchange-Traded Funds | |
| | |
Corporate Bonds — continued |
United Kingdom — continued |
(US Treasury Yield Curve Rate T Note Constant Maturity 5 Year + 5.63%), 6.00%, 12/29/2025 (c) (d) (e) (f) | | |
(US Treasury Yield Curve Rate T Note Constant Maturity 1 Year + 2.27%), 5.52%, 9/30/2028 (f) | | |
(EURIBOR 3 Month + 0.89%), 0.67%, 9/14/2029 (a) (f) | | |
(US Treasury Yield Curve Rate T Note Constant Maturity 1 Year + 1.50%), 5.78%, 3/1/2035 (f) | | |
NGG Finance plc (EUR Swap Annual 5 Year + 2.53%), 2.13%, 9/5/2082 (a) (f) | | |
Nomad Foods Bondco plc 2.50%, 6/24/2028 (a) | | |
Pinnacle Bidco plc 8.25%, 10/11/2028 (b) | | |
Punch Finance plc 6.13%, 6/30/2026 (a) | | |
RAC Bond Co. plc 5.25%, 11/4/2027 (a) | | |
RELX Finance BV 0.88%, 3/10/2032 (a) | | |
| | |
| | |
| | |
| | |
Santander UK Group Holdings plc | | |
(SOFR + 2.75%), 6.83%, 11/21/2026 (f) | | |
(SOFR + 0.99%), 1.67%, 6/14/2027 (f) | | |
(SOFR + 2.60%), 6.53%, 1/10/2029 (f) | | |
South Eastern Power Networks plc 5.63%, 9/30/2030 (a) | | |
| | |
(US Treasury Yield Curve Rate T Note Constant Maturity 1 Year + 1.65%), 3.97%, 3/30/2026 (b) (f) | | |
(US Treasury Yield Curve Rate T Note Constant Maturity 1 Year + 3.45%), 7.77%, 11/16/2028 (b) (f) | | |
| | |
|
United Kingdom — continued |
(US Treasury Yield Curve Rate T Note Constant Maturity 1 Year + 3.85%), 4.64%, 4/1/2031 (b) (f) | | |
Synthomer plc 3.88%, 7/1/2025 (a) | | |
Thames Water Utilities Finance plc 4.38%, 1/18/2031 (a) | | |
Virgin Media Finance plc 3.75%, 7/15/2030 (a) | | |
Vmed O2 UK Financing I plc 3.25%, 1/31/2031 (a) | | |
| | |
(EUR Swap Annual 5 Year + 3.43%), 4.20%, 10/3/2078 (a) (f) | | |
(USD Swap Semi 5 Year + 4.87%), 7.00%, 4/4/2079 (f) | | |
(EUR Swap Annual 5 Year + 3.48%), 3.00%, 8/27/2080 (a) (f) | | |
| | |
|
| | |
| | |
| | |
| | |
| | |
| | |
| | |
American Express Co. (US Treasury Yield Curve Rate T Note Constant Maturity 5 Year + 2.85%), 3.55%, 9/15/2026 (d) (e) (f) | | |
American Medical Systems Europe BV 1.63%, 3/8/2031 | | |
| | |
| | |
| | |
Ardagh Packaging Finance plc 2.13%, 8/15/2026 (a) | | |
| | |
| | |
| | |
SEE NOTES TO FINANCIAL STATEMENTS.
| J.P. Morgan Exchange-Traded Funds | |
JPMorgan International Bond Opportunities ETF
SCHEDULE OF PORTFOLIO INVESTMENTSAS OF February 29, 2024 (continued)
| | |
Corporate Bonds — continued |
United States — continued |
| | |
(SOFR + 1.29%), 5.08%, 1/20/2027 (f) | | |
(SOFR + 1.05%), 2.55%, 2/4/2028 (f) | | |
(SOFR + 1.63%), 5.20%, 4/25/2029 (f) | | |
(SOFR + 1.57%), 5.82%, 9/15/2029 (f) | | |
Series N, (SOFR + 1.22%), 2.65%, 3/11/2032 (f) | | |
(SOFR + 1.32%), 2.69%, 4/22/2032 (f) | | |
(SOFR + 1.22%), 2.30%, 7/21/2032 (f) | | |
(SOFR + 1.84%), 5.87%, 9/15/2034 (f) | | |
(SOFR + 1.65%), 5.47%, 1/23/2035 (f) | | |
Baxter International, Inc. 2.54%, 2/1/2032 | | |
Berkshire Hathaway Energy Co. 4.60%, 5/1/2053 | | |
Boeing Co. (The) 5.81%, 5/1/2050 | | |
BP Capital Markets America, Inc. | | |
| | |
| | |
| | |
| | |
| | |
| | |
Broadcom, Inc. 3.47%, 4/15/2034 (b) | | |
Capital One Financial Corp. Series M, (US Treasury Yield Curve Rate T Note Constant Maturity 5 Year + 3.16%), 3.95%, 9/1/2026 (d) (e) (f) | | |
CCO Holdings LLC 5.13%, 5/1/2027 (b) | | |
Cencora, Inc. 2.70%, 3/15/2031 | | |
CenterPoint Energy, Inc. 2.95%, 3/1/2030 | | |
CF Industries, Inc. 4.95%, 6/1/2043 | | |
| | |
|
United States — continued |
Charter Communications Operating LLC | | |
| | |
| | |
Cheniere Energy Partners LP 5.95%, 6/30/2033 | | |
| | |
Series W, (US Treasury Yield Curve Rate T Note Constant Maturity 5 Year + 3.60%), 4.00%, 12/10/2025 (d) (e) (f) | | |
Series X, (US Treasury Yield Curve Rate T Note Constant Maturity 5 Year + 3.42%), 3.88%, 2/18/2026 (d) (e) (f) | | |
(SOFR + 1.17%), 2.56%, 5/1/2032 (f) | | |
(SOFR + 1.18%), 2.52%, 11/3/2032 (f) | | |
Columbia Pipelines Operating Co. LLC | | |
| | |
| | |
| | |
| | |
| | |
| | |
Constellation Energy Generation LLC | | |
| | |
| | |
| | |
Crown Castle, Inc., REIT 4.80%, 9/1/2028 | | |
CVS Health Corp. 5.25%, 2/21/2033 | | |
Danaher Corp. 2.80%, 12/10/2051 | | |
Diamondback Energy, Inc. 3.13%, 3/24/2031 | | |
Discovery Communications LLC 3.63%, 5/15/2030 | | |
Duke Energy Indiana LLC 5.40%, 4/1/2053 | | |
| | |
| | |
SEE NOTES TO FINANCIAL STATEMENTS.
| J.P. Morgan Exchange-Traded Funds | |
| | |
Corporate Bonds — continued |
United States — continued |
| | |
Duquesne Light Holdings, Inc. 2.78%, 1/7/2032 (b) | | |
EMRLD Borrower LP 6.38%, 12/15/2030 (b) | | |
Energy Transfer LP (US Treasury Yield Curve Rate T Note Constant Maturity 5 Year + 4.02%), 8.00%, 5/15/2054 (f) | | |
Entergy Texas, Inc. 1.75%, 3/15/2031 | | |
Fells Point Funding Trust 3.05%, 1/31/2027 (b) | | |
FirstEnergy Transmission LLC 2.87%, 9/15/2028 (b) | | |
Ford Motor Credit Co. LLC | | |
| | |
| | |
| | |
| | |
| | |
| | |
| | |
General Electric Co. 4.13%, 9/19/2035 (a) | | |
Gilead Sciences, Inc. 5.55%, 10/15/2053 | | |
Global Payments, Inc. 2.90%, 11/15/2031 | | |
Goldman Sachs Group, Inc. (The) | | |
Series T, (US Treasury Yield Curve Rate T Note Constant Maturity 5 Year + 2.97%), 3.80%, 5/10/2026 (d) (e) (f) | | |
(SOFR + 0.91%), 1.95%, 10/21/2027 (f) | | |
Series W, (US Treasury Yield Curve Rate T Note Constant Maturity 5 Year + 3.16%), 7.50%, 2/10/2029 (d) (e) (f) | | |
(SOFR + 1.28%), 2.62%, 4/22/2032 (f) | | |
(SOFR + 1.25%), 2.38%, 7/21/2032 (f) | | |
| | |
|
United States — continued |
(SOFR + 1.26%), 2.65%, 10/21/2032 (f) | | |
Gray Oak Pipeline LLC 2.60%, 10/15/2025 (b) | | |
| | |
| | |
| | |
| | |
| | |
| | |
| | |
| | |
Healthpeak OP LLC, REIT 5.25%, 12/15/2032 | | |
| | |
| | |
| | |
| | |
International Game Technology plc 2.38%, 4/15/2028 (a) | | |
| | |
| | |
| | |
| | |
KeyCorp (SOFR + 2.42%), 6.40%, 3/6/2035 (f) | | |
Kinder Morgan, Inc. 5.20%, 6/1/2033 | | |
Kraft Heinz Foods Co. 4.88%, 10/1/2049 | | |
Lowe's Cos., Inc. 4.80%, 4/1/2026 | | |
Meta Platforms, Inc. 4.45%, 8/15/2052 | | |
Metropolitan Life Global Funding I 3.30%, 3/21/2029 (b) | | |
| | |
(SOFR + 0.88%), 1.59%, 5/4/2027 (f) | | |
(SOFR + 1.61%), 4.21%, 4/20/2028 (f) | | |
(SOFR + 1.73%), 5.12%, 2/1/2029 (f) | | |
(SOFR + 1.59%), 5.16%, 4/20/2029 (f) | | |
(SOFR + 1.63%), 5.45%, 7/20/2029 (f) | | |
SEE NOTES TO FINANCIAL STATEMENTS.
| J.P. Morgan Exchange-Traded Funds | |
JPMorgan International Bond Opportunities ETF
SCHEDULE OF PORTFOLIO INVESTMENTSAS OF February 29, 2024 (continued)
| | |
Corporate Bonds — continued |
United States — continued |
(SOFR + 1.18%), 2.24%, 7/21/2032 (f) | | |
(SOFR + 1.20%), 2.51%, 10/20/2032 (f) | | |
(SOFR + 1.88%), 5.42%, 7/21/2034 (f) | | |
(SOFR + 1.73%), 5.47%, 1/18/2035 (f) | | |
(US Treasury Yield Curve Rate T Note Constant Maturity 5 Year + 2.43%), 5.95%, 1/19/2038 (f) | | |
Netflix, Inc. 5.38%, 11/15/2029 (b) | | |
OI European Group BV 6.25%, 5/15/2028 (b) | | |
| | |
| | |
| | |
Pacific Gas and Electric Co. | | |
| | |
| | |
| | |
| | |
Par Pharmaceutical, Inc. 7.50%, 4/1/2027 (b) (g) (h) | | |
Pfizer Investment Enterprises Pte. Ltd. 5.34%, 5/19/2063 | | |
PNC Financial Services Group, Inc. (The) | | |
Series T, (US Treasury Yield Curve Rate T Note Constant Maturity 5 Year + 2.60%), 3.40%, 9/15/2026 (d) (e) (f) | | |
(SOFR + 1.90%), 5.68%, 1/22/2035 (f) | | |
Regency Centers LP, REIT 2.95%, 9/15/2029 | | |
Roper Technologies, Inc. 2.95%, 9/15/2029 | | |
State Street Corp. Series I, (US Treasury Yield Curve Rate T Note Constant Maturity 5 Year + 2.61%), 6.70%, 3/15/2029 (d) (e) (f) | | |
| | |
|
United States — continued |
Take-Two Interactive Software, Inc. | | |
| | |
| | |
| | |
Texas Instruments, Inc. 5.00%, 3/14/2053 | | |
Thermo Fisher Scientific, Inc. 0.88%, 10/1/2031 | | |
| | |
| | |
| | |
| | |
(SOFR + 2.30%), 6.12%, 10/28/2033 (f) | | |
(SOFR + 1.85%), 5.12%, 1/26/2034 (f) | | |
(SOFR + 2.36%), 5.87%, 6/8/2034 (f) | | |
(SOFR + 1.92%), 5.71%, 1/24/2035 (f) | | |
UGI International LLC 2.50%, 12/1/2029 (a) | | |
Union Electric Co. 3.90%, 4/1/2052 | | |
US Bancorp (SOFR + 1.86%), 5.68%, 1/23/2035 (f) | | |
Warnermedia Holdings, Inc. | | |
| | |
| | |
| | |
| | |
Series BB, (US Treasury Yield Curve Rate T Note Constant Maturity 5 Year + 3.45%), 3.90%, 3/15/2026 (d) (e) (f) | | |
(SOFR + 1.74%), 5.57%, 7/25/2029 (f) | | |
(SOFR + 1.99%), 5.56%, 7/25/2034 (f) | | |
SEE NOTES TO FINANCIAL STATEMENTS.
| J.P. Morgan Exchange-Traded Funds | |
| | |
Corporate Bonds — continued |
United States — continued |
(SOFR + 1.78%), 5.50%, 1/23/2035 (f) | | |
Welltower OP LLC, REIT 2.80%, 6/1/2031 | | |
| | |
Total Corporate Bonds
(Cost $260,519,700) | | |
Foreign Government Securities — 31.5% |
|
| | |
| | |
| | |
| | |
|
Commonwealth of Australia | | |
| | |
| | |
| | |
|
Kingdom of Bahrain 6.00%, 9/19/2044 (a) | | |
|
Notas do Tesouro Nacional | | |
| | |
| | |
| | |
|
| | |
| | |
| | |
| | |
| | |
| | |
|
| | |
| | |
| | |
| | |
| | |
| | |
| | |
|
|
| | |
| | |
| | |
| | |
|
| | |
| | |
| | |
| | |
| | |
Dominican Republic — 0.3% |
Dominican Republic Government Bond | | |
| | |
| | |
| | |
| | |
|
Bundesrepublik Deutschland 2.30%, 2/15/2033 (a) | | |
|
| | |
| | |
| | |
| | |
|
State of Israel Government Bond 3.38%, 1/15/2050 | | |
|
Italian Republic Government Bond 2.88%, 10/17/2029 | | |
|
Republic of Cote d'Ivoire | | |
| | |
| | |
| | |
| | |
SEE NOTES TO FINANCIAL STATEMENTS.
| J.P. Morgan Exchange-Traded Funds | |
JPMorgan International Bond Opportunities ETF
SCHEDULE OF PORTFOLIO INVESTMENTSAS OF February 29, 2024 (continued)
| | |
Foreign Government Securities — continued |
|
| | |
| | |
| | |
| | |
|
| | |
| | |
| | |
| | |
| | |
| | |
| | |
| | |
| | |
| | |
|
New Zealand Government Bond | | |
| | |
| | |
| | |
|
Federal Republic of Nigeria | | |
| | |
| | |
| | |
|
Sultanate of Oman Government Bond | | |
| | |
| | |
| | |
| | |
|
Republic of Paraguay 4.95%, 4/28/2031 (b) | | |
|
| | |
| | |
| | |
| | |
| | |
|
|
Republic of Poland 6.00%, 10/25/2033 | | |
|
| | |
| | |
| | |
| | |
| | |
| | |
|
Kingdom of Saudi Arabia 5.00%, 1/18/2053 (b) | | |
|
Republic of Senegal 6.25%, 5/23/2033 (a) | | |
|
| | |
| | |
| | |
| | |
| | |
| | |
|
Bonos and Obligaciones del Estado | | |
| | |
| | |
| | |
| | |
|
| | |
| | |
| | |
| | |
United Arab Emirates — 0.1% |
United Arab Emirates Government Bond 4.00%, 7/28/2050 (b) | | |
|
United Kingdom of Great Britain and Northern Ireland 3.75%, 10/22/2053 (a) | | |
SEE NOTES TO FINANCIAL STATEMENTS.
| J.P. Morgan Exchange-Traded Funds | |
| | |
Foreign Government Securities — continued |
|
Oriental Republic of Uruguay 5.10%, 6/18/2050 | | |
Total Foreign Government Securities
(Cost $135,178,623) | | |
U.S. Treasury Obligations — 1.1% |
|
U.S. Treasury Inflation Linked Notes , 1.38%, 7/15/2033
(Cost $4,342,087) | | |
Asset-Backed Securities — 1.0% |
|
Bain Capital Credit CLO Ltd. Series 2021-7A, Class A1, 6.72%, 1/22/2035 (b) (j) | | |
Dryden CLO Ltd. Series 2019-68A, Class AR, 6.75%, 7/15/2035 (b) (j) | | |
Galaxy CLO Ltd. Series 2013-15A, Class ARR, 6.55%, 10/15/2030 (b) (j) | | |
Neuberger Berman CLO Series 2013-15A, Class A1R2, 6.50%, 10/15/2029 (b) (j) | | |
| | |
|
Accelerated Assets LLC Series 2018-1, Class C, 6.65%, 12/2/2033 (b) | | |
American Credit Acceptance Receivables Trust | | |
Series 2023-1, Class A, 5.45%, 9/14/2026 (b) | | |
Series 2023-1, Class C, 5.59%, 4/12/2029 (b) | | |
BMW Vehicle Lease Trust Series 2023-1, Class A3, 5.16%, 11/25/2025 | | |
Chase Funding Trust Series 2003-6, Class 1A7, 5.28%, 11/25/2034 (h) | | |
Credit-Based Asset Servicing and Securitization LLC Series 2004-CB5, Class M1, 6.35%, 1/25/2034 (j) | | |
| | |
|
United States — continued |
Flagship Credit Auto Trust | | |
Series 2023-1, Class A3, 5.01%, 8/16/2027 (b) | | |
Series 2023-1, Class B, 5.05%, 1/18/2028 (b) | | |
FREED ABS Trust Series 2022-3FP, Class B, 5.79%, 8/20/2029 (b) | | |
GM Financial Automobile Leasing Trust | | |
Series 2023-1, Class A2B, 5.87%, 6/20/2025 (j) | | |
Series 2023-1, Class A3, 5.16%, 4/20/2026 | | |
GoldenTree Loan Opportunities Ltd. Series 2015-10A, Class AR, 6.70%, 7/20/2031 (b) (j) | | |
JetBlue Pass-Through Trust | | |
Series 2019-1, Class B, 8.00%, 11/15/2027 | | |
Series 2019-1, Class A, 2.95%, 5/15/2028 | | |
Series 2020-1, Class B, 7.75%, 11/15/2028 | | |
Progress Residential Series 2021-SFR1, Class E, 2.11%, 4/17/2038 (b) | | |
Santander Revolving Auto Loan Trust Series 2019-A, Class D, 3.45%, 1/26/2032 (b) | | |
Structured Asset Investment Loan Trust Series 2005-HE3, Class M1, 6.16%, 9/25/2035 (j) | | |
US Auto Funding Series 2021-1A, Class C, 2.20%, 5/15/2026 (b) | | |
| | |
Total Asset-Backed Securities
(Cost $4,315,886) | | |
Commercial Mortgage-Backed Securities — 0.8% |
|
BANK Series 2018-BN13, Class C, 4.54%, 8/15/2061 (j) | | |
SEE NOTES TO FINANCIAL STATEMENTS.
| J.P. Morgan Exchange-Traded Funds | |
JPMorgan International Bond Opportunities ETF
SCHEDULE OF PORTFOLIO INVESTMENTSAS OF February 29, 2024 (continued)
| | |
Commercial Mortgage-Backed Securities — continued |
United States — continued |
Benchmark Mortgage Trust Series 2019-B11, Class C, 3.75%, 5/15/2052 (j) | | |
BHMS Series 2018-ATLS, Class A, 6.86%, 7/15/2035 (b) (j) | | |
BX Trust Series 2024-MF, Class B, 6.99%, 2/15/2039 (b) (j) | | |
Cascade Funding Mortgage Trust Series 2021-FRR1, Class BK45, 2.05%, 2/28/2025 (b) (j) | | |
CCUBS Commercial Mortgage Trust Series 2017-C1, Class C, 4.43%, 11/15/2050 (j) | | |
CD Mortgage Trust Series 2016-CD2, Class C, 3.98%, 11/10/2049 (j) | | |
FHLMC, Multi-Family Structured Pass-Through Certificates | | |
Series K739, Class X1, IO, 1.20%, 9/25/2027 (j) | | |
Series K072, Class X3, IO, 2.14%, 12/25/2045 (j) | | |
Series K089, Class X3, IO, 2.30%, 1/25/2046 (j) | | |
Series K078, Class X3, IO, 2.21%, 6/25/2046 (j) | | |
Series K088, Class X3, IO, 2.35%, 2/25/2047 (j) | | |
FREMF Series 2018-KF46, Class B, 7.40%, 3/25/2028 (b) (j) | | |
| | |
Series 2017-KF31, Class B, 8.35%, 4/25/2024 (b) (j) | | |
Series 2017-KF38, Class B, 7.95%, 9/25/2024 (b) (j) | | |
Series 2018-KF47, Class B, 7.45%, 5/25/2025 (b) (j) | | |
Series 2018-KF49, Class B, 7.35%, 6/25/2025 (b) (j) | | |
Series 2017-K728, Class C, 3.72%, 11/25/2050 (b) (j) | | |
GS Mortgage Securities Trust | | |
Series 2012-GCJ9, Class D, 4.75%, 11/10/2045 (b) (j) | | |
| | |
|
United States — continued |
Series 2015-GC30, Class C, 4.07%, 5/10/2050 (j) | | |
JPMBB Commercial Mortgage Securities Trust | | |
Series 2015-C30, Class C, 4.23%, 7/15/2048 (j) | | |
Series 2015-C31, Class C, 4.62%, 8/15/2048 (j) | | |
JPMorgan Chase Commercial Mortgage Securities Trust Series 2016-JP4, Class C, 3.38%, 12/15/2049 (j) | | |
LB-UBS Commercial Mortgage Trust Series 2006-C6, Class AJ, 5.45%, 9/15/2039 (j) | | |
Morgan Stanley Bank of America Merrill Lynch Trust Series 2015-C24, Class C, 4.32%, 5/15/2048 (j) | | |
Morgan Stanley Capital I Trust Series 2015-MS1, Class B, 4.02%, 5/15/2048 (j) | | |
UBS Commercial Mortgage Trust Series 2017-C7, Class B, 4.29%, 12/15/2050 (j) | | |
Velocity Commercial Capital Loan Trust | | |
Series 2018-2, Class A, 4.05%, 10/26/2048 (b) (j) | | |
Series 2019-1, Class M1, 3.94%, 3/25/2049 (b) (j) | | |
Total Commercial Mortgage-Backed Securities
(Cost $3,772,280) | | |
Collateralized Mortgage Obligations — 0.6% |
|
| | |
Series 2004-25CB, Class A1, 6.00%, 12/25/2034 | | |
Series 2005-6CB, Class 1A6, 5.50%, 4/25/2035 | | |
Series 2005-80CB, Class 5A1, 6.00%, 2/25/2036 | | |
Series 2007-2CB, Class 1A6, 5.75%, 3/25/2037 | | |
SEE NOTES TO FINANCIAL STATEMENTS.
| J.P. Morgan Exchange-Traded Funds | |
| | |
Collateralized Mortgage Obligations — continued |
United States — continued |
Chase Mortgage Finance Trust Series 2007-A1, Class 1A5, 5.59%, 2/25/2037 (j) | | |
CHL Mortgage Pass-Through Trust Series 2007-16, Class A1, 6.50%, 10/25/2037 | | |
Connecticut Avenue Securities Trust Series 2023-R02, Class 1M1, 7.62%, 1/25/2043 (b) (j) | | |
| | |
Series 4305, Class SK, IF, IO, 1.16%, 2/15/2044 (j) | | |
Series 4689, Class SD, IF, IO, 0.71%, 6/15/2047 (j) | | |
Series 5022, IO, 3.00%, 9/25/2050 | | |
Series 5023, Class MI, IO, 3.00%, 10/25/2050 | | |
Series 4839, Class WS, IF, IO, 0.66%, 8/15/2056 (j) | | |
| | |
Series 2012-146, Class AI, IO, 3.00%, 1/25/2028 | | |
Series 2016-68, Class BI, IO, 3.00%, 10/25/2031 | | |
Series 2012-93, Class SE, IF, IO, 0.66%, 9/25/2042 (j) | | |
Series 2012-124, Class UI, IO, 4.00%, 11/25/2042 | | |
Series 2015-40, Class LS, IF, IO, 0.73%, 6/25/2045 (j) | | |
Series 2017-31, Class SG, IF, IO, 0.66%, 5/25/2047 (j) | | |
Series 2017-39, Class ST, IF, IO, 0.66%, 5/25/2047 (j) | | |
FNMA, STRIPS Series 409, Class 27, IO, 4.00%, 4/25/2027 (j) | | |
GNMA Series 2015-H13, Class GI, IO, 1.53%, 4/20/2065 (j) | | |
Merrill Lynch Mortgage Investors Trust Series 2004-C, Class A1, 6.00%, 7/25/2029 (j) | | |
MFA Trust Series 2023-RTL1, Class A1, 7.58%, 8/25/2027 (b) (h) | | |
| | |
|
United States — continued |
Structured Adjustable Rate Mortgage Loan Trust Series 2004-8, Class 3A, 6.50%, 7/25/2034 (j) | | |
VM Master Issuer LLC Series 2022-1, Class A1, 5.16%, 5/24/2025 ‡ (b) (j) | | |
Total Collateralized Mortgage Obligations
(Cost $2,960,147) | | |
| | |
|
|
Windstream Holdings, Inc. ‡ *(Cost $—) | | |
Short-Term Investments — 2.9% |
Investment Companies — 2.9% |
JPMorgan U.S. Government Money Market Fund Class IM Shares, 5.25% (k) (l)(Cost $12,140,460) | | |
Total Investments — 97.7%
(Cost $423,229,183) | | |
Other Assets Less Liabilities — 2.3% | | |
| | |
Percentages indicated are based on net assets. |
| |
| |
| |
| |
| |
| Collateralized Loan Obligations |
| Chicago Mercantile Exchange |
| |
| |
| Euro Interbank Offered Rate |
| Federal Home Loan Mortgage Corp. |
| Federal National Mortgage Association |
| |
| Government National Mortgage Association |
| Intercontinental Exchange |
SEE NOTES TO FINANCIAL STATEMENTS.
| J.P. Morgan Exchange-Traded Funds | |
JPMorgan International Bond Opportunities ETF
SCHEDULE OF PORTFOLIO INVESTMENTSAS OF February 29, 2024 (continued)
| Inverse Floaters represent securities that pay interest at a rate that increases (decreases) with a decline (incline) in a specified index or have an interest rate that adjusts periodically based on changes in current interest rates and prepayments on the underlying pool of assets. The interest rate shown is the rate in effect as of February 29, 2024. The rate may be subject to a cap and floor. |
| Interest Only represents the right to receive the monthly interest payments on an underlying pool of mortgage loans. The principal amount shown represents the par value on the underlying pool. The yields on these securities are subject to accelerated principal paydowns as a result of prepayment or refinancing of the underlying pool of mortgage instruments. As a result, interest income may be reduced considerably. |
| |
| |
| |
| |
| Limited liability company |
| Real Estate Investment Trust |
| Real Estate Mortgage Investment Conduit |
| Secured Overnight Financing Rate |
| Compounding index of the Secured Overnight Financing Rate |
| Separate Trading of Registered Interest and Principal of Securities. The STRIPS Program lets investors hold and trade individual interest and principal components of eligible notes and bonds as separate securities. |
| |
| |
| Amount rounds to less than 0.1% of net assets. |
| Value determined using significant unobservable inputs. | |
| Non-income producing security. | |
| Security exempt from registration pursuant to Regulation S under the Securities Act of 1933, as amended. Regulation S applies to securities offerings that are made outside of the United States and do not involve direct selling efforts in the United States and as such may have restrictions on resale. | |
| Securities exempt from registration under Rule 144A or section 4(a)(2), of the Securities Act of 1933, as amended. | |
| Contingent Capital security (“CoCo”). CoCos are hybrid debt securities that may be convertible into equity or may be written down if a pre-specified trigger event occurs. The total value of aggregate CoCo holdings at February 29, 2024 is $17,056,742 or 4.10% of the Fund’s net assets as of February 29, 2024. | |
| Security is an interest bearing note with preferred security characteristics. | |
| Security is perpetual and thus, does not have a predetermined maturity date. The coupon rate for this security is fixed for a period of time and may be structured to adjust thereafter. The date shown, if applicable, reflects the next call date. The coupon rate shown is the rate in effect as of February 29, 2024. | |
| Variable or floating rate security, linked to the referenced benchmark. The interest rate shown is the current rate as of February 29, 2024. | |
| | |
| Step bond. Interest rate is a fixed rate for an initial period that either resets at a specific date or may reset in the future contingent upon a predetermined trigger. The interest rate shown is the current rate as of February 29, 2024. | |
| Security has the ability to pay in kind (“PIK”) or pay income in cash. When applicable, separate rates of such payments are disclosed. | |
| Variable or floating rate security, the interest rate of which adjusts periodically based on changes in current interest rates and prepayments on the underlying pool of assets. The interest rate shown is the current rate as of February 29, 2024. | |
| Investment in an affiliated fund, which is registered under the Investment Company Act of 1940, as amended, and is advised by J.P. Morgan Investment Management Inc. | |
| The rate shown is the current yield as of February 29, 2024. | |
Futures contracts outstanding as of February 29, 2024:
| | | | | VALUE AND
UNREALIZED
APPRECIATION
(DEPRECIATION) ($) |
| | | | | |
| | | | | |
U.S. Treasury 10 Year Note | | | | | |
U.S. Treasury 10 Year Ultra Note | | | | | |
U.S. Treasury 2 Year Note | | | | | |
U.S. Treasury 5 Year Note | | | | | |
| | | | | |
SEE NOTES TO FINANCIAL STATEMENTS.
| J.P. Morgan Exchange-Traded Funds | |
| | | | | VALUE AND UNREALIZED APPRECIATION (DEPRECIATION) ($) |
| | | | | |
| | | | | |
| | | | | |
| | | | | |
| | | | | |
U.S. Treasury 10 Year Note | | | | | |
U.S. Treasury 10 Year Ultra Note | | | | | |
| | | | | |
| | | | | |
| | | | | |
U.S. Treasury 2 Year Note | | | | | |
U.S. Treasury 5 Year Note | | | | | |
| | | | | |
| | | | | |
SEE NOTES TO FINANCIAL STATEMENTS.
| J.P. Morgan Exchange-Traded Funds | |
JPMorgan International Bond Opportunities ETF
SCHEDULE OF PORTFOLIO INVESTMENTSAS OF February 29, 2024 (continued)
Forward foreign currency exchange contracts outstanding as of February 29, 2024:
| | | | UNREALIZED
APPRECIATION
(DEPRECIATION) ($) |
| | | | | | |
| | | | | | |
| | | | | | |
| | | | | | |
| | | | | | |
| | | | | | |
| | | | | | |
| | | | | | |
| | | | Merrill Lynch International** | | |
| | | | | | |
| | | | Goldman Sachs International | | |
| | | | | | |
| | | | | | |
| | | | | | |
| | | | | | |
| | | | Goldman Sachs International** | | |
| | | | | | |
| | | | | | |
| | | | Goldman Sachs International** | | |
| | | | Merrill Lynch International** | | |
| | | | | | |
| | | | | | |
| | | | Goldman Sachs International | | |
| | | | | | |
| | | | | | |
| | | | | | |
Total unrealized appreciation | |
| | | | | | |
| | | | | | |
| | | | | | |
| | | | | | |
| | | | | | |
| | | | | | |
| | | | | | |
| | | | | | |
| | | | Citigorup Global Markets, Inc.** | | |
| | | | | | |
| | | | Goldman Sachs International** | | |
| | | | | | |
| | | | | | |
| | | | | | |
| | | | Goldman Sachs International | | |
| | | | | | |
| | | | | | |
| | | | | | |
| | | | | | |
| | | | | | |
| | | | | | |
Total unrealized depreciation | |
Net unrealized depreciation | |
SEE NOTES TO FINANCIAL STATEMENTS.
| J.P. Morgan Exchange-Traded Funds | |
Centrally Cleared Credit default swap contracts outstanding - buy protection(*) as of February 29, 2024:
REFERENCE
OBLIGATION/INDEX | FINANCING
RATE PAID
BY THE FUND
(%) | | | | | UPFRONT
PAYMENTS
(RECEIPTS)
| UNREALIZED
APPRECIATION
(DEPRECIATION)
($) | |
iTraxx.Europe.Crossover.40-V1 | | | | | | | | |
| The Fund, as a buyer of credit protection, is generally obligated to make periodic payments and may also pay or receive an upfront premium to or from the protection seller, in exchange for the right to receive a contingent payment, upon occurrence of a credit event with respect to an underlying reference obligation, as defined under the terms of individual swap contracts. |
| Implied credit spreads are an indication of the seller's performance risk, related to the likelihood of a credit event occurring that would require a seller to make payment to a buyer. Implied credit spreads are used to determine the value of swap contracts and reflect the cost of buying/selling protection, which may include upfront payments made to enter into the contract. Therefore, higher spreads would indicate a greater likelihood that a seller will be obligated to perform (i.e. make payment) under the swap contract. Increasing values, in absolute terms and relative to notional amounts, are also indicative of greater performance risk. Implied credit spreads for credit default swaps on credit indices are linked to the weighted average spread across the underlying reference obligations included in a particular index. |
| The notional amount is the maximum amount that a seller of credit protection would be obligated to pay and a buyer of credit protection would receive, upon occurrence of a credit event. |
| Upfront payments and receipts generally represent premiums paid or received at the initiation of the agreement to compensate the differences between the stated terms of the swap agreement and current market conditions (credit spreads, interest rates and other relevant factors). |
SEE NOTES TO FINANCIAL STATEMENTS.
| J.P. Morgan Exchange-Traded Funds | |
JPMorgan International Bond Opportunities ETF
SCHEDULE OF PORTFOLIO INVESTMENTSAS OF February 29, 2024 (continued)
Centrally Cleared interest rate swap contracts outstanding as of February 29, 2024:
| | | | | UPFRONT
PAYMENTS
(RECEIPTS)
($) | UNREALIZED
APPRECIATION
(DEPRECIATION) ($) | |
| | | | | | | |
| | | | | | | |
| | | | | | | |
| | | | | | | |
| | | | | | | |
| | | | | | | |
| | | | | | | |
| | | | | | | |
| | | | | | | |
|
| Value of floating rate index at February 29, 2024 was as follows: |
| |
| |
| Secured Overnight Financing Rate |
| |
SEE NOTES TO FINANCIAL STATEMENTS.
| J.P. Morgan Exchange-Traded Funds | |
SCHEDULE OF PORTFOLIO INVESTMENTSAS OF February 29, 2024
| | |
Municipal Bonds — 86.7% (a) |
|
Alabama Federal Aid Highway Finance Authority Series 2015, Rev., 4.00%, 9/1/2024 (b) | | |
Black Belt Energy Gas District, Gas Project | | |
Series 2023A, Rev., 5.25%, 10/1/2030 (c) | | |
Series 2023B-2, Rev., LIQ : Royal Bank of Canada, 5.25%, 12/1/2030 (c) | | |
Black Belt Energy Gas District, Gas Project No. 8 Series 2022A, Rev., 4.00%, 12/1/2029 (c) | | |
City of Pell City, Warrants Series 2015A, GO, 5.00%, 2/1/2025 | | |
| | |
Series 2024, Rev., 5.00%, 10/1/2035 | | |
Series 2024, Rev., 5.00%, 10/1/2038 | | |
Series 2024, Rev., 5.00%, 10/1/2039 | | |
Series 2024, Rev., 5.25%, 10/1/2042 | | |
Series 2024, Rev., 5.25%, 10/1/2043 | | |
Series 2024, Rev., 5.25%, 10/1/2049 | | |
Energy Southeast A Cooperative District Series 2023A-1, Rev., 5.50%, 1/1/2031 (c) | | |
Lower Alabama Gas District (The), Gas Project Series 2016A, Rev., 5.00%, 9/1/2031 | | |
Selma Industrial Development Board, International Paper Co. Project Series 2020A, Rev., 1.38%, 6/16/2025 (c) | | |
Southeast Alabama Gas Supply District (The), Project No. 1 Series 2018A, Rev., 4.00%, 4/1/2024 (c) | | |
Southeast Alabama Gas Supply District (The), Project No. 2 Series 2024 B, Rev., 5.00%, 5/1/2032 (c) (d) | | |
Southeast Energy Authority A Cooperative District Project No.06 Series 2023B, Rev., LIQ : Royal Bank of Canada, 5.00%, 6/1/2030 (c) | | |
Southeast Energy Authority A Cooperative District, Project No. 2 Series 2021B, Rev., 4.00%, 12/1/2031 (c) | | |
| | |
|
|
Southeast Energy Authority A Cooperative District, Project No. 3 Series 2022A-1, Rev., 5.50%, 12/1/2029 (c) | | |
University of Alabama (The), Huntsville General Fee Series 2018B-2, Rev., 5.00%, 9/1/2031 | | |
| | |
|
| | |
Series 2020A, Rev., 5.00%, 7/1/2030 | | |
Series 2020A, Rev., 5.00%, 7/1/2033 | | |
Arizona Industrial Development Authority, Academies of Math and Science Projects Rev., 4.50%, 7/1/2033 (e) | | |
Arizona Industrial Development Authority, Cadence Campus Project Series 2020A, Rev., 4.00%, 7/15/2030 (e) | | |
Arizona Industrial Development Authority, Great Lakes Senior Living Communities LLC Project Series 2019A, Rev., 5.00%, 1/1/2036 | | |
Arizona Industrial Development Authority, KIPP Nashville Project | | |
Series 2022A, Rev., 5.00%, 7/1/2028 | | |
Series 2022A, Rev., 5.00%, 7/1/2029 | | |
Arizona Industrial Development Authority, National Charter School Revolving Loan Fund | | |
Series 2020A, Rev., 4.00%, 11/1/2038 | | |
Series 2023A, Rev., 5.00%, 11/1/2038 | | |
Series 2023A, Rev., 5.00%, 11/1/2040 | | |
Series 2023A, Rev., 5.25%, 11/1/2048 | | |
City of Phoenix Civic Improvement Corp., Junior Lien, Airport System Series 2019A, Rev., 5.00%, 7/1/2044 | | |
City of Phoenix Civic Improvement Corp., Junior Lien, Wastewater System | | |
Series 2023, Rev., 5.00%, 7/1/2041 | | |
Series 2023, Rev., 5.00%, 7/1/2043 | | |
City of Phoenix Civic Improvement Corp., Senior Lien, Airport System | | |
Series 2023, Rev., AMT, 5.00%, 7/1/2024 | | |
Series 2023, Rev., AMT, 5.00%, 7/1/2025 | | |
Gilbert Water Resource Municipal Property Corp. Series 2022, Rev., 4.00%, 7/15/2047 | | |
SEE NOTES TO FINANCIAL STATEMENTS.
| J.P. Morgan Exchange-Traded Funds | |
SCHEDULE OF PORTFOLIO INVESTMENTSAS OF February 29, 2024 (continued)
| | |
Municipal Bonds — continued |
|
Industrial Development Authority of the County of Pima (The), La Posada at Pusch Ridge Project Series 2022B-3, Rev., 5.13%, 11/15/2029 (e) | | |
Maricopa County Industrial Development Authority, Banner Health | | |
Series 2023A-1, Rev., 5.00%, 5/15/2026 (c) | | |
Series A, Rev., 4.00%, 1/1/2041 | | |
Maricopa County Industrial Development Authority, Valley Christian Schools Project Series 2023A, Rev., 6.00%, 7/1/2043 (e) | | |
Maricopa County School District No. 3, Tempe Elementary, School Improvement, Project of 2016 Series 2017A, GO, 5.00%, 7/1/2027 | | |
Maricopa County Unified School District No. 60 Higley COP, AGM, 5.00%, 6/1/2036 | | |
Salt River Project Agricultural Improvement and Power District, Arizona Electric System | | |
Series 2023 A, Rev., 5.00%, 1/1/2050 | | |
Series 2023B, Rev., 5.25%, 1/1/2053 | | |
Salt Verde Financial Corp. Series 2007-1, Rev., 5.25%, 12/1/2026 | | |
| | |
|
City of Fort Smith, Water and Sewer Construction Rev., 5.00%, 10/1/2024 | | |
County of Pulaski, Arkansas Children's Hospital Rev., 5.00%, 3/1/2037 | | |
| | |
|
Azusa Unified School District, Election of 2014 | | |
Series 2022D, GO, 5.00%, 8/1/2029 | | |
Series 2022D, GO, 5.00%, 8/1/2032 | | |
California Community Choice Financing Authority, Clean Energy Project | | |
Series 2023B-1, Rev., 5.00%, 8/1/2029 (c) | | |
Series 2023 G-1, Rev., 5.25%, 4/1/2030 (c) | | |
Series 2021B-1, Rev., 4.00%, 8/1/2031 (c) | | |
| | |
|
|
Series 2024 A, Rev., 5.00%, 4/1/2032 (c) | | |
California Enterprise Development Authority, Riverside County, Rocketship Public Schools-Obligated Group No. 2 Series 2022A, Rev., 4.00%, 6/1/2027 (e) | | |
California Health Facilities Financing Authority, On Lok Senior Health Service Rev., 5.00%, 8/1/2040 | | |
California Infrastructure and Economic Development Bank, Brightline West Passenger Rail Project | | |
Series 2020A-3, Rev., AMT, 8.00%, 8/15/2024 (c) (e) | | |
Series 2020A, Rev., AMT, 3.95%, 1/30/2025 (c) (e) | | |
California Infrastructure and Economic Development Bank, California Academy of Science Series 2024A, Rev., 3.25%, 8/1/2029 (d) | | |
California Municipal Finance Authority, Aymium Williams Project Series 2022, Rev., AMT, 4.00%, 6/26/2024 (c) (e) | | |
California Municipal Finance Authority, Community Health System Series 2021A, Rev., 5.00%, 2/1/2033 | | |
California Municipal Finance Authority, San Antonio Gardens Project Rev., 5.00%, 11/15/2039 | | |
California Municipal Finance Authority, Waste Management, Inc. Project Series 2022A, Rev., AMT, 4.13%, 10/1/2025 (c) | | |
California Pollution Control Financing Authority, Poseidon Resources Channelside LP Desalination Project Rev., AMT, 5.00%, 7/1/2036 (e) | | |
California Public Finance Authority, Enso Village Project Series 2021B-3, Rev., 2.13%, 11/15/2027 (e) | | |
California School Finance Authority, Kipp SoCal Public Schools Series 2019A, Rev., 5.00%, 7/1/2039 (e) | | |
City of Aliso Viejo COP, 4.00%, 11/1/2028 | | |
City of Los Angeles Department of Airports, International Airport Subordinate Series 2021A, Rev., AMT, 5.00%, 5/15/2039 | | |
City of Santa Rosa, Courthouse Square Project and Lease COP, 4.00%, 10/1/2024 | | |
SEE NOTES TO FINANCIAL STATEMENTS.
| J.P. Morgan Exchange-Traded Funds | |
| | |
Municipal Bonds — continued |
|
CSCDA Community Improvement Authority, Essential Housing, Pasadena Portfolio Series 2021A-1, Rev., 2.65%, 12/1/2046 (e) | | |
CSCDA Community Improvement Authority, Essential Housing, Towne at Glendale Apartments Series 2022B, Rev., 5.00%, 9/1/2037 (e) | | |
El Centro Financing Authority, Police Station Project | | |
Series 2023A, Rev., 5.00%, 10/1/2024 | | |
Series 2023A, Rev., 5.00%, 10/1/2025 | | |
Golden State Tobacco Securitization Corp., Enhanced Tobacco Settlement | | |
Series 2018A-1, Rev., 5.00%, 6/1/2028 (b) | | |
Series 2021B-2, Rev., Zero Coupon, 6/1/2066 | | |
Indio Finance Authority, City of Indio | | |
Series 2022A, Rev., 5.00%, 11/1/2028 | | |
Series 2022A, Rev., 5.00%, 11/1/2029 | | |
Series 2022A, Rev., 5.00%, 11/1/2030 | | |
Series 2022A, Rev., 5.00%, 11/1/2034 | | |
Los Angeles County Development Authority, West LA Building 156 and 157 Apartments Series 2023C, Rev., 3.75%, 12/1/2026 (c) | | |
Los Angeles Department of Water and Power, Power System Series 2022A, Rev., 5.00%, 7/1/2030 | | |
Ontario Public Financing Authority, Civic Center Improvements Series 2022A, Rev., AGM, 5.00%, 11/1/2033 | | |
Petaluma Public Financing Authority, Road Improvement Projects Rev., 5.00%, 5/1/2026 | | |
Redding Joint Powers Financing Authority Series 2019A, Rev., 5.00%, 4/1/2026 | | |
River Islands Public Financing Authority, Facilities District No. 2003 | | |
Series 2022A-1, AGM, 5.00%, 9/1/2029 | | |
Series 2022A-1, AGM, 5.00%, 9/1/2030 | | |
Salinas Union High School District, Election of 2020 Series A, GO, 4.00%, 8/1/2047 | | |
San Diego County Regional Airport Authority | | |
Series 2023B, Rev., AMT, 5.25%, 7/1/2038 | | |
| | |
|
|
Series 2023B, Rev., AMT, 5.00%, 7/1/2048 | | |
San Dieguito Union High School District, Election of 2012 Series A-2, GO, 5.00%, 8/1/2024 | | |
San Jose Evergreen Community College District Series C, GO, 4.00%, 9/1/2043 | | |
Solano Irrigation District, Water COP, 4.00%, 8/1/2031 | | |
South San Francisco Public Facilities Financing Authority, Community Civic Campus and Multiple Capital Projects Series 2021A, Rev., 4.00%, 6/1/2029 | | |
South San Francisco Public Facilities Financing Authority, Multiple Capital Project Series 2022A, Rev., 5.00%, 6/1/2029 | | |
State of California, Various Purpose GO, 5.00%, 11/1/2032 | | |
Tobacco Securitization Authority of Northern California, Sacramento County Tobacco Securitization Corp. Series 2021A, Class 1, Rev., 5.00%, 6/1/2032 | | |
Tracy Public Financing Authority, Legacy Fields Series 2022A, Rev., 5.00%, 11/1/2036 | | |
University of California Series 2018AZ, Rev., 4.00%, 5/15/2029 | | |
Vallecito Union School District Series A, GO, 5.00%, 8/1/2031 | | |
Yucaipa Valley Water District Financing Authority, Water and Sewer Series 2022A, Rev., 5.00%, 9/1/2034 | | |
| | |
|
Adams County Housing Authority, Maiker Housing Partners Multifamily Housing, Overlook At Thornton Series 2023, Rev., 4.50%, 5/1/2026 (c) | | |
Boulder Valley School District No. Re-2 Boulder GO, 4.13%, 12/1/2046 | | |
City and County of Denver Series 2020B, GO, 5.00%, 8/1/2029 | | |
City and County of Denver, Airport System | | |
Series 2018 A, Rev., AMT, 5.00%, 12/1/2028 | | |
Series 2022A, Rev., AMT, 5.00%, 11/15/2032 | | |
SEE NOTES TO FINANCIAL STATEMENTS.
| J.P. Morgan Exchange-Traded Funds | |
SCHEDULE OF PORTFOLIO INVESTMENTSAS OF February 29, 2024 (continued)
| | |
Municipal Bonds — continued |
|
Series 2018A, Rev., AMT, 5.00%, 12/1/2035 | | |
Series 2022A, Rev., AMT, 5.50%, 11/15/2042 | | |
City of Colorado Springs, Utilities System Improvement Series 2007A, Rev., VRDO, LIQ : TD Bank NA, 3.20%, 3/11/2024 (c) | | |
Colorado Educational and Cultural Facilities Authority, Vega Collegiate Academy Project Series 2021A, Rev., 5.00%, 2/1/2051 (e) | | |
Colorado Higher Education, Capital Construction, Lease Purchase Financing Program COP, 4.00%, 9/1/2034 | | |
Colorado Housing and Finance Authority Series 2023L, Class III, Rev., GNMA COLL, 5.75%, 11/1/2053 | | |
County of Adams COP, 5.00%, 12/1/2024 | | |
Dominion Water and Sanitation District Rev., 5.00%, 12/1/2027 | | |
San Miguel County School District R-1 Telluride | | |
Series 2024, GO, 5.00%, 12/1/2037 (d) | | |
Series 2024, GO, 5.00%, 12/1/2042 (d) | | |
State of Colorado, Building Excellent Schools Today Series S, COP, 4.00%, 3/15/2037 | | |
University of Colorado, Enterprise System Series 2017A-2, Rev., 5.00%, 6/1/2026 | | |
| | |
|
| | |
Series 2023, GO, 4.00%, 6/15/2041 | | |
| | |
| | |
Series 2023, GO, 4.00%, 8/15/2042 | | |
Series 2023, GO, 4.00%, 8/15/2043 | | |
Stamford Housing Authority, The Dogwoods Project Rev., BAN, 11.00%, 12/1/2027 (e) | | |
State of Connecticut Series A, GO, 5.00%, 4/15/2033 | | |
State of Connecticut Special Tax | | |
Series 2023A, Rev., 5.00%, 7/1/2037 | | |
Series 2023A, Rev., 5.00%, 7/1/2038 | | |
University of Connecticut Series 2017A, Rev., 5.00%, 1/15/2028 | | |
| | |
| | |
|
|
Delaware State Economic Development Authority, St. Andrews School Project Rev., 4.00%, 7/1/2041 | | |
District of Columbia — 1.7% |
District of Columbia Series 2023A, GO, 5.00%, 1/1/2036 | | |
District of Columbia, Income Tax | | |
Series 2019A, Rev., 5.00%, 3/1/2029 | | |
Series 2023 A, Rev., 5.00%, 5/1/2043 | | |
Series 2023 A, Rev., 5.25%, 5/1/2048 | | |
District of Columbia, Kipp DC Project Rev., 4.00%, 7/1/2039 | | |
District of Columbia, Water and Sewer Authority, Public Utility, Senior Lien Series B, Rev., 5.00%, 10/1/2025 | | |
District of Columbia, Water and Sewer Authority, Public Utility, Subordinate Lien Series 2022C1, Rev., 4.00%, 10/1/2040 | | |
Metropolitan Washington Airports Authority Aviation | | |
Series 2010D, Rev., VRDO, LOC : TD Bank NA, 3.30%, 3/11/2024 (c) | | |
Series 2023A, Rev., AMT, 5.00%, 10/1/2025 | | |
Series 2021A, Rev., AMT, 5.00%, 10/1/2031 | | |
Series 2020A, Rev., AMT, 4.00%, 10/1/2035 | | |
Washington Metropolitan Area Transit Authority Dedicated, Sustainability Climate Transition Bonds Series 2023A, Rev., 5.00%, 7/15/2037 | | |
Total District of Columbia | | |
|
Capital Trust Authority, IPS Enterprises, Inc., Projects | | |
Series 2023 A, Rev., 5.13%, 6/15/2033 (e) | | |
Series 2023 A, Rev., 6.00%, 6/15/2043 (e) | | |
Central Florida Tourism Oversight District Series 2016A, GO, 5.00%, 6/1/2026 | | |
City of Cape Coral, Florida Special Obligation Rev., 5.00%, 10/1/2024 | | |
City of Kissimmee, Sales Tax Rev., 4.00%, 10/1/2025 | | |
SEE NOTES TO FINANCIAL STATEMENTS.
| J.P. Morgan Exchange-Traded Funds | |
| | |
Municipal Bonds — continued |
|
City of Orlando, Capital Improvement Series B, Rev., 5.00%, 10/1/2024 | | |
City of Tampa, H. Lee Moffitt Cancer Center Project Series 2016B, Rev., 5.00%, 7/1/2024 | | |
Cobb County Kennestone Hospital Authority, Wellstar Health System, Inc., Project Series 2023, Rev., 5.00%, 6/1/2027 | | |
County of Hillsborough, Communications Services Tax Rev., 5.00%, 10/1/2024 | | |
| | |
Series 2021 B, Rev., AMT, 5.00%, 10/1/2031 | | |
Series 2021A, Rev., AMT, 5.00%, 10/1/2031 | | |
County of Manatee Series 2023, Rev., 5.50%, 10/1/2053 | | |
County of Miami-Dade, Aviation System Series A, Rev., AMT, 5.00%, 10/1/2034 | | |
County of Miami-Dade, Jackson Health System Series 2015A, Rev., 5.00%, 6/1/2025 | | |
County of Okaloosa, Sales Tax Rev., 5.00%, 10/1/2024 | | |
County of Pasco, H Lee Moffitt Cancer Center and Research Institutes | | |
Series 2023A, Rev., AGM, 5.25%, 9/1/2026 | | |
Series 2023A, Rev., AGM, 5.25%, 9/1/2027 | | |
Series 2023A, Rev., AGM, 5.25%, 9/1/2028 | | |
Duval County Public Schools Series 2022-A, COP, AGM, 5.00%, 7/1/2034 | | |
East Central Regional Wastewater Treatment Facilities Operation Board, Biosolids Project Rev., 5.00%, 10/1/2024 | | |
Florida Atlantic University Finance Corp., Student Housing Project Series 2019B, Rev., 5.00%, 7/1/2032 | | |
Florida Department of Children and Families, Evaluation Treatment Center Financing Corp. Project Series 2021B, COP, 5.00%, 10/1/2028 | | |
Florida Development Finance Corp., Educational Facilities, River City Science Academy Projects | | |
Series 2022A-1, Rev., 4.00%, 7/1/2031 | | |
Series 2021A, Rev., 4.00%, 7/1/2035 | | |
| | |
|
|
Florida Development Finance Corp., Idea Florida, Inc., Jacksonville IV Project Rev., 5.25%, 6/15/2029 (e) | | |
Florida Housing Finance Corp., Culmer Apartments Series 2023C, Rev., 5.00%, 12/1/2025 (c) | | |
Florida Housing Finance Corp., Hampton Point Apartments Series 2023E, Rev., 5.00%, 5/1/2025 (c) | | |
Florida Housing Finance Corp., Northside Transit Village III Series 2023B, Rev., GNMA COLL, 5.00%, 2/1/2026 (c) | | |
Florida Municipal Loan Council, Village of Palmetto Bay Series 2021A, Rev., 4.00%, 10/1/2028 | | |
Florida Municipal Power Agency, All-Requirements Power Supply Project Series 2016A, Rev., 5.00%, 10/1/2024 | | |
Florida State Board of Governors University of North Florida Dormitory | | |
Series 2023A, Rev., 5.00%, 11/1/2041 | | |
Series 2023A, Rev., 5.00%, 11/1/2042 | | |
Florida State Board of Governors, University of Florida Mandatory Student Fee Series 2021A, Rev., AGM, 5.00%, 11/1/2028 | | |
JEA Water and Sewer System Series 2024A, Rev., 5.25%, 10/1/2049 | | |
Lee County School Board (The) Series 2023A, COP, 4.00%, 8/1/2048 | | |
Miami-Dade County Housing Finance Authority, Running Brook Apartments Series 202, Rev., 3.55%, 1/1/2026 (c) | | |
Middleton Community Development District A, City of Wildwood, Florida Special Assessment 5.85%, 5/1/2037 | | |
Orange County Health Facilities Authority, Orlando Health Obligated Group Series 2023A, Rev., 5.00%, 10/1/2036 | | |
Orange County Health Facilities Authority, The Nemours Foundation Project Series 2009C-2, Rev., VRDO, LOC : TD Bank NA, 3.25%, 3/11/2024 (c) | | |
Palm Beach County Health Facilities Authority, Acts Retirement Life Communities, Inc., Obligated Group Rev., 5.00%, 11/15/2032 | | |
Palm Beach County School District Series 2024A, COP, 5.00%, 8/1/2039 | | |
SEE NOTES TO FINANCIAL STATEMENTS.
| J.P. Morgan Exchange-Traded Funds | |
SCHEDULE OF PORTFOLIO INVESTMENTSAS OF February 29, 2024 (continued)
| | |
Municipal Bonds — continued |
|
Polk County Housing Finance Authority, Episcopal Catholic Apartments Series 2023, Rev., 4.15%, 6/1/2026 (c) | | |
State of Florida Board of Education, Public Education Capital Outlay | | |
Series 2015B, GO, 5.00%, 6/1/2024 | | |
Series 2017B, GO, 5.00%, 6/1/2031 | | |
State of Florida, State Board of Education, Lottery Series 2016A, Rev., 5.00%, 7/1/2026 | | |
Tampa Bay Water, Regional Water Supply Authority, Utility System Series 2016C, Rev., 5.00%, 10/1/2025 | | |
Tampa-Hillsborough County Expressway Authority Series 2017B, Rev., 5.00%, 7/1/2031 | | |
University of Florida, Department of Housing and Residence Education Housing System Series 2021A, Rev., 5.00%, 7/1/2026 | | |
Village Community Development District No. 15 4.25%, 5/1/2028 (e) | | |
| | |
|
Augusta Development Authority, AU Health System, Inc. Project Series 2018, Rev., 4.00%, 7/1/2038 | | |
Bartow County Development Authority, Georgia Power Co. Plant Series 2009-1, Rev., 3.95%, 3/8/2028 (c) | | |
City of Atlanta, Airport Passenger Facility Charge, Subordinate Lien Series 2019D, Rev., AMT, 4.00%, 7/1/2037 | | |
City of Atlanta, Georgia Airport Series 2019B, Rev., AMT, 5.00%, 7/1/2031 | | |
Columbia County Hospital Authority, Wellstart Health System Inc., Project Series 2023B, Rev., 5.00%, 4/1/2042 | | |
County of DeKalb, Water and Sewerage Series 2006B, Rev., 5.25%, 10/1/2026 | | |
Development Authority of Monroe County (The), Georgia Power Co. Plant Scherer Project Series 2009-2, Rev., 3.88%, 3/6/2026 (c) | | |
Georgia Higher Education Facilities Authority, USG Real Estate Foundation II LLC Projects Rev., 4.00%, 6/15/2038 | | |
Georgia Ports Authority Series 2021, Rev., 4.00%, 7/1/2051 | | |
| | |
|
|
Glynn-Brunswick Memorial Hospital Authority, Southeast Georgia Health System Project Rev., 4.00%, 8/1/2037 | | |
Main Street Natural Gas, Inc., Gas Supply | | |
Series 2022B, Rev., 5.00%, 6/1/2029 (c) | | |
Series 2023B, Rev., 5.00%, 3/1/2030 (c) | | |
Series 2023A, Rev., 5.00%, 6/1/2030 (c) | | |
Series 2023C, Rev., 5.00%, 9/1/2030 (c) | | |
Series 2023D, Rev., 5.00%, 12/1/2030 (c) | | |
Series 2023E SUB E1, Rev., 5.00%, 6/1/2031 (c) | | |
Series 2024 A, Rev., 5.00%, 9/1/2031 (c) | | |
Metropolitan Atlanta Rapid Transit Authority, Sales Tax | | |
Series 2017D, Rev., 4.00%, 7/1/2028 | | |
Series 2023A, Rev., 5.00%, 7/1/2036 | | |
Series 2023A, Rev., 5.00%, 7/1/2039 | | |
Rome Building Authority, Rome City School Project Series 2023, Rev., 5.00%, 3/1/2036 | | |
Walton County Water and Sewer Authority, Hard Labor Creek Reservoir Water Treatment Facility Project | | |
| | |
| | |
| | |
|
City and County of Honolulu Series D, GO, 5.00%, 9/1/2032 | | |
State of Hawaii Series FK, GO, 5.00%, 5/1/2033 | | |
| | |
|
Idaho Health Facilities Authority, St. Luke's Health System Project Series 2021A, Rev., 5.00%, 3/1/2029 | | |
Idaho Housing and Finance Association, Transportation Expansion and Congestion Mitigation Fund Series 2022A, Rev., 5.00%, 8/15/2035 | | |
| | |
SEE NOTES TO FINANCIAL STATEMENTS.
| J.P. Morgan Exchange-Traded Funds | |
| | |
Municipal Bonds — continued |
|
Champaign County Community Unit School District No. 4 Champaign, School Building GO, 5.00%, 1/1/2027 | | |
Chicago Midway International Airport, Senior Lien | | |
Series 2023A, Rev., AMT, 5.00%, 1/1/2029 | | |
Series 2023A, Rev., AMT, 5.00%, 1/1/2030 | | |
Series 2023 C, Rev., AMT, 5.00%, 1/1/2034 | | |
Series 2023 C, Rev., AMT, 5.00%, 1/1/2039 | | |
Series 2023A, Rev., AMT, 5.75%, 1/1/2048 | | |
Series 2023A, Rev., AMT, 5.50%, 1/1/2053 | | |
Chicago O'Hare International Airport, Customer Facility Charge Senior Lien | | |
Series 2023, Rev., 5.00%, 1/1/2036 | | |
Series 2023, Rev., 5.00%, 1/1/2037 | | |
Chicago O'Hare International Airport, General Airport, Senior Lien | | |
Series 2020A, Rev., 5.00%, 1/1/2034 | | |
Series B, Rev., 5.00%, 1/1/2034 | | |
City of Chicago, Waterworks, Second Lien | | |
Series 2023B, Rev., 5.00%, 11/1/2024 | | |
Series 2023A, Rev., AGM, 5.25%, 11/1/2053 | | |
City of Decatur GO, 5.00%, 3/1/2027 | | |
City of Highland Park GO, 4.00%, 12/30/2028 | | |
Cook County School District No. 87 Berkeley GO, AGM, 4.00%, 12/1/2030 | | |
County of Cook, Sales Tax Rev., 5.00%, 11/15/2034 | | |
County of Lake, Sales Tax GO, 4.00%, 11/30/2027 | | |
Illinois Finance Authority, Clark-Lindsey Village Series 2022A, Rev., 5.13%, 6/1/2032 | | |
Illinois Finance Authority, Clean Water Initiative Revolving Fund Rev., 5.00%, 7/1/2032 | | |
Illinois Finance Authority, DePaul College Prep Project Series 2023A, Rev., 4.50%, 8/1/2033 (e) | | |
| | |
|
|
Illinois Finance Authority, Lake Forest College | | |
Series 2022A, Rev., 5.00%, 10/1/2029 | | |
Series 2022A, Rev., 5.00%, 10/1/2030 | | |
Series 2022A, Rev., 5.00%, 10/1/2031 | | |
Illinois Finance Authority, Plymouth Place, Inc. | | |
Series 2022B-2, Rev., 5.25%, 3/25/2024 | | |
Series 2022B-1, Rev., 6.00%, 11/15/2027 | | |
Illinois Finance Authority, Smith Crossing Rev., 4.00%, 10/15/2028 | | |
Illinois Finance Authority, Uchicago Medicine Series 2022B-2, Rev., 5.00%, 8/15/2027 (c) | | |
Illinois Finance Authority, University of Chicago Series 2015A, Rev., 5.00%, 10/1/2025 (b) | | |
Illinois Housing Development Authority | | |
Rev., FHA, 4.00%, 6/1/2025 (c) | | |
Series 2024 A, Rev., GNMA / FNMA / FHLMC, 6.00%, 10/1/2054 (d) | | |
Illinois State Toll Highway Authority | | |
Series 2019A, Rev., 5.00%, 1/1/2036 | | |
Series 2024 A, Rev., 5.00%, 1/1/2038 | | |
Lake County Community Consolidated School District No. 3 Beach Park GO, AGM, 4.00%, 2/1/2032 | | |
Sales Tax Securitization Corp., Second Lien Series 2020A, Rev., 4.00%, 1/1/2040 | | |
Sales Tax Securitization Corp., Senior Lien Series 2023C, Rev., 5.00%, 1/1/2033 | | |
Southern Illinois University | | |
Series 2022A, Rev., 5.00%, 4/1/2029 | | |
Series 2022A, Rev., 5.00%, 4/1/2030 | | |
Series 2022A, Rev., 5.00%, 4/1/2031 | | |
Series 2022A, Rev., 5.00%, 4/1/2032 | | |
| | |
| | |
Series 2018A, GO, 5.00%, 10/1/2024 | | |
Series 2023D, GO, 5.00%, 7/1/2025 | | |
Series 2017D, GO, 5.00%, 11/1/2025 | | |
Series 2017 A, GO, 5.00%, 12/1/2026 | | |
Series 2022A, GO, 5.00%, 3/1/2029 | | |
Series 2018B, GO, 5.00%, 10/1/2029 | | |
| | |
SEE NOTES TO FINANCIAL STATEMENTS.
| J.P. Morgan Exchange-Traded Funds | |
SCHEDULE OF PORTFOLIO INVESTMENTSAS OF February 29, 2024 (continued)
| | |
Municipal Bonds — continued |
|
Series 2020B, GO, 4.00%, 10/1/2033 | | |
Series 2018A, GO, 5.00%, 10/1/2033 | | |
Series 2023B, GO, 5.50%, 5/1/2047 | | |
Series 2023B, GO, 4.50%, 5/1/2048 | | |
University of Illinois, Auxiliary Facilities System Series 2021A, Rev., 5.00%, 4/1/2029 | | |
Village of Bolingbrook Series 2018A, GO, AGM, 5.00%, 1/1/2033 | | |
Village of Wilmette Series 2020B, GO, 5.00%, 12/1/2026 | | |
Will County School District No. 86 Joliet Series 2024, GO, 5.00%, 3/1/2043 | | |
| | |
|
Ball State University, Student Fee Series R, Rev., 5.00%, 7/1/2024 | | |
City of Goshen, Multi-Family, Green Oaks of Goshen Project Series 2021A, Rev., 5.00%, 8/1/2041 (e) | | |
City of Valparaiso Rev., 5.38%, 12/1/2041 (e) | | |
Decatur County, Jail Building Corp. Rev., 5.00%, 7/15/2028 | | |
Indiana Finance Authority Series 2016C, Rev., 5.00%, 12/1/2025 | | |
Indiana Finance Authority, CHF- Tippecanoe LLC- Student Housing Project | | |
Series 2023A, Rev., 5.00%, 6/1/2038 | | |
Series 2023A, Rev., 5.00%, 6/1/2043 | | |
Series 2023A, Rev., 5.00%, 6/1/2053 | | |
Indiana Finance Authority, CWA Authority Project Series 2023A, Rev., 5.00%, 10/1/2037 | | |
Indiana Finance Authority, DePauw University Series 2022A, Rev., 5.00%, 7/1/2031 | | |
Indiana Finance Authority, Franciscan Alliance, Inc., Obligated Group | | |
Series 2008-J, Rev., VRDO, LOC : Barclays Bank plc, 2.85%, 3/1/2024 (c) | | |
Series 2017C, Rev., 4.00%, 11/1/2034 | | |
Indiana Finance Authority, Rose-Hulman Institute of Technology Project Rev., 5.00%, 6/1/2030 | | |
| | |
|
|
Indiana Housing and Community Development Authority, Vita of New Whiteland Project Rev., 6.75%, 1/1/2043 | | |
Indiana State University, Housing and Dining System Rev., 5.00%, 4/1/2031 | | |
Perry Township Multi School Building Corp., Ad Valorem Property Tax First Mortgage Rev., 5.00%, 7/15/2025 | | |
Vinton-Tecumseh School Building Corp., Ad Valorem Property Tax | | |
| | |
| | |
Wheeler-Union Township School Building Corp. Rev., 4.00%, 7/15/2034 | | |
| | |
|
Cedar Rapids Community School District Infrastructure Sales Services and Use Tax | | |
Series 2023, Rev., AGM, 5.00%, 7/1/2035 | | |
Series 2023, Rev., AGM, 5.00%, 7/1/2036 | | |
City of West Des Moines, Urban Renewal Series 2016B, GO, 5.00%, 6/1/2024 | | |
Des Moines Independent Community School District, Sales Services and Use Tax Rev., 5.00%, 6/1/2028 | | |
Iowa Finance Authority, State Revolving Fund Rev., 5.00%, 8/1/2027 | | |
Iowa Student Loan Liquidity Corp., Student Loan | | |
Series 2023B, Rev., AMT, 5.00%, 12/1/2026 | | |
Series 2023B, Rev., AMT, 5.00%, 12/1/2027 | | |
| | |
|
City of Topeka, Kansas Health Care Facilities | | |
Series 2022B, Rev., 5.13%, 12/1/2026 | | |
Series 2022A, Rev., 5.75%, 12/1/2033 | | |
Johnson County Community College Foundation, Inc. COP, 5.00%, 10/1/2024 | | |
Johnson County Water District No. 1 Series 2017A, Rev., 5.00%, 1/1/2025 | | |
SEE NOTES TO FINANCIAL STATEMENTS.
| J.P. Morgan Exchange-Traded Funds | |
| | |
Municipal Bonds — continued |
|
Kansas Development Finance Authority, AdventHealth Series 2021B, Rev., 5.00%, 11/15/2031 (c) | | |
University of Kansas Hospital Authority, Health System Rev., VRDO, LOC : US Bank NA, 2.95%, 3/1/2024 (c) | | |
| | |
|
County of Boone, Duke Energy Kentucky, Inc. Series 2008A, Rev., 3.70%, 8/1/2027 | | |
Kentucky Economic Development Finance Authority, Baptist Healthcare System Obligated Group Series 2017B, Rev., 5.00%, 8/15/2029 | | |
Kentucky Public Energy Authority Series 2023 A-1, Rev., 5.25%, 2/1/2032 (c) | | |
Louisville and Jefferson County Metropolitan Government, Norton Healthcare, Inc. Series 2016A, Rev., 4.00%, 10/1/2036 | | |
Louisville and Jefferson County Metropolitan Sewer District, Sewer and Drainage System Series 2017B, Rev., 5.00%, 5/15/2024 | | |
University of Kentucky, General Receipts Series 2015A, Rev., 4.00%, 4/1/2038 | | |
| | |
|
Louisiana Local Government Environmental Facilities and Community Development Authority, Calcasieu Parish Projects Rev., 5.00%, 12/1/2030 | | |
Louisiana Public Facilities Authority, Materra Campus Project Series 2021C, Rev., 4.00%, 6/1/2031 (e) | | |
Parish of St. John the Baptist, Marathon Oil Corp., Project Series 2017A-1, Rev., 4.05%, 7/1/2026 (c) | | |
State of Louisiana Series 2016-B, GO, 4.00%, 8/1/2026 | | |
State of Louisiana Gasoline and Fuels Tax Series A, Rev., 4.50%, 5/1/2025 (b) | | |
State of Louisiana Gasoline and Fuels Tax, Second Lien Series 2023A-1, Rev., VRDO, LOC : TD Bank NA, 3.65%, 3/1/2024 (c) | | |
| | |
| | |
|
|
Maine Health and Higher Educational Facilities Authority, Mainehealth | | |
Series 2023A, Rev., AGM, 5.00%, 7/1/2038 | | |
Series 2023A, Rev., AGM, 5.00%, 7/1/2039 | | |
Maine Municipal Bond Bank Series C, Rev., 5.00%, 11/1/2024 | | |
Maine Turnpike Authority Rev., 4.00%, 7/1/2040 | | |
| | |
|
County of Anne Arundel Series 2022, GO, 5.00%, 10/1/2035 | | |
County of Baltimore, Consolidated Public Improvement Series 2020, GO, 5.00%, 3/1/2025 | | |
County of St. Mary's, Public Improvement GO, 4.00%, 7/15/2027 | | |
Maryland Health and Higher Educational Facilities Authority, Pooled Loan Program Series 1985B, Rev., VRDO, LOC : TD Bank NA, 3.40%, 3/11/2024 (c) | | |
Maryland Health and Higher Educational Facilities Authority, University of Maryland Medical System Series 2008D, Rev., VRDO, LOC : TD Bank NA, 3.65%, 3/1/2024 (c) | | |
State of Maryland, Department of Transportation Rev., 5.00%, 9/1/2026 | | |
State of Maryland, State and Local Facilities Loan of 2017 | | |
Series 2017A, GO, 5.00%, 8/1/2025 | | |
Series 2017B, GO, 5.00%, 8/1/2026 | | |
State of Maryland, State and Local Facilities Loan of 2021 Series 2021A, GO, 5.00%, 3/1/2031 | | |
State of Maryland, State and Local Facilities Loan of 2022 Series 2022A, GO, 5.00%, 6/1/2033 | | |
Town of Ocean City Series 2023, GO, 4.00%, 1/15/2043 | | |
| | |
|
City of Brockton GO, 4.00%, 8/1/2047 | | |
Commonwealth of Massachusetts | | |
Series 2024A, GO, 5.00%, 1/1/2041 | | |
SEE NOTES TO FINANCIAL STATEMENTS.
| J.P. Morgan Exchange-Traded Funds | |
SCHEDULE OF PORTFOLIO INVESTMENTSAS OF February 29, 2024 (continued)
| | |
Municipal Bonds — continued |
Massachusetts — continued |
Series 2024 A, GO, 5.00%, 3/1/2041 | | |
Series 2024B, GO, 5.00%, 11/1/2041 | | |
Series 2020 E, GO, 5.00%, 11/1/2050 | | |
Series 2023 D, GO, 5.00%, 10/1/2051 | | |
Series 2023A, GO, 5.00%, 5/1/2053 | | |
Massachusetts Development Finance Agency, Boston Medical Center Issue | | |
Series 2023G, Rev., 5.00%, 7/1/2029 | | |
Series 2023G, Rev., 4.38%, 7/1/2052 | | |
Series 2023G, Rev., 5.25%, 7/1/2052 | | |
Massachusetts Development Finance Agency, Mass General Brigham Series 2024 E-2, Rev., VRDO, LOC : Royal Bank of Canada, 2.75%, 3/1/2024 (c) | | |
Massachusetts Development Finance Agency, Milford Regional Medical Center Series 2020G, Rev., 5.00%, 7/15/2037 (e) | | |
Massachusetts Development Finance Agency, Salem Community Corp. Rev., 5.00%, 1/1/2030 | | |
Massachusetts State College Building Authority Series 2017D, Rev., 5.00%, 5/1/2027 | | |
| | |
Series 2023, GO, 4.00%, 12/1/2045 | | |
Series 2023, GO, 4.00%, 12/1/2046 | | |
Series 2023, GO, 4.00%, 12/1/2051 | | |
Town of Hopkinton, Municipal Purpose Loan GO, 5.00%, 11/15/2024 | | |
| | |
|
Berrien Springs Public Schools, School Building and Site, Unlimited Tax GO, Q-SBLF, 5.00%, 5/1/2030 | | |
| | |
| | |
| | |
City of Detroit, Unlimited Tax | | |
Series 2021A, GO, 5.00%, 4/1/2031 | | |
Series 2023C, GO, 6.00%, 5/1/2043 | | |
Series 2021A, GO, 5.00%, 4/1/2046 | | |
| | |
Series 2023, GO, 5.00%, 5/1/2041 | | |
Series 2023, GO, 5.00%, 5/1/2042 | | |
| | |
|
|
Grand Traverse County Hospital Finance Authority, Munson Healthcare Obligated Group Rev., 5.00%, 7/1/2026 | | |
Great Lakes Water Authority Sewage Disposal System, Second Lien Series 2023A, Rev., 5.00%, 7/1/2038 | | |
Lansing Board of Water and Light Series 2024 A, Rev., 5.00%, 7/1/2049 | | |
Michigan State Building Authority, Facilities Program Series 2023-II, Rev., 4.00%, 10/15/2047 | | |
State of Michigan Trunk Line Series 2021A, Rev., 4.00%, 11/15/2036 | | |
| | |
|
| | |
Series 2022B, GO, 5.00%, 2/1/2027 | | |
Series 2022B, GO, 5.00%, 2/1/2029 | | |
City of Minneapolis, Health Care System, Fairview Health Services Series 2018A, Rev., 5.00%, 11/15/2033 | | |
County of Hennepin Series 2023 A, GO, 5.00%, 12/1/2034 | | |
Duluth Economic Development Authority, Benedictine Health System Series 2021A, Rev., 3.00%, 7/1/2024 | | |
Metropolitan Council, Minneapolis St. Paul Metropolitan Area Series 2023C, GO, 4.00%, 3/1/2041 | | |
Minnesota Housing Finance Agency Series 2023F, Rev., GNMA / FNMA / FHLMC, 5.75%, 7/1/2053 | | |
Minnesota Municipal Gas Agency Subseries, 2022A, Rev., LIQ : Royal Bank of Canada, 4.00%, 6/1/2027 | | |
State of Minnesota, Various Purpose Series 2020A, GO, 5.00%, 8/1/2030 | | |
| | |
|
Mississippi Development Bank, Ranking County Project Rev., 5.00%, 3/1/2026 | | |
SEE NOTES TO FINANCIAL STATEMENTS.
| J.P. Morgan Exchange-Traded Funds | |
| | |
Municipal Bonds — continued |
|
Mississippi State University Educational Building Corp., New Facilities and Refinancing Project Rev., 5.00%, 8/1/2025 | | |
State of Mississippi Series 2016B, GO, 5.00%, 12/1/2025 | | |
| | |
|
Bi-State Development Agency of the Missouri-Illinois Metropolitan District, St. Clair County Metrolink Project Rev., AGM, 5.25%, 7/1/2024 | | |
City of Excelsior Springs Series 2020B, COP, 4.00%, 3/1/2030 | | |
Health and Educational Facilities Authority of the State of Missouri | | |
| | |
| | |
Health and Educational Facilities Authority of the State of Missouri, Lake Regional Health System Rev., 5.00%, 2/15/2027 | | |
Health and Educational Facilities Authority of the State of Missouri, Lutheran Senior Services Projects Series 2016A, Rev., 5.00%, 2/1/2036 | | |
Health and Educational Facilities Authority of the State of Missouri, Mercy Health Series 2018A, Rev., 5.00%, 6/1/2028 | | |
Health and Educational Facilities Authority of the State of Missouri, St. Luke's Episcopal-Presbyterian Hospitals Series 2015B, Rev., 5.00%, 12/1/2026 | | |
Health and Educational Facilities Authority of the State of Missouri, Wright Memorial Hospital Rev., 5.00%, 9/1/2026 | | |
Metropolitan St. Louis Sewer District, Wastewater System Improvement Series 2017A, Rev., 5.00%, 5/1/2027 | | |
Missouri Housing Development Commission, Single Family, First Place Homeownership Loan Program Series 2024 A, Rev., GNMA / FNMA / FHLMC, 5.75%, 5/1/2055 (d) | | |
Springfield School District No. R-12 GO, 4.00%, 3/1/2042 | | |
| | |
| | |
|
|
Yellowstone and Carbon Counties School District No. 7-70 Laurel Series 2023, GO, 5.00%, 7/1/2039 | | |
|
Central Plains Energy Project, Gas Project No. 3 Series 2017A, Rev., 5.00%, 9/1/2030 | | |
Central Plains Energy Project, Gas Project No. 5 Series 2022-1, Rev., 5.00%, 10/1/2029 (c) | | |
City of Lincoln, Electric System | | |
| | |
| | |
Omaha Public Power District, Electric System | | |
Series 2016A, Rev., 5.00%, 2/1/2026 | | |
Series 2016A, Rev., 5.00%, 2/1/2027 | | |
Series 2016A, Rev., 5.00%, 2/1/2028 | | |
| | |
|
Clark County School District, Limited Tax | | |
Series 2018A, GO, 5.00%, 6/15/2032 | | |
Series 2018A, GO, 4.00%, 6/15/2035 | | |
Clark County Water Reclamation District Series 2023, GO, 5.00%, 7/1/2043 | | |
County of Clark Department of Aviation, Jet Aviation Fuel tax Series 2022A, Rev., AMT, 5.00%, 7/1/2026 | | |
County of Clark, Limited Tax Series 2018B, GO, 5.00%, 12/1/2027 | | |
County of Clark, Passenger Facility Charge, Las Vegas-McCarran International Airport Passenger Facility Series 2019E, Rev., 5.00%, 7/1/2033 | | |
Nye County School District Series 2023, GO, PSF-GTD, 5.00%, 5/1/2036 | | |
Truckee Meadows Water Authority Rev., 5.00%, 7/1/2029 | | |
| | |
|
New Hampshire Business Finance Authority, Springpoint Senior Living Project Rev., 4.00%, 1/1/2025 | | |
New Hampshire Business Finance Authority, University of Nevada Reno Project | | |
Series 2023A, Rev., 5.00%, 12/1/2036 | | |
Series 2023A, Rev., 5.00%, 12/1/2037 | | |
SEE NOTES TO FINANCIAL STATEMENTS.
| J.P. Morgan Exchange-Traded Funds | |
SCHEDULE OF PORTFOLIO INVESTMENTSAS OF February 29, 2024 (continued)
| | |
Municipal Bonds — continued |
New Hampshire — continued |
Series 2023A, Rev., 5.00%, 12/1/2038 | | |
Series 2023A, Rev., 5.25%, 12/1/2039 | | |
Series 2023A, Rev., 5.25%, 6/1/2051 | | |
Series 2023A, Rev., 4.50%, 6/1/2053 | | |
| | |
|
Borough of North Haledon GO, BAN, 4.50%, 6/26/2024 | | |
Burlington County Bridge Commission, Government Leasing Program Series C, Rev., 4.50%, 8/7/2024 | | |
City of New Brunswick GO, 4.00%, 3/15/2024 | | |
New Jersey Economic Development Authority, School Facilities Construction Series 2024SSS, Rev., 5.00%, 6/15/2026 (d) | | |
New Jersey Transportation Trust Fund Authority, Transportation Program Series 2023 BB, Rev., 5.25%, 6/15/2050 | | |
New Jersey Transportation Trust Fund Authority, Transportation System | | |
Series 2018A, Rev., 4.00%, 12/15/2031 | | |
Series 2018A, Rev., 5.00%, 12/15/2033 | | |
New Jersey Turnpike Authority Series 2022B, Rev., 5.00%, 1/1/2042 | | |
Township of Raritan GO, BAN, 4.50%, 4/29/2024 | | |
| | |
|
Albuquerque Municipal School District No. 12 Series 2023B, GO, 5.00%, 8/1/2024 | | |
City of Albuquerque Series 2015A, Rev., 5.00%, 7/1/2026 | | |
Loving Municipal School District No. 10 Series 2023, GO, 5.00%, 9/15/2024 | | |
New Mexico Finance Authority, Senior Lien Public Project Revolving Fund Series 2016E, Rev., 5.00%, 6/1/2024 | | |
New Mexico Finance Authority, State Transportation, Subordinate Lien Series 2018A, Rev., 5.00%, 6/15/2027 | | |
State of New Mexico, Capital Projects GO, 5.00%, 3/1/2024 | | |
| | |
| | |
|
|
Build NYC Resource Corp., Kipp NYC Public School Facilities - Canal West Project | | |
| | |
| | |
City of New York, Fiscal Year 2006 Series 2006, Subseries I-4, GO, VRDO, LOC : TD Bank NA, 3.65%, 3/1/2024 (c) | | |
City of New York, Fiscal Year 2018 | | |
Series 2018E, GO, VRDO, LOC : TD Bank NA, 3.65%, 3/1/2024 (c) | | |
Series 2018F-1, GO, 5.00%, 4/1/2033 | | |
City of New York, Fiscal Year 2019 Series 2019E, GO, 5.00%, 8/1/2033 | | |
City of New York, Fiscal Year 2020 Series 2020C-1, GO, 5.00%, 8/1/2033 | | |
City of New York, Fiscal Year 2021 | | |
Series 2021A-1, GO, 5.00%, 8/1/2031 | | |
Series 2021-1, GO, 5.00%, 4/1/2033 | | |
Series 2021F, Subseries F-1, GO, 5.00%, 3/1/2037 | | |
City of New York, Fiscal Year 2022 Series 2022B,Subseries B-1, GO, 5.00%, 8/1/2033 | | |
City of New York, Fiscal Year 2023 Series 2023E, Subseries E-1, GO, 4.00%, 4/1/2050 | | |
City of New York, Fiscal Year 2024 Series 2024A, GO, 4.13%, 8/1/2053 | | |
Malone Central School District GO, BAN, 4.50%, 6/27/2024 | | |
Metropolitan Transportation Authority Series 2015 E-1, Rev., VRDO, LOC : Barclays Bank plc, 3.78%, 3/1/2024 (c) | | |
New York City Municipal Water Finance Authority, Water and Sewer System Series 2019FF-1, Rev., 4.00%, 6/15/2049 | | |
New York City Municipal Water Finance Authority, Water and Sewer System, Second General Resolution Series DD-1, Rev., VRDO, LIQ : TD Bank NA, 3.65%, 3/1/2024 (c) | | |
New York City Municipal Water Finance Authority, Water and Sewer System, Second General Resolution, Fiscal Year 2020 Series 2022FF, Rev., 4.00%, 6/15/2041 | | |
SEE NOTES TO FINANCIAL STATEMENTS.
| J.P. Morgan Exchange-Traded Funds | |
| | |
Municipal Bonds — continued |
|
New York City Municipal Water Finance Authority, Water and Sewer System, Second General Resolution, Fiscal Year 2023 | | |
Series 2023CC, Rev., VRDO, LIQ : Barclays Bank plc, 2.85%, 3/1/2024 (c) | | |
Series 2023, Subseries AA-3, Rev., 5.00%, 6/15/2047 | | |
Series 2023AA Subseries AA-1, Rev., 5.25%, 6/15/2052 | | |
New York City Municipal Water Finance Authority, Water and Sewer System, Second General Resolution, Fiscal Year 2024 Series 2024, Subseries AA-1, Rev., 5.25%, 6/15/2053 | | |
New York City Transitional Finance Authority Building Aid, Subordinate Series 2019 S-2A, Rev., 5.00%, 7/15/2025 (b) | | |
New York City Transitional Finance Authority Building Aid, Subordinate, Fiscal Year 2020 Series 2020S1, Subseries S-1B, Rev., 4.00%, 7/15/2042 | | |
New York City Transitional Finance Authority Building Aid, Subordinate, Fiscal Year 2023 Series 2023, Subseries S-1A, Rev., 5.00%, 7/15/2035 | | |
New York City Transitional Finance Authority, Building Aid, Fiscal Year 2018 Series 2018S-4A, Rev., 5.00%, 7/15/2033 | | |
New York City Transitional Finance Authority, Future Tax Secured, Fiscal Year 2014 Series D-3, Rev., VRDO, LIQ : Mizuho Bank Ltd., 2.85%, 3/1/2024 (c) | | |
New York City Transitional Finance Authority, Future Tax Secured, Fiscal Year 2017 Series 2017F-1, Rev., 5.00%, 5/1/2030 | | |
New York City Transitional Finance Authority, Future Tax Secured, Fiscal Year 2020 Series 2020A, Subseries A-2, Rev., 5.00%, 5/1/2039 | | |
New York City Transitional Finance Authority, Future Tax Secured, Fiscal Year 2021 Series 2021C, Subseries C-1, Rev., 4.00%, 5/1/2035 | | |
New York City Transitional Finance Authority, Future Tax Secured, Fiscal Year 2022 Series 2022B, Subseries B-1, Rev., 4.00%, 8/1/2045 | | |
| | |
|
|
New York City Transitional Finance Authority, Future Tax Secured, Fiscal Year 2023 Series 2023F, Subseries F-1, Rev., 4.00%, 2/1/2051 | | |
New York City Transitional Finance Authority, Future Tax Secured, Fiscal Year 2024 | | |
Series 2024C, Rev., 5.25%, 5/1/2048 | | |
Series 2024F, Subseries F-1, Rev., 5.25%, 2/1/2053 | | |
Series 2024C, Rev., 5.00%, 5/1/2053 | | |
Series 2024F, Subseries F-1, Rev., 4.25%, 2/1/2054 | | |
New York City Transitional Finance Authority, Future Tax Secured, Tax-Exempt, Fiscal Year 2022 Series 2022F, SubseriesF-1, Rev., 5.00%, 2/1/2036 | | |
New York Power Authority, Green Transmission Project | | |
Series 2023 A, Rev., AGM, 5.00%, 11/15/2053 | | |
Series 2023 A, Rev., AGM, 5.13%, 11/15/2058 | | |
New York State Dormitory Authority, Cornell University Series 2019D, Rev., 5.00%, 7/1/2033 | | |
New York State Dormitory Authority, Northwell Health Obligated Group Series 2019A, Rev., 5.00%, 5/1/2029 | | |
New York State Dormitory Authority, Personal Income Tax | | |
Series 2019D, Rev., 5.00%, 2/15/2034 | | |
Series 2015B, Rev., 5.00%, 2/15/2035 | | |
Series 2021A, Rev., 4.00%, 3/15/2037 | | |
Series 2021E, Rev., 4.00%, 3/15/2040 | | |
New York State Dormitory Authority, State Personal Income Tax, General Purpose Series 2021 E, Rev., 4.00%, 3/15/2042 | | |
New York State Dormitory Authority, State Supported Debt University Facilities Series 2019A, Rev., 5.00%, 7/1/2024 | | |
New York State Housing Finance Agency, 160 Madison Avenue LLC Series 2013A, Rev., VRDO, LOC : Landesbank Hessen-Thuringen Girozentrale, 3.55%, 3/1/2024 (c) | | |
SEE NOTES TO FINANCIAL STATEMENTS.
| J.P. Morgan Exchange-Traded Funds | |
SCHEDULE OF PORTFOLIO INVESTMENTSAS OF February 29, 2024 (continued)
| | |
Municipal Bonds — continued |
|
New York State Urban Development Corp., State Personal Income Tax, General Purpose | | |
Series 2017A, Rev., 5.00%, 3/15/2027 (b) | | |
Series 2020A, Rev., 4.00%, 3/15/2045 | | |
Series 2023A, Rev., 5.00%, 3/15/2057 | | |
New York State Urban Development Corp., State Sales Tax Series 2021A, Rev., 4.00%, 3/15/2046 | | |
New York Transportation Development Corp., Delta Air Lines, Inc., LaGuardia Airport Terminals C&D Redevelopment Project | | |
Series 2018, Rev., AMT, 5.00%, 1/1/2030 | | |
Series 2018, Rev., AMT, 5.00%, 1/1/2031 | | |
Series 2023, Rev., AMT, 6.00%, 4/1/2035 | | |
Series 2023, Rev., AMT, 5.63%, 4/1/2040 | | |
New York Transportation Development Corp., JFK International Airport New Terminal One Project Series 2023, Rev., AMT, AGM, 5.00%, 6/30/2049 | | |
Onondaga Civic Development Corp., Le Moyne College Project | | |
| | |
Series 2020B, Rev., 5.00%, 7/1/2032 | | |
Port Authority of New York and New Jersey, Consolidated | | |
Series 214, Rev., AMT, 5.00%, 9/1/2036 | | |
Series 223, Rev., AMT, 4.00%, 7/15/2037 | | |
Port Washington Union Free School District GO, 4.00%, 8/1/2036 | | |
Smithtown Central School District | | |
| | |
| | |
| | |
Suffolk Tobacco Asset Securitization Corp. Series 2021 A-2, Rev., 5.00%, 6/1/2033 | | |
Syracuse Industrial Development Agency, Syracuse City School District Project Series 2020A, Rev., 4.00%, 5/1/2036 | | |
Town of Stony Point GO, 5.00%, 8/15/2027 | | |
| | |
|
|
Triborough Bridge and Tunnel Authority Sales Tax Series 2024ASUB A-1, Rev., 5.00%, 5/15/2046 | | |
Triborough Bridge and Tunnel Authority Sales Tax, TBTA Capital Lockbox Series 2023A, Rev., 4.13%, 5/15/2053 | | |
Triborough Bridge and Tunnel Authority, Payroll Mobility Tax Series 2022D-1A, Rev., 5.00%, 11/15/2037 | | |
Tully Central School District GO, BAN, 4.50%, 6/27/2024 | | |
Westchester County Local Development Corp., Kendal on Hudson Project Series 2022B, Rev., 5.00%, 1/1/2032 | | |
Westchester County Local Development Corp., Purchase Senior Learning Community, Inc. Project | | |
Series 2021D, Rev., 2.88%, 4/1/2024 (e) | | |
Series 2021C-EFRB, Rev., 3.20%, 7/1/2028 (e) | | |
Yonkers Industrial Development Agency, New Community School Project Rev., 5.00%, 5/1/2042 | | |
| | |
|
City of Charlotte Series 2023B, Rev., AMT, 5.00%, 7/1/2048 | | |
City of Charlotte, North Carolina Government Facilities | | |
Series 2023B, COP, 5.00%, 6/1/2026 | | |
Series 2023B, COP, 5.00%, 6/1/2027 | | |
| | |
Series 2023, Rev., 5.00%, 4/1/2034 | | |
Series 2023, Rev., 5.00%, 4/1/2036 | | |
| | |
Series 2024, Rev., 5.00%, 10/1/2035 (d) | | |
Series 2024, Rev., 5.00%, 10/1/2036 (d) | | |
County of Davidson GO, 5.00%, 6/1/2027 | | |
County of Wayne, Limited Obligation Rev., 5.00%, 6/1/2024 | | |
State of North Carolina, Build NC Programs, Limited Obligation | | |
Series 2014C, Rev., 5.00%, 5/1/2024 | | |
Series 2020B, Rev., 5.00%, 5/1/2029 | | |
SEE NOTES TO FINANCIAL STATEMENTS.
| J.P. Morgan Exchange-Traded Funds | |
| | |
Municipal Bonds — continued |
North Carolina — continued |
University of North Carolina, Hospital at Chapel Hill Series A, Rev., VRDO, LIQ : TD Bank NA, 3.65%, 3/1/2024 (c) | | |
Water and Sewer Authority of Cabarrus County Series 2024, Rev., 4.00%, 6/1/2049 | | |
| | |
|
| | |
Series 2023A, Rev., AGM, 5.00%, 12/1/2039 | | |
Series 2023A, Rev., AGM, 5.00%, 12/1/2040 | | |
North Dakota Housing Finance Agency, Home Mortgage Finance Program | | |
Series 2017H, Rev., VRDO, LIQ : Royal Bank of Canada, 3.30%, 3/11/2024 (c) | | |
Series 2023A, Rev., 5.75%, 7/1/2053 | | |
| | |
|
Bowling Green State University, General Receipts Series 2016A, Rev., 5.00%, 6/1/2024 | | |
Buckeye Tobacco Settlement Financing Authority Series 2020B-2, Class 2, Rev., 5.00%, 6/1/2055 | | |
City of Cleveland Series 2022A, GO, 5.00%, 12/1/2035 | | |
County of Franklin, Ohio Hospital Facilities Series 2009A, Rev., VRDO, LIQ : Barclays Bank plc, 3.40%, 3/11/2024 (c) | | |
County of Summit, Various Purpose Improvement Series 2022, GO, 5.00%, 12/1/2031 | | |
County of Warren, Healthcare Facilities, Otterbein Homes Obligated Group Series 2019A, Rev., 4.00%, 7/1/2033 | | |
Jefferson County Port Authority, JSW Steel USA Ohio, Inc., Project Series 2023, Rev., 5.00%, 12/1/2028 (c) (e) | | |
Northeast Ohio Medical University Series 2022, Rev., 5.00%, 12/1/2035 | | |
Ohio Air Quality Development Authority, Duke Energy Corp. | | |
Series 2022B, Rev., 4.00%, 6/1/2027 (c) | | |
| | |
|
|
Series 2022A, Rev., AMT, 4.25%, 6/1/2027 (c) | | |
Ohio Higher Educational Facility Commission, Denison University 2017 Project Series 2017A, Rev., 5.00%, 11/1/2025 | | |
Ohio Higher Educational Facility Commission, John Carroll university Rev., 4.00%, 10/1/2034 | | |
Ohio State University (The), General Receipts Series 2023A-2, Rev., VRDO, 3.40%, 3/11/2024 (c) | | |
Ohio Turnpike and Infrastructure Commission, Junior Lien Series 2018A, Rev., 5.00%, 2/15/2027 | | |
Ohio Water Development Authority | | |
Series 2016B, Rev., 5.00%, 6/1/2026 | | |
Series 2023A, Rev., 5.00%, 12/1/2036 | | |
Ohio Water Development Authority, Drinking Water Assistance Fund Series 2022A, Rev., 5.00%, 12/1/2041 | | |
Ohio Water Development Authority, Water Pollution Control Loan Fund | | |
Series 2017A, Rev., 5.00%, 12/1/2026 | | |
Series 2023B, Rev., 5.00%, 12/1/2038 | | |
Series 2020 A, Rev., 5.00%, 12/1/2050 | | |
State of Ohio Series 2021B, GO, 5.00%, 9/15/2031 | | |
State of Ohio, Capital Facilities Lease Appropriation, Administrative Building Fund Projects, Tax Exempt Series 2018A, Rev., 5.00%, 10/1/2034 | | |
State of Ohio, Natural Resources Series 2017V, GO, 5.00%, 10/1/2027 | | |
Youngstown State University, General Receipts Rev., AGM, 4.00%, 12/15/2030 | | |
| | |
|
Oklahoma Capitol Improvement Authority Series 2014A, Rev., 5.00%, 7/1/2025 | | |
Oklahoma Capitol Improvement Authority, State Highway, Capital Improvement Rev., 5.00%, 7/1/2024 | | |
SEE NOTES TO FINANCIAL STATEMENTS.
| J.P. Morgan Exchange-Traded Funds | |
SCHEDULE OF PORTFOLIO INVESTMENTSAS OF February 29, 2024 (continued)
| | |
Municipal Bonds — continued |
|
Oklahoma Water Resources Board, State Loan Program | | |
Series 2024 A, Rev., 5.00%, 10/1/2037 | | |
Series 2023A, Rev., 4.00%, 10/1/2043 | | |
| | |
|
Salem Hospital Facility Authority, Multi Model, Salem Health Project Series 2019A, Rev., 5.00%, 5/15/2028 | | |
Tri-County Metropolitan Transportation District of Oregon, Senior Lien Payroll Tax | | |
Series 2018A, Rev., 5.00%, 9/1/2027 (b) | | |
Series 2021A, Rev., 5.00%, 9/1/2035 | | |
Union County Hospital Facility Authority, Grande Ronde Hospital, Inc. | | |
Series 2022, Rev., 5.00%, 7/1/2026 | | |
Series 2022, Rev., 5.00%, 7/1/2028 | | |
| | |
|
Aliquippa School District, Limited Tax GO, 3.88%, 12/1/2037 | | |
Allegheny County Airport Authority, Pittsburgh International Airport | | |
Series 2023A, Rev., AMT, AGM, 5.50%, 1/1/2048 | | |
Series 2023A, Rev., AMT, AGM, 5.50%, 1/1/2053 | | |
Allegheny County Higher Education Building Authority, Carnegie Mellon University Series 2008A, Rev., VRDO, LIQ : Bank of New York Mellon (The), 3.00%, 3/1/2024 (c) | | |
Allegheny County Higher Education Building Authority, University Refunding Duquesne University | | |
Series 2014A, Rev., 5.00%, 3/1/2024 | | |
Series 2024, Rev., 5.00%, 3/1/2043 | | |
Berks County Industrial Development Authority, The Highlands at Wyomissing Series 2017A, Rev., 5.00%, 5/15/2037 | | |
Bucks County Water and Sewer Authority | | |
Series 2022A, Rev., AGM, 5.00%, 12/1/2032 | | |
Series 2022A, Rev., AGM, 5.00%, 12/1/2033 | | |
| | |
|
|
Series 2022A, Rev., AGM, 5.00%, 12/1/2036 | | |
City of Philadelphia, Airport System Series 2017B, Rev., AMT, 5.00%, 7/1/2035 | | |
Commonwealth Financing Authority, Tobacco Master Settlement Payment Rev., 5.00%, 6/1/2035 | | |
Commonwealth of Pennsylvania Series 1, GO, 4.00%, 3/19/2024 | | |
County of Lehigh, Lehigh Valley Health Network Hospital Series 2016A, Rev., 4.00%, 7/1/2035 | | |
Delaware Valley Regional Finance Authority, Local Government Series 2022D, Rev., 4.00%, 3/1/2029 | | |
Geisinger Authority, Health System Series 2020B, Rev., 5.00%, 2/15/2027 (c) | | |
Montgomery County Higher Education and Health Authority, Thomas Jefferson University | | |
| | |
Series 2018A, Rev., 4.00%, 9/1/2038 | | |
Montgomery County Industrial Development Authority, Constellation Energy Generation Series 2023A, Rev., 4.10%, 4/3/2028 (c) | | |
Pennsylvania Economic Development Financing Authority, Junior Guaranteed, Capitol Region Parking System | | |
Series 2024 B, Rev., GTD, 4.25%, 1/1/2050 (d) | | |
Series 2024 B, Rev., GTD, 4.38%, 7/1/2053 (d) | | |
Pennsylvania Economic Development Financing Authority, Senior Insured, Capitol Region Parking System Series 2024 A, Rev., AGM, 4.00%, 1/1/2042 (d) | | |
Pennsylvania Economic Development Financing Authority, The Penndot Major Bridges Rev., AMT, AGM, 5.00%, 12/31/2057 | | |
Pennsylvania Economic Development Financing Authority, Waste Management, Inc. Project Series 2021A-2, Rev., 4.60%, 10/1/2026 (c) | | |
Pennsylvania Housing Finance Agency, Single Family Mortgage Series 2023-141A, Rev., 5.75%, 10/1/2053 | | |
SEE NOTES TO FINANCIAL STATEMENTS.
| J.P. Morgan Exchange-Traded Funds | |
| | |
Municipal Bonds — continued |
|
Pennsylvania Turnpike Commission | | |
Series A-1, Rev., 5.00%, 12/1/2029 | | |
Series A-1, Rev., 5.00%, 12/1/2031 | | |
Series 2016B, Rev., 4.00%, 6/1/2033 | | |
Series 2022A, Rev., 5.00%, 12/1/2033 | | |
Series 2022B, Rev., 5.25%, 12/1/2041 | | |
Pennsylvania Turnpike Commission, Subordinate Series 2023-1, Rev., 5.00%, 12/1/2036 | | |
Philadelphia Authority for Industrial Development, Holy Family University Project Rev., 5.00%, 9/1/2027 | | |
Philadelphia Energy Authority (The), Philadelphia Street Lighting Project | | |
Series 2023A, Rev., 5.00%, 11/1/2037 | | |
Series 2023A, Rev., 5.00%, 11/1/2038 | | |
Series 2023A, Rev., 5.00%, 11/1/2041 | | |
School District of Philadelphia (The) Series 2024A, Rev., RAN, 5.00%, 6/28/2024 | | |
Swarthmore Borough Authority Series 2023, Rev., 5.00%, 9/15/2053 | | |
| | |
| | |
| | |
| | |
| | |
University of Pittsburgh-of the Commonwealth System of Higher Education Series 2023 A, Rev., 5.00%, 2/15/2034 | | |
| | |
|
Puerto Rico Sales Tax Financing Corp. Sales Tax Series A-2, Rev., 4.78%, 7/1/2058 | | |
|
Rhode Island Health and Educational Building Corp., Lifespan Obligated Group | | |
Series 2024, Rev., 5.00%, 5/15/2036 | | |
Series 2024, Rev., 5.00%, 5/15/2038 | | |
Series 2024, Rev., 5.00%, 5/15/2042 | | |
Series 2024, Rev., 5.00%, 5/15/2043 | | |
State of Rhode Island and Providence Plantations Consolidated Capital Development Loan Series 2018A, GO, 5.00%, 4/1/2029 | | |
| | |
| | |
|
|
Charleston County Airport District Rev., 5.00%, 7/1/2035 | | |
County of Dorchester, Waterworks and Sewer System Series 2023, Rev., 4.25%, 10/1/2048 | | |
Horry County School District Series 2015A, GO, SCSDE, 4.00%, 3/1/2028 | | |
Patriots Energy Group Financing Agency Series 2023 SUB B-1, Rev., 5.25%, 3/1/2031 (c) | | |
| | |
|
South Dakota Housing Development Authority Series 2023J, Rev., GNMA / FNMA / FHLMC, 3.88%, 12/12/2024 (c) | | |
|
| | |
Series 2021A, Rev., 4.00%, 2/1/2041 | | |
Series 2021A, Rev., 4.00%, 2/1/2051 | | |
City of Knoxville, Wastewater System Series 2022B, Rev., 4.00%, 4/1/2045 | | |
City of Lenoir City, Electric System Series 2022, Rev., 5.00%, 6/1/2033 | | |
County of Coffee, Rural High School Series 2021A, GO, 5.00%, 6/1/2028 | | |
County of Sullivan GO, 5.00%, 5/1/2026 | | |
Johnson City Health and Educational Facilities Board, Ballad Health Series 2023A, Rev., 5.00%, 7/1/2024 | | |
Knox County Health Educational and Housing Facility Board, University of Tennessee Project | | |
Series 2024A-1, Rev., 5.00%, 7/1/2037 | | |
Series 2024A-1, Rev., 5.00%, 7/1/2038 | | |
Series 2024A-1, Rev., 5.00%, 7/1/2039 | | |
Series 2024A-1, Rev., 5.25%, 7/1/2049 | | |
Memphis-Shelby County Airport Authority Series 2021A, Rev., AMT, 5.00%, 7/1/2045 | | |
Metropolitan Government Nashville and Davidson County, Health and Educational Facilities Board, Belmont University | | |
| | |
Series 2023, Rev., 5.00%, 5/1/2038 | | |
Metropolitan Government of Nashville and Davidson County | | |
| | |
SEE NOTES TO FINANCIAL STATEMENTS.
| J.P. Morgan Exchange-Traded Funds | |
SCHEDULE OF PORTFOLIO INVESTMENTSAS OF February 29, 2024 (continued)
| | |
Municipal Bonds — continued |
|
Series 2024 A, Rev., 5.00%, 5/15/2038 | | |
Series 2024 A, Rev., 5.00%, 5/15/2039 | | |
Series 2024 A, Rev., 5.25%, 5/15/2049 | | |
Metropolitan Government of Nashville and Davidson County, Electric System Series 2014A, Rev., 5.00%, 5/15/2024 | | |
Metropolitan Nashville Airport Authority (The) | | |
Series 2022B, Rev., AMT, 5.25%, 7/1/2047 | | |
Series 2022B, Rev., AMT, 5.00%, 7/1/2052 | | |
Shelby County Health Educational and Housing Facilities Board, Methodist Le Bonheur Healthcare | | |
Series 2017A, Rev., 5.00%, 5/1/2024 | | |
Series 2017A, Rev., 5.00%, 5/1/2027 | | |
Shelby County Health Educational and Housing Facilities Board, The Farms at Bailey Station Project | | |
Series 2019A, Rev., 5.00%, 10/1/2029 | | |
Series 2019A, Rev., 5.50%, 10/1/2034 | | |
| | |
Series A, GO, 5.00%, 9/1/2024 (b) | | |
Series 2023A, GO, 5.00%, 5/1/2038 | | |
Tennessee Energy Acquisition Corp., Gas Project Series 2023A-1, Rev., 5.00%, 5/1/2028 (c) | | |
| | |
|
Aledo Independent School District, Unlimited Tax | | |
GO, PSF-GTD, 5.00%, 2/15/2042 | | |
GO, PSF-GTD, 5.00%, 2/15/2048 | | |
Arlington Higher Education Finance Corp., Trinity Basin Preparatory, Inc. | | |
Rev., PSF-GTD, 5.00%, 8/15/2026 | | |
Rev., PSF-GTD, 5.00%, 8/15/2027 | | |
Rev., PSF-GTD, 5.00%, 8/15/2028 | | |
Rev., PSF-GTD, 5.00%, 8/15/2029 | | |
Rev., PSF-GTD, 5.00%, 8/15/2030 | | |
Belton Independent School District, Unlimited Tax Series 2022, GO, PSF-GTD, 4.00%, 2/15/2052 | | |
Board of Regents of the University of Texas System, Financing System Series 2016D, Rev., 5.00%, 8/15/2024 | | |
| | |
|
|
Brushy Creek Regional Utility Authority, Inc., Brushy Creek Regional Water Treatment and Distribution Project Rev., 5.00%, 8/1/2026 | | |
City of Austin, Airport System | | |
Rev., AMT, 5.00%, 11/15/2035 | | |
Series 2017B, Rev., AMT, 5.00%, 11/15/2046 | | |
City of Corpus Christi, Utility System Series 2022B, Rev., 5.00%, 7/15/2032 | | |
City of Dallas Housing Finance Corp., Rosemont at Ash Creek Apartments Series 2023, Rev., FHA, 5.00%, 12/1/2025 (c) | | |
City of Georgetown Series 2022, GO, 4.00%, 8/15/2041 | | |
City of Georgetown, Utilities System | | |
Series 2023, Rev., 5.00%, 8/15/2025 | | |
Series 2023, Rev., 5.00%, 8/15/2038 | | |
City of Grand Prairie Series 2023, GO, 4.00%, 2/15/2037 | | |
City of Houston, Combined Utility System, First Lien Series 2018D, Rev., 5.00%, 11/15/2030 | | |
City of San Antonio, Electric and Gas Systems Series 2023B, Rev., 5.25%, 2/1/2041 | | |
City of San Marcos, Combination Tax GO, 5.00%, 8/15/2031 | | |
Clifton Higher Education Finance Corp., Yes Prep Public School, Inc. | | |
Series 2023, Rev., PSF-GTD, 5.00%, 4/1/2025 | | |
Series 2023, Rev., PSF-GTD, 5.00%, 4/1/2026 | | |
Series 2023, Rev., PSF-GTD, 5.00%, 4/1/2038 | | |
Series 2023, Rev., PSF-GTD, 4.25%, 4/1/2048 | | |
County of Hays, Limited Tax GO, 5.00%, 2/15/2026 | | |
County of Williamson, Limited Tax GO, 5.00%, 2/15/2026 | | |
Crandall Independent School District, Unlimited Tax | | |
Series 2023, GO, PSF-GTD, 5.00%, 2/1/2039 | | |
Series 2023, GO, PSF-GTD, 5.00%, 2/1/2041 | | |
SEE NOTES TO FINANCIAL STATEMENTS.
| J.P. Morgan Exchange-Traded Funds | |
| | |
Municipal Bonds — continued |
|
Series 2023, GO, PSF-GTD, 5.00%, 8/15/2053 | | |
Cypress-Fairbanks Independent School District, Unlimited Tax Series 2015A, GO, PSF-GTD, 5.00%, 2/15/2025 | | |
Dallas Area Rapid Transit, Sales Tax, Senior Lien Series 2014A, Rev., 5.00%, 12/1/2024 (b) | | |
Denton Independent School District Series 2023, GO, PSF-GTD, 5.00%, 8/15/2043 | | |
Garland Independent School District, Unlimited Tax, School Building Series 2023A, GO, PSF-GTD, 5.00%, 2/15/2040 | | |
Glen Rose Independent School District, Unlimited Tax | | |
Series 2023, GO, PSF-GTD, 5.00%, 8/15/2035 | | |
Series 2023, GO, PSF-GTD, 5.00%, 8/15/2036 | | |
Laredo Independent School District, Unlimited Tax GO, PSF-GTD, 5.00%, 8/1/2024 | | |
Lower Colorado River Authority, LCRA Transmission Services Corp. Project Rev., 5.00%, 5/15/2035 | | |
Melissa Independent School District, Unlimited Tax Series 2023, GO, PSF-GTD, 5.00%, 2/1/2041 | | |
Montgomery Independent School District, Unlimited Tax Series 2023, GO, PSF-GTD, 4.00%, 2/15/2053 | | |
North Texas Tollway Authority, First Tier Series 2023 A, Rev., 5.00%, 1/1/2026 | | |
Northside Independent School District, Unlimited Tax GO, PSF-GTD, 5.00%, 8/15/2024 | | |
Northwest Independent School District, Unlimited Tax Series 2023, GO, PSF-GTD, 5.00%, 2/15/2039 | | |
Permanent University Fund - University of Texas System Series 2016A, Rev., 5.00%, 7/1/2024 | | |
State of Texas Series 2015-A, GO, 5.00%, 10/1/2024 | | |
Tarrant County Cultural Education Facilities Finance Corp., Baylor Scott & White Health Project Series 2022F, Rev., 5.00%, 11/15/2030 (c) | | |
| | |
|
|
Tarrant County Cultural Education Facilities Finance Corp., Texas Health Resources System Series 2008A, Rev., VRDO, 3.30%, 3/11/2024 (c) | | |
Tarrant Regional Water District Water Supply System Series 2022, Rev., 5.00%, 3/1/2048 | | |
Texas A&M University, Financing System Series 2017E, Rev., 5.00%, 5/15/2030 | | |
Texas Municipal Gas Acquisition & Supply Corp. IV Series 2023B, Rev., 5.50%, 1/1/2034 (c) | | |
Texas Private Activity Bond Surface Transportation Corp., NTE Mobility Partners Segments 3 LLC Project Series 2023, Rev., AMT, 5.25%, 12/31/2036 | | |
Texas Public Finance Authority, Texas Southern University | | |
Series 2023, Rev., 5.00%, 5/1/2026 | | |
Series 2023, Rev., 5.00%, 5/1/2027 | | |
Texas State Affordable Housing Corp., Juniper Creek Apartments Project Series 2023, Rev., 3.75%, 7/1/2026 (c) | | |
Texas Water Development Board | | |
Series 2023 A, Rev., 5.00%, 10/15/2024 | | |
Series 2023 A, Rev., 5.00%, 10/15/2037 | | |
Series 2023 A, Rev., 5.00%, 10/15/2058 | | |
Trinity River Authority of Texas, Livingston Regional Water Supply System Project | | |
Series 2023, Rev., 5.00%, 8/1/2036 | | |
Series 2023, Rev., 5.00%, 8/1/2037 | | |
Trinity River Authority, Tarrant County Water Project | | |
Series 2023, Rev., 5.00%, 2/1/2041 | | |
Series 2023, Rev., 5.00%, 2/1/2042 | | |
Trinity River Authority, Water Project Rev., 5.00%, 2/1/2026 | | |
| | |
|
City of Salt Lake City, Airport System | | |
Series 2021A, Rev., AMT, 5.00%, 7/1/2029 | | |
Series 2023A, Rev., AMT, 5.25%, 7/1/2040 | | |
SEE NOTES TO FINANCIAL STATEMENTS.
| J.P. Morgan Exchange-Traded Funds | |
SCHEDULE OF PORTFOLIO INVESTMENTSAS OF February 29, 2024 (continued)
| | |
Municipal Bonds — continued |
|
Series 2023A, Rev., AMT, 5.25%, 7/1/2048 | | |
City of Salt Lake City, Sales and Excise Tax Series 2022A, Rev., 4.00%, 10/1/2030 | | |
Utah Charter School Finance Authority, The Freedom Academy Foundation, St. George Campus Project Series 2021A, Rev., 5.00%, 6/15/2041 (e) | | |
Utah Infrastructure Agency, Tax-Exempt Telecommunications Rev., 5.00%, 10/15/2032 | | |
Utah Telecommunication Open Infrastructure Agency, Sales Tax and Telecommunications | | |
| | |
| | |
| | |
Utah Transit Authority, Sales Tax | | |
Series 2007A, Rev., BHAC - CR, MBIA, 5.00%, 6/15/2035 | | |
Series 2023, Rev., 5.00%, 12/15/2041 | | |
| | |
|
Vermont Municipal Bond Bank | | |
Series 2024 1, Rev., 5.00%, 12/1/2035 (d) | | |
Series 2024 1, Rev., 5.00%, 12/1/2036 (d) | | |
| | |
|
City of Richmond, Public Improvement Series 2017B, GO, 5.00%, 7/15/2027 | | |
| | |
Series 2023A, GO, 4.00%, 10/1/2038 | | |
Series 2023A, GO, 4.00%, 10/1/2039 | | |
County of Spotsylvania, Public Improvement GO, 5.00%, 7/15/2029 | | |
Loudoun County Economic Development Authority, Howard Hughes Medical Institute Series E, Rev., VRDO, 3.39%, 3/11/2024 (c) | | |
Northern Virginia Transportation Commission, Transforming Rail in Virginia Program Rev., 5.00%, 6/1/2040 | | |
Virginia College Building Authority Series 2023A, Rev., 4.00%, 9/1/2040 | | |
| | |
|
|
Virginia Commonwealth Transportation Board Rev., 4.00%, 5/15/2045 | | |
Virginia Small Business Financing Authority, Environmental Facilities Series 2022, Rev., 5.00%, 11/15/2024 (c) | | |
Virginia Small Business Financing Authority, Senior Lien | | |
Rev., AMT, 4.00%, 7/1/2032 | | |
Rev., AMT, 4.00%, 1/1/2036 | | |
| | |
|
Auburn School District No. 408 of King and Pierce Counties, Unlimited Tax GO, 4.00%, 12/1/2036 | | |
Central Puget Sound Regional Transit Authority, Sales and Use Tax | | |
Series 2015S-1, Rev., 5.00%, 11/1/2024 | | |
Series 2021S-1, Rev., 4.00%, 11/1/2040 | | |
City of Seattle, Municipal Light and Power Series 2021 A, Rev., 4.00%, 7/1/2047 | | |
City of Seattle, Water System Rev., 5.00%, 8/1/2024 | | |
Clark County School District No. 101 La Center, Unlimited Tax GO, 5.00%, 12/1/2029 | | |
County of King Series 2016A, Rev., 4.00%, 7/1/2038 | | |
County of King, Limited Tax | | |
Series 2013B, GO, 5.00%, 3/5/2024 | | |
Series 2023 B, GO, 5.00%, 12/1/2053 | | |
County of Spokane, Limited Tax Series 2022A, GO, 5.00%, 12/1/2042 | | |
Energy Northwest, Columbia Generating Station Series 2021A, Rev., 4.00%, 7/1/2042 | | |
Energy Northwest, Project 1 Series 2017A, Rev., 5.00%, 7/1/2028 | | |
Franklin County School District No. 1 Pasco, Unlimited Tax GO, 5.00%, 12/1/2030 | | |
King County Public Hospital District No. 2, Evergreen Healthcare, Limited Tax GO, 5.00%, 12/1/2024 (b) | | |
King County School District No. 411 Issaquah, Unlimited Tax GO, 5.00%, 12/1/2024 | | |
SEE NOTES TO FINANCIAL STATEMENTS.
| J.P. Morgan Exchange-Traded Funds | |
| | |
Municipal Bonds — continued |
|
Mason County School District No. 309 Shelton, Unlimited Tax GO, 5.00%, 12/1/2029 | | |
North Thurston Public Schools, Unlimited Tax GO, 4.00%, 12/1/2036 | | |
Pierce County School District No. 416 White River, Unlimited Tax GO, 5.00%, 12/1/2025 | | |
Snohomish County School District No. 4 Lake Stevens, Unlimited Tax GO, 5.00%, 12/1/2024 | | |
Spokane County School District No. 354 Mead, Unlimited Tax GO, 5.00%, 12/1/2024 | | |
State of Washington Series 2024 C, GO, 5.00%, 2/1/2049 | | |
State of Washington, State and Local Agency Real and Personal Property Series 2015-C, COP, 5.00%, 1/1/2029 | | |
State of Washington, Various Purpose | | |
Series 2020C, GO, 5.00%, 2/1/2043 | | |
Series 2023B, GO, 5.00%, 2/1/2043 | | |
Series 2022A, GO, 5.00%, 8/1/2043 | | |
Series 2024B, GO, 5.00%, 6/1/2044 | | |
Washington State Housing Finance Commission | | |
Series 2023A, Rev., 5.00%, 7/1/2026 | | |
Series 2023A, Rev., 5.00%, 7/1/2027 | | |
Washington State Housing Finance Commission, Seattle Academy of Arts and Science Project Series 2023, Rev., 5.63%, 7/1/2038 (e) | | |
| | |
|
State of West Virginia Series 2019 A, GO, 5.00%, 12/1/2035 | | |
West Virginia Hospital Finance Authority, University Health System Series 2023 A, Rev., 5.00%, 6/1/2040 | | |
West Virginia Hospital Finance Authority, Vandalia Health Group Series 2023B, Rev., AGM, 5.00%, 9/1/2040 | | |
| | |
|
| | |
Series 2022E, Rev., 5.00%, 5/1/2027 | | |
Series 2022E, Rev., 5.00%, 5/1/2029 | | |
| | |
|
|
| | |
Series 2022D, Rev., 5.00%, 1/1/2027 | | |
Series 2022D, Rev., 5.00%, 1/1/2028 | | |
Public Finance Authority, AFCO Airport Real Estate Group | | |
Series 2023, Rev., AMT, 5.00%, 7/1/2025 | | |
Series 2023, Rev., AMT, 5.00%, 7/1/2026 | | |
Series 2023, Rev., AMT, 5.00%, 7/1/2027 | | |
Public Finance Authority, Eastern Michigan University Student Housing Project Series 2022A-1, Rev., 5.00%, 7/1/2032 | | |
Public Finance Authority, Piedmont Community Charter School Rev., 5.00%, 6/15/2039 | | |
Public Finance Authority, Triad Educational Services, Inc. Rev., 5.00%, 6/15/2032 | | |
Public Finance Authority, Ultimate Medical Academy Project Series 2019A, Rev., 5.00%, 10/1/2029 (e) | | |
| | |
Series 2016-1, GO, 5.00%, 11/1/2024 | | |
Series 2016-2, GO, 5.00%, 11/1/2026 | | |
Series 2015-1, GO, 5.00%, 5/1/2027 | | |
Series 2023B, GO, 5.00%, 5/1/2035 | | |
State of Wisconsin, Environmental Improvement Fund Series 2018A, Rev., 5.00%, 6/1/2025 | | |
Village of Pleasant Prairie GO, 4.00%, 8/1/2024 | | |
Wisconsin Department of Transportation Series 2017 2, Rev., 5.00%, 7/1/2031 | | |
Wisconsin Health and Educational Facilities Authority, Forensic science and Protective Medicine Collaboration, Inc. Project Series 2024, Rev., 5.00%, 8/1/2027 (d) (e) | | |
Wisconsin Health and Educational Facilities Authority, St. Camillus Health System Series 2019A, Rev., 5.00%, 11/1/2029 | | |
SEE NOTES TO FINANCIAL STATEMENTS.
| J.P. Morgan Exchange-Traded Funds | |
SCHEDULE OF PORTFOLIO INVESTMENTSAS OF February 29, 2024 (continued)
| | |
Municipal Bonds — continued |
|
Wisconsin Housing and Economic Development Authority Home Ownership Series 2024 A, Rev., GNMA / FNMA / FHLMC, 6.00%, 9/1/2054 | | |
WPPI Energy Series 2016A, Rev., 5.00%, 7/1/2024 | | |
| | |
Total Municipal Bonds
(Cost $1,039,670,345) | | |
U.S. Treasury Obligations — 0.3% |
U.S. Treasury Notes
3.88%, 4/30/2025 (Cost $3,990,398) | | |
| | |
Short-Term Investments — 14.6% |
Investment Companies — 14.6% |
JPMorgan Institutional Tax Free Money Market Fund Class IM Shares, 3.37% (f) (g)
(Cost $178,358,585) | | |
Total Investments — 101.6%
(Cost $1,222,019,328) | | |
Liabilities in Excess of Other Assets — (1.6)% | | |
| | |
Percentages indicated are based on net assets. |
| |
| Insured by Assured Guaranty Municipal Corp. |
| |
| |
| Insured by Berkshire Hathaway Assurance Corp. |
| |
| Certificate of Participation |
| |
| Federal Housing Administration |
| Federal Home Loan Mortgage Corp. |
| Federal National Mortgage Association |
| Government National Mortgage Association |
| |
| |
| |
| |
| Insured by Municipal Bond Insurance Corp. |
| Permanent School Fund Guaranteed |
| Qualified School Bond Loan Fund |
| Revenue Anticipation Note |
| |
| South Carolina School District Enhancement |
| Variable Rate Demand Obligation |
| Amount rounds to less than 0.1% of net assets. |
| The date shown represents the earliest of the prerefunded date, next put date or final maturity date. | |
| Security is prerefunded or escrowed to maturity. | |
| Variable or floating rate security, the interest rate of which adjusts periodically based on changes in current interest rates and prepayments on the underlying pool of assets. The interest rate shown is the current rate as of February 29, 2024. | |
| All or a portion of the security is a when-issued security, delayed delivery security, or forward commitment. | |
| Securities exempt from registration under Rule 144A or section 4(a)(2), of the Securities Act of 1933, as amended. | |
| Investment in an affiliated fund, which is registered under the Investment Company Act of 1940, as amended, and is advised by J.P. Morgan Investment Management Inc. | |
| The rate shown is the current yield as of February 29, 2024. | |
Futures contracts outstanding as of February 29, 2024:
| | | | | VALUE AND
UNREALIZED
APPRECIATION
(DEPRECIATION) ($) |
| | | | | |
U.S. Treasury 2 Year Note | | | | | |
U.S. Treasury 5 Year Note | | | | | |
| | | | | |
SEE NOTES TO FINANCIAL STATEMENTS.
| J.P. Morgan Exchange-Traded Funds | |
JPMorgan Short Duration Core Plus ETF
SCHEDULE OF PORTFOLIO INVESTMENTSAS OF February 29, 2024
| | |
|
Aerospace & Defense — 0.3% |
Bombardier, Inc. (Canada) |
| | |
| | |
RTX Corp. 5.75%, 11/8/2026 | | |
Spirit AeroSystems, Inc. 9.38%, 11/30/2029 (a) | | |
TransDigm, Inc. 6.38%, 3/1/2029 (a) | | |
| | |
Automobile Components — 0.2% |
Adient Global Holdings Ltd. |
| | |
| | |
Allison Transmission, Inc. 5.88%, 6/1/2029 (a) | | |
American Axle & Manufacturing, Inc. |
| | |
| | |
|
| | |
| | |
|
| | |
| | |
Goodyear Tire & Rubber Co. (The) 5.25%, 4/30/2031 | | |
Icahn Enterprises LP 5.25%, 5/15/2027 | | |
| | |
|
Ford Motor Co. 9.63%, 4/22/2030 | | |
|
| | |
| | |
Volkswagen Group of America Finance LLC (Germany) 3.35%, 5/13/2025 (a) | | |
| | |
|
ABN AMRO Bank NV (Netherlands) |
(US Treasury Yield Curve Rate T Note Constant Maturity 1 Year + 0.80%), 1.54%, 6/16/2027 (a) (b) | | |
(US Treasury Yield Curve Rate T Note Constant Maturity 1 Year + 1.65%), 6.34%, 9/18/2027 (a) (b) | | |
| | |
|
|
|
(3-MONTH SOFR + 1.87%), 4.26%, 4/10/2025 (a) (b) | | |
(SOFR + 2.33%), 6.61%, 9/13/2029 (a) (b) | | |
ASB Bank Ltd. (New Zealand) |
| | |
| | |
Banco Bilbao Vizcaya Argentaria SA (Spain) (US Treasury Yield Curve Rate T Note Constant Maturity 1 Year + 2.30%), 5.86%, 9/14/2026 (b) | | |
Banco Continental SAECA (Paraguay) 2.75%, 12/10/2025 (a) | | |
Banco Santander SA (Spain) |
| | |
(US Treasury Yield Curve Rate T Note Constant Maturity 1 Year + 0.90%), 1.72%, 9/14/2027 (b) | | |
| | |
| | |
|
(3-MONTH CME TERM SOFR + 0.90%), 2.02%, 2/13/2026 (b) | | |
(SOFR + 1.33%), 3.38%, 4/2/2026 (b) | | |
(SOFR + 0.96%), 1.73%, 7/22/2027 (b) | | |
(SOFR + 1.34%), 5.93%, 9/15/2027 (b) | | |
(SOFR + 1.05%), 2.55%, 2/4/2028 (b) | | |
(SOFR + 2.04%), 4.95%, 7/22/2028 (b) | | |
(SOFR + 1.99%), 6.20%, 11/10/2028 (b) | | |
(SOFR + 1.63%), 5.20%, 4/25/2029 (b) | | |
(SOFR + 1.57%), 5.82%, 9/15/2029 (b) | | |
Bank of Ireland Group plc (Ireland) |
(US Treasury Yield Curve Rate T Note Constant Maturity 1 Year + 2.65%), 6.25%, 9/16/2026 (a) (b) | | |
(US Treasury Yield Curve Rate T Note Constant Maturity 1 Year + 1.10%), 2.03%, 9/30/2027 (a) (b) | | |
Bank of Montreal (Canada) 5.20%, 2/1/2028 | | |
Bank of New Zealand (New Zealand) 5.08%, 1/30/2029 (a) | | |
Bank of Nova Scotia (The) (Canada) |
| | |
| | |
Banque Federative du Credit Mutuel SA (France) |
| | |
| | |
SEE NOTES TO FINANCIAL STATEMENTS.
| J.P. Morgan Exchange-Traded Funds | |
JPMorgan Short Duration Core Plus ETF
SCHEDULE OF PORTFOLIO INVESTMENTSAS OF February 29, 2024 (continued)
| | |
Corporate Bonds — continued |
|
| | |
Barclays plc (United Kingdom) (US Treasury Yield Curve Rate T Note Constant Maturity 1 Year + 1.05%), 2.28%, 11/24/2027 (b) | | |
|
(SOFR + 2.07%), 2.22%, 6/9/2026 (a) (b) | | |
(US Treasury Yield Curve Rate T Note Constant Maturity 1 Year + 1.50%), 5.34%, 6/12/2029 (a) (b) | | |
(SOFR + 1.59%), 5.50%, 5/20/2030 (a) (b) | | |
|
| | |
(SOFR + 1.52%), 1.65%, 10/6/2026 (a) (b) | | |
(SOFR + 2.10%), 5.98%, 1/18/2027 (a) (b) | | |
(SOFR + 1.98%), 6.61%, 10/19/2027 (a) (b) | | |
(SOFR + 2.27%), 6.71%, 10/19/2029 (a) (b) | | |
(US Treasury Yield Curve Rate T Note Constant Maturity 1 Year + 1.96%), 5.72%, 1/18/2030 (a) (b) | | |
CaixaBank SA (Spain) (SOFR + 2.08%), 6.68%, 9/13/2027 (a) (b) | | |
Canadian Imperial Bank of Commerce (Canada) 5.00%, 4/28/2028 | | |
|
(SOFR + 0.67%), 0.98%, 5/1/2025 (b) | | |
(SOFR + 0.69%), 2.01%, 1/25/2026 (b) | | |
(SOFR + 2.84%), 3.11%, 4/8/2026 (b) | | |
(SOFR + 1.55%), 5.61%, 9/29/2026 (b) | | |
(SOFR + 0.77%), 1.12%, 1/28/2027 (b) | | |
(3-MONTH CME TERM SOFR + 1.82%), 3.89%, 1/10/2028 (b) | | |
(SOFR + 1.28%), 3.07%, 2/24/2028 (b) | | |
(SOFR + 1.36%), 5.17%, 2/13/2030 (b) | | |
Cooperatieve Rabobank UA (Netherlands) |
(US Treasury Yield Curve Rate T Note Constant Maturity 1 Year + 1.22%), 3.65%, 4/6/2028 (a) (b) | | |
(US Treasury Yield Curve Rate T Note Constant Maturity 1 Year + 1.40%), 5.56%, 2/28/2029 (a) (b) | | |
Credit Agricole SA (France) |
(SOFR + 1.68%), 1.91%, 6/16/2026 (a) (b) | | |
| | |
(SOFR + 1.69%), 5.34%, 1/10/2030 (a) (b) | | |
| | |
|
|
Danske Bank A/S (Denmark) |
(US Treasury Yield Curve Rate T Note Constant Maturity 1 Year + 0.55%), 0.98%, 9/10/2025 (a) (b) | | |
(US Treasury Yield Curve Rate T Note Constant Maturity 1 Year + 1.18%), 6.26%, 9/22/2026 (a) (b) | | |
(US Treasury Yield Curve Rate T Note Constant Maturity 1 Year + 1.40%), 5.71%, 3/1/2030 (a) (b) | | |
DNB Bank ASA (Norway) (SOFRINDX + 1.95%), 5.90%, 10/9/2026 (a) (b) | | |
Federation des Caisses Desjardins du Quebec (Canada) |
| | |
| | |
| | |
HSBC Holdings plc (United Kingdom) |
(3-MONTH CME TERM SOFR + 1.21%), 3.80%, 3/11/2025 (b) | | |
(SOFR + 0.71%), 0.98%, 5/24/2025 (b) | | |
(SOFR + 1.29%), 1.59%, 5/24/2027 (b) | | |
(SOFR + 1.57%), 5.89%, 8/14/2027 (b) | | |
(SOFR + 1.10%), 2.25%, 11/22/2027 (b) | | |
(SOFR + 2.61%), 5.21%, 8/11/2028 (b) | | |
(SOFR + 1.97%), 6.16%, 3/9/2029 (b) | | |
ING Groep NV (Netherlands) |
(US Treasury Yield Curve Rate T Note Constant Maturity 1 Year + 1.10%), 1.40%, 7/1/2026 (a) (b) | | |
(SOFR + 1.01%), 1.73%, 4/1/2027 (b) | | |
KBC Group NV (Belgium) (US Treasury Yield Curve Rate T Note Constant Maturity 1 Year + 2.10%), 5.80%, 1/19/2029 (a) (b) | | |
Lloyds Banking Group plc (United Kingdom) |
(US Treasury Yield Curve Rate T Note Constant Maturity 1 Year + 1.00%), 2.44%, 2/5/2026 (b) | | |
(US Treasury Yield Curve Rate T Note Constant Maturity 1 Year + 1.48%), 5.99%, 8/7/2027 (b) | | |
(US Treasury Yield Curve Rate T Note Constant Maturity 1 Year + 1.38%), 5.46%, 1/5/2028 (b) | | |
(US Treasury Yield Curve Rate T Note Constant Maturity 1 Year + 1.70%), 5.87%, 3/6/2029 (b) | | |
SEE NOTES TO FINANCIAL STATEMENTS.
| J.P. Morgan Exchange-Traded Funds | |
| | |
Corporate Bonds — continued |
|
Mitsubishi UFJ Financial Group, Inc. (Japan) |
(US Treasury Yield Curve Rate T Note Constant Maturity 1 Year + 1.13%), 3.84%, 4/17/2026 (b) | | |
(US Treasury Yield Curve Rate T Note Constant Maturity 1 Year + 0.75%), 1.54%, 7/20/2027 (b) | | |
(US Treasury Yield Curve Rate T Note Constant Maturity 1 Year + 0.83%), 2.34%, 1/19/2028 (b) | | |
Mizuho Financial Group, Inc. (Japan) |
(3-MONTH CME TERM SOFR + 1.24%), 2.84%, 7/16/2025 (b) | | |
(US Treasury Yield Curve Rate T Note Constant Maturity 1 Year + 0.90%), 2.65%, 5/22/2026 (b) | | |
National Bank of Canada (Canada) 5.60%, 12/18/2028 | | |
NatWest Group plc (United Kingdom) |
| | |
(US Treasury Yield Curve Rate T Note Constant Maturity 1 Year + 1.35%), 5.85%, 3/2/2027 (b) | | |
(US Treasury Yield Curve Rate T Note Constant Maturity 1 Year + 1.10%), 5.58%, 3/1/2028 (b) | | |
(US Treasury Yield Curve Rate T Note Constant Maturity 1 Year + 1.95%), 5.81%, 9/13/2029 (b) | | |
Nordea Bank Abp (Finland) 1.50%, 9/30/2026 (a) | | |
Santander UK Group Holdings plc (United Kingdom) |
(SOFR + 0.79%), 1.09%, 3/15/2025 (b) | | |
(US Treasury Yield Curve Rate T Note Constant Maturity 1 Year + 1.25%), 1.53%, 8/21/2026 (b) | | |
Skandinaviska Enskilda Banken AB (Sweden) 5.38%, 3/5/2029 (a) | | |
Societe Generale SA (France) |
(US Treasury Yield Curve Rate T Note Constant Maturity 1 Year + 1.05%), 2.23%, 1/21/2026 (a) (b) | | |
(US Treasury Yield Curve Rate T Note Constant Maturity 1 Year + 1.10%), 1.49%, 12/14/2026 (a) (b) | | |
(US Treasury Yield Curve Rate T Note Constant Maturity 1 Year + 2.55%), 6.45%, 1/10/2029 (a) (b) | | |
| | |
|
|
(US Treasury Yield Curve Rate T Note Constant Maturity 1 Year + 1.75%), 5.63%, 1/19/2030 (a) (b) | | |
Standard Chartered plc (United Kingdom) |
(3-MONTH SOFR + 1.21%), 2.82%, 1/30/2026 (a) (b) | | |
(US Treasury Yield Curve Rate T Note Constant Maturity 1 Year + 1.65%), 3.97%, 3/30/2026 (a) (b) | | |
(US Treasury Yield Curve Rate T Note Constant Maturity 1 Year + 1.85%), 6.19%, 7/6/2027 (a) (b) | | |
Sumitomo Mitsui Financial Group, Inc. (Japan) |
| | |
| | |
Sumitomo Mitsui Trust Bank Ltd. (Japan) |
| | |
| | |
Svenska Handelsbanken AB (Sweden) 5.50%, 6/15/2028 (a) | | |
Toronto-Dominion Bank (The) (Canada) |
| | |
| | |
|
(3-MONTH CME TERM SOFR + 1.01%), 2.16%, 2/11/2026 (b) | | |
(SOFR + 1.51%), 3.53%, 3/24/2028 (b) | | |
(SOFR + 1.98%), 4.81%, 7/25/2028 (b) | | |
(SOFR + 1.74%), 5.57%, 7/25/2029 (b) | | |
(SOFR + 1.79%), 6.30%, 10/23/2029 (b) | | |
(SOFR + 1.50%), 5.20%, 1/23/2030 (b) | | |
Westpac New Zealand Ltd. (New Zealand) 5.20%, 2/28/2029 (a) | | |
| | |
|
Triton Water Holdings, Inc. 6.25%, 4/1/2029 (a) | | |
|
Emergent BioSolutions, Inc. 3.88%, 8/15/2028 (a) | | |
Broadline Retail — 0.0% ^ |
NMG Holding Co., Inc. 7.13%, 4/1/2026 (a) | | |
Nordstrom, Inc. 4.38%, 4/1/2030 | | |
| | |
SEE NOTES TO FINANCIAL STATEMENTS.
| J.P. Morgan Exchange-Traded Funds | |
JPMorgan Short Duration Core Plus ETF
SCHEDULE OF PORTFOLIO INVESTMENTSAS OF February 29, 2024 (continued)
| | |
Corporate Bonds — continued |
|
Builders FirstSource, Inc. 4.25%, 2/1/2032 (a) | | |
EMRLD Borrower LP 6.63%, 12/15/2030 (a) | | |
Griffon Corp. 5.75%, 3/1/2028 | | |
JELD-WEN, Inc. 4.88%, 12/15/2027 (a) | | |
PGT Innovations, Inc. 4.38%, 10/1/2029 (a) | | |
Smyrna Ready Mix Concrete LLC 8.88%, 11/15/2031 (a) | | |
Standard Industries, Inc. 4.75%, 1/15/2028 (a) | | |
Summit Materials LLC 5.25%, 1/15/2029 (a) | | |
| | |
|
Bank of New York Mellon Corp. (The) (SOFR + 1.03%), 4.95%, 4/26/2027 (b) | | |
Credit Suisse AG (Switzerland) 7.50%, 2/15/2028 | | |
Deutsche Bank AG (Germany) |
(SOFR + 1.87%), 2.13%, 11/24/2026 (b) | | |
(SOFR + 2.52%), 7.15%, 7/13/2027 (b) | | |
(SOFR + 1.22%), 2.31%, 11/16/2027 (b) | | |
(SOFR + 2.51%), 6.82%, 11/20/2029 (b) | | |
Goldman Sachs Group, Inc. (The) |
(SOFR + 0.91%), 1.95%, 10/21/2027 (b) | | |
(SOFR + 1.11%), 2.64%, 2/24/2028 (b) | | |
(SOFR + 1.85%), 3.62%, 3/15/2028 (b) | | |
(SOFR + 1.73%), 4.48%, 8/23/2028 (b) | | |
(SOFR + 1.77%), 6.48%, 10/24/2029 (b) | | |
Macquarie Bank Ltd. (Australia) 5.21%, 6/15/2026 (a) | | |
Macquarie Group Ltd. (Australia) |
| | |
(SOFR + 0.91%), 1.63%, 9/23/2027 (a) (b) | | |
(SOFR + 2.13%), 4.10%, 6/21/2028 (a) (b) | | |
|
(SOFR + 0.72%), 0.99%, 12/10/2026 (b) | | |
(SOFR + 0.86%), 1.51%, 7/20/2027 (b) | | |
(SOFR + 1.00%), 2.48%, 1/21/2028 (b) | | |
(SOFR + 2.24%), 6.30%, 10/18/2028 (b) | | |
(SOFR + 1.59%), 5.16%, 4/20/2029 (b) | | |
(SOFR + 1.63%), 5.45%, 7/20/2029 (b) | | |
(SOFR + 1.45%), 5.17%, 1/16/2030 (b) | | |
Nomura Holdings, Inc. (Japan) 1.85%, 7/16/2025 | | |
State Street Corp. (SOFR + 1.48%), 5.68%, 11/21/2029 (b) | | |
| | |
|
Capital Markets — continued |
UBS Group AG (Switzerland) |
(SOFR + 1.56%), 2.59%, 9/11/2025 (a) (b) | | |
(SOFR + 3.34%), 6.37%, 7/15/2026 (a) (b) | | |
(US Treasury Yield Curve Rate T Note Constant Maturity 1 Year + 1.55%), 5.71%, 1/12/2027 (a) (b) | | |
(US Treasury Yield Curve Rate T Note Constant Maturity 1 Year + 2.05%), 4.70%, 8/5/2027 (a) (b) | | |
(SOFR + 3.70%), 6.44%, 8/11/2028 (a) (b) | | |
(US Treasury Yield Curve Rate T Note Constant Maturity 1 Year + 1.52%), 5.43%, 2/8/2030 (a) (b) | | |
| | |
|
Avient Corp. 5.75%, 5/15/2025 (a) | | |
Braskem Netherlands Finance BV (Brazil) 4.50%, 1/31/2030 (c) | | |
Chemours Co. (The) 5.75%, 11/15/2028 (a) | | |
Element Solutions, Inc. 3.88%, 9/1/2028 (a) | | |
INEOS Finance plc (Luxembourg) 6.75%, 5/15/2028 (a) | | |
NOVA Chemicals Corp. (Canada) |
| | |
| | |
Scotts Miracle-Gro Co. (The) 4.50%, 10/15/2029 | | |
Trinseo Materials Operating SCA 5.38%, 9/1/2025 (a) | | |
WR Grace Holdings LLC 4.88%, 6/15/2027 (a) | | |
| | |
Commercial Services & Supplies — 0.4% |
ACCO Brands Corp. 4.25%, 3/15/2029 (a) | | |
Allied Universal Holdco LLC |
| | |
| | |
APi Group DE, Inc. 4.13%, 7/15/2029 (a) | | |
Aramark Services, Inc. 5.00%, 2/1/2028 (a) | | |
Brink's Co. (The) 4.63%, 10/15/2027 (a) | | |
Element Fleet Management Corp. (Canada) |
| | |
| | |
Garda World Security Corp. (Canada) 4.63%, 2/15/2027 (a) | | |
SEE NOTES TO FINANCIAL STATEMENTS.
| J.P. Morgan Exchange-Traded Funds | |
| | |
Corporate Bonds — continued |
Commercial Services & Supplies — continued |
GFL Environmental, Inc. (Canada) |
| | |
| | |
Madison IAQ LLC 4.13%, 6/30/2028 (a) | | |
Prime Security Services Borrower LLC |
| | |
| | |
| | |
Communications Equipment — 0.0% ^ |
|
| | |
| | |
| | |
Construction & Engineering — 0.1% |
Bioceanico Sovereign Certificate Ltd. (Paraguay) Zero Coupon, 6/5/2034 (c) | | |
Dycom Industries, Inc. 4.50%, 4/15/2029 (a) | | |
Global Infrastructure Solutions, Inc. 5.63%, 6/1/2029 (a) | | |
Pike Corp. 5.50%, 9/1/2028 (a) | | |
Weekley Homes LLC 4.88%, 9/15/2028 (a) | | |
| | |
|
AerCap Ireland Capital DAC (Ireland) |
| | |
| | |
| | |
Ally Financial, Inc. 5.75%, 11/20/2025 | | |
American Express Co. (SOFR + 1.33%), 6.34%, 10/30/2026 (b) | | |
Avolon Holdings Funding Ltd. (Ireland) |
| | |
| | |
Capital One Financial Corp. |
(SOFR + 2.08%), 5.47%, 2/1/2029 (b) | | |
(SOFR + 1.91%), 5.70%, 2/1/2030 (b) | | |
Ford Motor Credit Co. LLC 4.27%, 1/9/2027 | | |
General Motors Financial Co., Inc. 5.40%, 5/8/2027 | | |
|
| | |
| | |
|
Consumer Finance — continued |
| | |
| | |
| | |
Consumer Staples Distribution & Retail — 0.1% |
|
| | |
| | |
Performance Food Group, Inc. 5.50%, 10/15/2027 (a) | | |
Rite Aid Corp. 8.00%, 11/15/2026 (a) (d) | | |
| | |
Containers & Packaging — 0.2% |
Ardagh Packaging Finance plc 4.13%, 8/15/2026 (a) | | |
Graphic Packaging International LLC 1.51%, 4/15/2026 (a) | | |
LABL, Inc. 6.75%, 7/15/2026 (a) | | |
Mauser Packaging Solutions Holding Co. 7.88%, 8/15/2026 (a) | | |
Owens-Brockway Glass Container, Inc. 6.63%, 5/13/2027 (a) | | |
Pactiv Evergreen Group Issuer, Inc. 4.00%, 10/15/2027 (a) | | |
TriMas Corp. 4.13%, 4/15/2029 (a) | | |
Trivium Packaging Finance BV (Netherlands) 5.50%, 8/15/2026 (a) (e) | | |
| | |
Diversified Consumer Services — 0.0% ^ |
Service Corp. International 5.13%, 6/1/2029 | | |
Diversified Telecommunication Services — 0.4% |
Altice France SA (France) 5.13%, 7/15/2029 (a) | | |
|
| | |
| | |
| | |
| | |
Frontier Communications Holdings LLC 5.88%, 10/15/2027 (a) | | |
Intelsat Jackson Holdings SA (Luxembourg) 6.50%, 3/15/2030 (a) | | |
|
| | |
SEE NOTES TO FINANCIAL STATEMENTS.
| J.P. Morgan Exchange-Traded Funds | |
JPMorgan Short Duration Core Plus ETF
SCHEDULE OF PORTFOLIO INVESTMENTSAS OF February 29, 2024 (continued)
| | |
Corporate Bonds — continued |
Diversified Telecommunication Services — continued |
| | |
Telecom Italia Capital SA (Italy) 6.38%, 11/15/2033 | | |
| | |
Electric Utilities — 1.9% |
Enel Finance America LLC (Italy) 7.10%, 10/14/2027 (a) | | |
Enel Finance International NV (Italy) 4.63%, 6/15/2027 (a) | | |
EnfraGen Energia Sur SA (Colombia) 5.38%, 12/30/2030 (c) | | |
Eskom Holdings SOC Ltd. (South Africa) 7.13%, 2/11/2025 (c) | | |
Exelon Corp. 5.15%, 3/15/2028 | | |
Fells Point Funding Trust 3.05%, 1/31/2027 (a) | | |
Instituto Costarricense de Electricidad (Costa Rica) 6.75%, 10/7/2031 (a) | | |
ITC Holdings Corp. 3.65%, 6/15/2024 | | |
Metropolitan Edison Co. 5.20%, 4/1/2028 (a) | | |
NextEra Energy Capital Holdings, Inc. 5.75%, 9/1/2025 | | |
|
| | |
| | |
Pacific Gas and Electric Co. 5.55%, 5/15/2029 | | |
Pennsylvania Electric Co. 5.15%, 3/30/2026 (a) | | |
PG&E Corp. 5.00%, 7/1/2028 | | |
Southern California Edison Co. 5.15%, 6/1/2029 | | |
Vistra Operations Co. LLC |
| | |
| | |
| | |
| | |
| | |
Electrical Equipment — 0.0% ^ |
EnerSys 6.63%, 1/15/2032 (a) | | |
Vertiv Group Corp. 4.13%, 11/15/2028 (a) | | |
| | |
Electronic Equipment, Instruments & Components — 0.0% ^ |
Coherent Corp. 5.00%, 12/15/2029 (a) | | |
| | |
|
Energy Equipment & Services — 0.2% |
Archrock Partners LP 6.88%, 4/1/2027 (a) | | |
Diamond Foreign Asset Co. 8.50%, 10/1/2030 (a) | | |
Guara Norte SARL (Brazil) 5.20%, 6/15/2034 (a) | | |
Nabors Industries, Inc. 7.38%, 5/15/2027 (a) | | |
Noble Finance II LLC 8.00%, 4/15/2030 (a) | | |
Precision Drilling Corp. (Canada) 7.13%, 1/15/2026 (a) | | |
Transocean, Inc. 8.75%, 2/15/2030 (a) | | |
USA Compression Partners LP 6.88%, 9/1/2027 | | |
Valaris Ltd. 8.38%, 4/30/2030 (a) | | |
| | |
|
|
| | |
| | |
Live Nation Entertainment, Inc. |
| | |
| | |
Take-Two Interactive Software, Inc. 5.00%, 3/28/2026 | | |
| | |
Financial Services — 0.7% |
|
| | |
| | |
|
| | |
| | |
Nationstar Mortgage Holdings, Inc. 6.00%, 1/15/2027 (a) | | |
Nationwide Building Society (United Kingdom) (SOFR + 1.29%), 2.97%, 2/16/2028 (a) (b) | | |
NCR Atleos Corp. 9.50%, 4/1/2029 (a) | | |
|
| | |
| | |
| | |
| | |
|
|
| | |
SEE NOTES TO FINANCIAL STATEMENTS.
| J.P. Morgan Exchange-Traded Funds | |
| | |
Corporate Bonds — continued |
Food Products — continued |
| | |
Viterra Finance BV (Netherlands) |
| | |
| | |
| | |
|
|
| | |
| | |
Superior Plus LP (Canada) 4.50%, 3/15/2029 (a) | | |
| | |
Ground Transportation — 0.2% |
Avis Budget Car Rental LLC |
| | |
| | |
EquipmentShare.com, Inc. 9.00%, 5/15/2028 (a) | | |
First Student Bidco, Inc. 4.00%, 7/31/2029 (a) | | |
Hertz Corp. (The) 4.63%, 12/1/2026 (a) | | |
RXO, Inc. 7.50%, 11/15/2027 (a) | | |
Uber Technologies, Inc. 7.50%, 9/15/2027 (a) | | |
|
| | |
| | |
| | |
Health Care Equipment & Supplies — 0.1% |
|
| | |
| | |
| | |
Health Care Providers & Services — 0.9% |
Acadia Healthcare Co., Inc. 5.50%, 7/1/2028 (a) | | |
AdaptHealth LLC 4.63%, 8/1/2029 (a) | | |
Cardinal Health, Inc. 5.13%, 2/15/2029 | | |
Community Health Systems, Inc. |
| | |
| | |
| | |
| | |
DaVita, Inc. 4.63%, 6/1/2030 (a) | | |
Encompass Health Corp. 4.75%, 2/1/2030 | | |
| | |
|
Health Care Providers & Services — continued |
HCA, Inc. 5.20%, 6/1/2028 | | |
Owens & Minor, Inc. 4.50%, 3/31/2029 (a) | | |
Star Parent, Inc. 9.00%, 10/1/2030 (a) | | |
|
| | |
| | |
| | |
Hotel & Resort REITs — 0.0% ^ |
|
| | |
| | |
| | |
Hotels, Restaurants & Leisure — 0.5% |
1011778 BC ULC (Canada) 3.88%, 1/15/2028 (a) | | |
Boyd Gaming Corp. 4.75%, 12/1/2027 | | |
Boyne USA, Inc. 4.75%, 5/15/2029 (a) | | |
Caesars Entertainment, Inc. |
| | |
| | |
|
| | |
| | |
| | |
Cedar Fair LP 5.25%, 7/15/2029 | | |
Hilton Domestic Operating Co., Inc. 4.88%, 1/15/2030 | | |
Marriott Ownership Resorts, Inc. |
| | |
| | |
MGM Resorts International |
| | |
| | |
Royal Caribbean Cruises Ltd. |
| | |
| | |
| | |
Sands China Ltd. (Macau) 5.12%, 8/8/2025 (e) | | |
Six Flags Entertainment Corp. 5.50%, 4/15/2027 (a) | | |
Six Flags Theme Parks, Inc. 7.00%, 7/1/2025 (a) | | |
Station Casinos LLC 4.50%, 2/15/2028 (a) | | |
SEE NOTES TO FINANCIAL STATEMENTS.
| J.P. Morgan Exchange-Traded Funds | |
JPMorgan Short Duration Core Plus ETF
SCHEDULE OF PORTFOLIO INVESTMENTSAS OF February 29, 2024 (continued)
| | |
Corporate Bonds — continued |
Hotels, Restaurants & Leisure — continued |
Wynn Resorts Finance LLC 5.13%, 10/1/2029 (a) | | |
|
| | |
| | |
| | |
Household Durables — 0.1% |
CD&R Smokey Buyer, Inc. 6.75%, 7/15/2025 (a) | | |
Newell Brands, Inc. 6.38%, 9/15/2027 | | |
Tempur Sealy International, Inc. 4.00%, 4/15/2029 (a) | | |
| | |
Household Products — 0.1% |
|
| | |
| | |
|
| | |
| | |
Spectrum Brands, Inc. 5.00%, 10/1/2029 (a) | | |
| | |
Independent Power and Renewable Electricity Producers — 0.1% |
Calpine Corp. 4.50%, 2/15/2028 (a) | | |
Constellation Energy Generation LLC 5.60%, 3/1/2028 | | |
Termocandelaria Power Ltd. (Colombia) 7.88%, 1/30/2029 (c) | | |
| | |
|
|
| | |
| | |
Corebridge Global Funding 5.90%, 9/19/2028 (a) | | |
Equitable Financial Life Global Funding 0.80%, 8/12/2024 (a) | | |
HUB International Ltd. 7.25%, 6/15/2030 (a) | | |
Jackson National Life Global Funding |
| | |
| | |
|
|
| | |
Met Tower Global Funding 5.40%, 6/20/2026 (a) | | |
| | |
|
Ahead DB Holdings LLC 6.63%, 5/1/2028 (a) | | |
Arches Buyer, Inc. 4.25%, 6/1/2028 (a) | | |
Presidio Holdings, Inc. 4.88%, 2/1/2027 (a) | | |
| | |
Leisure Products — 0.0% ^ |
Vista Outdoor, Inc. 4.50%, 3/15/2029 (a) | | |
|
|
| | |
| | |
Hillenbrand, Inc. 6.25%, 2/15/2029 | | |
Terex Corp. 5.00%, 5/15/2029 (a) | | |
| | |
|
Altice Financing SA (Luxembourg) 5.00%, 1/15/2028 (a) | | |
Charter Communications Operating LLC 6.15%, 11/10/2026 | | |
Clear Channel Outdoor Holdings, Inc. |
| | |
| | |
| | |
|
| | |
| | |
Directv Financing LLC 5.88%, 8/15/2027 (a) | | |
|
| | |
| | |
| | |
DISH Network Corp. 11.75%, 11/15/2027 (a) | | |
Gannett Holdings LLC 6.00%, 11/1/2026 (a) | | |
|
| | |
| | |
iHeartCommunications, Inc. |
| | |
| | |
SEE NOTES TO FINANCIAL STATEMENTS.
| J.P. Morgan Exchange-Traded Funds | |
| | |
Corporate Bonds — continued |
|
| | |
News Corp. 3.88%, 5/15/2029 (a) | | |
Nexstar Media, Inc. 5.63%, 7/15/2027 (a) | | |
Outfront Media Capital LLC 4.25%, 1/15/2029 (a) | | |
Scripps Escrow II, Inc. 3.88%, 1/15/2029 (a) | | |
Scripps Escrow, Inc. 5.88%, 7/15/2027 (a) | | |
Sinclair Television Group, Inc. |
| | |
| | |
|
| | |
| | |
| | |
Stagwell Global LLC 5.63%, 8/15/2029 (a) | | |
TEGNA, Inc. 4.63%, 3/15/2028 | | |
Univision Communications, Inc. |
| | |
| | |
| | |
Videotron Ltd. (Canada) 5.13%, 4/15/2027 (a) | | |
| | |
|
ATI, Inc. 5.88%, 12/1/2027 | | |
Big River Steel LLC 6.63%, 1/31/2029 (a) | | |
Carpenter Technology Corp. 6.38%, 7/15/2028 | | |
|
| | |
| | |
| | |
CSN Inova Ventures (Brazil) 6.75%, 1/28/2028 (c) | | |
FMG Resources August 2006 Pty. Ltd. (Australia) 4.50%, 9/15/2027 (a) | | |
Novelis Corp. 4.75%, 1/30/2030 (a) | | |
| | |
|
DTE Energy Co. 5.10%, 3/1/2029 | | |
Oil, Gas & Consumable Fuels — 1.8% |
Antero Midstream Partners LP |
| | |
| | |
| | |
|
Oil, Gas & Consumable Fuels — continued |
|
| | |
| | |
APA Infrastructure Ltd. (Australia) 4.20%, 3/23/2025 (a) | | |
Ascent Resources Utica Holdings LLC 8.25%, 12/31/2028 (a) | | |
Baytex Energy Corp. (Canada) 8.75%, 4/1/2027 (a) | | |
Blue Racer Midstream LLC 6.63%, 7/15/2026 (a) | | |
Buckeye Partners LP 4.13%, 12/1/2027 | | |
California Resources Corp. 7.13%, 2/1/2026 (a) | | |
Chesapeake Energy Corp. 6.75%, 4/15/2029 (a) | | |
Chord Energy Corp. 6.38%, 6/1/2026 (a) | | |
|
| | |
| | |
CNX Resources Corp. 6.00%, 1/15/2029 (a) | | |
Comstock Resources, Inc. 6.75%, 3/1/2029 (a) | | |
Crescent Energy Finance LLC 9.25%, 2/15/2028 (a) | | |
DT Midstream, Inc. 4.13%, 6/15/2029 (a) | | |
|
| | |
| | |
| | |
Encino Acquisition Partners Holdings LLC 8.50%, 5/1/2028 (a) | | |
Energian Israel Finance Ltd. (Israel) 4.88%, 3/30/2026 (c) | | |
|
| | |
| | |
EQM Midstream Partners LP |
| | |
| | |
| | |
|
| | |
| | |
Gray Oak Pipeline LLC 2.60%, 10/15/2025 (a) | | |
Greenko Dutch BV (India) 3.85%, 3/29/2026 (a) | | |
SEE NOTES TO FINANCIAL STATEMENTS.
| J.P. Morgan Exchange-Traded Funds | |
JPMorgan Short Duration Core Plus ETF
SCHEDULE OF PORTFOLIO INVESTMENTSAS OF February 29, 2024 (continued)
| | |
Corporate Bonds — continued |
Oil, Gas & Consumable Fuels — continued |
Gulfport Energy Corp. 8.00%, 5/17/2026 (a) | | |
Hilcorp Energy I LP 5.75%, 2/1/2029 (a) | | |
KazMunayGas National Co. JSC (Kazakhstan) 5.38%, 4/24/2030 (c) | | |
Kinetik Holdings LP 5.88%, 6/15/2030 (a) | | |
Leviathan Bond Ltd. (Israel) |
| | |
| | |
MEG Energy Corp. (Canada) 5.88%, 2/1/2029 (a) | | |
NGL Energy Operating LLC 8.13%, 2/15/2029 (a) | | |
Northriver Midstream Finance LP (Canada) 5.63%, 2/15/2026 (a) | | |
NuStar Logistics LP 5.63%, 4/28/2027 | | |
Permian Resources Operating LLC 7.00%, 1/15/2032 (a) | | |
Peru LNG Srl (Peru) 5.38%, 3/22/2030 (c) | | |
Petroleos Mexicanos (Mexico) |
| | |
| | |
| | |
| | |
| | |
|
| | |
| | |
Rockies Express Pipeline LLC 4.95%, 7/15/2029 (a) | | |
|
| | |
| | |
|
| | |
| | |
Sunoco LP 5.88%, 3/15/2028 | | |
Tallgrass Energy Partners LP |
| | |
| | |
Venture Global LNG, Inc. 8.13%, 6/1/2028 (a) | | |
Vital Energy, Inc. 10.13%, 1/15/2028 | | |
| | |
Passenger Airlines — 0.1% |
|
| | |
| | |
|
Passenger Airlines — continued |
| | |
|
| | |
| | |
VistaJet Malta Finance plc (Switzerland) 9.50%, 6/1/2028 (a) | | |
| | |
Personal Care Products — 0.0% ^ |
Edgewell Personal Care Co. 5.50%, 6/1/2028 (a) | | |
Prestige Brands, Inc. 5.13%, 1/15/2028 (a) | | |
| | |
|
Bausch Health Americas, Inc. 9.25%, 4/1/2026 (a) | | |
|
| | |
| | |
Elanco Animal Health, Inc. 6.65%, 8/28/2028 (e) | | |
Organon & Co. 4.13%, 4/30/2028 (a) | | |
| | |
Real Estate Management & Development — 0.0% ^ |
Kennedy-Wilson, Inc. 4.75%, 3/1/2029 | | |
Realogy Group LLC 5.75%, 1/15/2029 (a) | | |
| | |
Semiconductors & Semiconductor Equipment — 0.3% |
Amkor Technology, Inc. 6.63%, 9/15/2027 (a) | | |
ams-OSRAM AG (Austria) 12.25%, 3/30/2029 (a) | | |
Entegris, Inc. 5.95%, 6/15/2030 (a) | | |
Marvell Technology, Inc. 5.75%, 2/15/2029 | | |
Synaptics, Inc. 4.00%, 6/15/2029 (a) | | |
| | |
|
Clarivate Science Holdings Corp. 3.88%, 7/1/2028 (a) | | |
|
| | |
| | |
RingCentral, Inc. 8.50%, 8/15/2030 (a) | | |
SS&C Technologies, Inc. 5.50%, 9/30/2027 (a) | | |
| | |
SEE NOTES TO FINANCIAL STATEMENTS.
| J.P. Morgan Exchange-Traded Funds | |
| | |
Corporate Bonds — continued |
Specialized REITs — 0.0% ^ |
Iron Mountain, Inc. 4.88%, 9/15/2027 (a) | | |
|
Asbury Automotive Group, Inc. 4.50%, 3/1/2028 | | |
|
| | |
| | |
| | |
Gap, Inc. (The) 3.63%, 10/1/2029 (a) | | |
Group 1 Automotive, Inc. 4.00%, 8/15/2028 (a) | | |
|
| | |
| | |
Penske Automotive Group, Inc. 3.75%, 6/15/2029 | | |
PetSmart, Inc. 4.75%, 2/15/2028 (a) | | |
Sonic Automotive, Inc. 4.63%, 11/15/2029 (a) | | |
SRS Distribution, Inc. 4.63%, 7/1/2028 (a) | | |
|
| | |
| | |
| | |
Technology Hardware, Storage & Peripherals — 0.0% ^ |
|
| | |
| | |
| | |
| | |
Trading Companies & Distributors — 0.1% |
Herc Holdings, Inc. 5.50%, 7/15/2027 (a) | | |
Imola Merger Corp. 4.75%, 5/15/2029 (a) | | |
United Rentals North America, Inc. 4.88%, 1/15/2028 | | |
WESCO Distribution, Inc. 7.25%, 6/15/2028 (a) | | |
| | |
Wireless Telecommunication Services — 0.2% |
Hughes Satellite Systems Corp. 6.63%, 8/1/2026 | | |
| | |
|
Wireless Telecommunication Services — continued |
|
| | |
| | |
| | |
Total Corporate Bonds
(Cost $153,350,012) | | |
Asset-Backed Securities — 19.2% |
Accelerated LLC Series 2021-1H, Class B, 1.90%, 10/20/2040 (a) | | |
ACHV ABS TRUST Series 2023-4CP, Class B, 7.24%, 11/25/2030 (a) | | |
ACM Auto Trust Series 2023-1A, Class B, 7.26%, 1/22/2030 (a) | | |
Aligned Data Centers Issuer LLC Series 2021-1A, Class A2, 1.94%, 8/15/2046 (a) | | |
American Credit Acceptance Receivables Trust | | |
Series 2022-1, Class D, 2.46%, 3/13/2028 (a) | | |
Series 2022-3, Class D, 5.83%, 10/13/2028 (a) | | |
Series 2023-1, Class D, 6.35%, 4/12/2029 (a) | | |
| | |
Series 2021-SFR3, Class E1, 2.33%, 10/17/2038 (a) | | |
Series 2021-SFR4, Class E1, 2.97%, 12/17/2038 (a) | | |
Series 2023-SFR2, Class B, 3.95%, 6/17/2040 (a) | | |
Aqua Finance Trust Series 2021-A, Class B, 2.40%, 7/17/2046 (a) | | |
AREIT Trust Series 2021-CRE5, Class C, 7.68%, 11/17/2038 ‡ (a) (f) | | |
Atlas Senior Loan Fund (Cayman Islands) Series 2019-13A, Class A1NR, 6.66%, 4/22/2031 (a) (f) | | |
Bain Capital Credit CLO Ltd. (Cayman Islands) Series 2017-1A, Class A1R, 6.55%, 7/20/2030 (a) (f) | | |
Bayview Opportunity Master Fund Trust Series 2024-SN1, Class D, 6.36%, 7/16/2029 (a) | | |
BOF Funding Trust Series 2023-CAR3, Class C, 4.50%, 7/26/2032 (a) | | |
Bridgecrest Lending Auto Securitization Trust Series 2024-1, Class C, 5.65%, 4/16/2029 | | |
SEE NOTES TO FINANCIAL STATEMENTS.
| J.P. Morgan Exchange-Traded Funds | |
JPMorgan Short Duration Core Plus ETF
SCHEDULE OF PORTFOLIO INVESTMENTSAS OF February 29, 2024 (continued)
| | |
Asset-Backed Securities — continued |
BSPRT Issuer Ltd. (Cayman Islands) Series 2021-FL7, Class B, 7.48%, 12/15/2038 (a) (f) | | |
Business Jet Securities LLC | | |
Series 2020-1A, Class A, 2.98%, 11/15/2035 ‡ (a) | | |
Series 2021-1A, Class A, 2.16%, 4/15/2036 ‡ (a) | | |
CarNow Auto Receivables Trust | | |
Series 2021-2A, Class C, 1.69%, 3/15/2027 (a) | | |
Series 2022-1A, Class D, 5.79%, 9/15/2027 (a) | | |
Carvana Auto Receivables Trust | | |
Series 2019-3A, Class E, 4.60%, 7/15/2026 (a) | | |
Series 2023-N3, Class C, 6.55%, 12/10/2029 (a) | | |
Series 2023-N4, Class B, 6.46%, 2/11/2030 (a) | | |
Series 2024-N1, Class C, 5.80%, 5/10/2030 (a) | | |
Continental Finance Credit Card ABS Master Trust Series 2021-A, Class A, 2.55%, 12/17/2029 (a) | | |
CPS Auto Receivables Trust | | |
Series 2019-B, Class E, 5.00%, 3/17/2025 (a) | | |
Series 2021-D, Class D, 2.31%, 12/15/2027 (a) | | |
Series 2022-A, Class D, 2.84%, 4/16/2029 (a) | | |
Series 2023-A, Class D, 6.44%, 4/16/2029 (a) | | |
Series 2023-C, Class C, 6.27%, 10/15/2029 (a) | | |
Series 2022-C, Class D, 6.45%, 4/15/2030 (a) | | |
Credit Acceptance Auto Loan Trust | | |
Series 2021-3A, Class C, 1.63%, 9/16/2030 (a) | | |
Series 2022-1A, Class C, 5.70%, 10/15/2032 (a) | | |
Series 2023-5A, Class C, 7.30%, 4/17/2034 (a) | | |
Crossroads Asset Trust Series 2021-A, Class C, 1.44%, 1/20/2026 (a) | | |
Dext ABS LLC Series 2021-1, Class A, 1.12%, 2/15/2028 (a) | | |
| | |
|
| | |
Series 2021-1A, Class D, 1.16%, 11/16/2026 (a) | | |
Series 2021-3A, Class D, 1.31%, 5/17/2027 (a) | | |
Series 2023-3A, Class B, 6.07%, 3/15/2028 (a) | | |
Series 2023-1A, Class C, 5.55%, 10/16/2028 (a) | | |
Series 2023-1A, Class D, 6.44%, 11/15/2028 (a) | | |
Series 2023-3A, Class C, 6.40%, 5/15/2029 (a) | | |
Elara HGV Timeshare Issuer LLC | | |
Series 2023-A, Class A, 6.16%, 2/25/2038 (a) | | |
Series 2023-A, Class C, 7.30%, 2/25/2038 (a) | | |
Equify ABS LLC Series 2023-1A, Class A, 7.20%, 9/15/2031 (a) | | |
Exeter Automobile Receivables Trust | | |
Series 2019-3A, Class D, 3.11%, 8/15/2025 (a) | | |
Series 2020-1A, Class E, 3.74%, 1/15/2027 (a) | | |
Series 2021-2A, Class D, 1.40%, 4/15/2027 | | |
Series 2022-5A, Class C, 6.51%, 12/15/2027 | | |
Series 2021-4A, Class D, 1.96%, 1/17/2028 | | |
Series 2023-3A, Class C, 6.21%, 6/15/2028 | | |
Series 2022-2A, Class D, 4.56%, 7/17/2028 | | |
Series 2022-5A, Class D, 7.40%, 2/15/2029 | | |
Series 2022-6A, Class D, 8.03%, 4/6/2029 | | |
Series 2023-4A, Class D, 6.95%, 12/17/2029 | | |
Series 2023-5A, Class D, 7.13%, 2/15/2030 | | |
FCI Funding LLC Series 2021-1A, Class A, 1.13%, 4/15/2033 ‡ (a) | | |
| | |
Series 2021-2A, Class A, 0.83%, 12/15/2026 (a) | | |
Series 2021-1A, Class A, 1.27%, 3/15/2027 (a) | | |
| | |
Series 2021-SFR3, Class E1, 2.99%, 12/17/2038 (a) | | |
Series 2022-SFR2, Class D, 4.50%, 7/17/2039 (a) | | |
SEE NOTES TO FINANCIAL STATEMENTS.
| J.P. Morgan Exchange-Traded Funds | |
| | |
Asset-Backed Securities — continued |
Flagship Credit Auto Trust | | |
Series 2021-1, Class D, 1.27%, 3/15/2027 (a) | | |
Series 2021-3, Class C, 1.46%, 9/15/2027 (a) | | |
Series 2022-1, Class D, 3.64%, 3/15/2028 (a) | | |
Series 2022-2, Class C, 5.30%, 4/17/2028 (a) | | |
Series 2022-3, Class C, 4.99%, 7/17/2028 (a) | | |
Series 2022-3, Class D, 6.00%, 7/17/2028 (a) | | |
Series 2023-3, Class C, 6.01%, 7/16/2029 (a) | | |
Foundation Finance Trust Series 2021-1A, Class A, 1.27%, 5/15/2041 (a) | | |
| | |
Series 2021-SFR1, Class B, 1.72%, 9/17/2038 (a) | | |
Series 2021-SFR1, Class D, 2.17%, 9/17/2038 (a) | | |
Galaxy CLO Ltd. (Cayman Islands) Series 2015-19A, Class A1RR, 6.53%, 7/24/2030 (a) (f) | | |
GLS Auto Receivables Issuer Trust | | |
Series 2019-4A, Class C, 3.06%, 8/15/2025 (a) | | |
Series 2021-3A, Class D, 1.48%, 7/15/2027 (a) | | |
Series 2020-4A, Class E, 3.51%, 10/15/2027 (a) | | |
Series 2022-1A, Class D, 3.97%, 1/18/2028 (a) | | |
Series 2023-3A, Class C, 6.01%, 5/15/2029 (a) | | |
GLS Auto Select Receivables Trust | | |
Series 2023-1A, Class A3, 5.96%, 10/16/2028 (a) | | |
Series 2023-1A, Class B, 6.09%, 3/15/2029 (a) | | |
Goldman Home Improvement Trust Issuer Trust Series 2021-GRN2, Class A, 1.15%, 6/25/2051 (a) | | |
Hilton Grand Vacations Trust Series 2023-1A, Class A, 5.72%, 1/25/2038 (a) | | |
Home Partners of America Trust Series 2021-3, Class E1, 3.20%, 1/17/2041 (a) | | |
| | |
|
LCM LP (Cayman Islands) Series 14A, Class AR, 6.62%, 7/20/2031 (a) (f) | | |
LCM Ltd. (Cayman Islands) Series 26A, Class A1, 6.65%, 1/20/2031 (a) (f) | | |
Lendbuzz Securitization Trust Series 2021-1A, Class A, 1.46%, 6/15/2026 (a) | | |
Lendingpoint Asset Securitization Trust Series 2022-A, Class C, 2.82%, 6/15/2029 (a) | | |
LendingPoint Asset Securitization Trust Series 2020-REV1, Class B, 4.49%, 10/15/2028 (a) | | |
LendingPoint Pass-Through Trust Series 2022-ST1, Class A, 2.50%, 3/15/2028 (a) | | |
| | |
Series 2021-1A, Class A, 1.90%, 11/20/2031 (a) | | |
Series 2023-1A, Class D, 8.69%, 5/20/2033 (a) | | |
LL ABS Trust Series 2021-1A, Class A, 1.07%, 5/15/2029 (a) | | |
LP LMS Asset Securitization Trust Series 2023-1A, Class A, 8.18%, 10/17/2033 (a) | | |
Mariner Finance Issuance Trust | | |
Series 2023-AA, Class A, 6.70%, 10/22/2035 (a) | | |
Series 2021-AA, Class A, 1.86%, 3/20/2036 (a) | | |
Merchants Fleet Funding LLC Series 2023-1A, Class A, 7.21%, 5/20/2036 (a) | | |
Mercury Financial Credit Card Master Trust Series 2023-1A, Class A, 8.04%, 9/20/2027 (a) | | |
Mission Lane Credit Card Master Trust Series 2023-A, Class A, 7.23%, 7/17/2028 (a) | | |
| | |
Series 2023-2A, Class C, 7.06%, 11/20/2040 (a) | | |
Series 2021-1WA, Class A, 1.14%, 1/22/2041 (a) | | |
Series 2021-1WA, Class B, 1.44%, 1/22/2041 (a) | | |
Neuberger Berman Loan Advisers CLO Ltd. (Cayman Islands) Series 2020-37A, Class AR, 6.55%, 7/20/2031 (a) (f) | | |
New Residential Mortgage Loan Trust | | |
Series 2022-SFR1, Class B, 2.85%, 2/17/2039 (a) | | |
Series 2022-SFR1, Class E1, 3.55%, 2/17/2039 (a) | | |
SEE NOTES TO FINANCIAL STATEMENTS.
| J.P. Morgan Exchange-Traded Funds | |
JPMorgan Short Duration Core Plus ETF
SCHEDULE OF PORTFOLIO INVESTMENTSAS OF February 29, 2024 (continued)
| | |
Asset-Backed Securities — continued |
NMEF Funding LLC Series 2021-A, Class B, 1.85%, 12/15/2027 (a) | | |
NRZ Excess Spread-Collateralized Notes Series 2021-FNT1, Class A, 2.98%, 3/25/2026 (a) | | |
Octane Receivables Trust Series 2023-1A, Class D, 7.76%, 3/20/2030 (a) | | |
Oportun Funding XIV LLC Series 2021-A, Class A, 1.21%, 3/8/2028 (a) | | |
| | |
Series 2021-B, Class B, 1.96%, 5/8/2031 (a) | | |
Series 2022-A, Class B, 5.25%, 6/9/2031 (a) | | |
Pagaya AI Debt Selection Trust Series 2021-HG1, Class A, 1.22%, 1/16/2029 (a) | | |
Palmer Square Loan Funding Ltd. (Cayman Islands) Series 2021-2A, Class A1, 6.38%, 5/20/2029 (a) (f) | | |
PFP Ltd. (Cayman Islands) Series 2021-7, Class C, 7.09%, 4/14/2038 (a) (f) | | |
| | |
Series 2021-NPL3, Class A1, 1.87%, 7/25/2051 (a) (e) | | |
Series 2021-NPL6, Class A1, 2.49%, 7/25/2051 (a) (e) | | |
Series 2021-RN4, Class A1, 2.49%, 10/25/2051 (a) (f) | | |
Pretium Mortgage Credit Partners I LLC | | |
Series 2021-NPL2, Class A1, 1.99%, 6/27/2060 (a) (e) | | |
Series 2021-NPL1, Class A1, 2.24%, 9/27/2060 (a) (e) | | |
Series 2021-NPL4, Class A1, 2.36%, 10/27/2060 (a) (e) | | |
Progress Residential Series 2021-SFR3, Class E1, 2.54%, 5/17/2026 (a) | | |
Progress Residential Trust | | |
Series 2021-SFR8, Class E1, 2.38%, 10/17/2038 (a) | | |
Series 2022-SFR3, Class D, 4.45%, 4/17/2039 (a) | | |
Series 2024-SFR1, Class D, 3.75%, 2/17/2041 (a) | | |
| | |
Series 2021-2, Class A1, 2.12%, 3/25/2026 (a) (f) | | |
Series 2021-5, Class A1, 1.79%, 6/25/2026 (a) (e) | | |
| | |
|
Series 2021-6, Class A1, 1.79%, 7/25/2026 (a) (e) | | |
Series 2021-7, Class A1, 1.87%, 8/25/2026 (a) (e) | | |
Series 2021-8, Class A1, 1.74%, 9/25/2026 (a) (f) | | |
Series 2021-11, Class A1, 2.49%, 11/25/2026 (a) (e) | | |
Purchasing Power Funding LLC Series 2024-A, Class B, 6.43%, 8/15/2028 (a) | | |
Reach ABS Trust Series 2023-1A, Class A, 7.05%, 2/18/2031 (a) | | |
Republic Finance Issuance Trust Series 2021-A, Class A, 2.30%, 12/22/2031 (a) | | |
Santander Drive Auto Receivables Trust | | |
Series 2021-3, Class D, 1.33%, 9/15/2027 | | |
Series 2022-3, Class C, 4.49%, 8/15/2029 | | |
Series 2022-4, Class C, 5.00%, 11/15/2029 | | |
Series 2022-6, Class D, 5.69%, 2/18/2031 | | |
Series 2023-6, Class C, 6.40%, 3/17/2031 | | |
Series 2023-4, Class C, 6.04%, 12/15/2031 | | |
SCF Equipment Leasing LLC Series 2021-1A, Class D, 1.93%, 9/20/2030 (a) | | |
Sierra Timeshare Receivables Funding LLC Series 2023-2A, Class A, 5.80%, 4/20/2040 (a) | | |
Skopos Auto Receivables Trust Series 2019-1A, Class D, 5.24%, 4/15/2025 (a) | | |
Sound Point CLO Ltd. (Cayman Islands) Series 2019-1A, Class AR, 6.66%, 1/20/2032 (a) (f) | | |
Stratus CLO Ltd. (Cayman Islands) Series 2021-1A, Class A, 6.38%, 12/29/2029 (a) (f) | | |
Symphony CLO Ltd. (Cayman Islands) Series 2016-18A, Class A1RR, 6.68%, 7/23/2033 (a) (f) | | |
| | |
Series 2021-SFR1, Class E1, 2.79%, 7/17/2038 (a) | | |
Series 2023-SFR1, Class B, 5.10%, 7/17/2040 (a) | | |
Upstart Pass-Through Trust | | |
Series 2021-ST4, Class A, 2.00%, 7/20/2027 (a) | | |
Series 2021-ST5, Class A, 2.00%, 7/20/2027 (a) | | |
Series 2021-ST8, Class A, 1.75%, 10/20/2029 (a) | | |
SEE NOTES TO FINANCIAL STATEMENTS.
| J.P. Morgan Exchange-Traded Funds | |
| | |
Asset-Backed Securities — continued |
Series 2021-ST9, Class A, 1.70%, 11/20/2029 (a) | | |
Series 2021-ST10, Class A, 2.25%, 1/20/2030 (a) | | |
Series 2022-ST1, Class A, 2.60%, 3/20/2030 (a) | | |
Upstart Securitization Trust | | |
Series 2021-2, Class B, 1.75%, 6/20/2031 (a) | | |
Series 2021-4, Class B, 1.84%, 9/20/2031 (a) | | |
Series 2021-5, Class B, 2.49%, 11/20/2031 (a) | | |
Series 2022-4, Class A, 5.98%, 8/20/2032 (a) | | |
US Auto Funding Trust Series 2022-1A, Class B, 5.13%, 12/15/2025 (a) | | |
| | |
Series 2021-NPL2, Class A1, 2.12%, 3/27/2051 (a) (e) | | |
Series 2021-NPL3, Class A1, 1.74%, 5/25/2051 (a) (e) | | |
Series 2021-NPL4, Class A1, 1.87%, 8/25/2051 (a) (e) | | |
Venture CLO Ltd. (Cayman Islands) Series 2018-32A, Class A2A, 6.63%, 7/18/2031 (a) (f) | | |
Veros Auto Receivables Trust | | |
Series 2022-1, Class A, 3.47%, 12/15/2025 (a) | | |
Series 2023-1, Class C, 8.32%, 11/15/2028 (a) | | |
VOLT CIII LLC Series 2021-CF1, Class A1, 1.99%, 8/25/2051 (a) (e) | | |
VOLT CV LLC Series 2021-CF2, Class A1, 2.49%, 11/27/2051 (a) (e) | | |
VOLT XCIX LLC Series 2021-NPL8, Class A1, 2.12%, 4/25/2051 (a) (e) | | |
VOLT XCVI LLC Series 2021-NPL5, Class A1, 5.12%, 3/27/2051 (a) (e) | | |
VOLT XCVII LLC Series 2021-NPL6, Class A1, 2.24%, 4/25/2051 (a) (e) | | |
Westlake Automobile Receivables Trust | | |
Series 2021-1A, Class D, 1.23%, 4/15/2026 (a) | | |
| | |
|
Series 2021-3A, Class D, 2.12%, 1/15/2027 (a) | | |
Series 2023-1A, Class D, 6.79%, 11/15/2028 (a) | | |
Total Asset-Backed Securities
(Cost $79,420,005) | | |
U.S. Treasury Obligations — 18.7% |
| | |
| | |
| | |
| | |
| | |
| | |
| | |
| | |
| | |
| | |
| | |
| | |
| | |
| | |
| | |
| | |
| | |
| | |
| | |
| | |
| | |
| | |
| | |
| | |
| | |
| | |
| | |
| | |
Total U.S. Treasury Obligations
(Cost $77,289,679) | | |
Mortgage-Backed Securities — 12.5% |
FHLMC Pool # 841368 ARM, 6.73%, 9/1/2047 (f) | | |
FHLMC Gold Pools, 30 Year Pool # G08878, 4.50%, 5/1/2049 | | |
FHLMC UMBS, 10 Year Pool # RD5034, 2.00%, 9/1/2030 | | |
| | |
Pool # ZS6689, 2.50%, 4/1/2028 | | |
SEE NOTES TO FINANCIAL STATEMENTS.
| J.P. Morgan Exchange-Traded Funds | |
JPMorgan Short Duration Core Plus ETF
SCHEDULE OF PORTFOLIO INVESTMENTSAS OF February 29, 2024 (continued)
| | |
Mortgage-Backed Securities — continued |
Pool # SB0725, 4.00%, 8/1/2037 | | |
Pool # SB8184, 4.00%, 10/1/2037 | | |
Pool # SB8189, 4.00%, 11/1/2037 | | |
Pool # SB8222, 4.50%, 4/1/2038 | | |
Pool # SB8229, 4.50%, 5/1/2038 | | |
Pool # SB8261, 5.50%, 10/1/2038 (g) | | |
| | |
Pool # ZT1703, 4.00%, 1/1/2049 | | |
Pool # SD8231, 4.50%, 7/1/2052 | | |
Pool # SD8246, 5.00%, 9/1/2052 | | |
Pool # SD8343, 6.00%, 7/1/2053 | | |
FNMA Pool # BM4562 ARM, 6.34%, 5/1/2047 (f) | | |
| | |
Pool # FM1156, 2.50%, 4/1/2033 | | |
Pool # MA4361, 2.50%, 6/1/2036 | | |
Pool # FM7767, 2.00%, 7/1/2036 | | |
Pool # CB1216, 2.50%, 7/1/2036 | | |
Pool # FS1563, 2.50%, 7/1/2036 | | |
Pool # FS1329, 2.00%, 2/1/2037 | | |
Pool # MA4640, 3.50%, 6/1/2037 | | |
Pool # MA4944, 4.50%, 3/1/2038 | | |
Pool # MA5093, 5.00%, 7/1/2038 | | |
| | |
Pool # FM3933, 3.00%, 6/1/2037 | | |
Pool # FM3075, 3.50%, 11/1/2039 | | |
Pool # CA8310, 2.50%, 12/1/2040 | | |
Pool # MA4780, 4.50%, 10/1/2042 | | |
| | |
Pool # FM2972, 4.00%, 12/1/2044 | | |
Pool # FS2237, 4.00%, 10/1/2046 | | |
Pool # BM1285, 4.50%, 5/1/2047 | | |
Pool # FS1847, 4.00%, 1/1/2049 | | |
Pool # FS1891, 4.00%, 1/1/2050 | | |
Pool # FS0085, 4.00%, 11/1/2050 | | |
Pool # MA4733, 4.50%, 9/1/2052 | | |
Pool # MA5039, 5.50%, 6/1/2053 | | |
| | |
Pool # MA8201, 4.50%, 8/20/2052 | | |
Pool # MA8429, 5.50%, 11/20/2052 | | |
Total Mortgage-Backed Securities
(Cost $52,293,083) | | |
| | |
Commercial Mortgage-Backed Securities — 4.5% |
BAMLL Commercial Mortgage Securities Trust | | |
Series 2015-200P, Class C, 3.60%, 4/14/2033 (a) (f) | | |
Series 2015-200P, Class D, 3.60%, 4/14/2033 (a) (f) | | |
Beast Mortgage Trust Series 2021-1818, Class B, 6.88%, 3/15/2036 (a) (f) | | |
Benchmark Mortgage Trust Series 2024-V5, Class C, 6.97%, 1/10/2057 (f) | | |
BMO Mortgage Trust Series 2024-5C3, Class C, 6.86%, 2/15/2057 (f) | | |
BX Commercial Mortgage Trust Series 2021-VOLT, Class D, 7.08%, 9/15/2036 (a) (f) | | |
| | |
Series 2021-RISE, Class D, 7.18%, 11/15/2036 (a) (f) | | |
Series 2022-LBA6, Class D, 7.32%, 1/15/2039 (a) (f) | | |
Series 2024-MF, Class B, 6.99%, 2/15/2039 (a) (f) | | |
Citigroup Commercial Mortgage Trust | | |
Series 2021-PRM2, Class F, 9.18%, 10/15/2038 (a) (f) | | |
Series 2015-GC27, Class B, 3.77%, 2/10/2048 | | |
Series 2015-GC27, Class C, 4.42%, 2/10/2048 (f) | | |
Series 2015-GC29, Class C, 4.14%, 4/10/2048 (f) | | |
Series 2015-GC31, Class C, 4.03%, 6/10/2048 (f) | | |
Commercial Mortgage Trust | | |
Series 2019-WCM, Class G, 8.13%, 10/15/2034 (a) (f) | | |
Series 2014-UBS5, Class C, 4.60%, 9/10/2047 (f) | | |
Series 2014-CR20, Class C, 4.45%, 11/10/2047 (f) | | |
Series 2015-CR26, Class B, 4.46%, 10/10/2048 (f) | | |
Series 2015-PC1, Class B, 4.28%, 7/10/2050 (f) | | |
CSAIL Commercial Mortgage Trust | | |
Series 2015-C4, Class E, 3.56%, 11/15/2048 (f) | | |
Series 2015-C2, Class C, 4.17%, 6/15/2057 (f) | | |
SEE NOTES TO FINANCIAL STATEMENTS.
| J.P. Morgan Exchange-Traded Funds | |
| | |
Commercial Mortgage-Backed Securities — continued |
FHLMC, Multi-Family Structured Pass-Through Certificates | | |
Series K068, Class X1, IO, 0.42%, 8/25/2027 (f) | | |
Series K111, Class X3, IO, 3.18%, 4/25/2048 (f) | | |
Series K110, Class X3, IO, 3.40%, 6/25/2048 (f) | | |
Series K115, Class X3, IO, 2.96%, 9/25/2048 (f) | | |
Series K125, Class X3, IO, 2.65%, 2/25/2049 (f) | | |
| | |
Series 2018-K732, Class C, 4.06%, 5/25/2025 (a) (f) | | |
Series 2014-K41, Class C, 3.83%, 11/25/2047 (a) (f) | | |
Series 2016-K57, Class C, 3.92%, 8/25/2049 (a) (f) | | |
Series 2016-K58, Class C, 3.74%, 9/25/2049 (a) (f) | | |
GS Mortgage Securities Trust | | |
Series 2016-GS2, Class B, 3.76%, 5/10/2049 (f) | | |
Series 2017-GS5, Class D, 3.51%, 3/10/2050 (a) (f) | | |
Independence Plaza Trust Series 2018-INDP, Class C, 4.16%, 7/10/2035 (a) | | |
JPMBB Commercial Mortgage Securities Trust | | |
Series 2015-C31, Class C, 4.62%, 8/15/2048 (f) | | |
Series 2016-C1, Class D1, 4.20%, 3/17/2049 (a) (f) | | |
JPMCC Commercial Mortgage Securities Trust | | |
Series 2017-JP5, Class C, 3.75%, 3/15/2050 (f) | | |
Series 2017-JP5, Class D, 4.50%, 3/15/2050 (a) (f) | | |
JPMorgan Chase Commercial Mortgage Securities Trust | | |
Series 2013-C16, Class D, 4.94%, 12/15/2046 (a) (f) | | |
Series 2016-JP3, Class C, 3.42%, 8/15/2049 (f) | | |
Life Mortgage Trust Series 2021-BMR, Class C, 6.53%, 3/15/2038 (a) (f) | | |
MHC Commercial Mortgage Trust Series 2021-MHC, Class D, 7.03%, 4/15/2038 (a) (f) | | |
| | |
|
Morgan Stanley Bank of America Merrill Lynch Trust | | |
Series 2015-C24, Class D, 3.26%, 5/15/2048 (a) | | |
Series 2015-C25, Class B, 4.52%, 10/15/2048 (f) | | |
SG Commercial Mortgage Securities Trust Series 2016-C5, Class B, 3.93%, 10/10/2048 | | |
SMRT Series 2022-MINI, Class E, 8.02%, 1/15/2039 (a) (f) | | |
STWD Mortgage Trust (Cayman Islands) Series 2021-LIH, Class B, 7.09%, 11/15/2036 (a) (f) | | |
Velocity Commercial Capital Loan Trust Series 2021-2, Class A, 1.52%, 8/25/2051 (a) (f) | | |
Wells Fargo Commercial Mortgage Trust | | |
Series 2015-NXS4, Class B, 4.22%, 12/15/2048 (f) | | |
Series 2015-LC22, Class D, 4.54%, 9/15/2058 (f) | | |
WFRBS Commercial Mortgage Trust | | |
Series 2013-C11, Class C, 4.00%, 3/15/2045 (f) | | |
Series 2014-C21, Class C, 4.23%, 8/15/2047 (f) | | |
Series 2014-C25, Class B, 4.24%, 11/15/2047 (f) | | |
Series 2014-C22, Class C, 3.75%, 9/15/2057 (f) | | |
Series 2014-C22, Class AS, 4.07%, 9/15/2057 (f) | | |
Total Commercial Mortgage-Backed Securities
(Cost $19,453,343) | | |
Collateralized Mortgage Obligations — 4.4% |
Connecticut Avenue Securities Trust | | |
Series 2022-R01, Class 1M2, 7.22%, 12/25/2041 (a) (f) | | |
Series 2022-R02, Class 2M2, 8.32%, 1/25/2042 (a) (f) | | |
| | |
Series 2021-DNA2, Class M2, 7.62%, 8/25/2033 (a) (f) | | |
Series 2022-DNA1, Class M1A, 6.32%, 1/25/2042 (a) (f) | | |
Series 2023-HQA3, Class M2, 8.67%, 11/25/2043 (a) (f) | | |
Series 2020-HQA3, Class B1, 11.19%, 7/25/2050 (a) (f) | | |
SEE NOTES TO FINANCIAL STATEMENTS.
| J.P. Morgan Exchange-Traded Funds | |
JPMorgan Short Duration Core Plus ETF
SCHEDULE OF PORTFOLIO INVESTMENTSAS OF February 29, 2024 (continued)
| | |
Collateralized Mortgage Obligations — continued |
| | |
Series 2673, Class PE, 5.50%, 9/15/2033 | | |
Series 4754, Class VG, 4.00%, 12/15/2036 | | |
Series 3878, Class PL, 4.50%, 11/15/2040 | | |
Series 4376, Class A, 4.00%, 7/15/2041 | | |
Series 4583, Class UP, 3.00%, 7/15/2045 | | |
Series 4599, Class PA, 3.00%, 9/15/2045 | | |
Series 4718, Class DA, 3.00%, 2/15/2047 | | |
Series 5194, Class H, 2.50%, 10/25/2047 | | |
Series 5021, Class MI, IO, 3.00%, 10/25/2050 | | |
| | |
Series 2012-136, Class DL, 3.50%, 12/25/2042 | | |
Series 2022-42, Class EA, 3.75%, 6/25/2052 | | |
Series 2022-43, Class P, 4.00%, 7/25/2052 | | |
GNMA Series 2021-9, Class MI, IO, 2.50%, 1/20/2051 | | |
Legacy Mortgage Asset Trust Series 2021-GS3, Class A1, 1.75%, 7/25/2061 (a) (e) | | |
LHOME Mortgage Trust Series 2024-RTL1, Class A1, 7.02%, 1/25/2029 (a) (e) | | |
NYMT Loan Trust Series 2021-SP1, Class A1, 1.67%, 8/25/2061 (a) (e) | | |
Verus Securitization Trust Series 2021-2, Class M1, 2.19%, 2/25/2066 (a) (f) | | |
Total Collateralized Mortgage Obligations
(Cost $18,275,257) | | |
Foreign Government Securities — 1.1% |
Benin Government Bond 7.96%, 2/13/2038 (a) | | |
Dominican Republic Government Bond | | |
| | |
| | |
| | |
| | |
Federal Republic of Nigeria | | |
| | |
| | |
Gabonese Republic 6.95%, 6/16/2025 (c) | | |
Hashemite Kingdom of Jordan | | |
| | |
| | |
Istanbul Metropolitan Municipality 10.50%, 12/6/2028 (a) | | |
| | |
|
| | |
| | |
| | |
Republic of Cote d'Ivoire | | |
| | |
5.75%, 12/31/2032 (c) (e) | | |
| | |
Republic of El Salvador 8.63%, 2/28/2029 (c) | | |
Republic of Iraq 5.80%, 1/15/2028 (c) | | |
Republic of Kenya 9.75%, 2/16/2031 (a) | | |
Republic of Senegal 6.25%, 5/23/2033 (c) | | |
Republic of Turkey 9.88%, 1/15/2028 | | |
Turkiye Ihracat Kredi Bankasi A/S 9.38%, 1/31/2026 (a) | | |
Total Foreign Government Securities
(Cost $4,767,726) | | |
Municipal Bonds — 0.0% (f) (h) ^ |
|
California Housing Finance Agency Series 2021-1, Class X, Rev., 0.80%, 11/20/2035 (Cost $103,392) | | |
| | |
Short-Term Investments — 6.6% |
Investment Companies — 6.3% |
JPMorgan Prime Money Market Fund Class IM Shares, 5.44% (i) (j)
(Cost $25,963,821) | | |
| | |
U.S. Treasury Obligations — 0.3% |
U.S. Treasury Bills, 5.19%, 8/8/2024 (k) (l)
(Cost $955,993) | | |
Total Short-Term Investments
(Cost $26,919,814) | | |
Total Investments — 103.9%
(Cost $431,872,311) | | |
Liabilities in Excess of Other Assets — (3.9)% | | |
| | |
Percentages indicated are based on net assets. |
SEE NOTES TO FINANCIAL STATEMENTS.
| J.P. Morgan Exchange-Traded Funds | |
| Adjustable Rate Mortgage. The interest rate shown is the rate in effect as of February 29, 2024. |
| Collateralized Loan Obligations |
| Chicago Mercantile Exchange |
| Federal Home Loan Mortgage Corp. |
| Federal National Mortgage Association |
| Government National Mortgage Association |
| Interest Only represents the right to receive the monthly interest payments on an underlying pool of mortgage loans. The principal amount shown represents the par value on the underlying pool. The yields on these securities are subject to accelerated principal paydowns as a result of prepayment or refinancing of the underlying pool of mortgage instruments. As a result, interest income may be reduced considerably. |
| |
| Real Estate Investment Trust |
| Real Estate Mortgage Investment Conduit |
| |
| Limited partnership with share capital |
| Secured Overnight Financing Rate |
| Compounding index of the Secured Overnight Financing Rate |
| Uniform Mortgage-Backed Securities |
| Amount rounds to less than 0.1% of net assets. |
| Value determined using significant unobservable inputs. | |
| Securities exempt from registration under Rule 144A or section 4(a)(2), of the Securities Act of 1933, as amended. | |
| Variable or floating rate security, linked to the referenced benchmark. The interest rate shown is the current rate as of February 29, 2024. | |
| Security exempt from registration pursuant to Regulation S under the Securities Act of 1933, as amended. Regulation S applies to securities offerings that are made outside of the United States and do not involve direct selling efforts in the United States and as such may have restrictions on resale. | |
| | |
| Step bond. Interest rate is a fixed rate for an initial period that either resets at a specific date or may reset in the future contingent upon a predetermined trigger. The interest rate shown is the current rate as of February 29, 2024. | |
| Variable or floating rate security, the interest rate of which adjusts periodically based on changes in current interest rates and prepayments on the underlying pool of assets. The interest rate shown is the current rate as of February 29, 2024. | |
| All or a portion of the security is a when-issued security, delayed delivery security, or forward commitment. | |
| The date shown represents the earliest of the prerefunded date, next put date or final maturity date. | |
| Investment in an affiliated fund, which is registered under the Investment Company Act of 1940, as amended, and is advised by J.P. Morgan Investment Management Inc. | |
| The rate shown is the current yield as of February 29, 2024. | |
| The rate shown is the effective yield as of February 29, 2024. | |
| All or a portion of this security is deposited with the broker as initial margin for futures contracts or centrally cleared swaps. | |
Futures contracts outstanding as of February 29, 2024:
| | | | | VALUE AND
UNREALIZED
APPRECIATION
(DEPRECIATION) ($) |
| | | | | |
U.S. Treasury 2 Year Note | | | | | |
U.S. Treasury 5 Year Note | | | | | |
| | | | | |
| | | | | |
U.S. Treasury 10 Year Note | | | | | |
U.S. Treasury 10 Year Ultra Note | | | | | |
| | | | | |
| | | | | |
| | | | | |
SEE NOTES TO FINANCIAL STATEMENTS.
| J.P. Morgan Exchange-Traded Funds | |
JPMorgan Short Duration Core Plus ETF
SCHEDULE OF PORTFOLIO INVESTMENTSAS OF February 29, 2024 (continued)
Centrally Cleared Credit default swap contracts outstanding — sell protection(**) as of February 29, 2024:
REFERENCE
OBLIGATION/INDEX | FINANCING
RATE PAID
BY THE FUND
(%) | | | | | UPFRONT
PAYMENTS
(RECEIPTS)
| UNREALIZED
APPRECIATION
(DEPRECIATION)
($) | |
| | | | | | | | |
| The Fund, as a seller of credit protection, receives periodic payments and may also receive or pay an upfront premium from or to the protection buyer, and is obligated to make a contingent payment, upon occurrence of a credit event with respect to an underlying reference obligation, as defined under the terms of individual swap contracts. |
| Implied credit spreads are an indication of the seller's performance risk, related to the likelihood of a credit event occurring that would require a seller to make payment to a buyer. Implied credit spreads are used to determine the value of swap contracts and reflect the cost of buying/selling protection, which may include upfront payments made to enter into the contract. Therefore, higher spreads would indicate a greater likelihood that a seller will be obligated to perform (i.e. make payment) under the swap contract.Increasing values, in absolute terms and relative to notional amounts, are also indicative of greater performance risk. Implied credit spreads for credit default swaps on credit indices are linked to the weighted average spread across the underlying reference obligations included in a particular index. |
| The notional amount is the maximum amount that a seller of credit protection would be obligated to pay and a buyer of credit protection would receive, upon occurrence of a credit event. |
| Upfront payments and receipts generally represent premiums paid or received at the initiation of the agreement to compensate the differences between the stated terms of the swap agreement and current market conditions (credit spreads, interest rates and other relevant factors). |
| |
| Credit Default Swap Index |
| |
SEE NOTES TO FINANCIAL STATEMENTS.
| J.P. Morgan Exchange-Traded Funds | |
JPMorgan Ultra-Short Income ETF
SCHEDULE OF PORTFOLIO INVESTMENTSAS OF February 29, 2024
| | |
|
Aerospace & Defense — 0.1% |
BAE Systems Holdings, Inc. (United Kingdom) 3.80%, 10/7/2024 (a) | | |
L3Harris Technologies, Inc. |
| | |
| | |
RTX Corp. 3.20%, 3/15/2024 | | |
| | |
Automobile Components — 0.1% |
Magna International, Inc. (Canada) 3.63%, 6/15/2024 | | |
|
BMW US Capital LLC (Germany) |
(SOFRINDX + 0.53%), 5.89%, 4/1/2024 (a) (b) | | |
(SOFRINDX + 0.62%), 5.94%, 8/11/2025 (a) (b) | | |
|
| | |
| | |
| | |
| | |
| | |
| | |
(SOFR + 1.32%), 6.65%, 11/3/2025 (a) (b) | | |
| | |
| | |
| | |
| | |
Kia Corp. (South Korea) 1.00%, 4/16/2024 (a) | | |
Mercedes-Benz Finance North America LLC (Germany) |
| | |
| | |
| | |
Volkswagen Group of America Finance LLC (Germany) |
| | |
(SOFR + 0.93%), 6.30%, 9/12/2025 (a) (b) | | |
4.63%, 11/13/2025 (a) (c) | | |
| | |
| | |
| | |
| | |
|
|
ABN AMRO Bank NV (Netherlands) (US Treasury Yield Curve Rate T Note Constant Maturity 1 Year + 1.65%), 6.34%, 9/18/2027 (a) (b) | | |
ASB Bank Ltd. (New Zealand) 3.13%, 5/23/2024 (a) (c) | | |
Australia & New Zealand Banking Group Ltd. (Australia) |
| | |
| | |
Banco Santander SA (Spain) |
| | |
| | |
(US Treasury Yield Curve Rate T Note Constant Maturity 1 Year + 0.45%), 5.74%, 6/30/2024 (b) | | |
| | |
| | |
|
(SOFR + 0.41%), 5.78%, 6/14/2024 (b) | | |
(3-MONTH CME TERM SOFR + 0.97%), 3.46%, 3/15/2025 (b) | | |
(SOFR + 0.69%), 0.98%, 4/22/2025 (b) | | |
(SOFR + 1.11%), 3.84%, 4/25/2025 (b) | | |
(3-MONTH CME TERM SOFR + 1.35%), 3.09%, 10/1/2025 (b) | | |
(3-MONTH CME TERM SOFR + 0.90%), 2.02%, 2/13/2026 (b) | | |
(SOFR + 1.29%), 5.08%, 1/20/2027 (b) | | |
Bank of America NA (SOFR + 0.78%), 6.10%, 8/18/2025 (b) | | |
Bank of Montreal (Canada) |
| | |
(SOFRINDX + 1.16%), 6.53%, 12/11/2026 (b) | | |
Bank of New Zealand (New Zealand) 4.85%, 2/7/2028 (a) | | |
Bank of Nova Scotia (The) (Canada) |
| | |
| | |
(SOFR + 0.46%), 5.81%, 1/10/2025 (b) | | |
| | |
| | |
SEE NOTES TO FINANCIAL STATEMENTS.
| J.P. Morgan Exchange-Traded Funds | |
JPMorgan Ultra-Short Income ETF
SCHEDULE OF PORTFOLIO INVESTMENTSAS OF February 29, 2024 (continued)
| | |
Corporate Bonds — continued |
|
| | |
| | |
Banque Federative du Credit Mutuel SA (France) |
| | |
| | |
| | |
Barclays plc (United Kingdom) (3-MONTH SOFR + 1.61%), 3.93%, 5/7/2025 (b) | | |
BNP Paribas SA (France) 3.38%, 1/9/2025 (a) | | |
|
| | |
| | |
(SOFR + 0.96%), 6.31%, 9/25/2025 (a) (b) | | |
| | |
| | |
Canadian Imperial Bank of Commerce (Canada) |
(SOFR + 0.94%), 6.29%, 4/7/2025 (b) | | |
| | |
| | |
|
(SOFR + 0.69%), 6.02%, 10/30/2024 (b) | | |
(SOFR + 0.67%), 0.98%, 5/1/2025 (b) | | |
(SOFR + 1.37%), 4.14%, 5/24/2025 (b) | | |
(SOFR + 0.53%), 1.28%, 11/3/2025 (b) | | |
| | |
(SOFR + 0.69%), 2.01%, 1/25/2026 (b) | | |
(SOFR + 1.53%), 3.29%, 3/17/2026 (b) | | |
(3-MONTH CME TERM SOFR + 1.51%), 6.84%, 7/1/2026 (b) | | |
Citizens Bank NA (SOFR + 1.02%), 5.28%, 1/26/2026 (b) | | |
Commonwealth Bank of Australia (Australia) (SOFR + 0.74%), 6.11%, 3/14/2025 (a) (b) | | |
Credit Agricole SA (France) |
| | |
| | |
| | |
|
|
|
(SOFRINDX + 0.81%), 2.97%, 3/28/2025 (a) (b) | | |
(SOFRINDX + 1.95%), 5.90%, 10/9/2026 (a) (b) | | |
Federation des Caisses Desjardins du Quebec (Canada) |
| | |
(SOFR + 0.43%), 5.75%, 5/21/2024 (a) (b) | | |
| | |
(SOFRINDX + 1.09%), 5.28%, 1/23/2026 (a) (b) | | |
Fifth Third Bancorp 2.55%, 5/5/2027 | | |
HSBC Holdings plc (United Kingdom) |
(3-MONTH CME TERM SOFR + 1.47%), 3.80%, 3/11/2025 (b) | | |
(SOFR + 0.71%), 0.98%, 5/24/2025 (b) | | |
(3-MONTH CME TERM SOFR + 1.40%), 2.63%, 11/7/2025 (b) | | |
HSBC USA, Inc. 5.63%, 3/17/2025 | | |
ING Groep NV (Netherlands) |
| | |
(SOFR + 1.56%), 6.08%, 9/11/2027 (b) | | |
|
(SOFRINDX + 0.32%), 5.69%, 6/14/2024 (b) | | |
| | |
Lloyds Banking Group plc (United Kingdom) |
| | |
| | |
(US Treasury Yield Curve Rate T Note Constant Maturity 1 Year + 1.00%), 2.44%, 2/5/2026 (b) | | |
(US Treasury Yield Curve Rate T Note Constant Maturity 1 Year + 1.38%), 5.46%, 1/5/2028 (b) | | |
Mitsubishi UFJ Financial Group, Inc. (Japan) |
| | |
| | |
(US Treasury Yield Curve Rate T Note Constant Maturity 1 Year + 0.55%), 0.95%, 7/19/2025 (b) | | |
(US Treasury Yield Curve Rate T Note Constant Maturity 1 Year + 1.55%), 5.06%, 9/12/2025 (b) | | |
SEE NOTES TO FINANCIAL STATEMENTS.
| J.P. Morgan Exchange-Traded Funds | |
| | |
Corporate Bonds — continued |
|
(US Treasury Yield Curve Rate T Note Constant Maturity 1 Year + 0.45%), 0.96%, 10/11/2025 (b) | | |
(US Treasury Yield Curve Rate T Note Constant Maturity 1 Year + 1.08%), 5.72%, 2/20/2026 (b) | | |
Mizuho Financial Group, Inc. (Japan) |
| | |
(3-MONTH CME TERM SOFR + 1.09%), 2.23%, 5/25/2026 (b) | | |
Morgan Stanley Bank NA (SOFR + 1.08%), 4.95%, 1/14/2028 (b) | | |
National Australia Bank Ltd. (Australia) |
| | |
(SOFR + 0.65%), 6.00%, 12/10/2025 (a) (b) | | |
(SOFR + 0.55%), 5.88%, 1/29/2026 (a) (b) | | |
National Bank of Canada (Canada) |
| | |
| | |
(SOFR + 1.01%), 3.75%, 6/9/2025 (b) | | |
NatWest Group plc (United Kingdom) |
(3-MONTH SOFR + 1.76%), 4.27%, 3/22/2025 (b) | | |
| | |
(US Treasury Yield Curve Rate T Note Constant Maturity 1 Year + 1.35%), 5.85%, 3/2/2027 (b) (c) | | |
(US Treasury Yield Curve Rate T Note Constant Maturity 1 Year + 1.10%), 5.58%, 3/1/2028 (b) | | |
NatWest Markets plc (United Kingdom) |
| | |
(SOFR + 0.53%), 5.85%, 8/12/2024 (a) (b) | | |
PNC Financial Services Group, Inc. (The) (SOFRINDX + 1.09%), 4.76%, 1/26/2027 (b) | | |
Royal Bank of Canada (Canada) 4.88%, 1/19/2027 | | |
Societe Generale SA (France) |
| | |
| | |
| | |
| | |
|
|
(US Treasury Yield Curve Rate T Note Constant Maturity 1 Year + 1.05%), 2.23%, 1/21/2026 (a) (b) | | |
(US Treasury Yield Curve Rate T Note Constant Maturity 1 Year + 1.50%), 5.52%, 1/19/2028 (a) (b) | | |
Standard Chartered plc (United Kingdom) |
(US Treasury Yield Curve Rate T Note Constant Maturity 1 Year + 0.88%), 1.21%, 3/23/2025 (a) (b) | | |
(US Treasury Yield Curve Rate T Note Constant Maturity 1 Year + 3.10%), 7.78%, 11/16/2025 (a) (b) | | |
(US Treasury Yield Curve Rate T Note Constant Maturity 1 Year + 0.95%), 1.82%, 11/23/2025 (a) (b) | | |
(SOFR + 1.74%), 7.10%, 3/30/2026 (a) (b) | | |
(US Treasury Yield Curve Rate T Note Constant Maturity 1 Year + 1.85%), 6.19%, 7/6/2027 (a) (b) | | |
Sumitomo Mitsui Financial Group, Inc. (Japan) |
| | |
| | |
Sumitomo Mitsui Trust Bank Ltd. (Japan) |
| | |
(SOFR + 0.44%), 5.81%, 9/16/2024 (a) (b) | | |
| | |
| | |
Svenska Handelsbanken AB (Sweden) 5.25%, 6/15/2026 (a) | | |
Toronto-Dominion Bank (The) (Canada) 1.20%, 6/3/2026 | | |
|
(SOFR + 0.51%), 0.81%, 5/19/2025 (b) | | |
(SOFR + 1.32%), 3.91%, 4/25/2026 (b) | | |
(SOFR + 2.00%), 2.19%, 4/30/2026 (b) | | |
(SOFR + 1.56%), 4.54%, 8/15/2026 (b) | | |
SEE NOTES TO FINANCIAL STATEMENTS.
| J.P. Morgan Exchange-Traded Funds | |
JPMorgan Ultra-Short Income ETF
SCHEDULE OF PORTFOLIO INVESTMENTSAS OF February 29, 2024 (continued)
| | |
Corporate Bonds — continued |
|
|
| | |
(SOFR + 1.07%), 6.44%, 12/11/2026 (b) | | |
Westpac Banking Corp. (Australia) (SOFR + 0.55%), 5.88%, 1/29/2026 (a) (b) | | |
Westpac New Zealand Ltd. (New Zealand) |
| | |
| | |
| | |
|
Constellation Brands, Inc. |
| | |
| | |
| | |
Suntory Holdings Ltd. (Japan) 2.25%, 10/16/2024 (a) | | |
| | |
|
|
| | |
| | |
|
| | |
| | |
| | |
Gilead Sciences, Inc. 3.70%, 4/1/2024 | | |
| | |
|
Bank of New York Mellon Corp. (The) (SOFR + 1.35%), 4.41%, 7/24/2026 (b) | | |
Credit Suisse AG (Switzerland) |
| | |
| | |
Goldman Sachs Group, Inc. (The) |
| | |
| | |
| | |
(SOFR + 0.49%), 5.83%, 10/21/2024 (b) | | |
| | |
(3-MONTH CME TERM SOFR + 1.46%), 3.27%, 9/29/2025 (b) | | |
| | |
|
Capital Markets — continued |
(SOFR + 0.61%), 0.86%, 2/12/2026 (b) | | |
| | |
(SOFR + 1.07%), 6.39%, 8/10/2026 (b) | | |
(SOFR + 0.79%), 1.09%, 12/9/2026 (b) | | |
| | |
Intercontinental Exchange, Inc. 3.65%, 5/23/2025 | | |
Macquarie Bank Ltd. (Australia) |
| | |
| | |
(SOFR + 1.20%), 6.58%, 12/7/2026 (a) (b) | | |
|
(SOFR + 0.51%), 5.85%, 1/22/2025 (b) | | |
(SOFR + 1.16%), 3.62%, 4/17/2025 (b) | | |
(SOFR + 0.53%), 0.79%, 5/30/2025 (b) | | |
(SOFR + 0.56%), 1.16%, 10/21/2025 (b) | | |
(SOFR + 0.72%), 0.99%, 12/10/2026 (b) | | |
(SOFR + 1.30%), 5.05%, 1/28/2027 (b) | | |
Nomura Holdings, Inc. (Japan) 5.10%, 7/3/2025 | | |
State Street Corp. (SOFR + 0.94%), 2.35%, 11/1/2025 (b) | | |
|
(SOFR + 0.45%), 5.78%, 8/9/2024 (a) (b) | | |
(SOFR + 0.93%), 6.30%, 9/11/2025 (b) | | |
UBS Group AG (Switzerland) |
| | |
(US Treasury Yield Curve Rate T Note Constant Maturity 1 Year + 1.60%), 4.49%, 8/5/2025 (a) (b) | | |
(SOFR + 1.56%), 2.59%, 9/11/2025 (a) (b) | | |
| | |
SEE NOTES TO FINANCIAL STATEMENTS.
| J.P. Morgan Exchange-Traded Funds | |
| | |
Corporate Bonds — continued |
|
LyondellBasell Industries NV 5.75%, 4/15/2024 | | |
Nutrien Ltd. (Canada) 5.90%, 11/7/2024 | | |
Sherwin-Williams Co. (The) |
| | |
| | |
|
| | |
| | |
| | |
Commercial Services & Supplies — 0.5% |
Element Fleet Management Corp. (Canada) |
| | |
| | |
| | |
Communications Equipment — 0.1% |
Cisco Systems, Inc. 4.80%, 2/26/2027 | | |
|
AerCap Ireland Capital DAC (Ireland) 1.65%, 10/29/2024 | | |
|
| | |
| | |
(SOFR + 1.00%), 4.99%, 5/1/2026 (b) | | |
| | |
| | |
(SOFR + 1.00%), 5.10%, 2/16/2028 (b) | | |
American Honda Finance Corp. |
(SOFRINDX + 0.62%), 5.95%, 6/7/2024 (b) | | |
| | |
(SOFRINDX + 0.70%), 6.02%, 11/22/2024 (b) | | |
(SOFR + 0.55%), 5.87%, 2/12/2025 (b) | | |
Series A, 4.60%, 4/17/2025 | | |
(SOFRINDX + 0.78%), 6.12%, 4/23/2025 (b) | | |
| | |
Avolon Holdings Funding Ltd. (Ireland) |
| | |
| | |
| | |
|
Consumer Finance — continued |
Capital One Financial Corp. |
| | |
(SOFR + 1.29%), 2.64%, 3/3/2026 (b) | | |
(SOFR + 2.16%), 4.99%, 7/24/2026 (b) | | |
(SOFR + 0.86%), 1.88%, 11/2/2027 (b) | | |
Caterpillar Financial Services Corp. (SOFR + 0.45%), 5.77%, 11/14/2024 (b) | | |
General Motors Financial Co., Inc. |
| | |
| | |
| | |
|
(SOFR + 0.50%), 5.84%, 7/3/2025 (b) | | |
(SOFR + 0.48%), 5.81%, 10/22/2025 (b) | | |
Toyota Motor Credit Corp. |
(SOFR + 0.52%), 5.83%, 8/22/2024 (b) | | |
(SOFR + 0.55%), 5.87%, 10/16/2024 (b) | | |
(SOFR + 0.65%), 6.00%, 1/5/2026 (b) | | |
| | |
Consumer Staples Distribution & Retail — 0.0% ^ |
7-Eleven, Inc. 0.95%, 2/10/2026 (a) | | |
Dollar General Corp. 3.88%, 4/15/2027 | | |
| | |
Containers & Packaging — 0.1% |
Avery Dennison Corp. 0.85%, 8/15/2024 | | |
Sonoco Products Co. 1.80%, 2/1/2025 | | |
| | |
|
|
| | |
| | |
| | |
Diversified Telecommunication Services — 0.2% |
AT&T, Inc. 0.90%, 3/25/2024 | | |
SEE NOTES TO FINANCIAL STATEMENTS.
| J.P. Morgan Exchange-Traded Funds | |
JPMorgan Ultra-Short Income ETF
SCHEDULE OF PORTFOLIO INVESTMENTSAS OF February 29, 2024 (continued)
| | |
Corporate Bonds — continued |
Diversified Telecommunication Services — continued |
Bell Canada (The) (Canada) Series US-3, 0.75%, 3/17/2024 | | |
NBN Co. Ltd. (Australia) 0.88%, 10/8/2024 (a) | | |
Telstra Corp. Ltd. (Australia) 3.13%, 4/7/2025 (a) | | |
Verizon Communications, Inc. 3.38%, 2/15/2025 | | |
| | |
Electric Utilities — 3.1% |
American Electric Power Co., Inc. Series N, 1.00%, 11/1/2025 | | |
Arizona Public Service Co. 2.55%, 9/15/2026 | | |
Cleveland Electric Illuminating Co. (The) 5.50%, 8/15/2024 | | |
|
| | |
| | |
| | |
Emera US Finance LP (Canada) 0.83%, 6/15/2024 | | |
Enel Finance International NV (Italy) |
| | |
| | |
| | |
| | |
|
| | |
| | |
Evergy, Inc. 2.45%, 9/15/2024 | | |
|
| | |
| | |
|
| | |
| | |
|
Series A, 2.20%, 9/15/2024 | | |
(SOFRINDX + 0.75%), 6.08%, 5/8/2025 (b) | | |
| | |
Interstate Power and Light Co. 3.25%, 12/1/2024 | | |
ITC Holdings Corp. 3.65%, 6/15/2024 | | |
| | |
|
Electric Utilities — continued |
NextEra Energy Capital Holdings, Inc. |
| | |
| | |
| | |
| | |
| | |
| | |
| | |
Niagara Mohawk Power Corp. 3.51%, 10/1/2024 (a) | | |
Pinnacle West Capital Corp. 1.30%, 6/15/2025 | | |
PPL Capital Funding, Inc. 3.10%, 5/15/2026 | | |
Southwestern Electric Power Co. Series K, 2.75%, 10/1/2026 | | |
Tampa Electric Co. 3.88%, 7/12/2024 | | |
Virginia Power Fuel Securitization LLC Series A-1, 5.09%, 5/1/2027 | | |
| | |
Electronic Equipment, Instruments & Components — 0.3% |
Amphenol Corp. 3.20%, 4/1/2024 | | |
TD SYNNEX Corp. 1.25%, 8/9/2024 | | |
Teledyne Technologies, Inc. 0.95%, 4/1/2024 | | |
| | |
Energy Equipment & Services — 0.0% ^ |
Schlumberger Holdings Corp. 4.00%, 12/21/2025 (a) | | |
|
Netflix, Inc. 5.88%, 2/15/2025 | | |
Take-Two Interactive Software, Inc. |
| | |
| | |
| | |
| | |
Financial Services — 1.4% |
Citigroup Global Markets Holdings, Inc. 0.75%, 6/7/2024 | | |
Corebridge Financial, Inc. 3.50%, 4/4/2025 | | |
EDP Finance BV (Portugal) 3.63%, 7/15/2024 (a) | | |
SEE NOTES TO FINANCIAL STATEMENTS.
| J.P. Morgan Exchange-Traded Funds | |
| | |
Corporate Bonds — continued |
Financial Services — continued |
Fidelity National Information Services, Inc. 0.60%, 3/1/2024 | | |
|
| | |
| | |
| | |
Global Payments, Inc. 2.65%, 2/15/2025 | | |
National Rural Utilities Cooperative Finance Corp. (SOFR + 0.70%), 6.03%, 5/7/2025 (b) | | |
NTT Finance Corp. (Japan) |
| | |
| | |
Siemens Financieringsmaatschappij NV (Germany) (SOFR + 0.43%), 5.80%, 3/11/2024 (a) (b) | | |
| | |
|
|
| | |
| | |
Conagra Brands, Inc. 4.30%, 5/1/2024 | | |
|
| | |
| | |
Mondelez International Holdings Netherlands BV |
| | |
| | |
Tyson Foods, Inc. 4.00%, 3/1/2026 | | |
| | |
Ground Transportation — 0.5% |
Canadian Pacific Railway Co. (Canada) 1.35%, 12/2/2024 | | |
Penske Truck Leasing Co. LP |
| | |
| | |
| | |
| | |
| | |
| | |
| | |
| | |
|
Health Care Equipment & Supplies — 0.1% |
Baxter International, Inc. 2.60%, 8/15/2026 | | |
|
| | |
| | |
Zimmer Biomet Holdings, Inc. 1.45%, 11/22/2024 | | |
| | |
Health Care Providers & Services — 0.8% |
Cardinal Health, Inc. 3.08%, 6/15/2024 | | |
|
| | |
| | |
| | |
| | |
CVS Health Corp. 5.00%, 2/20/2026 | | |
|
| | |
| | |
| | |
Laboratory Corp. of America Holdings 3.25%, 9/1/2024 | | |
| | |
|
Healthpeak OP LLC 3.40%, 2/1/2025 | | |
Ventas Realty LP 3.50%, 2/1/2025 | | |
Welltower OP LLC 3.63%, 3/15/2024 | | |
| | |
Hotels, Restaurants & Leisure — 0.2% |
Marriott International, Inc. |
Series EE, 5.75%, 5/1/2025 | | |
| | |
| | |
|
Aon North America, Inc. 5.13%, 3/1/2027 | | |
|
| | |
(SOFRINDX + 0.70%), 6.01%, 5/24/2024 (a) (b) | | |
| | |
Brighthouse Financial Global Funding |
| | |
SEE NOTES TO FINANCIAL STATEMENTS.
| J.P. Morgan Exchange-Traded Funds | |
JPMorgan Ultra-Short Income ETF
SCHEDULE OF PORTFOLIO INVESTMENTSAS OF February 29, 2024 (continued)
| | |
Corporate Bonds — continued |
|
| | |
CNA Financial Corp. 4.50%, 3/1/2026 | | |
Corebridge Global Funding |
| | |
| | |
(SOFR + 1.30%), 6.66%, 9/25/2026 (a) (b) | | |
Equitable Financial Life Global Funding 1.10%, 11/12/2024 (a) | | |
Jackson National Life Global Funding |
| | |
| | |
MassMutual Global Funding II (SOFR + 0.98%), 6.33%, 7/10/2026 (a) (b) | | |
Met Tower Global Funding 4.85%, 1/16/2027 (a) (c) | | |
New York Life Global Funding |
| | |
(SOFRINDX + 0.58%), 5.92%, 1/16/2026 (a) (b) | | |
Pacific Life Global Funding II |
(SOFRINDX + 0.86%), 6.23%, 6/16/2025 (a) (b) | | |
| | |
(SOFRINDX + 1.05%), 6.38%, 7/28/2026 (a) (b) | | |
Principal Life Global Funding II |
| | |
(SOFR + 0.90%), 6.21%, 8/28/2025 (a) (b) | | |
| | |
Protective Life Global Funding 4.99%, 1/12/2027 (a) | | |
Reliance Standard Life Global Funding II |
| | |
| | |
| | |
Life Sciences Tools & Services — 0.1% |
Thermo Fisher Scientific, Inc. 1.22%, 10/18/2024 | | |
|
Daimler Truck Finance North America LLC (Germany) |
(SOFR + 1.00%), 6.35%, 4/5/2024 (a) (b) | | |
| | |
| | |
|
|
| | |
| | |
| | |
| | |
| | |
| | |
| | |
Otis Worldwide Corp. 2.06%, 4/5/2025 | | |
Parker-Hannifin Corp. 3.65%, 6/15/2024 | | |
Stanley Black & Decker, Inc. 2.30%, 2/24/2025 | | |
| | |
|
Cox Communications, Inc. 3.35%, 9/15/2026 (a) | | |
Omnicom Group, Inc. 3.65%, 11/1/2024 | | |
| | |
|
Anglo American Capital plc (South Africa) 3.63%, 9/11/2024 (a) | | |
Glencore Funding LLC (Australia) |
| | |
| | |
| | |
|
|
| | |
| | |
|
(SOFRINDX + 0.65%), 5.97%, 5/13/2024 (b) | | |
| | |
|
Series C, 2.53%, 10/1/2024 (d) | | |
| | |
| | |
NiSource, Inc. 3.49%, 5/15/2027 | | |
Public Service Enterprise Group, Inc. 2.88%, 6/15/2024 | | |
WEC Energy Group, Inc. 0.80%, 3/15/2024 | | |
| | |
SEE NOTES TO FINANCIAL STATEMENTS.
| J.P. Morgan Exchange-Traded Funds | |
| | |
Corporate Bonds — continued |
Oil, Gas & Consumable Fuels — 2.1% |
ConocoPhillips Co. 2.40%, 3/7/2025 | | |
|
| | |
| | |
Energy Transfer LP 4.75%, 1/15/2026 | | |
Enterprise Products Operating LLC 4.60%, 1/11/2027 | | |
Kinder Morgan Energy Partners LP 4.30%, 5/1/2024 | | |
Magellan Midstream Partners LP 5.00%, 3/1/2026 | | |
Marathon Petroleum Corp. 3.63%, 9/15/2024 | | |
| | |
ONEOK, Inc. 2.75%, 9/1/2024 | | |
Phillips 66 3.85%, 4/9/2025 | | |
Pioneer Natural Resources Co. 5.10%, 3/29/2026 | | |
Sabine Pass Liquefaction LLC 5.75%, 5/15/2024 | | |
Spectra Energy Partners LP |
| | |
| | |
TransCanada PipeLines Ltd. (Canada) 1.00%, 10/12/2024 | | |
Williams Cos., Inc. (The) |
| | |
| | |
| | |
| | |
Paper & Forest Products — 0.0% ^ |
|
| | |
| | |
| | |
Personal Care Products — 0.1% |
Haleon UK Capital plc 3.13%, 3/24/2025 | | |
|
Bayer US Finance II LLC (Germany) |
| | |
| | |
Bayer US Finance LLC (Germany) 3.38%, 10/8/2024 (a) | | |
| | |
|
Pharmaceuticals — continued |
Bristol-Myers Squibb Co. (SOFR + 0.49%), 5.81%, 2/20/2026 (b) | | |
EMD Finance LLC (Germany) 3.25%, 3/19/2025 (a) | | |
| | |
Professional Services — 0.1% |
Equifax, Inc. 2.60%, 12/1/2024 | | |
Semiconductors & Semiconductor Equipment — 0.4% |
Microchip Technology, Inc. |
| | |
| | |
|
| | |
| | |
| | |
|
Oracle Corp. 2.50%, 4/1/2025 | | |
Roper Technologies, Inc. 2.35%, 9/15/2024 | | |
VMware LLC 1.00%, 8/15/2024 | | |
| | |
|
|
| | |
| | |
| | |
| | |
Crown Castle, Inc. 4.45%, 2/15/2026 | | |
| | |
Specialty Retail — 0.0% ^ |
|
| | |
| | |
| | |
|
| | |
| | |
| | |
Technology Hardware, Storage & Peripherals — 0.6% |
|
| | |
| | |
SEE NOTES TO FINANCIAL STATEMENTS.
| J.P. Morgan Exchange-Traded Funds | |
JPMorgan Ultra-Short Income ETF
SCHEDULE OF PORTFOLIO INVESTMENTSAS OF February 29, 2024 (continued)
| | |
Corporate Bonds — continued |
Technology Hardware, Storage & Peripherals — continued |
| | |
| | |
Hewlett Packard Enterprise Co. |
| | |
| | |
| | |
|
Altria Group, Inc. 2.35%, 5/6/2025 | | |
BAT Capital Corp. (United Kingdom) |
| | |
| | |
| | |
Trading Companies & Distributors — 0.2% |
Air Lease Corp. 0.80%, 8/18/2024 | | |
TTX Co. 5.50%, 9/25/2026 (a) | | |
| | |
Transportation Infrastructure — 0.0% ^ |
Sydney Airport Finance Co. Pty. Ltd. (Australia) 3.63%, 4/28/2026 (a) | | |
|
American Water Capital Corp. 3.40%, 3/1/2025 | | |
Wireless Telecommunication Services — 0.0% ^ |
T-Mobile USA, Inc. 3.50%, 4/15/2025 | | |
Total Corporate Bonds
(Cost $12,487,388,839) | | |
Asset-Backed Securities — 11.2% |
522 Funding CLO Ltd. (Cayman Islands) Series 2019-4A, Class AR, 6.66%, 4/20/2030 (a) (e) | | |
AIMCO CLO (Cayman Islands) | | |
Series 2018-AA, Class A, 6.60%, 4/17/2031 (a) (e) | | |
Series 2018-BA, Class AR, 6.68%, 1/15/2032 (a) (e) | | |
AIMCO CLO Ltd. (Cayman Islands) | | |
Series 2020-12A, Class XR, 6.17%, 1/17/2032 (a) (e) | | |
Series 2020-12A, Class AR, 6.49%, 1/17/2032 (a) (e) | | |
Series 2019-10A, Class AR, 6.64%, 7/22/2032 (a) (e) | | |
| | |
|
Ally Auto Receivables Trust Series 2022-3, Class A3, 5.07%, 4/15/2027 | | |
Anchorage Capital CLO Ltd. (Cayman Islands) Series 2016-9A, Class XR, 6.53%, 7/15/2032 (a) (e) | | |
Apidos CLO (Cayman Islands) | | |
Series 2016-24A, Class A1AL, 6.53%, 10/20/2030 (a) (e) | | |
Series 2018-18A, Class AR, 0.00%, 10/22/2030 (a) (e) (f) | | |
Series 2019-31A, Class A1R, 6.68%, 4/15/2031 (a) (e) | | |
Ares CLO Ltd. (Cayman Islands) | | |
Series 2016-40A, Class A1RR, 6.45%, 1/15/2029 (a) (e) | | |
Series 2013-2A, Class XR2, 6.53%, 10/28/2034 (a) (e) | | |
ARI Fleet Lease Trust Series 2023-A, Class A2, 5.41%, 2/17/2032 (a) | | |
Atlas Senior Loan Fund Ltd. (Cayman Islands) Series 2021-18A, Class X, 6.41%, 1/18/2035 (a) (e) | | |
Bain Capital Credit CLO (Cayman Islands) Series 2019-1A, Class X, 6.40%, 4/19/2034 (a) (e) | | |
Bain Capital Credit CLO Ltd. (Cayman Islands) Series 2020-3A, Class X, 6.43%, 10/23/2034 (a) (e) | | |
Ballyrock CLO Ltd. (Cayman Islands) | | |
Series 2020-2A, Class A1R, 6.59%, 10/20/2031 (a) (e) | | |
Series 2019-1A, Class A1R, 6.61%, 7/15/2032 (a) (e) | | |
Bank of America Auto Trust Series 2023-2A, Class A2, 5.85%, 8/17/2026 (a) | | |
Barings CLO Ltd. (Cayman Islands) Series 2018-3A, Class A1, 6.53%, 7/20/2029 (a) (e) | | |
BMW Vehicle Lease Trust Series 2024-1, Class A2A, 5.10%, 7/27/2026 | | |
BMW Vehicle Owner Trust Series 2023-A, Class A2A, 5.72%, 4/27/2026 | | |
Buckhorn Park CLO Ltd. (Cayman Islands) Series 2019-1A, Class XR, 6.21%, 7/18/2034 (a) (e) | | |
Capital One Prime Auto Receivables Trust Series 2021-1, Class A3, 0.77%, 9/15/2026 | | |
SEE NOTES TO FINANCIAL STATEMENTS.
| J.P. Morgan Exchange-Traded Funds | |
| | |
Asset-Backed Securities — continued |
Carlyle Global Market Strategies CLO Ltd. (Cayman Islands) | | |
Series 2015-1A, Class AR3, 6.56%, 7/20/2031 (a) (e) | | |
Series 2015-4A, Class A1R, 6.92%, 7/20/2032 (a) (e) | | |
CCG Receivables Trust Series 2023-2, Class A2, 6.28%, 4/14/2032 (a) | | |
Cedar Funding II CLO Ltd. (Cayman Islands) Series 2013-1A, Class AXR, 6.43%, 4/20/2034 (a) (e) | | |
Chesapeake Funding LLC (Canada) Series 2023-2A, Class A1, 6.16%, 10/15/2035 (a) | | |
CIFC Funding Ltd. (Cayman Islands) | | |
Series 2017-5A, Class A1, 6.76%, 11/16/2030 (a) (e) | | |
Series 2018-4A, Class A1, 6.73%, 10/17/2031 (a) (e) | | |
Citibank Credit Card Issuance Trust Series 2023-A2, Class A2, 5.96%, 12/8/2027 (e) | | |
CNH Equipment Trust Series 2024-A, Class A2, 5.19%, 7/15/2027 | | |
Dell Equipment Finance Trust | | |
Series 2022-1, Class A3, 2.49%, 8/23/2027 (a) | | |
Series 2023-1, Class A3, 5.65%, 9/22/2028 (a) | | |
Series 2023-2, Class A2, 5.84%, 1/22/2029 (a) | | |
Series 2023-3, Class A2, 6.10%, 4/23/2029 (a) | | |
Dewolf Park CLO Ltd. Series 2017-1A, Class AR, 6.50%, 10/15/2030 (a) (e) | | |
Dryden CLO Ltd. (Cayman Islands) Series 2018-58A, Class A1, 6.58%, 7/17/2031 (a) (e) | | |
Dryden Senior Loan Fund (Cayman Islands) | | |
Series 2017-47A, Class A1R, 6.56%, 4/15/2028 (a) (e) | | |
Series 2013-30A, Class AR, 6.39%, 11/15/2028 (a) (e) | | |
Series 2013-26A, Class AR, 6.48%, 4/15/2029 (a) (e) | | |
Series 2014-36A, Class AR3, 6.60%, 4/15/2029 (a) (e) | | |
Series 2015-41A, Class AR, 6.55%, 4/15/2031 (a) (e) | | |
| | |
|
Elmwood CLO Ltd. (Cayman Islands) | | |
Series 2022-5A, Class AR, 6.97%, 7/17/2033 (a) (e) | | |
Series 2021-3A, Class A, 6.62%, 10/20/2034 (a) (e) | | |
Enterprise Fleet Financing LLC | | |
Series 2022-4, Class A2, 5.76%, 10/22/2029 (a) | | |
Series 2023-3, Class A2, 6.40%, 3/20/2030 (a) | | |
Enterprise Fleet Funding LLC Series 2021-1, Class A2, 0.44%, 12/21/2026 (a) | | |
Flatiron CLO Ltd. (Cayman Islands) Series 2018-1A, Class A, 6.53%, 4/17/2031 (a) (e) | | |
Ford Credit Auto Lease Trust Series 2023-A, Class A2A, 5.19%, 6/15/2025 | | |
Galaxy CLO Ltd. (Cayman Islands) | | |
Series 2015-19A, Class A1RR, 6.53%, 7/24/2030 (a) (e) | | |
Series 2013-15A, Class ARR, 6.55%, 10/15/2030 (a) (e) | | |
Series 2018-28A, Class A1, 6.68%, 7/15/2031 (a) (e) | | |
Series 2016-22A, Class XRR, 6.48%, 4/16/2034 (a) (e) | | |
GM Financial Consumer Automobile Receivables Trust | | |
Series 2023-3, Class A2A, 5.74%, 9/16/2026 | | |
Series 2024-1, Class A2A, 5.12%, 2/16/2027 | | |
Goldentree Loan Management US CLO Ltd. (Cayman Islands) | | |
Series 2022-12A, Class X, 6.32%, 4/20/2034 (a) (e) | | |
Series 2022-14A, Class X, 6.52%, 7/20/2035 (a) (e) | | |
GoldenTree Loan Opportunities Ltd. (Cayman Islands) Series 2015-11A, Class AR2, 6.63%, 1/18/2031 (a) (e) | | |
| | |
Series 2018-1A, Class A2, 6.59%, 4/15/2031 (a) (e) | | |
Series 2018-1A, Class A1, 6.61%, 4/15/2031 (a) (e) | | |
SEE NOTES TO FINANCIAL STATEMENTS.
| J.P. Morgan Exchange-Traded Funds | |
JPMorgan Ultra-Short Income ETF
SCHEDULE OF PORTFOLIO INVESTMENTSAS OF February 29, 2024 (continued)
| | |
Asset-Backed Securities — continued |
Harriman Park CLO Ltd. (Cayman Islands) Series 2020-1A, Class XR, 6.18%, 4/20/2034 (a) (e) | | |
Honda Auto Receivables Owner Trust Series 2023-1, Class A2, 5.22%, 10/21/2025 | | |
Hyundai Auto Lease Securitization Trust Series 2022-C, Class A2A, 4.34%, 1/15/2025 (a) | | |
Hyundai Auto Receivables Trust | | |
Series 2021-A, Class A3, 0.38%, 9/15/2025 | | |
Series 2023-B, Class A2A, 5.77%, 5/15/2026 | | |
Series 2021-A, Class A4, 0.62%, 5/17/2027 | | |
ICG US CLO Ltd. (Cayman Islands) | | |
Series 2016-1A, Class XRR, 6.48%, 4/29/2034 (a) (e) | | |
Series 2014-1A, Class XR, 6.38%, 10/20/2034 (a) (e) | | |
KKR CLO Ltd. (Cayman Islands) | | |
Series 23, Class A1, 6.73%, 10/20/2031 (a) (e) | | |
Series 32A, Class A1, 6.90%, 1/15/2032 (a) (e) | | |
Series 24, Class A1R, 6.66%, 4/20/2032 (a) (e) | | |
Kubota Credit Owner Trust Series 2022-1A, Class A3, 2.67%, 10/15/2026 (a) | | |
LCM LP (Cayman Islands) Series 14A, Class AR, 6.62%, 7/20/2031 (a) (e) | | |
LCM Ltd. (Cayman Islands) | | |
Series 24A, Class AR, 6.56%, 3/20/2030 (a) (e) | | |
Series 25A, Class AR, 6.42%, 7/20/2030 (a) (e) | | |
Series 26A, Class A1, 6.65%, 1/20/2031 (a) (e) | | |
Series 29A, Class AR, 6.65%, 4/15/2031 (a) (e) | | |
Madison Park Funding Ltd. (Cayman Islands) | | |
Series 2015-17A, Class AR2, 6.58%, 7/21/2030 (a) (e) | | |
Series 2015-18A, Class ARR, 6.52%, 10/21/2030 (a) (e) | | |
Series 2021-52A, Class X, 6.48%, 1/22/2035 (a) (e) | | |
| | |
|
Magnetite Ltd. (Cayman Islands) | | |
Series 2016-18A, Class AR2, 6.45%, 11/15/2028 (a) (e) | | |
Series 2014-8A, Class AR2, 6.56%, 4/15/2031 (a) (e) | | |
Series 2016-17A, Class AR, 6.68%, 7/20/2031 (a) (e) | | |
Series 2015-15A, Class AR, 6.60%, 7/25/2031 (a) (e) | | |
Series 2020-25A, Class A, 6.79%, 1/25/2032 (a) (e) | | |
Mercedes-Benz Auto Receivables Trust Series 2023-1, Class A2, 5.09%, 1/15/2026 | | |
Neuberger Berman CLO (Cayman Islands) Series 2013-15A, Class A1R2, 6.50%, 10/15/2029 (a) (e) | | |
Neuberger Berman CLO Ltd. (Cayman Islands) | | |
Series 2013-14A, Class AR2, 6.61%, 1/28/2030 (a) (e) | | |
Series 2017-16SA, Class XR, 6.38%, 4/15/2034 (a) (e) | | |
Neuberger Berman Loan Advisers CLO Ltd. (Cayman Islands) | | |
Series 2017-26A, Class AR, 6.48%, 10/18/2030 (a) (e) | | |
Series 2019-31A, Class AR, 6.62%, 4/20/2031 (a) (e) | | |
Series 2020-37A, Class AR, 6.55%, 7/20/2031 (a) (e) | | |
Newark BSL CLO Ltd. (Cayman Islands) | | |
Series 2016-1A, Class A1R, 6.68%, 12/21/2029 (a) (e) | | |
Series 2017-1A, Class A1R, 6.56%, 7/25/2030 (a) (e) | | |
OCP CLO Ltd. (Cayman Islands) | | |
Series 2017-13A, Class A1AR, 6.54%, 7/15/2030 (a) (e) | | |
Series 2018-15A, Class A1, 6.68%, 7/20/2031 (a) (e) | | |
Series 2020-8RA, Class A1, 6.80%, 1/17/2032 (a) (e) | | |
Series 2019-17A, Class A1R, 6.62%, 7/20/2032 (a) (e) | | |
Series 2020-18A, Class AR, 6.67%, 7/20/2032 (a) (e) | | |
Series 2015-9A, Class X, 6.07%, 1/15/2033 (a) (e) | | |
SEE NOTES TO FINANCIAL STATEMENTS.
| J.P. Morgan Exchange-Traded Funds | |
| | |
Asset-Backed Securities — continued |
Octagon Investment Partners Ltd. (Cayman Islands) | | |
Series 2017-1A, Class A1R, 6.58%, 3/17/2030 (a) (e) | | |
Series 2018-1A, Class A1A, 6.64%, 1/20/2031 (a) (e) | | |
OHA Credit Partners Ltd. (Cayman Islands) Series 2016-13A, Class XR, 6.43%, 10/25/2034 (a) (e) | | |
OSD CLO Ltd. (Cayman Islands) | | |
Series 2021-23A, Class A, 6.45%, 4/17/2031 (a) (e) | | |
Series 2023-27A, Class A, 6.91%, 4/16/2035 (a) (e) | | |
Palmer Square CLO Ltd. (Cayman Islands) Series 2018-2A, Class A1A, 6.68%, 7/16/2031 (a) (e) | | |
Palmer Square Loan Funding Ltd. (Cayman Islands) | | |
Series 2021-1A, Class A1, 6.48%, 4/20/2029 (a) (e) | | |
Series 2021-2A, Class A1, 6.38%, 5/20/2029 (a) (e) | | |
Series 2021-4A, Class A1, 6.38%, 10/15/2029 (a) (e) | | |
Series 2022-1A, Class A1, 6.37%, 4/15/2030 (a) (e) | | |
Series 2022-3A, Class A1A, 7.13%, 4/15/2031 (a) (e) | | |
Porsche Financial Auto Securitization Trust Series 2023-1A, Class A2, 5.42%, 12/22/2026 (a) | | |
Rad CLO Ltd. (Cayman Islands) Series 2020-7A, Class A1R, 0.00%, 4/17/2036 (a) (e) (f) | | |
Santander Drive Auto Receivables Trust Series 2023-1, Class A2, 5.36%, 5/15/2026 | | |
Sculptor CLO Ltd. (Cayman Islands) Series 27A, Class X, 6.63%, 7/20/2034 (a) (e) | | |
Sound Point CLO II Ltd. (Cayman Islands) Series 2013-1A, Class A1R, 6.66%, 1/26/2031 (a) (e) | | |
Sound Point CLO Ltd. (Cayman Islands) Series 2019-1A, Class AR, 6.66%, 1/20/2032 (a) (e) | | |
Stratus CLO Ltd. (Cayman Islands) Series 2021-1A, Class A, 6.38%, 12/29/2029 (a) (e) | | |
| | |
|
Symphony CLO Ltd. (Cayman Islands) | | |
Series 2018-19A, Class A, 6.54%, 4/16/2031 (a) (e) | | |
Series 2020-24A, Class AR, 0.00%, 1/23/2032 (a) (e) (f) | | |
Series 2020-24A, Class A, 6.78%, 1/23/2032 (a) (e) | | |
Symphony Static CLO Ltd. (Cayman Islands) Series 2021-1A, Class A, 6.42%, 10/25/2029 (a) (e) | | |
TCI-Symphony CLO Ltd. (Cayman Islands) Series 2017-1A, Class AR, 6.51%, 7/15/2030 (a) (e) | | |
Venture CLO Ltd. (Cayman Islands) | | |
Series 2019-36A, Class XR, 6.28%, 4/20/2032 (a) (e) | | |
Series 2021-43A, Class X, 6.63%, 4/15/2034 (a) (e) | | |
Verizon Master Trust Series 2024-1, Class A1A, 5.00%, 12/20/2028 | | |
Volkswagen Auto Loan Enhanced Trust | | |
Series 2023-1, Class A2A, 5.50%, 12/21/2026 | | |
Series 2023-2, Class A2A, 5.72%, 3/22/2027 | | |
Voya CLO Ltd. (Cayman Islands) | | |
Series 2015-1A, Class A1R, 6.46%, 1/18/2029 (a) (e) | | |
Series 2017-3A, Class XR, 6.43%, 4/20/2034 (a) (e) | | |
World Omni Auto Receivables Trust | | |
Series 2021-A, Class A3, 0.30%, 1/15/2026 | | |
Series 2024-A, Class A2A, 5.05%, 4/15/2027 | | |
Total Asset-Backed Securities
(Cost $2,522,323,423) | | |
U.S. Treasury Obligations — 2.3% |
U.S. Treasury Notes
0.38%, 7/15/2024 (Cost $520,194,226) | | |
Commercial Mortgage-Backed Securities — 0.1% |
Benchmark Mortgage Trust Series 2018-B3, Class A2, 3.85%, 4/10/2051 | | |
Citigroup Commercial Mortgage Trust Series 2018-B2, Class A2, 3.79%, 3/10/2051 | | |
SEE NOTES TO FINANCIAL STATEMENTS.
| J.P. Morgan Exchange-Traded Funds | |
JPMorgan Ultra-Short Income ETF
SCHEDULE OF PORTFOLIO INVESTMENTSAS OF February 29, 2024 (continued)
| | |
Commercial Mortgage-Backed Securities — continued |
Wells Fargo Commercial Mortgage Trust Series 2018-C46, Class A2, 4.06%, 8/15/2051 | | |
Total Commercial Mortgage-Backed Securities
(Cost $6,987,247) | | |
Short-Term Investments — 31.8% |
Certificates of Deposits — 11.5% |
Bank of Montreal (Canada) , 5.85%, 7/12/2024 | | |
Bank of Nova Scotia (The) (Canada) | | |
(SOFR + 0.64%), 5.95%, 5/31/2024 (b) | | |
| | |
Barclays Bank plc (United Kingdom) , 6.00%, 8/8/2024 | | |
| | |
| | |
| | |
| | |
(SOFR + 0.56%), 5.87%, 8/8/2025 (b) | | |
Canadian Imperial Bank of Commerce (Canada) | | |
| | |
| | |
| | |
| | |
| | |
| | |
Cooperatieve Rabobank UA (Netherlands) | | |
| | |
| | |
Credit Agricole Corporate and Investment Bank (France) (SOFR + 0.60%), 5.91%, 8/1/2025 (b) | | |
First Abu Dhabi Bank USA NV (SOFR + 5.67%), 5.58%, 3/1/2024 (b) | | |
Kookmin Bank (South Korea) , 6.00%, 5/20/2024 | | |
Lloyds Bank Corporate Markets plc (United Kingdom) | | |
(SOFR + 0.66%), 5.97%, 8/15/2024 (b) | | |
| | |
| | |
|
Certificates of Deposits — continued |
Mitsubishi UFJ Trust & Banking Corp. (Japan) (SOFR + 0.50%), 5.81%, 7/5/2024 (b) | | |
MUFG Bank Ltd. (Japan) , 5.71%, 5/24/2024 | | |
National Australia Bank Ltd. (Australia) (SOFR + 5.93%), 5.83%, 10/16/2024 (b) | | |
Natixis SA (France) (SOFR + 0.59%), 5.90%, 8/8/2025 (b) | | |
Nordea Bank Abp (Finland) (SOFR + 0.27%), 5.58%, 2/27/2025 (b) | | |
Norinchukin Bank (The) (Japan) (SOFR + 5.61%), 5.52%, 7/19/2024 (b) | | |
Sumitomo Mitsui Banking Corp. (Japan) | | |
(SOFR + 6.11%), 6.01%, 6/6/2024 (b) | | |
(SOFR + 6.13%), 6.03%, 8/7/2024 (b) | | |
Svenska Handelsbanken AB (Sweden) | | |
(SOFR + 5.63%), 5.54%, 10/31/2024 (b) | | |
(SOFR + 5.76%), 5.66%, 1/23/2025 (b) | | |
(SOFR + 5.68%), 5.59%, 2/26/2025 (b) | | |
Toronto-Dominion Bank (The) (Canada) | | |
| | |
| | |
Wells Fargo Bank NA (SOFR + 0.60%), 5.91%, 11/4/2024 (b) | | |
Westpac Banking Corp. (Australia) (SOFR + 0.27%), 5.58%, 2/21/2025 (b) | | |
Total Certificates of Deposit
(Cost $2,576,058,286) | | |
|
ANZ New Zealand Int'l Ltd. (New Zealand) 5.24%, 10/22/2024 (a) | | |
Australia & New Zealand Banking Group Ltd. (Australia) | | |
| | |
| | |
Banco Santander SA (Spain) | | |
| | |
| | |
Bank of Montreal (Canada) (SOFR + 0.55%), 5.86%, 11/5/2024 (b) | | |
SEE NOTES TO FINANCIAL STATEMENTS.
| J.P. Morgan Exchange-Traded Funds | |
| | |
Short-Term Investments — continued |
Commercial Paper — continued |
Bell Canada (The) (Canada) | | |
| | |
| | |
BofA Securities, Inc. 5.38%, 2/26/2025 (g) | | |
Brookfield Corporate Treasury Ltd. (Canada) | | |
| | |
| | |
| | |
| | |
Canadian National Railway Co. (Canada) 5.65%, 4/4/2024 (a) | | |
Commonwealth Bank of Australia (Australia) 5.93%, 7/22/2024 (a) | | |
Credit Agricole Corporate and Investment Bank (France) 5.30%, 10/4/2024 (g) | | |
Credit Industriel et Commercial (France) 5.17%, 2/6/2025 (a) (g) | | |
CRH America Finance, Inc. | | |
| | |
| | |
| | |
DNB Bank ASA (Norway) 5.14%, 2/7/2025 (a) (g) | | |
First Abu Dhabi Bank PJSC (United Arab Emirates) | | |
| | |
| | |
General Motors Financial Co., Inc. | | |
| | |
| | |
| | |
Glencore Funding LLC (Australia) | | |
| | |
| | |
| | |
| | |
| | |
| | |
| | |
ING US Funding LLC (Netherlands) | | |
| | |
| | |
L3Harris Technologies, Inc. | | |
| | |
| | |
|
Commercial Paper — continued |
| | |
| | |
| | |
Lloyds Bank plc (United Kingdom) 5.90%, 4/22/2024 (g) | | |
LVMH Moet Hennessy Louis Vuitton, Inc. (France) | | |
| | |
| | |
Macquarie Bank Ltd. (Australia) | | |
| | |
| | |
| | |
| | |
| | |
NatWest Markets plc (United Kingdom) 5.31%, 10/23/2024 (a) | | |
Nordea Bank Abp (Finland) 5.78%, 4/11/2024 (g) | | |
| | |
| | |
| | |
Philip Morris International, Inc. 5.51%, 6/4/2024 (a) (g) | | |
Skandinaviska Enskilda Banken AB (Sweden) 5.79%, 4/1/2024 (g) | | |
Societe Generale SA (France) | | |
| | |
| | |
Standard Chartered Bank (United Kingdom) | | |
| | |
| | |
| | |
Suncorp-Metway Ltd. (Australia) 5.44%, 7/2/2024 (a) (g) | | |
Svenska Handelsbanken AB (Sweden) 6.00%, 8/22/2024 (g) | | |
Swedbank AB (Sweden) 5.33%, 7/1/2024 (g) | | |
Telstra Group Ltd. (Australia) | | |
| | |
| | |
| | |
TELUS Corp. (Canada) 5.82%, 6/12/2024 (a) | | |
SEE NOTES TO FINANCIAL STATEMENTS.
| J.P. Morgan Exchange-Traded Funds | |
JPMorgan Ultra-Short Income ETF
SCHEDULE OF PORTFOLIO INVESTMENTSAS OF February 29, 2024 (continued)
| | |
Short-Term Investments — continued |
Commercial Paper — continued |
Toronto-Dominion Bank (The) (Canada) 5.98%, 8/23/2024 (g) | | |
VW Credit, Inc. (Germany) 5.96%, 4/19/2024 (g) | | |
Westpac Banking Corp. (Australia) 5.91%, 9/13/2024 (g) | | |
Total Commercial Paper
(Cost $3,213,531,285) | | |
| | |
Investment Companies — 4.9% |
JPMorgan U.S. Government Money Market Fund Class IM Shares, 5.25% (h) (i)
(Cost $1,101,895,063) | | |
Investment of Cash Collateral from Securities Loaned — 0.1% |
JPMorgan Securities Lending Money Market Fund Agency SL Class Shares, 5.48% (h) (i) | | |
JPMorgan U.S. Government Money Market Fund Class IM Shares, 5.25% (h) (i) | | |
Total Investment of Cash Collateral from Securities Loaned
(Cost $31,757,692) | | |
| | |
Repurchase Agreements — 1.0% |
Wells Fargo Securities LLC, 5.88%, dated 2/29/2024, due 3/12/2024, repurchase price $230,450,800, collateralized by Collateralized Mortgage Obligations, 0.20% - 10.79%, due 5/28/2029 - 12/25/2068, with the value of $252,010,908.
(Cost $230,000,000) | | |
Total Short-Term Investments
(Cost $7,153,242,326) | | |
Total Investments — 100.8%
(Cost $22,690,136,061) | | |
Liabilities in Excess of Other Assets — (0.8)% | | |
| | |
Percentages indicated are based on net assets. |
| |
| Commercial Industrial Finance Corp. |
| Collateralized Loan Obligations |
| Chicago Mercantile Exchange |
| Public Joint Stock Company |
| Real Estate Investment Trust |
| Secured Overnight Financing Rate |
| Compounding index of the Secured Overnight Financing Rate |
| Amount rounds to less than 0.1% of net assets. |
| Securities exempt from registration under Rule 144A or section 4(a)(2), of the Securities Act of 1933, as amended. | |
| Variable or floating rate security, linked to the referenced benchmark. The interest rate shown is the current rate as of February 29, 2024. | |
| The security or a portion of this security is on loan at February 29, 2024. The total value of securities on loan at February 29, 2024 is $30,637,237. | |
| Step bond. Interest rate is a fixed rate for an initial period that either resets at a specific date or may reset in the future contingent upon a predetermined trigger. The interest rate shown is the current rate as of February 29, 2024. | |
| Variable or floating rate security, the interest rate of which adjusts periodically based on changes in current interest rates and prepayments on the underlying pool of assets. The interest rate shown is the current rate as of February 29, 2024. | |
| All or a portion of the security is a when-issued security, delayed delivery security, or forward commitment. | |
| The rate shown is the effective yield as of February 29, 2024. | |
| Investment in an affiliated fund, which is registered under the Investment Company Act of 1940, as amended, and is advised by J.P. Morgan Investment Management Inc. | |
| The rate shown is the current yield as of February 29, 2024. | |
SEE NOTES TO FINANCIAL STATEMENTS.
| J.P. Morgan Exchange-Traded Funds | |
Futures contracts outstanding as of February 29, 2024:
| | | | | VALUE AND
UNREALIZED
APPRECIATION
(DEPRECIATION) ($) |
| | | | | |
U.S. Treasury 2 Year Note | | | | | |
SEE NOTES TO FINANCIAL STATEMENTS.
| J.P. Morgan Exchange-Traded Funds | |
JPMorgan Ultra-Short Municipal Income ETF
SCHEDULE OF PORTFOLIO INVESTMENTSAS OF February 29, 2024
| | |
Municipal Bonds — 92.6% (a) |
|
Alabama Federal Aid Highway Finance Authority | | |
Series 2015, Rev., 4.00%, 9/1/2024 (b) | | |
Series 2015, Rev., 5.00%, 9/1/2024 (b) | | |
Alabama Public School and College Authority, Capital improvement | | |
Series 2014B, Rev., 5.00%, 1/1/2026 | | |
Series 2014-B, Rev., 5.00%, 1/1/2027 | | |
Alabama Public School and College Authority, Capital Improvement | | |
Series 2013A, Rev., 3.25%, 6/1/2024 | | |
Series 2014-B, Rev., 5.00%, 1/1/2025 | | |
Series 2014-A, Rev., 5.00%, 2/1/2025 | | |
Alabama Special Care Facilities Financing Authority-Birmingham Series 2015, Rev., 5.00%, 6/1/2024 | | |
| | |
Series 2014A, Rev., 5.00%, 6/1/2024 | | |
Series 2014A, Rev., 5.00%, 6/1/2024 (b) | | |
Autauga County Board of Education Rev., 5.00%, 4/1/2024 | | |
Birmingham Airport Authority | | |
| | |
| | |
Black Belt Energy Gas District, Gas Prepay Project No. 4 Series 2019A-1, Rev., 4.00%, 12/1/2025 (c) | | |
Black Belt Energy Gas District, Gas Project No. 6 Series 2021B, Rev., 4.00%, 12/1/2026 (c) | | |
Black Belt Energy Gas District, Gas Supply Series 2022D-2, Rev., LIQ : Royal Bank of Canada, (SOFR + 1.40%), 4.96%, 3/7/2024 (d) | | |
City of Hoover, Warrants GO, 2.00%, 3/1/2025 | | |
City of Huntsville, Warrants Series 2016D, GO, 5.00%, 5/1/2025 | | |
City of Huntsville, Warrants, Water Revenue Series 2015, Rev., 5.00%, 5/1/2025 (b) | | |
City of Tuscaloosa Series 2019A, GO, 4.00%, 7/1/2024 | | |
County of Jefferson Series 2024, Rev., 5.00%, 10/1/2026 | | |
County of Mobile, Warrants GO, 5.00%, 8/1/2025 (b) | | |
| | |
|
|
Industrial Development Board of The City of Mobile, Alabama Power Control, Barry Plant Project Series 2007A, Rev., 1.00%, 6/26/2025 (c) | | |
Montgomery County Public Building Authority, Facilities Project Rev., 5.00%, 3/1/2024 (b) | | |
Montgomery Water Works and Sanitary Sewer Board Series 2019-A, Rev., 5.00%, 9/1/2025 | | |
Southeast Alabama Gas Supply District (The), Project No. 1 Series 2018A, Rev., 4.00%, 4/1/2024 (c) | | |
Southeast Energy Authority A Cooperative District, Project No. 4 Series 2022B-1, Rev., 5.00%, 8/1/2024 | | |
University of Alabama (The) | | |
Series 2012-A, Rev., 5.00%, 7/1/2024 | | |
Series 2014B, Rev., 5.00%, 7/1/2024 (b) | | |
Series 2017A, Rev., 5.00%, 7/1/2024 | | |
| | |
|
Alaska Housing Finance Corp., General Mortgage Series 2019A, Rev., 1.50%, 6/1/2024 | | |
Alaska Housing Finance Corp., Home Mortgage Series 2007A, Rev., VRDO, LIQ : FHLB, 3.30%, 3/11/2024 (c) | | |
Alaska Housing Finance Corp., State Capital Project | | |
Series II 2015A, Rev., 5.00%, 6/1/2024 | | |
Series 2014D-II, Rev., 5.00%, 12/1/2024 | | |
Alaska Municipal Bond Bank Authority | | |
Series 2012-2, Rev., 5.00%, 9/1/2024 | | |
Series 1, Rev., 5.00%, 12/1/2024 | | |
Series 1, Rev., 5.00%, 12/1/2025 | | |
Series 3, Rev., 5.00%, 12/1/2026 | | |
Borough of Matanuska-Susitna, Goose Creek Correctional Center Project | | |
| | |
| | |
| | |
| | |
Series 2015, Rev., 5.25%, 9/1/2028 | | |
SEE NOTES TO FINANCIAL STATEMENTS.
| J.P. Morgan Exchange-Traded Funds | |
| | |
Municipal Bonds — continued |
|
Borough of North Slope Series 2020A, GO, 5.00%, 6/30/2025 | | |
City of Anchorage, Electric Utilities, Senior Lien Series 2014A, Rev., 5.00%, 12/1/2024 (b) | | |
Municipality of Anchorage | | |
Series 2019 B, GO, 5.00%, 4/1/2024 | | |
Series 2020 E, GO, 5.00%, 4/1/2024 | | |
State of Alaska Series 2016B, GO, 5.00%, 8/1/2028 | | |
University of Alaska Series 2015T, Rev., 5.00%, 10/1/2025 | | |
| | |
|
Arizona Department of Transportation State Highway Fund Series 2015, Rev., 5.00%, 7/1/2024 (b) | | |
Arizona Health Facilities Authority, Banner Health | | |
Series 2015 B, Rev., (SIFMA Municipal Swap Index Yield + 0.25%), 3.55%, 3/7/2024 (b) (d) | | |
Series 2015 B, Rev., (SIFMA Municipal Swap Index Yield + 0.25%), 3.55%, 3/7/2024 (d) | | |
Arizona Health Facilities Authority, Phoenix Children's Hospital Series 2013B, Rev., 5.00%, 2/1/2026 | | |
Arizona Health Facilities Authority, Scottsdale Lincoln Hospitals Series 2014A, Rev., 5.00%, 12/1/2026 | | |
Arizona Industrial Development Authority, Equitable School Revolving Fund LLC Series 2019A, Rev., 5.00%, 11/1/2024 | | |
Arizona State University Series 2015B, Rev., 5.00%, 7/1/2026 | | |
Arizona Transportation Board, Excise Tax, Maricopa County Regional Area Road Fund | | |
| | |
Series 2014, Rev., 5.00%, 7/1/2025 | | |
Chandler Industrial Development Authority, Intel Corp. Project Series 2019, Rev., AMT, 5.00%, 6/3/2024 (c) | | |
City of Buckeye, Excise Tax Series 2015, Rev., 5.00%, 7/1/2024 | | |
City of Goodyear, Water and Sewer Series 2020, Rev., AGM, 5.00%, 7/1/2024 | | |
| | |
|
|
| | |
Series 2006, Rev., AGM - CR, 5.00%, 7/1/2024 | | |
Series 2013, Rev., 5.00%, 7/1/2024 | | |
City of Phoenix Series 2014, GO, 4.00%, 7/1/2024 | | |
City of Phoenix Civic Improvement Corp., Junior Lien, Wastewater System | | |
| | |
Series 2016, Rev., 5.00%, 7/1/2024 | | |
City of Scottsdale Series 2015, GO, 4.00%, 7/1/2024 | | |
County of Maricopa Series 2018A, COP, 5.00%, 7/1/2024 | | |
County of Navajo Rev., 4.00%, 7/1/2025 | | |
County of Pima, Sewer System | | |
Series 2016, Rev., 5.00%, 7/1/2024 (b) | | |
Series 2019, Rev., 5.00%, 7/1/2024 | | |
County of Yuma Series 2022, Rev., 5.00%, 7/15/2024 | | |
Maricopa County Elementary School District No. 45 Fowler Series 2019D, GO, 5.00%, 7/1/2024 | | |
Maricopa County Industrial Development Authority, Banner Health | | |
Series C, Rev., 5.00%, 10/18/2024 (c) | | |
Series 2019 D, Rev., 5.00%, 5/15/2026 (c) | | |
Series 2023A-1, Rev., 5.00%, 5/15/2026 (c) | | |
Maricopa County Unified School District No. 41 Gilbert Series 2019C, GO, 5.00%, 7/1/2024 | | |
Maricopa County Unified School District No. 69 Paradise Valley Series 2018D, GO, 5.00%, 7/1/2024 | | |
Maricopa County Unified School District No. 95 Queen Creek Series 2018, GO, 5.00%, 7/1/2024 | | |
Maricopa County Unified School District No. 97-Deer Valley Series 2020A, GO, 5.00%, 7/1/2024 | | |
Pima County Regional Transportation Authority, Excise Tax | | |
| | |
Series 2014, Rev., 5.00%, 6/1/2025 | | |
SEE NOTES TO FINANCIAL STATEMENTS.
| J.P. Morgan Exchange-Traded Funds | |
JPMorgan Ultra-Short Municipal Income ETF
SCHEDULE OF PORTFOLIO INVESTMENTSAS OF February 29, 2024 (continued)
| | |
Municipal Bonds — continued |
|
RBC Municipal Products, Inc. Trust, Floater Certificates Series E-147, Rev., VRDO, LOC : Royal Bank of Canada, 3.33%, 3/11/2024 (c) (e) | | |
Salt River Project Agricultural Improvement and Power District, Arizona Electric System Series 2015A, Rev., 5.00%, 12/1/2045 | | |
Scottsdale Municipal Property Corp. Series 2015, Rev., 5.00%, 7/1/2025 (b) | | |
State of Arizona Series 2019A, COP, 5.00%, 10/1/2025 (b) | | |
| | |
|
City of Springdale Series 2018, Rev., 5.00%, 4/1/2024 (b) | | |
University of Arkansas, Various Facilities Fayetteville Series 2015A, Rev., 5.00%, 11/1/2024 (b) | | |
University of Central Arkansas, Student Fee Series 2020A, Rev., 5.00%, 11/1/2026 | | |
| | |
|
Antelope Valley Community College District GO, 5.00%, 2/15/2025 (b) | | |
Brentwood Infrastructure Financing Authority, Civic Center Project Rev., 5.00%, 10/1/2024 | | |
California County Tobacco Securitization Agency, Gold Country Settlement Funding Corp. Series 2020A, Rev., 5.00%, 6/1/2026 | | |
California Health Facilities Financing Authority Series 2019 C, Rev., 5.00%, 10/1/2025 (b) (c) | | |
California Health Facilities Financing Authority, Adventist Health System | | |
Series 2011A, Rev., VRDO, 3.00%, 3/1/2024 (c) | | |
Series 2013A, Rev., 5.00%, 3/1/2024 | | |
California Health Facilities Financing Authority, Cedars-Sinai Medical Center Rev., 5.00%, 11/15/2024 | | |
California Health Facilities Financing Authority, EL Camino Hospital Series 2017, Rev., 5.00%, 2/1/2025 | | |
| | |
|
|
California Health Facilities Financing Authority, St. Joseph Health System | | |
Series 2016B-2, Rev., 4.00%, 10/1/2024 (c) | | |
Series 2013 A, Rev., 5.00%, 7/1/2025 | | |
Series 2019C, Rev., 5.00%, 10/1/2025 (c) | | |
Series 2013A, Rev., 5.00%, 7/1/2026 | | |
California Infrastructure and Economic Development Bank, Brightline West Passenger Rail Project Series 2020A, Rev., AMT, 3.95%, 1/30/2025 (c) (e) | | |
California Infrastructure and Economic Development Bank, Colburn School (The) Rev., (SIFMA Municipal Swap Index Yield + 0.90%), 4.20%, 3/7/2024 (d) | | |
California Infrastructure and Economic Development Bank, The Broad Sustainability Bonds Series 2018C, Rev., (SIFMA Municipal Swap Index Yield + 0.35%), 3.65%, 3/6/2024 (d) | | |
California Infrastructure and Economic Development Bank, UCSF 2130 Third Street Series 2017, Rev., 5.00%, 5/15/2024 | | |
Chula Vista Municipal Financing Authority Rev., 5.00%, 5/1/2024 | | |
City of Long Beach Harbor, Private Activity Series 2020A, Rev., 4.00%, 5/15/2024 | | |
City of Los Angeles Department of Airports, International Airport Subordinate Series 2018E, Rev., 5.00%, 5/15/2024 | | |
City of Los Angeles, Wastewater System | | |
Series 2013-A, Rev., 5.00%, 6/1/2025 | | |
Series 2013A, Rev., 5.00%, 6/1/2026 | | |
Series 2013A, Rev., 5.00%, 6/1/2027 | | |
City of Petaluma Series 2019, Rev., 5.00%, 5/1/2024 | | |
City of San Francisco, Public Utilities Commission Water Series 2017A, Rev., 5.00%, 11/1/2024 (b) | | |
City of Vernon, Electric System Series 2021A, Rev., 5.00%, 10/1/2025 | | |
Colton Joint Unified School District, Election of 2008 Series 2010B, GO, AGM, 5.80%, 8/21/2026 (b) | | |
Contra Costa County Transportation Authority, Sales Tax Series 2015A, Rev., 5.00%, 3/1/2024 | | |
SEE NOTES TO FINANCIAL STATEMENTS.
| J.P. Morgan Exchange-Traded Funds | |
| | |
Municipal Bonds — continued |
|
County of Sacramento Airport System Series 2020, Rev., 5.00%, 7/1/2024 (b) | | |
El Dorado Irrigation District Series 2014A, Rev., AGM, 5.00%, 3/1/2024 (b) | | |
Grossmont Healthcare District Series C, GO, 5.00%, 7/15/2024 | | |
Hermosa Beach Public Financing Authority Rev., 4.00%, 11/1/2024 | | |
Merced Union High School District GO, AGM, Zero Coupon, 2/18/2025 (b) | | |
Orange County Water District Series 2021A, COP, 4.00%, 2/15/2025 | | |
Padre Dam Municipal Water District Series 2017A, COP, 5.00%, 10/1/2024 | | |
Palomar Community College District GO, 5.00%, 5/1/2024 | | |
Poway Public Financing Authority Series 2023 A, Rev., 5.00%, 6/1/2024 | | |
Sacramento Municipal Utility District, Electric Series 2019B, Rev., 5.00%, 10/15/2025 (c) | | |
San Francisco City and County Airport Commission, San Francisco International Airport | | |
Series 2019D, Rev., 5.00%, 5/1/2024 (b) | | |
Series 2016A, Rev., 4.00%, 5/1/2025 | | |
San Francisco Municipal Transportation Agency Series 2014, Rev., 5.00%, 3/1/2024 (b) | | |
San Joaquin Hills Transportation Corridor Agency, Toll Road, Senior Lien Series 1993, Rev., Zero Coupon, 1/1/2025 (b) | | |
San Juan Water District Rev., 5.00%, 2/1/2025 | | |
Sanger Public Financing Authority Series 2014, Rev., AGM, 4.00%, 6/15/2024 (b) | | |
Santa Clara Valley Transportation Authority Series 2023 A, Rev., 5.00%, 4/1/2024 | | |
Sequoia Union High School District GO, 5.00%, 7/1/2024 (b) | | |
State of California GO, 5.00%, 12/1/2025 | | |
State of California, Various Purpose GO, 5.00%, 10/1/2025 | | |
Tahoe-Truckee Sanitation Agency, Wastewater Rev., 5.00%, 7/1/2024 | | |
| | |
|
|
Tobacco Securitization Authority of Southern California, San Diego County Tobacco Asset Securitization Corp. Series 2019A, Class 1, Rev., 5.00%, 6/1/2025 | | |
Tustin Unified School District, School Facilities Improvement Districts No. 2002-1 and 2008-1 GO, 5.00%, 8/1/2025 | | |
University of California Series 2014AM, Rev., 5.00%, 5/15/2024 | | |
Ventura County Public Financing Authority Series 2016A, Rev., 5.00%, 11/1/2024 | | |
West Hollywood Public Financing Authority, Hollywood Park Phase II Rev., 5.00%, 4/1/2024 | | |
| | |
|
Adams 12 Five Star Schools, The City and County of Broomfield | | |
| | |
Series 2014B, GO, 5.00%, 12/15/2024 | | |
Apex Park and Recreation District GO, 3.00%, 12/1/2024 | | |
Board of Governors of Colorado State University System Series 2015A, Rev., 5.00%, 3/1/2025 (b) | | |
City and County of Broomfield, Sales and Use Tax | | |
Series 2017, Rev., 5.00%, 12/1/2024 | | |
Series A, Rev., 5.00%, 12/1/2024 | | |
City and County of Denver, Airport System | | |
Series B, Rev., 5.00%, 11/15/2024 | | |
Series 2016 A, Rev., 5.00%, 11/15/2025 | | |
Series 2023B, Rev., AMT, 5.00%, 11/15/2026 | | |
Series 2023B, Rev., AMT, 5.00%, 11/15/2027 | | |
City of Arvada, Sales and Use Tax Series 2019, Rev., 5.00%, 12/1/2024 | | |
City of Colorado Springs, Utilities System Improvement Series 2020 C, Rev., 5.00%, 11/15/2024 | | |
City of Northglenn Series 2017, COP, 5.00%, 12/1/2024 | | |
SEE NOTES TO FINANCIAL STATEMENTS.
| J.P. Morgan Exchange-Traded Funds | |
JPMorgan Ultra-Short Municipal Income ETF
SCHEDULE OF PORTFOLIO INVESTMENTSAS OF February 29, 2024 (continued)
| | |
Municipal Bonds — continued |
|
Colorado Health Facilities Authority, Adventhealth Obligated Group | | |
Series 2019B, Rev., 5.00%, 11/19/2026 (b) (c) | | |
Series 2019B, Rev., 5.00%, 11/19/2026 (c) | | |
Colorado Health Facilities Authority, Adventist Health System | | |
Series 2018B, Rev., 5.00%, 11/20/2025 (c) | | |
Series 2016C, Rev., 5.00%, 11/15/2026 (c) | | |
Colorado Health Facilities Authority, Children's Hospital Colorado Project | | |
Series C, Rev., 5.00%, 12/1/2024 | | |
Series C, Rev., 5.00%, 12/1/2026 | | |
Colorado Health Facilities Authority, CommonSpirit Health | | |
Series 2019A-1, Rev., 5.00%, 8/1/2025 | | |
Series 2019A-1, Rev., 5.00%, 8/1/2026 | | |
Series 2019B-2, Rev., 5.00%, 8/1/2026 (c) | | |
Series 2019A-2, Rev., 5.00%, 8/1/2027 | | |
Colorado Health Facilities Authority, CommonSpirit Health Obligated Group | | |
Series 2022A, Rev., 5.00%, 11/1/2024 | | |
Series 2022A, Rev., 5.00%, 11/1/2028 | | |
Colorado Health Facilities Authority, NCMC, Inc., Project | | |
Rev., 4.00%, 5/15/2026 (b) | | |
Series 2016, Rev., 4.00%, 5/15/2026 (b) | | |
Colorado Health Facilities Authority, Sanford Health Series 2019A, Rev., 5.00%, 11/1/2029 | | |
Colorado Health Facilities Authority, School Health System Series 2019A, Rev., 5.00%, 1/1/2025 | | |
Colorado Health Facilities Authority, The Evangelical Lutheran Good Samaritan Society Project Series 2015A, Rev., 5.00%, 6/1/2024 (b) | | |
Colorado Higher Education, Capital Construction, Lease Purchase Financing Program Series 2020, COP, 5.00%, 9/1/2024 | | |
| | |
|
|
Colorado State Education Loan Program Series 2023A, Rev., TRAN, 5.00%, 6/28/2024 | | |
County of Boulder, Flood Reconstruction Project Series 2021A, COP, 5.00%, 12/1/2024 | | |
E-470 Public Highway Authority Series 2020 A, Rev., 5.00%, 9/1/2026 | | |
El Paso County School District No. 38 Lewis-Palmer Series 2012, GO, 5.00%, 12/1/2024 | | |
Metro Wastewater Reclamation District Series 2019 A, Rev., 5.00%, 4/1/2024 | | |
Regional Transportation District, Denver Transit Partners | | |
Series 2020A, Rev., 5.00%, 7/15/2024 | | |
Series 2020A, Rev., 5.00%, 7/15/2025 | | |
| | |
Series 2013I, COP, 5.00%, 3/15/2024 | | |
Series 2013I, COP, 5.00%, 3/15/2024 (b) | | |
Series 2019O, COP, 5.00%, 3/15/2024 | | |
Series 2022, COP, 6.00%, 12/15/2024 | | |
Series 2018L, COP, 5.00%, 3/15/2027 | | |
State of Colorado Department of Transportation Series 2016, COP, 5.00%, 6/15/2024 | | |
Town of Castle Rock, Sales and Use Tax Rev., 5.00%, 6/1/2025 | | |
University of Colorado, Enterprise System | | |
Series B-1, Rev., 4.00%, 6/1/2024 (b) | | |
Series A, Rev., 5.00%, 6/1/2024 (b) | | |
Series A, Rev., 5.00%, 6/1/2025 (b) | | |
Series 2021C-3B, Rev., 2.00%, 10/15/2026 (c) | | |
University of Colorado, Hospital Authority Series 2019C, Rev., 5.00%, 11/15/2024 (c) | | |
| | |
|
City of Danbury Series 2024, GO, BAN, 5.00%, 9/24/2024 (e) | | |
City of Groton Series A, GO, 5.00%, 4/1/2024 | | |
Connecticut State Health and Educational Facilities Authority, Stamford Hospital Series L-1, Rev., 4.00%, 7/1/2024 | | |
SEE NOTES TO FINANCIAL STATEMENTS.
| J.P. Morgan Exchange-Traded Funds | |
| | |
Municipal Bonds — continued |
|
Connecticut State Health and Educational Facilities Authority, University System Issue Series L, Rev., 3.00%, 11/1/2026 | | |
Connecticut State Health and Educational Facilities Authority., Yale New Heaven Health Series A, Rev., 5.00%, 7/1/2026 | | |
Metropolitan District (The) Series 2015, GO, 5.00%, 3/1/2024 | | |
South Central Connecticut Regional Water Authority Series 29, Rev., 5.00%, 8/1/2024 | | |
| | |
Series 2018 D, GO, 5.00%, 4/15/2024 | | |
Series A, GO, 5.00%, 4/15/2024 | | |
Series F, GO, 5.00%, 11/15/2024 | | |
Series 2014E, GO, 4.00%, 9/1/2027 | | |
State of Connecticut Special Tax | | |
Series 2021 A, Rev., 4.00%, 5/1/2024 | | |
Series 2020 A, Rev., 5.00%, 5/1/2024 | | |
State of Connecticut, SIFMA Index Series 2013A, GO, (SIFMA Municipal Swap Index Yield + 0.99%), 4.29%, 3/7/2024 (d) | | |
State of Connecticut, Special Tax Transportation Infrastructure Purposes | | |
Series 2018 B, Rev., 5.00%, 10/1/2024 | | |
Series 2018C, Rev., 5.00%, 10/1/2024 | | |
Town of Darien GO, BAN, 4.00%, 4/25/2024 | | |
Town of Mansfield GO, BAN, 4.00%, 5/15/2024 | | |
Town of Monroe Series 2019, GO, 5.00%, 5/1/2024 | | |
Town of Southington Series 2023, GO, 5.00%, 5/1/2024 | | |
Town of Wolcott GO, BAN, 4.25%, 2/11/2025 | | |
University of Connecticut | | |
Series 2016 A, Rev., 5.00%, 3/15/2024 | | |
Series 2015A, Rev., 5.00%, 2/15/2026 | | |
| | |
|
County of New Castle GO, 5.00%, 4/1/2024 | | |
| | |
|
|
Delaware River and Bay Authority Series C, Rev., 5.00%, 5/1/2024 | | |
Delaware State Economic Development Authority, Delmarva Power and Light Co. Project Series 2020A, Rev., 1.05%, 7/1/2025 (c) | | |
| | |
District of Columbia — 1.3% |
District of Columbia Housing Finance Agency, Multifamily Housing Edgewood Apartments Project Series 2023, Rev., FHA, 5.00%, 6/1/2026 (c) | | |
District of Columbia Housing Finance Agency, Paxton Project Series 2022, Rev., 4.00%, 9/1/2025 (c) | | |
District of Columbia, Children's Hospital Obligated Group | | |
Series 2015, Rev., 5.00%, 7/15/2024 | | |
Series 2015, Rev., 5.00%, 7/15/2025 | | |
Series 2015, Rev., 5.00%, 7/15/2027 | | |
Series 2015, Rev., 5.00%, 7/15/2028 | | |
Series 2015, Rev., 5.00%, 7/15/2029 | | |
District of Columbia, Federal Highway Rev., 5.00%, 12/1/2024 | | |
District of Columbia, Gallery Place Project Rev., 5.00%, 6/1/2024 | | |
District of Columbia, National Public Radio, Inc. Rev., 5.00%, 4/1/2024 (b) | | |
District of Columbia, Water and Sewer Authority, Public Utility, Subordinate Lien Series 2014C, Rev., 5.00%, 10/1/2024 | | |
Metropolitan Washington Airports Authority Aviation | | |
Series 2010C-2, Rev., VRDO, LOC : TD Bank NA, 3.30%, 3/11/2024 (c) | | |
Series 2019 B, Rev., 5.00%, 10/1/2026 | | |
Series 2014A, Rev., AMT, 5.00%, 10/1/2028 | | |
Series 2021A, Rev., AMT, 5.00%, 10/1/2028 | | |
Washington Metropolitan Area Transit Authority | | |
Series 2017B, Rev., 5.00%, 7/1/2024 | | |
Series A-1, Rev., 5.00%, 7/1/2024 | | |
Series A-1, Rev., 5.00%, 7/1/2027 | | |
Total District of Columbia | | |
SEE NOTES TO FINANCIAL STATEMENTS.
| J.P. Morgan Exchange-Traded Funds | |
JPMorgan Ultra-Short Municipal Income ETF
SCHEDULE OF PORTFOLIO INVESTMENTSAS OF February 29, 2024 (continued)
| | |
Municipal Bonds — continued |
|
Alachua County School Board Series 2020, COP, AGM, 5.00%, 7/1/2027 | | |
Brevard County Health Facilities Authority, Health First, Inc., Project Rev., 5.00%, 4/1/2024 | | |
Brevard County School District | | |
Series C, COP, 5.00%, 7/1/2026 | | |
Series 2014, COP, 5.00%, 7/1/2027 | | |
Series 2014, COP, 5.00%, 7/1/2028 | | |
Capital Trust Agency, Inc., Sustainability Bonds -The Marie | | |
Rev., 4.00%, 6/15/2024 (e) | | |
Rev., 4.00%, 6/15/2025 (e) | | |
Central Florida Expressway Authority, Senior Lien | | |
Series 2017, Rev., 5.00%, 7/1/2024 | | |
Series 2016B, Rev., 5.00%, 7/1/2025 | | |
Series 2016 B, Rev., 5.00%, 7/1/2026 | | |
Series 2016 B, Rev., 5.00%, 7/1/2027 | | |
Series 2016 B, Rev., 5.00%, 7/1/2028 | | |
Central Florida Tourism Oversight District Series 2017A, GO, 5.00%, 6/1/2025 | | |
City of Gainesville, Utilities System | | |
Series 2017A, Rev., 5.00%, 10/1/2024 | | |
Series 2017 A, Rev., 5.00%, 10/1/2028 | | |
| | |
Series 2016, Rev., 5.00%, 10/1/2025 | | |
Series B, Rev., 5.00%, 10/1/2025 (b) | | |
City of Jacksonville, Health Care Facilities, Baptist Health Series 2019C, Rev., VRDO, 3.30%, 3/11/2024 (c) | | |
City of Lakeland, Department of Electric Utilities Rev., 5.00%, 10/1/2026 | | |
City of Miami Gardens, Florida General Series 2014, GO, 5.00%, 7/1/2024 (b) | | |
City of Orlando, Capital Improvement | | |
Series 2016B, Rev., 5.00%, 10/1/2024 | | |
Series 2018 B, Rev., 5.00%, 10/1/2024 | | |
City of Orlando, Florida Contract Tourist Development Tax Payments | | |
Series 2014A, Rev., 5.00%, 5/1/2024 (b) | | |
Series 2014A, Rev., 5.25%, 5/1/2024 (b) | | |
| | |
|
|
City of South Miami Health Facilities Authority, Inc., Baptist Health South Florida Obligated Group Rev., 5.00%, 8/15/2028 | | |
City of Tallahassee, Energy System | | |
Series 2020, Rev., 5.00%, 10/1/2025 | | |
Series 2020, Rev., 5.00%, 10/1/2027 | | |
County of Broward, Airport System | | |
Series Q-1, Rev., 5.00%, 10/1/2024 | | |
Series Q-1, Rev., 5.00%, 10/1/2025 | | |
Series 2013C, Rev., 5.25%, 10/1/2026 | | |
County of Hillsborough, Communications Services Tax Rev., 5.00%, 10/1/2024 | | |
County of Hillsborough, Community Investment Tax Rev., 5.00%, 11/1/2025 | | |
County of Hillsborough, Wastewater Impact Fee Series 2021, Rev., 5.00%, 5/1/2024 | | |
County of Lee, Tourist Development Tax Series 2019A, Rev., 5.00%, 10/1/2024 | | |
County of Lee, Transportation Facilities | | |
Rev., AGM, 5.00%, 10/1/2024 | | |
Series 2014, Rev., AGM, 5.00%, 10/1/2027 | | |
County of Lee, Water and Sewer Series A, Rev., 5.00%, 10/1/2024 | | |
| | |
Series 2016 B, Rev., 5.00%, 4/1/2024 | | |
Series 2019B, Rev., 5.00%, 4/1/2024 | | |
Series 2016B, Rev., 5.00%, 4/1/2027 | | |
County of Miami-Dade, Aviation System | | |
Series 2020A, Rev., 5.00%, 10/1/2024 | | |
Series B, Rev., 5.00%, 10/1/2024 | | |
Series A, Rev., 5.00%, 10/1/2025 | | |
Series B, Rev., 5.00%, 10/1/2026 | | |
Series A, Rev., 5.00%, 10/1/2027 | | |
Series A, Rev., 5.00%, 10/1/2028 | | |
County of Miami-Dade, Building Better Communities Program | | |
Series 2016A, GO, 5.00%, 7/1/2024 | | |
Series 2015B, GO, 5.00%, 7/1/2026 | | |
Series 2015-D, GO, 5.00%, 7/1/2028 | | |
County of Miami-Dade, Transit System Rev., 5.00%, 7/1/2026 | | |
County of Miami-Dade, Water and Sewer System | | |
Series 2015, Rev., 5.00%, 10/1/2024 | | |
SEE NOTES TO FINANCIAL STATEMENTS.
| J.P. Morgan Exchange-Traded Funds | |
| | |
Municipal Bonds — continued |
|
Series 2015, Rev., 5.00%, 10/1/2026 | | |
County of Polk Utility System Series 2013, Rev., 5.00%, 10/1/2024 | | |
County of St. Lucie Series 2017, Rev., 5.00%, 10/1/2024 | | |
County of St. Lucie, Power and Light Co., Project Rev., VRDO, 3.85%, 3/1/2024 (c) | | |
Duval County Public Schools | | |
Series 2022A, COP, 5.00%, 7/1/2024 | | |
Series 2022A, COP, AGM, 5.00%, 7/1/2026 | | |
Series 2015B, COP, 5.00%, 7/1/2027 | | |
Escambia County School Board Series 2020A, COP, 5.00%, 2/1/2026 | | |
Florida Department of Environmental Protection | | |
Series 2014A, Rev., 5.00%, 7/1/2024 | | |
Series 2015A, Rev., 5.00%, 7/1/2024 | | |
Series 2016A, Rev., 5.00%, 7/1/2024 | | |
Series 2016A, Rev., 5.00%, 7/1/2027 | | |
Florida Department of Environmental Protection, Everglades Restoration Series 2022A, Rev., 5.00%, 7/1/2024 | | |
Florida Department of Management Services | | |
Series 2015A, COP, 5.00%, 8/1/2024 | | |
Series 2017A, Rev., 5.00%, 9/1/2024 | | |
Series 2018A, COP, 5.00%, 11/1/2024 | | |
Series 2018A, COP, 5.00%, 11/1/2026 | | |
Florida Development Finance Corp., Nova Southeastern University Project Series 2020A, Rev., 5.00%, 4/1/2024 | | |
Florida Gulf Coast University Financing Corp., Housing Project Series 2008A, Rev., VRDO, LOC : TD Bank NA, 3.31%, 3/11/2024 (c) | | |
Florida Higher Educational Facilities Financial Authority, Rollins College Project Series 2012B, Rev., 3.13%, 12/1/2025 | | |
Florida Housing Finance Corp., Culmer Apartments Series 2023C, Rev., 5.00%, 12/1/2025 (c) | | |
Florida Housing Finance Corp., Hampton Point Apartments Series 2023E, Rev., 5.00%, 5/1/2025 (c) | | |
Florida Municipal Power Agency, All-Requirements Power Supply Project | | |
Series 2016A, Rev., 5.00%, 10/1/2024 | | |
Series 2017A, Rev., 5.00%, 10/1/2025 | | |
| | |
|
|
Series 2015B, Rev., 5.00%, 10/1/2026 | | |
Series 2016A, Rev., 5.00%, 10/1/2026 | | |
Series 2017 A, Rev., 5.00%, 10/1/2026 | | |
Series 2016A, Rev., 5.00%, 10/1/2027 | | |
Series 2017 A, Rev., 5.00%, 10/1/2027 | | |
Series 2018A, Rev., 4.00%, 10/1/2028 | | |
Series 2016A, Rev., 5.00%, 10/1/2028 | | |
FSU Financial Assistance, Inc. Series 2012C, Rev., 3.00%, 10/1/2025 | | |
Hillsborough County Aviation Authority, Tampa International Airport Series 2022A, Rev., AMT, 5.00%, 10/1/2027 | | |
Hillsborough County, Aviation Authority, Tampa International Airport Series 2015B, Rev., 5.00%, 10/1/2024 (b) | | |
Jacksonville Transportation Authority, Senior Lien Gas Tax Rev., 5.00%, 8/1/2024 | | |
JEA Water and Sewer System | | |
Series 2008A-1, Rev., VRDO, LIQ : US Bank NA, 3.45%, 3/1/2024 (c) | | |
Series 2014A, Rev., 5.00%, 4/1/2024 (b) | | |
Series 2017A, Rev., 5.00%, 10/1/2024 | | |
Lee County School Board (The) | | |
Series 2014B, COP, 5.00%, 8/1/2024 | | |
Series 2014B, COP, 5.00%, 8/1/2026 | | |
Series 2019A, COP, 5.00%, 8/1/2026 | | |
Lee Memorial Health System Series A-1, Rev., 5.00%, 4/1/2024 | | |
Miami Beach Redevelopment Agency Series A, Rev., 5.00%, 2/1/2028 | | |
Miami-Dade County Educational Facilities Authority Series B, Rev., AMBAC, 5.25%, 4/1/2024 | | |
Miami-Dade County Expressway Authority | | |
Series 2014B, Rev., 5.00%, 7/1/2024 | | |
Series 2014 A, Rev., 5.00%, 7/1/2027 | | |
Series 2014B, Rev., 5.00%, 7/1/2027 | | |
Series 2016A, Rev., 5.00%, 7/1/2028 | | |
Series 2014 A, Rev., 5.00%, 7/1/2029 | | |
Miami-Dade County Housing Finance Authority, Quail Roost Transit Village Series 2023, Rev., 5.00%, 9/1/2025 (c) | | |
Miami-Dade County Housing Finance Authority, Santa Clara II Apartments Series 2023, Rev., 5.00%, 10/1/2025 (c) | | |
SEE NOTES TO FINANCIAL STATEMENTS.
| J.P. Morgan Exchange-Traded Funds | |
JPMorgan Ultra-Short Municipal Income ETF
SCHEDULE OF PORTFOLIO INVESTMENTSAS OF February 29, 2024 (continued)
| | |
Municipal Bonds — continued |
|
Orange County Health Facilities Authority, Orlando Health Obligated Group Series 2019B, Rev., 5.00%, 10/1/2025 | | |
Orange County School Board | | |
Series 2015D, COP, 5.00%, 8/1/2024 | | |
Series 2015C, COP, 5.00%, 8/1/2025 (b) | | |
Series 2015D, COP, 5.00%, 8/1/2025 (b) | | |
Orlando Utilities Commission, Utility System | | |
Series 2013A, Rev., 5.00%, 10/1/2024 | | |
Series 2013A, Rev., 5.00%, 10/1/2025 | | |
Palm Beach County Health Facilities Authority, Baptist Health South Florida Obligated Group Rev., 5.00%, 8/15/2024 | | |
Palm Beach County School District | | |
Series 2015B, COP, 5.00%, 8/1/2024 | | |
Series 2015D, COP, 5.00%, 8/1/2024 | | |
Series 2018B, COP, 5.00%, 8/1/2024 | | |
Series 2014B, COP, 5.00%, 8/1/2025 | | |
Series 2017B, COP, 5.00%, 8/1/2025 | | |
Series 2015B, COP, 5.00%, 8/1/2027 | | |
Pasco County School Board | | |
Series 2013A, COP, 5.00%, 8/1/2024 | | |
Series 2013, Rev., 5.00%, 10/1/2024 | | |
Series 2022A, COP, 5.00%, 8/1/2025 | | |
Polk County School District Series 2019B, COP, 5.00%, 1/1/2025 | | |
Polk County School District, Sales Tax Rev., 5.00%, 10/1/2024 | | |
Sarasota County Public Hospital District, Sarasota Memorial Hospital Series 1998B, Rev., NATL - RE, 5.25%, 7/1/2024 | | |
School Board of Miami-Dade County (The), Florida Certificates Of Participation | | |
Series 2014A, COP, 5.00%, 5/1/2024 (b) (c) | | |
Series 2015A, COP, 5.00%, 5/1/2024 | | |
Series 2014D, COP, 5.00%, 11/1/2024 | | |
Series 2015D, COP, 5.00%, 2/1/2025 | | |
Series 2015A, COP, 5.00%, 5/1/2025 | | |
Series 2015C, COP, 5.00%, 5/1/2025 | | |
Series 2014D, COP, 5.00%, 11/1/2025 | | |
Series 2015D, COP, 5.00%, 2/1/2026 | | |
Series 2015A, COP, 5.00%, 5/1/2026 | | |
| | |
|
|
Series 2015A, COP, 5.00%, 7/1/2026 | | |
Series 2014D, COP, 5.00%, 11/1/2026 | | |
Series 2015D, COP, 5.00%, 2/1/2027 | | |
Series 2015A, COP, AGM, 5.00%, 5/1/2027 | | |
Series 2016B, COP, 5.00%, 8/1/2027 | | |
Series 2015A, COP, 5.00%, 5/1/2028 | | |
Series 2015D, COP, 5.00%, 5/1/2028 | | |
School District of Broward County, Florida Certificates Of Participation | | |
Series 2015A, COP, 5.00%, 7/1/2024 | | |
Series 2015B, COP, 5.00%, 7/1/2024 | | |
Series C, COP, 5.00%, 7/1/2024 | | |
Series 2015B, COP, 5.00%, 7/1/2025 | | |
Series A, COP, 5.00%, 7/1/2025 | | |
Series A, COP, 5.00%, 7/1/2026 | | |
Series C, COP, 5.00%, 7/1/2026 | | |
Series 2015B, COP, 5.00%, 7/1/2027 | | |
Series A, COP, 5.00%, 7/1/2027 | | |
Series B, COP, 5.00%, 7/1/2027 | | |
Series 2015A, COP, 5.00%, 7/1/2028 | | |
Series 2015A, COP, AGM, 5.00%, 7/1/2028 | | |
Series A, COP, 5.00%, 7/1/2028 | | |
Seacoast Utility Authority Series B, Rev., 5.00%, 3/1/2024 | | |
South Broward Hospital District, Memorial Healthcare System | | |
Series 2016, Rev., 5.00%, 5/1/2024 | | |
| | |
South Florida Water Management District Series 2015, COP, 5.00%, 10/1/2024 | | |
St. Johns County School Board, Sales Tax Rev., 5.00%, 10/1/2024 | | |
State of Florida Series 2023A, GO, 5.00%, 6/1/2026 | | |
State of Florida Board of Education, Public Education Capital Outlay Series 2015A, GO, 5.00%, 6/1/2026 | | |
State of Florida Department of Education | | |
Series 2021A, Rev., 5.00%, 7/1/2024 | | |
Series 2018A, Rev., 5.00%, 7/1/2025 | | |
State of Florida Department of Transportation Rev., 5.00%, 7/1/2024 | | |
SEE NOTES TO FINANCIAL STATEMENTS.
| J.P. Morgan Exchange-Traded Funds | |
| | |
Municipal Bonds — continued |
|
State of Florida Department of Transportation Turnpike System | | |
Series 2023 A, Rev., 5.00%, 7/1/2024 | | |
Series 2016B, Rev., 2.50%, 7/1/2026 | | |
State of Florida, Public Education Capital Outlay Series 2015 A, GO, 5.00%, 6/1/2025 | | |
State of Florida, State Board of Education, Lottery Series 2014A, Rev., 3.00%, 7/1/2025 | | |
| | |
|
Braselton Urban Redevelopment Agency, Municipal Facilities Project Rev., GTD, 4.00%, 7/1/2024 | | |
Carroll County School District, Sales Tax Series 2020, GO, 5.00%, 4/1/2024 | | |
City of Atlanta, Public Improvement GO, 4.75%, 12/1/2024 (b) | | |
City of Atlanta, Water and Wastewater Rev., 5.00%, 11/1/2026 | | |
Cobb County Kennestone Hospital Authority Rev., 5.00%, 4/1/2024 | | |
Cobb County Kennestone Hospital Authority, Wellstar Health System, Inc., Project Series 2020B, Rev., 5.00%, 4/1/2025 | | |
Columbus Medical Center Hospital Authority, Piedmont Healthcare Inc., Project Series 2019A, Rev., 5.00%, 7/1/2026 (c) | | |
County of DeKalb, Special Transportation, Parks and Greenspace and Libraries Tax GO, 5.00%, 12/1/2025 | | |
DeKalb Private Hospital Authority, Children's Healthcare Of Atlanta Series 2019B, Rev., 5.00%, 7/1/2024 | | |
Downtown Marietta Development Authority, Marietta School Project Series 2018, Rev., 5.00%, 3/1/2024 | | |
Forsyth County Water and Sewerage Authority Series 2012, Rev., GTD, 5.00%, 4/1/2024 (b) | | |
Gainesville and Hall County Development Authority, Hall County Facilities Project Rev., 5.00%, 5/1/2024 | | |
Gainesville and Hall County Hospital Authority, Northeast Georgia Health System, Inc., Project Series 2014A, Rev., GTD, 5.25%, 2/15/2025 (b) | | |
| | |
|
|
Henry County School District Series 2016, GO, 5.00%, 8/1/2025 | | |
Houston Healthcare System, Inc. Series 2016 A, Rev., 5.00%, 4/1/2024 (b) | | |
Municipal Electric Authority of Georgia Project Series 2016 A, Rev., 5.00%, 1/1/2026 | | |
Paulding County School District GO, 5.00%, 2/1/2025 (b) | | |
Richmond County Board of Education Series 2021, GO, 5.00%, 10/1/2024 | | |
Walton County School District Series 2012, GO, 5.25%, 8/1/2025 | | |
| | |
|
City and County Honolulu, Wastewater System Series B, Rev., 5.00%, 7/1/2024 | | |
City and County of Honolulu | | |
Series C, GO, 5.00%, 10/1/2024 | | |
Series 2012C, GO, 3.00%, 11/1/2025 | | |
County of Maui Series 2020, GO, 5.00%, 3/1/2024 | | |
| | |
Series FG, GO, 5.00%, 10/1/2024 | | |
Series FH, GO, 5.00%, 10/1/2024 | | |
Series ET, GO, 5.00%, 10/1/2028 | | |
Series EO, GO, 5.00%, 8/1/2029 | | |
| | |
|
Ada & Canyon Counties Joint School District No. 2 Meridian Series 2015, GO, 5.00%, 8/15/2025 (b) | | |
Idaho Housing and Finance Association, Federal Highway Trust | | |
Series 2015A, Rev., 5.00%, 7/15/2025 | | |
Series 2015A, Rev., 5.00%, 7/15/2026 | | |
Idaho Housing and Finance Association, Single Family Mortgage Series 2009A, Class I, Rev., VRDO, 3.48%, 3/11/2024 (c) | | |
Twin Falls County School District No. 411 Twin Falls | | |
Series A, GO, 4.25%, 9/15/2024 (b) | | |
Series A, GO, 4.50%, 9/15/2024 (b) | | |
| | |
SEE NOTES TO FINANCIAL STATEMENTS.
| J.P. Morgan Exchange-Traded Funds | |
JPMorgan Ultra-Short Municipal Income ETF
SCHEDULE OF PORTFOLIO INVESTMENTSAS OF February 29, 2024 (continued)
| | |
Municipal Bonds — continued |
|
Champaign County Community Unit School District No. 4 Champaign Series 2017, GO, 5.00%, 1/1/2025 | | |
Chicago Board of Education, Unlimited Tax Series 2018A, GO, AGM, 5.00%, 12/1/2024 | | |
Chicago Midway International Airport Series 2014A, Rev., AMT, 5.00%, 4/3/2024 | | |
Chicago O'Hare International Airport, Customer Facility Charge Senior Lien Series B, Rev., 5.00%, 1/1/2027 | | |
Chicago O'Hare International Airport, General Airport, Senior Lien | | |
Series B, Rev., 5.00%, 1/1/2025 | | |
Series C, Rev., 5.00%, 1/1/2025 | | |
Series 2020B, Rev., 5.00%, 1/1/2026 | | |
Series 2022D, Rev., 5.00%, 1/1/2026 | | |
Series B, Rev., 5.00%, 1/1/2026 | | |
Series E, Rev., 5.00%, 1/1/2026 | | |
Series 2022D, Rev., 5.00%, 1/1/2027 | | |
Series A, Rev., 5.00%, 1/1/2027 | | |
Series C, Rev., 5.00%, 1/1/2027 | | |
Series B, Rev., 5.00%, 1/1/2028 | | |
Series C, Rev., 5.00%, 1/1/2028 | | |
Chicago Transit Authority Capital Grant Receipts Series 2017, Rev., 5.00%, 6/1/2024 | | |
City of Chicago, Sales Tax Series 2002, Rev., 5.00%, 1/1/2025 (b) | | |
| | |
| | |
| | |
| | |
| | |
City of Springfield, Electric System, Senior Lien | | |
Series 2015, Rev., 5.00%, 3/1/2025 | | |
| | |
| | |
Series 2022A, GO, 5.00%, 11/15/2024 | | |
Series 2022 A, GO, 5.00%, 11/15/2025 | | |
Series 2021B, GO, 4.00%, 11/15/2026 | | |
Series 2021A, GO, 5.00%, 11/15/2028 | | |
Du Page and Will Counties Community School District No. 204 Indian Prairie GO, 4.00%, 12/30/2024 | | |
| | |
|
|
DuPage County Community Unit School District No. 200 Wheaton-Warrenville Series 2019, GO, 5.00%, 10/1/2024 | | |
Illinois Finance Authority, Advocate Health Care | | |
Series 2013A, Rev., 5.00%, 6/1/2024 | | |
Series 2014, Rev., 5.00%, 8/1/2024 (b) | | |
Illinois Finance Authority, Advocate Health Care Network Series 2014, Rev., 5.00%, 8/1/2024 (b) | | |
Illinois Finance Authority, Edward Elmhurst Healthcare Series 2017 A, Rev., 5.00%, 1/1/2027 (b) | | |
Illinois Finance Authority, Northwestern University Series 2015, Rev., 5.00%, 12/1/2026 | | |
Illinois Finance Authority, OSF Healthcare System | | |
Series 2015A, Rev., 5.00%, 11/15/2024 | | |
Series 2020 B-1, Rev., 5.00%, 11/15/2024 (c) | | |
Illinois Finance Authority, Presbyterian Homes Obligated Group Series 2021B, Rev., (SIFMA Municipal Swap Index Yield + 0.70%), 4.00%, 3/7/2024 (d) | | |
Illinois Finance Authority, Riverside Health System Rev., 5.00%, 11/15/2024 | | |
Illinois Finance Authority, Rush University Medical Center Obligated Group | | |
Series 2015A, Rev., 5.00%, 11/15/2024 | | |
Series 2015A, Rev., 5.00%, 11/15/2025 | | |
Series 2015A, Rev., 5.00%, 11/15/2027 | | |
Series 2015A, Rev., 5.00%, 11/15/2028 | | |
Illinois Finance Authority, State Clean Water Initiative | | |
Series 2017, Rev., 5.00%, 7/1/2024 | | |
Series 2019, Rev., 5.00%, 7/1/2024 | | |
Series 2016, Rev., 4.00%, 7/1/2026 | | |
Series 2016, Rev., 5.00%, 1/1/2028 | | |
Illinois Finance Authority, Swedish Covenant Hospital | | |
Series 2016A, Rev., 5.00%, 8/15/2026 (b) | | |
Series 2016 A, Rev., 5.25%, 8/15/2026 (b) | | |
Illinois Finance Authority, The Carle Foundation | | |
Series 2021A, Rev., 5.00%, 8/15/2025 | | |
SEE NOTES TO FINANCIAL STATEMENTS.
| J.P. Morgan Exchange-Traded Funds | |
| | |
Municipal Bonds — continued |
|
Series 2021A, Rev., 5.00%, 8/15/2028 | | |
Illinois Finance Authority, The University of Chicago Medical Center Series A, Rev., 5.00%, 8/15/2024 | | |
Illinois Finance Authority, University of Chicago Series 2015A, Rev., 5.00%, 10/1/2025 (b) | | |
Illinois Finance Authority, University Of Chicago Series 2014A, Rev., 5.00%, 10/1/2026 | | |
Illinois Housing Development Authority Rev., FHA, 4.00%, 6/1/2025 (c) | | |
Illinois Municipal Electric Agency, Power Supply System | | |
Series 2015A, Rev., 5.00%, 2/1/2025 | | |
Series 2015A, Rev., 5.00%, 2/1/2026 | | |
Illinois State Toll Highway Authority | | |
Series 2013A, Rev., 5.00%, 4/2/2024 | | |
Series 2014B, Rev., 5.00%, 4/2/2024 | | |
Series 2019 B, Rev., 5.00%, 1/1/2026 | | |
Kankakee & Will Counties Community Unit School District No. 5 Series 2015, GO, 4.00%, 5/1/2025 | | |
Lake Cook Kane & McHenry Counties Community Unit School District 220 Barrington Series 2022, GO, 5.00%, 12/1/2024 | | |
Lake County School District No. 112 North Shore Series 2022, GO, 5.00%, 12/1/2024 | | |
Northern Illinois Municipal Power Agency Series 2016 A, Rev., 5.00%, 12/1/2026 | | |
Public Building Commission of Chicago Series 2006, Rev., AMBAC, 5.25%, 3/1/2024 | | |
Railsplitter Tobacco Settlement Authority | | |
Rev., 5.00%, 6/1/2025 (b) | | |
Series 2017, Rev., 5.00%, 6/1/2026 (b) | | |
Regional Transportation Authority Series 2017A, Rev., 5.00%, 7/1/2024 | | |
Southwestern Illinois Development Authority Series 2020, Rev., 5.00%, 4/15/2024 | | |
| | |
Series 2021C, GO, 4.00%, 3/1/2024 | | |
Series 2021A, GO, 5.00%, 3/1/2024 | | |
Series 2021B, GO, 5.00%, 3/1/2024 | | |
Series 2022A, GO, 5.00%, 3/1/2024 | | |
Series 2022B, GO, 5.00%, 3/1/2024 | | |
| | |
|
|
Series 2018A, GO, 4.00%, 5/1/2024 | | |
Series 2018A, GO, 5.00%, 10/1/2024 | | |
Series 2022B, GO, 5.00%, 3/1/2025 | | |
Series 2014, GO, 5.00%, 5/1/2025 | | |
Series 2018B, GO, 5.00%, 10/1/2025 | | |
Series 2020B, GO, 5.00%, 10/1/2025 | | |
Series 2020D, GO, 5.00%, 10/1/2025 | | |
Series 2017D, GO, 5.00%, 11/1/2025 | | |
Series 2017A, GO, 5.00%, 12/1/2025 | | |
| | |
Series 2014, GO, 5.00%, 2/1/2026 | | |
Series 2021A, GO, 5.00%, 3/1/2026 | | |
Series 2016-6, GO, 5.00%, 6/1/2026 | | |
Series 2018B, GO, 5.00%, 10/1/2026 | | |
Series 2020B, GO, 5.00%, 10/1/2026 | | |
Series 2017D, GO, 5.00%, 11/1/2026 | | |
Series 2019 A, GO, 5.00%, 11/1/2026 | | |
Series 2022A, GO, 5.00%, 3/1/2027 | | |
Series 2023D, GO, 5.00%, 7/1/2028 | | |
Series 2020B, GO, 5.00%, 10/1/2028 | | |
Series 2017D, GO, 5.00%, 11/1/2028 | | |
Series 2021A, GO, 5.00%, 12/1/2028 | | |
State of Illinois Sales Tax Series 2013, Rev., 5.00%, 6/15/2026 | | |
State of Illinois, Sales Tax | | |
| | |
Series 2016A, Rev., 5.00%, 6/15/2024 | | |
Series 2002-4, Rev., NATL - RE, 6.00%, 6/15/2024 | | |
Tender Option Bond Trust Receipts/ Certificates Series 2017-XF2500, Rev., VRDO, LIQ : Wells Fargo Bank NA, 3.35%, 3/11/2024 (c) (e) | | |
University of Illinois, Auxiliary Facilities System | | |
Series 2018A, Rev., 5.00%, 4/1/2024 | | |
Series 2021 A, Rev., 5.00%, 4/1/2024 | | |
Village of Midlothian GO, AGM, 4.00%, 1/1/2025 | | |
Village of Rantoul GO, 4.00%, 1/1/2025 | | |
Will County School District No. 86 Joliet Series 2015C, GO, AGM - CR, 5.00%, 3/1/2024 | | |
| | |
SEE NOTES TO FINANCIAL STATEMENTS.
| J.P. Morgan Exchange-Traded Funds | |
JPMorgan Ultra-Short Municipal Income ETF
SCHEDULE OF PORTFOLIO INVESTMENTSAS OF February 29, 2024 (continued)
| | |
Municipal Bonds — continued |
|
Avon Community School Building Corp., Ad Valorem Property Tax First Mortgage Rev., 4.00%, 7/15/2024 | | |
Brownsburg 1999 School Building Corp., Ad Valorem Property Tax First Mortgage Series 2015B, Rev., 5.00%, 7/15/2024 | | |
Carmel Local Public Improvement Bond Bank Series 2021A, Rev., 4.00%, 7/15/2025 | | |
Carmel Redevelopment Authority, Option Income Tax Lease Rental Series 2014B, Rev., 5.00%, 7/1/2024 | | |
City of Indianapolis, Department of Public Utilities Water System Series 2018A, Rev., 5.00%, 10/1/2026 | | |
Clark Pleasant Middle School Corp., Ad Valorem Property Tax First Mortgage Rev., 4.00%, 1/15/2025 | | |
Fishers Industrial Redevelopment District, Income Tax Rev., 4.00%, 7/15/2024 | | |
Fort Wayne Redevelopment Authority Lease Rental Series 2014A, Rev., 3.00%, 8/1/2024 | | |
Franklin Township-Marion County Multiple School Building Corp. Series 2015B, Rev., 5.00%, 7/15/2024 | | |
GCS School Building Corp. One, Unlimited Ad Valorem Property Tax First Mortgage Rev., 5.00%, 1/15/2026 | | |
Indiana Finance Authority Series 2016C, Rev., 5.00%, 12/1/2024 | | |
Indiana Finance Authority, Community Foundation Of Northern Indiana Obligated Group | | |
Series 2015, Rev., 5.00%, 3/1/2024 | | |
Series 2016, Rev., 5.00%, 9/1/2026 | | |
Indiana Finance Authority, CWA Authority Project | | |
Series 2021-2, Rev., 5.00%, 10/1/2024 | | |
Series 2021-2, Rev., 5.00%, 10/1/2025 | | |
Indiana Finance Authority, Deaconess Health System Series 2015A, Rev., 4.00%, 3/1/2025 (b) | | |
Indiana Finance Authority, Franciscan Alliance, Inc., Obligated Group Series 2016B, Rev., 5.00%, 11/1/2024 | | |
Indiana Finance Authority, Goshen Health Series 2019B, Rev., 2.10%, 11/1/2026 (c) | | |
| | |
|
|
Indiana Finance Authority, Indiana University Health Obligated Group | | |
Series 2019C, Rev., 5.00%, 12/1/2024 | | |
Series 2019B, Rev., 2.25%, 7/1/2025 (c) | | |
Indiana Health Facility Financing Authority, Ascension Health Credit Group Series 2005A-7, Rev., 4.00%, 10/1/2025 | | |
Indiana Municipal Power Agency, Power Supply System | | |
Series 2014A, Rev., 5.00%, 1/1/2027 | | |
Series 2016C, Rev., 5.00%, 1/1/2027 | | |
Series 2016C, Rev., 5.00%, 1/1/2028 | | |
Indianapolis Local Public Improvement Bond Bank Series 2021A, Rev., 5.00%, 6/1/2024 | | |
Indianapolis Local Public Improvement Bond Bank, Stormwater Project Series 2013D, Rev., 3.25%, 1/1/2025 | | |
IPS Multi-School Building Corp., First Mortgage Series 2015, Rev., 5.00%, 7/15/2026 | | |
Ivy Tech Community College of Indiana, Student Fee | | |
Series T, Rev., 5.00%, 7/1/2024 | | |
Series W, Rev., 5.00%, 7/1/2024 | | |
Series W, Rev., 5.00%, 7/1/2025 | | |
Jackson County Building Corp. Rev., 2.00%, 1/15/2025 | | |
New Prairie United School District Building Corp., First Mortgage Rev., 4.00%, 1/15/2025 | | |
Pike Township Multi-School Building Corp., First Mortgage Rev., 5.00%, 7/15/2024 | | |
South Bend Community School Building Corp. Series 2017, Rev., 4.00%, 7/15/2024 | | |
South Gibson School Building Corp., First Mortgage Rev., 4.00%, 1/10/2025 | | |
Southmont School Building Corp., Ad Valorem Property Tax, First Mortgage Rev., 5.00%, 1/15/2025 | | |
Twin Lakes School Building Corp., First Mortgage Rev., 4.00%, 7/15/2024 | | |
Winfield Building Corp., Indiana Lease Rental, Sewage Works Treatment Plant Project | | |
Series 2020B, Rev., 4.00%, 7/15/2024 | | |
SEE NOTES TO FINANCIAL STATEMENTS.
| J.P. Morgan Exchange-Traded Funds | |
| | |
Municipal Bonds — continued |
|
Series 2020B, Rev., 4.00%, 1/15/2025 | | |
Series 2020B, Rev., 4.00%, 7/15/2025 | | |
Series 2020A, Rev., 4.00%, 1/15/2026 | | |
Series 2020B, Rev., 4.00%, 1/15/2026 | | |
Zionsville Community Schools Building Corp., First Mortgage, Capital Appreciation Series 2003Z, Rev., NATL - RE, Zero Coupon, 1/15/2025 | | |
| | |
|
City of Davenport Series 2023, GO, 5.00%, 6/1/2024 | | |
County of Linn Series 2019, COP, 5.00%, 6/1/2024 | | |
Iowa Finance Authority, Midwestern Disaster Area, Archer-Daniels-Midland Co. Project Rev., VRDO, 3.55%, 3/11/2024 (c) | | |
| | |
Series 2016A, Rev., 5.00%, 6/1/2024 | | |
Series 2016A, Rev., 5.00%, 6/1/2025 | | |
State of Iowa Board of Regents, University of Iowa, Hospitals and Clinics Series S, Rev., 5.00%, 9/1/2025 | | |
University of Iowa (The), Parking System Bond Anticipation Project Series 2023, Rev., BAN, 3.50%, 7/1/2026 | | |
Waukee Community School District Series 2019B, GO, 5.00%, 6/1/2024 | | |
Waukee Community School District Infrastructure Sales Services & Use Tax Series 2017A, Rev., 4.00%, 6/1/2024 | | |
| | |
|
City of Derby Series 2024-1, GO, 4.00%, 12/1/2026 (f) | | |
City of Lawrence Series I, GO, 5.00%, 5/1/2024 | | |
City of Manhattan, Temporary Notes Series 2020-03, GO, 0.75%, 6/15/2024 | | |
County of Shawnee COP, 3.00%, 9/1/2024 | | |
Franklin County Unified School District No. 290 Ottawa Series A, GO, 4.00%, 9/1/2025 (b) | | |
Johnson County Unified School District No. 233 Olathe Series 2016A, GO, 4.00%, 9/1/2024 (b) | | |
| | |
|
|
Kansas Development Finance Authority, University of Kansas Project Series 2020 B, Rev., 5.00%, 5/1/2024 | | |
Rice County Unified School District No. 376 Sterling Series 2015, GO, AGM, 4.00%, 9/1/2025 (b) | | |
Sedgwick County Unified School District No. 266 Maize Series 2017, GO, 5.00%, 9/1/2024 | | |
| | |
|
Campbell Kenton & Boone Counties Sanitation District No. 1 Series 2020, Rev., 5.00%, 8/1/2024 | | |
Johnson County School District Finance Corp. Series 2023, Rev., 4.00%, 4/1/2024 | | |
Kenton County Public Properties Corp., Court Facilities Project Rev., 3.00%, 3/1/2024 | | |
Kentucky Asset Liability Commission, Federal Highway Trust Fund | | |
Series 2021A, Rev., 5.00%, 11/1/2024 | | |
Series 2015A, Rev., 5.00%, 9/1/2025 | | |
Series 2023A, Rev., 5.00%, 9/1/2025 | | |
Series 2015A, Rev., 5.00%, 9/1/2026 | | |
Series A, Rev., 5.00%, 9/1/2026 | | |
Kentucky Economic Development Finance Authority, Catholic Health Initiatives Series 2011B-3, Rev., (SIFMA Municipal Swap Index Yield + 1.40%), 4.70%, 3/7/2024 (d) | | |
Kentucky Economic Development Finance Authority, CommonSpirit Health Obligated Group Series 2019A-1, Rev., 5.00%, 8/1/2025 | | |
Kentucky Municipal Power Agency, Prairie State Project Series 2015A, Rev., NATL - RE, 5.00%, 9/1/2024 | | |
Kentucky Public Energy Authority, Gas Supply | | |
Series 2018A, Rev., 4.00%, 3/15/2024 (c) | | |
Series 2020A, Rev., 4.00%, 6/1/2026 (c) | | |
Kentucky State Property and Building Commission, Project No. 108 | | |
Series B, Rev., 5.00%, 8/1/2024 | | |
Series B, Rev., 5.00%, 8/1/2026 | | |
Series A, Rev., 5.00%, 8/1/2028 | | |
SEE NOTES TO FINANCIAL STATEMENTS.
| J.P. Morgan Exchange-Traded Funds | |
JPMorgan Ultra-Short Municipal Income ETF
SCHEDULE OF PORTFOLIO INVESTMENTSAS OF February 29, 2024 (continued)
| | |
Municipal Bonds — continued |
|
Kentucky State Property and Building Commission, Project No. 112 | | |
Series B, Rev., 5.00%, 11/1/2025 | | |
Series B, Rev., 5.00%, 11/1/2026 | | |
Kentucky State Property and Building Commission, Project No. 115 Rev., 5.00%, 4/1/2028 | | |
Kentucky State Property and Building Commission, Project No. 122 Series A, Rev., 5.00%, 11/1/2027 | | |
Kentucky State Property and Building Commission, Project No.119 Rev., 5.00%, 5/1/2024 | | |
Kentucky Turnpike Authority, Revitalization Projects | | |
Series 2014A, Rev., 5.00%, 7/1/2024 | | |
Series B, Rev., 5.00%, 7/1/2025 | | |
Series B, Rev., 4.00%, 7/1/2027 | | |
Series 2016A, Rev., 5.00%, 7/1/2027 | | |
Lexington-Fayette Urban County Government Sewer System Series 2014A, Rev., 5.00%, 9/1/2024 | | |
Lexington-Fayette Urban County Government, Various Purpose | | |
Series 2012B, GO, 3.00%, 7/1/2024 | | |
Series 2017A, GO, 5.00%, 9/1/2024 | | |
Louisville and Jefferson County Metropolitan Government, Norton Healthcare, Inc. | | |
Series 2016 A, Rev., 5.00%, 10/1/2026 | | |
Series 2016A, Rev., 5.00%, 10/1/2027 | | |
Louisville and Jefferson County Metropolitan Sewer District Green Bond Certified Series 2022 A, Rev., 5.00%, 5/15/2024 | | |
Oldham County School District Finance Corp. Series 2023, Rev., 4.00%, 5/1/2024 | | |
Scott County School District Finance Corp. Rev., 5.00%, 6/1/2025 | | |
University of Kentucky, General Receipts | | |
Series 2014A, Rev., 4.00%, 4/1/2024 (b) | | |
Series 2014A, Rev., 5.00%, 4/1/2024 | | |
Series 2015B, Rev., 5.00%, 10/1/2024 | | |
| | |
|
Ascension Parish School Board | | |
Series 2013A, GO, 4.00%, 3/1/2024 (b) | | |
Series 2020, GO, 4.00%, 3/1/2024 | | |
| | |
|
|
City of New Orleans, Water System Series 2014, Rev., 5.00%, 12/1/2024 (b) | | |
East Baton Rouge Sewerage Commission Series 2014B, Rev., 5.00%, 2/1/2025 (b) | | |
Ernest N Morial New Orleans Exhibition Hall Authority Series 2022, Rev., 5.00%, 7/15/2024 | | |
Housing And Redevelopment Authority of The City of St. Paul Minnesota, Healtheast care System Series 2014, GO, 5.00%, 3/1/2024 | | |
Jefferson Parish School Board Series 2015, GO, 5.00%, 3/1/2024 | | |
Louisiana Local Government Environmental Facilities and Community Development Authority, City Of Lake Charles Public Improvement Projects Series 2017, Rev., 5.00%, 5/1/2024 | | |
Louisiana Local Government Environmental Facilities and Community Development Authority, LCTCS Act 360 Project Series 2014, Rev., 5.00%, 10/1/2024 (b) | | |
Louisiana Local Government Environmental Facilities and Community Development Authority, LCTCS Act 391 Project Series 2017, Rev., 5.00%, 10/1/2024 | | |
Louisiana Public Facilities Authority, Elementus Minerals, LLC Project Series 2023, Rev., 5.00%, 11/1/2025 (c) (e) | | |
Louisiana Public Facilities Authority, Hurricane Recovery Program Series 2014, Rev., 5.00%, 6/1/2024 | | |
Louisiana Public Facilities Authority, Tulane University of Louisiana Project Series 2016A, Rev., 5.00%, 12/15/2026 | | |
Louisiana State University and Agricultural and Mechanical College, Auxiliary Facilities System Series 2016A, Rev., 5.00%, 7/1/2024 | | |
St Charles Parish School District No. 1 Series 2015, GO, 5.00%, 3/1/2024 | | |
| | |
Series A, GO, 5.00%, 5/1/2024 | | |
Series 2014C, GO, 5.00%, 8/1/2025 | | |
State of Louisiana Gasoline & Fuels Tax | | |
Series 2014B, Rev., 4.00%, 5/1/2024 (b) | | |
Series 2014B, Rev., 5.00%, 5/1/2024 (b) | | |
SEE NOTES TO FINANCIAL STATEMENTS.
| J.P. Morgan Exchange-Traded Funds | |
| | |
Municipal Bonds — continued |
|
State of Louisiana Gasoline and Fuels Tax | | |
Series 2014B, Rev., 5.00%, 5/1/2024 (b) | | |
Series A, Rev., 4.50%, 5/1/2025 (b) | | |
State of Louisiana Gasoline and Fuels Tax, Second Lien | | |
Series 2023 A-2, Rev., VRDO, LOC : TD Bank NA, 2.95%, 3/1/2024 (c) | | |
Series 2022A, Rev., (SOFR + 0.50%), 4.22%, 3/7/2024 (d) | | |
Terrebonne Parish Consolidated Government Series 2015, GO, 5.00%, 3/1/2024 | | |
| | |
|
Maine Health and Higher Educational Facilities Authority, Mainehealth Series 2020A, Rev., 5.00%, 7/1/2026 | | |
Maine Municipal Bond Bank Series 2014C, Rev., 5.00%, 11/1/2024 | | |
Maine School Administrative District No. 51 GO, 4.00%, 8/1/2025 | | |
University of Maine System Rev., 5.00%, 3/1/2025 | | |
| | |
|
County of Baltimore GO, 5.00%, 3/1/2024 | | |
County of Baltimore, Consolidated Public Improvement GO, 5.00%, 2/1/2025 | | |
County of Baltimore, Equipment Acquisition Program Series 2022, COP, 5.00%, 3/1/2024 | | |
County of Charles Series 2016, GO, 5.00%, 10/1/2024 | | |
| | |
Series 2020B, COP, 4.00%, 4/1/2024 | | |
Series 2014A, GO, 5.00%, 11/1/2024 | | |
Series 2014A, GO, 5.00%, 11/1/2024 (b) | | |
Series 2015 B, GO, 5.00%, 12/1/2024 | | |
County of Montgomery, Trinity Health Credit Group Series 2013MD, Rev., VRDO, 3.75%, 6/3/2024 (c) | | |
County of Prince George's, Consolidated Public Improvement | | |
Series 2013A, GO, 3.00%, 3/1/2024 | | |
Series 2014A, GO, 4.00%, 9/1/2024 | | |
| | |
|
|
County of Prince George's, Maryland Chesapeake Lighthouse Charter School Project Series A, Rev., 7.00%, 12/1/2024 (b) | | |
County of Worcester Series 2014A, GO, 5.00%, 3/1/2024 | | |
Maryland Community Development Administration, Housing and Community Development Series 2019A, Rev., 2.10%, 3/1/2024 | | |
Maryland Health and Higher Educational Facilities Authority, Lifebridge Health Issue Rev., 5.00%, 7/1/2025 | | |
Maryland Health and Higher Educational Facilities Authority, Medstar Health Issue | | |
| | |
Series 2013A, Rev., 5.00%, 8/15/2024 | | |
Series 2020B-1, Rev., 5.00%, 7/1/2025 (c) | | |
Maryland Health and Higher Educational Facilities Authority, Peninsula Regional Medical Center Series 2015, Rev., 5.00%, 7/1/2024 (b) | | |
Maryland Health and Higher Educational Facilities Authority, Western Maryland Health System Series 2014, Rev., 5.25%, 7/1/2024 (b) | | |
Maryland Stadium Authority, Construction and Revitalization Program Series 2018A, Rev., 5.00%, 5/1/2024 | | |
Maryland Water Infrastructure Financing Administration Bay Restoration Fund Series 2016, Rev., 5.00%, 3/1/2024 | | |
| | |
Series 2019 FIRST SERIES, GO, 5.00%, 3/15/2024 | | |
Series 2020A-1, GO, 5.00%, 3/15/2024 | | |
Series 2016, GO, 4.00%, 6/1/2028 | | |
State of Maryland Department of Transportation Series 2015 THIRD ISSUE, Rev., 4.00%, 12/15/2024 | | |
State of Maryland Department of Transportation, Second Issue Rev., 5.00%, 6/1/2025 | | |
State of Maryland, State and Local Facilities Loan of 2017 Series A, GO, 5.00%, 3/15/2024 | | |
| | |
SEE NOTES TO FINANCIAL STATEMENTS.
| J.P. Morgan Exchange-Traded Funds | |
JPMorgan Ultra-Short Municipal Income ETF
SCHEDULE OF PORTFOLIO INVESTMENTSAS OF February 29, 2024 (continued)
| | |
Municipal Bonds — continued |
|
City of Attleboro Series 2016, GO, 4.00%, 3/15/2024 | | |
| | |
Series 2014A, GO, 4.00%, 3/1/2024 (b) | | |
Series 2015B, GO, 5.00%, 4/1/2024 | | |
City of Chicopee Series 2016, GO, 4.00%, 8/15/2024 | | |
City of Marlborough Series 2020, GO, 5.00%, 5/15/2024 | | |
City of Springfield Series 2019, GO, 5.00%, 3/1/2024 | | |
City of Woburn, Municipal Purpose Loan GO, 2.63%, 11/15/2025 | | |
Commonwealth of Massachusetts | | |
Series B, GO, 5.00%, 4/1/2024 | | |
Series 2018 C, GO, 5.00%, 4/19/2024 | | |
Series 2015A, GO, 5.00%, 5/1/2024 | | |
Series E, GO, 5.00%, 9/1/2024 | | |
Commonwealth of Massachusetts Federal Highway, Accelerated Bridge Program Series 2014A, Rev., GAN, 5.00%, 6/15/2024 | | |
Commonwealth of Massachusetts Federal Highway, Grant Anticipation Note Series 2014A, Rev., GAN, 5.00%, 6/15/2025 | | |
Massachusetts Development Finance Agency, Caregroup | | |
Series 2015 H-1, Rev., 5.00%, 7/1/2024 (b) | | |
Series 2015 H-1, Rev., 5.00%, 7/1/2024 | | |
Series 2015 H-1, Rev., 5.00%, 7/1/2025 (b) | | |
Series 2015 H-1, Rev., 5.00%, 7/1/2025 | | |
Massachusetts Development Finance Agency, Children's Hospital Corp Obligated Group Series 2014P, Rev., 5.00%, 10/1/2024 (b) | | |
Massachusetts Development Finance Agency, Partners Healthcare System Issue | | |
Series 2019T-1, Rev., (SIFMA Municipal Swap Index Yield + 0.60%), 3.90%, 3/7/2024 (d) (e) | | |
Series 2017S-2, Rev., 5.00%, 1/30/2025 (c) | | |
Massachusetts School Building Authority, Dedicated Sales Tax Series 2018A, Rev., 5.00%, 2/15/2028 | | |
| | |
|
Massachusetts — continued |
Massachusetts State College Building Authority | | |
Series 2017D, Rev., 5.00%, 5/1/2024 | | |
Series 2016A, Rev., 4.00%, 5/1/2025 | | |
Massachusetts Water Resources Authority | | |
Series 2014F, Rev., 5.00%, 8/1/2024 (b) | | |
Series 2014F, Rev., 5.00%, 8/1/2024 | | |
Montachusett Regional Transit Authority Rev., RAN, GTD, 4.50%, 7/26/2024 | | |
Nauset Regional School District GO, BAN, 5.00%, 5/16/2024 | | |
Southeastern Massachusetts Regional 911 District GO, BAN, 5.00%, 10/10/2024 | | |
Springfield Water and Sewer Commission Series 2019 E, Rev., 4.00%, 4/15/2024 | | |
Town of Hatfield GO, BAN, 4.50%, 5/16/2024 | | |
Town of Marshfield, Municipal Purpose Loan GO, 5.00%, 11/1/2024 | | |
Town of Middleton, Municipal Purpose Loan GO, 2.50%, 8/15/2025 | | |
Town of Randolph GO, BAN, 4.75%, 6/27/2024 | | |
Town of Tewksbury, Municipal Purpose Loan GO, 4.00%, 1/15/2025 | | |
Town of West Springfield GO, BAN, 4.75%, 6/20/2024 | | |
University of Massachusetts Building Authority Series 1, Rev., 5.00%, 11/1/2024 (b) | | |
| | |
|
Caledonia Community Schools Series 2014, GO, Q-SBLF, 5.00%, 5/1/2024 | | |
City of Battle Creek Series 2018, GO, 5.00%, 5/1/2024 | | |
City of Brighton Series 2021, GO, 4.00%, 10/1/2024 | | |
City of Detroit, Unlimited Tax Series 2004A, Rev., AGM, 5.25%, 7/1/2024 | | |
City of Grand Rapids, Capital Improvement, Limited Tax GO, 5.00%, 4/1/2024 | | |
City of Lathrup Village, Limited Tax GO, 5.00%, 10/1/2025 | | |
County of Jackson, Transportation GO, 2.00%, 5/1/2024 | | |
SEE NOTES TO FINANCIAL STATEMENTS.
| J.P. Morgan Exchange-Traded Funds | |
| | |
Municipal Bonds — continued |
|
County of Macomb, Limited Tax Series 2015, GO, 4.00%, 5/1/2024 | | |
Grand Valley State University | | |
Series 2016A, Rev., 5.00%, 12/1/2024 | | |
Series 2016A, Rev., 5.00%, 12/1/2027 | | |
Great Lakes Water Authority, Water Supply System, Second Lien Series 2018A, Rev., 5.00%, 7/1/2024 | | |
Kalamazoo Hospital Finance Authority, Bronson Healthcare Group, Inc. Rev., 5.00%, 5/15/2024 (b) | | |
Karegnondi Water Authority, Water Supply System Series 2014A, Rev., 5.00%, 11/1/2026 | | |
Kent Hospital Finance Authority, Mary Free Bed Rehabilitation Hospital | | |
Series 2021A, Rev., 5.00%, 4/1/2024 | | |
Series 2021A, Rev., 5.00%, 4/1/2025 | | |
L'Anse Creuse Public Schools Series 2015, GO, Q-SBLF, 5.00%, 5/1/2025 (b) | | |
Linden Community School District, School Building and Site, Unlimited Tax Series 2021I, GO, Q-SBLF, 4.00%, 5/1/2025 | | |
Livonia Municipal Building Authority, Limited Tax Rev., 4.00%, 5/1/2024 | | |
Michigan Finance Authority | | |
Series 2016C-3, Rev., 5.00%, 4/1/2024 | | |
Series 2015A, Rev., 5.00%, 8/1/2024 (b) | | |
Michigan Finance Authority, Ascension Senior Credit Group Series 2016E-1, Rev., 4.00%, 8/15/2024 (c) | | |
Michigan Finance Authority, Beaumont Health Credit Group | | |
Series 2022A, Rev., 5.00%, 4/15/2024 | | |
Series 2015A, Rev., 5.00%, 8/1/2024 (b) | | |
Series D-2, Rev., AGM, 5.00%, 7/1/2028 | | |
Michigan Finance Authority, Clean Water Revolving Fund | | |
Series 2016B, Rev., 5.00%, 10/1/2024 | | |
Series 2018B, Rev., 5.00%, 10/1/2024 | | |
Michigan Finance Authority, Detroit Regional Convention Facility Authority Series 2014H-1, Rev., 5.00%, 10/1/2024 | | |
Michigan Finance Authority, Henry Ford Health System | | |
Series 2016, Rev., 5.00%, 11/15/2025 | | |
| | |
|
|
| | |
Michigan Finance Authority, Hospital Trinity Health Credit Group | | |
Series 2015MI, Rev., 5.50%, 12/1/2026 | | |
Series 2017A-MI, Rev., 5.00%, 12/1/2027 | | |
Series 2015MI, Rev., 5.50%, 12/1/2027 | | |
Michigan Finance Authority, Local Government Loan Program, Detroit Water and Sewerage Department, Sewage Disposal | | |
Series 2014C-3, Rev., AGM, 5.00%, 7/1/2027 | | |
Series 2014C-7, Rev., NATL - RE, 5.00%, 7/1/2028 | | |
Michigan Finance Authority, Midmichigan Health Series 2014, Rev., 5.00%, 6/1/2024 (b) | | |
Michigan Finance Authority, Trinity Health Credit Group | | |
Series 2013MI-1, Rev., VRDO, 3.81%, 6/1/2024 (c) | | |
Series 2017A-MI, Rev., 5.00%, 12/1/2024 | | |
Series 2019MI-2, Rev., 5.00%, 2/1/2025 (c) | | |
Series 2017A-MI, Rev., 5.00%, 12/1/2026 | | |
Michigan State Building Authority, Facilities Program | | |
Series 2023-I, Rev., VRDO, 3.40%, 3/11/2024 (c) | | |
Series 2019 I, Rev., 5.00%, 4/15/2024 | | |
Michigan State Building Authority, Multi Modal Program Series III, Rev., VRDO, 3.40%, 3/11/2024 (c) | | |
Michigan State Hospital Finance Authority, Ascension Health Credit Group | | |
Series 2010F-3, Rev., 4.00%, 7/1/2024 (c) | | |
Series 1999B-4, Rev., 5.00%, 11/15/2027 | | |
Michigan State Hospital Finance Authority, Trinity Health Credit Group Series 2008C, Rev., 5.00%, 12/1/2024 | | |
Michigan State University Series 2015A, Rev., 5.00%, 8/15/2028 | | |
SEE NOTES TO FINANCIAL STATEMENTS.
| J.P. Morgan Exchange-Traded Funds | |
JPMorgan Ultra-Short Municipal Income ETF
SCHEDULE OF PORTFOLIO INVESTMENTSAS OF February 29, 2024 (continued)
| | |
Municipal Bonds — continued |
|
Michigan Strategic Fund Limited Obligation, Facility For Rare Isotope Beams Projects At Michigan State University Series 2014, Rev., 5.00%, 3/1/2024 | | |
Michigan Strategic Fund, Rare Isotope Beams Projects Series 2014, Rev., 5.00%, 3/1/2024 (b) | | |
North Gratiot Interceptor Drain Drainage District Series 2015, GTD, 5.00%, 5/1/2024 | | |
North Kent Sewer Authority Series 2016, Rev., 5.00%, 11/1/2024 | | |
Portage Public Schools Series 2016, GO, 5.00%, 11/1/2024 | | |
RIB Floater Trust Various States Series 46, Rev., VRDO, LOC : Barclays Bank plc, 3.90%, 3/1/2024 (c) (e) | | |
Royal Oak Hospital Finance Authority, William Beaumont Hospital Obligated Group Series 2014D, Rev., 5.00%, 3/1/2024 (b) | | |
Saginaw City School District, Unlimited Tax GO, Q-SBLF, 5.00%, 5/1/2024 | | |
Schoolcraft Community College District, Limited Tax GO, 3.00%, 5/1/2024 | | |
South Lake Schools, School Building and Site GO, Q-SBLF, 4.00%, 11/1/2024 | | |
| | |
Series 2016, Rev., GAN, 5.00%, 3/15/2024 | | |
Series 2016, Rev., GAN, 5.00%, 3/15/2025 | | |
Series 2016, Rev., GAN, 5.00%, 3/15/2026 | | |
Troy School District Series 2015, GO, Q-SBLF, 5.00%, 5/1/2024 | | |
University of Michigan Series 2014A, Rev., 5.00%, 4/1/2024 | | |
Wayne County Airport Authority Series C, Rev., 5.00%, 12/1/2026 | | |
Wayne State University Series 2019A, Rev., 5.00%, 11/15/2024 | | |
Western Michigan University Series 2015A, Rev., 5.00%, 11/15/2024 | | |
| | |
|
City of St. Cloud, Centracare Health System | | |
Series 2014B, Rev., 5.00%, 5/1/2024 | | |
| | |
|
|
Series 2016A, Rev., 5.00%, 5/1/2026 | | |
City of St. Cloud, Infrastructure Management Fund Series 2013A, GO, 3.00%, 2/1/2025 | | |
City of West St. Paul Series 2017A, GO, 4.00%, 2/1/2025 | | |
County of Clay Series 2017A, GO, 5.00%, 2/1/2025 | | |
Duluth Independent School District No. 709 | | |
Series A, COP, 4.00%, 2/1/2027 | | |
Series A, COP, 4.00%, 2/1/2028 | | |
Series 2019B, COP, 5.00%, 2/1/2028 | | |
Housing And Redevelopment Authority of The City of St. Paul Minnesota, Healtheast care System Series 2015A, Rev., 5.00%, 11/15/2025 (b) | | |
Metropolitan Council, Minneapolis St. Paul Metropolitan Area | | |
Series 2015 A, GO, 5.00%, 3/1/2024 | | |
Series 2019A, GO, 5.00%, 3/1/2024 | | |
Series 2022C, GO, 5.00%, 3/1/2024 | | |
Minneapolis-St. Paul Metropolitan Airports Commission Series A, Rev., 4.00%, 1/1/2026 | | |
Minnesota Higher Education Facilities Authority, Cartleton College Series 2017, Rev., 5.00%, 3/1/2024 | | |
Minnesota Housing Finance Agency Series 2020D, Rev., 4.00%, 8/1/2024 | | |
Minnesota Municipal Gas Agency Series 2022B, Rev., LIQ : Royal Bank of Canada, (SOFR + 1.00%), 4.56%, 3/7/2024 (d) | | |
Rosemount-Apple Valley-Eagan Independent School District No. 196 Series 2016A, GO, 5.00%, 2/1/2025 | | |
Sauk Rapids-Rice Independent School District No. 47 Series 2015 A, GO, 5.00%, 4/25/2024 | | |
St Paul Port Authority, State of Minnesota Freeman Office Building Series 2013-3, Rev., 5.00%, 12/1/2024 | | |
St. Cloud Independent School District No. 742 Series 2021A, COP, 3.00%, 2/1/2025 | | |
St. Paul Port Authority, State of Minnesota Freeman Office Building Series 2013-2, Rev., 5.00%, 12/1/2024 | | |
SEE NOTES TO FINANCIAL STATEMENTS.
| J.P. Morgan Exchange-Traded Funds | |
| | |
Municipal Bonds — continued |
|
State of Minnesota Series 2014B, GO, 4.00%, 8/1/2025 | | |
University of Minnesota Series 2016A, Rev., 5.00%, 4/1/2024 | | |
| | |
|
City of Ridgeland GO, 4.00%, 8/1/2024 | | |
Jackson State University Educational Building Corp. Series 2015A, Rev., 5.00%, 3/1/2024 | | |
Madison County School District GO, 5.00%, 3/1/2024 | | |
Mississippi Business Finance Corp., Waste Management, Inc., Project Rev., 0.70%, 9/1/2026 (c) | | |
Mississippi Development Bank, Department of Corrections Walnut Grove Correctional Facility Refunding Bonds Project Series A, Rev., 5.00%, 8/1/2026 | | |
Mississippi Development Bank, Harrison County Series 2013A, Rev., 5.00%, 1/1/2026 | | |
Mississippi Development Bank, Rankin County School District Project | | |
| | |
| | |
Rankin County School District, Limited Tax GO, 5.00%, 8/1/2025 | | |
| | |
Series 2020B, GO, 5.00%, 9/1/2024 | | |
Series 2015F, GO, 5.00%, 11/1/2025 (b) | | |
State of Mississippi, Tax-Exempt Series 2017A, GO, 5.00%, 10/1/2024 | | |
University of Mississippi Educational Building Corp., Facilities Refinancing Project Rev., 5.00%, 10/1/2024 | | |
University of Southern Mississippi (The) Series 2015A, Rev., 5.00%, 3/1/2024 | | |
| | |
|
Cape Girardeau School District No. 63 GO, 4.00%, 3/1/2025 | | |
City of Kansas City Series 2017C, Rev., 5.00%, 9/1/2027 | | |
City of Kansas City, Downtown Arena Project Series E, Rev., 5.00%, 4/1/2028 | | |
| | |
|
|
City of Kansas City, Missouri Special Obligation Refunding and Improvement, Main Streetcar Extension Project Series 2022C, Rev., 5.00%, 9/1/2025 | | |
City of St. Louis Airport Series 2005, Rev., NATL - RE, 5.50%, 7/1/2027 | | |
County of Clay Series 2018A, COP, 4.00%, 5/1/2024 (b) | | |
County of Dunklin Rev., 3.00%, 12/1/2026 | | |
County of Greene, Missouri Capital Project Series 2022A, COP, 5.00%, 3/1/2024 | | |
Fort Zumwalt School District Series 2022, GO, 5.00%, 3/1/2024 | | |
Health and Educational Facilities Authority of the State of Missouri Series 2021 C, Rev., 5.00%, 5/1/2028 (c) | | |
Health and Educational Facilities Authority of the State of Missouri, BJC Health System Series 2021B, Rev., 4.00%, 5/1/2026 (c) | | |
Health and Educational Facilities Authority of the State of Missouri, Children's Mercy Hospital Obligated Group | | |
Series 2016, Rev., 5.00%, 5/15/2024 | | |
| | |
Health and Educational Facilities Authority of the State of Missouri, Mercy Health | | |
Series 2018A, Rev., 5.00%, 6/1/2027 | | |
Series 2018A, Rev., 5.00%, 6/1/2029 | | |
Health and Educational Facilities Authority of the State of Missouri, SSM Health Care Obligated Group | | |
Series 2014A, Rev., 5.00%, 6/1/2024 (b) | | |
Series 2022A, Rev., 5.00%, 6/1/2026 | | |
Health and Educational Facilities Authority of the State of Missouri, St. Louis University Rev., 5.00%, 11/15/2028 | | |
Health and Educational Facilities Authority of the State of Missouri, St. Luke's Health System, Inc. Rev., 5.00%, 11/15/2029 | | |
Jasper County Reorganized School District No. R-IX Carthage, Missouri Direct Deposit Program Series 2013, GO, 4.00%, 3/1/2024 | | |
Jefferson City School District Series 2018, GO, 4.00%, 3/1/2024 | | |
Joplin Schools, Missouri Direct Deposit Program GO, 4.00%, 3/1/2025 | | |
SEE NOTES TO FINANCIAL STATEMENTS.
| J.P. Morgan Exchange-Traded Funds | |
JPMorgan Ultra-Short Municipal Income ETF
SCHEDULE OF PORTFOLIO INVESTMENTSAS OF February 29, 2024 (continued)
| | |
Municipal Bonds — continued |
|
Liberty Public School District No. 53 Series 2023, GO, 5.00%, 3/1/2024 | | |
Missouri Highway and Transportation Commission Series A, Rev., 5.00%, 5/1/2024 | | |
Missouri Joint Municipal Electric Utility Commission, Plum Point Project Series 2014A, Rev., 5.00%, 1/1/2025 | | |
Missouri Joint Municipal Electric Utility Commission, Prairie State Project | | |
Series 2015A, Rev., 5.00%, 12/1/2024 | | |
Series 2015A, Rev., 5.00%, 6/1/2028 | | |
Missouri State Board of Public Buildings | | |
Series 2016 A, Rev., 4.00%, 4/1/2024 | | |
Series 2017 A, Rev., 5.00%, 4/1/2024 | | |
Missouri State Environmental Improvement and Energy Resources Authority, Water Pollution Control and Drinking Water Series 2013A, Rev., 5.00%, 7/1/2024 | | |
Park Hill School District of Platte County Series 2020, GO, 5.00%, 3/1/2024 | | |
Springfield School District No. R-12, Missouri Direct Deposit Program Series B, GO, 5.00%, 3/1/2024 | | |
St. Louis County Library District COP, 4.00%, 4/1/2027 | | |
| | |
|
| | |
Series 2021, GO, 5.00%, 4/15/2024 | | |
Series 2022, GO, 5.00%, 4/15/2024 | | |
Series 2023, GO, 5.00%, 4/15/2024 | | |
City of Omaha, Sanitary Sewerage System Series 2020A, Rev., 4.00%, 4/1/2025 | | |
County of Douglas, Creighton University Projects Series 2021B, Rev., (SIFMA Municipal Swap Index Yield + 0.53%), 3.83%, 3/7/2024 (d) | | |
Douglas County Hospital Authority No. 2, Children's Obligated Group Series 2020B, Rev., 5.00%, 11/15/2025 (c) | | |
Nebraska Public Power District | | |
Series 2012B, Rev., 5.00%, 1/1/2025 | | |
Series A-1, Rev., 5.00%, 1/1/2025 | | |
Series 2016A, Rev., 5.00%, 1/1/2026 | | |
Series B, Rev., 5.00%, 1/1/2026 | | |
Series 2016A, Rev., 5.00%, 1/1/2027 | | |
| | |
|
|
Series 2023 A, Rev., 5.00%, 7/1/2028 | | |
Public Power Generation Agency, Whelan Energy Center Unit 2 | | |
Series 2015A, Rev., 5.00%, 1/1/2025 | | |
Series 2015A, Rev., 5.00%, 1/1/2026 | | |
Southern Public Power District Series 2015, Rev., 5.00%, 12/15/2024 (b) | | |
State of Nebraska Series 2023A, COP, 5.00%, 4/1/2024 | | |
University of Nebraska, OMAHA Student Housing Project Rev., 3.25%, 5/15/2024 (b) | | |
| | |
|
Clark County School District, Limited Tax | | |
Series 2015D, GO, 5.00%, 6/15/2024 | | |
Series 2016A, GO, 5.00%, 6/15/2024 | | |
Series 2016B, GO, 5.00%, 6/15/2024 | | |
Series 2016E, GO, 5.00%, 6/15/2024 | | |
Series 2018A, GO, 5.00%, 6/15/2024 | | |
Series 2015C, GO, 5.00%, 6/15/2025 | | |
Series 2015 C, GO, 5.00%, 6/15/2026 | | |
Series 2016B, GO, 5.00%, 6/15/2026 | | |
Series 2017A, GO, 5.00%, 6/15/2026 | | |
Series 2021C, GO, 5.00%, 6/15/2026 | | |
Series 2015C, GO, 5.00%, 6/15/2028 | | |
Series 2017C, GO, 5.00%, 6/15/2028 | | |
Clark County School District, Limited Tax, Various Purpose Series 2016F, GO, 3.00%, 6/15/2026 | | |
County of Clark Passenger Facility Charge, Harry Reid International Airport Passenger Facility Series 2022B, Rev., 5.00%, 7/1/2024 | | |
County of Clark, Department of Aviation, Nevada Airport System, Subordinate Lien | | |
Series 2019D, Rev., 5.00%, 7/1/2024 | | |
Series 2019D, Rev., 5.00%, 7/1/2025 | | |
County of Clark, Indexed Fuel and Subordinate Motor Vehicle Tax Series 2014, Rev., 5.00%, 7/1/2028 | | |
County of Clark, Limited Tax Series 2016B, GO, 5.00%, 11/1/2024 | | |
County of Clark, Park Improvement, Limited Tax GO, 5.00%, 12/1/2024 | | |
SEE NOTES TO FINANCIAL STATEMENTS.
| J.P. Morgan Exchange-Traded Funds | |
| | |
Municipal Bonds — continued |
|
County of Clark, Passenger Facility Charge, Las Vegas-McCarran International Airport Passenger Facility Series 2019E, Rev., 5.00%, 7/1/2026 | | |
County of Clark, Transportation Improvement, Limited Tax Series 2018B, GO, 5.00%, 12/1/2025 | | |
State of Nevada Series 2015D, GO, 5.00%, 4/1/2024 | | |
State of Nevada, Capital Improvement and Cultural Affairs | | |
Series 2015B, GO, 5.00%, 11/1/2024 | | |
Series 2015B, GO, 5.00%, 11/1/2025 | | |
State of Nevada, Limited Tax Series 2012-A, GO, 4.00%, 11/1/2024 | | |
| | |
|
Windham School District Series 2014A, GO, 5.00%, 7/15/2024 | | |
|
Bergen County Improvement Authority (The) Series 2023, Rev., GTD, 4.50%, 5/31/2024 | | |
Borough of Bellmawr County of Camden, New Jersey Bond, General Improvement Water Utility Note Series 2023A, GO, BAN, 4.50%, 8/6/2024 | | |
Borough of Carteret Series 2023, GO, BAN, 4.75%, 5/31/2024 | | |
Borough of Chatham GO, BAN, 4.50%, 5/17/2024 | | |
Borough of Emerson GO, BAN, 4.50%, 7/26/2024 | | |
Borough of Englewood Cliffs GO, BAN, 4.50%, 8/8/2024 | | |
Borough of Glen Ridge GO, BAN, 4.50%, 7/11/2024 | | |
Borough of High Bridge GO, BAN, 5.00%, 6/13/2024 | | |
Borough of Kenilworth GO, BAN, 4.50%, 3/1/2024 | | |
Borough of Montvale GO, BAN, 4.50%, 4/11/2024 | | |
Borough of Mountainside GO, BAN, 5.00%, 7/19/2024 | | |
Borough of North Caldwell GO, BAN, 4.50%, 7/12/2024 | | |
| | |
|
|
Borough of Northvale GO, BAN, 5.00%, 9/13/2024 | | |
Borough of Ogdensburg GO, BAN, 4.50%, 7/26/2024 | | |
Borough of Palisades Park GO, BAN, 4.50%, 3/15/2024 | | |
Borough of Ramsey GO, BAN, 4.50%, 2/28/2025 (f) | | |
Borough of Sussex GO, BAN, 4.50%, 7/19/2024 | | |
Borough of Union Beach GO, BAN, 4.50%, 4/23/2024 | | |
Brick Township Board of Education GO, 4.00%, 1/1/2025 | | |
Burlington County Bridge Commission, Government Leasing Program Series 2018, Rev., 5.00%, 4/15/2024 | | |
Camden County Improvement Authority (The) Series 2015A, Rev., GTD, 5.00%, 9/1/2024 | | |
Camden County Improvement Authority (The), City Hall Project Rev., GTD, 5.00%, 12/1/2025 | | |
City of Linwood GO, BAN, 4.50%, 7/26/2024 | | |
City of Long Branch Series 2020A, GO, 5.00%, 9/15/2025 | | |
City of Ocean City, General Improvement GO, 4.00%, 9/15/2025 | | |
City of Ventnor City GO, BAN, 4.50%, 7/10/2024 | | |
County of Atlantic GO, 0.50%, 6/1/2024 | | |
County of Gloucester Series 2021, GO, 5.00%, 3/1/2024 | | |
County of Hudson Series B, GO, 4.00%, 7/1/2025 | | |
Gloucester County Improvement Authority (The) Series 2013A, Rev., GTD, 5.00%, 9/1/2024 | | |
Hopewell Valley Regional School District GO, 3.25%, 1/15/2025 | | |
Hudson County Improvement Authority, Courthouse Project Rev., 4.00%, 10/1/2025 | | |
Jersey City Municipal Utilities Authority, Sewer Project Notes Series 2023A, Rev., 4.00%, 5/3/2024 | | |
SEE NOTES TO FINANCIAL STATEMENTS.
| J.P. Morgan Exchange-Traded Funds | |
JPMorgan Ultra-Short Municipal Income ETF
SCHEDULE OF PORTFOLIO INVESTMENTSAS OF February 29, 2024 (continued)
| | |
Municipal Bonds — continued |
|
Jersey City Municipal Utilities Authority, Water Project Notes Series 2023B, Rev., 4.00%, 5/3/2024 | | |
Middletown Township Board of Education GO, 2.25%, 8/1/2024 | | |
Monmouth County Improvement Authority (The) Series 2023, Rev., GTD, 4.00%, 3/15/2024 | | |
Montgomery Township Board of Education GO, 5.00%, 4/1/2024 | | |
New Jersey Building Authority Series 2016A, Rev., 5.00%, 6/15/2024 (b) | | |
New Jersey Economic Development Authority | | |
Series 2015A, Rev., 5.00%, 6/15/2024 | | |
Series 2014PP, Rev., 5.00%, 6/15/2026 | | |
Series A, Rev., 4.00%, 11/1/2027 | | |
New Jersey Economic Development Authority, School Facilities Construction | | |
Series 2012-II, Rev., 3.00%, 3/1/2024 | | |
Series 2023 RRR, Rev., 5.00%, 3/1/2024 | | |
Series 2014PP, Rev., 5.00%, 6/15/2024 (b) | | |
Series 2018FFF, Rev., 5.00%, 6/15/2024 | | |
Series XX, Rev., 5.00%, 6/15/2024 | | |
Series 2019GGG, Rev., 5.25%, 9/1/2024 (e) | | |
Series 2014PP, Rev., AGM - CR, 5.00%, 6/15/2025 | | |
Series 2005N-1, Rev., AGM, 5.50%, 9/1/2025 | | |
Series 2023RRR, Rev., 5.00%, 3/1/2026 | | |
Series 2024SSS, Rev., 5.00%, 6/15/2026 (f) | | |
Series XX, Rev., 4.38%, 6/15/2027 | | |
Series 2024SSS, Rev., 5.00%, 6/15/2027 (f) | | |
New Jersey Educational Facilities Authority, College of New Jersey | | |
Series 2015G, Rev., 5.00%, 7/1/2024 (b) | | |
Series 2015G, Rev., 5.00%, 7/1/2025 (b) | | |
New Jersey Educational Facilities Authority, Higher Education Facilities Trust Series 2014, Rev., 5.00%, 6/15/2024 | | |
| | |
|
|
New Jersey Educational Facilities Authority, Higher Educational Capital Improvement Series 2014A, Rev., 5.00%, 9/1/2024 | | |
New Jersey Health Care Facilities Financing Authority, Barnabas Health Obligated Group | | |
Series 2019B-2, Rev., 5.00%, 7/1/2025 (c) | | |
Series 2019B-3, Rev., 5.00%, 7/1/2026 (c) | | |
New Jersey Health Care Facilities Financing Authority, Hospital Asset Transformation Program Series 2017, Rev., 5.00%, 10/1/2024 | | |
New Jersey Health Care Facilities Financing Authority, RWJ Barnabas Health Obligated Group | | |
Series 2019B-1, Rev., 5.00%, 7/1/2024 (c) | | |
Series 2016A, Rev., 5.00%, 7/1/2026 | | |
New Jersey Health Care Facilities Financing Authority, Valley Health System Obligated Rev., 5.00%, 7/1/2026 | | |
New Jersey Health Care Facilities Financing Authority, Virtua Health Obligated Group | | |
| | |
| | |
| | |
Series 2013, Rev., 5.00%, 7/1/2027 | | |
New Jersey Higher Education Student Assistance Authority, Senior Student Loan Series 2019A, Rev., 5.00%, 12/1/2024 | | |
New Jersey Housing and Mortgage Finance Agency, NBA-New Brunswick LLC Series 2022C-2, Rev., 3.13%, 8/1/2024 (c) | | |
New Jersey Infrastructure Bank, Environmental Infrastructure Series 2015A-R1, Rev., GTD, 5.00%, 9/1/2024 | | |
New Jersey Sports and Exposition Authority Series 2018A, Rev., 5.00%, 9/1/2024 | | |
New Jersey Transportation Trust Fund Authority, Capital Appreciation Series 2010A, Rev., Zero Coupon, 12/15/2028 | | |
New Jersey Transportation Trust Fund Authority, Transportation Program | | |
Series 2014AA, Rev., 5.00%, 6/15/2025 | | |
Series 2023AA, Rev., 5.00%, 6/15/2025 | | |
SEE NOTES TO FINANCIAL STATEMENTS.
| J.P. Morgan Exchange-Traded Funds | |
| | |
Municipal Bonds — continued |
|
New Jersey Transportation Trust Fund Authority, Transportation System | | |
Series 2013A, Rev., 5.00%, 6/15/2024 | | |
Series 2006C, Rev., AMBAC, Zero Coupon, 12/15/2024 | | |
Series 2021 A, Rev., 5.00%, 6/15/2026 | | |
Series 2019 A, Rev., 5.00%, 12/15/2026 | | |
Series 2018 A, Rev., 5.00%, 12/15/2027 | | |
Series 2019 A, Rev., 5.00%, 12/15/2027 | | |
Series 2021 A, Rev., 5.00%, 6/15/2028 | | |
New Jersey Turnpike Authority | | |
Series 2014A, Rev., 5.00%, 1/1/2027 | | |
Series 2014A, Rev., 5.00%, 1/1/2028 | | |
Passaic County Utilities Authority, Solid Waste Disposal Rev., GTD, 4.50%, 3/1/2024 | | |
Penns Grove-Carneys Point Regional School District GO, GAN, 4.50%, 7/3/2024 | | |
Pequannock Township Board of Education GO, 4.00%, 1/15/2025 | | |
Ridgewood Board of Education Series 2016 A, GO, 4.00%, 3/15/2024 | | |
Rutgers The State University of New Jersey Series 2016M, Rev., 5.00%, 5/1/2024 | | |
South Brunswick Township Board of Education GO, 5.00%, 8/1/2024 | | |
State of New Jersey, COVID-19 Emergency Bonds Series 2020 A, GO, 5.00%, 6/1/2028 | | |
State of New Jersey, Various Purpose | | |
| | |
| | |
Tobacco Settlement Financing Corp. | | |
Series 2018A, Rev., 5.00%, 6/1/2024 | | |
Series 2018A, Rev., 5.00%, 6/1/2026 | | |
Town of Dover, General Improvement Water Utility Series 2024, GO, BAN, 4.50%, 1/23/2025 | | |
Town of Westfield GO, BAN, 4.75%, 11/8/2024 | | |
Township of Colts Neck GO, 4.00%, 11/15/2025 | | |
Township of Eastampton GO, BAN, 4.50%, 7/24/2024 | | |
| | |
|
|
Township of Hamilton Series 2013, GO, 4.00%, 8/1/2024 | | |
Township of Harrison GO, 4.00%, 8/1/2025 | | |
Township of Lacey Series 2023A, GO, BAN, 5.00%, 5/9/2024 | | |
Township of Lawrence GO, BAN, 5.00%, 6/7/2024 | | |
Township of Little Falls, General Improvement GO, 4.00%, 8/15/2025 | | |
Township of Mahwah Series 2023, GO, BAN, 5.00%, 5/31/2024 | | |
Township of Middle, General Improvement Sewer Utility GO, BAN, 4.50%, 9/5/2024 | | |
Township of Mount Holly Series 2023A, GO, BAN, 4.50%, 9/26/2024 | | |
Township of North Bergen GO, BAN, 4.00%, 4/24/2024 | | |
Township of Parsippany-Troy Hills Series 2023, GO, BAN, 5.00%, 10/31/2024 | | |
Township of Pennsauken Series 2023A, GO, BAN, 4.50%, 7/12/2024 | | |
Township of Readington, General Improvement GO, 5.00%, 1/15/2025 | | |
Township of Rochelle Park GO, BAN, 4.50%, 8/9/2024 | | |
Township of Scotch Plains GO, BAN, 4.50%, 1/17/2025 | | |
Township of South Brunswick Series 2020, GO, 4.00%, 10/1/2024 | | |
Township of Stafford Series 2017, GO, 5.00%, 5/1/2024 | | |
Township of Tewksbury Series 2023A, GO, 4.50%, 5/14/2024 | | |
Township of Toms River Series 2012, GO, 5.00%, 3/1/2024 | | |
Township of Washington GO, 4.00%, 3/1/2025 | | |
Township of West Deptford GO, 3.00%, 9/1/2026 | | |
Township of West Orange Series 203A, GO, 5.00%, 11/7/2024 | | |
Township of Woodbridge GO, BAN, 4.50%, 3/15/2024 | | |
| | |
|
Albuquerque Bernalillo County Water Utility Authority Series 2018, Rev., 5.00%, 7/1/2024 | | |
SEE NOTES TO FINANCIAL STATEMENTS.
| J.P. Morgan Exchange-Traded Funds | |
JPMorgan Ultra-Short Municipal Income ETF
SCHEDULE OF PORTFOLIO INVESTMENTSAS OF February 29, 2024 (continued)
| | |
Municipal Bonds — continued |
|
Albuquerque Municipal School District No. 12, School Building Series 2018, GO, 5.00%, 8/1/2024 | | |
City of Santa Fe, Wastewater Utility System Series 2019, Rev., 5.00%, 6/1/2024 | | |
New Mexico Finance Authority, Senior Lien Public Project Revolving Fund Series 2016C, Rev., 5.00%, 6/1/2024 | | |
New Mexico Finance Authority, State Transportation, Subordinate Lien Series B-2, Rev., 5.00%, 6/15/2024 | | |
New Mexico Finance Authority, Subordinate Lien Public Project Revolving Fund, Tax-Exempt | | |
Series 2017B, Rev., 3.50%, 6/15/2024 | | |
Series 2018C-1, Rev., 4.00%, 6/15/2024 | | |
New Mexico Hospital Equipment Loan Council, Presbyterian Health Care Services Series 2019B, Rev., 5.00%, 8/1/2025 (c) | | |
Santa Fe Public School District Series 2022A, GO, 5.00%, 8/1/2025 | | |
| | |
Series 2021, GO, 5.00%, 3/1/2024 | | |
Series 2023, GO, 5.00%, 3/1/2024 | | |
Series B, GO, 5.00%, 3/1/2024 | | |
State of New Mexico Severance Tax Permanent Fund | | |
Series B, Rev., 4.00%, 7/1/2024 | | |
Series 2018A, Rev., 5.00%, 7/1/2024 | | |
State of New Mexico, Capital Projects GO, 5.00%, 3/1/2025 | | |
University of New Mexico (The), Subordinate Lien System Series 2014C, Rev., 5.00%, 6/1/2024 | | |
| | |
|
Canton Central School District Series 2023B, GO, BAN, 4.50%, 7/5/2024 | | |
Chenango Forks Central School District Series B, GO, BAN, 4.50%, 6/28/2024 | | |
City of Albany Series 2023, GO, BAN, 4.50%, 3/22/2024 | | |
City of Long Beach Series 2024A, GO, BAN, 4.50%, 9/27/2024 | | |
| | |
Series 2014J, GO, 5.00%, 8/1/2028 | | |
| | |
|
|
Series G, GO, 4.00%, 8/1/2029 | | |
City of New York, Fiscal Year 2004 Series 2004A-6, GO, 5.00%, 8/1/2024 | | |
City of New York, Fiscal Year 2014 | | |
Series 2014I-1, GO, 5.00%, 3/1/2024 | | |
Series 2014 I-1, GO, 5.00%, 3/1/2025 | | |
Series 2014J, GO, 5.00%, 8/1/2025 | | |
Series 2014I-1, GO, 5.00%, 3/1/2026 | | |
City of New York, Fiscal Year 2015 Series 2015A, GO, 5.00%, 8/1/2026 | | |
City of New York, Fiscal Year 2016 Series E, GO, 5.00%, 8/1/2024 | | |
City of New York, Fiscal Year 2017 Series C, GO, 5.00%, 8/1/2025 | | |
City of New York, Fiscal Year 2018 Series 2018F-1, GO, 4.00%, 4/1/2025 | | |
City of New York, Fiscal Year 2019 | | |
Series G, GO, 5.00%, 8/1/2024 | | |
Series G, GO, 5.00%, 8/1/2026 | | |
City of New York, Tax-Exempt Series 2015C, GO, 5.00%, 8/1/2025 | | |
City of Oneida Series 2023, GO, BAN, 4.00%, 3/29/2024 | | |
City of Troy GO, BAN, 4.50%, 7/26/2024 | | |
Clarence Central School District GO, BAN, 4.50%, 6/20/2024 | | |
County of Albany Series 2018, GO, 5.00%, 4/1/2024 | | |
County of Nassau Series 2014A, GO, AGM, 5.00%, 4/1/2024 (b) | | |
County of Nassau, General Improvement | | |
Series 2015B, GO, 5.00%, 4/1/2024 (b) | | |
Series 2016A, GO, 5.00%, 1/1/2025 | | |
County of Oneida Series 2023, GO, BAN, 5.00%, 3/1/2024 | | |
County of Ontario Series 2016, GO, 5.00%, 4/15/2024 | | |
County of Rockland Series 2014A, GO, AGM, 5.00%, 3/1/2024 | | |
County of Washington Series 2023, GO, BAN, 4.50%, 3/22/2024 | | |
Deposit Central School District Series A, GO, BAN, 4.75%, 6/28/2024 | | |
East Islip Union Free School District GO, BAN, 4.50%, 6/26/2024 | | |
SEE NOTES TO FINANCIAL STATEMENTS.
| J.P. Morgan Exchange-Traded Funds | |
| | |
Municipal Bonds — continued |
|
Erie County Industrial Development Agency (The), School District Buffalo Project Series 2015A, Rev., 5.00%, 5/1/2024 | | |
Evans-Brant Central School District Series B, GO, BAN, 4.50%, 6/20/2024 | | |
Fonda-Fultonville Central School District GO, BAN, 4.50%, 7/12/2024 | | |
Frewsburg Central School District GO, BAN, 4.50%, 7/9/2024 | | |
Greenwich Central School District GO, BAN, 4.50%, 6/25/2024 | | |
Guilderland Central School District GO, BAN, 4.50%, 7/26/2024 | | |
Hempstead Union Free School District | | |
Series 2023A, GO, BAN, 4.00%, 4/19/2024 | | |
GO, RAN, 5.00%, 6/28/2024 | | |
Horseheads Central School District Series 2023, GO, BAN, 4.75%, 6/21/2024 | | |
Hudson Yards Infrastructure Corp., Second Indenture Series 2017A, Rev., 5.00%, 2/15/2025 | | |
Iroquois Central School District GO, 5.00%, 6/15/2025 | | |
Lafayette Central School District | | |
GO, RAN, 5.00%, 6/14/2024 | | |
GO, BAN, 4.50%, 6/28/2024 | | |
Lakeland Central School District GO, BAN, 4.50%, 8/16/2024 | | |
Le Roy Central School District Series B, GO, BAN, 4.75%, 6/28/2024 | | |
Letchworth Central School District of Gainesville GO, BAN, 4.75%, 6/21/2024 | | |
Long Island Power Authority, Electric System | | |
Series 2020B, Rev., 0.85%, 9/1/2025 (c) | | |
| | |
Lyncourt Union Free School District GO, BAN, 4.50%, 6/27/2024 | | |
Malone Central School District GO, BAN, 4.50%, 6/27/2024 | | |
Massena Central School District GO, BAN, 4.50%, 6/28/2024 | | |
Metropolitan Transportation Authority | | |
Series 2005D-2, Rev., VRDO, LOC : Bank of Montreal, 3.50%, 3/1/2024 (c) | | |
Series 2014B, Rev., 5.00%, 5/15/2024 (b) | | |
| | |
|
|
Series 2016D, Rev., 4.00%, 11/15/2024 | | |
Series 2014B, Rev., 5.00%, 11/15/2024 | | |
Series 2014C, Rev., 5.00%, 11/15/2024 | | |
Series 2014D-1, Rev., 5.00%, 11/15/2024 (b) | | |
Series 2016B, Rev., 5.00%, 11/15/2024 | | |
Series 2017B, Rev., 5.00%, 11/15/2024 | | |
Series D-1, Rev., 5.00%, 11/15/2024 | | |
Series A-1, Rev., 5.00%, 11/15/2025 | | |
Metropolitan Transportation Authority, Dedicated Tax Fund Series 2013B-1, Rev., 5.00%, 11/15/2024 | | |
Monroe County Industrial Development Corp., Rochester Schools Modernization Project | | |
Series 2015, Rev., 5.00%, 5/1/2024 | | |
Series 2017, Rev., 5.00%, 5/1/2024 | | |
New York City Health and Hospitals Corp., Health System Series 2008C, Rev., VRDO, LOC : TD Bank NA, 3.40%, 3/11/2024 (c) | | |
New York City Industrial Development Agency, Queens Baseball Stadium Project Series 2021A, Rev., AGM, 5.00%, 1/1/2028 | | |
New York City Municipal Water Finance Authority, Water and Sewer System, Second General Resolution, Fiscal Year 2021 Series 2021, Subseries EE2, Rev., VRDO, LIQ : State Street Bank & Trust Co., 3.45%, 3/1/2024 (c) | | |
New York City Municipal Water Finance Authority, Water and Sewer System, Second General Resolution, Fiscal Year 2023 Series 2023, Subseries B-1, Rev., VRDO, LIQ : Mizuho Bank Ltd., 3.78%, 3/1/2024 (c) | | |
New York City Transitional Finance Authority Building Aid, Subordinate Series 2016 S-1, Rev., 5.00%, 7/15/2028 | | |
New York City Transitional Finance Authority, Building Aid, Fiscal Year 2018 Series S-2, Rev., 5.00%, 7/15/2028 | | |
New York City Transitional Finance Authority, Future Tax Secured | | |
Series B-1, Rev., 5.00%, 8/1/2024 | | |
Series C, Rev., 5.00%, 11/1/2027 | | |
SEE NOTES TO FINANCIAL STATEMENTS.
| J.P. Morgan Exchange-Traded Funds | |
JPMorgan Ultra-Short Municipal Income ETF
SCHEDULE OF PORTFOLIO INVESTMENTSAS OF February 29, 2024 (continued)
| | |
Municipal Bonds — continued |
|
New York City Transitional Finance Authority, Future Tax Secured, Fiscal Year 2014 | | |
Series D-3, Rev., VRDO, LIQ : Mizuho Bank Ltd., 2.85%, 3/1/2024 (c) | | |
Series 2014A-1, Rev., 5.00%, 4/2/2024 | | |
Series 2014D-1, Rev., 5.00%, 4/2/2024 | | |
Series 2014B-1, Rev., 5.00%, 11/1/2024 | | |
Series 2014 C, Rev., 5.00%, 11/1/2025 | | |
Series 2014B-1, Rev., 5.00%, 11/1/2026 | | |
Series 2014C, Rev., 5.00%, 11/1/2026 | | |
New York City Transitional Finance Authority, Future Tax Secured, Fiscal Year 2017 Series 2017F-1, Rev., 5.00%, 5/1/2024 | | |
New York City Transitional Finance Authority, Future Tax Secured, Fiscal Year 2018 | | |
Series 2018B-1, Rev., 5.00%, 8/1/2024 (b) | | |
Series 2018B-1, Rev., 5.00%, 8/1/2024 | | |
New York City Transitional Finance Authority, Future Tax Secured, Fiscal Year 2021 | | |
Series 2021C, Subseries C-1, Rev., 5.00%, 5/1/2024 | | |
Series 2021-1, Rev., 5.00%, 11/1/2025 | | |
New York City Transitional Finance Authority, Future Tax Secured, Fiscal Year 2022 Series 2022B,Subseries B-1, Rev., 5.00%, 8/1/2024 | | |
New York City Transitional Finance Authority, Future Tax Secured, Tax-Exempt, Fiscal Year 2016 Series 2016, Subseries E-1, Rev., 5.00%, 2/1/2025 | | |
New York State Dormitory Authority Series F, Rev., 5.00%, 10/1/2024 | | |
New York State Dormitory Authority, Hospitals Center, Langone Hospitals Obligated Group Series 2016A, Rev., 5.00%, 7/1/2024 | | |
New York State Dormitory Authority, Icahn School of Medicine at Mount Sinai | | |
Series 2015A, Rev., 5.00%, 7/1/2024 | | |
Series 2015A, Rev., 5.00%, 7/1/2025 | | |
New York State Dormitory Authority, Northwell Health Obligated Group Series 2019B2, Rev., 5.00%, 5/1/2024 (c) | | |
| | |
|
|
New York State Dormitory Authority, Personal Income Tax | | |
Series 2019A, Rev., 5.00%, 3/15/2024 (b) | | |
Series 2021 E, Rev., 5.00%, 3/15/2024 | | |
New York State Dormitory Authority, Pratt institute Series 2015A, Rev., 5.00%, 7/1/2024 (b) | | |
New York State Dormitory Authority, Pratt Institute Series 2015A, Rev., 5.00%, 7/1/2024 (b) | | |
New York State Dormitory Authority, Sales Tax Series 2017 A, Rev., 5.00%, 3/15/2024 (b) | | |
New York State Dormitory Authority, School Districts Financing Program | | |
Series 2018D, Rev., 5.00%, 4/1/2024 | | |
Series 2017G, Rev., 5.00%, 10/1/2024 | | |
Series 2018A, Rev., 5.00%, 10/1/2024 | | |
Series C, Rev., 5.00%, 10/1/2024 | | |
Series H, Rev., 5.00%, 10/1/2025 | | |
New York State Dormitory Authority, State Personal Income Tax Series 2014C, Rev., 5.00%, 3/15/2024 (b) | | |
New York State Dormitory Authority, State Personal Income Tax, General Purpose | | |
Series 2014C, Rev., 5.00%, 3/15/2024 (b) | | |
Series 2015 E, Rev., 5.00%, 3/15/2024 (b) | | |
New York State Dormitory Authority, State Sales Tax | | |
Series A, Rev., 4.00%, 3/15/2024 (b) | | |
Series 2016A, Rev., 5.00%, 3/15/2024 (b) | | |
Series 2018E, Rev., 5.00%, 3/15/2024 (b) | | |
Series A, Rev., 5.00%, 3/15/2024 (b) | | |
Series 2015A, Rev., 5.00%, 3/15/2025 (b) | | |
New York State Dormitory Authority, State University Education Facility Series 2005 A, Rev., NATL - RE, 5.50%, 5/15/2024 | | |
New York State Environmental Facilities Corp., State Revolving Funds, Master Financing Program Series 2012E, Rev., 5.00%, 5/15/2024 | | |
SEE NOTES TO FINANCIAL STATEMENTS.
| J.P. Morgan Exchange-Traded Funds | |
| | |
Municipal Bonds — continued |
|
New York State Housing Finance Agency, Historic Front Street Series 2003A, Rev., VRDO, LOC : Landesbank Hessen-Thuringen Girozentrale, 3.37%, 3/11/2024 (c) | | |
New York State Thruway Authority | | |
Series J, Rev., 5.00%, 5/14/2024 | | |
Series K, Rev., 5.00%, 1/1/2028 | | |
New York State Urban Development Corp., State Personal Income Tax | | |
Series 2017C, Rev., 5.00%, 3/15/2024 | | |
Series 2020 C, Rev., 5.00%, 3/15/2024 | | |
Series 2016A, Rev., 5.00%, 3/15/2025 (b) | | |
New York State Urban Development Corp., State Personal Income Tax, General Purpose | | |
Series 2014A, Rev., 5.00%, 3/15/2024 (b) | | |
Series 2014A-B, Rev., 5.00%, 3/15/2024 (b) | | |
Series A-2, Rev., NATL - RE, 5.50%, 3/15/2024 | | |
Onondaga Central School District GO, BAN, 4.50%, 6/28/2024 | | |
Oriskany Central School District Series B, GO, BAN, 4.50%, 7/5/2024 | | |
Otego-Unadilla Central School District, New York General Obligation Anticipation GO, BAN, 4.50%, 7/18/2024 | | |
Owego Apalachin Central School District GO, BAN, 4.50%, 7/5/2024 | | |
Pleasantville Union Free School District Series 2016, GO, 5.00%, 5/1/2024 | | |
Port Authority of New York and New Jersey, Consolidated | | |
Series 189, Rev., 5.00%, 5/1/2025 | | |
Series 175, Rev., 5.00%, 12/1/2025 | | |
Series 183, Rev., 5.00%, 12/15/2025 | | |
Series 175, Rev., 4.00%, 12/1/2026 | | |
Sales Tax Asset Receivable Corp., Fiscal Year 2015 Series 2015A, Rev., 5.00%, 10/15/2024 (b) | | |
Saranac Lake Central School District GO, BAN, 4.50%, 6/21/2024 | | |
Schenectady City School District GO, BAN, 4.50%, 7/19/2024 | | |
| | |
|
|
Shenendehowa Central School District GO, BAN, 4.50%, 6/28/2024 | | |
South Country Central School District at Brookhaven Series 2016, GO, 4.00%, 7/15/2024 | | |
Spencer Van Etten Central School GO, BAN, 4.50%, 6/28/2024 | | |
Syracuse Industrial Development Agency | | |
Series 2018 B, Rev., 5.00%, 5/1/2024 | | |
Series 2019A, Rev., 5.00%, 5/1/2024 | | |
Three Village Central School District Brookhaven and Smithtown | | |
Series 2019, GO, 5.00%, 5/15/2024 | | |
| | |
Town of Brookhaven Series 2016, GO, 4.00%, 3/15/2028 | | |
Town of Dryden Series 2024, GO, BAN, 4.50%, 1/23/2025 | | |
Town of Hempstead Series 2017, GO, AGM, 4.00%, 4/1/2024 | | |
Town of Lancaster Series A, GO, BAN, 4.50%, 7/19/2024 | | |
Town of Monroe GO, BAN, 4.50%, 8/2/2024 | | |
| | |
Series 2023A, GO, BAN, 4.00%, 3/22/2024 | | |
Series 2020 B, GO, 5.00%, 5/1/2024 | | |
Town of Orchard Park GO, BAN, 4.50%, 8/16/2024 | | |
Town of Oyster Bay Series 2023, GO, 5.00%, 3/8/2024 | | |
Town of Riverhead Series 2023B, GO, BAN, 4.50%, 8/15/2024 | | |
Town of Stillwater Series 2023, GO, BAN, 4.50%, 5/31/2024 | | |
Town of Wawarsing GO, BAN, 4.50%, 7/25/2024 | | |
Triborough Bridge and Tunnel Authority, Payroll Mobility Tax | | |
Series 2022A, Rev., BAN, 5.00%, 8/15/2024 | | |
Series 2022B, Rev., BAN, 5.00%, 12/16/2024 | | |
Tully Central School District GO, BAN, 4.50%, 6/27/2024 | | |
Village of Farmingdale Series l, GO, BAN, 4.25%, 1/30/2025 | | |
SEE NOTES TO FINANCIAL STATEMENTS.
| J.P. Morgan Exchange-Traded Funds | |
JPMorgan Ultra-Short Municipal Income ETF
SCHEDULE OF PORTFOLIO INVESTMENTSAS OF February 29, 2024 (continued)
| | |
Municipal Bonds — continued |
|
Village of Lancaster Series 2023, GO, BAN, 4.50%, 5/24/2024 | | |
Village of Skaneateles GO, BAN, 5.00%, 6/14/2024 | | |
Warwick Valley Central School District Series 2023A, GO, BAN, 4.75%, 6/28/2024 | | |
Wayne Central School District GO, BAN, 4.50%, 7/26/2024 | | |
Westchester County Local Development Corp., Purchase Senior Learning Community, Inc. Project Series 2021D, Rev., 2.88%, 4/1/2024 (e) | | |
Westfield Central School District GO, BAN, 5.00%, 6/13/2024 | | |
Windsor Central School District GO, BAN, 4.50%, 7/26/2024 | | |
Yorktown Central School District Series 2019, GO, 5.00%, 3/1/2024 | | |
| | |
|
Charlotte-Mecklenburg Hospital Authority (The), Atrium Health Variable Rate, Health Care Series 2021B, Rev., 5.00%, 12/2/2024 (c) | | |
City of Charlotte, Airport Special Facilities Series A, Rev., 5.00%, 7/1/2024 | | |
City of Charlotte, Convention Facility Project Series 2019A, COP, 5.00%, 6/1/2024 | | |
City of Durham Series 2018, Rev., 5.00%, 4/1/2024 | | |
City of Fayetteville, Public Works Commission | | |
Series 2014, Rev., 5.00%, 3/1/2024 | | |
Series 2016, Rev., 5.00%, 3/1/2024 | | |
City of Greensboro Series 2014, Rev., 5.00%, 4/1/2024 (b) | | |
City of High Point Series 2016, GO, 5.00%, 3/1/2024 | | |
City of Sanford, Utility Systems Series 2019, Rev., 5.00%, 6/1/2024 | | |
County of Buncombe Series A, Rev., 5.00%, 6/1/2024 (b) | | |
County of Durham Series 2014, GO, 5.00%, 4/1/2024 (b) | | |
County of Forsyth Series 2019 A, GO, 5.00%, 3/1/2024 | | |
County of Lee, Community College Series 2017, GO, 5.00%, 4/1/2024 | | |
| | |
|
North Carolina — continued |
County of New Hanover Series 2017, Rev., 5.00%, 10/1/2025 (b) | | |
| | |
Series 2010-C, GO, 5.00%, 3/1/2024 | | |
Series 2016 A, Rev., 5.00%, 12/1/2024 | | |
County of Wake, Hospital System Rev., NATL - RE, 5.13%, 10/1/2026 (b) | | |
County of Wake, Public Improvement Series 2019 A, GO, 5.00%, 3/1/2024 | | |
Greenville Utilities Commission Series 2016, Rev., 5.00%, 4/1/2024 | | |
North Carolina Capital Facilities Finance Agency, Duke University Project Series 2015B, Rev., 5.00%, 10/1/2025 (b) | | |
North Carolina Housing Finance Agency, Homeownership Series 44, Rev., 1.50%, 7/1/2024 | | |
North Carolina Medical Care Commission, Caromont Health Series 2021B, Rev., 5.00%, 2/1/2026 (c) | | |
North Carolina Medical Care Commission, Novant Health Series 2013A, Rev., 5.00%, 11/1/2024 | | |
North Carolina Municipal Power Agency No. 1 | | |
Series A, Rev., 5.00%, 1/1/2026 | | |
Series 2016 A, Rev., 5.00%, 1/1/2028 | | |
Raleigh Durham Airport Authority | | |
Series 2020A, Rev., AMT, 5.00%, 5/1/2025 | | |
Series 2020B, Rev., 5.00%, 5/1/2025 | | |
| | |
| | |
Series 2017 B, Rev., 5.00%, 5/1/2024 | | |
Series 2022A, Rev., 5.00%, 5/1/2025 | | |
State of North Carolina, Limited Obligation Series 2013A, Rev., 2.25%, 5/1/2026 | | |
Town of Cary, Public Improvement | | |
Series 2014, GO, 4.00%, 3/1/2024 (b) | | |
Series 2014, GO, 5.00%, 3/1/2024 | | |
University of North Carolina at Charlotte (The) Series 2014, Rev., 5.00%, 4/1/2024 (b) | | |
University of North Carolina at Greensboro Series 2014, Rev., 4.00%, 4/1/2024 | | |
| | |
SEE NOTES TO FINANCIAL STATEMENTS.
| J.P. Morgan Exchange-Traded Funds | |
| | |
Municipal Bonds — continued |
|
Minot Public School District No. 1 GO, 4.00%, 8/1/2025 | | |
North Dakota Housing Finance Agency, Home Mortgage Finance Program Series 2020B, Rev., 1.05%, 7/1/2026 | | |
University of North Dakota Series 2021A, COP, AGM, 5.00%, 6/1/2024 | | |
West Fargo Public School District No. 6, School Building GO, 4.00%, 8/1/2024 | | |
| | |
|
Akron Bath Copley Joint Township Hospital District, Children's Hospital Medical Center of Akron | | |
Series 2022A, Rev., 5.00%, 11/15/2024 | | |
Series 2022A, Rev., 5.00%, 11/15/2026 | | |
Series 2022A, Rev., 5.00%, 11/15/2027 | | |
American Municipal Power, Inc., AMP Fremont Energy Center Project | | |
Series 2017A, Rev., 5.00%, 2/15/2026 | | |
Series 2017A, Rev., 5.00%, 2/15/2028 | | |
American Municipal Power, Inc., Electric System Improvement, City of Wapakoneta Project Rev., BAN, 4.50%, 6/21/2024 | | |
Athens City School District, Unlimited Tax Series 2023, GO, BAN, 4.75%, 6/3/2024 | | |
Big Walnut Local School District, Unlimited Tax Series 2015, GO, 5.00%, 6/1/2025 (b) | | |
Bowling Green City School District, Ohio Wood County School Facilities General Obligation Unlimited Tax GO, BAN, 4.75%, 6/3/2024 | | |
Central Ohio Solid Waste Authority Series 2016, GO, 5.00%, 12/1/2024 | | |
Cincinnati City School District Series 2014, COP, 5.00%, 12/15/2024 (b) | | |
City of Blue Ash, Town Square Renovation Project GO, BAN, 4.25%, 3/28/2024 | | |
City of Columbus, Unlimited Tax, General Obligation | | |
Series 2017-1, GO, 5.00%, 4/1/2024 | | |
Series 2021 A, GO, 5.00%, 4/1/2024 | | |
City of Columbus, Various Purpose, Unlimited Tax | | |
Series 2018 A, GO, 5.00%, 4/1/2024 | | |
Series 2014A, GO, 4.00%, 2/15/2028 | | |
| | |
|
|
City of Dublin, Various Purpose Series 2018 B, GO, 5.00%, 12/1/2024 | | |
City of Gahanna, Ohio Capital Facilities Series 2023, GO, BAN, 5.13%, 10/24/2024 | | |
City of Hamilton Series 2023, GO, BAN, 4.50%, 12/19/2024 | | |
City of Lebanon Series 2024, GO, BAN, 4.13%, 2/5/2025 | | |
City of Sandusky, Various Purpose Limited Tax GO, BAN, 4.50%, 9/6/2024 | | |
City of Springfield GO, BAN, 4.25%, 4/3/2024 | | |
City of Strongsville Series 2023, GO, BAN, 4.50%, 6/7/2024 | | |
Columbus Metropolitan Library, Ohio Library Facilities, Special Obligation Series 2020, Rev., 4.00%, 12/1/2024 | | |
| | |
Series 2017A, Rev., 5.00%, 8/1/2025 | | |
Series 2017 A, Rev., 5.00%, 8/1/2027 | | |
County of Allen, Hospital Facilities, Bon Secours Mercy Health, Inc. | | |
Series 2017A, Rev., 5.00%, 8/1/2024 | | |
Series 2017 A, Rev., 5.00%, 8/1/2026 | | |
County of Cuyahoga, Ohio Economic Development Series 2020D, Rev., 4.00%, 12/1/2024 | | |
County of Franklin, Hospital Facilities, Nationwide Children's Hospital Project Series 2016C, Rev., 5.00%, 11/1/2024 | | |
County of Hamilton, Hospital Facility Cincinnati Children's Hospital | | |
Series 2014S, Rev., 5.00%, 5/15/2025 | | |
Series 2014S, Rev., 5.00%, 5/15/2026 | | |
Series 2014S, Rev., 5.00%, 5/15/2027 | | |
County of Hamilton, Metropolotan Sewer district of Greater Cincinnati | | |
Series 2014A, Rev., 5.00%, 12/1/2027 | | |
Series 2014A, Rev., 5.00%, 12/1/2028 | | |
County of Hamilton, Sales Tax | | |
Series 2016A, Rev., 5.00%, 12/1/2024 | | |
Series 2016A, Rev., 5.00%, 12/1/2026 | | |
County of Hamilton, Trihealth, Inc. Group Project Series 2020 A, Rev., 5.00%, 8/15/2027 | | |
SEE NOTES TO FINANCIAL STATEMENTS.
| J.P. Morgan Exchange-Traded Funds | |
JPMorgan Ultra-Short Municipal Income ETF
SCHEDULE OF PORTFOLIO INVESTMENTSAS OF February 29, 2024 (continued)
| | |
Municipal Bonds — continued |
|
County of Montgomery, Dayton Children's Hospital Series 2021, Rev., 5.00%, 8/1/2026 | | |
Cuyahoga Metropolitan Housing Authority, Carver Park Phase III Project Rev., FHA, 4.00%, 6/1/2025 (c) | | |
Cuyahoga Metropolitan Housing Authority, Wade Park Apartments Rev., FHA, 4.75%, 12/1/2025 (c) | | |
Dayton Metro Library, Unlimited Tax GO, 4.00%, 12/1/2024 | | |
Dublin City School District GO, BAN, 5.00%, 12/18/2024 | | |
Dublin City School District, School Facilities Construction and Improvement Series 2019C, GO, 4.00%, 12/1/2024 | | |
Franklin County Convention Facilities Authority, Tax Lease | | |
Rev., 5.00%, 12/1/2024 (b) | | |
Series 2014, Rev., 5.00%, 12/1/2024 (b) | | |
Lucas-Plaza Housing Development Corp. Series B, Rev., FHA, Zero Coupon, 6/1/2024 (b) | | |
Miamisburg City School District Series 2016, GO, 5.00%, 12/1/2025 (b) | | |
Ohio Higher Educational Facility Commission, Case Western Reserve University Project Series 2021B, Rev., (SIFMA Municipal Swap Index Yield + 0.23%), 3.53%, 3/7/2024 (d) | | |
Ohio Housing Finance Agency, Marianna Terrace Apartments Series 2022A, Rev., VRDO, 1.30%, 3/1/2024 (c) | | |
Ohio Housing Finance Agency, RAD Post Oak LLC Series 2022, Rev., 3.35%, 7/1/2024 (c) | | |
Ohio Housing Finance Agency, Riverview San Macro LLC Series 2023, Rev., FHA, 5.00%, 8/1/2025 (c) | | |
Ohio Water Development Authority Series 2016B, Rev., 5.00%, 6/1/2024 | | |
Salem City School District Series 2023, GO, BAN, 5.25%, 6/3/2024 | | |
| | |
Series 2017 A, GO, 5.00%, 3/15/2024 | | |
Series 2019A, Rev., 5.00%, 4/1/2024 | | |
Series A, Rev., 5.00%, 4/1/2024 | | |
Series 2018A, Rev., 5.00%, 6/1/2024 | | |
| | |
|
|
Series A, Rev., 5.00%, 6/1/2024 | | |
Series 1A, Rev., 5.00%, 12/15/2024 | | |
Series 2016A, Rev., 5.00%, 2/1/2025 | | |
Series 2021A, Rev., 5.00%, 2/1/2025 | | |
Series 2017B, GO, 5.00%, 9/15/2025 | | |
Series 2016-1, Rev., 5.00%, 12/15/2025 | | |
State of Ohio, Adult Correctional Building Fund Projects Series 2013A, Rev., 5.00%, 10/1/2024 | | |
State of Ohio, Capital Facilities Lease Appropriation Series 2017A, Rev., 5.00%, 12/1/2024 | | |
State of Ohio, Cleveland Clinic Health System | | |
Series 2019F, Rev., VRDO, LIQ : US Bank NA, 3.45%, 3/1/2024 (c) | | |
Series 2019D-2, Rev., VRDO, 3.16%, 3/11/2024 (c) | | |
State of Ohio, Higher Education Series 2014A, GO, 4.00%, 5/1/2024 | | |
State of Ohio, Infrastructure Improvement Series 2017B, GO, 5.00%, 9/1/2025 | | |
State of Ohio, Major New Infrastructure Project Series 2018-1, Rev., 5.00%, 12/15/2024 | | |
State of Ohio, University Hospitals Health System, Inc. | | |
Series 2021B, Rev., VRDO, 3.60%, 3/1/2024 (c) | | |
Series 2014B, Rev., VRDO, 3.60%, 3/11/2024 (c) | | |
Series 2020B, Rev., 5.00%, 1/15/2025 (c) | | |
Series 2016A, Rev., 5.00%, 1/15/2027 | | |
University of Cincinnati Series D, Rev., 5.00%, 6/1/2024 | | |
Wright State University Series 2021A, Rev., 4.00%, 5/1/2024 | | |
| | |
|
Canadian County Educational Facilities Authority, Mustang Public Schools Project Series 2017, Rev., 4.00%, 9/1/2025 | | |
Canadian County Independent School District No. 69 Mustang Series 2023, GO, 4.00%, 6/1/2027 | | |
SEE NOTES TO FINANCIAL STATEMENTS.
| J.P. Morgan Exchange-Traded Funds | |
| | |
Municipal Bonds — continued |
|
Grand River Dam Authority | | |
Series 2016A, Rev., 4.00%, 6/1/2024 | | |
Series 2014A, Rev., 5.00%, 6/1/2025 | | |
Series 2014A, Rev., 5.00%, 6/1/2026 | | |
Series 2016A, Rev., 5.00%, 6/1/2026 | | |
Series 2014A, Rev., 5.00%, 6/1/2028 | | |
Oklahoma Capitol Improvement Authority, Oklahoma Department of Transportation Project Series 2020 A, Rev., 5.00%, 7/1/2025 | | |
Oklahoma County Finance Authority, Educational Facilities, Lease Midwest City-Del City Public Schools Project | | |
| | |
| | |
Oklahoma Development Finance Authority, Health System, Integris Obligated Group | | |
Series 2020C, Rev., VRDO, 3.75%, 3/11/2024 (c) | | |
Series 2015A, Rev., 5.00%, 8/15/2024 | | |
Oklahoma Development Finance Authority, State System Higher Education Master Real Property Series 2014A, Rev., 5.00%, 6/1/2024 | | |
Oklahoma Turnpike Authority, Turnpike System, Second Senior | | |
Series 2017 D, Rev., 5.00%, 1/1/2025 | | |
Series 2020A, Rev., 5.00%, 1/1/2025 | | |
Tulsa County Industrial Authority Educational Facilities Lease, Broken Arrow Public Schools Project Rev., 5.00%, 9/1/2025 | | |
| | |
|
City of Eugene, Electric Utility System Rev., 4.00%, 8/1/2024 | | |
City of Portland Water System, Second Lien Series 2013 A, Rev., 5.00%, 10/1/2025 | | |
City of Tualatin Series 2018, GO, 5.00%, 6/15/2024 | | |
Hospital Facilities Authority of Multnomah County Oregon, Adventist Health System Rev., 5.00%, 3/1/2025 (c) | | |
Metro, Oregon Convention Center Hotel Project Rev., 5.00%, 6/15/2025 | | |
Oregon State Facilities Authority, Providence Health and Services Series 2013A, Rev., 5.00%, 10/1/2024 | | |
| | |
|
|
| | |
Series B, Rev., 5.00%, 4/1/2024 | | |
Series C, Rev., 5.00%, 4/1/2024 | | |
Series C, Rev., 5.00%, 4/1/2025 | | |
State of Oregon, Article XI-Q State Projects Series 2023 A, GO, 5.00%, 5/1/2024 | | |
State of Oregon, Housing and Community Services Department, Single-Family Mortgage Program Series 2020A, Rev., 0.90%, 7/1/2024 | | |
Tri-County Metropolitan Transportation District of Oregon Series 2017A, Rev., 5.00%, 10/1/2025 | | |
| | |
|
Allegheny County Higher Education Building Authority, University Refunding Duquesne University Series 2016, Rev., 5.00%, 3/1/2027 | | |
Allegheny County Hospital Development Authority, Allegheny Health Network Obligated Group Series 2018A, Rev., 5.00%, 4/1/2025 | | |
Allegheny County Hospital Development Authority, Pittsburgh Medical Center | | |
Series 2019A, Rev., 5.00%, 7/15/2024 | | |
Series 2019 A, Rev., 5.00%, 7/15/2025 | | |
Series 2019 A, Rev., 5.00%, 7/15/2026 | | |
Allegheny County Hospital Development Authority, UPMC Health Center Series 1997B, Rev., NATL - RE, 6.00%, 7/1/2024 | | |
Allegheny County Sanitary Authority, Sewer | | |
Series 2015, Rev., 5.00%, 12/1/2024 | | |
| | |
Ambridge Borough Water Authority Series 2019, Rev., 4.00%, 11/15/2024 | | |
Berks County Industrial Development Authority, The Highlands at Wyomissing Series 2018, Rev., 5.00%, 5/15/2025 (b) | | |
Bethel Park School District GO, 5.00%, 8/1/2025 | | |
Borough of Hanover Series 2020B, GO, 4.00%, 10/1/2024 | | |
Carlisle Area School District, Limited Tax GO, 3.00%, 9/1/2024 | | |
SEE NOTES TO FINANCIAL STATEMENTS.
| J.P. Morgan Exchange-Traded Funds | |
JPMorgan Ultra-Short Municipal Income ETF
SCHEDULE OF PORTFOLIO INVESTMENTSAS OF February 29, 2024 (continued)
| | |
Municipal Bonds — continued |
|
Centennial School District Bucks County | | |
Series 2017 B, GO, 5.00%, 12/15/2024 | | |
Series 2017A, GO, 5.00%, 12/15/2024 | | |
Central Dauphin School District Series 2016, GO, 5.00%, 2/1/2026 | | |
Chambersburg Area School District Series A, GO, 5.00%, 3/1/2025 | | |
Cheltenham Township School District Series 2019A, GO, 4.00%, 2/15/2025 | | |
| | |
Series 2017, GO, 5.00%, 8/1/2024 | | |
Series 2017A, GO, 5.00%, 8/1/2024 | | |
Series 2019A, GO, 5.00%, 8/1/2024 | | |
Series 2019 A, GO, 5.00%, 8/1/2025 | | |
Series 2021 A, GO, 5.00%, 5/1/2026 | | |
Series 2017 A, GO, 5.00%, 8/1/2026 | | |
Series 2021A, GO, 5.00%, 5/1/2028 | | |
City of Philadelphia Water And Wastewater Series 2016, Rev., 5.00%, 10/1/2025 | | |
City of Philadelphia, Airport System | | |
Series 2017A, Rev., 5.00%, 7/1/2024 | | |
Series 2020A, Rev., 5.00%, 7/1/2024 | | |
Commonwealth Financing Authority | | |
Series B-1, Rev., 5.00%, 6/1/2024 | | |
Series B-1, Rev., AGM, 5.00%, 6/1/2025 | | |
Series 2019B, Rev., 5.00%, 6/1/2027 | | |
Commonwealth Financing Authority, Tobacco Master Settlement Payment | | |
| | |
| | |
| | |
| | |
| | |
Commonwealth of Pennsylvania | | |
Series 2013, GO, 4.00%, 3/19/2024 | | |
Series 2ND, GO, 4.38%, 3/19/2024 | | |
Series 2ND, GO, 5.00%, 3/19/2024 | | |
Series 2014-1, GO, 5.00%, 6/15/2024 | | |
Series 1ST, GO, 5.00%, 7/1/2024 | | |
Series 2016, GO, 5.00%, 9/15/2024 | | |
Series 1ST, GO, 5.00%, 9/15/2026 | | |
Series 2018A, COP, 5.00%, 7/1/2028 | | |
Council Rock School District Series 2019A, GO, 4.00%, 11/15/2025 | | |
County of Allegheny Series C-75, GO, 5.00%, 11/1/2027 | | |
| | |
|
|
Cumberland County Municipal Authority Series 2015, Rev., 5.00%, 1/1/2025 (b) | | |
Daniel Boone Area School District | | |
Series 2017, GO, 5.00%, 4/1/2024 | | |
Series 2017, GO, 5.00%, 4/1/2024 (b) | | |
Delaware County Authority, Villanova University Rev., 5.00%, 8/1/2024 | | |
Delaware County Industrial Development Authority, United Parcel Service Project Rev., VRDO, 3.00%, 3/1/2024 (c) | | |
Delaware Valley Regional Finance Authority, Local Government Series 2020B, Rev., 5.00%, 11/1/2024 | | |
East Hempfield Township Industrial Development Authority, Student Services, Inc. Student Housing Project At Millerville University Of Pennsylvania Series 2014, Rev., 5.00%, 7/1/2024 (b) | | |
Easton Area School District Series 2020A, GO, 4.00%, 4/1/2025 | | |
Exeter Township School District Series 2020 A, GO, 5.00%, 5/15/2024 | | |
Garnet Valley School District Series 2017, GO, 4.00%, 4/1/2027 | | |
Geisinger Authority, Health System Series 2020B, Rev., 5.00%, 2/15/2027 (c) | | |
General Authority of Southcentral Pennsylvania, Wellspan Health Obligated Group Series 2019E, Rev., VRDO, LIQ : US Bank NA, 2.80%, 3/1/2024 (c) | | |
Hamburg Area School District Series 2020A, GO, 4.00%, 4/1/2024 | | |
Methacton School District GO, 4.00%, 9/15/2025 | | |
Monroeville Finance Authority, University of Pittsburg Medical Center Rev., 5.00%, 2/15/2026 | | |
North Allegheny School District, Unlimited Tax Series 2019A, GO, 4.00%, 5/1/2024 | | |
North Penn School District Series 2019A, GO, 3.00%, 1/15/2025 | | |
North Penn Water Authority Rev., (SIFMA Municipal Swap Index Yield + 0.56%), 3.86%, 3/7/2024 (d) | | |
Pennsylvania Economic Development Financing Authority, Solid Waste Disposal, Republic Services, Inc., Project Series 2010 B, Rev., 3.75%, 4/1/2024 (c) | | |
SEE NOTES TO FINANCIAL STATEMENTS.
| J.P. Morgan Exchange-Traded Funds | |
| | |
Municipal Bonds — continued |
|
Pennsylvania Economic Development Financing Authority, University of Pittsburgh Medical Center | | |
Series 2014A, Rev., 5.00%, 2/1/2025 | | |
Series 2017A, Rev., 5.00%, 11/15/2026 | | |
Pennsylvania Economic Development Financing Authority, UPMC | | |
Series 2016, Rev., 5.00%, 3/15/2024 | | |
| | |
Pennsylvania Economic Development Financing Authority, Waste Management, Inc., Project Series 2013, Rev., AMT, 4.10%, 5/1/2024 (c) | | |
Pennsylvania Higher Educational Facilities Authority | | |
Series AW, Rev., 5.00%, 6/15/2024 (b) | | |
Series AW, Rev., 5.00%, 6/15/2024 | | |
Series AQ, Rev., 5.00%, 6/15/2025 (b) | | |
Series AQ, Rev., 5.00%, 6/15/2025 | | |
Series AT-1, Rev., 5.00%, 6/15/2025 | | |
Pennsylvania Higher Educational Facilities Authority, BRYN MAWR College Rev., 5.00%, 12/1/2024 | | |
Pennsylvania Higher Educational Facilities Authority, University of Pennsylvania Health System | | |
Series 2016 A, Rev., 5.00%, 8/15/2027 | | |
Series 2019, Rev., 5.00%, 8/15/2028 | | |
Pennsylvania Housing Finance Agency, Single Family Mortgage Series 2019-130A, Rev., 1.40%, 4/1/2024 | | |
Pennsylvania Turnpike Commission | | |
Rev., VRDO, LOC : TD Bank NA, 3.30%, 3/11/2024 (c) | | |
Series A-1, Rev., 5.00%, 12/1/2025 | | |
Series B-2, Rev., 5.00%, 6/1/2026 | | |
Series 2016B, Rev., 5.00%, 6/1/2027 | | |
Series 2016A-1, Rev., 5.00%, 12/1/2027 | | |
Series 2016A-3, Rev., 5.00%, 12/1/2027 | | |
Series 2021A, Rev., 5.00%, 12/1/2028 | | |
Series 2014C, Rev., 5.00%, 12/1/2030 | | |
Series 2014, Rev., 5.00%, 12/1/2031 | | |
Series 2014A, Rev., 5.00%, 12/1/2038 | | |
Series 2014C, Rev., 5.00%, 12/1/2039 | | |
| | |
|
|
Pennsylvania Turnpike Commission Oil Franchise Tax Series B, Rev., 5.00%, 12/1/2028 | | |
Pennsylvania Turnpike Commission, Motor License Fund, Enhanced, Subordinate Series 2017, Rev., 5.00%, 12/1/2028 | | |
Perkiomen Valley School District GO, 5.00%, 3/1/2024 | | |
Peters Township School District Washington County GO, 5.00%, 1/15/2026 | | |
Philadelphia Authority for Industrial Development | | |
Series B-2, Rev., VRDO, LOC : TD Bank NA, 3.30%, 3/11/2024 (c) | | |
Series 2019, Rev., 5.00%, 10/1/2026 | | |
Series 2016, Rev., 5.00%, 4/1/2028 | | |
Series 2019, Rev., 5.00%, 10/1/2029 | | |
Philadelphia Gas Works Co. | | |
Series 13, Rev., 5.00%, 8/1/2024 | | |
Series 13TH, Rev., 5.00%, 8/1/2025 | | |
Philadelphia Gas Works Co., 1998 General Ordinance Series 14TH, Rev., 5.00%, 10/1/2026 | | |
School District of Philadelphia (The) | | |
Series F, GO, 5.00%, 9/1/2024 | | |
Series F, GO, 5.00%, 9/1/2025 | | |
Series F, GO, 5.00%, 9/1/2026 | | |
Southeastern Pennsylvania Transportation Authority | | |
| | |
Series 2020, Rev., 5.00%, 6/1/2026 | | |
Series 2020, Rev., 5.00%, 6/1/2028 | | |
Southeastern Pennsylvania Transportation Authority, Capital Grant Receipts Rev., 5.00%, 6/1/2024 | | |
State College Area School District Series 2017, GO, 5.00%, 5/15/2024 | | |
State Public School Building Authority Series 2016 A, Rev., 5.00%, 6/1/2024 | | |
State Public School Building Authority, The School District of the City of Harrisburg Project Series 2016A, Rev., AGM, 4.00%, 12/1/2026 (b) | | |
Township of Hampden Series 2020, GO, 4.00%, 5/15/2024 | | |
Township of Lower Paxton GO, 4.00%, 4/1/2024 | | |
SEE NOTES TO FINANCIAL STATEMENTS.
| J.P. Morgan Exchange-Traded Funds | |
JPMorgan Ultra-Short Municipal Income ETF
SCHEDULE OF PORTFOLIO INVESTMENTSAS OF February 29, 2024 (continued)
| | |
Municipal Bonds — continued |
|
Union County Higher Educational Facilities Financing Authority, Bucknell University Series B, Rev., 5.00%, 4/1/2024 | | |
Upper Dublin School District Series 2017, GO, 5.00%, 11/15/2024 | | |
West Jefferson Hills School District | | |
| | |
Series 2017A, GO, 5.00%, 8/1/2024 | | |
West View Municipal Authority Water Series 2014, Rev., 5.00%, 11/15/2024 (b) | | |
| | |
|
Rhode Island Commerce Corp., Department of Transportation | | |
Series 2016A, Rev., 5.00%, 6/15/2024 | | |
Series 2016 B, Rev., 5.00%, 6/15/2025 | | |
Series 2016 B, Rev., 5.00%, 6/15/2026 | | |
Series 2016B, Rev., 5.00%, 6/15/2027 | | |
Series 2016B, Rev., 5.00%, 6/15/2028 | | |
Rhode Island Health and Educational Building Corp. Series 2016A, Rev., 5.00%, 5/15/2024 | | |
Rhode Island Infrastructure Bank Water Pollution Control Revolving Fund Series 2015A, Rev., 5.00%, 10/1/2024 (b) | | |
State of Rhode Island and Providence Plantations Capital Development Series 2019 E, GO, 5.00%, 1/15/2025 | | |
| | |
|
Aiken County Consolidated School District Series 2018A, GO, SCSDE, 5.00%, 3/1/2024 | | |
Anderson County School District No. 5 Series 2016 B, GO, SCSDE, 5.00%, 3/1/2024 | | |
Beaufort County School District | | |
Series 2015A, GO, SCSDE, 5.00%, 3/1/2024 | | |
Series 2015B, GO, SCSDE, 5.00%, 3/1/2024 | | |
Beaufort-Jasper Water and Sewer Authority Series B, Rev., 5.00%, 3/1/2024 | | |
Charleston Educational Excellence Finance Corp., Installment Purchase, Charleston County School District, South Carolina Project Series 2014, Rev., 5.00%, 12/1/2024 | | |
| | |
|
South Carolina — continued |
City of Hanahan Series 2021, GO, 5.00%, 3/1/2024 | | |
County of Newberry Series 2017, GO, 5.00%, 5/1/2024 (b) | | |
County Square Redevelopment Corp., South Carolina Project Series 2024, Rev., BAN, 5.00%, 2/9/2025 | | |
Dorchester County School District No. 2 Series 2014 A, GO, SCSDE, 4.00%, 3/1/2024 (b) | | |
Horry County School District Series 2016, GO, SCSDE, 5.00%, 3/1/2024 | | |
Lexington County School District No 2 Series 2017 C, GO, SCSDE, 5.00%, 3/1/2024 | | |
Oconee County School District GO, SCSDE, 5.00%, 3/1/2024 | | |
Piedmont Municipal Power Agency | | |
Rev., NATL - RE, 5.38%, 1/1/2025 | | |
Series 2015A, Rev., 5.00%, 1/1/2026 | | |
SCAGO Educational Facilities Corp. for Pickens School District Rev., 5.00%, 12/1/2027 | | |
South Carolina Jobs-Economic Development Authority, Bon Secours Mercy Health, Inc. Series 2020B, Rev., 5.00%, 10/1/2025 (c) | | |
South Carolina Jobs-Economic Development Authority, York Preparatory Academy Project Series 2014A, Rev., 7.25%, 11/1/2024 (b) (e) | | |
South Carolina Public Service Authority | | |
Series 2014C, Rev., 5.00%, 12/1/2024 | | |
Series 2022A, Rev., 5.00%, 12/1/2026 | | |
South Carolina Public Service Authority, Santee Cooper Series A, Rev., 5.00%, 12/1/2026 | | |
South Carolina Transportation Infrastructure Bank Series 2015A, Rev., 5.00%, 10/1/2024 | | |
Spartanburg County School District No. 5 Series 2015B, GO, SCSDE, 5.00%, 3/1/2024 | | |
State of South Carolina Series 2016A, GO, 5.00%, 4/1/2024 | | |
SEE NOTES TO FINANCIAL STATEMENTS.
| J.P. Morgan Exchange-Traded Funds | |
| | |
Municipal Bonds — continued |
South Carolina — continued |
University of South Carolina, Higher Education Facilities Rev., 5.00%, 5/1/2025 | | |
York County School District No. 1 Series 2016, GO, SCSDE, 5.00%, 3/1/2024 | | |
| | |
|
South Dakota Board of Regents Housing and Auxiliary Facilities System Series 2015, Rev., 5.00%, 4/1/2024 | | |
South Dakota State Building Authority | | |
Series 2019A, Rev., 4.00%, 6/1/2024 | | |
Series 2018 A, Rev., 5.00%, 6/1/2024 | | |
Series E, Rev., 5.00%, 6/1/2024 | | |
Series D, Rev., 5.00%, 9/1/2024 | | |
| | |
|
City of Chattanooga GO, 3.13%, 10/1/2025 | | |
City of Johnson City Series 2019, GO, 5.00%, 6/1/2024 | | |
City of Knoxville, Wastewater System Series 2020A, Rev., 5.00%, 4/1/2024 | | |
| | |
Series 2014B, GO, 4.13%, 4/1/2024 (b) | | |
Series 2014B, GO, 5.00%, 4/1/2024 | | |
Series 2014B, GO, 5.00%, 4/1/2024 (b) | | |
Series 2015C, GO, 5.00%, 4/1/2024 (b) | | |
County of Maury GO, 5.00%, 4/1/2024 | | |
County of Shelby Series 2012A, GO, 5.00%, 3/1/2024 | | |
| | |
Series 2015, GO, 5.00%, 4/1/2024 | | |
Series 2016, GO, 5.00%, 4/1/2024 | | |
| | |
Harpeth Valley Utilities District of Davidson and Williamson Counties Series 2015, Rev., 5.00%, 9/1/2024 | | |
Johnson City Health and Educational Facilities Board, Ballad Health Series 2023A, Rev., 5.00%, 7/1/2025 | | |
Knox County Health Educational and Housing Facility Board, Covenant Health Series 2012A, Rev., 5.00%, 1/1/2026 | | |
Memphis-Shelby County Industrial Development Board | | |
Series 2017B, Rev., 5.00%, 11/1/2025 | | |
| | |
|
|
Series 2017B, Rev., 5.00%, 11/1/2026 | | |
State of Tennessee Series A, GO, 5.00%, 8/1/2025 (b) | | |
Tennessee Energy Acquisition Corp., Commodity Project | | |
Series 2021A, Rev., 5.00%, 11/1/2025 | | |
Series 2021A, Rev., 5.00%, 11/1/2026 | | |
Tennessee State School Bond Authority, Higher Educational Facilities Second Program | | |
Series 2014B, Rev., 5.00%, 11/1/2024 (b) | | |
Series B, Rev., 5.00%, 11/1/2024 | | |
Series 2015B, Rev., 5.00%, 11/1/2025 (b) | | |
Town of Smyrna GO, 5.00%, 4/1/2024 | | |
| | |
|
Arlington Higher Education Finance Corp., Lifeschool of Dallas Series 2014A, Rev., PSF-GTD, 5.00%, 8/15/2024 (b) | | |
Austin Independent School District, Unlimited Tax Series A, GO, PSF-GTD, 4.00%, 8/1/2025 (b) | | |
Bay City Independent School District, Unlimited Tax GO, PSF-GTD, 5.00%, 2/15/2025 | | |
Bexar County Hospital District, Limited Tax GO, 5.00%, 2/15/2025 | | |
Brazosport Water Authority Series 2015C, Rev., 5.00%, 9/1/2024 | | |
Camino Real Regional Mobility Authority, Senior Lien Series 2014, Rev., 5.00%, 6/1/2024 | | |
Central Texas Regional Mobility Authority, Senior Lien Series A, Rev., 5.00%, 7/1/2025 (b) | | |
Central Texas Regional Mobility Authority, Subordinate Lien | | |
Series 2020F, Rev., BAN, 5.00%, 1/1/2025 | | |
Series 2021C, Rev., BAN, 5.00%, 1/1/2027 | | |
Central Texas Turnpike System Series C, Rev., 5.00%, 8/15/2025 | | |
City of Austin, Airport System Series 2017A, Rev., 5.00%, 11/15/2027 | | |
SEE NOTES TO FINANCIAL STATEMENTS.
| J.P. Morgan Exchange-Traded Funds | |
JPMorgan Ultra-Short Municipal Income ETF
SCHEDULE OF PORTFOLIO INVESTMENTSAS OF February 29, 2024 (continued)
| | |
Municipal Bonds — continued |
|
City of Austin, Electric Utility System Series 2019B, Rev., 5.00%, 11/15/2024 | | |
City of Austin, Water and Wastewater System Series 2014, Rev., 5.00%, 11/15/2028 | | |
City of Beaumont Series 2015, GO, 5.00%, 3/1/2024 | | |
City of Brownsville, Utilities System | | |
Series 2013A, Rev., 5.00%, 9/1/2024 | | |
Rev., AGM, 5.00%, 9/1/2025 | | |
Series 2013A, Rev., 5.00%, 9/1/2025 | | |
City of Buda GO, 5.00%, 8/15/2024 | | |
City of Cedar Hill, Refunding and Improvement GO, 5.00%, 2/15/2025 | | |
| | |
Series 2018B, GO, 5.00%, 11/15/2024 | | |
Series 2019A, GO, 5.00%, 3/1/2025 | | |
City of Copperas Cove GO, 4.00%, 8/15/2025 | | |
| | |
Series 2013A, GO, 5.00%, 2/15/2025 | | |
Series 2014, GO, 5.00%, 2/15/2026 | | |
Series 2014, GO, 5.00%, 2/15/2027 | | |
Series 2014, GO, 5.00%, 2/15/2028 | | |
City of Deer Park GO, 3.00%, 3/15/2024 | | |
City of Denton, Utility System Series 2017, Rev., 5.00%, 12/1/2027 | | |
City of El Paso Water and Sewer | | |
Series 2014, Rev., 5.00%, 3/1/2024 (b) | | |
Series 2015, Rev., 5.00%, 3/1/2024 | | |
City of Farmers Branch GO, 4.00%, 2/15/2025 | | |
City of Fort Worth, Texas Combination Tax Series 2023, GO, 5.00%, 3/1/2024 | | |
City of Friendswood, Waterworks and Sewer System Series 2018, Rev., 5.00%, 3/1/2024 | | |
City of Frisco, Collin and Denton Counties GO, 5.00%, 2/15/2025 | | |
City of Garland, Electric Utility System Series 2016B, Rev., 5.00%, 3/1/2025 | | |
City of Garland, Water and Sewer System Series 2019 A, Rev., 5.00%, 3/1/2024 | | |
City of Georgetown Series 2018, GO, 5.00%, 8/15/2024 | | |
City of Granbury Series 2016A, GO, 4.00%, 8/15/2025 | | |
| | |
|
|
City of Heath, Combination Tax and Surplus GO, 5.00%, 2/15/2025 | | |
City of Houston, Airport System, Subordinate Lien | | |
Series 2018D, Rev., 5.00%, 7/1/2026 | | |
Series 2020B, Rev., 5.00%, 7/1/2026 | | |
Series 2020B, Rev., 5.00%, 7/1/2027 | | |
Series 2023B, Rev., AGM, 5.00%, 7/1/2028 | | |
City of Houston, Combined Utility System, First Lien | | |
Series 2014 C, Rev., 5.00%, 5/15/2024 | | |
Series 2017 B, Rev., 5.00%, 11/15/2025 | | |
Series 2014 C, Rev., 5.00%, 5/15/2026 | | |
City of Houston, Combined Utility System, Junior Lien Series A, Rev., AGM, Zero Coupon, 12/1/2024 | | |
City of Houston, Public Improvement | | |
Series 2014A, GO, 4.00%, 3/1/2024 (b) | | |
Series 2014A, GO, 5.00%, 3/1/2024 (b) | | |
Series 2016A, GO, 5.00%, 3/1/2024 | | |
Series 2021 A, GO, 5.00%, 3/1/2024 | | |
Series 2021A, GO, 5.00%, 3/1/2026 | | |
City of Kenedy, Combination Tax GO, 4.00%, 5/1/2025 | | |
City of Laredo, Combination Tax GO, 5.00%, 2/15/2025 | | |
City of Lubbock GO, 5.00%, 2/15/2027 | | |
City of Lubbock, Electric Light and Power System | | |
| | |
Series 2018, Rev., 5.00%, 4/15/2024 | | |
Series 2021, Rev., 5.00%, 4/15/2028 | | |
City of McKinney GO, 5.00%, 8/15/2025 | | |
City of McKinney, Waterworks and Sewer System Series 2016, Rev., 5.00%, 3/15/2024 | | |
City of Midland Series 2018A, GO, 5.00%, 3/1/2025 | | |
City of Midland, Certificates of Obligation GO, 5.00%, 3/1/2025 | | |
City of Midlothian, Combination Tax, Navarro College District GO, 3.00%, 8/15/2024 | | |
City of Missouri City GO, 5.00%, 6/15/2024 | | |
SEE NOTES TO FINANCIAL STATEMENTS.
| J.P. Morgan Exchange-Traded Funds | |
| | |
Municipal Bonds — continued |
|
City of Missouri City, Combination Tax, Certificates of Obligation | | |
Series 2018A, GO, 5.00%, 6/15/2024 | | |
Series 2018B, GO, 4.00%, 6/15/2025 | | |
City of Mont Belvieu Series 2017A, GO, 5.00%, 8/15/2024 | | |
City of New Braunfels Series 2016, Rev., 5.00%, 7/1/2024 | | |
City of New Braunfels, Combination Tax GO, 5.00%, 2/1/2025 | | |
City of Odessa Series 2015, GO, 5.00%, 3/1/2024 | | |
City of Pearland, Permanent Improvement | | |
| | |
Series 2016B, GO, 5.00%, 3/1/2024 | | |
City of Plano Series 2022, GO, 4.00%, 9/1/2024 | | |
City of Port Aransas Series 2024, GO, 5.00%, 3/1/2024 | | |
City of Port Aransas, Combination Tax, Certificates of Obligation GO, 4.00%, 2/1/2025 | | |
City of Rockwall, General Obligation Series 2013, GO, 5.00%, 8/1/2024 | | |
City of Round Rock Series 2017, GO, 5.00%, 8/15/2024 | | |
City of Sachse, Combination Tax and Limited Surplus Series 2017A, GO, 4.00%, 2/15/2025 | | |
City of San Antonio, Drainage Utility System Rev., 5.00%, 2/1/2027 | | |
City of San Antonio, Electric and Gas Systems Series 2012, Rev., 5.25%, 2/1/2025 | | |
City of San Marcos, Combination Tax GO, 5.00%, 8/15/2024 | | |
City of Sherman, Combination Tax GO, 5.00%, 8/15/2024 | | |
City of Socorro GO, 5.00%, 3/1/2024 (b) | | |
City of Victoria Series 2017, GO, 5.00%, 8/15/2024 | | |
City of Waco GO, 5.00%, 2/1/2026 | | |
City of Waco, Combination Tax GO, 5.00%, 2/1/2025 | | |
| | |
Series 2016 B, GO, 5.00%, 8/1/2024 | | |
Series 2016A, GO, 5.00%, 8/1/2024 | | |
| | |
|
|
City of Waxahachie, Combination Tax GO, 4.00%, 8/1/2024 | | |
City of Weatherford GO, 4.00%, 3/1/2025 | | |
City of Weslaco Series 2016, GO, 5.00%, 2/15/2025 | | |
Collin County Community College District Series 2018, GO, 5.00%, 8/15/2025 | | |
Columbia-Brazoria Independent School District, Unlimited Tax GO, PSF-GTD, 3.00%, 2/1/2025 | | |
Comal Independent School District, Unlimited Tax | | |
GO, PSF-GTD, 5.00%, 2/1/2025 | | |
Series B, GO, PSF-GTD, 5.00%, 2/1/2025 | | |
County of Bexar, Combination Tax Series 2014, GO, 5.00%, 6/15/2024 (b) | | |
County of Bexar, Flood Control Tax GO, 5.00%, 6/15/2024 | | |
County of Bexar, Limited Tax Series 2016, GO, 4.00%, 6/15/2025 (b) | | |
County of Brazoria, Limited Tax Series 2021, GO, 5.00%, 3/1/2024 | | |
County of Comal, Limited Tax GO, 4.00%, 2/1/2025 | | |
| | |
Series 2014, GO, 5.00%, 7/15/2024 | | |
Series 2019, GO, 5.00%, 7/15/2024 | | |
| | |
Series 2014, GO, 4.50%, 3/1/2024 | | |
Series B, GO, 5.00%, 3/1/2025 | | |
County of Galveston, Limited Tax GO, 5.00%, 2/1/2025 | | |
County of Harris Series 2022A, GO, 5.00%, 10/1/2024 | | |
County of Harris, Senior Lien | | |
Series 2016 A, Rev., 5.00%, 8/15/2024 | | |
Series 2015 B, Rev., 5.00%, 8/15/2026 | | |
Series 2015 B, Rev., 5.00%, 8/15/2027 | | |
Series 2016 A, Rev., 5.00%, 8/15/2027 | | |
County of Harris, Unlimited Tax Series 2022A, GO, 5.00%, 10/1/2024 | | |
County of Hays, Limited Tax GO, 5.00%, 2/15/2025 | | |
County of La Salle Series 2018 A, GO, AGM, 5.00%, 3/1/2024 | | |
County of Montgomery Series 2014A, GO, 5.00%, 3/1/2027 | | |
SEE NOTES TO FINANCIAL STATEMENTS.
| J.P. Morgan Exchange-Traded Funds | |
JPMorgan Ultra-Short Municipal Income ETF
SCHEDULE OF PORTFOLIO INVESTMENTSAS OF February 29, 2024 (continued)
| | |
Municipal Bonds — continued |
|
County of Nueces, Combination Tax | | |
| | |
| | |
County of Taylor, Limited Tax GO, 5.00%, 2/15/2025 | | |
County of Tom Green, Combination Tax and Limited Surplus GO, 5.00%, 2/1/2025 | | |
County of Travis Series A, GO, 5.00%, 3/1/2024 | | |
County of Williamson, Unlimited Tax Series 2014, GO, 5.00%, 2/15/2025 | | |
Dallas Area Rapid Transit, Sales Tax, Senior Lien | | |
| | |
Series 2014A, Rev., 5.00%, 12/1/2024 | | |
Series 2014A, Rev., 5.00%, 12/1/2024 (b) | | |
Dallas County Park Cities Municipal Utility District Rev., 4.00%, 8/1/2025 | | |
Dallas County Utility and Reclamation District, Unlimited Tax | | |
Series 2016, GO, 5.00%, 2/15/2025 | | |
Series 2016, GO, 5.00%, 2/15/2028 | | |
Dallas Fort Worth International Airport | | |
Series 2021B, Rev., 5.00%, 11/1/2024 | | |
Series 2020B, Rev., 5.00%, 11/1/2025 | | |
Series 2020 A, Rev., 5.00%, 11/1/2026 | | |
Series 2023B, Rev., 5.00%, 11/1/2026 | | |
Series 2023B, Rev., 5.00%, 11/1/2027 | | |
Series 2023B, Rev., 5.00%, 11/1/2028 | | |
Dallas Independent School District, Unlimited Tax | | |
Series 2014A, GO, PSF-GTD, 5.00%, 8/15/2024 (b) | | |
Series 2016A, GO, PSF-GTD, 4.00%, 2/15/2025 (b) | | |
GO, PSF-GTD, 5.00%, 2/15/2025 | | |
Denton County Housing Finance Corp., THF Pathway on Woodrow LP Series 2022, Rev., 5.00%, 2/1/2025 (c) | | |
DeSoto Independent School District Series 2013, GO, PSF-GTD, Zero Coupon, 8/15/2025 | | |
El Paso Housing Finance Corp., Columbia Housing Partners LP Rev., 4.50%, 3/1/2025 (c) | | |
| | |
|
|
El Paso Independent School District Series 2015A, GO, PSF-GTD, 5.00%, 8/15/2025 (b) | | |
Floresville Independent School District, Unlimited Tax GO, PSF-GTD, 3.00%, 2/1/2025 | | |
Fort Bend Grand Parkway Toll Road Authority Series 2021 A, Rev., GTD, 5.00%, 3/1/2024 | | |
Frisco Independent School District Series 2016A, GO, PSF-GTD, 5.00%, 8/15/2025 | | |
Galveston Public Facility Corp., The Oleanders at Broadway Rev., 0.47%, 8/1/2024 (c) | | |
Garland Independent School District, Unlimited Tax, School Building | | |
Series 2016, GO, PSF-GTD, 5.00%, 2/15/2025 | | |
Series A, GO, PSF-GTD, 5.00%, 2/15/2025 | | |
Hallsville Independent School District Series 2020, GO, PSF-GTD, 5.00%, 2/15/2025 | | |
Harris County Cultural Education Facilities Finance Corp., Memorial Hermann Health System | | |
Series 2019C-2, Rev., (SIFMA Municipal Swap Index Yield + 0.57%), 3.87%, 3/7/2024 (d) | | |
Series 2014A, Rev., 5.00%, 12/1/2024 | | |
Series 2019A, Rev., 5.00%, 12/1/2024 | | |
Series 2020C-2, Rev., 5.00%, 12/1/2024 (c) | | |
Series 2014A, Rev., 5.00%, 12/1/2025 | | |
Series 2014A, Rev., 5.00%, 12/1/2027 | | |
Harris County Health Facilities Development Corp., Sisters of Charity of the Incarnate Word Series 1997B, Rev., 5.75%, 7/1/2027 (b) | | |
Housing Options, Inc., Brooks Manor - The Oaks Project Rev., 0.50%, 3/1/2025 (c) | | |
Houston Community College System Series 2019, Rev., 5.00%, 4/15/2024 | | |
Houston Housing Finance Corp. Multi Family Housing Sunset Garden Apartments Series 2022, Rev., FHA, 4.00%, 10/1/2024 (c) | | |
Houston Independent School District, Limited Tax Series 2014B, GO, PSF-GTD, 4.00%, 2/15/2027 | | |
SEE NOTES TO FINANCIAL STATEMENTS.
| J.P. Morgan Exchange-Traded Funds | |
| | |
Municipal Bonds — continued |
|
Houston Independent School District, Limited Tax Schoolhouse GO, PSF-GTD, 5.00%, 2/15/2025 | | |
Humble Independent School District, Unlimited Tax School Building Series 2020A, GO, PSF-GTD, 5.00%, 2/15/2025 | | |
Joshua Independent School District Series 2015, GO, PSF-GTD, 5.00%, 8/15/2024 (b) | | |
Keller Independent School District, Unlimited Tax Series 2015, GO, PSF-GTD, 5.00%, 2/15/2025 (b) | | |
Klein Independent School District, Unlimited Tax | | |
Series 2015A, GO, PSF-GTD, 5.00%, 8/1/2024 | | |
GO, PSF-GTD, 5.00%, 2/1/2025 | | |
Leander Independent School District, Unlimited Tax | | |
Series 2014 C, GO, PSF-GTD, Zero Coupon, 8/15/2024 (b) | | |
Series 2014D, GO, PSF-GTD, Zero Coupon, 8/15/2024 (b) | | |
Lewisville Independent School District, Unlimited Tax | | |
Series 2023, GO, PSF-GTD, 5.00%, 8/15/2024 | | |
Series 2023, GO, PSF-GTD, 5.00%, 8/15/2026 | | |
Series 2016 A, GO, PSF-GTD, 4.00%, 8/15/2027 | | |
Lower Colorado River Authority, LCRA Transmission Services Corp. Project | | |
Series 2016, Rev., 5.00%, 5/15/2024 | | |
Series 2018, Rev., 5.00%, 5/15/2024 | | |
Series 2019, Rev., 5.00%, 5/15/2024 | | |
Series 2022, Rev., 5.00%, 5/15/2024 | | |
Series 2022A, Rev., 5.00%, 5/15/2024 | | |
| | |
| | |
Series 2019A, Rev., 5.00%, 5/15/2026 | | |
Series 2018, Rev., 5.00%, 5/15/2027 | | |
Series 2019, Rev., 5.00%, 5/15/2028 | | |
Series 2023, Rev., AGM, 5.00%, 5/15/2028 | | |
Metropolitan Transit Authority of Harris County, Sales and Use Tax | | |
Series 2017B, Rev., 5.00%, 11/1/2025 | | |
| | |
|
|
Series 2018, Rev., 5.00%, 11/1/2026 | | |
Mission Economic Development Corp., Republic Services, Inc., Project Series 2012, Rev., AMT, 4.10%, 5/1/2024 (c) | | |
New Hope Cultural Education Facilities Finance Corp., Collegiate Housing Galveston LLC Series A, Rev., 5.00%, 4/1/2024 (b) | | |
New Hope Cultural Education Facilities Finance Corp., Collegiate Housing Stephenville LLC Tarleton State University Project Series A, Rev., 5.00%, 4/1/2024 (b) | | |
New Hope Cultural Education Facilities Finance Corp., Student Housing CHF Collegiate Housing Stephenville Tarleton State University Project Series A, Rev., 5.00%, 4/1/2025 (b) | | |
New Hope Cultural Education Facilities Finance Corp., Student Housing Texas A&M University Series 2017A, Rev., 5.00%, 4/1/2025 (b) | | |
North Harris County Regional Water Authority, Senior Lien Rev., 4.00%, 12/15/2024 | | |
North Texas Municipal Water District Water System | | |
Series 2015, Rev., 5.00%, 6/1/2024 | | |
Series 2019A, Rev., 3.00%, 9/1/2024 | | |
| | |
Series 2014, Rev., 5.00%, 9/1/2024 | | |
Series 2015, Rev., 5.00%, 9/1/2027 | | |
North Texas Tollway Authority, First Tier | | |
Series 2016A, Rev., 5.00%, 1/1/2025 | | |
Series A, Rev., 5.00%, 1/1/2025 | | |
Series 2020A, Rev., 5.00%, 1/1/2026 | | |
Series A, Rev., 5.00%, 1/1/2028 | | |
North Texas Tollway Authority, Second Tier | | |
Series B, Rev., 5.00%, 1/1/2025 | | |
Series B, Rev., 5.00%, 1/1/2026 | | |
Series 2019 B, Rev., 5.00%, 1/1/2027 | | |
Series B, Rev., 5.00%, 1/1/2027 | | |
Series 2019 B, Rev., 5.00%, 1/1/2028 | | |
Northwest Independent School District, Unlimited Tax Series 2016A, GO, PSF-GTD, 5.00%, 2/15/2026 (b) | | |
Pasadena Independent School District Series 2023B, GO, 5.00%, 2/15/2027 | | |
SEE NOTES TO FINANCIAL STATEMENTS.
| J.P. Morgan Exchange-Traded Funds | |
JPMorgan Ultra-Short Municipal Income ETF
SCHEDULE OF PORTFOLIO INVESTMENTSAS OF February 29, 2024 (continued)
| | |
Municipal Bonds — continued |
|
Permanent University Fund - University of Texas System | | |
Series 2008A, Rev., VRDO, LIQ : University of Texas Investment Management Co. (The), 3.33%, 3/11/2024 (c) | | |
Series 2014 B, Rev., 5.00%, 7/1/2024 | | |
Red River Education Finance Corp., Christian University Project Series 2016A, Rev., 5.00%, 3/15/2025 | | |
Richardson Independent School District, Unlimited Tax Series 2015B, GO, 5.00%, 2/15/2025 | | |
Robstown Independent School District Series 2016, GO, PSF-GTD, 4.00%, 2/15/2026 | | |
Rockwall Independent School District, Unlimited Tax GO, PSF-GTD, Zero Coupon, 2/15/2025 | | |
Round Rock Independent School District | | |
Series 2019 A, GO, PSF-GTD, 5.00%, 8/1/2025 | | |
Series 2016, GO, PSF-GTD, 5.00%, 8/1/2027 | | |
San Antonio Housing Trust Finance Corp. Series 2010, Rev., FHLMC COLL, LIQ : FHLMC, 3.50%, 10/1/2024 (b) (c) | | |
San Antonio Independent School District GO, PSF-GTD, 5.00%, 8/15/2024 | | |
San Antonio Public Facilities Corp., Convention Center Facility Project | | |
Series 2022, Rev., 5.00%, 9/15/2024 | | |
Series 2022, Rev., 5.00%, 9/15/2028 | | |
San Antonio Water System, Junior Lien | | |
Series 2016A, Rev., 5.00%, 5/15/2024 | | |
Series 2018A, Rev., 5.00%, 5/15/2024 | | |
San Elizario Independent School District, Unlimited Tax Series 2015, GO, PSF-GTD, 5.00%, 5/1/2025 (b) | | |
San Jacinto Community College District, Limited Tax GO, 5.00%, 2/15/2025 | | |
Southwest Higher Education Authority, Inc., Southern Methodist University Project Series 2016A, Rev., 5.00%, 10/1/2024 | | |
Spring Independent School District Series 2017 A, GO, 5.00%, 8/15/2028 | | |
| | |
Series 2014, GO, 4.00%, 4/1/2024 (b) | | |
Series 2014, GO, 5.00%, 4/1/2024 (b) | | |
| | |
|
|
State of Texas, Transportation Commission Highway improvement General Obligation Series 2014, GO, 5.00%, 4/1/2024 | | |
State of Texas, Transportation Commission Mobility Fund | | |
| | |
Series 2014, GO, 5.00%, 4/1/2024 (b) | | |
| | |
| | |
Series 2015A, GO, VRDO, LIQ : State Street Bank & Trust Co., 3.40%, 3/7/2024 (c) | | |
Series 2013A, GO, VRDO, LIQ : State Street Bank & Trust Co., 3.50%, 3/11/2024 (c) | | |
Tarrant Regional Water District Water Supply System | | |
Series 2014, Rev., 5.00%, 3/1/2024 (b) | | |
Series 2015, Rev., 5.00%, 3/1/2024 | | |
Texas A&M University Series 2022, Rev., 5.00%, 5/15/2024 | | |
Texas A&M University, Financing System Series 2017C, Rev., 5.00%, 5/15/2028 | | |
Texas Department of Housing and Community Affairs, Fishpond at Corpus Christi Apartments Series 2020, Rev., VRDO, 4.00%, 3/1/2024 (c) | | |
Texas Department of Housing and Community Affairs, North Grand Villas Series 2023, Rev., FHA, 5.00%, 8/1/2025 (c) | | |
Texas Department of Housing and Community Affairs, Socorro Village | | |
Series 2022, Rev., 4.00%, 8/1/2024 (c) | | |
Series 2023, Rev., 4.75%, 8/1/2024 (c) | | |
Texas Home Collaborative, 1518 Apartments Series 2023, Rev., 5.00%, 10/1/2026 (c) | | |
Texas Public Finance Authority Rev., 5.00%, 2/1/2025 | | |
Texas State Technical College Series 2022 A, Rev., AGM, 5.00%, 8/1/2028 | | |
Texas State University System | | |
Series 2019A, Rev., 5.00%, 3/15/2024 | | |
Series 2017A, Rev., 5.00%, 3/15/2025 | | |
Series 2019A, Rev., 5.00%, 3/15/2025 | | |
Texas Transportation Commission State Highway Fund, First Tier | | |
SEE NOTES TO FINANCIAL STATEMENTS.
| J.P. Morgan Exchange-Traded Funds | |
| | |
Municipal Bonds — continued |
|
Series 2014-A, Rev., 5.00%, 4/1/2024 (b) | | |
Series 2014-A, Rev., 5.00%, 6/14/2024 | | |
Series 2016B, Rev., 0.56%, 4/1/2026 | | |
Texas Water Development Board, State Revolving Fund Series 2020, Rev., 5.00%, 8/1/2025 | | |
Texas Water Development Board, State Water Implementation Fund | | |
Series 2017 A, Rev., 5.00%, 4/15/2024 | | |
Series 2018 A, Rev., 5.00%, 4/15/2024 | | |
Series 2018A, Rev., 5.00%, 10/15/2024 | | |
Tomball Independent School District, Unlimited Tax School Building GO, PSF-GTD, 5.00%, 2/15/2025 | | |
Trinity River Authority, Water Project Rev., 5.00%, 2/1/2025 | | |
Trinity River Public Facility Corp., Cowan Place Apartments Series 2021, Rev., 4.40%, 4/1/2024 (c) | | |
| | |
Series 2017A, Rev., 5.00%, 2/15/2025 | | |
Series 2016A, Rev., 4.00%, 2/15/2027 | | |
University of North Texas System, Financing System Series 2017A, Rev., 5.00%, 4/15/2025 | | |
University of North Texas, Financing System Series 2020A, Rev., 5.00%, 4/15/2025 | | |
Weatherford Independent School District, Unlimited Tax GO, PSF-GTD, Zero Coupon, 2/15/2025 | | |
| | |
|
Alpine School District, Utah School Bond Guaranty Program | | |
Series 2017 B, GO, 5.00%, 3/15/2024 | | |
Series 2019 B, GO, 5.00%, 3/15/2024 | | |
Central Utah Water Conservancy District Series 2021 A, GO, 5.00%, 4/1/2024 | | |
City of American Fork Series 2016, GO, 5.00%, 5/1/2024 | | |
City of Sandy City, Sales Tax Rev., 5.00%, 3/1/2024 | | |
County of Utah, IHC Health Services, Inc. | | |
Series 2020B-1, Rev., 5.00%, 8/1/2024 (c) | | |
| | |
|
|
Series 2020B-2, Rev., 5.00%, 8/1/2026 (c) | | |
State of Utah GO, 5.00%, 7/1/2024 | | |
University of Utah (The) Series 2017A, Rev., 5.00%, 8/1/2024 | | |
Utah Associated Municipal Power Systems, Horse Butte Wind Project Series 2017A, Rev., 5.00%, 9/1/2026 | | |
Utah State Building Ownership Authority, Master Lease Program Series 2012A, Rev., 3.00%, 5/15/2025 | | |
Utah Transit Authority, Sales Tax Series 2015 A, Rev., 5.00%, 6/15/2025 | | |
Utah Water Finance Agency, Loan Financing Program Series 2019 B, Rev., 5.00%, 3/1/2024 | | |
| | |
|
Caroline County Economic Development Authority Series 2021, Rev., 5.00%, 4/1/2024 | | |
City of Alexandria Series 2017 C, GO, 5.00%, 7/1/2025 | | |
City of Chesapeake Series A, Rev., AGM - CR, 4.00%, 7/15/2024 | | |
| | |
Series 2019 A, GO, 5.00%, 3/1/2024 | | |
Series 2015B, GO, 5.00%, 9/1/2024 (b) | | |
City of Norfolk Rev., 5.00%, 11/1/2024 | | |
City of Richmond, Public Improvement Series 2014A, GO, 5.00%, 3/1/2024 (b) | | |
Commonwealth of Virginia Series 2013B, GO, 4.00%, 6/3/2024 | | |
County of Fairfax Series 2012 B, GO, 5.00%, 4/1/2024 | | |
Culpeper County Economic Development Authority, Capital Projects Rev., 5.00%, 6/1/2024 | | |
Fairfax County Industrial Development Authority, Virginia Health Care, Inova Health System Project Series 2018 A, Rev., 5.00%, 5/15/2024 | | |
Fairfax County Water Authority Series 2017, Rev., 5.00%, 4/1/2024 | | |
Loudoun County Economic Development Authority Series 2022A, Rev., 5.00%, 12/1/2024 | | |
SEE NOTES TO FINANCIAL STATEMENTS.
| J.P. Morgan Exchange-Traded Funds | |
JPMorgan Ultra-Short Municipal Income ETF
SCHEDULE OF PORTFOLIO INVESTMENTSAS OF February 29, 2024 (continued)
| | |
Municipal Bonds — continued |
|
Louisa Industrial Development Authority, Electric and Power Co. Project Series 2008B, Rev., 0.75%, 9/2/2025 (c) | | |
Upper Occoquan Sewage Authority Series 2014, Rev., 5.00%, 7/1/2025 (b) | | |
Virginia Beach Development Authority | | |
Series 2020 A, Rev., 5.00%, 4/15/2024 | | |
Series B, Rev., 4.00%, 5/1/2024 | | |
Virginia College Building Authority Educational Facilities, 21St Century College and Equipment Programs Series 2015A, Rev., 5.00%, 2/1/2025 (b) | | |
Virginia Commonwealth Transportation Board Series 2017, Rev., GAN, 5.00%, 3/15/2024 | | |
Virginia Commonwealth Transportation Board, Capital Projects | | |
| | |
Series 2017A, Rev., 5.00%, 5/15/2025 | | |
Virginia Commonwealth Transportation Board, Federal Highway Transportation Rev., GAN, 5.00%, 3/15/2028 | | |
Virginia Commonwealth Transportation Board, Federal Transportation Rev., GAN, 5.00%, 3/15/2025 | | |
Virginia Commonwealth University Health System Authority Series B, Rev., 5.00%, 7/1/2025 | | |
Virginia Housing Development Authority Series 2020B, Rev., 0.99%, 3/1/2024 | | |
Virginia Public Building Authority, Public Facilities Series C, Rev., 4.00%, 8/1/2026 | | |
Virginia Public School Authority, School Financing 1997 Resolution Series 2015A, Rev., 5.00%, 8/1/2024 | | |
Virginia Resources Authority, Infrastructure Moral Obligation Series 2012B, Rev., 4.00%, 11/1/2024 | | |
Wise County Industrial Development Authority, Electric and Power Co. Project Series 2010A, Rev., 1.20%, 5/31/2024 (c) | | |
| | |
|
Auburn School District No. 408 of King and Pierce Counties, Unlimited Tax GO, 5.00%, 12/1/2024 | | |
| | |
|
|
Central Washington University Rev., 4.00%, 5/1/2026 | | |
City of Olympia, Limited Tax GO, 5.00%, 12/1/2024 | | |
City of Redmond, Utility System Series 2014, Rev., 5.00%, 12/1/2024 (b) | | |
City of Seattle, Municipal Light and Power Series 2015A, Rev., 5.00%, 5/1/2024 | | |
City of Seattle, Solid Waste Series 2014, Rev., 5.00%, 5/1/2027 | | |
Clark County School District No. 114 Evergreen Series 2019, GO, 5.00%, 12/1/2025 | | |
County of King, Limited Tax Series 2015A, GO, 5.00%, 1/1/2025 (b) | | |
County of King, Sewer, Junior Lien Series 2020B, Rev., 0.88%, 1/1/2026 (c) | | |
County of Pierce Series A, GO, 5.00%, 8/1/2024 | | |
County of Skagit, Limited Tax GO, 5.00%, 12/1/2024 | | |
Energy Northwest, Columbia Generating Station | | |
Series 2018 A, Rev., 5.00%, 7/1/2024 | | |
Series A, Rev., 5.00%, 7/1/2024 | | |
Energy Northwest, Project 1 | | |
Series 2014-C, Rev., 5.00%, 7/1/2025 | | |
Series 2014C, Rev., 5.00%, 7/1/2026 | | |
Series 2014-C, Rev., 5.00%, 7/1/2027 | | |
Series 2015-A, Rev., 5.00%, 7/1/2027 | | |
Energy Northwest, Project 3 Electric Series 2018C, Rev., 5.00%, 7/1/2025 | | |
Franklin County School District No. 1 Pasco, Unlimited Tax Series 2015, GO, 5.00%, 12/1/2025 | | |
FYI Properties, State of Washington District Project Series 2019, Rev., 5.00%, 6/1/2024 | | |
King and Snohomish Counties School District No. 417 Northshore, Unlimited Tax GO, 5.00%, 12/1/2024 | | |
King County Fire Protection District No. 39, Unlimited Tax Series 2015A, GO, 5.00%, 12/1/2024 | | |
King County Public Hospital District No. 2, Evergreen Healthcare, Limited Tax Series 2015B, GO, 5.00%, 12/1/2024 (b) | | |
SEE NOTES TO FINANCIAL STATEMENTS.
| J.P. Morgan Exchange-Traded Funds | |
| | |
Municipal Bonds — continued |
|
King County School District No. 403 Renton, Unlimited Tax GO, 4.00%, 12/1/2024 | | |
King County School District No. 405 Bellevue, Unlimited Tax GO, 5.00%, 12/1/2024 | | |
King County School District No. 411 Issaquah, Unlimited Tax Series 2022, GO, 5.00%, 12/1/2025 | | |
Port of Seattle, Intermediate Lien | | |
Series 2016, Rev., 5.00%, 2/1/2026 | | |
Series 2022A, Rev., 5.00%, 8/1/2026 | | |
Series 2016, Rev., 5.00%, 2/1/2027 | | |
| | |
Series 2022A, Rev., 5.00%, 8/1/2028 | | |
Public Utility District No. 1 of Lewis County, Cowlitz Falls Hydroelec Project Series 2013, Rev., 5.25%, 10/1/2028 | | |
RBC Municipal Products, Inc. Trust, Floater Certificates Series G-123, Rev., VRDO, LOC : Royal Bank of Canada, 3.50%, 3/7/2024 (c) (e) | | |
Snohomish County School District No. 6 Mukilteo Series 2022, GO, 5.00%, 12/1/2024 | | |
| | |
Series 2019B, COP, 5.00%, 7/1/2024 | | |
Series 2020B, COP, 5.00%, 7/1/2024 | | |
Series R-2022C, GO, 4.00%, 7/1/2027 | | |
State of Washington, State and Local Agency Personal Property Series 2014B, COP, 5.00%, 7/1/2024 | | |
State of Washington, State and Local Agency Real and Personal Property Series 2018C, COP, 5.00%, 7/1/2024 | | |
State of Washington, Various Purpose | | |
Series R-2015E, GO, 5.00%, 7/1/2024 | | |
Series 2018A, GO, 5.00%, 8/1/2024 | | |
Series R-2018C, GO, 5.00%, 8/1/2024 | | |
Series 2021C, COP, 5.00%, 1/1/2025 | | |
University of Washington Series 2020C, Rev., 5.00%, 4/1/2026 | | |
Washington Economic Development Finance Authority, Washington Biomedical Research Properties Series A, Rev., 5.00%, 6/1/2024 | | |
Washington Health Care Facilities Authority | | |
Series 2014A, Rev., 5.00%, 5/15/2024 (b) | | |
| | |
|
|
Series 2012A, Rev., 5.00%, 10/1/2025 | | |
Washington Health Care Facilities Authority, Multicare Health System Series B, Rev., 5.00%, 8/15/2026 | | |
Washington Health Care Facilities Authority, Providence Health and Services | | |
Series 2012A, Rev., 5.00%, 10/1/2024 | | |
Series 2012A, Rev., 5.00%, 10/1/2026 | | |
Washington Health Care Facilities Authority, Seattle Cancer Care Alliance Rev., 5.00%, 3/1/2026 | | |
Washington State Housing Finance Commission Series A, Rev., 7.00%, 7/1/2025 (b) (e) | | |
Washington State Housing Finance Commission, Herons Key Senior Living Series A, Rev., 7.00%, 7/1/2025 (b) (e) | | |
Washington State University Series 2014, Rev., 5.00%, 4/1/2024 (b) | | |
Whitman County School District No. 267 Pullman, Unlimited Tax Series 2016, GO, 5.00%, 12/1/2024 | | |
| | |
|
West Virginia Economic Development Authority, Appalachian Power Co. Series 2015A, Rev., 2.55%, 4/1/2024 (c) | | |
West Virginia Economic Development Authority, Correctional Juvenile and Public Safety Facilities | | |
Series 2012A, Rev., 5.00%, 6/1/2024 | | |
Series 2012A, Rev., 5.00%, 6/1/2025 | | |
West Virginia Economic Development Authority, Solid Waste Disposal Facilities, Appalachian Power Co. Amos Project Series 2010A, Rev., 0.63%, 12/15/2025 (c) | | |
West Virginia Hospital Finance Authority Series 2016A, Rev., 5.00%, 6/1/2025 | | |
| | |
|
Berlin Area School District GO, 4.00%, 3/1/2024 (b) | | |
City of De Pere Series 2013A, GO, 3.38%, 12/1/2026 | | |
City of Madison, Water Utility Rev., BAN, 1.50%, 11/1/2024 | | |
SEE NOTES TO FINANCIAL STATEMENTS.
| J.P. Morgan Exchange-Traded Funds | |
JPMorgan Ultra-Short Municipal Income ETF
SCHEDULE OF PORTFOLIO INVESTMENTSAS OF February 29, 2024 (continued)
| | |
Municipal Bonds — continued |
|
City of Milwaukee, Promissory Notes Series N4, GO, 5.00%, 4/1/2024 | | |
County of Milwaukee, Corporate Purpose Series 2018D, GO, 3.00%, 8/1/2024 | | |
Howard-Suamico School District Series 2021, GO, 5.00%, 3/1/2024 | | |
Onalaska School District GO, 5.00%, 4/1/2024 | | |
Parkview School District GO, 4.00%, 4/1/2024 (b) | | |
Public Finance Authority Lease Development, Ku Campus Development Corp. Project Series 2016, Rev., 5.00%, 3/1/2024 | | |
Public Finance Authority, Rose Villa Project Series 2014A, Rev., 5.75%, 11/15/2024 (b) (e) | | |
| | |
Series 2022A, COP, 4.00%, 3/1/2024 | | |
Series 2023-1, GO, 5.00%, 5/1/2024 | | |
Series 2016-2, GO, 5.00%, 11/1/2024 | | |
Series 2014-4, GO, 5.00%, 5/1/2025 | | |
State of Wisconsin Clean Water Fund Leveraged Loan Portfolio | | |
Series 2015-1, Rev., 5.00%, 6/1/2024 (b) | | |
Series 20161, Rev., 5.00%, 6/1/2024 (b) | | |
Village of Fox Crossing, Corporate Purpose GO, 3.00%, 4/1/2024 | | |
Wauwatosa School District Series 2019B, GO, 5.00%, 9/1/2024 | | |
Western Technical College District Series 2017 E, GO, 5.00%, 4/1/2024 | | |
Wisconsin Health and Educational Facilities Authority, Advocate Aurora Health Credit Series 2018B-4, Rev., 5.00%, 1/29/2025 (c) | | |
Wisconsin Health and Educational Facilities Authority, Advocate Aurora Health Credit Group | | |
Series 2018B-2, Rev., 5.00%, 6/24/2026 (c) | | |
Series 2018C1, Rev., 5.00%, 7/29/2026 (c) | | |
Wisconsin Health and Educational Facilities Authority, Ascension Health Credit Series 2013B-5, Rev., 5.00%, 12/3/2024 (c) | | |
| | |
|
|
Wisconsin Health and Educational Facilities Authority, Ascension Health Credit Group Series 2016 A, Rev., 5.00%, 11/15/2029 | | |
Wisconsin Health and Educational Facilities Authority, Ascension Senior Credit Group | | |
Series 2016A, Rev., 5.00%, 11/15/2024 | | |
Series 2019A, Rev., 5.00%, 11/15/2024 | | |
Series 2016A, Rev., 5.00%, 11/15/2026 | | |
Series 2016A, Rev., 5.00%, 11/15/2028 | | |
Wisconsin Health and Educational Facilities Authority, Mercy Alliance, Inc. Rev., 5.00%, 6/1/2026 | | |
Wisconsin Health and Educational Facilities Authority, Milwaukee Regional Medical Center Thermal Service | | |
Series 2018, Rev., 5.00%, 4/1/2024 | | |
Series 2018, Rev., 5.00%, 4/1/2028 | | |
Wisconsin Health and Educational Facilities Authority, The Monroe Clinic, Inc. | | |
Rev., 3.00%, 8/15/2025 (b) | | |
Rev., 4.00%, 8/15/2025 (b) | | |
Wisconsin Health and Educational Facilities Authority, Unity Point Health | | |
Series 2014A, Rev., 5.00%, 12/1/2024 | | |
Series 2014A, Rev., 5.00%, 12/1/2025 | | |
| | |
Total Municipal Bonds
(Cost $2,443,738,385) | | |
| | |
Short-Term Investments — 7.1% |
Investment Companies — 7.1% |
JPMorgan Institutional Tax Free Money Market Fund Class IM Shares, 3.37% (g) (h)
(Cost $186,997,054) | | |
Total Investments — 99.7%
(Cost $2,630,735,439) | | |
Other Assets Less Liabilities — 0.3% | | |
| | |
Percentages indicated are based on net assets. |
| |
| Insured by Assured Guaranty Municipal Corp. |
SEE NOTES TO FINANCIAL STATEMENTS.
| J.P. Morgan Exchange-Traded Funds | |
| Insured by American Municipal Bond Assurance Corp. |
| |
| |
| |
| Certificate of Participation |
| |
| Federal Housing Administration |
| |
| Federal Home Loan Mortgage Corp. |
| |
| |
| |
| |
| |
| Insured by National Public Finance Guarantee Corp. |
| Permanent School Fund Guaranteed |
| Qualified School Bond Loan Fund |
| Revenue Anticipation Note |
| |
| |
| South Carolina School District Enhancement |
| The Securities Industry and Financial Markets Association |
| Secured Overnight Financing Rate |
| Tax & Revenue Anticipation Note |
| Variable Rate Demand Obligation |
| Amount rounds to less than 0.1% of net assets. |
| The date shown represents the earliest of the prerefunded date, next put date or final maturity date. | |
| Security is prerefunded or escrowed to maturity. | |
| Variable or floating rate security, the interest rate of which adjusts periodically based on changes in current interest rates and prepayments on the underlying pool of assets. The interest rate shown is the current rate as of February 29, 2024. | |
| Variable or floating rate security, linked to the referenced benchmark. The interest rate shown is the current rate as of February 29, 2024. | |
| Securities exempt from registration under Rule 144A or section 4(a)(2), of the Securities Act of 1933, as amended. | |
| All or a portion of the security is a when-issued security, delayed delivery security, or forward commitment. | |
| Investment in an affiliated fund, which is registered under the Investment Company Act of 1940, as amended, and is advised by J.P. Morgan Investment Management Inc. | |
| The rate shown is the current yield as of February 29, 2024. | |
SEE NOTES TO FINANCIAL STATEMENTS.
| J.P. Morgan Exchange-Traded Funds | |
STATEMENTS OF ASSETS AND LIABILITIESAS OF February 29, 2024
| | JPMorgan
Core Plus
Bond ETF | | JPMorgan
International
Bond
Opportunities ETF |
| | | | |
Investments in non-affiliates, at value | | | | |
Investments in affiliates, at value | | | | |
| | | | |
Foreign currency, at value | | | | |
Deposits at broker for futures contracts | | | | |
Deposits at broker for centrally cleared swaps | | | | |
| | | | |
| | | | |
Investment securities sold | | | | |
Investment securities sold — delayed delivery securities | | | | |
| | | | |
Interest from non-affiliates | | | | |
Dividends from affiliates | | | | |
| | | | |
Variation margin on futures contracts | | | | |
Variation margin on centrally cleared swaps | | | | |
Unrealized appreciation on forward foreign currency exchange contracts | | | | |
| | | | |
| | | | |
| | | | |
| | | | |
Foreign currency due to custodian, at value | | | | |
TBA short commitments, at value | | | | |
Investment securities purchased | | | | |
Investment securities purchased — delayed delivery securities | | | | |
Unrealized depreciation on forward foreign currency exchange contracts | | | | |
Variation margin on centrally cleared swaps | | | | |
Outstanding OTC swap contracts, at value | | | | |
| | | | |
Management fees (See Note 3.A.) | | | | |
Deferred foreign capital gains tax | | | | |
| | | | |
| | | | |
SEE NOTES TO FINANCIAL STATEMENTS.
| J.P. Morgan Exchange-Traded Funds | |
| | JPMorgan Core Plus Bond ETF | | JPMorgan International Bond Opportunities ETF |
| | | | |
| | | | |
Total distributable earnings (loss) | | | | |
| | | | |
Outstanding number of shares
(unlimited number of shares authorized - par value $0.0001) | | | | |
Net asset value, per share | | | | |
Cost of investments in non-affiliates | | | | |
Cost of investments in affiliates | | | | |
| | | | |
| | | | |
Net upfront payments/(receipts) on centrally cleared swaps | | | | |
Net upfront payments on OTC swap contracts | | | | |
SEE NOTES TO FINANCIAL STATEMENTS.
| J.P. Morgan Exchange-Traded Funds | |
STATEMENTS OF ASSETS AND LIABILITIESAS OF February 29, 2024 (continued)
| | JPMorgan Short
Duration Core
Plus ETF | JPMorgan
Ultra-Short
Income ETF | JPMorgan
Ultra-Short
Municipal
Income ETF |
| | | | |
Investments in non-affiliates, at value | | | | |
Investments in affiliates, at value | | | | |
Investments of cash collateral received from securities loaned, at value (See Note 2.F.) | | | | |
Repurchase agreements, at value | | | | |
| | | | |
Foreign currency, at value | | | | |
Deposits at broker for futures contracts | | | | |
| | | | |
| | | | |
Investment securities sold | | | | |
| | | | |
Interest from non-affiliates | | | | |
Dividends from affiliates | | | | |
Securities lending income (See Note 2.F.) | | | | |
Variation margin on futures contracts | | | | |
| | | | |
| | | | |
| | | | |
Investment securities purchased | | | | |
Investment securities purchased — delayed delivery securities | | | | |
Collateral received on securities loaned (See Note 2.F.) | | | | |
Variation margin on futures contracts | | | | |
Variation margin on centrally cleared swaps | | | | |
| | | | |
Management fees (See Note 3.A.) | | | | |
| | | | |
| | | | |
| | | | |
| | | | |
Total distributable earnings (loss) | | | | |
| | | | |
Outstanding number of shares
(unlimited number of shares authorized - par value $0.0001) | | | | |
Net asset value, per share | | | | |
Cost of investments in non-affiliates | | | | |
Cost of investments in affiliates | | | | |
Cost of repurchase agreements | | | | |
| | | | |
Investment securities on loan, at value (See Note 2.F.) | | | | |
Cost of investment of cash collateral (See Note 2.F.) | | | | |
Net upfront payments on centrally cleared swaps | | | | |
SEE NOTES TO FINANCIAL STATEMENTS.
| J.P. Morgan Exchange-Traded Funds | |
STATEMENTS OF OPERATIONSFOR THE YEAR ENDED February 29, 2024
| JPMorgan
Active
Bond ETF (a) | JPMorgan
Core Plus
Bond ETF | | JPMorgan
International
Bond
|
| | | | |
Interest income from non-affiliates | | | | |
Interest income from affiliates | | | | |
Dividend income from non-affiliates | | | | |
Dividend income from affiliates | | | | |
Foreign taxes withheld (net) | | | | |
| | | | |
| | | | |
Management fees (See Note 3.A.) | | | | |
Interest expense to non-affiliates | | | | |
Interest expense to affiliates | | | | |
| | | | |
Net investment income (loss) | | | | |
REALIZED/UNREALIZED GAINS (LOSSES): | | | | |
Net realized gain (loss) on transactions from: | | | | |
Investments in non-affiliates | | | | |
Investments in affiliates | | | | |
| | | | |
Foreign currency transactions | | | | |
Forward foreign currency exchange contracts | | | | |
| | | | |
| | | | |
Change in net unrealized appreciation/depreciation on: | | | | |
Investments in non-affiliates | | | | |
Investments in affiliates | | | | |
| | | | |
Foreign currency translations | | | | |
Forward foreign currency exchange contracts | | | | |
| | | | |
Change in net unrealized appreciation/depreciation | | | | |
Net realized/unrealized gains (losses) | | | | |
Change in net assets resulting from operations | | | | |
(a)
Commencement of operations was October 11, 2023.
(b)
Net of foreign capital gains tax of $(13,184).
SEE NOTES TO FINANCIAL STATEMENTS.
| J.P. Morgan Exchange-Traded Funds | |
STATEMENTS OF OPERATIONSFOR THE YEAR ENDED February 29, 2024 (continued)
| | JPMorgan Short
Duration Core
Plus ETF | JPMorgan
Ultra-Short
Income ETF | JPMorgan
Ultra-Short
Municipal
Income ETF |
| | | | |
Interest income from non-affiliates | | | | |
Interest income from affiliates | | | | |
Dividend income from affiliates | | | | |
Income from securities lending (net) (See Note 2.F.) | | | | |
| | | | |
| | | | |
Management fees (See Note 3.A.) | | | | |
Interest expense to non-affiliates | | | | |
Interest expense to affiliates | | | | |
| | | | |
Net investment income (loss) | | | | |
REALIZED/UNREALIZED GAINS (LOSSES): | | | | |
Net realized gain (loss) on transactions from: | | | | |
Investments in non-affiliates | | | | |
Investments in affiliates | | | | |
| | | | |
Foreign currency transactions | | | | |
Forward foreign currency exchange contracts | | | | |
| | | | |
| | | | |
Change in net unrealized appreciation/depreciation on: | | | | |
Investments in non-affiliates | | | | |
Investments in affiliates | | | | |
| | | | |
Foreign currency translations | | | | |
| | | | |
Change in net unrealized appreciation/depreciation | | | | |
Net realized/unrealized gains (losses) | | | | |
Change in net assets resulting from operations | | | | |
SEE NOTES TO FINANCIAL STATEMENTS.
| J.P. Morgan Exchange-Traded Funds | |
STATEMENTS OF CHANGES IN NET ASSETSFOR THE PERIODS INDICATED
| | JPMorgan Core
Plus Bond ETF |
| Period Ended
February 29, 2024 (a) | Year Ended
February 29, 2024 | |
CHANGE IN NET ASSETS RESULTING FROM OPERATIONS: | | | |
Net investment income (loss) | | | |
| | | |
Change in net unrealized appreciation/depreciation | | | |
Change in net assets resulting from operations | | | |
DISTRIBUTIONS TO SHAREHOLDERS: | | | |
Total distributions to shareholders | | | |
| | | |
Change in net assets resulting from capital transactions | | | |
| | | |
| | | |
| | | |
| | | |
| | | |
Proceeds from shares issued | | | |
Total change in net assets resulting from capital transactions | | | |
| | | |
| | | |
Net increase in shares from transactions | | | |
(a)
Commencement of operations was October 11, 2023.
SEE NOTES TO FINANCIAL STATEMENTS.
| J.P. Morgan Exchange-Traded Funds | |
STATEMENTS OF CHANGES IN NET ASSETSFOR THE PERIODS INDICATED (continued)
| | JPMorgan International Bond
Opportunities ETF |
| Year Ended
February 29, 2024 | Year Ended
February 28, 2023 | Year Ended
February 29, 2024 | Year Ended
February 28, 2023 |
CHANGE IN NET ASSETS RESULTING FROM OPERATIONS: | | | | |
Net investment income (loss) | | | | |
| | | | |
Change in net unrealized appreciation/depreciation | | | | |
Change in net assets resulting from operations | | | | |
DISTRIBUTIONS TO SHAREHOLDERS: | | | | |
Total distributions to shareholders | | | | |
| | | | |
Change in net assets resulting from capital transactions | | | | |
| | | | |
| | | | |
| | | | |
| | | | |
| | | | |
Proceeds from shares issued | | | | |
| | | | |
Total change in net assets resulting from capital transactions | | | | |
| | | | |
| | | | |
| | | | |
Net increase (decrease) in shares from share transactions | | | | |
SEE NOTES TO FINANCIAL STATEMENTS.
| J.P. Morgan Exchange-Traded Funds | |
| | JPMorgan Short
Duration Core Plus ETF |
| Year Ended
February 29, 2024 | Year Ended
February 28, 2023 | Year Ended
February 29, 2024 | Year Ended
February 28, 2023 |
CHANGE IN NET ASSETS RESULTING FROM OPERATIONS: | | | | |
Net investment income (loss) | | | | |
| | | | |
Distributions of capital gains received from investment company affiliates | | | | |
Change in net unrealized appreciation/depreciation | | | | |
Change in net assets resulting from operations | | | | |
DISTRIBUTIONS TO SHAREHOLDERS: | | | | |
Total distributions to shareholders | | | | |
| | | | |
Change in net assets resulting from capital transactions | | | | |
| | | | |
| | | | |
| | | | |
| | | | |
| | | | |
Proceeds from shares issued | | | | |
| | | | |
Total change in net assets resulting from capital transactions | | | | |
| | | | |
| | | | |
| | | | |
Net increase in shares from transactions | | | | |
SEE NOTES TO FINANCIAL STATEMENTS.
| J.P. Morgan Exchange-Traded Funds | |
STATEMENTS OF CHANGES IN NET ASSETSFOR THE PERIODS INDICATED (continued)
| JPMorgan Ultra-Short
Income ETF | JPMorgan Ultra-Short Municipal
Income ETF |
| Year Ended
February 29, 2024 | Year Ended
February 28, 2023 | Year Ended
February 29, 2024 | Year Ended
February 28, 2023 |
CHANGE IN NET ASSETS RESULTING FROM OPERATIONS: | | | | |
Net investment income (loss) | | | | |
| | | | |
Distributions of capital gains received from investment company affiliates | | | | |
Change in net unrealized appreciation/depreciation | | | | |
Change in net assets resulting from operations | | | | |
DISTRIBUTIONS TO SHAREHOLDERS: | | | | |
Total distributions to shareholders | | | | |
| | | | |
Change in net assets resulting from capital transactions | | | | |
| | | | |
| | | | |
| | | | |
| | | | |
| | | | |
Proceeds from shares issued | | | | |
| | | | |
Total change in net assets resulting from capital transactions | | | | |
| | | | |
| | | | |
| | | | |
Net increase (decrease) in shares from share transactions | | | | |
SEE NOTES TO FINANCIAL STATEMENTS.
| J.P. Morgan Exchange-Traded Funds | |
THIS PAGE IS INTENTIONALLY LEFT BLANK
FINANCIAL HIGHLIGHTSFOR THE PERIODS INDICATED
| Per share operating performance |
| | | |
| Net asset
value,
beginning
of period | Net investment
income
(loss) (b) | Net realized
and unrealized
gains
(losses)
on investments | Total from
investment
operations | | | |
| | | | | | | |
October 11, 2023 (f)
through February 29, 2024 | | | | | | | |
JPMorgan Core Plus Bond ETF | | | | | | | |
Year Ended February 29, 2024 | | | | | | | |
Year Ended February 28, 2023 | | | | | | | |
Year Ended February 28, 2022 | | | | | | | |
Year Ended February 28, 2021 | | | | | | | |
Year Ended February 29, 2020 | | | | | | | |
| | | | | | | |
Year Ended February 29, 2024 | | | | | | | |
Year Ended February 28, 2023 | | | | | | | |
October 28, 2021 (f)
through February 28, 2022 | | | | | | | |
JPMorgan International Bond Opportunities ETF | | | | | | | |
Year Ended February 29, 2024 | | | | | | | |
Year Ended February 28, 2023 | | | | | | | |
Year Ended February 28, 2022 | | | | | | | |
Year Ended February 28, 2021 | | | | | | | |
Year Ended February 29, 2020 | | | | | | | |
|
| Annualized for periods less than one year, unless otherwise noted. |
| Calculated based upon average shares outstanding. |
| Not annualized for periods less than one year. |
| Includes adjustments in accordance with accounting principles generally accepted in the United States of America and as such, the net asset values for financial reporting purposes and the returns based upon those net asset values may differ from the net asset values and returns for shareholder transactions. |
| Prior to December 9, 2019, market price return was calculated assuming an initial investment made at the market price at the beginning of the reporting period, reinvestment of all dividends and distributions at market price during the period, and sale at the market price on the last day of the period. The price used to calculate the market price return was the midpoint of the bid/ask spread at the close of business on the listing exchange of the Fund. Effective December 9, 2019, the closing price was used to calculate the market price return; however, any prices used in the calculation for market price return prior to December 9, 2019, would have used the midpoint of the bid/ask spread at the close of business on the exchange. |
| Commencement of operations. |
| Calculation of the net realized and unrealized gains (losses) per share does not correlate with the Fund’s net realized and unrealized gains (losses) presented in the Statements of Operations due to the timing of capital transactions in relation to the fluctuating market values of the Fund’s investments. |
| Prior to November 1, 2019, the Fund may have waived fees if expenses exceeded the expense cap. On November 1, 2019, the Fund adopted a unitary fee structure where a management fee is accrued by the Fund based on prior day net assets and other expenses are paid by the Advisor. |
| Since the shares of the Fund did not trade in the secondary market until the day after the Fund’s inception, for the period from the inception to the first day of secondary market trading, the net asset value is used as a proxy for the secondary market trading price to calculate the market returns. |
SEE NOTES TO FINANCIAL STATEMENTS.
| J.P. Morgan Exchange-Traded Funds | |
| |
| | | | | Ratios to average net assets (a) | |
Net asset
value,
end of
period | | | Market
price
total
return (c)(e) | | | Net
investment
income
(loss) | Expenses
without waivers
and reimbursements | Portfolio
turnover
rate (c) |
| | | | | | | | |
| | | | | | | | |
| | | | | | | | |
| | | | | | | | |
| | | | | | | | |
| | | | | | | | |
| | | | | | | | |
| | | | | | | | |
| | | | | | | | |
| | | | | | | | |
| | | | | | | | |
| | | | | | | | |
| | | | | | | | |
| | | | | | | | |
| | | | | | | | |
| | | | | | | | |
| | | | | | | | |
| | | | | | | | |
SEE NOTES TO FINANCIAL STATEMENTS.
| J.P. Morgan Exchange-Traded Funds | |
FINANCIAL HIGHLIGHTSFOR THE PERIODS INDICATED (continued)
| Per share operating performance |
| | | |
| Net asset
value,
beginning
of period | Net investment
income
(loss) (b) | Net realized
and unrealized
gains
(losses)
on investments | Total from
investment
operations | | | |
| | | | | | | |
Year Ended February 29, 2024 | | | | | | | |
Year Ended February 28, 2023 | | | | | | | |
Year Ended February 28, 2022 | | | | | | | |
Year Ended February 28, 2021 | | | | | | | |
Year Ended February 29, 2020 | | | | | | | |
JPMorgan Short Duration Core Plus ETF | | | | | | | |
Year Ended February 29, 2024 | | | | | | | |
Year Ended February 28, 2023 | | | | | | | |
March 1, 2021 (g)
through February 28, 2022 | | | | | | | |
JPMorgan Ultra-Short Income ETF | | | | | | | |
Year Ended February 29, 2024 | | | | | | | |
Year Ended February 28, 2023 | | | | | | | |
Year Ended February 28, 2022 | | | | | | | |
Year Ended February 28, 2021 | | | | | | | |
Year Ended February 29, 2020 | | | | | | | |
JPMorgan Ultra-Short Municipal Income ETF | | | | | | | |
Year Ended February 29, 2024 | | | | | | | |
Year Ended February 28, 2023 | | | | | | | |
Year Ended February 28, 2022 | | | | | | | |
Year Ended February 28, 2021 | | | | | | | |
Year Ended February 29, 2020 | | | | | | | |
|
| Annualized for periods less than one year, unless otherwise noted. |
| Calculated based upon average shares outstanding. |
| Not annualized for periods less than one year. |
| Includes adjustments in accordance with accounting principles generally accepted in the United States of America and as such, the net asset values for financial reporting purposes and the returns based upon those net asset values may differ from the net asset values and returns for shareholder transactions. |
| Prior to December 9, 2019, market price return was calculated assuming an initial investment made at the market price at the beginning of the reporting period, reinvestment of all dividends and distributions at market price during the period, and sale at the market price on the last day of the period. The price used to calculate the market price return was the midpoint of the bid/ask spread at the close of business on the listing exchange of the Fund. Effective December 9, 2019, the closing price was used to calculate the market price return; however, any prices used in the calculation for market price return prior to December 9, 2019, would have used the midpoint of the bid/ask spread at the close of business on the exchange. |
| Prior to November 1, 2019, the Fund may have waived fees if expenses exceeded the expense cap. On November 1, 2019, the Fund adopted a unitary fee structure where a management fee is accrued by the Fund based on prior day net assets and other expenses are paid by the Advisor. |
| Commencement of operations. |
| Since the shares of the Fund did not trade in the secondary market until the day after the Fund’s inception, for the period from the inception to the first day of secondary market trading, the net asset value is used as a proxy for the secondary market trading price to calculate the market returns. |
| Amount rounds to less than $0.005. |
SEE NOTES TO FINANCIAL STATEMENTS.
| J.P. Morgan Exchange-Traded Funds | |
| |
| | | | | Ratios to average net assets (a) | |
Net asset
value,
end of
period | | | Market
price
total
return (c)(e) | | | Net
investment
income
(loss) | Expenses
without waivers
and reimbursements | Portfolio
turnover
rate (c) |
| | | | | | | | |
| | | | | | | | |
| | | | | | | | |
| | | | | | | | |
| | | | | | | | |
| | | | | | | | |
| | | | | | | | |
| | | | | | | | |
| | | | | | | | |
| | | | | | | | |
| | | | | | | | |
| | | | | | | | |
| | | | | | | | |
| | | | | | | | |
| | | | | | | | |
| | | | | | | | |
| | | | | | | | |
| | | | | | | | |
| | | | | | | | |
| | | | | | | | |
| | | | | | | | |
| | | | | | | | |
SEE NOTES TO FINANCIAL STATEMENTS.
| J.P. Morgan Exchange-Traded Funds | |
NOTES TO FINANCIAL STATEMENTSAS OF February 29, 2024
1. Organization
J.P. Morgan Exchange-Traded Fund Trust (the “Trust”) was formed on February 25, 2010, and is governed by a Declaration of Trust as amended and restated February 19, 2014, and is registered under the Investment Company Act of 1940, as amended (the “1940 Act”), as an open-end management investment company.
The following are 8 separate funds of the Trust (each, a "Fund" and collectively, the "Funds") covered by this report:
| Diversification Classification |
| |
JPMorgan Core Plus Bond ETF | |
| |
JPMorgan International Bond Opportunities ETF | |
| |
JPMorgan Short Duration Core Plus ETF | |
JPMorgan Ultra-Short Income ETF | |
JPMorgan Ultra-Short Municipal Income ETF | |
The investment objective of JPMorgan Active Bond ETF (“Active Bond ETF”) is to seek to deliver total return from a portfolio of investment grade intermediate- and long-term bonds.
The investment objective of JPMorgan Core Plus Bond ETF (“Core Plus Bond ETF”) is to seek a high level of current income by investing primarily in a diversified portfolio of high-, medium- and low-grade debt securities.
The investment objective of JPMorgan Income ETF (“Income ETF”) is to seek to provide income with a secondary objective of capital appreciation.
The investment objective of JPMorgan International Bond Opportunities ETF (“International Bond Opportunities ETF”) is to seek to provide total return.
The investment objective of JPMorgan Municipal ETF (“Municipal ETF”) is to seek to provide monthly dividends, which are excluded from gross income, and to protect the value of your investment by investing primarily in municipal obligations. For purposes of the Fund’s investment objective, “gross income” means gross income for federal income tax purposes.
The investment objective of JPMorgan Short Duration Core Plus ETF (“Short Duration Core Plus ETF”) is to seek total return, consistent with preservation of capital.
The investment objective of JPMorgan Ultra-Short Income ETF (“Ultra-Short Income ETF”) is to seek to provide current income while seeking to maintain a low volatility of principal.
The investment objective of JPMorgan Ultra-Short Municipal Income ETF (“Ultra-Short Municipal Income ETF”) is to seek to provide as high a level of current income exempt from federal income tax as is consistent with relative stability of principal.
J.P. Morgan Investment Management Inc. (“JPMIM”), an indirect, wholly-owned subsidiary of JPMorgan Chase & Co. (“JPMorgan”), acts as adviser (the “Adviser”) and administrator (the “Administrator”) to the Funds.
Shares of each Fund are listed and traded at market price on an exchange as follows:
| |
| New York Stock Exchange LLC |
| |
| |
International Bond Opportunities ETF | |
| |
Short Duration Core Plus ETF | |
| |
Ultra-Short Municipal Income ETF | |
Market prices for the Funds’ shares may be different from their net asset value (“NAV”).
The Funds issue and redeem their shares on a continuous basis, through JPMorgan Distribution Services, Inc. (the “Distributor” or “JPMDS”), an indirect, wholly-owned subsidiary of JPMorgan, at NAV in large blocks of shares, referred to as “Creation Units”. Creation Units are issued and redeemed in exchange for a basket of securities and/or cash. Shares are generally traded in the secondary market in amounts less than a Creation
Unit at market prices that change throughout the day. Only individuals or institutions that have entered into an authorized participant agreement with the Distributor may do business directly with the Funds (each, an “Authorized Participant”).
2. Significant Accounting Policies
The following is a summary of significant accounting policies followed by the Funds in the preparation of their financial statements. The Funds are investment companies and, accordingly, follow the investment company accounting and reporting guidance of the Financial Accounting Standards Board (“FASB”) Accounting Standards Codification Topic 946 — Investment Companies, which is part of U.S. generally accepted accounting principles (“GAAP”). The preparation of financial statements in conformity with GAAP requires management to make estimates and assumptions that affect (i) the reported amounts of assets and liabilities, (ii) disclosure of contingent assets and liabilities at the date of the financial statements, and (iii) the reported amounts of increases and decreases in net assets from operations during the reporting period. Actual results could differ from those estimates.
A. Valuation of Investments— Investments are valued in accordance with GAAP and the Funds' valuation policies set forth by, and under the supervision and responsibility of, the Board of Trustees of the Trust (the "Board"), which established the following approach to valuation, as described more fully below: (i) investments for which market quotations are readily available shall be valued at their market value and (ii) all other investments for which market quotations are not readily available shall be valued at their fair value as determined in good faith by the Board.
Under Section 2(a)(41) of the 1940 Act, the Board is required to determine fair value for securities that do not have readily available market quotations. Under SEC Rule 2a-5 (Good Faith Determinations of Fair Value), the Board may designate the performance of these fair valuation determinations to a valuation designee. The Board has designated the Adviser as the “Valuation Designee” to perform fair valuation determinations for the Funds on behalf of the Board subject to appropriate oversight by the Board. The Adviser, as Valuation Designee, leverages the J.P. Morgan Asset Management Americas Valuation Committee (“AVC”) to help oversee and carry out the policies for the valuation of investments held in the Funds. The Adviser, as Valuation Designee, remains responsible for the valuation determinations.
This oversight by the AVC includes monitoring the appropriateness of fair values based on results of ongoing valuation oversight including, but not limited to, consideration of macro or security specific events, market events, and pricing vendor and broker due diligence. The Administrator is responsible for discussing and assessing the potential impacts to the fair values on an ongoing basis, and, at least on a quarterly basis, with the AVC and the Board.
A market-based approach is primarily used to value the Funds' investments. Investments for which market quotations are not readily available are fair valued using prices supplied by approved affiliated and/or unaffiliated pricing vendors or third party broker-dealers (collectively referred to as “Pricing Services”) or may be internally fair valued using methods set forth by the valuation policies approved by the Board. This may include the use of related or comparable assets or liabilities, recent transactions, market multiples, book values and other relevant information for the investment. An income-based valuation approach may be used in which the anticipated future cash flows of the investment are discounted to calculate the fair value. Discounts may also be applied due to the nature or duration of any restrictions on the disposition of the investments. Valuations may be based upon current market prices of securities that are comparable in coupon, rating, maturity and industry. It is possible that the estimated values may differ significantly from the values that would have been used had a ready market for the investments existed, and such differences could be material.
Fixed income instruments are valued based on prices received from Pricing Services. The Pricing Services use multiple valuation techniques to determine the valuation of fixed income instruments. In instances where sufficient market activity exists, the Pricing Services may utilize a market-based approach through which trades or quotes from market makers are used to determine the valuation of these instruments. In instances where sufficient market activity may not exist, the Pricing Services also utilize proprietary valuation models which may consider market transactions in comparable securities and the various relationships between securities in determining fair value and/or market characteristics in order to estimate the relevant cash flows, which are then discounted to calculate the fair values.
Equities and other exchange-traded instruments are valued at the last sale price or official market closing price on the primary exchange on which the instrument is traded before the NAVs of the Funds are calculated on a valuation date. Certain foreign equity instruments are valued by applying international fair value factors provided by approved Pricing Services. The factors seek to adjust the local closing price for movements of local markets post-closing, but prior to the time the NAVs are calculated.
Investments in open-end investment companies (“Underlying Funds”) are valued at each Underlying Fund’s NAV per share as of the report date.
Futures contracts are generally valued on the basis of available market quotations. Swaps and forward foreign currency exchange contracts are valued utilizing market quotations from approved Pricing Services.
See the tables on “Quantitative Information about Level 3 Fair Value Measurements” for information on the valuation techniques and inputs used to value level 3 securities held by Active Bond ETF, Core Plus Bond ETF and Income ETF at February 29, 2024.
Valuations reflected in this report are as of the report date. As a result, changes in valuation due to market events and/or issuer-related events after the report date and prior to issuance of the report are not reflected herein.
NOTES TO FINANCIAL STATEMENTSAS OF February 29, 2024 (continued)
The various inputs that are used in determining the valuation of the Funds' investments are summarized into the three broad levels listed below.
•
Level 1 — Unadjusted inputs using quoted prices in active markets for identical investments.
•
Level 2 — Other significant observable inputs including, but not limited to, quoted prices for similar investments, inputs other than quoted prices that are observable for investments (such as interest rates, prepayment speeds, credit risk, etc.) or other market corroborated inputs.
•
Level 3 — Significant inputs based on the best information available in the circumstances, to the extent observable inputs are not available (including the Funds' assumptions in determining the fair value of investments).
A financial instrument’s level within the fair value hierarchy is based on the lowest level of any input, both individually and in the aggregate, that is significant to the fair value measurement. The inputs or methodology used for valuing instruments are not necessarily an indication of the risk associated with investing in those instruments.
The following tables represent each valuation input as presented on the Schedules of Portfolio Investments ("SOIs"):
| | | | |
| | Level 2
Other significant
observable inputs | Level 3
Significant
unobservable inputs | |
Investments in Securities | | | | |
| | | | |
Collateralized Mortgage Obligations | | | | |
Commercial Mortgage-Backed Securities | | | | |
| | | | |
Foreign Government Securities | | | | |
Mortgage-Backed Securities | | | | |
U.S. Treasury Obligations | | | | |
| | | | |
| | | | |
Total Investments in Securities | | | | |
Appreciation in Other Financial Instruments | | | | |
| | | | |
| | | | |
| | Level 2
Other significant
observable inputs | Level 3
Significant
unobservable inputs | |
Investments in Securities | | | | |
| | | | |
Collateralized Mortgage Obligations | | | | |
Commercial Mortgage-Backed Securities | | | | |
| | | | |
Diversified Telecommunication Services | | | | |
Health Care Providers & Services | | | | |
Oil, Gas & Consumable Fuels | | | | |
| | | | |
Wireless Telecommunication Services | | | | |
| | | | |
| | | | |
| | | | |
| | | | |
| | | | |
| | | | |
| | | | |
| | | | |
Core Plus Bond ETF (continued) | | | | |
| | Level 2 Other significant observable inputs | Level 3 Significant unobservable inputs | |
| | | | |
| | | | |
| | | | |
| | | | |
Commercial Services & Supplies | | | | |
| | | | |
Construction & Engineering | | | | |
| | | | |
| | | | |
Consumer Staples Distribution & Retail | | | | |
| | | | |
| | | | |
Diversified Consumer Services | | | | |
| | | | |
Diversified Telecommunication Services | | | | |
| | | | |
| | | | |
Electronic Equipment, Instruments & Components | | | | |
Energy Equipment & Services | | | | |
| | | | |
| | | | |
| | | | |
| | | | |
| | | | |
Health Care Equipment & Supplies | | | | |
Health Care Providers & Services | | | | |
| | | | |
| | | | |
| | | | |
Hotels, Restaurants & Leisure | | | | |
| | | | |
| | | | |
Independent Power and Renewable Electricity Producers | | | | |
| | | | |
| | | | |
| | | | |
Interactive Media & Services | | | | |
| | | | |
| | | | |
Life Sciences Tools & Services | | | | |
| | | | |
| | | | |
| | | | |
| | | | |
Mortgage Real Estate Investment Trusts (REITs) | | | | |
| | | | |
| | | | |
Oil, Gas & Consumable Fuels | | | | |
NOTES TO FINANCIAL STATEMENTSAS OF February 29, 2024 (continued)
Core Plus Bond ETF (continued) | | | | |
| | Level 2 Other significant observable inputs | Level 3 Significant unobservable inputs | |
| | | | |
| | | | |
| | | | |
Real Estate Management & Development | | | | |
| | | | |
| | | | |
Semiconductors & Semiconductor Equipment | | | | |
| | | | |
| | | | |
| | | | |
Technology Hardware, Storage & Peripherals | | | | |
Textiles, Apparel & Luxury Goods | | | | |
| | | | |
Trading Companies & Distributors | | | | |
Transportation Infrastructure | | | | |
| | | | |
Wireless Telecommunication Services | | | | |
| | | | |
Foreign Government Securities | | | | |
| | | | |
Mortgage-Backed Securities | | | | |
| | | | |
| | | | |
U.S. Treasury Obligations | | | | |
| | | | |
| | | | |
| | | | |
Total Investments in Securities | | | | |
Appreciation in Other Financial Instruments | | | | |
Forward Foreign Currency Exchange Contracts | | | | |
| | | | |
| | | | |
Depreciation in Other Financial Instruments | | | | |
Forward Foreign Currency Exchange Contracts | | | | |
| | | | |
| | | | |
Total Net Appreciation/ Depreciation in Other
Financial Instruments | | | | |
| | | | |
| | Level 2
Other significant
observable inputs | Level 3
Significant
unobservable inputs | |
Investments in Securities | | | | |
| | | | |
Collateralized Mortgage Obligations | | | | |
Commercial Mortgage-Backed Securities | | | | |
| | | | |
| | Level 2 Other significant observable inputs | Level 3 Significant unobservable inputs | |
| | | | |
| | | | |
| | | | |
| | | | |
| | | | |
| | | | |
| | | | |
| | | | |
| | | | |
| | | | |
Commercial Services & Supplies | | | | |
| | | | |
Construction & Engineering | | | | |
| | | | |
| | | | |
Consumer Staples Distribution & Retail | | | | |
| | | | |
| | | | |
Diversified Consumer Services | | | | |
| | | | |
Diversified Telecommunication Services | | | | |
| | | | |
| | | | |
Electronic Equipment, Instruments & Components | | | | |
Energy Equipment & Services | | | | |
| | | | |
| | | | |
| | | | |
| | | | |
| | | | |
Health Care Equipment & Supplies | | | | |
Health Care Providers & Services | | | | |
| | | | |
| | | | |
Hotels, Restaurants & Leisure | | | | |
| | | | |
| | | | |
Independent Power and Renewable Electricity Producers | | | | |
| | | | |
| | | | |
| | | | |
| | | | |
| | | | |
| | | | |
Oil, Gas & Consumable Fuels | | | | |
| | | | |
| | | | |
| | | | |
NOTES TO FINANCIAL STATEMENTSAS OF February 29, 2024 (continued)
| | | | |
| | Level 2 Other significant observable inputs | Level 3 Significant unobservable inputs | |
| | | | |
| | | | |
Real Estate Management & Development | | | | |
Semiconductors & Semiconductor Equipment | | | | |
| | | | |
| | | | |
| | | | |
Technology Hardware, Storage & Peripherals | | | | |
Textiles, Apparel & Luxury Goods | | | | |
| | | | |
Trading Companies & Distributors | | | | |
Wireless Telecommunication Services | | | | |
| | | | |
| | | | |
Foreign Government Securities | | | | |
Mortgage-Backed Securities | | | | |
| | | | |
| | | | |
| | | | |
Total Investments in Securities | | | | |
| | | | |
| | | | |
Total Liabilities in Securities Sold Short | | | | |
Appreciation in Other Financial Instruments | | | | |
Forward Foreign Currency Exchange Contracts | | | | |
| | | | |
Depreciation in Other Financial Instruments | | | | |
Forward Foreign Currency Exchange Contracts | | | | |
| | | | |
| | | | |
Total Net Appreciation/ Depreciation in Other
Financial Instruments | | | | |
International Bond Opportunities ETF | | |
| | Level 2
Other significant
observable inputs | Level 3
Significant
unobservable inputs | |
Investments in Securities | | | | |
| | | | |
Collateralized Mortgage Obligations | | | | |
| | | | |
Commercial Mortgage-Backed Securities | | | | |
| | | | |
| | | | |
Foreign Government Securities | | | | |
U.S. Treasury Obligations | | | | |
International Bond Opportunities ETF (continued) | | |
| | Level 2 Other significant observable inputs | Level 3 Significant unobservable inputs | |
| | | | |
| | | | |
Total Investments in Securities | | | | |
Appreciation in Other Financial Instruments | | | | |
Forward Foreign Currency Exchange Contracts | | | | |
| | | | |
| | | | |
Depreciation in Other Financial Instruments | | | | |
Forward Foreign Currency Exchange Contracts | | | | |
| | | | |
| | | | |
Total Net Appreciation/ Depreciation in Other
Financial Instruments | | | | |
| | | | |
| | Level 2
Other significant
observable inputs | Level 3
Significant
unobservable inputs | |
Investments in Securities | | | | |
| | | | |
U.S. Treasury Obligations | | | | |
| | | | |
| | | | |
Total Investments in Securities | | | | |
Appreciation in Other Financial Instruments | | | | |
| | | | |
Short Duration Core Plus ETF | | | | |
| | Level 2
Other significant
observable inputs | Level 3
Significant
unobservable inputs | |
Investments in Securities | | | | |
| | | | |
Collateralized Mortgage Obligations | | | | |
Commercial Mortgage-Backed Securities | | | | |
| | | | |
| | | | |
| | | | |
| | | | |
| | | | |
| | | | |
| | | | |
| | | | |
| | | | |
| | | | |
| | | | |
Commercial Services & Supplies | | | | |
NOTES TO FINANCIAL STATEMENTSAS OF February 29, 2024 (continued)
Short Duration Core Plus ETF (continued) | | | | |
| | Level 2 Other significant observable inputs | Level 3 Significant unobservable inputs | |
| | | | |
Construction & Engineering | | | | |
| | | | |
Consumer Staples Distribution & Retail | | | | |
| | | | |
Diversified Consumer Services | | | | |
Diversified Telecommunication Services | | | | |
| | | | |
| | | | |
Electronic Equipment, Instruments & Components | | | | |
Energy Equipment & Services | | | | |
| | | | |
| | | | |
| | | | |
| | | | |
| | | | |
Health Care Equipment & Supplies | | | | |
Health Care Providers & Services | | | | |
| | | | |
Hotels, Restaurants & Leisure | | | | |
| | | | |
| | | | |
Independent Power and Renewable Electricity Producers | | | | |
| | | | |
| | | | |
| | | | |
| | | | |
| | | | |
| | | | |
| | | | |
Oil, Gas & Consumable Fuels | | | | |
| | | | |
| | | | |
| | | | |
Real Estate Management & Development | | | | |
Semiconductors & Semiconductor Equipment | | | | |
| | | | |
| | | | |
| | | | |
Technology Hardware, Storage & Peripherals | | | | |
Trading Companies & Distributors | | | | |
Wireless Telecommunication Services | | | | |
| | | | |
Foreign Government Securities | | | | |
Mortgage-Backed Securities | | | | |
| | | | |
U.S. Treasury Obligations | | | | |
Short Duration Core Plus ETF (continued) | | | | |
| | Level 2 Other significant observable inputs | Level 3 Significant unobservable inputs | |
| | | | |
| | | | |
U.S. Treasury Obligations | | | | |
Total Short-Term Investments | | | | |
Total Investments in Securities | | | | |
Appreciation in Other Financial Instruments | | | | |
| | | | |
| | | | |
Depreciation in Other Financial Instruments | | | | |
| | | | |
Total Net Appreciation/ Depreciation in Other
Financial Instruments | | | | |
| | | | |
| | Level 2
Other significant
observable inputs | Level 3
Significant
unobservable inputs | |
Investments in Securities | | | | |
| | | | |
Commercial Mortgage-Backed Securities | | | | |
| | | | |
U.S. Treasury Obligations | | | | |
| | | | |
| | | | |
| | | | |
| | | | |
Investment of Cash Collateral from Securities Loaned | | | | |
| | | | |
Total Short-Term Investments | | | | |
Total Investments in Securities | | | | |
Depreciation in Other Financial Instruments | | | | |
| | | | |
Ultra-Short Municipal Income ETF | | | | |
| | Level 2
Other significant
observable inputs | Level 3
Significant
unobservable inputs | |
Investments in Securities | | | | |
| | | | |
| | | | |
| | | | |
Total Investments in Securities | | | | |
NOTES TO FINANCIAL STATEMENTSAS OF February 29, 2024 (continued)
The following is a summary of investments for which significant unobservable inputs (level 3) were used in determining fair value:
| Balance as of
October 11, 2023(a) | | Change in net
unrealized
appreciation
(depreciation) | Net
accretion
(amortization) | | | | | Balance as of
February 29,
2024 |
Investments in Securities: | | | | | | | | | |
| | | | | | | | | |
Commercial Mortgage-Backed Securities | | | | | | | | | |
| | | | | | | | | |
|
| Purchases include all purchases of securities and securities received in corporate actions. |
| Sales include all sales of securities, maturities, paydowns and securities tendered in corporate actions. |
| Commencement of operations was October 11, 2023 |
The changes in net unrealized appreciation (depreciation) attributable to securities owned at February 29, 2024, which were valued using significant unobservable inputs (level 3) amounted to $9,296.
| Balance as of
February 28,
2023 | | Change in net
unrealized
appreciation
(depreciation) | Net
accretion
(amortization) | | | | | | Balance as of
February 29,
2024 |
Investments in Securities: | | | | | | | | | | |
| | | | | | | | | | |
Collateralized Mortgage Obligations | | | | | | | | | | |
Commercial Mortgage-Backed Securities | | | | | | | | | | |
| | | | | | | | | | |
| | | | | | | | | | |
| | | | | | | | | | |
| | | | | | | | | | |
| | | | | | | | | | |
| | | | | | | | | | |
|
| Purchases include all purchases of securities and securities received in corporate actions. |
| Sales include all sales of securities, maturities, paydowns and securities tendered in corporate actions. |
| Certain Level 3 investments were re-classified between Collateralized Mortgage Obligations and Asset-Backed Securities. |
The changes in net unrealized appreciation (depreciation) attributable to securities owned at February 29, 2024, which were valued using significant unobservable inputs (level 3) amounted to $(682,021).
There were no significant transfers into or out of level 3 for the year ended February 29, 2024.
| Balance as of
February 28,
2023 | | Change in net
unrealized
appreciation
(depreciation) | Net
accretion
(amortization) | | | | | Balance as of
February 29,
2024 |
Investments in Securities: | | | | | | | | | |
| | | | | | | | | |
Collateralized Mortgage Obligations | | | | | | | | | |
Commercial Mortgage-Backed Securities | | | | | | | | | |
| | | | | | | | | |
| | | | | | | | | |
|
| Purchases include all purchases of securities and securities received in corporate actions. |
| Sales include all sales of securities, maturities, paydowns and securities tendered in corporate actions. |
The changes in net unrealized appreciation (depreciation) attributable to securities owned at February 29, 2024, which were valued using significant unobservable inputs (level 3) amounted to $(468,378).
There were no significant transfers into or out of level 3 for the year ended February 29, 2024.
International Bond Opportunities ETF | Balance as of
February 28,
2023 | | Change in net
unrealized
appreciation
(depreciation) | Net
accretion
(amortization) | | | | | Balance as of
February 29,
2024 |
Investments in Securities: | | | | | | | | | |
Collateralized Mortgage Obligations | | | | | | | | | |
Commercial Mortgage-Backed Securities | | | | | | | | | |
| | | | | | | | | |
| | | | | | | | | |
| | | | | | | | | |
|
| Purchases include all purchases of securities and securities received in corporate actions. |
| Sales include all sales of securities, maturities, paydowns and securities tendered in corporate actions. |
The changes in net unrealized appreciation (depreciation) attributable to securities owned at February 29, 2024, which were valued using significant unobservable inputs (level 3) amounted to $59,917.
NOTES TO FINANCIAL STATEMENTSAS OF February 29, 2024 (continued)
Short Duration Core Plus ETF | Balance as of
February 28,
2023 | | Change in net
unrealized
appreciation
(depreciation) | Net
accretion
(amortization) | | | | | Balance as of
February 29,
2024 |
Investments in Securities: | | | | | | | | | |
| | | | | | | | | |
| | | | | | | | | |
| | | | | | | | | |
|
| Purchases include all purchases of securities and securities received in corporate actions. |
| Sales include all sales of securities, maturities, paydowns and securities tendered in corporate actions. |
The changes in net unrealized appreciation (depreciation) attributable to securities owned at February 29, 2024, which were valued using significant unobservable inputs (level 3) amounted to $13,239.
There were no significant transfers into or out of level 3 for the year ended February 29, 2024.
The significant unobservable inputs used in the fair value measurement of the Funds' investments are listed below. Generally, a change in the assumptions used in any input in isolation may be accompanied by a change in another input. Significant changes in any of the unobservable inputs may significantly impact the fair value measurement. The impact is based on the relationship between each unobservable input and the fair value measurement. Significant increases (decreases) in enterprise multiples may increase (decrease) the fair value measurement. Significant increases (decreases) in the discount for lack of marketability, liquidity discount, probability of default, yield and default rate may decrease (increase) the fair value measurement. A significant change in the discount rate or prepayment rate (Constant Prepayment Rate or PSA Prepayment Model) may decrease or increase the fair value measurement.
Active
Bond ETF
Quantitative Information about Level 3 Fair Value Measurements #
| Fair Value at February 29, 2024 | | | Range (Weighted Average) (a) |
| | | | |
| | | Yield (Discount Rate of Cash Flows) | |
| | | | |
| | | | |
| | | | |
| The table above does not include certain level 3 investments that are valued by brokers and Pricing Services. At February 29, 2024, the value of these investments was $4,586,878. The inputs for these investments are not readily available or cannot be reasonably estimated and are generally those inputs described in Note 2.A. |
| Unobservable inputs were weighted by the relative fair value of the instruments. |
Core Plus
Bond ETF
Quantitative Information about Level 3 Fair Value Measurements #
| Fair Value at February 29, 2024 | | | Range (Weighted Average) (a) |
| | | | |
| | | | |
| | | Yield (Discount Rate of Cash Flows) | |
| | | | |
| | | | |
| | | Yield (Discount Rate of Cash Flows) | |
| | | | |
Collateralized Mortgage Obligations | | | | |
| | | | |
| The table above does not include certain level 3 investments that are valued by brokers and Pricing Services. At February 29, 2024, the value of these investments was $43,626,577. The inputs for these investments are not readily available or cannot be reasonably estimated and are generally those inputs described in Note 2.A. |
| Unobservable inputs were weighted by the relative fair value of the instruments. |
Income ETF
Quantitative Information about Level 3 Fair Value Measurements #
| Fair Value at February 29, 2024 | | | Range (Weighted Average) (a) |
| | | | |
| | | | |
| | | Yield (Discount Rate of Cash Flows) | |
| | | | |
| | | Yield (Discount Rate of Cash Flows) | |
| | | | |
Collateralized Mortgage Obligations | | | | |
| | | | |
| The table above does not include certain level 3 investments that are valued by brokers and Pricing Services. At February 29, 2024, the value of these investments was $8,917,130. The inputs for these investments are not readily available or cannot be reasonably estimated and are generally those inputs described in Note 2.A. |
| Unobservable inputs were weighted by the relative fair value of the instruments. |
B. Restricted Securities— Certain securities held by the Funds may be subject to legal or contractual restrictions on resale. Restricted securities generally are resold in transactions exempt from registration under the Securities Act of 1933, as amended (the “Securities Act”). Disposal of these securities may involve time-consuming negotiations and expense. Prompt sale at the current valuation may be difficult and could adversely affect the NAVs of the Funds.
As of February 29, 2024, the Funds had no investments in restricted securities other than securities sold to the Funds under Rule 144A and/or Regulation S under the Securities Act.
NOTES TO FINANCIAL STATEMENTSAS OF February 29, 2024 (continued)
C. Repurchase Agreements— Ultra-Short Income ETF may enter into repurchase agreement transactions that meet the credit guidelines of JPMIM. Repurchase agreements involve the purchase of securities subject to the seller’s agreement to repurchase the securities at a mutually agreed upon date and price. The Fund requires that the collateral received in a repurchase agreement transaction be transferred to a custodian in a manner sufficient to enable the Fund to obtain collateral in the event of a counterparty default. If the counterparty defaults and the fair value of the collateral declines, realization of the collateral by the Fund may be delayed or limited. Repurchase agreement collateral may be held in segregated accounts maintained by JPMorgan Chase Bank, N.A. (“JPMCB”), a wholly-owned subsidiary of JPMorgan.
The Fund's repurchase agreements are not subject to master netting arrangements.
D. Loan Assignments— Core Plus Bond ETF invested in debt instruments that are interests in amounts owed to lenders or lending syndicates (a “Lender”) by corporate, governmental or other borrowers (a “Borrower”). A loan is often administered by a bank or other financial institution (the “Agent”) that acts as Agent for all holders. The Agent administers the terms of the loan, as specified in the loan agreement. The invested in loan assignments of all or a portion of the loans. When a Fund purchases a loan assignment, the Fund has direct rights against the Borrower on a loan. In addition, it is unclear whether loans, loan assignments and other forms of direct indebtedness offer securities law protections against fraud and misrepresentation. Also, because JPMIM may wish to invest in publicly traded securities of a Borrower, it may not have access to material non-public information regarding the Borrower to which other investors have access. Although certain loans are secured by collateral, a Fund could experience delays or limitations in realizing the value on such collateral or have its interest subordinated to other indebtedness of the Borrower.
Loan assignments are vulnerable to market conditions such that economic conditions or other events may reduce the demand for assignments and certain assignments which were liquid when purchased, may become illiquid and difficult to value. In addition, the settlement period for loans is uncertain as there is no standardized settlement schedule applicable to such investments. Therefore, the Fund may not receive the proceeds from a sale of such investments for a period after the sale.
Certain loan assignments are also subject to the risks associated with high yield securities described under Note 7.
E. When-Issued Securities, Delayed Delivery Securities and Forward Commitments— The Funds purchased when-issued securities, including To-Be-Announced securities, and entered into contracts to purchase or sell securities for a fixed price that may be settled a month or more after the trade date, or purchased delayed delivery securities which generally settle seven days after the trade date. When-issued securities are securities that have been authorized, but not issued in the market. A forward commitment involves entering into a contract to purchase or sell securities for a fixed price at a future date that may be settled a month or more after the trade date. A delayed delivery security is agreed upon in advance between the buyer and the seller of the security and is generally delivered beyond seven days of the agreed upon date. The purchase of securities on a when-issued, delayed delivery or forward commitment basis involves the risk that the value of the security to be purchased declines before the settlement date. The sale of securities on a forward commitment basis involves the risk that the value of the securities sold may increase before the settlement date. The Funds may be exposed to credit risk if the counterparty fails to perform under the terms of the transaction. Interest income for securities purchased on a when-issued, delayed delivery or forward commitment basis is not accrued until the settlement date.
International Bond Opportunities ETF may be required to post or receive collateral for delayed delivery securities in the form of cash or securities under a Master Securities Forward Transaction Agreement with the counterparties (each, an “MSFTA”). The collateral requirements are generally calculated by netting the mark-to-market amount for a Fund's transactions under the MSFTA and comparing that amount to the value of the collateral pledged by a Fund and the counterparty. Daily movement of cash collateral is subject to minimum threshold amounts. Collateral posted by a Fund is held in a segregated account at the Fund's custodian bank and is included on the Statements of Assets and Liabilities as Restricted cash. Collateral received by the Fund is held in a separate segregated account maintained by JPMCB. These amounts are not reflected on the Fund's Statements of Assets and Liabilities.
Active Bond ETF, Core Plus Bond ETF, Income ETF, Municipal ETF, Short Duration Core Plus ETF, Ultra-Short Income ETF and Ultra-Short Municipal Income ETF had when-issued securities, delayed delivery securities or forward commitments outstanding as of February 29, 2024, which are shown as a Receivable for Investment securities sold — delayed delivery securities and/or a Payable for Investment securities purchased — delayed delivery securities, respectively, on the Statements of Assets and Liabilities. The values of these securities held at February 29, 2024 are detailed on the SOIs, if any.
F. Securities Lending — The Funds, except International Bond Opportunities ETF, are authorized to engage in securities lending in order to generate additional income. The Funds are able to lend to approved borrowers. Citibank N.A. (“Citibank”) serves as lending agent for the Funds, pursuant to a Securities Lending Agency Agreement (the “Securities Lending Agency Agreement”). Securities loaned are collateralized by cash equal to at least 100% of the market value plus accrued interest on the securities lent, which is invested in the Class IM Shares of the JPMorgan U.S. Government Money Market Fund and the Agency SL Class Shares of the JPMorgan Securities Lending Money Market Fund. The Funds retain the interest earned on cash collateral investments but are required to pay the borrower a rebate for the use of the cash collateral. In cases where the lent security is of high value to borrowers, there may be a negative rebate (i.e., a net payment from the borrower to the Funds). Upon termination of a loan, the Funds are required to return to the borrower an amount equal to the cash collateral, plus any rebate owed to the borrowers. The remaining maturities of the securities lending transactions are considered overnight and continuous. Loans are subject to termination by the Funds or the borrower at any time.
The net income earned on the securities lending (after payment of rebates and Citibank’s fee) is included on the Statements of Operations as Income from securities lending (net). The Funds also receive payments from the borrower during the period of the loan, equivalent to dividends and interest earned on the securities loaned, which are recorded as Dividend or Interest income, respectively, on the Statements of Operations.
Under the Securities Lending Agency Agreement, Citibank marks to market the loaned securities on a daily basis. In the event the cash received from the borrower is less than 102% of the value of the loaned securities (105% for loans of non-U.S. securities), Citibank requests additional cash from the borrower so as to maintain a collateralization level of at least 102% of the value of the loaned securities plus accrued interest (105% for loans of non-U.S. securities), subject to certain de minimis amounts.
The value of securities out on loan is recorded as an asset on the Statements of Assets and Liabilities. The value of the cash collateral received is recorded as a liability on the Statements of Assets and Liabilities and details of collateral investments are disclosed on the SOIs.
The Funds bear the risk of loss associated with the collateral investments and are not entitled to additional collateral from the borrower to cover any such losses. To the extent that the value of the collateral investments declines below the amount owed to a borrower, the Funds may incur losses that exceed the amount they earned on lending the security. Upon termination of a loan, the Funds may use leverage (borrow money) to repay the borrower for cash collateral posted if the Adviser does not believe that it is prudent to sell the collateral investments to fund the payment of this liability. Securities lending activity is subject to master netting arrangements.
The following table presents for each lending Fund, the value of the securities on loan with Citibank, net of amounts available for offset under the master netting arrangements and any related collateral received or posted by the Funds as of February 29, 2024.
| Investment Securities
on Loan, at value,
Presented on the
Statements of Assets
and Liabilities | Cash Collateral
Posted by Borrower* | Net Amount Due
to Counterparty
(not less than zero) |
| | | |
|
| Collateral posted reflects the value of securities on loan and does not include any additional amounts received from the borrower. |
Securities lending also involves counterparty risks, including the risk that the loaned securities may not be returned in a timely manner or at all. Subject to certain conditions, Citibank has agreed to indemnify the Funds from losses resulting from a borrower’s failure to return a loaned security.
JPMIM voluntarily waived management fees charged to the Funds to reduce the impact of the cash collateral investment in the JPMorgan U.S. Government Money Market Fund from 0.13% to 0.06%. For the year ended February 29, 2024, JPMIM waived fees associated with the Funds' investment in the JPMorgan U.S. Government Money Market Fund as follows:
Short Duration Core Plus ETF | |
| |
The above waiver is included in the determination of earnings on cash collateral investment and in the calculation of Citibank’s compensation and is included on the Statements of Operations as Income from securities lending (net).
Active Bond ETF, Core Plus Bond ETF, Income ETF, International Bond Opportunities ETF, Municipal ETF, Short Duration Core Plus ETF and Ultra-Short Municipal Income ETF did not lend out any securities during the year ended February 29, 2024.
NOTES TO FINANCIAL STATEMENTSAS OF February 29, 2024 (continued)
G. Investment Transactions with Affiliates— The Funds invested in Underlying Funds advised by the Adviser. An issuer which is under common control with a Fund may be considered an affiliate. For the purposes of the financial statements, the Funds assume the issuers listed in the tables below to be affiliated issuers. The Underlying Funds’ distributions may be reinvested into such Underlying Funds. Reinvestment amounts are included in the purchases at cost amounts in the tables below.
|
For the period ended February 29, 2024 |
| Value at
October 11,
2023(a) | | | | Change in
Unrealized
Appreciation/
(Depreciation) | | Shares at
February 29,
2024 | | Capital Gain
Distributions |
JPMorgan U.S. Government Money Market Fund Class IM Shares, 5.25% (b) (c) | | | | | | | | | |
|
| Commencement of operations was October 11, 2023. |
| Investment in an affiliated fund, which is registered under the Investment Company Act of 1940, as amended, and is advised by J.P. Morgan Investment Management Inc. |
| The rate shown is the current yield as of February 29, 2024. |
|
For the year ended February 29, 2024 |
| | | | | Change in
Unrealized
Appreciation/
(Depreciation) | | Shares at
February 29,
2024 | | Capital Gain
Distributions |
JPMorgan U.S. Government Money Market Fund Class IM Shares, 5.25% (a) (b) | | | | | | | | | |
|
| Investment in an affiliated fund, which is registered under the Investment Company Act of 1940, as amended, and is advised by J.P. Morgan Investment Management Inc. |
| The rate shown is the current yield as of February 29, 2024. |
|
For the year ended February 29, 2024 |
| | | | | Change in
Unrealized
Appreciation/
(Depreciation) | | Shares at
February 29,
2024 | | Capital Gain
Distributions |
JPMorgan Prime Money Market Fund Class IM Shares, 5.44% (a) (b) | | | | | | | | | |
|
| Investment in an affiliated fund, which is registered under the Investment Company Act of 1940, as amended, and is advised by J.P. Morgan Investment Management Inc. |
| The rate shown is the current yield as of February 29, 2024. |
International Bond Opportunities ETF |
For the year ended February 29, 2024 |
| | | | | Change in
Unrealized
Appreciation/
(Depreciation) | | Shares at
February 29,
2024 | | Capital Gain
Distributions |
JPMorgan U.S. Government Money Market Fund Class IM Shares, 5.25% (a) (b) | | | | | | | | | |
|
| Investment in an affiliated fund, which is registered under the Investment Company Act of 1940, as amended, and is advised by J.P. Morgan Investment Management Inc. |
| The rate shown is the current yield as of February 29, 2024. |
|
For the year ended February 29, 2024 |
| | | | | Change in
Unrealized
Appreciation/
(Depreciation) | | Shares at
February 29,
2024 | | Capital Gain
Distributions |
JPMorgan Institutional Tax Free Money Market Fund Class IM Shares, 3.37% (a) (b) | | | | | | | | | |
|
| Investment in an affiliated fund, which is registered under the Investment Company Act of 1940, as amended, and is advised by J.P. Morgan Investment Management Inc. |
| The rate shown is the current yield as of February 29, 2024. |
Short Duration Core Plus ETF |
For the year ended February 29, 2024 |
| | | | | Change in
Unrealized
Appreciation/
(Depreciation) | | Shares at
February 29,
2024 | | Capital Gain
Distributions |
JPMorgan Prime Money Market Fund Class IM Shares, 5.44% (a) (b) | | | | | | | | | |
JPMorgan U.S. Government Money Market Fund Class IM Shares, 5.25% (a) (b) | | | | | | | | | |
| | | | | | | | | |
|
| Investment in an affiliated fund, which is registered under the Investment Company Act of 1940, as amended, and is advised by J.P. Morgan Investment Management Inc. |
| The rate shown is the current yield as of February 29, 2024. |
| Amount is included on the Statements of Operations as Income from securities lending (net) (after payments of rebates and Citibank’s fee). |
NOTES TO FINANCIAL STATEMENTSAS OF February 29, 2024 (continued)
|
For the year ended February 29, 2024 |
| | | | | Change in
Unrealized
Appreciation/
(Depreciation) | | Shares at
February 29,
2024 | | Capital Gain
Distributions |
JPMorgan Securities Lending Money Market Fund Agency SL Class Shares, 5.48% (a) (b) | | | | | | | | | |
JPMorgan U.S. Government Money Market Fund Class IM Shares, 5.25% (a) (b) | | | | | | | | | |
JPMorgan U.S. Government Money Market Fund Class IM Shares, 5.25% (a) (b) | | | | | | | | | |
| | | | | | | | | |
|
| Investment in an affiliated fund, which is registered under the Investment Company Act of 1940, as amended, and is advised by J.P. Morgan Investment Management Inc. |
| The rate shown is the current yield as of February 29, 2024. |
| Amount is included on the Statements of Operations as Income from securities lending (net) (after payments of rebates and Citibank’s fee). |
Ultra-Short Municipal Income ETF |
For the year ended February 29, 2024 |
| | | | | Change in
Unrealized
Appreciation/
(Depreciation) | | Shares at
February 29,
2024 | | Capital Gain
Distributions |
JPMorgan Institutional Tax Free Money Market Fund Class IM Shares, 3.37% (a) (b) | | | | | | | | | |
|
| Investment in an affiliated fund, which is registered under the Investment Company Act of 1940, as amended, and is advised by J.P. Morgan Investment Management Inc. |
| The rate shown is the current yield as of February 29, 2024. |
H. Foreign Currency Translation — The books and records of the Funds are maintained in U.S. dollars. Foreign currency amounts are translated into U.S. dollars at the prevailing exchange rates of such currencies against the U.S. dollar. The market value of investment securities and other assets and liabilities are translated at the exchange rate as of the valuation date. Purchases and sales of investment securities, income and expenses are translated at the exchange rate prevailing on the respective dates of such transactions.
The Funds do not isolate the effect of changes in foreign exchange rates from changes in market prices on securities held. Accordingly, such changes are included within Change in net unrealized appreciation/depreciation on investments in non-affiliates on the Statements of Operations.
Reported realized foreign currency gains and losses arise from the disposition of foreign currency, currency gains or losses realized between the trade and settlement dates on securities transactions, and the difference between the amounts of dividends, interest and foreign withholding taxes recorded on each Fund's books on the transaction date and the U.S. dollar equivalent of the amounts actually received or paid. These reported realized foreign currency gains and losses are included in Net realized gain (loss) on foreign currency transactions on the Statements of Operations. Unrealized foreign currency gains and losses arise from changes (due to changes in exchange rates) in the value of foreign currency and other assets and liabilities denominated in foreign currencies, which are held at year end and are included in Change in net unrealized appreciation/depreciation on foreign currency translations on the Statements of Operations.
I. Derivatives —The Funds used derivative instruments including futures contracts, forward foreign currency exchange contracts and swaps, in connection with their respective investment strategy. Derivative instruments may be used as substitutes for securities in which the Funds can invest, to hedge portfolio investments or to generate income or gain to the Funds. Derivatives may also be used to manage duration, sector and yield curve exposures and credit and spread volatility.
The Funds may be subject to various risks from the use of derivatives, including the risk that changes in the value of a derivative may not correlate perfectly with the underlying asset, rate or index; counterparty credit risk related to derivatives counterparties’ failure to perform under contract terms; liquidity risk related to the potential lack of a liquid market for these contracts allowing the Funds to close out their position(s); and documentation risk relating to disagreement over contract terms. Investing in certain derivatives also results in a form of leverage and as such, the Funds' risk of loss associated with these instruments may exceed their value, as recorded on the Statements of Assets and Liabilities.
The Funds are party to various derivative contracts governed by International Swaps and Derivatives Association master agreements (“ISDA agreements”). The Funds' ISDA agreements, which are separately negotiated with each dealer counterparty, may contain provisions allowing, absent other considerations, a counterparty to exercise rights, to the extent not otherwise waived, against the Funds in the event the Funds' net assets decline over time by a pre-determined percentage or fall below a pre-determined floor. The ISDA agreements may also contain provisions allowing, absent other conditions, the Funds to exercise rights, to the extent not otherwise waived, against a counterparty (e.g., decline in a counterparty’s credit rating below a specified level). Such rights for both a counterparty and the Funds often include the ability to terminate (i.e., close out) open contracts at prices which may favor a counterparty, which could have an adverse effect on the Funds. The ISDA agreements give the Funds and a counterparty the right, upon an event of default, to close out all transactions traded under such agreements and to net amounts owed or due across all transactions and offset such net payable or receivable against collateral posted to a segregated account by one party for the benefit of the other.
Counterparty credit risk may be mitigated to the extent a counterparty posts additional collateral for mark-to-market gains to the Funds.
Notes I(1) — I(3) below describe the various derivatives used by the Funds.
(1) Futures Contracts— The Funds used treasury futures contracts to manage and hedge interest rate risk associated with portfolio investments. The Funds also purchased futures contracts to invest incoming cash in the market or sold futures in response to cash outflows, thereby simulating an invested position in the underlying index while maintaining a cash balance for liquidity.
Futures contracts provide for the delayed delivery of the underlying instrument at a fixed price or are settled for a cash amount based on the change in the value of the underlying instrument at a specific date in the future. Upon entering into a futures contract, the Funds are required to deposit with the broker, cash or securities in an amount equal to a certain percentage of the contract amount, which is referred to as the initial margin deposit. Subsequent payments, referred to as variation margin, are made or received by the Funds periodically and are based on changes in the market value of open futures contracts. Changes in the market value of open futures contracts are recorded as Change in net unrealized appreciation/depreciation on futures contracts on the Statements of Operations. Realized gains or losses, representing the difference between the value of the contract at the time it was opened and the value at the time it was closed, are reported on the Statements of Operations at the closing or expiration of the futures contract. Securities deposited as initial margin are designated on the SOIs, while cash deposited, which is considered restricted, is recorded on the Statements of Assets and Liabilities. A receivable from and/or a payable to brokers for the daily variation margin is also recorded on the Statements of Assets and Liabilities.
The use of futures contracts exposes the Funds to interest rate risk. The Funds may be subject to the risk that the change in the value of the futures contract may not correlate perfectly with the underlying instrument. Use of long futures contracts subjects the Funds to risk of loss in excess of the amounts shown on the Statements of Assets and Liabilities, up to the notional amount of the futures contracts. Use of short futures contracts subjects the Funds to unlimited risk of loss. The Funds may enter into futures contracts only on exchanges or boards of trade. The exchange or board of trade acts as the counterparty to each futures transaction; therefore, the Funds' credit risk is limited to failure of the exchange or board of trade. Under some circumstances, futures exchanges may establish daily limits on the amount that the price of a futures contract can vary from the previous day’s settlement price, which could effectively prevent liquidation of positions.
NOTES TO FINANCIAL STATEMENTSAS OF February 29, 2024 (continued)
The Funds' futures contracts are not subject to master netting arrangements (the right to close out all transactions traded with a counterparty and net amounts owed or due across transactions).
(2) Forward Foreign Currency Exchange Contracts— Core Plus Bond ETF, Income ETF, International Bond Opportunities ETF and Short Duration Core Plus ETF are exposed to foreign currency risks associated with some or all of their portfolio investments and used forward foreign currency exchange contracts to hedge or manage certain of these exposures as part of an investment strategy. The Funds also bought forward foreign currency exchange contracts to gain exposure to currencies. Forward foreign currency exchange contracts represent obligations to purchase or sell foreign currency on a specified future date at a price fixed at the time the contracts are entered into. Non-deliverable forward foreign currency exchange contracts are settled with the counterparty in U.S. dollars without the delivery of the foreign currency.
The values of the forward foreign currency exchange contracts are adjusted daily based on the applicable exchange rate of the underlying currency. Changes in the value of these contracts are recorded as unrealized appreciation or depreciation until the contract settlement date. When the forward foreign currency exchange contract is closed, the Funds record a realized gain or loss equal to the difference between the value at the time the contract was opened and the value at the time it was closed. The Funds also record a realized gain or loss, upon settlement, when a forward foreign currency exchange contract offsets another forward foreign currency exchange contract with the same counterparty.
The Funds' forward foreign currency exchange contracts are subject to master netting arrangements (the right to close out all transactions with a counterparty and net amounts owed or due across transactions).
The Funds may be required to post or receive collateral for non-deliverable forward foreign currency exchange contracts.
(3) Swaps — Core Plus Bond ETF, Income ETF, International Bond Opportunities ETF, Municipal ETF and Short Duration Core Plus ETF engaged in various swap transactions, to manage credit and interest rate (e.g., duration, yield curve) risks within their respective portfolios. The Funds also used swaps as alternatives to direct investments. Swap transactions are contracts negotiated over-the-counter (“OTC swaps”) between a fund and a counterparty or are centrally cleared (“centrally cleared swaps”) through a central clearinghouse managed by a Futures Commission Merchant (“FCM”) that exchange investment cash flows, assets, foreign currencies or market-linked returns at specified, future intervals.
Upfront payments made and/or received by the Funds are recorded as assets or liabilities, respectively, on the Statements of Assets and Liabilities and amortized over the term of the swap. The value of an OTC swap agreement is recorded as either an asset or a liability on the Statements of Assets and Liabilities at the beginning of the measurement period. Upon entering into a centrally cleared swap, the Funds are required to deposit with the FCM cash or securities, which is referred to as initial margin deposit. Securities deposited as initial margin are designated on the Schedule of Portfolio Investments, while cash deposited, which is considered restricted, is reported as Deposits at broker for centrally cleared swaps on the Statements of Assets and Liabilities. Daily changes in valuation of centrally cleared swaps, if any, are recorded as a variation margin receivable or payable on the Statements of Assets and Liabilities. The change in the value of swaps, including accruals of periodic amounts of interest to be paid or received on swaps, is reported as Change in net unrealized appreciation/depreciation on swaps on the Statements of Operations. A realized gain or loss is recorded upon payment or receipt of a periodic payment or payment made upon termination of a swap agreement.
The central clearinghouse acts as the counterparty to each centrally cleared swap transaction; therefore credit risk is limited to the failure of the clearinghouse.
The Funds’ OTC swap contracts are subject to master netting arrangements.
Credit Default Swaps
Core Plus Bond ETF, Income ETF, International Bond Opportunities ETF, Municipal ETF and Short Duration Core Plus ETF entered into credit default swaps to simulate long and/or short bond positions or to take an active long and/or short position with respect to the likelihood of a default or credit event by the issuer of the underlying reference obligation.
The underlying reference obligation may be a single issuer of corporate or sovereign debt, a basket of issuers or a credit index. A credit index is a list of credit instruments or exposures that reference a fixed number of obligors with shared characteristics that represents some part of the credit market as a whole. Index credit default swaps have standardized terms including a fixed spread and standard maturity dates. The composition of the obligations within a particular index changes periodically.
Credit default swaps involve one party, the protection buyer, making a stream of payments to another party, the protection seller, in exchange for the right to receive a contingent payment if there is a credit event related to the underlying reference obligation. In the event that the reference obligation matures prior to the termination date of the contract, a similar security will be substituted for the duration of the contract term. Credit events are defined under individual swap agreements and generally include bankruptcy, failure to pay, restructuring, repudiation/moratorium, obligation acceleration and obligation default.
If a credit event occurs, the Funds, as protection sellers, would be obligated to make a payment, which may be either: (i) a net cash settlement equal to the notional amount of the swap less the auction value of the reference obligation or (ii) the notional amount of the swap in exchange for the delivery of the reference obligation. Selling protection effectively adds leverage to the Funds' portfolio up to the notional amount of swap agreements. The notional amount represents the maximum potential liability under a contract and is not reflected on the Statements of Assets and
Liabilities. Potential liabilities under these contracts may be reduced by: the auction rates of the underlying reference obligations; upfront payments received at the inception of a swap; and net amounts received from credit default swaps purchased with the identical reference obligation.
Interest Rate Swaps
International Bond Opportunities ETF entered into interest rate swap contracts to manage fund exposure to interest rates or to either preserve or generate a return on a particular investment or portion of its portfolio. These are agreements between counterparties to exchange periodic interest payments based on interest rates. One cash flow stream will typically be a floating rate payment based upon a specified interest rate, while the other is typically based on a fixed interest rate.
(4) Summary of Derivatives Information—The following tables present the value of derivatives held as of February 29, 2024, by their primary underlying risk exposure and respective location on the Statements of Assets and Liabilities:
| | | | International
Bond
Opportunities
ETF | | Short
Duration
Core Plus
ETF | |
Foreign Exchange Rate Risk Exposure: | | | | | | | |
Unrealized Appreciation on Forward Foreign Currency Exchange Contracts | | | | | | | |
Unrealized Depreciation on Forward Foreign Currency Exchange Contracts | | | | | | | |
Interest Rate Risk Exposure: | | | | | | | |
Unrealized Appreciation on Futures Contracts * | | | | | | | |
Swaps at Value (Assets) ** | | | | | | | |
Unrealized Depreciation on Futures Contracts * | | | | | | | |
Swaps at Value (Liabilities) ** | | | | | | | |
| | | | | | | |
Swaps at Value (Assets) ** | | | | | | | |
Swaps at Value (Liabilities) ** | | | | | | | |
Net Fair Value of Derivative Contracts: | | | | | | | |
Unrealized Appreciation (Depreciation) on Futures Contracts * | | | | | | | |
| | | | | | | |
Unrealized Appreciation (Depreciation) on Forward Foreign Currency Exchange Contracts | | | | | | | |
|
| Includes cumulative appreciation/(depreciation) on futures contracts, if any, as reported on the SOIs. Only current day’s variation margin is reported within the Statements of Assets and Liabilities. |
| Includes the fair value of centrally cleared swap contracts as reported on the SOIs. Only current day’s variation margin is reported within the Statements of Assets and Liabilities. |
NOTES TO FINANCIAL STATEMENTSAS OF February 29, 2024 (continued)
The following tables present the effect of derivatives on the Statements of Operations for the year ended February 29, 2024, by primary underlying risk exposure:
| | | | International
Bond
Opportunities
ETF | |
Realized Gain (Loss) on Derivatives Recognized as a Result From Operations: |
Foreign Exchange Rate Risk Exposure: |
Forward Foreign Currency Exchange Contracts | | | | | |
Interest Rate Risk Exposure: |
| | | | | |
| | | | | |
|
| | | | | |
Net Change in Unrealized Appreciation (Depreciation) on Derivatives Recognized as a Result of Operations: |
Foreign Exchange Rate Risk Exposure: |
Forward Foreign Currency Exchange Contracts | | | | | |
Interest Rate Risk Exposure: |
| | | | | |
| | | | | |
|
| | | | | |
| Short
Duration
Core Plus
ETF | | Ultra-Short
Municipal
Income ETF |
Realized Gain (Loss) on Derivatives Recognized as a Result From Operations: |
Foreign Exchange Rate Risk Exposure: |
Forward Foreign Currency Exchange Contracts | | | |
Interest Rate Risk Exposure: |
| | | |
|
| | | |
Net Change in Unrealized Appreciation (Depreciation) on Derivatives Recognized as a Result of Operations: |
Interest Rate Risk Exposure: |
| | | |
|
| | | |
Derivatives Volume
The table below discloses the volume of the Funds' futures contracts, forward foreign currency exchange contracts and swaps activity during the year ended February 29, 2024. Please refer to the tables in the Summary of Derivatives Information for derivative-related gains and losses associated with volume activity:
| | | | International
Bond
Opportunities
ETF |
| | | | |
Average Notional Balance Long | | | | |
Average Notional Balance Short | | | | |
Ending Notional Balance Long | | | | |
Ending Notional Balance Short | | | | |
Forward Foreign Currency Exchange Contracts: | | | | |
Average Settlement Value Purchased | | | | |
Average Settlement Value Sold | | | | |
Ending Settlement Value Purchased | | | | |
Ending Settlement Value Sold | | | | |
Interest Rate-Related Swaps : | | | | |
Average Notional Balance - Pays Fixed Rate | | | | |
Average Notional Balance - Receives Fixed Rate | | | | |
Ending Notional Balance - Pays Fixed Rate | | | | |
Ending Notional Balance - Receives Fixed Rate | | | | |
| | | | |
Average Notional Balance - Buy Protection | | | | |
Average Notional Balance - Sell Protection | | | | |
Ending Notional Balance - Buy Protection | | | | |
Ending Notional Balance - Sell Protection | | | | |
|
| For the period October 11, 2023 through February 29, 2024. |
| | Short
Duration
Core Plus
ETF | | Ultra-Short
Municipal
Income ETF |
| | | | |
Average Notional Balance Long | | | | |
Average Notional Balance Short | | | | |
Ending Notional Balance Long | | | | |
Ending Notional Balance Short | | | | |
Forward Foreign Currency Exchange Contracts: | | | | |
Average Settlement Value Purchased | | | | |
Average Settlement Value Sold | | | | |
| | | | |
Average Notional Balance - Buy Protection | | | | |
Average Notional Balance - Sell Protection | | | | |
Ending Notional Balance - Sell Protection | | | | |
The Funds may be required to post or receive collateral based on the net value of the Funds’ outstanding non-deliverable forward foreign currency exchange contracts and/or OTC swap contracts with the counterparty in the form of cash or securities. Daily movement of cash collateral is subject to minimum threshold amounts. Collateral posted by the Funds is held in a segregated account at the Funds’ custodian bank. For certain counterparties cash collateral posted by the Funds is invested in an affiliated money market fund (See Note 3.E), otherwise the cash collateral is included on the Statements of Assets and Liabilities as Restricted cash for OTC derivatives. Collateral received by the Funds is held in a separate segregated account maintained by JPMCB, an affiliate of the Funds.
NOTES TO FINANCIAL STATEMENTSAS OF February 29, 2024 (continued)
International Bond Opportunities ETF’s derivative contracts collateral requirements and collateral posted or received by counterparty as of February 29, 2024 are as follows:
| | | | |
International Bond Opportunities ETF | | Merrill Lynch International | | |
The Funds' derivatives contracts held at February 29, 2024 are not accounted for as hedging instruments under GAAP.
J. Security Transactions and Investment Income— Investment transactions are accounted for on the trade date (the date the order to buy or sell is executed). Securities gains and losses are calculated on a specifically identified cost basis.
Interest income is determined on the basis of coupon interest accrued using the effective interest method, which adjusts for amortization of premiums and accretion of discounts.
Dividend income, net of foreign taxes withheld, if any, is recorded on the ex-dividend date or when a Fund first learns of the dividend.
To the extent such information is publicly available, the Funds record distributions received in excess of income earned from underlying investments as a reduction of cost of investments and/or realized gain. Such amounts are based on estimates if actual amounts are not available and actual amounts of income, realized gain and return of capital may differ from the estimated amounts. The Funds adjust the estimated amounts of the components of distributions (and consequently their net investment income) as necessary, once the issuers provide information about the actual composition of the distributions.
K. Federal Income Taxes— Each Fund is treated as a separate taxable entity for Federal income tax purposes. Each Fund has elected to have a tax year of the end of February except Active Bond ETF, which is expected to elect a tax year of September 30th. Each Fund's policy is to comply with the provisions of the Internal Revenue Code (the “Code”) applicable to regulated investment companies and to distribute to shareholders all of its distributable net investment income and net realized capital gains on investments. Accordingly, no provision for Federal income tax is necessary. Management has reviewed the Funds' tax positions for all open tax years and has determined that as of February 29, 2024, no liability for Federal income tax is required in the Funds' financial statements for net unrecognized tax benefits. However, management’s conclusions may be subject to future review based on changes in, or the interpretation of, the accounting standards or tax laws and regulations. Each Fund's Federal tax returns for the prior three fiscal years, or since inception if shorter, remain subject to examination by the Internal Revenue Service.
L. Foreign Taxes—The Funds may be subject to foreign taxes on income, gains on investments or currency purchases/repatriation, a portion of which may be recoverable. The Funds will accrue such taxes and recoveries as applicable, based upon their current interpretation of tax rules and regulations that exist in the markets in which they invest. When a capital gains tax is determined to apply, the Funds record an estimated deferred tax liability in an amount that would be payable if the securities were disposed of on the valuation date.
M. Distributions to Shareholders— Distributions from net investment income, if any, are generally declared monthly and paid at least monthly and are declared separately for each class. Net realized capital gains, if any, are distributed by each Fund at least annually. The amount of distributions from net investment income and net realized capital gains is determined in accordance with Federal income tax regulations, which may differ from GAAP. To the extent these “book/tax” differences are permanent in nature (i.e., that they result from other than timing of recognition — “temporary differences”), such amounts are reclassified within the capital accounts based on their Federal tax basis treatment.
The following amounts were reclassified within the capital accounts:
| | Accumulated
undistributed
(distributions in
excess of)
net investment
income | Accumulated
net realized
gains (losses) |
| | | |
| | | |
International Bond Opportunities ETF | | | |
| | | |
Short Duration Core Plus ETF | | | |
| | | |
Ultra-Short Municipal Income ETF | | | |
The reclassifications for the Funds relate primarily to foreign currency gains or losses and tax adjustments on certain investments.
3. Fees and Other Transactions with Affiliates
A. Management Fee—JPMIM manages the investments of each Fund pursuant to a Management Agreement. For such services, JPMIM is paid a fee which is accrued daily and paid no more frequently than monthly based on each Fund's respective average daily net assets at the following rate:
| |
| |
| |
| |
International Bond Opportunities ETF | |
| |
Short Duration Core Plus ETF | |
| |
Ultra-Short Municipal Income ETF | |
Under each Management Agreement, JPMIM is responsible for substantially all expenses of each Fund, (including expenses of the Trust relating to each Fund), except for the management fees, payments under the Funds' 12b-1 plan (if any), interest expenses, dividend and interest expenses related to short sales, taxes, acquired fund fees and expenses (other than fees for funds advised by the Adviser and/or its affiliates), costs of holding shareholder meetings, and litigation and potential litigation and other extraordinary expenses not incurred in the ordinary course of each Fund’s business. Additionally, each Fund is responsible for its non-operating expenses, including brokerage commissions and fees and expenses associated with each Fund’s securities lending program, if applicable. For the avoidance of doubt, the Adviser’s payment of such expenses may be accomplished through a Fund’s payment of such expenses and a corresponding reduction in the fee payable to the Adviser, provided, however, that if the amount of expenses paid by a Fund exceeds the fee payable to the Adviser, the Adviser will reimburse that Fund for such amount.
B. Administration Fee— JPMIM provides administration services to the Funds. Pursuant to each Management Agreement, JPMIM is compensated as described in Note 3.A.
JPMCB serves as the Funds' sub-administrator (the “Sub-administrator”). For its services as Sub-administrator, JPMCB receives a portion of the management fees payable to JPMIM.
C. Custodian, Accounting and Transfer Agent Fees— JPMCB provides custody, accounting and transfer agency services to the Funds. For performing these services, JPMIM pays JPMCB transaction and asset-based fees that vary according to the number of transactions and positions, plus out-of-pocket expenses.
Additionally, Authorized Participants generally pay transaction fees associated with the creation and redemption of Fund shares. These fees are paid to JPMIM to offset certain custodian charges that are covered by each Management Agreement.
Interest income earned on cash balances at the custodian, if any, is included in Interest income from affiliates on the Statements of Operations.
Interest expense paid to the custodian related to cash overdrafts, if any, is included in Interest expense to affiliates on the Statements of Operations.
D. Distribution Services— The Distributor or its agent distributes Creation Units for each Fund on an agency basis. The Distributor does not maintain a secondary market in shares of each Fund. JPMDS receives no fees for their distribution services under the distribution agreement with the Trust (the “Distribution Agreement”). Although the Trust does not pay any fees under the Distribution Agreement, JPMIM pays JPMDS for certain distribution related services.
E. Waivers and Reimbursements— The Funds may invest in one or more money market funds advised by the Adviser (affiliated money market funds). The fees for the affiliated money market funds, except for investments of securities lending cash collateral, are covered under each Management Agreement as described in Note 3.A.
F. Other — Certain officers of the Trust are affiliated with the Adviser, the Administrator and JPMDS. Such officers receive no compensation from the Funds for serving in their respective roles.
The Board designated and appointed a Chief Compliance Officer to the Funds pursuant to Rule 38a-1 under the 1940 Act. The fees associated with the office of the Chief Compliance Officer are paid for by JPMIM as described in Note 3.A.
During the year ended February 29, 2024, the Funds purchased securities from an underwriting syndicate in which the principal underwriter or members of the syndicate were affiliated with the Adviser.
The Securities and Exchange Commission (“SEC”) has granted an exemptive order permitting the Funds to engage in principal transactions with J.P. Morgan Securities LLC, an affiliated broker, involving taxable money market instruments, subject to certain conditions.
NOTES TO FINANCIAL STATEMENTSAS OF February 29, 2024 (continued)
4. Investment Transactions
During the year ended February 29, 2024, purchases and sales of investments (excluding short-term investments) were as follows:
| Purchases
(excluding
U.S. Government) | Sales
(excluding
U.S. Government) | Purchases
of U.S.
Government | |
| | | | |
| | | | |
| | | | |
International Bond Opportunities ETF | | | | |
| | | | |
Short Duration Core Plus ETF | | | | |
| | | | |
Ultra-Short Municipal Income ETF | | | | |
For the year ended February 29, 2024, in-kind transactions associated with creations and redemptions were as follows:
5. Federal Income Tax Matters
For Federal income tax purposes, the estimated cost and unrealized appreciation (depreciation) in value of investments held at February 29, 2024 were as follows:
| | Gross
Unrealized
Appreciation | Gross
Unrealized
Depreciation | Net Unrealized
Appreciation
(Depreciation) |
| | | | |
| | | | |
| | | | |
International Bond Opportunities ETF | | | | |
| | | | |
Short Duration Core Plus ETF | | | | |
| | | | |
Ultra-Short Municipal Income ETF | | | | |
|
| The Fund has an expected tax year end of September 30. The cost of investment securities and components of net assets on a tax basis presented have been estimated as of February 29, 2024, the Fund’s fiscal year end. The actual cost of investment securities and components of net assets on a tax basis will be different as of the Fund’s tax year end. The Fund’s required distributions will be determined by the net investment income and net realized gain or loss for the expected tax year end of September 30. |
The difference between book and tax basis appreciation (depreciation) on investments is primarily attributed to tax adjustments on certain derivatives and investments and foreign currency gains or losses.
The tax character of distributions paid during the year ended February 29, 2024 was as follows:
| | | |
| | | |
| | | |
| | | |
International Bond Opportunities ETF | | | |
| | | |
Short Duration Core Plus ETF | | | |
| | | |
Ultra-Short Municipal Income ETF | | | |
|
| Short-term gain distributions are treated as ordinary income for income tax purposes. |
| The Fund has an expected tax year end of September 30. The cost of investment securities and components of net assets on a tax basis presented have been estimated as of February 29, 2024, the Fund’s fiscal year end. The actual cost of investment securities and components of net assets on a tax basis will be different as of the Fund’s tax year end. The Fund’s required distributions will be determined by the net investment income and net realized gain or loss for the expected tax year end of September 30. |
The tax character of distributions paid during the year ended February 28, 2023 was as follows:
| | Net
Long-Term
Capital Gains | | |
| | | | |
| | | | |
International Bond Opportunities ETF | | | | |
| | | | |
Short Duration Core Plus ETF | | | | |
| | | | |
Ultra-Short Municipal Income ETF | | | | |
|
| Short-term gain distributions are treated as ordinary income for income tax purposes. |
NOTES TO FINANCIAL STATEMENTSAS OF February 29, 2024 (continued)
As of February 29, 2024, the estimated components of net assets (excluding paid-in-capital) on a tax basis were as follows:
| Current
Distributable
Ordinary
Income | Current
Distributable
Long-Term
Capital Gain
(Tax Basis Capital
Loss Carryover) | | Unrealized
Appreciation
(Depreciation) |
| | | | |
| | | | |
| | | | |
International Bond Opportunities ETF | | | | |
| | | | |
Short Duration Core Plus ETF | | | | |
| | | | |
Ultra-Short Municipal Income ETF | | | | |
|
| The Fund has an expected tax year end of September 30. The cost of investment securities and components of net assets on a tax basis presented have been estimated as of February 29, 2024, the Fund’s fiscal year end. The actual cost of investment securities and components of net assets on a tax basis will be different as of the Fund’s tax year end. The Fund’s required distributions will be determined by the net investment income and net realized gain or loss for the expected tax year end of September 30. |
The cumulative timing differences primarily consist of post-October capital loss deferrals and tax adjustments on certain investments.
At February 29, 2024, the following Funds had net capital loss carryforwards which are available to offset future realized gains as follows:
| Capital Loss Carryforward Character |
| | |
| | |
| | |
International Bond Opportunities ETF | | |
| | |
Short Duration Core Plus ETF | | |
| | |
Ultra-Short Municipal Income ETF | | |
Net capital losses (gains) and specified ordinary losses incurred after October 31, and within the taxable year are deemed to arise on the first business day of the Funds' next taxable year. For the year ended February 29, 2024, the Funds deferred to March 1, 2024 the following net capital losses (gains) of:
| Net Capital Losses (Gains) | |
| | |
| | | |
International Bond Opportunities ETF | | | |
| | | |
Short Duration Core Plus ETF | | | |
| | | |
Ultra-Short Municipal Income ETF | | | |
6. Capital Share Transactions
The Trust issues and redeems shares of the Funds only in Creation Units through the Distributor at NAV. Capital shares transactions detail can be found in the Statements of Changes in Net Assets.
Shares of the Funds may only be purchased or redeemed by Authorized Participants. Such Authorized Participants may from time to time hold, of record or beneficially, a substantial percentage of the Funds' shares outstanding and act as executing or clearing broker for investment transactions
on behalf of the Funds. An Authorized Participant is either (1) a “Participating Party” or other participant in the clearing process through the Continuous Net Settlement System of the National Securities Clearing Corporation (“NSCC”); or (2) a DTC Participant; which, in either case, must have executed an agreement with the Distributor.
Creation Units of a Fund may be created in advance of receipt by the Trust of all or a portion of the applicable basket of fixed income securities and other instruments (“Deposit Instruments”) and cash as described in the Funds’ registration statement. In these instances, the initial Deposit Instruments and cash must be deposited in an amount equal to the sum of the cash amount, plus at least 105%, for the Funds, of the market value of undelivered Deposit Instruments. A transaction fee may be imposed to offset transfer and other transaction costs associated with the purchase or redemption of Creation Units.
Authorized Participants transacting in Creation Units for cash may also pay a variable fee to compensate the relevant fund for market impact expenses relating to investing in portfolio securities. Such variable fees, if any, are included in “Proceeds from shares issued” in the Statements of Changes in Net Assets.
7. Borrowings
Effective November 1, 2022, the Funds rely upon an exemptive order granted by the SEC (the “Order”) permitting the establishment and operation of an Interfund Lending Facility (the “Facility”). The Facility allows the Funds to directly lend and borrow money to or from any other fund relying upon the Order at rates beneficial to both the borrowing and lending funds. Advances under the Facility are taken primarily for temporary or emergency purposes, including the meeting of redemption requests that otherwise might require the untimely disposition of securities, and are subject to each Fund's borrowing restrictions. The interfund loan rate is determined, as specified in the Order, by averaging the current repurchase agreement rate and the current bank loan rate. The Order was granted to JPMorgan Trust II and may be relied upon by the Funds because the Funds and the series of JPMorgan Trust II are all investment companies in the same “group of investment companies” (as defined in Section 12(d)(1)(G) of the 1940 Act).
The Funds had no borrowings outstanding from another fund, or loans outstanding to another fund, during the year ended February 29, 2024.
The Trust and JPMCB have entered into a financing arrangement. Under this arrangement, JPMCB provides an unsecured, uncommitted credit facility in the aggregate amount of $100 million to certain of the J.P. Morgan Funds, including the Funds. Advances under the arrangement are taken primarily for temporary or emergency purposes, including the meeting of redemption requests that otherwise might require the untimely disposition of securities, and are subject to each Fund's borrowing restrictions. Interest on borrowings is payable at a rate determined by JPMCB at the time of borrowing. This agreement has been extended until October 29, 2024.
The Funds had no borrowings outstanding from the unsecured, uncommitted credit facility during the year ended February 29, 2024.
Effective August 8, 2023, the Trust, excluding Active Bond ETF, along with certain other trusts for J.P. Morgan Funds (“Borrowers”), has entered into an existing joint syndicated senior unsecured revolving credit facility totaling $1.5 billion (“Credit Facility”) with various lenders and The Bank of New York Mellon, as administrative agent for the lenders. Although the Trust is effectively part of the Credit Facility as of August 8, 2023, it is not eligible to draw on the Credit Facility, and will not incur costs associated with being a part of the Credit Facility, until on or about May 28, 2024.
This Credit Facility provides a source of funds to the Borrowers for temporary and emergency purposes, including the meeting of redemption requests that otherwise might require the untimely disposition of securities. Under the terms of the Credit Facility, a borrowing fund must have a minimum of $25 million in adjusted net asset value and not exceed certain adjusted net asset coverage ratios prior to and during the time in which any borrowings are outstanding. If a fund does not comply with the aforementioned requirements, the fund must remediate within three business days with respect to the $25 million minimum adjusted net asset value or within one business day with respect to certain asset coverage ratios or the administrative agent at the request of, or with the consent of, the lenders may terminate the Credit Facility and declare any outstanding borrowings to be due and payable immediately.
Interest associated with any borrowing under the Credit Facility is charged to the borrowing fund at a rate of interest equal to 1.00% (the “Applicable Margin”), plus the greater of the federal funds effective rate or the one-month Adjusted Secured Overnight Financing Rate (“SOFR”). Effective August 8, 2023, the Credit Facility has been amended and restated for a term of 364 days, unless extended.
The Funds did not utilize the Credit Facility during the year ended February 29, 2024.
8. Risks, Concentrations and Indemnifications
In the normal course of business, the Funds enter into contracts that contain a variety of representations which provide general indemnifications. Each Fund's maximum exposure under these arrangements is unknown. The amount of exposure would depend on future claims that may be brought against each Fund. However, based on experience, the Funds expect the risk of loss to be remote.
As of February 29, 2024, the Adviser owned shares representing more than 10% of net assets of the following Funds:
NOTES TO FINANCIAL STATEMENTSAS OF February 29, 2024 (continued)
The Funds are subject to risks associated with securities with contractual cash flows including asset-backed and mortgage-related securities such as collateralized mortgage obligations, mortgage pass-through securities and commercial mortgage-backed securities, including securities backed by sub-prime mortgage loans. The value, liquidity and related income of these securities are sensitive to changes in economic conditions, including real estate value, pre-payments, delinquencies and/or defaults, and may be adversely affected by shifts in the market’s perception of the issuers and changes in interest rates.
International Bond Opportunities ETF’s investments in sovereign and corporate debt obligations within emerging market countries may be subject to potentially higher risks than investments in more developed markets and the prices of such investments may be volatile. The yields of emerging market debt obligations reflect, among other things, perceived credit risk. The consequences of political, social or economic instability in these markets may have disruptive effects on the market prices of the Funds’ investments and the income they generate, as well as the Funds’ ability to repatriate such amounts.
The Funds are subject to interest rate risk. Investments in bonds and other debt securities will change in value based on changes in interest rates. If rates increase, the value of these investments generally declines. Securities with greater interest rate sensitivity and longer maturities generally are subject to greater fluctuations in value. The Funds may face a heightened level of interest rate risk due to certain changes in monetary policy. It is difficult to predict the pace at which central banks or monetary authorities may increase interest rates or the timing, frequency, or magnitude of such increases. Any such changes could be sudden and could expose debt markets to significant volatility and reduced liquidity for Fund investments.
The Funds are subject to credit risk. The Funds' investments are subject to the risk that an issuer and/or a counterparty will fail to make payments when due or default completely. Prices of the Funds' investments may be adversely affected if any of the issuers or counterparties it is invested in are subject to an actual or perceived deterioration in their credit quality. Credit spreads may increase, which may reduce the market values of the Funds' securities. Credit spread risk is the risk that economic and market conditions or any actual or perceived credit deterioration may lead to an increase in the credit spreads (i.e., the difference in yield between two securities of similar maturity but different credit quality) and a decline in price of the issuer’s securities.
Core Plus Bond ETF, Income ETF, International Bond Opportunities ETF and Short Duration Core Plus ETF invest in high yield securities that are not rated or rated below investment grade (commonly known as “junk bonds”). These securities are considered to be high risk investments. Investments in lower-rated securities or unrated securities of comparable quality tend to be more sensitive to economic conditions than higher rated securities. Junk bonds involve a greater risk of default by the issuer because such securities are generally unsecured and are often subordinated to other creditors’ claims. The market price of these securities can change suddenly and unexpectedly. As a result, the Funds are intended for investors who are able and willing to assume a high degree of risk.
International Bond Opportunities ETF may have elements of risk not typically associated with investments in the United States of America due to concentrated investments in a limited number of foreign countries or regions, which may vary throughout the period. Such concentrations may subject each of these Funds to additional risks resulting from political or economic conditions in such countries or regions and the possible imposition of adverse governmental laws or currency exchange restrictions could cause the securities and their markets to be less liquid and their prices to be more volatile than those of comparable U.S. securities.
Derivatives may be riskier than other types of investments because they may be more sensitive to changes in economic and market conditions and could result in losses that significantly exceed the Funds’ original investment. Many derivatives create leverage thereby causing the Funds to be more volatile than they would have been if they had not used derivatives. Derivatives also expose the Funds to counterparty risk (the risk that the derivative counterparty will not fulfill its contractual obligations), including credit risk of the derivative counterparty. The possible lack of a liquid secondary market for derivatives and the resulting inability of the Funds to sell or otherwise close a derivatives position could expose the Funds to losses.
The Funds are also subject to counterparty credit risk, which is the risk that a counterparty fails to perform on agreements with the Funds.
Disruptions to creations and redemptions, the existence of significant market volatility or potential lack of an active trading market for the Shares (including through a trading halt), as well as other factors, may result in Shares trading significantly above (at a premium) or below (at a discount) to the NAV or to the intraday value of the Funds’ holdings. During such periods, investors may incur significant losses if shares are sold.
The Funds may not track the return of their underlying index for a number of reasons and therefore may not achieve their investment objective. For example, the Funds incur a number of operating expenses not applicable to their underlying index, and incur costs in buying and selling securities, especially when rebalancing the Funds’ securities holdings to reflect changes in the composition of the underlying index. In addition, each Fund’s return may differ from the return of its underlying index as a result of, among other things, pricing differences and the inability to purchase certain securities included in the underlying index due to regulatory or other restrictions. To the extent of the previously outlined items, each Fund’s return may differ from the return of the underlying index.
London Interbank Offered Rate ("LIBOR") was a leading floating rate benchmark used in loans, notes, derivatives and other instruments or investments. As a result of benchmark reforms, publication of most LIBOR settings has ceased. Some LIBOR settings continue to be published but only on a temporary, synthetic and non-representative basis. Regulated entities have generally ceased entering into new LIBOR contracts in connection with regulatory guidance or prohibitions. Public and private sector actors have worked to establish alternative reference rates to be used in place of
LIBOR. There is no assurance that any such alternative reference rate will be similar to or produce the same value or economic equivalence as LIBOR or that it will have the same volume or liquidity as did LIBOR which may affect the value, volatility, liquidity or return on certain of the Funds' loans, notes, derivatives and other instruments or investments comprising some or all of the Funds' investments and result in costs incurred in connection with changing reference rates used for positions, closing out positions and entering into new trades. Certain of the Funds' investments may have transitioned from LIBOR or will transition from LIBOR in the future. The transition from LIBOR to alternative reference rates may result in operational issues for the Funds or their investments. No assurances can be given as to the impact of the LIBOR transition (and the timing of any such impact) on the Funds and their investments.
The Funds, excluding Municipal ETF and Ultra-Short Municipal Income ETF, invest in foreign issuers and foreign securities (including depositary receipts) that are subject to additional risks, including political and economic risks, civil conflicts and war, greater volatility, expropriation and nationalization risks, sanctions or other measures by the United States or other governments, currency fluctuations, higher transaction costs, delayed settlement, possible foreign controls on investment, liquidity risks and less stringent investor protection and disclosure standards of foreign markets. In certain markets where securities and other instruments are not traded “delivery versus payment,” a Fund may not receive timely payment for securities or other instruments it has delivered or receive delivery of securities paid for and may be subject to increased risk that the counterparty will fail to make payments or delivery when due or default completely.
Events and evolving conditions in certain economies or markets may alter the risks associated with investments tied to countries or regions that historically were perceived as comparatively stable becoming riskier and more volatile.
The Funds are subject to infectious disease epidemics/pandemics risk. For example, the outbreak of COVID-19 negatively affected economies, markets and individual companies throughout the world, including those in which the Funds invest. The effects of any future pandemic or other global event to business and market conditions may have a significant negative impact on the performance of a Fund's investments, increase a Fund's volatility, exacerbate other pre-existing political, social and economic risks to the Funds and negatively impact broad segments of businesses and populations. In addition, governments, their regulatory agencies, or self-regulatory organizations have taken or may take actions in response to a pandemic or other global event that affect the instruments in which the Funds invest, or the issuers of such instruments, in ways that could have a significant negative impact on a Fund’s investment performance. The ultimate impact of any pandemic or other global event and the extent to which the associated conditions and governmental responses impact a Fund will also depend on future developments, which are highly uncertain, difficult to accurately predict and subject to frequent changes.
The Funds invest in foreign issuers and foreign securities (including depositary receipts) that are subject to additional risks, including political and economic risks, civil conflicts and war, greater volatility, expropriation and nationalization risks, sanctions or other measures by the United States or other governments, currency fluctuations, higher transaction costs, delayed settlement, possible foreign controls on investment, liquidity risks and less stringent investor protection and disclosure standards of foreign markets. In certain markets where securities and other instruments are not traded “delivery versus payment,” a Fund may not receive timely payment for securities or other instruments it has delivered or receive delivery of securities paid for and may be subject to increased risk that the counterparty will fail to make payments or delivery when due or default completely.
Events and evolving conditions in certain economies or markets may alter the risks associated with investments tied to countries or regions that historically were perceived as comparatively stable becoming riskier and more volatile.
As of February 29, 2024, the following Funds had non-U.S. country allocations representing greater than 10% of total investments (excluding investment of cash collateral from securities loaned) as follows:
| International
Bond
Opportunities
ETF | |
| | |
| | |
REPORT OF INDEPENDENT REGISTERED PUBLIC ACCOUNTING FIRM
To the Board of Trustees of J.P. Morgan Exchange-Traded Fund Trust and Shareholders of each of the eight funds listed in the table below
Opinions on the Financial Statements
We have audited the accompanying statements of assets and liabilities, including the schedules of portfolio investments, of each of the funds listed in the table below (eight of the funds constituting J.P. Morgan Exchange-Traded Fund Trust, hereafter collectively referred to as the "Funds") as of February 29, 2024, the related statements of operations and of changes in net assets for each of the periods indicated in the table below, including the related notes, and the financial highlights for each of the periods indicated therein (collectively referred to as the “financial statements”). In our opinion, the financial statements present fairly, in all material respects, the financial position of each of the Funds as of February 29, 2024, the results of each of their operations and the changes in each of their net assets for the periods indicated in the table below, and each of the financial highlights for each of the periods indicated therein, in conformity with accounting principles generally accepted in the United States of America.
JPMorgan Active Bond ETF (1) | JPMorgan Municipal ETF (2) |
JPMorgan Core Plus Bond ETF (2) | JPMorgan Short Duration Core Plus ETF (2) |
| JPMorgan Ultra-Short Income ETF (2) |
JPMorgan International Bond Opportunities ETF (2) | JPMorgan Ultra-Short Municipal Income ETF (2) |
(1) Statement of operations and statement of changes in net assets for the period October 11, 2023 (commencement of operations) through February 29, 2024 |
(2) Statement of operations for the year ended February 29, 2024 and statement of changes in net assets for the years ended February 29, 2024 and February 28, 2023 |
Basis for Opinions
These financial statements are the responsibility of the Funds’ management. Our responsibility is to express an opinion on the Funds’ financial statements based on our audits. We are a public accounting firm registered with the Public Company Accounting Oversight Board (United States) (PCAOB) and are required to be independent with respect to the Funds in accordance with the U.S. federal securities laws and the applicable rules and regulations of the Securities and Exchange Commission and the PCAOB.
We conducted our audits of these financial statements in accordance with the standards of the PCAOB. Those standards require that we plan and perform the audit to obtain reasonable assurance about whether the financial statements are free of material misstatement, whether due to error or fraud.
Our audits included performing procedures to assess the risks of material misstatement of the financial statements, whether due to error or fraud, and performing procedures that respond to those risks. Such procedures included examining, on a test basis, evidence regarding the amounts and disclosures in the financial statements. Our audits also included evaluating the accounting principles used and significant estimates made by management, as well as evaluating the overall presentation of the financial statements. Our procedures included confirmation of securities owned as of February 29, 2024 by correspondence with the custodian, transfer agent, agent banks and brokers; when replies were not received from brokers, we performed other auditing procedures. We believe that our audits provide a reasonable basis for our opinions.
/s/ PricewaterhouseCoopers LLP
New York, New York
April 24, 2024
We have served as the auditor of one or more investment companies in the JPMorgan Funds complex since 1993.
The Funds' Statement of Additional Information includes additional information about the Funds' Trustees and is available, without charge, upon request by calling 1-844-457-6383 or on the J.P. Morgan Funds’ website at www.jpmorganfunds.com.
Name (Year of Birth);
Positions With
the Funds (1) | Principal Occupation
During Past 5 Years | Number of
Funds in Fund
Complex Overseen
by Trustee (2) | Other Directorships Held
During the Past 5 Years |
| |
John F. Finn (1947); Chair
since 2020; Trustee since 1998. | Chairman, Gardner, Inc. (supply chain management company serving industrial and consumer markets) (serving in various roles 1974-present). | | Director, Greif, Inc. (GEF) (industrial package products and services) (2007-2023); Trustee, Columbus Association for the Performing Arts (1988-present). |
Stephen P. Fisher (1959);
Trustee since 2018. | Retired; Chairman and Chief Executive Officer, NYLIFE Distributors LLC (registered broker-dealer) (serving in various roles 2008-2013); Chairman, NYLIM Service Company LLC (transfer agent) (2008-2017); New York Life Investment Management LLC (registered investment adviser) (serving in various roles 2005-2017); Chairman, IndexIQ Advisors LLC (registered investment adviser for ETFs) (2014-2017); President, MainStay VP Funds Trust (2007-2017), MainStay DefinedTerm Municipal Opportunities Fund (2011-2017) and MainStay Funds Trust (2007-2017) (registered investment companies). | | |
Gary L. French (1951);
Trustee since 2014. | Real Estate Investor (2011-2020); Investment management industry Consultant and Expert Witness (2011-present); Senior Consultant for The Regulatory Fundamentals Group LLC (2011-2017). | | Independent Trustee, The China Fund, Inc. (2013-2019); Exchange Traded Concepts Trust II (2012-2014); Exchange Traded Concepts Trust I (2011-2014). |
Kathleen M. Gallagher (1958);
Trustee since 2018. | Retired; Chief Investment Officer — Benefit Plans, Ford Motor Company (serving in various roles 1985-2016). | | Non- Executive Director, Legal & General Investment Management (Holdings) (2018-present); Non-Executive Director, Legal & General Investment Management America (U.S. Holdings) (financial services and insurance) (2017-present); Advisory Board Member, State Street Global Advisors Total Portfolio Solutions (2017-present); Member, Client Advisory Council, Financial Engines, LLC (registered investment adviser) (2011-2016); Director, Ford Pension Funds Investment Management Ltd. (2007-2016). |
Robert J. Grassi (1957);
Trustee since 2014. | Sole Proprietor, Academy Hills Advisors LLC (2012-present); Pension Director, Corning Incorporated (2002-2012). | | |
Name (Year of Birth); Positions With the Funds (1) | Principal Occupation During Past 5 Years | Number of Funds in Fund Complex Overseen by Trustee (2) | Other Directorships Held During the Past 5 Years |
| |
Frankie D. Hughes (1952);
Trustee since 2008. | President, Ashland Hughes Properties (property management) (2014-present); President and Chief Investment Officer, Hughes Capital Management, Inc. (fixed income asset management) (1993-2014). | | |
Raymond Kanner (1953);
Trustee since 2017. | Retired; Managing Director and Chief Investment Officer, IBM Retirement Funds (2007-2016). | | Advisory Board Member, Penso Advisors, LLC (2020-present); Advisory Board Member, Los Angeles Capital (2018-present); Advisory Board Member, State Street Global Advisors Total Portfolio Solutions (2017- present); Acting Executive Director, Committee on Investment of Employee Benefit Assets (CIEBA) (2016-2017); Advisory Board Member, Betterment for Business (robo advisor) (2016- 2017); Advisory Board Member, BlueStar Indexes (index creator) (2013-2017); Director, Emerging Markets Growth Fund (registered investment company) (1997-2016); Member, Russell Index Client Advisory Board (2001-2015). |
Thomas P. Lemke (1954);
Trustee since 2014. | | | (1) Independent Trustee of Advisors’ Inner Circle III fund platform, consisting of the following: (i) the Advisors’ Inner Circle Fund III, (ii) the Gallery Trust, (iii) the Schroder Series Trust, (iv) the Delaware Wilshire Private Markets Fund (since 2020), (v) Chiron Capital Allocation Fund Ltd., and (vi) formerly the Winton Diversified Opportunities Fund (2014-2018); and (2) Independent Trustee of the Symmetry Panoramic Trust (since 2018). |
Lawrence R. Maffia (1950);
Trustee since 2014. | Retired; Director and President, ICI Mutual Insurance Company (2006-2013). | | Director, ICI Mutual Insurance Company (1999-2013). |
Mary E. Martinez (1960); Vice
Chair since 2021; Trustee since 2013. | Associate, Special Properties, a Christie’s International Real Estate Affiliate (2010-present); Managing Director, Bank of America (asset management) (2007-2008); Chief Operating Officer, U.S. Trust Asset Management, U.S. Trust Company (asset management) (2003-2007); President, Excelsior Funds (registered investment companies) (2004-2005). | | |
Marilyn McCoy (1948);
Trustee since 1999. | Retired; Vice President of Administration and Planning, Northwestern University (1985-2023). | | |
Name (Year of Birth); Positions With the Funds (1) | Principal Occupation During Past 5 Years | Number of Funds in Fund Complex Overseen by Trustee (2) | Other Directorships Held During the Past 5 Years |
| |
Dr. Robert A. Oden, Jr. (1946); Trustee
since 1997. | Retired; President, Carleton College (2002-2010); President, Kenyon College (1995-2002). | | Trustee, The Coldwater Conservation Fund (2017-present); Trustee, American Museum of Fly Fishing (2013-present); Trustee and Vice Chair, Trout Unlimited (2017-2021); Trustee, Dartmouth- Hitchcock Medical Center (2011-2020). |
Marian U. Pardo* (1946);
Trustee since 2013. | Managing Director and Founder, Virtual Capital Management LLC (investment consulting) (2007-present); Managing Director, Credit Suisse Asset Management (portfolio manager) (2003-2006). | | Board Chair and Member, Board of Governors, Columbus Citizens Foundation (not-for-profit supporting philanthropic and cultural programs) (2006-present). |
Emily A. Youssouf (1951);
Trustee since 2014. | Adjunct Professor (2011-present) and Clinical Professor (2009-2011), NYU Schack Institute of Real Estate; Board Member and Member of the Audit Committee (2013–present), Chair of Finance Committee (2019-present), Member of Related Parties Committee (2013-2018) and Member of the Enterprise Risk Committee (2015-2018), PennyMac Financial Services, Inc.; Board Member (2005-2018), Chair of Capital Committee (2006-2016), Chair of Audit Committee (2005-2018), Member of Finance Committee (2005-2018) and Chair of IT Committee (2016-2018), NYC Health and Hospitals Corporation. | | Trustee, NYC School Construction Authority (2009-present); Board Member, NYS Job Development Authority (2008-present); Trustee and Chair of the Audit Committee of the Transit Center Foundation (2015-2019). |
| |
Robert F. Deutsch** (1957);
Trustee since 2014. | Retired; Head of ETF Business for JPMorgan Asset Management (2013-2017); Head of Global Liquidity Business for JPMorgan Asset Management (2003-2013). | | Treasurer and Director of the JUST Capital Foundation (2017-present). |
Nina O. Shenker** (1957);
Trustee since 2022. | Vice Chair (2017-2021), General Counsel and Managing Director (2008-2016), Associate General Counsel and Managing Director (2004-2008), J.P. Morgan Asset & Wealth Management. | | Director and Member of Legal and Human Resources Subcommittees, American Jewish Joint Distribution Committee (2018-present). |
|
| The year shown is the first year in which a Trustee became a member of any of the following: the JPMorgan Mutual Fund Board, the JPMorgan ETF Board, the heritage J.P. Morgan Funds or the heritage One Group Mutual Funds. Trustees serve an indefinite term, until resignation, retirement, removal or death. The Board's current retirement policy sets retirement at the end of the calendar year in which the Trustee attains the age of 75, provided that any Board member who was a member of the JPMorgan Mutual Fund Board prior to January 1, 2022 and was born prior to January 1, 1950 shall retire from the Board at the end of the calendar year in which the Trustee attains the age of 78. |
| A Fund Complex means two or more registered investment companies that hold themselves out to investors as related companies for purposes of investment and investor services or have a common investment adviser or have an investment adviser that is an affiliated person of the investment adviser of any of the other registered investment companies. The J.P. Morgan Funds Complex for which the Board of Trustees serves currently includes eight registered investment companies (167 J.P. Morgan Funds). |
| In connection with prior employment with JPMorgan Chase, Ms. Pardo was the recipient of non-qualified pension plan payments from JPMorgan Chase in the amount of approximately $2,055 per month, which she irrevocably waived effective January 1, 2013, and deferred compensation payments from JPMorgan Chase in the amount of approximately $7,294 per year, which ended in January 2013. In addition, Ms. Pardo receives payments from a fully-funded qualified plan, which is not an obligation of JPMorgan Chase. |
| Designation as an “Interested Trustee” is based on prior employment by the Adviser or an affiliate of the Adviser or interests in a control person of the Adviser. |
| The contact address for each of the Trustees is 277 Park Avenue, New York, NY 10172. |
Name (Year of Birth),
Positions Held with
the Trust (Since) | Principal Occupations During Past 5 Years |
Brian S. Shlissel (1964),
President and Principal Executive
Officer (2021) | Managing Director and Chief Administrative Officer for J.P. Morgan pooled vehicles, J.P. Morgan Investment Management Inc. since 2014. |
Timothy J. Clemens (1975),
Treasurer and Principal Financial
Officer (2020) | Managing Director, J.P. Morgan Investment Management Inc. Mr. Clemens has been with J.P. Morgan Investment Management Inc. since 2013. |
Gregory S. Samuels (1980),
Secretary (2022) (formerly Assistant
Secretary 2014-2022) | Managing Director and Assistant General Counsel, JPMorgan Chase & Co. Mr. Samuels has been with JPMorgan Chase & Co. since 2010. |
Stephen M. Ungerman (1953),
Chief Compliance Officer (2014) | Managing Director, JPMorgan Chase & Co. Mr. Ungerman has been with JPMorgan Chase & Co. since 2000. |
Kiesha Astwood-Smith (1973),
Assistant Secretary (2021) | Vice President and Assistant General Counsel, JPMorgan Chase & Co. since June 2021; Senior Director and Counsel, Equitable Financial Life Insurance Company (formerly, AXA Equitable Life Insurance Company) from September 2015 through June 2021. |
Matthew Beck (1988),
Assistant Secretary (2021)* | Vice President and Assistant General Counsel, JPMorgan Chase & Co. since May 2021; Senior Legal Counsel, Ultimus Fund Solutions from May 2018 through May 2021; General Counsel, The Nottingham Company from April 2014 through May 2018. |
Elizabeth A. Davin (1964),
Assistant Secretary (2022)
(formerly Secretary 2018-2022)* | Executive Director and Assistant General Counsel, JPMorgan Chase & Co. Ms. Davin has been with JPMorgan Chase & Co. (formerly Bank One Corporation) since 2004. |
Jessica K. Ditullio (1962),
Assistant Secretary (2014)* | Executive Director and Assistant General Counsel, JPMorgan Chase & Co. Ms. Ditullio has been with JPMorgan Chase & Co. (formerly Bank One Corporation) since 1990. |
Anthony Geron (1971),
Assistant Secretary (2019) | Vice President and Assistant General Counsel, JPMorgan Chase & Co. since September 2018; Lead Director and Counsel, AXA Equitable Life Insurance Company from 2015 to 2018 and Senior Director and Counsel, AXA Equitable Life Insurance Company from 2014 to 2015. |
Carmine Lekstutis (1980),
Assistant Secretary (2014) | Executive Director and Assistant General Counsel, JPMorgan Chase & Co. Mr. Lekstutis has been with JPMorgan Chase & Co. since 2011. |
Max Vogel (1990),
Assistant Secretary (2021) | Vice President and Assistant General Counsel, JPMorgan Chase & Co. since June 2021; Associate, Proskauer Rose LLP (law firm) from March 2017 to June 2021. |
Zachary E. Vonnegut-Gabovitch
(1986),
Assistant Secretary (2017) | Executive Director and Assistant General Counsel, JPMorgan Chase & Co. Mr. Vonnegut-Gabovitch has been with JPMorgan Chase & Co. since September 2016. |
Frederick J. Cavaliere (1978),
Assistant Treasurer (2015)** | Executive Director, J.P. Morgan Investment Management Inc. Mr. Cavaliere has been with JPMorgan Chase & Co. since May 2006. |
Michael M. D’Ambrosio (1969),
Assistant Treasurer (2014) | Managing Director, J.P. Morgan Investment Management Inc. Mr. D’Ambrosio has been with J.P. Morgan Investment Management Inc. since 2012. |
Aleksandr Fleytekh (1972),
Assistant Treasurer (2023) | Executive Director, J.P. Morgan Investment Management Inc. Mr. Fleytekh has been with J.P. Morgan Investment Management Inc. since February 2012. |
Shannon Gaines (1977),
Assistant Treasurer (2019)* | Executive Director, J.P. Morgan Investment Management Inc. Mr. Gaines has been with J.P. Morgan Investment Management Inc. since January 2014. |
Jeffrey D. House (1972),
Assistant Treasurer (2023)* | Vice President, J.P. Morgan Investment Management Inc. Mr. House has been with J.P. Morgan Investment Management Inc. since July 2006. |
Michael Mannarino (1985),
Assistant Treasurer (2023) | Vice President, J.P. Morgan Investment Management Inc. Mr. Mannarino has been with J.P. Morgan Investment Management Inc. since 2014. |
| J.P. Morgan Exchange-Traded Funds | |
OFFICERS(Unaudited) (continued)
Nektarios E. Manolakakis (1972),
Assistant Treasurer (2020) | Executive Director, J.P. Morgan Investment Management Inc. since February 2021, formerly Vice President, J.P. Morgan Investment Management Inc. since 2014; Vice President, J.P. Morgan Corporate & Investment Bank 2010-2014. |
Todd McEwen (1981),
Assistant Treasurer (2020)* | Executive Director, J.P. Morgan Investment Management Inc. Mr. McEwen has been with J.P. Morgan Investment Management Inc. since 2010. |
Joseph Parascondola (1963),
Assistant Treasurer (2023)** | Executive Director, J.P. Morgan Investment Management Inc. Mr. Parascondola has been with J.P. Morgan Investment Management Inc. since 2006. |
Gillian I. Sands (1969),
Assistant Treasurer (2023) | Executive Director, J.P. Morgan Investment Management Inc. Ms. Sands has been with J.P. Morgan Investment Management Inc. since September 2012. |
|
The contact address for each of the officers, unless otherwise noted, is 277 Park Avenue, New York, NY 10172. |
| The contact address for the officer is 1111 Polaris Parkway, Columbus, OH 43240. |
| The contact address for the officer is 575 Washington Boulevard, Jersey City, NJ 07310. |
| J.P. Morgan Exchange-Traded Funds | |
SCHEDULE OF SHAREHOLDER EXPENSES(Unaudited)
Hypothetical $1,000 Investment
As a shareholder of the Funds, you incur two types of costs: (1) transaction costs, including brokerage commissions on your purchase and sales of Fund shares and (2) ongoing costs, primarily management fees. The examples below are intended to help you understand your ongoing costs (in dollars) of investing in the Funds and to compare these ongoing costs with the ongoing costs of investing in other funds. The examples assume that you had a $1,000 investment at the beginning of the reporting period, September 1, 2023, and continued to hold your shares at the end of the reporting period, February 29, 2024.
Actual Expenses
For each Fund in the table below, the first line provides information about actual account values and actual expenses. You may use the information in this line, together with the amount you invested, to estimate the expenses that you paid over the period. Simply divide your account value by $1,000 (for example, an $8,600 account value divided by $1,000 = 8.6), then multiply the result by the number in the first line of each
Fund under the heading titled “Expenses Paid During the Period” to estimate the expenses you paid on your account during this period.
Hypothetical Example for Comparison Purposes
The second line of each Fund in the table below provides information about hypothetical account values and hypothetical expenses based on the actual expense ratio and an assumed rate of return of 5% per year before expenses, which is not the Fund's actual return. The hypothetical account values and expenses may not be used to estimate the actual ending account balance or expenses you paid for the period. You may use this information to compare the ongoing costs of investing in the Fund and other funds. To do so, compare this 5% hypothetical example with the 5% hypothetical examples that appear in the shareholder reports of the other funds. The examples also assume all dividends and distributions have been reinvested. The examples do not take into account brokerage commissions that you pay when purchasing or selling shares of a Fund.
| Beginning Account Value September 1, 2023 | Ending Account Value February 29, 2024 | Expenses Paid During the Period | |
| | | | |
| | | | |
| | | | |
JPMorgan Core Plus Bond ETF | | | | |
| | | | |
| | | | |
| | | | |
| | | | |
| | | | |
JPMorgan International Bond Opportunities ETF | | | | |
| | | | |
| | | | |
| | | | |
| | | | |
| | | | |
JPMorgan Short Duration Core Plus ETF | | | | |
| | | | |
| | | | |
JPMorgan Ultra-Short Income ETF | | | | |
| | | | |
| | | | |
JPMorgan Ultra-Short Municipal Income ETF | | | | |
| | | | |
| | | | |
|
| Expenses are equal to the Fund’s annualized net expense ratio, multiplied by the average account value over the period, multiplied by 141/366 (to reflect the actual period). The Fund commenced operations on October 11, 2023. |
| Expenses are equal to each Fund’s annualized net expense ratio, multiplied by the average account value over the period, multiplied by 182/366 (to reflect the one-half year period). |
| J.P. Morgan Exchange-Traded Funds | |
LIQUIDITY RISK MANAGEMENT PROGRAM(Unaudited)
Each of the Funds covered in this report has adopted the J.P. Morgan Funds and J.P. Morgan Exchange-Traded Funds Amended and Restated Liquidity Risk Management Program (the “Program”) under Rule 22e-4 under the Investment Company Act of 1940, as amended (the “Liquidity Rule”). The Program seeks to assess, manage and review each Fund’s Liquidity Risk. “Liquidity Risk” is defined as the risk that a fund could not meet requests to redeem shares issued by the fund without significant dilution of remaining investors’ interests in the fund. Pursuant to an exemptive order (the “Exemptive Order”) from the Securities and Exchange Commission, the Program permits the Funds to use liquidity definitions and classification methodologies that differ from the requirements under the Liquidity Rule in some respects. Among other things, the Liquidity Rule requires that a written report be provided to the Board of Trustees (the “Board”) on an annual basis that addresses the operation of the Program and assesses the adequacy and effectiveness of its implementation, including the operation of any Highly Liquid Investment Minimum (“HLIM”), where applicable, and any material changes to the Program.1
The Board has appointed J.P. Morgan Asset Management’s Liquidity Risk Forum to be the program administrator for the Program (the “Program Administrator”). In addition to regular reporting at each of its quarterly meetings, on February 7, 2024, the Board reviewed the Program Administrator’s annual written report (the “Report”) concerning the operation of the Program for the period from January 1, 2023 through December 31, 2023 (the “Program Reporting Period”). The Report addressed the operation of the Program and assessed its adequacy and effectiveness of implementation, including, where applicable, the operation of a Fund’s HLIM. There were no material changes to the Program during the Program Reporting Period.
The Report summarized the operation of the Program and the information and factors considered by the Program Administrator in assessing whether the Program has been adequately
and effectively implemented with respect to each Fund. Such information and factors included, among other things: (1) the effectiveness of the Program with respect to the identification of each Fund that qualifies as an “In-Kind ETF” (as defined in the Liquidity Rule); (2) the liquidity risk framework used to assess, manage, and periodically review each Fund’s Liquidity Risk and the results of this assessment; (3) the methodology and inputs for classifying the investments of a Fund (other than an In-Kind ETF) into one of the required liquidity categories that reflect an estimate of the liquidity of those investments under current market conditions (and, for In-Kind ETFs, the methodology and inputs for determining whether any investments should be classified as “Illiquid Investments” (as defined or modified under the Program)); (4) whether a Fund (other than an In-Kind ETF) invested primarily in “Highly Liquid Investments” (as defined or modified under the Program), as well as whether an HLIM should be established for a Fund (other than an In-Kind ETF) and the procedures for monitoring any HLIM; (5) whether a Fund invested more than 15% of its assets in “Illiquid Investments” and the procedures for monitoring for this limit; and (6) specific liquidity events arising during the Program Reporting Period. The Report further summarized the conditions of the Exemptive Order and whether all applicable Funds were in compliance with the terms of the Exemptive Order.
Based on this review, the Report concluded that: (1) the Program continues to be reasonably designed to effectively assess and manage each Fund’s Liquidity Risk; and (2) the Program has been adequately and effectively implemented with respect to each Fund during the Program Reporting Period.
1 Effective July 24, 2024, the J.P. Morgan Funds will implement the Tailored Shareholder Reports for Mutual Funds and Exchanged-Traded Funds Rule. This rule rescinds the currently-required statement regarding the operation and effectiveness of a fund’s Liquidity Risk Management Program from the shareholder report.
| J.P. Morgan Exchange-Traded Funds | |
BOARD APPROVAL OF INITIAL MANAGEMENT AGREEMENT(Unaudited)
JPMorgan Active Bond ETF
On August 8-10, 2023, the Board of Trustees (the “Board” or the “Trustees”) held meetings and approved the initial management agreement (the “Management Agreement”) for the JPMorgan Active Bond ETF (the “Fund”). The Management Agreement was approved by a majority of the Trustees who are not “Interested Persons” (as defined in the Investment Company Act of 1940) of any party to the Management Agreement or any of their affiliates. In connection with the approval of the Management Agreement, the Trustees reviewed written materials prepared by J.P. Morgan Investment Management Inc. (the “Adviser”) and received oral presentations from Adviser personnel. Before voting on the proposed Management Agreement, the Trustees reviewed the Management Agreement with representatives of the Adviser and with counsel to the Fund and independent legal counsel to the Trustees and received a memorandum from independent legal counsel discussing the legal standards for their consideration of the proposed Management Agreement. They also considered information they received from the Adviser over the course of the year in connection with their oversight of other funds managed by the Adviser. The Trustees also discussed the proposed Management Agreement with independent legal counsel in executive session at which no representatives of the Adviser were present.
A summary of the material factors evaluated by the Trustees in determining whether to approve the Management Agreement is provided below. The Trustees considered information provided with respect to the Fund and the approval of the Management Agreement. Each Trustee attributed his or her own evaluation of the significance of the various factors, and no factor alone was considered determinative. The Trustees determined that the proposed compensation to be received by the Adviser from the Fund under its Management Agreement was fair and reasonable and that initial approval of the Management Agreement was in the best interests of the Fund and its potential shareholders.
Summarized below are the material factors considered and discussed by the Trustees in reaching their conclusions:
Nature, Extent and Quality of Services Provided by the Adviser
In connection with the approval of the Fund’s initial Management Agreement, the Trustees considered the materials furnished specifically in connection with the approval of the Management Agreement, as well as other relevant information furnished for the Trustees, regarding the nature, extent, and quality of services provided by the adviser. Among other things, the Trustees considered:
• The background and experience of the Adviser’s senior management and investment personnel;
• The qualifications, backgrounds and responsibilities of the portfolio management team to be primarily responsible for the day-to-day management of the Fund;
• The investment strategy for the Fund, and the infrastructure supporting the portfolio management team;
• Information about the structure and distribution strategy of the Fund and how it fits within the Adviser’s other fund offerings within the J.P. Morgan Funds complex;
• The administration services to be provided by the Adviser under the Management Agreement;
• Their knowledge of the nature and quality of the services provided by the Adviser and its affiliates gained from their experience as Trustees of the Fund and in the financial industry generally;
• The overall reputation and capabilities of the Adviser and its affiliates;
• The commitment of the Adviser to provide high quality service to the Fund;
• Their overall confidence in the Adviser’s integrity; and
• The Adviser’s responsiveness to requests for additional information, questions or concerns raised by them.
Based upon these considerations and other factors, the Trustees concluded that they were satisfied with the nature, extent and quality of services to be provided to the Fund by the Adviser.
Fall-Out Benefits
The Trustees reviewed information regarding potential “fall-out” or ancillary benefits expected to be received by the Adviser and its affiliates as a result of their relationship with the Fund. Additionally, the Trustees considered that any fall-out or ancillary benefits would be comparable to those related to the other funds in the complex.
The Trustees also considered the benefits the Adviser is expected to receive as the result of the roles JPMorgan Chase Bank, N.A. (“JPMCB”), an affiliate of the Adviser, plays as custodian, fund accountant and transfer agent for the Fund, including the profitability of those arrangements to JPMCB.
Economies of Scale
The Trustees considered the extent to which the Fund may benefit from potential economies of scale. The Trustees considered that under the Management Agreement, the Adviser will provide advisory and administrative services and will be responsible for substantially all expenses of the Fund under a “unitary fee structure.” The Trustees noted that the proposed unitary management fee for the Fund does not contain breakpoints. The Trustees considered that shareholders would benefit because expenses would be limited even when the Fund
| J.P. Morgan Exchange-Traded Funds | |
BOARD APPROVAL OF INITIAL MANAGEMENT AGREEMENT(Unaudited) (continued)
is new and not achieving economies of scale. The Trustees considered the fact that increases in assets would not lead to management fee decreases even if economies of scale are achieved, but also that the Trustees would have the opportunity to further review the appropriateness of the fee payable to the Adviser under its Management Agreement in the future. After considering the factors identified above, the Trustees concluded that the Fund’s shareholders will receive the benefits of potential economies of scale.
Fees Relative to Adviser’s Other Clients
The Trustees received and considered information about the nature and extent of management services and fee rates offered to clients of the Adviser, including, to the extent applicable, institutional separate accounts, collective investment trusts, other registered investment companies and/or private funds sub-advised by the Adviser, for management styles substantially similar to that of the Fund. The Trustees considered the Adviser’s view that it does not manage other accounts with a substantially similar investment strategy as that of the Fund.
Investment Performance
The Trustees considered the Fund’s investment strategy and processes, the portfolio management team and competitive positioning against identified peer funds and concluded that the prospects for competitive future performance were acceptable.
Management Fee
The Trustees considered the contractual management fee rate that will be paid by the Fund to the Adviser and compared that rate to information prepared by Broadridge Investor Communications Solutions Inc. (“Broadridge”), an independent provider of investment company data, providing management fee rates paid by other funds in the same Morningstar category as the Fund. The Trustees also considered the fees paid to JPMCB, for custody, fund accounting, transfer agency and other related services for the Fund and the profitability of these arrangements to JPMCB.
The Trustees considered how the Fund will be positioned against peer funds, as identified by management and/or Broadridge, as well as how the peer funds included in the Broadridge data differed from the Fund. The Trustees also noted that because the Fund was not yet operational, no profitability information was available. After considering the factors identified above and other factors, in light of the information, the Trustees concluded that the Fund’s proposed management fee was fair and reasonable.
| J.P. Morgan Exchange-Traded Funds | |
Certain tax information for the J.P. Morgan Funds is required to be provided to shareholders based upon the Funds' income and distributions for the taxable year ended February 29, 2024. The information and distributions reported in this letter may differ from the information and taxable distributions reported to the shareholders for the calendar year ending December 31, 2024. The information necessary to complete your income tax returns for the calendar year ending December 31, 2024 will be provided under separate cover.
Qualified Interest Income (QII) and Short-Term Capital Gain
Each Fund listed below paid the following amount, or maximum allowable amount, of ordinary distributions treated as qualified interest income and short-term capital gains for the fiscal year ended February 29, 2024:
| |
JPMorgan Active Bond ETF* | |
JPMorgan Core Plus Bond ETF | |
| |
JPMorgan International Bond Opportunities ETF | |
JPMorgan Short Duration Core Plus ETF | |
JPMorgan Ultra-Short Income ETF | |
|
| The Fund has an expected tax year end of September 30. The maximum allowable amount of ordinary distributions treated as Qualified Interest Income (QII) and Short-Term Capital Gain will be different as of the Fund’s tax year end. |
Tax Exempt Income
Each Fund listed below had the following amount, or maximum allowable amount, of dividends paid from investment income that are exempt from federal income tax for the fiscal year ended February 29, 2024:
| |
| |
JPMorgan Ultra-Short Municipal Income ETF | |
Treasury Income
Each Fund listed below had the following percentage, or maximum allowable percentage, of income earned from direct U.S. Treasury Obligations for the fiscal year ended February 29, 2024:
| Income from
U.S. Treasury
Obligations |
JPMorgan Active Bond ETF* | |
JPMorgan Core Plus Bond ETF | |
| |
JPMorgan Short Duration Core Plus ETF | |
JPMorgan Ultra-Short Income ETF | |
|
| The Fund has an expected tax year end of September 30. The maximum allowable percentage of income earned from direct U.S. Treasury Obligations will be different as of the Fund’s tax year end. |
| J.P. Morgan Exchange-Traded Funds | |
THIS PAGE IS INTENTIONALLY LEFT BLANK
J.P. Morgan Exchange-Traded Funds are distributed by JPMorgan Distribution Services, Inc., an indirect, wholly-owned subsidiary of JPMorgan Chase & Co. Affiliates of JPMorgan Chase & Co. receive fees for providing various services to the Funds.
Contact J.P. Morgan Exchange-Traded Funds at 1-844-457-6383 (844-4JPM ETF) for a fund prospectus. You can also visit us at www.jpmorganfunds.com. Investors should carefully consider the investment objectives and risks as well as charges and expenses of the fund before investing. The prospectus contains this and other information about the fund. Read the prospectus carefully before investing.
Investors may obtain information about the Securities Investor Protection Corporation (SIPC), including the SIPC brochure, by visiting www.sipc.org or by calling SIPC at 202-371-8300.
Each Fund files a complete schedule of its fund holdings for the first and third quarters of its fiscal year with the SEC as an exhibit to its report on Form N-PORT. The Funds' Form N-PORT reports are available on the SEC’s website at http://www.sec.gov. Each Fund's quarterly holdings can be found by visiting the J.P. Morgan Funds’ website at www.jpmorganfunds.com.
Effective January 24, 2023, the SEC adopted rule and form amendments that will result in changes to the design and delivery of shareholder reports of mutual funds and ETFs, requiring them to transmit concise and visually engaging streamlined annual and semi-annual reports to shareholders that highlight key information. Other information, including financial statements, will no longer appear in a streamlined shareholder report but must be available online, delivered free of charge upon request, and filed on a semi-annual basis on Form N-CSR. The rule and form amendments have a compliance date of July 24, 2024.
A description of each Fund's policies and procedures with respect to the disclosure of each Fund's holdings is available in the prospectus and Statement of Additional Information.
A copy of proxy policies and procedures is available without charge upon request by calling 1-844-457-6383 and on the Funds' website at www.jpmorganfunds.com. A description of such policies and procedures is on the SEC’s website at www.sec.gov. The Trustees have delegated the authority to vote proxies for securities owned by the Funds to the Adviser. A copy of the Funds' voting record for the most recent 12-month period ended June 30 is available on the SEC’s website at www.sec.gov or at the Funds' website at www.jpmorganfunds.com no later than August 31 of each year. The Funds' proxy voting record will include, among other things, a brief description of the matter voted on for each fund security, and will state how each vote was cast, for example, for or against the proposal.
J.P. Morgan Asset Management is the brand name for the asset management business of JPMorgan Chase & Co. and its affiliates worldwide.
© JPMorgan Chase & Co., 2024. All rights reserved. February 2024.
AN-FIETF-224
Annual Report
J.P. Morgan Exchange-Traded Funds
February 29, 2024
| | |
JPMorgan BetaBuilders MSCI US REIT ETF | | |
CONTENTS
Investments in the Fund are not deposits or obligations of, or guaranteed or endorsed by, any bank and are not insured or guaranteed by the FDIC, the Federal Reserve Board or any other government agency. You could lose money if you sell when the Fund’s share price is lower than when you invested.
Past performance is no guarantee of future performance. The general market views expressed in this report are opinions based on market and other conditions through the end of the reporting period and are subject to change without notice. These views are not intended to predict the future performance of the Fund or the securities markets.
Prospective investors should refer to the Fund's prospectus for a discussion of the Fund's investment objectives, strategies and risks. Call J.P. Morgan Exchange-Traded Funds at (844) 457-6383 for a prospectus containing more complete information about the Fund, including management fees and other expenses. Please read it carefully before investing.
Shares are bought and sold throughout the day on an exchange at market price (not at net asset value) through a brokerage account, and are not individually subscribed and redeemed from the Fund. Shares may only be subscribed and redeemed directly from the Fund by Authorized Participants, in large creation/redemption units. Brokerage commissions will reduce returns.
President's LetterApril 15, 2024 (Unaudited)
Dear Shareholder,
Financial markets largely rallied through the final months of 2023 and into the first quarter of 2024, as leading central banks refrained from implementing further interest rate increases. Equity markets generally outperformed bond markets for the twelve months ended February 29, 2024, led by four consecutive months of net gains in U.S. equity prices.
|
“The global economic outlook for the year ahead remains positive and financial markets appear more resilient than a year ago.” — Brian S. Shlissel
|
Economic data were stronger than many economists expected in the face of elevated interest rates throughout the year. Following weak but positive economic growth in the first half of 2023, U.S. gross domestic product increased to 4.9% in the third quarter and 3.4% growth in the final quarter of the year. While the U.S. unemployment rate rose slightly during the second half of the year, it remained below 4% for the entire 12 month period and monthly job growth data frequently surpassed the consensus forecasts of economists.
Meanwhile, the U.S. Federal Reserve (the “Fed”) continued to raise interest rates through the end of summer 2023, then settled on a benchmark lending rate range of 5.25 - 5.50% through the first quarter of 2024. The European Central Bank and the Bank of England followed similar trajectories, raising interest rates at regular intervals into the third quarter of 2023 and then holding rates at those elevated levels for the remainder of the period. Notably, the Bank of Japan raised interest rates for the first time in 17 years in mid-March 2024, ending eight years of negative interest rates and setting its benchmark rate range at 0.0 to 0.1%.
The Fed and certain other leading central banks fueled investor expectations for interest rate reductions in 2024 and growing optimism that developed market economies could enjoy a “soft landing” of positive growth coupled with relatively low unemployment.
However, there remain significant risks to the macroeconomic backdrop. Slower economic growth due to the impact of higher interest rates could leave the U.S. economy more vulnerable to potential shocks from geopolitical events, natural disasters or political turmoil, particularly taking into account the upcoming U.S. presidential election. Additionally, financial markets may also come under pressure should the Fed decide not to reduce interest rates to the extent anticipated by investors. Finally, the recent run-up in U.S. equity prices could lead to increased volatility in certain sectors of the market.
The global economic outlook for the year ahead remains positive and financial markets appear to be more resilient than a year ago. Global growth is estimated at 2.9% this year and 3.0% for 2025, with a continued decline in inflation, according to the Organization for Economic Cooperation and Development’s February 2024 forecast. However, across market cycles, we believe that those investors who hold a well-diversified portfolio and a long-term view are best positioned.
Our suite of investment solutions seeks to provide investors with the ability to build durable portfolios that meet their financial goals, regardless of macroeconomic and geopolitical uncertainties.
Sincerely,
Brian S. Shlissel
President, J.P. Morgan Exchange-Traded Funds
J.P. Morgan Asset Management
1-844-4JPM-ETF or jpmorgan.com/etfs for more information
| J.P. Morgan Exchange-Traded Funds | |
JPMorgan BetaBuilders MSCI US REIT ETF
FUND COMMENTARYTWELVE MONTHS ENDED February 29, 2024 (Unaudited)
| |
| |
| |
MSCI US REIT Custom Capped Index | |
Net Assets as of 2/29/2024 | |
| |
INVESTMENT OBJECTIVE***
The JPMorgan BetaBuilders MSCI US REIT ETF (the “Fund”) seeks investment results that closely correspond, before fees and expenses, to the performance of the MSCI US REIT Custom Capped Index (the “Underlying Index”).
INVESTMENT APPROACH
The Underlying Index is a free-float adjusted market-cap weighted index designed to measure the performance of U.S. equity real estate investment trust (REIT) securities. Using a passive investment approach, the Fund attempts to replicate the constituent securities of the Underlying Index as closely as possible and invests at least 80% of its assets in securities included in the Underlying Index. The Underlying Index includes a capping methodology, which is designed to prevent the weight of any single issuer, and the aggregate weight of issuers representing over 5% of the Underlying Index, from exceeding a maximum of 25% of the Underlying Index.
HOW DID THE MARKET PERFORM?
U.S. equities generated positive returns for the period, following a rally in share prices from October 2023 through February 2024. Shares of REITs underperformed the broader market amid elevated interest rates and weakness in the commercial real estate sector.
During the period, the U.S. Federal Reserve (the “Fed”) raised interest rates at regular intervals through May 2023, but improved inflation data allowed the central bank to withhold a
further rate increase at its June meeting. The Fed then raised rates once again in July 2023 and then held rates at the 5.25%-to-5.50% range through the end of the period.
Meanwhile, the banking sector was roiled in late March 2023 by the failures of Silicon Valley Bank and First Republic Bank in the U.S. and Credit Suisse Group AG in Switzerland. However, in each case government regulators moved to prevent further contagion within the banking industry, and financial sector stocks largely rebounded in the second half of the period.
HOW DID THE FUND PERFORM?
For the twelve months ended February 29, 2024, the Fund performed in line with the Underlying Index, before considering the effects of operating expenses, fees and tax management of the Fund’s portfolio.
The REIT sector generally rebounded in the second half of the period as the Fed declined to further raise interest rates, which contributed to performance of the Fund and the Underlying Index. The Fund’s and the Underlying Index’s allocations to data center REITs were leading contributors to performance. The Fund’s and the Underlying Index’s allocations to the diversified REITs sector was a leading detractor from performance.
HOW WAS THE FUND POSITIONED?
At the end of the reporting period, the Fund’s and the Underlying Index’s largest allocations were to the diversified and industrial REIT sectors, and the smallest allocations were to the hotels and regional malls REIT sectors.
| J.P. Morgan Exchange-Traded Funds | |
*
The return shown is based on net asset value and may differ from the return shown in the financial highlights, which reflects adjustments made to the net asset value in accordance with accounting principles generally accepted in the United States of America. The net asset value was $87.30 as of February 29, 2024.
**
Market price return was calculated assuming an initial investment made at the market price at the beginning of the reporting period, reinvestment of all dividends and distributions at the market price during the period, and sale at the market price on the last day of the period. The price used to calculate the market price return was the closing price on the Cboe BZX Exchange, Inc. As of February 29, 2024, the closing price was $87.21.
***
The adviser seeks to achieve the Fund’s objective. There can be no guarantee it will be achieved.
TOP TEN HOLDINGS OF THE
PORTFOLIO AS OF February 29, 2024 | PERCENT OF
TOTAL
INVESTMENTS |
| | |
| | |
| | |
| Simon Property Group, Inc. | |
| Digital Realty Trust, Inc. | |
| | |
| | |
| Extra Space Storage, Inc. | |
| | |
| AvalonBay Communities, Inc. | |
PORTFOLIO COMPOSITION BY SECTOR
AS OF February 29, 2024 | PERCENT OF
TOTAL
INVESTMENTS |
| |
| |
| |
| |
| |
| |
| |
| |
| |
| |
| |
| J.P. Morgan Exchange-Traded Funds | |
JPMorgan BetaBuilders MSCI US REIT ETF
FUND COMMENTARYTWELVE MONTHS ENDED February 29, 2024 (Unaudited) (continued)
AVERAGE ANNUAL TOTAL RETURNS AS OF February 29, 2024 (Unaudited)
| | | | |
JPMorgan BetaBuilders MSCI US REIT ETF | | | | |
| | | | |
| | | | |
LIFE OF FUND PERFORMANCE (6/15/18 TO 2/29/24)
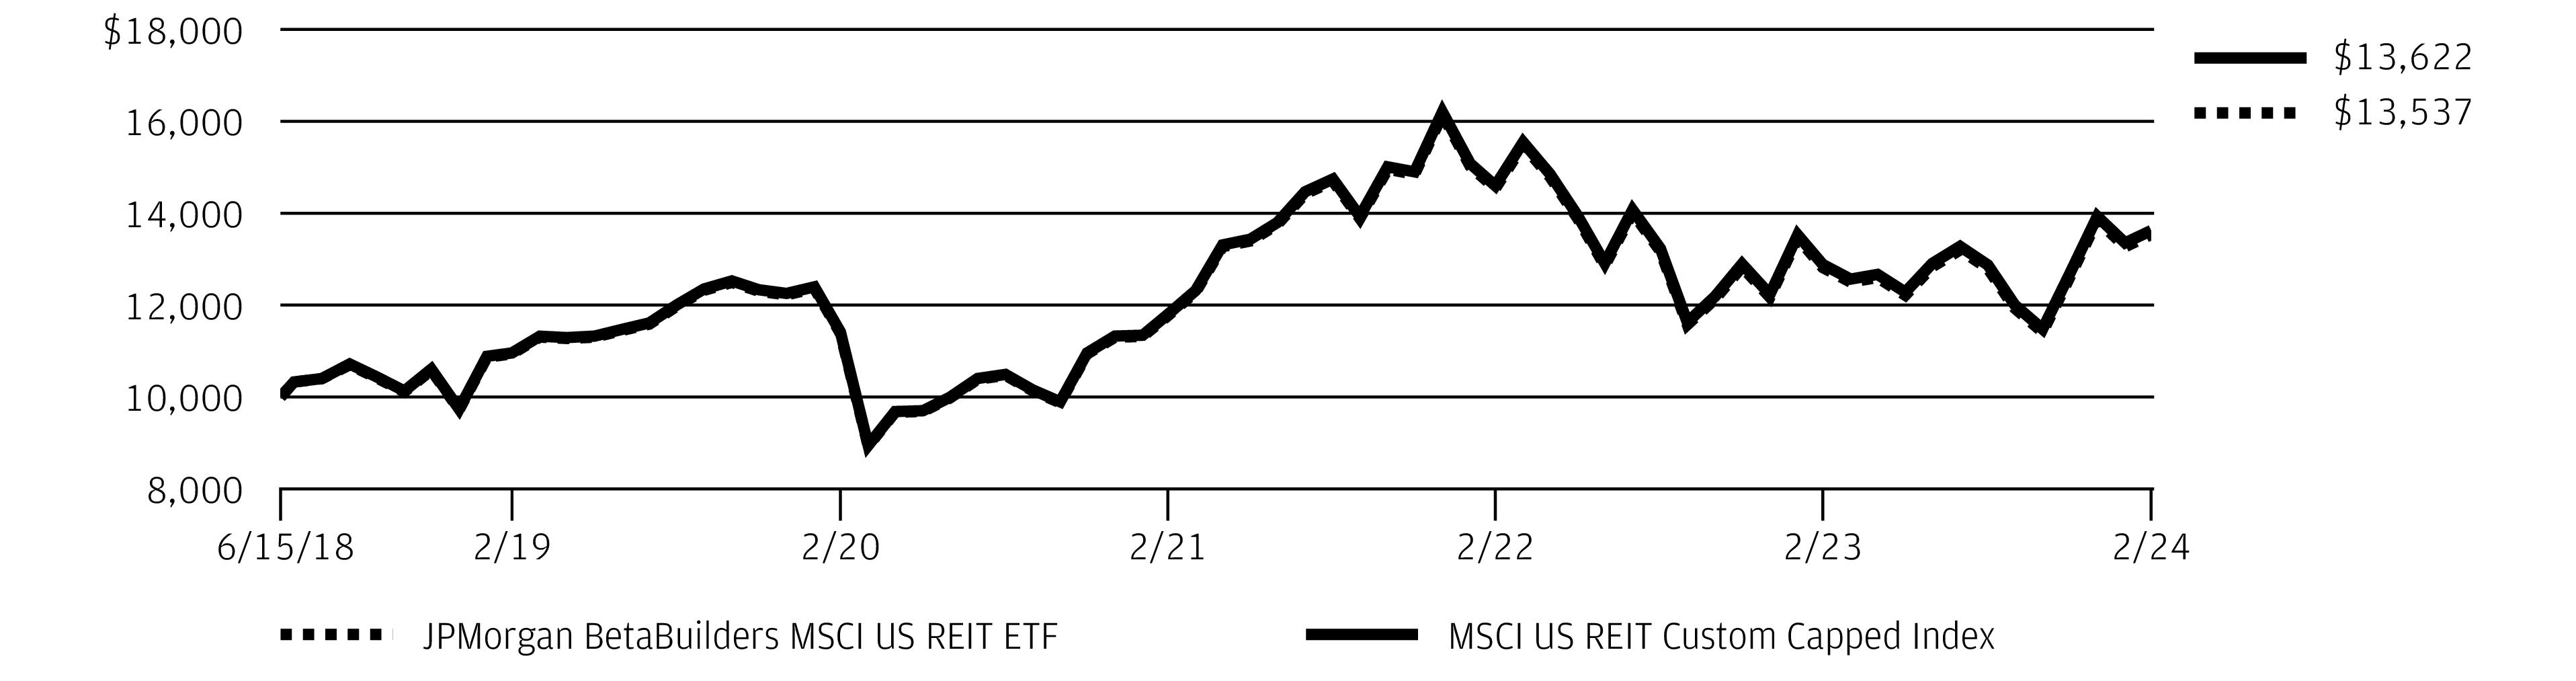
The performance quoted is past performance and is not a guarantee of future results. Exchange-traded funds are subject to certain market risks. Investment returns and principal value of an investment will fluctuate so that an investor’s shares, when sold or redeemed, may be worth more or less than their original cost. Current performance may be higher or lower than the performance data shown. Updated performance information is available by visiting www.jpmorganfunds.com or by calling 1-844-457-6383.
Fund commenced operations on June 15, 2018.
The graph illustrates comparative performance for $10,000 invested in shares of the JPMorgan BetaBuilders MSCI US REIT ETF and the MSCI US REIT Custom Capped Index from June 15, 2018 to February 29, 2024. The performance of the Fund reflects the deduction of Fund expenses and assumes reinvestment of all dividends and capital gain distributions, if any. The performance of the MSCI US REIT Custom Capped Index does not reflect the deduction of expenses associated with an exchange-traded fund and has been adjusted to reflect reinvestment of all dividends and capital gain distributions of the securities included in the respective Index, if applicable.
The MSCI US REIT Custom Capped Index is designed to measure the performance of the US equity REIT market across all market capitalizations. It starts with the universe and weightings of stocks in the MSCI US REIT Index and applies certain investment limits designed to prevent the weight of any single issuer, and the aggregate weight of issuers representing over 5% of the MSCI US REIT Custom Capped Index, from exceeding a maximum of 25% of the MSCI US REIT Custom Capped Index.
For periods presented prior to the adoption of a unitary fee structure, Fund performance reflects the waiver of the Fund’s fees and reimbursement of
expenses for certain periods since the inception date. Without these waivers and reimbursements, performance would have been lower. Also, performance shown in this section does not reflect the deduction of taxes that a shareholder may pay on Fund distributions or on gains resulting from redemption or sale of Fund shares.
The returns shown are based on net asset values calculated for shareholder transactions and may differ from the returns shown in the financial highlights, which reflect adjustments made to the net asset values in accordance with accounting principles generally accepted in the United States of America.
Source: MSCI. The MSCI information may only be used for your internal use, may not be reproduced or redisseminated in any form and may not be used as a basis for or a component of any financial instruments or products or indices. None of the MSCI information is intended to constitute investment advice or a recommendation to make (or refrain from making) any kind of investment decision and may not be relied on as such. Historical data and analysis should not be taken as an indication or guarantee of any future performance analysis, forecast, or prediction. The MSCI information is provided on an "as is" basis and the user of this information assumes the entire risk of any use made of this information. MSCI, each of its affiliates and each other person involved in or related to compiling, computing or creating any MSCI information (collectively, the "MSCI Parties") expressly disclaims all warranties (including, without limitation, any warranties of originality, accuracy, completeness, timeliness, non-infringement, merchantability and fitness for a particular purpose) with respect to this information. Without limiting any of the foregoing, in no event shall any MSCI Party have any liability for any direct, indirect, special, incidental, punitive, consequential (including, without limitation, lost profits) or any other damages. (www.msci.com)
| J.P. Morgan Exchange-Traded Funds | |
JPMorgan BetaBuilders MSCI US REIT ETF
SCHEDULE OF PORTFOLIO INVESTMENTSAS OF February 29, 2024
| | |
|
|
American Homes 4 Rent, Class A, REIT | | |
Apartment Income REIT Corp., REIT | | |
Apartment Investment and Management Co., Class A, REIT * | | |
AvalonBay Communities, Inc., REIT | | |
Camden Property Trust, REIT | | |
| | |
| | |
Equity LifeStyle Properties, Inc., REIT | | |
| | |
Essex Property Trust, Inc., REIT | | |
Independence Realty Trust, Inc., REIT | | |
Invitation Homes, Inc., REIT | | |
Mid-America Apartment Communities, Inc., REIT | | |
NexPoint Residential Trust, Inc., REIT | | |
Sun Communities, Inc., REIT | | |
| | |
| | |
|
Alexander & Baldwin, Inc., REIT | | |
American Assets Trust, Inc., REIT | | |
Armada Hoffler Properties, Inc., REIT | | |
Broadstone Net Lease, Inc., REIT | | |
Digital Realty Trust, Inc., REIT | | |
| | |
| | |
Farmland Partners, Inc., REIT | | |
Gaming and Leisure Properties, Inc., REIT | | |
Gladstone Commercial Corp., REIT (a) | | |
Gladstone Land Corp., REIT | | |
Global Net Lease, Inc., REIT (a) | | |
InvenTrust Properties Corp., REIT | | |
One Liberty Properties, Inc., REIT | | |
| | |
UMH Properties, Inc., REIT | | |
Veris Residential, Inc., REIT | | |
VICI Properties, Inc., REIT | | |
| | |
| | |
|
CareTrust REIT, Inc., REIT | | |
Community Healthcare Trust, Inc., REIT | | |
Diversified Healthcare Trust, REIT | | |
Global Medical REIT, Inc., REIT | | |
| | |
|
|
Healthcare Realty Trust, Inc., REIT | | |
Healthpeak Properties, Inc., REIT | | |
LTC Properties, Inc., REIT | | |
Medical Properties Trust, Inc., REIT (a) | | |
National Health Investors, Inc., REIT | | |
Omega Healthcare Investors, Inc., REIT | | |
Sabra Health Care REIT, Inc., REIT | | |
Universal Health Realty Income Trust, REIT | | |
| | |
| | |
| | |
|
Apple Hospitality REIT, Inc., REIT | | |
Chatham Lodging Trust, REIT | | |
DiamondRock Hospitality Co., REIT | | |
Host Hotels & Resorts, Inc., REIT | | |
Park Hotels & Resorts, Inc., REIT | | |
Pebblebrook Hotel Trust, REIT | | |
| | |
Ryman Hospitality Properties, Inc., REIT | | |
Service Properties Trust, REIT | | |
Summit Hotel Properties, Inc., REIT | | |
Sunstone Hotel Investors, Inc., REIT | | |
Xenia Hotels & Resorts, Inc., REIT | | |
| | |
|
Americold Realty Trust, Inc., REIT | | |
EastGroup Properties, Inc., REIT | | |
First Industrial Realty Trust, Inc., REIT | | |
Innovative Industrial Properties, Inc., REIT (a) | | |
LXP Industrial Trust, REIT | | |
Plymouth Industrial REIT, Inc., REIT | | |
| | |
Rexford Industrial Realty, Inc., REIT | | |
STAG Industrial, Inc., REIT | | |
Terreno Realty Corp., REIT | | |
| | |
|
Alexandria Real Estate Equities, Inc., REIT | | |
Boston Properties, Inc., REIT | | |
Brandywine Realty Trust, REIT | | |
COPT Defense Properties, REIT | | |
Cousins Properties, Inc., REIT | | |
SEE NOTES TO FINANCIAL STATEMENTS.
| J.P. Morgan Exchange-Traded Funds | |
JPMorgan BetaBuilders MSCI US REIT ETF
SCHEDULE OF PORTFOLIO INVESTMENTSAS OF February 29, 2024 (continued)
| | |
Common Stocks — continued |
|
Douglas Emmett, Inc., REIT (a) | | |
Easterly Government Properties, Inc., REIT (a) | | |
Empire State Realty Trust, Inc., Class A, REIT | | |
Equity Commonwealth, REIT * | | |
Highwoods Properties, Inc., REIT (a) | | |
Hudson Pacific Properties, Inc., REIT (a) | | |
JBG SMITH Properties, REIT | | |
Kilroy Realty Corp., REIT | | |
Paramount Group, Inc., REIT | | |
Peakstone Realty Trust, REIT (a) | | |
Piedmont Office Realty Trust, Inc., Class A, REIT | | |
SL Green Realty Corp., REIT (a) | | |
Vornado Realty Trust, REIT (a) | | |
| | |
|
CBL & Associates Properties, Inc., REIT (a) | | |
Macerich Co. (The), REIT (a) | | |
Simon Property Group, Inc., REIT | | |
| | |
| | |
|
Acadia Realty Trust, REIT | | |
| | |
Brixmor Property Group, Inc., REIT | | |
Federal Realty Investment Trust, REIT | | |
| | |
Kite Realty Group Trust, REIT | | |
NETSTREIT Corp., REIT (a) | | |
Phillips Edison & Co., Inc., REIT (a) | | |
Regency Centers Corp., REIT | | |
Retail Opportunity Investments Corp., REIT | | |
| | |
| | |
Urban Edge Properties, REIT | | |
| | |
| | |
|
| | |
Essential Properties Realty Trust, Inc., REIT | | |
Four Corners Property Trust, Inc., REIT | | |
| | |
| | |
|
Single Tenant — continued |
| | |
Realty Income Corp., REIT | | |
| | |
|
| | |
Extra Space Storage, Inc., REIT | | |
Iron Mountain, Inc., REIT | | |
National Storage Affiliates Trust, REIT (a) | | |
| | |
| | |
Total Common Stocks
(Cost $923,705,972) | | |
Short-Term Investments — 2.7% |
Investment Companies — 0.2% |
JPMorgan U.S. Government Money Market Fund Class IM Shares, 5.25% (b) (c)
(Cost $1,720,296) | | |
Investment of Cash Collateral from Securities Loaned — 2.5% |
JPMorgan Securities Lending Money Market Fund Agency SL Class Shares, 5.48% (b) (c) | | |
JPMorgan U.S. Government Money Market Fund Class IM Shares, 5.25% (b) (c) | | |
Total Investment of Cash Collateral from Securities Loaned
(Cost $19,753,548) | | |
Total Short-Term Investments
(Cost $21,473,844) | | |
Total Investments — 102.3%
(Cost $945,179,816) | | |
Liabilities in Excess of Other Assets — (2.3)% | | |
| | |
Percentages indicated are based on net assets. |
| |
| Real Estate Investment Trust |
| Non-income producing security. |
| The security or a portion of this security is on loan at February 29, 2024. The total value of securities on loan at February 29, 2024 is $19,647,837. |
SEE NOTES TO FINANCIAL STATEMENTS.
| J.P. Morgan Exchange-Traded Funds | |
| Investment in an affiliated fund, which is registered under the Investment Company Act of 1940, as amended, and is advised by J.P. Morgan Investment Management Inc. |
| The rate shown is the current yield as of February 29, 2024. |
Futures contracts outstanding as of February 29, 2024:
| | | | | VALUE AND
UNREALIZED
APPRECIATION
(DEPRECIATION) ($) |
| | | | | |
| | | | | |
SEE NOTES TO FINANCIAL STATEMENTS.
| J.P. Morgan Exchange-Traded Funds | |
STATEMENT OF ASSETS AND LIABILITIESAS OF February 29, 2024
| JPMorgan
BetaBuilders MSCI
US REIT ETF |
| |
Investments in non-affiliates, at value | |
Investments in affiliates, at value | |
Investments of cash collateral received from securities loaned, at value (See Note 2.B.) | |
| |
Deposits at broker for futures contracts | |
| |
Investment securities sold | |
| |
Dividends from non-affiliates | |
Dividends from affiliates | |
Securities lending income (See Note 2.B.) | |
Variation margin on futures contracts | |
| |
| |
| |
Investment securities purchased | |
Collateral received on securities loaned (See Note 2.B.) | |
| |
Management fees (See Note 3.A.) | |
| |
| |
| |
| |
Total distributable earnings (loss) | |
| |
Outstanding number of shares
(unlimited number of shares authorized - par value $0.0001) | |
Net asset value, per share | |
Cost of investments in non-affiliates | |
Cost of investments in affiliates | |
Investment securities on loan, at value (See Note 2.B.) | |
Cost of investment of cash collateral (See Note 2.B.) | |
SEE NOTES TO FINANCIAL STATEMENTS.
| J.P. Morgan Exchange-Traded Funds | |
STATEMENT OF OPERATIONSFOR THE YEAR ENDED February 29, 2024
| JPMorgan
BetaBuilders MSCI
US REIT ETF |
| |
Interest income from non-affiliates | |
Interest income from affiliates | |
Dividend income from non-affiliates | |
Dividend income from affiliates | |
Income from securities lending (net) (See Note 2.B.) | |
| |
| |
Management fees (See Note 3.A.) | |
Interest expense to affiliates | |
| |
Net investment income (loss) | |
REALIZED/UNREALIZED GAINS (LOSSES): | |
Net realized gain (loss) on transactions from: | |
Investments in non-affiliates | |
In-kind redemptions of investments in non-affiliates (See Note 4) | |
| |
| |
Change in net unrealized appreciation/depreciation on: | |
Investments in non-affiliates | |
Investments in affiliates | |
| |
Change in net unrealized appreciation/depreciation | |
Net realized/unrealized gains (losses) | |
Change in net assets resulting from operations | |
SEE NOTES TO FINANCIAL STATEMENTS.
| J.P. Morgan Exchange-Traded Funds | |
STATEMENTS OF CHANGES IN NET ASSETSFOR THE PERIODS INDICATED
| JPMorgan BetaBuilders
MSCI US REIT ETF |
| Year Ended
February 29, 2024 | Year Ended
February 28, 2023 |
CHANGE IN NET ASSETS RESULTING FROM OPERATIONS: | | |
Net investment income (loss) | | |
| | |
Change in net unrealized appreciation/depreciation | | |
Change in net assets resulting from operations | | |
DISTRIBUTIONS TO SHAREHOLDERS: | | |
Total distributions to shareholders | | |
| | |
Change in net assets resulting from capital transactions | | |
| | |
| | |
| | |
| | |
| | |
Proceeds from shares issued | | |
| | |
Total change in net assets resulting from capital transactions | | |
| | |
| | |
| | |
Net increase (decrease) in shares from share transactions | | |
SEE NOTES TO FINANCIAL STATEMENTS.
| J.P. Morgan Exchange-Traded Funds | |
THIS PAGE IS INTENTIONALLY LEFT BLANK
FINANCIAL HIGHLIGHTSFOR THE PERIODS INDICATED
| Per share operating performance |
| | | |
| Net asset
value,
beginning
of period | Net investment
income
(loss) (a) | Net realized
and unrealized
gains
(losses)
on investments | Total from
investment
operations | | | |
JPMorgan BetaBuilders MSCI US REIT ETF | | | | | | | |
Year Ended February 29, 2024 | | | | | | | |
Year Ended February 28, 2023 | | | | | | | |
Year Ended February 28, 2022 | | | | | | | |
Year Ended February 28, 2021 | | | | | | | |
Year Ended February 29, 2020 | | | | | | | |
|
| Calculated based upon average shares outstanding. |
| Includes adjustments in accordance with accounting principles generally accepted in the United States of America and as such, the net asset values for financial reporting purposes and the returns based upon those net asset values may differ from the net asset values and returns for shareholder transactions. |
| Prior to December 9, 2019, market price return was calculated assuming an initial investment made at the market price at the beginning of the reporting period, reinvestment of all dividends and distributions at market price during the period, and sale at the market price on the last day of the period. The price used to calculate the market price return was the midpoint of the bid/ask spread at the close of business on the listing exchange of the Fund. Effective December 9, 2019, the closing price was used to calculate the market price return; however, any prices used in the calculation for market price return prior to December 9, 2019, would have used the midpoint of the bid/ask spread at the close of business on the exchange. |
| Calculation of the net realized and unrealized gains (losses) per share does not correlate with the Fund’s net realized and unrealized gains (losses) presented in the Statement of Operations due to the timing of capital transactions in relation to the fluctuating market values of the Fund’s investments. |
| Prior to November 1, 2019, the Fund may have waived fees if expenses exceeded the expense cap. On November 1, 2019, the Fund adopted a unitary fee structure where a management fee is accrued by the Fund based on prior day net assets and other expenses are paid by the Advisor. |
SEE NOTES TO FINANCIAL STATEMENTS.
| J.P. Morgan Exchange-Traded Funds | |
| |
| | | | | Ratios to average net assets | |
Net asset
value,
end of
period | | | Market
price
total
return (c) | | | Net
investment
income
(loss) | Expenses
without waivers
and reimbursements | |
| | | | | | | | |
| | | | | | | | |
| | | | | | | | |
| | | | | | | | |
| | | | | | | | |
| | | | | | | | |
SEE NOTES TO FINANCIAL STATEMENTS.
| J.P. Morgan Exchange-Traded Funds | |
NOTES TO FINANCIAL STATEMENTSAS OF February 29, 2024
1. Organization
J.P. Morgan Exchange-Traded Fund Trust (the “Trust”) was formed on February 25, 2010, and is governed by a Declaration of Trust as amended and restated February 19, 2014, and is registered under the Investment Company Act of 1940, as amended (the “1940 Act”), as an open-end management investment company. JPMorgan BetaBuilders MSCI US REIT ETF (the “Fund”) is a separate diversified series of the Trust covered in this report.
The investment objective of the Fund is to seek investment results that closely correspond, before fees and expenses, to the performance of the MSCI US REIT Custom Capped Index.
J.P. Morgan Investment Management Inc. (“JPMIM”), an indirect, wholly-owned subsidiary of JPMorgan Chase & Co. (“JPMorgan”), acts as adviser (the “Adviser”) and administrator (the “Administrator”) to the Fund.
Shares of the Fund are listed and traded at market price on the Cboe BZX Exchange, Inc. Market prices for the Fund’s shares may be different from its net asset value (“NAV”). The Fund issues and redeems its shares on a continuous basis, through JPMorgan Distribution Services, Inc. (the “Distributor” or “JPMDS”), an indirect, wholly-owned subsidiary of JPMorgan, at NAV in large blocks of shares, referred to as “Creation Units". Creation Units are issued and redeemed in exchange for a basket of securities and/or cash. Shares are generally traded in the secondary market in amounts less than a Creation Unit at market prices that change throughout the day. Only individuals or institutions that have entered into an authorized participant agreement with the Distributor may do business directly with the Fund (each, an “Authorized Participant”).
2. Significant Accounting Policies
The following is a summary of significant accounting policies followed by the Fund in the preparation of its financial statements. The Fund is an investment company and, accordingly, follows the investment company accounting and reporting guidance of the Financial Accounting Standards Board (“FASB”) Accounting Standards Codification Topic 946 — Investment Companies, which is part of U.S. generally accepted accounting principles (“GAAP”). The preparation of financial statements in conformity with GAAP requires management to make estimates and assumptions that affect (i) the reported amounts of assets and liabilities, (ii) disclosure of contingent assets and liabilities at the date of the financial statements, and (iii) the reported amounts of increases and decreases in net assets from operations during the reporting period. Actual results could differ from those estimates.
A. Valuation of Investments— Investments are valued in accordance with GAAP and the Fund's valuation policies set forth by, and under the supervision and responsibility of, the Board of Trustees of the Trust (the "Board"), which established the following approach to valuation, as described more fully below: (i) investments for which market quotations are readily available shall be valued at their market value and (ii) all other investments for which market quotations are not readily available shall be valued at their fair value as determined in good faith by the Board.
Under Section 2(a)(41) of the 1940 Act, the Board is required to determine fair value for securities that do not have readily available market quotations. Under SEC Rule 2a-5 (Good Faith Determinations of Fair Value), the Board may designate the performance of these fair valuation determinations to a valuation designee. The Board has designated the Adviser as the “Valuation Designee” to perform fair valuation determinations for the Fund on behalf of the Board subject to appropriate oversight by the Board. The Adviser, as Valuation Designee, leverages the J.P. Morgan Asset Management Americas Valuation Committee (“AVC”) to help oversee and carry out the policies for the valuation of investments held in the Fund. The Adviser, as Valuation Designee, remains responsible for the valuation determinations.
This oversight by the AVC includes monitoring the appropriateness of fair values based on results of ongoing valuation oversight including, but not limited to, consideration of macro or security specific events, market events, and pricing vendor and broker due diligence. The Administrator is responsible for discussing and assessing the potential impacts to the fair values on an ongoing basis, and, at least on a quarterly basis, with the AVC and the Board.
Equities and other exchange-traded instruments are valued at the last sale price or official market closing price on the primary exchange on which the instrument is traded before the NAV of the Fund is calculated on a valuation date.
Investments in open-end investment companies (“Underlying Funds”) are valued at each Underlying Fund’s NAV per share as of the report date.
Futures contracts are generally valued on the basis of available market quotations.
Valuations reflected in this report are as of the report date. As a result, changes in valuation due to market events and/or issuer-related events after the report date and prior to issuance of the report are not reflected herein.
The various inputs that are used in determining the valuation of the Fund's investments are summarized into the three broad levels listed below.
•
Level 1 — Unadjusted inputs using quoted prices in active markets for identical investments.
•
Level 2 — Other significant observable inputs including, but not limited to, quoted prices for similar investments, inputs other than quoted prices that are observable for investments (such as interest rates, prepayment speeds, credit risk, etc.) or other market corroborated inputs.
•
Level 3 — Significant inputs based on the best information available in the circumstances, to the extent observable inputs are not available (including the Fund's assumptions in determining the fair value of investments).
| J.P. Morgan Exchange-Traded Funds | |
A financial instrument’s level within the fair value hierarchy is based on the lowest level of any input, both individually and in the aggregate, that is significant to the fair value measurement. The inputs or methodology used for valuing instruments are not necessarily an indication of the risk associated with investing in those instruments.
The following table represents each valuation input as presented on the Schedule of Portfolio Investments ("SOI"):
| | | | |
| | Level 2
Other significant
observable inputs | Level 3
Significant
unobservable inputs | |
Total Investments in Securities (a) | | | | |
Appreciation in Other Financial Instruments | | | | |
| | | | |
|
| Please refer to the SOI for specifics of portfolio holdings. |
B. Securities Lending — The Fund is authorized to engage in securities lending in order to generate additional income. The Fund is able to lend to approved borrowers. Citibank N.A. (“Citibank”) serves as lending agent for the Fund, pursuant to a Securities Lending Agency Agreement (the “Securities Lending Agency Agreement”). Securities loaned are collateralized by cash equal to at least 100% of the market value plus accrued interest on the securities lent, which is invested in the Class IM Shares of the JPMorgan U.S. Government Money Market Fund and the Agency SL Class Shares of the JPMorgan Securities Lending Money Market Fund. The Fund retains the interest earned on cash collateral investments but is required to pay the borrower a rebate for the use of the cash collateral. In cases where the lent security is of high value to borrowers, there may be a negative rebate (i.e., a net payment from the borrower to the Fund). Upon termination of a loan, the Fund is required to return to the borrower an amount equal to the cash collateral, plus any rebate owed to the borrowers. The remaining maturities of the securities lending transactions are considered overnight and continuous. Loans are subject to termination by the Fund or the borrower at any time.
The net income earned on the securities lending (after payment of rebates and Citibank’s fee) is included on the Statement of Operations as Income from securities lending (net). The Fund also receives payments from the borrower during the period of the loan, equivalent to dividends and interest earned on the securities loaned, which are recorded as Dividend or Interest income, respectively, on the Statement of Operations.
Under the Securities Lending Agency Agreement, Citibank marks to market the loaned securities on a daily basis. In the event the cash received from the borrower is less than 102% of the value of the loaned securities (105% for loans of non-U.S. securities), Citibank requests additional cash from the borrower so as to maintain a collateralization level of at least 102% of the value of the loaned securities plus accrued interest (105% for loans of non-U.S. securities), subject to certain de minimis amounts.
The value of securities out on loan is recorded as an asset on the Statement of Assets and Liabilities. The value of the cash collateral received is recorded as a liability on the Statement of Assets and Liabilities and details of collateral investments are disclosed on the SOI.
The Fund bears the risk of loss associated with the collateral investments and is not entitled to additional collateral from the borrower to cover any such losses. To the extent that the value of the collateral investments declines below the amount owed to a borrower, the Fund may incur losses that exceed the amount it earned on lending the security. Upon termination of a loan, the Fund may use leverage (borrow money) to repay the borrower for cash collateral posted if the Adviser does not believe that it is prudent to sell the collateral investments to fund the payment of this liability. Securities lending activity is subject to master netting arrangements.
The following table presents the Fund's value of the securities on loan with Citibank, net of amounts available for offset under the master netting arrangements and any related collateral received or posted by the Fund as of February 29, 2024.
| Investment Securities
on Loan, at value,
Presented on the
Statement of Assets
and Liabilities | Cash Collateral
Posted by Borrower* | Net Amount Due
to Counterparty
(not less than zero) |
| | | |
|
| Collateral posted reflects the value of securities on loan and does not include any additional amounts received from the borrower. |
Securities lending also involves counterparty risks, including the risk that the loaned securities may not be returned in a timely manner or at all. Subject to certain conditions, Citibank has agreed to indemnify the Fund from losses resulting from a borrower’s failure to return a loaned security.
| J.P. Morgan Exchange-Traded Funds | |
NOTES TO FINANCIAL STATEMENTSAS OF February 29, 2024 (continued)
JPMIM voluntarily waived management fees charged to the Fund to reduce the impact of the cash collateral investment in the JPMorgan U.S. Government Money Market Fund from 0.13% to 0.06%. For the year ended February 29, 2024, JPMIM waived fees associated with the Fund's investment in the JPMorgan U.S. Government Money Market Fund. The amount of this waiver was $2,839.
The above waiver is included in the determination of earnings on cash collateral investment and in the calculation of Citibank’s compensation and is included on the Statement of Operations as Income from securities lending (net).
C. Investment Transactions with Affiliates— The Fund invested in Underlying Funds advised by the Adviser. An issuer which is under common control with the Fund may be considered an affiliate. For the purposes of the financial statements, the Fund assumes the issuers listed in the table below to be affiliated issuers. The Underlying Funds’ distributions may be reinvested into such Underlying Funds. Reinvestment amounts are included in the purchases at cost amounts in the table below.
|
For the year ended February 29, 2024 |
| | | | | Change in
Unrealized
Appreciation/
(Depreciation) | | Shares at
February 29,
2024 | | Capital Gain
Distributions |
JPMorgan Securities Lending Money Market Fund Agency SL Class Shares, 5.48% (a) (b) | | | | | | | | | |
JPMorgan U.S. Government Money Market Fund Class IM Shares, 5.25% (a) (b) | | | | | | | | | |
JPMorgan U.S. Government Money Market Fund Class IM Shares, 5.25% (a) (b) | | | | | | | | | |
| | | | | | | | | |
|
| Investment in an affiliated fund, which is registered under the Investment Company Act of 1940, as amended, and is advised by J.P. Morgan Investment Management Inc. |
| The rate shown is the current yield as of February 29, 2024. |
| Amount is included on the Statement of Operations as Income from securities lending (net) (after payments of rebates and Citibank’s fee). |
D. Futures Contracts— The Fund used index futures contracts to gain or reduce exposure to the stock market, or maintain liquidity or minimize transaction costs. The Fund also purchased futures contracts to invest incoming cash in the market or sold futures in response to cash outflows, thereby simulating an invested position in the underlying index while maintaining a cash balance for liquidity.
Futures contracts provide for the delayed delivery of the underlying instrument at a fixed price or are settled for a cash amount based on the change in the value of the underlying instrument at a specific date in the future. Upon entering into a futures contract, the Fund is required to deposit with the broker, cash or securities in an amount equal to a certain percentage of the contract amount, which is referred to as the initial margin deposit. Subsequent payments, referred to as variation margin, are made or received by the Fund periodically and are based on changes in the market value of open futures contracts. Changes in the market value of open futures contracts are recorded as Change in net unrealized appreciation/depreciation on futures contracts on the Statement of Operations. Realized gains or losses, representing the difference between the value of the contract at the time it was opened and the value at the time it was closed, are reported on the Statement of Operations at the closing or expiration of the futures contract. Securities deposited as initial margin are designated on the SOI, while cash deposited, which is considered restricted, is recorded on the Statement of Assets and Liabilities. A receivable from and/or a payable to brokers for the daily variation margin is also recorded on the Statement of Assets and Liabilities.
The use of futures contracts exposes the Fund to equity price risk. The Fund may be subject to the risk that the change in the value of the futures contract may not correlate perfectly with the underlying instrument. Use of long futures contracts subjects the Fund to risk of loss in excess of the amounts shown on the Statement of Assets and Liabilities, up to the notional amount of the futures contracts. Use of short futures contracts subjects the Fund to unlimited risk of loss. The Fund may enter into futures contracts only on exchanges or boards of trade. The exchange or board of trade acts as the counterparty to each futures transaction; therefore, the Fund's credit risk is limited to failure of the exchange or board of trade. Under some circumstances, futures exchanges may establish daily limits on the amount that the price of a futures contract can vary from the previous day’s settlement price, which could effectively prevent liquidation of positions.
The Fund's futures contracts are not subject to master netting arrangements (the right to close out all transactions traded with a counterparty and net amounts owed or due across transactions).
| J.P. Morgan Exchange-Traded Funds | |
The table below discloses the volume of the Fund's futures contracts activity during the year ended February 29, 2024:
| |
| |
Average Notional Balance Long | |
Ending Notional Balance Long | |
E. Security Transactions and Investment Income— Investment transactions are accounted for on the trade date (the date the order to buy or sell is executed). Securities gains and losses are calculated on a specifically identified cost basis. Dividend income is recorded on the ex-dividend date or when the Fund first learns of the dividend.
To the extent such information is publicly available, the Fund records distributions received in excess of income earned from underlying investments as a reduction of cost of investments and/or realized gain. Such amounts are based on estimates if actual amounts are not available and actual amounts of income, realized gain and return of capital may differ from the estimated amounts. The Fund adjusts the estimated amounts of the components of distributions (and consequently its net investment income) as necessary, once the issuers provide information about the actual composition of the distributions.
F. Federal Income Taxes— The Fund is treated as a separate taxable entity for Federal income tax purposes. The Fund's policy is to comply with the provisions of the Internal Revenue Code (the “Code”) applicable to regulated investment companies and to distribute to shareholders all of its distributable net investment income and net realized capital gains on investments. Accordingly, no provision for Federal income tax is necessary. Management has reviewed the Fund's tax positions for all open tax years and has determined that as of February 29, 2024, no liability for Federal income tax is required in the Fund's financial statements for net unrecognized tax benefits. However, management’s conclusions may be subject to future review based on changes in, or the interpretation of, the accounting standards or tax laws and regulations. The Fund's Federal tax returns for the prior three fiscal years remain subject to examination by the Internal Revenue Service.
G. Distributions to Shareholders— Distributions from net investment income, if any, are generally declared and paid at least quarterly. Net realized capital gains, if any, are distributed at least annually. The amount of distributions from net investment income and net realized capital gains is determined in accordance with Federal income tax regulations, which may differ from GAAP. To the extent these “book/tax” differences are permanent in nature (i.e., that they result from other than timing of recognition — “temporary differences”), such amounts are reclassified within the capital accounts based on their Federal tax basis treatment.
The following amounts were reclassified within the capital accounts:
| | Accumulated
undistributed
(distributions in
excess of)
net investment
income | Accumulated
net realized
gains (losses) |
| | | |
The reclassifications for the Fund relate primarily to redemptions in-kind.
3. Fees and Other Transactions with Affiliates
A. Management Fee— JPMIM manages the investments of the Fund pursuant to the Management Agreement. For such services, JPMIM is paid a fee, which is accrued daily and paid no more frequently than monthly at an annual rate of 0.11% of the Fund's average daily net assets.
Under the Management Agreement, JPMIM is responsible for substantially all expenses of the Fund, (including expenses of the Trust relating to the Fund), except for the management fee, payments under the Fund's 12b-1 plan (if any), interest expenses, dividend and interest expenses related to short sales, taxes, acquired fund fees and expenses (other than fees for funds advised by the Adviser and/or its affiliates), costs of holding shareholder meetings, and litigation and potential litigation and other extraordinary expenses not incurred in the ordinary course of the Fund’s business. Additionally, the Fund is responsible for its non-operating expenses, including brokerage commissions and fees and expenses associated with the Fund’s securities lending program, if applicable. For the avoidance of doubt, the Adviser’s payment of such expenses may be accomplished through the Fund’s payment of such expenses and a corresponding reduction in the fee payable to the Adviser, provided, however, that if the amount of expenses paid by the Fund exceeds the fee payable to the Adviser, the Adviser will reimburse the Fund for such amount.
B. Administration Fee— JPMIM provides administration services to the Fund. Pursuant to the Management Agreement for the Fund, JPMIM is compensated as described in Note 3.A.
JPMorgan Chase Bank, N.A. (“JPMCB”), a wholly-owned subsidiary of JPMorgan, serves as the Fund's sub-administrator (the “Sub-administrator”). For its services as Sub-administrator, JPMCB receives a portion of the management fees payable to JPMIM.
| J.P. Morgan Exchange-Traded Funds | |
NOTES TO FINANCIAL STATEMENTSAS OF February 29, 2024 (continued)
C. Custodian, Accounting and Transfer Agent Fees— JPMCB provides custody, accounting and transfer agency services to the Fund. For performing these services, JPMIM pays JPMCB transaction and asset-based fees that vary according to the number of transactions and positions, plus out-of-pocket expenses.
Additionally, Authorized Participants generally pay transaction fees associated with the creation and redemption of Fund shares. These fees are paid to JPMIM to offset certain custodian charges that are covered by the Management Agreement.
Interest income earned on cash balances at the custodian, if any, is included in Interest income from affiliates on the Statement of Operations.
Interest expense paid to the custodian related to cash overdrafts, if any, is included in Interest expense to affiliates on the Statement of Operations.
D. Distribution Services— The Distributor or its agent distributes Creation Units for the Fund on an agency basis. The Distributor does not maintain a secondary market in shares of the Fund. JPMDS receives no fees for their distribution services under the distribution agreement with the Trust (the “Distribution Agreement”). Although the Trust does not pay any fees under the Distribution Agreement, JPMIM pays JPMDS for certain distribution related services.
E. Waivers and Reimbursements— The Fund may invest in one or more money market funds advised by the Adviser (affiliated money market funds). The fees for the affiliated money market funds, except for investments of securities lending cash collateral, are covered under the Management Agreement as described in Note 3.A.
F. Other— Certain officers of the Trust are affiliated with the Adviser, the Administrator and JPMDS. Such officers receive no compensation from the Fund for serving in their respective roles.
The Board designated and appointed a Chief Compliance Officer to the Fund pursuant to Rule 38a-1 under the 1940 Act. The fees associated with the office of the Chief Compliance Officer are paid for by JPMIM as described in Note 3.A.
The Securities and Exchange Commission ("SEC") has granted an exemptive order permitting the Fund to engage in principal transactions with J.P. Morgan Securities LLC, an affiliated broker, involving taxable money market instruments, subject to certain conditions.
4. Investment Transactions
During the year ended February 29, 2024, purchases and sales of investments (excluding short-term investments) were as follows:
| Purchases
(excluding
U.S. Government) | Sales
(excluding
U.S. Government) |
| | |
During the year ended February 29, 2024, there were no purchases or sales of U.S. Government securities.
For the year ended February 29, 2024, in-kind transactions associated with creations and redemptions were as follows:
During the year ended February 29, 2024, the Fund delivered portfolio securities for the redemption of Fund shares (in-kind redemptions). Cash and portfolio securities were transferred for redemptions at fair value. For financial reporting purposes, the Fund recorded net realized gains and losses in connection with each in-kind redemption transaction.
5. Federal Income Tax Matters
For Federal income tax purposes, the estimated cost and unrealized appreciation (depreciation) in value of investments held at February 29, 2024 were as follows:
| | Gross
Unrealized
Appreciation | Gross
Unrealized
Depreciation | Net Unrealized
Appreciation
(Depreciation) |
| | | | |
The difference between book and tax basis appreciation (depreciation) on investments is primarily attributed to wash sale loss deferrals.
| J.P. Morgan Exchange-Traded Funds | |
The tax character of distributions paid during the year ended February 29, 2024 was as follows:
|
| Short-term gain distributions are treated as ordinary income for income tax purposes. |
The tax character of distributions paid during the year ended February 28, 2023 was as follows:
|
| Short-term gain distributions are treated as ordinary income for income tax purposes. |
As of February 29, 2024, the estimated components of net assets (excluding paid-in-capital) on a tax basis were as follows:
| Current
Distributable
Ordinary
Income | Current
Distributable
Long-Term
Capital Gain
(Tax Basis Capital
Loss Carryover) | Unrealized
Appreciation
(Depreciation) |
| | | |
The cumulative timing differences primarily consist of post-October capital loss deferrals and wash sale loss deferrals.
At February 29, 2024, the Fund had net capital loss carryforwards which are available to offset future realized gains as follows:
| Capital Loss Carryforward Character |
| | |
| | |
Net capital losses (gains) incurred after October 31, and within the taxable year are deemed to arise on the first business day of the Fund's next taxable year. For the year ended February 29, 2024, the Fund deferred to March 1, 2024 the following net capital losses (gains) of:
| Net Capital Losses (Gains) |
| | |
| | |
6. Capital Share Transactions
The Trust issues and redeems shares of the Fund only in Creation Units through the Distributor at NAV. Capital shares transactions detail can be found in the Statement of Changes in Net Assets.
Shares of the Fund may only be purchased or redeemed by Authorized Participants. Such Authorized Participants may from time to time hold, of record or beneficially, a substantial percentage of the Fund's shares outstanding and act as executing or clearing broker for investment transactions on behalf of the Fund. An Authorized Participant is either (1) a “Participating Party” or other participant in the clearing process through the Continuous Net Settlement System of the National Securities Clearing Corporation (“NSCC”); or (2) a DTC Participant; which, in either case, must have executed an agreement with the Distributor.
7. Borrowings
Effective November 1, 2022, the Fund relies upon an exemptive order granted by the SEC (the “Order”) permitting the establishment and operation of an Interfund Lending Facility (the “Facility”). The Facility allows the Fund to directly lend and borrow money to or from any other fund relying
| J.P. Morgan Exchange-Traded Funds | |
NOTES TO FINANCIAL STATEMENTSAS OF February 29, 2024 (continued)
upon the Order at rates beneficial to both the borrowing and lending funds. Advances under the Facility are taken primarily for temporary or emergency purposes, including the meeting of redemption requests that otherwise might require the untimely disposition of securities, and are subject to the Fund's borrowing restrictions. The interfund loan rate is determined, as specified in the Order, by averaging the current repurchase agreement rate and the current bank loan rate. The Order was granted to JPMorgan Trust II and may be relied upon by the Fund because the Fund and the series of JPMorgan Trust II are all investment companies in the same “group of investment companies” (as defined in Section 12(d)(1)(G) of the 1940 Act).
The Fund had no borrowings outstanding from another fund, or loans outstanding to another fund, during the year ended February 29, 2024.
The Trust and JPMCB have entered into a financing arrangement. Under this arrangement, JPMCB provides an unsecured, uncommitted credit facility in the aggregate amount of $100 million to certain of the J.P. Morgan Funds, including the Fund. Advances under the arrangement are taken primarily for temporary or emergency purposes, including the meeting of redemption requests that otherwise might require the untimely disposition of securities, and are subject to the Fund's borrowing restrictions. Interest on borrowings is payable at a rate determined by JPMCB at the time of borrowing. This agreement has been extended until October 29, 2024.
The Fund had no borrowings outstanding from the unsecured, uncommitted credit facility during the year ended February 29, 2024.
Effective August 8, 2023, the Trust, along with certain other trusts for J.P. Morgan Funds (“Borrowers”), has entered into an existing joint syndicated senior unsecured revolving credit facility totaling $1.5 billion (“Credit Facility”) with various lenders and The Bank of New York Mellon, as administrative agent for the lenders. Although the Trust is effectively part of the Credit Facility as of August 8, 2023, it is not eligible to draw on the Credit Facility, and will not incur costs associated with being a part of the Credit Facility, until on or about May 28, 2024.
This Credit Facility provides a source of funds to the Borrowers for temporary and emergency purposes, including the meeting of redemption requests that otherwise might require the untimely disposition of securities. Under the terms of the Credit Facility, a borrowing fund must have a minimum of $25 million in adjusted net asset value and not exceed certain adjusted net asset coverage ratios prior to and during the time in which any borrowings are outstanding. If a fund does not comply with the aforementioned requirements, the fund must remediate within three business days with respect to the $25 million minimum adjusted net asset value or within one business day with respect to certain asset coverage ratios or the administrative agent at the request of, or with the consent of, the lenders may terminate the Credit Facility and declare any outstanding borrowings to be due and payable immediately.
Interest associated with any borrowing under the Credit Facility is charged to the borrowing fund at a rate of interest equal to 1.00% (the “Applicable Margin”), plus the greater of the federal funds effective rate or the one-month Adjusted Secured Overnight Financing Rate (“SOFR”). Effective August 8, 2023, the Credit Facility has been amended and restated for a term of 364 days, unless extended.
The Fund did not utilize the Credit Facility during the year ended February 29, 2024.
8. Risks, Concentrations and Indemnifications
In the normal course of business, the Fund enters into contracts that contain a variety of representations which provide general indemnifications. The Fund's maximum exposure under these arrangements is unknown. The amount of exposure would depend on future claims that may be brought against the Fund. However, based on experience, the Fund expects the risk of loss to be remote.
As of February 29, 2024, JPMorgan SmartRetirement Funds and JPMorgan SmartRetirement Blend Funds, which are affiliated funds of funds, each owned in the aggregate, shares representing more than 10% of the net assets of the Fund as follows:
| JPMorgan
SmartRetirement
Funds | JPMorgan
SmartRetirement
Blend Funds |
| | |
Significant shareholder transactions by these shareholders may impact the Fund's performance and liquidity.
Derivatives may be riskier than other types of investments because they may be more sensitive to changes in economic and market conditions and could result in losses that significantly exceed the Fund’s original investment. Many derivatives create leverage thereby causing the Fund to be more volatile than they would have been if they had not used derivatives. Derivatives also expose the Fund to counterparty risk (the risk that the derivative counterparty will not fulfill its contractual obligations), including credit risk of the derivative counterparty. The possible lack of a liquid secondary market for derivatives and the resulting inability of the Fund to sell or otherwise close a derivatives position could expose the Fund to losses.
Disruptions to creations and redemptions, the existence of significant market volatility or potential lack of an active trading market for the shares (including through a trading halt), as well as other factors, may result in shares trading significantly above (at a premium) or below (at a discount) to the NAV or to the intraday value of the Fund’s holdings. During such periods, investors may incur significant losses if shares are sold.
| J.P. Morgan Exchange-Traded Funds | |
The Fund may not track the return of its underlying index for a number of reasons and therefore may not achieve its investment objective. For example, the Fund incurs a number of operating expenses not applicable to its underlying index, and incurs costs in buying and selling securities, especially when rebalancing the Fund’s securities holdings to reflect changes in the composition of the underlying index. In addition, the Fund’s return may differ from the return of its underlying index as a result of, among other things, pricing differences and the inability to purchase certain securities included in the underlying index due to regulatory or other restrictions. To the extent of the previously outlined items, the Fund’s return may differ from the return of the underlying index.
Because the Fund invests in Real Estate Investment Trusts (“REITs”), the Fund may be subject to certain risks similar to those associated with direct investments in real estate. REITs may be affected by changes in the value of their underlying properties and by defaults by tenants. REITs depend generally on their ability to generate cash flow to make distributions to shareholders, and certain REITs have self-liquidation provisions by which mortgages held may be paid in full and distributions of capital returns may be made at any time.
London Interbank Offered Rate (“LIBOR”) was a leading floating rate benchmark used in loans, notes, derivatives and other instruments or investments. As a result of benchmark reforms, publication of most LIBOR settings has ceased. Some LIBOR settings continue to be published but only on a temporary, synthetic and non-representative basis. Regulated entities have generally ceased entering into new LIBOR contracts in connection with regulatory guidance or prohibitions. Public and private sector actors have worked to establish alternative reference rates to be used in place of LIBOR. There is no assurance that any such alternative reference rate will be similar to or produce the same value or economic equivalence as LIBOR or that it will have the same volume or liquidity as did LIBOR which may affect the value, volatility, liquidity or return on certain of the Fund's loans, notes, derivatives and other instruments or investments comprising some or all of the Fund's investments and result in costs incurred in connection with changing reference rates used for positions, closing out positions and entering into new trades. Certain of the Fund's investments may have transitioned from LIBOR or will transition from LIBOR in the future. The transition from LIBOR to alternative reference rates may result in operational issues for the Fund or its investments. No assurances can be given as to the impact of the LIBOR transition (and the timing of any such impact) on the Fund and its investments.
The Fund is subject to infectious disease epidemics/pandemics risk. For example, the outbreak of COVID-19 negatively affected economies, markets and individual companies throughout the world, including those in which the Fund invests. The effects of any future pandemic or other global event to business and market conditions may have a significant negative impact on the performance of the Fund's investments, increase the Fund's volatility, exacerbate other pre-existing political, social and economic risks to the Fund and negatively impact broad segments of businesses and populations. In addition, governments, their regulatory agencies, or self-regulatory organizations have taken or may take actions in response to a pandemic or other global event that affect the instruments in which the Fund invests, or the issuers of such instruments, in ways that could have a significant negative impact on the Fund’s investment performance. The ultimate impact of any pandemic or other global event and the extent to which the associated conditions and governmental responses impact the Fund will also depend on future developments, which are highly uncertain, difficult to accurately predict and subject to frequent changes.
| J.P. Morgan Exchange-Traded Funds | |
REPORT OF INDEPENDENT REGISTERED PUBLIC ACCOUNTING FIRM
To the Board of Trustees of J.P. Morgan Exchange-Traded Fund Trust and Shareholders of JPMorgan BetaBuilders MSCI US REIT ETF
Opinion on the Financial Statements
We have audited the accompanying statement of assets and liabilities, including the schedule of portfolio investments, of JPMorgan BetaBuilders MSCI US REIT ETF (one of the funds constituting J.P. Morgan Exchange-Traded Fund Trust, referred to hereafter as the "Fund") as of February 29, 2024, the related statement of operations for the year ended February 29, 2024, the statement of changes in net assets for each of the two years in the period ended February 29, 2024, including the related notes, and the financial highlights for each of the five years in the period ended February 29, 2024 (collectively referred to as the “financial statements”). In our opinion, the financial statements present fairly, in all material respects, the financial position of the Fund as of February 29, 2024, the results of its operations for the year then ended, the changes in its net assets for each of the two years in the period ended February 29, 2024 and the financial highlights for each of the five years in the period ended February 29, 2024 in conformity with accounting principles generally accepted in the United States of America.
Basis for Opinion
These financial statements are the responsibility of the Fund’s management. Our responsibility is to express an opinion on the Fund’s financial statements based on our audits. We are a public accounting firm registered with the Public Company Accounting Oversight Board (United States) (PCAOB) and are required to be independent with respect to the Fund in accordance with the U.S. federal securities laws and the applicable rules and regulations of the Securities and Exchange Commission and the PCAOB.
We conducted our audits of these financial statements in accordance with the standards of the PCAOB. Those standards require that we plan and perform the audit to obtain reasonable assurance about whether the financial statements are free of material misstatement, whether due to error or fraud.
Our audits included performing procedures to assess the risks of material misstatement of the financial statements, whether due to error or fraud, and performing procedures that respond to those risks. Such procedures included examining, on a test basis, evidence regarding the amounts and disclosures in the financial statements. Our audits also included evaluating the accounting principles used and significant estimates made by management, as well as evaluating the overall presentation of the financial statements. Our procedures included confirmation of securities owned as of February 29, 2024 by correspondence with the custodian, transfer agent and brokers; when replies were not received from brokers, we performed other auditing procedures. We believe that our audits provide a reasonable basis for our opinion.
/s/ PricewaterhouseCoopers LLP
New York, New York
April 24, 2024
We have served as the auditor of one or more investment companies in the JPMorgan Funds complex since 1993.
| J.P. Morgan Exchange-Traded Funds | |
The Fund's Statement of Additional Information includes additional information about the Fund's Trustees and is available, without charge, upon request by calling 1-844-457-6383 or on the J.P. Morgan Funds’ website at www.jpmorganfunds.com.
Name (Year of Birth);
Positions With
the Funds (1) | Principal Occupation
During Past 5 Years | Number of
Funds in Fund
Complex Overseen
by Trustee (2) | Other Directorships Held
During the Past 5 Years |
| |
John F. Finn (1947); Chair
since 2020; Trustee since 1998. | Chairman, Gardner, Inc. (supply chain management company serving industrial and consumer markets) (serving in various roles 1974-present). | | Director, Greif, Inc. (GEF) (industrial package products and services) (2007-2023); Trustee, Columbus Association for the Performing Arts (1988-present). |
Stephen P. Fisher (1959);
Trustee since 2018. | Retired; Chairman and Chief Executive Officer, NYLIFE Distributors LLC (registered broker-dealer) (serving in various roles 2008-2013); Chairman, NYLIM Service Company LLC (transfer agent) (2008-2017); New York Life Investment Management LLC (registered investment adviser) (serving in various roles 2005-2017); Chairman, IndexIQ Advisors LLC (registered investment adviser for ETFs) (2014-2017); President, MainStay VP Funds Trust (2007-2017), MainStay DefinedTerm Municipal Opportunities Fund (2011-2017) and MainStay Funds Trust (2007-2017) (registered investment companies). | | |
Gary L. French (1951);
Trustee since 2014. | Real Estate Investor (2011-2020); Investment management industry Consultant and Expert Witness (2011-present); Senior Consultant for The Regulatory Fundamentals Group LLC (2011-2017). | | Independent Trustee, The China Fund, Inc. (2013-2019); Exchange Traded Concepts Trust II (2012-2014); Exchange Traded Concepts Trust I (2011-2014). |
Kathleen M. Gallagher (1958);
Trustee since 2018. | Retired; Chief Investment Officer — Benefit Plans, Ford Motor Company (serving in various roles 1985-2016). | | Non- Executive Director, Legal & General Investment Management (Holdings) (2018-present); Non-Executive Director, Legal & General Investment Management America (U.S. Holdings) (financial services and insurance) (2017-present); Advisory Board Member, State Street Global Advisors Total Portfolio Solutions (2017-present); Member, Client Advisory Council, Financial Engines, LLC (registered investment adviser) (2011-2016); Director, Ford Pension Funds Investment Management Ltd. (2007-2016). |
Robert J. Grassi (1957);
Trustee since 2014. | Sole Proprietor, Academy Hills Advisors LLC (2012-present); Pension Director, Corning Incorporated (2002-2012). | | |
| J.P. Morgan Exchange-Traded Funds | |
TRUSTEES(Unaudited) (continued)
Name (Year of Birth); Positions With the Funds (1) | Principal Occupation During Past 5 Years | Number of Funds in Fund Complex Overseen by Trustee (2) | Other Directorships Held During the Past 5 Years |
Independent Trustees (continued) | |
Frankie D. Hughes (1952);
Trustee since 2008. | President, Ashland Hughes Properties (property management) (2014-present); President and Chief Investment Officer, Hughes Capital Management, Inc. (fixed income asset management) (1993-2014). | | |
Raymond Kanner (1953);
Trustee since 2017. | Retired; Managing Director and Chief Investment Officer, IBM Retirement Funds (2007-2016). | | Advisory Board Member, Penso Advisors, LLC (2020-present); Advisory Board Member, Los Angeles Capital (2018-present); Advisory Board Member, State Street Global Advisors Total Portfolio Solutions (2017- present); Acting Executive Director, Committee on Investment of Employee Benefit Assets (CIEBA) (2016-2017); Advisory Board Member, Betterment for Business (robo advisor) (2016- 2017); Advisory Board Member, BlueStar Indexes (index creator) (2013-2017); Director, Emerging Markets Growth Fund (registered investment company) (1997-2016); Member, Russell Index Client Advisory Board (2001-2015). |
Thomas P. Lemke (1954);
Trustee since 2014. | | | (1) Independent Trustee of Advisors’ Inner Circle III fund platform, consisting of the following: (i) the Advisors’ Inner Circle Fund III, (ii) the Gallery Trust, (iii) the Schroder Series Trust, (iv) the Delaware Wilshire Private Markets Fund (since 2020), (v) Chiron Capital Allocation Fund Ltd., and (vi) formerly the Winton Diversified Opportunities Fund (2014-2018); and (2) Independent Trustee of the Symmetry Panoramic Trust (since 2018). |
Lawrence R. Maffia (1950);
Trustee since 2014. | Retired; Director and President, ICI Mutual Insurance Company (2006-2013). | | Director, ICI Mutual Insurance Company (1999-2013). |
Mary E. Martinez (1960); Vice
Chair since 2021; Trustee since 2013. | Associate, Special Properties, a Christie’s International Real Estate Affiliate (2010-present); Managing Director, Bank of America (asset management) (2007-2008); Chief Operating Officer, U.S. Trust Asset Management, U.S. Trust Company (asset management) (2003-2007); President, Excelsior Funds (registered investment companies) (2004-2005). | | |
Marilyn McCoy (1948);
Trustee since 1999. | Retired; Vice President of Administration and Planning, Northwestern University (1985-2023). | | |
| J.P. Morgan Exchange-Traded Funds | |
Name (Year of Birth); Positions With the Funds (1) | Principal Occupation During Past 5 Years | Number of Funds in Fund Complex Overseen by Trustee (2) | Other Directorships Held During the Past 5 Years |
Independent Trustees (continued) | |
Dr. Robert A. Oden, Jr. (1946); Trustee
since 1997. | Retired; President, Carleton College (2002-2010); President, Kenyon College (1995-2002). | | Trustee, The Coldwater Conservation Fund (2017-present); Trustee, American Museum of Fly Fishing (2013-present); Trustee and Vice Chair, Trout Unlimited (2017-2021); Trustee, Dartmouth- Hitchcock Medical Center (2011-2020). |
Marian U. Pardo* (1946);
Trustee since 2013. | Managing Director and Founder, Virtual Capital Management LLC (investment consulting) (2007-present); Managing Director, Credit Suisse Asset Management (portfolio manager) (2003-2006). | | Board Chair and Member, Board of Governors, Columbus Citizens Foundation (not-for-profit supporting philanthropic and cultural programs) (2006-present). |
Emily A. Youssouf (1951);
Trustee since 2014. | Adjunct Professor (2011-present) and Clinical Professor (2009-2011), NYU Schack Institute of Real Estate; Board Member and Member of the Audit Committee (2013–present), Chair of Finance Committee (2019-present), Member of Related Parties Committee (2013-2018) and Member of the Enterprise Risk Committee (2015-2018), PennyMac Financial Services, Inc.; Board Member (2005-2018), Chair of Capital Committee (2006-2016), Chair of Audit Committee (2005-2018), Member of Finance Committee (2005-2018) and Chair of IT Committee (2016-2018), NYC Health and Hospitals Corporation. | | Trustee, NYC School Construction Authority (2009-present); Board Member, NYS Job Development Authority (2008-present); Trustee and Chair of the Audit Committee of the Transit Center Foundation (2015-2019). |
| |
Robert F. Deutsch** (1957);
Trustee since 2014. | Retired; Head of ETF Business for JPMorgan Asset Management (2013-2017); Head of Global Liquidity Business for JPMorgan Asset Management (2003-2013). | | Treasurer and Director of the JUST Capital Foundation (2017-present). |
Nina O. Shenker** (1957);
Trustee since 2022. | Vice Chair (2017-2021), General Counsel and Managing Director (2008-2016), Associate General Counsel and Managing Director (2004-2008), J.P. Morgan Asset & Wealth Management. | | Director and Member of Legal and Human Resources Subcommittees, American Jewish Joint Distribution Committee (2018-present). |
|
| The year shown is the first year in which a Trustee became a member of any of the following: the JPMorgan Mutual Fund Board, the JPMorgan ETF Board, the heritage J.P. Morgan Funds or the heritage One Group Mutual Funds. Trustees serve an indefinite term, until resignation, retirement, removal or death. The Board's current retirement policy sets retirement at the end of the calendar year in which the Trustee attains the age of 75, provided that any Board member who was a member of the JPMorgan Mutual Fund Board prior to January 1, 2022 and was born prior to January 1, 1950 shall retire from the Board at the end of the calendar year in which the Trustee attains the age of 78. |
| A Fund Complex means two or more registered investment companies that hold themselves out to investors as related companies for purposes of investment and investor services or have a common investment adviser or have an investment adviser that is an affiliated person of the investment adviser of any of the other registered investment companies. The J.P. Morgan Funds Complex for which the Board of Trustees serves currently includes eight registered investment companies (167 J.P. Morgan Funds). |
| In connection with prior employment with JPMorgan Chase, Ms. Pardo was the recipient of non-qualified pension plan payments from JPMorgan Chase in the amount of approximately $2,055 per month, which she irrevocably waived effective January 1, 2013, and deferred compensation payments from JPMorgan Chase in the amount of approximately $7,294 per year, which ended in January 2013. In addition, Ms. Pardo receives payments from a fully-funded qualified plan, which is not an obligation of JPMorgan Chase. |
| J.P. Morgan Exchange-Traded Funds | |
TRUSTEES(Unaudited) (continued)
| Designation as an “Interested Trustee” is based on prior employment by the Adviser or an affiliate of the Adviser or interests in a control person of the Adviser. |
| The contact address for each of the Trustees is 277 Park Avenue, New York, NY 10172. |
| J.P. Morgan Exchange-Traded Funds | |
Name (Year of Birth),
Positions Held with
the Trust (Since) | Principal Occupations During Past 5 Years |
Brian S. Shlissel (1964),
President and Principal Executive
Officer (2021) | Managing Director and Chief Administrative Officer for J.P. Morgan pooled vehicles, J.P. Morgan Investment Management Inc. since 2014. |
Timothy J. Clemens (1975),
Treasurer and Principal Financial
Officer (2020) | Managing Director, J.P. Morgan Investment Management Inc. Mr. Clemens has been with J.P. Morgan Investment Management Inc. since 2013. |
Gregory S. Samuels (1980),
Secretary (2022) (formerly Assistant
Secretary 2014-2022) | Managing Director and Assistant General Counsel, JPMorgan Chase & Co. Mr. Samuels has been with JPMorgan Chase & Co. since 2010. |
Stephen M. Ungerman (1953),
Chief Compliance Officer (2014) | Managing Director, JPMorgan Chase & Co. Mr. Ungerman has been with JPMorgan Chase & Co. since 2000. |
Kiesha Astwood-Smith (1973),
Assistant Secretary (2021) | Vice President and Assistant General Counsel, JPMorgan Chase & Co. since June 2021; Senior Director and Counsel, Equitable Financial Life Insurance Company (formerly, AXA Equitable Life Insurance Company) from September 2015 through June 2021. |
Matthew Beck (1988),
Assistant Secretary (2021)* | Vice President and Assistant General Counsel, JPMorgan Chase & Co. since May 2021; Senior Legal Counsel, Ultimus Fund Solutions from May 2018 through May 2021; General Counsel, The Nottingham Company from April 2014 through May 2018. |
Elizabeth A. Davin (1964),
Assistant Secretary (2022)
(formerly Secretary 2018-2022)* | Executive Director and Assistant General Counsel, JPMorgan Chase & Co. Ms. Davin has been with JPMorgan Chase & Co. (formerly Bank One Corporation) since 2004. |
Jessica K. Ditullio (1962),
Assistant Secretary (2014)* | Executive Director and Assistant General Counsel, JPMorgan Chase & Co. Ms. Ditullio has been with JPMorgan Chase & Co. (formerly Bank One Corporation) since 1990. |
Anthony Geron (1971),
Assistant Secretary (2019) | Vice President and Assistant General Counsel, JPMorgan Chase & Co. since September 2018; Lead Director and Counsel, AXA Equitable Life Insurance Company from 2015 to 2018 and Senior Director and Counsel, AXA Equitable Life Insurance Company from 2014 to 2015. |
Carmine Lekstutis (1980),
Assistant Secretary (2014) | Executive Director and Assistant General Counsel, JPMorgan Chase & Co. Mr. Lekstutis has been with JPMorgan Chase & Co. since 2011. |
Max Vogel (1990),
Assistant Secretary (2021) | Vice President and Assistant General Counsel, JPMorgan Chase & Co. since June 2021; Associate, Proskauer Rose LLP (law firm) from March 2017 to June 2021. |
Zachary E. Vonnegut-Gabovitch
(1986),
Assistant Secretary (2017) | Executive Director and Assistant General Counsel, JPMorgan Chase & Co. Mr. Vonnegut-Gabovitch has been with JPMorgan Chase & Co. since September 2016. |
Frederick J. Cavaliere (1978),
Assistant Treasurer (2015)** | Executive Director, J.P. Morgan Investment Management Inc. Mr. Cavaliere has been with JPMorgan Chase & Co. since May 2006. |
Michael M. D’Ambrosio (1969),
Assistant Treasurer (2014) | Managing Director, J.P. Morgan Investment Management Inc. Mr. D’Ambrosio has been with J.P. Morgan Investment Management Inc. since 2012. |
Aleksandr Fleytekh (1972),
Assistant Treasurer (2023) | Executive Director, J.P. Morgan Investment Management Inc. Mr. Fleytekh has been with J.P. Morgan Investment Management Inc. since February 2012. |
Shannon Gaines (1977),
Assistant Treasurer (2019)* | Executive Director, J.P. Morgan Investment Management Inc. Mr. Gaines has been with J.P. Morgan Investment Management Inc. since January 2014. |
Jeffrey D. House (1972),
Assistant Treasurer (2023)* | Vice President, J.P. Morgan Investment Management Inc. Mr. House has been with J.P. Morgan Investment Management Inc. since July 2006. |
Michael Mannarino (1985),
Assistant Treasurer (2023) | Vice President, J.P. Morgan Investment Management Inc. Mr. Mannarino has been with J.P. Morgan Investment Management Inc. since 2014. |
| J.P. Morgan Exchange-Traded Funds | |
OFFICERS(Unaudited) (continued)
Nektarios E. Manolakakis (1972),
Assistant Treasurer (2020) | Executive Director, J.P. Morgan Investment Management Inc. since February 2021, formerly Vice President, J.P. Morgan Investment Management Inc. since 2014; Vice President, J.P. Morgan Corporate & Investment Bank 2010-2014. |
Todd McEwen (1981),
Assistant Treasurer (2020)* | Executive Director, J.P. Morgan Investment Management Inc. Mr. McEwen has been with J.P. Morgan Investment Management Inc. since 2010. |
Joseph Parascondola (1963),
Assistant Treasurer (2023)** | Executive Director, J.P. Morgan Investment Management Inc. Mr. Parascondola has been with J.P. Morgan Investment Management Inc. since 2006. |
Gillian I. Sands (1969),
Assistant Treasurer (2023) | Executive Director, J.P. Morgan Investment Management Inc. Ms. Sands has been with J.P. Morgan Investment Management Inc. since September 2012. |
|
The contact address for each of the officers, unless otherwise noted, is 277 Park Avenue, New York, NY 10172. |
| The contact address for the officer is 1111 Polaris Parkway, Columbus, OH 43240. |
| The contact address for the officer is 575 Washington Boulevard, Jersey City, NJ 07310. |
| J.P. Morgan Exchange-Traded Funds | |
SCHEDULE OF SHAREHOLDER EXPENSES(Unaudited)
Hypothetical $1,000 Investment
As a shareholder of the Fund, you incur two types of costs: (1) transaction costs, including brokerage commissions on your purchase and sales of Fund shares and (2) ongoing costs, primarily management fees. The examples below are intended to help you understand your ongoing costs (in dollars) of investing in the Fund and to compare these ongoing costs with the ongoing costs of investing in other funds. The examples assume that you had a $1,000 investment at the beginning of the reporting period, September 1, 2023, and continued to hold your shares at the end of the reporting period, February 29, 2024.
Actual Expenses
For the Fund in the table below, the first line provides information about actual account values and actual expenses. You may use the information in this line, together with the amount you invested, to estimate the expenses that you paid over the period. Simply divide your account value by $1,000 (for example, an $8,600 account value divided by $1,000 = 8.6), then multiply the result by the number in the first line of the
Fund under the heading titled “Expenses Paid During the Period” to estimate the expenses you paid on your account during this period.
Hypothetical Example for Comparison Purposes
The second line of the Fund in the table below provides information about hypothetical account values and hypothetical expenses based on the actual expense ratio and an assumed rate of return of 5% per year before expenses, which is not the Fund's actual return. The hypothetical account values and expenses may not be used to estimate the actual ending account balance or expenses you paid for the period. You may use this information to compare the ongoing costs of investing in the Fund and other funds. To do so, compare this 5% hypothetical example with the 5% hypothetical examples that appear in the shareholder reports of the other funds. The examples also assume all dividends and distributions have been reinvested. The examples do not take into account brokerage commissions that you pay when purchasing or selling shares of the Fund.
| Beginning Account Value September 1, 2023 | Ending Account Value February 29, 2024 | | |
JPMorgan BetaBuilders MSCI US REIT ETF | | | | |
| | | | |
| | | | |
|
| Expenses are equal to the Fund’s annualized net expense ratio, multiplied by the average account value over the period, multiplied by 182/366 (to reflect the one-half year period). |
| J.P. Morgan Exchange-Traded Funds | |
LIQUIDITY RISK MANAGEMENT PROGRAM(Unaudited)
The JPMorgan BetaBuilders MSCI US REIT ETF (the “Fund”) has adopted the J.P. Morgan Funds and J.P. Morgan Exchange-Traded Funds Amended and Restated Liquidity Risk Management Program (the “Program”) under Rule 22e-4 under the Investment Company Act of 1940, as amended (the “Liquidity Rule”). The Program seeks to assess, manage and review of the Fund’s Liquidity Risk. “Liquidity Risk” is defined as the risk that a fund could not meet requests to redeem shares issued by the Fund without significant dilution of remaining investors’ interests in the Fund. Pursuant to an exemptive order (the “Exemptive Order”) from the Securities and Exchange Commission, the Program permits the Funds to use liquidity definitions and classification methodologies that differ from the requirements under the Liquidity Rule in some respects. Among other things, the Liquidity Rule requires that a written report be provided to the Board of Trustees (the “Board”) on an annual basis that addresses the operation of the Program and assesses the adequacy and effectiveness of its implementation, including the operation of any Highly Liquid Investment Minimum (“HLIM”), where applicable, and any material changes to the Program.1
The Board has appointed J.P. Morgan Asset Management’s Liquidity Risk Forum to be the program administrator for the Program (the “Program Administrator”). In addition to regular reporting at each of its quarterly meetings, on February 7, 2024, the Board reviewed the Program Administrator’s annual written report (the “Report”) concerning the operation of the Program for the period from January 1, 2023 through December 31, 2023 (the “Program Reporting Period”). The Report addressed the operation of the Program and assessed its adequacy and effectiveness of implementation, including, where applicable, the operation of the Fund’s HLIM. There were no material changes to the Program during the Program Reporting Period.
The Report summarized the operation of the Program and the information and factors considered by the Program Adminis
trator in assessing whether the Program has been adequately and effectively implemented with respect to the Fund. Such information and factors included, among other things: (1) the effectiveness of the Program with respect to the identification of each Fund that qualifies as an “In-Kind ETF” (as defined in the Liquidity Rule); (2) the liquidity risk framework used to assess, manage, and periodically review the Fund’s Liquidity Risk and the results of this assessment; (3) the methodology and inputs for classifying the investments of a Fund (other than an In-Kind ETF) into one of the required liquidity categories that reflect an estimate of the liquidity of those investments under current market conditions (and, for In-Kind ETFs, the methodology and inputs for determining whether any investments should be classified as “Illiquid Investments” (as defined or modified under the Program)); (4) whether a Fund (other than an In-Kind ETF) invested primarily in “Highly Liquid Investments” (as defined or modified under the Program), as well as whether an HLIM should be established for the Fund (other than an In-Kind ETF) and the procedures for monitoring any HLIM; (5) whether the Fund invested more than 15% of its assets in “Illiquid Investments” and the procedures for monitoring for this limit; and (6) specific liquidity events arising during the Program Reporting Period. The Report further summarized the conditions of the Exemptive Order and whether all applicable Funds were in compliance with the terms of the Exemptive Order.
Based on this review, the Report concluded that: (1) the Program continues to be reasonably designed to effectively assess and manage the Fund’s Liquidity Risk; and (2) the Program has been adequately and effectively implemented with respect to the Fund during the Program Reporting Period.
1 Effective July 24, 2024, the J.P. Morgan Funds will implement the Tailored Shareholder Reports for Mutual Funds and Exchanged-Traded Funds Rule. This rule rescinds the currently-required statement regarding the operation and effectiveness of a fund’s Liquidity Risk Management Program from the shareholder report.
| J.P. Morgan Exchange-Traded Funds | |
Certain tax information for the J.P. Morgan Funds is required to be provided to shareholders based upon the Fund's income and distributions for the taxable year ended February 29, 2024. The information and distributions reported in this letter may differ from the information and taxable distributions reported to the shareholders for the calendar year ending December 31, 2024. The information necessary to complete your income tax returns for the calendar year ending December 31, 2024 will be provided under separate cover.
Section 199A Income
The Fund had the following amount, or maximum allowable amount, of ordinary income distributions treated as section 199A dividends for the fiscal year ended February 29, 2024.
| |
JPMorgan BetaBuilders MSCI US REIT ETF | |
| J.P. Morgan Exchange-Traded Funds | |
THIS PAGE IS INTENTIONALLY LEFT BLANK
J.P. Morgan Exchange-Traded Funds are distributed by JPMorgan Distribution Services, Inc., an indirect, wholly-owned subsidiary of JPMorgan Chase & Co. Affiliates of JPMorgan Chase & Co. receive fees for providing various services to the Funds.
Contact J.P. Morgan Exchange-Traded Funds at 1-844-457-6383 (844-4JPM ETF) for a fund prospectus. You can also visit us at www.jpmorganfunds.com. Investors should carefully consider the investment objectives and risks as well as charges and expenses of the fund before investing. The prospectus contains this and other information about the fund. Read the prospectus carefully before investing.
Investors may obtain information about the Securities Investor Protection Corporation (SIPC), including the SIPC brochure, by visiting www.sipc.org or by calling SIPC at 202-371-8300.
The Fund files a complete schedule of its fund holdings for the first and third quarters of its fiscal year with the SEC as an exhibit to its report on Form N-PORT. The Fund's Form N-PORT reports are available on the SEC’s website at http://www.sec.gov. The Fund's quarterly holdings can be found by visiting the J.P. Morgan Funds’ website at www.jpmorganfunds.com.
Effective January 24, 2023, the SEC adopted rule and form amendments that will result in changes to the design and delivery of shareholder reports of mutual funds and ETFs, requiring them to transmit concise and visually engaging streamlined annual and semi-annual reports to shareholders that highlight key information. Other information, including financial statements, will no longer appear in a streamlined shareholder report but must be available online, delivered free of charge upon request, and filed on a semi-annual basis on Form N-CSR. The rule and form amendments have a compliance date of July 24, 2024.
A description of the Fund's policies and procedures with respect to the disclosure of the Fund's holdings is available in the prospectus and Statement of Additional Information.
A copy of proxy policies and procedures is available without charge upon request by calling 1-844-457-6383 and on the Fund's website at www.jpmorganfunds.com. A description of such policies and procedures is on the SEC’s website at www.sec.gov. The Trustees have delegated the authority to vote proxies for securities owned by the Fund to the Adviser. A copy of the Fund's voting record for the most recent 12-month period ended June 30 is available on the SEC’s website at www.sec.gov or at the Fund's website at www.jpmorganfunds.com no later than August 31 of each year. The Fund's proxy voting record will include, among other things, a brief description of the matter voted on for each fund security, and will state how each vote was cast, for example, for or against the proposal.
J.P. Morgan Asset Management is the brand name for the asset management business of JPMorgan Chase & Co. and its affiliates worldwide.
© JPMorgan Chase & Co., 2024. All rights reserved. February 2024.
AN-RETF-224
Annual Report
J.P. Morgan Exchange-Traded Funds
February 29, 2024
| | |
JPMorgan Inflation Managed Bond ETF | | |
JPMorgan Realty Income ETF | | |
CONTENTS
Investments in a Fund are not deposits or obligations of, or guaranteed or endorsed by, any bank and are not insured or guaranteed by the FDIC, the Federal Reserve Board or any other government agency. You could lose money if you sell when a Fund’s share price is lower than when you invested.
Past performance is no guarantee of future performance. The general market views expressed in this report are opinions based on market and other conditions through the end of the reporting period and are subject to change without notice. These views are not intended to predict the future performance of a Fund or the securities markets.
Prospective investors should refer to the Funds’ prospectuses for a discussion of the Funds’ investment objectives, strategies and risks. Call J.P. Morgan Exchange-Traded Funds at (844) 457-6383 for a prospectus containing more complete information about a Fund, including management fees and other expenses. Please read it carefully before investing.
Shares are bought and sold throughout the day on an exchange at market price (not at net asset value) through a brokerage account, and are not individually subscribed and redeemed from a Fund. Shares may only be subscribed and redeemed directly from a Fund by Authorized Participants, in very large creation/redemption units. Brokerage commissions will reduce returns.
President's LetterApril 15, 2024 (Unaudited)
Dear Shareholder,
Financial markets largely rallied through the final months of 2023 and into the first quarter of 2024, as leading central banks refrained from implementing further interest rate increases. Equity markets generally outperformed bond markets for the twelve months ended February 29, 2024, led by four consecutive months of net gains in U.S. equity prices.
|
“The global economic outlook for the year ahead remains positive and financial markets appear more resilient than a year ago.” — Brian S. Shlissel
|
Economic data were stronger than many economists expected in the face of elevated interest rates throughout the year. Following weak but positive economic growth in the first half of 2023, U.S. gross domestic product increased to 4.9% in the third quarter and 3.4% growth in the final quarter of the year. While the U.S. unemployment rate rose slightly during the second half of the year, it remained below 4% for the entire 12 month period and monthly job growth data frequently surpassed the consensus forecasts of economists.
Meanwhile, the U.S. Federal Reserve (the “Fed”) continued to raise interest rates through the end of summer 2023, then settled on a benchmark lending rate range of 5.25 - 5.50% through the first quarter of 2024. The European Central Bank and the Bank of England followed similar trajectories, raising interest rates at regular intervals into the third quarter of 2023 and then holding rates at those elevated levels for the remainder of the period. Notably, the Bank of Japan raised interest rates for the first time in 17 years in mid-March 2024, ending eight years of negative interest rates and setting its benchmark rate range at 0.0 to 0.1%.
The Fed and certain other leading central banks fueled investor expectations for interest rate reductions in 2024 and growing optimism that developed market economies could enjoy a “soft landing” of positive growth coupled with relatively low unemployment.
However, there remain significant risks to the macroeconomic backdrop. Slower economic growth due to the impact of higher interest rates could leave the U.S. economy more vulnerable to potential shocks from geopolitical events, natural disasters or political turmoil, particularly taking into account the upcoming U.S. presidential election. Additionally, financial markets may also come under pressure should the Fed decide not to reduce interest rates to the extent anticipated by investors. Finally, the recent run-up in U.S. equity prices could lead to increased volatility in certain sectors of the market.
The global economic outlook for the year ahead remains positive and financial markets appear to be more resilient than a year ago. Global growth is estimated at 2.9% this year and 3.0% for 2025, with a continued decline in inflation, according to the Organization for Economic Cooperation and Development’s February 2024 forecast. However, across market cycles, we believe that those investors who hold a well-diversified portfolio and a long-term view are best positioned.
Our suite of investment solutions seeks to provide investors with the ability to build durable portfolios that meet their financial goals, regardless of macroeconomic and geopolitical uncertainties.
Sincerely,
Brian S. Shlissel
President, J.P. Morgan Exchange-Traded Funds
J.P. Morgan Asset Management
1-844-4JPM-ETF or jpmorgan.com/etfs for more information
| J.P. Morgan Exchange-Traded Funds | |
J.P. Morgan Exchange-Traded Funds
MARKET OVERVIEWTWELVE MONTHS ENDED February 29, 2024 (Unaudited)
While bond markets generally underperformed equity markets during the period, fixed income securities rallied in late 2023 as leading central banks signaled that they could begin to lower interest rates in 2024. Overall, U.S. high yield bonds (also known as junk bonds) and emerging markets debt outperformed other sectors of the bond market, and corporate debt generally outperformed U.S. Treasury bonds and other developed markets sovereign debt for the twelve months ended February 29, 2024.
Global economic growth was stronger than expected in the first quarter of 2023, but in late March, Silicon Valley Bank collapsed after management sold off the bank’s portfolio of U.S. Treasury bonds at a steep loss, which triggered a run on the bank’s deposits. While U.S. regulators moved swiftly to guarantee some deposits at the bank to prevent further contagion, depositors began withdrawing cash from First Republic Bank. At the end of April, U.S. regulators announced First Republic Bank had been closed and sold to J.P. Morgan Chase & Co. Meanwhile, the Swiss government brokered a takeover of troubled Credit Suisse by UBS Group AG. These events sharply elevated market volatility in the banking sector, particularly in U.S. regional bank stocks.
Throughout the first half of 2023, leading central banks continued to raise interest rates at regular intervals in an effort to ease inflationary pressures. By the end of summer 2023, inflation data in the U.S. and across Europe had shown significant reduction in core consumer prices. In response, the U.S. Federal Reserve, the European Central Bank and the Bank of England in separate decisions each declined to raise interest rates further during the final months of 2023.
By the start of the second half of 2023, the general consensus among economists was that interest rates would remain elevated for an extended period, particularly in the U.S. where labor markets remained tight and economic growth was generally stronger than expected. However, at its December meeting, the U.S. Federal Reserve indicated that it was prepared to begin the process of cutting interest rates in 2024, given the trajectory of inflation data.
Global economic growth largely proved more resilient than economists’ forecasts during the period, led by expansions in the U.S., Japan, India and select emerging markets. Meanwhile, the Eurozone, U.K., China and Canada struggled with weaker growth. China’s economy faced low levels of consumer spending and business confidence, along with long-standing debt issues in the domestic property sector. Across Europe, weakness in consumer and business spending and ongoing stresses from the war in Ukraine weighed on economic growth. Notably, inflation data in the U.K. indicated that prices were declining at a somewhat slower pace than in other developed markets.
However, investor concerns about a potential economic recession receded during the period as data showed a general trend toward stability in labor markets amid declining inflation and the pivot in the policies of leading central banks. Global equity markets responded with a four-month rally through the end of February 2024. Notably, the outperformance of U.S. equity markets was led by a handful of large cap companies in the information technology and communications sectors; Apple Inc., Amazon.com Inc., Alphabet Inc., Meta Platforms Inc., Microsoft Corp., Nvidia Corp. and Tesla Inc.
For the twelve months ended February 29, 2024, the Bloomberg U.S. Corporate High Yield Index returned 11.03%, the Bloomberg Emerging Markets Index returned 7.92% and the Bloomberg U.S. Aggregate Index returned 3.33%.
| J.P. Morgan Exchange-Traded Funds | |
JPMorgan Inflation Managed Bond ETF
FUND COMMENTARYTWELVE MONTHS ENDED February 29, 2024 (Unaudited)
| |
| |
| |
Bloomberg 1-10 Year U.S. TIPS Index | |
Bloomberg U.S. Intermediate Aggregate Index | |
Net Assets as of 2/29/2024 | |
| |
| |
INVESTMENT OBJECTIVE***
The JPMorgan Inflation Managed Bond ETF (the “Fund”) seeks to maximize inflation protected total return.
INVESTMENT APPROACH
The Fund invests in a core portfolio of fixed income securities in combination with swaps that are based on the Non-Seasonally Adjusted Consumer Price Index for All Urban Consumers (CPI-U) and other investments including actual inflation-protected securities to protect the total return generated by its core fixed income holding from inflation risk.
WHAT WERE THE MAIN DRIVERS OF THE FUND’S PERFORMANCE?
For the twelve months ended February 29, 2024, the Fund outperformed both the Bloomberg 1-10 Year U.S. TIPS Index (the “Index”) and the Bloomberg U.S. Intermediate Aggregate Index.
Relative to the Index, the Fund’s allocations to investment grade credit, agency mortgage-backed securities, commercial mortgage-backed securities and asset-backed securities were leading contributors to relative performance.
The Fund’s longer duration posture and yield curve steepening exposure were the leading detractors from performance as interest rates rose during the period. Bonds of longer duration generally experience a larger decline in price compared with bonds of shorter duration when interest rates rise. The yield curve shows the relationship between yields and maturity dates for a set of similar bonds at a given point in time.
Relative to the Bloomberg U.S. Intermediate Aggregate Index, the Fund’s inflation exposure was the leading contributor to performance.
HOW WAS THE FUND POSITIONED?
Among the Fund’s fixed income holdings, the Fund’s portfolio managers continued to focus on security selection and relative
value, which seeks to exploit pricing discrepancies between individual securities or market sectors. The Fund’s portfolio managers used bottom-up fundamental research to construct, in their view, a portfolio of undervalued fixed income securities.
The Fund’s portfolio managers sought to protect the portfolio from inflation risk across maturities. Therefore, the yield curve positioning of the underlying core bonds was used as the general basis for the Fund’s inflation swap positioning.
The Fund’s portfolio managers manage the duration of the inflation protection versus the duration of the underlying bonds to protect the portfolio from actual, realized inflation, as well as from the loss of value that results from an increase in inflation expectations. The inflation protection was actively managed using CPI-U swaps and TIPS. Generally, the swaps were structured so that a counterparty agrees to pay the cumulative percentage change in the CPI-U over the duration of the swap. In turn, the Fund pays a compounded fixed rate. TIPS adjust the principal of the underlying bond so that it increases with inflation as measured by the CPI-U and decreases with deflation. At maturity, a TIPS investor is paid either the adjusted or the original principal, whichever is greater.
PORTFOLIO COMPOSITION
AS OF February 29, 2024 | PERCENT OF
TOTAL
INVESTMENTS |
| |
Mortgage-Backed Securities | |
U.S. Treasury Obligations | |
| |
Collateralized Mortgage Obligations | |
Commercial Mortgage-Backed Securities | |
Others (each less than 1.0%) | |
| |
*
The return shown is based on net asset value and may differ from the return shown in the financial highlights, which reflects
| J.P. Morgan Exchange-Traded Funds | |
JPMorgan Inflation Managed Bond ETF
FUND COMMENTARYTWELVE MONTHS ENDED February 29, 2024 (Unaudited) (continued)
adjustments made to the net asset value in accordance with accounting principles generally accepted in the United States of America. The net asset value was $46.41 as of February 29, 2024.
**
Market price return was calculated assuming an initial investment made at the market price at the beginning of the reporting period, reinvestment of all dividends and distributions at the market price during the period, and sale at the market price on the last day of the period. The price used to calculate the market price return was the closing price on the Cboe BZX Exchange, Inc. As of February 29, 2024, the closing price was $46.47.
***
The adviser seeks to achieve the Fund’s objective. There can be no guarantee it will be achieved.
| J.P. Morgan Exchange-Traded Funds | |
AVERAGE ANNUAL TOTAL RETURNS AS OF February 29, 2024 (Unaudited)
| | | | |
JPMorgan Inflation Managed Bond ETF | | | | |
| | | | |
| | | | |
|
| Inception date for Class R6 Shares of the Predecessor Fund (as defined below). |
TEN YEAR FUND PERFORMANCE (2/28/14 TO 2/29/24)
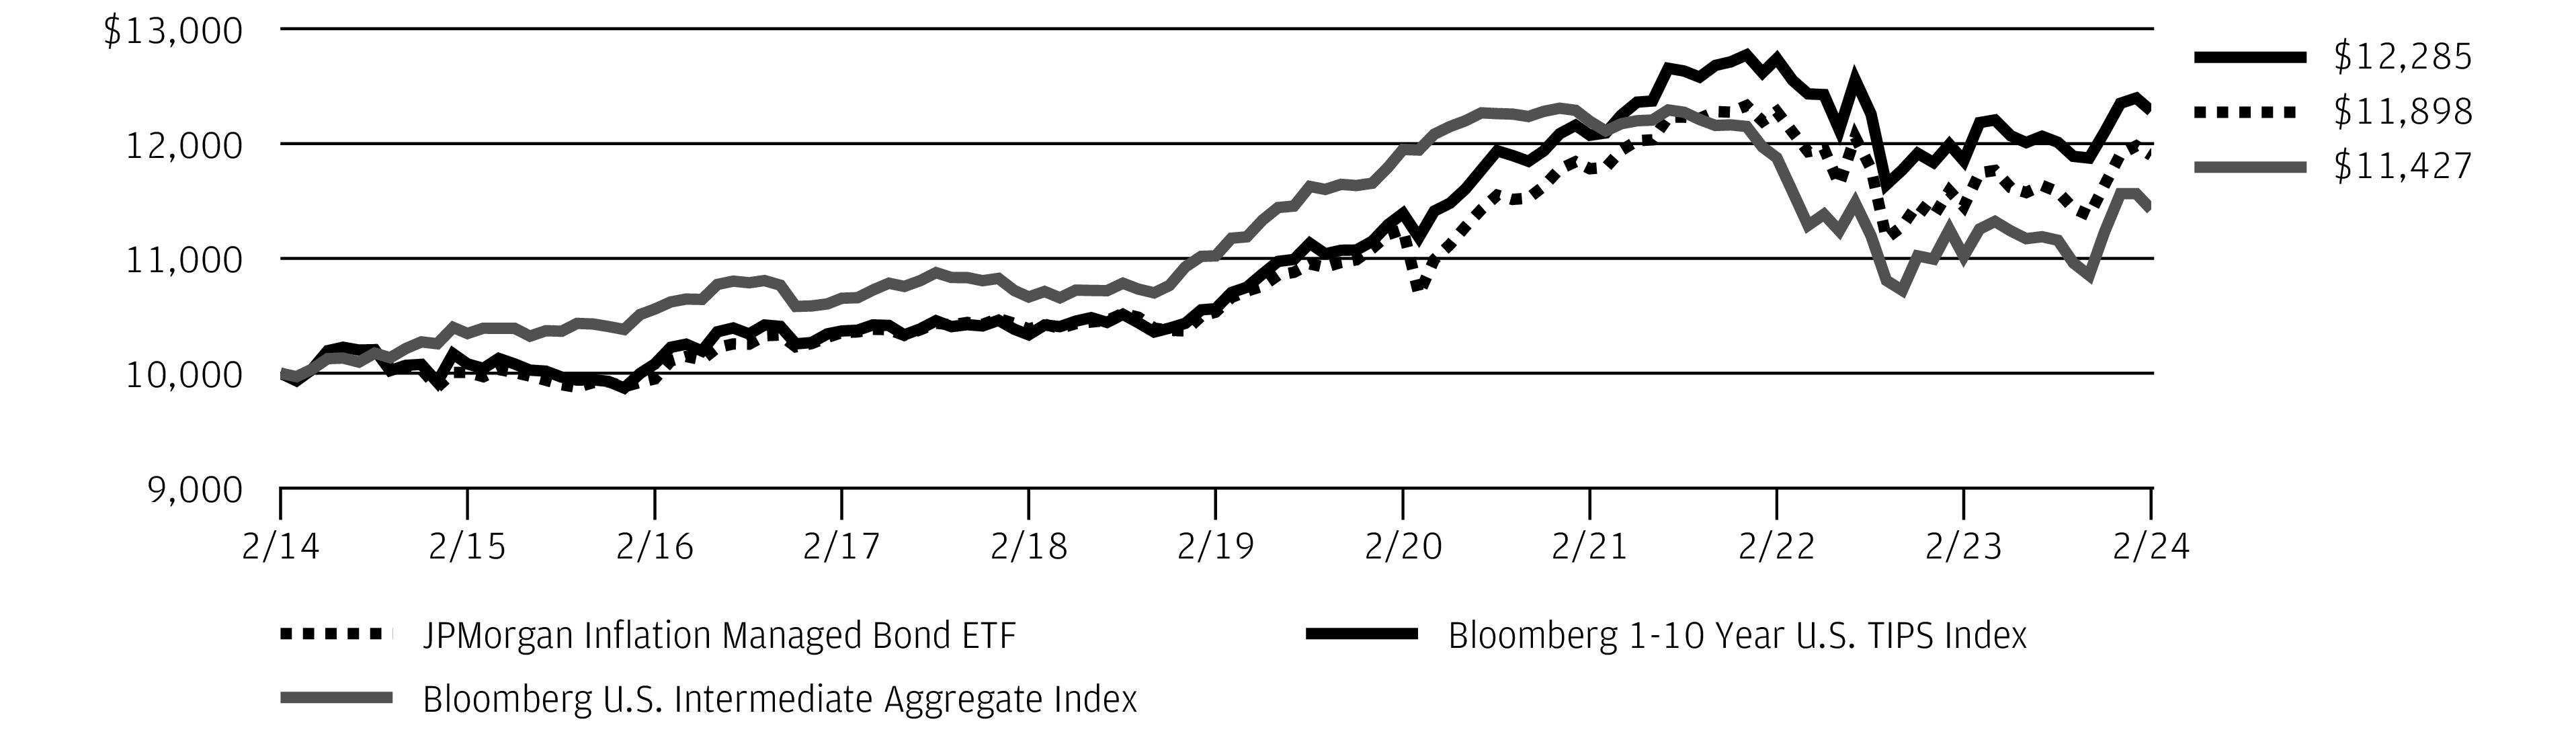
The performance quoted is past performance and is not a guarantee of future results. Exchange-traded funds are subject to certain market risks. Investment returns and principal value of an investment will fluctuate so that an investor’s shares, when sold or redeemed, may be worth more or less than their original cost. Current performance may be higher or lower than the performance data shown. Updated performance information is available by visiting www.jpmorganfunds.com or by calling 1-844-457-6383.
JPMorgan Inflation Managed Bond ETF (the “Fund”) acquired the assets and liabilities of the JPMorgan Inflation Managed Bond Fund (“Predecessor Fund”) in a reorganization that occurred as of the close of business on April 8, 2022. Performance and financial history of the Predecessor Fund’s Class R6 Shares have been adopted by the Fund and will be used going forward. As a result, the performance for the Fund prior to April 8, 2022 is the performance of the Predecessor Fund’s Class R6 Shares. Inception date for the Predecessor Fund’s Class R6 Shares is November 30, 2010.
Performance for the Fund’s shares has not been adjusted to reflect the Fund’s shares’ lower expenses than those of the Predecessor Fund’s Class R6 Shares. Had the Predecessor Fund been structured as an exchange-traded fund (“ETF”), its performance may have differed. Performance for the Predecessor Fund is based on the net asset value ("NAV") per share of the Predecessor Fund Shares rather than on market-determined prices. Prior to the Fund’s listing on April 11, 2022, the NAV performance of the Fund and the Class R6 Shares of the Predecessor Fund are used as proxy market price returns.
The graph illustrates comparative performance for $10,000 invested in shares of the Fund and the Bloomberg 1-10 Year U.S. TIPS Index and the Bloomberg U.S. Intermediate Aggregate Index from February 28, 2014 to February 29, 2024. The performance of the Fund reflects the deduction of Fund expenses and assumes reinvestment of all dividends and capital gain distributions, if any.
The performance of the Bloomberg 1-10 Year U.S. TIPS Index and the Bloomberg U.S. Intermediate Aggregate Index does not reflect the deduction of expenses associated with an ETF and approximates the minimum possible dividend reinvestment of the securities included in the Index, if applicable. The Bloomberg 1–10 Year U.S. TIPS Index represents the performance of intermediate (1–10 year) U.S. Treasury Inflation Protection Securities. The Bloomberg U.S. Intermediate Aggregate Index is an unmanaged index comprised of U.S. government, mortgage, corporate and asset-backed securities with maturities of one to 10 years. Investors cannot invest directly in an index.
Fund performance may reflect the waiver of the Fund’s fees and reimbursement of expenses for certain periods. Without these waivers and reimbursements, performance would have been lower. Also, performance shown in this section does not reflect the deduction of taxes that a shareholder would pay on Fund distributions or on gains resulting from redemption or sale of Fund shares.
The returns shown are based on NAVs calculated for shareholder transactions and may differ from the returns shown in the financial highlights, which reflect adjustments made to the NAVs in accordance with accounting principles generally accepted in the United States of America.
Source: Bloomberg Index Services Limited. BLOOMBERG® is a trademark and service mark of Bloomberg Finance L.P. and its affiliates (collectively "Bloomberg"). Bloomberg or Bloomberg's licensors own all proprietary rights in the Bloomberg Indices. Bloomberg does not approve or endorse this material, or guarantee the accuracy or completeness of any information herein, or make any warranty, express or implied, as to the results to be obtained therefrom and, to the maximum extent allowed by law, shall have any liability or responsibility for injury or damages arising in connection therewith.
| J.P. Morgan Exchange-Traded Funds | |
JPMorgan Realty Income ETF
FUND COMMENTARYTWELVE MONTHS ENDED February 29, 2024 (Unaudited)
| |
| |
| |
FTSE NAREIT All Equity REITs Index 1 | |
| |
Net Assets as of 2/29/2024 | |
| |
INVESTMENT OBJECTIVE***
The JPMorgan Realty Income ETF (the “Fund”) seeks to provide high total investment return through a combination of capital appreciation and current income.
INVESTMENT APPROACH
The Fund invests primarily in equity securities of real estate investment trusts (“REITs”) across the market capitalization spectrum and uses an in-depth analysis of each REIT to evaluate whether each company’s current price fully reflects its long-term value.
WHAT WERE THE MAIN DRIVERS OF THE FUND’S PERFORMANCE?
For the twelve months ended February 29, 2024, the Fund outperformed the FTSE NAREIT All Equity Index (the “Benchmark”).
Relative to the Benchmark, the Fund’s overweight allocation to the hotels sector and its security selection in the “other” sector were leading contributors to performance, while the Fund’s security selection in the new leases and retail sectors was a leading detractor from relative performance.
Leading individual contributors to the Fund’s relative performance included its out-of-Benchmark position in Tricon Residential Inc., its overweight position in Digital Realty Trust Inc. and its underweight position in Healthpeak Properties Inc. Shares of Tricon Residential, an owner/operator of single-family homes, rose in January 2024 after the company agreed to be acquired by Blackstone Inc. for an estimated $3.5 billion. Shares of Digital Realty Trust, a data center and work co-location REIT, rose after the company reported better-than-expected results for the second and third quarters of 2023. Shares of Healthpeak Properties, a health care sector REIT, fell after the company reported weaker-than-expected revenue for the fourth quarter of 2023.
Leading individual detractors from the Fund’s relative performance included its overweight positions in W.P. Carey Inc., UDR Inc. and Ventas Inc. Shares of W.P. Carey, a commercial property REIT, fell as rising interest rates during most of the period hurt the broader net lease sector. Shares of UDR, a multi-family residential REIT, fell after the company reported weaker-than-expected revenue for the third quarter of 2023 and fourth-quarter 2023 earnings in line with analysts’ estimates. Shares of Ventas, a health care REIT, fell after the company reported fourth quarter 2024 earnings in line with equity analysts’ expectations and after it issued a weaker-than-expected forecast for 2024.
HOW WAS THE FUND POSITIONED?
The Fund’s adviser used bottom-up fundamental research to construct, in its view, a portfolio of attractively valued real estate securities. The adviser projected long-term cash flow for each portfolio holding and valued the holdings using a proprietary dividend discount model.
During the period, the Fund’s largest allocations were to the technology and hotels sectors and its smallest allocations were
to the housing and office sectors.
TOP TEN HOLDINGS OF THE
PORTFOLIO AS OF February 29, 2024 | PERCENT OF
TOTAL
INVESTMENTS |
| | |
| | |
| | |
| Digital Realty Trust, Inc. | |
| | |
| | |
| | |
| | |
| | |
| | |
| J.P. Morgan Exchange-Traded Funds | |
*
The return shown is based on net asset value and may differ from the return shown in the financial highlights, which reflects adjustments made to the net asset value in accordance with accounting principles generally accepted in the United States of America. The net asset value was $43.61 as of February 29, 2024.
**
Market price return was calculated assuming an initial investment made at the market price at the beginning of the reporting period, reinvestment of all dividends and distributions at the market price during the period, and sale at the market price on the last day of the period. The price used to calculate the market price return was the closing price on the NYSE Arca, Inc. As of February 29, 2024, the closing price was $43.56.
1
On April 1, 2023, the primary benchmark for the JPMorgan Realty Income ETF was changed to the FTSE NAREIT All Equity REITs Index from the MSCI US REIT Index to more closely align the Fund’s primary benchmark to the current real estate landscape.
***
The adviser seeks to achieve the Fund’s objective. There can be no guarantee it will be achieved.
PORTFOLIO COMPOSITION BY SECTOR
AS OF February 29, 2024 | PERCENT OF
TOTAL
INVESTMENTS |
| |
| |
| |
| |
| |
| |
| |
| |
| |
Others (each less than 1.0%) | |
| |
| J.P. Morgan Exchange-Traded Funds | |
JPMorgan Realty Income ETF
FUND COMMENTARYTWELVE MONTHS ENDED February 29, 2024 (Unaudited) (continued)
AVERAGE ANNUAL TOTAL RETURNS AS OF February 29, 2024 (Unaudited)
| | | | |
JPMorgan Realty Income ETF | | | | |
| | | | |
| | | | |
|
| Inception date for Class R5 Shares of the Predecessor Fund (as defined below). |
TEN YEAR FUND PERFORMANCE (2/28/14 TO 2/29/24)
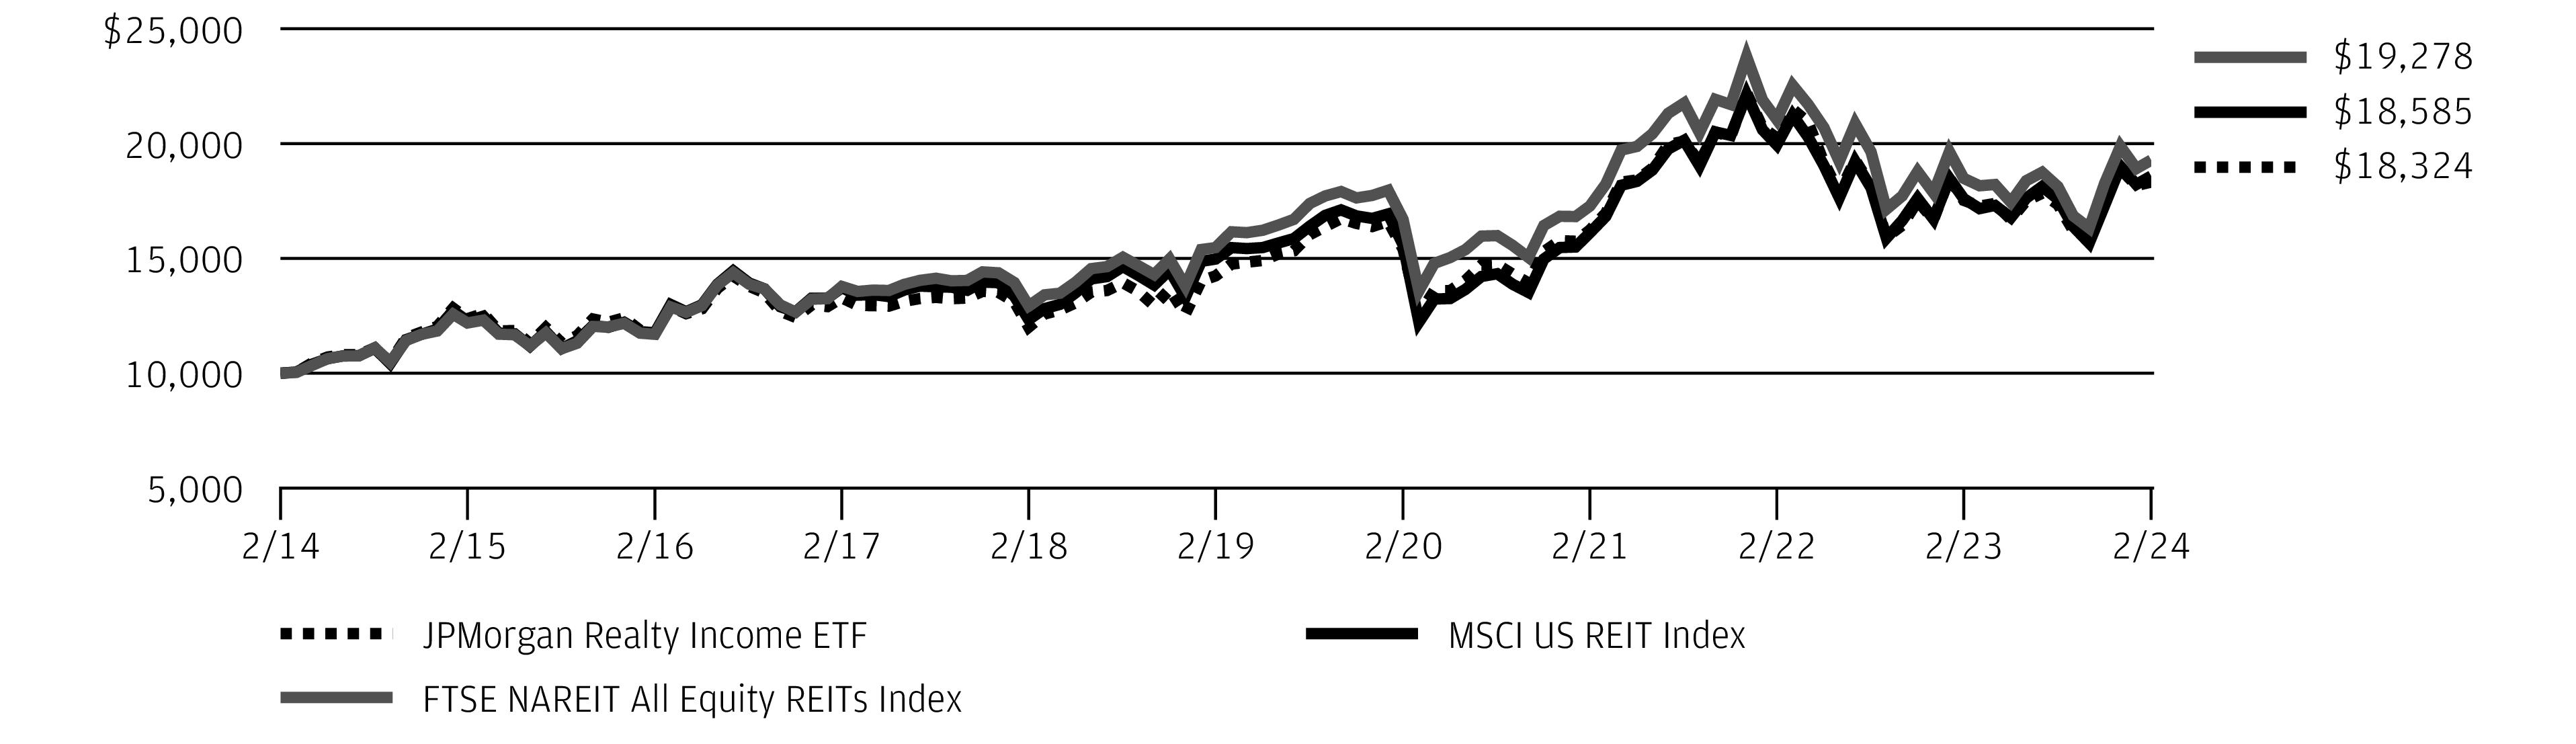
The performance quoted is past performance and is not a guarantee of future results. Exchange-traded funds are subject to certain market risks. Investment returns and principal value of an investment will fluctuate so that an investor’s shares, when sold or redeemed, may be worth more or less than their original cost. Current performance may be higher or lower than the performance data shown. Updated performance information is available by visiting www.jpmorganfunds.com or by calling 1-844-457-6383.
JPMorgan Realty Income ETF (the “Fund”) acquired the assets and liabilities of the JPMorgan Realty Income Fund (“Predecessor Fund”) in a reorganization that occurred as of the close of business on May 20, 2022. Performance and financial history of the Predecessor Fund’s Class R6 Shares have been adopted by the Fund and will be used going forward. As a result, the performance for the Fund prior to May 20, 2022 is the performance of the Predecessor Fund’s Class R6 Shares. Inception date for the Predecessor Fund’s Class R6 Shares is November 2, 2015. Returns for the Predecessor Fund’s Class R6 Shares prior to their inception date are based on the performance of the Predecessors Fund’s Class R5 Shares. The actual returns of the Predecessor Fund’s Class R6 Shares would have been different than those shown because the Predecessor Fund’s Class R6 Shares had different expenses than the Predecessor Fund’s Class R5 Shares. Inception date for the Predecessor Fund’s Class R5 Shares is May 15, 2006.
Performance for the Fund’s shares has not been adjusted to reflect the Fund’s shares’ lower expenses than those of the Predecessor Fund’s Class R6 Shares and Class R5 Shares. Had the Predecessor Fund been structured as an exchange-traded fund (“ETF”), its performance may have differed. Performance for the Predecessor Fund is based on the net asset value ("NAV") per share of the Predecessor Fund Shares rather than on market-determined prices. Prior to the Fund’s listing on May 23, 2022, the NAV performance of the Fund and the Class R6 Shares of the Predecessor Fund are used as proxy market price returns.
The graph illustrates comparative performance for $10,000 invested in shares of the Fund, the MSCI US REIT Index and the FTSE NAREIT All Equity REITs Index from February 28, 2014 to February 29, 2024. The performance of the Fund reflects the deduction of Fund expenses and assumes reinvestment of all dividends and capital gain distributions, if any. The performance of the MSCI US REIT Index and the FTSE NAREIT All Equity REITs Index does not reflect the deduction of expenses associated with an ETF and approximates the minimum possible dividend reinvestment of the securities included in the Index, if
applicable. The MSCI US REIT Index is a free float-adjusted market capitalization weighted index comprised of equity REITs that are included in the MSCI US Investable Market 2500 Index, except specialty equity REITs that do not generate a majority of their revenue and income from real estate rental and leasing operations. The FTSE NAREIT All Equity REITs Index is a free-float adjusted, market capitalization-weighted index of U.S. equity REITs. Constituents of the index include all tax-qualified REITs with more than 50 percent of total assets in qualifying real estate assets other than mortgages secured by real property. Investors cannot invest directly in an index.
Fund performance may reflect the waiver of the Fund’s fees and reimbursement of expenses for certain periods. Without these waivers and reimbursements, performance would have been lower. Also, performance shown in this section does not reflect the deduction of taxes that a shareholder would pay on Fund distributions or on gains resulting from redemption or sale of Fund shares.
Effective April 1, 2023, the Fund’s primary benchmark changed from the MSCI US REIT Index to the FTSE NAREIT All Equity REITs Index to more closely align the Fund’s primary benchmark to the current real estate landscape.
The returns shown are based on NAVs calculated for shareholder transactions and may differ from the returns shown in the financial highlights, which reflect adjustments made to the NAVs in accordance with accounting principles generally accepted in the United States of America.
The JPMorgan Realty Income ETF (the “JPMorgan Realty Income ETF”) has been developed solely by JPMorgan Chase Bank N.A. The JPMorgan Realty Income ETF is not in any way connected to or sponsored, endorsed, sold or promoted by FTSE International Limited (“FTSE”) or the London Stock Exchange Group plc and its group undertakings (collectively, the “LSE Group”) or Nareit. All rights in the FTSE NAREIT All Equity REITs Index (the “Index”) vest in FTSE and Nareit. “FTSE®” is a trade mark of the LSE Group and is used by FTSE International Limited (“FTSE”) under licence. “NAREIT®” is a trade mark of the Nareit. The Index is calculated by FTSE. Neither FTSE, nor the LSE Group, nor Nareit accept any liability whatsoever to any person arising out of (a) the use of, reliance on or any error in the Index or (b) investment in or operation of the JPMorgan Realty Income ETF. FTSE, the LSE Group, and Nareit make no claim, prediction, warranty or representation either as to the results to be obtained from the JPMorgan Realty Income ETF or the suitability of the Index for the purpose to which it is being put by JPMorgan Chase Bank N.A.
| J.P. Morgan Exchange-Traded Funds | |
Source: MSCI. The MSCI information may only be used for your internal use, may not be reproduced or redisseminated in any form and may not be used as a basis for or a component of any financial instruments or products or indices. None of the MSCI information is intended to constitute investment advice or a recommendation to make (or refrain from making) any kind of investment decision and may not be relied on as such. Historical data and analysis should not be taken as an indication or guarantee of any future performance analysis, forecast, or prediction. The MSCI information is provided on an "as is" basis and the user of this information assumes the entire risk of any use made of this
information. MSCI, each of its affiliates and each other person involved in or related to compiling, computing or creating any MSCI information (collectively, the "MSCI Parties") expressly disclaims all warranties (including, without limitation, any warranties of originality, accuracy, completeness, timeliness, non-infringement, merchantability and fitness for a particular purpose) with respect to this information. Without limiting any of the foregoing, in no event shall any MSCI Party have any liability for any direct, indirect, special, incidental, punitive, consequential (including, without limitation, lost profits) or any other damages. (www.msci.com)
| J.P. Morgan Exchange-Traded Funds | |
JPMorgan Inflation Managed Bond ETF
SCHEDULE OF PORTFOLIO INVESTMENTSAS OF February 29, 2024
| | |
|
Aerospace & Defense — 0.7% |
BAE Systems plc (United Kingdom) 3.40%, 4/15/2030 (a) | | |
|
| | |
| | |
L3Harris Technologies, Inc. 3.85%, 12/15/2026 | | |
Leidos, Inc. 2.30%, 2/15/2031 | | |
|
| | |
| | |
| | |
Automobile Components — 0.0% ^ |
Lear Corp. 2.60%, 1/15/2032 | | |
|
|
| | |
| | |
Nissan Motor Acceptance Co. LLC 2.45%, 9/15/2028 (a) | | |
Nissan Motor Co. Ltd. (Japan) 4.81%, 9/17/2030 (a) | | |
Stellantis Finance US, Inc. 2.69%, 9/15/2031 (a) | | |
| | |
|
ABN AMRO Bank NV (Netherlands) (US Treasury Yield Curve Rate T Note Constant Maturity 1 Year + 1.10%), 2.47%, 12/13/2029 (a) (b) | | |
AIB Group plc (Ireland) (SOFR + 2.33%), 6.61%, 9/13/2029 (a) (b) | | |
Australia & New Zealand Banking Group Ltd. (Australia) 4.40%, 5/19/2026 (a) (c) | | |
Banco Santander SA (Spain) |
(US Treasury Yield Curve Rate T Note Constant Maturity 1 Year + 0.90%), 1.72%, 9/14/2027 (b) | | |
| | |
|
(SOFR + 1.15%), 1.32%, 6/19/2026 (b) | | |
Series N, (SOFR + 0.91%), 1.66%, 3/11/2027 (b) | | |
(3-MONTH CME TERM SOFR + 1.84%), 3.82%, 1/20/2028 (b) | | |
| | |
|
|
(SOFR + 1.63%), 5.20%, 4/25/2029 (b) | | |
(SOFR + 1.53%), 1.90%, 7/23/2031 (b) | | |
(SOFR + 1.65%), 5.47%, 1/23/2035 (b) | | |
Bank of Ireland Group plc (Ireland) (US Treasury Yield Curve Rate T Note Constant Maturity 1 Year + 1.10%), 2.03%, 9/30/2027 (a) (b) | | |
Bank of Montreal (Canada) 2.65%, 3/8/2027 | | |
Banque Federative du Credit Mutuel SA (France) 5.90%, 7/13/2026 (a) | | |
Barclays plc (United Kingdom) |
(SOFR + 1.88%), 6.50%, 9/13/2027 (b) | | |
(SOFR + 2.98%), 6.22%, 5/9/2034 (b) | | |
|
(SOFR + 2.07%), 2.22%, 6/9/2026 (a) (b) | | |
(SOFR + 1.23%), 2.59%, 1/20/2028 (a) (b) | | |
|
(SOFR + 1.09%), 2.05%, 10/19/2027 (a) (b) | | |
(SOFR + 1.31%), 2.28%, 1/20/2032 (a) (b) | | |
|
(SOFR + 0.77%), 1.12%, 1/28/2027 (b) | | |
| | |
(3-MONTH CME TERM SOFR + 1.82%), 3.89%, 1/10/2028 (b) | | |
(SOFR + 1.17%), 2.56%, 5/1/2032 (b) | | |
(3-MONTH CME TERM SOFR + 1.43%), 3.88%, 1/24/2039 (b) | | |
Cooperatieve Rabobank UA (Netherlands) |
(US Treasury Yield Curve Rate T Note Constant Maturity 1 Year + 0.73%), 1.98%, 12/15/2027 (a) (b) | | |
(US Treasury Yield Curve Rate T Note Constant Maturity 1 Year + 1.40%), 5.56%, 2/28/2029 (a) (b) | | |
Credit Agricole SA (France) |
(SOFR + 1.68%), 1.91%, 6/16/2026 (a) (b) | | |
(SOFR + 1.69%), 5.34%, 1/10/2030 (a) (b) | | |
Danske Bank A/S (Denmark) (US Treasury Yield Curve Rate T Note Constant Maturity 1 Year + 2.10%), 6.47%, 1/9/2026 (a) (b) | | |
|
| | |
SEE NOTES TO FINANCIAL STATEMENTS.
| J.P. Morgan Exchange-Traded Funds | |
| | |
Corporate Bonds — continued |
|
| | |
DNB Bank ASA (Norway) (US Treasury Yield Curve Rate T Note Constant Maturity 1 Year + 0.68%), 1.61%, 3/30/2028 (a) (b) | | |
|
| | |
(SOFR + 1.84%), 5.63%, 1/29/2032 (b) | | |
Fifth Third Bank NA 2.25%, 2/1/2027 | | |
HSBC Holdings plc (United Kingdom) |
(3-MONTH CME TERM SOFR + 1.61%), 4.29%, 9/12/2026 (b) | | |
(SOFR + 1.73%), 2.01%, 9/22/2028 (b) | | |
(3-MONTH CME TERM SOFR + 1.87%), 3.97%, 5/22/2030 (b) | | |
(SOFR + 2.39%), 2.85%, 6/4/2031 (b) | | |
(SOFR + 1.78%), 5.72%, 3/4/2035 (b) | | |
ING Groep NV (Netherlands) (SOFR + 1.01%), 1.73%, 4/1/2027 (b) | | |
KeyBank NA 3.30%, 6/1/2025 | | |
KeyCorp (SOFRINDX + 1.25%), 3.88%, 5/23/2025 (b) | | |
Lloyds Banking Group plc (United Kingdom) |
(US Treasury Yield Curve Rate T Note Constant Maturity 1 Year + 1.00%), 2.44%, 2/5/2026 (b) | | |
| | |
Mitsubishi UFJ Financial Group, Inc. (Japan) |
| | |
(US Treasury Yield Curve Rate T Note Constant Maturity 1 Year + 0.83%), 2.34%, 1/19/2028 (b) | | |
Mizuho Financial Group Cayman 3 Ltd. (Japan) 4.60%, 3/27/2024 (a) (c) | | |
Mizuho Financial Group, Inc. (Japan) (US Treasury Yield Curve Rate T Note Constant Maturity 1 Year + 1.12%), 5.38%, 5/26/2030 (b) | | |
Morgan Stanley Bank NA 4.75%, 4/21/2026 | | |
National Australia Bank Ltd. (Australia) 2.33%, 8/21/2030 (a) (c) | | |
National Bank of Canada (Canada) 5.60%, 12/18/2028 | | |
NatWest Group plc (United Kingdom) |
(US Treasury Yield Curve Rate T Note Constant Maturity 1 Year + 0.90%), 1.64%, 6/14/2027 (b) | | |
| | |
|
|
(US Treasury Yield Curve Rate T Note Constant Maturity 1 Year + 1.50%), 5.78%, 3/1/2035 (b) | | |
PNC Financial Services Group, Inc. (The) |
(SOFRINDX + 1.09%), 4.76%, 1/26/2027 (b) | | |
(SOFR + 1.34%), 5.30%, 1/21/2028 (b) | | |
Santander UK Group Holdings plc (United Kingdom) |
(US Treasury Yield Curve Rate T Note Constant Maturity 1 Year + 1.25%), 1.53%, 8/21/2026 (b) | | |
(SOFR + 2.75%), 6.83%, 11/21/2026 (b) | | |
(SOFR + 2.60%), 6.53%, 1/10/2029 (b) | | |
Societe Generale SA (France) |
| | |
| | |
(US Treasury Yield Curve Rate T Note Constant Maturity 1 Year + 1.00%), 1.79%, 6/9/2027 (a) (b) | | |
Standard Chartered plc (United Kingdom) |
(3-MONTH SOFR + 1.21%), 2.82%, 1/30/2026 (a) (b) | | |
(US Treasury Yield Curve Rate T Note Constant Maturity 1 Year + 2.10%), 6.10%, 1/11/2035 (a) (b) | | |
Sumitomo Mitsui Financial Group, Inc. (Japan) 1.90%, 9/17/2028 | | |
Toronto-Dominion Bank (The) (Canada) 1.15%, 6/12/2025 | | |
Truist Bank 3.30%, 5/15/2026 | | |
|
(SOFR + 2.45%), 7.16%, 10/30/2029 (b) | | |
(SOFR + 1.62%), 5.44%, 1/24/2030 (b) | | |
|
(US Treasury Yield Curve Rate T Note Constant Maturity 1 Year + 1.20%), 1.98%, 6/3/2027 (a) (b) | | |
(USD ICE Swap Rate 5 Year + 3.70%), 5.86%, 6/19/2032 (a) (b) | | |
|
(SOFR + 1.56%), 5.38%, 1/23/2030 (b) | | |
(SOFR + 1.86%), 5.68%, 1/23/2035 (b) | | |
Wachovia Corp. 7.57%, 8/1/2026 (d) | | |
|
(SOFR + 2.10%), 2.39%, 6/2/2028 (b) | | |
(SOFR + 1.50%), 5.20%, 1/23/2030 (b) | | |
SEE NOTES TO FINANCIAL STATEMENTS.
| J.P. Morgan Exchange-Traded Funds | |
JPMorgan Inflation Managed Bond ETF
SCHEDULE OF PORTFOLIO INVESTMENTSAS OF February 29, 2024 (continued)
| | |
Corporate Bonds — continued |
|
(3-MONTH CME TERM SOFR + 1.43%), 2.88%, 10/30/2030 (b) | | |
Westpac Banking Corp. (Australia) |
| | |
(US Treasury Yield Curve Rate T Note Constant Maturity 5 Year + 1.35%), 2.89%, 2/4/2030 (b) (c) | | |
| | |
|
|
| | |
| | |
| | |
Amgen, Inc. 5.25%, 3/2/2030 | | |
Gilead Sciences, Inc. 3.50%, 2/1/2025 | | |
Regeneron Pharmaceuticals, Inc. 1.75%, 9/15/2030 | | |
| | |
Broadline Retail — 0.0% ^ |
eBay, Inc. 2.60%, 5/10/2031 | | |
|
Brookfield Finance, Inc. (Canada) 4.25%, 6/2/2026 | | |
Credit Suisse AG (Switzerland) |
| | |
| | |
Deutsche Bank AG (Germany) |
(SOFR + 2.52%), 7.15%, 7/13/2027 (b) | | |
(SOFR + 1.32%), 2.55%, 1/7/2028 (b) | | |
(SOFR + 1.72%), 3.04%, 5/28/2032 (b) | | |
Goldman Sachs Group, Inc. (The) |
| | |
| | |
(SOFR + 1.09%), 1.99%, 1/27/2032 (b) | | |
(SOFR + 1.28%), 2.62%, 4/22/2032 (b) | | |
Invesco Finance plc 3.75%, 1/15/2026 | | |
Macquarie Group Ltd. (Australia) |
(3-MONTH SOFR + 1.75%), 5.03%, 1/15/2030 (a) (b) | | |
(SOFR + 2.30%), 6.26%, 12/7/2034 (a) (b) | | |
|
(SOFR + 1.99%), 2.19%, 4/28/2026 (b) | | |
| | |
| | |
|
Capital Markets — continued |
(SOFR + 1.45%), 5.17%, 1/16/2030 (b) | | |
(SOFR + 1.02%), 1.93%, 4/28/2032 (b) | | |
Nasdaq, Inc. 5.55%, 2/15/2034 | | |
Nomura Holdings, Inc. (Japan) |
| | |
| | |
UBS Group AG (Switzerland) |
(SOFR + 2.04%), 2.19%, 6/5/2026 (a) (b) | | |
(SOFRINDX + 0.98%), 1.31%, 2/2/2027 (a) (b) | | |
| | |
|
Albemarle Corp. 5.05%, 6/1/2032 | | |
RPM International, Inc. 2.95%, 1/15/2032 | | |
Westlake Corp. 3.60%, 8/15/2026 | | |
| | |
Communications Equipment — 0.0% ^ |
Cisco Systems, Inc. 5.05%, 2/26/2034 | | |
Construction & Engineering — 0.1% |
Quanta Services, Inc. 2.35%, 1/15/2032 | | |
Construction Materials — 0.0% ^ |
Martin Marietta Materials, Inc. Series CB, 2.50%, 3/15/2030 | | |
|
AerCap Ireland Capital DAC (Ireland) |
| | |
| | |
American Express Co. (SOFR + 1.33%), 6.34%, 10/30/2026 (b) | | |
Avolon Holdings Funding Ltd. (Ireland) |
| | |
| | |
| | |
| | |
Capital One Financial Corp. |
(SOFR + 1.37%), 4.17%, 5/9/2025 (b) | | |
(SOFR + 1.27%), 2.62%, 11/2/2032 (b) | | |
General Motors Financial Co., Inc. |
| | |
| | |
Mitsubishi HC Finance America LLC (Japan) 5.81%, 9/12/2028 (a) | | |
| | |
SEE NOTES TO FINANCIAL STATEMENTS.
| J.P. Morgan Exchange-Traded Funds | |
| | |
Corporate Bonds — continued |
Consumer Staples Distribution & Retail — 0.1% |
7-Eleven, Inc. 1.80%, 2/10/2031 (a) | | |
Walmart, Inc. 4.10%, 4/15/2033 | | |
| | |
Containers & Packaging — 0.1% |
Graphic Packaging International LLC 1.51%, 4/15/2026 (a) | | |
WRKCo, Inc. 4.90%, 3/15/2029 | | |
| | |
|
Goodman US Finance Three LLC (Australia) 3.70%, 3/15/2028 (a) | | |
Safehold GL Holdings LLC 2.80%, 6/15/2031 | | |
Simon Property Group LP 2.45%, 9/13/2029 | | |
|
| | |
| | |
| | |
Diversified Telecommunication Services — 0.5% |
AT&T, Inc. 1.65%, 2/1/2028 | | |
NBN Co. Ltd. (Australia) 2.63%, 5/5/2031 (a) | | |
Sprint Capital Corp. 6.88%, 11/15/2028 | | |
Verizon Communications, Inc. |
| | |
| | |
| | |
Electric Utilities — 1.9% |
Alabama Power Co. 5.85%, 11/15/2033 | | |
American Electric Power Co., Inc. |
| | |
| | |
Arizona Public Service Co. 3.35%, 6/15/2024 | | |
Atlantic City Electric Co. 4.00%, 10/15/2028 | | |
CenterPoint Energy Houston Electric LLC Series AA, 3.00%, 2/1/2027 | | |
Cleveland Electric Illuminating Co. (The) |
| | |
| | |
| | |
Connecticut Light and Power Co. (The) Series A, 3.20%, 3/15/2027 | | |
DTE Electric Co. 3.38%, 3/1/2025 | | |
Duke Energy Carolinas LLC 6.45%, 10/15/2032 | | |
| | |
|
Electric Utilities — continued |
Duke Energy Indiana LLC 5.25%, 3/1/2034 | | |
Duke Energy Ohio, Inc. 5.25%, 4/1/2033 | | |
Duquesne Light Holdings, Inc. |
| | |
| | |
Edison International 3.55%, 11/15/2024 | | |
Entergy Louisiana LLC 1.60%, 12/15/2030 | | |
Evergy, Inc. 2.90%, 9/15/2029 | | |
Fells Point Funding Trust 3.05%, 1/31/2027 (a) | | |
Fortis, Inc. (Canada) 3.06%, 10/4/2026 | | |
Interstate Power and Light Co. 4.10%, 9/26/2028 | | |
ITC Holdings Corp. 2.95%, 5/14/2030 (a) | | |
Kentucky Utilities Co. 3.30%, 10/1/2025 | | |
NextEra Energy Capital Holdings, Inc. 2.25%, 6/1/2030 | | |
Niagara Mohawk Power Corp. |
| | |
| | |
NRG Energy, Inc. 2.45%, 12/2/2027 (a) | | |
Pacific Gas and Electric Co. |
| | |
| | |
Pennsylvania Electric Co. 3.25%, 3/15/2028 (a) | | |
PG&E Wildfire Recovery Funding LLC Series A-2, 4.26%, 6/1/2036 | | |
Potomac Electric Power Co. 5.20%, 3/15/2034 | | |
SCE Recovery Funding LLC Series A-2, 1.94%, 5/15/2038 | | |
Southern Co. (The) 5.70%, 3/15/2034 | | |
Southwestern Electric Power Co. Series M, 4.10%, 9/15/2028 | | |
Tampa Electric Co. 4.90%, 3/1/2029 | | |
Virginia Electric and Power Co. Series A, 3.50%, 3/15/2027 | | |
Wisconsin Electric Power Co. 3.10%, 6/1/2025 | | |
| | |
Electrical Equipment — 0.0% ^ |
Eaton Corp. 3.10%, 9/15/2027 | | |
Electronic Equipment, Instruments & Components — 0.1% |
Arrow Electronics, Inc. 3.88%, 1/12/2028 | | |
SEE NOTES TO FINANCIAL STATEMENTS.
| J.P. Morgan Exchange-Traded Funds | |
JPMorgan Inflation Managed Bond ETF
SCHEDULE OF PORTFOLIO INVESTMENTSAS OF February 29, 2024 (continued)
| | |
Corporate Bonds — continued |
Energy Equipment & Services — 0.0% ^ |
Halliburton Co. 2.92%, 3/1/2030 | | |
Schlumberger Holdings Corp. 3.90%, 5/17/2028 (a) | | |
| | |
Financial Services — 0.5% |
Corebridge Financial, Inc. 3.65%, 4/5/2027 | | |
Fiserv, Inc. 5.35%, 3/15/2031 | | |
|
| | |
| | |
LSEGA Financing plc (United Kingdom) 2.00%, 4/6/2028 (a) | | |
Nationwide Building Society (United Kingdom) 4.85%, 7/27/2027 (a) | | |
| | |
|
Bimbo Bakeries USA, Inc. (Mexico) 6.05%, 1/15/2029 (a) | | |
General Mills, Inc. 4.95%, 3/29/2033 | | |
J M Smucker Co. (The) 6.20%, 11/15/2033 | | |
Mead Johnson Nutrition Co. (United Kingdom) 4.13%, 11/15/2025 | | |
|
| | |
| | |
| | |
|
Atmos Energy Corp. 2.63%, 9/15/2029 | | |
ONE Gas, Inc. 2.00%, 5/15/2030 | | |
| | |
Ground Transportation — 0.5% |
Canadian Pacific Railway Co. (Canada) 2.05%, 3/5/2030 | | |
ERAC USA Finance LLC 3.85%, 11/15/2024 (a) | | |
Penske Truck Leasing Co. LP |
| | |
| | |
Triton Container International Ltd. (Bermuda) |
| | |
| | |
| | |
| | |
|
Health Care Equipment & Supplies — 0.0% ^ |
Becton Dickinson & Co. 3.36%, 6/6/2024 | | |
Health Care Providers & Services — 0.5% |
|
| | |
| | |
CVS Health Corp. 1.88%, 2/28/2031 | | |
|
| | |
| | |
| | |
Humana, Inc. 3.95%, 3/15/2027 | | |
|
| | |
| | |
| | |
UnitedHealth Group, Inc. 3.38%, 4/15/2027 | | |
| | |
|
Healthcare Realty Holdings LP |
| | |
| | |
Healthpeak OP LLC 2.13%, 12/1/2028 | | |
Physicians Realty LP 2.63%, 11/1/2031 | | |
Sabra Health Care LP 3.20%, 12/1/2031 | | |
|
| | |
| | |
| | |
Welltower OP LLC 2.75%, 1/15/2032 | | |
| | |
Hotels, Restaurants & Leisure — 0.2% |
Expedia Group, Inc. 3.25%, 2/15/2030 | | |
|
Prologis LP 4.75%, 6/15/2033 | | |
|
Aon North America, Inc. 5.45%, 3/1/2034 | | |
Athene Global Funding 2.72%, 1/7/2029 (a) | | |
|
| | |
| | |
F&G Global Funding 2.30%, 4/11/2027 (a) | | |
Five Corners Funding Trust II 2.85%, 5/15/2030 (a) | | |
SEE NOTES TO FINANCIAL STATEMENTS.
| J.P. Morgan Exchange-Traded Funds | |
| | |
Corporate Bonds — continued |
|
Guardian Life Global Funding 0.88%, 12/10/2025 (a) | | |
Manulife Financial Corp. (Canada) 4.15%, 3/4/2026 | | |
Marsh & McLennan Cos., Inc. 3.88%, 3/15/2024 | | |
Principal Financial Group, Inc. |
| | |
| | |
Prudential Insurance Co. of America (The) 8.30%, 7/1/2025 (a) | | |
| | |
|
Hasbro, Inc. 3.90%, 11/19/2029 | | |
|
Charter Communications Operating LLC 4.91%, 7/23/2025 | | |
Comcast Corp. 4.15%, 10/15/2028 | | |
Discovery Communications LLC 3.95%, 3/20/2028 | | |
Paramount Global 2.90%, 1/15/2027 | | |
Time Warner Cable Enterprises LLC 8.38%, 7/15/2033 | | |
| | |
|
Glencore Funding LLC (Australia) |
| | |
| | |
Steel Dynamics, Inc. 1.65%, 10/15/2027 | | |
| | |
|
Ameren Corp. 5.00%, 1/15/2029 | | |
CenterPoint Energy, Inc. 1.45%, 6/1/2026 | | |
CMS Energy Corp. 2.95%, 2/15/2027 | | |
Consolidated Edison Co. of New York, Inc. 3.80%, 5/15/2028 | | |
Consumers Energy Co. 4.63%, 5/15/2033 | | |
NiSource, Inc. 5.25%, 3/30/2028 | | |
PG&E Energy Recovery Funding LLC Series A-2, 2.28%, 1/15/2036 | | |
Public Service Enterprise Group, Inc. 1.60%, 8/15/2030 | | |
Puget Energy, Inc. 2.38%, 6/15/2028 | | |
| | |
| | |
|
|
Alexandria Real Estate Equities, Inc. 3.38%, 8/15/2031 | | |
COPT Defense Properties LP 2.00%, 1/15/2029 | | |
Kilroy Realty LP 2.65%, 11/15/2033 | | |
| | |
Oil, Gas & Consumable Fuels — 1.9% |
Aker BP ASA (Norway) 2.00%, 7/15/2026 (a) | | |
APA Infrastructure Ltd. (Australia) 4.25%, 7/15/2027 (a) | | |
BP Capital Markets America, Inc. 2.72%, 1/12/2032 | | |
Cameron LNG LLC 2.90%, 7/15/2031 (a) | | |
Cheniere Corpus Christi Holdings LLC 5.88%, 3/31/2025 | | |
Columbia Pipelines Holding Co. LLC 5.68%, 1/15/2034 (a) | | |
Coterra Energy, Inc. 3.90%, 5/15/2027 | | |
Eastern Energy Gas Holdings LLC Series A, 2.50%, 11/15/2024 | | |
Ecopetrol SA (Colombia) 5.38%, 6/26/2026 | | |
Enbridge, Inc. (Canada) 5.70%, 3/8/2033 | | |
|
| | |
| | |
| | |
Enterprise Products Operating LLC 3.95%, 2/15/2027 | | |
Flex Intermediate Holdco LLC 3.36%, 6/30/2031 (a) | | |
|
| | |
| | |
HF Sinclair Corp. 5.88%, 4/1/2026 | | |
|
| | |
| | |
| | |
| | |
NGPL PipeCo LLC 3.25%, 7/15/2031 (a) | | |
Ovintiv, Inc. 5.38%, 1/1/2026 | | |
Pioneer Natural Resources Co. 1.90%, 8/15/2030 | | |
Plains All American Pipeline LP |
| | |
SEE NOTES TO FINANCIAL STATEMENTS.
| J.P. Morgan Exchange-Traded Funds | |
JPMorgan Inflation Managed Bond ETF
SCHEDULE OF PORTFOLIO INVESTMENTSAS OF February 29, 2024 (continued)
| | |
Corporate Bonds — continued |
Oil, Gas & Consumable Fuels — continued |
| | |
Sabine Pass Liquefaction LLC 4.50%, 5/15/2030 | | |
Suncor Energy, Inc. (Canada) 5.95%, 12/1/2034 | | |
Targa Resources Partners LP 4.00%, 1/15/2032 | | |
| | |
Passenger Airlines — 0.0% ^ |
Continental Airlines Pass-Through Trust Series 2012-2, Class A Shares, 4.00%, 10/29/2024 | | |
|
Astrazeneca Finance LLC (United Kingdom) 5.00%, 2/26/2034 | | |
|
| | |
| | |
Takeda Pharmaceutical Co. Ltd. (Japan) 2.05%, 3/31/2030 | | |
| | |
Real Estate Management & Development — 0.1% |
Mitsui Fudosan Co. Ltd. (Japan) 3.65%, 7/20/2027 (a) | | |
Ontario Teachers' Cadillac Fairview Properties Trust (Canada) 3.88%, 3/20/2027 (a) | | |
| | |
|
Essex Portfolio LP 1.65%, 1/15/2031 | | |
Mid-America Apartments LP 1.70%, 2/15/2031 | | |
|
| | |
| | |
| | |
| | |
|
Brixmor Operating Partnership LP |
| | |
| | |
| | |
|
| | |
| | |
| | |
|
|
Realty Income Corp. 4.13%, 10/15/2026 | | |
|
| | |
| | |
Scentre Group Trust 1 (Australia) 3.50%, 2/12/2025 (a) | | |
SITE Centers Corp. 3.63%, 2/1/2025 | | |
| | |
Semiconductors & Semiconductor Equipment — 0.4% |
|
| | |
| | |
KLA Corp. 4.70%, 2/1/2034 | | |
Marvell Technology, Inc. 2.95%, 4/15/2031 | | |
NXP BV (China) 2.50%, 5/11/2031 | | |
| | |
|
|
| | |
| | |
| | |
| | |
|
| | |
| | |
Workday, Inc. 3.50%, 4/1/2027 | | |
| | |
|
American Tower Corp. 1.45%, 9/15/2026 | | |
Crown Castle, Inc. 4.45%, 2/15/2026 | | |
Equinix, Inc. 2.90%, 11/18/2026 | | |
|
| | |
| | |
| | |
|
AutoZone, Inc. 1.65%, 1/15/2031 | | |
|
| | |
| | |
O'Reilly Automotive, Inc. |
| | |
SEE NOTES TO FINANCIAL STATEMENTS.
| J.P. Morgan Exchange-Traded Funds | |
| | |
Corporate Bonds — continued |
Specialty Retail — continued |
| | |
| | |
| | |
|
Altria Group, Inc. 2.45%, 2/4/2032 | | |
BAT Capital Corp. (United Kingdom) |
| | |
| | |
| | |
Trading Companies & Distributors — 0.3% |
|
| | |
| | |
Aviation Capital Group LLC 5.50%, 12/15/2024 (a) | | |
BOC Aviation Ltd. (China) 3.50%, 10/10/2024 (a) | | |
| | |
|
American Water Capital Corp. |
| | |
| | |
| | |
Wireless Telecommunication Services — 0.3% |
Rogers Communications, Inc. (Canada) 3.80%, 3/15/2032 | | |
|
| | |
| | |
| | |
Total Corporate Bonds
(Cost $196,098,250) | | |
Mortgage-Backed Securities — 26.4% |
FHLMC Gold Pools, 20 Year | | |
Pool # C91030, 5.50%, 5/1/2027 | | |
Pool # C91802, 3.50%, 1/1/2035 | | |
FHLMC Gold Pools, 30 Year | | |
Pool # A15232, 5.00%, 10/1/2033 | | |
Pool # A57681, 6.00%, 12/1/2036 | | |
Pool # G06493, 4.50%, 5/1/2041 | | |
| | |
Pool # WN1157, 1.80%, 11/1/2028 | | |
| | |
|
Pool # U90690, 3.50%, 6/1/2042 | | |
| | |
Pool # ZM6956, 4.50%, 6/1/2048 | | |
Pool # RA5276, 2.50%, 5/1/2051 | | |
Pool # QC3244, 3.00%, 6/1/2051 | | |
Pool # QC7410, 2.50%, 9/1/2051 | | |
Pool # RA5906, 2.50%, 9/1/2051 | | |
Pool # RA6702, 3.00%, 2/1/2052 | | |
Pool # RA7937, 5.00%, 9/1/2052 | | |
| | |
Pool # MA1138, 3.50%, 8/1/2032 | | |
Pool # AP9584, 3.00%, 10/1/2032 | | |
| | |
Pool # AL0045, 6.00%, 12/1/2032 | | |
Pool # 735503, 6.00%, 4/1/2035 | | |
Pool # 888460, 6.50%, 10/1/2036 | | |
Pool # 888890, 6.50%, 10/1/2037 | | |
Pool # 949320, 7.00%, 10/1/2037 | | |
Pool # 995149, 6.50%, 10/1/2038 | | |
Pool # 994410, 7.00%, 11/1/2038 | | |
Pool # AD9151, 5.00%, 8/1/2040 | | |
Pool # AE0681, 4.50%, 12/1/2040 | | |
Pool # BM3500, 4.00%, 9/1/2047 | | |
Pool # BM3499, 4.00%, 12/1/2047 | | |
Pool # BE8354, 4.00%, 3/1/2048 | | |
Pool # CA6989, 2.50%, 9/1/2050 | | |
Pool # FS5384, 2.50%, 6/1/2051 | | |
Pool # FM7957, 2.50%, 7/1/2051 (e) | | |
Pool # FS6514, 2.50%, 9/1/2051 | | |
Pool # CB1878, 3.00%, 10/1/2051 | | |
Pool # CB2637, 2.50%, 1/1/2052 | | |
Pool # CB2670, 3.00%, 1/1/2052 | | |
Pool # FS5986, 2.50%, 2/1/2052 | | |
Pool # FS0882, 2.50%, 3/1/2052 | | |
Pool # CB3378, 4.00%, 4/1/2052 | | |
Pool # CB3629, 4.00%, 5/1/2052 | | |
Pool # DA4015, 6.00%, 10/1/2053 | | |
| | |
Pool # AN1247, 2.64%, 6/1/2026 | | |
Pool # AN6732, 2.83%, 5/1/2027 | | |
Pool # AN7338, 3.06%, 11/1/2027 | | |
Pool # AN7943, 3.10%, 1/1/2028 | | |
Pool # AN1161, 3.05%, 4/1/2028 | | |
Pool # BS8224, 4.10%, 5/1/2028 | | |
Pool # AN9486, 3.57%, 6/1/2028 | | |
SEE NOTES TO FINANCIAL STATEMENTS.
| J.P. Morgan Exchange-Traded Funds | |
JPMorgan Inflation Managed Bond ETF
SCHEDULE OF PORTFOLIO INVESTMENTSAS OF February 29, 2024 (continued)
| | |
Mortgage-Backed Securities — continued |
Pool # AN2069, 2.35%, 8/1/2028 | | |
Pool # BL0907, 3.88%, 12/1/2028 | | |
Pool # BM4162, 3.12%, 10/1/2029 (f) | | |
Pool # BL4333, 2.52%, 11/1/2029 | | |
Pool # BS8252, 4.36%, 4/1/2030 | | |
Pool # BM7037, 1.75%, 3/1/2032 (f) | | |
Pool # BS5117, 2.58%, 3/1/2032 | | |
Pool # BS8503, 4.62%, 5/1/2033 | | |
Pool # BS2933, 1.82%, 9/1/2033 | | |
Pool # MA1125, 4.00%, 7/1/2042 | | |
Pool # MA1437, 3.50%, 5/1/2043 | | |
Pool # MA1463, 3.50%, 6/1/2043 | | |
Pool # BF0669, 4.00%, 6/1/2052 | | |
Pool # BF0230, 5.50%, 1/1/2058 | | |
Pool # BM6734, 4.00%, 8/1/2059 | | |
Pool # BF0497, 3.00%, 7/1/2060 | | |
Pool # BF0546, 2.50%, 7/1/2061 | | |
Pool # BF0617, 2.50%, 3/1/2062 | | |
FNMA/FHLMC UMBS, Single Family, 30 Year | | |
TBA, 2.50%, 4/25/2054 (e) | | |
TBA, 3.00%, 4/25/2054 (e) | | |
TBA, 5.50%, 4/25/2054 (e) | | |
TBA, 6.00%, 4/25/2054 (e) | | |
| | |
Pool # 4245, 6.00%, 9/20/2038 | | |
Pool # BA7567, 4.50%, 5/20/2048 | | |
Pool # BI0416, 4.50%, 11/20/2048 | | |
Pool # BM9692, 4.50%, 7/20/2049 | | |
Total Mortgage-Backed Securities
(Cost $179,463,028) | | |
U.S. Treasury Obligations — 20.5% |
U.S. Treasury Inflation Indexed Notes
0.25%, 1/15/2025 (g) | | |
U.S. Treasury Inflation Linked Notes | | |
| | |
| | |
| | |
| | |
Total U.S. Treasury Obligations
(Cost $135,156,005) | | |
Asset-Backed Securities — 10.6% |
ACM Auto Trust Series 2023-1A, Class A, 6.61%, 1/22/2030 (a) | | |
| | |
|
Air Canada Pass-Through Trust (Canada) | | |
Series 2013-1, Class A, 4.13%, 5/15/2025 (a) | | |
Series 2017-1, Class AA, 3.30%, 1/15/2030 (a) | | |
Aligned Data Centers Issuer LLC Series 2021-1A, Class A2, 1.94%, 8/15/2046 (a) | | |
American Airlines Pass-Through Trust | | |
Series 2016-3, Class AA, 3.00%, 10/15/2028 | | |
Series 2021-1, Class B, 3.95%, 7/11/2030 | | |
American Credit Acceptance Receivables Trust | | |
Series 2023-2, Class A, 5.89%, 10/13/2026 (a) | | |
Series 2023-1, Class C, 5.59%, 4/12/2029 (a) | | |
AmeriCredit Automobile Receivables Trust | | |
Series 2020-3, Class B, 0.76%, 12/18/2025 | | |
Series 2021-2, Class B, 0.69%, 1/19/2027 | | |
| | |
Series 2020-SFR4, Class A, 1.36%, 11/17/2037 (a) | | |
Series 2020-SFR5, Class A, 1.38%, 11/17/2037 (a) | | |
Amur Equipment Finance Receivables LLC Series 2022-1A, Class A2, 1.64%, 10/20/2027 (a) | | |
Avis Budget Rental Car Funding AESOP LLC Series 2020-1A, Class A, 2.33%, 8/20/2026 (a) | | |
Business Jet Securities LLC | | |
Series 2020-1A, Class A, 2.98%, 11/15/2035 ‡ (a) | | |
Series 2022-1A, Class A, 4.46%, 6/15/2037 ‡ (a) | | |
| | |
Series 2021-1, Class A3, 0.34%, 12/15/2025 | | |
Series 2023-4, Class A3, 6.00%, 7/17/2028 | | |
Carvana Auto Receivables Trust | | |
Series 2021-P3, Class A3, 0.70%, 11/10/2026 | | |
Series 2023-N1, Class A, 6.36%, 4/12/2027 (a) | | |
Series 2022-P3, Class A3, 4.61%, 11/10/2027 | | |
SEE NOTES TO FINANCIAL STATEMENTS.
| J.P. Morgan Exchange-Traded Funds | |
| | |
Asset-Backed Securities — continued |
Series 2021-P4, Class A4, 1.64%, 12/10/2027 | | |
CoreVest American Finance Trust | | |
Series 2019-3, Class A, 2.71%, 10/15/2052 (a) | | |
Series 2022-1, Class A, 4.74%, 6/17/2055 (a) (f) | | |
CPS Auto Receivables Trust | | |
Series 2023-A, Class C, 5.54%, 4/16/2029 (a) | | |
Series 2022-C, Class B, 4.88%, 4/15/2030 (a) | | |
Credit Acceptance Auto Loan Trust | | |
Series 2021-3A, Class A, 1.00%, 5/15/2030 (a) | | |
Series 2023-1A, Class B, 7.02%, 5/16/2033 (a) | | |
| | |
Series 2022-2A, Class A, 2.88%, 6/15/2026 (a) | | |
Series 2021-3A, Class C, 0.87%, 5/17/2027 (a) | | |
Series 2021-4A, Class D, 1.99%, 9/15/2027 (a) | | |
Series 2023-1A, Class C, 5.55%, 10/16/2028 (a) | | |
Series 2023-2A, Class B, 5.41%, 2/15/2029 (a) | | |
Exeter Automobile Receivables Trust | | |
Series 2022-5A, Class B, 5.97%, 3/15/2027 | | |
Series 2023-5A, Class A3, 6.32%, 3/15/2027 | | |
Series 2022-4A, Class C, 4.92%, 12/15/2028 | | |
Series 2023-1A, Class D, 6.69%, 6/15/2029 | | |
FHF Trust Series 2023-1A, Class A2, 6.57%, 6/15/2028 (a) | | |
| | |
Series 2020-SFR2, Class A, 1.27%, 10/19/2037 (a) | | |
Series 2021-SFR1, Class E1, 2.39%, 8/17/2038 (a) | | |
Series 2021-SFR2, Class D, 2.06%, 9/17/2038 (a) | | |
Flagship Credit Auto Trust | | |
Series 2021-4, Class A, 0.81%, 7/17/2026 (a) | | |
| | |
|
Series 2022-1, Class A, 1.79%, 10/15/2026 (a) | | |
Series 2023-1, Class A2, 5.38%, 12/15/2026 (a) | | |
Series 2023-2, Class A2, 5.76%, 4/15/2027 (a) | | |
Series 2023-1, Class C, 5.43%, 5/15/2029 (a) | | |
FRTKL Series 2021-SFR1, Class A, 1.57%, 9/17/2038 (a) | | |
GLS Auto Receivables Issuer Trust Series 2021-3A, Class C, 1.11%, 9/15/2026 (a) | | |
GM Financial Consumer Automobile Receivables Trust Series 2021-1, Class A3, 0.35%, 10/16/2025 | | |
HERO Funding (Cayman Islands) Series 2017-3A, Class A2, 3.95%, 9/20/2048 ‡ (a) | | |
Hertz Vehicle Financing LLC Series 2022-1A, Class A, 1.99%, 6/25/2026 (a) | | |
Home Partners of America Trust Series 2022-1, Class D, 4.73%, 4/17/2039 (a) | | |
Kubota Credit Owner Trust Series 2023-1A, Class A3, 5.02%, 6/15/2027 (a) | | |
Lendmark Funding Trust Series 2022-1A, Class A, 5.12%, 7/20/2032 (a) | | |
LP LMS Asset Securitization Trust Series 2023-1A, Class A, 8.18%, 10/17/2033 (a) | | |
| | |
Series 2021-2A, Class A, 1.43%, 5/20/2039 (a) | | |
Series 2021-1WA, Class A, 1.14%, 1/22/2041 (a) | | |
OneMain Direct Auto Receivables Trust Series 2023-1A, Class A, 5.41%, 11/14/2029 (a) | | |
PRET LLC Series 2021-NPL6, Class A1, 2.49%, 7/25/2051 (a) (d) | | |
Progress Residential Trust | | |
Series 2020-SFR3, Class B, 1.50%, 10/17/2027 (a) | | |
Series 2021-SFR2, Class E1, 2.55%, 4/19/2038 (a) | | |
Series 2021-SFR8, Class E1, 2.38%, 10/17/2038 (a) | | |
Series 2021-SFR11, Class A, 2.28%, 1/17/2039 (a) | | |
Series 2023-SFR1, Class A, 4.30%, 3/17/2040 (a) | | |
Series 2021-SFR9, Class E1, 2.81%, 11/17/2040 (a) | | |
SEE NOTES TO FINANCIAL STATEMENTS.
| J.P. Morgan Exchange-Traded Funds | |
JPMorgan Inflation Managed Bond ETF
SCHEDULE OF PORTFOLIO INVESTMENTSAS OF February 29, 2024 (continued)
| | |
Asset-Backed Securities — continued |
PRPM LLC Series 2021-10, Class A1, 2.49%, 10/25/2026 (a) (d) | | |
Santander Drive Auto Receivables Trust | | |
Series 2022-5, Class B, 4.43%, 3/15/2027 | | |
Series 2023-1, Class B, 4.98%, 2/15/2028 | | |
Series 2023-5, Class B, 6.16%, 12/17/2029 | | |
Santander Retail Auto Lease Trust Series 2022-A, Class A3, 1.34%, 7/21/2025 (a) | | |
SCF Equipment Leasing LLC Series 2022-2A, Class A3, 6.50%, 10/21/2030 (a) | | |
Sierra Timeshare Receivables Funding LLC Series 2022-2A, Class A, 4.73%, 6/20/2040 (a) | | |
Spirit Airlines Pass-Through Trust Series 2017-1, Class AA, 3.38%, 2/15/2030 | | |
SpringCastle America Funding LLC Series 2020-AA, Class A, 1.97%, 9/25/2037 (a) | | |
Toyota Auto Receivables Owner Trust | | |
Series 2021-A, Class A3, 0.26%, 5/15/2025 | | |
Series 2020-C, Class A4, 0.57%, 10/15/2025 | | |
Series 2021-C, Class A4, 0.72%, 1/15/2027 | | |
United Airlines Pass-Through Trust | | |
Series 2016-1, Class AA, 3.10%, 7/7/2028 | | |
Series 2016-2, Class AA, 2.88%, 10/7/2028 | | |
Series 2018-1, Class AA, 3.50%, 3/1/2030 | | |
Series 2018-1, Class A, 3.70%, 3/1/2030 | | |
US Auto Funding Trust Series 2022-1A, Class A, 3.98%, 4/15/2025 (a) | | |
VOLT C LLC Series 2021-NPL9, Class A1, 1.99%, 5/25/2051 (a) (d) | | |
VOLT CI LLC Series 2021-NP10, Class A1, 1.99%, 5/25/2051 (a) (d) | | |
VOLT CV LLC Series 2021-CF2, Class A1, 2.49%, 11/27/2051 (a) (d) | | |
VOLT XCIII LLC Series 2021-NPL2, Class A1, 4.89%, 2/27/2051 (a) (d) | | |
VOLT XCIV LLC Series 2021-NPL3, Class A1, 2.24%, 2/27/2051 (a) (d) | | |
VOLT XCIX LLC Series 2021-NPL8, Class A1, 2.12%, 4/25/2051 (a) (d) | | |
VOLT XCVI LLC Series 2021-NPL5, Class A1, 5.12%, 3/27/2051 (a) (d) | | |
VOLT XCVII LLC Series 2021-NPL6, Class A1, 2.24%, 4/25/2051 (a) (d) | | |
| | |
|
Westgate Resorts LLC Series 2022-1A, Class A, 1.79%, 8/20/2036 (a) | | |
Westlake Automobile Receivables Trust | | |
Series 2022-3A, Class A3, 5.49%, 7/15/2026 (a) | | |
Series 2021-3A, Class D, 2.12%, 1/15/2027 (a) | | |
Series 2023-1A, Class A3, 5.21%, 1/18/2028 (a) | | |
Series 2023-1A, Class C, 5.74%, 8/15/2028 (a) | | |
World Omni Auto Receivables Trust | | |
Series 2021-A, Class A3, 0.30%, 1/15/2026 | | |
Series 2021-C, Class A3, 0.44%, 8/17/2026 | | |
Series 2023-D, Class A3, 5.79%, 2/15/2029 | | |
Total Asset-Backed Securities
(Cost $72,254,967) | | |
Collateralized Mortgage Obligations — 6.5% |
CHL Mortgage Pass-Through Trust Series 2004-8, Class 2A1, 4.50%, 6/25/2019 ‡ | | |
Citigroup Mortgage Loan Trust Series 2004-HYB4, Class WA, 6.25%, 12/25/2034 (f) | | |
Citigroup Mortgage Loan Trust, Inc. Series 2003-1, Class 3A4, 5.25%, 9/25/2033 | | |
CSFB Mortgage-Backed Pass-Through Certificates Series 2003-27, Class 5A4, 5.25%, 11/25/2033 | | |
CSMC Trust Series 2022-JR1, Class A1, 4.27%, 10/25/2066 (a) (d) | | |
| | |
Series 3521, Class B, 4.00%, 4/15/2024 | | |
Series 3544, Class BC, 4.00%, 6/15/2024 | | |
Series 3546, Class NB, 4.00%, 6/15/2024 | | |
Series 3562, Class JC, 4.00%, 8/15/2024 | | |
Series 3563, Class BD, 4.00%, 8/15/2024 | | |
Series 3571, Class MY, 4.00%, 9/15/2024 | | |
Series 3575, Class EB, 4.00%, 9/15/2024 | | |
Series 3577, Class B, 4.00%, 9/15/2024 | | |
Series 3578, Class KB, 4.00%, 9/15/2024 | | |
Series 2989, Class TG, 5.00%, 6/15/2025 | | |
Series 2988, Class TY, 5.50%, 6/15/2025 | | |
Series 3816, Class HA, 3.50%, 11/15/2025 | | |
SEE NOTES TO FINANCIAL STATEMENTS.
| J.P. Morgan Exchange-Traded Funds | |
| | |
Collateralized Mortgage Obligations — continued |
Series 3087, Class KX, 5.50%, 12/15/2025 | | |
Series 3787, Class AY, 3.50%, 1/15/2026 | | |
Series 3794, Class LB, 3.50%, 1/15/2026 | | |
Series 3102, Class CE, 5.50%, 1/15/2026 | | |
Series 3123, Class HT, 5.00%, 3/15/2026 | | |
Series 3121, Class JD, 5.50%, 3/15/2026 | | |
Series 3150, Class EQ, 5.00%, 5/15/2026 | | |
Series 3898, Class KH, 3.50%, 6/15/2026 | | |
Series 3885, Class AC, 4.00%, 6/15/2026 | | |
Series 3911, Class B, 3.50%, 8/15/2026 | | |
Series 3959, Class PB, 3.00%, 11/15/2026 | | |
Series 3337, Class MD, 5.50%, 6/15/2027 | | |
Series 2110, Class PG, 6.00%, 1/15/2029 | | |
Series 3563, Class LB, 4.00%, 8/15/2029 | | |
Series 3653, Class B, 4.50%, 4/15/2030 | | |
Series 3824, Class EY, 3.50%, 3/15/2031 | | |
Series 2525, Class AM, 4.50%, 4/15/2032 | | |
Series 2441, Class GF, 6.50%, 4/15/2032 | | |
Series 2436, Class MC, 7.00%, 4/15/2032 | | |
Series 2760, Class KT, 4.50%, 9/15/2032 | | |
Series 2505, Class D, 5.50%, 9/15/2032 | | |
Series 2544, Class KE, 5.50%, 12/15/2032 | | |
Series 2557, Class HL, 5.30%, 1/15/2033 | | |
Series 2575, Class PE, 5.50%, 2/15/2033 | | |
Series 2586, Class WG, 4.00%, 3/15/2033 | | |
Series 2596, Class QD, 4.00%, 3/15/2033 | | |
Series 2621, Class QH, 5.00%, 5/15/2033 | | |
Series 2624, Class QH, 5.00%, 6/15/2033 | | |
Series 2648, Class BK, 5.00%, 7/15/2033 | | |
Series 4238, Class UY, 3.00%, 8/15/2033 | | |
Series 2673, Class PE, 5.50%, 9/15/2033 | | |
Series 2696, Class DG, 5.50%, 10/15/2033 | | |
Series 2725, Class TA, 4.50%, 12/15/2033 | | |
Series 2733, Class ME, 5.00%, 1/15/2034 | | |
Series 2768, Class PK, 5.00%, 3/15/2034 | | |
Series 2934, Class KG, 5.00%, 2/15/2035 | | |
Series 3077, Class TO, PO, 4/15/2035 | | |
Series 2960, Class JH, 5.50%, 4/15/2035 | | |
Series 3082, Class PW, 5.50%, 12/15/2035 | | |
Series 3084, Class BH, 5.50%, 12/15/2035 | | |
| | |
|
Series 3098, Class KG, 5.50%, 1/15/2036 | | |
Series 3136, Class CO, PO, 4/15/2036 | | |
Series 3145, Class AJ, 5.50%, 4/15/2036 | | |
Series 3819, Class ZQ, 6.00%, 4/15/2036 | | |
Series 3200, PO, 8/15/2036 | | |
Series 3270, Class AT, 5.50%, 1/15/2037 | | |
Series 3272, Class PA, 6.00%, 2/15/2037 | | |
Series 3348, Class HT, 6.00%, 7/15/2037 | | |
Series 3501, Class A, 4.50%, 1/15/2039 | | |
Series 3508, Class PK, 4.00%, 2/15/2039 | | |
Series 3513, Class A, 4.50%, 2/15/2039 | | |
Series 3653, Class HJ, 5.00%, 4/15/2040 | | |
Series 3677, Class KB, 4.50%, 5/15/2040 | | |
Series 3677, Class PB, 4.50%, 5/15/2040 | | |
Series 3715, Class PC, 4.50%, 8/15/2040 | | |
Series 3955, Class HB, 3.00%, 12/15/2040 | | |
Series 3828, Class PU, 4.50%, 3/15/2041 | | |
Series 3852, Class TP, IF, 5.50%, 5/15/2041 (f) | | |
Series 3956, Class EB, 3.25%, 11/15/2041 | | |
Series 3963, Class JB, 4.50%, 11/15/2041 | | |
Series 4026, Class MQ, 4.00%, 4/15/2042 | | |
Series 4616, Class HP, 3.00%, 9/15/2046 | | |
Series 3688, Class GT, 7.54%, 11/15/2046 (f) | | |
FHLMC, STRIPS Series 262, Class 35, 3.50%, 7/15/2042 | | |
| | |
Series 2004-44, Class KT, 6.00%, 6/25/2024 | | |
Series 2004-53, Class NC, 5.50%, 7/25/2024 | | |
Series 2010-49, Class KB, 4.00%, 5/25/2025 | | |
Series 2010-41, Class DC, 4.50%, 5/25/2025 | | |
Series 1997-57, Class PN, 5.00%, 9/18/2027 | | |
Series 2009-39, Class LB, 4.50%, 6/25/2029 | | |
Series 2009-96, Class DB, 4.00%, 11/25/2029 | | |
Series 2010-28, Class DE, 5.00%, 4/25/2030 | | |
Series 2001-63, Class TC, 6.00%, 12/25/2031 | | |
SEE NOTES TO FINANCIAL STATEMENTS.
| J.P. Morgan Exchange-Traded Funds | |
JPMorgan Inflation Managed Bond ETF
SCHEDULE OF PORTFOLIO INVESTMENTSAS OF February 29, 2024 (continued)
| | |
Collateralized Mortgage Obligations — continued |
Series 2001-81, Class HE, 6.50%, 1/25/2032 | | |
Series 2002-75, Class GB, 5.50%, 11/25/2032 | | |
Series 2011-39, Class ZA, 6.00%, 11/25/2032 | | |
Series 2002-85, Class PE, 5.50%, 12/25/2032 | | |
Series 2003-21, Class OU, 5.50%, 3/25/2033 | | |
Series 2003-26, Class EB, 3.50%, 4/25/2033 | | |
Series 2003-23, Class CH, 5.00%, 4/25/2033 | | |
Series 2003-63, Class YB, 5.00%, 7/25/2033 | | |
Series 2003-69, Class N, 5.00%, 7/25/2033 | | |
Series 2003-80, Class QG, 5.00%, 8/25/2033 | | |
Series 2003-85, Class QD, 5.50%, 9/25/2033 | | |
Series 2003-94, Class CE, 5.00%, 10/25/2033 | | |
Series 2005-5, Class CK, 5.00%, 1/25/2035 | | |
Series 2005-29, Class WC, 4.75%, 4/25/2035 | | |
Series 2005-48, Class TD, 5.50%, 6/25/2035 | | |
Series 2005-53, Class MJ, 5.50%, 6/25/2035 | | |
Series 2005-58, Class EP, 5.50%, 7/25/2035 | | |
Series 2005-68, Class BE, 5.25%, 8/25/2035 | | |
Series 2005-68, Class PG, 5.50%, 8/25/2035 | | |
Series 2005-102, Class PG, 5.00%, 11/25/2035 | | |
Series 2005-110, Class GL, 5.50%, 12/25/2035 | | |
Series 2006-49, Class PA, 6.00%, 6/25/2036 | | |
Series 2009-19, Class PW, 4.50%, 10/25/2036 | | |
Series 2006-114, Class HE, 5.50%, 12/25/2036 | | |
Series 2007-33, Class HE, 5.50%, 4/25/2037 | | |
| | |
|
Series 2007-65, Class KI, IF, IO, 1.18%, 7/25/2037 (f) | | |
Series 2007-71, Class KP, 5.50%, 7/25/2037 | | |
Series 2007-71, Class GB, 6.00%, 7/25/2037 | | |
Series 2009-86, Class OT, PO, 10/25/2037 | | |
Series 2008-72, Class BX, 5.50%, 8/25/2038 | | |
Series 2008-74, Class B, 5.50%, 9/25/2038 | | |
Series 2009-37, Class KI, IF, IO, 0.56%, 6/25/2039 (f) | | |
Series 2009-86, Class IP, IO, 5.50%, 10/25/2039 | | |
Series 2009-92, Class AD, 6.00%, 11/25/2039 | | |
Series 2009-112, Class ST, IF, IO, 0.81%, 1/25/2040 (f) | | |
Series 2010-22, Class PE, 5.00%, 3/25/2040 | | |
Series 2010-35, Class SB, IF, IO, 0.98%, 4/25/2040 (f) | | |
Series 2010-37, Class CY, 5.00%, 4/25/2040 | | |
Series 2010-54, Class EA, 4.50%, 6/25/2040 | | |
Series 2010-64, Class DM, 5.00%, 6/25/2040 | | |
Series 2010-71, Class HJ, 5.50%, 7/25/2040 | | |
Series 2010-123, Class BP, 4.50%, 11/25/2040 | | |
Series 2011-41, Class KL, 4.00%, 5/25/2041 | | |
Series 2011-50, Class LP, 4.00%, 6/25/2041 | | |
Series 2012-137, Class CF, 5.74%, 8/25/2041 (f) | | |
Series 2012-103, Class DA, 3.50%, 10/25/2041 | | |
Series 2012-14, Class DE, 3.50%, 3/25/2042 | | |
Series 2012-139, Class JA, 3.50%, 12/25/2042 | | |
Series 2013-104, Class CY, 5.00%, 10/25/2043 | | |
Series 2019-65, Class PA, 2.50%, 5/25/2048 | | |
SEE NOTES TO FINANCIAL STATEMENTS.
| J.P. Morgan Exchange-Traded Funds | |
| | |
Collateralized Mortgage Obligations — continued |
Series 2009-96, Class CB, 4.00%, 11/25/2049 | | |
Series 2019-7, Class CA, 3.50%, 11/25/2057 | | |
| | |
Series 293, Class 1, PO, 12/25/2024 | | |
Series 314, Class 1, PO, 7/25/2031 | | |
| | |
Series 2003-29, Class PD, 5.50%, 4/16/2033 | | |
Series 2003-65, Class AP, 5.50%, 8/20/2033 | | |
Series 2003-77, Class TK, 5.00%, 9/16/2033 | | |
Series 2004-16, Class GC, 5.50%, 2/20/2034 | | |
Series 2004-54, Class BG, 5.50%, 7/20/2034 | | |
Series 2004-93, Class PD, 5.00%, 11/16/2034 | | |
Series 2004-101, Class BE, 5.00%, 11/20/2034 | | |
Series 2005-11, Class PL, 5.00%, 2/20/2035 | | |
Series 2005-26, Class XY, 5.50%, 3/20/2035 | | |
Series 2005-33, Class AY, 5.50%, 4/16/2035 | | |
Series 2005-49, Class B, 5.50%, 6/20/2035 | | |
Series 2005-51, Class DC, 5.00%, 7/20/2035 | | |
Series 2005-56, Class BD, 5.00%, 7/20/2035 | | |
Series 2006-7, Class ND, 5.50%, 8/20/2035 | | |
Series 2007-37, Class LB, 5.50%, 6/16/2037 | | |
Series 2007-79, Class BL, 5.75%, 8/20/2037 | | |
Series 2009-106, Class ST, IF, IO, 0.57%, 2/20/2038 (f) | | |
Series 2008-7, Class PQ, 5.00%, 2/20/2038 | | |
Series 2008-9, Class PW, 5.25%, 2/20/2038 | | |
Series 2008-23, Class YA, 5.25%, 3/20/2038 | | |
| | |
|
Series 2008-35, Class NF, 5.00%, 4/20/2038 | | |
Series 2008-34, Class PG, 5.25%, 4/20/2038 | | |
Series 2008-33, Class PB, 5.50%, 4/20/2038 | | |
Series 2008-38, Class BG, 5.00%, 5/16/2038 | | |
Series 2008-43, Class NB, 5.50%, 5/20/2038 | | |
Series 2008-56, Class PX, 5.50%, 6/20/2038 | | |
Series 2008-58, Class PE, 5.50%, 7/16/2038 | | |
Series 2008-62, Class SA, IF, IO, 0.72%, 7/20/2038 (f) | | |
Series 2008-76, Class US, IF, IO, 0.47%, 9/20/2038 (f) | | |
Series 2011-97, Class WA, 6.10%, 11/20/2038 (f) | | |
Series 2008-95, Class DS, IF, IO, 1.87%, 12/20/2038 (f) | | |
Series 2009-14, Class AG, 4.50%, 3/20/2039 | | |
Series 2009-72, Class SM, IF, IO, 0.81%, 8/16/2039 (f) | | |
Series 2009-61, Class AP, 4.00%, 8/20/2039 | | |
Series 2010-130, Class BD, 4.00%, 12/20/2039 | | |
Series 2010-157, Class OP, PO, 12/20/2040 | | |
Series 2014-H11, Class VA, 5.96%, 6/20/2064 (f) | | |
Series 2015-H20, Class FA, 5.93%, 8/20/2065 (f) | | |
Series 2015-H26, Class FG, 5.98%, 10/20/2065 (f) | | |
GSR Mortgage Loan Trust Series 2004-6F, Class 2A4, 5.50%, 5/25/2034 | | |
| | |
Series 2006-A2, Class 5A3, 6.09%, 11/25/2033 (f) | | |
Series 2007-A1, Class 5A5, 5.53%, 7/25/2035 (f) | | |
MASTR Adjustable Rate Mortgages Trust Series 2004-13, Class 2A1, 5.95%, 4/21/2034 (f) | | |
SEE NOTES TO FINANCIAL STATEMENTS.
| J.P. Morgan Exchange-Traded Funds | |
JPMorgan Inflation Managed Bond ETF
SCHEDULE OF PORTFOLIO INVESTMENTSAS OF February 29, 2024 (continued)
| | |
Collateralized Mortgage Obligations — continued |
Merrill Lynch Mortgage Investors Trust | | |
Series 2003-F, Class A1, 6.08%, 10/25/2028 (f) | | |
Series 2004-B, Class A1, 5.94%, 5/25/2029 (f) | | |
Morgan Stanley Mortgage Loan Trust Series 2004-3, Class 4A, 5.64%, 4/25/2034 (f) | | |
PHH Mortgage Trust Series 2008-CIM2, Class 5A1, 6.00%, 7/25/2038 | | |
Seasoned Credit Risk Transfer Trust | | |
Series 2018-1, Class M60C, 3.50%, 5/25/2057 | | |
Series 2017-4, Class M60C, 3.50%, 6/25/2057 | | |
Series 2017-4, Class MT, 3.50%, 6/25/2057 | | |
Series 2018-2, Class M55D, 4.00%, 11/25/2057 | | |
Series 2019-3, Class M55D, 4.00%, 10/25/2058 | | |
Series 2020-1, Class M55G, 3.00%, 8/25/2059 | | |
Seasoned Loans Structured Transaction Series 2018-2, Class A1, 3.50%, 11/25/2028 | | |
Sequoia Mortgage Trust Series 2004-11, Class A1, 6.03%, 12/20/2034 (f) | | |
Structured Asset Mortgage Investments II Trust Series 2003-AR4, Class A1, 6.13%, 1/19/2034 (f) | | |
Thornburg Mortgage Securities Trust Series 2004-4, Class 3A, 5.61%, 12/25/2044 (f) | | |
Vendee Mortgage Trust Series 2003-2, Class Z, 5.00%, 5/15/2033 | | |
WaMu Mortgage Pass-Through Certificates Trust Series 2003-AR11, Class A6, 5.86%, 10/25/2033 (f) | | |
Total Collateralized Mortgage Obligations
(Cost $46,703,819) | | |
Commercial Mortgage-Backed Securities — 6.0% |
20 Times Square Trust Series 2018-20TS, Class A, 3.10%, 5/15/2035 (a) (f) | | |
BB-UBS Trust Series 2012-SHOW, Class A, 3.43%, 11/5/2036 (a) | | |
BXP Trust Series 2017-GM, Class A, 3.38%, 6/13/2039 (a) | | |
FHLMC, Multi-Family Structured Pass-Through Certificates | | |
Series J22F, Class A2, 4.09%, 9/25/2024 | | |
| | |
|
Series KL3L, Class ALNZ, 3.46%, 4/25/2025 (f) | | |
Series KLU2, Class A7, 2.23%, 9/25/2025 (f) | | |
Series K737, Class AM, 2.10%, 10/25/2026 | | |
Series K072, Class A2, 3.44%, 12/25/2027 | | |
Series K083, Class A2, 4.05%, 9/25/2028 (f) | | |
Series KJ44, Class A2, 4.61%, 2/25/2033 | | |
Series K145, Class AM, 2.58%, 6/25/2055 | | |
| | |
Series 2014-M8, Class A2, 3.06%, 6/25/2024 (f) | | |
Series 2015-M10, Class A2, 3.09%, 4/25/2027 (f) | | |
Series 2017-M8, Class A2, 3.06%, 5/25/2027 (f) | | |
Series 2017-M12, Class A2, 3.06%, 6/25/2027 (f) | | |
Series 2017-M13, Class A2, 2.93%, 9/25/2027 (f) | | |
Series 2018-M2, Class A2, 2.91%, 1/25/2028 (f) | | |
Series 2018-M4, Class A2, 3.06%, 3/25/2028 (f) | | |
Series 2018-M9, Class APT2, 3.10%, 4/25/2028 (f) | | |
Series 2018-M14, Class A2, 3.58%, 8/25/2028 (f) | | |
Series 2017-M5, Class A2, 3.07%, 4/25/2029 (f) | | |
Series 2018-M3, Class A2, 3.07%, 2/25/2030 (f) | | |
Series 2020-M50, Class A2, 1.20%, 10/25/2030 | | |
Series 2020-M50, Class X1, IO, 1.82%, 10/25/2030 (f) | | |
Series 2021-M11, Class A2, 1.46%, 3/25/2031 (f) | | |
Series 2022-M1G, Class A2, 1.53%, 9/25/2031 (f) | | |
Series 2021-M3, Class 1A1, 1.00%, 11/25/2033 | | |
Series 2021-M3, Class X1, IO, 1.92%, 11/25/2033 (f) | | |
FREMF Mortgage Trust Series 2015-K44, Class B, 3.72%, 1/25/2048 (a) (f) | | |
SEE NOTES TO FINANCIAL STATEMENTS.
| J.P. Morgan Exchange-Traded Funds | |
| | |
Commercial Mortgage-Backed Securities — continued |
Morgan Stanley Capital I Trust Series 2021-PLZA, Class A, 2.57%, 11/9/2043 (a) | | |
MRCD MARK Mortgage Trust Series 2019-PARK, Class A, 2.72%, 12/15/2036 (a) | | |
SLG Office Trust Series 2021-OVA, Class A, 2.59%, 7/15/2041 (a) | | |
UBS-BAMLL Trust Series 2012-WRM, Class A, 3.66%, 6/10/2030 (a) | | |
Total Commercial Mortgage-Backed Securities
(Cost $42,779,797) | | |
Foreign Government Securities — 0.2% |
Republic of Colombia 7.38%, 9/18/2037 | | |
| | |
| | |
| | |
Total Foreign Government Securities
(Cost $1,660,040) | | |
| | |
Short-Term Investments — 15.3% |
Investment Companies — 15.3% |
JPMorgan Prime Money Market Fund Class IM Shares, 5.44% (h) (i)
(Cost $100,751,153) | | |
Total Investments — 113.6%
(Cost $774,867,059) | | |
Liabilities in Excess of Other Assets — (13.6)% | | |
| | |
Percentages indicated are based on net assets. |
| |
| Alternative Credit Enhancement Securities |
| Chicago Mercantile Exchange |
| Credit Suisse Mortgage Trust |
| Federal Home Loan Mortgage Corp. |
| Federal National Mortgage Association |
| Government National Mortgage Association |
| Intercontinental Exchange |
| Inverse Floaters represent securities that pay interest at a rate that increases (decreases) with a decline (incline) in a specified index or have an interest rate that adjusts periodically based on changes in current interest rates and prepayments on the underlying pool of assets. The interest rate shown is the rate in effect as of February 29, 2024. The rate may be subject to a cap and floor. |
| Interest Only represents the right to receive the monthly interest payments on an underlying pool of mortgage loans. The principal amount shown represents the par value on the underlying pool. The yields on these securities are subject to accelerated principal paydowns as a result of prepayment or refinancing of the underlying pool of mortgage instruments. As a result, interest income may be reduced considerably. |
| Principal Only represents the right to receive the principal portion only on an underlying pool of mortgage loans. The market value of these securities is extremely volatile in response to changes in market interest rates. As prepayments on the underlying mortgages of these securities increase, the yield on these securities increases. |
| Real Estate Investment Trust |
| Real Estate Mortgage Investment Conduit |
| Secured Overnight Financing Rate |
| Compounding index of the Secured Overnight Financing Rate |
| Separate Trading of Registered Interest and Principal of Securities. The STRIPS Program lets investors hold and trade individual interest and principal components of eligible notes and bonds as separate securities. |
| To Be Announced; Security is subject to delayed delivery. |
| Uniform Mortgage-Backed Securities |
| |
| Amount rounds to less than 0.1% of net assets. |
| Value determined using significant unobservable inputs. | |
| Securities exempt from registration under Rule 144A or section 4(a)(2), of the Securities Act of 1933, as amended. | |
| Variable or floating rate security, linked to the referenced benchmark. The interest rate shown is the current rate as of February 29, 2024. | |
| Contingent Capital security (“CoCo”). CoCos are hybrid debt securities that may be convertible into equity or may be written down if a pre-specified trigger event occurs. The total value of aggregate CoCo holdings at February 29, 2024 is $3,523,433 or 0.53% of the Fund’s net assets as of February 29, 2024. | |
| Step bond. Interest rate is a fixed rate for an initial period that either resets at a specific date or may reset in the future contingent upon a predetermined trigger. The interest rate shown is the current rate as of February 29, 2024. | |
| All or a portion of the security is a when-issued security, delayed delivery security, or forward commitment. | |
| Variable or floating rate security, the interest rate of which adjusts periodically based on changes in current interest rates and prepayments on the underlying pool of assets. The interest rate shown is the current rate as of February 29, 2024. | |
| All or a portion of this security is deposited with the broker as initial margin for futures contracts or centrally cleared swaps. | |
SEE NOTES TO FINANCIAL STATEMENTS.
| J.P. Morgan Exchange-Traded Funds | |
JPMorgan Inflation Managed Bond ETF
SCHEDULE OF PORTFOLIO INVESTMENTSAS OF February 29, 2024 (continued)
| Investment in an affiliated fund, which is registered under the Investment Company Act of 1940, as amended, and is advised by J.P. Morgan Investment Management Inc. | |
| The rate shown is the current yield as of February 29, 2024. | |
Futures contracts outstanding as of February 29, 2024:
| | | | | VALUE AND
UNREALIZED
APPRECIATION
(DEPRECIATION) ($) |
| | | | | |
U.S. Treasury 10 Year Note | | | | | |
U.S. Treasury 10 Year Ultra Note | | | | | |
U.S. Treasury 5 Year Note | | | | | |
| | | | | |
| | | | | |
| | | | | |
| | | | | |
U.S. Treasury 2 Year Note | | | | | |
| | | | | |
| | | | | |
Centrally Cleared Inflation-linked swap contracts outstanding as of February 29, 2024 :
| | | | | UPFRONT
PAYMENTS
(RECEIPTS)
$ | UNREALIZED
APPRECIATION
(DEPRECIATION) ($) | |
| | | | | | | |
| | | | | | | |
| | | | | | | |
| | | | | | | |
| | | | | | | |
| | | | | | | |
| | | | | | | |
| | | | | | | |
| | | | | | | |
| | | | | | | |
| | | | | | | |
| | | | | | | |
| | | | | | | |
SEE NOTES TO FINANCIAL STATEMENTS.
| J.P. Morgan Exchange-Traded Funds | |
| | | | | UPFRONT PAYMENTS (RECEIPTS) $ | UNREALIZED APPRECIATION (DEPRECIATION) ($) | |
| | | | | | | |
| | | | | | | |
| | | | | | | |
| | | | | | | |
| | | | | | | |
| | | | | | | |
| | | | | | | |
| | | | | | | |
| | | | | | | |
| | | | | | | |
| | | | | | | |
| | | | | | | |
| | | | | | | |
| |
| Consumer Price Index for All Urban Consumers |
| |
(a) Value of floating rate index at February 29, 2024 was as follows: |
Centrally Cleared Credit default swap contracts outstanding - buy protection(*) as of February 29, 2024:
REFERENCE
OBLIGATION/INDEX | FINANCING
RATE PAID
BY THE FUND
(%) | | | | | UPFRONT
PAYMENTS
(RECEIPTS)
| UNREALIZED
APPRECIATION
(DEPRECIATION)
($) | |
| | | | | | | | |
| The Fund, as a buyer of credit protection, is generally obligated to make periodic payments and may also pay or receive an upfront premium to or from the protection seller, in exchange for the right to receive a contingent payment, upon occurrence of a credit event with respect to an underlying reference obligation, as defined under the terms of individual swap contracts. |
| Implied credit spreads are an indication of the seller's performance risk, related to the likelihood of a credit event occurring that would require a seller to make payment to a buyer. Implied credit spreads are used to determine the value of swap contracts and reflect the cost of buying/selling protection, which may include upfront payments made to enter into the contract. Therefore, higher spreads would indicate a greater likelihood that a seller will be obligated to perform (i.e. make payment) under the swap contract. Increasing values, in absolute terms and relative to notional amounts, are also indicative of greater performance risk. Implied credit spreads for credit default swaps on credit indices are linked to the weighted average spread across the underlying reference obligations included in a particular index. |
| The notional amount is the maximum amount that a seller of credit protection would be obligated to pay and a buyer of credit protection would receive, upon occurrence of a credit event. |
| Upfront payments and receipts generally represent premiums paid or received at the initiation of the agreement to compensate the differences between the stated terms of the swap agreement and current market conditions (credit spreads, interest rates and other relevant factors). |
| |
| Credit Default Swap Index |
| |
SEE NOTES TO FINANCIAL STATEMENTS.
| J.P. Morgan Exchange-Traded Funds | |
JPMorgan Realty Income ETF
SCHEDULE OF PORTFOLIO INVESTMENTSAS OF February 29, 2024
| | |
|
|
American Homes 4 Rent, Class A, REIT | | |
Apartment Income REIT Corp., REIT | | |
| | |
Sun Communities, Inc., REIT | | |
| | |
| | |
|
American Tower Corp., REIT | | |
Digital Realty Trust, Inc., REIT | | |
| | |
SBA Communications Corp., REIT | | |
| | |
| | |
|
CareTrust REIT, Inc., REIT | | |
Healthcare Realty Trust, Inc., REIT | | |
Sabra Health Care REIT, Inc., REIT | | |
| | |
| | |
| | |
|
DiamondRock Hospitality Co., REIT | | |
Host Hotels & Resorts, Inc., REIT | | |
| | |
|
Americold Realty Trust, Inc., REIT | | |
| | |
Rexford Industrial Realty, Inc., REIT | | |
| | |
|
Alexandria Real Estate Equities, Inc., REIT | | |
Boston Properties, Inc., REIT | | |
COPT Defense Properties, REIT | | |
| | |
Real Estate Management & Development — 0.6% |
Tricon Residential, Inc., REIT (Canada) | | |
| | |
|
|
| | |
|
Federal Realty Investment Trust, REIT | | |
| | |
| | |
|
| | |
Realty Income Corp., REIT | | |
| | |
|
Extra Space Storage, Inc., REIT | | |
| | |
| | |
Total Common Stocks
(Cost $293,520,133) | | |
Short-Term Investments — 3.3% |
Investment Companies — 3.3% |
JPMorgan Prime Money Market Fund Class IM Shares, 5.44% (a) (b)
(Cost $11,027,560) | | |
Total Investments — 100.4%
(Cost $304,547,693) | | |
Liabilities in Excess of Other Assets — (0.4)% | | |
| | |
Percentages indicated are based on net assets. |
| |
| Real Estate Investment Trust |
| Investment in an affiliated fund, which is registered under the Investment Company Act of 1940, as amended, and is advised by J.P. Morgan Investment Management Inc. |
| The rate shown is the current yield as of February 29, 2024. |
SEE NOTES TO FINANCIAL STATEMENTS.
STATEMENTS OF ASSETS AND LIABILITIESAS OF February 29, 2024
| JPMorgan
Inflation
Managed
Bond ETF | |
| | |
Investments in non-affiliates, at value | | |
Investments in affiliates, at value | | |
| | |
Deposits at broker for centrally cleared swaps | | |
| | |
| | |
Investment securities sold | | |
| | |
Interest from non-affiliates | | |
Dividends from non-affiliates | | |
Dividends from affiliates | | |
Variation margin on futures contracts | | |
Variation margin on centrally cleared swaps | | |
| | |
| | |
| | |
Investment securities purchased | | |
Investment securities purchased — delayed delivery securities | | |
| | |
| | |
| | |
Printing and mailing costs | | |
Custodian and accounting fees | | |
| | |
| | |
| | |
| | |
| | |
Total distributable earnings (loss) | | |
| | |
Outstanding number of shares
(unlimited number of shares authorized - par value $0.0001) | | |
Net asset value, per share | | |
Cost of investments in non-affiliates | | |
Cost of investments in affiliates | | |
Net upfront receipts on centrally cleared swaps | | |
SEE NOTES TO FINANCIAL STATEMENTS.
| J.P. Morgan Exchange-Traded Funds | |
STATEMENTS OF OPERATIONSFOR THE YEAR ENDED February 29, 2024
| JPMorgan
Inflation
Managed
Bond ETF | |
| | |
Interest income from non-affiliates | | |
Interest income from affiliates | | |
Dividend income from non-affiliates | | |
Dividend income from affiliates | | |
Income from securities lending (net) (See Note 2.D.) | | |
| | |
| | |
| | |
| | |
Custodian and accounting fees | | |
Interest expense to non-affiliates | | |
Interest expense to affiliates | | |
| | |
Trustees’ and Chief Compliance Officer’s fees | | |
Printing and mailing costs | | |
Registration and filing fees | | |
| | |
| | |
| | |
Less expense reimbursements | | |
| | |
Net investment income (loss) | | |
REALIZED/UNREALIZED GAINS (LOSSES): | | |
Net realized gain (loss) on transactions from: | | |
Investments in non-affiliates | | |
Investments in affiliates | | |
In-kind redemptions of investments in non-affiliates (See Note 4) | | |
| | |
| | |
| | |
Change in net unrealized appreciation/depreciation on: | | |
Investments in non-affiliates | | |
Investments in affiliates | | |
| | |
| | |
Change in net unrealized appreciation/depreciation | | |
Net realized/unrealized gains (losses) | | |
Change in net assets resulting from operations | | |
SEE NOTES TO FINANCIAL STATEMENTS.
| J.P. Morgan Exchange-Traded Funds | |
STATEMENTS OF CHANGES IN NET ASSETSFOR THE PERIODS INDICATED
| JPMorgan Inflation Managed Bond ETF | JPMorgan Realty Income ETF |
| Year Ended
February 29, 2024 | Year Ended
February 28, 2023 (a) | Year Ended
February 29, 2024 | |
CHANGE IN NET ASSETS RESULTING FROM OPERATIONS: | | | | |
Net investment income (loss) | | | | |
| | | | |
Change in net unrealized appreciation/depreciation | | | | |
Change in net assets resulting from operations | | | | |
DISTRIBUTIONS TO SHAREHOLDERS: | | | | |
Total distributions to shareholders | | | | |
| | | | |
Change in net assets resulting from capital transactions | | | | |
| | | | |
| | | | |
| | | | |
| | | | |
(a)
JPMorgan Inflation Managed Bond ETF acquired all of the assets and liabilities of the JPMorgan Inflation Managed Bond Fund ("Predecessor Fund") in a reorganization that occurred as of the close of business on April 8, 2022. Performance and financial history of the Predecessor Fund’s Class R6 Shares have been adopted by JPMorgan Inflation Managed Bond ETF and will be used going forward. As a result, the information prior to close of business on April 8, 2022, reflects that of the Predecessor Fund's Class R6 Shares. The Predecessor Fund ceased operations as of the date of the reorganization. See Note 1.
(b)
JPMorgan Realty Income ETF acquired all of the assets and liabilities of the JPMorgan Realty Income Fund ("Predecessor Fund") in a reorganization that occurred as of the close of business on May 20, 2022. Performance and financial history of the Predecessor Fund’s Class R6 Shares have been adopted by JPMorgan Realty Income ETF and will be used going forward. As a result, the information prior to close of business on May 20, 2022, reflects that of the Predecessor Fund's Class R6 Shares. The Predecessor Fund ceased operations as of the date of the reorganization. See Note 1.
SEE NOTES TO FINANCIAL STATEMENTS.
| J.P. Morgan Exchange-Traded Funds | |
STATEMENTS OF CHANGES IN NET ASSETSFOR THE PERIODS INDICATED (continued)
| JPMorgan Inflation Managed Bond ETF | JPMorgan Realty Income ETF |
| Year Ended February 29, 2024 | Year Ended February 28, 2023(a) | Year Ended February 29, 2024 | |
CAPITAL TRANSACTIONS: (c) (d) | | | | |
Proceeds from shares issued | | | | |
| | | | |
| | | | |
Redemptions in-kind (See Note 9) | | | | |
Change in net assets resulting from capital transactions | | | | |
| | | | |
Proceeds from shares issued | | | | |
| | | | |
| | | | |
Change in net assets resulting from Class A capital transactions | | | | |
| | | | |
Proceeds from shares issued | | | | |
| | | | |
| | | | |
Change in net assets resulting from Class C capital transactions | | | | |
| | | | |
Proceeds from shares issued | | | | |
| | | | |
| | | | |
Change in net assets resulting from Class I capital transactions | | | | |
| | | | |
Proceeds from shares issued | | | | |
| | | | |
| | | | |
Change in net assets resulting from Class L capital transactions | | | | |
(a)
JPMorgan Inflation Managed Bond ETF acquired all of the assets and liabilities of the JPMorgan Inflation Managed Bond Fund ("Predecessor Fund") in a reorganization that occurred as of the close of business on April 8, 2022. Performance and financial history of the Predecessor Fund’s Class R6 Shares have been adopted by JPMorgan Inflation Managed Bond ETF and will be used going forward. As a result, the information prior to close of business on April 8, 2022, reflects that of the Predecessor Fund's Class R6 Shares. The Predecessor Fund ceased operations as of the date of the reorganization. See Note 1.
(b)
JPMorgan Realty Income ETF acquired all of the assets and liabilities of the JPMorgan Realty Income Fund ("Predecessor Fund") in a reorganization that occurred as of the close of business on May 20, 2022. Performance and financial history of the Predecessor Fund’s Class R6 Shares have been adopted by JPMorgan Realty Income ETF and will be used going forward. As a result, the information prior to close of business on May 20, 2022, reflects that of the Predecessor Fund's Class R6 Shares. The Predecessor Fund ceased operations as of the date of the reorganization. See Note 1.
(c)
Reflects reorganization from JPMorgan Inflation Managed Bond Fund on April 8, 2022. See Note 1.
(d)
Reflects reorganization from JPMorgan Realty Income Fund on May 20, 2022. See Note 1.
SEE NOTES TO FINANCIAL STATEMENTS.
| J.P. Morgan Exchange-Traded Funds | |
| JPMorgan Inflation Managed Bond ETF | JPMorgan Realty Income ETF |
| Year Ended February 29, 2024 | Year Ended February 28, 2023(a) | Year Ended February 29, 2024 | |
CAPITAL TRANSACTIONS: (c) (d) (continued) | | | | |
| | | | |
Proceeds from shares issued | | | | |
| | | | |
| | | | |
Change in net assets resulting from Class R5 capital transactions | | | | |
Total change in net assets resulting from capital transactions | | | | |
(a)
JPMorgan Inflation Managed Bond ETF acquired all of the assets and liabilities of the JPMorgan Inflation Managed Bond Fund ("Predecessor Fund") in a reorganization that occurred as of the close of business on April 8, 2022. Performance and financial history of the Predecessor Fund’s Class R6 Shares have been adopted by JPMorgan Inflation Managed Bond ETF and will be used going forward. As a result, the information prior to close of business on April 8, 2022, reflects that of the Predecessor Fund's Class R6 Shares. The Predecessor Fund ceased operations as of the date of the reorganization. See Note 1.
(b)
JPMorgan Realty Income ETF acquired all of the assets and liabilities of the JPMorgan Realty Income Fund ("Predecessor Fund") in a reorganization that occurred as of the close of business on May 20, 2022. Performance and financial history of the Predecessor Fund’s Class R6 Shares have been adopted by JPMorgan Realty Income ETF and will be used going forward. As a result, the information prior to close of business on May 20, 2022, reflects that of the Predecessor Fund's Class R6 Shares. The Predecessor Fund ceased operations as of the date of the reorganization. See Note 1.
(c)
Reflects reorganization from JPMorgan Inflation Managed Bond Fund on April 8, 2022. See Note 1.
(d)
Reflects reorganization from JPMorgan Realty Income Fund on May 20, 2022. See Note 1.
SEE NOTES TO FINANCIAL STATEMENTS.
| J.P. Morgan Exchange-Traded Funds | |
STATEMENTS OF CHANGES IN NET ASSETSFOR THE PERIODS INDICATED (continued)
| JPMorgan Inflation Managed Bond ETF | JPMorgan Realty Income ETF |
| Year Ended February 29, 2024 | Year Ended February 28, 2023(a) | Year Ended February 29, 2024 | |
SHARE TRANSACTIONS: (c) (d) | | | | |
| | | | |
| | | | |
| | | | |
Redemptions in-kind (See Note 9) | | | | |
| | | | |
| | | | |
| | | | |
| | | | |
| | | | |
| | | | |
| | | | |
| | | | |
| | | | |
| | | | |
| | | | |
| | | | |
| | | | |
| | | | |
| | | | |
| | | | |
| | | | |
| | | | |
| | | | |
| | | | |
| | | | |
(a)
JPMorgan Inflation Managed Bond ETF acquired all of the assets and liabilities of the JPMorgan Inflation Managed Bond Fund ("Predecessor Fund") in a reorganization that occurred as of the close of business on April 8, 2022. Performance and financial history of the Predecessor Fund’s Class R6 Shares have been adopted by JPMorgan Inflation Managed Bond ETF and will be used going forward. As a result, the information prior to close of business on April 8, 2022, reflects that of the Predecessor Fund's Class R6 Shares. The Predecessor Fund ceased operations as of the date of the reorganization. See Note 1.
(b)
JPMorgan Realty Income ETF acquired all of the assets and liabilities of the JPMorgan Realty Income Fund ("Predecessor Fund") in a reorganization that occurred as of the close of business on May 20, 2022. Performance and financial history of the Predecessor Fund’s Class R6 Shares have been adopted by JPMorgan Realty Income ETF and will be used going forward. As a result, the information prior to close of business on May 20, 2022, reflects that of the Predecessor Fund's Class R6 Shares. The Predecessor Fund ceased operations as of the date of the reorganization. See Note 1.
(c)
Reflects reorganization from JPMorgan Inflation Managed Bond Fund on April 8, 2022. See Note 1.
(d)
Reflects reorganization from JPMorgan Realty Income Fund on May 20, 2022. See Note 1.
SEE NOTES TO FINANCIAL STATEMENTS.
| J.P. Morgan Exchange-Traded Funds | |
| JPMorgan Inflation Managed Bond ETF | JPMorgan Realty Income ETF |
| Year Ended February 29, 2024 | Year Ended February 28, 2023(a) | Year Ended February 29, 2024 | |
SHARE TRANSACTIONS: (c) (d) (continued) | | | | |
| | | | |
| | | | |
| | | | |
| | | | |
Change in Class R5 Shares | | | | |
(a)
JPMorgan Inflation Managed Bond ETF acquired all of the assets and liabilities of the JPMorgan Inflation Managed Bond Fund ("Predecessor Fund") in a reorganization that occurred as of the close of business on April 8, 2022. Performance and financial history of the Predecessor Fund’s Class R6 Shares have been adopted by JPMorgan Inflation Managed Bond ETF and will be used going forward. As a result, the information prior to close of business on April 8, 2022, reflects that of the Predecessor Fund's Class R6 Shares. The Predecessor Fund ceased operations as of the date of the reorganization. See Note 1.
(b)
JPMorgan Realty Income ETF acquired all of the assets and liabilities of the JPMorgan Realty Income Fund ("Predecessor Fund") in a reorganization that occurred as of the close of business on May 20, 2022. Performance and financial history of the Predecessor Fund’s Class R6 Shares have been adopted by JPMorgan Realty Income ETF and will be used going forward. As a result, the information prior to close of business on May 20, 2022, reflects that of the Predecessor Fund's Class R6 Shares. The Predecessor Fund ceased operations as of the date of the reorganization. See Note 1.
(c)
Reflects reorganization from JPMorgan Inflation Managed Bond Fund on April 8, 2022. See Note 1.
(d)
Reflects reorganization from JPMorgan Realty Income Fund on May 20, 2022. See Note 1.
SEE NOTES TO FINANCIAL STATEMENTS.
| J.P. Morgan Exchange-Traded Funds | |
FINANCIAL HIGHLIGHTSFOR THE PERIODS INDICATED
| Per share operating performance (a) |
| | | |
| Net asset
value,
beginning
of period | Net investment
income
(loss) (b) | Net realized
and unrealized
gains
(losses)
on investments | Total from
investment
operations | | | | Net asset
value,
end of
period |
JPMorgan Inflation Managed Bond ETF(f) | | | | | | | | |
Year Ended February 29, 2024 | | | | | | | | |
Year Ended February 28, 2023 | | | | | | | | |
Year Ended February 28, 2022 | | | | | | | | |
Year Ended February 28, 2021 | | | | | | | | |
Year Ended February 29, 2020 | | | | | | | | |
JPMorgan Realty Income ETF(g) | | | | | | | | |
Year Ended February 29, 2024 | | | | | | | | |
Year Ended February 28, 2023 | | | | | | | | |
Year Ended February 28, 2022 | | | | | | | | |
Year Ended February 28, 2021 | | | | | | | | |
Year Ended February 29, 2020 | | | | | | | | |
|
| Per Share amounts reflect the conversion of the JPMorgan Inflation Managed Bond Fund into the JPMorgan Inflation Managed Bond ETF as of the close of business on April 8, 2022 and the conversion of the JPMorgan Realty Income Fund into the JPMorgan Realty Income ETF as of the close of business on May 20, 2022. See Note 1. |
| Calculated based upon average shares outstanding. |
| Includes adjustments in accordance with accounting principles generally accepted in the United States of America and as such, the net asset values for financial reporting purposes and the returns based upon those net asset values may differ from the net asset values and returns for shareholder transactions. |
| JPMorgan Inflation Managed Bond ETF acquired all of the assets and liabilities of the JPMorgan Inflation Managed Bond Fund (“Predecessor Fund”) in a reorganization that occurred as of the close of business on April 8, 2022. Market price returns are calculated using the official closing price of the JPMorgan Inflation Managed Bond ETF on the listing exchange as of the time that the JPMorgan Inflation Managed Bond ETF's NAV is calculated. Prior to the JPMorgan Inflation Managed Bond ETF's listing on April, 11, 2022, the NAV performance of the Class R6 Shares of the Predecessor Fund are used as proxy market price returns. |
| JPMorgan Realty Income ETF acquired all of the assets and liabilities of the JPMorgan Realty Income Fund (“Predecessor Fund”) in a reorganization that occurred as of the close of business on May 20, 2022. Market price returns are calculated using the official closing price of the JPMorgan Realty Income ETF on the listing exchange as of the time that the JPMorgan Realty Income ETF's NAV is calculated. Prior to the JPMorgan Realty Income ETF's listing on May 23, 2022, the NAV performance of the Class R6 Shares of the Predecessor Fund are used as proxy market price returns. |
| JPMorgan Inflation Managed Bond ETF (the “Fund”) acquired all of the assets and liabilities of the JPMorgan Inflation Managed Bond Fund (“Predecessor Fund”) in a reorganization that occurred as of the close of business on April 8, 2022. Performance and financial history of the Predecessor Fund’s Class R6 Shares have been adopted by the Fund and will be used going forward. As a result, the financial highlight information reflects that of the Predecessor Fund’s Class R6 Shares for the period March 1, 2017 up through the reorganization. |
| JPMorgan Realty Income ETF (the “Fund”) acquired all of the assets and liabilities of the JPMorgan Realty Income Fund (“Predecessor Fund”) in a reorganization that occurred as of the close of business on May 20, 2022. Performance and financial history of the Predecessor Fund’s Class R6 Shares have been adopted by the Fund and will be used going forward. As a result, the financial highlight information reflects that of the Predecessor Fund’s Class R6 Shares for the period September 1, 2017 up through the reorganization. |
| Reflects special dividends paid out during the period by several of the Fund’s holdings. Had the Fund not received the special dividends, the net investment income (loss) per share would have been $0.81 and the net investment income (loss) ratio would have been 1.59%, |
SEE NOTES TO FINANCIAL STATEMENTS.
| J.P. Morgan Exchange-Traded Funds | |
| |
| | | | Ratios to average net assets | |
| | Market
price
total
return (d)(e) | | | Net
investment
income
(loss) | Expenses
without waivers
and reimbursements | |
| | | | | | | |
| | | | | | | |
| | | | | | | |
| | | | | | | |
| | | | | | | |
| | | | | | | |
| | | | | | | |
| | | | | | | |
| | | | | | | |
| | | | | | | |
| | | | | | | |
| | | | | | | |
SEE NOTES TO FINANCIAL STATEMENTS.
| J.P. Morgan Exchange-Traded Funds | |
NOTES TO FINANCIAL STATEMENTSAS OF February 29, 2024
1. Organization
J.P. Morgan Exchange-Traded Fund Trust (the “Trust”) was formed on February 25, 2010, and is governed by a Declaration of Trust as amended and restated February 19, 2014, and is registered under the Investment Company Act of 1940, as amended (the “1940 Act”), as an open-end management investment company.
The following are 2 separate funds of the Trust (each, a "Fund" and collectively, the "Funds") covered by this report:
| Diversification Classification |
JPMorgan Inflation Managed Bond ETF | |
JPMorgan Realty Income ETF | |
Pursuant to an Agreement and Plan of Reorganization and Liquidation previously approved by the Board of Trustees (the “Board”) of the applicable mutual fund trust, the following mutual funds (each, an “Acquired Fund” and collectively the “Acquired Funds”) were each reorganized into a newly created exchange-traded fund (each, a “Reorganization”) as of the close of business on the dates noted below (each, a “Closing Date”):
| | |
JPMorgan Inflation Managed Bond Fund | JPMorgan Inflation Managed Bond ETF | |
JPMorgan Realty Income Fund | JPMorgan Realty Income ETF | |
Following its Reorganization, each Acquired Fund’s performance (Class R6 Shares) and financial history were adopted by the new Fund. In connection with each Reorganization, each shareholder of an Acquired Fund (except as noted below) received shares of the surviving Fund equal in value to the number of shares of the Acquired Fund they owned on the Closing Date, including a cash payment in lieu of fractional shares of the Fund, which cash payment might have been taxable. Shareholders of an Acquired Fund who did not hold their shares through a brokerage account that could accept shares of the Fund on the Closing Date had their Acquired Funds shares liquidated, and such shareholders received cash equal in value to their Acquired Funds shares, which cash payment might have been taxable. Shareholders of an Acquired Fund who held their shares through a fund direct individual retirement account and did not take action prior to the applicable Reorganization had their Acquired Fund shares exchanged for Morgan Shares of the JPMorgan U.S. Government Money Market Fund equal in value to their Acquired Fund shares. Each Fund has the same investment adviser, investment objective and fundamental investment policies and substantially similar investment strategies as its Acquired Fund. Effective as of the close of business on its Closing Date, each Acquired Fund ceased operations in connection with the consummation of its Reorganization.
J.P. Morgan Investment Management Inc. (“JPMIM”), an indirect, wholly-owned subsidiary of JPMorgan Chase & Co. (“JPMorgan”), acts as adviser (the “Adviser”) and administrator (the “Administrator”) to the Funds.
Costs incurred by the Funds and the Acquired Funds associated with each Reorganization (including the legal costs associated with each Reorganization) were borne by the Adviser by waiving fees or reimbursing expenses to offset the costs incurred by each Fund or Acquired Fund associated with each Reorganization, including any brokerage fees and expenses incurred by the Fund or Acquired Fund related to the disposition and acquisition of assets as part of each Reorganization. Brokerage fees and expenses related to the disposition and acquisition of assets (including any disposition to raise cash to pay redemption proceeds) that were incurred in the ordinary course of business were borne by the Funds and the Acquired Funds. The management fee of each Fund is the same as the management fee of the corresponding Acquired Fund. The total annual fund operating expenses of each Fund is expected to be lower than the net expenses of each share class of the Acquired Fund after taking into consideration the expense limitation agreement the Adviser has entered into with the Funds for a term ending July 31, 2026. Each Reorganization did not result in the material change to the Acquired Funds' portfolio holdings. There are no material differences in accounting policies of the Acquired Funds as compared to those of the Funds. Each Fund did not purchase or sell securities following its Reorganization for purposes of realigning its investment portfolio. Accordingly, each Reorganization of an Acquired Fund did not affect the corresponding Fund’s portfolio turnover ratios for the year ended February 29, 2024.
The investment objective of JPMorgan Inflation Managed Bond ETF ("Inflation Managed Bond ETF") is to seek to maximize inflation protected total return.
The investment objective of JPMorgan Realty Income ETF ("Realty Income ETF") is to seek to provide high total investment return through a combination of capital appreciation and current income.
Shares of each Fund are listed and traded at market price on an exchange as follows:
| |
Inflation Managed Bond ETF | |
| |
Market prices for the Funds’ shares may be different from their net asset value (“NAV”).
| J.P. Morgan Exchange-Traded Funds | |
The Funds issue and redeem their shares on a continuous basis, through JPMorgan Distribution Services, Inc. (the “Distributor” or “JPMDS”), an indirect, wholly-owned subsidiary of JPMorgan, at NAV in large blocks of shares, referred to as “Creation Units”. Creation Units are issued and redeemed in exchange for a basket of securities and/or cash. Shares are generally traded in the secondary market in amounts less than a Creation Unit at market prices that change throughout the day. Only individuals or institutions that have entered into an authorized participant agreement with the Distributor may do business directly with the Funds (each, an “Authorized Participant”).
2. Significant Accounting Policies
The following is a summary of significant accounting policies followed by the Funds in the preparation of their financial statements. The Funds are investment companies and, accordingly, follow the investment company accounting and reporting guidance of the Financial Accounting Standards Board (“FASB”) Accounting Standards Codification Topic 946 — Investment Companies, which is part of U.S. generally accepted accounting principles (“GAAP”). The preparation of financial statements in conformity with GAAP requires management to make estimates and assumptions that affect (i) the reported amounts of assets and liabilities, (ii) disclosure of contingent assets and liabilities at the date of the financial statements, and (iii) the reported amounts of increases and decreases in net assets from operations during the reporting period. Actual results could differ from those estimates.
A. Valuation of Investments— Investments are valued in accordance with GAAP and the Funds' valuation policies set forth by, and under the supervision and responsibility of, the Board, which established the following approach to valuation, as described more fully below: (i) investments for which market quotations are readily available shall be valued at their market value and (ii) all other investments for which market quotations are not readily available shall be valued at their fair value as determined in good faith by the Board.
Under Section 2(a)(41) of the 1940 Act, the Board is required to determine fair value for securities that do not have readily available market quotations. Under SEC Rule 2a-5 (Good Faith Determinations of Fair Value), the Board may designate the performance of these fair valuation determinations to a valuation designee. The Board has designated the Adviser as the “Valuation Designee” to perform fair valuation determinations for the Funds on behalf of the Board subject to appropriate oversight by the Board. The Adviser, as Valuation Designee, leverages the J.P. Morgan Asset Management Americas Valuation Committee (“AVC”) to help oversee and carry out the policies for the valuation of investments held in the Funds. The Adviser, as Valuation Designee, remains responsible for the valuation determinations.
This oversight by the AVC includes monitoring the appropriateness of fair values based on results of ongoing valuation oversight including, but not limited to, consideration of macro or security specific events, market events, and pricing vendor and broker due diligence. The Administrator is responsible for discussing and assessing the potential impacts to the fair values on an ongoing basis, and, at least on a quarterly basis, with the AVC and the Board.
A market-based approach is primarily used to value the Funds' investments. Investments for which market quotations are not readily available are fair valued using prices supplied by approved affiliated and/or unaffiliated pricing vendors or third party broker-dealers (collectively referred to as “Pricing Services”) or may be internally fair valued using methods set forth by the valuation policies approved by the Boards. This may include the use of related or comparable assets or liabilities, recent transactions, market multiples, book values and other relevant information for the investment. An income-based valuation approach may be used in which the anticipated future cash flows of the investment are discounted to calculate the fair value. Discounts may also be applied due to the nature or duration of any restrictions on the disposition of the investments. Valuations may be based upon current market prices of securities that are comparable in coupon, rating, maturity and industry. It is possible that the estimated values may differ significantly from the values that would have been used had a ready market for the investments existed, and such differences could be material.
Fixed income instruments are valued based on prices received from Pricing Services. The Pricing Services use multiple valuation techniques to determine the valuation of fixed income instruments. In instances where sufficient market activity exists, the Pricing Services may utilize a market-based approach through which trades or quotes from market makers are used to determine the valuation of these instruments. In instances where sufficient market activity may not exist, the Pricing Services also utilize proprietary valuation models which may consider market transactions in comparable securities and the various relationships between securities in determining fair value and/or market characteristics in order to estimate the relevant cash flows, which are then discounted to calculate the fair values.
Equities and other exchange-traded instruments are valued at the last sale price or official market closing price on the primary exchange on which the instrument is traded before the NAV of the Funds are calculated on a valuation date.
Investments in open-end investment companies (“Underlying Funds”) are valued at each Underlying Fund’s NAV per share as of the report date.
Futures contracts are generally valued on the basis of available market quotations. Swaps are valued utilizing market quotations from approved Pricing Services.
Valuations reflected in this report are as of the report date. As a result, changes in valuation due to market events and/or issuer-related events after the report date and prior to issuance of the report are not reflected herein.
The various inputs that are used in determining the valuation of the Funds' investments are summarized into the three broad levels listed below.
•
Level 1 — Unadjusted inputs using quoted prices in active markets for identical investments.
| J.P. Morgan Exchange-Traded Funds | |
NOTES TO FINANCIAL STATEMENTSAS OF February 29, 2024 (continued)
•
Level 2 — Other significant observable inputs including, but not limited to, quoted prices for similar investments, inputs other than quoted prices that are observable for investments (such as interest rates, prepayment speeds, credit risk, etc.) or other market corroborated inputs.
•
Level 3 — Significant inputs based on the best information available in the circumstances, to the extent observable inputs are not available (including the Funds' assumptions in determining the fair value of investments).
A financial instrument’s level within the fair value hierarchy is based on the lowest level of any input, both individually and in the aggregate, that is significant to the fair value measurement. The inputs or methodology used for valuing instruments are not necessarily an indication of the risk associated with investing in those instruments.
The following tables represent each valuation input as presented on the Schedules of Portfolio Investments ("SOIs"):
Inflation Managed Bond ETF | | | | |
| | Level 2
Other significant
observable inputs | Level 3
Significant
unobservable inputs | |
Investments in Securities | | | | |
| | | | |
Collateralized Mortgage Obligations | | | | |
Commercial Mortgage-Backed Securities | | | | |
| | | | |
Foreign Government Securities | | | | |
Mortgage-Backed Securities | | | | |
U.S. Treasury Obligations | | | | |
| | | | |
| | | | |
Total Investments in Securities | | | | |
Appreciation in Other Financial Instruments | | | | |
| | | | |
| | | | |
Depreciation in Other Financial Instruments | | | | |
| | | | |
| | | | |
Total Net Appreciation/ Depreciation in Other
Financial Instruments | | | | |
| | | | |
| | Level 2
Other significant
observable inputs | Level 3
Significant
unobservable inputs | |
Total Investments in Securities (a) | | | | |
|
| Please refer to the SOI for specifics of portfolio holdings. |
B. Restricted Securities— Certain securities held by the Funds may be subject to legal or contractual restrictions on resale. Restricted securities generally are resold in transactions exempt from registration under the Securities Act of 1933, as amended (the “Securities Act”). Disposal of these securities may involve time-consuming negotiations and expense. Prompt sale at the current valuation may be difficult and could adversely affect the NAVs of the Funds.
As of February 29, 2024, the Funds had no investments in restricted securities other than securities sold to the Funds under Rule 144A and/or Regulation S under the Securities Act.
| J.P. Morgan Exchange-Traded Funds | |
C. When-Issued Securities, Delayed Delivery Securities and Forward Commitments— Inflation Managed Bond ETF purchased when-issued securities, including To-Be-Announced (“TBA”) securities, and entered into contracts to purchase or sell securities for a fixed price that may be settled a month or more after the trade date, or purchased delayed delivery securities which generally settle seven days after the trade date. When-issued securities are securities that have been authorized, but not issued in the market. A forward commitment involves entering into a contract to purchase or sell securities for a fixed price at a future date that may be settled a month or more after the trade date. A delayed delivery security is agreed upon in advance between the buyer and the seller of the security and is generally delivered beyond seven days of the agreed upon date. The purchase of securities on a when-issued, delayed delivery or forward commitment basis involves the risk that the value of the security to be purchased declines before the settlement date. The sale of securities on a forward commitment basis involves the risk that the value of the securities sold may increase before the settlement date. The Funds may be exposed to credit risk if the counterparty fails to perform under the terms of the transaction. Interest income for securities purchased on a when-issued, delayed delivery or forward commitment basis is not accrued until the settlement date.
Inflation Managed Bond ETF had when-issued securities, delayed delivery securities or forward commitments outstanding as of February 29, 2024, which are shown as a Receivable for Investment securities sold — delayed delivery securities and/or a Payable for Investment securities purchased — delayed delivery securities, respectively, on the Statement of Assets and Liabilities. The values of these securities held at February 29, 2024 are detailed on the SOI, if any.
D. Securities Lending — The Funds are authorized to engage in securities lending in order to generate additional income. The Funds are able to lend to approved borrowers. Citibank N.A. (“Citibank”) serves as lending agent for the Funds, pursuant to a Securities Lending Agency Agreement (the “Securities Lending Agency Agreement”). Securities loaned are collateralized by cash equal to at least 100% of the market value plus accrued interest on the securities lent, which is invested in Class IM Shares of the JPMorgan U.S. Government Money Market Fund and the Agency SL Class Shares of the JPMorgan Securities Lending Money Market Fund. The Funds retain the interest earned on cash collateral investments but are required to pay the borrower a rebate for the use of the cash collateral. In cases where the lent security is of high value to borrowers, there may be a negative rebate (i.e., a net payment from the borrower to the Funds). Upon termination of a loan, the Funds are required to return to the borrower an amount equal to the cash collateral, plus any rebate owed to the borrowers. The remaining maturities of the securities lending transactions are considered overnight and continuous. Loans are subject to termination by the Funds or the borrower at any time.
The net income earned on the securities lending (after payment of rebates and Citibank’s fee) is included on the Statements of Operations as Income from securities lending (net). The Funds also receive payments from the borrower during the period of the loan, equivalent to dividends and interest earned on the securities loaned, which are recorded as Dividend or Interest income, respectively, on the Statements of Operations.
Under the Securities Lending Agency Agreement, Citibank marks to market the loaned securities on a daily basis. In the event the cash received from the borrower is less than 102% of the value of the loaned securities (105% for loans of non-U.S. securities), Citibank requests additional cash from the borrower so as to maintain a collateralization level of at least 102% of the value of the loaned securities plus accrued interest (105% for loans of non-U.S. securities), subject to certain de minimis amounts.
The value of securities out on loan is recorded as an asset on the Statements of Assets and Liabilities. The value of the cash collateral received is recorded as a liability on the Statements of Assets and Liabilities and details of collateral investments are disclosed on the SOIs.
The Funds bear the risk of loss associated with the collateral investments and are not entitled to additional collateral from the borrower to cover any such losses. To the extent that the value of the collateral investments declines below the amount owed to a borrower, the Funds may incur losses that exceed the amount they earned on lending the security. Upon termination of a loan, the Funds may use leverage (borrow money) to repay the borrower for cash collateral posted if the Adviser does not believe that it is prudent to sell the collateral investments to fund the payment of this liability. Securities lending activity is subject to master netting arrangements.
Securities lending also involves counterparty risks, including the risk that the loaned securities may not be returned in a timely manner or at all. Subject to certain conditions, Citibank has agreed to indemnify the Funds from losses resulting from a borrower’s failure to return a loaned security.
JPMIM voluntarily waived management fees charged to the Funds to reduce the impact of the cash collateral investment in the JPMorgan U.S. Government Money Market Fund from 0.13% to 0.06%. For the year ended February 29, 2024, JPMIM waived fees associated with the Funds' investment in the JPMorgan U.S. Government Money Market Fund as follows:
The above waiver is included in the determination of earnings on cash collateral investment and in the calculation of Citibank’s compensation and is included on the Statements of Operations as Income from securities lending (net).
Inflation Managed Bond ETF did not lend out any securities during the year ended February 29, 2024. Realty Income ETF did not have any securities
out on loan at February 29, 2024.
| J.P. Morgan Exchange-Traded Funds | |
NOTES TO FINANCIAL STATEMENTSAS OF February 29, 2024 (continued)
E. Investment Transactions with Affiliates— The Funds invested in Underlying Funds advised by the Adviser. An issuer which is under common control with a Fund may be considered an affiliate. For the purposes of the financial statements, the Funds assume the issuers listed in the tables below to be affiliated issuers. The Underlying Funds’ distributions may be reinvested into such Underlying Funds. Reinvestment amounts are included in the purchases at cost amounts in the tables below.
Inflation Managed Bond ETF |
For the year ended February 29, 2024 |
| | | | | Change in
Unrealized
Appreciation/
(Depreciation) | | Shares at
February 29,
2024 | | Capital Gain
Distributions |
JPMorgan Prime Money Market Fund Class IM Shares, 5.44% (a) (b) | | | | | | | | | |
|
| Investment in an affiliated fund, which is registered under the Investment Company Act of 1940, as amended, and is advised by J.P. Morgan Investment Management Inc. |
| The rate shown is the current yield as of February 29, 2024. |
|
For the year ended February 29, 2024 |
| | | | | Change in
Unrealized
Appreciation/
(Depreciation) | | Shares at
February 29,
2024 | | Capital Gain
Distributions |
JPMorgan Prime Money Market Fund Class IM Shares, 5.44% (a) (b) | | | | | | | | | |
JPMorgan Securities Lending Money Market Fund Agency SL Class Shares, 5.48% (a) (b) | | | | | | | | | |
JPMorgan U.S. Government Money Market Fund Class IM Shares, 5.25% (a) (b) | | | | | | | | | |
| | | | | | | | | |
|
| Investment in an affiliated fund, which is registered under the Investment Company Act of 1940, as amended, and is advised by J.P. Morgan Investment Management Inc. |
| The rate shown is the current yield as of February 29, 2024. |
| Amount is included on the Statements of Operations as Income from securities lending (net) (after payments of rebates and Citibank’s fee). |
F. Derivatives—Inflation Managed Bond ETF used derivative instruments including futures contracts and swaps, in connection with its investment strategy. Derivative instruments may be used as substitutes for securities in which the Funds can invest, to hedge portfolio investments or to generate income or gain to the Funds. Derivatives may also be used to manage duration, sector and yield curve exposures and credit and spread volatility.
The Funds may be subject to various risks from the use of derivatives, including the risk that changes in the value of a derivative may not correlate perfectly with the underlying asset, rate or index; counterparty credit risk related to derivatives counterparties’ failure to perform under contract terms; liquidity risk related to the potential lack of a liquid market for these contracts allowing the Funds to close out their position(s); and documentation risk relating to disagreement over contract terms. Investing in certain derivatives also results in a form of leverage and as such, the Funds' risk of loss associated with these instruments may exceed their value, as recorded on the Statements of Assets and Liabilities.
The Funds are party to various derivative contracts governed by International Swaps and Derivatives Association master agreements (“ISDA agreements”). The Funds' ISDA agreements, which are separately negotiated with each dealer counterparty, may contain provisions allowing, absent other considerations, a counterparty to exercise rights, to the extent not otherwise waived, against the Funds in the event the Funds' net assets decline over time by a pre-determined percentage or fall below a pre-determined floor. The ISDA agreements may also contain provisions allowing, absent other conditions, the Funds to exercise rights, to the extent not otherwise waived, against a counterparty (e.g., decline in a counterparty’s credit rating below a specified level). Such rights for both a counterparty and the Funds often include the ability to terminate (i.e., close out) open
| J.P. Morgan Exchange-Traded Funds | |
contracts at prices which may favor a counterparty, which could have an adverse effect on the Funds. The ISDA agreements give the Funds and a counterparty the right, upon an event of default, to close out all transactions traded under such agreements and to net amounts owed or due across all transactions and offset such net payable or receivable against collateral posted to a segregated account by one party for the benefit of the other.
Counterparty credit risk may be mitigated to the extent a counterparty posts additional collateral for mark-to-market gains to the Funds.
Notes F(1) — F(3) below describe the various derivatives used by the Funds.
(1) Futures Contracts— Inflation Managed Bond ETF used treasury futures contracts to manage and hedge interest rate risk associated with portfolio investments. The Fund also purchased futures contracts to invest incoming cash in the market or sold futures in response to cash outflows, thereby simulating an invested position in the underlying index while maintaining a cash balance for liquidity.
Futures contracts provide for the delayed delivery of the underlying instrument at a fixed price or are settled for a cash amount based on the change in the value of the underlying instrument at a specific date in the future. Upon entering into a futures contract, the Fund is required to deposit with the broker, cash or securities in an amount equal to a certain percentage of the contract amount, which is referred to as the initial margin deposit. Subsequent payments, referred to as variation margin, are made or received by the Fund periodically and are based on changes in the market value of open futures contracts. Changes in the market value of open futures contracts are recorded as Change in net unrealized appreciation/depreciation on futures contracts on the Statements of Operations. Realized gains or losses, representing the difference between the value of the contract at the time it was opened and the value at the time it was closed, are reported on the Statements of Operations at the closing or expiration of the futures contract. Securities deposited as initial margin are designated on the SOI, while cash deposited, which is considered restricted, is recorded on the Statements of Assets and Liabilities. A receivable from and/or a payable to brokers for the daily variation margin is also recorded on the Statements of Assets and Liabilities.
The use of futures contracts exposes the Fund to interest rate risk. The Fund may be subject to the risk that the change in the value of the futures contract may not correlate perfectly with the underlying instrument. Use of long futures contracts subjects the Fund to risk of loss in excess of the amounts shown on the Statements of Assets and Liabilities, up to the notional amount of the futures contracts. Use of short futures contracts subjects the Fund to unlimited risk of loss. The Fund may enter into futures contracts only on exchanges or boards of trade. The exchange or board of trade acts as the counterparty to each futures transaction; therefore, the Fund's credit risk is limited to failure of the exchange or board of trade. Under some circumstances, futures exchanges may establish daily limits on the amount that the price of a futures contract can vary from the previous day’s settlement price, which could effectively prevent liquidation of positions.
The Fund's futures contracts are not subject to master netting arrangements (the right to close out all transactions traded with a counterparty and net amounts owed or due across transactions).
(2) Swaps— Inflation Managed Bond ETF engaged in various swap transactions, including total return basket swaps, to manage total return risks within its portfolio. The Fund also used swaps as alternatives to direct investments. Swap transactions are contracts negotiated over-the-counter (“OTC swaps”) between a fund and a counterparty or are centrally cleared (“centrally cleared swaps”) through a central clearinghouse managed by a Futures Commission Merchant (“FCM”) that exchange investment cash flows, assets, foreign currencies or market-linked returns at specified, future intervals.
Upfront payments made and/or received by the Fund are recorded as assets or liabilities, respectively, on the Statements of Assets and Liabilities and amortized over the term of the swap. The value of an OTC swap agreement is recorded as either an asset or a liability on the Statements of Assets and Liabilities at the beginning of the measurement period. Upon entering into a centrally cleared swap, the Fund is required to deposit with the FCM cash or securities, which is referred to as initial margin deposit. Securities deposited as initial margin are designated on the Schedule of Portfolio Investments, while cash deposited, which is considered restricted, is reported as Deposits at broker for centrally cleared swaps on the Statements of Assets and Liabilities. Daily changes in valuation of centrally cleared swaps, if any, are recorded as a variation margin receivable or payable on the Statements of Assets and Liabilities. The change in the value of swaps, including accruals of periodic amounts of interest to be paid or received on swaps, is reported as Change in net unrealized appreciation/depreciation on swaps on the Statements of Operations. A realized gain or loss is recorded upon payment or receipt of a periodic payment or payment made upon termination of a swap agreement.
The Fund may be required to post or receive collateral based on the net value of the Fund’s outstanding OTC swap contracts with the counterparty in the form of cash or securities. Daily movement of cash collateral is subject to minimum threshold amounts. Collateral posted by the Fund is held in a segregated account at the Fund’s custodian bank. For certain counterparties, cash collateral posted by the Fund is invested in an affiliated money market fund and/or held as restricted cash. Collateral received by the Fund is held in a separate segregated account maintained by JPMorgan Chase Bank, N.A, an affiliate of the Fund.
The Fund may be subject to various risks from the use of swaps including: (i) the risk that changes in the value of the swap may not correlate perfectly with the underlying instrument; (ii) counterparty credit risk related to the failure, by the counterparty to an over-the-counter derivative, to perform under the terms of the contract; (iii) liquidity risk related to the lack of a liquid market for these contracts allowing the Fund to close out its position(s); and (iv) documentation risk relating to disagreement over contract terms.
The Fund’s OTC swap contracts are subject to master netting arrangements.
Credit Default Swaps
| J.P. Morgan Exchange-Traded Funds | |
NOTES TO FINANCIAL STATEMENTSAS OF February 29, 2024 (continued)
Inflation Managed Bond ETF entered into credit default swaps to simulate long and/or short bond positions or to take an active long and/or short position with respect to the likelihood of a default or credit event by the issuer of the underlying reference obligation.
The underlying reference obligation may be a single issuer of corporate or sovereign debt, a basket of issuers or a credit index. A credit index is a list of credit instruments or exposures that reference a fixed number of obligors with shared characteristics that represents some part of the credit market as a whole. Index credit default swaps have standardized terms including a fixed spread and standard maturity dates. The composition of the obligations within a particular index changes periodically.
Credit default swaps involve one party, the protection buyer, making a stream of payments to another party, the protection seller, in exchange for the right to receive a contingent payment if there is a credit event related to the underlying reference obligation. In the event that the reference obligation matures prior to the termination date of the contract, a similar security will be substituted for the duration of the contract term. Credit events are defined under individual swap agreements and generally include bankruptcy, failure to pay, restructuring, repudiation/moratorium, obligation acceleration and obligation default.
If a credit event occurs, the Fund, as protection seller, would be obligated to make a payment, which may be either: (i) a net cash settlement equal to the notional amount of the swap less the auction value of the reference obligation or (ii) the notional amount of the swap in exchange for the delivery of the reference obligation. Selling protection effectively adds leverage to a Fund’s portfolio up to the notional amount of swap agreements. The notional amount represents the maximum potential liability under a contract and is not reflected on the Statements of Assets and Liabilities. Potential liabilities under these contracts may be reduced by: the auction rates of the underlying reference obligations; upfront payments received at the inception of a swap; and net amounts received from credit default swaps purchased with the identical reference obligation.
Inflation-Linked Swaps
Inflation Managed Bond ETF used inflation-linked swaps to provide inflation protection within its portfolio. These are agreements between counterparties to exchange interest payments based on interest rates over the life of the swap. One cash flow stream will typically be a floating rate payment based upon the Consumer Price Index upon while the other is a pre-determined fixed interest rate. The use of swaps exposes the Fund to interest rate risk.
(3) Summary of Derivatives Information—The following table presents the value of derivatives held as of February 29, 2024, by their primary underlying risk exposure and respective location on the Statements of Assets and Liabilities:
| |
Interest Rate Risk Exposure: | |
Unrealized Appreciation on Futures Contracts * | |
Swaps at Value (Assets) ** | |
Unrealized Depreciation on Futures Contracts * | |
Swaps at Value (Liabilities) ** | |
| |
Swaps at Value (Liabilities) ** | |
Net Fair Value of Derivative Contracts: | |
Unrealized Appreciation (Depreciation) on Futures Contracts * | |
| |
|
| Includes cumulative appreciation/(depreciation) on futures contracts, if any, as reported on the SOIs. Only current day’s variation margin is reported within the Statements of Assets and Liabilities. |
| Includes the fair value of centrally cleared swap contracts as reported on the SOIs. Only current day’s variation margin is reported within the Statements of Assets and Liabilities. |
| J.P. Morgan Exchange-Traded Funds | |
The following table presents the effect of derivatives on the Statements of Operations for the year ended February 29, 2024, by primary underlying risk exposure:
| |
Realized Gain (Loss) on Derivatives Recognized as a Result From Operations: |
Interest Rate Risk Exposure: |
| |
| |
|
| |
Net Change in Unrealized Appreciation (Depreciation) on Derivatives Recognized as a Result of Operations: |
Interest Rate Risk Exposure: |
| |
| |
|
| |
Derivatives Volume
The table below discloses the volume of the Fund's futures contracts and swaps activity during the year ended February 29, 2024. Please refer to the tables in the Summary of Derivatives Information for derivative-related gains and losses associated with volume activity:
| |
| |
Average Notional Balance Long | |
Average Notional Balance Short | |
Ending Notional Balance Long | |
Ending Notional Balance Short | |
Interest Rate-Related Swaps (Inflation-Linked Swaps) : | |
Average Notional Balance - Pays Fixed Rate | |
Ending Notional Balance - Pays Fixed Rate | |
| |
Average Notional Balance - Buy Protection | |
Ending Notional Balance - Buy Protection | |
G. Security Transactions and Investment Income — Investment transactions are accounted for on the trade date (the date the order to buy or sell is executed). Securities gains and losses are calculated on a specifically identified cost basis. Interest income is determined on the basis of coupon interest accrued using the effective interest method, which adjusts for amortization of premiums and accretion of discounts. Dividend income and distributions of net investment income and realized capital gains from the Underlying Funds, if any, are recorded on the ex-dividend date or when a Fund first learns of the dividend.
Inflation Managed Bond ETF invests in treasury inflation protected securities (TIPS). The principal amount of TIPS is adjusted periodically and is increased for inflation or decreased for deflation based on a monthly published index. These adjustments are recorded as increases or decreases to interest income on the Statements of Operations. Coupon payments are based on the adjusted principal at the time the interest is paid.
To the extent such information is publicly available, the Funds record distributions received in excess of income earned from underlying investments as a reduction of cost of investments and/or realized gain. Such amounts are based on estimates if actual amounts are not available and actual amounts of income, realized gain and return of capital may differ from the estimated amounts. The Funds adjust the estimated amounts of the components of distributions (and consequently their net investment income) as necessary, once the issuers provide information about the actual composition of the distributions.
| J.P. Morgan Exchange-Traded Funds | |
NOTES TO FINANCIAL STATEMENTSAS OF February 29, 2024 (continued)
H. Allocation of Income and Expenses— Expenses directly attributable to a Fund are charged directly to that Fund, while the expenses attributable to more than one fund of the Trust are allocated among the applicable funds.
I. Federal Income Taxes— Each Fund is treated as a separate taxable entity for Federal income tax purposes. Each Fund's policy is to comply with the provisions of the Internal Revenue Code (the “Code”) applicable to regulated investment companies and to distribute to shareholders all of its distributable net investment income and net realized capital gains on investments. Accordingly, no provision for Federal income tax is necessary. Management has reviewed the Funds' tax positions for all open tax years and has determined that as of February 29, 2024, no liability for Federal income tax is required in the Funds' financial statements for net unrecognized tax benefits. However, management’s conclusions may be subject to future review based on changes in, or the interpretation of, the accounting standards or tax laws and regulations. Each Fund's Federal tax returns for the prior three fiscal years remain subject to examination by the Internal Revenue Service.
J. Distributions to Shareholders— Distributions from net investment income, if any, are generally declared and paid at least monthly. Net realized capital gains, if any, are distributed by each Fund at least annually. The amount of distributions from net investment income and net realized capital gains is determined in accordance with Federal income tax regulations, which may differ from GAAP. To the extent these “book/tax” differences are permanent in nature (i.e., that they result from other than timing of recognition — “temporary differences”), such amounts are reclassified within the capital accounts based on their Federal tax basis treatment.
The following amounts were reclassified within the capital accounts:
| | Accumulated
undistributed
(distributions in
excess of)
net investment
income | Accumulated
net realized
gains (losses) |
Inflation Managed Bond ETF | | | |
| | | |
The reclassifications for the Funds relate primarily to redemptions in-kind and tax adjustments on certain investments.
3. Fees and Other Transactions with Affiliates
A. Investment Advisory Fee— Pursuant to an Investment Advisory Agreement, the Adviser manages the investments of each Fund and for such services is paid a fee. The investment advisory fee is accrued daily and paid monthly at an annual rate based on each Fund’s respective average daily net assets. The annual rate for each Fund is as follows:
| |
Inflation Managed Bond ETF | |
| |
The Adviser waived investment advisory fees and/or reimbursed expenses as outlined in Note 3.E.
B. Administration Fee— Pursuant to an Administration Agreement, the Administrator provides certain administration services to each Fund. In consideration of these services, the Administrator receives a fee accrued daily and paid monthly at an annual rate of 0.075% of the first $10 billion of each Fund's respective average daily net assets, plus 0.050% of each Fund's respective average daily net assets between $10 billion and $20 billion, plus 0.025% of each Fund's respective average daily net assets between $20 billion and $25 billion, plus 0.010% of each Fund's respective average daily net assets in excess of $25 billion. For the year ended February 29, 2024, the effective rate was 0.075% of each Fund's average daily net assets, notwithstanding any fee waivers and/or expense reimbursements.
The Administrator waived administration fees as outlined in Note 3.E.
JPMorgan Chase Bank, N.A. (“JPMCB”), a wholly-owned subsidiary of JPMorgan, serves as the Funds' sub-administrator (the “Sub-administrator”). For its services as Sub-administrator, JPMCB receives a portion of the administration fees payable to JPMIM.
| J.P. Morgan Exchange-Traded Funds | |
C. Distribution Fees— The Distributor or its agent distributes Creation Units for each Fund on an agency basis. The Distributor does not maintain a secondary market in shares of each Fund. JPMDS receives no fees for their distribution services under the distribution agreement with the Trust (the “Distribution Agreement”). Although the Trust does not pay any fees under the Distribution Agreement, JPMIM pays JPMDS for certain distribution related services.
D. Custodian, Accounting and Transfer Agent Fees— JPMCB provides portfolio custody, accounting and transfer agency services (effective as of the Closing Date) to the Funds. For performing these services, the Funds pay JPMCB transaction and asset-based fees that vary according to the number of transactions and positions, plus out-of-pocket expenses. The amounts paid directly to JPMCB by the Funds for custody and accounting services are included in Custodian and accounting fees on the Statements of Operations. The amounts paid directly to JPMCB by the Funds for transfer agency services are included in Transfer agency fees on the Statements of Operations.
Additionally, Authorized Participants generally pay transaction fees associated with the creation and redemption of Fund shares. These fees are used to offset certain custodian charges incurred by the Funds for these transactions.
Interest income earned on cash balances at the custodian, if any, is included in Interest income from affiliates on the Statements of Operations.
Interest expense paid to the custodian related to cash overdrafts, if any, is included in Interest expense to affiliates on the Statements of Operations.
E. Waivers and Reimbursements—The Adviser, Administrator and/or JPMDS had contractually agreed to waive fees and/or reimburse the Funds to the extent that total annual operating expenses (excluding acquired fund fees and expenses other than certain money market fund fees as described below, dividend and interest expenses related to short sales, interest, taxes, expenses related to litigation and potential litigation, expenses related to trustee elections and extraordinary expenses) exceed 0.25% of Inflation Managed Bond ETF's average daily net assets and 0.50% of Realty Income ETF's average daily net assets.
The expense limitation agreement was in effect for the year ended February 29, 2024 and the contractual expense limitation is in place until at least June 30, 2025.
For the year ended February 29, 2024, the Funds' service providers waived fees and/or reimbursed expenses for the Funds as follows. None of these parties expect the Funds to repay any such waived fees and/or reimbursed expenses in future years.
| |
| Contractual
Reimbursements |
Inflation Managed Bond ETF | |
| |
Additionally, the Funds may invest in one or more money market funds advised by the Adviser (affiliated money market funds). The Adviser, Administrator and/or JPMDS, as shareholder servicing agent, have contractually agreed to waive fees and/or reimburse expenses in an amount sufficient to offset the respective net fees each collects from the affiliated money market fund on the applicable Fund’s investment in such affiliated money market fund, except for investments of securities lending cash collateral. None of these parties expect the Funds to repay any such waived fees and/ or reimbursed expenses in future years.
The amounts of these waivers resulting from investments in these money market funds for the year ended February 29, 2024 were as follows:
| |
Inflation Managed Bond ETF | |
| |
JPMIM voluntarily agreed to reimburse the Funds for the Trustee Fees paid to one of the interested Trustees. For the year ended February 29, 2024, the amount of these reimbursements were as follows:
| |
Inflation Managed Bond ETF | |
| |
F. Other— Certain officers of the Trust are affiliated with the Adviser, the Administrator and JPMDS. Such officers, with the exception of the Chief Compliance Officer, receive no compensation from the Funds for serving in their respective roles.
The Board designated and appointed a Chief Compliance Officer to the Funds pursuant to Rule 38a-1 under the 1940 Act. The Funds, along with certain other affiliated funds, make reimbursement payments, on a pro-rata basis, to the Administrator for a portion of the fees associated with the office of the Chief Compliance Officer. Such fees are included in Trustees’ and Chief Compliance Officer’s fees on the Statements of Operations.
| J.P. Morgan Exchange-Traded Funds | |
NOTES TO FINANCIAL STATEMENTSAS OF February 29, 2024 (continued)
The Trust adopted a Trustee Deferred Compensation Plan (the “Plan”) which allows the independent Trustees to defer the receipt of all or a portion of compensation related to performance of their duties as Trustees. The deferred fees are invested in various J.P. Morgan Funds until distribution in accordance with the Plan.
During the year ended February 29, 2024, Inflation Managed Bond ETF purchased securities from an underwriting syndicate in which the principal underwriter or members of the syndicate were affiliated with the Adviser.
The Securities and Exchange Commission ("SEC") has granted an exemptive order permitting the Funds to engage in principal transactions with J.P. Morgan Securities LLC, an affiliated broker, involving taxable money market instruments, subject to certain conditions.
4. Investment Transactions
During the year ended February 29, 2024, purchases and sales of investments (excluding short-term investments) were as follows:
| Purchases
(excluding
U.S. Government) | Sales
(excluding
U.S. Government) | Purchases
of U.S.
Government | |
Inflation Managed Bond ETF | | | | |
| | | | |
For the year ended February 29, 2024, in-kind transactions associated with creations and redemptions were as follows:
| | |
Inflation Managed Bond ETF | | |
| | |
During the year ended February 29, 2024, the Funds delivered portfolio securities for the redemption of Fund shares (in-kind redemptions). Cash and portfolio securities were transferred for redemptions at fair value. For financial reporting purposes, the Funds recorded net realized gains and losses in connection with each in-kind redemption transaction.
5. Federal Income Tax Matters
For Federal income tax purposes, the estimated cost and unrealized appreciation (depreciation) in value of investments held at February 29, 2024 were as follows:
| | Gross
Unrealized
Appreciation | Gross
Unrealized
Depreciation | Net Unrealized
Appreciation
(Depreciation) |
Inflation Managed Bond ETF | | | | |
| | | | |
The difference between book and tax basis appreciation (depreciation) on investments is primarily attributed to tax adjustments on certain investments and wash sale loss deferrals.
The tax character of distributions paid during the year ended February 29, 2024 was as follows:
| | |
Inflation Managed Bond ETF | | |
| | |
|
| Short-term gain distributions are treated as ordinary income for income tax purposes. |
| J.P. Morgan Exchange-Traded Funds | |
The tax character of distributions paid during the year ended February 28, 2023 was as follows:
| | Net
Long-Term
Capital Gains | |
Inflation Managed Bond ETF | | | |
| | | |
|
| Short-term gain distributions are treated as ordinary income for income tax purposes. |
As of February 29, 2024, the estimated components of net assets (excluding paid-in-capital) on a tax basis were as follows:
| Current
Distributable
Ordinary
Income | Current
Distributable
Long-Term
Capital Gain
(Tax Basis Capital
Loss Carryover) | Unrealized
Appreciation
(Depreciation) |
Inflation Managed Bond ETF | | | |
| | | |
The cumulative timing differences primarily consist of tax adjustments on certain investments, post-October capital loss deferrals and wash sale loss deferrals.
At February 29, 2024, the following Funds had net capital loss carryforwards which are available to offset future realized gains:
| Capital Loss Carryforward Character |
| | |
Inflation Managed Bond ETF | | |
| | |
Net capital losses (gains) and specified ordinary losses incurred after October 31, and within the taxable year are deemed to arise on the first business day of the Funds' next taxable year. For the year ended February 29, 2024, the Funds deferred to March 1, 2024 the following net capital losses (gains) of:
| Net Capital Losses (Gains) | |
| | |
Inflation Managed Bond ETF | | | |
| | | |
6. Capital Share Transactions
The Trust issues and redeems shares of the Funds only in Creation Units through the Distributor at NAV. Capital shares transactions detail can be found in the Statements of Changes in Net Assets.
Shares of the Funds may only be purchased or redeemed by Authorized Participants. Such Authorized Participants may from time to time hold, of record or beneficially, a substantial percentage of the Funds' shares outstanding and act as executing or clearing broker for investment transactions on behalf of the Funds. An Authorized Participant is either (1) a “Participating Party” or other participant in the clearing process through the Continuous Net Settlement System of the National Securities Clearing Corporation (“NSCC”); or (2) a DTC Participant; which, in either case, must have executed an agreement with the Distributor.
Creation Units of a Fund may be created in advance of receipt by the Trust of all or a portion of the applicable basket of equity securities and other instruments (“Deposit Instruments”) and cash as described in the Funds’ registration statement. In these instances, the initial Deposit Instruments and cash must be deposited in an amount equal to the sum of the cash amount, plus at least 105% for the Funds, of the market value of undelivered Deposit Instruments. A transaction fee may be imposed to offset transfer and other transaction costs associated with the purchase or redemption of Creation Units.
| J.P. Morgan Exchange-Traded Funds | |
NOTES TO FINANCIAL STATEMENTSAS OF February 29, 2024 (continued)
Authorized Participants transacting in Creation Units for cash may also pay a variable fee to compensate the relevant fund for market impact expenses relating to investing in portfolio securities. Such variable fees, if any, are included in “Proceeds from shares issued” in the Statements of Changes in Net Assets.
7. Borrowings
Effective November 1, 2022, the Funds rely upon an exemptive order granted by the SEC (the “Order”) permitting the establishment and operation of an Interfund Lending Facility (the “Facility”). The Facility allows the Funds to directly lend and borrow money to or from any other fund relying upon the Order at rates beneficial to both the borrowing and lending funds. Advances under the Facility are taken primarily for temporary or emergency purposes, including the meeting of redemption requests that otherwise might require the untimely disposition of securities, and are subject to each Fund's borrowing restrictions. The interfund loan rate is determined, as specified in the Order, by averaging the current repurchase agreement rate and the current bank loan rate. The Order was granted to JPMorgan Trust II and may be relied upon by the Funds because the Funds and the series of JPMorgan Trust II are all investment companies in the same “group of investment companies” (as defined in Section 12(d)(1)(G) of the 1940 Act).
The Funds had no borrowings outstanding from another fund, or loans outstanding to another fund, during the year ended February 29, 2024.
The Trust and JPMCB have entered into a financing arrangement. Under this arrangement, JPMCB provides an unsecured, uncommitted credit facility in the aggregate amount of $100 million to certain of the J.P. Morgan Funds, including the Funds. Advances under the arrangement are taken primarily for temporary or emergency purposes, including the meeting of redemption requests that otherwise might require the untimely disposition of securities, and are subject to each Fund's borrowing restrictions. Interest on borrowings is payable at a rate determined by JPMCB at the time of borrowing. This agreement has been extended until October 29, 2024.
The Funds had no borrowings outstanding from the unsecured, uncommitted credit facility during the year ended February 29, 2024.
Effective August 8, 2023, the Trust, along with certain other trusts for J.P. Morgan Funds (“Borrowers”), has entered into an existing joint syndicated senior unsecured revolving credit facility totaling $1.5 billion (“Credit Facility”) with various lenders and The Bank of New York Mellon, as administrative agent for the lenders. Although the Trust is effectively part of the Credit Facility as of August 8, 2023, it is not eligible to draw on the Credit Facility, and will not incur costs associated with being a part of the Credit Facility, until on or about May 28, 2024.
This Credit Facility provides a source of funds to the Borrowers for temporary and emergency purposes, including the meeting of redemption requests that otherwise might require the untimely disposition of securities. Under the terms of the Credit Facility, a borrowing fund must have a minimum of $25 million in adjusted net asset value and not exceed certain adjusted net asset coverage ratios prior to and during the time in which any borrowings are outstanding. If a fund does not comply with the aforementioned requirements, the fund must remediate within three business days with respect to the $25 million minimum adjusted net asset value or within one business day with respect to certain asset coverage ratios or the administrative agent at the request of, or with the consent of, the lenders may terminate the Credit Facility and declare any outstanding borrowings to be due and payable immediately.
Interest associated with any borrowing under the Credit Facility is charged to the borrowing fund at a rate of interest equal to 1.00% (the “Applicable Margin”), plus the greater of the federal funds effective rate or the one-month Adjusted Secured Overnight Financing Rate (“SOFR”). Effective August 8, 2023, the Credit Facility has been amended and restated for a term of 364 days, unless extended.
The Funds did not utilize the Credit Facility during the year ended February 29, 2024.
8. Risks, Concentrations and Indemnifications
In the normal course of business, the Funds enter into contracts that contain a variety of representations which provide general indemnifications. Each Fund's maximum exposure under these arrangements is unknown. The amount of exposure would depend on future claims that may be brought against each Fund. However, based on experience, the Funds expect the risk of loss to be remote.
As of February 29, 2024, JPMorgan SmartRetirement Funds and JPMorgan SmartRetirement Blend Funds, which are affiliated fund of funds, each owned in the aggregate, shares representing more than 10% of the net assets of the Funds as follows:
| JPMorgan
SmartRetirement
Funds | JPMorgan
SmartRetirement
Blend Funds |
Inflation Managed Bond ETF | | |
| | |
Significant shareholder transactions by these shareholders may impact the Funds' performance and liquidity.
Disruptions to creations and redemptions, the existence of significant market volatility or potential lack of an active trading market for the shares (including through a trading halt), as well as other factors, may result in shares trading significantly above (at a premium) or below (at a discount) to the NAV or to the intraday value of the Funds’ holdings. During such periods, investors may incur significant losses if shares are sold.
| J.P. Morgan Exchange-Traded Funds | |
Derivatives may be riskier than other types of investments because they may be more sensitive to changes in economic and market conditions and could result in losses that significantly exceed the Funds’ original investment. Many derivatives create leverage thereby causing the Funds to be more volatile than they would have been if they had not used derivatives. Derivatives also expose the Funds to counterparty risk (the risk that the derivative counterparty will not fulfill its contractual obligations), including credit risk of the derivative counterparty. The possible lack of a liquid secondary market for derivatives and the resulting inability of the Funds to sell or otherwise close a derivatives position could expose the Funds to losses and could make derivatives more difficult for the Fund to value accurately.
Inflation Managed Bond ETF invests in Inflation-linked debt securities which are subject to the effects of changes in market interest rates caused by factors other than inflation (real interest rates). In general, the price of an inflation-linked security tends to decline when real interest rates increase.
Unlike conventional bonds, the principal and interest payments of inflation protected securities such as TIPS are adjusted periodically to a specified rate of inflation (e.g., CPI-U). There can be no assurance that the inflation index used will accurately measure the actual rate of inflation. These securities may lose value in the event that the actual rate of inflation is different than the rate of the inflation index.
Inflation Managed Bond ETF is subject to interest rate risk. Investments in bonds and other debt securities will change in value based on changes in interest rates. If rates increase, the value of these investments generally declines. Securities with greater interest rate sensitivity and longer maturities generally are subject to greater fluctuations in value. The Funds may face a heightened level of interest rate risk due to certain changes in monetary policy. It is difficult to predict the pace at which central banks or monetary authorities may increase interest rates or the timing, frequency, or magnitude of such increases. Any such changes could be sudden and could expose debt markets to significant volatility and reduced liquidity for Fund investments.
Inflation Managed Bond ETF is subject to credit risk. The Fund's investments are subject to the risk that an issuer and/or a counterparty will fail to make payments when due or default completely. Prices of the Fund's investments may be adversely affected if any of the issuers or counterparties it is invested in are subject to an actual or perceived deterioration in their credit quality. Credit spreads may increase, which may reduce the market values of the Fund's securities. Credit spread risk is the risk that economic and market conditions or any actual or perceived credit deterioration may lead to an increase in the credit spreads (i.e., the difference in yield between two securities of similar maturity but different credit quality) and a decline in price of the issuer’s securities.
The Funds are also subject to counterparty credit risk, which is the risk that a counterparty fails to perform on agreements with the Funds.
Because Realty Income ETF invests in Real Estate Investment Trusts (“REITs”), the Fund may be subject to certain risks similar to those associated with direct investments in real estate. REITs may be affected by changes in the value of their underlying properties and by defaults by tenants. REITs depend generally on their ability to generate cash flow to make distributions to shareholders, and certain REITs have self-liquidation provisions by which mortgages held may be paid in full and distributions of capital returns may be made at any time.
Realty Income ETF invests in companies with relatively small market capitalizations. Investments in companies with relatively small market capitalizations may involve greater risk than is usually associated with stocks of larger companies. These securities may have limited marketability and may be subject to more abrupt or erratic movements in price than securities of companies with larger capitalizations.
Since Realty Income ETF is non-diversified, it may invest a greater percentage of its assets in a particular issuer or group of issuers than a diversified fund would. This increased investment in fewer issuers may result in the Fund’s shares being more sensitive to economic results of those issuing the securities.
London Interbank Offered Rate (“LIBOR”) was a leading floating rate benchmark used in loans, notes, derivatives and other instruments or investments. As a result of benchmark reforms, publication of most LIBOR settings has ceased. Some LIBOR settings continue to be published but only on a temporary, synthetic and non-representative basis. Regulated entities have generally ceased entering into new LIBOR contracts in connection with regulatory guidance or prohibitions. Public and private sector actors have worked to establish alternative reference rates to be used in place of LIBOR. There is no assurance that any such alternative reference rate will be similar to or produce the same value or economic equivalence as LIBOR or that it will have the same volume or liquidity as did LIBOR which may affect the value, volatility, liquidity or return on certain of the Funds' loans, notes, derivatives and other instruments or investments comprising some or all of the Funds' investments and result in costs incurred in connection with changing reference rates used for positions, closing out positions and entering into new trades. Certain of the Funds' investments may have transitioned from LIBOR or will transition from LIBOR in the future. The transition from LIBOR to alternative reference rates may result in operational issues for the Funds or their investments. No assurances can be given as to the impact of the LIBOR transition (and the timing of any such impact) on the Funds and their investments.
The Funds are subject to infectious disease epidemics/pandemics risk. For example, the outbreak of COVID-19 negatively affected economies, markets and individual companies throughout the world, including those in which the Funds invest. The effects of any future pandemic or other global event to business and market conditions may have a significant negative impact on the performance of a Fund's investments, increase a Fund's volatility, exacerbate other pre-existing political, social and economic risks to the Funds and negatively impact broad segments of businesses and populations. In addition, governments, their regulatory agencies, or self-regulatory organizations have taken or may take actions in response to a pandemic or other global event that affect the instruments in which the Funds invest, or the issuers of such instruments, in ways that could have a significant negative impact on a Fund’s investment performance. The ultimate impact of any pandemic or other global event and the extent to which
| J.P. Morgan Exchange-Traded Funds | |
NOTES TO FINANCIAL STATEMENTSAS OF February 29, 2024 (continued)
the associated conditions and governmental responses impact a Fund will also depend on future developments, which are highly uncertain, difficult to accurately predict and subject to frequent changes.
9. Transfer in-Kind
On March 21, 2022, certain shareholders sold shares of the Realty Income ETF for the below given class. The portfolio securities were delivered primarily by means of redemption in-kind in exchange for shares of the Fund. Cash and portfolio securities were transferred as detailed below.
|
| This amount includes cash of approximately $4,856,743 associated with the redemption in-kind. |
| J.P. Morgan Exchange-Traded Funds | |
REPORT OF INDEPENDENT REGISTERED PUBLIC ACCOUNTING FIRM
To the Board of Trustees of J.P. Morgan Exchange-Traded Fund Trust and Shareholders of JPMorgan Inflation Managed Bond ETF and JPMorgan Realty Income ETF
Opinions on the Financial Statements
We have audited the accompanying statements of assets and liabilities, including the schedules of portfolio investments, of JPMorgan Inflation Managed Bond ETF and JPMorgan Realty Income ETF (two of the funds constituting J.P. Morgan Exchange-Traded Fund Trust, hereafter collectively referred to as the "Funds") as of February 29, 2024, the related statements of operations for the year ended February 29, 2024, the statements of changes in net assets for each of the two years in the period ended February 29, 2024, including the related notes, and the financial highlights for each of the five years in the period ended February 29, 2024 (collectively referred to as the “financial statements”). In our opinion, the financial statements present fairly, in all material respects, the financial position of each of the Funds as of February 29, 2024, the results of each of their operations for the year then ended, the changes in each of their net assets for each of the two years in the period ended February 29, 2024 and each of the financial highlights for each of the five years in the period ended February 29, 2024 in conformity with accounting principles generally accepted in the United States of America.
Basis for Opinions
These financial statements are the responsibility of the Funds’ management. Our responsibility is to express an opinion on the Funds’ financial statements based on our audits. We are a public accounting firm registered with the Public Company Accounting Oversight Board (United States) (PCAOB) and are required to be independent with respect to the Funds in accordance with the U.S. federal securities laws and the applicable rules and regulations of the Securities and Exchange Commission and the PCAOB.
We conducted our audits of these financial statements in accordance with the standards of the PCAOB. Those standards require that we plan and perform the audit to obtain reasonable assurance about whether the financial statements are free of material misstatement, whether due to error or fraud.
Our audits included performing procedures to assess the risks of material misstatement of the financial statements, whether due to error or fraud, and performing procedures that respond to those risks. Such procedures included examining, on a test basis, evidence regarding the amounts and disclosures in the financial statements. Our audits also included evaluating the accounting principles used and significant estimates made by management, as well as evaluating the overall presentation of the financial statements. Our procedures included confirmation of securities owned as of February 29, 2024 by correspondence with the custodian, transfer agent and brokers; when replies were not received from brokers, we performed other auditing procedures. We believe that our audits provide a reasonable basis for our opinions.
/s/ PricewaterhouseCoopers LLP
New York, New York
April 24, 2024
We have served as the auditor of one or more investment companies in the JPMorgan Funds complex since 1993.
| J.P. Morgan Exchange-Traded Funds | |
The Funds' Statement of Additional Information includes additional information about the Funds' Trustees and is available, without charge, upon request by calling 1-844-457-6383 or on the J.P. Morgan Funds’ website at www.jpmorganfunds.com.
Name (Year of Birth);
Positions With
the Funds (1) | Principal Occupation
During Past 5 Years | Number of
Funds in Fund
Complex Overseen
by Trustee (2) | Other Directorships Held
During the Past 5 Years |
| |
John F. Finn (1947); Chair
since 2020; Trustee since 1998. | Chairman, Gardner, Inc. (supply chain management company serving industrial and consumer markets) (serving in various roles 1974-present). | | Director, Greif, Inc. (GEF) (industrial package products and services) (2007-2023); Trustee, Columbus Association for the Performing Arts (1988-present). |
Stephen P. Fisher (1959);
Trustee since 2018. | Retired; Chairman and Chief Executive Officer, NYLIFE Distributors LLC (registered broker-dealer) (serving in various roles 2008-2013); Chairman, NYLIM Service Company LLC (transfer agent) (2008-2017); New York Life Investment Management LLC (registered investment adviser) (serving in various roles 2005-2017); Chairman, IndexIQ Advisors LLC (registered investment adviser for ETFs) (2014-2017); President, MainStay VP Funds Trust (2007-2017), MainStay DefinedTerm Municipal Opportunities Fund (2011-2017) and MainStay Funds Trust (2007-2017) (registered investment companies). | | |
Gary L. French (1951);
Trustee since 2014. | Real Estate Investor (2011-2020); Investment management industry Consultant and Expert Witness (2011-present); Senior Consultant for The Regulatory Fundamentals Group LLC (2011-2017). | | Independent Trustee, The China Fund, Inc. (2013-2019); Exchange Traded Concepts Trust II (2012-2014); Exchange Traded Concepts Trust I (2011-2014). |
Kathleen M. Gallagher (1958);
Trustee since 2018. | Retired; Chief Investment Officer — Benefit Plans, Ford Motor Company (serving in various roles 1985-2016). | | Non- Executive Director, Legal & General Investment Management (Holdings) (2018-present); Non-Executive Director, Legal & General Investment Management America (U.S. Holdings) (financial services and insurance) (2017-present); Advisory Board Member, State Street Global Advisors Total Portfolio Solutions (2017-present); Member, Client Advisory Council, Financial Engines, LLC (registered investment adviser) (2011-2016); Director, Ford Pension Funds Investment Management Ltd. (2007-2016). |
Robert J. Grassi (1957);
Trustee since 2014. | Sole Proprietor, Academy Hills Advisors LLC (2012-present); Pension Director, Corning Incorporated (2002-2012). | | |
| J.P. Morgan Exchange-Traded Funds | |
Name (Year of Birth); Positions With the Funds (1) | Principal Occupation During Past 5 Years | Number of Funds in Fund Complex Overseen by Trustee (2) | Other Directorships Held During the Past 5 Years |
Independent Trustees (continued) | |
Frankie D. Hughes (1952);
Trustee since 2008. | President, Ashland Hughes Properties (property management) (2014-present); President and Chief Investment Officer, Hughes Capital Management, Inc. (fixed income asset management) (1993-2014). | | |
Raymond Kanner (1953);
Trustee since 2017. | Retired; Managing Director and Chief Investment Officer, IBM Retirement Funds (2007-2016). | | Advisory Board Member, Penso Advisors, LLC (2020-present); Advisory Board Member, Los Angeles Capital (2018-present); Advisory Board Member, State Street Global Advisors Total Portfolio Solutions (2017- present); Acting Executive Director, Committee on Investment of Employee Benefit Assets (CIEBA) (2016-2017); Advisory Board Member, Betterment for Business (robo advisor) (2016- 2017); Advisory Board Member, BlueStar Indexes (index creator) (2013-2017); Director, Emerging Markets Growth Fund (registered investment company) (1997-2016); Member, Russell Index Client Advisory Board (2001-2015). |
Thomas P. Lemke (1954);
Trustee since 2014. | | | (1) Independent Trustee of Advisors’ Inner Circle III fund platform, consisting of the following: (i) the Advisors’ Inner Circle Fund III, (ii) the Gallery Trust, (iii) the Schroder Series Trust, (iv) the Delaware Wilshire Private Markets Fund (since 2020), (v) Chiron Capital Allocation Fund Ltd., and (vi) formerly the Winton Diversified Opportunities Fund (2014-2018); and (2) Independent Trustee of the Symmetry Panoramic Trust (since 2018). |
Lawrence R. Maffia (1950);
Trustee since 2014. | Retired; Director and President, ICI Mutual Insurance Company (2006-2013). | | Director, ICI Mutual Insurance Company (1999-2013). |
Mary E. Martinez (1960); Vice
Chair since 2021; Trustee since 2013. | Associate, Special Properties, a Christie’s International Real Estate Affiliate (2010-present); Managing Director, Bank of America (asset management) (2007-2008); Chief Operating Officer, U.S. Trust Asset Management, U.S. Trust Company (asset management) (2003-2007); President, Excelsior Funds (registered investment companies) (2004-2005). | | |
Marilyn McCoy (1948);
Trustee since 1999. | Retired; Vice President of Administration and Planning, Northwestern University (1985-2023). | | |
| J.P. Morgan Exchange-Traded Funds | |
TRUSTEES(Unaudited) (continued)
Name (Year of Birth); Positions With the Funds (1) | Principal Occupation During Past 5 Years | Number of Funds in Fund Complex Overseen by Trustee (2) | Other Directorships Held During the Past 5 Years |
Independent Trustees (continued) | |
Dr. Robert A. Oden, Jr. (1946); Trustee
since 1997. | Retired; President, Carleton College (2002-2010); President, Kenyon College (1995-2002). | | Trustee, The Coldwater Conservation Fund (2017-present); Trustee, American Museum of Fly Fishing (2013-present); Trustee and Vice Chair, Trout Unlimited (2017-2021); Trustee, Dartmouth- Hitchcock Medical Center (2011-2020). |
Marian U. Pardo* (1946);
Trustee since 2013. | Managing Director and Founder, Virtual Capital Management LLC (investment consulting) (2007-present); Managing Director, Credit Suisse Asset Management (portfolio manager) (2003-2006). | | Board Chair and Member, Board of Governors, Columbus Citizens Foundation (not-for-profit supporting philanthropic and cultural programs) (2006-present). |
Emily A. Youssouf (1951);
Trustee since 2014. | Adjunct Professor (2011-present) and Clinical Professor (2009-2011), NYU Schack Institute of Real Estate; Board Member and Member of the Audit Committee (2013–present), Chair of Finance Committee (2019-present), Member of Related Parties Committee (2013-2018) and Member of the Enterprise Risk Committee (2015-2018), PennyMac Financial Services, Inc.; Board Member (2005-2018), Chair of Capital Committee (2006-2016), Chair of Audit Committee (2005-2018), Member of Finance Committee (2005-2018) and Chair of IT Committee (2016-2018), NYC Health and Hospitals Corporation. | | Trustee, NYC School Construction Authority (2009-present); Board Member, NYS Job Development Authority (2008-present); Trustee and Chair of the Audit Committee of the Transit Center Foundation (2015-2019). |
| |
Robert F. Deutsch** (1957);
Trustee since 2014. | Retired; Head of ETF Business for JPMorgan Asset Management (2013-2017); Head of Global Liquidity Business for JPMorgan Asset Management (2003-2013). | | Treasurer and Director of the JUST Capital Foundation (2017-present). |
Nina O. Shenker** (1957);
Trustee since 2022. | Vice Chair (2017-2021), General Counsel and Managing Director (2008-2016), Associate General Counsel and Managing Director (2004-2008), J.P. Morgan Asset & Wealth Management. | | Director and Member of Legal and Human Resources Subcommittees, American Jewish Joint Distribution Committee (2018-present). |
|
| The year shown is the first year in which a Trustee became a member of any of the following: the JPMorgan Mutual Fund Board, the JPMorgan ETF Board, the heritage J.P. Morgan Funds or the heritage One Group Mutual Funds. Trustees serve an indefinite term, until resignation, retirement, removal or death. The Board's current retirement policy sets retirement at the end of the calendar year in which the Trustee attains the age of 75, provided that any Board member who was a member of the JPMorgan Mutual Fund Board prior to January 1, 2022 and was born prior to January 1, 1950 shall retire from the Board at the end of the calendar year in which the Trustee attains the age of 78. |
| A Fund Complex means two or more registered investment companies that hold themselves out to investors as related companies for purposes of investment and investor services or have a common investment adviser or have an investment adviser that is an affiliated person of the investment adviser of any of the other registered investment companies. The J.P. Morgan Funds Complex for which the Board of Trustees serves currently includes eight registered investment companies (167 J.P. Morgan Funds). |
| In connection with prior employment with JPMorgan Chase, Ms. Pardo was the recipient of non-qualified pension plan payments from JPMorgan Chase in the amount of approximately $2,055 per month, which she irrevocably waived effective January 1, 2013, and deferred compensation payments from JPMorgan Chase in the amount of approximately $7,294 per year, which ended in January 2013. In addition, Ms. Pardo receives payments from a fully-funded qualified plan, which is not an obligation of JPMorgan Chase. |
| J.P. Morgan Exchange-Traded Funds | |
| Designation as an “Interested Trustee” is based on prior employment by the Adviser or an affiliate of the Adviser or interests in a control person of the Adviser. |
| The contact address for each of the Trustees is 277 Park Avenue, New York, NY 10172. |
| J.P. Morgan Exchange-Traded Funds | |
Name (Year of Birth),
Positions Held with
the Trust (Since) | Principal Occupations During Past 5 Years |
Brian S. Shlissel (1964),
President and Principal Executive
Officer (2021) | Managing Director and Chief Administrative Officer for J.P. Morgan pooled vehicles, J.P. Morgan Investment Management Inc. since 2014. |
Timothy J. Clemens (1975),
Treasurer and Principal Financial
Officer (2020) | Managing Director, J.P. Morgan Investment Management Inc. Mr. Clemens has been with J.P. Morgan Investment Management Inc. since 2013. |
Gregory S. Samuels (1980),
Secretary (2022) (formerly Assistant
Secretary 2014-2022) | Managing Director and Assistant General Counsel, JPMorgan Chase & Co. Mr. Samuels has been with JPMorgan Chase & Co. since 2010. |
Stephen M. Ungerman (1953),
Chief Compliance Officer (2014) | Managing Director, JPMorgan Chase & Co. Mr. Ungerman has been with JPMorgan Chase & Co. since 2000. |
Kiesha Astwood-Smith (1973),
Assistant Secretary (2021) | Vice President and Assistant General Counsel, JPMorgan Chase & Co. since June 2021; Senior Director and Counsel, Equitable Financial Life Insurance Company (formerly, AXA Equitable Life Insurance Company) from September 2015 through June 2021. |
Matthew Beck (1988),
Assistant Secretary (2021)* | Vice President and Assistant General Counsel, JPMorgan Chase & Co. since May 2021; Senior Legal Counsel, Ultimus Fund Solutions from May 2018 through May 2021; General Counsel, The Nottingham Company from April 2014 through May 2018. |
Elizabeth A. Davin (1964),
Assistant Secretary (2022)
(formerly Secretary 2018-2022)* | Executive Director and Assistant General Counsel, JPMorgan Chase & Co. Ms. Davin has been with JPMorgan Chase & Co. (formerly Bank One Corporation) since 2004. |
Jessica K. Ditullio (1962),
Assistant Secretary (2014)* | Executive Director and Assistant General Counsel, JPMorgan Chase & Co. Ms. Ditullio has been with JPMorgan Chase & Co. (formerly Bank One Corporation) since 1990. |
Anthony Geron (1971),
Assistant Secretary (2019) | Vice President and Assistant General Counsel, JPMorgan Chase & Co. since September 2018; Lead Director and Counsel, AXA Equitable Life Insurance Company from 2015 to 2018 and Senior Director and Counsel, AXA Equitable Life Insurance Company from 2014 to 2015. |
Carmine Lekstutis (1980),
Assistant Secretary (2014) | Executive Director and Assistant General Counsel, JPMorgan Chase & Co. Mr. Lekstutis has been with JPMorgan Chase & Co. since 2011. |
Max Vogel (1990),
Assistant Secretary (2021) | Vice President and Assistant General Counsel, JPMorgan Chase & Co. since June 2021; Associate, Proskauer Rose LLP (law firm) from March 2017 to June 2021. |
Zachary E. Vonnegut-Gabovitch
(1986),
Assistant Secretary (2017) | Executive Director and Assistant General Counsel, JPMorgan Chase & Co. Mr. Vonnegut-Gabovitch has been with JPMorgan Chase & Co. since September 2016. |
Frederick J. Cavaliere (1978),
Assistant Treasurer (2015)** | Executive Director, J.P. Morgan Investment Management Inc. Mr. Cavaliere has been with JPMorgan Chase & Co. since May 2006. |
Michael M. D’Ambrosio (1969),
Assistant Treasurer (2014) | Managing Director, J.P. Morgan Investment Management Inc. Mr. D’Ambrosio has been with J.P. Morgan Investment Management Inc. since 2012. |
Aleksandr Fleytekh (1972),
Assistant Treasurer (2023) | Executive Director, J.P. Morgan Investment Management Inc. Mr. Fleytekh has been with J.P. Morgan Investment Management Inc. since February 2012. |
Shannon Gaines (1977),
Assistant Treasurer (2019)* | Executive Director, J.P. Morgan Investment Management Inc. Mr. Gaines has been with J.P. Morgan Investment Management Inc. since January 2014. |
Jeffrey D. House (1972),
Assistant Treasurer (2023)* | Vice President, J.P. Morgan Investment Management Inc. Mr. House has been with J.P. Morgan Investment Management Inc. since July 2006. |
Michael Mannarino (1985),
Assistant Treasurer (2023) | Vice President, J.P. Morgan Investment Management Inc. Mr. Mannarino has been with J.P. Morgan Investment Management Inc. since 2014. |
| J.P. Morgan Exchange-Traded Funds | |
Nektarios E. Manolakakis (1972),
Assistant Treasurer (2020) | Executive Director, J.P. Morgan Investment Management Inc. since February 2021, formerly Vice President, J.P. Morgan Investment Management Inc. since 2014; Vice President, J.P. Morgan Corporate & Investment Bank 2010-2014. |
Todd McEwen (1981),
Assistant Treasurer (2020)* | Executive Director, J.P. Morgan Investment Management Inc. Mr. McEwen has been with J.P. Morgan Investment Management Inc. since 2010. |
Joseph Parascondola (1963),
Assistant Treasurer (2023)** | Executive Director, J.P. Morgan Investment Management Inc. Mr. Parascondola has been with J.P. Morgan Investment Management Inc. since 2006. |
Gillian I. Sands (1969),
Assistant Treasurer (2023) | Executive Director, J.P. Morgan Investment Management Inc. Ms. Sands has been with J.P. Morgan Investment Management Inc. since September 2012. |
|
The contact address for each of the officers, unless otherwise noted, is 277 Park Avenue, New York, NY 10172. |
| The contact address for the officer is 1111 Polaris Parkway, Columbus, OH 43240. |
| The contact address for the officer is 575 Washington Boulevard, Jersey City, NJ 07310. |
| J.P. Morgan Exchange-Traded Funds | |
SCHEDULE OF SHAREHOLDER EXPENSES(Unaudited)
Hypothetical $1,000 Investment
As a shareholder of the Funds, you incur two types of costs: (1) transaction costs, including brokerage commissions on your purchase and sales of Fund shares and (2) ongoing costs, including investment advisory fees, administration fees, and other fund expenses. The examples below are intended to help you understand your ongoing costs (in dollars) of investing in the Funds and to compare these ongoing costs with the ongoing costs of investing in other funds. The examples assume that you had a $1,000 investment at the beginning of the reporting period, September 1, 2023, and continued to hold your shares at the end of the reporting period, February 29, 2024.
Actual Expenses
For each Fund in the table below, the first line provides information about actual account values and actual expenses. You may use the information in this line, together with the amount you invested, to estimate the expenses that you paid over the period. Simply divide your account value by $1,000 (for example, an $8,600 account value divided by $1,000 = 8.6), then multiply the result by the number in the first line of each
Fund under the heading titled “Expenses Paid During the Period” to estimate the expenses you paid on your account during this period.
Hypothetical Example for Comparison Purposes
The second line of each Fund in the table below provides information about hypothetical account values and hypothetical expenses based on the actual expense ratio and an assumed rate of return of 5% per year before expenses, which is not the Fund's actual return. The hypothetical account values and expenses may not be used to estimate the actual ending account balance or expenses you paid for the period. You may use this information to compare the ongoing costs of investing in the Funds and other funds. To do so, compare this 5% hypothetical example with the 5% hypothetical examples that appear in the shareholder reports of the other funds. The examples also assume all dividends and distributions have been reinvested. The examples do not take into account brokerage commissions that you pay when purchasing or selling shares of a Fund.
| Beginning Account Value September 1, 2023 | Ending Account Value February 29, 2024 | | |
JPMorgan Inflation Managed Bond ETF | | | | |
| | | | |
| | | | |
JPMorgan Realty Income ETF | | | | |
| | | | |
| | | | |
|
| Expenses are equal to each Fund's annualized net expense ratio, multiplied by the average account value over the period, multiplied by 182/366 (to reflect the one-half year period). |
| J.P. Morgan Exchange-Traded Funds | |
LIQUIDITY RISK MANAGEMENT PROGRAM(Unaudited)
Each of the Funds covered in this report has adopted the J.P. Morgan Funds and J.P. Morgan Exchange-Traded Funds Amended and Restated Liquidity Risk Management Program (the “Program”) under Rule 22e-4 under the Investment Company Act of 1940, as amended (the “Liquidity Rule”). The Program seeks to assess, manage and review each Fund’s Liquidity Risk. “Liquidity Risk” is defined as the risk that a fund could not meet requests to redeem shares issued by the fund without significant dilution of remaining investors’ interests in the fund. Pursuant to an exemptive order (the “Exemptive Order”) from the Securities and Exchange Commission, the Program permits the Funds to use liquidity definitions and classification methodologies that differ from the requirements under the Liquidity Rule in some respects. Among other things, the Liquidity Rule requires that a written report be provided to the Board of Trustees (the “Board”) on an annual basis that addresses the operation of the Program and assesses the adequacy and effectiveness of its implementation, including the operation of any Highly Liquid Investment Minimum (“HLIM”), where applicable, and any material changes to the Program.1
The Board has appointed J.P. Morgan Asset Management’s Liquidity Risk Forum to be the program administrator for the Program (the “Program Administrator”). In addition to regular reporting at each of its quarterly meetings, on February 7, 2024, the Board reviewed the Program Administrator’s annual written report (the “Report”) concerning the operation of the Program for the period from January 1, 2023 through December 31, 2023 (the “Program Reporting Period”). The Report addressed the operation of the Program and assessed its adequacy and effectiveness of implementation, including, where applicable, the operation of a Fund’s HLIM. There were no material changes to the Program during the Program Reporting Period.
The Report summarized the operation of the Program and the information and factors considered by the Program Administrator in assessing whether the Program has been adequately
and effectively implemented with respect to each Fund. Such information and factors included, among other things: (1) the effectiveness of the Program with respect to the identification of each Fund that qualifies as an “In-Kind ETF” (as defined in the Liquidity Rule); (2) the liquidity risk framework used to assess, manage, and periodically review each Fund’s Liquidity Risk and the results of this assessment; (3) the methodology and inputs for classifying the investments of a Fund (other than an In-Kind ETF) into one of the required liquidity categories that reflect an estimate of the liquidity of those investments under current market conditions (and, for In-Kind ETFs, the methodology and inputs for determining whether any investments should be classified as “Illiquid Investments” (as defined or modified under the Program)); (4) whether a Fund (other than an In-Kind ETF) invested primarily in “Highly Liquid Investments” (as defined or modified under the Program), as well as whether an HLIM should be established for a Fund (other than an In-Kind ETF) and the procedures for monitoring any HLIM; (5) whether a Fund invested more than 15% of its assets in “Illiquid Investments” and the procedures for monitoring for this limit; and (6) specific liquidity events arising during the Program Reporting Period. The Report further summarized the conditions of the Exemptive Order and whether all applicable Funds were in compliance with the terms of the Exemptive Order.
Based on this review, the Report concluded that: (1) the Program continues to be reasonably designed to effectively assess and manage each Fund’s Liquidity Risk; and (2) the Program has been adequately and effectively implemented with respect to each Fund during the Program Reporting Period.
1 Effective July 24, 2024, the J.P. Morgan Funds will implement the Tailored Shareholder Reports for Mutual Funds and Exchanged-Traded Funds Rule. This rule rescinds the currently-required statement regarding the operation and effectiveness of a fund’s Liquidity Risk Management Program from the shareholder report.
| J.P. Morgan Exchange-Traded Funds | |
TAX LETTER(Unaudited)
(Dollar values in thousands)
Certain tax information for the J.P. Morgan Funds is required to be provided to shareholders based upon the Funds' income and distributions for the taxable year ended February 29, 2024. The information and distributions reported in this letter may differ from the information and taxable distributions reported to the shareholders for the calendar year ending December 31, 2024. The information necessary to complete your income tax returns for the calendar year ending December 31, 2024 will be provided under separate cover.
Qualified Interest Income (QII)
The Fund listed below paid the following amount, or maximum allowable amount, of ordinary distributions treated as qualified interest income for the fiscal year ended February 29, 2024:
| |
JPMorgan Inflation Managed Bond ETF | |
Section 199A Income
The Fund listed below had the following amount, or maximum allowable amount, of ordinary income distributions treated as 199A dividends for the fiscal year ended February 28, 2023.
| |
JPMorgan Realty Income ETF | |
Treasury Income
The Fund listed below had the following percentage, or maximum allowable percentage, of income earned from direct U.S. Treasury Obligations for the fiscal year ended February 29, 2024:
| Income from
U.S. Treasury
Obligations |
JPMorgan Inflation Managed Bond ETF | |
| J.P. Morgan Exchange-Traded Funds | |
THIS PAGE IS INTENTIONALLY LEFT BLANK
THIS PAGE IS INTENTIONALLY LEFT BLANK
J.P. Morgan Asset Management is the brand name for the asset management business of JPMorgan Chase & Co. and its affiliates worldwide.
© JPMorgan Chase & Co., 2024. All rights reserved. February 2024.
AN-CONVETF1-224
J.P. Morgan Exchange-Traded Funds are distributed by JPMorgan Distribution Services, Inc., an indirect, wholly-owned subsidiary of JPMorgan Chase & Co. Affiliates of JPMorgan Chase & Co. receive fees for providing various services to the Funds.
Contact J.P. Morgan Exchange-Traded Funds at 1-844-457-6383 (844-4JPM ETF) for a fund prospectus. You can also visit us at www.jpmorganfunds.com. Investors should carefully consider the investment objectives and risks as well as charges and expenses of the fund before investing. The prospectus contains this and other information about the fund. Read the prospectus carefully before investing.
Investors may obtain information about the Securities Investor Protection Corporation (SIPC), including the SIPC brochure, by visiting www.sipc.org or by calling SIPC at 202-371-8300.
Each Fund files a complete schedule of its fund holdings for the first and third quarters of its fiscal year with the SEC as an exhibit to its report on Form N-PORT. The Funds' Form N-PORT reports are available on the SEC’s website at http://www.sec.gov. Each Fund's quarterly holdings can be found by visiting the J.P. Morgan Funds’ website at www.jpmorganfunds.com.
Effective January 24, 2023, the SEC adopted rule and form amendments that will result in changes to the design and delivery of shareholder reports of mutual funds and ETFs, requiring them to transmit concise and visually engaging streamlined annual and semi-annual reports to shareholders that highlight key information. Other information, including financial statements, will no longer appear in a streamlined shareholder report but must be available online, delivered free of charge upon request, and filed on a semi-annual basis on Form N-CSR. The rule and form amendments have a compliance date of July 24, 2024.
A description of each Fund's policies and procedures with respect to the disclosure of each Fund's holdings is available in the prospectus and Statement of Additional Information.
A copy of proxy policies and procedures is available without charge upon request by calling 1-844-457-6383 and on the Funds' website at www.jpmorganfunds.com. A description of such policies and procedures is on the SEC’s website at www.sec.gov. The Trustees have delegated the authority to vote proxies for securities owned by the Funds to the Adviser. A copy of the Funds' voting record for the most recent 12-month period ended June 30 is available on the SEC’s website at www.sec.gov or at the Funds' website at www.jpmorganfunds.com no later than August 31 of each year. The Funds' proxy voting record will include, among other things, a brief description of the matter voted on for each fund security, and will state how each vote was cast, for example, for or against the proposal.
Annual Report
J.P. Morgan Exchange-Traded Funds
February 29, 2024
| | |
JPMorgan BetaBuilders 1-5 Year U.S. Aggregate Bond ETF | | |
JPMorgan BetaBuilders U.S. Aggregate Bond ETF | | |
JPMorgan BetaBuilders U.S. TIPS 0-5 Year ETF | | |
JPMorgan BetaBuilders U.S. Treasury Bond 1-3 Year ETF | | |
JPMorgan BetaBuilders U.S. Treasury Bond 20+ Year ETF | | |
JPMorgan BetaBuilders U.S. Treasury Bond 3-10 Year ETF | | |
JPMorgan BetaBuilders USD High Yield Corporate Bond ETF | | |
JPMorgan BetaBuilders USD Investment Grade Corporate Bond ETF | | |
JPMorgan USD Emerging Markets Sovereign Bond ETF | | |
CONTENTS
Investments in a Fund are not deposits or obligations of, or guaranteed or endorsed by, any bank and are not insured or guaranteed by the FDIC, the Federal Reserve Board or any other government agency. You could lose money if you sell when a Fund’s share price is lower than when you invested.
Past performance is no guarantee of future performance. The general market views expressed in this report are opinions based on market and other conditions through the end of the reporting period and are subject to change without notice. These views are not intended to predict the future performance of a Fund or the securities markets.
Prospective investors should refer to the Funds’ prospectuses for a discussion of the Funds’ investment objectives, strategies and risks. Call J.P. Morgan Exchange-Traded Funds at (844) 457-6383 for a prospectus containing more complete information about a Fund, including management fees and other expenses. Please read it carefully before investing.
Shares are bought and sold throughout the day on an exchange at market price (not at net asset value) through a brokerage account, and are not individually subscribed and redeemed from a Fund. Shares may only be subscribed and redeemed directly from a Fund by Authorized Participants, in very large creation/redemption units. Brokerage commissions will reduce returns.
President's LetterApril 15, 2024 (Unaudited)
Dear Shareholder,
Financial markets largely rallied through the final months of 2023 and into the first quarter of 2024, as leading central banks refrained from implementing further interest rate increases. Equity markets generally outperformed bond markets for the twelve months ended February 29, 2024, led by four consecutive months of net gains in U.S. equity prices.
|
“The global economic outlook for the year ahead remains positive and financial markets appear more resilient than a year ago.” — Brian S. Shlissel
|
Economic data were stronger than many economists expected in the face of elevated interest rates throughout the year. Following weak but positive economic growth in the first half of 2023, U.S. gross domestic product increased to 4.9% in the third quarter and 3.4% growth in the final quarter of the year. While the U.S. unemployment rate rose slightly during the second half of the year, it remained below 4% for the entire 12 month period and monthly job growth data frequently surpassed the consensus forecasts of economists.
Meanwhile, the U.S. Federal Reserve (the “Fed”) continued to raise interest rates through the end of summer 2023, then settled on a benchmark lending rate range of 5.25 - 5.50% through the first quarter of 2024. The European Central Bank and the Bank of England followed similar trajectories, raising interest rates at regular intervals into the third quarter of 2023 and then holding rates at those elevated levels for the remainder of the period. Notably, the Bank of Japan raised interest rates for the first time in 17 years in mid-March 2024, ending eight years of negative interest rates and setting its benchmark rate range at 0.0 to 0.1%.
The Fed and certain other leading central banks fueled investor expectations for interest rate reductions in 2024 and growing optimism that developed market economies could enjoy a “soft landing” of positive growth coupled with relatively low unemployment.
However, there remain significant risks to the macroeconomic backdrop. Slower economic growth due to the impact of higher interest rates could leave the U.S. economy more vulnerable to potential shocks from geopolitical events, natural disasters or political turmoil, particularly taking into account the upcoming U.S. presidential election. Additionally, financial markets may also come under pressure should the Fed decide not to reduce interest rates to the extent anticipated by investors. Finally, the recent run-up in U.S. equity prices could lead to increased volatility in certain sectors of the market.
The global economic outlook for the year ahead remains positive and financial markets appear to be more resilient than a year ago. Global growth is estimated at 2.9% this year and 3.0% for 2025, with a continued decline in inflation, according to the Organization for Economic Cooperation and Development’s February 2024 forecast. However, across market cycles, we believe that those investors who hold a well-diversified portfolio and a long-term view are best positioned.
Our suite of investment solutions seeks to provide investors with the ability to build durable portfolios that meet their financial goals, regardless of macroeconomic and geopolitical uncertainties.
Sincerely,
Brian S. Shlissel
President, J.P. Morgan Exchange-Traded Funds
J.P. Morgan Asset Management
1-844-4JPM-ETF or jpmorgan.com/etfs for more information
| J.P. Morgan Exchange-Traded Funds | |
J.P. Morgan Exchange-Traded Funds
MARKET OVERVIEWTWELVE MONTHS ENDED February 29, 2024 (Unaudited)
While bond markets generally underperformed equity markets during the period, fixed income securities rallied in late 2023 as leading central banks signaled that they could begin to lower interest rates in 2024. Overall, U.S. high yield bonds (also known as junk bonds) and emerging markets debt outperformed other sectors of the bond market, and corporate debt generally outperformed U.S. Treasury bonds and other developed markets sovereign debt for the twelve months ended February 29, 2024.
Global economic growth was stronger than expected in the first quarter of 2023, but in late March, Silicon Valley Bank collapsed after management sold off the bank’s portfolio of U.S. Treasury bonds at a steep loss, which triggered a run on the bank’s deposits. While U.S. regulators moved swiftly to guarantee some deposits at the bank to prevent further contagion, depositors began withdrawing cash from First Republic Bank. At the end of April, U.S. regulators announced First Republic Bank had been closed and sold to J.P. Morgan Chase & Co. Meanwhile, the Swiss government brokered a takeover of troubled Credit Suisse by UBS Group AG. These events sharply elevated market volatility in the banking sector, particularly in U.S. regional bank stocks.
Throughout the first half of 2023, leading central banks continued to raise interest rates at regular intervals in an effort to ease inflationary pressures. By the end of summer 2023, inflation data in the U.S. and across Europe had shown significant reduction in core consumer prices. In response, the U.S. Federal Reserve, the European Central Bank and the Bank of England in separate decisions each declined to raise interest rates further during the final months of 2023.
By the start of the second half of 2023, the general consensus among economists was that interest rates would remain elevated for an extended period, particularly in the U.S. where labor markets remained tight and economic growth was generally stronger than expected. However, at its December meeting, the U.S. Federal Reserve indicated that it was prepared to begin the process of cutting interest rates in 2024, given the trajectory of inflation data.
Global economic growth largely proved more resilient than economists’ forecasts during the period, led by expansions in the U.S., Japan, India and select emerging markets. Meanwhile, the Eurozone, U.K., China and Canada struggled with weaker growth. China’s economy faced low levels of consumer spending and business confidence, along with long-standing debt issues in the domestic property sector. Across Europe, weakness in consumer and business spending and ongoing stresses from the war in Ukraine weighed on economic growth. Notably, inflation data in the U.K. indicated that prices were declining at a somewhat slower pace than in other developed markets.
However, investor concerns about a potential economic recession receded during the period as data showed a general trend toward stability in labor markets amid declining inflation and the pivot in the policies of leading central banks. Global equity markets responded with a four-month rally through the end of February 2024. Notably, the outperformance of U.S. equity markets was led by a handful of large cap companies in the information technology and communications sectors; Apple Inc., Amazon.com Inc., Alphabet Inc., Meta Platforms Inc., Microsoft Corp., Nvidia Corp. and Tesla Inc.
For the twelve months ended February 29, 2024, the Bloomberg U.S. Corporate High Yield Index returned 11.03%, the Bloomberg Emerging Markets Index returned 7.92% and the Bloomberg U.S. Aggregate Index returned 3.33%.
| J.P. Morgan Exchange-Traded Funds | |
JPMorgan BetaBuilders 1-5 Year U.S. Aggregate Bond ETF
FUND COMMENTARYTWELVE MONTHS ENDED February 29, 2024 (Unaudited)
| |
| |
| |
Bloomberg Short-Term U.S. Aggregate Bond Index | |
Net Assets as of 2/29/2024 | |
| |
| |
INVESTMENT OBJECTIVE***
The JPMorgan BetaBuilders 1-5 Year U.S. Aggregate Bond ETF (the “Fund”) seeks investment results that closely correspond, before fees and expenses, to the performance of the Bloomberg Short-Term U.S. Aggregate Bond Index (the “Underlying Index”).
INVESTMENT APPROACH
The Underlying Index, which includes U.S. dollar denominated investment grade taxable bonds with remaining effective maturities between one and five years, is a subset of the Bloomberg U.S. Aggregate Bond Index. Using a “passive” investment approach, the Fund attempts to closely correspond to the performance of the Underlying Index and invests at least 80% of its assets in securities included in the Underlying Index.
HOW DID THE FUND PERFORM?
For the twelve months ended February 29, 2024, the Fund generated a positive absolute return and performed in line with the Underlying Index before considering the effects of operating expenses, fees and tax management of the Fund’s portfolio.
The Fund’s and Underlying Index’s exposures to investment grade bonds was the largest contributor to absolute performance. While the Fund’s allocations were largely consistent with those of the Underlying Index’s during the period, the Fund is prohibited from holding J.P. Morgan Chase & Co. bonds because it is an affiliate, which detracted from performance relative to the Underlying Index.
HOW WAS THE FUND POSITIONED?
At the end of the reporting period, the Fund’s and the Underlying Index’s largest allocations were to the U.S. Treasury
and corporate bond sectors, and the smallest allocations were to the agency bond and foreign government securities sectors.
PORTFOLIO COMPOSITION
AS OF February 29, 2024 | PERCENT OF
TOTAL
INVESTMENTS |
U.S. Treasury Obligations | |
| |
Mortgage-Backed Securities | |
| |
Commercial Mortgage-Backed Securities | |
U.S. Government Agency Securities | |
Foreign Government Securities | |
Others (each less than 1.0%) | |
| |
*
The return shown is based on net asset value and may differ from the return shown in the financial highlights, which reflects adjustments made to the net asset value in accordance with accounting principles generally accepted in the United States of America. The net asset value was $47.51 as of February 29, 2024.
**
Market price return was calculated assuming an initial investment made at the market price at the beginning of the reporting period, reinvestment of all dividends and distributions at the market price during the period, and sale at the market price on the last day of the period. The price used to calculate the market price return was the closing price on the Cboe BZX Exchange, Inc. As of February 29, 2024, the closing price was $47.52.
***
The adviser seeks to achieve the Fund’s objective. There can be no guarantee it will be achieved.
| J.P. Morgan Exchange-Traded Funds | |
JPMorgan BetaBuilders 1-5 Year U.S. Aggregate Bond ETF
FUND COMMENTARYTWELVE MONTHS ENDED February 29, 2024 (Unaudited) (continued)
AVERAGE ANNUAL TOTAL RETURNS AS OF February 29, 2024 (Unaudited)
| | | |
JPMorgan BetaBuilders 1-5 Year U.S. Aggregate Bond ETF | | | |
| | | |
| | | |
LIFE OF FUND PERFORMANCE (3/12/19 TO 2/29/24)
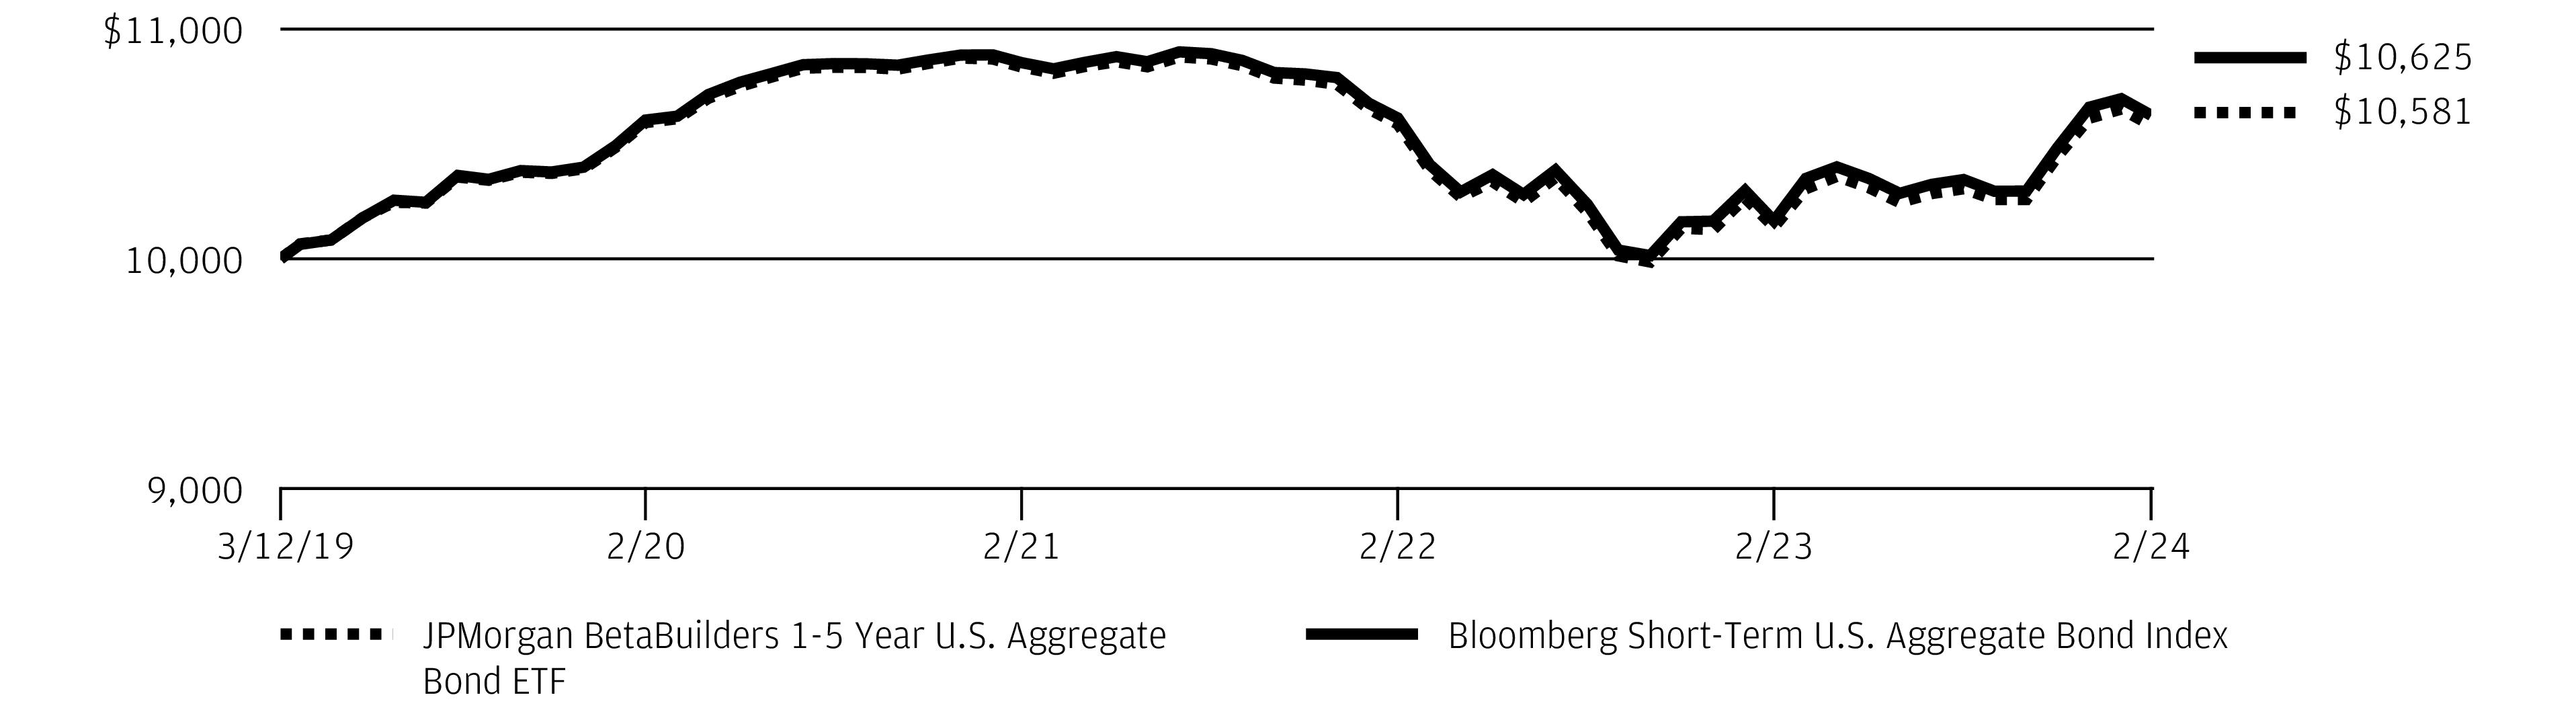
The performance quoted is past performance and is not a guarantee of future results. Exchange-traded funds are subject to certain market risks. Investment returns and principal value of an investment will fluctuate so that an investor’s shares, when sold or redeemed, may be worth more or less than their original cost. Current performance may be higher or lower than the performance data shown. Updated performance information is available by visiting www.jpmorganfunds.com or by calling 1-844-457-6383.
Fund commenced operations on March 12, 2019.
The graph illustrates comparative performance for $10,000 invested in shares of the JPMorgan BetaBuilders 1-5 Year U.S. Aggregate Bond ETF and the Bloomberg Short-Term U.S. Aggregate Bond Index from March 12, 2019 to February 29, 2024. The performance of the Fund reflects the deduction of Fund expenses and assumes reinvestment of all dividends and capital gain distributions, if any. The performance of the Bloomberg Short-Term U.S. Aggregate Bond Index does not reflect the deduction of expenses associated with an exchange-traded fund and has been adjusted to reflect reinvestment of all dividends and capital gain distributions of the securities included in the Index, if applicable. The Bloomberg Short-Term U.S. Aggregate Bond Index is an unmanaged index that represents securities that are taxable and dollar denominated. The index covers the U.S. investment grade fixed rate
bond market, with index components for government and corporate securities, mortgage pass-through securities, and asset-backed securities. Investors cannot invest directly in an index.
Fund performance shown in this section does not reflect the deduction of taxes that a shareholder may pay on Fund distributions or on gains resulting from redemption or sale of Fund shares.
The returns shown are based on net asset values calculated for shareholder transactions and may differ from the returns shown in the financial highlights, which reflect adjustments made to the net asset values in accordance with accounting principles generally accepted in the United States of America.
Source: Bloomberg Index Services Limited. BLOOMBERG® is a trademark and service mark of Bloomberg Finance L.P. and its affiliates (collectively "Bloomberg"). Bloomberg or Bloomberg's licensors own all proprietary rights in the Bloomberg Indices. Bloomberg does not approve or endorse this material, or guarantee the accuracy or completeness of any information herein, or make any warranty, express or implied, as to the results to be obtained therefrom and, to the maximum extent allowed by law, shall have any liability or responsibility for injury or damages arising in connection therewith.
| J.P. Morgan Exchange-Traded Funds | |
JPMorgan BetaBuilders U.S. Aggregate Bond ETF
FUND COMMENTARYTWELVE MONTHS ENDED February 29, 2024 (Unaudited)
| |
| |
| |
Bloomberg U.S. Aggregate Index | |
Net Assets as of 2/29/2024 | |
| |
| |
INVESTMENT OBJECTIVE***
The JPMorgan BetaBuilders U.S. Aggregate Bond ETF (the “Fund”) seeks investment results that closely correspond, before fees and expenses, to the performance of the Bloomberg U.S. Aggregate Index (the “Underlying Index”).
INVESTMENT APPROACH
The Fund uses a “passive” investment approach and attempts to closely correspond to the performance of the Underlying Index, which covers the U.S. investment grade fixed rate bond market, with index components for government and corporate securities, mortgage pass-through securities and asset-backed securities. With respect to corporate sub-sectors, the adviser applied a systematic multi-factor screening process that seeks exposure to those debt issuers with attractive value, quality and momentum characteristics.
HOW DID THE FUND PERFORM?
For the twelve months ended February 29, 2024, the Fund generated a positive return and performed in line with the Underlying Index, before considering the effects of operating expenses, fees and tax management of the Fund’s portfolio.
The Fund’s and the Underlying Index’s exposures to investment grade debt were leading contributors to absolute performance as the difference between yields on benchmark 10-year U.S. Treasury bonds and other debt securities narrowed amid an improved outlook for the U.S. economy. The Fund’s and the Underlying Index’s exposures to U.S. agency mortgage-backed securities and industrial sector bonds were leading detractors from absolute performance during the period.
HOW WAS THE FUND POSITIONED?
At the end of the period, the Fund’s and the Underlying Index’s largest allocations were to the U.S. Treasury bonds and agency
mortgage-backed securities, and their smallest allocations were to securitized debt and non-agency commercial mortgage-backed securities.
PORTFOLIO COMPOSITION
AS OF February 29, 2024 | PERCENT OF
TOTAL
INVESTMENTS |
U.S. Treasury Obligations | |
Mortgage-Backed Securities | |
| |
Foreign Government Securities | |
Commercial Mortgage-Backed Securities | |
| |
U.S. Government Agency Securities | |
Others (each less than 1.0%) | |
| |
*
The return shown is based on net asset value and may differ from the return shown in the financial highlights, which reflects adjustments made to the net asset value in accordance with accounting principles generally accepted in the United States of America. The net asset value was $45.62 as of February 29, 2024.
**
Market price return was calculated assuming an initial investment made at the market price at the beginning of the reporting period, reinvestment of all dividends and distributions at the market price during the period, and sale at the market price on the last day of the period. The price used to calculate the market price return was the closing price on the NYSE Arca, Inc. As of February 29, 2024, the closing price was $45.63.
***
The adviser seeks to achieve the Fund’s objective. There can be no guarantee it will be achieved.
| J.P. Morgan Exchange-Traded Funds | |
JPMorgan BetaBuilders U.S. Aggregate Bond ETF
FUND COMMENTARYTWELVE MONTHS ENDED February 29, 2024 (Unaudited) (continued)
AVERAGE ANNUAL TOTAL RETURNS AS OF February 29, 2024 (Unaudited)
| | | | |
JPMorgan BetaBuilders U.S. Aggregate Bond ETF | | | | |
| | | | |
| | | | |
LIFE OF FUND PERFORMANCE (12/12/18 TO 2/29/24)
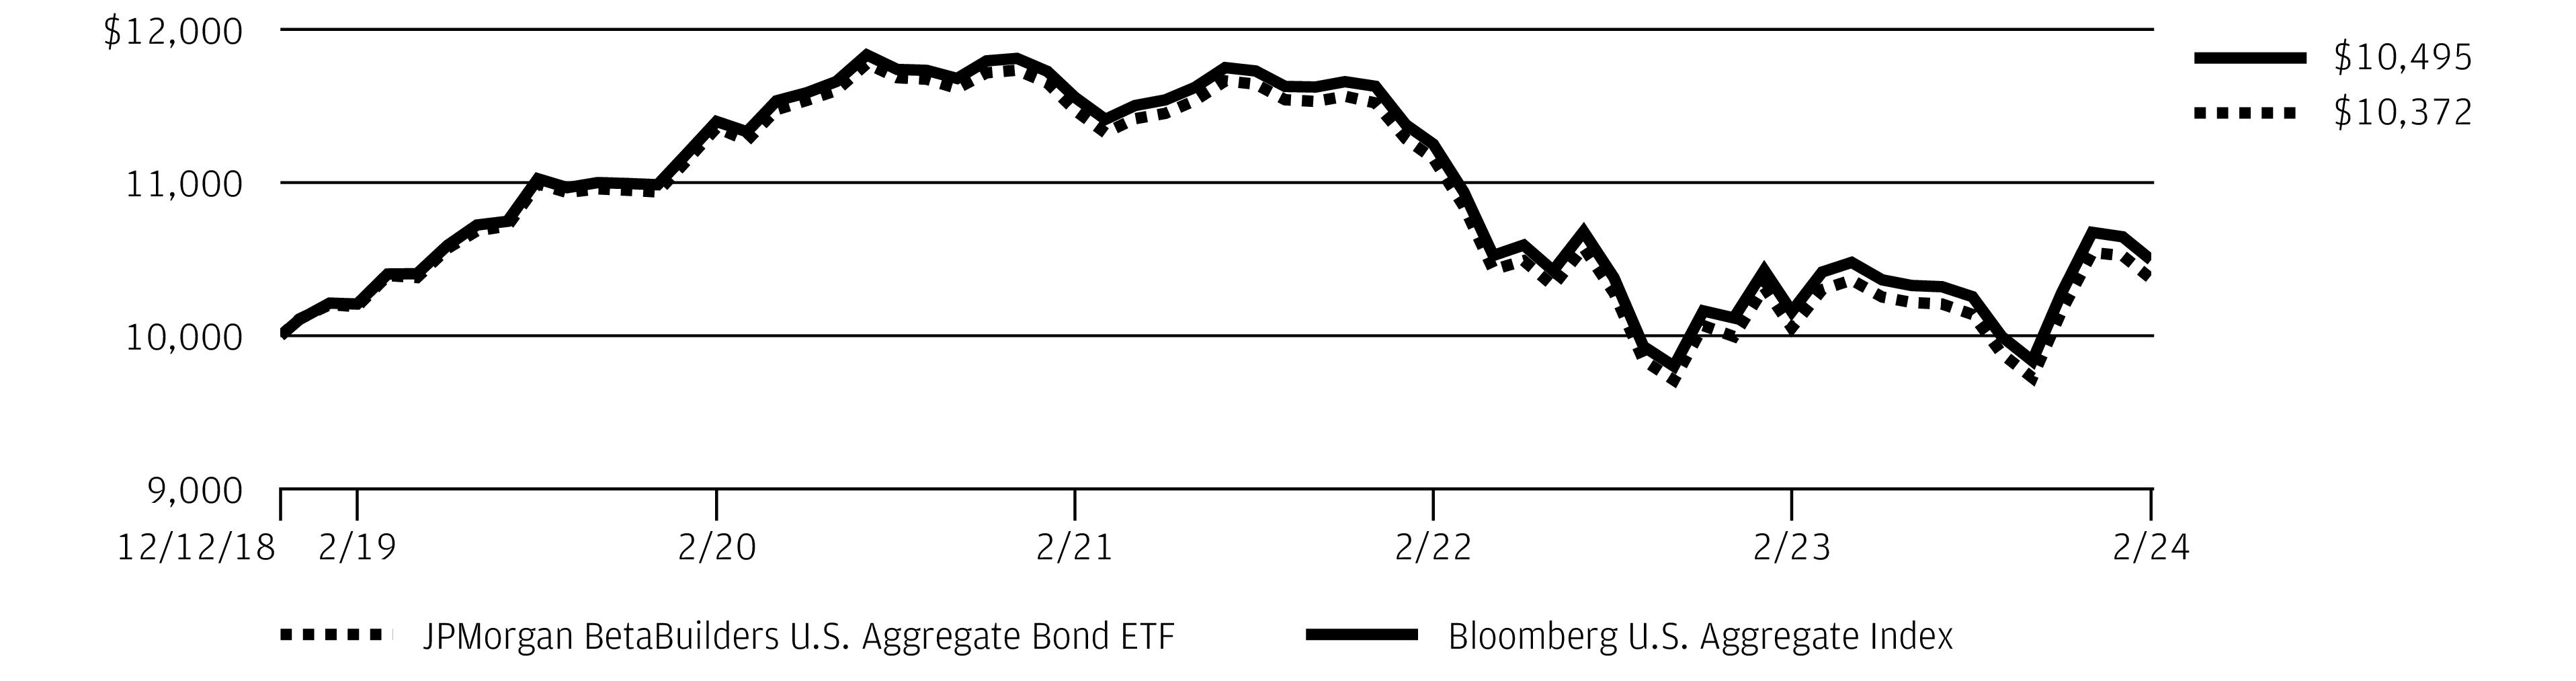
The performance quoted is past performance and is not a guarantee of future results. Exchange-traded funds are subject to certain market risks. Investment returns and principal value of an investment will fluctuate so that an investor’s shares, when sold or redeemed, may be worth more or less than their original cost. Current performance may be higher or lower than the performance data shown. Updated performance information is available by visiting www.jpmorganfunds.com or by calling 1-844-457-6383.
Fund commenced operations on December 12, 2018.
The graph illustrates comparative performance for $10,000 invested in shares of the JPMorgan BetaBuilders U.S. Aggregate Bond ETF and the Bloomberg U.S. Aggregate Index from December 12, 2018 to February 29, 2024. The performance of the Fund reflects the deduction of Fund expenses and assumes reinvestment of all dividends and capital gain distributions, if any. The performance of the Bloomberg U.S. Aggregate Index does not reflect the deduction of expenses associated with an exchange-traded fund and has been adjusted to reflect reinvestment of all dividends and capital gain distributions of the securities included in the Index, if applicable. The Bloomberg U.S. Aggregate Index is an unmanaged index that represents securities that are taxable and dollar denominated. The index covers the U.S. investment grade fixed rate bond market, with index components for government and corporate securities, mortgage pass-through securities, and asset-backed securities. Investors cannot invest directly in an index.
Fund performance reflects waiver of a portion of the Fund’s fees and reimbursement of expenses for certain periods from the Fund’s inception date
and prior to implementation of a unitary fee structure on November 19, 2019. Without these waivers and reimbursements, performance would have been lower. Also, performance shown in this section does not reflect the deduction of taxes that a shareholder may pay on Fund distributions or on gains resulting from redemption or sale of Fund shares.
Effective February 1, 2023, the Fund’s investment strategy and approach were changed to a passively managed portfolio from an actively managed portfolio. Although past performance is not necessarily an indication of how the Fund will perform in the future, in view of these changes, the Fund’s performance record prior to this date may be less relevant for investors considering whether to purchase shares of the Fund.
The returns shown are based on net asset values calculated for shareholder transactions and may differ from the returns shown in the financial highlights, which reflect adjustments made to the net asset values in accordance with accounting principles generally accepted in the United States of America.
Source: Bloomberg Index Services Limited. BLOOMBERG® is a trademark and service mark of Bloomberg Finance L.P. and its affiliates (collectively "Bloomberg"). Bloomberg or Bloomberg's licensors own all proprietary rights in the Bloomberg Indices. Bloomberg does not approve or endorse this material, or guarantee the accuracy or completeness of any information herein, or make any warranty, express or implied, as to the results to be obtained therefrom and, to the maximum extent allowed by law, shall have any liability or responsibility for injury or damages arising in connection therewith.
| J.P. Morgan Exchange-Traded Funds | |
JPMorgan BetaBuilders U.S. TIPS 0-5 Year ETF
FUND COMMENTARYFOR THE PERIOD May 10, 2023 (FUND INCEPTION) THROUGH February 29, 2024 (Unaudited)
| |
| |
| |
ICE 0-5 Year U.S. Inflation-Linked Treasury Index | |
Net Assets as of 2/29/2024 | |
| |
| |
INVESTMENT OBJECTIVE***
The JPMorgan BetaBuilders U.S. TIPS 0-5 Year ETF (the “Fund”) seeks investment results that closely correspond, before fees and expenses, to the performance of the ICE 0-5 Year U.S. Inflation-Linked Treasury Index (the “Underlying Index”).
INVESTMENT APPROACH
The Underlying Index tracks the performance of U.S. dollar-denominated sovereign debt publicly issued by the U.S. government in its domestic market with interest and principal payments tied to inflation via Treasury inflation protected securities (TIPS), with a remaining term to final maturity of less than or equal to five years. The Fund invests at least 80% of its assets in securities included in the Underlying Index.
HOW DID THE FUND PERFORM?
For the period from May 10, 2023 to February 29, 2024, the Fund performed in line with the Underlying Index, before considering the effects of operating expenses, fees and tax management of the Fund’s portfolio.
The Fund’s and the Underlying Index’s allocations to TIPS contributed to absolute performance as income from TIPS offset higher interest rates and a decline in U.S. inflation during the period.
HOW WAS THE FUND POSITIONED?
The Fund’s duration fell to 2.47 years at February 29, 2024 from 2.57 years at August 31, 2023. Duration is a measure of the
price sensitivity of a portfolio of bonds relative to changes in interest rates. Generally, bonds of shorter duration will experience a smaller decrease in price compared with longer duration bonds when interest rates rise.
PORTFOLIO COMPOSITION
AS OF February 29, 2024 | PERCENT OF
TOTAL
INVESTMENTS |
U.S. Treasury Obligations | |
| |
*
The return shown is based on net asset value and may differ from the return shown in the financial highlights, which reflects adjustments made to the net asset value in accordance with accounting principles generally accepted in the United States of America. The net asset value was $98.18 as of February 29, 2024.
**
Market price return was calculated assuming an initial investment made at the inception date net asset value, reinvestment of all dividends and distributions at the market price during the period, and sale at the market price on the last day of the period. The price used to calculate the market price return was the closing price on the Cboe BZX Exchange, Inc. As of February 29, 2024, the closing price was $98.26.
***
The adviser seeks to achieve the Fund’s objective. There can be no guarantee it will be achieved.
| J.P. Morgan Exchange-Traded Funds | |
JPMorgan BetaBuilders U.S. TIPS 0-5 Year ETF
FUND COMMENTARYFOR THE PERIOD May 10, 2023 (FUND INCEPTION) THROUGH February 29, 2024 (Unaudited) (continued)
TOTAL RETURNS AS OF February 29, 2024 (Unaudited)
| | CUMULATIVE SINCE INCEPTION |
JPMorgan BetaBuilders U.S. TIPS 0-5 Year ETF | | |
| | |
| | |
LIFE OF FUND PERFORMANCE (5/10/23 TO 2/29/24)
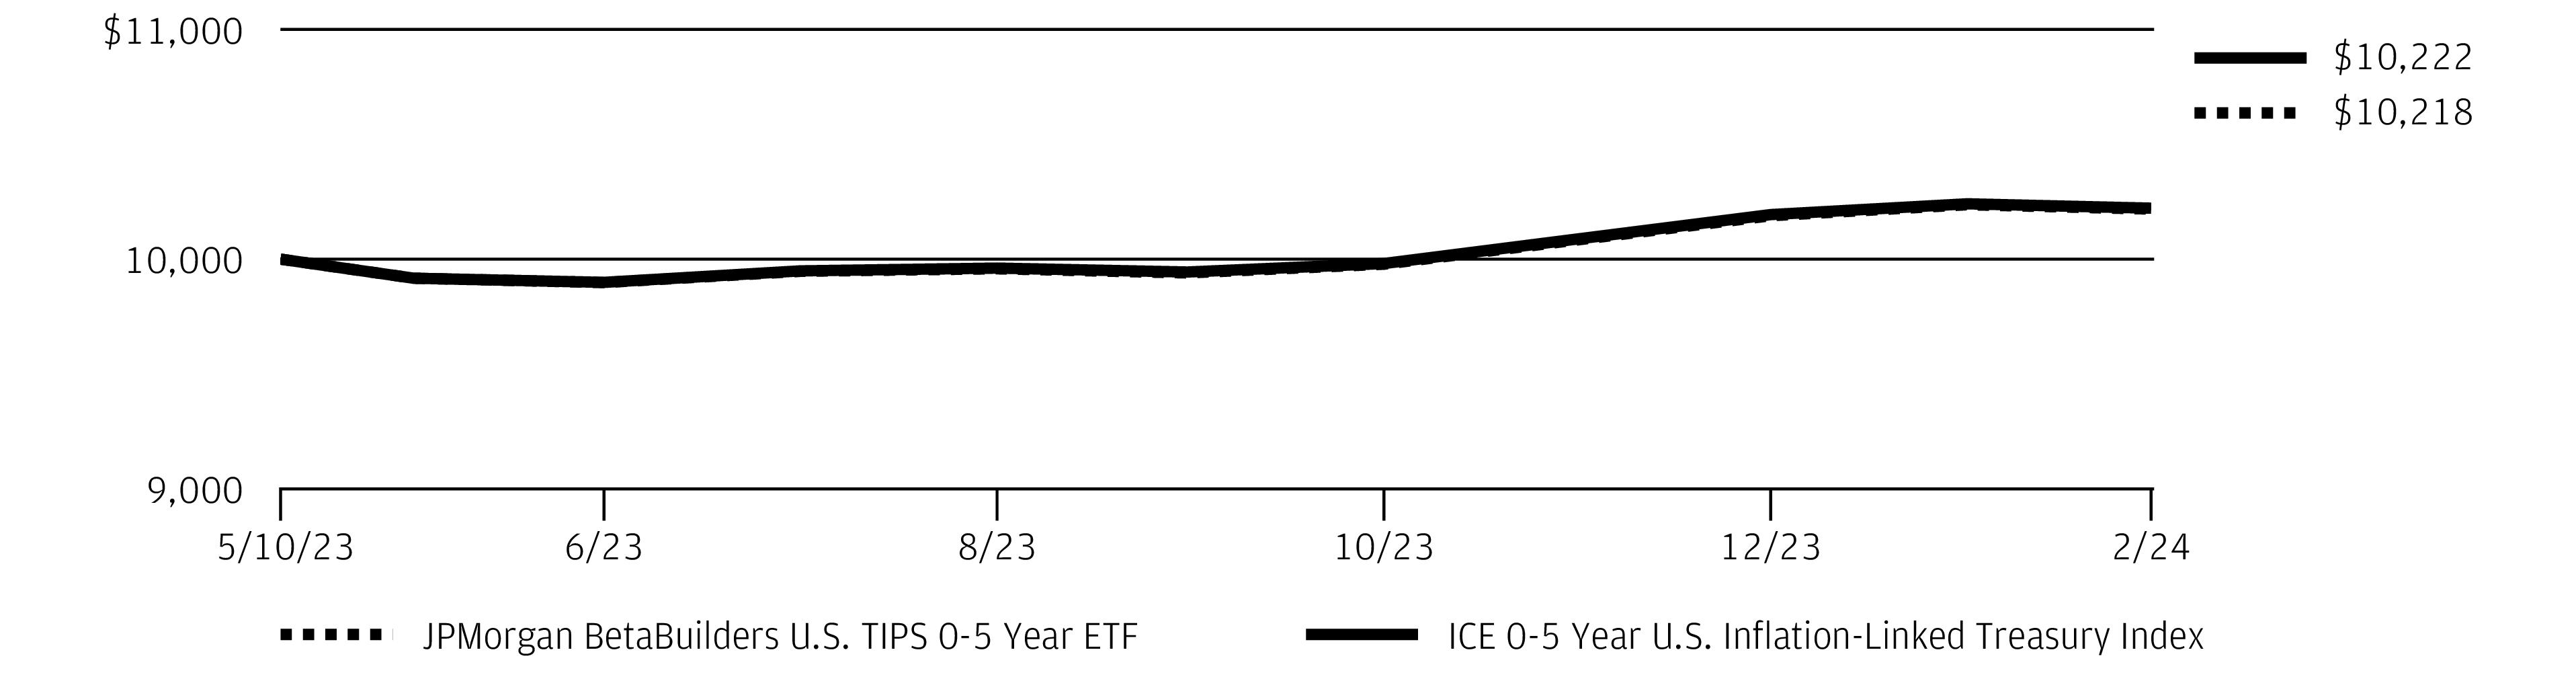
The performance quoted is past performance and is not a guarantee of future results. Exchange-traded funds are subject to certain market risks. Investment returns and principal value of an investment will fluctuate so that an investor’s shares, when sold or redeemed, may be worth more or less than their original cost. Current performance may be higher or lower than the performance data shown. Updated performance information is available by visiting www.jpmorganfunds.com or by calling 1-844-457-6383.
Fund commenced operations on May 10, 2023.
The graph illustrates comparative performance for $10,000 invested in shares of the JPMorgan BetaBuilders U.S. TIPS 0-5 Year ETF and the ICE 0-5 Year U.S. Inflation-Linked Treasury Index from May 10, 2023 to February 29, 2024. The performance of the Fund reflects the deduction of Fund expenses and assumes reinvestment of all dividends and capital gain distributions, if any. The ICE 0-5 Year U.S. Inflation-Linked Treasury Index does not reflect the deduction of expenses associated with an exchange-traded fund and has been adjusted to reflect reinvestment of all dividends and capital gain distributions of the securities included in the Index, if applicable. The ICE 0-5 Year U.S. Inflation-Linked Treasury Index tracks the performance of short-maturity US dollar denominated inflation-linked sovereign debt publicly issued by the US government in its domestic market, with a minimum term to maturity of at
least one month but less than or equal to five years. Investors cannot invest directly in an index.
Fund performance shown in this section does not reflect the deduction of taxes that a shareholder may pay on Fund distributions or on gains resulting from redemption or sale of Fund shares.
The returns shown are based on net asset values calculated for shareholder transactions and may differ from the returns shown in the financial highlights, which reflect adjustments made to the net asset values in accordance with accounting principles generally accepted in the United States of America.
Source ICE Data Indices, LLC is used with permission. ICE® is a registered trademark of ICE Data Indices, LLC or its affiliates and BofA® is a registered trademark of Bank of America Corporation licensed by Bank of America Corporation and its affiliates ("BofA"), and may not be used without BofA's prior written approval. The index data referenced herein is the property of ICE Data Indices, LLC, its affiliates (“ICE Data”) and/or its third party suppliers and has been licensed for use by J.P. Morgan Investment Management, Inc. ICE Data and its Third Party Suppliers accept no liability in connection with the use of such index data or marks. See prospectus for a full copy of the Disclaimer.
| J.P. Morgan Exchange-Traded Funds | |
JPMorgan BetaBuilders U.S. Treasury Bond 1-3 Year ETF
FUND COMMENTARYFOR THE PERIOD April 19, 2023 (FUND INCEPTION) THROUGH February 29, 2024 (Unaudited)
| |
| |
| |
ICE U.S. Treasury 1-3 Year Bond Index | |
Net Assets as of 2/29/2024 | |
| |
| |
INVESTMENT OBJECTIVE***
The JPMorgan BetaBuilders U.S. Treasury Bond 1-3 Year ETF (the “Fund”) seeks investment results that closely correspond, before fees and expenses, to the performance of the ICE U.S. Treasury 1-3 Year Bond Index (the “Underlying Index”).
INVESTMENT APPROACH
The Underlying Index measures the performance of U.S. dollar-denominated, fixed rate securities with minimum term to maturity greater than one year and less than or equal to three years. The Fund will invest at least 80% of its assets in securities included in the Underlying Index.
HOW DID THE FUND PERFORM?
For the period from April 19, 2023 to February 29, 2024, the Fund generated a positive return and performed in line with the Underlying Index, before considering the effects of operating expenses, fees and tax management of the Fund’s portfolio.
The Fund’s and Underlying Index’s allocations to U.S. Treasury bonds with 1-3 year maturities contributed to performance as shorter-dated bonds outperformed longer-dated U.S. Treasury bonds amid rising interest rates during the period.
HOW WAS THE FUND POSITIONED?
The Fund was invested in U.S. Treasury bonds rated AAA. At the end of the period, the Fund’s duration was 1.89 years compared with 1.88 years at August 31, 2023.
PORTFOLIO COMPOSITION
AS OF February 29, 2024 | PERCENT OF
TOTAL
INVESTMENTS |
U.S. Treasury Obligations | |
| |
*
The return shown is based on net asset value and may differ from the return shown in the financial highlights, which reflects adjustments made to the net asset value in accordance with accounting principles generally accepted in the United States of America. The net asset value was $98.28 as of February 29, 2024.
**
Market price return was calculated assuming an initial investment made at the inception date net asset value, reinvestment of all dividends and distributions at the market price during the period, and sale at the market price on the last day of the period. The price used to calculate the market price return was the closing price on the Cboe BZX Exchange, Inc. As of February 29, 2024, the closing price was $98.33.
***
The adviser seeks to achieve the Fund’s objective. There can be no guarantee it will be achieved.
| J.P. Morgan Exchange-Traded Funds | |
JPMorgan BetaBuilders U.S. Treasury Bond 1-3 Year ETF
FUND COMMENTARYFOR THE PERIOD April 19, 2023 (FUND INCEPTION) THROUGH February 29, 2024 (Unaudited) (continued)
TOTAL RETURNS AS OF February 29, 2024 (Unaudited)
| | CUMULATIVE SINCE INCEPTION |
JPMorgan BetaBuilders U.S. Treasury Bond 1-3 Year ETF | | |
| | |
| | |
LIFE OF FUND PERFORMANCE (4/19/23 TO 2/29/24)
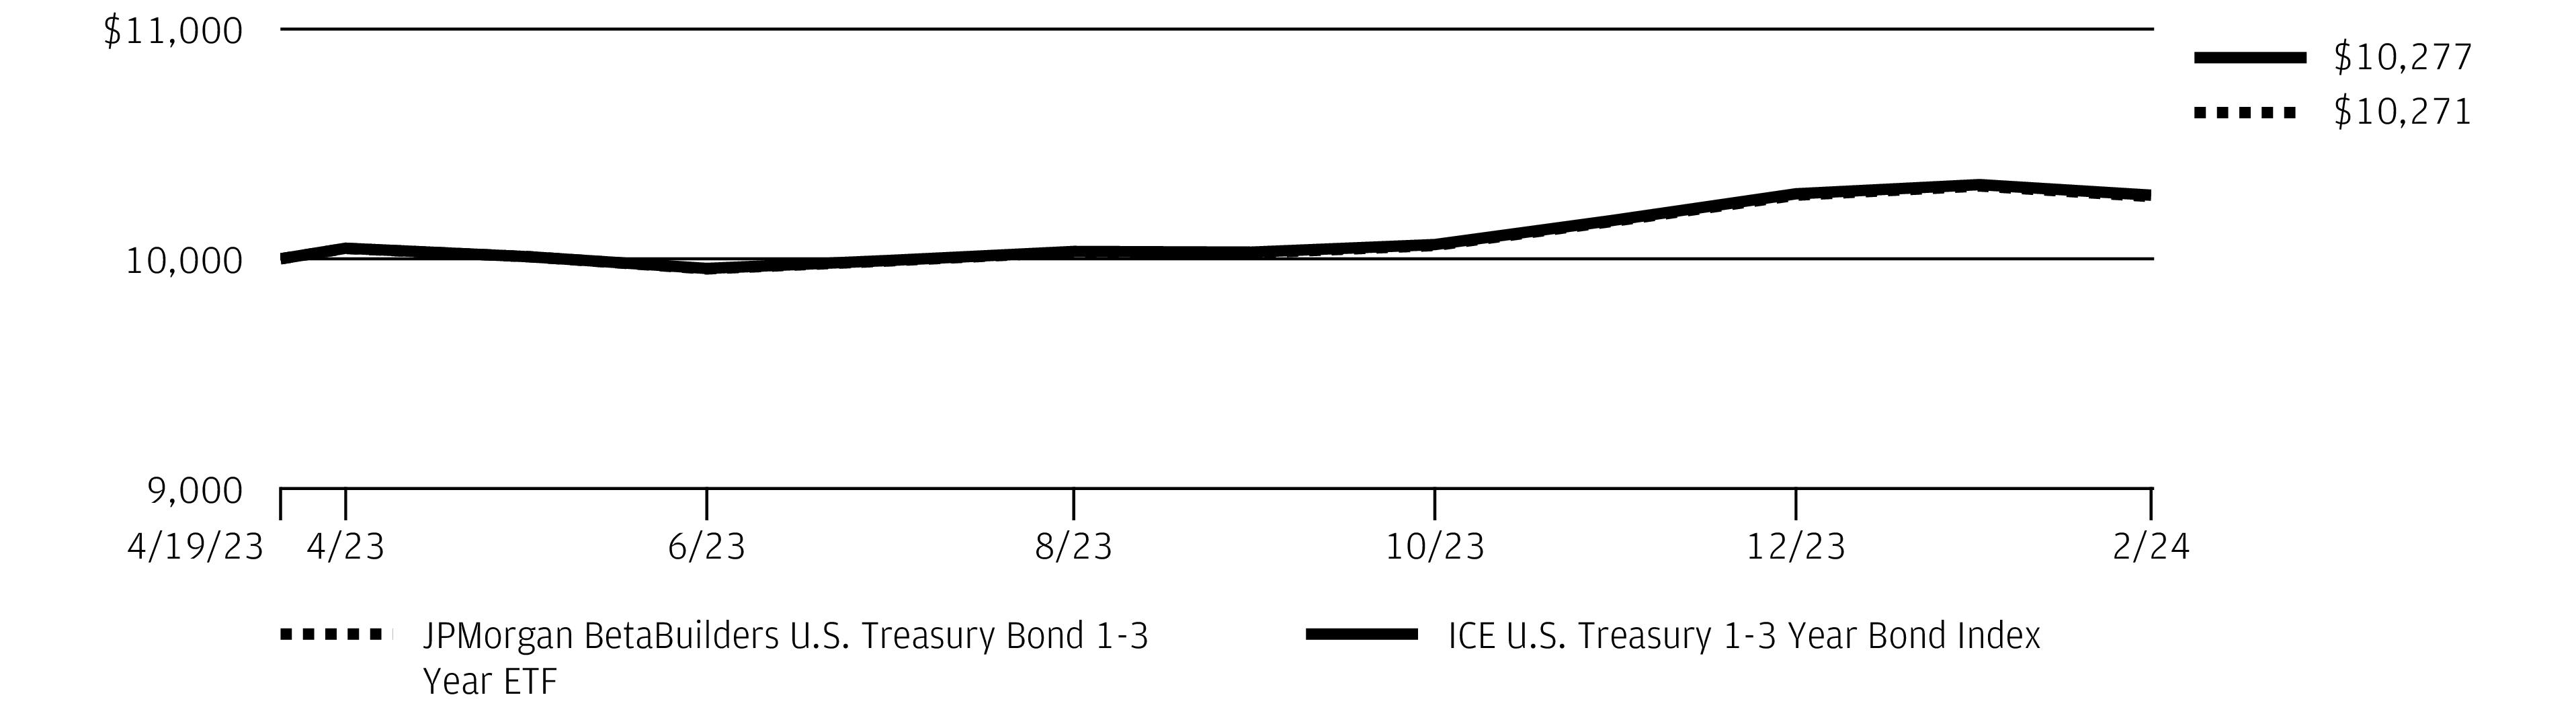
The performance quoted is past performance and is not a guarantee of future results. Exchange-traded funds are subject to certain market risks. Investment returns and principal value of an investment will fluctuate so that an investor’s shares, when sold or redeemed, may be worth more or less than their original cost. Current performance may be higher or lower than the performance data shown. Updated performance information is available by visiting www.jpmorganfunds.com or by calling 1-844-457-6383.
Fund commenced operations on April 19, 2023.
The graph illustrates comparative performance for $10,000 invested in shares of the JPMorgan BetaBuilders U.S. Treasury Bond 1-3 Year ETF and the ICE U.S. Treasury 1-3 Year Bond Index from April 19, 2023 to February 29, 2024. The performance of the Fund reflects the deduction of Fund expenses and assumes reinvestment of all dividends and capital gain distributions, if any. The ICE U.S. Treasury 1-3 Year Bond Index does not reflect the deduction of expenses associated with an exchange-traded fund and has been adjusted to reflect reinvestment of all dividends and capital gain distributions of the securities included in the Index, if applicable. The ICE U.S. Treasury 1-3 Year Bond Index tracks the performance of US dollar denominated sovereign debt publicly issued by the US government in its domestic market, with a minimum term to
maturity greater than one year and less than or equal to three years. Investors cannot invest directly in an index.
Fund performance shown in this section does not reflect the deduction of taxes that a shareholder may pay on Fund distributions or on gains resulting from redemption or sale of Fund shares.
The returns shown are based on net asset values calculated for shareholder transactions and may differ from the returns shown in the financial highlights, which reflect adjustments made to the net asset values in accordance with accounting principles generally accepted in the United States of America.
Source ICE Data Indices, LLC is used with permission. ICE® is a registered trademark of ICE Data Indices, LLC or its affiliates and BofA® is a registered trademark of Bank of America Corporation licensed by Bank of America Corporation and its affiliates ("BofA"), and may not be used without BofA's prior written approval. The index data referenced herein is the property of ICE Data Indices, LLC, its affiliates (“ICE Data”) and/or its third party suppliers and has been licensed for use by J.P. Morgan Investment Management, Inc. ICE Data and its Third Party Suppliers accept no liability in connection with the use of such index data or marks. See prospectus for a full copy of the Disclaimer.
| J.P. Morgan Exchange-Traded Funds | |
JPMorgan BetaBuilders U.S. Treasury Bond 20+ Year ETF
FUND COMMENTARYFOR THE PERIOD April 19, 2023 (FUND INCEPTION) THROUGH February 29, 2024 (Unaudited)
| |
| |
| |
ICE U.S. Treasury 20+ Year Bond Index | |
Net Assets as of 2/29/2024 | |
| |
| |
INVESTMENT OBJECTIVE***
The JPMorgan BetaBuilders U.S. Treasury Bond 20+ Year ETF (the “Fund”) seeks investment results that closely correspond, before fees and expenses, to the performance of the ICE U.S. Treasury 20+ Year Bond Index (the “Underlying Index”).
INVESTMENT APPROACH
The Underlying Index measures the performance of U.S. dollar-denominated, fixed rate securities with minimum term to maturity greater than 20 years. The Fund will invest at least 80% of its assets in securities included in the Underlying Index.
HOW DID THE FUND PERFORM?
For the period from April 19, 2023 to February 29, 2024, the Fund generated a negative return and performed in line with the Underlying Index, before considering the effects of operating expenses, fees and tax management of the Fund’s portfolio.
The Fund’s and the Underlying Index’s allocations to U.S. Treasury bonds with 20+ year maturities detracted from performance amid moderately rising interest rates during the period.
HOW WAS THE FUND POSITIONED?
The Fund was invested in U.S. Treasury bonds rated AAA. At the end of the period, the Fund’s duration was 16.9 years compared with 17.2 years at the August 31, 2023.
PORTFOLIO COMPOSITION
AS OF February 29, 2024 | PERCENT OF
TOTAL
INVESTMENTS |
U.S. Treasury Obligations | |
| |
*
The return shown is based on net asset value and may differ from the return shown in the financial highlights, which reflects adjustments made to the net asset value in accordance with accounting principles generally accepted in the United States of America. The net asset value was $89.86 as of February 29, 2024.
**
Market price return was calculated assuming an initial investment made at the inception date net asset value, reinvestment of all dividends and distributions at the market price during the period, and sale at the market price on the last day of the period. The price used to calculate the market price return was the closing price on the Cboe BZX Exchange, Inc. As of February 29, 2024, the closing price was $89.85.
***
The adviser seeks to achieve the Fund’s objective. There can be no guarantee it will be achieved.
****
Amount rounds to less than 0.1%.
| J.P. Morgan Exchange-Traded Funds | |
JPMorgan BetaBuilders U.S. Treasury Bond 20+ Year ETF
FUND COMMENTARYFOR THE PERIOD April 19, 2023 (FUND INCEPTION) THROUGH February 29, 2024 (Unaudited) (continued)
TOTAL RETURNS AS OF February 29, 2024 (Unaudited)
| | CUMULATIVE SINCE INCEPTION |
JPMorgan BetaBuilders U.S. Treasury Bond 20+ Year ETF | | |
| | |
| | |
LIFE OF FUND PERFORMANCE (4/19/23 TO 2/29/24)
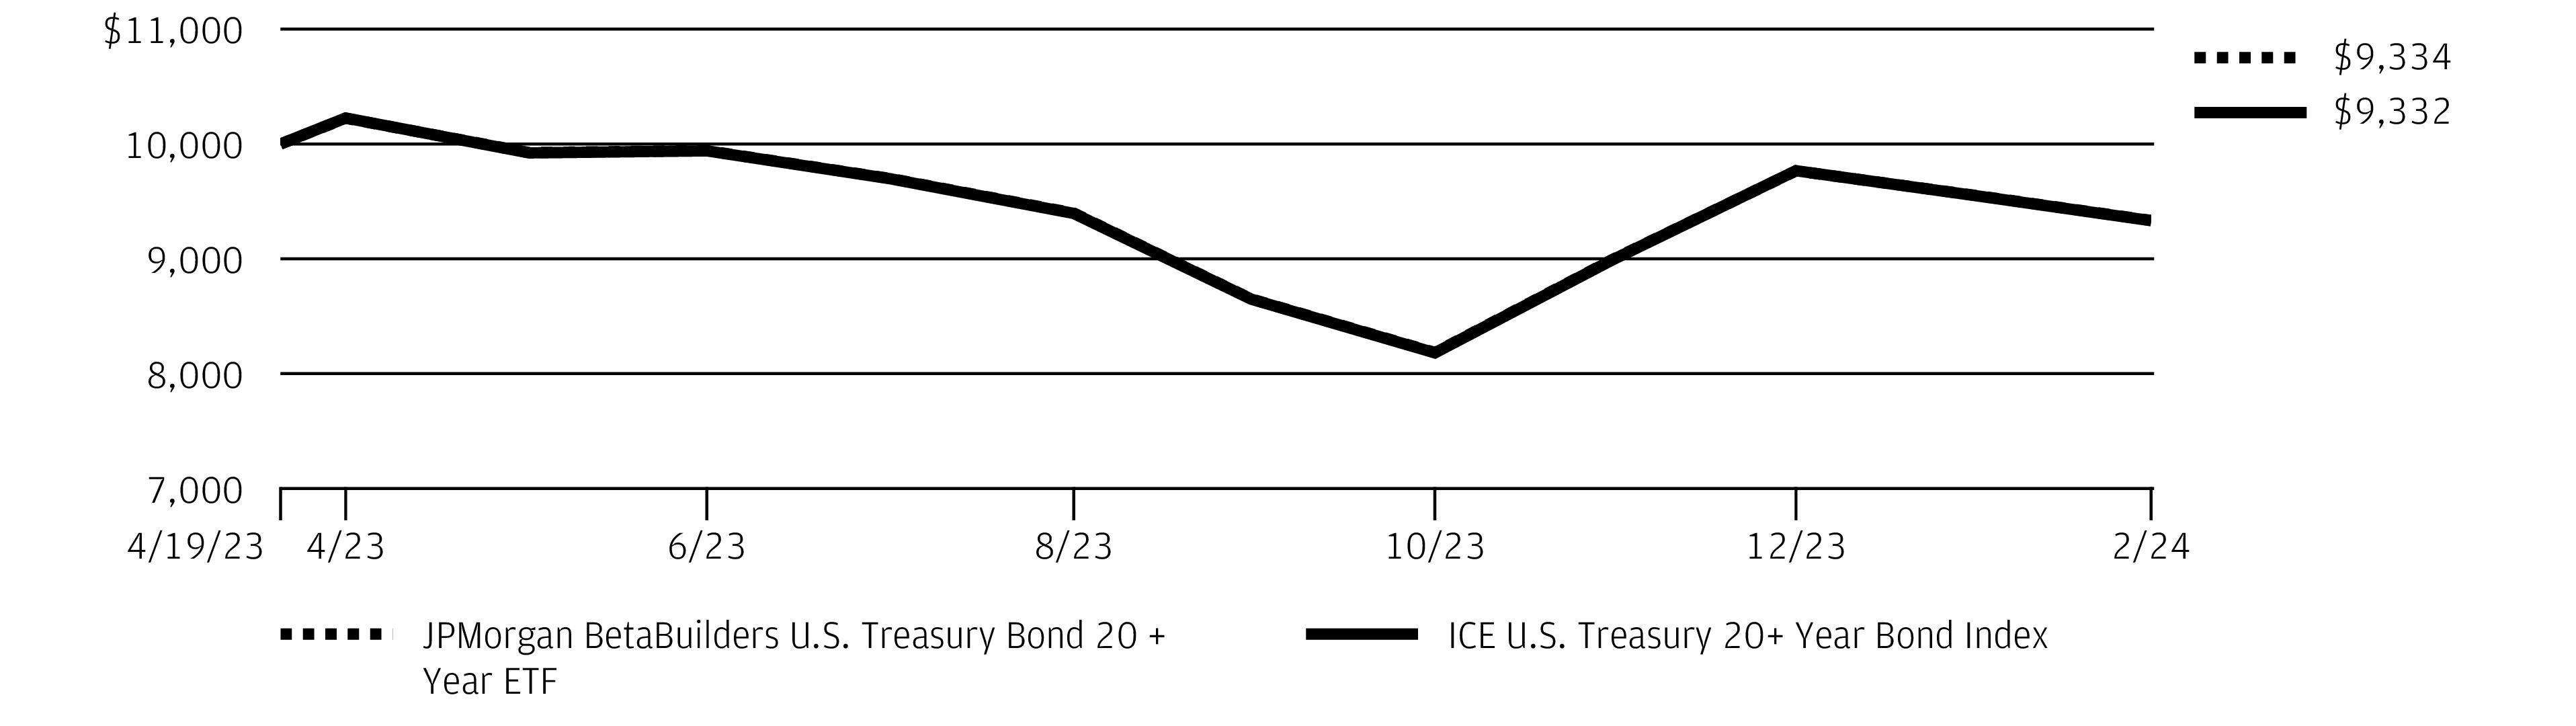
The performance quoted is past performance and is not a guarantee of future results. Exchange-traded funds are subject to certain market risks. Investment returns and principal value of an investment will fluctuate so that an investor’s shares, when sold or redeemed, may be worth more or less than their original cost. Current performance may be higher or lower than the performance data shown. Updated performance information is available by visiting www.jpmorganfunds.com or by calling 1-844-457-6383.
Fund commenced operations on April 19, 2023.
The graph illustrates comparative performance for $10,000 invested in shares of the JPMorgan BetaBuilders U.S. Treasury Bond 20+ Year ETF and the ICE U.S. Treasury 20+ Year Bond Index from April 19, 2023 to February 29, 2024. The performance of the Fund reflects the deduction of Fund expenses and assumes reinvestment of all dividends and capital gain distributions, if any. The ICE U.S. Treasury 20+ Year Bond Index does not reflect the deduction of expenses associated with an exchange-traded fund and has been adjusted to reflect reinvestment of all dividends and capital gain distributions of the securities included in the Index, if applicable. The ICE U.S. Treasury 20+ Year Bond Index tracks the performance of US dollar denominated sovereign debt publicly issued by the US government in its domestic market, with a minimum
term to maturity greater than or equal to twenty years. Investors cannot invest directly in an index.
Fund performance shown in this section does not reflect the deduction of taxes that a shareholder may pay on Fund distributions or on gains resulting from redemption or sale of Fund shares.
The returns shown are based on net asset values calculated for shareholder transactions and may differ from the returns shown in the financial highlights, which reflect adjustments made to the net asset values in accordance with accounting principles generally accepted in the United States of America.
Source ICE Data Indices, LLC is used with permission. ICE® is a registered trademark of ICE Data Indices, LLC or its affiliates and BofA® is a registered trademark of Bank of America Corporation licensed by Bank of America Corporation and its affiliates ("BofA"), and may not be used without BofA's prior written approval. The index data referenced herein is the property of ICE Data Indices, LLC, its affiliates (“ICE Data”) and/or its third party suppliers and has been licensed for use by J.P. Morgan Investment Management, Inc. ICE Data and its Third Party Suppliers accept no liability in connection with the use of such index data or marks. See prospectus for a full copy of the Disclaimer.
| J.P. Morgan Exchange-Traded Funds | |
JPMorgan BetaBuilders U.S. Treasury Bond 3-10 Year ETF
FUND COMMENTARYFOR THE PERIOD April 19, 2023 (FUND INCEPTION) THROUGH February 29, 2024 (Unaudited)
| |
| |
| |
ICE U.S. Treasury 3-10 Year Bond Index | |
Net Assets as of 2/29/2024 | |
| |
| |
INVESTMENT OBJECTIVE***
The JPMorgan BetaBuilders U.S. Treasury Bond 3-10 Year ETF (the “Fund”) seeks investment results that closely correspond, before fees and expenses, to the performance of the ICE U.S. Treasury 3-10 Year Bond Index (the “Underlying Index”).
INVESTMENT APPROACH
The Underlying Index measures the performance of U.S. dollar-denominated, fixed rate securities with minimum term to maturity greater than three years and less than or equal to ten years. The Fund will invest at least 80% of its assets in securities included in the Underlying Index.
HOW DID THE FUND PERFORM?
For the period from April 19, 2023 to February 29, 2024, the Fund generated a positive return and performed in line with the Underlying Index, before considering the effects of operating expenses, fees and tax management of the Fund’s portfolio.
The Fund’s and the Underlying Index’s allocations to U.S. Treasury bonds with 3-10 year maturities contributed to performance amid elevated but stable interest rates during the period.
HOW WAS THE FUND POSITIONED?
The Fund was invested in U.S. Treasury bonds rated AAA. At the end of the period, the Fund’s duration was 5.02 years, compared with 5.09 years at August 31, 2023.
PORTFOLIO COMPOSITION
AS OF February 29, 2024 | PERCENT OF
TOTAL
INVESTMENTS |
U.S. Treasury Obligations | |
| |
*
The return shown is based on net asset value and may differ from the return shown in the financial highlights, which reflects adjustments made to the net asset value in accordance with accounting principles generally accepted in the United States of America. The net asset value was $96.91 as of February 29, 2024.
**
Market price return was calculated assuming an initial investment made at the inception date net asset value, reinvestment of all dividends and distributions at the market price during the period, and sale at the market price on the last day of the period. The price used to calculate the market price return was the closing price on the Cboe BZX Exchange, Inc. As of February 29, 2024, the closing price was $96.95.
***
The adviser seeks to achieve the Fund’s objective. There can be no guarantee it will be achieved.
| J.P. Morgan Exchange-Traded Funds | |
JPMorgan BetaBuilders U.S. Treasury Bond 3-10 Year ETF
FUND COMMENTARYFOR THE PERIOD April 19, 2023 (FUND INCEPTION) THROUGH February 29, 2024 (Unaudited) (continued)
TOTAL RETURNS AS OF February 29, 2024 (Unaudited)
| | CUMULATIVE SINCE INCEPTION |
JPMorgan BetaBuilders U.S. Treasury Bond 3-10 Year ETF | | |
| | |
| | |
LIFE OF FUND PERFORMANCE (4/19/23 TO 2/29/24)
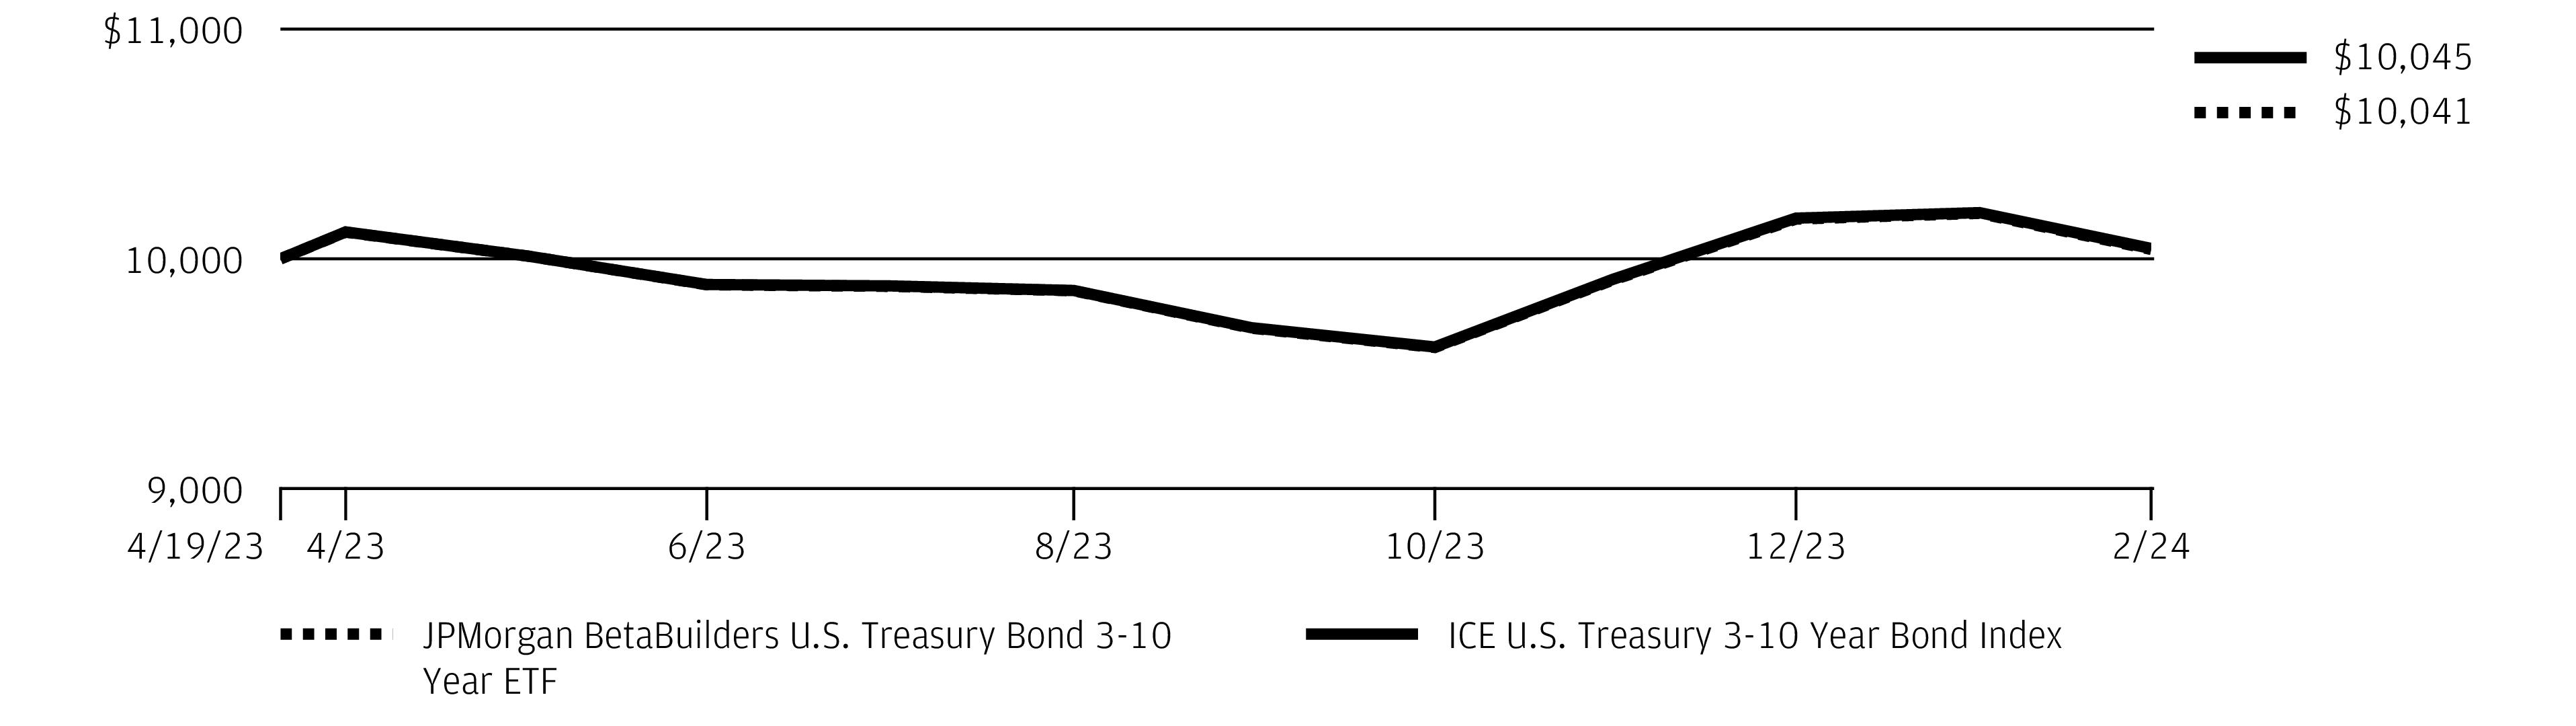
The performance quoted is past performance and is not a guarantee of future results. Exchange-traded funds are subject to certain market risks. Investment returns and principal value of an investment will fluctuate so that an investor’s shares, when sold or redeemed, may be worth more or less than their original cost. Current performance may be higher or lower than the performance data shown. Updated performance information is available by visiting www.jpmorganfunds.com or by calling 1-844-457-6383.
Fund commenced operations on April 19, 2023.
The graph illustrates comparative performance for $10,000 invested in shares of the JPMorgan BetaBuilders U.S. Treasury Bond 3-10 Year ETF and the ICE U.S. Treasury 3-10 Year Bond Index from April 19, 2023 to February 29, 2024. The performance of the Fund reflects the deduction of Fund expenses and assumes reinvestment of all dividends and capital gain distributions, if any. The ICE U.S. Treasury 3-10 Year Bond Index does not reflect the deduction of expenses associated with an exchange-traded fund and has been adjusted to reflect reinvestment of all dividends and capital gain distributions of the securities included in the Index, if applicable. ICE U.S. Treasury 3-10 Year Bond Index tracks the performance of US dollar denominated sovereign debt publicly issued by the US government in its domestic market, with a minimum term to
maturity greater than three years and less than or equal to ten years. Investors cannot invest directly in an index.
Fund performance shown in this section does not reflect the deduction of taxes that a shareholder may pay on Fund distributions or on gains resulting from redemption or sale of Fund shares.
The returns shown are based on net asset values calculated for shareholder transactions and may differ from the returns shown in the financial highlights, which reflect adjustments made to the net asset values in accordance with accounting principles generally accepted in the United States of America.
Source ICE Data Indices, LLC is used with permission. ICE® is a registered trademark of ICE Data Indices, LLC or its affiliates and BofA® is a registered trademark of Bank of America Corporation licensed by Bank of America Corporation and its affiliates ("BofA"), and may not be used without BofA's prior written approval. The index data referenced herein is the property of ICE Data Indices, LLC, its affiliates (“ICE Data”) and/or its third party suppliers and has been licensed for use by J.P. Morgan Investment Management, Inc. ICE Data and its Third Party Suppliers accept no liability in connection with the use of such index data or marks. See prospectus for a full copy of the Disclaimer.
| J.P. Morgan Exchange-Traded Funds | |
JPMorgan BetaBuilders USD High Yield Corporate Bond ETF
FUND COMMENTARYTWELVE MONTHS ENDED February 29, 2024 (Unaudited)
| |
| |
| |
ICE BofA US High Yield Total Return Index | |
Net Assets as of 2/29/2024 | |
| |
| |
INVESTMENT OBJECTIVE***
The JPMorgan BetaBuilders USD High Yield Corporate Bond ETF (the “Fund”) seeks investment results that closely correspond, before fees and expenses, to the performance of the ICE BofA US High Yield Total Return Index (the “Underlying Index”).
INVESTMENT APPROACH
The Fund uses a "passive" investment approach and attempts to closely correspond to the performance of the Underlying Index, which is designed to measure the performance of U.S. dollar denominated below investment grade corporate debt publicly issued in the U.S.
HOW DID THE FUND PERFORM?
For the twelve months ended February 29, 2024, the Fund generated a positive absolute return and performed in line with the Underlying Index, before considering the effects of operating expenses, fees and tax management of the Fund’s portfolio, and the impact of a legacy restructured equity position held prior to the Fund’s February 1, 2023 conversion to a passively managed exchange-traded fund. Investor demand for higher yielding debt securities during the period drove positive absolute performance for the Fund and the Underlying Index.
HOW WAS THE FUND POSITIONED?
At the end of the period, the Fund’s and Underlying Index’s largest allocations were to the consumer cyclical and communications sectors, and the smallest allocations were to the utilities and industrials sectors.
PORTFOLIO COMPOSITION BY INDUSTRY
AS OF February 29, 2024 | PERCENT OF
TOTAL
INVESTMENTS |
Oil, Gas & Consumable Fuels | |
Hotels, Restaurants & Leisure | |
| |
Diversified Telecommunication Services | |
Health Care Providers & Services | |
| |
Commercial Services & Supplies | |
| |
| |
| |
| |
| |
| |
| |
| |
| |
| |
| |
Energy Equipment & Services | |
Trading Companies & Distributors | |
| |
| |
| |
| |
| |
| |
| |
Wireless Telecommunication Services | |
Consumer Staples Distribution & Retail | |
Health Care Equipment & Supplies | |
Others (each less than 1.0%) | |
| |
*
The return shown is based on net asset value and may differ from the return shown in the financial highlights, which reflects adjustments made to the net asset value in accordance with accounting principles generally accepted in the United States of America. The net asset value was $45.80 as of February 29, 2024.
**
Market price return was calculated assuming an initial investment made at the market price at the beginning of the reporting period, reinvestment of all dividends and distributions at the
| J.P. Morgan Exchange-Traded Funds | |
JPMorgan BetaBuilders USD High Yield Corporate Bond ETF
FUND COMMENTARYTWELVE MONTHS ENDED February 29, 2024 (Unaudited) (continued)
market price during the period, and sale at the market price on the last day of the period. The price used to calculate the market price return was the closing price on the Cboe BZX Exchange, Inc. As of February 29, 2024, the closing price was $45.88.
***
The adviser seeks to achieve the Fund’s objective. There can be no guarantee it will be achieved.
| J.P. Morgan Exchange-Traded Funds | |
AVERAGE ANNUAL TOTAL RETURNS AS OF February 29, 2024 (Unaudited)
| | | | |
JPMorgan BetaBuilders USD High Yield Corporate Bond ETF | | | | |
| | | | |
| | | | |
LIFE OF FUND PERFORMANCE (9/14/16 TO 2/29/24)
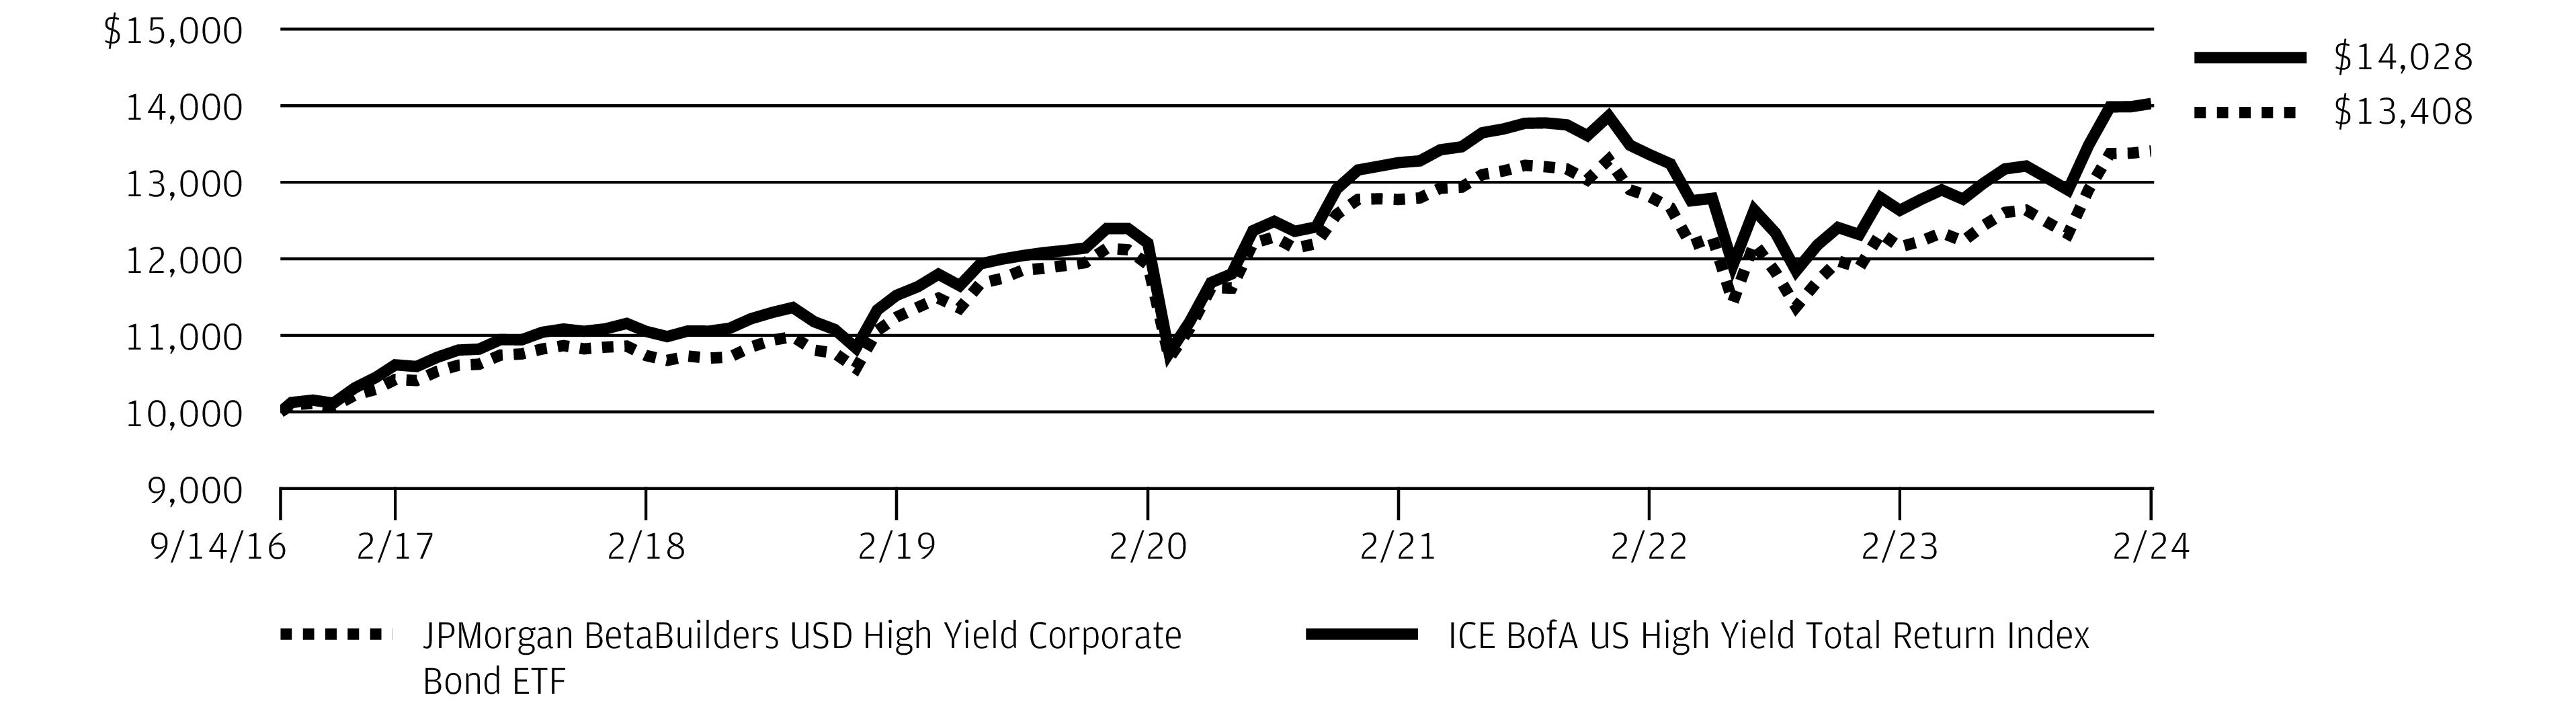
The performance quoted is past performance and is not a guarantee of future results. Exchange-traded funds are subject to certain market risks. Investment returns and principal value of an investment will fluctuate so that an investor’s shares, when sold or redeemed, may be worth more or less than their original cost. Current performance may be higher or lower than the performance data shown. Updated performance information is available by visiting www.jpmorganfunds.com or by calling 1-844-457-6383.
Fund commenced operations on September 14, 2016.
The graph illustrates comparative performance for $10,000 invested in shares of the JPMorgan BetaBuilders USD High Yield Corporate Bond ETF and the ICE BofA US High Yield Total Return Index from September 14, 2016 to February 29, 2024. The performance of the Fund reflects the deduction of Fund expenses and assumes reinvestment of all dividends and capital gain distributions, if any. The performance of the ICE BofA US High Yield Total Return Index does not reflect the deduction of expenses associated with an exchange-traded fund and has been adjusted to reflect reinvestment of all dividends and capital gain distributions of the securities included in the Index, if applicable. The ICE BofA US High Yield Total Return Index tracks the performance of US dollar denominated below investment grade corporate debt publicly issued in the US domestic market. Investors cannot invest directly in an index.
Fund performance reflects waiver of a portion of the Fund’s fees and reimbursement of expenses for certain periods from the Fund’s inception date and prior to implementation of a unitary fee structure on November 19, 2019.
Without these waivers and reimbursements, performance would have been lower. Also, performance shown in this section does not reflect the deduction of taxes that a shareholder may pay on Fund distributions or on gains resulting from redemption or sale of Fund shares.
Effective February 1, 2023, the Fund’s investment strategy and approach were changed to a passively managed portfolio from an actively managed portfolio. Although past performance is not necessarily an indication of how the Fund will perform in the future, in view of these changes, the Fund’s performance record prior to this date may be less relevant for investors considering whether to purchase shares of the Fund.
The returns shown are based on net asset values calculated for shareholder transactions and may differ from the returns shown in the financial highlights, which reflect adjustments made to the net asset values in accordance with accounting principles generally accepted in the United States of America.
Source ICE Data Indices, LLC is used with permission. ICE® is a registered trademark of ICE Data Indices, LLC or its affiliates and BofA® is a registered trademark of Bank of America Corporation licensed by Bank of America Corporation and its affiliates ("BofA"), and may not be used without BofA's prior written approval. The index data referenced herein is the property of ICE Data Indices, LLC, its affiliates (“ICE Data”) and/or its third party suppliers and has been licensed for use by J.P. Morgan Investment Management, Inc. ICE Data and its Third Party Suppliers accept no liability in connection with the use of such index data or marks. See prospectus for a full copy of the Disclaimer.
| J.P. Morgan Exchange-Traded Funds | |
JPMorgan BetaBuilders USD Investment Grade Corporate Bond ETF
FUND COMMENTARYTWELVE MONTHS ENDED February 29, 2024 (Unaudited)
| |
| |
| |
Bloomberg U.S. Corporate Index | |
Net Assets as of 2/29/2024 | |
| |
| |
INVESTMENT OBJECTIVE***
The JPMorgan BetaBuilders USD Investment Grade Corporate Bond ETF (the “Fund”) seeks investment results that closely correspond, before fees and expenses, to the performance of the Bloomberg U.S. Corporate Index (the “Underlying Index”).
INVESTMENT APPROACH
The Fund seeks investment results that closely correspond, before fees and expenses, to the performance of the Underlying Index, which measures the investment grade, fixed-rate, taxable corporate bond market and includes U.S. dollar denominated securities publicly issued by U.S. and non-U.S. industrial, utility and financial issuers.
HOW DID THE FUND PERFORM?
For the twelve months ended February 29, 2024, the Fund had a positive return and performed in line with the Underlying Index before considering the effects of operating expenses, fees and tax management of the Fund’s portfolio.
While the Fund’s allocations were largely consistent with the Underlying Index’s during the period, the Fund is prohibited from holding J.P. Morgan Chase & Co. bonds because it is an affiliate, which was a leading detractor from performance relative to the Underlying Index. The Fund’s and Underlying Index’s exposures to investment grade bonds contributed to absolute performance.
HOW WAS THE FUND POSITIONED?
At February 29, 2024, the Fund’s and the Underlying Index’s largest allocations were to the financial institutions and consumer non-cyclical sectors, and their smallest allocations were to the other industrial and transportation sectors.
PORTFOLIO COMPOSITION
AS OF February 29, 2024 | PERCENT OF
TOTAL
INVESTMENTS |
| |
| |
*
The return shown is based on net asset value and may differ from the return shown in the financial highlights, which reflects adjustments made to the net asset value in accordance with accounting principles generally accepted in the United States of America. The net asset value was $45.16 as of February 29, 2024.
**
Market price return was calculated assuming an initial investment made at the market price at the beginning of the reporting period, reinvestment of all dividends and distributions at the market price during the period, and sale at the market price on the last day of the period. The price used to calculate the market price return was the closing price on the NYSE Arca, Inc. As of February 29, 2024, the closing price was $45.15.
***
The adviser seeks to achieve the Fund’s objective. There can be no guarantee it will be achieved.
| J.P. Morgan Exchange-Traded Funds | |
AVERAGE ANNUAL TOTAL RETURNS AS OF February 29, 2024 (Unaudited)
| | | | |
JPMorgan BetaBuilders USD Investment Grade Corporate Bond ETF | | | | |
| | | | |
| | | | |
LIFE OF FUND PERFORMANCE (12/12/18 TO 2/29/24)
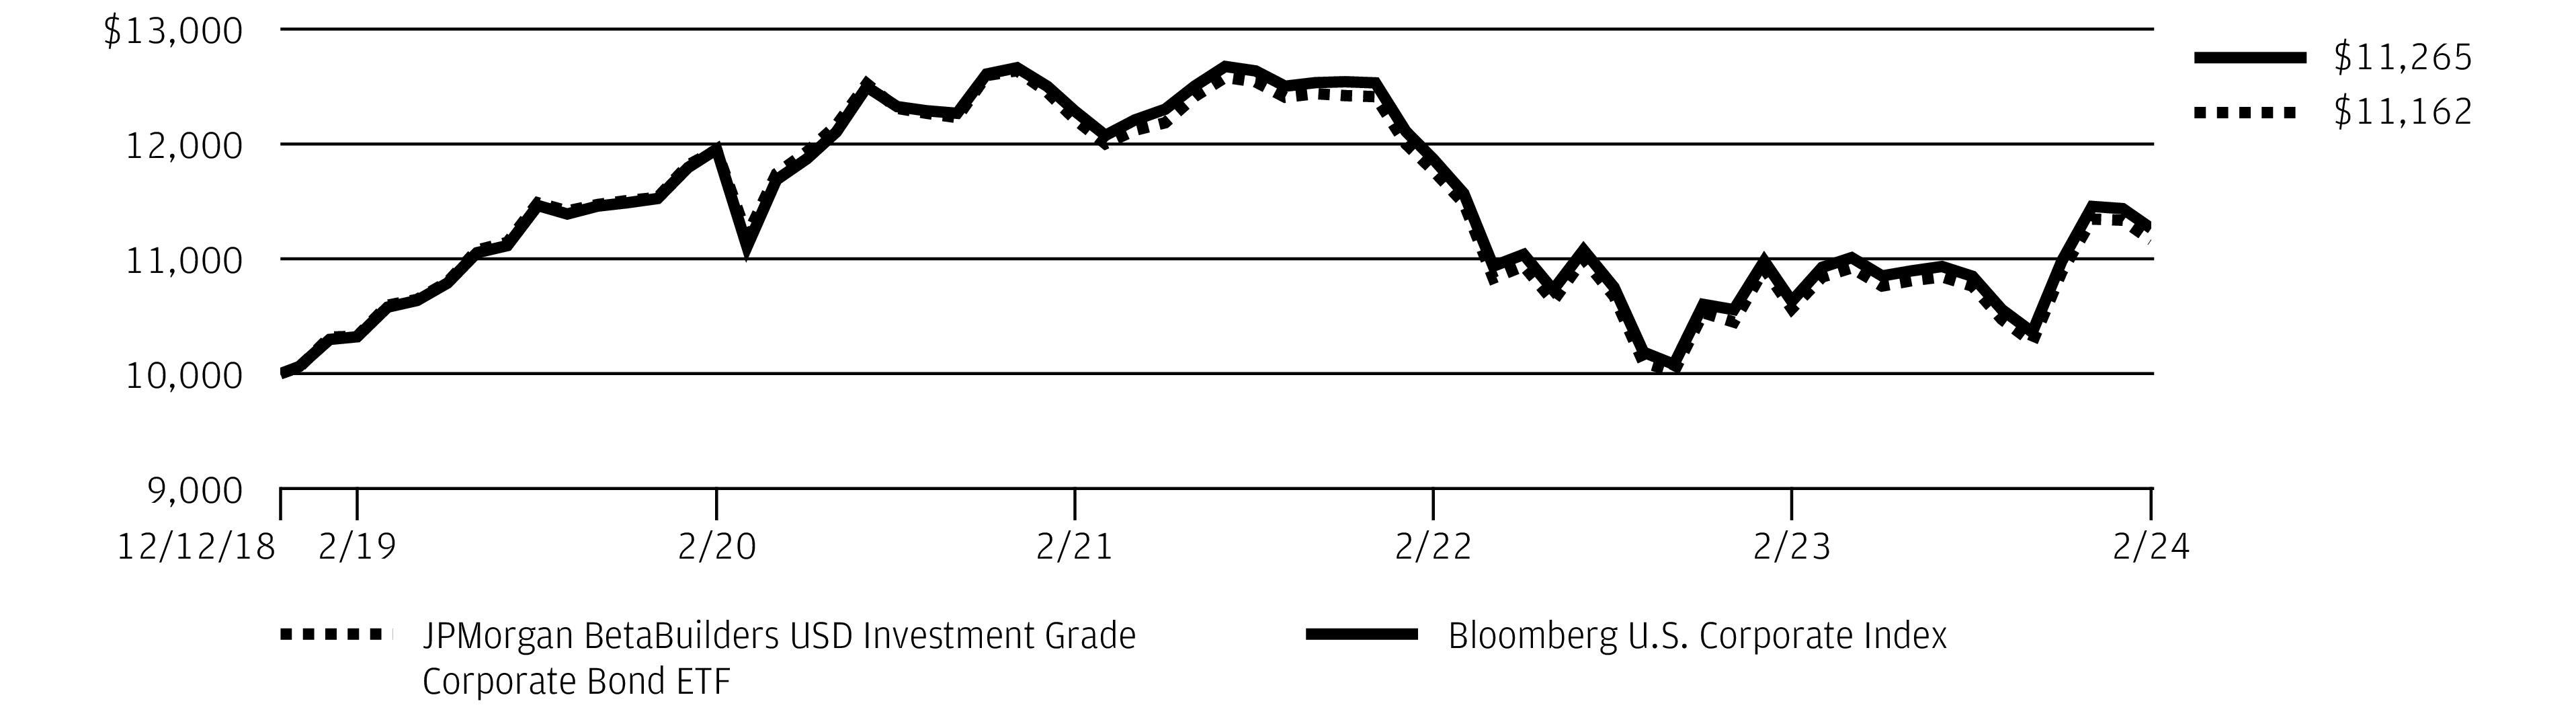
The performance quoted is past performance and is not a guarantee of future results. Exchange-traded funds are subject to certain market risks. Investment returns and principal value of an investment will fluctuate so that an investor’s shares, when sold or redeemed, may be worth more or less than their original cost. Current performance may be higher or lower than the performance data shown. Updated performance information is available by visiting www.jpmorganfunds.com or by calling 1-844-457-6383.
Fund commenced operations on December 12, 2018.
The graph illustrates comparative performance for $10,000 invested in shares of the JPMorgan Corporate Bond Research Enhanced ETF and the Bloomberg U.S. Corporate Index from December 12, 2018 to February 29, 2024. The performance of the Fund reflects the deduction of Fund expenses and assumes reinvestment of all dividends and capital gain distributions, if any. The performance of the Bloomberg U.S. Corporate Index does not reflect the deduction of expenses associated with an exchange-traded fund and has been adjusted to reflect reinvestment of all dividends and capital gain distributions of the securities included in the Index, if applicable. The Bloomberg U.S. Corporate Index broadly measures the investment grade, fixed-rate, taxable, corporate bond market. It includes USD denominated securities publicly issued by U.S. and non-U.S. industrial, utility, and financial issuers that meet specified maturity, liquidity, and quality requirements. Securities in the index roll up to the U.S. Credit and U.S. Aggregate Indices. Investors cannot invest directly in an index.
Fund performance reflects waiver of a portion of the Fund’s fees and reimbursement of expenses for certain periods from the Fund’s inception date
and prior to implementation of a unitary fee structure on November 19, 2019. Without these waivers and reimbursements, performance would have been lower. Also, performance shown in this section does not reflect the deduction of taxes that a shareholder may pay on Fund distributions or on gains resulting from redemption or sale of Fund shares.
Effective February 1, 2023, the Fund’s investment strategy and approach were changed to a passively managed portfolio from an actively managed portfolio. Although past performance is not necessarily an indication of how the Fund will perform in the future, in view of these changes, the Fund’s performance record prior to this date may be less relevant for investors considering whether to purchase shares of the Fund.
The returns shown are based on net asset values calculated for shareholder transactions and may differ from the returns shown in the financial highlights, which reflect adjustments made to the net asset values in accordance with accounting principles generally accepted in the United States of America.
Source: Bloomberg Index Services Limited. BLOOMBERG® is a trademark and service mark of Bloomberg Finance L.P. and its affiliates (collectively "Bloomberg"). Bloomberg or Bloomberg's licensors own all proprietary rights in the Bloomberg Indices. Bloomberg does not approve or endorse this material, or guarantee the accuracy or completeness of any information herein, or make any warranty, express or implied, as to the results to be obtained therefrom and, to the maximum extent allowed by law, shall have any liability or responsibility for injury or damages arising in connection therewith.
| J.P. Morgan Exchange-Traded Funds | |
JPMorgan USD Emerging Markets Sovereign Bond ETF
FUND COMMENTARYTWELVE MONTHS ENDED February 29, 2024 (Unaudited)
| |
| |
| |
JPMorgan Emerging Markets Risk-Aware Bond Index | |
Net Assets as of 2/29/2024 | |
| |
| |
INVESTMENT OBJECTIVE***
The JPMorgan USD Emerging Markets Sovereign Bond ETF (the “Fund”) seeks investment results that closely correspond, before fees and expenses, to the performance of the JPMorgan Emerging Markets Risk-Aware Bond Index (the “Underlying Index”).
INVESTMENT APPROACH
The Fund is passively managed to the Underlying Index, which is comprised of liquid, U.S. dollar-denominated sovereign and quasi-sovereign fixed and floating rate debt securities from emerging markets. The Underlying Index utilizes a rules-based, proprietary methodology that filters for liquidity and country risk and allocates risk based on credit rating. The Underlying Index methodology includes monthly rebalancing within each country and semi-annually across countries. The Fund also employs stratified sampling and optimization techniques that seek to minimize tracking error to the Underlying Index.
HOW DID THE FUND PERFORM?
For the twelve months ended February 29, 2024, the Fund generated a positive absolute return and performed in line with the Underlying Index before considering the effects of operating expenses, fees and tax management of the Fund’s portfolio.
The performance of the Fund and the Underlying Index benefitted from a rally in bond markets in the final months of 2023. The Fund’s and the Underlying Index’s long duration positions were leading contributors to performance amid investor expectations for lower interest rates in the year ahead. Generally, bonds of longer duration will experience a larger increase in price compared with shorter duration bonds when interest rates fall. The Fund’s and the Underlying Index’s allocations to lower quality bonds also contributed to absolute performance amid investor demand for higher-yielding, lower-rated bonds.
Overall, the Fund’s and the Underlying Index’s exposures to Panama, Turkey and Poland contributed to absolute performance, while their exposures to Angola, Egypt and Oman detracted from absolute performance.
HOW WAS THE FUND POSITIONED?
The Fund invested at least 80% of its assets in securities included in the Underlying Index. Among the largest positions in the Fund and the Underlying Index were Turkey, Mexico and
Oman, while the smallest positions were in Bolivia, Ethiopia and Trinidad & Tobago.
PORTFOLIO COMPOSITION BY COUNTRY
AS OF February 29, 2024 | PERCENT OF
TOTAL
INVESTMENTS |
| |
| |
| |
| |
| |
| |
| |
| |
| |
| |
| |
| |
| |
| |
| |
| |
| |
| |
| |
| |
| |
| |
| |
| |
| |
| |
| |
Others (each less than 1.0%) | |
| |
*
The return shown is based on net asset value and may differ from the return shown in the financial highlights, which reflects adjustments made to the net asset value in accordance with accounting principles generally accepted in the United States of America. The net asset value was $38.92 as of February 29, 2024.
**
Market price return was calculated assuming an initial investment made at the market price at the beginning of the reporting period, reinvestment of all dividends and distributions at the market price during the period, and sale at the market price on
| J.P. Morgan Exchange-Traded Funds | |
the last day of the period. The price used to calculate the market price return was the closing price on the NYSE Arca, Inc. As of February 29, 2024, the closing price was $38.95.
***
The adviser seeks to achieve the Fund’s objective. There can be no guarantee it will be achieved.
| J.P. Morgan Exchange-Traded Funds | |
JPMorgan USD Emerging Markets Sovereign Bond ETF
FUND COMMENTARYTWELVE MONTHS ENDED February 29, 2024 (Unaudited) (continued)
AVERAGE ANNUAL TOTAL RETURNS AS OF February 29, 2024 (Unaudited)
| | | | |
JPMorgan USD Emerging Markets Sovereign Bond ETF | | | | |
| | | | |
| | | | |
LIFE OF FUND PERFORMANCE (1/29/18 TO 2/29/24)
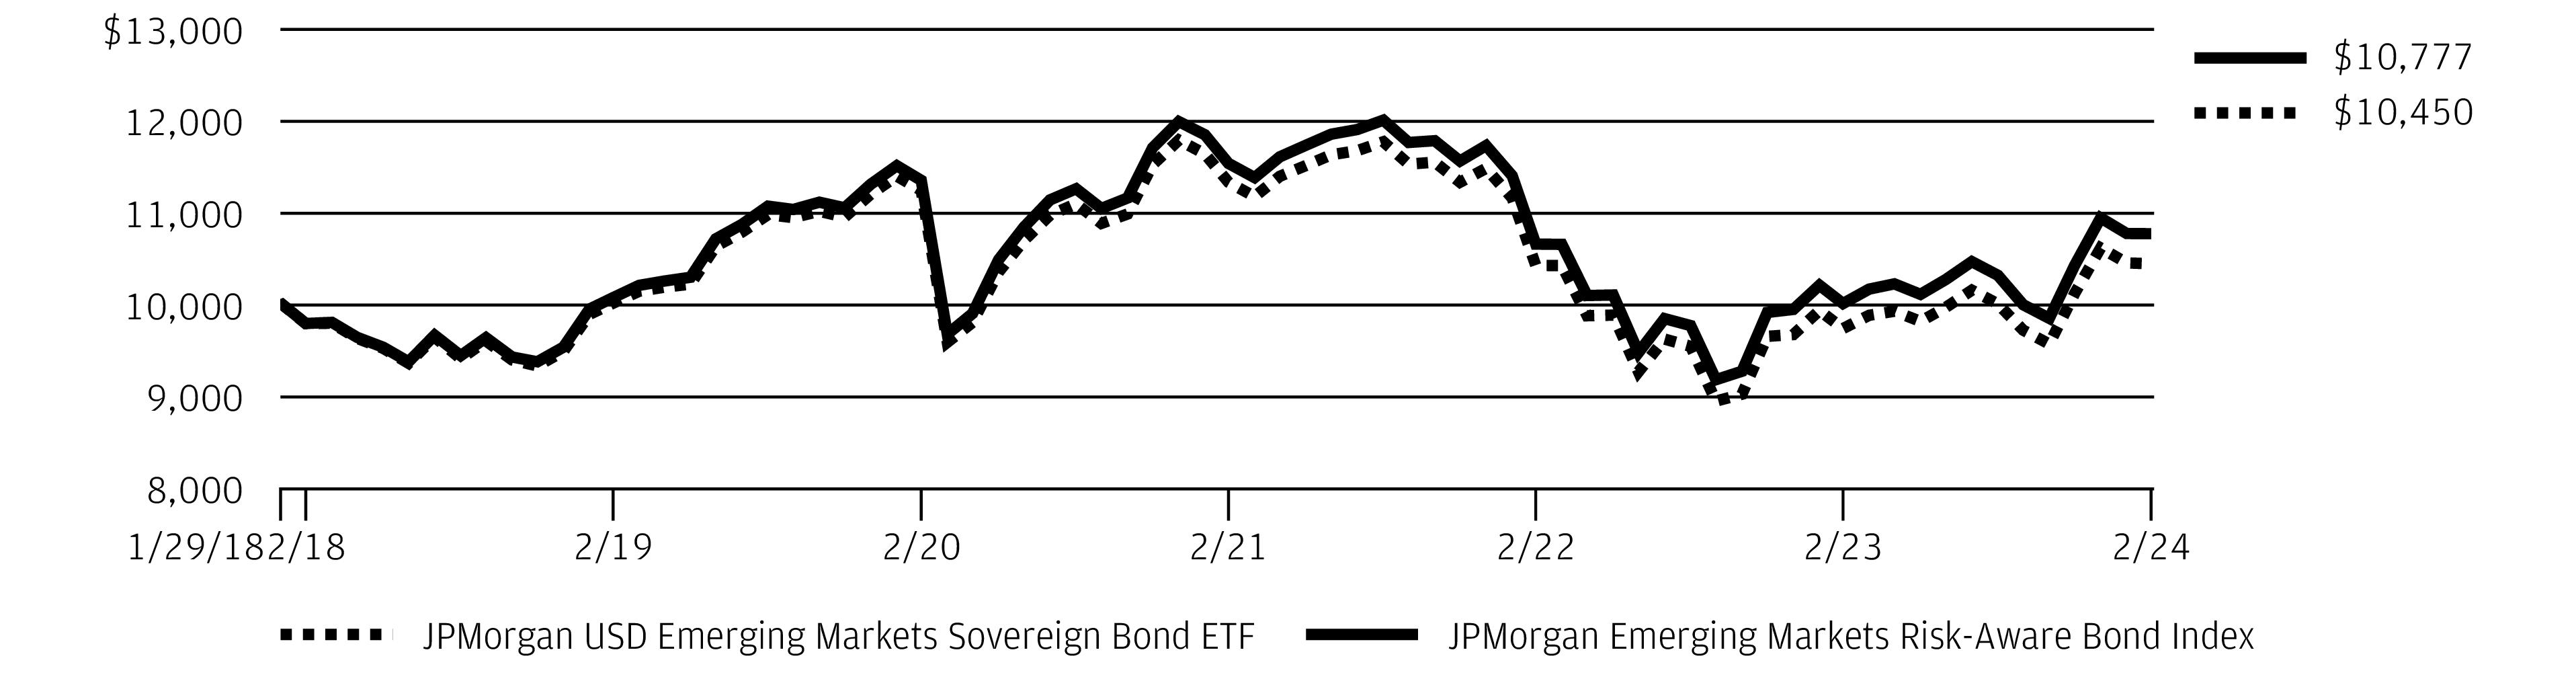
The performance quoted is past performance and is not a guarantee of future results. Exchange-traded funds are subject to certain market risks. Investment returns and principal value of an investment will fluctuate so that an investor’s shares, when sold or redeemed, may be worth more or less than their original cost. Current performance may be higher or lower than the performance data shown. Updated performance information is available by visiting www.jpmorganfunds.com or by calling 1-844-457-6383.
Fund commenced operations on January 29, 2018.
The graph illustrates comparative performance for $10,000 invested in shares of the JPMorgan USD Emerging Markets Sovereign Bond ETF and the JPMorgan Emerging Markets Risk-Aware Bond Index from January 29, 2018 to February 29, 2024. The performance of the Fund reflects the deduction of Fund expenses and assumes reinvestment of all dividends and capital gain distributions, if any. The performance of the JPMorgan Emerging Markets Risk-Aware Bond Index does not reflect the deduction of expenses associated with an exchange-traded fund and has been adjusted to reflect reinvestment of all dividends and capital gain distributions of the securities included in the Index, if applicable. The JPMorgan Emerging Markets Risk-Aware Bond Index (the “Index”) is comprised of liquid, U.S. dollar-denominated sovereign and quasi-sovereign fixed and floating rate debt securities from emerging markets selected using a rules-based methodology and is owned by J.P. Morgan Investment Inc., the Fund’s adviser (the “Adviser”). The Index is maintained and calculated by J.P. Morgan Securities LLC (“JPMS” or the “Index Provider”), which selects securities in accordance with the methodology from among the components of the J.P. Morgan Emerging Market Bond Index Global Diversified, which was developed and is maintained by the Index Provider. The Index Provider and the Adviser are both wholly-owned subsidiaries of JPMorgan Chase & Co., a publicly-held financial services holding company. The Index starts with the J.P. Morgan Emerging Market Bond Index Global Diversified and applies a proprietary methodology that filters for liquidity and for country risk and allocates risk based on credit rating. Historically, the J.P. Morgan Emerging Markets Bond
Index Global Diversified has included bonds issued by the countries of Angola, Argentina, Armenia, Azerbaijan, Belize, Bolivia, Brazil, Cameroon, Chile, China, Colombia, Costa Rica, Cote D’Ivoire, Croatia, Dominican Republic, Ecuador, Egypt, El Salvador, Ethiopia, Gabon, Georgia, Ghana, Guatemala, Honduras, Hungary, India, Indonesia, Iraq, Jamaica, Jordan, Kazakhstan, Kenya, Latvia, Lebanon, Lithuania, Malaysia, Mexico, Mongolia, Morocco, Mozambique, Namibia, Nigeria, Oman, Pakistan, Panama, Paraguay, Peru, Philippines, Poland, Romania, Russian Federation, Senegal, Serbia, Slovakia, South Africa, Sri Lanka, Suriname, Trinidad and Tobago, Tunisia, Turkey, Ukraine, Uruguay, Venezuela, Vietnam, Zambia; however, this universe of countries may change in accordance with the Index Provider’s determination of eligible emerging market countries and there is no assurance that a particular country will be represented in the Underlying Index at any given time. Investors cannot invest directly in an index.
Fund performance reflects waiver of a portion of the Fund’s fees and reimbursement of expenses for certain periods from the Fund’s inception date and prior to implementation of a unitary fee structure on November 19, 2019. Without these waivers and reimbursements, performance would have been lower. Also, performance shown in this section does not reflect the deduction of taxes that a shareholder may pay on Fund distributions or on gains resulting from redemption or sale of Fund shares.
The returns shown are based on net asset values calculated for shareholder transactions and may differ from the returns shown in the financial highlights, which reflect adjustments made to the net asset values in accordance with accounting principles generally accepted in the United States of America.
Information has been obtained from sources believed to be reliable but J.P. Morgan does not warrant its completeness or accuracy. The Index is used with permission. The Index may not be copied, used, or distributed without J.P. Morgan's prior written approval. Copyright [2016], J.P. Morgan Chase & Co. All rights reserved.
| J.P. Morgan Exchange-Traded Funds | |
JPMorgan BetaBuilders 1-5 Year U.S. Aggregate Bond ETF
SCHEDULE OF PORTFOLIO INVESTMENTSAS OF February 29, 2024
| | |
U.S. Treasury Obligations — 59.0% |
U.S. Treasury Bonds
7.63%, 2/15/2025 | | |
| | |
| | |
| | |
| | |
| | |
| | |
| | |
| | |
| | |
| | |
| | |
| | |
| | |
| | |
| | |
| | |
| | |
| | |
| | |
| | |
| | |
| | |
| | |
| | |
| | |
| | |
| | |
| | |
| | |
| | |
| | |
| | |
| | |
| | |
| | |
| | |
| | |
| | |
| | |
| | |
| | |
| | |
| | |
| | |
| | |
|
| | |
| | |
| | |
| | |
| | |
| | |
| | |
| | |
| | |
| | |
| | |
| | |
| | |
Total U.S. Treasury Obligations
(Cost $9,313,207) | | |
|
Aerospace & Defense — 0.5% |
|
| | |
| | |
HEICO Corp. 5.25%, 8/1/2028 | | |
Leidos, Inc. 3.63%, 5/15/2025 | | |
Lockheed Martin Corp. 3.55%, 1/15/2026 | | |
| | |
|
Ford Motor Co. 6.63%, 10/1/2028 | | |
Toyota Motor Corp. (Japan) |
| | |
| | |
| | |
|
Bangko Sentral ng Pilipinas International Bond (Philippines) 8.60%, 6/15/2027 | | |
|
Series L, 3.95%, 4/21/2025 | | |
(SOFR + 1.01%), 1.20%, 10/24/2026 (a) | | |
Series N, (SOFR + 0.91%), 1.66%, 3/11/2027 (a) | | |
(SOFR + 0.96%), 1.73%, 7/22/2027 (a) | | |
Series L, 4.18%, 11/25/2027 | | |
(SOFR + 1.58%), 4.38%, 4/27/2028 (a) | | |
Bank of Montreal (Canada) |
(SOFR + 0.60%), 0.95%, 1/22/2027 (a) | | |
| | |
SEE NOTES TO FINANCIAL STATEMENTS.
| J.P. Morgan Exchange-Traded Funds | |
JPMorgan BetaBuilders 1-5 Year U.S. Aggregate Bond ETF
SCHEDULE OF PORTFOLIO INVESTMENTSAS OF February 29, 2024 (continued)
| | |
Corporate Bonds — continued |
|
BankUnited, Inc. 4.88%, 11/17/2025 | | |
Barclays plc (United Kingdom) 3.65%, 3/16/2025 | | |
|
| | |
(3-MONTH CME TERM SOFR + 1.41%), 3.52%, 10/27/2028 (a) | | |
(3-MONTH CME TERM SOFR + 1.45%), 4.08%, 4/23/2029 (a) | | |
Citizens Financial Group, Inc. 2.85%, 7/27/2026 | | |
Fifth Third Bancorp (SOFR + 1.36%), 4.06%, 4/25/2028 (a) | | |
HSBC Holdings plc (United Kingdom) (SOFR + 1.29%), 1.59%, 5/24/2027 (a) | | |
KeyCorp 4.15%, 10/29/2025 | | |
Kreditanstalt fuer Wiederaufbau (Germany) |
| | |
| | |
Landwirtschaftliche Rentenbank (Germany) 0.88%, 3/30/2026 | | |
Mitsubishi UFJ Financial Group, Inc. (Japan) |
| | |
| | |
Oesterreichische Kontrollbank AG (Austria) |
| | |
| | |
PNC Financial Services Group, Inc. (The) (SOFR + 1.84%), 5.58%, 6/12/2029 (a) | | |
Regions Financial Corp. 1.80%, 8/12/2028 | | |
Royal Bank of Canada (Canada) 1.20%, 4/27/2026 | | |
Santander Holdings USA, Inc. |
(SOFR + 2.33%), 5.81%, 9/9/2026 (a) | | |
(SOFR + 1.25%), 2.49%, 1/6/2028 (a) | | |
Sumitomo Mitsui Financial Group, Inc. (Japan) |
| | |
| | |
| | |
Toronto-Dominion Bank (The) (Canada) |
| | |
| | |
(USD Swap Semi 5 Year + 2.21%), 3.63%, 9/15/2031 (a) (b) | | |
|
| | |
(SOFR + 1.37%), 4.12%, 6/6/2028 (a) | | |
| | |
|
|
|
Series X, 3.15%, 4/27/2027 | | |
(SOFR + 0.73%), 2.22%, 1/27/2028 (a) | | |
|
| | |
(SOFR + 1.32%), 3.91%, 4/25/2026 (a) | | |
(SOFR + 2.00%), 2.19%, 4/30/2026 (a) | | |
(3-MONTH CME TERM SOFR + 1.43%), 3.20%, 6/17/2027 (a) | | |
| | |
Westpac Banking Corp. (Australia) |
| | |
| | |
| | |
|
Anheuser-Busch Cos. LLC (Belgium) 3.65%, 2/1/2026 | | |
Coca-Cola Co. (The) 1.45%, 6/1/2027 | | |
|
| | |
| | |
|
| | |
| | |
| | |
|
AbbVie, Inc. 3.80%, 3/15/2025 | | |
Amgen, Inc. 1.65%, 8/15/2028 | | |
Baxalta, Inc. 4.00%, 6/23/2025 | | |
| | |
Building Products — 0.0% ^ |
Lennox International, Inc. 1.35%, 8/1/2025 | | |
|
Ameriprise Financial, Inc. 2.88%, 9/15/2026 | | |
|
| | |
| | |
| | |
Bank of New York Mellon Corp. (The) 1.05%, 10/15/2026 | | |
Blue Owl Capital Corp. 2.88%, 6/11/2028 | | |
Charles Schwab Corp. (The) 2.00%, 3/20/2028 | | |
CME Group, Inc. 3.00%, 3/15/2025 | | |
SEE NOTES TO FINANCIAL STATEMENTS.
| J.P. Morgan Exchange-Traded Funds | |
| | |
Corporate Bonds — continued |
Capital Markets — continued |
Deutsche Bank AG (Germany) 4.10%, 1/13/2026 | | |
FactSet Research Systems, Inc. 2.90%, 3/1/2027 | | |
Franklin Resources, Inc. 2.85%, 3/30/2025 | | |
Goldman Sachs Group, Inc. (The) |
(SOFR + 0.80%), 1.43%, 3/9/2027 (a) | | |
(SOFR + 0.91%), 1.95%, 10/21/2027 (a) | | |
(SOFR + 1.11%), 2.64%, 2/24/2028 (a) | | |
(3-MONTH CME TERM SOFR + 1.42%), 3.81%, 4/23/2029 (a) | | |
(3-MONTH CME TERM SOFR + 1.56%), 4.22%, 5/1/2029 (a) | | |
Intercontinental Exchange, Inc. 3.75%, 12/1/2025 | | |
Janus Henderson US Holdings, Inc. 4.88%, 8/1/2025 | | |
|
| | |
(SOFR + 0.72%), 0.99%, 12/10/2026 (a) | | |
| | |
(SOFR + 0.88%), 1.59%, 5/4/2027 (a) | | |
| | |
(3-MONTH CME TERM SOFR + 1.89%), 4.43%, 1/23/2030 (a) | | |
State Street Corp. (SOFR + 0.73%), 2.20%, 2/7/2028 (a) | | |
| | |
|
Air Products and Chemicals, Inc. 1.85%, 5/15/2027 | | |
DuPont de Nemours, Inc. 4.49%, 11/15/2025 | | |
LYB International Finance III LLC 1.25%, 10/1/2025 | | |
| | |
|
American Express Co. 1.65%, 11/4/2026 | | |
American Honda Finance Corp. |
| | |
| | |
| | |
Capital One Financial Corp. (SOFR + 2.06%), 4.93%, 5/10/2028 (a) | | |
Caterpillar Financial Services Corp. 1.10%, 9/14/2027 | | |
| | |
|
Consumer Finance — continued |
PACCAR Financial Corp. 2.00%, 2/4/2027 | | |
Synchrony Financial 3.95%, 12/1/2027 | | |
Toyota Motor Credit Corp. |
| | |
| | |
| | |
Consumer Staples Distribution & Retail — 0.2% |
Costco Wholesale Corp. 1.38%, 6/20/2027 | | |
Dollar General Corp. 3.88%, 4/15/2027 | | |
Kroger Co. (The) 3.50%, 2/1/2026 | | |
Walgreens Boots Alliance, Inc. 3.45%, 6/1/2026 | | |
| | |
Containers & Packaging — 0.2% |
Berry Global, Inc. 1.57%, 1/15/2026 | | |
WRKCo, Inc. 4.65%, 3/15/2026 | | |
| | |
|
LKQ Corp. 5.75%, 6/15/2028 | | |
|
|
| | |
| | |
| | |
Diversified Telecommunication Services — 0.5% |
|
| | |
| | |
Verizon Communications, Inc. |
| | |
| | |
| | |
| | |
| | |
Electric Utilities — 1.0% |
American Electric Power Co., Inc. Series N, 1.00%, 11/1/2025 | | |
Eversource Energy Series Q, 0.80%, 8/15/2025 | | |
ITC Holdings Corp. 3.25%, 6/30/2026 | | |
NextEra Energy Capital Holdings, Inc. (3-MONTH SOFR + 2.41%), 4.80%, 12/1/2077 (a) | | |
Pacific Gas and Electric Co. |
| | |
SEE NOTES TO FINANCIAL STATEMENTS.
| J.P. Morgan Exchange-Traded Funds | |
JPMorgan BetaBuilders 1-5 Year U.S. Aggregate Bond ETF
SCHEDULE OF PORTFOLIO INVESTMENTSAS OF February 29, 2024 (continued)
| | |
Corporate Bonds — continued |
Electric Utilities — continued |
| | |
| | |
Public Service Electric and Gas Co. 0.95%, 3/15/2026 | | |
Union Electric Co. 2.95%, 6/15/2027 | | |
Virginia Electric and Power Co. Series A, 3.80%, 4/1/2028 | | |
| | |
Electrical Equipment — 0.2% |
|
| | |
| | |
| | |
Electronic Equipment, Instruments & Components — 0.2% |
Amphenol Corp. 2.05%, 3/1/2025 | | |
Jabil, Inc. 3.95%, 1/12/2028 | | |
| | |
Energy Equipment & Services — 0.4% |
Baker Hughes Holdings LLC 3.34%, 12/15/2027 | | |
Schlumberger Investment SA 4.50%, 5/15/2028 | | |
| | |
|
TWDC Enterprises 18 Corp. 2.95%, 6/15/2027 | | |
Walt Disney Co. (The) 3.35%, 3/24/2025 | | |
| | |
Financial Services — 1.1% |
Block Financial LLC 2.50%, 7/15/2028 | | |
Corebridge Financial, Inc. (US Treasury Yield Curve Rate T Note Constant Maturity 5 Year + 3.85%), 6.88%, 12/15/2052 (a) | | |
Global Payments, Inc. 4.95%, 8/15/2027 | | |
PayPal Holdings, Inc. 1.65%, 6/1/2025 | | |
Private Export Funding Corp. Series PP, 1.40%, 7/15/2028 | | |
Shell International Finance BV (Netherlands) 3.88%, 11/13/2028 | | |
|
| | |
| | |
Voya Financial, Inc. (3-MONTH SOFR + 2.08%), 4.70%, 1/23/2048 (a) | | |
| | |
| | |
|
|
Hormel Foods Corp. 1.70%, 6/3/2028 | | |
Kellanova 3.25%, 4/1/2026 | | |
| | |
Ground Transportation — 0.4% |
BNSF Funding Trust I (3-MONTH SOFR + 2.35%), 6.61%, 12/15/2055 (a) | | |
CSX Corp. 3.80%, 3/1/2028 | | |
JB Hunt Transport Services, Inc. 3.88%, 3/1/2026 | | |
Ryder System, Inc. 4.63%, 6/1/2025 | | |
Union Pacific Corp. 2.15%, 2/5/2027 | | |
| | |
Health Care Providers & Services — 0.8% |
Advocate Health & Hospitals Corp. 3.83%, 8/15/2028 | | |
Cencora, Inc. 3.25%, 3/1/2025 | | |
CVS Health Corp. 1.30%, 8/21/2027 | | |
Elevance Health, Inc. 1.50%, 3/15/2026 | | |
Humana, Inc. 1.35%, 2/3/2027 | | |
Sutter Health Series 20A, 1.32%, 8/15/2025 | | |
UnitedHealth Group, Inc. 1.15%, 5/15/2026 | | |
| | |
Health Care REITs — 0.0% ^ |
Welltower OP LLC 4.00%, 6/1/2025 | | |
Hotels, Restaurants & Leisure — 0.3% |
Expedia Group, Inc. 5.00%, 2/15/2026 | | |
Hyatt Hotels Corp. 4.85%, 3/15/2026 | | |
Starbucks Corp. 2.00%, 3/12/2027 | | |
| | |
Household Durables — 0.1% |
DR Horton, Inc. 1.40%, 10/15/2027 | | |
Lennar Corp. 5.00%, 6/15/2027 | | |
| | |
Household Products — 0.2% |
Procter & Gamble Co. (The) 2.80%, 3/25/2027 | | |
Industrial Conglomerates — 0.2% |
Honeywell International, Inc. 1.10%, 3/1/2027 | | |
Industrial REITs — 0.0% ^ |
Prologis LP 2.13%, 4/15/2027 | | |
|
Aflac, Inc. 1.13%, 3/15/2026 | | |
SEE NOTES TO FINANCIAL STATEMENTS.
| J.P. Morgan Exchange-Traded Funds | |
| | |
Corporate Bonds — continued |
|
Assurant, Inc. 4.90%, 3/27/2028 | | |
Berkshire Hathaway Finance Corp. 2.30%, 3/15/2027 | | |
Enstar Finance LLC (US Treasury Yield Curve Rate T Note Constant Maturity 5 Year + 5.47%), 5.75%, 9/1/2040 (a) | | |
Prudential Financial, Inc. 1.50%, 3/10/2026 | | |
| | |
Interactive Media & Services — 0.2% |
Alphabet, Inc. 0.80%, 8/15/2027 | | |
|
DXC Technology Co. 2.38%, 9/15/2028 | | |
Kyndryl Holdings, Inc. 2.05%, 10/15/2026 | | |
| | |
|
Otis Worldwide Corp. 5.25%, 8/16/2028 | | |
|
Charter Communications Operating LLC 3.75%, 2/15/2028 | | |
|
| | |
| | |
| | |
|
ArcelorMittal SA (Luxembourg) 4.55%, 3/11/2026 | | |
BHP Billiton Finance USA Ltd. (Australia) |
| | |
| | |
Nucor Corp. 2.00%, 6/1/2025 | | |
| | |
|
DTE Energy Co. Series F, 1.05%, 6/1/2025 | | |
NiSource, Inc. 0.95%, 8/15/2025 | | |
| | |
Oil, Gas & Consumable Fuels — 0.9% |
BP Capital Markets plc (United Kingdom) 3.72%, 11/28/2028 | | |
Cheniere Energy, Inc. 4.63%, 10/15/2028 | | |
Chevron Corp. 2.00%, 5/11/2027 | | |
|
| | |
| | |
|
Oil, Gas & Consumable Fuels — continued |
| | |
Equinor ASA (Norway) 1.75%, 1/22/2026 | | |
Marathon Petroleum Corp. 4.70%, 5/1/2025 | | |
| | |
ONEOK, Inc. 2.20%, 9/15/2025 | | |
Ovintiv, Inc. 5.65%, 5/15/2025 | | |
Petroleos Mexicanos (Mexico) 6.84%, 1/23/2030 (d) | | |
Pioneer Natural Resources Co. 1.13%, 1/15/2026 | | |
Sabine Pass Liquefaction LLC 4.20%, 3/15/2028 | | |
TotalEnergies Capital International SA (France) 3.46%, 2/19/2029 | | |
| | |
Paper & Forest Products — 0.2% |
Suzano Austria GmbH (Brazil) 2.50%, 9/15/2028 | | |
|
AstraZeneca plc (United Kingdom) |
| | |
| | |
GlaxoSmithKline Capital, Inc. (United Kingdom) 3.63%, 5/15/2025 | | |
|
| | |
| | |
| | |
|
| | |
| | |
| | |
Professional Services — 0.1% |
Concentrix Corp. 6.60%, 8/2/2028 | | |
Residential REITs — 0.0% ^ |
AvalonBay Communities, Inc. 3.50%, 11/15/2025 | | |
|
Agree LP 2.00%, 6/15/2028 | | |
Brixmor Operating Partnership LP 3.90%, 3/15/2027 | | |
| | |
SEE NOTES TO FINANCIAL STATEMENTS.
| J.P. Morgan Exchange-Traded Funds | |
JPMorgan BetaBuilders 1-5 Year U.S. Aggregate Bond ETF
SCHEDULE OF PORTFOLIO INVESTMENTSAS OF February 29, 2024 (continued)
| | |
Corporate Bonds — continued |
Semiconductors & Semiconductor Equipment — 0.1% |
NVIDIA Corp. 1.55%, 6/15/2028 | | |
QUALCOMM, Inc. 1.30%, 5/20/2028 | | |
| | |
|
Microsoft Corp. 3.30%, 2/6/2027 | | |
Roper Technologies, Inc. 1.00%, 9/15/2025 | | |
| | |
|
American Tower Corp. 1.30%, 9/15/2025 | | |
|
| | |
| | |
| | |
CubeSmart LP 2.25%, 12/15/2028 | | |
|
| | |
| | |
Public Storage Operating Co. 0.88%, 2/15/2026 | | |
| | |
|
Home Depot, Inc. (The) 3.35%, 9/15/2025 | | |
|
| | |
| | |
O'Reilly Automotive, Inc. 3.60%, 9/1/2027 | | |
| | |
Technology Hardware, Storage & Peripherals — 0.2% |
|
| | |
| | |
| | |
Dell International LLC 5.85%, 7/15/2025 | | |
| | |
|
BAT Capital Corp. (United Kingdom) 2.26%, 3/25/2028 | | |
BAT International Finance plc (United Kingdom) 5.93%, 2/2/2029 | | |
Philip Morris International, Inc. 1.50%, 5/1/2025 | | |
| | |
| | |
|
Trading Companies & Distributors — 0.2% |
|
| | |
| | |
GATX Corp. 3.25%, 9/15/2026 | | |
| | |
|
American Water Capital Corp. 2.95%, 9/1/2027 | | |
Wireless Telecommunication Services — 0.2% |
T-Mobile USA, Inc. 3.50%, 4/15/2025 | | |
Total Corporate Bonds
(Cost $3,965,927) | | |
Mortgage-Backed Securities — 6.7% |
FHLMC Gold Pools, 15 Year | | |
Pool # J14776, 3.00%, 3/1/2026 | | |
Pool # G18568, 2.50%, 9/1/2030 | | |
Pool # J33012, 3.00%, 10/1/2030 | | |
Pool # G18600, 2.50%, 5/1/2031 | | |
Pool # J35495, 2.50%, 10/1/2031 | | |
Pool # G18632, 3.00%, 2/1/2032 | | |
Pool # J37147, 3.00%, 6/1/2032 | | |
Pool # G18715, 3.00%, 12/1/2033 | | |
| | |
Pool # ZS8617, 2.50%, 8/1/2031 | | |
Pool # ZS7938, 2.50%, 1/1/2033 | | |
Pool # ZK9341, 3.00%, 3/1/2033 | | |
Pool # ZT0716, 3.00%, 10/1/2033 | | |
Pool # SB0194, 2.50%, 12/1/2033 | | |
Pool # SB0109, 2.50%, 11/1/2034 | | |
Pool # SB0264, 2.50%, 2/1/2035 | | |
Pool # SB0401, 2.00%, 7/1/2035 | | |
Pool # SB0394, 2.50%, 7/1/2035 | | |
Pool # SB8501, 2.00%, 8/1/2035 | | |
Pool # SB0406, 2.50%, 8/1/2035 | | |
Pool # SB8058, 2.50%, 8/1/2035 | | |
Pool # RC1591, 1.50%, 10/1/2035 | | |
Pool # QN4278, 2.00%, 11/1/2035 | | |
Pool # QN4490, 1.50%, 12/1/2035 | | |
Pool # SB0450, 2.00%, 12/1/2035 | | |
Pool # SB8083, 1.50%, 1/1/2036 | | |
Pool # SB8102, 1.50%, 5/1/2036 | | |
Pool # SB8118, 1.50%, 9/1/2036 | | |
Pool # SB8141, 2.00%, 2/1/2037 | | |
Pool # SB8222, 4.50%, 4/1/2038 | | |
SEE NOTES TO FINANCIAL STATEMENTS.
| J.P. Morgan Exchange-Traded Funds | |
| | |
Mortgage-Backed Securities — continued |
| | |
Pool # AV4793, 3.50%, 5/1/2029 | | |
Pool # AS4489, 2.50%, 3/1/2030 | | |
Pool # AL6583, 3.00%, 3/1/2030 | | |
Pool # AL9852, 3.00%, 9/1/2030 | | |
Pool # AS7467, 2.50%, 7/1/2031 | | |
Pool # FM6169, 3.50%, 5/1/2032 | | |
Pool # BM3276, 3.50%, 12/1/2032 | | |
Pool # CA1089, 3.00%, 2/1/2033 | | |
Pool # FM4036, 2.50%, 12/1/2033 | | |
Pool # BN3975, 3.00%, 1/1/2034 | | |
Pool # MA3631, 3.00%, 4/1/2034 | | |
Pool # MA3709, 2.50%, 6/1/2034 | | |
Pool # BJ5549, 3.00%, 8/1/2034 | | |
Pool # FM2403, 3.50%, 9/1/2034 | | |
Pool # FM5400, 2.50%, 10/1/2034 | | |
Pool # MA3828, 3.00%, 11/1/2034 | | |
Pool # BP5762, 2.50%, 6/1/2035 | | |
Pool # FM3936, 2.50%, 8/1/2035 | | |
Pool # CA7497, 2.50%, 10/1/2035 | | |
Pool # FM4850, 2.00%, 11/1/2035 | | |
Pool # FM5396, 2.00%, 12/1/2035 | | |
Pool # FM6510, 2.00%, 3/1/2036 | | |
Pool # FM6512, 2.00%, 3/1/2036 | | |
Pool # MA4298, 2.50%, 3/1/2036 | | |
Pool # CB0302, 1.50%, 5/1/2036 | | |
Pool # FM7113, 2.00%, 5/1/2036 | | |
Pool # MA4329, 2.00%, 5/1/2036 | | |
Pool # BP3507, 2.00%, 6/1/2036 | | |
Pool # CB0747, 2.50%, 6/1/2036 | | |
Pool # MA4384, 2.50%, 7/1/2036 | | |
Pool # FM9020, 2.00%, 9/1/2036 | | |
Pool # FM9367, 1.50%, 11/1/2036 | | |
Pool # MA4470, 2.00%, 11/1/2036 | | |
Pool # MA4497, 2.00%, 12/1/2036 | | |
Pool # MA4516, 2.00%, 1/1/2037 | | |
Pool # FS4759, 2.50%, 4/1/2037 | | |
FNMA/FHLMC UMBS, Single Family, 15 Year | | |
TBA, 1.50%, 3/25/2039 (e) | | |
TBA, 2.00%, 3/25/2039 (e) | | |
TBA, 2.50%, 3/25/2039 (e) | | |
TBA, 3.00%, 3/25/2039 (e) | | |
TBA, 3.50%, 3/25/2039 (e) | | |
TBA, 4.00%, 3/25/2039 (e) | | |
TBA, 5.00%, 3/25/2039 (e) | | |
| | |
|
TBA, 5.50%, 3/25/2039 (e) | | |
TBA, 6.00%, 3/25/2039 (e) | | |
| | |
Pool # MA4559, 3.00%, 7/20/2032 | | |
Pool # MA7107, 2.50%, 1/20/2036 | | |
Total Mortgage-Backed Securities
(Cost $1,126,917) | | |
|
African Development Bank (Supranational)
0.88%, 3/23/2026 | | |
Asian Development Bank (Supranational) | | |
| | |
| | |
Asian Infrastructure Investment Bank (The) (Supranational)
0.50%, 5/28/2025 | | |
European Bank for Reconstruction & Development (Supranational) | | |
| | |
| | |
European Investment Bank (Supranational)
3.88%, 3/15/2028 | | |
Inter-American Development Bank (Supranational) | | |
| | |
| | |
| | |
International Bank for Reconstruction & Development (Supranational) | | |
| | |
| | |
| | |
| | |
International Finance Corp. (Supranational)
0.75%, 10/8/2026 | | |
Total Supranational
(Cost $395,855) | | |
Commercial Mortgage-Backed Securities — 1.9% |
Benchmark Mortgage Trust Series 2019-B12, Class A2, 3.00%, 8/15/2052 | | |
CGMS Commercial Mortgage Trust Series 2017-B1, Class AAB, 3.24%, 8/15/2050 | | |
Citigroup Commercial Mortgage Trust | | |
Series 2016-C1, Class AAB, 3.00%, 5/10/2049 | | |
Series 2020-GC46, Class A2, 2.71%, 2/15/2053 | | |
SEE NOTES TO FINANCIAL STATEMENTS.
| J.P. Morgan Exchange-Traded Funds | |
JPMorgan BetaBuilders 1-5 Year U.S. Aggregate Bond ETF
SCHEDULE OF PORTFOLIO INVESTMENTSAS OF February 29, 2024 (continued)
| | |
Commercial Mortgage-Backed Securities — continued |
CSAIL Commercial Mortgage Trust Series 2015-C3, Class A4, 3.72%, 8/15/2048 | | |
FHLMC, Multi-Family Structured Pass-Through Certificates Series K092, Class A1, 3.13%, 10/25/2028 | | |
FNMA ACES Series 2017-M10, Class AV2, 2.58%, 7/25/2024 (c) | | |
JPMBB Commercial Mortgage Securities Trust Series 2014-C19, Class C, 10.09%, 4/15/2047 (c) | | |
JPMorgan Chase Commercial Mortgage Securities Trust Series 2015-JP1, Class D, 4.22%, 1/15/2049 (c) | | |
Morgan Stanley Bank of America Merrill Lynch Trust | | |
Series 2014-C19, Class A3, 3.25%, 12/15/2047 | | |
Series 2016-C31, Class A5, 3.10%, 11/15/2049 | | |
Wells Fargo Commercial Mortgage Trust Series 2015-C31, Class A4, 3.70%, 11/15/2048 | | |
WFRBS Commercial Mortgage Trust | | |
Series 2012-C10, Class B, 3.74%, 12/15/2045 | | |
Series 2014-C20, Class A5, 4.00%, 5/15/2047 | | |
Total Commercial Mortgage-Backed Securities
(Cost $304,734) | | |
U.S. Government Agency Securities — 1.5% |
| | |
| | |
| | |
| | |
| | |
| | |
| | |
| | |
| | |
| | |
| | |
| | |
| | |
Tennessee Valley Authority
3.88%, 3/15/2028 | | |
Total U.S. Government Agency Securities
(Cost $243,148) | | |
| | |
Foreign Government Securities — 1.2% |
Canada Government Bond 0.75%, 5/19/2026 | | |
Province of Alberta 1.00%, 5/20/2025 | | |
Province of British Columbia 0.90%, 7/20/2026 | | |
Province of Manitoba 1.50%, 10/25/2028 | | |
| | |
| | |
| | |
| | |
| | |
| | |
Republic of Panama 8.88%, 9/30/2027 | | |
Republic of Peru 4.13%, 8/25/2027 | | |
Republic of Poland 3.25%, 4/6/2026 | | |
Total Foreign Government Securities
(Cost $194,752) | | |
Asset-Backed Securities — 0.5% |
AmeriCredit Automobile Receivables Trust Series 2020-3, Class B, 0.76%, 12/18/2025 | | |
Capital One Multi-Asset Execution Trust Series 2022-A2, Class A, 3.49%, 5/15/2027 | | |
CarMax Auto Owner Trust Series 2021-1, Class A3, 0.34%, 12/15/2025 | | |
Discover Card Execution Note Trust Series 2022-A1, Class A1, 1.96%, 2/15/2027 | | |
Exeter Automobile Receivables Trust Series 2021-3A, Class C, 0.96%, 10/15/2026 | | |
Ford Credit Floorplan Master Owner Trust Series 2019-2, Class A, 3.06%, 4/15/2026 | | |
World Omni Auto Receivables Trust Series 2021-C, Class A3, 0.44%, 8/17/2026 | | |
Total Asset-Backed Securities
(Cost $71,647) | | |
Municipal Bonds — 0.2% (f) |
|
University of California, Taxable Series 2020BG, Rev., 0.88%, 5/15/2025 | | |
|
State Board of Administration Finance Corp. Series 2020A, Rev., 1.71%, 7/1/2027 | | |
Total Municipal Bonds
(Cost $39,025) | | |
SEE NOTES TO FINANCIAL STATEMENTS.
| J.P. Morgan Exchange-Traded Funds | |
| | |
Short-Term Investments — 0.9% |
Investment Companies — 0.9% |
JPMorgan U.S. Government Money Market Fund Class IM Shares, 5.25% (g) (h)
(Cost $130,683) | | |
Total Investments — 99.9%
(Cost $15,785,895) | | |
Other Assets Less Liabilities — 0.1% | | |
| | |
Percentages indicated are based on net assets. |
| |
| Alternative Credit Enhancement Securities |
| Chicago Mercantile Exchange |
| |
| |
| Federal Home Loan Mortgage Corp. |
| Federal National Mortgage Association |
| Government National Mortgage Association |
| Real Estate Investment Trust |
| |
| Secured Overnight Financing Rate |
| To Be Announced; Security is subject to delayed delivery. |
| Uniform Mortgage-Backed Securities |
| |
| Amount rounds to less than 0.1% of net assets. |
| Variable or floating rate security, linked to the referenced benchmark. The interest rate shown is the current rate as of February 29, 2024. | |
| Contingent Capital security (“CoCo”). CoCos are hybrid debt securities that may be convertible into equity or may be written down if a pre-specified trigger event occurs. The total value of aggregate CoCo holdings at February 29, 2024 is $6,680 or 0.04% of the Fund’s net assets as of February 29, 2024. | |
| Variable or floating rate security, the interest rate of which adjusts periodically based on changes in current interest rates and prepayments on the underlying pool of assets. The interest rate shown is the current rate as of February 29, 2024. | |
| Security exempt from registration pursuant to Regulation S under the Securities Act of 1933, as amended. Regulation S applies to securities offerings that are made outside of the United States and do not involve direct selling efforts in the United States and as such may have restrictions on resale. | |
| All or a portion of the security is a when-issued security, delayed delivery security, or forward commitment. | |
| The date shown represents the earliest of the prerefunded date, next put date or final maturity date. | |
| Investment in an affiliated fund, which is registered under the Investment Company Act of 1940, as amended, and is advised by J.P. Morgan Investment Management Inc. | |
| The rate shown is the current yield as of February 29, 2024. | |
SEE NOTES TO FINANCIAL STATEMENTS.
| J.P. Morgan Exchange-Traded Funds | |
JPMorgan BetaBuilders U.S. Aggregate Bond ETF
SCHEDULE OF PORTFOLIO INVESTMENTSAS OF February 29, 2024
| | |
U.S. Treasury Obligations — 41.7% |
| | |
| | |
| | |
| | |
| | |
| | |
| | |
| | |
| | |
| | |
| | |
| | |
| | |
| | |
| | |
| | |
| | |
| | |
| | |
| | |
| | |
| | |
| | |
| | |
| | |
| | |
| | |
| | |
| | |
| | |
| | |
| | |
| | |
| | |
| | |
| | |
| | |
| | |
| | |
| | |
| | |
| | |
| | |
| | |
| | |
SEE NOTES TO FINANCIAL STATEMENTS.
| J.P. Morgan Exchange-Traded Funds | |
| | |
U.S. Treasury Obligations — continued |
| | |
| | |
| | |
| | |
| | |
| | |
| | |
| | |
| | |
| | |
| | |
| | |
| | |
| | |
| | |
| | |
| | |
| | |
| | |
| | |
| | |
| | |
| | |
| | |
| | |
| | |
| | |
| | |
| | |
| | |
| | |
| | |
| | |
| | |
| | |
| | |
| | |
| | |
| | |
| | |
| | |
| | |
| | |
| | |
| | |
SEE NOTES TO FINANCIAL STATEMENTS.
| J.P. Morgan Exchange-Traded Funds | |
JPMorgan BetaBuilders U.S. Aggregate Bond ETF
SCHEDULE OF PORTFOLIO INVESTMENTSAS OF February 29, 2024 (continued)
| | |
U.S. Treasury Obligations — continued |
| | |
| | |
| | |
| | |
| | |
| | |
| | |
| | |
| | |
| | |
| | |
| | |
| | |
| | |
| | |
| | |
| | |
| | |
| | |
| | |
| | |
| | |
| | |
| | |
| | |
| | |
| | |
| | |
| | |
| | |
| | |
| | |
| | |
| | |
| | |
Total U.S. Treasury Obligations
(Cost $736,158,392) | | |
Mortgage-Backed Securities — 26.4% |
FHLMC Gold Pools, 15 Year | | |
Pool # J10548, 4.00%, 8/1/2024 | | |
Pool # J15449, 4.00%, 5/1/2026 | | |
Pool # G14781, 3.50%, 3/1/2027 | | |
Pool # G15201, 4.00%, 5/1/2027 | | |
Pool # J20129, 2.50%, 8/1/2027 | | |
Pool # G15438, 4.00%, 9/1/2027 | | |
| | |
|
Pool # G15602, 2.50%, 11/1/2027 | | |
Pool # E09028, 2.00%, 3/1/2028 | | |
Pool # J23362, 2.00%, 4/1/2028 | | |
Pool # G18466, 2.00%, 5/1/2028 | | |
Pool # G18465, 2.50%, 5/1/2028 | | |
Pool # G15601, 2.50%, 1/1/2029 | | |
Pool # G14957, 3.50%, 1/1/2029 | | |
Pool # G16570, 4.00%, 7/1/2029 | | |
Pool # G18540, 2.50%, 2/1/2030 | | |
Pool # G18556, 2.50%, 6/1/2030 | | |
Pool # V60840, 3.00%, 6/1/2030 | | |
Pool # G16622, 3.00%, 11/1/2030 | | |
Pool # G16019, 3.50%, 12/1/2030 | | |
Pool # J36524, 3.00%, 3/1/2032 | | |
Pool # J36660, 3.00%, 3/1/2032 | | |
Pool # G16568, 2.50%, 4/1/2033 | | |
FHLMC Gold Pools, 30 Year | | |
Pool # V81680, 4.50%, 12/1/2034 | | |
Pool # A30892, 5.00%, 1/1/2035 | | |
Pool # A39210, 5.50%, 10/1/2035 | | |
Pool # V83754, 5.50%, 1/1/2036 | | |
Pool # A82255, 5.50%, 9/1/2036 | | |
Pool # G03381, 5.50%, 9/1/2037 | | |
Pool # A89760, 4.50%, 12/1/2039 | | |
Pool # A92197, 5.00%, 5/1/2040 | | |
Pool # G06856, 6.00%, 5/1/2040 | | |
Pool # A93359, 4.00%, 8/1/2040 | | |
Pool # G06222, 4.00%, 1/1/2041 | | |
Pool # G07794, 5.50%, 6/1/2041 | | |
Pool # Q03516, 4.50%, 9/1/2041 | | |
Pool # Q04088, 3.50%, 10/1/2041 | | |
Pool # Q04688, 4.00%, 11/1/2041 | | |
Pool # G08477, 3.50%, 2/1/2042 | | |
Pool # Q06771, 3.00%, 3/1/2042 | | |
Pool # C03858, 3.50%, 4/1/2042 | | |
Pool # Q08646, 3.50%, 6/1/2042 | | |
Pool # G60737, 4.50%, 8/1/2042 | | |
Pool # Q11220, 3.50%, 9/1/2042 | | |
Pool # Q13477, 3.00%, 12/1/2042 | | |
Pool # Q14321, 3.00%, 12/1/2042 | | |
Pool # C04420, 3.00%, 1/1/2043 | | |
Pool # Q14694, 3.00%, 1/1/2043 | | |
Pool # G61723, 3.50%, 1/1/2043 | | |
Pool # C09031, 2.50%, 2/1/2043 | | |
Pool # V80026, 3.00%, 4/1/2043 | | |
SEE NOTES TO FINANCIAL STATEMENTS.
| J.P. Morgan Exchange-Traded Funds | |
| | |
Mortgage-Backed Securities — continued |
Pool # Q17374, 4.00%, 4/1/2043 | | |
Pool # Z40090, 4.50%, 9/1/2044 | | |
Pool # G61617, 4.50%, 1/1/2045 | | |
Pool # G08651, 4.00%, 6/1/2045 | | |
Pool # G08653, 3.00%, 7/1/2045 | | |
Pool # Q35223, 4.00%, 8/1/2045 | | |
Pool # G60238, 3.50%, 10/1/2045 | | |
Pool # G60506, 3.50%, 4/1/2046 | | |
Pool # G08710, 3.00%, 6/1/2046 | | |
Pool # Q41024, 3.00%, 6/1/2046 | | |
Pool # G08724, 2.50%, 9/1/2046 | | |
Pool # G61070, 3.00%, 9/1/2046 | | |
Pool # G61730, 3.00%, 9/1/2046 | | |
Pool # G61235, 4.50%, 9/1/2046 | | |
Pool # G08736, 2.50%, 12/1/2046 | | |
Pool # Q45872, 3.00%, 1/1/2047 | | |
Pool # G08747, 3.00%, 2/1/2047 | | |
Pool # G61623, 3.00%, 4/1/2047 | | |
Pool # G60985, 3.00%, 5/1/2047 | | |
Pool # G60996, 3.50%, 5/1/2047 | | |
Pool # Q47884, 4.00%, 5/1/2047 | | |
Pool # V83233, 4.00%, 6/1/2047 | | |
Pool # G08775, 4.00%, 8/1/2047 | | |
Pool # Q50152, 4.00%, 8/1/2047 | | |
Pool # Q51268, 3.50%, 10/1/2047 | | |
Pool # G08787, 3.00%, 11/1/2047 | | |
Pool # G61681, 3.00%, 12/1/2047 | | |
Pool # Q52866, 3.00%, 12/1/2047 | | |
Pool # G08793, 4.00%, 12/1/2047 | | |
Pool # Q53751, 3.50%, 1/1/2048 | | |
Pool # G08812, 3.00%, 4/1/2048 | | |
Pool # G61866, 4.00%, 6/1/2048 | | |
Pool # G08842, 4.00%, 10/1/2048 | | |
Pool # G61885, 4.50%, 11/1/2048 | | |
Pool # G08862, 4.00%, 2/1/2049 | | |
Pool # Q61487, 4.00%, 2/1/2049 | | |
Pool # G08876, 3.50%, 5/1/2049 | | |
| | |
Pool # ZS5890, 4.00%, 7/1/2024 | | |
Pool # ZK2080, 4.00%, 1/1/2025 | | |
Pool # ZA2587, 4.00%, 9/1/2025 | | |
Pool # ZK2723, 3.50%, 11/1/2025 | | |
Pool # ZK3540, 3.00%, 9/1/2026 | | |
Pool # ZS8460, 3.00%, 4/1/2027 | | |
Pool # SB0031, 3.50%, 10/1/2027 | | |
| | |
|
Pool # ZS6674, 2.50%, 4/1/2028 | | |
Pool # ZS7140, 2.00%, 1/1/2029 | | |
Pool # ZS7751, 3.00%, 1/1/2029 | | |
Pool # SB0071, 2.50%, 5/1/2030 | | |
Pool # ZS7331, 3.00%, 12/1/2030 | | |
Pool # ZS7888, 2.50%, 10/1/2032 | | |
Pool # ZK9070, 3.00%, 11/1/2032 | | |
Pool # SB0256, 4.00%, 11/1/2033 | | |
Pool # SB0077, 3.50%, 10/1/2034 | | |
Pool # SB0302, 3.00%, 4/1/2035 | | |
Pool # QN2407, 2.00%, 6/1/2035 | | |
Pool # SB8500, 2.50%, 7/1/2035 | | |
Pool # RC1712, 1.50%, 12/1/2035 | | |
Pool # SB8090, 2.50%, 2/1/2036 | | |
Pool # QN6095, 2.00%, 5/1/2036 | | |
Pool # QN6718, 2.00%, 6/1/2036 | | |
Pool # QN8347, 1.50%, 10/1/2036 | | |
Pool # SB8127, 1.50%, 11/1/2036 | | |
Pool # SB8131, 1.50%, 12/1/2036 | | |
Pool # SB8136, 1.50%, 1/1/2037 | | |
Pool # SB8140, 1.50%, 2/1/2037 | | |
Pool # SB8141, 2.00%, 2/1/2037 | | |
Pool # SB8147, 1.50%, 4/1/2037 | | |
| | |
Pool # ZA2277, 3.00%, 9/1/2032 | | |
Pool # ZJ9491, 3.50%, 12/1/2032 | | |
Pool # ZS9164, 3.00%, 9/1/2033 | | |
Pool # SC0107, 3.50%, 11/1/2034 | | |
Pool # ZA2463, 3.50%, 6/1/2037 | | |
Pool # RB5026, 2.50%, 11/1/2039 | | |
Pool # QK0157, 2.50%, 1/1/2040 | | |
Pool # RB5032, 2.50%, 2/1/2040 | | |
Pool # RB5037, 2.50%, 3/1/2040 | | |
Pool # RB5043, 2.50%, 4/1/2040 | | |
Pool # RB5048, 2.50%, 5/1/2040 | | |
Pool # SC0131, 1.50%, 3/1/2041 | | |
Pool # SC0134, 1.50%, 3/1/2041 | | |
Pool # RB5145, 2.00%, 2/1/2042 | | |
Pool # RB5154, 2.50%, 4/1/2042 | | |
Pool # RB5166, 3.00%, 7/1/2042 | | |
| | |
Pool # ZI3765, 5.50%, 11/1/2035 | | |
Pool # ZS2546, 5.00%, 2/1/2039 | | |
Pool # ZJ0449, 4.00%, 9/1/2040 | | |
Pool # ZL3548, 3.50%, 8/1/2042 | | |
SEE NOTES TO FINANCIAL STATEMENTS.
| J.P. Morgan Exchange-Traded Funds | |
JPMorgan BetaBuilders U.S. Aggregate Bond ETF
SCHEDULE OF PORTFOLIO INVESTMENTSAS OF February 29, 2024 (continued)
| | |
Mortgage-Backed Securities — continued |
Pool # ZA4209, 3.00%, 4/1/2043 | | |
Pool # ZS3712, 3.50%, 4/1/2043 | | |
Pool # ZS4077, 3.50%, 1/1/2044 | | |
Pool # ZS4592, 4.00%, 11/1/2044 | | |
Pool # ZS4609, 3.00%, 4/1/2045 | | |
Pool # ZS9618, 3.50%, 3/1/2046 | | |
Pool # SD0146, 3.00%, 11/1/2046 | | |
Pool # ZM2209, 3.50%, 12/1/2046 | | |
Pool # SD0388, 3.50%, 6/1/2047 | | |
Pool # ZS4729, 3.00%, 8/1/2047 | | |
Pool # ZM4635, 4.00%, 11/1/2047 | | |
Pool # SD0225, 3.00%, 12/1/2047 | | |
Pool # ZT0534, 3.50%, 12/1/2047 | | |
Pool # ZS4750, 3.00%, 1/1/2048 | | |
Pool # SD0343, 3.00%, 3/1/2048 | | |
Pool # SI2002, 4.00%, 3/1/2048 | | |
Pool # ZM6887, 3.00%, 5/1/2048 | | |
Pool # ZM7669, 3.50%, 8/1/2048 | | |
Pool # ZN4476, 3.50%, 12/1/2048 | | |
Pool # ZA6286, 4.00%, 2/1/2049 | | |
Pool # ZT1776, 3.50%, 3/1/2049 | | |
Pool # ZN5087, 4.00%, 4/1/2049 | | |
Pool # ZT1864, 4.00%, 4/1/2049 | | |
Pool # ZT1951, 3.50%, 5/1/2049 | | |
Pool # ZT1952, 4.00%, 5/1/2049 | | |
Pool # QA4907, 3.00%, 6/1/2049 | | |
Pool # ZT2086, 3.50%, 6/1/2049 | | |
Pool # SD7502, 3.50%, 7/1/2049 | | |
Pool # SD8001, 3.50%, 7/1/2049 | | |
Pool # SD7501, 4.00%, 7/1/2049 | | |
Pool # QA1997, 3.00%, 8/1/2049 | | |
Pool # RA1202, 3.50%, 8/1/2049 | | |
Pool # SD8005, 3.50%, 8/1/2049 | | |
Pool # SD8006, 4.00%, 8/1/2049 | | |
Pool # SD8023, 2.50%, 11/1/2049 | | |
Pool # QA4509, 3.00%, 11/1/2049 | | |
Pool # SD8025, 3.50%, 11/1/2049 | | |
Pool # SD8029, 2.50%, 12/1/2049 | | |
Pool # RA1878, 3.50%, 12/1/2049 | | |
Pool # SD8037, 2.50%, 1/1/2050 | | |
Pool # QA7416, 3.00%, 2/1/2050 | | |
Pool # QA7554, 3.00%, 2/1/2050 | | |
Pool # RA2116, 3.00%, 2/1/2050 | | |
Pool # SD0303, 2.50%, 4/1/2050 | | |
Pool # QA9653, 3.50%, 5/1/2050 | | |
| | |
|
Pool # SD8080, 2.00%, 6/1/2050 | | |
Pool # QB1691, 2.00%, 7/1/2050 | | |
Pool # RA3727, 2.00%, 10/1/2050 | | |
Pool # SD8104, 1.50%, 11/1/2050 | | |
Pool # RA4197, 2.50%, 12/1/2050 | | |
Pool # RA4349, 2.50%, 1/1/2051 | | |
Pool # QB8583, 1.50%, 2/1/2051 | | |
Pool # SD8140, 2.00%, 4/1/2051 | | |
Pool # SD8142, 3.00%, 4/1/2051 | | |
Pool # SD8145, 1.50%, 5/1/2051 | | |
Pool # QC2565, 2.00%, 6/1/2051 | | |
Pool # QC3259, 2.00%, 6/1/2051 | | |
Pool # SD8158, 3.50%, 6/1/2051 | | |
Pool # QC5125, 2.00%, 8/1/2051 | | |
Pool # QC6057, 2.50%, 8/1/2051 | | |
Pool # SD8163, 3.50%, 8/1/2051 | | |
Pool # RA5832, 2.50%, 9/1/2051 | | |
Pool # SD8168, 3.00%, 9/1/2051 | | |
Pool # SD0688, 2.50%, 10/1/2051 | | |
Pool # SD8173, 2.50%, 10/1/2051 | | |
Pool # QC8788, 3.00%, 10/1/2051 | | |
Pool # QD3500, 2.50%, 12/1/2051 | | |
Pool # RA6649, 2.00%, 1/1/2052 | | |
Pool # RA6694, 2.00%, 1/1/2052 | | |
Pool # SD0963, 3.50%, 1/1/2052 | | |
Pool # RA6816, 2.00%, 2/1/2052 | | |
Pool # SD0897, 2.00%, 2/1/2052 | | |
Pool # SD8199, 2.00%, 3/1/2052 | | |
Pool # SD8204, 2.00%, 4/1/2052 | | |
Pool # QD9578, 2.50%, 4/1/2052 | | |
Pool # QD9765, 2.50%, 4/1/2052 | | |
Pool # SD8205, 2.50%, 4/1/2052 | | |
Pool # SD0945, 3.50%, 4/1/2052 | | |
Pool # SD1461, 3.00%, 5/1/2052 | | |
Pool # SD8214, 3.50%, 5/1/2052 | | |
Pool # SD1840, 3.00%, 6/1/2052 | | |
Pool # SD1406, 2.00%, 8/1/2052 | | |
Pool # RA8112, 4.50%, 10/1/2052 | | |
Pool # SD2381, 5.50%, 3/1/2053 | | |
Pool # SD2572, 5.50%, 3/1/2053 | | |
Pool # SD2580, 6.00%, 3/1/2053 | | |
Pool # RA8736, 6.50%, 3/1/2053 | | |
Pool # SD8322, 4.50%, 5/1/2053 | | |
Pool # RA9469, 6.50%, 7/1/2053 | | |
Pool # SD8373, 6.00%, 11/1/2053 | | |
SEE NOTES TO FINANCIAL STATEMENTS.
| J.P. Morgan Exchange-Traded Funds | |
| | |
Mortgage-Backed Securities — continued |
| | |
Pool # AC8711, 4.00%, 12/1/2024 | | |
Pool # AC7007, 4.50%, 1/1/2025 | | |
Pool # AL9580, 4.00%, 3/1/2025 | | |
Pool # 932724, 4.00%, 4/1/2025 | | |
Pool # AE0971, 4.00%, 5/1/2025 | | |
Pool # AE0939, 3.50%, 2/1/2026 | | |
Pool # FM2968, 4.00%, 5/1/2026 | | |
Pool # AJ6632, 3.00%, 11/1/2026 | | |
Pool # AJ9357, 3.50%, 1/1/2027 | | |
Pool # AK4047, 3.00%, 2/1/2027 | | |
Pool # AL4586, 4.00%, 2/1/2027 | | |
Pool # AO0527, 3.00%, 5/1/2027 | | |
Pool # AO4400, 2.50%, 7/1/2027 | | |
Pool # AL8138, 4.00%, 9/1/2027 | | |
Pool # AB6811, 2.50%, 10/1/2027 | | |
Pool # AQ9442, 2.00%, 12/1/2027 | | |
Pool # AB8447, 2.50%, 2/1/2028 | | |
Pool # AR4180, 2.50%, 2/1/2028 | | |
Pool # AL3802, 3.00%, 2/1/2028 | | |
Pool # AB8787, 2.00%, 3/1/2028 | | |
Pool # AP6059, 2.00%, 6/1/2028 | | |
Pool # BM5381, 3.00%, 6/1/2028 | | |
Pool # BM1892, 2.50%, 9/1/2028 | | |
Pool # AS0761, 3.00%, 10/1/2028 | | |
Pool # AU6961, 3.00%, 10/1/2028 | | |
Pool # AL6132, 4.50%, 3/1/2029 | | |
Pool # FM1105, 2.50%, 6/1/2029 | | |
Pool # AS3345, 2.00%, 7/1/2029 | | |
Pool # MA2061, 3.00%, 10/1/2029 | | |
Pool # FM1465, 3.00%, 5/1/2030 | | |
Pool # 890666, 2.00%, 6/1/2030 | | |
Pool # MA2684, 3.00%, 7/1/2031 | | |
Pool # AL9418, 3.50%, 8/1/2031 | | |
Pool # BD5647, 2.00%, 11/1/2031 | | |
Pool # 890776, 3.50%, 11/1/2031 | | |
Pool # BM5490, 3.50%, 11/1/2031 | | |
Pool # AS8708, 2.50%, 2/1/2032 | | |
Pool # BM4993, 3.50%, 3/1/2032 | | |
Pool # BM4741, 3.00%, 4/1/2032 | | |
Pool # FM1645, 3.00%, 4/1/2032 | | |
Pool # MA3124, 2.50%, 9/1/2032 | | |
Pool # FM3099, 3.50%, 9/1/2032 | | |
Pool # CA0775, 2.50%, 11/1/2032 | | |
Pool # MA3188, 3.00%, 11/1/2032 | | |
| | |
|
Pool # BH7081, 2.50%, 12/1/2032 | | |
Pool # BH8720, 3.50%, 12/1/2032 | | |
Pool # FM1161, 2.50%, 1/1/2033 | | |
Pool # FM1691, 2.50%, 1/1/2033 | | |
Pool # CA9078, 3.00%, 9/1/2033 | | |
Pool # FM1123, 4.00%, 9/1/2033 | | |
Pool # FM2153, 4.00%, 11/1/2033 | | |
Pool # BD9105, 4.00%, 1/1/2034 | | |
Pool # BM5306, 4.00%, 1/1/2034 | | |
Pool # FM1733, 3.50%, 5/1/2034 | | |
Pool # FM6946, 3.00%, 7/1/2034 | | |
Pool # BO1822, 3.50%, 7/1/2034 | | |
Pool # MA3764, 2.50%, 9/1/2034 | | |
Pool # MA3910, 2.00%, 1/1/2035 | | |
Pool # FM3569, 3.00%, 1/1/2035 | | |
Pool # FM7941, 2.50%, 2/1/2035 | | |
Pool # FM2708, 3.00%, 3/1/2035 | | |
Pool # MA4075, 2.50%, 7/1/2035 | | |
Pool # CA7497, 2.50%, 10/1/2035 | | |
Pool # BP7572, 2.50%, 11/1/2035 | | |
Pool # FM5396, 2.00%, 12/1/2035 | | |
Pool # BR3349, 1.50%, 1/1/2036 | | |
Pool # BR1309, 2.00%, 1/1/2036 | | |
Pool # FM5537, 2.00%, 1/1/2036 | | |
Pool # FM5797, 2.00%, 1/1/2036 | | |
Pool # FM5367, 1.50%, 2/1/2036 | | |
Pool # CB0305, 1.50%, 5/1/2036 | | |
Pool # FM7843, 1.50%, 6/1/2036 | | |
Pool # MA4430, 1.00%, 8/1/2036 | | |
Pool # BT0273, 1.50%, 9/1/2036 | | |
Pool # MA4417, 1.50%, 9/1/2036 | | |
Pool # MA4418, 2.00%, 9/1/2036 | | |
Pool # MA4441, 1.50%, 10/1/2036 | | |
Pool # BT9452, 1.50%, 11/1/2036 | | |
Pool # FM9247, 2.00%, 11/1/2036 | | |
Pool # MA4497, 2.00%, 12/1/2036 | | |
Pool # BV7189, 2.00%, 3/1/2037 | | |
Pool # MA4581, 1.50%, 4/1/2037 | | |
Pool # MA4582, 2.00%, 4/1/2037 | | |
Pool # FS2037, 1.50%, 5/1/2037 | | |
Pool # FS3117, 2.50%, 5/1/2037 | | |
Pool # FS4274, 3.00%, 5/1/2037 | | |
Pool # MA4604, 3.00%, 5/1/2037 | | |
Pool # FS4059, 1.50%, 8/1/2037 | | |
Pool # FS4794, 2.00%, 8/1/2037 | | |
SEE NOTES TO FINANCIAL STATEMENTS.
| J.P. Morgan Exchange-Traded Funds | |
JPMorgan BetaBuilders U.S. Aggregate Bond ETF
SCHEDULE OF PORTFOLIO INVESTMENTSAS OF February 29, 2024 (continued)
| | |
Mortgage-Backed Securities — continued |
Pool # FS4756, 2.50%, 8/1/2037 | | |
| | |
Pool # AE6799, 4.50%, 11/1/2030 | | |
Pool # MA0885, 3.50%, 10/1/2031 | | |
Pool # AB4853, 3.00%, 4/1/2032 | | |
Pool # MA1058, 3.00%, 5/1/2032 | | |
Pool # MA1165, 3.00%, 9/1/2032 | | |
Pool # MA2079, 4.00%, 11/1/2034 | | |
Pool # AL7654, 3.00%, 9/1/2035 | | |
Pool # MA2472, 3.00%, 12/1/2035 | | |
Pool # FM1133, 4.00%, 6/1/2036 | | |
Pool # BM3089, 4.00%, 8/1/2037 | | |
Pool # MA3099, 4.00%, 8/1/2037 | | |
Pool # BM5330, 2.50%, 12/1/2037 | | |
Pool # FM3204, 4.00%, 10/1/2038 | | |
Pool # MA4072, 2.50%, 7/1/2040 | | |
Pool # MA4128, 2.00%, 9/1/2040 | | |
Pool # MA4204, 2.00%, 12/1/2040 | | |
Pool # CA9019, 2.00%, 2/1/2041 | | |
Pool # MA4310, 1.50%, 4/1/2041 | | |
Pool # MA4422, 2.00%, 9/1/2041 | | |
Pool # FS0316, 1.50%, 11/1/2041 | | |
Pool # MA4474, 2.00%, 11/1/2041 | | |
Pool # MA4519, 1.50%, 1/1/2042 | | |
Pool # MA4521, 2.50%, 1/1/2042 | | |
Pool # BV7697, 2.50%, 4/1/2042 | | |
Pool # MA4587, 2.50%, 4/1/2042 | | |
Pool # MA4632, 3.00%, 6/1/2042 | | |
| | |
Pool # 254447, 6.00%, 9/1/2032 | | |
Pool # 711215, 5.50%, 6/1/2033 | | |
Pool # AA1005, 5.00%, 12/1/2033 | | |
Pool # 725232, 5.00%, 3/1/2034 | | |
Pool # 725228, 6.00%, 3/1/2034 | | |
Pool # 790003, 6.00%, 8/1/2034 | | |
Pool # 735503, 6.00%, 4/1/2035 | | |
Pool # 190360, 5.00%, 8/1/2035 | | |
Pool # 904601, 6.00%, 11/1/2036 | | |
Pool # 888538, 5.50%, 1/1/2037 | | |
Pool # AB0284, 6.00%, 2/1/2037 | | |
Pool # AL2627, 5.00%, 7/1/2037 | | |
Pool # 956965, 6.50%, 12/1/2037 | | |
Pool # BH7907, 6.50%, 12/1/2037 | | |
Pool # 961793, 5.00%, 3/1/2038 | | |
Pool # 985661, 5.50%, 6/1/2038 | | |
| | |
|
Pool # AU7519, 3.50%, 9/1/2038 | | |
Pool # AA7402, 4.50%, 6/1/2039 | | |
Pool # AC2638, 5.00%, 10/1/2039 | | |
Pool # AL0100, 6.00%, 10/1/2039 | | |
Pool # AC4886, 5.00%, 11/1/2039 | | |
Pool # 190399, 5.50%, 11/1/2039 | | |
Pool # AB1143, 4.50%, 6/1/2040 | | |
Pool # AD6938, 4.50%, 6/1/2040 | | |
Pool # AD5479, 5.00%, 6/1/2040 | | |
Pool # AB1259, 5.00%, 7/1/2040 | | |
Pool # AB1292, 5.00%, 8/1/2040 | | |
Pool # AL5437, 5.00%, 8/1/2040 | | |
Pool # AB1421, 5.00%, 9/1/2040 | | |
Pool # AE4142, 5.00%, 9/1/2040 | | |
Pool # AE3857, 5.00%, 10/1/2040 | | |
Pool # AE8289, 4.00%, 12/1/2040 | | |
Pool # MA0622, 3.50%, 1/1/2041 | | |
Pool # AH2312, 5.00%, 1/1/2041 | | |
Pool # AE0828, 3.50%, 2/1/2041 | | |
Pool # AH3804, 4.00%, 2/1/2041 | | |
Pool # MA0639, 4.00%, 2/1/2041 | | |
Pool # AB2676, 3.50%, 4/1/2041 | | |
Pool # AL0241, 4.00%, 4/1/2041 | | |
Pool # AI1887, 4.50%, 5/1/2041 | | |
Pool # BM3118, 6.00%, 7/1/2041 | | |
Pool # AJ2293, 4.00%, 9/1/2041 | | |
Pool # AL0933, 5.00%, 10/1/2041 | | |
Pool # AW8154, 3.50%, 1/1/2042 | | |
Pool # AX5318, 4.50%, 1/1/2042 | | |
Pool # BD4480, 4.50%, 1/1/2042 | | |
Pool # AL1998, 4.00%, 3/1/2042 | | |
Pool # AO4134, 3.50%, 6/1/2042 | | |
Pool # AO8694, 4.50%, 7/1/2042 | | |
Pool # AP4258, 3.00%, 8/1/2042 | | |
Pool # AB6632, 3.50%, 10/1/2042 | | |
Pool # AB6633, 3.50%, 10/1/2042 | | |
Pool # AL3344, 4.50%, 10/1/2042 | | |
Pool # AB6828, 3.50%, 11/1/2042 | | |
Pool # AL3182, 3.50%, 12/1/2042 | | |
Pool # AQ9316, 2.50%, 1/1/2043 | | |
Pool # AB7580, 3.00%, 1/1/2043 | | |
Pool # AQ1104, 3.00%, 1/1/2043 | | |
Pool # AR0168, 3.00%, 2/1/2043 | | |
Pool # AB7964, 3.50%, 2/1/2043 | | |
Pool # AR2271, 3.50%, 2/1/2043 | | |
SEE NOTES TO FINANCIAL STATEMENTS.
| J.P. Morgan Exchange-Traded Funds | |
| | |
Mortgage-Backed Securities — continued |
Pool # BM4751, 3.50%, 3/1/2043 | | |
Pool # AB8742, 4.00%, 3/1/2043 | | |
Pool # AR6770, 4.00%, 3/1/2043 | | |
Pool # AT2015, 3.00%, 4/1/2043 | | |
Pool # AT2016, 3.00%, 4/1/2043 | | |
Pool # AB9194, 3.50%, 5/1/2043 | | |
Pool # FM4462, 3.50%, 5/1/2043 | | |
Pool # AU1629, 3.00%, 7/1/2043 | | |
Pool # BM3785, 3.50%, 7/1/2043 | | |
Pool # AS0241, 4.00%, 8/1/2043 | | |
Pool # BM3704, 3.00%, 9/1/2043 | | |
Pool # AT2612, 3.50%, 9/1/2043 | | |
Pool # AU4256, 3.50%, 9/1/2043 | | |
Pool # AU4283, 3.50%, 9/1/2043 | | |
Pool # AL4062, 4.00%, 9/1/2043 | | |
Pool # BM4635, 2.50%, 10/1/2043 | | |
Pool # AS1121, 4.00%, 11/1/2043 | | |
Pool # AV0022, 4.00%, 11/1/2043 | | |
Pool # AL7696, 3.00%, 12/1/2043 | | |
Pool # AV6103, 4.00%, 1/1/2044 | | |
Pool # BC1737, 4.00%, 1/1/2044 | | |
Pool # BM5365, 4.00%, 3/1/2044 | | |
Pool # FM1744, 3.50%, 5/1/2044 | | |
Pool # AS2700, 4.00%, 6/1/2044 | | |
Pool # AW6233, 4.50%, 6/1/2044 | | |
Pool # AS2947, 4.00%, 7/1/2044 | | |
Pool # AL9072, 5.00%, 7/1/2044 | | |
Pool # AL9569, 5.00%, 8/1/2044 | | |
Pool # AX0152, 4.50%, 9/1/2044 | | |
Pool # BM4620, 3.00%, 10/1/2044 | | |
Pool # AS3867, 4.00%, 11/1/2044 | | |
Pool # FM1746, 3.50%, 1/1/2045 | | |
Pool # FM0015, 4.00%, 2/1/2045 | | |
Pool # MA2193, 4.50%, 2/1/2045 | | |
Pool # FM3414, 4.00%, 3/1/2045 | | |
Pool # BM3398, 3.50%, 4/1/2045 | | |
Pool # CA2709, 4.00%, 9/1/2045 | | |
Pool # AS5851, 4.50%, 9/1/2045 | | |
Pool # AS6184, 3.50%, 11/1/2045 | | |
Pool # BA0315, 3.50%, 11/1/2045 | | |
Pool # FM1869, 4.00%, 11/1/2045 | | |
Pool # BM4833, 3.00%, 12/1/2045 | | |
Pool # FM1708, 3.00%, 12/1/2045 | | |
Pool # BC0066, 3.50%, 12/1/2045 | | |
Pool # FM3413, 4.00%, 1/1/2046 | | |
| | |
|
Pool # FM2323, 4.00%, 2/1/2046 | | |
Pool # AL9128, 4.50%, 2/1/2046 | | |
Pool # AS6811, 3.00%, 3/1/2046 | | |
Pool # BM4834, 3.00%, 3/1/2046 | | |
Pool # FM1782, 4.00%, 3/1/2046 | | |
Pool # FM2195, 4.00%, 3/1/2046 | | |
Pool # AS7003, 3.00%, 4/1/2046 | | |
Pool # AS7198, 4.50%, 5/1/2046 | | |
Pool # BD0166, 2.50%, 6/1/2046 | | |
Pool # BM5168, 2.50%, 6/1/2046 | | |
Pool # BC6105, 3.50%, 6/1/2046 | | |
Pool # AS7660, 2.50%, 8/1/2046 | | |
Pool # MA2730, 2.50%, 8/1/2046 | | |
Pool # FM3810, 3.00%, 10/1/2046 | | |
Pool # AL9385, 3.00%, 11/1/2046 | | |
Pool # MA2806, 3.00%, 11/1/2046 | | |
Pool # BM3288, 3.50%, 12/1/2046 | | |
Pool # BM4990, 2.50%, 1/1/2047 | | |
Pool # FM2807, 3.00%, 1/1/2047 | | |
Pool # 890856, 3.50%, 1/1/2047 | | |
Pool # FM3374, 3.50%, 1/1/2047 | | |
Pool # FM0041, 3.00%, 2/1/2047 | | |
Pool # BM5955, 4.00%, 2/1/2047 | | |
Pool # BM5270, 4.50%, 2/1/2047 | | |
Pool # BM4350, 3.00%, 3/1/2047 | | |
Pool # MA2920, 3.00%, 3/1/2047 | | |
Pool # FM3107, 3.50%, 3/1/2047 | | |
Pool # AS9313, 4.00%, 3/1/2047 | | |
Pool # FM4735, 3.00%, 4/1/2047 | | |
Pool # FM6073, 4.00%, 4/1/2047 | | |
Pool # AS9480, 4.50%, 4/1/2047 | | |
Pool # FM1772, 4.50%, 5/1/2047 | | |
Pool # BD0667, 4.50%, 6/1/2047 | | |
Pool # AS9937, 3.00%, 7/1/2047 | | |
Pool # AS9946, 3.50%, 7/1/2047 | | |
Pool # BM1568, 3.50%, 7/1/2047 | | |
Pool # BH7375, 3.50%, 8/1/2047 | | |
Pool # CA0148, 4.50%, 8/1/2047 | | |
Pool # CA0850, 3.00%, 9/1/2047 | | |
Pool # MA3147, 3.00%, 10/1/2047 | | |
Pool # BM2003, 4.00%, 10/1/2047 | | |
Pool # BH9392, 3.50%, 11/1/2047 | | |
Pool # CA0681, 3.50%, 11/1/2047 | | |
Pool # MA3182, 3.50%, 11/1/2047 | | |
Pool # FM0028, 3.00%, 12/1/2047 | | |
SEE NOTES TO FINANCIAL STATEMENTS.
| J.P. Morgan Exchange-Traded Funds | |
JPMorgan BetaBuilders U.S. Aggregate Bond ETF
SCHEDULE OF PORTFOLIO INVESTMENTSAS OF February 29, 2024 (continued)
| | |
Mortgage-Backed Securities — continued |
Pool # MA3209, 3.00%, 12/1/2047 | | |
Pool # FM1420, 3.50%, 12/1/2047 | | |
Pool # CA4015, 3.00%, 1/1/2048 | | |
Pool # BJ6154, 3.50%, 1/1/2048 | | |
Pool # MA3238, 3.50%, 1/1/2048 | | |
Pool # BJ5910, 3.50%, 2/1/2048 | | |
Pool # MA3305, 3.50%, 3/1/2048 | | |
Pool # FM3494, 2.50%, 4/1/2048 | | |
Pool # CA2687, 3.00%, 5/1/2048 | | |
Pool # BM4054, 4.00%, 5/1/2048 | | |
Pool # MA3425, 3.00%, 6/1/2048 | | |
Pool # BM4757, 3.50%, 7/1/2048 | | |
Pool # FM3438, 3.00%, 8/1/2048 | | |
Pool # BM2007, 4.00%, 9/1/2048 | | |
Pool # CA2368, 4.00%, 9/1/2048 | | |
Pool # MA3472, 5.00%, 9/1/2048 | | |
Pool # CA4655, 3.50%, 10/1/2048 | | |
Pool # MA3495, 4.00%, 10/1/2048 | | |
Pool # CA2432, 4.50%, 10/1/2048 | | |
Pool # FM7895, 3.50%, 11/1/2048 | | |
Pool # FM1248, 4.50%, 11/1/2048 | | |
Pool # CA2797, 4.50%, 12/1/2048 | | |
Pool # FM0030, 3.00%, 2/1/2049 | | |
Pool # FM6237, 3.50%, 4/1/2049 | | |
Pool # MA3637, 3.50%, 4/1/2049 | | |
Pool # MA3638, 4.00%, 4/1/2049 | | |
Pool # BN5418, 4.50%, 4/1/2049 | | |
Pool # MA3663, 3.50%, 5/1/2049 | | |
Pool # MA3664, 4.00%, 5/1/2049 | | |
Pool # FM4074, 4.50%, 5/1/2049 | | |
Pool # CA4358, 3.50%, 7/1/2049 | | |
Pool # MA3692, 3.50%, 7/1/2049 | | |
Pool # FM1672, 4.50%, 7/1/2049 | | |
Pool # MA3745, 3.50%, 8/1/2049 | | |
Pool # MA3746, 4.00%, 8/1/2049 | | |
Pool # FM1385, 5.00%, 8/1/2049 | | |
Pool # BO4012, 3.00%, 9/1/2049 | | |
Pool # FM1449, 3.50%, 9/1/2049 | | |
Pool # FM4430, 3.50%, 9/1/2049 | | |
Pool # FM3572, 4.50%, 9/1/2049 | | |
Pool # MA3803, 3.50%, 10/1/2049 | | |
Pool # MA3833, 2.50%, 11/1/2049 | | |
Pool # BK0350, 3.00%, 11/1/2049 | | |
Pool # MA3834, 3.00%, 11/1/2049 | | |
Pool # FM2363, 3.00%, 1/1/2050 | | |
| | |
|
Pool # MA3905, 3.00%, 1/1/2050 | | |
Pool # CA5021, 3.50%, 1/1/2050 | | |
Pool # FM5922, 3.50%, 1/1/2050 | | |
Pool # MA3906, 3.50%, 1/1/2050 | | |
Pool # CA5135, 2.50%, 2/1/2050 | | |
Pool # MA3937, 3.00%, 2/1/2050 | | |
Pool # FM2733, 2.50%, 3/1/2050 | | |
Pool # FM4883, 2.50%, 3/1/2050 | | |
Pool # FM4372, 3.50%, 3/1/2050 | | |
Pool # BP2403, 3.50%, 4/1/2050 | | |
Pool # BP5001, 2.50%, 5/1/2050 | | |
Pool # FM3257, 3.00%, 5/1/2050 | | |
Pool # BK2753, 2.50%, 7/1/2050 | | |
Pool # FS2252, 3.00%, 7/1/2050 | | |
Pool # BP6626, 2.00%, 8/1/2050 | | |
Pool # MA4100, 2.00%, 8/1/2050 | | |
Pool # BP9500, 2.50%, 8/1/2050 | | |
Pool # BQ0723, 3.50%, 8/1/2050 | | |
Pool # FM5750, 4.00%, 8/1/2050 | | |
Pool # BK3044, 2.50%, 9/1/2050 | | |
Pool # BP6702, 2.50%, 9/1/2050 | | |
Pool # FM8260, 4.00%, 9/1/2050 | | |
Pool # MA4159, 2.50%, 10/1/2050 | | |
Pool # CA7603, 2.50%, 11/1/2050 | | |
Pool # MA4183, 2.50%, 11/1/2050 | | |
Pool # CA8005, 1.50%, 12/1/2050 | | |
Pool # CA8222, 1.50%, 12/1/2050 | | |
Pool # MA4209, 1.50%, 12/1/2050 | | |
Pool # BQ5160, 2.00%, 12/1/2050 | | |
Pool # FM5849, 2.00%, 12/1/2050 | | |
Pool # MA4208, 2.00%, 12/1/2050 | | |
Pool # FM5597, 2.00%, 1/1/2051 | | |
Pool # FM6241, 2.00%, 1/1/2051 | | |
Pool # FM5854, 2.50%, 1/1/2051 | | |
Pool # MA4254, 1.50%, 2/1/2051 | | |
Pool # CA9190, 2.00%, 2/1/2051 | | |
Pool # FM6126, 2.00%, 2/1/2051 | | |
Pool # BR3515, 2.50%, 2/1/2051 | | |
Pool # FM6244, 2.00%, 3/1/2051 | | |
Pool # MA4281, 2.00%, 3/1/2051 | | |
Pool # FM6523, 2.50%, 3/1/2051 | | |
Pool # FM6764, 2.50%, 3/1/2051 | | |
Pool # FM6537, 2.00%, 4/1/2051 | | |
Pool # MA4306, 2.50%, 4/1/2051 | | |
Pool # FM7099, 3.00%, 4/1/2051 | | |
SEE NOTES TO FINANCIAL STATEMENTS.
| J.P. Morgan Exchange-Traded Funds | |
| | |
Mortgage-Backed Securities — continued |
Pool # MA4343, 1.50%, 5/1/2051 | | |
Pool # FM7066, 2.50%, 5/1/2051 | | |
Pool # MA4326, 2.50%, 5/1/2051 | | |
Pool # MA4354, 1.50%, 6/1/2051 | | |
Pool # CB0727, 2.50%, 6/1/2051 | | |
Pool # FM7418, 2.50%, 6/1/2051 | | |
Pool # MA4356, 2.50%, 6/1/2051 | | |
Pool # MA4377, 1.50%, 7/1/2051 | | |
Pool # FM8194, 2.00%, 7/1/2051 | | |
Pool # CB1027, 2.50%, 7/1/2051 | | |
Pool # MA4379, 2.50%, 7/1/2051 | | |
Pool # CB1150, 3.00%, 7/1/2051 | | |
Pool # MA4380, 3.00%, 7/1/2051 | | |
Pool # FM8278, 3.50%, 7/1/2051 | | |
Pool # BR2236, 2.50%, 8/1/2051 | | |
Pool # BR2237, 2.50%, 8/1/2051 | | |
Pool # BR2258, 2.50%, 8/1/2051 | | |
Pool # CB1276, 2.50%, 8/1/2051 | | |
Pool # MA4399, 2.50%, 8/1/2051 | | |
Pool # MA4401, 3.50%, 8/1/2051 | | |
Pool # BT0240, 2.00%, 9/1/2051 | | |
Pool # FM8730, 2.00%, 9/1/2051 | | |
Pool # MA4413, 2.00%, 9/1/2051 | | |
Pool # MA4414, 2.50%, 9/1/2051 | | |
Pool # MA4436, 1.50%, 10/1/2051 | | |
Pool # CB1917, 3.00%, 10/1/2051 | | |
Pool # MA4464, 1.50%, 11/1/2051 | | |
Pool # CB2364, 2.00%, 12/1/2051 | | |
Pool # FM9868, 2.50%, 12/1/2051 | | |
Pool # FM9870, 2.50%, 12/1/2051 | | |
Pool # MA4493, 2.50%, 12/1/2051 | | |
Pool # MA4512, 2.50%, 1/1/2052 | | |
Pool # MA4513, 3.00%, 1/1/2052 | | |
Pool # CB2773, 2.00%, 2/1/2052 | | |
Pool # CB2850, 2.00%, 2/1/2052 | | |
Pool # MA4547, 2.00%, 2/1/2052 | | |
Pool # MA4548, 2.50%, 2/1/2052 | | |
Pool # BV4248, 2.00%, 3/1/2052 | | |
Pool # CB3040, 2.00%, 3/1/2052 | | |
Pool # MA4562, 2.00%, 3/1/2052 | | |
Pool # FS2099, 1.50%, 4/1/2052 | | |
Pool # FS1598, 2.00%, 4/1/2052 | | |
Pool # MA4577, 2.00%, 4/1/2052 | | |
Pool # MA4578, 2.50%, 4/1/2052 | | |
Pool # FS1538, 3.00%, 4/1/2052 | | |
| | |
|
Pool # MA4579, 3.00%, 4/1/2052 | | |
Pool # MA4597, 2.00%, 5/1/2052 | | |
Pool # MA4599, 3.00%, 5/1/2052 | | |
Pool # CB3608, 3.50%, 5/1/2052 | | |
Pool # MA4600, 3.50%, 5/1/2052 | | |
Pool # MA4622, 2.00%, 6/1/2052 | | |
Pool # CB4209, 3.50%, 7/1/2052 | | |
Pool # MA4654, 3.50%, 7/1/2052 | | |
Pool # MA4698, 3.00%, 8/1/2052 | | |
Pool # MA4699, 3.50%, 8/1/2052 | | |
Pool # MA4700, 4.00%, 8/1/2052 | | |
Pool # MA4701, 4.50%, 8/1/2052 | | |
Pool # FS2619, 5.00%, 8/1/2052 | | |
Pool # FS3392, 4.00%, 9/1/2052 | | |
Pool # MA4732, 4.00%, 9/1/2052 | | |
Pool # MA4733, 4.50%, 9/1/2052 | | |
Pool # MA4761, 5.00%, 9/1/2052 | | |
Pool # MA4783, 4.00%, 10/1/2052 | | |
Pool # MA4784, 4.50%, 10/1/2052 | | |
Pool # MA4803, 3.50%, 11/1/2052 | | |
Pool # MA4805, 4.50%, 11/1/2052 | | |
Pool # MA4838, 3.50%, 12/1/2052 | | |
Pool # MA4839, 4.00%, 12/1/2052 | | |
Pool # MA4840, 4.50%, 12/1/2052 | | |
Pool # FS3455, 5.00%, 12/1/2052 | | |
Pool # MA4866, 4.00%, 1/1/2053 | | |
Pool # MA4868, 5.00%, 1/1/2053 | | |
Pool # MA4869, 5.50%, 1/1/2053 | | |
Pool # MA4933, 3.50%, 2/1/2053 | | |
Pool # MA4918, 5.00%, 2/1/2053 | | |
Pool # CB5600, 5.50%, 2/1/2053 | | |
Pool # MA4919, 5.50%, 2/1/2053 | | |
Pool # MA4920, 6.00%, 2/1/2053 | | |
Pool # MA4962, 4.00%, 3/1/2053 | | |
Pool # CB5906, 5.50%, 3/1/2053 | | |
Pool # MA4943, 6.50%, 3/1/2053 | | |
Pool # MA4964, 7.00%, 3/1/2053 | | |
Pool # MA4979, 5.50%, 4/1/2053 | | |
Pool # MA5038, 5.00%, 6/1/2053 | | |
Pool # MA5071, 5.00%, 7/1/2053 | | |
Pool # MA5072, 5.50%, 7/1/2053 | | |
Pool # MA5138, 5.50%, 9/1/2053 | | |
Pool # MA5166, 6.00%, 10/1/2053 | | |
Pool # DA4550, 6.50%, 11/1/2053 | | |
Pool # MA5217, 6.50%, 12/1/2053 | | |
SEE NOTES TO FINANCIAL STATEMENTS.
| J.P. Morgan Exchange-Traded Funds | |
JPMorgan BetaBuilders U.S. Aggregate Bond ETF
SCHEDULE OF PORTFOLIO INVESTMENTSAS OF February 29, 2024 (continued)
| | |
Mortgage-Backed Securities — continued |
FNMA/FHLMC UMBS, Single Family, 15 Year | | |
TBA, 1.50%, 3/25/2039 (a) | | |
TBA, 2.00%, 3/25/2039 (a) | | |
TBA, 2.50%, 3/25/2039 (a) | | |
TBA, 3.00%, 3/25/2039 (a) | | |
TBA, 3.50%, 3/25/2039 (a) | | |
TBA, 4.00%, 3/25/2039 (a) | | |
TBA, 4.50%, 3/25/2039 (a) | | |
FNMA/FHLMC UMBS, Single Family, 30 Year | | |
TBA, 2.00%, 3/25/2054 (a) | | |
TBA, 2.50%, 3/25/2054 (a) | | |
TBA, 3.00%, 3/25/2054 (a) | | |
TBA, 4.00%, 3/25/2054 (a) | | |
TBA, 5.00%, 3/25/2054 (a) | | |
TBA, 5.50%, 3/25/2054 (a) | | |
TBA, 6.00%, 3/25/2054 (a) | | |
TBA, 6.50%, 3/25/2054 (a) | | |
| | |
Pool # 704155, 5.50%, 1/15/2039 | | |
Pool # 726769, 5.00%, 9/15/2039 | | |
Pool # 721340, 5.00%, 12/15/2039 | | |
Pool # 754439, 3.50%, 12/15/2041 | | |
Pool # 711674, 3.00%, 9/15/2042 | | |
Pool # 783748, 3.50%, 4/15/2043 | | |
Pool # 784660, 4.00%, 4/15/2043 | | |
Pool # AC2224, 3.50%, 6/15/2043 | | |
Pool # 785088, 3.50%, 7/15/2043 | | |
Pool # AJ4151, 4.00%, 9/15/2044 | | |
Pool # AL9314, 3.00%, 3/15/2045 | | |
Pool # 784664, 4.00%, 4/15/2045 | | |
Pool # AO0544, 3.00%, 8/15/2045 | | |
Pool # 627030, 3.00%, 12/15/2045 | | |
Pool # 784429, 3.00%, 8/15/2046 | | |
Pool # 784652, 4.00%, 11/15/2047 | | |
Pool # 784766, 3.50%, 3/15/2048 | | |
| | |
Pool # MA0513, 2.50%, 11/20/2027 | | |
Pool # MA4625, 3.50%, 8/20/2032 | | |
Pool # MA6906, 2.50%, 10/20/2035 | | |
| | |
Pool # 711773, 3.50%, 6/20/2033 | | |
Pool # 3459, 5.50%, 10/20/2033 | | |
Pool # AQ5932, 3.50%, 1/20/2036 | | |
Pool # 4222, 6.00%, 8/20/2038 | | |
Pool # 709148, 4.50%, 2/20/2039 | | |
| | |
|
Pool # 4446, 4.50%, 5/20/2039 | | |
Pool # 4467, 4.00%, 6/20/2039 | | |
Pool # 4468, 4.50%, 6/20/2039 | | |
Pool # 4494, 4.00%, 7/20/2039 | | |
Pool # 4495, 4.50%, 7/20/2039 | | |
Pool # 4519, 4.50%, 8/20/2039 | | |
Pool # 4558, 4.50%, 10/20/2039 | | |
Pool # 4576, 4.00%, 11/20/2039 | | |
Pool # 4598, 4.50%, 12/20/2039 | | |
Pool # 4617, 4.50%, 1/20/2040 | | |
Pool # 4656, 4.00%, 3/20/2040 | | |
Pool # 4677, 4.00%, 4/20/2040 | | |
Pool # 4678, 4.50%, 4/20/2040 | | |
Pool # 4695, 4.00%, 5/20/2040 | | |
Pool # 4712, 4.00%, 6/20/2040 | | |
Pool # 4800, 4.00%, 9/20/2040 | | |
Pool # 737727, 4.00%, 12/20/2040 | | |
Pool # 4945, 4.00%, 2/20/2041 | | |
Pool # 759342, 4.50%, 2/20/2041 | | |
Pool # 4950, 5.50%, 2/20/2041 | | |
Pool # 4976, 3.50%, 3/20/2041 | | |
Pool # 4977, 4.00%, 3/20/2041 | | |
Pool # 5016, 4.00%, 4/20/2041 | | |
Pool # 5054, 4.00%, 5/20/2041 | | |
Pool # 5114, 4.00%, 7/20/2041 | | |
Pool # 779497, 3.50%, 10/20/2041 | | |
Pool # 5233, 4.00%, 11/20/2041 | | |
Pool # 5258, 3.50%, 12/20/2041 | | |
Pool # 5259, 4.00%, 12/20/2041 | | |
Pool # 5279, 3.50%, 1/20/2042 | | |
Pool # 5330, 3.00%, 3/20/2042 | | |
Pool # 754406, 3.50%, 5/20/2042 | | |
Pool # 796468, 4.00%, 9/20/2042 | | |
Pool # AA6040, 3.00%, 1/20/2043 | | |
Pool # AD1584, 3.00%, 1/20/2043 | | |
Pool # AD2125, 3.50%, 1/20/2043 | | |
Pool # AA6054, 3.00%, 2/20/2043 | | |
Pool # AD1744, 3.00%, 2/20/2043 | | |
Pool # 783755, 3.00%, 4/20/2043 | | |
Pool # 783976, 3.50%, 4/20/2043 | | |
Pool # MA1284, 3.00%, 9/20/2043 | | |
Pool # 785065, 3.50%, 10/20/2043 | | |
Pool # MA1376, 4.00%, 10/20/2043 | | |
Pool # AI7106, 4.00%, 6/20/2044 | | |
Pool # 784026, 3.50%, 12/20/2044 | | |
SEE NOTES TO FINANCIAL STATEMENTS.
| J.P. Morgan Exchange-Traded Funds | |
| | |
Mortgage-Backed Securities — continued |
Pool # MA2678, 3.50%, 3/20/2045 | | |
Pool # MA2679, 4.00%, 3/20/2045 | | |
Pool # MA2753, 3.00%, 4/20/2045 | | |
Pool # 626942, 3.00%, 5/20/2045 | | |
Pool # MA2829, 5.00%, 5/20/2045 | | |
Pool # 784800, 3.00%, 6/20/2045 | | |
Pool # AM9881, 3.00%, 6/20/2045 | | |
Pool # AO9442, 3.50%, 12/20/2045 | | |
Pool # 784119, 3.00%, 2/20/2046 | | |
Pool # MA3458, 5.50%, 2/20/2046 | | |
Pool # MA3735, 3.00%, 6/20/2046 | | |
Pool # AT7138, 3.50%, 6/20/2046 | | |
Pool # MA3935, 2.50%, 9/20/2046 | | |
Pool # 784768, 3.00%, 9/20/2046 | | |
Pool # AT8215, 3.00%, 9/20/2046 | | |
Pool # MA4002, 2.50%, 10/20/2046 | | |
Pool # AW0199, 3.00%, 10/20/2046 | | |
Pool # MA4072, 5.00%, 11/20/2046 | | |
Pool # MA4125, 2.50%, 12/20/2046 | | |
Pool # MA4126, 3.00%, 12/20/2046 | | |
Pool # MA4260, 2.50%, 2/20/2047 | | |
Pool # AZ3119, 3.50%, 3/20/2047 | | |
Pool # AZ7084, 3.50%, 4/20/2047 | | |
Pool # MA4511, 4.00%, 6/20/2047 | | |
Pool # BA5041, 5.00%, 6/20/2047 | | |
Pool # MA4584, 2.50%, 7/20/2047 | | |
Pool # MA4718, 3.00%, 9/20/2047 | | |
Pool # BC2742, 3.50%, 11/20/2047 | | |
Pool # BD6940, 3.50%, 12/20/2047 | | |
Pool # MA5019, 3.50%, 2/20/2048 | | |
Pool # 785033, 3.50%, 5/20/2048 | | |
Pool # MA5329, 3.50%, 7/20/2048 | | |
Pool # MA5468, 5.00%, 9/20/2048 | | |
Pool # MA5527, 3.50%, 10/20/2048 | | |
Pool # MA5595, 4.00%, 11/20/2048 | | |
Pool # BJ6759, 4.50%, 11/20/2048 | | |
Pool # MA5651, 4.00%, 12/20/2048 | | |
Pool # MA5709, 3.50%, 1/20/2049 | | |
Pool # BI6473, 4.00%, 1/20/2049 | | |
Pool # BJ9901, 3.00%, 2/20/2049 | | |
Pool # MA5983, 2.50%, 6/20/2049 | | |
Pool # MA5985, 3.50%, 6/20/2049 | | |
Pool # BM5450, 4.50%, 7/20/2049 | | |
Pool # MA6220, 4.00%, 10/20/2049 | | |
Pool # BR4627, 3.00%, 11/20/2049 | | |
| | |
|
Pool # MA6283, 3.00%, 11/20/2049 | | |
Pool # 785067, 3.50%, 12/20/2049 | | |
Pool # MA6478, 5.00%, 2/20/2050 | | |
Pool # MA6542, 3.50%, 3/20/2050 | | |
Pool # BV1348, 2.50%, 6/20/2050 | | |
Pool # MA6818, 2.00%, 8/20/2050 | | |
Pool # BY8818, 2.00%, 10/20/2050 | | |
Pool # 785401, 2.50%, 10/20/2050 | | |
Pool # MA6994, 2.00%, 11/20/2050 | | |
Pool # BY8832, 2.50%, 11/20/2050 | | |
Pool # MA7051, 2.00%, 12/20/2050 | | |
Pool # CA4485, 2.50%, 12/20/2050 | | |
Pool # MA7052, 2.50%, 12/20/2050 | | |
Pool # MA7055, 4.00%, 12/20/2050 | | |
Pool # MA7135, 2.00%, 1/20/2051 | | |
Pool # MA7254, 2.00%, 3/20/2051 | | |
Pool # 785449, 3.00%, 4/20/2051 | | |
Pool # MA7417, 2.00%, 6/20/2051 | | |
Pool # MA7418, 2.50%, 6/20/2051 | | |
Pool # MA7420, 3.50%, 6/20/2051 | | |
Pool # MA7473, 3.00%, 7/20/2051 | | |
Pool # MA7588, 2.00%, 9/20/2051 | | |
Pool # MA7766, 2.00%, 12/20/2051 | | |
Pool # MA7826, 2.00%, 1/20/2052 | | |
Pool # 785881, 2.50%, 1/20/2052 | | |
Pool # 785945, 3.00%, 2/20/2052 | | |
Pool # 786017, 3.00%, 3/20/2052 | | |
Pool # MA7986, 2.00%, 4/20/2052 | | |
Pool # MA7988, 3.00%, 4/20/2052 | | |
Pool # MA8043, 3.00%, 5/20/2052 | | |
Pool # MA8147, 2.50%, 7/20/2052 | | |
Pool # MA8199, 3.50%, 8/20/2052 | | |
Pool # MA8267, 4.00%, 9/20/2052 | | |
Pool # MA8269, 5.00%, 9/20/2052 | | |
Pool # MA8270, 5.50%, 9/20/2052 | | |
Pool # MA8346, 4.00%, 10/20/2052 | | |
Pool # MA8492, 6.00%, 12/20/2052 | | |
Pool # MA8493, 6.50%, 12/20/2052 | | |
Pool # MA8573, 7.00%, 1/20/2053 | | |
Pool # MA8800, 5.00%, 4/20/2053 | | |
Pool # 786633, 6.00%, 4/20/2053 | | |
Pool # MA8947, 5.00%, 6/20/2053 | | |
Pool # MA8948, 5.50%, 6/20/2053 | | |
Pool # MA9015, 4.50%, 7/20/2053 | | |
Pool # MA9017, 5.50%, 7/20/2053 | | |
SEE NOTES TO FINANCIAL STATEMENTS.
| J.P. Morgan Exchange-Traded Funds | |
JPMorgan BetaBuilders U.S. Aggregate Bond ETF
SCHEDULE OF PORTFOLIO INVESTMENTSAS OF February 29, 2024 (continued)
| | |
Mortgage-Backed Securities — continued |
Pool # MA9018, 6.00%, 7/20/2053 | | |
Pool # MA9019, 6.50%, 7/20/2053 | | |
Pool # MA9105, 5.00%, 8/20/2053 | | |
Pool # MA9174, 7.00%, 9/20/2053 | | |
GNMA II, Single Family, 30 Year | | |
TBA, 2.00%, 3/15/2054 (a) | | |
TBA, 2.50%, 3/15/2054 (a) | | |
TBA, 3.00%, 3/15/2054 (a) | | |
TBA, 3.50%, 3/15/2054 (a) | | |
TBA, 4.00%, 3/15/2054 (a) | | |
TBA, 4.50%, 3/15/2054 (a) | | |
Total Mortgage-Backed Securities
(Cost $468,094,369) | | |
|
Aerospace & Defense — 0.6% |
|
| | |
| | |
| | |
| | |
| | |
Huntington Ingalls Industries, Inc. 3.48%, 12/1/2027 | | |
L3Harris Technologies, Inc. 4.85%, 4/27/2035 | | |
Lockheed Martin Corp. 3.60%, 3/1/2035 | | |
|
| | |
| | |
| | |
Precision Castparts Corp. 4.38%, 6/15/2045 | | |
|
| | |
| | |
| | |
| | |
| | |
|
| | |
| | |
| | |
Air Freight & Logistics — 0.1% |
CH Robinson Worldwide, Inc. 4.20%, 4/15/2028 | | |
| | |
|
Air Freight & Logistics — continued |
|
| | |
| | |
| | |
| | |
United Parcel Service, Inc. |
| | |
| | |
| | |
| | |
Automobile Components — 0.0% ^ |
BorgWarner, Inc. 2.65%, 7/1/2027 | | |
Lear Corp. 5.25%, 5/15/2049 | | |
Magna International, Inc. (Canada) 4.15%, 10/1/2025 | | |
| | |
|
Ford Motor Co. 9.63%, 4/22/2030 | | |
|
| | |
| | |
| | |
Mercedes-Benz Finance North America LLC (Germany) 8.50%, 1/18/2031 | | |
Toyota Motor Corp. (Japan) 1.34%, 3/25/2026 | | |
| | |
|
Australia & New Zealand Banking Group Ltd. (Australia) 5.38%, 7/3/2025 | | |
Banco Santander SA (Spain) |
| | |
| | |
|
| | |
(SOFR + 1.75%), 4.83%, 7/22/2026 (b) | | |
| | |
| | |
(SOFR + 1.01%), 1.20%, 10/24/2026 (b) | | |
Series N, (SOFR + 0.91%), 1.66%, 3/11/2027 (b) | | |
(SOFR + 1.05%), 2.55%, 2/4/2028 (b) | | |
(3-MONTH CME TERM SOFR + 1.30%), 3.42%, 12/20/2028 (b) | | |
SEE NOTES TO FINANCIAL STATEMENTS.
| J.P. Morgan Exchange-Traded Funds | |
| | |
Corporate Bonds — continued |
|
(SOFR + 1.06%), 2.09%, 6/14/2029 (b) | | |
(3-MONTH CME TERM SOFR + 1.57%), 4.27%, 7/23/2029 (b) | | |
(3-MONTH CME TERM SOFR + 1.47%), 3.97%, 2/7/2030 (b) | | |
(3-MONTH CME TERM SOFR + 1.25%), 2.50%, 2/13/2031 (b) | | |
(SOFR + 1.37%), 1.92%, 10/24/2031 (b) | | |
Series N, (SOFR + 1.22%), 2.65%, 3/11/2032 (b) | | |
(SOFR + 1.83%), 4.57%, 4/27/2033 (b) | | |
(US Treasury Yield Curve Rate T Note Constant Maturity 5 Year + 1.20%), 2.48%, 9/21/2036 (b) | | |
(SOFR + 1.58%), 3.31%, 4/22/2042 (b) | | |
| | |
(3-MONTH CME TERM SOFR + 2.25%), 4.44%, 1/20/2048 (b) | | |
(3-MONTH CME TERM SOFR + 1.45%), 3.95%, 1/23/2049 (b) | | |
(3-MONTH CME TERM SOFR + 3.41%), 4.08%, 3/20/2051 (b) | | |
Series N, (SOFR + 1.65%), 3.48%, 3/13/2052 (b) | | |
Bank of Montreal (Canada) |
| | |
(SOFR + 0.60%), 0.95%, 1/22/2027 (b) | | |
| | |
Bank of Nova Scotia (The) (Canada) |
| | |
| | |
| | |
Barclays plc (United Kingdom) |
| | |
(US Treasury Yield Curve Rate T Note Constant Maturity 1 Year + 1.30%), 2.89%, 11/24/2032 (b) | | |
(US Treasury Yield Curve Rate T Note Constant Maturity 1 Year + 3.00%), 5.75%, 8/9/2033 (b) | | |
|
| | |
| | |
| | |
| | |
(3-MONTH CME TERM SOFR + 1.60%), 3.98%, 3/20/2030 (b) | | |
| | |
|
|
(SOFR + 1.42%), 2.98%, 11/5/2030 (b) | | |
(SOFR + 3.91%), 4.41%, 3/31/2031 (b) | | |
(SOFR + 2.11%), 2.57%, 6/3/2031 (b) | | |
| | |
(SOFR + 1.18%), 2.52%, 11/3/2032 (b) | | |
(SOFR + 1.35%), 3.06%, 1/25/2033 (b) | | |
(SOFR + 2.09%), 4.91%, 5/24/2033 (b) | | |
| | |
(SOFR + 2.34%), 6.27%, 11/17/2033 (b) | | |
Cooperatieve Rabobank UA (Netherlands) 3.75%, 7/21/2026 | | |
Fifth Third Bancorp (SOFR + 2.34%), 6.34%, 7/27/2029 (b) | | |
First-Citizens Bank & Trust Co. (3-MONTH CME TERM SOFR + 1.72%), 2.97%, 9/27/2025 (b) | | |
HSBC Holdings plc (United Kingdom) |
(SOFR + 1.54%), 1.65%, 4/18/2026 (b) | | |
(SOFR + 1.93%), 2.10%, 6/4/2026 (b) | | |
(SOFR + 3.03%), 7.34%, 11/3/2026 (b) | | |
(SOFR + 1.97%), 6.16%, 3/9/2029 (b) | | |
(3-MONTH CME TERM SOFR + 1.80%), 4.58%, 6/19/2029 (b) | | |
(SOFR + 2.39%), 2.85%, 6/4/2031 (b) | | |
(SOFR + 1.95%), 2.36%, 8/18/2031 (b) | | |
| | |
HSBC USA, Inc. 5.63%, 3/17/2025 | | |
Huntington National Bank (The) (SOFRINDX + 1.65%), 4.55%, 5/17/2028 (b) (c) | | |
ING Groep NV (Netherlands) |
| | |
(SOFR + 1.01%), 1.73%, 4/1/2027 (b) | | |
KeyBank NA 4.70%, 1/26/2026 | | |
KeyCorp (SOFRINDX + 2.06%), 4.79%, 6/1/2033 (b) | | |
Korea Development Bank (The) (South Korea) 1.00%, 9/9/2026 | | |
Kreditanstalt fuer Wiederaufbau (Germany) |
| | |
| | |
Landwirtschaftliche Rentenbank (Germany) 0.88%, 3/30/2026 | | |
Lloyds Banking Group plc (United Kingdom) 4.45%, 5/8/2025 | | |
M&T Bank Corp. (SOFR + 1.85%), 5.05%, 1/27/2034 (b) | | |
SEE NOTES TO FINANCIAL STATEMENTS.
| J.P. Morgan Exchange-Traded Funds | |
JPMorgan BetaBuilders U.S. Aggregate Bond ETF
SCHEDULE OF PORTFOLIO INVESTMENTSAS OF February 29, 2024 (continued)
| | |
Corporate Bonds — continued |
|
Mitsubishi UFJ Financial Group, Inc. (Japan) 3.75%, 7/18/2039 | | |
Mizuho Financial Group, Inc. (Japan) 4.02%, 3/5/2028 | | |
NatWest Group plc (United Kingdom) (US Treasury Yield Curve Rate T Note Constant Maturity 1 Year + 2.55%), 3.07%, 5/22/2028 (b) | | |
Oesterreichische Kontrollbank AG (Austria) |
| | |
| | |
PNC Bank NA 3.10%, 10/25/2027 | | |
PNC Financial Services Group, Inc. (The) (SOFR + 1.93%), 5.07%, 1/24/2034 (b) | | |
Royal Bank of Canada (Canada) 6.00%, 11/1/2027 | | |
Santander Holdings USA, Inc. (SOFR + 2.70%), 6.57%, 6/12/2029 (b) | | |
Santander UK Group Holdings plc (United Kingdom) (US Treasury Yield Curve Rate T Note Constant Maturity 1 Year + 1.25%), 1.53%, 8/21/2026 (b) | | |
Sumitomo Mitsui Financial Group, Inc. (Japan) |
| | |
| | |
| | |
| | |
| | |
Toronto-Dominion Bank (The) (Canada) |
| | |
| | |
| | |
| | |
| | |
|
(SOFR + 0.61%), 1.27%, 3/2/2027 (b) | | |
| | |
US Bancorp (SOFR + 2.11%), 4.97%, 7/22/2033 (b) | | |
|
(3-MONTH CME TERM SOFR + 1.09%), 2.41%, 10/30/2025 (b) | | |
| | |
(SOFR + 2.00%), 2.19%, 4/30/2026 (b) | | |
| | |
| | |
| | |
| | |
|
|
(3-MONTH CME TERM SOFR + 1.57%), 3.58%, 5/22/2028 (b) | | |
(SOFR + 2.10%), 2.39%, 6/2/2028 (b) | | |
| | |
(3-MONTH CME TERM SOFR + 1.43%), 2.88%, 10/30/2030 (b) | | |
(3-MONTH CME TERM SOFR + 4.03%), 4.48%, 4/4/2031 (b) | | |
(SOFR + 1.99%), 5.56%, 7/25/2034 (b) | | |
| | |
(SOFR + 2.53%), 3.07%, 4/30/2041 (b) | | |
| | |
| | |
Westpac Banking Corp. (Australia) |
| | |
| | |
(US Treasury Yield Curve Rate T Note Constant Maturity 5 Year + 1.35%), 2.89%, 2/4/2030 (b) (d) | | |
| | |
|
Anheuser-Busch Cos. LLC (Belgium) 4.70%, 2/1/2036 | | |
Anheuser-Busch InBev Finance, Inc. (Belgium) 4.70%, 2/1/2036 | | |
Anheuser-Busch InBev Worldwide, Inc. (Belgium) |
| | |
| | |
| | |
| | |
| | |
|
| | |
| | |
| | |
| | |
| | |
Constellation Brands, Inc. 3.60%, 2/15/2028 | | |
Diageo Capital plc (United Kingdom) |
| | |
| | |
|
| | |
| | |
| | |
SEE NOTES TO FINANCIAL STATEMENTS.
| J.P. Morgan Exchange-Traded Funds | |
| | |
Corporate Bonds — continued |
|
| | |
| | |
|
| | |
| | |
| | |
|
|
| | |
| | |
| | |
| | |
| | |
| | |
|
| | |
| | |
| | |
| | |
| | |
| | |
| | |
| | |
| | |
| | |
Biogen, Inc. 2.25%, 5/1/2030 | | |
|
| | |
| | |
| | |
| | |
| | |
| | |
| | |
Regeneron Pharmaceuticals, Inc. 2.80%, 9/15/2050 | | |
| | |
|
|
| | |
| | |
| | |
| | |
| | |
|
Broadline Retail — continued |
eBay, Inc. 4.00%, 7/15/2042 | | |
JD.com, Inc. (China) 3.38%, 1/14/2030 | | |
| | |
|
|
| | |
| | |
| | |
Fortune Brands Innovations, Inc. 4.00%, 3/25/2032 | | |
Johnson Controls International plc |
| | |
| | |
|
| | |
| | |
| | |
|
Ares Capital Corp. 3.88%, 1/15/2026 | | |
Bank of New York Mellon Corp. (The) Series J, (SOFR + 1.61%), 4.97%, 4/26/2034 (b) | | |
Blackstone Private Credit Fund 3.25%, 3/15/2027 | | |
Cboe Global Markets, Inc. 3.65%, 1/12/2027 | | |
Charles Schwab Corp. (The) |
| | |
| | |
CME Group, Inc. 4.15%, 6/15/2048 | | |
Credit Suisse AG (Switzerland) 1.25%, 8/7/2026 | | |
Credit Suisse USA, Inc. (Switzerland) 7.13%, 7/15/2032 | | |
Deutsche Bank AG (Germany) |
(SOFR + 1.87%), 2.13%, 11/24/2026 (b) | | |
(SOFR + 1.22%), 2.31%, 11/16/2027 (b) | | |
(SOFR + 2.51%), 6.82%, 11/20/2029 (b) | | |
(SOFR + 3.65%), 7.08%, 2/10/2034 (b) | | |
Eaton Vance Corp. 3.50%, 4/6/2027 | | |
FactSet Research Systems, Inc. 2.90%, 3/1/2027 | | |
|
| | |
| | |
SEE NOTES TO FINANCIAL STATEMENTS.
| J.P. Morgan Exchange-Traded Funds | |
JPMorgan BetaBuilders U.S. Aggregate Bond ETF
SCHEDULE OF PORTFOLIO INVESTMENTSAS OF February 29, 2024 (continued)
| | |
Corporate Bonds — continued |
Capital Markets — continued |
Goldman Sachs Group, Inc. (The) |
(SOFR + 0.79%), 1.09%, 12/9/2026 (b) | | |
(SOFR + 0.80%), 1.43%, 3/9/2027 (b) | | |
(SOFR + 1.11%), 2.64%, 2/24/2028 (b) | | |
(3-MONTH CME TERM SOFR + 1.42%), 3.81%, 4/23/2029 (b) | | |
(3-MONTH CME TERM SOFR + 1.56%), 4.22%, 5/1/2029 (b) | | |
| | |
(SOFR + 1.09%), 1.99%, 1/27/2032 (b) | | |
(SOFR + 1.28%), 2.62%, 4/22/2032 (b) | | |
(SOFR + 1.25%), 2.38%, 7/21/2032 (b) | | |
| | |
(SOFR + 1.41%), 3.10%, 2/24/2033 (b) | | |
| | |
(SOFR + 1.63%), 3.44%, 2/24/2043 (b) | | |
| | |
| | |
Intercontinental Exchange, Inc. |
| | |
| | |
Jefferies Financial Group, Inc. 4.15%, 1/23/2030 | | |
Moody's Corp. 4.25%, 2/1/2029 | | |
|
| | |
(SOFR + 0.72%), 0.99%, 12/10/2026 (b) | | |
| | |
| | |
(SOFR + 0.88%), 1.59%, 5/4/2027 (b) | | |
(SOFR + 1.00%), 2.48%, 1/21/2028 (b) | | |
| | |
(3-MONTH CME TERM SOFR + 1.40%), 3.77%, 1/24/2029 (b) | | |
(SOFR + 1.14%), 2.70%, 1/22/2031 (b) | | |
(SOFR + 1.03%), 1.79%, 2/13/2032 (b) | | |
(SOFR + 1.02%), 1.93%, 4/28/2032 (b) | | |
(SOFR + 1.18%), 2.24%, 7/21/2032 (b) | | |
(SOFR + 1.88%), 5.42%, 7/21/2034 (b) | | |
(SOFR + 1.49%), 3.22%, 4/22/2042 (b) | | |
| | |
|
| | |
| | |
| | |
|
Capital Markets — continued |
Nomura Holdings, Inc. (Japan) |
| | |
| | |
Raymond James Financial, Inc. 4.95%, 7/15/2046 | | |
S&P Global, Inc. 3.70%, 3/1/2052 | | |
|
| | |
(SOFR + 0.94%), 2.35%, 11/1/2025 (b) | | |
(SOFR + 1.72%), 5.82%, 11/4/2028 (b) | | |
(SOFR + 1.57%), 4.82%, 1/26/2034 (b) | | |
| | |
|
Air Products and Chemicals, Inc. 4.80%, 3/3/2033 | | |
Albemarle Corp. 5.05%, 6/1/2032 | | |
|
| | |
| | |
|
| | |
| | |
| | |
| | |
DuPont de Nemours, Inc. 4.73%, 11/15/2028 | | |
|
| | |
| | |
|
| | |
| | |
FMC Corp. 3.45%, 10/1/2029 | | |
Huntsman International LLC 4.50%, 5/1/2029 | | |
LYB International Finance III LLC 2.25%, 10/1/2030 | | |
Sherwin-Williams Co. (The) |
| | |
| | |
| | |
| | |
SEE NOTES TO FINANCIAL STATEMENTS.
| J.P. Morgan Exchange-Traded Funds | |
| | |
Corporate Bonds — continued |
|
| | |
Westlake Corp. 5.00%, 8/15/2046 | | |
| | |
Commercial Services & Supplies — 0.1% |
Cintas Corp. No. 2 3.70%, 4/1/2027 | | |
RELX Capital, Inc. (United Kingdom) 4.75%, 5/20/2032 | | |
Republic Services, Inc. 2.38%, 3/15/2033 | | |
|
| | |
| | |
| | |
| | |
|
| | |
| | |
| | |
Communications Equipment — 0.1% |
|
| | |
| | |
Motorola Solutions, Inc. 5.60%, 6/1/2032 | | |
| | |
Construction Materials — 0.0% ^ |
Martin Marietta Materials, Inc. Series CB, 2.50%, 3/15/2030 | | |
|
| | |
| | |
| | |
|
AerCap Ireland Capital DAC (Ireland) |
| | |
| | |
| | |
| | |
| | |
Ally Financial, Inc. 2.20%, 11/2/2028 | | |
|
| | |
| | |
(SOFR + 1.00%), 4.99%, 5/1/2026 (b) | | |
| | |
| | |
|
Consumer Finance — continued |
(SOFR + 0.97%), 5.39%, 7/28/2027 (b) | | |
American Honda Finance Corp. |
| | |
| | |
| | |
Capital One Financial Corp. |
| | |
| | |
| | |
(SOFR + 2.08%), 5.47%, 2/1/2029 (b) | | |
Caterpillar Financial Services Corp. |
| | |
| | |
| | |
Discover Financial Services 3.95%, 11/6/2024 | | |
Ford Motor Credit Co. LLC |
| | |
| | |
| | |
| | |
General Motors Financial Co., Inc. |
| | |
| | |
| | |
| | |
| | |
|
| | |
| | |
| | |
PACCAR Financial Corp. 3.55%, 8/11/2025 | | |
|
| | |
| | |
| | |
Toyota Motor Credit Corp. |
| | |
| | |
| | |
| | |
| | |
| | |
SEE NOTES TO FINANCIAL STATEMENTS.
| J.P. Morgan Exchange-Traded Funds | |
JPMorgan BetaBuilders U.S. Aggregate Bond ETF
SCHEDULE OF PORTFOLIO INVESTMENTSAS OF February 29, 2024 (continued)
| | |
Corporate Bonds — continued |
Consumer Staples Distribution & Retail — 0.3% |
|
| | |
| | |
| | |
|
| | |
| | |
Dollar Tree, Inc. 2.65%, 12/1/2031 | | |
|
| | |
| | |
Sysco Corp. 2.40%, 2/15/2030 | | |
Target Corp. 2.95%, 1/15/2052 | | |
|
| | |
| | |
| | |
| | |
Containers & Packaging — 0.1% |
Avery Dennison Corp. 4.88%, 12/6/2028 | | |
Berry Global, Inc. 1.57%, 1/15/2026 | | |
|
| | |
| | |
WestRock MWV LLC 7.95%, 2/15/2031 | | |
|
| | |
| | |
| | |
Diversified Consumer Services — 0.1% |
George Washington University (The) Series 2018, 4.13%, 9/15/2048 | | |
Georgetown University (The) Series B, 4.32%, 4/1/2049 | | |
Trustees of Boston College 3.13%, 7/1/2052 | | |
Trustees of Princeton University (The) Series 2020, 2.52%, 7/1/2050 | | |
Trustees of the University of Pennsylvania (The) 3.61%, 2/15/2119 | | |
University of Miami Series 2022, 4.06%, 4/1/2052 | | |
| | |
|
Digital Realty Trust LP 3.70%, 8/15/2027 | | |
| | |
|
Diversified REITs — continued |
GLP Capital LP 4.00%, 1/15/2030 | | |
|
| | |
| | |
| | |
| | |
|
| | |
| | |
WP Carey, Inc. 3.85%, 7/15/2029 | | |
| | |
Diversified Telecommunication Services — 0.8% |
|
| | |
| | |
| | |
| | |
| | |
| | |
| | |
| | |
| | |
| | |
| | |
| | |
| | |
Bell Canada (The) (Canada) |
Series US-5, 2.15%, 2/15/2032 | | |
| | |
Deutsche Telekom International Finance BV (Germany) 9.25%, 6/1/2032 | | |
Orange SA (France) 5.38%, 1/13/2042 | | |
Telefonica Emisiones SA (Spain) |
| | |
| | |
TELUS Corp. (Canada) 3.40%, 5/13/2032 | | |
Verizon Communications, Inc. |
| | |
| | |
| | |
| | |
| | |
| | |
| | |
SEE NOTES TO FINANCIAL STATEMENTS.
| J.P. Morgan Exchange-Traded Funds | |
| | |
Corporate Bonds — continued |
Diversified Telecommunication Services — continued |
| | |
| | |
| | |
| | |
| | |
| | |
| | |
Electric Utilities — 1.4% |
|
| | |
Series B, 3.70%, 12/1/2047 | | |
| | |
American Electric Power Co., Inc. 5.63%, 3/1/2033 | | |
Arizona Public Service Co. 4.35%, 11/15/2045 | | |
Avangrid, Inc. 3.80%, 6/1/2029 | | |
CenterPoint Energy Houston Electric LLC |
Series ai., 4.45%, 10/1/2032 | | |
Series K2, 6.95%, 3/15/2033 | | |
Series AD, 2.90%, 7/1/2050 | | |
Series AF, 3.35%, 4/1/2051 | | |
|
| | |
Series 130, 3.13%, 3/15/2051 | | |
Connecticut Light and Power Co. (The) 5.25%, 1/15/2053 | | |
Dominion Energy South Carolina, Inc. 5.10%, 6/1/2065 | | |
|
Series A, 1.90%, 4/1/2028 | | |
| | |
| | |
| | |
| | |
Series B, 3.25%, 4/1/2051 | | |
Duke Energy Carolinas LLC |
| | |
| | |
| | |
| | |
| | |
Duke Energy Corp. 3.75%, 9/1/2046 | | |
|
| | |
| | |
|
Electric Utilities — continued |
| | |
|
| | |
| | |
|
| | |
| | |
|
| | |
| | |
Enel Americas SA (Chile) 4.00%, 10/25/2026 | | |
|
| | |
| | |
|
| | |
| | |
Entergy Louisiana LLC 0.95%, 10/1/2024 | | |
Entergy Mississippi LLC 3.50%, 6/1/2051 | | |
Evergy Metro, Inc. Series 2020, 2.25%, 6/1/2030 | | |
Evergy, Inc. 2.45%, 9/15/2024 | | |
|
Series L, 2.90%, 10/1/2024 | | |
| | |
|
| | |
| | |
Florida Power & Light Co. |
| | |
| | |
Georgia Power Co. 4.95%, 5/17/2033 | | |
Hydro-Quebec (Canada) 8.50%, 12/1/2029 | | |
Iberdrola International BV (Spain) 5.81%, 3/15/2025 | | |
Interstate Power and Light Co. |
| | |
| | |
ITC Holdings Corp. 3.35%, 11/15/2027 | | |
|
| | |
| | |
NextEra Energy Capital Holdings, Inc. |
| | |
SEE NOTES TO FINANCIAL STATEMENTS.
| J.P. Morgan Exchange-Traded Funds | |
JPMorgan BetaBuilders U.S. Aggregate Bond ETF
SCHEDULE OF PORTFOLIO INVESTMENTSAS OF February 29, 2024 (continued)
| | |
Corporate Bonds — continued |
Electric Utilities — continued |
| | |
| | |
| | |
| | |
| | |
Northern States Power Co. |
| | |
| | |
|
| | |
| | |
| | |
Oklahoma Gas and Electric Co. |
| | |
| | |
Oncor Electric Delivery Co. LLC |
| | |
| | |
Pacific Gas and Electric Co. |
| | |
| | |
| | |
| | |
| | |
|
| | |
| | |
PG&E Wildfire Recovery Funding LLC Series A-4, 4.45%, 12/1/2047 | | |
Potomac Electric Power Co. 4.15%, 3/15/2043 | | |
Public Service Co. of Colorado 2.70%, 1/15/2051 | | |
Public Service Co. of New Hampshire 5.35%, 10/1/2033 | | |
Public Service Electric and Gas Co. |
| | |
| | |
| | |
SCE Recovery Funding LLC Series A-2, 2.94%, 11/15/2042 | | |
|
Series A, 3.70%, 4/30/2030 | | |
| | |
| | |
|
Electric Utilities — continued |
Series B, (US Treasury Yield Curve Rate T Note Constant Maturity 5 Year + 3.73%), 4.00%, 1/15/2051 (b) | | |
Southwestern Electric Power Co. |
Series N, 1.65%, 3/15/2026 | | |
Series J, 3.90%, 4/1/2045 | | |
| | |
Tampa Electric Co. 4.35%, 5/15/2044 | | |
Virginia Electric and Power Co. |
Series B, 2.95%, 11/15/2026 | | |
Series A, 3.80%, 4/1/2028 | | |
| | |
Series B, 3.80%, 9/15/2047 | | |
Wisconsin Electric Power Co. 4.30%, 10/15/2048 | | |
|
| | |
| | |
| | |
Electrical Equipment — 0.0% ^ |
Eaton Corp. 4.15%, 3/15/2033 | | |
Electronic Equipment, Instruments & Components — 0.1% |
|
| | |
| | |
Arrow Electronics, Inc. 2.95%, 2/15/2032 | | |
Keysight Technologies, Inc. 3.00%, 10/30/2029 | | |
Teledyne Technologies, Inc. 2.75%, 4/1/2031 | | |
Trimble, Inc. 6.10%, 3/15/2033 | | |
| | |
Energy Equipment & Services — 0.1% |
|
| | |
| | |
Helmerich & Payne, Inc. 2.90%, 9/29/2031 | | |
NOV, Inc. 3.60%, 12/1/2029 | | |
Patterson-UTI Energy, Inc. 7.15%, 10/1/2033 | | |
| | |
|
|
| | |
SEE NOTES TO FINANCIAL STATEMENTS.
| J.P. Morgan Exchange-Traded Funds | |
| | |
Corporate Bonds — continued |
Entertainment — continued |
| | |
|
| | |
| | |
Take-Two Interactive Software, Inc. 3.70%, 4/14/2027 | | |
TWDC Enterprises 18 Corp. 3.00%, 7/30/2046 | | |
|
| | |
| | |
| | |
| | |
Warnermedia Holdings, Inc. |
| | |
| | |
| | |
Financial Services — 0.5% |
Berkshire Hathaway, Inc. 3.13%, 3/15/2026 | | |
|
| | |
| | |
Fidelity National Information Services, Inc. 3.10%, 3/1/2041 | | |
|
| | |
| | |
| | |
|
| | |
| | |
| | |
| | |
|
| | |
| | |
National Rural Utilities Cooperative Finance Corp. |
Series D, 1.00%, 10/18/2024 | | |
| | |
|
| | |
| | |
Shell International Finance BV (Netherlands) |
| | |
| | |
|
Financial Services — continued |
| | |
| | |
| | |
| | |
Synchrony Bank 5.63%, 8/23/2027 | | |
Visa, Inc. 0.75%, 8/15/2027 | | |
|
| | |
| | |
| | |
|
Archer-Daniels-Midland Co. 2.70%, 9/15/2051 | | |
Bunge Ltd. Finance Corp. 2.75%, 5/14/2031 | | |
Campbell Soup Co. 4.80%, 3/15/2048 | | |
Conagra Brands, Inc. 5.30%, 11/1/2038 | | |
Hormel Foods Corp. 1.70%, 6/3/2028 | | |
J M Smucker Co. (The) 3.38%, 12/15/2027 | | |
|
| | |
| | |
| | |
| | |
Kellanova 4.30%, 5/15/2028 (c) | | |
Kraft Heinz Foods Co. 6.50%, 2/9/2040 | | |
McCormick & Co., Inc. 0.90%, 2/15/2026 | | |
Mondelez International, Inc. |
| | |
| | |
Pilgrim's Pride Corp. 6.88%, 5/15/2034 | | |
|
| | |
| | |
| | |
| | |
Unilever Capital Corp. (United Kingdom) |
| | |
| | |
| | |
|
CenterPoint Energy Resources Corp. 5.85%, 1/15/2041 | | |
SEE NOTES TO FINANCIAL STATEMENTS.
| J.P. Morgan Exchange-Traded Funds | |
JPMorgan BetaBuilders U.S. Aggregate Bond ETF
SCHEDULE OF PORTFOLIO INVESTMENTSAS OF February 29, 2024 (continued)
| | |
Corporate Bonds — continued |
Gas Utilities — continued |
National Fuel Gas Co. 5.20%, 7/15/2025 | | |
Southern California Gas Co. Series VV, 4.30%, 1/15/2049 | | |
| | |
Ground Transportation — 0.3% |
Burlington Northern Santa Fe LLC 6.15%, 5/1/2037 | | |
Canadian National Railway Co. (Canada) 2.75%, 3/1/2026 | | |
|
| | |
| | |
| | |
| | |
| | |
|
| | |
| | |
| | |
| | |
| | |
|
| | |
| | |
| | |
| | |
| | |
| | |
| | |
Health Care Equipment & Supplies — 0.2% |
Abbott Laboratories 6.15%, 11/30/2037 | | |
Baxter International, Inc. |
| | |
| | |
| | |
|
| | |
| | |
DENTSPLY SIRONA, Inc. 3.25%, 6/1/2030 | | |
Zimmer Biomet Holdings, Inc. 5.75%, 11/30/2039 | | |
| | |
| | |
|
Health Care Providers & Services — 1.1% |
Baptist Healthcare System Obligated Group Series 20B, 3.54%, 8/15/2050 | | |
Cardinal Health, Inc. 3.75%, 9/15/2025 | | |
Cencora, Inc. 2.70%, 3/15/2031 | | |
|
| | |
| | |
CommonSpirit Health 4.35%, 11/1/2042 | | |
Cottage Health Obligated Group Series 2020, 3.30%, 11/1/2049 | | |
|
| | |
| | |
| | |
| | |
| | |
| | |
| | |
| | |
| | |
| | |
| | |
| | |
|
| | |
| | |
| | |
| | |
| | |
| | |
| | |
| | |
| | |
HCA, Inc. 3.13%, 3/15/2027 | | |
|
| | |
| | |
| | |
| | |
Laboratory Corp. of America Holdings 4.70%, 2/1/2045 | | |
Mass General Brigham, Inc. Series 2020, 3.34%, 7/1/2060 | | |
McKesson Corp. 5.10%, 7/15/2033 | | |
SEE NOTES TO FINANCIAL STATEMENTS.
| J.P. Morgan Exchange-Traded Funds | |
| | |
Corporate Bonds — continued |
Health Care Providers & Services — continued |
Memorial Sloan-Kettering Cancer Center 5.00%, 7/1/2042 | | |
MyMichigan Health Series 2020, 3.41%, 6/1/2050 | | |
Quest Diagnostics, Inc. 2.95%, 6/30/2030 | | |
Trinity Health Corp. 4.13%, 12/1/2045 | | |
UMass Memorial Health Care Obligated Group 5.36%, 7/1/2052 | | |
|
| | |
| | |
| | |
| | |
| | |
| | |
| | |
| | |
| | |
| | |
| | |
UPMC Series D-1, 3.60%, 4/3/2025 | | |
| | |
|
|
| | |
| | |
|
| | |
| | |
|
| | |
| | |
| | |
Hotels, Restaurants & Leisure — 0.2% |
|
| | |
| | |
Darden Restaurants, Inc. 3.85%, 5/1/2027 | | |
|
| | |
| | |
| | |
Marriott International, Inc. Series GG, 3.50%, 10/15/2032 | | |
| | |
|
Hotels, Restaurants & Leisure — continued |
|
| | |
| | |
| | |
| | |
| | |
|
| | |
| | |
| | |
Household Durables — 0.1% |
DR Horton, Inc. 2.50%, 10/15/2024 | | |
Leggett & Platt, Inc. 4.40%, 3/15/2029 | | |
Lennar Corp. 4.75%, 11/29/2027 | | |
MDC Holdings, Inc. 3.97%, 8/6/2061 | | |
NVR, Inc. 3.00%, 5/15/2030 | | |
|
| | |
| | |
Toll Brothers Finance Corp. 4.88%, 11/15/2025 | | |
|
| | |
| | |
| | |
Household Products — 0.2% |
Church & Dwight Co., Inc. 5.60%, 11/15/2032 | | |
Clorox Co. (The) 4.40%, 5/1/2029 | | |
Colgate-Palmolive Co. 4.60%, 3/1/2033 | | |
|
| | |
| | |
| | |
Procter & Gamble Co. (The) |
| | |
| | |
| | |
Independent Power and Renewable Electricity Producers — 0.0% ^ |
Constellation Energy Generation LLC |
| | |
| | |
SEE NOTES TO FINANCIAL STATEMENTS.
| J.P. Morgan Exchange-Traded Funds | |
JPMorgan BetaBuilders U.S. Aggregate Bond ETF
SCHEDULE OF PORTFOLIO INVESTMENTSAS OF February 29, 2024 (continued)
| | |
Corporate Bonds — continued |
Independent Power and Renewable Electricity Producers — continued |
| | |
Oglethorpe Power Corp. 3.75%, 8/1/2050 | | |
| | |
Industrial Conglomerates — 0.1% |
|
| | |
| | |
| | |
GE Capital Funding LLC 4.55%, 5/15/2032 (c) | | |
GE Capital International Funding Co. Unlimited Co. 4.42%, 11/15/2035 | | |
Honeywell International, Inc. |
| | |
| | |
| | |
| | |
Industrial REITs — 0.0% ^ |
|
| | |
| | |
| | |
| | |
| | |
| | |
|
Aflac, Inc. 3.60%, 4/1/2030 | | |
|
| | |
| | |
American International Group, Inc. |
| | |
| | |
Aon Global Ltd. 3.88%, 12/15/2025 | | |
Arthur J Gallagher & Co. 2.40%, 11/9/2031 | | |
Athene Holding Ltd. 3.50%, 1/15/2031 | | |
Berkshire Hathaway Finance Corp. 2.88%, 3/15/2032 | | |
Brighthouse Financial, Inc. |
| | |
| | |
Brown & Brown, Inc. 4.50%, 3/15/2029 | | |
| | |
|
|
|
| | |
| | |
|
| | |
| | |
Hartford Financial Services Group, Inc. (The) 2.80%, 8/19/2029 | | |
|
| | |
| | |
Loews Corp. 3.75%, 4/1/2026 | | |
|
| | |
| | |
Marsh & McLennan Cos., Inc. 2.25%, 11/15/2030 | | |
|
| | |
| | |
| | |
| | |
| | |
Nationwide Financial Services, Inc. 6.75%, 5/15/2037 | | |
Old Republic International Corp. 4.88%, 10/1/2024 | | |
Progressive Corp. (The) 4.00%, 3/1/2029 | | |
Prudential Financial, Inc. |
(3-MONTH SOFR + 3.03%), 5.38%, 5/15/2045 (b) | | |
| | |
| | |
Travelers Cos., Inc. (The) 3.05%, 6/8/2051 | | |
| | |
Interactive Media & Services — 0.2% |
|
| | |
| | |
Baidu, Inc. (China) 1.72%, 4/9/2026 | | |
|
| | |
SEE NOTES TO FINANCIAL STATEMENTS.
| J.P. Morgan Exchange-Traded Funds | |
| | |
Corporate Bonds — continued |
Interactive Media & Services — continued |
| | |
| | |
| | |
|
Amdocs Ltd. 2.54%, 6/15/2030 | | |
International Business Machines Corp. |
| | |
| | |
| | |
| | |
| | |
Kyndryl Holdings, Inc. 3.15%, 10/15/2031 | | |
| | |
Leisure Products — 0.0% ^ |
|
| | |
| | |
Hasbro, Inc. 3.90%, 11/19/2029 | | |
| | |
Life Sciences Tools & Services — 0.1% |
Thermo Fisher Scientific, Inc. |
| | |
| | |
| | |
|
Cummins, Inc. 2.60%, 9/1/2050 | | |
Dover Corp. 3.15%, 11/15/2025 | | |
IDEX Corp. 3.00%, 5/1/2030 | | |
Illinois Tool Works, Inc. 4.88%, 9/15/2041 | | |
Otis Worldwide Corp. 2.29%, 4/5/2027 | | |
Parker-Hannifin Corp. 4.25%, 9/15/2027 | | |
Snap-on, Inc. 3.10%, 5/1/2050 | | |
| | |
|
Charter Communications Operating LLC |
| | |
| | |
| | |
| | |
|
| | |
| | |
| | |
|
|
| | |
| | |
| | |
| | |
| | |
| | |
| | |
| | |
| | |
| | |
Discovery Communications LLC |
| | |
| | |
Fox Corp. 4.71%, 1/25/2029 (c) | | |
|
| | |
| | |
|
| | |
| | |
| | |
Time Warner Cable LLC 4.50%, 9/15/2042 | | |
| | |
|
ArcelorMittal SA (Luxembourg) |
| | |
| | |
BHP Billiton Finance USA Ltd. (Australia) 4.75%, 2/28/2028 | | |
|
| | |
| | |
|
| | |
| | |
Rio Tinto Finance USA plc (Australia) |
| | |
| | |
Steel Dynamics, Inc. 5.00%, 12/15/2026 | | |
Vale Overseas Ltd. (Brazil) 3.75%, 7/8/2030 | | |
Yamana Gold, Inc. (Canada) 2.63%, 8/15/2031 | | |
| | |
SEE NOTES TO FINANCIAL STATEMENTS.
| J.P. Morgan Exchange-Traded Funds | |
JPMorgan BetaBuilders U.S. Aggregate Bond ETF
SCHEDULE OF PORTFOLIO INVESTMENTSAS OF February 29, 2024 (continued)
| | |
Corporate Bonds — continued |
|
Ameren Corp. 1.75%, 3/15/2028 | | |
Avista Corp. 4.00%, 4/1/2052 | | |
Berkshire Hathaway Energy Co. |
| | |
| | |
| | |
|
| | |
| | |
CenterPoint Energy, Inc. 2.95%, 3/1/2030 | | |
CMS Energy Corp. 4.88%, 3/1/2044 | | |
Consolidated Edison Co. of New York, Inc. |
Series 12-A, 4.20%, 3/15/2042 | | |
| | |
|
| | |
| | |
| | |
|
Series D, 2.85%, 8/15/2026 | | |
Series C, 3.38%, 4/1/2030 | | |
Series A, 4.35%, 8/15/2032 | | |
Series C, 4.05%, 9/15/2042 | | |
| | |
DTE Energy Co. 2.95%, 3/1/2030 | | |
|
| | |
| | |
| | |
PG&E Energy Recovery Funding LLC Series A-1, 1.46%, 7/15/2031 | | |
Public Service Enterprise Group, Inc. |
| | |
| | |
| | |
Puget Sound Energy, Inc. 5.80%, 3/15/2040 | | |
|
| | |
(US Treasury Yield Curve Rate T Note Constant Maturity 5 Year + 2.87%), 4.13%, 4/1/2052 (b) | | |
Southern Co. Gas Capital Corp. |
| | |
| | |
| | |
| | |
|
|
Alexandria Real Estate Equities, Inc. |
| | |
| | |
| | |
|
| | |
| | |
| | |
| | |
COPT Defense Properties LP 2.00%, 1/15/2029 | | |
Kilroy Realty LP 2.65%, 11/15/2033 | | |
| | |
Oil, Gas & Consumable Fuels — 1.6% |
Boardwalk Pipelines LP 4.80%, 5/3/2029 | | |
BP Capital Markets America, Inc. |
| | |
| | |
| | |
| | |
| | |
BP Capital Markets plc (United Kingdom) 3.28%, 9/19/2027 | | |
Canadian Natural Resources Ltd. (Canada) 2.05%, 7/15/2025 | | |
Cenovus Energy, Inc. (Canada) 5.40%, 6/15/2047 | | |
Cheniere Corpus Christi Holdings LLC 5.88%, 3/31/2025 | | |
Chevron Corp. 2.00%, 5/11/2027 | | |
Chevron USA, Inc. 0.69%, 8/12/2025 | | |
CNOOC Petroleum North America ULC (China) 5.88%, 3/10/2035 | | |
Continental Resources, Inc. 4.38%, 1/15/2028 | | |
|
| | |
| | |
|
| | |
| | |
|
| | |
| | |
| | |
SEE NOTES TO FINANCIAL STATEMENTS.
| J.P. Morgan Exchange-Traded Funds | |
| | |
Corporate Bonds — continued |
Oil, Gas & Consumable Fuels — continued |
|
| | |
| | |
| | |
| | |
| | |
| | |
| | |
| | |
| | |
| | |
Enterprise Products Operating LLC |
| | |
(3-MONTH CME TERM SOFR + 2.83%), 5.38%, 2/15/2078 (b) | | |
EOG Resources, Inc. 4.15%, 1/15/2026 | | |
EQT Corp. 7.00%, 2/1/2030 (f) | | |
|
| | |
| | |
|
| | |
| | |
| | |
Hess Corp. 7.30%, 8/15/2031 | | |
Kinder Morgan Energy Partners LP |
| | |
| | |
|
| | |
| | |
| | |
| | |
Marathon Oil Corp. 6.80%, 3/15/2032 | | |
|
| | |
| | |
|
| | |
| | |
| | |
| | |
ONEOK Partners LP 6.65%, 10/1/2036 | | |
|
| | |
| | |
|
Oil, Gas & Consumable Fuels — continued |
| | |
| | |
| | |
|
| | |
| | |
| | |
Phillips 66 Co. 3.75%, 3/1/2028 | | |
Pioneer Natural Resources Co. 1.13%, 1/15/2026 | | |
Sabine Pass Liquefaction LLC |
| | |
| | |
Targa Resources Partners LP |
| | |
| | |
TC PipeLines LP 4.38%, 3/13/2025 | | |
Tosco Corp. 8.13%, 2/15/2030 | | |
TotalEnergies Capital International SA (France) 3.39%, 6/29/2060 | | |
TransCanada PipeLines Ltd. (Canada) |
| | |
| | |
| | |
| | |
Transcontinental Gas Pipe Line Co. LLC 4.45%, 8/1/2042 | | |
|
| | |
| | |
| | |
Western Midstream Operating LP |
| | |
| | |
| | |
Williams Cos., Inc. (The) |
| | |
| | |
| | |
| | |
| | |
Paper & Forest Products — 0.0% ^ |
Suzano Austria GmbH (Brazil) |
| | |
SEE NOTES TO FINANCIAL STATEMENTS.
| J.P. Morgan Exchange-Traded Funds | |
JPMorgan BetaBuilders U.S. Aggregate Bond ETF
SCHEDULE OF PORTFOLIO INVESTMENTSAS OF February 29, 2024 (continued)
| | |
Corporate Bonds — continued |
Paper & Forest Products — continued |
Series DM3N, 3.13%, 1/15/2032 | | |
Suzano International Finance BV (Brazil) 5.50%, 1/17/2027 | | |
| | |
Passenger Airlines — 0.0% ^ |
Southwest Airlines Co. 5.13%, 6/15/2027 | | |
Personal Care Products — 0.1% |
Estee Lauder Cos., Inc. (The) 4.38%, 5/15/2028 | | |
|
| | |
| | |
| | |
| | |
| | |
|
Astrazeneca Finance LLC (United Kingdom) 1.75%, 5/28/2028 | | |
|
| | |
| | |
| | |
| | |
| | |
| | |
|
| | |
| | |
| | |
| | |
|
| | |
| | |
|
| | |
| | |
| | |
Pfizer Investment Enterprises Pte. Ltd. 4.75%, 5/19/2033 | | |
|
| | |
| | |
| | |
| | |
| | |
|
Pharmaceuticals — continued |
| | |
Pharmacia LLC 6.60%, 12/1/2028 (f) | | |
Royalty Pharma plc 1.75%, 9/2/2027 | | |
Takeda Pharmaceutical Co. Ltd. (Japan) 2.05%, 3/31/2030 | | |
|
| | |
| | |
| | |
Wyeth LLC 5.95%, 4/1/2037 | | |
Zoetis, Inc. 2.00%, 5/15/2030 | | |
| | |
Professional Services — 0.0% ^ |
Broadridge Financial Solutions, Inc. 2.90%, 12/1/2029 | | |
Concentrix Corp. 6.60%, 8/2/2028 | | |
Equifax, Inc. 2.35%, 9/15/2031 | | |
Thomson Reuters Corp. (Canada) 3.35%, 5/15/2026 | | |
Verisk Analytics, Inc. 5.75%, 4/1/2033 | | |
| | |
|
American Homes 4 Rent LP 4.90%, 2/15/2029 | | |
AvalonBay Communities, Inc. |
| | |
| | |
| | |
|
| | |
| | |
ERP Operating LP 4.15%, 12/1/2028 | | |
Sun Communities Operating LP 4.20%, 4/15/2032 | | |
|
| | |
| | |
| | |
|
Brixmor Operating Partnership LP 4.05%, 7/1/2030 | | |
Kimco Realty OP LLC 4.60%, 2/1/2033 | | |
|
| | |
SEE NOTES TO FINANCIAL STATEMENTS.
| J.P. Morgan Exchange-Traded Funds | |
| | |
Corporate Bonds — continued |
|
| | |
| | |
| | |
Semiconductors & Semiconductor Equipment — 0.6% |
|
| | |
| | |
Applied Materials, Inc. 2.75%, 6/1/2050 | | |
|
| | |
| | |
| | |
| | |
| | |
| | |
|
| | |
| | |
| | |
| | |
| | |
| | |
KLA Corp. 3.30%, 3/1/2050 | | |
Lam Research Corp. 3.75%, 3/15/2026 | | |
|
| | |
| | |
| | |
NVIDIA Corp. 2.85%, 4/1/2030 | | |
|
| | |
| | |
| | |
|
| | |
| | |
Skyworks Solutions, Inc. 1.80%, 6/1/2026 | | |
Texas Instruments, Inc. 2.90%, 11/3/2027 | | |
TSMC Arizona Corp. (Taiwan) 1.75%, 10/25/2026 | | |
| | |
|
Adobe, Inc. 2.15%, 2/1/2027 | | |
| | |
|
|
|
| | |
| | |
|
| | |
| | |
| | |
| | |
| | |
| | |
| | |
| | |
| | |
| | |
Roper Technologies, Inc. 1.00%, 9/15/2025 | | |
|
| | |
| | |
|
| | |
| | |
| | |
Workday, Inc. 3.70%, 4/1/2029 | | |
| | |
|
|
| | |
| | |
| | |
| | |
| | |
| | |
| | |
|
| | |
| | |
| | |
| | |
| | |
| | |
| | |
Equinix, Inc. 3.90%, 4/15/2032 | | |
SEE NOTES TO FINANCIAL STATEMENTS.
| J.P. Morgan Exchange-Traded Funds | |
JPMorgan BetaBuilders U.S. Aggregate Bond ETF
SCHEDULE OF PORTFOLIO INVESTMENTSAS OF February 29, 2024 (continued)
| | |
Corporate Bonds — continued |
Specialized REITs — continued |
Public Storage Operating Co. |
| | |
| | |
| | |
|
|
| | |
| | |
|
| | |
| | |
Dick's Sporting Goods, Inc. 4.10%, 1/15/2052 | | |
|
| | |
| | |
| | |
| | |
| | |
| | |
|
| | |
| | |
| | |
| | |
| | |
| | |
O'Reilly Automotive, Inc. 3.90%, 6/1/2029 | | |
TJX Cos., Inc. (The) 1.15%, 5/15/2028 | | |
Tractor Supply Co. 5.25%, 5/15/2033 | | |
| | |
Technology Hardware, Storage & Peripherals — 0.5% |
|
| | |
| | |
| | |
| | |
| | |
| | |
|
| | |
| | |
| | |
| | |
| | |
|
Technology Hardware, Storage & Peripherals — continued |
Hewlett Packard Enterprise Co. |
| | |
| | |
|
| | |
| | |
NetApp, Inc. 2.70%, 6/22/2030 | | |
Western Digital Corp. 2.85%, 2/1/2029 | | |
| | |
Textiles, Apparel & Luxury Goods — 0.1% |
NIKE, Inc. 2.38%, 11/1/2026 | | |
PVH Corp. 4.63%, 7/10/2025 | | |
Ralph Lauren Corp. 3.75%, 9/15/2025 | | |
Tapestry, Inc. 4.13%, 7/15/2027 | | |
VF Corp. 2.95%, 4/23/2030 (c) | | |
| | |
|
|
| | |
| | |
| | |
BAT Capital Corp. (United Kingdom) |
| | |
| | |
| | |
| | |
| | |
| | |
Philip Morris International, Inc. |
| | |
| | |
| | |
| | |
Reynolds American, Inc. (United Kingdom) 5.70%, 8/15/2035 | | |
| | |
Trading Companies & Distributors — 0.0% ^ |
Air Lease Corp. 4.25%, 9/15/2024 | | |
|
American Water Capital Corp. 3.45%, 6/1/2029 | | |
Essential Utilities, Inc. 4.28%, 5/1/2049 | | |
| | |
SEE NOTES TO FINANCIAL STATEMENTS.
| J.P. Morgan Exchange-Traded Funds | |
| | |
Corporate Bonds — continued |
Wireless Telecommunication Services — 0.5% |
America Movil SAB de CV (Mexico) 3.63%, 4/22/2029 | | |
Rogers Communications, Inc. (Canada) |
| | |
| | |
| | |
|
| | |
| | |
| | |
Vodafone Group plc (United Kingdom) 4.38%, 5/30/2028 | | |
| | |
Total Corporate Bonds
(Cost $415,279,226) | | |
Foreign Government Securities — 1.8% |
Hungary Government Bond 7.63%, 3/29/2041 | | |
Italian Republic Government Bond | | |
| | |
| | |
Japan Bank for International Cooperation | | |
| | |
| | |
| | |
| | |
| | |
| | |
| | |
| | |
| | |
Japan International Cooperation Agency | | |
| | |
| | |
| | |
| | |
Oriental Republic of Uruguay | | |
| | |
| | |
| | |
| | |
| | |
| | |
| | |
|
Province of British Columbia | | |
| | |
| | |
| | |
| | |
| | |
| | |
| | |
| | |
| | |
| | |
| | |
| | |
| | |
| | |
| | |
| | |
| | |
| | |
| | |
| | |
| | |
| | |
| | |
| | |
| | |
| | |
| | |
| | |
| | |
| | |
| | |
| | |
| | |
| | |
| | |
| | |
| | |
| | |
| | |
| | |
| | |
| | |
| | |
| | |
SEE NOTES TO FINANCIAL STATEMENTS.
| J.P. Morgan Exchange-Traded Funds | |
JPMorgan BetaBuilders U.S. Aggregate Bond ETF
SCHEDULE OF PORTFOLIO INVESTMENTSAS OF February 29, 2024 (continued)
| | |
Foreign Government Securities — continued |
| | |
State of Israel Government Bond 2.75%, 7/3/2030 | | |
| | |
| | |
| | |
| | |
| | |
| | |
| | |
| | |
| | |
| | |
| | |
| | |
| | |
| | |
| | |
| | |
| | |
Total Foreign Government Securities
(Cost $30,068,788) | | |
Commercial Mortgage-Backed Securities — 1.6% |
| | |
Series 2017-BNK4, Class ASB, 3.42%, 5/15/2050 | | |
Series 2019-BN16, Class A4, 4.01%, 2/15/2052 | | |
Series 2019-BN21, Class A5, 2.85%, 10/17/2052 | | |
Series 2019-BN23, Class A3, 2.92%, 12/15/2052 | | |
Series 2018-BN10, Class A5, 3.69%, 2/15/2061 | | |
Series 2019-BN19, Class A3, 3.18%, 8/15/2061 | | |
Series 2018-BN13, Class C, 4.54%, 8/15/2061 (e) | | |
Series 2019-BN22, Class A4, 2.98%, 11/15/2062 | | |
Series 2020-BN26, Class A4, 2.40%, 3/15/2063 | | |
Series 2021-BN36, Class A5, 2.47%, 9/15/2064 | | |
Bank of America Merrill Lynch Commercial Mortgage Trust Series 2017-BNK3, Class A4, 3.57%, 2/15/2050 | | |
| | |
|
BBCMS Mortgage Trust Series 2018-C2, Class A5, 4.31%, 12/15/2051 | | |
| | |
Series 2018-B1, Class A5, 3.67%, 1/15/2051 (e) | | |
Series 2018-B2, Class B, 4.29%, 2/15/2051 (e) | | |
Series 2018-B5, Class A4, 4.21%, 7/15/2051 | | |
Series 2018-B6, Class A2, 4.20%, 10/10/2051 | | |
Series 2018-B8, Class A5, 4.23%, 1/15/2052 | | |
Series 2019-B11, Class A2, 3.41%, 5/15/2052 | | |
Series 2021-B31, Class A5, 2.67%, 12/15/2054 | | |
Cantor Commercial Real Estate Lending Series 2019-CF2, Class AS, 3.12%, 11/15/2052 | | |
| | |
Series 2017-CD6, Class ASB, 3.33%, 11/13/2050 | | |
Series 2017-CD6, Class AM, 3.71%, 11/13/2050 (e) | | |
Series 2018-CD7, Class A3, 4.01%, 8/15/2051 | | |
CFCRE Commercial Mortgage Trust | | |
Series 2017-C8, Class A4, 3.57%, 6/15/2050 | | |
Series 2016-C7, Class ASB, 3.64%, 12/10/2054 | | |
Citigroup Commercial Mortgage Trust | | |
Series 2014-GC23, Class B, 4.17%, 7/10/2047 (e) | | |
Series 2015-GC29, Class C, 4.14%, 4/10/2048 (e) | | |
Series 2016-C1, Class AAB, 3.00%, 5/10/2049 | | |
Series 2019-GC43, Class A4, 3.04%, 11/10/2052 | | |
Commercial Mortgage Trust | | |
Series 2014-UBS5, Class AM, 4.19%, 9/10/2047 (e) | | |
Series 2014-CR20, Class A3, 3.33%, 11/10/2047 | | |
Series 2014-UBS6, Class A4, 3.38%, 12/10/2047 | | |
Series 2015-LC19, Class A4, 3.18%, 2/10/2048 | | |
SEE NOTES TO FINANCIAL STATEMENTS.
| J.P. Morgan Exchange-Traded Funds | |
| | |
Commercial Mortgage-Backed Securities — continued |
Series 2015-LC21, Class AM, 4.04%, 7/10/2048 (e) | | |
Series 2015-CR25, Class A4, 3.76%, 8/10/2048 | | |
Series 2015-PC1, Class A5, 3.90%, 7/10/2050 | | |
CSAIL Commercial Mortgage Trust | | |
Series 2015-C3, Class A4, 3.72%, 8/15/2048 | | |
Series 2016-C5, Class A5, 3.76%, 11/15/2048 | | |
DBGS Mortgage Trust Series 2018-C1, Class A4, 4.47%, 10/15/2051 | | |
DBJPM Mortgage Trust Series 2017-C6, Class A5, 3.33%, 6/10/2050 | | |
FHLMC, Multi-Family Structured Pass-Through Certificates | | |
Series K728, Class A2, 3.06%, 8/25/2024 (e) | | |
Series K040, Class A2, 3.24%, 9/25/2024 | | |
Series K731, Class A2, 3.60%, 2/25/2025 (e) | | |
Series K051, Class A2, 3.31%, 9/25/2025 | | |
Series K735, Class A2, 2.86%, 5/25/2026 | | |
Series K057, Class A2, 2.57%, 7/25/2026 | | |
Series K063, Class A1, 3.05%, 8/25/2026 | | |
Series K059, Class A2, 3.12%, 9/25/2026 (e) | | |
Series K062, Class A2, 3.41%, 12/25/2026 | | |
Series K064, Class A2, 3.22%, 3/25/2027 | | |
Series K072, Class A2, 3.44%, 12/25/2027 | | |
Series K084, Class A2, 3.78%, 10/25/2028 (e) | | |
Series K087, Class A2, 3.77%, 12/25/2028 | | |
Series K091, Class A2, 3.51%, 3/25/2029 | | |
Series K097, Class A2, 2.51%, 7/25/2029 | | |
Series K096, Class A2, 2.52%, 7/25/2029 | | |
Series K100, Class A2, 2.67%, 9/25/2029 | | |
Series K102, Class A2, 2.54%, 10/25/2029 | | |
Series K113, Class A2, 1.34%, 6/25/2030 | | |
Series K158, Class A1, 3.90%, 7/25/2030 | | |
Series K117, Class A2, 1.41%, 8/25/2030 | | |
Series K123, Class A2, 1.62%, 12/25/2030 | | |
| | |
|
Series K125, Class A2, 1.85%, 1/25/2031 | | |
Series K127, Class A2, 2.11%, 1/25/2031 | | |
Series K-1512, Class A2, 2.99%, 5/25/2031 | | |
Series K155, Class A3, 3.75%, 4/25/2033 | | |
Series K157, Class A2, 3.99%, 5/25/2033 (e) | | |
Series K156, Class A3, 3.70%, 6/25/2033 (e) | | |
Series K-1512, Class A3, 3.06%, 4/25/2034 | | |
| | |
Series 2017-M10, Class AV2, 2.58%, 7/25/2024 (e) | | |
Series 2017-M7, Class A2, 2.96%, 2/25/2027 (e) | | |
Series 2017-M14, Class A2, 2.81%, 11/25/2027 (e) | | |
Series 2018-M10, Class A2, 3.36%, 7/25/2028 (e) | | |
Series 2018-M14, Class A2, 3.58%, 8/25/2028 (e) | | |
Series 2019-M1, Class A2, 3.55%, 9/25/2028 (e) | | |
Series 2019-M22, Class A2, 2.52%, 8/25/2029 | | |
Series 2021-M2S, Class A2, 1.81%, 10/25/2031 (e) | | |
GS Mortgage Securities Trust | | |
Series 2014-GC24, Class AAB, 3.65%, 9/10/2047 | | |
Series 2014-GC24, Class AS, 4.16%, 9/10/2047 (e) | | |
Series 2015-GC28, Class A4, 3.14%, 2/10/2048 | | |
Series 2015-GC30, Class A4, 3.38%, 5/10/2050 | | |
Series 2018-GS9, Class A4, 3.99%, 3/10/2051 (e) | | |
JPMBB Commercial Mortgage Securities Trust | | |
Series 2013-C12, Class C, 3.96%, 7/15/2045 (e) | | |
Series 2015-C29, Class B, 4.12%, 5/15/2048 (e) | | |
Series 2015-C31, Class A3, 3.80%, 8/15/2048 | | |
JPMCC Commercial Mortgage Securities Trust Series 2017-JP5, Class A5, 3.72%, 3/15/2050 | | |
SEE NOTES TO FINANCIAL STATEMENTS.
| J.P. Morgan Exchange-Traded Funds | |
JPMorgan BetaBuilders U.S. Aggregate Bond ETF
SCHEDULE OF PORTFOLIO INVESTMENTSAS OF February 29, 2024 (continued)
| | |
Commercial Mortgage-Backed Securities — continued |
JPMDB Commercial Mortgage Securities Trust | | |
Series 2016-C2, Class B, 3.99%, 6/15/2049 (e) | | |
Series 2017-C5, Class B, 4.01%, 3/15/2050 (e) | | |
Morgan Stanley Bank of America Merrill Lynch Trust | | |
Series 2015-C22, Class AS, 3.56%, 4/15/2048 | | |
Series 2015-C25, Class ASB, 3.38%, 10/15/2048 | | |
Series 2015-C25, Class A5, 3.64%, 10/15/2048 | | |
Series 2016-C31, Class A5, 3.10%, 11/15/2049 | | |
Series 2016-C32, Class A4, 3.72%, 12/15/2049 | | |
Morgan Stanley Capital I Trust | | |
Series 2016-UB12, Class A3, 3.34%, 12/15/2049 | | |
Series 2017-H1, Class C, 4.28%, 6/15/2050 (e) | | |
Series 2019-L2, Class A4, 4.07%, 3/15/2052 | | |
Series 2019-L3, Class A4, 3.13%, 11/15/2052 | | |
UBS Commercial Mortgage Trust | | |
Series 2017-C2, Class A4, 3.49%, 8/15/2050 | | |
Series 2017-C4, Class ASB, 3.37%, 10/15/2050 | | |
Series 2017-C5, Class AS, 3.78%, 11/15/2050 (e) | | |
Series 2017-C7, Class AS, 4.06%, 12/15/2050 (e) | | |
Wells Fargo Commercial Mortgage Trust | | |
Series 2015-C27, Class A4, 3.19%, 2/15/2048 | | |
Series 2015-C28, Class A4, 3.54%, 5/15/2048 | | |
Series 2015-C29, Class A4, 3.64%, 6/15/2048 | | |
Series 2017-C38, Class A5, 3.45%, 7/15/2050 | | |
Series 2018-C45, Class A3, 3.92%, 6/15/2051 | | |
Series 2019-C51, Class A3, 3.06%, 6/15/2052 | | |
| | |
|
Series 2019-C52, Class A5, 2.89%, 8/15/2052 | | |
Series 2019-C53, Class A4, 3.04%, 10/15/2052 | | |
Series 2020-C55, Class A5, 2.73%, 2/15/2053 | | |
WFRBS Commercial Mortgage Trust | | |
Series 2014-C22, Class A4, 3.49%, 9/15/2057 | | |
Series 2014-C22, Class A5, 3.75%, 9/15/2057 | | |
Total Commercial Mortgage-Backed Securities
(Cost $28,040,313) | | |
|
African Development Bank (Supranational) | | |
| | |
| | |
| | |
Asian Development Bank (Supranational) | | |
| | |
| | |
| | |
| | |
| | |
| | |
Corp. Andina de Fomento (Supranational)
2.25%, 2/8/2027 | | |
European Investment Bank (Supranational) | | |
| | |
| | |
| | |
| | |
| | |
| | |
| | |
Inter-American Development Bank (Supranational) | | |
| | |
| | |
| | |
| | |
| | |
| | |
| | |
| | |
SEE NOTES TO FINANCIAL STATEMENTS.
| J.P. Morgan Exchange-Traded Funds | |
| | |
Supranational — continued |
Inter-American Investment Corp. (Supranational)
4.13%, 2/15/2028 | | |
International Bank for Reconstruction & Development (Supranational) | | |
| | |
| | |
| | |
| | |
| | |
| | |
| | |
| | |
| | |
International Finance Corp. (Supranational) | | |
| | |
| | |
| | |
Nordic Investment Bank (Supranational) | | |
| | |
| | |
Total Supranational
(Cost $22,083,858) | | |
U.S. Government Agency Securities — 1.1% |
| | |
| | |
| | |
| | |
| | |
| | |
| | |
| | |
| | |
| | |
| | |
| | |
| | |
| | |
| | |
| | |
| | |
| | |
| | |
| | |
| | |
| | |
| | |
|
| | |
| | |
| | |
| | |
| | |
| | |
| | |
| | |
| | |
| | |
| | |
| | |
| | |
| | |
| | |
| | |
| | |
| | |
| | |
| | |
| | |
| | |
| | |
| | |
| | |
| | |
| | |
| | |
| | |
| | |
| | |
| | |
| | |
| | |
| | |
Israel Government AID Bond (Israel)
5.50%, 9/18/2033 | | |
Tennessee Valley Authority | | |
| | |
| | |
| | |
| | |
Total U.S. Government Agency Securities
(Cost $19,388,671) | | |
SEE NOTES TO FINANCIAL STATEMENTS.
| J.P. Morgan Exchange-Traded Funds | |
JPMorgan BetaBuilders U.S. Aggregate Bond ETF
SCHEDULE OF PORTFOLIO INVESTMENTSAS OF February 29, 2024 (continued)
| | |
Asset-Backed Securities — 0.5% |
American Express Credit Account Master Trust | | |
Series 2022-2, Class A, 3.39%, 5/15/2027 | | |
Series 2022-3, Class A, 3.75%, 8/15/2027 | | |
Capital One Multi-Asset Execution Trust | | |
Series 2022-A2, Class A, 3.49%, 5/15/2027 | | |
Series 2019-A3, Class A3, 2.06%, 8/15/2028 | | |
CarMax Auto Owner Trust Series 2022-1, Class A4, 1.70%, 8/16/2027 | | |
Citibank Credit Card Issuance Trust Series 2018-A7, Class A7, 3.96%, 10/13/2030 | | |
Delta Air Lines Pass-Through Trust Series 2020-1, Class AA, 2.00%, 6/10/2028 | | |
Discover Card Execution Note Trust Series 2022-A3, Class A3, 3.56%, 7/15/2027 | | |
Evergy Metro, Inc., 4.20%, 3/15/2048 | | |
Ford Credit Floorplan Master Owner Trust | | |
Series 2020-2, Class A, 1.06%, 9/15/2027 | | |
Series 2018-4, Class A, 4.06%, 11/15/2030 | | |
GM Financial Consumer Automobile Receivables Trust Series 2020-3, Class A4, 0.58%, 1/16/2026 | | |
Toyota Auto Receivables Owner Trust Series 2022-B, Class A3, 2.93%, 9/15/2026 | | |
United Airlines Pass-Through Trust | | |
Series 2014-1, Class A, 4.00%, 4/11/2026 | | |
Series 2020-1, Class A, 5.88%, 10/15/2027 | | |
Series 2016-2, Class AA, 2.88%, 10/7/2028 | | |
Series 2018-1, Class AA, 3.50%, 3/1/2030 | | |
Verizon Master Trust Series 2022-4, Class A, 3.40%, 11/20/2028 | | |
Total Asset-Backed Securities
(Cost $8,210,236) | | |
Municipal Bonds — 0.4% (i) |
|
City of Tucson, Taxable Series 2021A, COP, AGM, 2.86%, 7/1/2047 | | |
| | |
|
|
Bay Area Toll Authority, Toll Bridge | | |
Series 2010S-1, Rev., 6.92%, 4/1/2040 | | |
Series 2009F-2, Rev., 6.26%, 4/1/2049 | | |
California State University, Systemwide Series 2021B, Rev., 2.72%, 11/1/2052 | | |
East Bay Municipal Utility District, Water System Series 2010B, Rev., 5.87%, 6/1/2040 | | |
Golden State Tobacco Securitization Corp., Enhanced Tobacco Settlement Series 2021B, Rev., 3.29%, 6/1/2042 | | |
Los Angeles Unified School District, Build America Bonds | | |
Series 2009 KRY, GO, 5.75%, 7/1/2034 | | |
Series 2010RY, GO, 6.76%, 7/1/2034 | | |
Regents of the University of California, Medical Center Pooled | | |
Series 2010H, Rev., 6.55%, 5/15/2048 | | |
Series 2020N, Rev., 3.71%, 5/15/2120 | | |
State of California, Various Purpose | | |
| | |
| | |
| | |
|
State of Connecticut Series A, GO, 5.85%, 3/15/2032 | | |
|
State Board of Administration Finance Corp. Series 2020A, Rev., 2.15%, 7/1/2030 | | |
|
Municipal Electric Authority of Georgia, Plant Vogtle Units 3 and 4 Project Series 2010A, Rev., 7.06%, 4/1/2057 | | |
|
Chicago O'Hare International Airport, General Airport, Senior Lien Series 2018C, Rev., 4.47%, 1/1/2049 | | |
Metropolitan Water Reclamation District of Greater Chicago GO, 5.72%, 12/1/2038 | | |
Sales Tax Securitization Corp. Series 2019A, Rev., 4.64%, 1/1/2040 | | |
State of Illinois GO, 5.10%, 6/1/2033 | | |
| | |
SEE NOTES TO FINANCIAL STATEMENTS.
| J.P. Morgan Exchange-Traded Funds | |
| | |
Municipal Bonds — continued |
|
University of Nebraska Facilities Corp., University System Facilities Series 2019A, Rev., 3.04%, 10/1/2049 | | |
|
New Jersey Economic Development Authority, Pension Funding Series 1997A, Rev., NATL - RE, 7.43%, 2/15/2029 | | |
New Jersey Turnpike Authority Series 2009F, Rev., 7.41%, 1/1/2040 | | |
| | |
|
Port Authority of New York and New Jersey, Consolidated Series 192, Rev., 4.81%, 10/15/2065 | | |
|
American Municipal Power, Inc., Combined Hydroelectric Projects Series 2010A, Rev., 7.83%, 2/15/2041 | | |
|
Dallas Area Rapid Transit, Sales Tax, Senior Lien Series 2021A, Rev., 2.61%, 12/1/2048 | | |
Grand Parkway Transportation Corp., System Toll Series 2020B, Rev., 3.24%, 10/1/2052 | | |
Permanent University Fund - Texas A&M University System Series 2017B, Rev., 3.66%, 7/1/2047 | | |
State of Texas, Transportation Commission Highway Improvement Series 2010A, GO, 4.68%, 4/1/2040 | | |
State of Texas, Transportation Commission Mobility Fund Series 2009A, GO, 5.52%, 4/1/2039 | | |
Texas Private Activity Bond Surface Transportation Corp., North Tarrant Express Managed Lanes Project, Mobility Partners LLC Series 2019B, Rev., 3.92%, 12/31/2049 | | |
| | |
|
University of Virginia Series 2020, Rev., 2.26%, 9/1/2050 | | |
Total Municipal Bonds
(Cost $8,412,544) | | |
| | |
Short-Term Investments — 5.8% |
Investment Companies — 5.3% |
JPMorgan U.S. Government Money Market Fund Class IM Shares, 5.25% (j) (k)
(Cost $87,934,755) | | |
Investment of Cash Collateral from Securities Loaned — 0.5% |
JPMorgan Securities Lending Money Market Fund Agency SL Class Shares, 5.48% (j) (k) | | |
JPMorgan U.S. Government Money Market Fund Class IM Shares, 5.25% (j) (k) | | |
Total Investment of Cash Collateral from Securities Loaned
(Cost $7,795,436) | | |
Total Short-Term Investments
(Cost $95,730,191) | | |
Total Investments — 105.4%
(Cost $1,831,466,588) | | |
Liabilities in Excess of Other Assets — (5.4)% | | |
| | |
Percentages indicated are based on net assets. |
| |
| Alternative Credit Enhancement Securities |
| Insured by Assured Guaranty Municipal Corp. |
| Chicago Mercantile Exchange |
| Certificate of Participation |
| |
| |
| Federal Home Loan Mortgage Corp. |
| Federal National Mortgage Association |
| Government National Mortgage Association |
| |
| Insured by National Public Finance Guarantee Corp. |
| |
| Real Estate Investment Trust |
| |
| Secured Overnight Financing Rate |
| Compounding index of the Secured Overnight Financing Rate |
| To Be Announced; Security is subject to delayed delivery. |
| Uniform Mortgage-Backed Securities |
| Amount rounds to less than 0.1% of net assets. |
| All or a portion of the security is a when-issued security, delayed delivery security, or forward commitment. | |
SEE NOTES TO FINANCIAL STATEMENTS.
| J.P. Morgan Exchange-Traded Funds | |
JPMorgan BetaBuilders U.S. Aggregate Bond ETF
SCHEDULE OF PORTFOLIO INVESTMENTSAS OF February 29, 2024 (continued)
| Variable or floating rate security, linked to the referenced benchmark. The interest rate shown is the current rate as of February 29, 2024. | |
| The security or a portion of this security is on loan at February 29, 2024. The total value of securities on loan at February 29, 2024 is $7,495,969. | |
| Contingent Capital security (“CoCo”). CoCos are hybrid debt securities that may be convertible into equity or may be written down if a pre-specified trigger event occurs. The total value of aggregate CoCo holdings at February 29, 2024 is $518,679 or 0.03% of the Fund’s net assets as of February 29, 2024. | |
| Variable or floating rate security, the interest rate of which adjusts periodically based on changes in current interest rates and prepayments on the underlying pool of assets. The interest rate shown is the current rate as of February 29, 2024. | |
| Step bond. Interest rate is a fixed rate for an initial period that either resets at a specific date or may reset in the future contingent upon a predetermined trigger. The interest rate shown is the current rate as of February 29, 2024. | |
| Securities exempt from registration under Rule 144A or section 4(a)(2), of the Securities Act of 1933, as amended. | |
| The rate shown is the effective yield as of February 29, 2024. | |
| The date shown represents the earliest of the prerefunded date, next put date or final maturity date. | |
| Investment in an affiliated fund, which is registered under the Investment Company Act of 1940, as amended, and is advised by J.P. Morgan Investment Management Inc. | |
| The rate shown is the current yield as of February 29, 2024. | |
SEE NOTES TO FINANCIAL STATEMENTS.
| J.P. Morgan Exchange-Traded Funds | |
JPMorgan BetaBuilders U.S. TIPS 0-5 Year ETF
SCHEDULE OF PORTFOLIO INVESTMENTSAS OF February 29, 2024
| | |
U.S. Treasury Obligations — 99.6% |
U.S. Treasury Inflation Indexed Bonds | | |
| | |
| | |
| | |
U.S. Treasury Inflation Indexed Notes | | |
| | |
| | |
| | |
| | |
| | |
| | |
U.S. Treasury Inflation Linked Bonds | | |
| | |
| | |
| | |
U.S. Treasury Inflation Linked Notes | | |
| | |
| | |
| | |
| | |
| | |
| | |
| | |
| | |
| | |
| | |
|
| | |
| | |
| | |
| | |
| | |
Total U.S. Treasury Obligations
(Cost $7,610,806) | | |
| | |
Short-Term Investments — 0.2% |
Investment Companies — 0.2% |
JPMorgan Prime Money Market Fund Class IM Shares, 5.44% (a) (b)
(Cost $14,206) | | |
Total Investments — 99.8%
(Cost $7,625,012) | | |
Other Assets Less Liabilities — 0.2% | | |
| | |
Percentages indicated are based on net assets. |
| Investment in an affiliated fund, which is registered under the Investment Company Act of 1940, as amended, and is advised by J.P. Morgan Investment Management Inc. |
| The rate shown is the current yield as of February 29, 2024. |
SEE NOTES TO FINANCIAL STATEMENTS.
| J.P. Morgan Exchange-Traded Funds | |
JPMorgan BetaBuilders U.S. Treasury Bond 1-3 Year ETF
SCHEDULE OF PORTFOLIO INVESTMENTSAS OF February 29, 2024
| | |
U.S. Treasury Obligations — 98.8% |
| | |
| | |
| | |
| | |
| | |
| | |
| | |
| | |
| | |
| | |
| | |
| | |
| | |
| | |
| | |
| | |
| | |
| | |
| | |
| | |
| | |
| | |
| | |
| | |
| | |
| | |
| | |
| | |
| | |
| | |
| | |
| | |
| | |
| | |
| | |
| | |
| | |
| | |
| | |
| | |
| | |
| | |
| | |
| | |
| | |
| | |
|
| | |
| | |
| | |
| | |
| | |
| | |
| | |
| | |
| | |
| | |
| | |
| | |
| | |
| | |
| | |
| | |
| | |
| | |
| | |
| | |
| | |
| | |
| | |
| | |
| | |
| | |
| | |
| | |
| | |
| | |
| | |
| | |
| | |
| | |
| | |
| | |
| | |
| | |
| | |
| | |
| | |
| | |
| | |
Total U.S. Treasury Obligations
(Cost $4,362,050) | | |
SEE NOTES TO FINANCIAL STATEMENTS.
| J.P. Morgan Exchange-Traded Funds | |
| | |
Short-Term Investments — 0.3% |
Investment Companies — 0.3% |
JPMorgan Prime Money Market Fund Class IM Shares, 5.44% (a) (b)
(Cost $12,559) | | |
Total Investments — 99.1%
(Cost $4,374,609) | | |
Other Assets Less Liabilities — 0.9% | | |
| | |
Percentages indicated are based on net assets. |
| Investment in an affiliated fund, which is registered under the Investment Company Act of 1940, as amended, and is advised by J.P. Morgan Investment Management Inc. |
| The rate shown is the current yield as of February 29, 2024. |
SEE NOTES TO FINANCIAL STATEMENTS.
| J.P. Morgan Exchange-Traded Funds | |
JPMorgan BetaBuilders U.S. Treasury Bond 20+ Year ETF
SCHEDULE OF PORTFOLIO INVESTMENTSAS OF February 29, 2024
| | |
U.S. Treasury Obligations — 98.9% |
| | |
| | |
| | |
| | |
| | |
| | |
| | |
| | |
| | |
| | |
| | |
| | |
| | |
| | |
| | |
| | |
| | |
| | |
| | |
| | |
| | |
| | |
| | |
| | |
| | |
| | |
| | |
| | |
| | |
| | |
| | |
| | |
| | |
| | |
| | |
| | |
| | |
| | |
| | |
| | |
| | |
Total U.S. Treasury Obligations
(Cost $33,105,953) | | |
| | |
Short-Term Investments — 0.0% ^ |
Investment Companies — 0.0% ^ |
JPMorgan Prime Money Market Fund Class IM Shares, 5.44% (a) (b)
(Cost $10,824) | | |
Total Investments — 98.9%
(Cost $33,116,777) | | |
Other Assets Less Liabilities — 1.1% | | |
| | |
Percentages indicated are based on net assets. |
| Amount rounds to less than 0.1% of net assets. |
| Investment in an affiliated fund, which is registered under the Investment Company Act of 1940, as amended, and is advised by J.P. Morgan Investment Management Inc. | |
| The rate shown is the current yield as of February 29, 2024. | |
SEE NOTES TO FINANCIAL STATEMENTS.
| J.P. Morgan Exchange-Traded Funds | |
JPMorgan BetaBuilders U.S. Treasury Bond 3-10 Year ETF
SCHEDULE OF PORTFOLIO INVESTMENTSAS OF February 29, 2024
| | |
U.S. Treasury Obligations — 99.0% |
| | |
| | |
| | |
| | |
| | |
| | |
| | |
| | |
| | |
| | |
| | |
| | |
| | |
| | |
| | |
| | |
| | |
| | |
| | |
| | |
| | |
| | |
| | |
| | |
| | |
| | |
| | |
| | |
| | |
| | |
| | |
| | |
| | |
| | |
| | |
| | |
| | |
| | |
| | |
| | |
| | |
| | |
| | |
| | |
| | |
SEE NOTES TO FINANCIAL STATEMENTS.
| J.P. Morgan Exchange-Traded Funds | |
JPMorgan BetaBuilders U.S. Treasury Bond 3-10 Year ETF
SCHEDULE OF PORTFOLIO INVESTMENTSAS OF February 29, 2024 (continued)
| | |
U.S. Treasury Obligations — continued |
| | |
| | |
| | |
Total U.S. Treasury Obligations
(Cost $8,497,295) | | |
| | |
Short-Term Investments — 0.2% |
Investment Companies — 0.2% |
JPMorgan Prime Money Market Fund Class IM Shares, 5.44% (a) (b)
(Cost $15,758) | | |
Total Investments — 99.2%
(Cost $8,513,053) | | |
Other Assets Less Liabilities — 0.8% | | |
| | |
Percentages indicated are based on net assets. |
| Investment in an affiliated fund, which is registered under the Investment Company Act of 1940, as amended, and is advised by J.P. Morgan Investment Management Inc. |
| The rate shown is the current yield as of February 29, 2024. |
SEE NOTES TO FINANCIAL STATEMENTS.
| J.P. Morgan Exchange-Traded Funds | |
JPMorgan BetaBuilders USD High Yield Corporate Bond ETF
SCHEDULE OF PORTFOLIO INVESTMENTSAS OF February 29, 2024
| | |
|
Aerospace & Defense — 2.1% |
Bombardier, Inc. (Canada) |
| | |
| | |
| | |
| | |
|
| | |
| | |
Moog, Inc. 4.25%, 12/15/2027 (a) | | |
Rolls-Royce plc (United Kingdom) 5.75%, 10/15/2027 (a) | | |
|
| | |
| | |
| | |
|
| | |
| | |
| | |
| | |
| | |
| | |
|
| | |
| | |
| | |
Air Freight & Logistics — 0.1% |
Cargo Aircraft Management, Inc. 4.75%, 2/1/2028 (a) | | |
Rand Parent LLC 8.50%, 2/15/2030 (a) | | |
| | |
Automobile Components — 2.4% |
Adient Global Holdings Ltd. |
| | |
| | |
| | |
Allison Transmission, Inc. |
| | |
| | |
American Axle & Manufacturing, Inc. |
| | |
| | |
| | |
| | |
|
Automobile Components — continued |
|
| | |
| | |
| | |
| | |
|
| | |
| | |
| | |
Dornoch Debt Merger Sub, Inc. 6.63%, 10/15/2029 (a) | | |
Goodyear Tire & Rubber Co. (The) |
| | |
| | |
| | |
| | |
| | |
|
| | |
| | |
| | |
IHO Verwaltungs GmbH (Germany) |
4.75% (Cash), 9/15/2026 (a) (b) | | |
6.37% (Cash), 5/15/2029 (a) (b) | | |
JB Poindexter & Co., Inc. 8.75%, 12/15/2031 (a) | | |
|
| | |
| | |
Real Hero Merger Sub 2, Inc. 6.25%, 2/1/2029 (a) | | |
Tenneco, Inc. 8.00%, 11/17/2028 (a) | | |
ZF North America Capital, Inc. (Germany) |
| | |
| | |
| | |
|
Aston Martin Capital Holdings Ltd. (Jersey) 10.50%, 11/30/2025 (a) | | |
Jaguar Land Rover Automotive plc (United Kingdom) |
| | |
| | |
| | |
| | |
SEE NOTES TO FINANCIAL STATEMENTS.
| J.P. Morgan Exchange-Traded Funds | |
JPMorgan BetaBuilders USD High Yield Corporate Bond ETF
SCHEDULE OF PORTFOLIO INVESTMENTSAS OF February 29, 2024 (continued)
| | |
Corporate Bonds — continued |
|
Mclaren Finance plc (United Kingdom) 7.50%, 8/1/2026 (a) | | |
PM General Purchaser LLC 9.50%, 10/1/2028 (a) | | |
Thor Industries, Inc. 4.00%, 10/15/2029 (a) | | |
Winnebago Industries, Inc. 6.25%, 7/15/2028 (a) | | |
| | |
|
Banc of California (3-MONTH CME TERM SOFR + 2.52%), 3.25%, 5/1/2031 (c) | | |
Intesa Sanpaolo SpA (Italy) |
| | |
(US Treasury Yield Curve Rate T Note Constant Maturity 1 Year + 2.60%), 4.20%, 6/1/2032 (a) (c) | | |
(US Treasury Yield Curve Rate T Note Constant Maturity 1 Year + 2.75%), 4.95%, 6/1/2042 (a) (c) | | |
Popular, Inc. (Puerto Rico) 7.25%, 3/13/2028 | | |
Standard Chartered plc (United Kingdom) (3-MONTH SOFR + 1.46%), 7.01%, 7/30/2037 (a) (c) (d) (e) | | |
|
(USD ICE Swap Rate 5 Year + 3.70%), 5.86%, 6/19/2032 (a) (c) | | |
(US Treasury Yield Curve Rate T Note Constant Maturity 5 Year + 4.75%), 5.46%, 6/30/2035 (a) (c) | | |
Western Alliance Bancorp (3-MONTH CME TERM SOFR + 2.25%), 3.00%, 6/15/2031 (c) | | |
| | |
|
Primo Water Holdings, Inc. (Canada) 4.38%, 4/30/2029 (a) | | |
Triton Water Holdings, Inc. 6.25%, 4/1/2029 (a) | | |
| | |
|
Emergent BioSolutions, Inc. 3.88%, 8/15/2028 (a) | | |
Grifols SA (Spain) 4.75%, 10/15/2028 (a) | | |
| | |
|
ANGI Group LLC 3.88%, 8/15/2028 (a) | | |
| | |
|
Broadline Retail — continued |
Go Daddy Operating Co. LLC 3.50%, 3/1/2029 (a) | | |
GrubHub Holdings, Inc. 5.50%, 7/1/2027 (a) | | |
Kohl's Corp. 4.62%, 5/1/2031 (f) | | |
Macy's Retail Holdings LLC |
| | |
| | |
| | |
| | |
Match Group Holdings II LLC |
| | |
| | |
| | |
| | |
| | |
Millennium Escrow Corp. 6.63%, 8/1/2026 (a) | | |
NMG Holding Co., Inc. 7.13%, 4/1/2026 (a) | | |
|
| | |
| | |
| | |
| | |
| | |
Photo Holdings Merger Sub, Inc. 8.50%, 10/1/2026 (a) | | |
|
| | |
| | |
| | |
Rakuten Group, Inc. (Japan) (US Treasury Yield Curve Rate T Note Constant Maturity 5 Year + 4.96%), 6.25%, 4/22/2031 (a) (c) (d) (e) | | |
| | |
|
ACProducts Holdings, Inc. 6.38%, 5/15/2029 (a) | | |
Advanced Drainage Systems, Inc. |
| | |
| | |
AmeriTex HoldCo Intermediate LLC 10.25%, 10/15/2028 (a) | | |
Builders FirstSource, Inc. |
| | |
| | |
SEE NOTES TO FINANCIAL STATEMENTS.
| J.P. Morgan Exchange-Traded Funds | |
| | |
Corporate Bonds — continued |
Building Products — continued |
Camelot Return Merger Sub, Inc. 8.75%, 8/1/2028 (a) | | |
CP Atlas Buyer, Inc. 7.00%, 12/1/2028 (a) | | |
Eco Material Technologies, Inc. 7.88%, 1/31/2027 (a) | | |
EMRLD Borrower LP 6.63%, 12/15/2030 (a) | | |
Griffon Corp. 5.75%, 3/1/2028 | | |
James Hardie International Finance DAC 5.00%, 1/15/2028 (a) | | |
JELD-WEN, Inc. 4.88%, 12/15/2027 (a) | | |
Masonite International Corp. |
| | |
| | |
MIWD Holdco II LLC 5.50%, 2/1/2030 (a) | | |
New Enterprise Stone & Lime Co., Inc. 5.25%, 7/15/2028 (a) | | |
Oscar AcquisitionCo LLC 9.50%, 4/15/2030 (a) | | |
PGT Innovations, Inc. 4.38%, 10/1/2029 (a) | | |
Smyrna Ready Mix Concrete LLC 8.88%, 11/15/2031 (a) | | |
Standard Industries, Inc. |
| | |
| | |
| | |
|
| | |
| | |
| | |
|
AG TTMT Escrow Issuer LLC 8.63%, 9/30/2027 (a) | | |
Aretec Group, Inc. 7.50%, 4/1/2029 (a) | | |
Brightsphere Investment Group, Inc. 4.80%, 7/27/2026 | | |
Coinbase Global, Inc. 3.38%, 10/1/2028 (a) | | |
Compass Group Diversified Holdings LLC |
| | |
| | |
Dresdner Funding Trust I 8.15%, 6/30/2031 (a) | | |
|
| | |
| | |
| | |
| | |
| | |
|
Capital Markets — continued |
Jane Street Group 4.50%, 11/15/2029 (a) | | |
Osaic Holdings, Inc. 10.75%, 8/1/2027 (a) | | |
StoneX Group, Inc. 8.63%, 6/15/2025 (a) | | |
| | |
|
|
| | |
| | |
ASP Unifrax Holdings, Inc. |
| | |
| | |
|
| | |
| | |
Axalta Coating Systems LLC 4.75%, 6/15/2027 (a) | | |
Cerdia Finanz GmbH (Germany) 10.50%, 2/15/2027 (a) | | |
|
| | |
| | |
| | |
CVR Partners LP 6.13%, 6/15/2028 (a) | | |
Element Solutions, Inc. 3.88%, 9/1/2028 (a) | | |
FXI Holdings, Inc. 12.25%, 11/15/2026 (a) | | |
GPD Cos., Inc. 10.13%, 4/1/2026 (a) | | |
HB Fuller Co. 4.00%, 2/15/2027 | | |
INEOS Finance plc (Luxembourg) 6.75%, 5/15/2028 (a) | | |
Ingevity Corp. 3.88%, 11/1/2028 (a) | | |
LSB Industries, Inc. 6.25%, 10/15/2028 (a) | | |
Mativ Holdings, Inc. 6.88%, 10/1/2026 (a) | | |
|
| | |
| | |
| | |
NOVA Chemicals Corp. (Canada) |
| | |
| | |
| | |
Nufarm Australia Ltd. (Australia) 5.00%, 1/27/2030 (a) | | |
|
| | |
| | |
SEE NOTES TO FINANCIAL STATEMENTS.
| J.P. Morgan Exchange-Traded Funds | |
JPMorgan BetaBuilders USD High Yield Corporate Bond ETF
SCHEDULE OF PORTFOLIO INVESTMENTSAS OF February 29, 2024 (continued)
| | |
Corporate Bonds — continued |
|
| | |
Olympus Water US Holding Corp. |
| | |
| | |
| | |
Polar US Borrower LLC 6.75%, 5/15/2026 (a) | | |
Rain Carbon, Inc. 12.25%, 9/1/2029 (a) | | |
Rain CII Carbon LLC 7.25%, 4/1/2025 (a) | | |
Rayonier AM Products, Inc. 7.63%, 1/15/2026 (a) | | |
|
| | |
| | |
SCIL IV LLC 5.38%, 11/1/2026 (a) | | |
Scotts Miracle-Gro Co. (The) |
| | |
| | |
| | |
SK Invictus Intermediate II SARL 5.00%, 10/30/2029 (a) | | |
Trinseo Materials Operating SCA 5.13%, 4/1/2029 (a) | | |
Tronox, Inc. 4.63%, 3/15/2029 (a) | | |
Vibrantz Technologies, Inc. 9.00%, 2/15/2030 (a) | | |
WR Grace Holdings LLC 5.63%, 8/15/2029 (a) | | |
| | |
Commercial Services & Supplies — 3.0% |
ACCO Brands Corp. 4.25%, 3/15/2029 (a) | | |
|
| | |
| | |
Allied Universal Holdco LLC |
| | |
| | |
| | |
| | |
|
| | |
| | |
Aptim Corp. 7.75%, 6/15/2025 (a) | | |
APX Group, Inc. 5.75%, 7/15/2029 (a) | | |
Aramark Services, Inc. 5.00%, 2/1/2028 (a) | | |
Brink's Co. (The) 4.63%, 10/15/2027 (a) | | |
Cimpress plc (Ireland) 7.00%, 6/15/2026 | | |
| | |
|
Commercial Services & Supplies — continued |
|
| | |
| | |
CoreCivic, Inc. 8.25%, 4/15/2026 | | |
Covanta Holding Corp. 5.00%, 9/1/2030 | | |
Deluxe Corp. 8.00%, 6/1/2029 (a) | | |
Enviri Corp. 5.75%, 7/31/2027 (a) | | |
Garda World Security Corp. (Canada) |
| | |
| | |
| | |
| | |
GEO Group, Inc. (The) 10.50%, 6/30/2028 | | |
GFL Environmental, Inc. (Canada) |
| | |
| | |
| | |
| | |
Interface, Inc. 5.50%, 12/1/2028 (a) | | |
|
| | |
| | |
Neptune Bidco US, Inc. 9.29%, 4/15/2029 (a) | | |
|
| | |
| | |
Prime Security Services Borrower LLC |
| | |
| | |
Steelcase, Inc. 5.13%, 1/18/2029 | | |
Vericast Corp. 11.00%, 9/15/2026 (a) | | |
Waste Pro USA, Inc. 5.50%, 2/15/2026 (a) | | |
|
| | |
| | |
| | |
| | |
Communications Equipment — 0.6% |
CommScope Technologies LLC 6.00%, 6/15/2025 (a) | | |
|
| | |
| | |
| | |
SEE NOTES TO FINANCIAL STATEMENTS.
| J.P. Morgan Exchange-Traded Funds | |
| | |
Corporate Bonds — continued |
Communications Equipment — continued |
|
| | |
| | |
Viavi Solutions, Inc. 3.75%, 10/1/2029 (a) | | |
| | |
Construction & Engineering — 0.8% |
| | |
Arcosa, Inc. 4.38%, 4/15/2029 (a) | | |
ATP Tower Holdings LLC (Chile) 4.05%, 4/27/2026 (a) | | |
Brand Industrial Services, Inc. 10.38%, 8/1/2030 (a) | | |
Brundage-Bone Concrete Pumping Holdings, Inc. 6.00%, 2/1/2026 (a) | | |
Dycom Industries, Inc. 4.50%, 4/15/2029 (a) | | |
Fluor Corp. 4.25%, 9/15/2028 | | |
Global Infrastructure Solutions, Inc. 5.63%, 6/1/2029 (a) | | |
INNOVATE Corp. 8.50%, 2/1/2026 (a) | | |
|
| | |
| | |
Railworks Holdings LP 8.25%, 11/15/2028 (a) | | |
Tutor Perini Corp. 6.88%, 5/1/2025 (a) | | |
VM Consolidated, Inc. 5.50%, 4/15/2029 (a) | | |
Weekley Homes LLC 4.88%, 9/15/2028 (a) | | |
| | |
|
|
| | |
| | |
Bread Financial Holdings, Inc. 9.75%, 3/15/2029 (a) | | |
Cobra AcquisitionCo LLC 6.38%, 11/1/2029 (a) | | |
Credit Acceptance Corp. 6.63%, 3/15/2026 | | |
Curo Group Holdings Corp. 7.50%, 8/1/2028 (a) | | |
Enova International, Inc. 8.50%, 9/15/2025 (a) | | |
Finance of America Funding LLC 7.88%, 11/15/2025 (a) | | |
|
| | |
| | |
| | |
|
Consumer Finance — continued |
GGAM Finance Ltd. (Ireland) 8.00%, 2/15/2027 (a) | | |
goeasy Ltd. (Canada) 4.38%, 5/1/2026 (a) | | |
LFS Topco LLC 5.88%, 10/15/2026 (a) | | |
Macquarie Airfinance Holdings Ltd. (United Kingdom) |
| | |
| | |
|
| | |
| | |
| | |
| | |
| | |
| | |
| | |
| | |
|
| | |
| | |
| | |
| | |
| | |
| | |
| | |
|
| | |
| | |
| | |
PROG Holdings, Inc. 6.00%, 11/15/2029 (a) | | |
Synchrony Financial 7.25%, 2/2/2033 | | |
World Acceptance Corp. 7.00%, 11/1/2026 (a) | | |
| | |
Consumer Staples Distribution & Retail — 1.0% |
|
| | |
| | |
| | |
| | |
C&S Group Enterprises LLC 5.00%, 12/15/2028 (a) | | |
Performance Food Group, Inc. |
| | |
| | |
| | |
SEE NOTES TO FINANCIAL STATEMENTS.
| J.P. Morgan Exchange-Traded Funds | |
JPMorgan BetaBuilders USD High Yield Corporate Bond ETF
SCHEDULE OF PORTFOLIO INVESTMENTSAS OF February 29, 2024 (continued)
| | |
Corporate Bonds — continued |
Consumer Staples Distribution & Retail — continued |
Rite Aid Corp. 8.00%, 11/15/2026 (a) (g) | | |
Safeway, Inc. 7.25%, 2/1/2031 | | |
United Natural Foods, Inc. 6.75%, 10/15/2028 (a) | | |
|
| | |
| | |
| | |
| | |
Containers & Packaging — 2.8% |
ARD Finance SA (Luxembourg) 6.50% (Cash), 6/30/2027 (a) (b) | | |
Ardagh Metal Packaging Finance USA LLC |
| | |
| | |
Ardagh Packaging Finance plc |
| | |
| | |
| | |
|
| | |
| | |
| | |
| | |
Berry Global, Inc. 5.63%, 7/15/2027 (a) | | |
Cascades, Inc. (Canada) 5.38%, 1/15/2028 (a) | | |
Clydesdale Acquisition Holdings, Inc. |
| | |
| | |
|
| | |
| | |
Crown Cork & Seal Co., Inc. 7.38%, 12/15/2026 | | |
Graham Packaging Co., Inc. 7.13%, 8/15/2028 (a) | | |
Graphic Packaging International LLC |
| | |
| | |
| | |
| | |
Iris Holding, Inc. 10.00%, 12/15/2028 (a) | | |
|
| | |
| | |
| | |
|
Containers & Packaging — continued |
| | |
| | |
Mauser Packaging Solutions Holding Co. |
| | |
| | |
Owens-Brockway Glass Container, Inc. |
| | |
| | |
Pactiv Evergreen Group Issuer LLC 4.38%, 10/15/2028 (a) | | |
|
| | |
| | |
| | |
| | |
Silgan Holdings, Inc. 4.13%, 2/1/2028 | | |
TriMas Corp. 4.13%, 4/15/2029 (a) | | |
Trivium Packaging Finance BV (Netherlands) 5.50%, 8/15/2026 (a) (f) | | |
| | |
|
American Builders & Contractors Supply Co., Inc. |
| | |
| | |
Dealer Tire LLC 8.00%, 2/1/2028 (a) | | |
Resideo Funding, Inc. 4.00%, 9/1/2029 (a) | | |
Ritchie Bros Holdings, Inc. (Canada) 6.75%, 3/15/2028 (a) | | |
Verde Purchaser LLC 10.50%, 11/30/2030 (a) | | |
Windsor Holdings III LLC 8.50%, 6/15/2030 (a) | | |
| | |
Diversified Consumer Services — 0.7% |
Adtalem Global Education, Inc. 5.50%, 3/1/2028 (a) | | |
Carriage Services, Inc. 4.25%, 5/15/2029 (a) | | |
Grand Canyon University 4.13%, 10/1/2024 | | |
Mavis Tire Express Services Topco Corp. 6.50%, 5/15/2029 (a) | | |
Service Corp. International |
| | |
| | |
| | |
Signal Parent, Inc. 6.13%, 4/1/2029 (a) | | |
Sotheby's 7.38%, 10/15/2027 (a) | | |
SEE NOTES TO FINANCIAL STATEMENTS.
| J.P. Morgan Exchange-Traded Funds | |
| | |
Corporate Bonds — continued |
Diversified Consumer Services — continued |
StoneMor, Inc. 8.50%, 5/15/2029 (a) | | |
Wand NewCo 3, Inc. 7.63%, 1/30/2032 (a) | | |
WW International, Inc. 4.50%, 4/15/2029 (a) | | |
| | |
|
Iron Mountain Information Management Services, Inc. 5.00%, 7/15/2032 (a) | | |
|
| | |
| | |
| | |
| | |
| | |
Diversified Telecommunication Services — 5.0% |
Altice France SA (France) |
| | |
| | |
| | |
| | |
British Telecommunications plc (United Kingdom) (US Treasury Yield Curve Rate T Note Constant Maturity 5 Year + 3.49%), 4.88%, 11/23/2081 (a) (c) | | |
C&W Senior Financing DAC (Panama) 6.88%, 9/15/2027 (a) | | |
|
| | |
| | |
| | |
| | |
| | |
| | |
| | |
| | |
| | |
| | |
| | |
| | |
Consolidated Communications, Inc. |
| | |
| | |
Embarq Corp. 8.00%, 6/1/2036 | | |
Frontier Communications Holdings LLC |
| | |
| | |
|
Diversified Telecommunication Services — continued |
| | |
| | |
| | |
| | |
| | |
| | |
Frontier Florida LLC Series E, 6.86%, 2/1/2028 | | |
Iliad Holding SASU (France) 6.50%, 10/15/2026 (a) | | |
Intelsat Jackson Holdings SA (Luxembourg) 6.50%, 3/15/2030 (a) | | |
|
| | |
| | |
| | |
| | |
| | |
Qwest Corp. 7.25%, 9/15/2025 | | |
Sable International Finance Ltd. (Chile) 5.75%, 9/7/2027 (a) | | |
Telecom Italia Capital SA (Italy) |
| | |
| | |
| | |
| | |
|
| | |
| | |
| | |
Virgin Media Finance plc (United Kingdom) 5.00%, 7/15/2030 (a) | | |
Virgin Media Secured Finance plc (United Kingdom) 5.50%, 5/15/2029 (a) | | |
Windstream Escrow LLC 7.75%, 8/15/2028 (a) | | |
Zayo Group Holdings, Inc. |
| | |
| | |
| | |
Electric Utilities — 1.8% |
DPL, Inc. 4.35%, 4/15/2029 | | |
Drax Finco plc (United Kingdom) 6.63%, 11/1/2025 (a) | | |
SEE NOTES TO FINANCIAL STATEMENTS.
| J.P. Morgan Exchange-Traded Funds | |
JPMorgan BetaBuilders USD High Yield Corporate Bond ETF
SCHEDULE OF PORTFOLIO INVESTMENTSAS OF February 29, 2024 (continued)
| | |
Corporate Bonds — continued |
Electric Utilities — continued |
|
(US Treasury Yield Curve Rate T Note Constant Maturity 5 Year + 3.86%), 8.13%, 6/15/2053 (c) | | |
(US Treasury Yield Curve Rate T Note Constant Maturity 5 Year + 3.66%), 7.88%, 6/15/2054 (c) | | |
Emera, Inc. (Canada) Series 16-A, (3-MONTH SOFR + 5.44%), 6.75%, 6/15/2076 (c) | | |
|
Series B, 4.15%, 7/15/2027 (f) | | |
| | |
Series B, 2.25%, 9/1/2030 | | |
Series C, 7.38%, 11/15/2031 | | |
Series C, 5.10%, 7/15/2047 (f) | | |
Series C, 3.40%, 3/1/2050 | | |
Leeward Renewable Energy Operations LLC 4.25%, 7/1/2029 (a) | | |
NextEra Energy Operating Partners LP 4.50%, 9/15/2027 (a) | | |
|
| | |
| | |
| | |
| | |
Pattern Energy Operations LP 4.50%, 8/15/2028 (a) | | |
|
| | |
| | |
Terraform Global Operating LP 6.13%, 3/1/2026 (a) | | |
Vistra Operations Co. LLC |
| | |
| | |
| | |
| | |
| | |
| | |
Electrical Equipment — 0.3% |
Atkore, Inc. 4.25%, 6/1/2031 (a) | | |
|
| | |
| | |
|
Electrical Equipment — continued |
| | |
Vertiv Group Corp. 4.13%, 11/15/2028 (a) | | |
| | |
Electronic Equipment, Instruments & Components — 0.2% |
Coherent Corp. 5.00%, 12/15/2029 (a) | | |
Sensata Technologies, Inc. |
| | |
| | |
| | |
Energy Equipment & Services — 1.7% |
|
| | |
| | |
Bristow Group, Inc. 6.88%, 3/1/2028 (a) | | |
CGG SA (France) 8.75%, 4/1/2027 (a) | | |
CSI Compressco LP 7.50%, 4/1/2025 (a) | | |
Diamond Foreign Asset Co. 8.50%, 10/1/2030 (a) | | |
Enerflex Ltd. (Canada) 9.00%, 10/15/2027 (a) | | |
Global Marine, Inc. 7.00%, 6/1/2028 | | |
Helix Energy Solutions Group, Inc. 9.75%, 3/1/2029 (a) | | |
|
| | |
| | |
Nabors Industries, Inc. 7.38%, 5/15/2027 (a) | | |
Nine Energy Service, Inc. 13.00%, 2/1/2028 | | |
Noble Finance II LLC 8.00%, 4/15/2030 (a) | | |
Oceaneering International, Inc. 6.00%, 2/1/2028 | | |
Petrofac Ltd. (United Kingdom) 9.75%, 11/15/2026 (a) | | |
Precision Drilling Corp. (Canada) |
| | |
| | |
Seadrill Finance Ltd. (Norway) 8.38%, 8/1/2030 (a) | | |
|
| | |
| | |
| | |
| | |
| | |
| | |
SEE NOTES TO FINANCIAL STATEMENTS.
| J.P. Morgan Exchange-Traded Funds | |
| | |
Corporate Bonds — continued |
Energy Equipment & Services — continued |
USA Compression Partners LP |
| | |
| | |
Valaris Ltd. 8.38%, 4/30/2030 (a) | | |
Weatherford International Ltd. |
| | |
| | |
Welltec International ApS (Denmark) 8.25%, 10/15/2026 (a) | | |
| | |
|
Allen Media LLC 10.50%, 2/15/2028 (a) | | |
AMC Entertainment Holdings, Inc. |
10.00% (Cash), 6/15/2026 (a) (b) | | |
| | |
Banijay Entertainment SASU (France) 8.13%, 5/1/2029 (a) | | |
Cinemark USA, Inc. 5.25%, 7/15/2028 (a) | | |
Lions Gate Capital Holdings LLC 5.50%, 4/15/2029 (a) | | |
Live Nation Entertainment, Inc. |
| | |
| | |
| | |
| | |
Odeon Finco plc (United Kingdom) 12.75%, 11/1/2027 (a) | | |
ROBLOX Corp. 3.88%, 5/1/2030 (a) | | |
|
| | |
| | |
| | |
Financial Services — 2.8% |
Armor Holdco, Inc. 8.50%, 11/15/2029 (a) | | |
Block, Inc. 3.50%, 6/1/2031 | | |
Burford Capital Global Finance LLC 9.25%, 7/1/2031 (a) | | |
CPI CG, Inc. 8.63%, 3/15/2026 (a) | | |
|
| | |
| | |
| | |
| | |
| | |
|
Financial Services — continued |
GTCR W-2 Merger Sub LLC 7.50%, 1/15/2031 (a) | | |
Jefferies Finance LLC 5.00%, 8/15/2028 (a) | | |
Jefferson Capital Holdings LLC 6.00%, 8/15/2026 (a) | | |
LD Holdings Group LLC 6.13%, 4/1/2028 (a) | | |
Midcap Financial Issuer Trust |
| | |
| | |
Mobius Merger Sub, Inc. 9.00%, 6/1/2030 (a) | | |
MPH Acquisition Holdings LLC |
| | |
| | |
Nationstar Mortgage Holdings, Inc. |
| | |
| | |
| | |
NCR Atleos Corp. 9.50%, 4/1/2029 (a) | | |
Oxford Finance LLC 6.38%, 2/1/2027 (a) | | |
Paysafe Finance plc 4.00%, 6/15/2029 (a) | | |
PennyMac Financial Services, Inc. |
| | |
| | |
| | |
PHH Mortgage Corp. 7.88%, 3/15/2026 (a) | | |
|
| | |
| | |
|
| | |
| | |
Shift4 Payments LLC 4.63%, 11/1/2026 (a) | | |
Stena International SA (Sweden) 7.25%, 1/15/2031 (a) | | |
United Wholesale Mortgage LLC |
| | |
| | |
Verscend Escrow Corp. 9.75%, 8/15/2026 (a) | | |
| | |
|
|
| | |
| | |
| | |
SEE NOTES TO FINANCIAL STATEMENTS.
| J.P. Morgan Exchange-Traded Funds | |
JPMorgan BetaBuilders USD High Yield Corporate Bond ETF
SCHEDULE OF PORTFOLIO INVESTMENTSAS OF February 29, 2024 (continued)
| | |
Corporate Bonds — continued |
Food Products — continued |
Chobani LLC 4.63%, 11/15/2028 (a) | | |
Darling Ingredients, Inc. 5.25%, 4/15/2027 (a) | | |
H-Food Holdings LLC 8.50%, 6/1/2026 (a) | | |
Lamb Weston Holdings, Inc. |
| | |
| | |
| | |
|
| | |
| | |
| | |
| | |
|
| | |
| | |
| | |
| | |
Simmons Foods, Inc. 4.63%, 3/1/2029 (a) | | |
| | |
|
|
| | |
| | |
|
| | |
| | |
Suburban Propane Partners LP 5.00%, 6/1/2031 (a) | | |
| | |
Ground Transportation — 1.1% |
AerCap Global Aviation Trust (Ireland) (3-MONTH CME TERM SOFR + 4.56%), 6.50%, 6/15/2045 (a) (c) | | |
Albion Financing 1 SARL (Luxembourg) 6.13%, 10/15/2026 (a) | | |
Avis Budget Car Rental LLC |
| | |
| | |
| | |
Carriage Purchaser, Inc. 7.88%, 10/15/2029 (a) | | |
EquipmentShare.com, Inc. 9.00%, 5/15/2028 (a) | | |
First Student Bidco, Inc. 4.00%, 7/31/2029 (a) | | |
| | |
|
Ground Transportation — continued |
GN Bondco LLC 9.50%, 10/15/2031 (a) | | |
|
| | |
| | |
NESCO Holdings II, Inc. 5.50%, 4/15/2029 (a) | | |
PECF USS Intermediate Holding III Corp. 8.00%, 11/15/2029 (a) | | |
RXO, Inc. 7.50%, 11/15/2027 (a) | | |
|
| | |
| | |
Watco Cos. LLC 6.50%, 6/15/2027 (a) | | |
XPO CNW, Inc. 6.70%, 5/1/2034 | | |
XPO, Inc. 7.13%, 2/1/2032 (a) | | |
| | |
Health Care Equipment & Supplies — 1.0% |
Avantor Funding, Inc. 4.63%, 7/15/2028 (a) | | |
Embecta Corp. 5.00%, 2/15/2030 (a) | | |
Hologic, Inc. 3.25%, 2/15/2029 (a) | | |
|
| | |
| | |
Neogen Food Safety Corp. 8.63%, 7/20/2030 (a) | | |
| | |
Health Care Providers & Services — 4.0% |
Acadia Healthcare Co., Inc. 5.50%, 7/1/2028 (a) | | |
|
| | |
| | |
| | |
AHP Health Partners, Inc. 5.75%, 7/15/2029 (a) | | |
Community Health Systems, Inc. |
| | |
| | |
| | |
| | |
| | |
| | |
| | |
| | |
| | |
SEE NOTES TO FINANCIAL STATEMENTS.
| J.P. Morgan Exchange-Traded Funds | |
| | |
Corporate Bonds — continued |
Health Care Providers & Services — continued |
|
| | |
| | |
|
| | |
| | |
| | |
Global Medical Response, Inc. 6.50%, 10/1/2025 (a) | | |
HealthEquity, Inc. 4.50%, 10/1/2029 (a) | | |
Heartland Dental LLC 10.50%, 4/30/2028 (a) | | |
Kedrion SpA (Italy) 6.50%, 9/1/2029 (a) | | |
Legacy LifePoint Health LLC 4.38%, 2/15/2027 (a) | | |
LifePoint Health, Inc. 5.38%, 1/15/2029 (a) | | |
ModivCare Escrow Issuer, Inc. 5.00%, 10/1/2029 (a) | | |
ModivCare, Inc. 5.88%, 11/15/2025 (a) | | |
|
| | |
| | |
|
| | |
| | |
Prime Healthcare Services, Inc. 7.25%, 11/1/2025 (a) | | |
|
8.50% (Blend (Cash 5.00% + PIK 3.50%)), 1/31/2029 (a) (b) | | |
9.78% (PIK), 2/15/2030 (a) (b) | | |
RegionalCare Hospital Partners Holdings, Inc. 9.75%, 12/1/2026 (a) | | |
Select Medical Corp. 6.25%, 8/15/2026 (a) | | |
Star Parent, Inc. 9.00%, 10/1/2030 (a) | | |
Team Health Holdings, Inc. 6.38%, 2/1/2025 (a) | | |
|
| | |
| | |
| | |
| | |
| | |
| | |
| | |
| | |
| | |
| | |
|
Health Care Providers & Services — continued |
Toledo Hospital (The) 6.02%, 11/15/2048 | | |
US Acute Care Solutions LLC 6.38%, 3/1/2026 (a) | | |
| | |
|
Diversified Healthcare Trust |
| | |
| | |
MPT Operating Partnership LP |
| | |
| | |
| | |
Health Care Technology — 0.2% |
IQVIA, Inc. 5.00%, 10/15/2026 (a) | | |
Hotel & Resort REITs — 0.8% |
Park Intermediate Holdings LLC |
| | |
| | |
| | |
RHP Hotel Properties LP 4.75%, 10/15/2027 | | |
RLJ Lodging Trust LP 4.00%, 9/15/2029 (a) | | |
|
| | |
| | |
| | |
| | |
| | |
| | |
| | |
|
| | |
| | |
| | |
Hotels, Restaurants & Leisure — 8.1% |
|
| | |
| | |
| | |
| | |
Affinity Interactive 6.88%, 12/15/2027 (a) | | |
Bloomin' Brands, Inc. 5.13%, 4/15/2029 (a) | | |
Boyd Gaming Corp. 4.75%, 12/1/2027 | | |
Boyne USA, Inc. 4.75%, 5/15/2029 (a) | | |
SEE NOTES TO FINANCIAL STATEMENTS.
| J.P. Morgan Exchange-Traded Funds | |
JPMorgan BetaBuilders USD High Yield Corporate Bond ETF
SCHEDULE OF PORTFOLIO INVESTMENTSAS OF February 29, 2024 (continued)
| | |
Corporate Bonds — continued |
Hotels, Restaurants & Leisure — continued |
Brinker International, Inc. 8.25%, 7/15/2030 (a) | | |
Caesars Entertainment, Inc. |
| | |
| | |
| | |
|
| | |
| | |
| | |
| | |
| | |
Carnival Holdings Bermuda Ltd. 10.38%, 5/1/2028 (a) | | |
Carrols Restaurant Group, Inc. 5.88%, 7/1/2029 (a) | | |
CEC Entertainment LLC 6.75%, 5/1/2026 (a) | | |
|
| | |
| | |
| | |
|
| | |
| | |
ClubCorp Holdings, Inc. 8.50%, 9/15/2025 (a) | | |
Dave & Buster's, Inc. 7.63%, 11/1/2025 (a) | | |
Empire Resorts, Inc. 7.75%, 11/1/2026 (a) | | |
Fertitta Entertainment LLC |
| | |
| | |
Full House Resorts, Inc. 8.25%, 2/15/2028 (a) | | |
GPS Hospitality Holding Co. LLC 7.00%, 8/15/2028 (a) | | |
Hilton Domestic Operating Co., Inc. |
| | |
| | |
| | |
| | |
| | |
Hilton Grand Vacations Borrower Escrow LLC 5.00%, 6/1/2029 (a) | | |
Hilton Worldwide Finance LLC 4.88%, 4/1/2027 | | |
International Game Technology plc |
| | |
| | |
|
Hotels, Restaurants & Leisure — continued |
| | |
| | |
IRB Holding Corp. 7.00%, 6/15/2025 (a) | | |
Jacobs Entertainment, Inc. 6.75%, 2/15/2029 (a) | | |
KFC Holding Co. 4.75%, 6/1/2027 (a) | | |
|
| | |
| | |
| | |
|
| | |
| | |
Light & Wonder International, Inc. |
| | |
| | |
Lindblad Expeditions Holdings, Inc. 9.00%, 5/15/2028 (a) | | |
Lindblad Expeditions LLC 6.75%, 2/15/2027 (a) | | |
MajorDrive Holdings IV LLC 6.38%, 6/1/2029 (a) | | |
Marriott Ownership Resorts, Inc. |
| | |
| | |
Merlin Entertainments Ltd. (United Kingdom) 5.75%, 6/15/2026 (a) | | |
MGM Resorts International |
| | |
| | |
| | |
| | |
Mohegan Tribal Gaming Authority 8.00%, 2/1/2026 (a) | | |
|
| | |
| | |
| | |
| | |
| | |
Ontario Gaming GTA LP (Canada) 8.00%, 8/1/2030 (a) | | |
Penn Entertainment, Inc. 4.13%, 7/1/2029 (a) | | |
Premier Entertainment Sub LLC |
| | |
| | |
SEE NOTES TO FINANCIAL STATEMENTS.
| J.P. Morgan Exchange-Traded Funds | |
| | |
Corporate Bonds — continued |
Hotels, Restaurants & Leisure — continued |
Resorts World Las Vegas LLC 4.63%, 4/16/2029 (a) | | |
Royal Caribbean Cruises Ltd. |
| | |
| | |
| | |
| | |
| | |
| | |
| | |
| | |
Scientific Games Holdings LP 6.63%, 3/1/2030 (a) | | |
SeaWorld Parks & Entertainment, Inc. 5.25%, 8/15/2029 (a) | | |
Six Flags Entertainment Corp. |
| | |
| | |
Six Flags Theme Parks, Inc. 7.00%, 7/1/2025 (a) | | |
Sizzling Platter LLC 8.50%, 11/28/2025 (a) | | |
Speedway Motorsports LLC 4.88%, 11/1/2027 (a) | | |
|
| | |
| | |
Sugarhouse HSP Gaming Prop Mezz LP 5.88%, 5/15/2025 (a) | | |
|
| | |
| | |
|
| | |
| | |
| | |
| | |
Vail Resorts, Inc. 6.25%, 5/15/2025 (a) | | |
|
| | |
| | |
| | |
Viking Ocean Cruises Ship VII Ltd. 5.63%, 2/15/2029 (a) | | |
VOC Escrow Ltd. 5.00%, 2/15/2028 (a) | | |
Wyndham Hotels & Resorts, Inc. 4.38%, 8/15/2028 (a) | | |
| | |
|
Hotels, Restaurants & Leisure — continued |
Wynn Las Vegas LLC 5.25%, 5/15/2027 (a) | | |
|
| | |
| | |
|
| | |
| | |
| | |
| | |
| | |
Household Durables — 1.6% |
|
| | |
| | |
|
| | |
| | |
Brookfield Residential Properties, Inc. (Canada) |
| | |
| | |
| | |
CD&R Smokey Buyer, Inc. 6.75%, 7/15/2025 (a) | | |
Century Communities, Inc. |
| | |
| | |
Dream Finders Homes, Inc. 8.25%, 8/15/2028 (a) | | |
Empire Communities Corp. (Canada) 7.00%, 12/15/2025 (a) | | |
|
| | |
| | |
| | |
LGI Homes, Inc. 8.75%, 12/15/2028 (a) | | |
|
| | |
| | |
Mattamy Group Corp. (Canada) 5.25%, 12/15/2027 (a) | | |
|
| | |
| | |
| | |
| | |
SEE NOTES TO FINANCIAL STATEMENTS.
| J.P. Morgan Exchange-Traded Funds | |
JPMorgan BetaBuilders USD High Yield Corporate Bond ETF
SCHEDULE OF PORTFOLIO INVESTMENTSAS OF February 29, 2024 (continued)
| | |
Corporate Bonds — continued |
Household Durables — continued |
| | |
| | |
Shea Homes LP 4.75%, 2/15/2028 | | |
SWF Escrow Issuer Corp. 6.50%, 10/1/2029 (a) | | |
Taylor Morrison Communities, Inc. |
| | |
| | |
Tempur Sealy International, Inc. 4.00%, 4/15/2029 (a) | | |
|
| | |
| | |
Tri Pointe Homes, Inc. 5.70%, 6/15/2028 | | |
| | |
Household Products — 0.4% |
|
| | |
| | |
| | |
|
| | |
| | |
| | |
Kronos Acquisition Holdings, Inc. (Canada) |
| | |
| | |
Spectrum Brands, Inc. 5.00%, 10/1/2029 (a) | | |
| | |
Independent Power and Renewable Electricity Producers — 0.8% |
|
| | |
| | |
| | |
| | |
Clearway Energy Operating LLC |
| | |
| | |
| | |
Talen Energy Supply LLC 8.63%, 6/1/2030 (a) | | |
TransAlta Corp. (Canada) 6.50%, 3/15/2040 | | |
| | |
| | |
|
|
|
| | |
| | |
| | |
| | |
Alliant Holdings Intermediate LLC |
| | |
| | |
| | |
| | |
| | |
Assurant, Inc. (3-MONTH SOFR + 4.14%), 7.00%, 3/27/2048 (c) | | |
AssuredPartners, Inc. 5.63%, 1/15/2029 (a) | | |
BroadStreet Partners, Inc. 5.88%, 4/15/2029 (a) | | |
Genworth Holdings, Inc. 6.50%, 6/15/2034 | | |
Global Atlantic Fin Co. (US Treasury Yield Curve Rate T Note Constant Maturity 5 Year + 3.80%), 4.70%, 10/15/2051 (a) (c) | | |
|
| | |
| | |
| | |
Jones Deslauriers Insurance Management, Inc. (Canada) 8.50%, 3/15/2030 (a) | | |
Liberty Mutual Group, Inc. |
| | |
(US Treasury Yield Curve Rate T Note Constant Maturity 5 Year + 3.32%), 4.13%, 12/15/2051 (a) (c) | | |
| | |
|
| | |
| | |
| | |
| | |
Ryan Specialty LLC 4.38%, 2/1/2030 (a) | | |
| | |
Interactive Media & Services — 0.2% |
Cars.com, Inc. 6.38%, 11/1/2028 (a) | | |
Rackspace Technology Global, Inc. |
| | |
| | |
TripAdvisor, Inc. 7.00%, 7/15/2025 (a) | | |
SEE NOTES TO FINANCIAL STATEMENTS.
| J.P. Morgan Exchange-Traded Funds | |
| | |
Corporate Bonds — continued |
Interactive Media & Services — continued |
Ziff Davis, Inc. 4.63%, 10/15/2030 (a) | | |
ZipRecruiter, Inc. 5.00%, 1/15/2030 (a) | | |
| | |
|
Ahead DB Holdings LLC 6.63%, 5/1/2028 (a) | | |
Arches Buyer, Inc. 6.13%, 12/1/2028 (a) | | |
Cablevision Lightpath LLC |
| | |
| | |
Conduent Business Services LLC 6.00%, 11/1/2029 (a) | | |
Newfold Digital Holdings Group, Inc. 6.00%, 2/15/2029 (a) | | |
|
| | |
| | |
|
| | |
| | |
Twilio, Inc. 3.88%, 3/15/2031 | | |
Unisys Corp. 6.88%, 11/1/2027 (a) | | |
| | |
Life Sciences Tools & Services — 0.2% |
Charles River Laboratories International, Inc. |
| | |
| | |
Fortrea Holdings, Inc. 7.50%, 7/1/2030 (a) | | |
| | |
|
Amsted Industries, Inc. 4.63%, 5/15/2030 (a) | | |
Calderys Financing LLC (France) 11.25%, 6/1/2028 (a) | | |
Chart Industries, Inc. 7.50%, 1/1/2030 (a) | | |
Enpro, Inc. 5.75%, 10/15/2026 | | |
GrafTech Finance, Inc. 4.63%, 12/15/2028 (a) | | |
GrafTech Global Enterprises, Inc. 9.88%, 12/15/2028 (a) | | |
|
| | |
| | |
Husky III Holding Ltd. (Canada) 13.00% (Cash), 2/15/2025 (a) (b) | | |
Manitowoc Co., Inc. (The) 9.00%, 4/1/2026 (a) | | |
| | |
|
|
Mueller Water Products, Inc. 4.00%, 6/15/2029 (a) | | |
OT Merger Corp. 7.88%, 10/15/2029 (a) | | |
Park-Ohio Industries, Inc. 6.63%, 4/15/2027 | | |
Roller Bearing Co. of America, Inc. 4.38%, 10/15/2029 (a) | | |
SPX FLOW, Inc. 8.75%, 4/1/2030 (a) | | |
Terex Corp. 5.00%, 5/15/2029 (a) | | |
Titan International, Inc. 7.00%, 4/30/2028 | | |
TK Elevator Holdco GmbH (Germany) 7.63%, 7/15/2028 (a) | | |
TK Elevator US Newco, Inc. (Germany) 5.25%, 7/15/2027 (a) | | |
Werner FinCo. LP 14.50% (Blend (Cash 8.75% + PIK 5.75%)), 10/15/2028 (a) (b) | | |
| | |
Marine Transportation — 0.0% ^ |
Danaos Corp. (Greece) 8.50%, 3/1/2028 (a) | | |
|
Advantage Sales & Marketing, Inc. 6.50%, 11/15/2028 (a) | | |
Altice Financing SA (Luxembourg) |
| | |
| | |
|
| | |
| | |
Beasley Mezzanine Holdings LLC 8.63%, 2/1/2026 (a) | | |
Cable One, Inc. 4.00%, 11/15/2030 (a) | | |
Clear Channel International BV (United Kingdom) 6.63%, 8/1/2025 (a) | | |
Clear Channel Outdoor Holdings, Inc. |
| | |
| | |
CMG Media Corp. 8.88%, 12/15/2027 (a) | | |
|
| | |
| | |
| | |
| | |
| | |
| | |
| | |
| | |
SEE NOTES TO FINANCIAL STATEMENTS.
| J.P. Morgan Exchange-Traded Funds | |
JPMorgan BetaBuilders USD High Yield Corporate Bond ETF
SCHEDULE OF PORTFOLIO INVESTMENTSAS OF February 29, 2024 (continued)
| | |
Corporate Bonds — continued |
|
| | |
Cumulus Media New Holdings, Inc. 6.75%, 7/1/2026 (a) | | |
Directv Financing LLC 5.88%, 8/15/2027 (a) | | |
|
| | |
| | |
| | |
| | |
| | |
DISH Network Corp. 11.75%, 11/15/2027 (a) | | |
Gannett Holdings LLC 6.00%, 11/1/2026 (a) | | |
GCI LLC 4.75%, 10/15/2028 (a) | | |
|
| | |
| | |
| | |
iHeartCommunications, Inc. |
| | |
| | |
| | |
| | |
|
| | |
| | |
| | |
LCPR Senior Secured Financing DAC |
| | |
| | |
Liberty Interactive LLC 8.25%, 2/1/2030 | | |
McGraw-Hill Education, Inc. |
| | |
| | |
|
| | |
| | |
|
| | |
| | |
Outfront Media Capital LLC |
| | |
| | |
| | |
| | |
|
|
Paramount Global (US Treasury Yield Curve Rate T Note Constant Maturity 5 Year + 4.00%), 6.38%, 3/30/2062 (c) | | |
|
| | |
| | |
|
| | |
| | |
Scripps Escrow, Inc. 5.88%, 7/15/2027 (a) | | |
Sinclair Television Group, Inc. |
| | |
| | |
|
| | |
| | |
| | |
| | |
| | |
| | |
Spanish Broadcasting System, Inc. 9.75%, 3/1/2026 (a) | | |
Stagwell Global LLC 5.63%, 8/15/2029 (a) | | |
Summer BC Bidco B LLC 5.50%, 10/31/2026 (a) | | |
Sunrise FinCo. I BV (Netherlands) 4.88%, 7/15/2031 (a) | | |
Sunrise HoldCo IV BV (Netherlands) 5.50%, 1/15/2028 (a) | | |
|
| | |
| | |
Townsquare Media, Inc. 6.88%, 2/1/2026 (a) | | |
Univision Communications, Inc. |
| | |
| | |
| | |
Urban One, Inc. 7.38%, 2/1/2028 (a) | | |
Videotron Ltd. (Canada) 5.13%, 4/15/2027 (a) | | |
Virgin Media Vendor Financing Notes IV DAC (United Kingdom) 5.00%, 7/15/2028 (a) | | |
VZ Secured Financing BV (Netherlands) 5.00%, 1/15/2032 (a) | | |
Ziggo Bond Co. BV (Netherlands) 5.13%, 2/28/2030 (a) | | |
| | |
SEE NOTES TO FINANCIAL STATEMENTS.
| J.P. Morgan Exchange-Traded Funds | |
| | |
Corporate Bonds — continued |
|
Arsenal AIC Parent LLC 8.00%, 10/1/2030 (a) | | |
ATI, Inc. 5.13%, 10/1/2031 | | |
Baffinland Iron Mines Corp. (Canada) 8.75%, 7/15/2026 (a) | | |
Big River Steel LLC 6.63%, 1/31/2029 (a) | | |
Carpenter Technology Corp. 6.38%, 7/15/2028 | | |
|
| | |
| | |
| | |
| | |
Coeur Mining, Inc. 5.13%, 2/15/2029 (a) | | |
|
| | |
| | |
Compass Minerals International, Inc. 6.75%, 12/1/2027 (a) | | |
Constellium SE 5.63%, 6/15/2028 (a) | | |
Eldorado Gold Corp. (Turkey) 6.25%, 9/1/2029 (a) | | |
FMG Resources August 2006 Pty. Ltd. (Australia) |
| | |
| | |
| | |
| | |
Hecla Mining Co. 7.25%, 2/15/2028 | | |
Hudbay Minerals, Inc. (Canada) |
| | |
| | |
IAMGOLD Corp. (Burkina Faso) 5.75%, 10/15/2028 (a) | | |
Infrabuild Australia Pty. Ltd. (Australia) 14.50%, 11/15/2028 (a) | | |
Kaiser Aluminum Corp. 4.63%, 3/1/2028 (a) | | |
Mineral Resources Ltd. (Australia) |
| | |
| | |
| | |
New Gold, Inc. (Canada) 7.50%, 7/15/2027 (a) | | |
|
| | |
| | |
| | |
SunCoke Energy, Inc. 4.88%, 6/30/2029 (a) | | |
| | |
|
Metals & Mining — continued |
Taseko Mines Ltd. (Canada) 7.00%, 2/15/2026 (a) | | |
United States Steel Corp. |
| | |
| | |
| | |
Mortgage Real Estate Investment Trusts (REITs) — 0.4% |
Apollo Commercial Real Estate Finance, Inc. 4.63%, 6/15/2029 (a) | | |
Ladder Capital Finance Holdings LLLP |
| | |
| | |
Rithm Capital Corp. 6.25%, 10/15/2025 (a) | | |
Starwood Property Trust, Inc. |
| | |
| | |
| | |
| | |
|
Algonquin Power & Utilities Corp. (Canada) (US Treasury Yield Curve Rate T Note Constant Maturity 5 Year + 3.25%), 4.75%, 1/18/2082 (c) | | |
|
Brandywine Operating Partnership LP |
| | |
| | |
Hudson Pacific Properties LP 3.25%, 1/15/2030 | | |
Office Properties Income Trust |
| | |
| | |
| | |
| | |
| | |
Oil, Gas & Consumable Fuels — 10.6% |
Aethon United BR LP 8.25%, 2/15/2026 (a) | | |
Alliance Resource Operating Partners LP 7.50%, 5/1/2025 (a) | | |
Antero Midstream Partners LP |
| | |
| | |
Ascent Resources Utica Holdings LLC |
| | |
SEE NOTES TO FINANCIAL STATEMENTS.
| J.P. Morgan Exchange-Traded Funds | |
JPMorgan BetaBuilders USD High Yield Corporate Bond ETF
SCHEDULE OF PORTFOLIO INVESTMENTSAS OF February 29, 2024 (continued)
| | |
Corporate Bonds — continued |
Oil, Gas & Consumable Fuels — continued |
| | |
Baytex Energy Corp. (Canada) |
| | |
| | |
|
| | |
| | |
|
| | |
| | |
| | |
| | |
California Resources Corp. 7.13%, 2/1/2026 (a) | | |
|
| | |
| | |
| | |
Calumet Specialty Products Partners LP |
| | |
| | |
| | |
|
| | |
| | |
Chord Energy Corp. 6.38%, 6/1/2026 (a) | | |
|
| | |
| | |
| | |
CNX Midstream Partners LP 4.75%, 4/15/2030 (a) | | |
|
| | |
| | |
| | |
|
| | |
| | |
CQP Holdco LP 5.50%, 6/15/2031 (a) | | |
Crescent Energy Finance LLC 9.25%, 2/15/2028 (a) | | |
|
| | |
| | |
| | |
|
Oil, Gas & Consumable Fuels — continued |
CVR Energy, Inc. 5.75%, 2/15/2028 (a) | | |
Delek Logistics Partners LP 7.13%, 6/1/2028 (a) | | |
|
| | |
| | |
Encino Acquisition Partners Holdings LLC 8.50%, 5/1/2028 (a) | | |
Endeavor Energy Resources LP 5.75%, 1/30/2028 (a) | | |
Energean plc (Egypt) 6.50%, 4/30/2027 (a) | | |
|
| | |
| | |
|
| | |
| | |
EnLink Midstream Partners LP |
| | |
| | |
| | |
| | |
Enviva Partners LP 6.50%, 1/15/2026 (a) | | |
EQM Midstream Partners LP |
| | |
| | |
| | |
| | |
| | |
| | |
FTAI Infra Escrow Holdings LLC 10.50%, 6/1/2027 (a) | | |
|
| | |
| | |
| | |
|
| | |
| | |
Gran Tierra Energy International Holdings Ltd. (Colombia) 6.25%, 2/15/2025 (a) | | |
Gran Tierra Energy, Inc. (Colombia) 9.50%, 10/15/2029 (a) | | |
Gulfport Energy Corp. 8.00%, 5/17/2026 | | |
Harvest Midstream I LP 7.50%, 9/1/2028 (a) | | |
SEE NOTES TO FINANCIAL STATEMENTS.
| J.P. Morgan Exchange-Traded Funds | |
| | |
Corporate Bonds — continued |
Oil, Gas & Consumable Fuels — continued |
Hess Infrastructure Partners LP 5.63%, 2/15/2026 (a) | | |
Hess Midstream Operations LP |
| | |
| | |
| | |
|
| | |
| | |
| | |
| | |
| | |
| | |
Ithaca Energy North Sea plc (United Kingdom) 9.00%, 7/15/2026 (a) | | |
ITT Holdings LLC 6.50%, 8/1/2029 (a) | | |
|
| | |
| | |
Martin Midstream Partners LP 11.50%, 2/15/2028 (a) | | |
Matador Resources Co. 6.88%, 4/15/2028 (a) | | |
MEG Energy Corp. (Canada) |
| | |
| | |
Moss Creek Resources Holdings, Inc. |
| | |
| | |
|
| | |
| | |
| | |
Neptune Energy Bondco plc (United Kingdom) 6.63%, 5/15/2025 (a) | | |
New Fortress Energy, Inc. |
| | |
| | |
NGL Energy Partners LP 7.50%, 4/15/2026 | | |
|
| | |
| | |
Northriver Midstream Finance LP (Canada) 5.63%, 2/15/2026 (a) | | |
|
| | |
| | |
|
Oil, Gas & Consumable Fuels — continued |
| | |
|
| | |
| | |
| | |
|
| | |
| | |
Permian Resources Operating LLC |
| | |
| | |
| | |
|
| | |
| | |
Rockcliff Energy II LLC 5.50%, 10/15/2029 (a) | | |
Rockies Express Pipeline LLC |
| | |
| | |
| | |
|
| | |
| | |
| | |
|
| | |
| | |
| | |
| | |
Strathcona Resources Ltd. (Canada) 6.88%, 8/1/2026 (a) | | |
Summit Midstream Holdings LLC |
| | |
9.00%, 10/15/2026 (a) (f) | | |
|
| | |
| | |
|
| | |
| | |
| | |
| | |
Tallgrass Energy Partners LP |
| | |
| | |
SEE NOTES TO FINANCIAL STATEMENTS.
| J.P. Morgan Exchange-Traded Funds | |
JPMorgan BetaBuilders USD High Yield Corporate Bond ETF
SCHEDULE OF PORTFOLIO INVESTMENTSAS OF February 29, 2024 (continued)
| | |
Corporate Bonds — continued |
Oil, Gas & Consumable Fuels — continued |
| | |
| | |
Teine Energy Ltd. (Canada) 6.88%, 4/15/2029 (a) | | |
TerraForm Power Operating LLC |
| | |
| | |
Topaz Solar Farms LLC 5.75%, 9/30/2039 (a) | | |
TransMontaigne Partners LP 6.13%, 2/15/2026 | | |
Venture Global Calcasieu Pass LLC |
| | |
| | |
| | |
|
| | |
| | |
| | |
| | |
Vermilion Energy, Inc. (Canada) 6.88%, 5/1/2030 (a) | | |
|
| | |
| | |
| | |
W&T Offshore, Inc. 11.75%, 2/1/2026 (a) | | |
| | |
Paper & Forest Products — 0.3% |
Ahlstrom Holding 3 Oy (Finland) 4.88%, 2/4/2028 (a) | | |
Domtar Corp. 6.75%, 10/1/2028 (a) | | |
Glatfelter Corp. 4.75%, 11/15/2029 (a) | | |
Louisiana-Pacific Corp. 3.63%, 3/15/2029 (a) | | |
Mercer International, Inc. (Germany) |
| | |
| | |
| | |
Passenger Airlines — 1.5% |
Air Canada (Canada) 3.88%, 8/15/2026 (a) | | |
Allegiant Travel Co. 7.25%, 8/15/2027 (a) | | |
American Airlines Group, Inc. 3.75%, 3/1/2025 (a) | | |
|
| | |
| | |
|
Passenger Airlines — continued |
| | |
| | |
|
| | |
| | |
| | |
Hawaiian Brand Intellectual Property Ltd. 5.75%, 1/20/2026 (a) | | |
Spirit Loyalty Cayman Ltd. 8.00%, 9/20/2025 (a) | | |
United Airlines Holdings, Inc. 4.88%, 1/15/2025 | | |
|
| | |
| | |
VistaJet Malta Finance plc (Switzerland) |
| | |
| | |
| | |
| | |
Personal Care Products — 0.4% |
BellRing Brands, Inc. 7.00%, 3/15/2030 (a) | | |
|
| | |
| | |
| | |
Herbalife Nutrition Ltd. 7.88%, 9/1/2025 (a) | | |
|
| | |
| | |
| | |
|
Bausch Health Americas, Inc. |
| | |
| | |
|
| | |
| | |
| | |
| | |
| | |
| | |
| | |
| | |
SEE NOTES TO FINANCIAL STATEMENTS.
| J.P. Morgan Exchange-Traded Funds | |
| | |
Corporate Bonds — continued |
Pharmaceuticals — continued |
| | |
| | |
Catalent Pharma Solutions, Inc. |
| | |
| | |
Cheplapharm Arzneimittel GmbH (Germany) 5.50%, 1/15/2028 (a) | | |
Elanco Animal Health, Inc. 6.65%, 8/28/2028 (f) | | |
HLF Financing SARL LLC 4.88%, 6/1/2029 (a) | | |
Jazz Securities DAC 4.38%, 1/15/2029 (a) | | |
|
| | |
| | |
Perrigo Finance Unlimited Co. |
| | |
| | |
| | |
| | |
Professional Services — 0.3% |
|
| | |
| | |
CoreLogic, Inc. 4.50%, 5/1/2028 (a) | | |
Dun & Bradstreet Corp. (The) 5.00%, 12/15/2029 (a) | | |
KBR, Inc. 4.75%, 9/30/2028 (a) | | |
Science Applications International Corp. 4.88%, 4/1/2028 (a) | | |
TriNet Group, Inc. 3.50%, 3/1/2029 (a) | | |
| | |
Real Estate Management & Development — 0.7% |
Anywhere Real Estate Group LLC 7.00%, 4/15/2030 (a) | | |
Cushman & Wakefield US Borrower LLC 6.75%, 5/15/2028 (a) | | |
Five Point Operating Co. LP 10.50%, 1/15/2028 (a) (f) | | |
|
| | |
| | |
Greystar Real Estate Partners LLC 7.75%, 9/1/2030 (a) | | |
Howard Hughes Corp. (The) |
| | |
| | |
|
Real Estate Management & Development — continued |
| | |
| | |
Hunt Cos., Inc. 5.25%, 4/15/2029 (a) | | |
|
| | |
| | |
|
| | |
| | |
WeWork Cos. LLC 5.00%, 7/10/2025 (a) (g) | | |
| | |
|
Brookfield Property REIT, Inc. |
| | |
| | |
| | |
Semiconductors & Semiconductor Equipment — 0.4% |
Amkor Technology, Inc. 6.63%, 9/15/2027 (a) | | |
ams-OSRAM AG (Austria) 12.25%, 3/30/2029 (a) | | |
|
| | |
| | |
| | |
ON Semiconductor Corp. 3.88%, 9/1/2028 (a) | | |
Synaptics, Inc. 4.00%, 6/15/2029 (a) | | |
| | |
|
ACI Worldwide, Inc. 5.75%, 8/15/2026 (a) | | |
Boxer Parent Co., Inc. 7.13%, 10/2/2025 (a) | | |
Camelot Finance SA 4.50%, 11/1/2026 (a) | | |
Capstone Borrower, Inc. 8.00%, 6/15/2030 (a) | | |
Central Parent LLC 8.00%, 6/15/2029 (a) | | |
Clarivate Science Holdings Corp. |
| | |
| | |
Cloud Software Group, Inc. |
| | |
| | |
Consensus Cloud Solutions, Inc. 6.50%, 10/15/2028 (a) | | |
Crowdstrike Holdings, Inc. 3.00%, 2/15/2029 | | |
Elastic NV 4.13%, 7/15/2029 (a) | | |
SEE NOTES TO FINANCIAL STATEMENTS.
| J.P. Morgan Exchange-Traded Funds | |
JPMorgan BetaBuilders USD High Yield Corporate Bond ETF
SCHEDULE OF PORTFOLIO INVESTMENTSAS OF February 29, 2024 (continued)
| | |
Corporate Bonds — continued |
|
|
| | |
| | |
|
| | |
| | |
| | |
GoTo Group, Inc. 5.50%, 5/1/2028 (a) | | |
McAfee Corp. 7.38%, 2/15/2030 (a) | | |
MicroStrategy, Inc. 6.13%, 6/15/2028 (a) | | |
|
| | |
| | |
| | |
|
| | |
| | |
Open Text Holdings, Inc. (Canada) |
| | |
| | |
PTC, Inc. 4.00%, 2/15/2028 (a) | | |
RingCentral, Inc. 8.50%, 8/15/2030 (a) | | |
Rocket Software, Inc. 6.50%, 2/15/2029 (a) | | |
SS&C Technologies, Inc. 5.50%, 9/30/2027 (a) | | |
Veritas US, Inc. 7.50%, 9/1/2025 (a) | | |
ZoomInfo Technologies LLC 3.88%, 2/1/2029 (a) | | |
| | |
|
|
| | |
| | |
| | |
| | |
| | |
| | |
| | |
|
| | |
| | |
| | |
|
99 Escrow Issuer, Inc. 7.50%, 1/15/2026 (a) | | |
Advance Auto Parts, Inc. 3.50%, 3/15/2032 | | |
| | |
|
Specialty Retail — continued |
Arko Corp. 5.13%, 11/15/2029 (a) | | |
Asbury Automotive Group, Inc. |
| | |
| | |
| | |
At Home Group, Inc. 4.88%, 7/15/2028 (a) | | |
|
| | |
| | |
| | |
| | |
| | |
| | |
BCPE Ulysses Intermediate, Inc. 7.75% (Cash), 4/1/2027 (a) (b) | | |
|
| | |
14.00% (PIK), 6/1/2031 (a) (b) | | |
eG Global Finance plc (United Kingdom) 12.00%, 11/30/2028 (a) | | |
Evergreen Acqco 1 LP 9.75%, 4/26/2028 (a) | | |
Foot Locker, Inc. 4.00%, 10/1/2029 (a) | | |
|
| | |
| | |
Group 1 Automotive, Inc. 4.00%, 8/15/2028 (a) | | |
Guitar Center, Inc. 8.50%, 1/15/2026 (a) | | |
LBM Acquisition LLC 6.25%, 1/15/2029 (a) | | |
LCM Investments Holdings II LLC |
| | |
| | |
|
| | |
| | |
LSF9 Atlantis Holdings LLC 7.75%, 2/15/2026 (a) | | |
Michaels Cos., Inc. (The) |
| | |
| | |
|
| | |
| | |
| | |
SEE NOTES TO FINANCIAL STATEMENTS.
| J.P. Morgan Exchange-Traded Funds | |
| | |
Corporate Bonds — continued |
Specialty Retail — continued |
Park River Holdings, Inc. |
| | |
| | |
Penske Automotive Group, Inc. 3.75%, 6/15/2029 | | |
|
| | |
| | |
Sally Holdings LLC 5.63%, 12/1/2025 | | |
|
| | |
| | |
Specialty Building Products Holdings LLC 6.38%, 9/30/2026 (a) | | |
|
| | |
| | |
|
| | |
| | |
Upbound Group, Inc. 6.38%, 2/15/2029 (a) | | |
Victoria's Secret & Co. 4.63%, 7/15/2029 (a) | | |
White Cap Buyer LLC 6.88%, 10/15/2028 (a) | | |
White Cap Parent LLC 8.25% (Cash), 3/15/2026 (a) (b) | | |
| | |
Technology Hardware, Storage & Peripherals — 0.6% |
|
| | |
| | |
| | |
| | |
| | |
|
| | |
| | |
|
| | |
| | |
|
| | |
| | |
| | |
| | |
|
Textiles, Apparel & Luxury Goods — 0.5% |
|
| | |
| | |
G-III Apparel Group Ltd. 7.88%, 8/15/2025 (a) | | |
|
| | |
| | |
Kontoor Brands, Inc. 4.13%, 11/15/2029 (a) | | |
Levi Strauss & Co. 3.50%, 3/1/2031 (a) | | |
Under Armour, Inc. 3.25%, 6/15/2026 | | |
William Carter Co. (The) 5.63%, 3/15/2027 (a) | | |
Wolverine World Wide, Inc. 4.00%, 8/15/2029 (a) | | |
| | |
|
Turning Point Brands, Inc. 5.63%, 2/15/2026 (a) | | |
|
| | |
| | |
| | |
Trading Companies & Distributors — 1.6% |
Alta Equipment Group, Inc. 5.63%, 4/15/2026 (a) | | |
Beacon Roofing Supply, Inc. |
| | |
| | |
| | |
BlueLinx Holdings, Inc. 6.00%, 11/15/2029 (a) | | |
Boise Cascade Co. 4.88%, 7/1/2030 (a) | | |
Fortress Transportation and Infrastructure Investors LLC |
| | |
| | |
Foundation Building Materials, Inc. 6.00%, 3/1/2029 (a) | | |
H&E Equipment Services, Inc. 3.88%, 12/15/2028 (a) | | |
Herc Holdings, Inc. 5.50%, 7/15/2027 (a) | | |
Imola Merger Corp. 4.75%, 5/15/2029 (a) | | |
United Rentals North America, Inc. |
| | |
| | |
| | |
| | |
SEE NOTES TO FINANCIAL STATEMENTS.
| J.P. Morgan Exchange-Traded Funds | |
JPMorgan BetaBuilders USD High Yield Corporate Bond ETF
SCHEDULE OF PORTFOLIO INVESTMENTSAS OF February 29, 2024 (continued)
| | |
Corporate Bonds — continued |
Trading Companies & Distributors — continued |
| | |
|
| | |
| | |
| | |
Wireless Telecommunication Services — 1.1% |
Altice France Holding SA (Luxembourg) |
| | |
| | |
Connect Finco SARL (United Kingdom) 6.75%, 10/1/2026 (a) | | |
Hughes Satellite Systems Corp. |
| | |
| | |
Millicom International Cellular SA (Guatemala) 4.50%, 4/27/2031 (a) | | |
Rogers Communications, Inc. (Canada) (US Treasury Yield Curve Rate T Note Constant Maturity 5 Year + 3.59%), 5.25%, 3/15/2082 (a) (c) | | |
United States Cellular Corp. 6.70%, 12/15/2033 | | |
Vmed O2 UK Financing I plc (United Kingdom) |
| | |
| | |
Vodafone Group plc (United Kingdom) |
(USD Swap Semi 5 Year + 4.87%), 7.00%, 4/4/2079 (c) | | |
(US Treasury Yield Curve Rate T Note Constant Maturity 5 Year + 2.45%), 3.25%, 6/4/2081 (c) | | |
(US Treasury Yield Curve Rate T Note Constant Maturity 5 Year + 3.07%), 5.13%, 6/4/2081 (c) | | |
| | |
Total Corporate Bonds
(Cost $791,306,293) | | |
| | |
|
Financial Services — 0.0% ^ |
Mallinckrodt plc (Luxembourg) ‡ | | |
| | |
|
|
Cwt Travel Group, Inc. ‡ * | | |
Total Common Stocks
(Cost $65,231) | | |
Short-Term Investments — 1.0% |
Investment Companies — 1.0% |
JPMorgan U.S. Government Money Market Fund Class IM Shares, 5.25% (h) (i)
(Cost $7,787,177) | | |
Total Investments — 98.9%
(Cost $799,158,701) | | |
Other Assets Less Liabilities — 1.1% | | |
| | |
Percentages indicated are based on net assets. |
| |
| Chicago Mercantile Exchange |
| High Coupon Bonds (a.k.a. "IOettes") represent the right to receive interest payments on an underlying pool of mortgages with similar features as those associated with IO securities. Unlike IO's the owner also has a right to receive a very small portion of principal. The high interest rates result from taking interest payments from other classes in the Real Estate Mortgage Investment Conduit trust and allocating them to the small principal of the HB class. |
| Intercontinental Exchange |
| |
| Real Estate Investment Trust |
| Limited partnership with share capital |
| Secured Overnight Financing Rate |
| |
| Amount rounds to less than 0.1% of net assets. |
| Value determined using significant unobservable inputs. | |
| Non-income producing security. | |
| Securities exempt from registration under Rule 144A or section 4(a)(2), of the Securities Act of 1933, as amended. | |
| Security has the ability to pay in kind (“PIK”) or pay income in cash. When applicable, separate rates of such payments are disclosed. | |
| Variable or floating rate security, linked to the referenced benchmark. The interest rate shown is the current rate as of February 29, 2024. | |
| Security is an interest bearing note with preferred security characteristics. | |
SEE NOTES TO FINANCIAL STATEMENTS.
| J.P. Morgan Exchange-Traded Funds | |
| Security is perpetual and thus, does not have a predetermined maturity date. The coupon rate for this security is fixed for a period of time and may be structured to adjust thereafter. The date shown, if applicable, reflects the next call date. The coupon rate shown is the rate in effect as of February 29, 2024. | |
| Step bond. Interest rate is a fixed rate for an initial period that either resets at a specific date or may reset in the future contingent upon a predetermined trigger. The interest rate shown is the current rate as of February 29, 2024. | |
| | |
| Investment in an affiliated fund, which is registered under the Investment Company Act of 1940, as amended, and is advised by J.P. Morgan Investment Management Inc. | |
| The rate shown is the current yield as of February 29, 2024. | |
SEE NOTES TO FINANCIAL STATEMENTS.
| J.P. Morgan Exchange-Traded Funds | |
JPMorgan BetaBuilders USD Investment Grade Corporate Bond ETF
SCHEDULE OF PORTFOLIO INVESTMENTSAS OF February 29, 2024
| | |
|
Aerospace & Defense — 3.1% |
|
| | |
| | |
| | |
| | |
|
| | |
| | |
| | |
| | |
| | |
Hexcel Corp. 4.20%, 2/15/2027 (a) | | |
Huntington Ingalls Industries, Inc. 4.20%, 5/1/2030 | | |
L3Harris Technologies, Inc. |
| | |
| | |
|
| | |
| | |
| | |
| | |
| | |
|
| | |
| | |
| | |
|
| | |
| | |
| | |
|
| | |
| | |
| | |
Air Freight & Logistics — 0.4% |
|
| | |
| | |
United Parcel Service, Inc. |
| | |
| | |
| | |
| | |
|
Automobile Components — 0.1% |
Lear Corp. 3.50%, 5/30/2030 | | |
|
|
| | |
| | |
| | |
|
| | |
| | |
| | |
| | |
Toyota Motor Corp. (Japan) 1.34%, 3/25/2026 | | |
| | |
|
Banco Santander SA (Spain) (US Treasury Yield Curve Rate T Note Constant Maturity 1 Year + 2.00%), 4.18%, 3/24/2028 (b) | | |
|
| | |
(SOFR + 1.29%), 5.08%, 1/20/2027 (b) | | |
Series N, (SOFR + 0.91%), 1.66%, 3/11/2027 (b) | | |
(3-MONTH CME TERM SOFR + 1.32%), 3.56%, 4/23/2027 (b) | | |
(SOFR + 1.34%), 5.93%, 9/15/2027 (b) | | |
Series L, 4.18%, 11/25/2027 | | |
(SOFR + 1.05%), 2.55%, 2/4/2028 (b) | | |
(SOFR + 2.04%), 4.95%, 7/22/2028 (b) | | |
(3-MONTH CME TERM SOFR + 1.30%), 3.42%, 12/20/2028 (b) | | |
(3-MONTH CME TERM SOFR + 1.44%), 3.19%, 7/23/2030 (b) | | |
(3-MONTH CME TERM SOFR + 1.25%), 2.50%, 2/13/2031 (b) | | |
Series N, (SOFR + 1.22%), 2.65%, 3/11/2032 (b) | | |
(SOFR + 1.32%), 2.69%, 4/22/2032 (b) | | |
(US Treasury Yield Curve Rate T Note Constant Maturity 5 Year + 1.20%), 2.48%, 9/21/2036 (b) | | |
(3-MONTH CME TERM SOFR + 2.25%), 4.44%, 1/20/2048 (b) | | |
(3-MONTH CME TERM SOFR + 3.41%), 4.08%, 3/20/2051 (b) | | |
Bank of Montreal (Canada) (SOFR + 0.60%), 0.95%, 1/22/2027 (b) | | |
SEE NOTES TO FINANCIAL STATEMENTS.
| J.P. Morgan Exchange-Traded Funds | |
| | |
Corporate Bonds — continued |
|
Bank of Nova Scotia (The) (Canada) |
| | |
(US Treasury Yield Curve Rate T Note Constant Maturity 5 Year + 2.05%), 4.59%, 5/4/2037 (b) (c) | | |
Barclays plc (United Kingdom) |
| | |
(SOFR + 2.21%), 5.83%, 5/9/2027 (b) | | |
Canadian Imperial Bank of Commerce (Canada) |
| | |
| | |
Citibank NA 5.86%, 9/29/2025 | | |
|
| | |
(SOFR + 1.89%), 4.66%, 5/24/2028 (b) | | |
(SOFR + 1.42%), 2.98%, 11/5/2030 (b) | | |
(SOFR + 1.15%), 2.67%, 1/29/2031 (b) | | |
(SOFR + 3.91%), 4.41%, 3/31/2031 (b) | | |
| | |
Citizens Financial Group, Inc. (US Treasury Yield Curve Rate T Note Constant Maturity 5 Year + 2.75%), 5.64%, 5/21/2037 (b) | | |
Cooperatieve Rabobank UA (Netherlands) 5.25%, 5/24/2041 | | |
|
(SOFRINDX + 2.19%), 6.36%, 10/27/2028 (b) | | |
| | |
HSBC Holdings plc (United Kingdom) |
(SOFR + 1.10%), 2.25%, 11/22/2027 (b) | | |
(SOFR + 1.29%), 2.21%, 8/17/2029 (b) | | |
(SOFR + 2.87%), 5.40%, 8/11/2033 (b) | | |
| | |
| | |
Huntington Bancshares, Inc. (US Treasury Yield Curve Rate T Note Constant Maturity 5 Year + 1.17%), 2.49%, 8/15/2036 (b) | | |
KeyCorp (SOFRINDX + 2.06%), 4.79%, 6/1/2033 (b) | | |
Lloyds Banking Group plc (United Kingdom) 4.55%, 8/16/2028 | | |
M&T Bank Corp. (SOFR + 1.85%), 5.05%, 1/27/2034 (b) | | |
Mitsubishi UFJ Financial Group, Inc. (Japan) |
| | |
| | |
| | |
|
|
| | |
| | |
Mizuho Financial Group, Inc. (Japan) 4.02%, 3/5/2028 | | |
PNC Financial Services Group, Inc. (The) |
| | |
| | |
|
| | |
| | |
Royal Bank of Canada (Canada) |
| | |
| | |
| | |
Santander Holdings USA, Inc. |
| | |
| | |
Sumitomo Mitsui Financial Group, Inc. (Japan) |
| | |
| | |
| | |
| | |
| | |
Toronto-Dominion Bank (The) (Canada) 3.77%, 6/6/2025 | | |
|
(SOFR + 1.46%), 4.26%, 7/28/2026 (b) | | |
| | |
|
(SOFR + 2.11%), 4.97%, 7/22/2033 (b) | | |
(SOFR + 1.60%), 4.84%, 2/1/2034 (b) | | |
|
(SOFR + 1.98%), 4.81%, 7/25/2028 (b) | | |
(SOFR + 1.74%), 5.57%, 7/25/2029 (b) | | |
(3-MONTH CME TERM SOFR + 1.43%), 2.88%, 10/30/2030 (b) | | |
(SOFR + 2.02%), 5.39%, 4/24/2034 (b) | | |
(SOFR + 1.99%), 5.56%, 7/25/2034 (b) | | |
(SOFR + 2.06%), 6.49%, 10/23/2034 (b) | | |
| | |
| | |
| | |
| | |
(SOFR + 2.13%), 4.61%, 4/25/2053 (b) | | |
SEE NOTES TO FINANCIAL STATEMENTS.
| J.P. Morgan Exchange-Traded Funds | |
JPMorgan BetaBuilders USD Investment Grade Corporate Bond ETF
SCHEDULE OF PORTFOLIO INVESTMENTSAS OF February 29, 2024 (continued)
| | |
Corporate Bonds — continued |
|
Westpac Banking Corp. (Australia) |
| | |
(US Treasury Yield Curve Rate T Note Constant Maturity 5 Year + 2.00%), 4.11%, 7/24/2034 (b) (c) | | |
| | |
| | |
|
Anheuser-Busch Cos. LLC (Belgium) |
| | |
| | |
Anheuser-Busch InBev Finance, Inc. (Belgium) 4.70%, 2/1/2036 | | |
Anheuser-Busch InBev Worldwide, Inc. (Belgium) |
| | |
| | |
| | |
| | |
Coca-Cola Co. (The) 1.65%, 6/1/2030 | | |
Constellation Brands, Inc. |
| | |
| | |
|
| | |
| | |
Molson Coors Beverage Co. 4.20%, 7/15/2046 | | |
|
| | |
| | |
| | |
| | |
| | |
| | |
|
|
| | |
| | |
| | |
|
| | |
| | |
| | |
| | |
| | |
| | |
|
Biotechnology — continued |
| | |
| | |
| | |
Biogen, Inc. 3.15%, 5/1/2050 | | |
|
| | |
| | |
| | |
|
Alibaba Group Holding Ltd. (China) 2.13%, 2/9/2031 | | |
|
| | |
| | |
| | |
| | |
| | |
| | |
eBay, Inc. 4.00%, 7/15/2042 | | |
| | |
|
Carrier Global Corp. 3.58%, 4/5/2050 | | |
Masco Corp. 2.00%, 10/1/2030 | | |
| | |
|
Ares Capital Corp. 3.88%, 1/15/2026 | | |
Bank of New York Mellon Corp. (The) |
| | |
(SOFR + 1.76%), 4.60%, 7/26/2030 (b) | | |
|
| | |
| | |
Blue Owl Capital Corp. II 8.45%, 11/15/2026 (d) | | |
Blue Owl Capital Corp. III 3.13%, 4/13/2027 | | |
Blue Owl Credit Income Corp. 5.50%, 3/21/2025 | | |
Brookfield Finance, Inc. (Canada) 4.85%, 3/29/2029 | | |
Charles Schwab Corp. (The) (SOFR + 2.50%), 5.85%, 5/19/2034 (b) | | |
CME Group, Inc. 4.15%, 6/15/2048 | | |
Credit Suisse USA, Inc. (Switzerland) 7.13%, 7/15/2032 | | |
Deutsche Bank AG (Germany) (SOFR + 1.87%), 2.13%, 11/24/2026 (b) | | |
SEE NOTES TO FINANCIAL STATEMENTS.
| J.P. Morgan Exchange-Traded Funds | |
| | |
Corporate Bonds — continued |
Capital Markets — continued |
FS KKR Capital Corp. 3.25%, 7/15/2027 | | |
Goldman Sachs Group, Inc. (The) |
| | |
| | |
(SOFR + 0.82%), 1.54%, 9/10/2027 (b) | | |
(SOFR + 1.85%), 3.62%, 3/15/2028 (b) | | |
(3-MONTH CME TERM SOFR + 1.56%), 4.22%, 5/1/2029 (b) | | |
| | |
(SOFR + 1.25%), 2.38%, 7/21/2032 (b) | | |
| | |
Hercules Capital, Inc. 3.38%, 1/20/2027 | | |
Intercontinental Exchange, Inc. |
| | |
| | |
Moody's Corp. 3.75%, 2/25/2052 | | |
|
| | |
(SOFR + 1.77%), 6.14%, 10/16/2026 (b) | | |
| | |
| | |
(SOFR + 0.88%), 1.59%, 5/4/2027 (b) | | |
(SOFR + 1.61%), 4.21%, 4/20/2028 (b) | | |
(3-MONTH CME TERM SOFR + 1.40%), 3.77%, 1/24/2029 (b) | | |
(SOFR + 3.12%), 3.62%, 4/1/2031 (b) | | |
(SOFR + 1.03%), 1.79%, 2/13/2032 (b) | | |
| | |
(SOFR + 1.29%), 2.94%, 1/21/2033 (b) | | |
(SOFR + 1.36%), 2.48%, 9/16/2036 (b) | | |
(US Treasury Yield Curve Rate T Note Constant Maturity 5 Year + 2.43%), 5.95%, 1/19/2038 (b) | | |
| | |
(SOFR + 1.43%), 2.80%, 1/25/2052 (b) | | |
Nomura Holdings, Inc. (Japan) 2.33%, 1/22/2027 | | |
|
| | |
| | |
|
| | |
| | |
S&P Global, Inc. 3.70%, 3/1/2052 | | |
| | |
|
Capital Markets — continued |
|
(SOFR + 1.72%), 5.82%, 11/4/2028 (b) | | |
(SOFR + 1.00%), 2.62%, 2/7/2033 (b) | | |
(SOFR + 1.49%), 3.03%, 11/1/2034 (b) | | |
UBS AG (Switzerland) 5.80%, 9/11/2025 | | |
| | |
|
|
| | |
| | |
|
| | |
| | |
Dow Chemical Co. (The) 6.90%, 5/15/2053 | | |
Eastman Chemical Co. 4.65%, 10/15/2044 | | |
Ecolab, Inc. 2.75%, 8/18/2055 | | |
FMC Corp. 4.50%, 10/1/2049 | | |
International Flavors & Fragrances, Inc. 4.45%, 9/26/2028 | | |
Nutrien Ltd. (Canada) 5.88%, 12/1/2036 | | |
RPM International, Inc. 3.75%, 3/15/2027 | | |
Sherwin-Williams Co. (The) 2.95%, 8/15/2029 | | |
| | |
Commercial Services & Supplies — 0.1% |
Cintas Corp. No. 2 4.00%, 5/1/2032 | | |
Republic Services, Inc. 6.20%, 3/1/2040 | | |
Veralto Corp. 5.50%, 9/18/2026 (d) | | |
| | |
Communications Equipment — 0.4% |
|
| | |
| | |
Nokia OYJ (Finland) 6.63%, 5/15/2039 | | |
| | |
Construction & Engineering — 0.1% |
|
| | |
| | |
| | |
Construction Materials — 0.1% |
Martin Marietta Materials, Inc. 3.20%, 7/15/2051 | | |
SEE NOTES TO FINANCIAL STATEMENTS.
| J.P. Morgan Exchange-Traded Funds | |
JPMorgan BetaBuilders USD Investment Grade Corporate Bond ETF
SCHEDULE OF PORTFOLIO INVESTMENTSAS OF February 29, 2024 (continued)
| | |
Corporate Bonds — continued |
|
AerCap Ireland Capital DAC (Ireland) 1.75%, 1/30/2026 | | |
Ally Financial, Inc. 4.75%, 6/9/2027 | | |
|
| | |
| | |
| | |
American Honda Finance Corp. |
| | |
| | |
Capital One Financial Corp. |
| | |
(SOFR + 2.60%), 5.25%, 7/26/2030 (b) | | |
(SOFR + 1.34%), 2.36%, 7/29/2032 (b) | | |
Caterpillar Financial Services Corp. |
| | |
| | |
Discover Financial Services (SOFRINDX + 3.37%), 7.96%, 11/2/2034 (b) | | |
Ford Motor Credit Co. LLC 4.54%, 8/1/2026 | | |
General Motors Financial Co., Inc. |
| | |
| | |
|
| | |
| | |
PACCAR Financial Corp. 2.85%, 4/7/2025 | | |
|
| | |
| | |
| | |
Toyota Motor Credit Corp. |
| | |
| | |
| | |
Consumer Staples Distribution & Retail — 1.0% |
Dollar General Corp. 5.50%, 11/1/2052 | | |
Kroger Co. (The) 5.40%, 1/15/2049 | | |
Sysco Corp. 6.60%, 4/1/2050 | | |
|
| | |
| | |
|
| | |
| | |
|
Consumer Staples Distribution & Retail — continued |
| | |
| | |
| | |
| | |
Containers & Packaging — 0.3% |
International Paper Co. 6.00%, 11/15/2041 | | |
Sonoco Products Co. 5.75%, 11/1/2040 | | |
WRKCo, Inc. 4.90%, 3/15/2029 | | |
| | |
Diversified Consumer Services — 0.2% |
|
Series 2020, 2.68%, 10/1/2044 | | |
Series 2020, 2.83%, 10/1/2055 | | |
Georgetown University (The) Series A, 5.22%, 10/1/2118 | | |
Johns Hopkins University Series 2013, 4.08%, 7/1/2053 | | |
Northwestern University Series 2020, 2.64%, 12/1/2050 | | |
President and Fellows of Harvard College 3.30%, 7/15/2056 | | |
University of Southern California 3.03%, 10/1/2039 | | |
| | |
|
American Assets Trust LP 3.38%, 2/1/2031 | | |
|
| | |
| | |
| | |
|
| | |
| | |
|
| | |
| | |
| | |
Diversified Telecommunication Services — 2.4% |
|
| | |
| | |
| | |
| | |
SEE NOTES TO FINANCIAL STATEMENTS.
| J.P. Morgan Exchange-Traded Funds | |
| | |
Corporate Bonds — continued |
Diversified Telecommunication Services — continued |
| | |
| | |
| | |
| | |
Deutsche Telekom International Finance BV (Germany) 9.25%, 6/1/2032 | | |
Orange SA (France) 5.38%, 1/13/2042 | | |
Telefonica Emisiones SA (Spain) 7.05%, 6/20/2036 | | |
Verizon Communications, Inc. |
| | |
| | |
| | |
| | |
| | |
| | |
| | |
| | |
Electric Utilities — 6.3% |
AEP Texas, Inc. 3.45%, 5/15/2051 | | |
|
| | |
Series M, 3.65%, 4/1/2050 | | |
|
| | |
Series A, 4.30%, 7/15/2048 | | |
Baltimore Gas and Electric Co. 3.20%, 9/15/2049 | | |
|
| | |
| | |
Connecticut Light and Power Co. (The) Series A, 4.15%, 6/1/2045 | | |
Dominion Energy South Carolina, Inc. 5.10%, 6/1/2065 | | |
DTE Electric Co. Series C, 2.63%, 3/1/2031 | | |
Duke Energy Carolinas LLC 3.70%, 12/1/2047 | | |
|
| | |
| | |
| | |
(US Treasury Yield Curve Rate T Note Constant Maturity 5 Year + 2.32%), 3.25%, 1/15/2082 (b) | | |
| | |
|
Electric Utilities — continued |
Duke Energy Indiana LLC Series YYY, 3.25%, 10/1/2049 | | |
Duke Energy Ohio, Inc. 4.30%, 2/1/2049 | | |
Emera US Finance LP (Canada) 2.64%, 6/15/2031 | | |
Entergy Corp. 0.90%, 9/15/2025 | | |
Entergy Louisiana LLC 4.00%, 3/15/2033 | | |
Evergy, Inc. 2.90%, 9/15/2029 | | |
|
| | |
Series R, 1.65%, 8/15/2030 | | |
| | |
|
| | |
| | |
Florida Power & Light Co. |
| | |
Series A, 3.30%, 5/30/2027 | | |
| | |
| | |
| | |
Fortis, Inc. (Canada) 3.06%, 10/4/2026 | | |
|
| | |
Series B, 3.70%, 1/30/2050 | | |
Idaho Power Co. 5.50%, 3/15/2053 | | |
MidAmerican Energy Co. 4.25%, 5/1/2046 | | |
NextEra Energy Capital Holdings, Inc. |
| | |
| | |
| | |
Oncor Electric Delivery Co. LLC |
| | |
| | |
Pacific Gas and Electric Co. |
| | |
| | |
| | |
| | |
| | |
| | |
| | |
|
| | |
| | |
SEE NOTES TO FINANCIAL STATEMENTS.
| J.P. Morgan Exchange-Traded Funds | |
JPMorgan BetaBuilders USD Investment Grade Corporate Bond ETF
SCHEDULE OF PORTFOLIO INVESTMENTSAS OF February 29, 2024 (continued)
| | |
Corporate Bonds — continued |
Electric Utilities — continued |
| | |
| | |
| | |
PECO Energy Co. 5.95%, 10/1/2036 | | |
PPL Electric Utilities Corp. 5.00%, 5/15/2033 | | |
Public Service Co. of Colorado |
Series 17, 6.25%, 9/1/2037 | | |
| | |
Public Service Electric and Gas Co. |
| | |
| | |
Southern California Edison Co. |
Series 20C, 1.20%, 2/1/2026 | | |
Series D, 4.70%, 6/1/2027 | | |
| | |
Series C, 3.60%, 2/1/2045 | | |
|
| | |
| | |
Union Electric Co. 5.45%, 3/15/2053 | | |
Virginia Electric and Power Co. |
Series C, 4.00%, 11/15/2046 | | |
| | |
| | |
Electrical Equipment — 0.3% |
Emerson Electric Co. 2.20%, 12/21/2031 | | |
Regal Rexnord Corp. 6.05%, 4/15/2028 (d) | | |
Rockwell Automation, Inc. 2.80%, 8/15/2061 | | |
| | |
Electronic Equipment, Instruments & Components — 0.4% |
Arrow Electronics, Inc. 6.13%, 3/1/2026 | | |
|
| | |
| | |
Keysight Technologies, Inc. 4.60%, 4/6/2027 | | |
Vontier Corp. 2.95%, 4/1/2031 | | |
| | |
Energy Equipment & Services — 0.0% ^ |
Halliburton Co. 4.85%, 11/15/2035 | | |
|
TWDC Enterprises 18 Corp. 7.00%, 3/1/2032 | | |
|
| | |
| | |
|
Entertainment — continued |
| | |
Warnermedia Holdings, Inc. |
| | |
| | |
| | |
Financial Services — 1.6% |
Berkshire Hathaway, Inc. 3.13%, 3/15/2026 | | |
Corebridge Financial, Inc. |
| | |
(US Treasury Yield Curve Rate T Note Constant Maturity 5 Year + 3.85%), 6.88%, 12/15/2052 (b) | | |
|
| | |
| | |
Fidelity National Information Services, Inc. |
| | |
| | |
Fiserv, Inc. 4.40%, 7/1/2049 | | |
|
| | |
| | |
| | |
National Rural Utilities Cooperative Finance Corp. (3-MONTH SOFR + 3.63%), 5.25%, 4/20/2046 (b) | | |
ORIX Corp. (Japan) 5.20%, 9/13/2032 | | |
PayPal Holdings, Inc. 5.25%, 6/1/2062 | | |
Shell International Finance BV (Netherlands) |
| | |
| | |
| | |
Visa, Inc. 0.75%, 8/15/2027 | | |
Voya Financial, Inc. (3-MONTH SOFR + 2.08%), 4.70%, 1/23/2048 (b) | | |
| | |
|
Archer-Daniels-Midland Co. 3.75%, 9/15/2047 | | |
Bunge Ltd. Finance Corp. 2.75%, 5/14/2031 | | |
Conagra Brands, Inc. 5.40%, 11/1/2048 | | |
Hershey Co. (The) 0.90%, 6/1/2025 | | |
J M Smucker Co. (The) 3.50%, 3/15/2025 | | |
|
| | |
SEE NOTES TO FINANCIAL STATEMENTS.
| J.P. Morgan Exchange-Traded Funds | |
| | |
Corporate Bonds — continued |
Food Products — continued |
| | |
|
| | |
| | |
| | |
|
| | |
| | |
| | |
|
|
| | |
| | |
| | |
Piedmont Natural Gas Co., Inc. 5.05%, 5/15/2052 | | |
Southern California Gas Co. Series VV, 4.30%, 1/15/2049 | | |
|
Series K, 3.80%, 9/15/2046 | | |
| | |
| | |
Ground Transportation — 1.6% |
Burlington Northern Santa Fe LLC 4.45%, 1/15/2053 | | |
Canadian National Railway Co. (Canada) 4.40%, 8/5/2052 | | |
Canadian Pacific Railway Co. (Canada) |
| | |
| | |
| | |
| | |
| | |
| | |
|
| | |
| | |
|
| | |
| | |
| | |
| | |
Ryder System, Inc. 2.85%, 3/1/2027 | | |
| | |
|
Ground Transportation — continued |
|
| | |
| | |
| | |
| | |
| | |
Health Care Equipment & Supplies — 1.3% |
|
| | |
| | |
| | |
Baxter International, Inc. |
| | |
| | |
|
| | |
| | |
Boston Scientific Corp. 4.70%, 3/1/2049 | | |
DENTSPLY SIRONA, Inc. 3.25%, 6/1/2030 | | |
DH Europe Finance II SARL 2.60%, 11/15/2029 | | |
GE HealthCare Technologies, Inc. 5.65%, 11/15/2027 | | |
|
| | |
| | |
|
| | |
| | |
| | |
| | |
Health Care Providers & Services — 4.1% |
Aetna, Inc. 3.88%, 8/15/2047 | | |
|
| | |
| | |
Centene Corp. 3.00%, 10/15/2030 | | |
|
| | |
| | |
| | |
| | |
CommonSpirit Health 6.07%, 11/1/2027 | | |
|
| | |
SEE NOTES TO FINANCIAL STATEMENTS.
| J.P. Morgan Exchange-Traded Funds | |
JPMorgan BetaBuilders USD Investment Grade Corporate Bond ETF
SCHEDULE OF PORTFOLIO INVESTMENTSAS OF February 29, 2024 (continued)
| | |
Corporate Bonds — continued |
Health Care Providers & Services — continued |
| | |
| | |
| | |
| | |
| | |
|
| | |
| | |
| | |
|
| | |
| | |
| | |
| | |
| | |
| | |
| | |
|
| | |
| | |
New York and Presbyterian Hospital (The) Series 2019, 3.95%, 8/1/2119 | | |
Providence St. Joseph Health Obligated Group Series A, 3.93%, 10/1/2048 | | |
|
| | |
| | |
SSM Health Care Corp. Series A, 3.82%, 6/1/2027 | | |
|
| | |
| | |
| | |
| | |
| | |
| | |
| | |
| | |
|
Healthpeak OP LLC 2.88%, 1/15/2031 | | |
Sabra Health Care LP 3.90%, 10/15/2029 | | |
Ventas Realty LP 4.38%, 2/1/2045 | | |
Welltower OP LLC 4.95%, 9/1/2048 | | |
| | |
| | |
|
Hotels, Restaurants & Leisure — 1.0% |
Booking Holdings, Inc. 3.65%, 3/15/2025 | | |
Choice Hotels International, Inc. 3.70%, 1/15/2031 | | |
|
| | |
| | |
Hyatt Hotels Corp. 4.38%, 9/15/2028 | | |
|
| | |
| | |
| | |
| | |
| | |
|
| | |
| | |
| | |
| | |
| | |
Household Durables — 0.9% |
DR Horton, Inc. 1.40%, 10/15/2027 | | |
Leggett & Platt, Inc. 3.50%, 11/15/2051 | | |
|
| | |
| | |
Mohawk Industries, Inc. 3.63%, 5/15/2030 | | |
Toll Brothers Finance Corp. 4.88%, 11/15/2025 | | |
Whirlpool Corp. 4.60%, 5/15/2050 | | |
| | |
Household Products — 0.4% |
|
| | |
| | |
Kimberly-Clark Corp. 6.63%, 8/1/2037 | | |
Procter & Gamble Co. (The) |
| | |
| | |
| | |
Industrial Conglomerates — 0.5% |
| | |
GE Capital Funding LLC 4.55%, 5/15/2032 | | |
Honeywell International, Inc. 5.70%, 3/15/2036 | | |
| | |
SEE NOTES TO FINANCIAL STATEMENTS.
| J.P. Morgan Exchange-Traded Funds | |
| | |
Corporate Bonds — continued |
|
Prologis LP 3.00%, 4/15/2050 | | |
Rexford Industrial Realty LP 2.13%, 12/1/2030 | | |
| | |
|
ACE Capital Trust II 9.70%, 4/1/2030 | | |
Aflac, Inc. 3.60%, 4/1/2030 | | |
Alleghany Corp. 3.25%, 8/15/2051 | | |
|
| | |
(3-MONTH SOFR + 2.12%), 6.50%, 5/15/2057 (b) | | |
American International Group, Inc. 3.88%, 1/15/2035 | | |
|
| | |
| | |
Arch Capital Group Ltd. 3.64%, 6/30/2050 | | |
Assured Guaranty US Holdings, Inc. 6.13%, 9/15/2028 | | |
AXIS Specialty Finance LLC (US Treasury Yield Curve Rate T Note Constant Maturity 5 Year + 3.19%), 4.90%, 1/15/2040 (b) | | |
Berkshire Hathaway Finance Corp. |
| | |
| | |
| | |
Brighthouse Financial, Inc. 3.85%, 12/22/2051 | | |
|
| | |
| | |
Cincinnati Financial Corp. 6.13%, 11/1/2034 | | |
Enstar Finance LLC (US Treasury Yield Curve Rate T Note Constant Maturity 5 Year + 4.01%), 5.50%, 1/15/2042 (b) | | |
Hartford Financial Services Group, Inc. (The) 2.90%, 9/15/2051 | | |
Manulife Financial Corp. (Canada) (USD ICE Swap Rate 5 Year + 1.65%), 4.06%, 2/24/2032 (b) | | |
Markel Group, Inc. 3.35%, 9/17/2029 | | |
Marsh & McLennan Cos., Inc. |
| | |
| | |
|
| | |
| | |
| | |
|
|
Principal Financial Group, Inc. |
| | |
| | |
Progressive Corp. (The) 4.13%, 4/15/2047 | | |
Prudential Financial, Inc. |
| | |
| | |
Selective Insurance Group, Inc. 5.38%, 3/1/2049 | | |
Transatlantic Holdings, Inc. 8.00%, 11/30/2039 | | |
Travelers Cos., Inc. (The) 4.10%, 3/4/2049 | | |
Travelers Property Casualty Corp. 6.38%, 3/15/2033 | | |
Willis North America, Inc. 3.88%, 9/15/2049 | | |
WR Berkley Corp. 4.75%, 8/1/2044 | | |
| | |
Interactive Media & Services — 0.9% |
|
| | |
| | |
| | |
|
| | |
| | |
| | |
| | |
|
International Business Machines Corp. |
| | |
| | |
| | |
| | |
VeriSign, Inc. 2.70%, 6/15/2031 | | |
| | |
|
Brunswick Corp. 5.10%, 4/1/2052 | | |
Hasbro, Inc. 3.90%, 11/19/2029 | | |
| | |
Life Sciences Tools & Services — 0.1% |
Agilent Technologies, Inc. 2.30%, 3/12/2031 | | |
SEE NOTES TO FINANCIAL STATEMENTS.
| J.P. Morgan Exchange-Traded Funds | |
JPMorgan BetaBuilders USD Investment Grade Corporate Bond ETF
SCHEDULE OF PORTFOLIO INVESTMENTSAS OF February 29, 2024 (continued)
| | |
Corporate Bonds — continued |
|
|
| | |
| | |
CNH Industrial Capital LLC 3.95%, 5/23/2025 | | |
Deere & Co. 2.88%, 9/7/2049 | | |
Illinois Tool Works, Inc. 2.65%, 11/15/2026 | | |
Otis Worldwide Corp. 3.36%, 2/15/2050 | | |
Snap-on, Inc. 4.10%, 3/1/2048 | | |
| | |
|
Charter Communications Operating LLC |
| | |
| | |
| | |
| | |
| | |
|
| | |
| | |
| | |
| | |
| | |
| | |
Discovery Communications LLC |
| | |
| | |
| | |
| | |
| | |
Fox Corp. 5.58%, 1/25/2049 | | |
|
| | |
| | |
| | |
| | |
|
| | |
| | |
| | |
|
ArcelorMittal SA (Luxembourg) 6.75%, 3/1/2041 (a) | | |
BHP Billiton Finance USA Ltd. (Australia) |
| | |
| | |
|
Metals & Mining — continued |
| | |
Kinross Gold Corp. (Canada) 4.50%, 7/15/2027 | | |
Rio Tinto Finance USA plc (Australia) 5.13%, 3/9/2053 | | |
Southern Copper Corp. (Mexico) |
| | |
| | |
Teck Resources Ltd. (Canada) 5.40%, 2/1/2043 | | |
Vale Overseas Ltd. (Brazil) |
| | |
| | |
| | |
|
Ameren Corp. 3.50%, 1/15/2031 | | |
Berkshire Hathaway Energy Co. 6.13%, 4/1/2036 | | |
Black Hills Corp. 6.15%, 5/15/2034 | | |
CMS Energy Corp. (US Treasury Yield Curve Rate T Note Constant Maturity 5 Year + 4.12%), 4.75%, 6/1/2050 (b) | | |
Consolidated Edison Co. of New York, Inc. |
Series 20B, 3.95%, 4/1/2050 | | |
| | |
| | |
|
| | |
| | |
|
Series A, 3.30%, 3/15/2025 | | |
| | |
National Grid plc (United Kingdom) 5.81%, 6/12/2033 | | |
|
| | |
| | |
| | |
| | |
San Diego Gas & Electric Co. |
| | |
| | |
Southern Co. Gas Capital Corp. 4.40%, 5/30/2047 | | |
|
| | |
SEE NOTES TO FINANCIAL STATEMENTS.
| J.P. Morgan Exchange-Traded Funds | |
| | |
Corporate Bonds — continued |
Multi-Utilities — continued |
| | |
| | |
| | |
|
Alexandria Real Estate Equities, Inc. 2.95%, 3/15/2034 | | |
Boston Properties LP 2.75%, 10/1/2026 | | |
COPT Defense Properties LP 2.75%, 4/15/2031 | | |
|
| | |
| | |
Piedmont Operating Partnership LP |
| | |
| | |
| | |
Oil, Gas & Consumable Fuels — 6.5% |
Apache Corp. 4.25%, 1/15/2030 | | |
BP Capital Markets America, Inc. |
| | |
| | |
| | |
| | |
BP Capital Markets plc (United Kingdom) 3.28%, 9/19/2027 | | |
Cenovus Energy, Inc. (Canada) 4.25%, 4/15/2027 | | |
Cheniere Energy, Inc. 4.63%, 10/15/2028 | | |
Chevron Corp. 2.95%, 5/16/2026 | | |
Chevron USA, Inc. 0.69%, 8/12/2025 | | |
Columbia Pipeline Group, Inc. 4.50%, 6/1/2025 | | |
|
| | |
| | |
|
| | |
| | |
|
| | |
| | |
Enbridge Energy Partners LP Series B, 7.50%, 4/15/2038 | | |
Enbridge, Inc. (Canada) 2.50%, 8/1/2033 | | |
|
| | |
| | |
|
Oil, Gas & Consumable Fuels — continued |
| | |
| | |
| | |
| | |
Enterprise Products Operating LLC |
| | |
| | |
| | |
Series E, (3-MONTH CME TERM SOFR + 3.29%), 5.25%, 8/16/2077 (b) | | |
EQT Corp. 7.00%, 2/1/2030 (a) | | |
|
| | |
| | |
| | |
| | |
| | |
|
| | |
| | |
| | |
|
| | |
| | |
|
| | |
| | |
Marathon Petroleum Corp. 5.00%, 9/15/2054 | | |
|
| | |
| | |
| | |
Occidental Petroleum Corp. 4.40%, 4/15/2046 | | |
|
| | |
| | |
Ovintiv, Inc. 6.50%, 8/15/2034 | | |
Phillips 66 4.88%, 11/15/2044 | | |
Plains All American Pipeline LP 6.65%, 1/15/2037 | | |
Sabine Pass Liquefaction LLC |
| | |
| | |
Suncor Energy, Inc. (Canada) 3.75%, 3/4/2051 | | |
Targa Resources Corp. 6.50%, 2/15/2053 | | |
SEE NOTES TO FINANCIAL STATEMENTS.
| J.P. Morgan Exchange-Traded Funds | |
JPMorgan BetaBuilders USD Investment Grade Corporate Bond ETF
SCHEDULE OF PORTFOLIO INVESTMENTSAS OF February 29, 2024 (continued)
| | |
Corporate Bonds — continued |
Oil, Gas & Consumable Fuels — continued |
Targa Resources Partners LP 4.88%, 2/1/2031 | | |
TotalEnergies Capital International SA (France) |
| | |
| | |
TransCanada PipeLines Ltd. (Canada) |
| | |
| | |
| | |
| | |
Transcontinental Gas Pipe Line Co. LLC 4.60%, 3/15/2048 | | |
|
| | |
| | |
Western Midstream Operating LP |
| | |
| | |
| | |
| | |
Paper & Forest Products — 0.1% |
Suzano Austria GmbH (Brazil) 3.75%, 1/15/2031 | | |
Personal Care Products — 0.7% |
Estee Lauder Cos., Inc. (The) |
| | |
| | |
|
| | |
| | |
| | |
|
AstraZeneca plc (United Kingdom) |
| | |
| | |
| | |
| | |
|
| | |
| | |
| | |
| | |
|
| | |
| | |
|
Pharmaceuticals — continued |
| | |
| | |
GlaxoSmithKline Capital, Inc. (United Kingdom) |
| | |
| | |
|
| | |
| | |
| | |
| | |
|
| | |
| | |
| | |
| | |
Merck Sharp & Dohme Corp. 5.95%, 12/1/2028 | | |
Novartis Capital Corp. (Switzerland) 3.00%, 11/20/2025 | | |
|
| | |
| | |
| | |
| | |
|
| | |
| | |
Shire Acquisitions Investments Ireland DAC 3.20%, 9/23/2026 | | |
|
| | |
| | |
| | |
Professional Services — 0.4% |
Automatic Data Processing, Inc. 3.38%, 9/15/2025 | | |
Equifax, Inc. 2.35%, 9/15/2031 | | |
Jacobs Engineering Group, Inc. 5.90%, 3/1/2033 | | |
| | |
|
American Homes 4 Rent LP 3.38%, 7/15/2051 | | |
Camden Property Trust 2.80%, 5/15/2030 | | |
UDR, Inc. 3.00%, 8/15/2031 | | |
| | |
SEE NOTES TO FINANCIAL STATEMENTS.
| J.P. Morgan Exchange-Traded Funds | |
| | |
Corporate Bonds — continued |
|
Brixmor Operating Partnership LP 4.05%, 7/1/2030 | | |
Kimco Realty OP LLC 2.25%, 12/1/2031 | | |
NNN REIT, Inc. 3.00%, 4/15/2052 | | |
|
| | |
| | |
| | |
| | |
Semiconductors & Semiconductor Equipment — 2.3% |
Analog Devices, Inc. 3.50%, 12/5/2026 | | |
Broadcom Corp. 3.88%, 1/15/2027 | | |
|
| | |
| | |
| | |
| | |
| | |
|
| | |
| | |
| | |
| | |
| | |
KLA Corp. 4.10%, 3/15/2029 | | |
Micron Technology, Inc. 5.88%, 9/15/2033 | | |
NVIDIA Corp. 2.00%, 6/15/2031 | | |
|
| | |
| | |
QUALCOMM, Inc. 3.25%, 5/20/2027 | | |
|
| | |
| | |
| | |
| | |
| | |
| | |
|
|
| | |
| | |
| | |
| | |
| | |
|
|
| | |
|
| | |
| | |
| | |
| | |
| | |
| | |
| | |
| | |
| | |
| | |
| | |
Salesforce, Inc. 3.05%, 7/15/2061 | | |
| | |
|
American Tower Corp. 2.10%, 6/15/2030 | | |
|
| | |
| | |
| | |
| | |
EPR Properties 4.50%, 6/1/2027 | | |
|
| | |
| | |
Public Storage Operating Co. |
| | |
| | |
Weyerhaeuser Co. 4.00%, 3/9/2052 | | |
| | |
|
|
| | |
| | |
| | |
| | |
|
| | |
| | |
| | |
| | |
SEE NOTES TO FINANCIAL STATEMENTS.
| J.P. Morgan Exchange-Traded Funds | |
JPMorgan BetaBuilders USD Investment Grade Corporate Bond ETF
SCHEDULE OF PORTFOLIO INVESTMENTSAS OF February 29, 2024 (continued)
| | |
Corporate Bonds — continued |
Specialty Retail — continued |
O'Reilly Automotive, Inc. |
| | |
| | |
| | |
Technology Hardware, Storage & Peripherals — 1.9% |
|
| | |
| | |
| | |
| | |
| | |
| | |
| | |
| | |
| | |
| | |
| | |
|
| | |
| | |
| | |
| | |
| | |
|
| | |
| | |
| | |
Textiles, Apparel & Luxury Goods — 0.0% ^ |
NIKE, Inc. 3.88%, 11/1/2045 | | |
|
|
| | |
| | |
| | |
| | |
BAT Capital Corp. (United Kingdom) |
| | |
| | |
| | |
| | |
Philip Morris International, Inc. |
| | |
| | |
| | |
|
|
| | |
| | |
| | |
Reynolds American, Inc. (United Kingdom) 4.45%, 6/12/2025 | | |
| | |
Trading Companies & Distributors — 0.3% |
|
| | |
| | |
|
| | |
| | |
| | |
| | |
| | |
|
American Water Capital Corp. |
| | |
| | |
| | |
| | |
Essential Utilities, Inc. 5.30%, 5/1/2052 | | |
| | |
Wireless Telecommunication Services — 1.3% |
Rogers Communications, Inc. (Canada) 5.45%, 10/1/2043 | | |
|
| | |
| | |
| | |
Vodafone Group plc (United Kingdom) |
| | |
| | |
| | |
Total Corporate Bonds
(Cost $47,828,672) | | |
SEE NOTES TO FINANCIAL STATEMENTS.
| J.P. Morgan Exchange-Traded Funds | |
| | |
Short-Term Investments — 0.1% |
Investment Companies — 0.1% |
JPMorgan U.S. Government Money Market Fund Class IM Shares, 5.25% (f) (g)
(Cost $56,033) | | |
Total Investments — 98.2%
(Cost $47,884,705) | | |
Other Assets Less Liabilities — 1.8% | | |
| | |
Percentages indicated are based on net assets. |
| |
| Chicago Mercantile Exchange |
| Intercontinental Exchange |
| |
| Real Estate Investment Trust |
| Secured Overnight Financing Rate |
| Compounding index of the Secured Overnight Financing Rate |
| |
| Amount rounds to less than 0.1% of net assets. |
| Step bond. Interest rate is a fixed rate for an initial period that either resets at a specific date or may reset in the future contingent upon a predetermined trigger. The interest rate shown is the current rate as of February 29, 2024. | |
| Variable or floating rate security, linked to the referenced benchmark. The interest rate shown is the current rate as of February 29, 2024. | |
| Contingent Capital security (“CoCo”). CoCos are hybrid debt securities that may be convertible into equity or may be written down if a pre-specified trigger event occurs. The total value of aggregate CoCo holdings at February 29, 2024 is $163,993 or 0.35% of the Fund’s net assets as of February 29, 2024. | |
| Securities exempt from registration under Rule 144A or section 4(a)(2), of the Securities Act of 1933, as amended. | |
| Variable or floating rate security, the interest rate of which adjusts periodically based on changes in current interest rates and prepayments on the underlying pool of assets. The interest rate shown is the current rate as of February 29, 2024. | |
| Investment in an affiliated fund, which is registered under the Investment Company Act of 1940, as amended, and is advised by J.P. Morgan Investment Management Inc. | |
| The rate shown is the current yield as of February 29, 2024. | |
SEE NOTES TO FINANCIAL STATEMENTS.
| J.P. Morgan Exchange-Traded Funds | |
JPMorgan USD Emerging Markets Sovereign Bond ETF
SCHEDULE OF PORTFOLIO INVESTMENTSAS OF February 29, 2024
| | |
Foreign Government Securities — 84.9% |
|
| | |
| | |
| | |
| | |
| | |
|
| | |
| | |
| | |
| | |
|
CBB International Sukuk Co. 7 SPC 6.88%, 10/5/2025 (a) | | |
CBB International Sukuk Programme Co. SPC | | |
| | |
| | |
CBB International Sukuk Programme Co. WLL 3.88%, 5/18/2029 (a) | | |
| | |
| | |
| | |
| | |
| | |
| | |
| | |
| | |
| | |
| | |
| | |
| | |
|
Federative Republic of Brazil | | |
| | |
| | |
| | |
| | |
| | |
| | |
| | |
| | |
| | |
| | |
|
|
| | |
| | |
| | |
|
| | |
| | |
| | |
| | |
| | |
| | |
| | |
| | |
| | |
|
Export-Import Bank of China (The) 2.88%, 4/26/2026 (a) | | |
People's Republic of China | | |
| | |
| | |
| | |
| | |
|
| | |
| | |
| | |
| | |
| | |
| | |
| | |
| | |
| | |
| | |
| | |
| | |
| | |
| | |
| | |
|
| | |
| | |
| | |
| | |
SEE NOTES TO FINANCIAL STATEMENTS.
| J.P. Morgan Exchange-Traded Funds | |
| | |
Foreign Government Securities — continued |
|
| | |
| | |
| | |
Dominican Republic — 4.7% |
Dominican Republic Government Bond | | |
| | |
| | |
| | |
| | |
| | |
| | |
| | |
| | |
| | |
| | |
| | |
| | |
| | |
|
| | |
| | |
| | |
| | |
|
| | |
| | |
| | |
| | |
| | |
| | |
| | |
| | |
| | |
| | |
Magyar Export-Import Bank Zrt. 6.13%, 12/4/2027 (a) | | |
| | |
|
Export-Import Bank of India | | |
| | |
| | |
|
|
| | |
| | |
| | |
| | |
|
Perusahaan Penerbit SBSN Indonesia III | | |
| | |
| | |
| | |
| | |
| | |
| | |
| | |
| | |
| | |
| | |
| | |
| | |
| | |
| | |
| | |
| | |
| | |
| | |
| | |
| | |
| | |
| | |
| | |
| | |
| | |
|
Republic of Iraq 5.80%, 1/15/2028 (a) | | |
|
Republic of Cote d'Ivoire 6.13%, 6/15/2033 (a) | | |
|
| | |
| | |
| | |
| | |
SEE NOTES TO FINANCIAL STATEMENTS.
| J.P. Morgan Exchange-Traded Funds | |
JPMorgan USD Emerging Markets Sovereign Bond ETF
SCHEDULE OF PORTFOLIO INVESTMENTSAS OF February 29, 2024 (continued)
| | |
Foreign Government Securities — continued |
|
Hashemite Kingdom of Jordan | | |
| | |
| | |
| | |
| | |
| | |
|
| | |
| | |
| | |
| | |
| | |
| | |
| | |
|
State of Kuwait 3.50%, 3/20/2027 (a) | | |
|
Malaysia Sovereign Sukuk Bhd. 3.04%, 4/22/2025 (a) | | |
Malaysia Sukuk Global Bhd. 3.18%, 4/27/2026 (a) | | |
| | |
|
| | |
| | |
| | |
| | |
| | |
| | |
| | |
| | |
| | |
| | |
| | |
| | |
| | |
| | |
| | |
| | |
| | |
| | |
| | |
|
|
| | |
| | |
| | |
| | |
| | |
| | |
|
Federal Republic of Nigeria | | |
| | |
| | |
| | |
| | |
| | |
| | |
| | |
| | |
| | |
| | |
| | |
|
Oman Sovereign Sukuk SAOC | | |
| | |
| | |
Sultanate of Oman Government Bond | | |
| | |
| | |
| | |
| | |
| | |
| | |
| | |
| | |
| | |
| | |
| | |
| | |
|
| | |
| | |
| | |
| | |
| | |
| | |
SEE NOTES TO FINANCIAL STATEMENTS.
| J.P. Morgan Exchange-Traded Funds | |
| | |
Foreign Government Securities — continued |
|
| | |
| | |
| | |
| | |
| | |
| | |
|
| | |
| | |
| | |
| | |
|
| | |
| | |
| | |
| | |
| | |
| | |
| | |
| | |
| | |
| | |
| | |
| | |
|
| | |
| | |
| | |
| | |
| | |
| | |
| | |
| | |
| | |
| | |
| | |
| | |
| | |
| | |
| | |
| | |
| | |
SEE NOTES TO FINANCIAL STATEMENTS.
| J.P. Morgan Exchange-Traded Funds | |
JPMorgan USD Emerging Markets Sovereign Bond ETF
SCHEDULE OF PORTFOLIO INVESTMENTSAS OF February 29, 2024 (continued)
| | |
Foreign Government Securities — continued |
|
| | |
| | |
| | |
| | |
| | |
| | |
| | |
| | |
| | |
| | |
| | |
|
| | |
| | |
| | |
| | |
|
| | |
| | |
| | |
| | |
|
| | |
| | |
| | |
| | |
| | |
| | |
| | |
| | |
| | |
| | |
| | |
| | |
| | |
| | |
Trinidad And Tobago — 0.3% |
Republic of Trinidad and Tobago 4.50%, 8/4/2026 (a) | | |
|
Hazine Mustesarligi Varlik Kiralama A/S | | |
| | |
| | |
|
|
| | |
| | |
| | |
| | |
| | |
| | |
| | |
| | |
| | |
| | |
| | |
| | |
| | |
| | |
| | |
| | |
| | |
| | |
| | |
| | |
| | |
| | |
| | |
United Arab Emirates — 2.6% |
Sharjah Sukuk Program Ltd. | | |
| | |
| | |
United Arab Emirates Government Bond | | |
| | |
| | |
| | |
| | |
| | |
| | |
| | |
| | |
| | |
| | |
| | |
| | |
| | |
| | |
| | |
| | |
SEE NOTES TO FINANCIAL STATEMENTS.
| J.P. Morgan Exchange-Traded Funds | |
| | |
Foreign Government Securities — continued |
United Arab Emirates—continued |
| | |
| | |
| | |
|
Oriental Republic of Uruguay | | |
| | |
| | |
| | |
| | |
| | |
| | |
| | |
Total Foreign Government Securities
(Cost $555,534,325) | | |
|
|
Southern Gas Corridor CJSC 6.88%, 3/24/2026 (a) | | |
|
Bapco Energies BSCC 7.50%, 10/25/2027 (a) | | |
|
Corp. Nacional del Cobre de Chile | | |
| | |
| | |
| | |
| | |
| | |
| | |
Empresa de Transporte de Pasajeros Metro SA 4.70%, 5/7/2050 (a) | | |
| | |
|
China Development Bank 1.00%, 10/27/2025 (a) | | |
CNAC HK Finbridge Co. Ltd. 4.13%, 7/19/2027 (a) | | |
Minmetals Bounteous Finance BVI Ltd. (US Treasury Yield Curve Rate T Note Constant Maturity 5 Year + 5.21%), 3.38%, 9/3/2024 (a) (d) (e) (f) | | |
Sinopec Group Overseas Development 2012 Ltd. 4.88%, 5/17/2042 (a) | | |
| | |
|
|
Sinopec Group Overseas Development 2018 Ltd. | | |
| | |
| | |
| | |
| | |
SPIC MTN Co. Ltd. 1.63%, 7/27/2025 (a) | | |
State Grid Overseas Investment BVI Ltd. | | |
| | |
| | |
| | |
|
China Life Insurance Overseas Co. Ltd. (US Treasury Yield Curve Rate T Note Constant Maturity 5 Year + 1.23%), 5.35%, 8/15/2033 (a) (f) | | |
|
MFB Magyar Fejlesztesi Bank Zrt. 6.50%, 6/29/2028 (a) | | |
|
Indonesia Asahan Aluminium PT 4.75%, 5/15/2025 (a) | | |
Pelabuhan Indonesia Persero PT 4.25%, 5/5/2025 (a) | | |
| | |
| | |
| | |
| | |
Perusahaan Perseroan Persero PT Perusahaan Listrik Negara | | |
| | |
| | |
| | |
| | |
| | |
| | |
|
| | |
| | |
| | |
| | |
| | |
| | |
SEE NOTES TO FINANCIAL STATEMENTS.
| J.P. Morgan Exchange-Traded Funds | |
JPMorgan USD Emerging Markets Sovereign Bond ETF
SCHEDULE OF PORTFOLIO INVESTMENTSAS OF February 29, 2024 (continued)
| | |
Corporate Bonds — continued |
|
Banco Nacional de Comercio Exterior SNC 4.38%, 10/14/2025 (a) | | |
Comision Federal de Electricidad 4.69%, 5/15/2029 (a) | | |
Mexico City Airport Trust 5.50%, 7/31/2047 (a) | | |
| | |
| | |
| | |
| | |
| | |
| | |
| | |
| | |
| | |
| | |
| | |
| | |
| | |
| | |
|
| | |
| | |
| | |
| | |
|
Aeropuerto Internacional de Tocumen SA 5.13%, 8/11/2061 (a) | | |
Banco Nacional de Panama 2.50%, 8/11/2030 (a) | | |
| | |
|
| | |
| | |
| | |
| | |
|
Bank Gospodarstwa Krajowego 5.38%, 5/22/2033 (a) | | |
| | |
|
|
QatarEnergy 2.25%, 7/12/2031 (a) | | |
QatarEnergy Trading LLC 3.13%, 7/12/2041 (a) | | |
| | |
|
Gaci First Investment Co. | | |
| | |
| | |
| | |
| | |
| | |
|
Eskom Holdings SOC Ltd. 6.35%, 8/10/2028 (a) | | |
Transnet SOC Ltd. 8.25%, 2/6/2028 (a) | | |
| | |
United Arab Emirates — 1.2% |
Abu Dhabi Crude Oil Pipeline LLC 4.60%, 11/2/2047 (a) | | |
DP World Ltd. 6.85%, 7/2/2037 (a) | | |
DP World Salaam (US Treasury Yield Curve Rate T Note Constant Maturity 5 Year + 5.75%), 6.00%, 10/1/2025 (a) (d) (e) (f) | | |
| | |
| | |
| | |
| | |
| | |
| | |
| | |
Total Corporate Bonds
(Cost $84,944,478) | | |
| | |
Short-Term Investments — 1.8% |
Investment Companies — 0.6% |
JPMorgan U.S. Government Money Market Fund Class IM Shares, 5.25% (g) (h)(Cost $3,914,092) | | |
Investment of Cash Collateral from Securities Loaned — 1.2% |
JPMorgan Securities Lending Money Market Fund Agency SL Class Shares, 5.48% (g) (h) | | |
SEE NOTES TO FINANCIAL STATEMENTS.
| J.P. Morgan Exchange-Traded Funds | |
| | |
Short-Term Investments — continued |
Investment of Cash Collateral from Securities Loaned — continued |
JPMorgan U.S. Government Money Market Fund Class IM Shares, 5.25% (g) (h) | | |
Total Investment of Cash Collateral from Securities Loaned
(Cost $7,898,818) | | |
Total Short-Term Investments
(Cost $11,812,910) | | |
Total Investments — 99.7%
(Cost $652,291,713) | | |
Other Assets Less Liabilities — 0.3% | | |
| | |
Percentages indicated are based on net assets. |
| |
| Closed Joint Stock Company |
| |
| |
| Limited liability company |
| |
| Security exempt from registration pursuant to Regulation S under the Securities Act of 1933, as amended. Regulation S applies to securities offerings that are made outside of the United States and do not involve direct selling efforts in the United States and as such may have restrictions on resale. |
| Securities exempt from registration under Rule 144A or section 4(a)(2), of the Securities Act of 1933, as amended. |
| The security or a portion of this security is on loan at February 29, 2024. The total value of securities on loan at February 29, 2024 is $7,704,114. |
| Security is an interest bearing note with preferred security characteristics. |
| Security is perpetual and thus, does not have a predetermined maturity date. The coupon rate for this security is fixed for a period of time and may be structured to adjust thereafter. The date shown, if applicable, reflects the next call date. The coupon rate shown is the rate in effect as of February 29, 2024. |
| Variable or floating rate security, linked to the referenced benchmark. The interest rate shown is the current rate as of February 29, 2024. |
| Investment in an affiliated fund, which is registered under the Investment Company Act of 1940, as amended, and is advised by J.P. Morgan Investment Management Inc. |
| The rate shown is the current yield as of February 29, 2024. |
SEE NOTES TO FINANCIAL STATEMENTS.
| J.P. Morgan Exchange-Traded Funds | |
STATEMENTS OF ASSETS AND LIABILITIESAS OF February 29, 2024
| JPMorgan
BetaBuilders
1-5 Year U.S.
Aggregate
Bond ETF | JPMorgan
BetaBuilders
U.S. Aggregate
Bond ETF | JPMorgan
BetaBuilders U.S.
TIPS 0-5 Year ETF |
| | | |
Investments in non-affiliates, at value | | | |
Investments in affiliates, at value | | | |
Investments of cash collateral received from securities loaned, at value (See Note 2.D.) | | | |
| | | |
Foreign currency, at value | | | |
| | | |
Investment securities sold | | | |
Investment securities sold — delayed delivery securities | | | |
Interest from non-affiliates | | | |
Dividends from affiliates | | | |
Securities lending income (See Note 2.D.) | | | |
| | | |
| | | |
| | | |
Investment securities purchased | | | |
Investment securities purchased — delayed delivery securities | | | |
Collateral received on securities loaned (See Note 2.D.) | | | |
| | | |
Management fees (See Note 3.A.) | | | |
| | | |
| | | |
| | | |
| | | |
Total distributable earnings (loss) | | | |
| | | |
Outstanding number of shares
(unlimited number of shares authorized - par value $0.0001) | | | |
Net asset value, per share | | | |
Cost of investments in non-affiliates | | | |
Cost of investments in affiliates | | | |
| | | |
Investment securities on loan, at value (See Note 2.D.) | | | |
Cost of investment of cash collateral (See Note 2.D.) | | | |
SEE NOTES TO FINANCIAL STATEMENTS.
| J.P. Morgan Exchange-Traded Funds | |
| JPMorgan
BetaBuilders
U.S. Treasury
Bond 1-3
Year ETF | JPMorgan
BetaBuilders
U.S. Treasury
Bond 20+
Year ETF | JPMorgan
BetaBuilders
U.S. Treasury
Bond 3-10
Year ETF |
| | | |
Investments in non-affiliates, at value | | | |
Investments in affiliates, at value | | | |
| | | |
| | | |
Investment securities sold | | | |
Interest from non-affiliates | | | |
Dividends from affiliates | | | |
| | | |
| | | |
| | | |
| | | |
Investment securities purchased | | | |
| | | |
Management fees (See Note 3.A.) | | | |
| | | |
| | | |
| | | |
| | | |
Total distributable earnings (loss) | | | |
| | | |
Outstanding number of shares
(unlimited number of shares authorized - par value $0.0001) | | | |
Net asset value, per share | | | |
Cost of investments in non-affiliates | | | |
Cost of investments in affiliates | | | |
SEE NOTES TO FINANCIAL STATEMENTS.
| J.P. Morgan Exchange-Traded Funds | |
STATEMENTS OF ASSETS AND LIABILITIESAS OF February 29, 2024 (continued)
| JPMorgan
BetaBuilders
USD High
Yield Corporate
Bond ETF | JPMorgan
BetaBuilders
USD Investment
Grade Corporate
Bond ETF | JPMorgan USD
Emerging
Markets
Sovereign
Bond ETF |
| | | |
Investments in non-affiliates, at value | | | |
Investments in affiliates, at value | | | |
Investments of cash collateral received from securities loaned, at value (See Note 2.D.) | | | |
| | | |
Foreign currency, at value | | | |
Segregated cash balance with Authorized Participant for deposit securities | | | |
| | | |
Investment securities sold | | | |
Interest from non-affiliates | | | |
Dividends from affiliates | | | |
Securities lending income (See Note 2.D.) | | | |
| | | |
| | | |
| | | |
| | | |
Investment securities purchased | | | |
Collateral received on securities loaned (See Note 2.D.) | | | |
| | | |
Collateral upon return of deposit securities | | | |
| | | |
Management fees (See Note 3.A.) | | | |
| | | |
| | | |
| | | |
| | | |
Total distributable earnings (loss) | | | |
| | | |
Outstanding number of shares
(unlimited number of shares authorized - par value $0.0001) | | | |
Net asset value, per share | | | |
Cost of investments in non-affiliates | | | |
Cost of investments in affiliates | | | |
| | | |
Investment securities on loan, at value (See Note 2.D.) | | | |
Cost of investment of cash collateral (See Note 2.D.) | | | |
SEE NOTES TO FINANCIAL STATEMENTS.
| J.P. Morgan Exchange-Traded Funds | |
STATEMENTS OF OPERATIONSFOR THE YEAR ENDED February 29, 2024
| JPMorgan
BetaBuilders
1-5 Year U.S.
Aggregate
Bond ETF | JPMorgan
BetaBuilders
U.S. Aggregate
Bond ETF | JPMorgan
BetaBuilders U.S.
|
| | | |
Interest income from non-affiliates | | | |
Interest income from affiliates | | | |
Dividend income from affiliates | | | |
Income from securities lending (net) (See Note 2.D.) | | | |
| | | |
| | | |
Management fees (See Note 3.A.) | | | |
Interest expense to affiliates | | | |
| | | |
Net investment income (loss) | | | |
REALIZED/UNREALIZED GAINS (LOSSES): | | | |
Net realized gain (loss) on transactions from: | | | |
Investments in non-affiliates | | | |
Investments in affiliates | | | |
In-kind redemptions of investments in non-affiliates (See Note 4) | | | |
| | | |
Change in net unrealized appreciation/depreciation on: | | | |
Investments in non-affiliates | | | |
Investments in affiliates | | | |
Foreign currency translations | | | |
Change in net unrealized appreciation/depreciation | | | |
Net realized/unrealized gains (losses) | | | |
Change in net assets resulting from operations | | | |
(a)
Commencement of operations was May 10, 2023.
SEE NOTES TO FINANCIAL STATEMENTS.
| J.P. Morgan Exchange-Traded Funds | |
STATEMENTS OF OPERATIONSFOR THE YEAR ENDED February 29, 2024 (continued)
| JPMorgan
BetaBuilders
U.S. Treasury
Bond 1-3
Year ETF (a) | JPMorgan
BetaBuilders
U.S. Treasury
Bond 20+
Year ETF (a) | JPMorgan
BetaBuilders
U.S. Treasury
Bond 3-10
|
| | | |
Interest income from non-affiliates | | | |
Dividend income from affiliates | | | |
| | | |
| | | |
Management fees (See Note 3.A.) | | | |
| | | |
Net investment income (loss) | | | |
REALIZED/UNREALIZED GAINS (LOSSES): | | | |
Net realized gain (loss) on transactions from: | | | |
Investments in non-affiliates | | | |
Investments in affiliates | | | |
In-kind redemptions of investments in non-affiliates (See Note 4) | | | |
| | | |
Change in net unrealized appreciation/depreciation on: | | | |
Investments in non-affiliates | | | |
Investments in affiliates | | | |
Change in net unrealized appreciation/depreciation | | | |
Net realized/unrealized gains (losses) | | | |
Change in net assets resulting from operations | | | |
(a)
Commencement of operations was April 19, 2023.
SEE NOTES TO FINANCIAL STATEMENTS.
| J.P. Morgan Exchange-Traded Funds | |
| JPMorgan
BetaBuilders
USD High
Yield Corporate
Bond ETF | JPMorgan
BetaBuilders
USD Investment
Grade Corporate
Bond ETF | JPMorgan USD
Emerging
Markets
Sovereign
Bond ETF |
| | | |
Interest income from non-affiliates | | | |
Interest income from affiliates | | | |
Dividend income from affiliates | | | |
Income from securities lending (net) (See Note 2.D.) | | | |
| | | |
| | | |
Management fees (See Note 3.A.) | | | |
Interest expense to non-affiliates | | | |
Interest expense to affiliates | | | |
| | | |
| | | |
Net investment income (loss) | | | |
REALIZED/UNREALIZED GAINS (LOSSES): | | | |
Net realized gain (loss) on transactions from: | | | |
Investments in non-affiliates | | | |
In-kind redemptions of investments in non-affiliates (See Note 4) | | | |
Foreign currency transactions | | | |
| | | |
Change in net unrealized appreciation/depreciation on: | | | |
Investments in non-affiliates | | | |
Investments in affiliates | | | |
Foreign currency translations | | | |
Change in net unrealized appreciation/depreciation | | | |
Net realized/unrealized gains (losses) | | | |
Change in net assets resulting from operations | | | |
SEE NOTES TO FINANCIAL STATEMENTS.
| J.P. Morgan Exchange-Traded Funds | |
STATEMENTS OF CHANGES IN NET ASSETSFOR THE PERIODS INDICATED
| JPMorgan BetaBuilders 1-5 Year U.S.
Aggregate Bond ETF | JPMorgan BetaBuilders U.S.
Aggregate Bond ETF |
| Year Ended
February 29, 2024 | Year Ended
February 28, 2023 | Year Ended
February 29, 2024 | Year Ended
February 28, 2023 |
CHANGE IN NET ASSETS RESULTING FROM OPERATIONS: | | | | |
Net investment income (loss) | | | | |
| | | | |
Change in net unrealized appreciation/depreciation | | | | |
Change in net assets resulting from operations | | | | |
DISTRIBUTIONS TO SHAREHOLDERS: | | | | |
Total distributions to shareholders | | | | |
| | | | |
Change in net assets resulting from capital transactions | | | | |
| | | | |
| | | | |
| | | | |
| | | | |
| | | | |
Proceeds from shares issued | | | | |
| | | | |
Total change in net assets resulting from capital transactions | | | | |
| | | | |
| | | | |
| | | | |
Net increase (decrease) in shares from share transactions | | | | |
SEE NOTES TO FINANCIAL STATEMENTS.
| J.P. Morgan Exchange-Traded Funds | |
| JPMorgan
BetaBuilders U.S.
TIPS 0-5 Year ETF | JPMorgan
BetaBuilders U.S.
Treasury Bond 1-3 Year ETF |
| Period Ended
February 29, 2024 (a) | |
CHANGE IN NET ASSETS RESULTING FROM OPERATIONS: | | |
Net investment income (loss) | | |
| | |
Change in net unrealized appreciation/depreciation | | |
Change in net assets resulting from operations | | |
DISTRIBUTIONS TO SHAREHOLDERS: | | |
From net investment income | | |
| | |
Total distributions to shareholders | | |
| | |
Change in net assets resulting from capital transactions | | |
| | |
| | |
| | |
| | |
| | |
Proceeds from shares issued | | |
| | |
Total change in net assets resulting from capital transactions | | |
| | |
| | |
| | |
Net increase in shares from transactions | | |
(a)
Commencement of operations was May 10, 2023.
(b)
Commencement of operations was April 19, 2023.
SEE NOTES TO FINANCIAL STATEMENTS.
| J.P. Morgan Exchange-Traded Funds | |
STATEMENTS OF CHANGES IN NET ASSETSFOR THE PERIODS INDICATED (continued)
| JPMorgan
BetaBuilders U.S.
Treasury Bond 20+ Year ETF | JPMorgan
BetaBuilders U.S.
Treasury Bond 3-10 Year ETF |
| Period Ended
February 29, 2024 (a) | |
CHANGE IN NET ASSETS RESULTING FROM OPERATIONS: | | |
Net investment income (loss) | | |
| | |
Change in net unrealized appreciation/depreciation | | |
Change in net assets resulting from operations | | |
DISTRIBUTIONS TO SHAREHOLDERS: | | |
Total distributions to shareholders | | |
| | |
Change in net assets resulting from capital transactions | | |
| | |
| | |
| | |
| | |
| | |
Proceeds from shares issued | | |
| | |
Total change in net assets resulting from capital transactions | | |
| | |
| | |
| | |
Net increase in shares from transactions | | |
(a)
Commencement of operations was April 19, 2023.
SEE NOTES TO FINANCIAL STATEMENTS.
| J.P. Morgan Exchange-Traded Funds | |
| JPMorgan BetaBuilders USD High
Yield Corporate Bond ETF | JPMorgan BetaBuilders USD Investment
Grade Corporate Bond ETF |
| Year Ended
February 29, 2024 | Year Ended
February 28, 2023 | Year Ended
February 29, 2024 | Year Ended
February 28, 2023 |
CHANGE IN NET ASSETS RESULTING FROM OPERATIONS: | | | | |
Net investment income (loss) | | | | |
| | | | |
Change in net unrealized appreciation/depreciation | | | | |
Change in net assets resulting from operations | | | | |
DISTRIBUTIONS TO SHAREHOLDERS: | | | | |
Total distributions to shareholders | | | | |
| | | | |
Change in net assets resulting from capital transactions | | | | |
| | | | |
| | | | |
| | | | |
| | | | |
| | | | |
Proceeds from shares issued | | | | |
| | | | |
Total change in net assets resulting from capital transactions | | | | |
| | | | |
| | | | |
| | | | |
Net increase (decrease) in shares from share transactions | | | | |
SEE NOTES TO FINANCIAL STATEMENTS.
| J.P. Morgan Exchange-Traded Funds | |
STATEMENTS OF CHANGES IN NET ASSETSFOR THE PERIODS INDICATED (continued)
| JPMorgan
USD Emerging Markets
Sovereign Bond ETF |
| Year Ended
February 29, 2024 | Year Ended
February 28, 2023 |
CHANGE IN NET ASSETS RESULTING FROM OPERATIONS: | | |
Net investment income (loss) | | |
| | |
Change in net unrealized appreciation/depreciation | | |
Change in net assets resulting from operations | | |
DISTRIBUTIONS TO SHAREHOLDERS: | | |
Total distributions to shareholders | | |
| | |
Change in net assets resulting from capital transactions | | |
| | |
| | |
| | |
| | |
| | |
Proceeds from shares issued | | |
| | |
Total change in net assets resulting from capital transactions | | |
| | |
| | |
| | |
Net increase in shares from transactions | | |
SEE NOTES TO FINANCIAL STATEMENTS.
| J.P. Morgan Exchange-Traded Funds | |
THIS PAGE IS INTENTIONALLY LEFT BLANK
FINANCIAL HIGHLIGHTSFOR THE PERIODS INDICATED
| Per share operating performance |
| | | |
| Net asset
value,
beginning
of period | Net investment
income
(loss) (b) | Net realized
and unrealized
gains
(losses)
on investments | Total from
investment
operations | | | | |
JPMorgan BetaBuilders 1-5 Year U.S. Aggregate Bond ETF | | | | | | | | |
Year Ended February 29, 2024 | | | | | | | | |
Year Ended February 28, 2023 | | | | | | | | |
Year Ended February 28, 2022 (f) | | | | | | | | |
Year Ended February 28, 2021 (f) | | | | | | | | |
March 12, 2019 (g)
through February 29, 2020 (f) | | | | | | | | |
JPMorgan BetaBuilders U.S. Aggregate Bond ETF | | | | | | | | |
Year Ended February 29, 2024 | | | | | | | | |
Year Ended February 28, 2023 | | | | | | | | |
Year Ended February 28, 2022 (f) | | | | | | | | |
Year Ended February 28, 2021 (f) | | | | | | | | |
Year Ended February 29, 2020 (f) | | | | | | | | |
JPMorgan BetaBuilders U.S. TIPS 0-5 Year ETF | | | | | | | | |
May 10, 2023 (g)
through February 29, 2024 | | | | | | | | |
JPMorgan BetaBuilders U.S. Treasury Bond 1-3 Year ETF | | | | | | | | |
April 19, 2023 (g)
through February 29, 2024 | | | | | | | | |
JPMorgan BetaBuilders U.S. Treasury Bond 20+ Year ETF | | | | | | | | |
April 19, 2023 (g)
through February 29, 2024 | | | | | | | | |
JPMorgan BetaBuilders U.S. Treasury Bond 3-10 Year ETF | | | | | | | | |
April 19, 2023 (g)
through February 29, 2024 | | | | | | | | |
|
| Annualized for periods less than one year, unless otherwise noted. |
| Calculated based upon average shares outstanding. |
| Not annualized for periods less than one year. |
| Includes adjustments in accordance with accounting principles generally accepted in the United States of America and as such, the net asset values for financial reporting purposes and the returns based upon those net asset values may differ from the net asset values and returns for shareholder transactions. |
| Prior to December 9, 2019, market price return was calculated assuming an initial investment made at the market price at the beginning of the reporting period, reinvestment of all dividends and distributions at market price during the period, and sale at the market price on the last day of the period. The price used to calculate the market price return was the midpoint of the bid/ask spread at the close of business on the listing exchange of the Fund. Effective December 9, 2019, the closing price was used to calculate the market price return; however, any prices used in the calculation for market price return prior to December 9, 2019, would have used the midpoint of the bid/ask spread at the close of business on the exchange. |
| Per share amounts reflects a 1:2 reverse stock split that occurred on April 12, 2021. See Note 1. |
| Commencement of operations. |
| Since the shares of the Fund did not trade in the secondary market until the day after the Fund’s inception, for the period from the inception to the first day of secondary market trading, the net asset value is used as a proxy for the secondary market trading price to calculate the market returns. |
| Prior to November 1, 2019, the Fund may have waived fees if expenses exceeded the expense cap. On November 1, 2019, the Fund adopted a unitary fee structure where a management fee is accrued by the Fund based on prior day net assets and other expenses are paid by the Advisor. |
SEE NOTES TO FINANCIAL STATEMENTS.
| J.P. Morgan Exchange-Traded Funds | |
| |
| | | | | Ratios to average net assets (a) | |
Net asset
value,
end of
period | | | Market
price
total
return (c)(e) | | | Net
investment
income
(loss) | Expenses
without waivers
and reimbursements | Portfolio
turnover
rate (c) |
| | | | | | | | |
| | | | | | | | |
| | | | | | | | |
| | | | | | | | |
| | | | | | | | |
| | | | | | | | |
| | | | | | | | |
| | | | | | | | |
| | | | | | | | |
| | | | | | | | |
| | | | | | | | |
| | | | | | | | |
| | | | | | | | |
| | | | | | | | |
| | | | | | | | |
| | | | | | | | |
| | | | | | | | |
| | | | | | | | |
| | | | | | | | |
| | | | | | | | |
SEE NOTES TO FINANCIAL STATEMENTS.
| J.P. Morgan Exchange-Traded Funds | |
FINANCIAL HIGHLIGHTSFOR THE PERIODS INDICATED (continued)
| Per share operating performance |
| | | |
| Net asset
value,
beginning
of period | Net investment
income
(loss) (a) | Net realized
and unrealized
gains
(losses)
on investments | Total from
investment
operations | | | |
JPMorgan BetaBuilders USD High Yield Corporate Bond ETF | | | | | | | |
Year Ended February 29, 2024 | | | | | | | |
Year Ended February 28, 2023 | | | | | | | |
Year Ended February 28, 2022 | | | | | | | |
Year Ended February 28, 2021 | | | | | | | |
Year Ended February 29, 2020 | | | | | | | |
JPMorgan BetaBuilders USD Investment Grade Corporate Bond ETF | | | | | | | |
Year Ended February 29, 2024 | | | | | | | |
Year Ended February 28, 2023 | | | | | | | |
Year Ended February 28, 2022 | | | | | | | |
Year Ended February 28, 2021 | | | | | | | |
Year Ended February 29, 2020 | | | | | | | |
JPMorgan USD Emerging Markets Sovereign Bond ETF | | | | | | | |
Year Ended February 29, 2024 | | | | | | | |
Year Ended February 28, 2023 | | | | | | | |
Year Ended February 28, 2022 | | | | | | | |
Year Ended February 28, 2021 | | | | | | | |
Year Ended February 29, 2020 | | | | | | | |
|
| Calculated based upon average shares outstanding. |
| Includes adjustments in accordance with accounting principles generally accepted in the United States of America and as such, the net asset values for financial reporting purposes and the returns based upon those net asset values may differ from the net asset values and returns for shareholder transactions. |
| Prior to December 9, 2019, market price return was calculated assuming an initial investment made at the market price at the beginning of the reporting period, reinvestment of all dividends and distributions at market price during the period, and sale at the market price on the last day of the period. The price used to calculate the market price return was the midpoint of the bid/ask spread at the close of business on the listing exchange of the Fund. Effective December 9, 2019, the closing price was used to calculate the market price return; however, any prices used in the calculation for market price return prior to December 9, 2019, would have used the midpoint of the bid/ask spread at the close of business on the exchange. |
| Calculation of the net realized and unrealized gains (losses) per share does not correlate with the Fund’s net realized and unrealized gains (losses) presented in the Statements of Operations due to the timing of capital transactions in relation to the fluctuating market values of the Fund’s investments. |
| Prior to November 1, 2019, the Fund may have waived fees if expenses exceeded the expense cap. On November 1, 2019, the Fund adopted a unitary fee structure where a management fee is accrued by the Fund based on prior day net assets and other expenses are paid by the Advisor. |
SEE NOTES TO FINANCIAL STATEMENTS.
| J.P. Morgan Exchange-Traded Funds | |
| |
| | | | | Ratios to average net assets | |
Net asset
value,
end of
period | | | Market
price
total
return (c) | | | Net
investment
income
(loss) | Expenses
without waivers
and reimbursements | |
| | | | | | | | |
| | | | | | | | |
| | | | | | | | |
| | | | | | | | |
| | | | | | | | |
| | | | | | | | |
| | | | | | | | |
| | | | | | | | |
| | | | | | | | |
| | | | | | | | |
| | | | | | | | |
| | | | | | | | |
| | | | | | | | |
| | | | | | | | |
| | | | | | | | |
| | | | | | | | |
| | | | | | | | |
| | | | | | | | |
SEE NOTES TO FINANCIAL STATEMENTS.
| J.P. Morgan Exchange-Traded Funds | |
NOTES TO FINANCIAL STATEMENTSAS OF February 29, 2024
1. Organization
J.P. Morgan Exchange-Traded Fund Trust (the “Trust”) was formed on February 25, 2010, and is governed by a Declaration of Trust as amended and restated February 19, 2014, and is registered under the Investment Company Act of 1940, as amended (the “1940 Act”), as an open-end management investment company.
The following are 9 separate funds of the Trust (each, a "Fund" and collectively, the "Funds") covered by this report:
| Diversification Classification |
JPMorgan BetaBuilders 1-5 Year U.S. Aggregate Bond ETF | |
JPMorgan BetaBuilders U.S. Aggregate Bond ETF | |
JPMorgan BetaBuilders U.S. TIPS 0-5 Year ETF(1) | |
JPMorgan BetaBuilders U.S. Treasury Bond 1-3 Year ETF(2) | |
JPMorgan BetaBuilders U.S. Treasury Bond 20+ Year ETF(2) | |
JPMorgan BetaBuilders U.S. Treasury Bond 3-10 Year ETF(2) | |
JPMorgan BetaBuilders USD High Yield Corporate Bond ETF | |
JPMorgan BetaBuilders USD Investment Grade Corporate Bond ETF | |
JPMorgan USD Emerging Markets Sovereign Bond ETF | |
|
| Commencement of operations was May 10, 2023. |
| Commencement of operations was April 19, 2023. |
The investment objective of JPMorgan BetaBuilders 1-5 Year U.S. Aggregate Bond ETF (“BetaBuilders 1-5 Year U.S. Aggregate Bond ETF”) is to seek investment results that closely correspond, before fees and expenses, to the performance of the Bloomberg Short-Term U.S. Aggregate Bond Index.
The investment objective of JPMorgan BetaBuilders U.S. Aggregate Bond ETF (“BetaBuilders U.S. Aggregate Bond ETF”) is to seek investment results that closely correspond, before fees and expenses, to the performance of the Bloomberg U.S. Aggregate Index.
The investment objective of JPMorgan BetaBuilders U.S. TIPS 0-5 Year ETF (“BetaBuilders U.S. TIPS 0-5 Year ETF”) is to seek investment results that closely correspond, before fees and expenses, to the performance of the ICE 0-5 Year U.S. Inflation-Linked Treasury Index.
The investment objective of JPMorgan BetaBuilders U.S. Treasury Bond 1-3 Year ETF (“BetaBuilders U.S. Treasury Bond 1-3 Year ETF”) is to seek investment results that closely correspond, before fees and expenses, to the performance of the ICE U.S. Treasury 1-3 Year Bond Index.
The investment objective of JPMorgan BetaBuilders U.S. Treasury Bond 20+ Year ETF (“BetaBuilders U.S. Treasury Bond 20+ Year ETF”) is to seek investment results that closely correspond, before fees and expenses, to the performance of the ICE U.S. Treasury 20+ Year Bond Index.
The investment objective of JPMorgan BetaBuilders U.S. Treasury Bond 3-10 Year ETF (“BetaBuilders U.S. Treasury Bond 3-10 Year ETF”) is to seek investment results that closely correspond, before fees and expenses, to the performance of the ICE U.S. Treasury 3-10 Year Bond Index.
The investment objective of JPMorgan BetaBuilders USD High Yield Corporate Bond ETF (“BetaBuilders USD High Yield Corporate Bond ETF”) is to seek investment results that closely correspond, before fees and expenses, to the performance of the ICE BofA US High Yield Total Return Index.
The investment objective of JPMorgan BetaBuilders USD Investment Grade Corporate Bond ETF (“BetaBuilders USD Investment Grade Corporate Bond ETF”) is to seek investment results that closely correspond, before fees and expenses, to the performance of the Bloomberg U.S. Corporate Index.
The investment objective of JPMorgan USD Emerging Markets Sovereign Bond ETF (“USD Emerging Markets Sovereign Bond ETF”) is to seek investment results that closely correspond, before fees and expenses, to the performance of the JPMorgan Emerging Markets Risk-Aware Bond Index.
J.P. Morgan Investment Management Inc. (“JPMIM”), an indirect, wholly-owned subsidiary of JPMorgan Chase & Co. (“JPMorgan”), acts as adviser (the “Adviser”) and administrator (the “Administrator”) to the Funds.
| J.P. Morgan Exchange-Traded Funds | |
Shares of each Fund are listed and traded at market price on an exchange as follows:
| |
BetaBuilders 1-5 Year U.S. Aggregate Bond ETF | |
BetaBuilders U.S. Aggregate Bond ETF | |
BetaBuilders U.S. TIPS 0-5 Year ETF | |
BetaBuilders U.S. Treasury Bond 1-3 Year ETF | |
BetaBuilders U.S. Treasury Bond 20+ Year ETF | |
BetaBuilders U.S. Treasury Bond 3-10 Year ETF | |
BetaBuilders USD High Yield Corporate Bond ETF | |
BetaBuilders USD Investment Grade Corporate Bond ETF | |
USD Emerging Markets Sovereign Bond ETF | |
Market prices for the Funds’ shares may be different from their net asset value (“NAV”).
The Funds issue and redeem their shares on a continuous basis, through JPMorgan Distribution Services, Inc. (the “Distributor” or “JPMDS”), an indirect, wholly-owned subsidiary of JPMorgan, at NAV in large blocks of shares, referred to as “Creation Units”. Creation Units are issued and redeemed in exchange for a basket of securities and/or cash. Shares are generally traded in the secondary market in amounts less than a Creation Unit at market prices that change throughout the day. Only individuals or institutions that have entered into an authorized participant agreement with the Distributor may do business directly with the Funds (each, an “Authorized Participant”).
2. Significant Accounting Policies
The following is a summary of significant accounting policies followed by the Funds in the preparation of their financial statements. The Funds are investment companies and, accordingly, follow the investment company accounting and reporting guidance of the Financial Accounting Standards Board (“FASB”) Accounting Standards Codification Topic 946 — Investment Companies, which is part of U.S. generally accepted accounting principles (“GAAP”). The preparation of financial statements in conformity with GAAP requires management to make estimates and assumptions that affect (i) the reported amounts of assets and liabilities, (ii) disclosure of contingent assets and liabilities at the date of the financial statements, and (iii) the reported amounts of increases and decreases in net assets from operations during the reporting period. Actual results could differ from those estimates.
A. Valuation of Investments— Investments are valued in accordance with GAAP and the Funds' valuation policies set forth by, and under the supervision and responsibility of, the Board of Trustees of the Trust (the "Board"), which established the following approach to valuation, as described more fully below: (i) investments for which market quotations are readily available shall be valued at their market value and (ii) all other investments for which market quotations are not readily available shall be valued at their fair value as determined in good faith by the Board.
Under Section 2(a)(41) of the 1940 Act, the Board is required to determine fair value for securities that do not have readily available market quotations. Under SEC Rule 2a-5 (Good Faith Determinations of Fair Value), the Board may designate the performance of these fair valuation determinations to a valuation designee. The Board has designated the Adviser as the “Valuation Designee” to perform fair valuation determinations for the Funds on behalf of the Board subject to appropriate oversight by the Board. The Adviser, as Valuation Designee, leverages the J.P. Morgan Asset Management Americas Valuation Committee (“AVC”) to help oversee and carry out the policies for the valuation of investments held in the Funds. The Adviser, as Valuation Designee, remains responsible for the valuation determinations.
This oversight by the AVC includes monitoring the appropriateness of fair values based on results of ongoing valuation oversight including, but not limited to, consideration of macro or security specific events, market events, and pricing vendor and broker due diligence. The Administrator is responsible for discussing and assessing the potential impacts to the fair values on an ongoing basis, and, at least on a quarterly basis, with the AVC and the Board.
A market-based approach is primarily used to value the Funds' investments. Investments for which market quotations are not readily available are fair valued using prices supplied by approved affiliated and/or unaffiliated pricing vendors or third party broker-dealers (collectively referred to as “Pricing Services”) or may be internally fair valued using methods set forth by the valuation policies approved by the Board. This may include the use of related or comparable assets or liabilities, recent transactions, market multiples, book values and other relevant information for the investment. An income-based valuation approach may be used in which the anticipated future cash flows of the investment are discounted to calculate the fair value. Discounts may also be applied due to the nature or duration of any restrictions on the disposition of the investments. Valuations may be based upon current market prices of securities that are comparable in coupon, rating, maturity and industry. It is possible that the estimated values may differ significantly from the values that would have been used had a ready market for the investments existed, and such differences could be material.
Fixed income instruments are valued based on prices received from Pricing Services. The Pricing Services use multiple valuation techniques to determine the valuation of fixed income instruments. In instances where sufficient market activity exists, the Pricing Services may utilize a market-based approach through which trades or quotes from market makers are used to determine the valuation of these instruments. In instances where
| J.P. Morgan Exchange-Traded Funds | |
NOTES TO FINANCIAL STATEMENTSAS OF February 29, 2024 (continued)
sufficient market activity may not exist, the Pricing Services also utilize proprietary valuation models which may consider market transactions in comparable securities and the various relationships between securities in determining fair value and/or market characteristics in order to estimate the relevant cash flows, which are then discounted to calculate the fair values.
Equities and other exchange-traded instruments are valued at the last sale price or official market closing price on the primary exchange on which the instrument is traded before the NAV of the Funds are calculated on a valuation date.
Investments in open-end investment companies (“Underlying Funds”) are valued at each Underlying Fund’s NAV per share as of the report date.
Valuations reflected in this report are as of the report date. As a result, changes in valuation due to market events and/or issuer-related events after the report date and prior to issuance of the report are not reflected herein.
The various inputs that are used in determining the valuation of the Funds' investments are summarized into the three broad levels listed below.
•
Level 1 — Unadjusted inputs using quoted prices in active markets for identical investments.
•
Level 2 — Other significant observable inputs including, but not limited to, quoted prices for similar investments, inputs other than quoted prices that are observable for investments (such as interest rates, prepayment speeds, credit risk, etc.) or other market corroborated inputs.
•
Level 3 — Significant inputs based on the best information available in the circumstances, to the extent observable inputs are not available (including the Funds' assumptions in determining the fair value of investments).
A financial instrument’s level within the fair value hierarchy is based on the lowest level of any input, both individually and in the aggregate, that is significant to the fair value measurement. The inputs or methodology used for valuing instruments are not necessarily an indication of the risk associated with investing in those instruments.
The following tables represent each valuation input as presented on the Schedules of Portfolio Investments ("SOIs"):
BetaBuilders 1-5 Year U.S. Aggregate Bond ETF | | | | |
| | Level 2
Other significant
observable inputs | Level 3
Significant
unobservable inputs | |
Investments in Securities | | | | |
| | | | |
Commercial Mortgage-Backed Securities | | | | |
| | | | |
Foreign Government Securities | | | | |
Mortgage-Backed Securities | | | | |
| | | | |
| | | | |
U.S. Government Agency Securities | | | | |
U.S. Treasury Obligations | | | | |
| | | | |
| | | | |
Total Investments in Securities | | | | |
BetaBuilders U.S. Aggregate Bond ETF | | | | |
| | Level 2
Other significant
observable inputs | Level 3
Significant
unobservable inputs | |
Investments in Securities | | | | |
| | | | |
Commercial Mortgage-Backed Securities | | | | |
| | | | |
Foreign Government Securities | | | | |
Mortgage-Backed Securities | | | | |
| | | | |
| | | | |
U.S. Government Agency Securities | | | | |
U.S. Treasury Obligations | | | | |
| J.P. Morgan Exchange-Traded Funds | |
BetaBuilders U.S. Aggregate Bond ETF (continued) | | | | |
| | Level 2 Other significant observable inputs | Level 3 Significant unobservable inputs | |
| | | | |
| | | | |
Investment of Cash Collateral from Securities Loaned | | | | |
Total Short-Term Investments | | | | |
Total Investments in Securities | | | | |
BetaBuilders U.S. TIPS 0-5 Year ETF | | | | |
| | Level 2
Other significant
observable inputs | Level 3
Significant
unobservable inputs | |
Investments in Securities | | | | |
U.S. Treasury Obligations | | | | |
| | | | |
| | | | |
Total Investments in Securities | | | | |
BetaBuilders U.S. Treasury Bond 1-3 Year ETF | | | | |
| | Level 2
Other significant
observable inputs | Level 3
Significant
unobservable inputs | |
Investments in Securities | | | | |
U.S. Treasury Obligations | | | | |
| | | | |
| | | | |
Total Investments in Securities | | | | |
BetaBuilders U.S. Treasury Bond 20+ Year ETF | | | | |
| | Level 2
Other significant
observable inputs | Level 3
Significant
unobservable inputs | |
Investments in Securities | | | | |
U.S. Treasury Obligations | | | | |
| | | | |
| | | | |
Total Investments in Securities | | | | |
BetaBuilders U.S. Treasury Bond 3-10 Year ETF | | | | |
| | Level 2
Other significant
observable inputs | Level 3
Significant
unobservable inputs | |
Investments in Securities | | | | |
U.S. Treasury Obligations | | | | |
| | | | |
| | | | |
Total Investments in Securities | | | | |
| J.P. Morgan Exchange-Traded Funds | |
NOTES TO FINANCIAL STATEMENTSAS OF February 29, 2024 (continued)
BetaBuilders USD High Yield Corporate Bond ETF | | | | |
| | Level 2
Other significant
observable inputs | Level 3
Significant
unobservable inputs | |
Investments in Securities | | | | |
| | | | |
| | | | |
| | | | |
| | | | |
Total Investments in Securities | | | | |
There were no significant transfers into or out of level 3 for the year ended February 29, 2024.
BetaBuilders USD Investment Grade Corporate Bond ETF | | | | |
| | Level 2
Other significant
observable inputs | Level 3
Significant
unobservable inputs | |
Investments in Securities | | | | |
| | | | |
| | | | |
| | | | |
Total Investments in Securities | | | | |
USD Emerging Markets Sovereign Bond ETF | | | | |
| | Level 2
Other significant
observable inputs | Level 3
Significant
unobservable inputs | |
Investments in Securities | | | | |
| | | | |
Foreign Government Securities | | | | |
| | | | |
| | | | |
Investment of Cash Collateral from Securities Loaned | | | | |
Total Short-Term Investments | | | | |
Total Investments in Securities | | | | |
B. Restricted Securities— Certain securities held by the Funds may be subject to legal or contractual restrictions on resale. Restricted securities generally are resold in transactions exempt from registration under the Securities Act of 1933, as amended (the “Securities Act”). Disposal of these securities may involve time-consuming negotiations and expense. Prompt sale at the current valuation may be difficult and could adversely affect the NAVs of the Funds.
As of February 29, 2024, the Funds had no investments in restricted securities other than securities sold to the Funds under Rule 144A and/or Regulation S under the Securities Act.
| J.P. Morgan Exchange-Traded Funds | |
C. When-Issued Securities, Delayed Delivery Securities and Forward Commitments— BetaBuilders 1-5 Year U.S. Aggregate Bond ETF and BetaBuilders U.S. Aggregate Bond ETF purchased when-issued securities, including To-Be-Announced (“TBA”) securities, and entered into contracts to purchase or sell securities for a fixed price that may be settled a month or more after the trade date, or purchased delayed delivery securities which generally settle seven days after the trade date. When-issued securities are securities that have been authorized, but not issued in the market. A forward commitment involves entering into a contract to purchase or sell securities for a fixed price at a future date that may be settled a month or more after the trade date. A delayed delivery security is agreed upon in advance between the buyer and the seller of the security and is generally delivered beyond seven days of the agreed upon date. The purchase of securities on a when-issued, delayed delivery or forward commitment basis involves the risk that the value of the security to be purchased declines before the settlement date. The sale of securities on a forward commitment basis involves the risk that the value of the securities sold may increase before the settlement date. The Funds may be exposed to credit risk if the counterparty fails to perform under the terms of the transaction. Interest income for securities purchased on a when-issued, delayed delivery or forward commitment basis is not accrued until the settlement date.
BetaBuilders 1-5 Year U.S. Aggregate Bond ETF and BetaBuilders U.S. Aggregate Bond ETF had when-issued securities, delayed delivery securities or forward commitments outstanding as of February 29, 2024, which are shown as a Receivable for Investment securities sold — delayed delivery securities and/or a Payable for Investment securities purchased — delayed delivery securities, respectively, on the Statements of Assets and Liabilities. The values of these securities held at February 29, 2024 are detailed on the SOIs, if any.
D. Securities Lending — The Funds are authorized to engage in securities lending in order to generate additional income. The Funds are able to lend to approved borrowers. Citibank N.A. (“Citibank”) serves as lending agent for the Funds, pursuant to a Securities Lending Agency Agreement (the “Securities Lending Agency Agreement”). Securities loaned are collateralized by cash equal to at least 100% of the market value plus accrued interest on the securities lent, which is invested in the Class IM Shares of the JPMorgan U.S. Government Money Market Fund and the Agency SL Class Shares of the JPMorgan Securities Lending Money Market Fund. The Funds retain the interest earned on cash collateral investments but are required to pay the borrower a rebate for the use of the cash collateral. In cases where the lent security is of high value to borrowers, there may be a negative rebate (i.e., a net payment from the borrower to the Funds). Upon termination of a loan, the Funds are required to return to the borrower an amount equal to the cash collateral, plus any rebate owed to the borrowers. The remaining maturities of the securities lending transactions are considered overnight and continuous. Loans are subject to termination by the Funds or the borrower at any time.
The net income earned on the securities lending (after payment of rebates and Citibank’s fee) is included on the Statements of Operations as Income from securities lending (net). The Funds also receive payments from the borrower during the period of the loan, equivalent to dividends and interest earned on the securities loaned, which are recorded as Dividend or Interest income, respectively, on the Statements of Operations.
Under the Securities Lending Agency Agreement, Citibank marks to market the loaned securities on a daily basis. In the event the cash received from the borrower is less than 102% of the value of the loaned securities (105% for loans of non-U.S. securities), Citibank requests additional cash from the borrower so as to maintain a collateralization level of at least 102% of the value of the loaned securities plus accrued interest (105% for loans of non-U.S. securities), subject to certain de minimis amounts.
The value of securities out on loan is recorded as an asset on the Statements of Assets and Liabilities. The value of the cash collateral received is recorded as a liability on the Statements of Assets and Liabilities and details of collateral investments are disclosed on the SOIs.
The Funds bear the risk of loss associated with the collateral investments and are not entitled to additional collateral from the borrower to cover any such losses. To the extent that the value of the collateral investments declines below the amount owed to a borrower, the Funds may incur losses that exceed the amount they earned on lending the security. Upon termination of a loan, the Funds may use leverage (borrow money) to repay the borrower for cash collateral posted if the Adviser does not believe that it is prudent to sell the collateral investments to fund the payment of this liability. Securities lending activity is subject to master netting arrangements.
The following table presents for each lending Fund, the value of the securities on loan with Citibank, net of amounts available for offset under the master netting arrangements and any related collateral received or posted by the Funds as of February 29, 2024.
| Investment Securities
on Loan, at value,
Presented on the
Statements of Assets
and Liabilities | Cash Collateral
Posted by Borrower* | Net Amount Due
to Counterparty
(not less than zero) |
BetaBuilders U.S. Aggregate Bond ETF | | | |
USD Emerging Markets Sovereign Bond ETF | | | |
|
| Collateral posted reflects the value of securities on loan and does not include any additional amounts received from the borrower. |
Securities lending also involves counterparty risks, including the risk that the loaned securities may not be returned in a timely manner or at all. Subject to certain conditions, Citibank has agreed to indemnify the Funds from losses resulting from a borrower’s failure to return a loaned security.
| J.P. Morgan Exchange-Traded Funds | |
NOTES TO FINANCIAL STATEMENTSAS OF February 29, 2024 (continued)
JPMIM voluntarily waived management fees charged to the Funds to reduce the impact of the cash collateral investment in the JPMorgan U.S. Government Money Market Fund from 0.13% to 0.06%. For the year ended February 29, 2024, JPMIM waived fees associated with the Funds' investment in the JPMorgan U.S. Government Money Market Fund as follows:
BetaBuilders U.S. Aggregate Bond ETF | |
USD Emerging Markets Sovereign Bond ETF | |
The above waiver is included in the determination of earnings on cash collateral investment and in the calculation of Citibank’s compensation and is included on the Statements of Operations as Income from securities lending (net).
BetaBuilders 1-5 Year U.S. Aggregate Bond ETF, BetaBuilders U.S. TIPS 0-5 Year ETF, BetaBuilders U.S. Treasury Bond 1-3 Year ETF, BetaBuilders U.S. Treasury Bond 20+ Year ETF, BetaBuilders U.S. Treasury Bond 3-10 Year ETF, BetaBuilders USD High Yield Corporate Bond ETF and BetaBuilders USD Investment Grade Corporate Bond ETF did not lend out any securities during the year ended February 29, 2024.
E. Investment Transactions with Affiliates— The Funds invested in Underlying Funds advised by the Adviser. An issuer which is under common control with a Fund may be considered an affiliate. For the purposes of the financial statements, the Funds assume the issuers listed in the tables below to be affiliated issuers. The Underlying Funds’ distributions may be reinvested into such Underlying Funds Reinvestment amounts are included in the purchases at cost amounts in the tables below.
BetaBuilders 1-5 Year U.S. Aggregate Bond ETF |
For the year ended February 29, 2024 |
| | | | | Change in
Unrealized
Appreciation/
(Depreciation) | | Shares at
February 29,
2024 | | Capital Gain
Distributions |
JPMorgan U.S. Government Money Market Fund Class IM Shares, 5.25% (a) (b) | | | | | | | | | |
|
| Investment in an affiliated fund, which is registered under the Investment Company Act of 1940, as amended, and is advised by J.P. Morgan Investment Management Inc. |
| The rate shown is the current yield as of February 29, 2024. |
BetaBuilders U.S. Aggregate Bond ETF |
For the year ended February 29, 2024 |
| | | | | Change in
Unrealized
Appreciation/
(Depreciation) | | Shares at
February 29,
2024 | | Capital Gain
Distributions |
JPMorgan Securities Lending Money Market Fund Agency SL Class Shares, 5.48% (a) (b) | | | | | | | | | |
JPMorgan U.S. Government Money Market Fund Class IM Shares, 5.25% (a) (b) | | | | | | | | | |
JPMorgan U.S. Government Money Market Fund Class IM Shares, 5.25% (a) (b) | | | | | | | | | |
| | | | | | | | | |
|
| Investment in an affiliated fund, which is registered under the Investment Company Act of 1940, as amended, and is advised by J.P. Morgan Investment Management Inc. |
| The rate shown is the current yield as of February 29, 2024. |
| Amount is included on the Statements of Operations as Income from securities lending (net) (after payments of rebates and Citibank’s fee). |
| J.P. Morgan Exchange-Traded Funds | |
BetaBuilders U.S. TIPS 0-5 Year ETF |
For the period ended February 29, 2024 |
| | | | | Change in
Unrealized
Appreciation/
(Depreciation) | | Shares at
February 29,
2024 | | Capital Gain
Distributions |
JPMorgan Prime Money Market Fund Class IM Shares, 5.44% (b) (c) | | | | | | | | | |
|
| Commencement of operations was May 10, 2023. |
| Investment in an affiliated fund, which is registered under the Investment Company Act of 1940, as amended, and is advised by J.P. Morgan Investment Management Inc. |
| The rate shown is the current yield as of February 29, 2024. |
BetaBuilders U.S. Treasury Bond 1-3 Year ETF |
For the period ended February 29, 2024 |
| | | | | Change in
Unrealized
Appreciation/
(Depreciation) | | Shares at
February 29,
2024 | | Capital Gain
Distributions |
JPMorgan Prime Money Market Fund Class IM Shares, 5.44% (b) (c) | | | | | | | | | |
|
| Commencement of operations was April 19, 2023. |
| Investment in an affiliated fund, which is registered under the Investment Company Act of 1940, as amended, and is advised by J.P. Morgan Investment Management Inc. |
| The rate shown is the current yield as of February 29, 2024. |
BetaBuilders U.S. Treasury Bond 20+ Year ETF |
For the period ended February 29, 2024 |
| | | | | Change in
Unrealized
Appreciation/
(Depreciation) | | Shares at
February 29,
2024 | | Capital Gain
Distributions |
JPMorgan Prime Money Market Fund Class IM Shares, 5.44% (b) (c) | | | | | | | | | |
|
| Commencement of operations was April 19, 2023. |
| Investment in an affiliated fund, which is registered under the Investment Company Act of 1940, as amended, and is advised by J.P. Morgan Investment Management Inc. |
| The rate shown is the current yield as of February 29, 2024. |
BetaBuilders U.S. Treasury Bond 3-10 Year ETF |
For the period ended February 29, 2024 |
| | | | | Change in
Unrealized
Appreciation/
(Depreciation) | | Shares at
February 29,
2024 | | Capital Gain
Distributions |
JPMorgan Prime Money Market Fund Class IM Shares, 5.44% (b) (c) | | | | | | | | | |
|
| Commencement of operations was April 19, 2023. |
| Investment in an affiliated fund, which is registered under the Investment Company Act of 1940, as amended, and is advised by J.P. Morgan Investment Management Inc. |
| The rate shown is the current yield as of February 29, 2024. |
| J.P. Morgan Exchange-Traded Funds | |
NOTES TO FINANCIAL STATEMENTSAS OF February 29, 2024 (continued)
BetaBuilders USD High Yield Corporate Bond ETF |
For the year ended February 29, 2024 |
| | | | | Change in
Unrealized
Appreciation/
(Depreciation) | | Shares at
February 29,
2024 | | Capital Gain
Distributions |
JPMorgan U.S. Government Money Market Fund Class IM Shares, 5.25% (a) (b) | | | | | | | | | |
|
| Investment in an affiliated fund, which is registered under the Investment Company Act of 1940, as amended, and is advised by J.P. Morgan Investment Management Inc. |
| The rate shown is the current yield as of February 29, 2024. |
BetaBuilders USD Investment Grade Corporate Bond ETF |
For the year ended February 29, 2024 |
| | | | | Change in
Unrealized
Appreciation/
(Depreciation) | | Shares at
February 29,
2024 | | Capital Gain
Distributions |
JPMorgan U.S. Government Money Market Fund Class IM Shares, 5.25% (a) (b) | | | | | | | | | |
|
| Investment in an affiliated fund, which is registered under the Investment Company Act of 1940, as amended, and is advised by J.P. Morgan Investment Management Inc. |
| The rate shown is the current yield as of February 29, 2024. |
USD Emerging Markets Sovereign Bond ETF |
For the year ended February 29, 2024 |
| | | | | Change in
Unrealized
Appreciation/
(Depreciation) | | Shares at
February 29,
2024 | | Capital Gain
Distributions |
JPMorgan Securities Lending Money Market Fund Agency SL Class Shares, 5.48% (a) (b) | | | | | | | | | |
JPMorgan U.S. Government Money Market Fund Class IM Shares, 5.25% (a) (b) | | | | | | | | | |
JPMorgan U.S. Government Money Market Fund Class IM Shares, 5.25% (a) (b) | | | | | | | | | |
| | | | | | | | | |
|
| Investment in an affiliated fund, which is registered under the Investment Company Act of 1940, as amended, and is advised by J.P. Morgan Investment Management Inc. |
| The rate shown is the current yield as of February 29, 2024. |
| Amount is included on the Statements of Operations as Income from securities lending (net) (after payments of rebates and Citibank’s fee). |
F. Foreign Currency Translation — The books and records of the Funds are maintained in U.S. dollars. Foreign currency amounts are translated into U.S. dollars at the prevailing exchange rates of such currencies against the U.S. dollar. The market value of investment securities and other assets and liabilities are translated at the exchange rate as of the valuation date. Purchases and sales of investment securities, income and expenses are translated at the exchange rate prevailing on the respective dates of such transactions.
The Funds do not isolate the effect of changes in foreign exchange rates from changes in market prices on securities held. Accordingly, such changes are included within Change in net unrealized appreciation/depreciation on investments in non-affiliates on the Statements of Operations.
| J.P. Morgan Exchange-Traded Funds | |
Reported realized foreign currency gains and losses arise from the disposition of foreign currency, currency gains or losses realized between the trade and settlement dates on securities transactions, and the difference between the amounts of dividends, interest and foreign withholding taxes recorded on each Fund's books on the transaction date and the U.S. dollar equivalent of the amounts actually received or paid. These reported realized foreign currency gains and losses are included in Net realized gain (loss) on foreign currency transactions on the Statements of Operations. Unrealized foreign currency gains and losses arise from changes (due to changes in exchange rates) in the value of foreign currency and other assets and liabilities denominated in foreign currencies, which are held at year end and are included in Change in net unrealized appreciation/depreciation on foreign currency translations on the Statements of Operations.
G. Security Transactions and Investment Income— Investment transactions are accounted for on the trade date (the date the order to buy or sell is executed). Securities gains and losses are calculated on a specifically identified cost basis.
Interest income is determined on the basis of coupon interest accrued using the effective interest method, which adjusts for amortization of premiums and accretion of discounts.
Dividend income, net of foreign taxes withheld, if any, and distributions of net investment income and realized capital gains from the Underlying Funds, if any, are recorded on the ex-dividend date or when a Fund first learns of the dividend.
To the extent such information is publicly available, the Funds record distributions received in excess of income earned from underlying investments as a reduction of cost of investments and/or realized gain. Such amounts are based on estimates if actual amounts are not available and actual amounts of income, realized gain and return of capital may differ from the estimated amounts. The Funds adjust the estimated amounts of the components of distributions (and consequently their net investment income) as necessary, once the issuers provide information about the actual composition of the distributions.
H. Federal Income Taxes— Each Fund is treated as a separate taxable entity for Federal income tax purposes. Each Fund's policy is to comply with the provisions of the Internal Revenue Code (the “Code”) applicable to regulated investment companies and to distribute to shareholders all of its distributable net investment income and net realized capital gains on investments. Accordingly, no provision for Federal income tax is necessary. Management has reviewed the Funds' tax positions for all open tax years and has determined that as of February 29, 2024, no liability for Federal income tax is required in the Funds' financial statements for net unrecognized tax benefits. However, management’s conclusions may be subject to future review based on changes in, or the interpretation of, the accounting standards or tax laws and regulations. Each Fund's Federal tax returns for the prior three fiscal years, or since inception if shorter, remain subject to examination by the Internal Revenue Service.
I. Foreign Taxes—The Funds may be subject to foreign taxes on income, gains on investments or currency purchases/repatriation, a portion of which may be recoverable. The Funds will accrue such taxes and recoveries as applicable, based upon their current interpretation of tax rules and regulations that exist in the markets in which they invest. When a capital gains tax is determined to apply, the Funds record an estimated deferred tax liability in an amount that would be payable if the securities were disposed of on the valuation date.
J. Distributions to Shareholders— Distributions from net investment income, if any, are generally declared and paid at least monthly. Net realized capital gains, if any, are distributed by each Fund at least annually. The amount of distributions from net investment income and net realized capital gains is determined in accordance with Federal income tax regulations, which may differ from GAAP. To the extent these “book/tax” differences are permanent in nature (i.e., that they result from other than timing of recognition — “temporary differences”), such amounts are reclassified within the capital accounts based on their Federal tax basis treatment.
The following amounts were reclassified within the capital accounts:
| | Accumulated
undistributed
(distributions in
excess of)
net investment
income | Accumulated
net realized
gains (losses) |
BetaBuilders 1-5 Year U.S. Aggregate Bond ETF | | | |
BetaBuilders U.S. Aggregate Bond ETF | | | |
BetaBuilders U.S. Treasury Bond 20+ Year ETF | | | |
BetaBuilders USD High Yield Corporate Bond ETF | | | |
BetaBuilders USD Investment Grade Corporate Bond ETF | | | |
USD Emerging Markets Sovereign Bond ETF | | | |
The reclassifications for the Funds relate primarily to redemptions in-kind and tax adjustments on certain investments.
| J.P. Morgan Exchange-Traded Funds | |
NOTES TO FINANCIAL STATEMENTSAS OF February 29, 2024 (continued)
3. Fees and Other Transactions with Affiliates
A. Management Fee—JPMIM manages the investments of each Fund pursuant to a Management Agreement. For such services, JPMIM is paid a fee which is accrued daily and paid no more frequently than monthly based on each Fund's respective average daily net assets at the following rate:
| |
BetaBuilders 1-5 Year U.S. Aggregate Bond ETF | |
BetaBuilders U.S. Aggregate Bond ETF | |
BetaBuilders U.S. TIPS 0-5 Year ETF | |
BetaBuilders U.S. Treasury Bond 1-3 Year ETF | |
BetaBuilders U.S. Treasury Bond 20+ Year ETF | |
BetaBuilders U.S. Treasury Bond 3-10 Year ETF | |
BetaBuilders USD High Yield Corporate Bond ETF | |
BetaBuilders USD Investment Grade Corporate Bond ETF | |
USD Emerging Markets Sovereign Bond ETF | |
Under each Management Agreement, JPMIM is responsible for substantially all expenses of each Fund, (including expenses of the Trust relating to each Fund), except for the management fees, payments under the Funds' 12b-1 plan (if any), interest expenses, dividend and interest expenses related to short sales, taxes, acquired fund fees and expenses (other than fees for funds advised by the Adviser and/or its affiliates), costs of holding shareholder meetings, and litigation and potential litigation and other extraordinary expenses not incurred in the ordinary course of each Fund’s business. Additionally, each Fund is responsible for its non-operating expenses, including brokerage commissions and fees and expenses associated with each Fund’s securities lending program, if applicable. For the avoidance of doubt, the Adviser’s payment of such expenses may be accomplished through a Fund’s payment of such expenses and a corresponding reduction in the fee payable to the Adviser, provided, however, that if the amount of expenses paid by a Fund exceeds the fee payable to the Adviser, the Adviser will reimburse that Fund for such amount.
B. Administration Fee— JPMIM provides administration services to the Funds. Pursuant to each Management Agreement, JPMIM is compensated as described in Note 3.A.
JPMorgan Chase Bank, N.A. (“JPMCB”), a wholly-owned subsidiary of JPMorgan, serves as the Funds' sub-administrator (the “Sub-administrator”). For its services as Sub-administrator, JPMCB receives a portion of the management fees payable to JPMIM.
C. Custodian, Accounting and Transfer Agent Fees— JPMCB provides custody, accounting and transfer agency services to the Funds. For performing these services, JPMIM pays JPMCB transaction and asset-based fees that vary according to the number of transactions and positions, plus out-of-pocket expenses.
Additionally, Authorized Participants generally pay transaction fees associated with the creation and redemption of Fund shares. These fees are paid to JPMIM to offset certain custodian charges that are covered by each Management Agreement.
Interest income earned on cash balances at the custodian, if any, is included in Interest income from affiliates on the Statements of Operations.
Interest expense paid to the custodian related to cash overdrafts, if any, is included in Interest expense to affiliates on the Statements of Operations.
D. Distribution Services— The Distributor or its agent distributes Creation Units for each Fund on an agency basis. The Distributor does not maintain a secondary market in shares of each Fund. JPMDS receives no fees for their distribution services under the distribution agreement with the Trust (the “Distribution Agreement”). Although the Trust does not pay any fees under the Distribution Agreement, JPMIM pays JPMDS for certain distribution related services.
E. Waivers and Reimbursements— The Funds may invest in one or more money market funds advised by the Adviser (affiliated money market funds). The fees for the affiliated money market funds, except for investments of securities lending cash collateral, are covered under each Management Agreement as described in Note 3.A.
F. Other — Certain officers of the Trust are affiliated with the Adviser, the Administrator and JPMDS. Such officers receive no compensation from the Funds for serving in their respective roles.
The Board designated and appointed a Chief Compliance Officer to the Funds pursuant to Rule 38a-1 under the 1940 Act. The fees associated with the office of the Chief Compliance Officer are paid for by JPMIM as described in Note 3.A.
The Securities and Exchange Commission (“SEC”) has granted an exemptive order permitting the Funds to engage in principal transactions with J.P. Morgan Securities LLC, an affiliated broker, involving taxable money market instruments, subject to certain conditions.
| J.P. Morgan Exchange-Traded Funds | |
4. Investment Transactions
During the year ended February 29, 2024, purchases and sales of investments (excluding short-term investments) were as follows:
| Purchases
(excluding
U.S. Government) | Sales
(excluding
U.S. Government) | Purchases
of U.S.
Government | |
BetaBuilders 1-5 Year U.S. Aggregate Bond ETF | | | | |
BetaBuilders U.S. Aggregate Bond ETF | | | | |
BetaBuilders U.S. TIPS 0-5 Year ETF | | | | |
BetaBuilders U.S. Treasury Bond 1-3 Year ETF | | | | |
BetaBuilders U.S. Treasury Bond 20+ Year ETF | | | | |
BetaBuilders U.S. Treasury Bond 3-10 Year ETF | | | | |
BetaBuilders USD High Yield Corporate Bond ETF | | | | |
BetaBuilders USD Investment Grade Corporate Bond ETF | | | | |
USD Emerging Markets Sovereign Bond ETF | | | | |
For the year ended February 29, 2024, in-kind transactions associated with creations and redemptions were as follows:
| | |
BetaBuilders 1-5 Year U.S. Aggregate Bond ETF | | |
BetaBuilders U.S. Aggregate Bond ETF | | |
BetaBuilders U.S. Treasury Bond 20+ Year ETF | | |
BetaBuilders U.S. Treasury Bond 3-10 Year ETF | | |
BetaBuilders USD High Yield Corporate Bond ETF | | |
BetaBuilders USD Investment Grade Corporate Bond ETF | | |
USD Emerging Markets Sovereign Bond ETF | | |
During the year ended February 29, 2024, the Funds delivered portfolio securities for the redemption of Fund shares (in-kind redemptions). Cash and portfolio securities were transferred for redemptions at fair value. For financial reporting purposes, the Funds recorded net realized gains and losses in connection with each in-kind redemption transaction.
5. Federal Income Tax Matters
For Federal income tax purposes, the estimated cost and unrealized appreciation (depreciation) in value of investments held at February 29, 2024 were as follows:
| | Gross
Unrealized
Appreciation | Gross
Unrealized
Depreciation | Net Unrealized
Appreciation
(Depreciation) |
BetaBuilders 1-5 Year U.S. Aggregate Bond ETF | | | | |
BetaBuilders U.S. Aggregate Bond ETF | | | | |
BetaBuilders U.S. TIPS 0-5 Year ETF | | | | |
BetaBuilders U.S. Treasury Bond 1-3 Year ETF | | | | |
BetaBuilders U.S. Treasury Bond 20+ Year ETF | | | | |
BetaBuilders U.S. Treasury Bond 3-10 Year ETF | | | | |
BetaBuilders USD High Yield Corporate Bond ETF | | | | |
BetaBuilders USD Investment Grade Corporate Bond ETF | | | | |
USD Emerging Markets Sovereign Bond ETF | | | | |
The difference between book and tax basis appreciation (depreciation) on investments is primarily attributed to tax adjustments on certain investments and wash sale loss deferrals.
| J.P. Morgan Exchange-Traded Funds | |
NOTES TO FINANCIAL STATEMENTSAS OF February 29, 2024 (continued)
The tax character of distributions paid during the year ended February 29, 2024 was as follows:
| | | |
BetaBuilders 1-5 Year U.S. Aggregate Bond ETF | | | |
BetaBuilders U.S. Aggregate Bond ETF | | | |
BetaBuilders U.S. TIPS 0-5 Year ETF | | | |
BetaBuilders U.S. Treasury Bond 1-3 Year ETF | | | |
BetaBuilders U.S. Treasury Bond 20+ Year ETF | | | |
BetaBuilders U.S. Treasury Bond 3-10 Year ETF | | | |
BetaBuilders USD High Yield Corporate Bond ETF | | | |
BetaBuilders USD Investment Grade Corporate Bond ETF | | | |
USD Emerging Markets Sovereign Bond ETF | | | |
| | | |
|
| Short-term gain distributions are treated as ordinary income for income tax purposes. |
The tax character of distributions paid during the year ended February 28, 2023 was as follows:
| | |
BetaBuilders 1-5 Year U.S. Aggregate Bond ETF | | |
BetaBuilders U.S. Aggregate Bond ETF | | |
BetaBuilders USD High Yield Corporate Bond ETF | | |
BetaBuilders USD Investment Grade Corporate Bond ETF | | |
USD Emerging Markets Sovereign Bond ETF | | |
|
| Short-term gain distributions are treated as ordinary income for income tax purposes. |
As of February 29, 2024, the estimated components of net assets (excluding paid-in-capital) on a tax basis were as follows:
| Current
Distributable
Ordinary
Income | Current
Distributable
Long-Term
Capital Gain
(Tax Basis Capital
Loss Carryover) | Unrealized
Appreciation
(Depreciation) |
BetaBuilders 1-5 Year U.S. Aggregate Bond ETF | | | |
BetaBuilders U.S. Aggregate Bond ETF | | | |
BetaBuilders U.S. TIPS 0-5 Year ETF | | | |
BetaBuilders U.S. Treasury Bond 1-3 Year ETF | | | |
BetaBuilders U.S. Treasury Bond 20+ Year ETF | | | |
BetaBuilders U.S. Treasury Bond 3-10 Year ETF | | | |
BetaBuilders USD High Yield Corporate Bond ETF | | | |
BetaBuilders USD Investment Grade Corporate Bond ETF | | | |
USD Emerging Markets Sovereign Bond ETF | | | |
|
| Amount includes capital loss carryforwards which are limited in future years under Internal Revenue Code sections 381-384. |
The cumulative timing differences primarily consist of tax adjustments on certain investments, post-October capital loss deferrals, trustee deferred compensation and wash sale loss deferrals.
| J.P. Morgan Exchange-Traded Funds | |
At February 29, 2024, the following Funds had net capital loss carryforwards which are available to offset future realized gains as follows:
| Capital Loss Carryforward Character |
| | |
BetaBuilders 1-5 Year U.S. Aggregate Bond ETF | | |
BetaBuilders U.S. Aggregate Bond ETF | | |
BetaBuilders U.S. TIPS 0-5 Year ETF | | |
BetaBuilders U.S. Treasury Bond 1-3 Year ETF | | |
BetaBuilders U.S. Treasury Bond 20+ Year ETF | | |
BetaBuilders U.S. Treasury Bond 3-10 Year ETF | | |
BetaBuilders USD High Yield Corporate Bond ETF | | |
BetaBuilders USD Investment Grade Corporate Bond ETF | | |
USD Emerging Markets Sovereign Bond ETF | | |
|
| Amount includes capital loss carryforwards which are limited in future years under Internal Revenue Code sections 381-384. |
Net capital losses (gains) and specified ordinary losses incurred after October 31 and within the taxable year are deemed to arise on the first business day of the Funds' next taxable year. For the year ended February 29, 2024, the following Funds deferred to March 1, 2024 the following net capital losses (gains) and/or specified ordinary losses of:
| Net Capital Losses (Gains) | |
| | |
BetaBuilders 1-5 Year U.S. Aggregate Bond ETF | | | |
BetaBuilders U.S. Aggregate Bond ETF | | | |
BetaBuilders U.S. TIPS 0-5 Year ETF | | | |
BetaBuilders U.S. Treasury Bond 1-3 Year ETF | | | |
BetaBuilders U.S. Treasury Bond 20+ Year ETF | | | |
BetaBuilders U.S. Treasury Bond 3-10 Year ETF | | | |
BetaBuilders USD High Yield Corporate Bond ETF | | | |
BetaBuilders USD Investment Grade Corporate Bond ETF | | | |
USD Emerging Markets Sovereign Bond ETF | | | |
During the year ended February 29, 2024, the following Fund utilized capital loss carryforwards as follows:
| |
| |
BetaBuilders USD High Yield Corporate Bond ETF | |
For the year ended February 29, 2024, USD Emerging Markets Sovereign Bond ETF incurred an excise tax liability of $6,205 on undistributed net investment of income pertaining to calendar year 2022.
6. Capital Share Transactions
The Trust issues and redeems shares of the Funds only in Creation Units through the Distributor at NAV. Capital shares transactions detail can be found in the Statements of Changes in Net Assets.
Shares of the Funds may only be purchased or redeemed by Authorized Participants. Such Authorized Participants may from time to time hold, of record or beneficially, a substantial percentage of the Funds' shares outstanding and act as executing or clearing broker for investment transactions on behalf of the Funds. An Authorized Participant is either (1) a “Participating Party” or other participant in the clearing process through the Continuous Net Settlement System of the National Securities Clearing Corporation (“NSCC”); or (2) a DTC Participant; which, in either case, must have executed an agreement with the Distributor.
Creation Units of a Fund may be created in advance of receipt by the Trust of all or a portion of the applicable basket of fixed income securities and other instruments (“Deposit Instruments”) and cash as described in the Funds’ registration statement. In these instances, the initial Deposit Instruments and cash must be deposited in an amount equal to the sum of the cash amount, plus at least 105%, for the Funds, of the market value of
| J.P. Morgan Exchange-Traded Funds | |
NOTES TO FINANCIAL STATEMENTSAS OF February 29, 2024 (continued)
undelivered Deposit Instruments. A transaction fee may be imposed to offset transfer and other transaction costs associated with the purchase or redemption of Creation Units.
Authorized Participants transacting in Creation Units for cash may also pay a variable fee to compensate the relevant fund for market impact expenses relating to investing in portfolio securities. Such variable fees, if any, are included in “Proceeds from shares issued” in the Statements of Changes in Net Assets.
7. Borrowings
Effective November 1, 2022, the Funds rely upon an exemptive order granted by the SEC (the “Order”) permitting the establishment and operation of an Interfund Lending Facility (the “Facility”). The Facility allows the Funds to directly lend and borrow money to or from any other fund relying upon the Order at rates beneficial to both the borrowing and lending funds. Advances under the Facility are taken primarily for temporary or emergency purposes, including the meeting of redemption requests that otherwise might require the untimely disposition of securities, and are subject to each Fund's borrowing restrictions. The interfund loan rate is determined, as specified in the Order, by averaging the current repurchase agreement rate and the current bank loan rate. The Order was granted to JPMorgan Trust II and may be relied upon by the Funds because the Funds and the series of JPMorgan Trust II are all investment companies in the same “group of investment companies” (as defined in Section 12(d)(1)(G) of the 1940 Act).
The Funds had no borrowings outstanding from another fund, or loans outstanding to another fund, during the year ended February 29, 2024.
The Trust and JPMCB have entered into a financing arrangement. Under this arrangement, JPMCB provides an unsecured, uncommitted credit facility in the aggregate amount of $100 million to certain of the J.P. Morgan Funds, including the Funds. Advances under the arrangement are taken primarily for temporary or emergency purposes, including the meeting of redemption requests that otherwise might require the untimely disposition of securities, and are subject to each Fund's borrowing restrictions. Interest on borrowings is payable at a rate determined by JPMCB at the time of borrowing. This agreement has been extended until October 29, 2024.
The Funds had no borrowings outstanding from the unsecured, uncommitted credit facility during the year ended February 29, 2024.
Effective August 8, 2023, the Trust, along with certain other trusts for J.P. Morgan Funds (“Borrowers”), has entered into an existing joint syndicated senior unsecured revolving credit facility totaling $1.5 billion (“Credit Facility”) with various lenders and The Bank of New York Mellon, as administrative agent for the lenders. Although the Trust is effectively part of the Credit Facility as of August 8, 2023, it is not eligible to draw on the Credit Facility, and will not incur costs associated with being a part of the Credit Facility, until on or about May 28, 2024.
This Credit Facility provides a source of funds to the Borrowers for temporary and emergency purposes, including the meeting of redemption requests that otherwise might require the untimely disposition of securities. Under the terms of the Credit Facility, a borrowing fund must have a minimum of $25 million in adjusted net asset value and not exceed certain adjusted net asset coverage ratios prior to and during the time in which any borrowings are outstanding. If a fund does not comply with the aforementioned requirements, the fund must remediate within three business days with respect to the $25 million minimum adjusted net asset value or within one business day with respect to certain asset coverage ratios or the administrative agent at the request of, or with the consent of, the lenders may terminate the Credit Facility and declare any outstanding borrowings to be due and payable immediately.
Interest associated with any borrowing under the Credit Facility is charged to the borrowing fund at a rate of interest equal to 1.00% (the “Applicable Margin”), plus the greater of the federal funds effective rate or the one-month Adjusted Secured Overnight Financing Rate (“SOFR”). Effective August 8, 2023, the Credit Facility has been amended and restated for a term of 364 days, unless extended.
The Funds did not utilize the Credit Facility during the year ended February 29, 2024.
8. Risks, Concentrations and Indemnifications
In the normal course of business, the Funds enter into contracts that contain a variety of representations which provide general indemnifications. Each Fund's maximum exposure under these arrangements is unknown. The amount of exposure would depend on future claims that may be brought against each Fund. However, based on experience, the Funds expect the risk of loss to be remote.
As of February 29, 2024, JPMorgan SmartRetirement Funds and JPMorgan SmartRetirement Blend Funds, which are affiliated funds of funds, each owned in the aggregate, shares representing more than 10% of the net assets of the Funds as follows:
| JPMorgan
SmartRetirement
Funds | JPMorgan
SmartRetirement
Blend Funds |
BetaBuilders U.S. Aggregate Bond ETF | | |
BetaBuilders USD High Yield Corporate Bond ETF | | |
Significant shareholder transactions by these shareholders may impact the Funds' performance and liquidity.
| J.P. Morgan Exchange-Traded Funds | |
USD Emerging Markets Sovereign Bond ETF’s investments in sovereign and corporate debt obligations within emerging market countries may be subject to potentially higher risks than investments in more developed markets and the prices of such investments may be volatile. The yields of emerging market debt obligations reflect, among other things, perceived credit risk. The consequences of political, social or economic instability in these markets may have disruptive effects on the market prices of the Fund’s investments and the income they generate, as well as the Fund’s ability to repatriate such amounts.
BetaBuilders USD High Yield Corporate Bond ETF and USD Emerging Markets Sovereign Bond ETF invest in high yield securities that are not rated or rated below investment grade (commonly known as “junk bonds”). These securities are considered to be high risk investments. Investments in lower-rated securities or unrated securities of comparable quality tend to be more sensitive to economic conditions than higher rated securities. Junk bonds involve a greater risk of default by the issuer because such securities are generally unsecured and are often subordinated to other creditors’ claims. The market price of these securities can change suddenly and unexpectedly. As a result, the Funds are intended for investors who are able and willing to assume a high degree of risk.
The Funds are also subject to counterparty credit risk, which is the risk that a counterparty fails to perform on agreements with the Funds.
Disruptions to creations and redemptions, the existence of significant market volatility or potential lack of an active trading market for the shares (including through a trading halt), as well as other factors, may result in shares trading significantly above (at a premium) or below (at a discount) to the NAV or to the intraday value of the Funds’ holdings. During such periods, investors may incur significant losses if shares are sold.
The Funds are subject to interest rate risk. Investments in bonds and other debt securities will change in value based on changes in interest rates. If rates increase, the value of these investments generally declines. Securities with greater interest rate sensitivity and longer maturities generally are subject to greater fluctuations in value. The Funds invest in variable and floating rate loans and other variable and floating rate securities. Although these investments are generally less sensitive to interest rate changes than fixed rate instruments, the value of floating rate loans and other securities may decline if their interest rates do not rise as quickly, or as much, as general interest rates. The Funds may face a heightened level of interest rate risk due to certain changes in monetary policy. It is difficult to predict the pace at which central banks or monetary authorities may increase interest rates or the timing, frequency, or magnitude of such increases. Any such changes could be sudden and could expose debt markets to significant volatility and reduced liquidity for Fund investments.
The Funds are subject to credit risk. The Funds' investments are subject to the risk that an issuer and/or a counterparty will fail to make payments when due or default completely. Prices of the Funds' investments may be adversely affected if any of the issuers or counterparties it is invested in are subject to an actual or perceived deterioration in their credit quality. Credit spreads may increase, which may reduce the market values of the Funds' securities. Credit spread risk is the risk that economic and market conditions or any actual or perceived credit deterioration may lead to an increase in the credit spreads (i.e., the difference in yield between two securities of similar maturity but different credit quality) and a decline in price of the issuer’s securities.
The Funds may not track the return of their underlying index for a number of reasons and therefore may not achieve their investment objective. For example, the Funds incur a number of operating expenses not applicable to their underlying index, and incur costs in buying and selling securities, especially when rebalancing the Funds’ securities holdings to reflect changes in the composition of the underlying index. In addition, each Fund’s return may differ from the return of its underlying index as a result of, among other things, pricing differences and the inability to purchase certain securities included in the underlying index due to regulatory or other restrictions. To the extent of the previously outlined items, each Fund’s return may differ from the return of the underlying index.
The Funds invest in foreign issuers and foreign securities (including depositary receipts) that are subject to additional risks, including political and economic risks, civil conflicts and war, greater volatility, expropriation and nationalization risks, sanctions or other measures by the United States or other governments, currency fluctuations, higher transaction costs, delayed settlement, possible foreign controls on investment, liquidity risks and less stringent investor protection and disclosure standards of foreign markets. In certain markets where securities and other instruments are not traded “delivery versus payment,” a Fund may not receive timely payment for securities or other instruments it has delivered or receive delivery of securities paid for and may be subject to increased risk that the counterparty will fail to make payments or delivery when due or default completely.
Events and evolving conditions in certain economies or markets may alter the risks associated with investments tied to countries or regions that historically were perceived as comparatively stable becoming riskier and more volatile.
USD Emerging Markets Sovereign Bond ETF may have elements of risk not typically associated with investments in the United States of America due to concentrated investments in a limited number of foreign countries or regions, which may vary throughout the period. Such concentrations may subject this Fund to additional risks resulting from political or economic conditions in such countries or regions and the possible imposition of
adverse governmental laws or currency exchange restrictions could cause the securities and their markets to be less liquid and their prices to be more volatile than those of comparable U.S. securities.
BetaBuilders 1-5 Year U.S. Aggregate Bond ETF, BetaBuilders U.S. Aggregate Bond ETF and BetaBuilders USD Investment Grade Corporate Bond ETF invest in contingent convertible securities (“CoCos”) and are subject to additional risks from such investments. CoCos are hybrid debt securities that may be convertible into equity or may be written down if a pre-specified trigger event such as a decline in capital ratio below a prescribed threshold occurs. If such a trigger event occurs, the Funds may lose the principal amount invested on a permanent or temporary basis or the CoCo may be converted to equity. Even though the Funds do not invest in common stock as a principal investment strategy, the Funds will be subject to increased
| J.P. Morgan Exchange-Traded Funds | |
NOTES TO FINANCIAL STATEMENTSAS OF February 29, 2024 (continued)
equity market risk in the event that such securities are converted to equity. In addition to being subject to a possible write-down upon the occurrence of a trigger event, CoCos may also be subject to a permanent write-down or conversion into equity (in whole or in part), if the applicable bank regulator or other public administrative authority having responsibility for managing the orderly dissolution of an institution has determined that the issuer is not viable. Coupon payments on CoCos may be discretionary and may be cancelled by the issuer. Holders of CoCos may suffer a loss of capital when comparable equity holders do not. As CoCos may be perpetual or have long-dated maturities, they may face greater interest rate sensitivity and may be subject to greater fluctuations in value than securities with shorter maturity dates. Such securities also may be subject to prepayment risk due to optional or mandatory redemption provisions.
London Interbank Offered Rate ("LIBOR") was a leading floating rate benchmark used in loans, notes, derivatives and other instruments or investments. As a result of benchmark reforms, publication of most LIBOR settings has ceased. Some LIBOR settings continue to be published but only on a temporary, synthetic and non-representative basis. Regulated entities have generally ceased entering into new LIBOR contracts in connection with regulatory guidance or prohibitions. Public and private sector actors have worked to establish alternative reference rates to be used in place of LIBOR. There is no assurance that any such alternative reference rate will be similar to or produce the same value or economic equivalence as LIBOR or that it will have the same volume or liquidity as did LIBOR which may affect the value, volatility, liquidity or return on certain of the Funds' loans, notes, derivatives and other instruments or investments comprising some or all of the Funds' investments and result in costs incurred in connection with changing reference rates used for positions, closing out positions and entering into new trades. Certain of the Funds' investments may have transitioned from LIBOR or will transition from LIBOR in the future. The transition from LIBOR to alternative reference rates may result in operational issues for the Funds or their investments. No assurances can be given as to the impact of the LIBOR transition (and the timing of any such impact) on the Funds and their investments.
The Funds are subject to infectious disease epidemics/pandemics risk. For example, the outbreak of COVID-19 negatively affected economies, markets and individual companies throughout the world, including those in which the Funds invest. The effects of any future pandemic or other global event to business and market conditions may have a significant negative impact on the performance of a Fund's investments, increase a Fund's volatility, exacerbate other pre-existing political, social and economic risks to the Funds and negatively impact broad segments of businesses and populations. In addition, governments, their regulatory agencies, or self-regulatory organizations have taken or may take actions in response to a pandemic or other global event that affect the instruments in which the Funds invest, or the issuers of such instruments, in ways that could have a significant negative impact on a Fund’s investment performance. The ultimate impact of any pandemic or other global event and the extent to which the associated conditions and governmental responses impact a Fund will also depend on future developments, which are highly uncertain, difficult to accurately predict and subject to frequent changes.
9. Subsequent Events
Subsequent to February 29, 2024, BetaBuilders U.S. TIPS 0-5 Year ETF, BetaBuilders U.S. Treasury Bond 1 – 3 Year ETF, BetaBuilders U.S. Treasury Bond 20+ Year ETF, and BetaBuilders U.S. Treasury Bond 3 – 10 Year ETF had net redemptions of $6,651,620, $1,471,743, $6,858,071, and $4,380,334, respectively, which represented 87%, 33%, 22%, and 52%, respectively, of the Funds’ net assets as of February 29, 2024.
| J.P. Morgan Exchange-Traded Funds | |
REPORT OF INDEPENDENT REGISTERED PUBLIC ACCOUNTING FIRM
To the Board of Trustees of J.P. Morgan Exchange-Traded Fund Trust and Shareholders of each of the nine funds listed in the table below
Opinions on the Financial Statements
We have audited the accompanying statements of assets and liabilities, including the schedules of portfolio investments, of each of the funds listed in the table below (nine of the funds constituting J.P. Morgan Exchange-Traded Fund Trust, hereafter collectively referred to as the “Funds”) as of February 29, 2024, the related statements of operations and of changes in net assets for each of the periods indicated in the table below, including the related notes, and the financial highlights for each of the periods indicated therein (collectively referred to as the “financial statements”). In our opinion, the financial statements present fairly, in all material respects, the financial position of each of the Funds as of February 29, 2024, the results of each of their operations and the changes in each of their net assets for the periods indicated in the table below, and each of the financial highlights for each of the periods indicated therein, in conformity with accounting principles generally accepted in the United States of America.
Fund
JPMorgan BetaBuilders 1-5 Year U.S. Aggregate Bond ETF (1) |
JPMorgan BetaBuilders U.S. Aggregate Bond ETF (1) |
JPMorgan BetaBuilders U.S. TIPS 0-5 Year ETF (2) |
JPMorgan BetaBuilders U.S. Treasury Bond 1-3 Year ETF (3) |
JPMorgan BetaBuilders U.S. Treasury Bond 20+ Year ETF (3) |
JPMorgan BetaBuilders U.S. Treasury Bond 3-10 Year ETF (3) |
JPMorgan BetaBuilders USD High Yield Corporate Bond ETF (1) |
JPMorgan BetaBuilders USD Investment Grade Corporate Bond ETF (1) |
JPMorgan USD Emerging Markets Sovereign Bond ETF (1) |
| Statement of operations for the year ended February 29, 2024 and statement of changes in net assets for the years ended February 29, 2024 and February 28, 2023 |
| Statement of operations and statement of changes in net assets for the period May 10, 2023 (commencement of operations) through February 29, 2024 |
| Statement of operations and statement of changes in net assets for the period April 19, 2023 (commencement of operations) through February 29, 2024 |
Basis for Opinions
These financial statements are the responsibility of the Funds’ management. Our responsibility is to express an opinion on the Funds’ financial statements based on our audits. We are a public accounting firm registered with the Public Company Accounting Oversight Board (United States) (PCAOB) and are required to be independent with respect to the Funds in accordance with the U.S. federal securities laws and the applicable rules and regulations of the Securities and Exchange Commission and the PCAOB.
We conducted our audits of these financial statements in accordance with the standards of the PCAOB. Those standards require that we plan and perform the audit to obtain reasonable assurance about whether the financial statements are free of material misstatement, whether due to error or fraud.
Our audits included performing procedures to assess the risks of material misstatement of the financial statements, whether due to error or fraud, and performing procedures that respond to those risks. Such procedures included examining, on a test basis, evidence regarding the amounts and disclosures in the financial statements. Our audits also included evaluating the accounting principles used and significant estimates made by management, as well as evaluating the overall presentation of the financial statements. Our procedures included confirmation of securities owned as of February 29, 2024 by correspondence with the custodian, transfer agent, agent banks and brokers; when replies were not received from brokers, we performed other auditing procedures. We believe that our audits provide a reasonable basis for our opinions.
/s/ PricewaterhouseCoopers LLP
New York, New York
April 24, 2024
We have served as the auditor of one or more investment companies in the JPMorgan Funds complex since 1993.
The Funds' Statement of Additional Information includes additional information about the Funds' Trustees and is available, without charge, upon request by calling 1-844-457-6383 or on the J.P. Morgan Funds’ website at www.jpmorganfunds.com.
Name (Year of Birth);
Positions With
the Funds (1) | Principal Occupation
During Past 5 Years | Number of
Funds in Fund
Complex Overseen
by Trustee (2) | Other Directorships Held
During the Past 5 Years |
| |
John F. Finn (1947); Chair
since 2020; Trustee since 1998. | Chairman, Gardner, Inc. (supply chain management company serving industrial and consumer markets) (serving in various roles 1974-present). | | Director, Greif, Inc. (GEF) (industrial package products and services) (2007-2023); Trustee, Columbus Association for the Performing Arts (1988-present). |
Stephen P. Fisher (1959);
Trustee since 2018. | Retired; Chairman and Chief Executive Officer, NYLIFE Distributors LLC (registered broker-dealer) (serving in various roles 2008-2013); Chairman, NYLIM Service Company LLC (transfer agent) (2008-2017); New York Life Investment Management LLC (registered investment adviser) (serving in various roles 2005-2017); Chairman, IndexIQ Advisors LLC (registered investment adviser for ETFs) (2014-2017); President, MainStay VP Funds Trust (2007-2017), MainStay DefinedTerm Municipal Opportunities Fund (2011-2017) and MainStay Funds Trust (2007-2017) (registered investment companies). | | |
Gary L. French (1951);
Trustee since 2014. | Real Estate Investor (2011-2020); Investment management industry Consultant and Expert Witness (2011-present); Senior Consultant for The Regulatory Fundamentals Group LLC (2011-2017). | | Independent Trustee, The China Fund, Inc. (2013-2019); Exchange Traded Concepts Trust II (2012-2014); Exchange Traded Concepts Trust I (2011-2014). |
Kathleen M. Gallagher (1958);
Trustee since 2018. | Retired; Chief Investment Officer — Benefit Plans, Ford Motor Company (serving in various roles 1985-2016). | | Non- Executive Director, Legal & General Investment Management (Holdings) (2018-present); Non-Executive Director, Legal & General Investment Management America (U.S. Holdings) (financial services and insurance) (2017-present); Advisory Board Member, State Street Global Advisors Total Portfolio Solutions (2017-present); Member, Client Advisory Council, Financial Engines, LLC (registered investment adviser) (2011-2016); Director, Ford Pension Funds Investment Management Ltd. (2007-2016). |
Robert J. Grassi (1957);
Trustee since 2014. | Sole Proprietor, Academy Hills Advisors LLC (2012-present); Pension Director, Corning Incorporated (2002-2012). | | |
| J.P. Morgan Exchange-Traded Funds | |
Name (Year of Birth); Positions With the Funds (1) | Principal Occupation During Past 5 Years | Number of Funds in Fund Complex Overseen by Trustee (2) | Other Directorships Held During the Past 5 Years |
Independent Trustees (continued) | |
Frankie D. Hughes (1952);
Trustee since 2008. | President, Ashland Hughes Properties (property management) (2014-present); President and Chief Investment Officer, Hughes Capital Management, Inc. (fixed income asset management) (1993-2014). | | |
Raymond Kanner (1953);
Trustee since 2017. | Retired; Managing Director and Chief Investment Officer, IBM Retirement Funds (2007-2016). | | Advisory Board Member, Penso Advisors, LLC (2020-present); Advisory Board Member, Los Angeles Capital (2018-present); Advisory Board Member, State Street Global Advisors Total Portfolio Solutions (2017- present); Acting Executive Director, Committee on Investment of Employee Benefit Assets (CIEBA) (2016-2017); Advisory Board Member, Betterment for Business (robo advisor) (2016- 2017); Advisory Board Member, BlueStar Indexes (index creator) (2013-2017); Director, Emerging Markets Growth Fund (registered investment company) (1997-2016); Member, Russell Index Client Advisory Board (2001-2015). |
Thomas P. Lemke (1954);
Trustee since 2014. | | | (1) Independent Trustee of Advisors’ Inner Circle III fund platform, consisting of the following: (i) the Advisors’ Inner Circle Fund III, (ii) the Gallery Trust, (iii) the Schroder Series Trust, (iv) the Delaware Wilshire Private Markets Fund (since 2020), (v) Chiron Capital Allocation Fund Ltd., and (vi) formerly the Winton Diversified Opportunities Fund (2014-2018); and (2) Independent Trustee of the Symmetry Panoramic Trust (since 2018). |
Lawrence R. Maffia (1950);
Trustee since 2014. | Retired; Director and President, ICI Mutual Insurance Company (2006-2013). | | Director, ICI Mutual Insurance Company (1999-2013). |
Mary E. Martinez (1960); Vice
Chair since 2021; Trustee since 2013. | Associate, Special Properties, a Christie’s International Real Estate Affiliate (2010-present); Managing Director, Bank of America (asset management) (2007-2008); Chief Operating Officer, U.S. Trust Asset Management, U.S. Trust Company (asset management) (2003-2007); President, Excelsior Funds (registered investment companies) (2004-2005). | | |
Marilyn McCoy (1948);
Trustee since 1999. | Retired; Vice President of Administration and Planning, Northwestern University (1985-2023). | | |
| J.P. Morgan Exchange-Traded Funds | |
TRUSTEES(Unaudited) (continued)
Name (Year of Birth); Positions With the Funds (1) | Principal Occupation During Past 5 Years | Number of Funds in Fund Complex Overseen by Trustee (2) | Other Directorships Held During the Past 5 Years |
Independent Trustees (continued) | |
Dr. Robert A. Oden, Jr. (1946); Trustee
since 1997. | Retired; President, Carleton College (2002-2010); President, Kenyon College (1995-2002). | | Trustee, The Coldwater Conservation Fund (2017-present); Trustee, American Museum of Fly Fishing (2013-present); Trustee and Vice Chair, Trout Unlimited (2017-2021); Trustee, Dartmouth- Hitchcock Medical Center (2011-2020). |
Marian U. Pardo* (1946);
Trustee since 2013. | Managing Director and Founder, Virtual Capital Management LLC (investment consulting) (2007-present); Managing Director, Credit Suisse Asset Management (portfolio manager) (2003-2006). | | Board Chair and Member, Board of Governors, Columbus Citizens Foundation (not-for-profit supporting philanthropic and cultural programs) (2006-present). |
Emily A. Youssouf (1951);
Trustee since 2014. | Adjunct Professor (2011-present) and Clinical Professor (2009-2011), NYU Schack Institute of Real Estate; Board Member and Member of the Audit Committee (2013–present), Chair of Finance Committee (2019-present), Member of Related Parties Committee (2013-2018) and Member of the Enterprise Risk Committee (2015-2018), PennyMac Financial Services, Inc.; Board Member (2005-2018), Chair of Capital Committee (2006-2016), Chair of Audit Committee (2005-2018), Member of Finance Committee (2005-2018) and Chair of IT Committee (2016-2018), NYC Health and Hospitals Corporation. | | Trustee, NYC School Construction Authority (2009-present); Board Member, NYS Job Development Authority (2008-present); Trustee and Chair of the Audit Committee of the Transit Center Foundation (2015-2019). |
| |
Robert F. Deutsch** (1957);
Trustee since 2014. | Retired; Head of ETF Business for JPMorgan Asset Management (2013-2017); Head of Global Liquidity Business for JPMorgan Asset Management (2003-2013). | | Treasurer and Director of the JUST Capital Foundation (2017-present). |
Nina O. Shenker** (1957);
Trustee since 2022. | Vice Chair (2017-2021), General Counsel and Managing Director (2008-2016), Associate General Counsel and Managing Director (2004-2008), J.P. Morgan Asset & Wealth Management. | | Director and Member of Legal and Human Resources Subcommittees, American Jewish Joint Distribution Committee (2018-present). |
|
| The year shown is the first year in which a Trustee became a member of any of the following: the JPMorgan Mutual Fund Board, the JPMorgan ETF Board, the heritage J.P. Morgan Funds or the heritage One Group Mutual Funds. Trustees serve an indefinite term, until resignation, retirement, removal or death. The Board's current retirement policy sets retirement at the end of the calendar year in which the Trustee attains the age of 75, provided that any Board member who was a member of the JPMorgan Mutual Fund Board prior to January 1, 2022 and was born prior to January 1, 1950 shall retire from the Board at the end of the calendar year in which the Trustee attains the age of 78. |
| A Fund Complex means two or more registered investment companies that hold themselves out to investors as related companies for purposes of investment and investor services or have a common investment adviser or have an investment adviser that is an affiliated person of the investment adviser of any of the other registered investment companies. The J.P. Morgan Funds Complex for which the Board of Trustees serves currently includes eight registered investment companies (167 J.P. Morgan Funds). |
| In connection with prior employment with JPMorgan Chase, Ms. Pardo was the recipient of non-qualified pension plan payments from JPMorgan Chase in the amount of approximately $2,055 per month, which she irrevocably waived effective January 1, 2013, and deferred compensation payments from JPMorgan Chase in the amount of approximately $7,294 per year, which ended in January 2013. In addition, Ms. Pardo receives payments from a fully-funded qualified plan, which is not an obligation of JPMorgan Chase. |
| J.P. Morgan Exchange-Traded Funds | |
| Designation as an “Interested Trustee” is based on prior employment by the Adviser or an affiliate of the Adviser or interests in a control person of the Adviser. |
| The contact address for each of the Trustees is 277 Park Avenue, New York, NY 10172. |
| J.P. Morgan Exchange-Traded Funds | |
Name (Year of Birth),
Positions Held with
the Trust (Since) | Principal Occupations During Past 5 Years |
Brian S. Shlissel (1964),
President and Principal Executive
Officer (2021) | Managing Director and Chief Administrative Officer for J.P. Morgan pooled vehicles, J.P. Morgan Investment Management Inc. since 2014. |
Timothy J. Clemens (1975),
Treasurer and Principal Financial
Officer (2020) | Managing Director, J.P. Morgan Investment Management Inc. Mr. Clemens has been with J.P. Morgan Investment Management Inc. since 2013. |
Gregory S. Samuels (1980),
Secretary (2022) (formerly Assistant
Secretary 2014-2022) | Managing Director and Assistant General Counsel, JPMorgan Chase & Co. Mr. Samuels has been with JPMorgan Chase & Co. since 2010. |
Stephen M. Ungerman (1953),
Chief Compliance Officer (2014) | Managing Director, JPMorgan Chase & Co. Mr. Ungerman has been with JPMorgan Chase & Co. since 2000. |
Kiesha Astwood-Smith (1973),
Assistant Secretary (2021) | Vice President and Assistant General Counsel, JPMorgan Chase & Co. since June 2021; Senior Director and Counsel, Equitable Financial Life Insurance Company (formerly, AXA Equitable Life Insurance Company) from September 2015 through June 2021. |
Matthew Beck (1988),
Assistant Secretary (2021)* | Vice President and Assistant General Counsel, JPMorgan Chase & Co. since May 2021; Senior Legal Counsel, Ultimus Fund Solutions from May 2018 through May 2021; General Counsel, The Nottingham Company from April 2014 through May 2018. |
Elizabeth A. Davin (1964),
Assistant Secretary (2022)
(formerly Secretary 2018-2022)* | Executive Director and Assistant General Counsel, JPMorgan Chase & Co. Ms. Davin has been with JPMorgan Chase & Co. (formerly Bank One Corporation) since 2004. |
Jessica K. Ditullio (1962),
Assistant Secretary (2014)* | Executive Director and Assistant General Counsel, JPMorgan Chase & Co. Ms. Ditullio has been with JPMorgan Chase & Co. (formerly Bank One Corporation) since 1990. |
Anthony Geron (1971),
Assistant Secretary (2019) | Vice President and Assistant General Counsel, JPMorgan Chase & Co. since September 2018; Lead Director and Counsel, AXA Equitable Life Insurance Company from 2015 to 2018 and Senior Director and Counsel, AXA Equitable Life Insurance Company from 2014 to 2015. |
Carmine Lekstutis (1980),
Assistant Secretary (2014) | Executive Director and Assistant General Counsel, JPMorgan Chase & Co. Mr. Lekstutis has been with JPMorgan Chase & Co. since 2011. |
Max Vogel (1990),
Assistant Secretary (2021) | Vice President and Assistant General Counsel, JPMorgan Chase & Co. since June 2021; Associate, Proskauer Rose LLP (law firm) from March 2017 to June 2021. |
Zachary E. Vonnegut-Gabovitch
(1986),
Assistant Secretary (2017) | Executive Director and Assistant General Counsel, JPMorgan Chase & Co. Mr. Vonnegut-Gabovitch has been with JPMorgan Chase & Co. since September 2016. |
Frederick J. Cavaliere (1978),
Assistant Treasurer (2015)** | Executive Director, J.P. Morgan Investment Management Inc. Mr. Cavaliere has been with JPMorgan Chase & Co. since May 2006. |
Michael M. D’Ambrosio (1969),
Assistant Treasurer (2014) | Managing Director, J.P. Morgan Investment Management Inc. Mr. D’Ambrosio has been with J.P. Morgan Investment Management Inc. since 2012. |
Aleksandr Fleytekh (1972),
Assistant Treasurer (2023) | Executive Director, J.P. Morgan Investment Management Inc. Mr. Fleytekh has been with J.P. Morgan Investment Management Inc. since February 2012. |
Shannon Gaines (1977),
Assistant Treasurer (2019)* | Executive Director, J.P. Morgan Investment Management Inc. Mr. Gaines has been with J.P. Morgan Investment Management Inc. since January 2014. |
Jeffrey D. House (1972),
Assistant Treasurer (2023)* | Vice President, J.P. Morgan Investment Management Inc. Mr. House has been with J.P. Morgan Investment Management Inc. since July 2006. |
Michael Mannarino (1985),
Assistant Treasurer (2023) | Vice President, J.P. Morgan Investment Management Inc. Mr. Mannarino has been with J.P. Morgan Investment Management Inc. since 2014. |
| J.P. Morgan Exchange-Traded Funds | |
Nektarios E. Manolakakis (1972),
Assistant Treasurer (2020) | Executive Director, J.P. Morgan Investment Management Inc. since February 2021, formerly Vice President, J.P. Morgan Investment Management Inc. since 2014; Vice President, J.P. Morgan Corporate & Investment Bank 2010-2014. |
Todd McEwen (1981),
Assistant Treasurer (2020)* | Executive Director, J.P. Morgan Investment Management Inc. Mr. McEwen has been with J.P. Morgan Investment Management Inc. since 2010. |
Joseph Parascondola (1963),
Assistant Treasurer (2023)** | Executive Director, J.P. Morgan Investment Management Inc. Mr. Parascondola has been with J.P. Morgan Investment Management Inc. since 2006. |
Gillian I. Sands (1969),
Assistant Treasurer (2023) | Executive Director, J.P. Morgan Investment Management Inc. Ms. Sands has been with J.P. Morgan Investment Management Inc. since September 2012. |
|
The contact address for each of the officers, unless otherwise noted, is 277 Park Avenue, New York, NY 10172. |
| The contact address for the officer is 1111 Polaris Parkway, Columbus, OH 43240. |
| The contact address for the officer is 575 Washington Boulevard, Jersey City, NJ 07310. |
| J.P. Morgan Exchange-Traded Funds | |
SCHEDULE OF SHAREHOLDER EXPENSES(Unaudited)
Hypothetical $1,000 Investment
As a shareholder of the Funds, you incur two types of costs: (1) transaction costs, including brokerage commissions on your purchase and sales of Fund shares and (2) ongoing costs, primarily management fees. The examples below are intended to help you understand your ongoing costs (in dollars) of investing in the Funds and to compare these ongoing costs with the ongoing costs of investing in other funds. The examples assume that you had a $1,000 investment at the beginning of the reporting period, September 1, 2023, and continued to hold your shares at the end of the reporting period, February 29, 2024.
Actual Expenses
For each Fund in the table below, the first line provides information about actual account values and actual expenses. You may use the information in this line, together with the amount you invested, to estimate the expenses that you paid over the period. Simply divide your account value by $1,000 (for example, an $8,600 account value divided by $1,000 = 8.6), then multiply the result by the number in the first line of each
Fund under the heading titled “Expenses Paid During the Period” to estimate the expenses you paid on your account during this period.
Hypothetical Example for Comparison Purposes
The second line of each Fund in the table below provides information about hypothetical account values and hypothetical expenses based on the actual expense ratio and an assumed rate of return of 5% per year before expenses, which is not the Fund's actual return. The hypothetical account values and expenses may not be used to estimate the actual ending account balance or expenses you paid for the period. You may use this information to compare the ongoing costs of investing in the Funds and other funds. To do so, compare this 5% hypothetical example with the 5% hypothetical examples that appear in the shareholder reports of the other funds. The examples also assume all dividends and distributions have been reinvested. The examples do not take into account brokerage commissions that you pay when purchasing or selling shares of a Fund.
| Beginning Account Value September 1, 2023 | Ending Account Value February 29, 2024 | | |
JPMorgan BetaBuilders 1-5 Year U.S. Aggregate Bond ETF | | | | |
| | | | |
| | | | |
JPMorgan BetaBuilders U.S. Aggregate Bond ETF | | | | |
| | | | |
| | | | |
JPMorgan BetaBuilders U.S. TIPS 0-5 Year ETF | | | | |
| | | | |
| | | | |
JPMorgan BetaBuilders U.S. Treasury Bond 1-3 Year ETF | | | | |
| | | | |
| | | | |
JPMorgan BetaBuilders U.S. Treasury Bond 20+ Year ETF | | | | |
| | | | |
| | | | |
JPMorgan BetaBuilders U.S. Treasury Bond 3-10 Year ETF | | | | |
| | | | |
| | | | |
JPMorgan BetaBuilders USD High Yield Corporate Bond ETF | | | | |
| | | | |
| | | | |
JPMorgan BetaBuilders USD Investment Grade Corporate Bond ETF | | | | |
| | | | |
| | | | |
| Beginning Account Value September 1, 2023 | Ending Account Value February 29, 2024 | Expenses Paid During the Period* | |
JPMorgan USD Emerging Markets Sovereign Bond ETF | | | | |
| | | | |
| | | | |
|
| Expenses are equal to each Fund's annualized net expense ratio, multiplied by the average account value over the period, multiplied by 182/366 (to reflect the one-half year period). |
LIQUIDITY RISK MANAGEMENT PROGRAM(Unaudited)
Each of the Funds covered in this report has adopted the J.P. Morgan Funds and J.P. Morgan Exchange-Traded Funds Amended and Restated Liquidity Risk Management Program (the “Program”) under Rule 22e-4 under the Investment Company Act of 1940, as amended (the “Liquidity Rule”). The Program seeks to assess, manage and review each Fund’s Liquidity Risk. “Liquidity Risk” is defined as the risk that a fund could not meet requests to redeem shares issued by the fund without significant dilution of remaining investors’ interests in the fund. Pursuant to an exemptive order (the “Exemptive Order”) from the Securities and Exchange Commission, the Program permits the Funds to use liquidity definitions and classification methodologies that differ from the requirements under the Liquidity Rule in some respects. Among other things, the Liquidity Rule requires that a written report be provided to the Board of Trustees (the “Board”) on an annual basis that addresses the operation of the Program and assesses the adequacy and effectiveness of its implementation, including the operation of any Highly Liquid Investment Minimum (“HLIM”), where applicable, and any material changes to the Program.1
The Board has appointed J.P. Morgan Asset Management’s Liquidity Risk Forum to be the program administrator for the Program (the “Program Administrator”). In addition to regular reporting at each of its quarterly meetings, on February 7, 2024, the Board reviewed the Program Administrator’s annual written report (the “Report”) concerning the operation of the Program for the period from January 1, 2023 through December 31, 2023 (the “Program Reporting Period”). The Report addressed the operation of the Program and assessed its adequacy and effectiveness of implementation, including, where applicable, the operation of a Fund’s HLIM. There were no material changes to the Program during the Program Reporting Period.
The Report summarized the operation of the Program and the information and factors considered by the Program Administrator in assessing whether the Program has been adequately
and effectively implemented with respect to each Fund. Such information and factors included, among other things: (1) the effectiveness of the Program with respect to the identification of each Fund that qualifies as an “In-Kind ETF” (as defined in the Liquidity Rule); (2) the liquidity risk framework used to assess, manage, and periodically review each Fund’s Liquidity Risk and the results of this assessment; (3) the methodology and inputs for classifying the investments of a Fund (other than an In-Kind ETF) into one of the required liquidity categories that reflect an estimate of the liquidity of those investments under current market conditions (and, for In-Kind ETFs, the methodology and inputs for determining whether any investments should be classified as “Illiquid Investments” (as defined or modified under the Program)); (4) whether a Fund (other than an In-Kind ETF) invested primarily in “Highly Liquid Investments” (as defined or modified under the Program), as well as whether an HLIM should be established for a Fund (other than an In-Kind ETF) and the procedures for monitoring any HLIM; (5) whether a Fund invested more than 15% of its assets in “Illiquid Investments” and the procedures for monitoring for this limit; and (6) specific liquidity events arising during the Program Reporting Period. The Report further summarized the conditions of the Exemptive Order and whether all applicable Funds were in compliance with the terms of the Exemptive Order.
Based on this review, the Report concluded that: (1) the Program continues to be reasonably designed to effectively assess and manage each Fund’s Liquidity Risk; and (2) the Program has been adequately and effectively implemented with respect to each Fund during the Program Reporting Period.
1 Effective July 24, 2024, the J.P. Morgan Funds will implement the Tailored Shareholder Reports for Mutual Funds and Exchanged-Traded Funds Rule. This rule rescinds the currently-required statement regarding the operation and effectiveness of a fund’s Liquidity Risk Management Program from the shareholder report.
| J.P. Morgan Exchange-Traded Funds | |
Certain tax information for the J.P. Morgan Funds is required to be provided to shareholders based upon the Funds' income and distributions for the taxable year ended February 29, 2024. The information and distributions reported in this letter may differ from the information and taxable distributions reported to the shareholders for the calendar year ending December 31, 2024. The information necessary to complete your income tax returns for the calendar year ending December 31, 2024 will be provided under separate cover.
Qualified Interest Income (QII) and Short-Term Capital Gain
Each Fund listed below paid the following amount, or maximum allowable amount, of ordinary distributions treated as qualified interest income and short-term capital gains for the fiscal year ended February 29, 2024:
| |
JPMorgan BetaBuilders 1-5 Year U.S. Aggregate Bond ETF | |
JPMorgan BetaBuilders U.S. Aggregate Bond ETF | |
JPMorgan BetaBuilders U.S. TIPS 0-5 Year ETF | |
JPMorgan BetaBuilders U.S. Treasury Bond 1-3 Year ETF | |
JPMorgan BetaBuilders U.S. Treasury Bond 20+ Year ETF | |
JPMorgan BetaBuilders U.S. Treasury Bond 3-10 Year ETF | |
JPMorgan BetaBuilders USD High Yield Corporate Bond ETF | |
JPMorgan BetaBuilders USD Investment Grade Corporate Bond ETF | |
Treasury Income
Each Fund listed below had the following percentage, or maximum allowable percentage, of income earned from direct U.S. Treasury Obligations for the fiscal year ended February 29, 2024:
| Income from
U.S. Treasury
Obligations |
JPMorgan BetaBuilders 1-5 Year U.S. Aggregate Bond ETF | |
JPMorgan BetaBuilders U.S. Aggregate Bond ETF | |
JPMorgan BetaBuilders U.S. TIPS 0-5 Year ETF | |
JPMorgan BetaBuilders U.S. Treasury Bond 1-3 Year ETF | |
JPMorgan BetaBuilders U.S. Treasury Bond 20+ Year ETF | |
JPMorgan BetaBuilders U.S. Treasury Bond 3-10 Year ETF | |
| J.P. Morgan Exchange-Traded Funds | |
THIS PAGE IS INTENTIONALLY LEFT BLANK
THIS PAGE IS INTENTIONALLY LEFT BLANK
THIS PAGE IS INTENTIONALLY LEFT BLANK
J.P. Morgan Exchange-Traded Funds are distributed by JPMorgan Distribution Services, Inc., an indirect, wholly-owned subsidiary of JPMorgan Chase & Co. Affiliates of JPMorgan Chase & Co. receive fees for providing various services to the Funds.
Contact J.P. Morgan Exchange-Traded Funds at 1-844-457-6383 (844-4JPM ETF) for a fund prospectus. You can also visit us at www.jpmorganfunds.com. Investors should carefully consider the investment objectives and risks as well as charges and expenses of the fund before investing. The prospectus contains this and other information about the fund. Read the prospectus carefully before investing.
Investors may obtain information about the Securities Investor Protection Corporation (SIPC), including the SIPC brochure, by visiting www.sipc.org or by calling SIPC at 202-371-8300.
Each Fund files a complete schedule of its fund holdings for the first and third quarters of its fiscal year with the SEC as an exhibit to its report on Form N-PORT. The Funds' Form N-PORT reports are available on the SEC’s website at http://www.sec.gov. Each Fund's quarterly holdings can be found by visiting the J.P. Morgan Funds’ website at www.jpmorganfunds.com.
Effective January 24, 2023, the SEC adopted rule and form amendments that will result in changes to the design and delivery of shareholder reports of mutual funds and ETFs, requiring them to transmit concise and visually engaging streamlined annual and semi-annual reports to shareholders that highlight key information. Other information, including financial statements, will no longer appear in a streamlined shareholder report but must be available online, delivered free of charge upon request, and filed on a semi-annual basis on Form N-CSR. The rule and form amendments have a compliance date of July 24, 2024.
A description of each Fund's policies and procedures with respect to the disclosure of each Fund's holdings is available in the prospectuses and Statements of Additional Information.
A copy of proxy policies and procedures is available without charge upon request by calling 1-844-457-6383 and on the Funds' website at www.jpmorganfunds.com. A description of such policies and procedures is on the SEC’s website at www.sec.gov. The Trustees have delegated the authority to vote proxies for securities owned by the Funds to the Adviser. A copy of the Funds' voting record for the most recent 12-month period ended June 30 is available on the SEC’s website at www.sec.gov or at the Funds' website at www.jpmorganfunds.com no later than August 31 of each year. The Funds' proxy voting record will include, among other things, a brief description of the matter voted on for each fund security, and will state how each vote was cast, for example, for or against the proposal.
J.P. Morgan Asset Management is the brand name for the asset management business of JPMorgan Chase & Co. and its affiliates worldwide.
© JPMorgan Chase & Co., 2024. All rights reserved. February 2024.
AN-PASSETF-224
Annual Report
J.P. Morgan Exchange-Traded Funds
February 29, 2024
| | |
JPMorgan High Yield Municipal ETF | | |
JPMorgan Limited Duration Bond ETF | | |
JPMorgan Sustainable Municipal Income ETF | | |
CONTENTS
Investments in a Fund are not deposits or obligations of, or guaranteed or endorsed by, any bank and are not insured or guaranteed by the FDIC, the Federal Reserve Board or any other government agency. You could lose money if you sell when a Fund’s share price is lower than when you invested.
Past performance is no guarantee of future performance. The general market views expressed in this report are opinions based on market and other conditions through the end of the reporting period and are subject to change without notice. These views are not intended to predict the future performance of a Fund or the securities markets.
Prospective investors should refer to the Funds’ prospectuses for a discussion of the Funds’ investment objectives, strategies and risks. Call J.P. Morgan Exchange-Traded Funds at (844) 457-6383 for a prospectus containing more complete information about a Fund, including management fees and other expenses. Please read it carefully before investing.
Shares are bought and sold throughout the day on an exchange at market price (not at net asset value) through a brokerage account, and are not individually subscribed and redeemed from a Fund. Shares may only be subscribed and redeemed directly from a Fund by Authorized Participants, in very large creation/redemption units. Brokerage commissions will reduce returns.
President's LetterApril 15, 2024 (Unaudited)
Dear Shareholder,
Financial markets largely rallied through the final months of 2023 and into the first quarter of 2024, as leading central banks refrained from implementing further interest rate increases. Equity markets generally outperformed bond markets for the twelve months ended February 29, 2024, led by four consecutive months of net gains in U.S. equity prices.
|
“The global economic outlook for the year ahead remains positive and financial markets appear more resilient than a year ago.” — Brian S. Shlissel
|
Economic data were stronger than many economists expected in the face of elevated interest rates throughout the year. Following weak but positive economic growth in the first half of 2023, U.S. gross domestic product increased to 4.9% in the third quarter and 3.4% growth in the final quarter of the year. While the U.S. unemployment rate rose slightly during the second half of the year, it remained below 4% for the entire 12 month period and monthly job growth data frequently surpassed the consensus forecasts of economists.
Meanwhile, the U.S. Federal Reserve (the “Fed”) continued to raise interest rates through the end of summer 2023, then settled on a benchmark lending rate range of 5.25 - 5.50% through the first quarter of 2024. The European Central Bank and the Bank of England followed similar trajectories, raising interest rates at regular intervals into the third quarter of 2023 and then holding rates at those elevated levels for the remainder of the period. Notably, the Bank of Japan raised interest rates for the first time in 17 years in mid-March 2024, ending eight years of negative interest rates and setting its benchmark rate range at 0.0 to 0.1%.
The Fed and certain other leading central banks fueled investor expectations for interest rate reductions in 2024 and growing optimism that developed market economies could enjoy a “soft landing” of positive growth coupled with relatively low unemployment.
However, there remain significant risks to the macroeconomic backdrop. Slower economic growth due to the impact of higher interest rates could leave the U.S. economy more vulnerable to potential shocks from geopolitical events, natural disasters or political turmoil, particularly taking into account the upcoming U.S. presidential election. Additionally, financial markets may also come under pressure should the Fed decide not to reduce interest rates to the extent anticipated by investors. Finally, the recent run-up in U.S. equity prices could lead to increased volatility in certain sectors of the market.
The global economic outlook for the year ahead remains positive and financial markets appear to be more resilient than a year ago. Global growth is estimated at 2.9% this year and 3.0% for 2025, with a continued decline in inflation, according to the Organization for Economic Cooperation and Development’s February 2024 forecast. However, across market cycles, we believe that those investors who hold a well-diversified portfolio and a long-term view are best positioned.
Our suite of investment solutions seeks to provide investors with the ability to build durable portfolios that meet their financial goals, regardless of macroeconomic and geopolitical uncertainties.
Sincerely,
Brian S. Shlissel
President, J.P. Morgan Exchange-Traded Funds
J.P. Morgan Asset Management
1-844-4JPM-ETF or jpmorgan.com/etfs for more information
| J.P. Morgan Exchange-Traded Funds | |
J.P. Morgan Exchange-Traded Funds
MARKET OVERVIEWTWELVE MONTHS ENDED February 29, 2024 (Unaudited)
While bond markets generally underperformed equity markets during the period, fixed income securities rallied in late 2023 as leading central banks signaled that they could begin to lower interest rates in 2024. Overall, U.S. high yield bonds (also known as junk bonds) and emerging markets debt outperformed other sectors of the bond market, and corporate debt generally outperformed U.S. Treasury bonds and other developed markets sovereign debt for the twelve months ended February 29, 2024.
Global economic growth was stronger than expected in the first quarter of 2023, but in late March, Silicon Valley Bank collapsed after management sold off the bank’s portfolio of U.S. Treasury bonds at a steep loss, which triggered a run on the bank’s deposits. While U.S. regulators moved swiftly to guarantee some deposits at the bank to prevent further contagion, depositors began withdrawing cash from First Republic Bank. At the end of April, U.S. regulators announced First Republic Bank had been closed and sold to J.P. Morgan Chase & Co. Meanwhile, the Swiss government brokered a takeover of troubled Credit Suisse by UBS Group AG. These events sharply elevated market volatility in the banking sector, particularly in U.S. regional bank stocks.
Throughout the first half of 2023, leading central banks continued to raise interest rates at regular intervals in an effort to ease inflationary pressures. By the end of summer 2023, inflation data in the U.S. and across Europe had shown significant reduction in core consumer prices. In response, the U.S. Federal Reserve, the European Central Bank and the Bank of England in separate decisions each declined to raise interest rates further during the final months of 2023.
By the start of the second half of 2023, the general consensus among economists was that interest rates would remain elevated for an extended period, particularly in the U.S. where labor markets remained tight and economic growth was generally stronger than expected. However, at its December meeting, the U.S. Federal Reserve indicated that it was prepared to begin the process of cutting interest rates in 2024, given the trajectory of inflation data.
Global economic growth largely proved more resilient than economists’ forecasts during the period, led by expansions in the U.S., Japan, India and select emerging markets. Meanwhile, the Eurozone, U.K., China and Canada struggled with weaker growth. China’s economy faced low levels of consumer spending and business confidence, along with long-standing debt issues in the domestic property sector. Across Europe, weakness in consumer and business spending and ongoing stresses from the war in Ukraine weighed on economic growth. Notably, inflation data in the U.K. indicated that prices were declining at a somewhat slower pace than in other developed markets.
However, investor concerns about a potential economic recession receded during the period as data showed a general trend toward stability in labor markets amid declining inflation and the pivot in the policies of leading central banks. Global equity markets responded with a four-month rally through the end of February 2024. Notably, the outperformance of U.S. equity markets was led by a handful of large cap companies in the information technology and communications sectors; Apple Inc., Amazon.com Inc., Alphabet Inc., Meta Platforms Inc., Microsoft Corp., Nvidia Corp. and Tesla Inc.
For the twelve months ended February 29, 2024, the Bloomberg U.S. Corporate High Yield Index returned 11.03%, the Bloomberg Emerging Markets Index returned 7.92% and the Bloomberg U.S. Aggregate Index returned 3.33%.
| J.P. Morgan Exchange-Traded Funds | |
JPMorgan High Yield Municipal ETF
FUND COMMENTARYTWELVE MONTHS ENDED February 29, 2024 (Unaudited)
| |
| |
| |
Bloomberg US Municipal Index | |
Bloomberg High Yield Municipal Bond Index | |
Bloomberg 65% High Grade Index / 35% High Yield Total Return Index | |
Net Assets as of 2/29/2024 | |
| |
| |
INVESTMENT OBJECTIVE***
The JPMorgan High Yield Municipal ETF1 (the “Fund”) seeks a high level of current income exempt from federal income taxes.
INVESTMENT APPROACH
The Fund invests in U.S. municipal securities that are exempt from federal income taxes and seeks a competitive yield and higher after-tax returns by focusing on high yield municipal bonds. The Fund may invest up to 100% in securities rated below investment grade that offer a higher yield than investment grade securities but involve a greater degree of risk.
WHAT WERE THE MAIN DRIVERS OF THE FUND’S PERFORMANCE?
For the twelve months ended February 29, 2024, the Fund underperformed the Bloomberg US Municipal Index, the Bloomberg High Yield Municipal Bond Index and the Bloomberg 65% High Grade Index / 35% High Yield Total Return Index (the “Composite Index”).
Relative to the Composite Index, the Fund’s underweight positions in the transportation and leasing sectors and its underweight position in bonds issued by Puerto Rico were leading detractors from performance. The Fund’s cash allocation, which was used to manage day-to-day operations of the Fund, also detracted from relative performance.
The Fund’s longer overall duration was a leading contributor to performance relative to the Composite Index as interest rates generally fell in the second half of the period. Generally, bonds of longer duration will experience a greater increase in price compared with shorter duration bonds when interest rates fall. The Fund’s overweight positions in the industrial development revenue/pollution control revenue and special tax sectors, and its underweight position in the pre-refunded sector, where the Fund had no holdings, also contributed to relative performance.
HOW WAS THE FUND POSITIONED?
During the period, the Fund’s assets were invested in municipal bonds, with a small allocation to loan assignments. At the end of the reporting period, the Fund’s largest allocations were to unrated bonds and bonds rated BB, while its smallest allocations were to bonds rated CCC and lower and bonds rated BBB. At the end of the period, the Fund’s duration was 7.8 years compared with 6.4 years for the Composite Index.
1On July 14, 2023, the Fund acquired the assets and liabilities, and assumed the performance, financial and other historical information, of the JPMorgan High Yield Municipal Fund (the “Predecessor Fund”), an open-end mutual fund that had operated since September 17, 2007. The Fund’s performance prior to July 14, 2023 is linked to the Predecessor Fund’s Class R6 Shares.
| J.P. Morgan Exchange-Traded Funds | |
JPMorgan High Yield Municipal ETF
FUND COMMENTARYTWELVE MONTHS ENDED February 29, 2024 (Unaudited) (continued)
*
The return shown is based on net asset value and may differ from the return shown in the financial highlights, which reflects adjustments made to the net asset value in accordance with accounting principles generally accepted in the United States of America. The net asset value was $49.98 as of February 29, 2024.
**
Market price return was calculated assuming an initial investment made at the market price at the beginning of the reporting period, reinvestment of all dividends and distributions at the market price during the period, and sale at the market price on the last day of the period. Prior to the Fund's listing on July 17, 2023, the NAV performance of the Fund and the Class R6 Shares of the Predecessor Fund are used as proxy market price returns. The price used to calculate the market price return was the closing price on the NYSE Arca, Inc. As of February 29, 2024, the closing price was $49.75.
***
The adviser seeks to achieve the Fund’s objective. There can be no guarantee it will be achieved.
CREDIT QUALITY ALLOCATIONS
AS OF FEBRUARY 29, 2024 | PERCENT OF
TOTAL
INVESTMENTS |
| |
| |
| |
| |
| |
| |
| |
| J.P. Morgan Exchange-Traded Funds | |
AVERAGE ANNUAL TOTAL RETURNS AS OF February 29, 2024 (Unaudited)
| | | | |
JPMorgan High Yield Municipal ETF | | | | |
| | | | |
| | | | |
|
| Inception date for Class I Shares of the Predecessor Fund (as defined below). |
TEN YEAR FUND PERFORMANCE (2/28/14 TO 2/29/24)
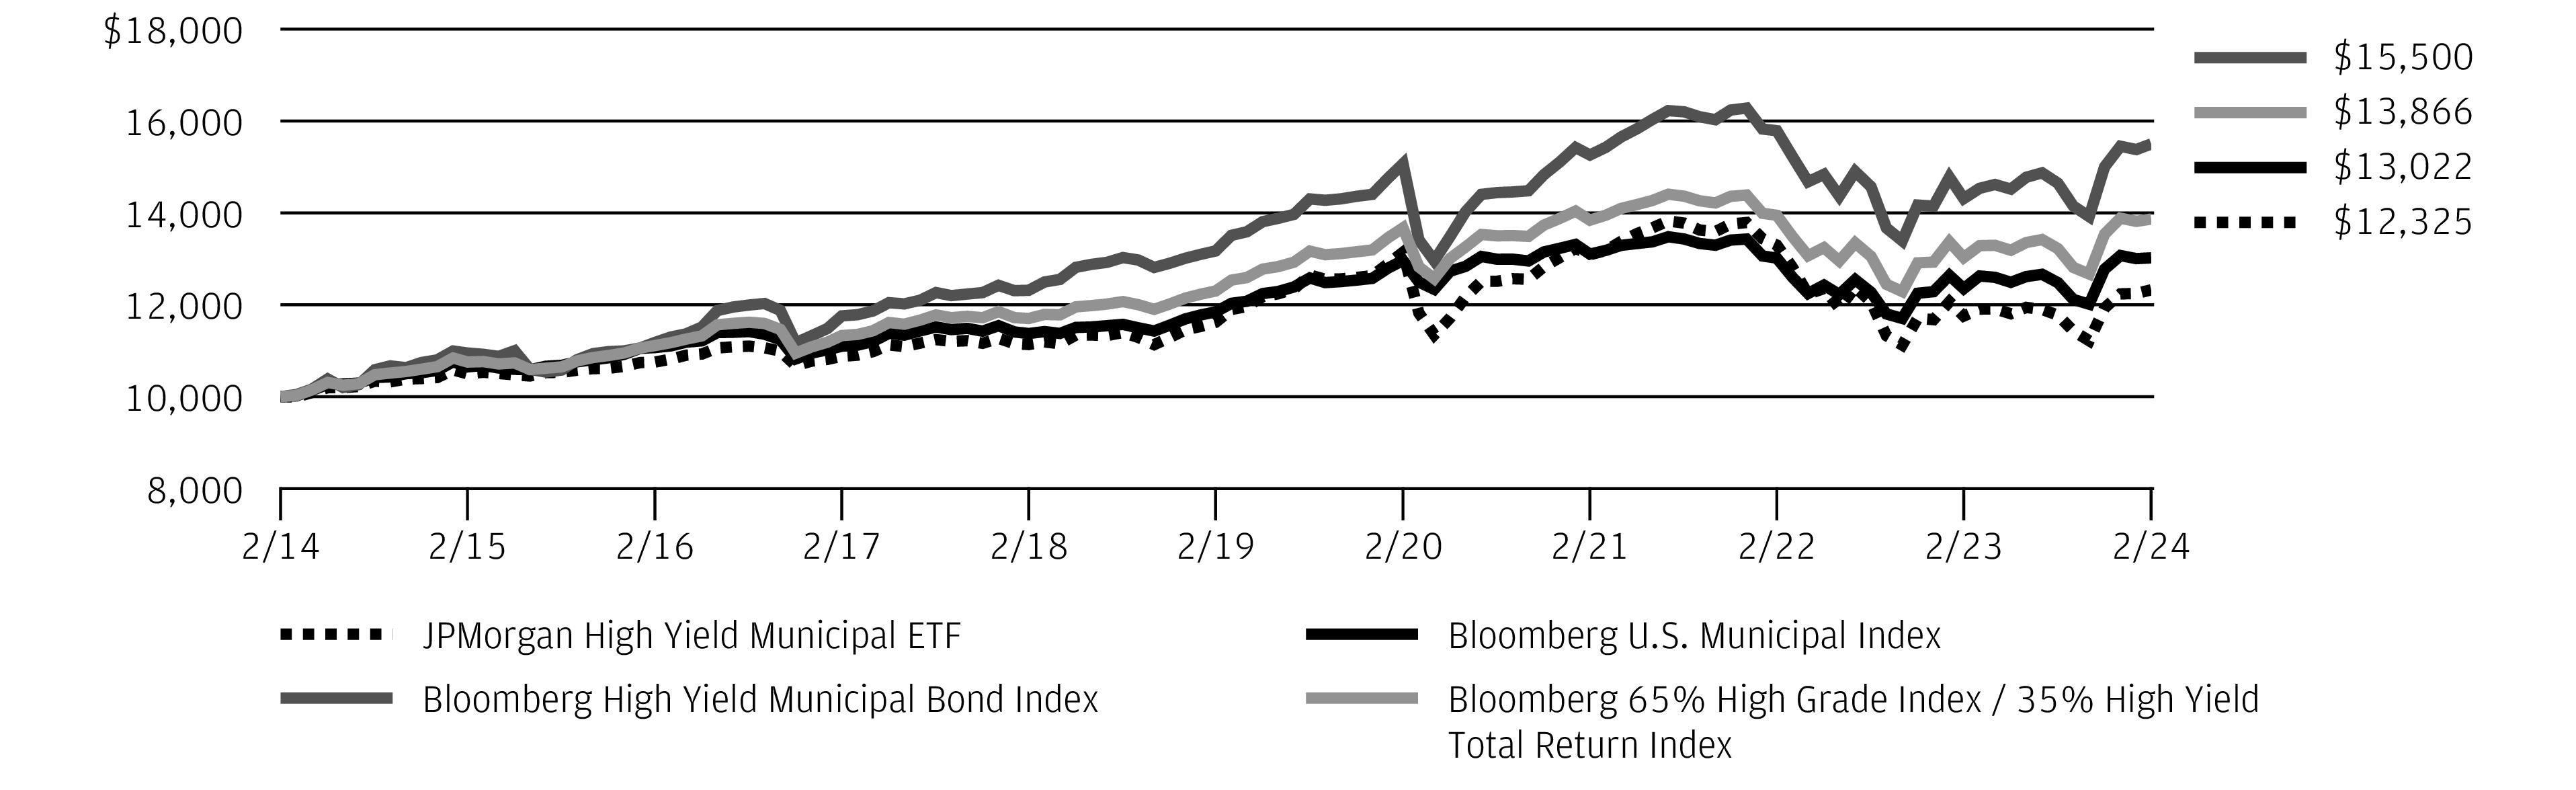
The performance quoted is past performance and is not a guarantee of future results. Exchange-traded funds are subject to certain market risks. Investment returns and principal value of an investment will fluctuate so that an investor’s shares, when sold or redeemed, may be worth more or less than their original cost. Current performance may be higher or lower than the performance data shown. Updated performance information is available by visiting www.jpmorganfunds.com or by calling 1-844-457-6383.
JPMorgan High Yield Municipal ETF (the “Fund”) acquired the assets and liabilities of the JPMorgan High Yield Municipal Fund (“Predecessor Fund”) in a reorganization that occurred as of the close of business on July 14, 2023. Performance and financial history of the Predecessor Fund’s Class R6 Shares have been adopted by the Fund and will be used going forward. As a result, the performance for the Fund prior to the close of business on July 14, 2023 is the performance of the Predecessor Fund’s Class R6 Shares. Inception date for the Predecessor Fund’s Class R6 Shares is November 1, 2018. Returns for the Predecessor Fund’s Class R6 Shares prior to their inception date are based on the performance of the Predecessors Fund’s Class I Shares. The actual returns of the Predecessor Fund’s Class R6 Shares would have been different than those shown because the Predecessor Fund’s Class R6 Shares had different expenses than the Predecessor Fund’s Class I Shares. Inception date for the Predecessor Fund’s Class I Shares is September 17, 2007.
Performance for the Fund’s shares has not been adjusted to reflect the Fund’s shares lower expenses than those of the Predecessor Fund’s Class R6 Shares and Class I Shares. Had the Predecessor Fund been structured as an exchange-traded fund (“ETF”), its performance may have differed. Performance for the Predecessor Fund is based on the net asset value (“NAV”) per share of the Predecessor Fund Shares rather than on market-determined prices. Prior to the Fund’s listing on July 17, 2023, the NAV performance of the Fund and the Class R6 Shares of the Predecessor Fund are used as proxy market price returns.
The graph illustrates comparative performance for $10,000 invested in shares of the Fund, the Bloomberg US Municipal Index, the Bloomberg High Yield Municipal Bond Index and the Bloomberg 65% High Grade Index / 35% High Yield Total Return Index from February 28, 2014 to February 29, 2024. The
performance of the Fund reflects the deduction of Fund expenses and assumes reinvestment of all dividends and capital gain distributions, if any. The performance of the Bloomberg US Municipal Index, the Bloomberg High Yield Municipal Bond Index and the Bloomberg 65% High Grade Index / 35% High Yield Total Return Index does not reflect the deduction of expenses associated with an ETF and approximates the minimum possible dividend reinvestment of the securities included in the Index, if applicable. The Bloomberg US Municipal Index is a total return performance benchmark for the long-term, investment-grade tax-exempt bond market. The Bloomberg High Yield Municipal Bond Index is an unmanaged index made up of bonds that are non-investment grade, unrated, or rated below Ba1 by Moody’s Investors Service with a remaining maturity of at least one year. The Bloomberg 65% High Grade Index / 35% High Yield Total Return Index is an unmanaged index of investment and non-investment-grade bonds, with a 65% weighting in the Bloomberg U.S. Municipal Index and a 35% weighting to the Bloomberg Municipal High Yield Index. Investors cannot invest directly in an index.
Fund performance may reflect the waiver of the Fund’s fees and reimbursement of expenses for certain periods. Without these waivers and reimbursements, performance would have been lower. Also, performance shown in this section does not reflect the deduction of taxes that a shareholder would pay on Fund distributions or on gains resulting from redemption or sale of Fund shares.
The returns shown are based on NAVs calculated for shareholder transactions and may differ from the returns shown in the financial highlights, which reflect adjustments made to the NAVs in accordance with accounting principles generally accepted in the United States of America.
Source: Bloomberg Index Services Limited. BLOOMBERG® is a trademark and service mark of Bloomberg Finance L.P. and its affiliates (collectively "Bloomberg"). Bloomberg or Bloomberg's licensors own all proprietary rights in the Bloomberg Indices. Bloomberg does not approve or endorse this material, or guarantee the accuracy or completeness of any information herein, or make any warranty, express or implied, as to the results to be obtained therefrom and, to the maximum extent allowed by law, shall have any liability or responsibility for injury or damages arising in connection therewith.
| J.P. Morgan Exchange-Traded Funds | |
JPMorgan Limited Duration Bond ETF
FUND COMMENTARYTWELVE MONTHS ENDED February 29, 2024 (Unaudited)
| |
| |
| |
Bloomberg 1-3 Year U.S. Government/Credit Bond Index | |
Net Assets as of 2/29/2024 | |
| |
| |
INVESTMENT OBJECTIVE***
The JPMorgan Limited Duration Bond ETF1 (the “Fund”) seeks a high level of current income consistent with low volatility of principal.
INVESTMENT APPROACH
The Fund mainly invests in mortgage-backed securities, asset-backed securities, mortgage-related securities, adjustable-rate mortgages, money market instruments, and structured investments. The Fund seeks to maintain a duration of three years or less. Duration measures the price sensitivity of a debt security or a portfolio of debt securities to changes in interest rates. Under normal circumstances, the Fund will invest at least 80% of its assets in bonds.
HOW DID THE FUND PERFORM?
For the twelve months ended February 29, 2024, the Fund outperformed the Bloomberg 1–3 Year U.S. Government/Credit Bond Index (the “Benchmark”).
Relative to the Benchmark, the Fund’s out-of-Benchmark allocation to commercial mortgage-backed securities was a leading contributor to performance. The Fund’s positions in other securitized debt sectors, including agency and
non-agency mortgage-backed securities, asset-backed securities and collateralized loan obligations, also contributed to relative performance.
The Fund’s allocation to bonds of durations longer than three years and its underweight allocation to corporate credit were leading detractors from performance relative to the Benchmark. Generally, bonds of longer duration will experience a larger decline in price compared with shorter duration bonds when interest rates rise.
HOW WAS THE FUND POSITIONED?
During the period, the Fund’s portfolio managers continued to focus on security selection, using bottom-up fundamental research to construct, in their view, a portfolio of undervalued fixed income securities. The Fund’s portfolio managers aimed to keep the duration of the Fund at 1.5 years. During the reporting period, the Fund’s duration increased to 1.50 years at February 29, 2024 from 1.48 years at February 28, 2023.
1On July 28, 2023, the Fund acquired the assets and liabilities, and assumed the performance, financial and other historical information, of the JPMorgan Limited Duration Bond Fund (the “Predecessor Fund”), an open-end mutual fund that had operated since February 2, 1993. The Fund’s performance prior to July 28, 2023 is linked to the Predecessor Fund’s Class R6 Shares.
| J.P. Morgan Exchange-Traded Funds | |
*
The return shown is based on net asset value and may differ from the return shown in the financial highlights, which reflects adjustments made to the net asset value in accordance with accounting principles generally accepted in the United States of America. The net asset value was $50.95 as of February 29, 2024.
**
Market price return was calculated assuming an initial investment made at the market price at the beginning of the reporting period, reinvestment of all dividends and distributions at the market price during the period, and sale at the market price on the last day of the period. Prior to the Fund's listing on July 31, 2023, the NAV performance of the Fund and the Class R6 Shares of the Predecessor Fund are used as proxy market price returns. The price used to calculate the market price return was the closing price on the Cboe BZX Exchange, Inc. As of February 29, 2024, the closing price was $50.80.
***
The adviser seeks to achieve the Fund’s objective. There can be no guarantee it will be achieved.
PORTFOLIO COMPOSITION
AS OF February 29, 2024 | PERCENT OF
TOTAL
INVESTMENTS |
| |
Collateralized Mortgage Obligations | |
Mortgage-Backed Securities | |
Commercial Mortgage-Backed Securities | |
| |
| |
| J.P. Morgan Exchange-Traded Funds | |
JPMorgan Limited Duration Bond ETF
FUND COMMENTARYTWELVE MONTHS ENDED February 29, 2024 (Unaudited) (continued)
AVERAGE ANNUAL TOTAL RETURNS AS OF February 29, 2024 (Unaudited)
| | | | |
JPMorgan Limited Duration Bond ETF | | | | |
| | | | |
| | | | |
TEN YEAR FUND PERFORMANCE (2/28/14 TO 2/29/24)
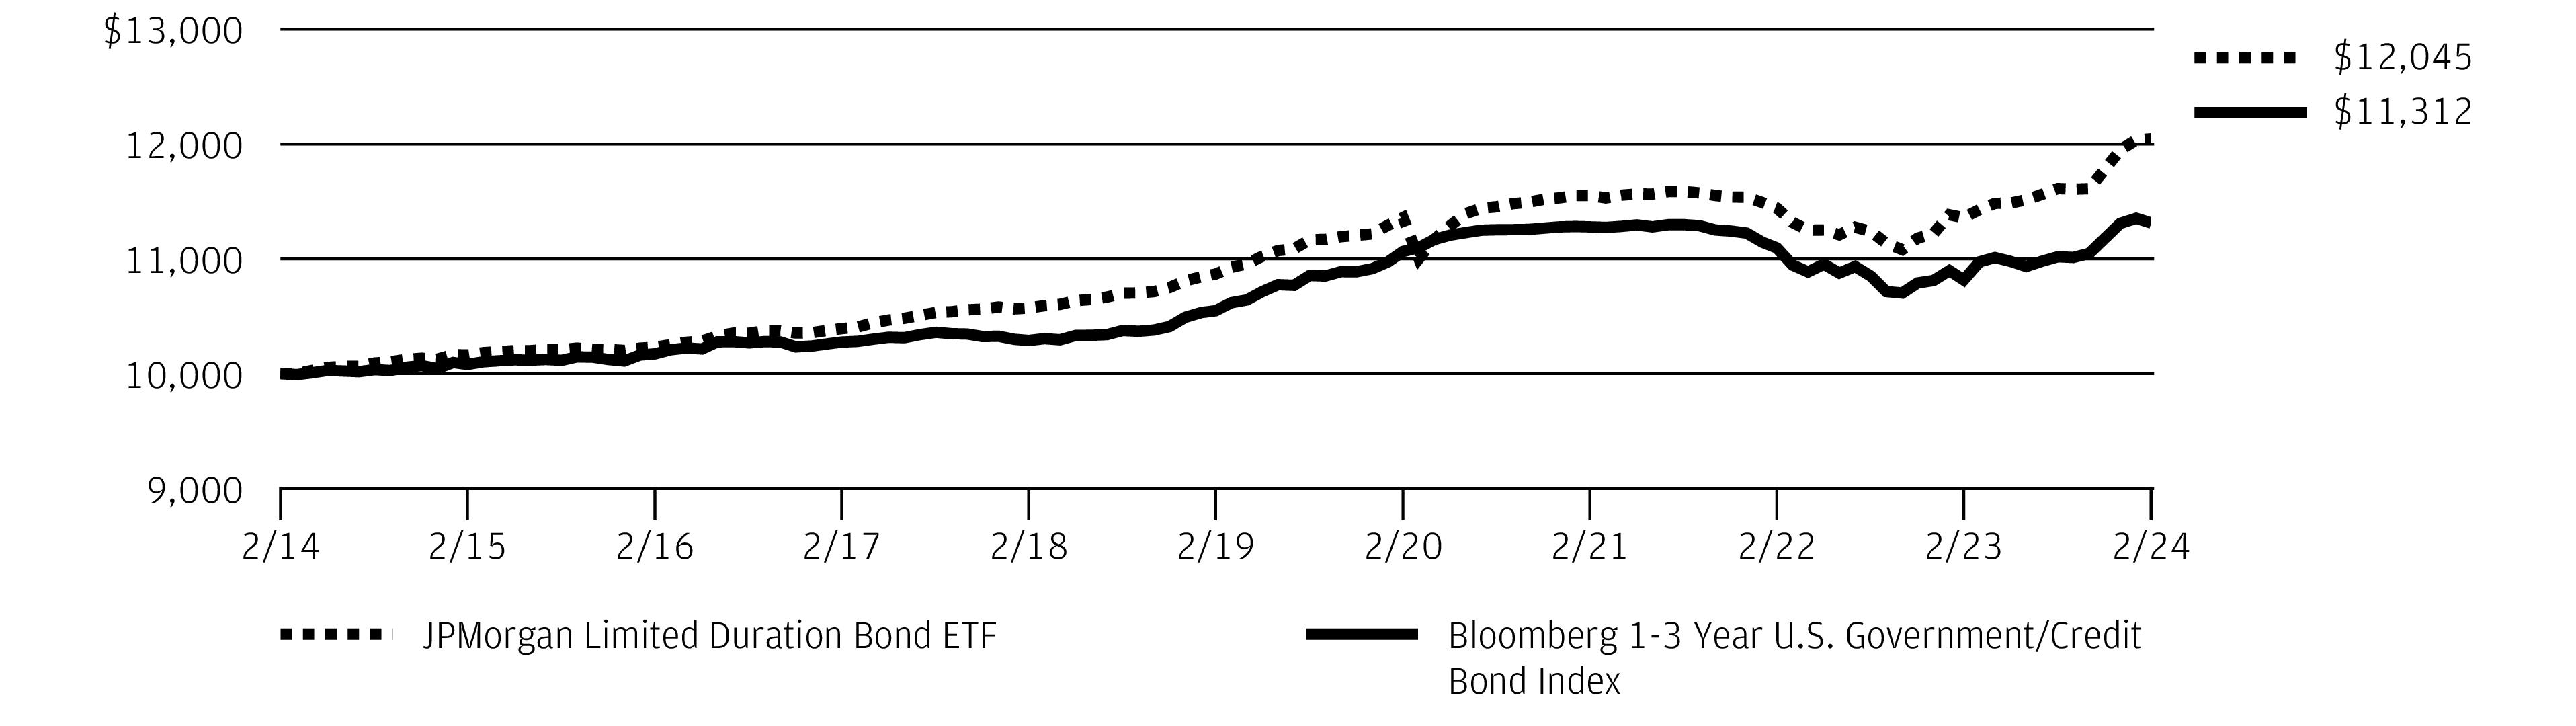
The performance quoted is past performance and is not a guarantee of future results. Exchange-traded funds are subject to certain market risks. Investment returns and principal value of an investment will fluctuate so that an investor’s shares, when sold or redeemed, may be worth more or less than their original cost. Current performance may be higher or lower than the performance data shown. Updated performance information is available by visiting www.jpmorganfunds.com or by calling 1-844-457-6383.
JPMorgan Limited Duration Bond ETF (the “Fund”) acquired the assets and liabilities of the JPMorgan Limited Duration Bond Fund (“Predecessor Fund”) in a reorganization that occurred as of the close of business on July 28, 2023. Performance and financial history of the Predecessor Fund’s Class R6 Shares have been adopted by the Fund and will be used going forward. As a result, the performance for the Fund prior to the close of business on July 28, 2023 is the performance of the Predecessor Fund’s Class R6 Shares. Inception date for the Predecessor Fund’s Class R6 Shares is February 22, 2005.
Performance for the Fund’s shares has not been adjusted to reflect the Fund’s shares lower expenses than those of the Predecessor Fund’s Class R6 Shares. Had the Predecessor Fund been structured as an exchange-traded fund (“ETF”), its performance may have differed. Performance for the Predecessor Fund is based on the net asset value (“NAV”) per share of the Predecessor Fund Shares rather than on market-determined prices. Prior to the Fund’s listing on July 31, 2023, the NAV performance of the Fund and the Class R6 Shares of the Predecessor Fund are used as proxy market price returns.
The graph illustrates comparative performance for $10,000 invested in shares of the Fund and the Bloomberg 1–3 Year U.S. Government/Credit Bond Index from February 28, 2014 to February 29, 2024. The performance of the Fund
reflects the deduction of Fund expenses and assumes reinvestment of all dividends and capital gain distributions, if any. The performance of the Bloomberg 1–3 Year U.S. Government/Credit Bond Index does not reflect the deduction of expenses associated with an ETF and approximates the minimum possible dividend reinvestment of the securities included in the Index, if applicable. The Bloomberg 1–3 Year U.S. Government/Credit Bond Index is an unmanaged index of investment grade government and corporate bonds with maturities of one to three years. Investors cannot invest directly in an index.
Fund performance may reflect the waiver of the Fund’s fees and reimbursement of expenses for certain periods. Without these waivers and reimbursements, performance would have been lower. Also, performance shown in this section does not reflect the deduction of taxes that a shareholder would pay on Fund distributions or on gains resulting from redemption or sale of Fund shares.
The returns shown are based on NAVs calculated for shareholder transactions and may differ from the returns shown in the financial highlights, which reflect adjustments made to the NAVs in accordance with accounting principles generally accepted in the United States of America.
Source: Bloomberg Index Services Limited. BLOOMBERG® is a trademark and service mark of Bloomberg Finance L.P. and its affiliates (collectively "Bloomberg"). Bloomberg or Bloomberg's licensors own all proprietary rights in the Bloomberg Indices. Bloomberg does not approve or endorse this material, or guarantee the accuracy or completeness of any information herein, or make any warranty, express or implied, as to the results to be obtained therefrom and, to the maximum extent allowed by law, shall have any liability or responsibility for injury or damages arising in connection therewith.
| J.P. Morgan Exchange-Traded Funds | |
JPMorgan Sustainable Municipal Income ETF
FUND COMMENTARYTWELVE MONTHS ENDED February 29, 2024 (Unaudited)
| |
| |
| |
Bloomberg U.S. 1-15 Year Blend (1-17) Municipal Bond Index | |
Net Assets as of 2/29/2024 | |
| |
| |
INVESTMENT OBJECTIVE***
The JPMorgan Sustainable Municipal Income ETF1 (the “Fund”) seeks current income exempt from federal income taxes.
INVESTMENT APPROACH
The Fund uses a value-oriented approach to invest in a core fixed income portfolio of municipal bonds, including securities whose proceeds aim to provide positive social or environmental benefits. The Fund uses extensive risk/reward analysis for factors such as income, interest rate risk, credit risk and the transaction’s legal/technical structure.
WHAT WERE THE MAIN DRIVERS OF THE FUND’S PERFORMANCE?
For the twelve months ended February 29, 2024, the Fund outperformed the Bloomberg U.S. 1-15 Year Blend (1-17) Municipal Bond Index (the “Benchmark”).
Relative to the Benchmark, the Fund’s longer overall duration was a leading contributor to performance as interest rates on municipal bonds fell in the second half of the period. Generally, bonds with longer durations will experience a smaller decrease
in price compared with longer duration bonds when interest rates rise. The Fund’s underweight position in the electric sector and its overweight position in the leasing sector also contributed to relative performance. The Fund’s underweight allocation to bonds rated AA and higher, and its overweight allocation to bonds rated single-A and lower also contributed to relative performance as lower quality bonds generally outperformed higher quality bonds.
The Fund’s shorter duration position in the housing sector and its underweight position in the industrial development revenue/pollution control revenue bonds sector were leading detractors from performance relative to the Benchmark.
HOW WAS THE FUND POSITIONED?
At the end of the reporting period, the Fund’s duration was 5.3 years and the Benchmark’s duration was 4.6 years.
1On July 14, 2023, the Fund acquired the assets and liabilities, and assumed the performance, financial and other historical information, of the JPMorgan Sustainable Municipal Income Fund (the “Predecessor Fund”), an open-end mutual fund that had operated since February 9, 1993. The Fund’s performance prior to July 14, 2023 is linked to the Predecessor Fund’s Class R6 Shares.
| J.P. Morgan Exchange-Traded Funds | |
JPMorgan Sustainable Municipal Income ETF
FUND COMMENTARYTWELVE MONTHS ENDED February 29, 2024 (Unaudited) (continued)
*
The return shown is based on net asset value and may differ from the return shown in the financial highlights, which reflects adjustments made to the net asset value in accordance with accounting principles generally accepted in the United States of America. The net asset value was $50.55 as of February 29, 2024.
**
Market price return was calculated assuming an initial investment made at the market price at the beginning of the reporting period, reinvestment of all dividends and distributions at the market price during the period, and sale at the market price on the last day of the period. Prior to the Fund's listing on July 17, 2023, the NAV performance of the Fund and the Class R6 Shares of the Predecessor Fund are used as proxy market price returns. The price used to calculate the market price return was the closing price on the NYSE Arca, Inc. As of February 29, 2024, the closing price was $50.49.
***
The adviser seeks to achieve the Fund’s objective. There can be no guarantee it will be achieved.
CREDIT QUALITY ALLOCATIONS
AS OF FEBRUARY 29, 2024 | PERCENT OF
TOTAL
INVESTMENTS |
| |
| |
| |
| |
| |
| |
| J.P. Morgan Exchange-Traded Funds | |
AVERAGE ANNUAL TOTAL RETURNS AS OF February 29, 2024 (Unaudited)
| | | | |
JPMorgan Sustainable Municipal Income ETF | | | | |
| | | | |
| | | | |
|
| Inception date for Class I Shares of the Predecessor Fund (as defined below). |
TEN YEAR FUND PERFORMANCE (2/28/14 TO 2/29/24)
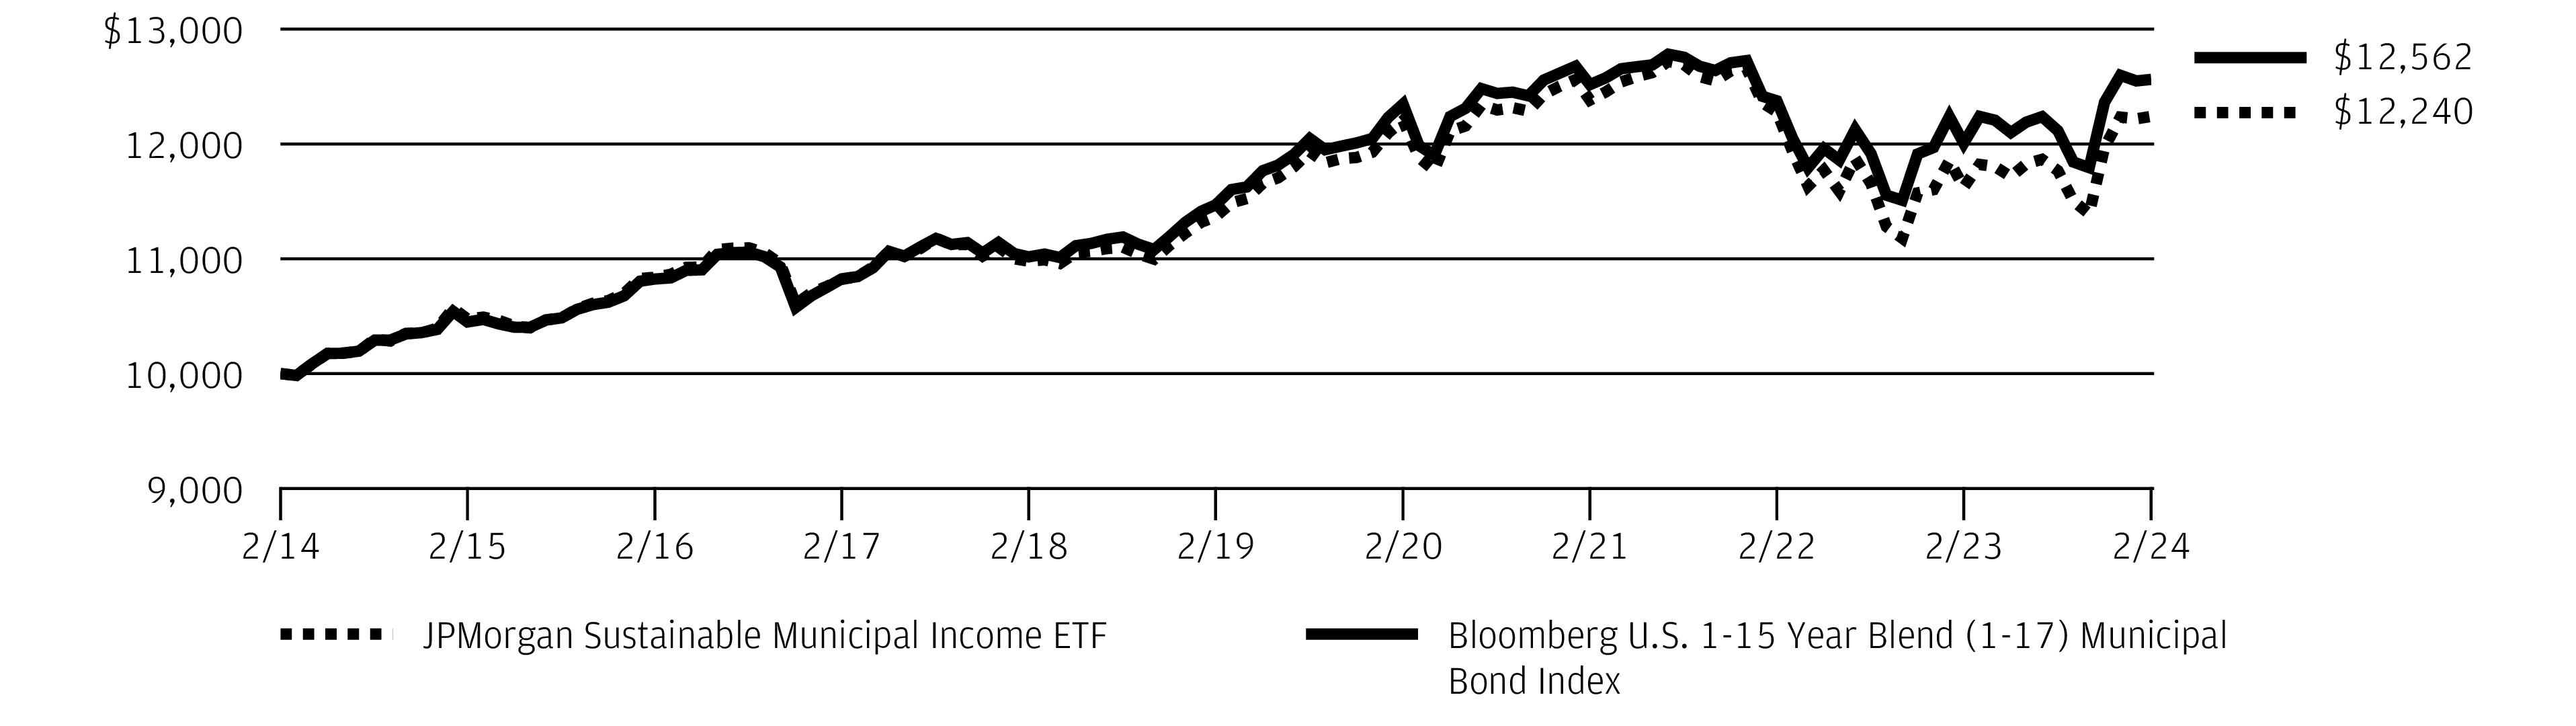
The performance quoted is past performance and is not a guarantee of future results. Exchange-traded funds are subject to certain market risks. Investment returns and principal value of an investment will fluctuate so that an investor’s shares, when sold or redeemed, may be worth more or less than their original cost. Current performance may be higher or lower than the performance data shown. Updated performance information is available by visiting www.jpmorganfunds.com or by calling 1-844-457-6383.
JPMorgan Sustainable Municipal Income ETF (the “Fund”) acquired the assets and liabilities of the JPMorgan Sustainable Municipal Income Fund (“Predecessor Fund”) in a reorganization that occurred as of the close of business on July 14, 2023. Performance and financial history of the Predecessor Fund’s Class R6 Shares have been adopted by the Fund and will be used going forward. As a result, the performance for the Fund prior to the close of business on July 14, 2023 is the performance of the Predecessor Fund’s Class R6 Shares. Inception date for the Predecessor Fund’s Class R6 Shares is November 6, 2017. Returns for the Predecessor Fund’s Class R6 Shares prior to their inception date are based on the performance of the Predecessors Fund’s Class I Shares. The actual returns of the Predecessor Fund’s Class R6 Shares would have been different than those shown because the Predecessor Fund’s Class R6 Shares had different expenses than the Predecessor Fund’s Class I Shares. Inception date for the Predecessor Fund’s Class I Shares is February 9, 1993.
Performance for the Fund’s shares has not been adjusted to reflect the Fund’s shares lower expenses than those of the Predecessor Fund’s Class R6 Shares and Class I Shares. Had the Predecessor Fund been structured as an exchange-traded fund (“ETF”), its performance may have differed. Performance for the Predecessor Fund is based on the net asset value (“NAV”) per share of the Predecessor Fund Shares rather than on market-determined prices. Prior to the Fund’s listing on July 17, 2023, the NAV performance of the Fund and the Class R6 Shares of the Predecessor Fund are used as proxy market price returns.
The graph illustrates comparative performance for $10,000 invested in shares of the Fund and the Bloomberg U.S. 1-15 Year Blend (1-17) Municipal Bond Index from February 28, 2014 to February 29, 2024. The performance of the Fund reflects the deduction of Fund expenses and assumes reinvestment of all dividends and capital gain distributions, if any. The performance of the Bloomberg U.S. 1-15 Year Blend (1-17) Municipal Bond Index does not reflect the deduction of expenses associated with an ETF and approximates the minimum possible dividend reinvestment of the securities included in the Index, if applicable. The Bloomberg U.S. 1-15 Year Blend (1-17) Municipal Bond Index represents the performance of municipal bonds with maturities from 1 to 17 years. Investors cannot invest directly in an index.
Fund performance may reflect the waiver of the Fund’s fees and reimbursement of expenses for certain periods. Without these waivers and reimbursements, performance would have been lower. Also, performance shown in this section does not reflect the deduction of taxes that a shareholder would pay on Fund distributions or on gains resulting from redemption or sale of Fund shares.
The returns shown are based on NAVs calculated for shareholder transactions and may differ from the returns shown in the financial highlights, which reflect adjustments made to the NAVs in accordance with accounting principles generally accepted in the United States of America.
Source: Bloomberg Index Services Limited. BLOOMBERG® is a trademark and service mark of Bloomberg Finance L.P. and its affiliates (collectively "Bloomberg"). Bloomberg or Bloomberg's licensors own all proprietary rights in the Bloomberg Indices. Bloomberg does not approve or endorse this material, or guarantee the accuracy or completeness of any information herein, or make any warranty, express or implied, as to the results to be obtained therefrom and, to the maximum extent allowed by law, shall have any liability or responsibility for injury or damages arising in connection therewith.
| J.P. Morgan Exchange-Traded Funds | |
JPMorgan High Yield Municipal ETF
SCHEDULE OF PORTFOLIO INVESTMENTSAS OF February 29, 2024
| | |
Municipal Bonds — 91.0% (a) |
|
Black Belt Energy Gas District, Gas Project | | |
Series 2023D-1, Rev., 5.50%, 2/1/2029 (b) | | |
Series 2021A, Rev., 4.00%, 12/1/2031 (b) | | |
| | |
Series 2024, Rev., 5.25%, 10/1/2049 | | |
Series 2024, Rev., 5.50%, 10/1/2053 | | |
| | |
|
Arizona Industrial Development Authority, Doral Academy of Northern Nevada Project Series 2021A, Rev., 4.00%, 7/15/2041 (c) | | |
Arizona Industrial Development Authority, Great Lakes Senior Living Communities LLC Project | | |
Series 2019A, Rev., 5.00%, 1/1/2029 | | |
Series 2019A, Rev., 5.00%, 1/1/2037 | | |
Series 2019A, Rev., 5.00%, 1/1/2038 | | |
Series 2019A, Rev., 4.25%, 1/1/2039 | | |
Series 2019A, Rev., 4.50%, 1/1/2049 | | |
Maricopa County Industrial Development Authority, Ottawa University | | |
Rev., 5.00%, 10/1/2026 (c) | | |
Rev., 5.13%, 10/1/2030 (c) | | |
| | |
|
Arkansas Development Finance Authority, Industrial Development , Hybar Steel Project Series 2023B, Rev., AMT, 7.38%, 7/1/2048 (c) | | |
|
California Community Choice Financing Authority, Clean Energy Project Series 2023B-1, Rev., 5.00%, 8/1/2029 (b) | | |
California Community Housing Agency, Glendale Properties Series 2021A-2, Rev., 4.00%, 8/1/2047 (c) | | |
California Infrastructure and Economic Development Bank, Brightline West Passenger Rail Project | | |
Series 2020A-3, Rev., AMT, 8.00%, 8/15/2024 (b) (c) | | |
Series 2020A, Rev., AMT, 3.95%, 1/30/2025 (b) (c) | | |
California Municipal Finance Authority, Linxs Apartments Project, Senior Lien Series 2018 A, Rev., AMT, 5.00%, 12/31/2047 | | |
| | |
|
|
California Public Finance Authority, Laverne Elementary Preparatory Academy Series 2019A, Rev., 5.00%, 6/15/2039 (c) | | |
California School Facilities Financing Authority, Capital Appreciation, Azusa Unified School District Series 2009A, Rev., AGM, Zero Coupon, 8/1/2030 | | |
California Statewide Communities Development Authority, Loma Linda University Medical Center Series 2016 A, Rev., 5.25%, 12/1/2056 (c) | | |
CSCDA Community Improvement Authority, Essential Housing, Mezzanine Lien Series 2021B, Rev., 4.00%, 2/1/2057 (c) | | |
CSCDA Community Improvement Authority, Essential Housing, Oceanaire-Long Beach Series 2021A-2, Rev., 4.00%, 9/1/2056 (c) | | |
CSCDA Community Improvement Authority, Essential Housing, Towne at Glendale Apartments Series 2022B, Rev., 5.00%, 9/1/2037 (c) | | |
Golden State Tobacco Securitization Corp., Enhanced Tobacco Settlement Series 2021B-2, Rev., Zero Coupon, 6/1/2066 | | |
San Diego County Regional Airport Authority Series 2023B, Rev., AMT, 5.00%, 7/1/2048 | | |
| | |
|
Bradburn Metropolitan District No. 2, Limited Tax | | |
Series 2018A, GO, 5.00%, 12/1/2038 | | |
Series 2018B, GO, 7.25%, 12/15/2047 | | |
Canyon Pines Metropolitan District Special Improvement District No. 1 Series 2021A-2, 3.75%, 12/1/2040 | | |
Colorado Housing and Finance Authority Series 2023L, Class III, Rev., GNMA COLL, 5.75%, 11/1/2053 | | |
Dominion Water and Sanitation District Rev., 5.25%, 12/1/2032 | | |
Raindance Metropolitan District No. 1, Non-Potable Water System Rev., 5.00%, 12/1/2040 | | |
Reunion Metropolitan District Series 2021A, Rev., 3.63%, 12/1/2044 | | |
Rocky Mountain Rail Park Metropolitan District, Limited Tax Series 2021A, GO, 5.00%, 12/1/2041 (c) | | |
| | |
Municipal Bonds — continued |
|
Third Creek Metropolitan District No. 1, Limited Tax | | |
Series 2022A-1, GO, 4.50%, 12/1/2037 | | |
Series 2022A-1, GO, 4.75%, 12/1/2051 | | |
Verve Metropolitan District No. 1 GO, 5.00%, 12/1/2041 | | |
Westerly Metropolitan District No. 4, Limited Tax Series 2021A, GO, 5.00%, 12/1/2040 | | |
Windler Public Improvement Authority, Limited Tax Series 2021A-1, Rev., 4.00%, 12/1/2036 | | |
| | |
|
Stamford Housing Authority, The Dogwoods Project Rev., BAN, 11.00%, 12/1/2027 (c) | | |
|
Delaware State Economic Development Authority, Delmarva Power and Light Co. Project Series 2020A, Rev., 1.05%, 7/1/2025 (b) | | |
|
Capital Trust Agency, Inc., Legends Academy Project Series 2021A, Rev., 5.00%, 12/1/2045 (c) | | |
Florida Development Finance Corp., Educational Facilities, UCP Charter Schools Project Series 2020A, Rev., 5.00%, 6/1/2040 | | |
Florida Development Finance Corp., Idea Florida, Inc., Jacksonville IV Project Rev., 5.25%, 6/15/2029 (c) | | |
Martin County Health Facilities Authority, Cleveland Clinic Health System Obligated Group Series 2019A, Rev., 4.00%, 1/1/2046 | | |
Miami-Dade County Industrial Development Authority, Solid Waste Disposal, Waste Management, Inc., Project Series 2011, Rev., AMT, 5.00%, 11/1/2024 (b) | | |
Palm Beach County Health Facilities Authority, Jupiter Medical Center Series 2022, Rev., 5.00%, 11/1/2052 | | |
| | |
|
Columbia County Hospital Authority, Wellstart Health System Inc., Project Series 2023A, Rev., AGM, 5.00%, 4/1/2048 | | |
| | |
|
|
Main Street Natural Gas, Inc., Gas Supply Series 2023A, Rev., 5.00%, 6/1/2030 (b) | | |
Municipal Electric Authority of Georgia, Plant Vogtle Units 3 and 4 Project Series 2019B, Rev., 5.00%, 1/1/2059 | | |
| | |
|
Idaho Housing and Finance Association, Compass Public Charter School, Inc., Project Series 2018A, Rev., 4.63%, 7/1/2029 (c) | | |
|
Chicago O'Hare International Airport, General Airport, Senior Lien Series 2018A, Rev., AMT, 5.00%, 1/1/2053 | | |
Chicago Transit Authority Sales Tax Receipts Fund Series 2014, Rev., 5.25%, 12/1/2049 | | |
Illinois Finance Authority, Plymouth Place, Inc. Series 2022B-1, Rev., 6.00%, 11/15/2027 | | |
| | |
| | |
Series 2019C, GO, 4.00%, 11/1/2042 | | |
Series 2020C, GO, 4.25%, 10/1/2045 | | |
Series 2023B, GO, 4.50%, 5/1/2048 | | |
| | |
|
City of Goshen, Multi-Family, Green Oaks of Goshen Project Series 2021A, Rev., 5.00%, 8/1/2041 (c) | | |
City of Valparaiso Rev., 5.38%, 12/1/2041 (c) | | |
Indiana Finance Authority, Educational Facilities, Kipp Indianapolis, Inc., Project Series 2020A, Rev., 5.00%, 7/1/2055 | | |
Indiana Housing and Community Development Authority, Vita of Marion Project Series 2021A, Rev., 5.25%, 4/1/2041 (c) | | |
Indianapolis Local Public Improvement Bond Bank Series 2023F-1, Rev., 5.25%, 3/1/2067 | | |
| | |
|
City of Wichita, Health Care Facilities, Presbyterian Manors, Inc. | | |
Series 2018 I, Rev., 5.00%, 5/15/2033 | | |
Series 2018 I, Rev., 5.00%, 5/15/2038 | | |
| | |
JPMorgan High Yield Municipal ETF
SCHEDULE OF PORTFOLIO INVESTMENTSAS OF February 29, 2024 (continued)
| | |
Municipal Bonds — continued |
|
Louisiana Public Facilities Authority, Lincoln Preparatory School Project Series 2021A, Rev., 5.25%, 6/1/2051 (c) | | |
Louisiana Public Facilities Authority, Mentorship Steam Academy Project | | |
Series 2021A, Rev., 5.00%, 6/1/2051 (c) | | |
Series 2021A, Rev., 5.00%, 6/1/2056 (c) | | |
| | |
|
Maryland Health and Higher Educational Facilities Authority, University of Maryland Medical System Series 2008D, Rev., VRDO, LOC : TD Bank NA, 3.65%, 3/1/2024 (b) | | |
|
City of Detroit, Unlimited Tax Series 2020, GO, 5.50%, 4/1/2050 | | |
State of Michigan Trunk Line Series 2020 B, Rev., 4.00%, 11/15/2045 | | |
| | |
|
County of Gallatin, Bozeman Fiber Project Series 2021A, Rev., 4.00%, 10/15/2032 (c) | | |
|
Central Plains Energy Project, Gas Project No. 4 Series 2023 A-1, Rev., 5.00%, 11/1/2029 (b) | | |
|
New Jersey Economic Development Authority Series 2020, Rev., 5.00%, 1/1/2040 (c) (d) | | |
New Jersey Economic Development Authority, Black Horse EHT Urban Renewal LLC Project Series 2019A, Rev., 5.00%, 10/1/2039 (c) (d) | | |
New Jersey Economic Development Authority, Marion P. Thomas Charter School, Inc., Project Series 2018A, Rev., 5.00%, 10/1/2033 (c) | | |
Tobacco Settlement Financing Corp. Series 2018B, Rev., 5.00%, 6/1/2046 | | |
| | |
|
Buffalo & Fort Erie Public Bridge Authority Series 2017, Rev., 5.00%, 1/1/2047 | | |
Build NYC Resource Corp., Richmond Charter Schools Series 2021A, Rev., 5.00%, 6/1/2051 (c) | | |
| | |
|
|
City of New York, Fiscal Year 2023 Series 2023A, Subseries A-3, GO, VRDO, LIQ : Bank of Montreal, 3.65%, 3/1/2024 (b) | | |
Jefferson County Civic Facility Development Corp., Samaritan Medical Center Project Series 2017A, Rev., 4.00%, 11/1/2042 | | |
Monroe County Industrial Development Corp.,Rochester Regional Health Project Series 2020A, Rev., 4.00%, 12/1/2036 | | |
New York City Transitional Finance Authority, Future Tax Secured, Fiscal Year 2019 Series 2019C-4, Rev., VRDO, LIQ : Barclays Bank plc, 2.85%, 3/1/2024 (b) | | |
New York Counties Tobacco Trust Series 2016 A-2B, Rev., 5.00%, 6/1/2051 | | |
New York Transportation Development Corp., Delta Air Lines, Inc., LaGuardia Airport Terminals C&D Redevelopment Project | | |
Rev., AMT, 5.00%, 1/1/2028 | | |
Rev., AMT, 5.00%, 1/1/2034 | | |
Series 2023, Rev., AMT, 6.00%, 4/1/2035 | | |
Rev., AMT, 4.38%, 10/1/2045 | | |
Series 2016 A, Rev., AMT, 5.00%, 7/1/2046 | | |
New York Transportation Development Corp., JFK International Airport New Terminal One Project Series 2023, Rev., AMT, AGM, 5.00%, 6/30/2049 | | |
| | |
|
Water and Sewer Authority of Cabarrus County Series 2024, Rev., 4.00%, 6/1/2049 | | |
|
Buckeye Tobacco Settlement Financing Authority | | |
Series 2020A-2 CL 1, Rev., 4.00%, 6/1/2039 | | |
Series 2020B-2, Rev., 5.00%, 6/1/2055 | | |
Series 2020B-3, Rev., Zero Coupon, 6/1/2057 | | |
Jefferson County Port Authority, JSW Steel USA Ohio, Inc., Project Series 2023, Rev., 5.00%, 12/1/2028 (b) (c) | | |
Ohio Air Quality Development Authority, Duke Energy Corp. Series 2022A, Rev., AMT, 4.25%, 6/1/2027 (b) | | |
| | |
| | |
Municipal Bonds — continued |
|
Oklahoma Development Finance Authority, Health System, OU Medicine Project Series 2018B, Rev., 5.50%, 8/15/2057 | | |
|
Allegheny County Airport Authority, Pittsburgh International Airport Series 2023A, Rev., AMT, AGM, 5.50%, 1/1/2048 | | |
Pennsylvania Economic Development Financing Authority, Senior Insured, Capitol Region Parking System Series 2024 A, Rev., AGM, 4.00%, 1/1/2041 (e) | | |
Philadelphia Authority for Industrial Development, International Education and Community Initiatives Project Series 2018A, Rev., 4.50%, 6/1/2029 (c) | | |
| | |
|
Commonwealth of Puerto Rico Series A, GO, 0.00%, 11/1/2043 (b) | | |
Puerto Rico Sales Tax Financing Corp. Sales Tax (Puerto Rico) | | |
Series A-1, Rev., Zero Coupon, 7/1/2046 | | |
Series A-2, Rev., 4.78%, 7/1/2058 | | |
| | |
|
Nashville Metropolitan Development and Housing Agency, Tax Increment, Fifth Broadway Development Project Series 2018, Rev., 5.13%, 6/1/2036 (c) | | |
Shelby County Health Educational and Housing Facilities Board Retirement Facility The Farm At Bailey Station Series 2019A, Rev., 5.50%, 10/1/2039 | | |
Shelby County Health Educational and Housing Facilities Board, The Farms at Bailey Station Project Series 2019A, Rev., 5.75%, 10/1/2059 | | |
| | |
|
Arlington Higher Education Finance Corp., Winfree Academy Charter Schools Series 2019A, Rev., 5.75%, 8/15/2043 | | |
City of Houston, Combined Utility System, Junior Lien Series A, Rev., AGM, Zero Coupon, 12/1/2027 (f) | | |
| | |
|
|
New Hope Cultural Education Facilities Finance Corp., Legacy Midtown Park Project Series 2018A, Rev., 5.50%, 7/1/2054 | | |
New Hope Cultural Education Facilities Finance Corp., Morningside Ministries Project Rev., 4.00%, 1/1/2037 | | |
Tarrant County Cultural Education Facilities Finance Corp., Retirement Facility, MRC Stevenson Oaks Project Series 2020A, Rev., 6.25%, 11/15/2031 | | |
Texas Private Activity Bond Surface Transportation Corp., NTE Mobility Partners Segments 3 LLC Project Series 2019, Rev., AMT, 5.00%, 6/30/2058 | | |
Texas Water Development Board Series 2023 A, Rev., 5.00%, 10/15/2058 | | |
| | |
|
Mida Golf and Equestrian Center Public Infrastructure District, Limited Tax GO, 4.25%, 6/1/2041 (c) | | |
Mida Mountain Village Public Infrastructure District, Mountain Village Assessment Area Series 2020B, 6.25%, 8/1/2030 (c) | | |
Utah Charter School Finance Authority, Wallace Stegner Academy | | |
Series 2022A, Rev., 5.25%, 6/15/2032 (c) | | |
Series 2022A, Rev., 5.63%, 6/15/2042 (c) | | |
| | |
|
Fredericksburg Economic Development Authority, Stadium Project | | |
Series 2021A, Rev., 7.00%, 11/15/2026 (c) | | |
Series 2019B, Rev., 6.13%, 9/1/2029 (c) | | |
Series 2019B, Rev., 7.00%, 9/1/2044 (c) | | |
Roanoke County Economic Development Authority, Residential Care Facility, Richfield Living | | |
Series 2019A, Rev., 4.75%, 9/1/2029 (d) | | |
Series 2019A, Rev., 5.00%, 9/1/2034 (d) | | |
Virginia Small Business Financing Authority, Environmental Facilities Series 2022, Rev., 5.00%, 11/15/2024 (b) | | |
| | |
JPMorgan High Yield Municipal ETF
SCHEDULE OF PORTFOLIO INVESTMENTSAS OF February 29, 2024 (continued)
| | |
Municipal Bonds — continued |
|
Washington State Housing Finance Commission, Seattle Academy of Arts and Science Project Series 2023, Rev., 6.38%, 7/1/2063 (c) | | |
|
Public Finance Authority, Cedars Obligated Group Series 2019, Rev., 4.25%, 5/1/2029 (c) | | |
Public Finance Authority, Presbyterian Villages of Michigan Obligated Group Series 2020A, Rev., 4.00%, 11/15/2042 (c) | | |
Public Finance Authority, Ripple Ranch, LLC Obligate Series 2021A, Rev., 5.25%, 12/1/2051 (c) | | |
Public Finance Authority, The Franklin School of Innovation Rev., 5.00%, 1/1/2042 (c) | | |
Public Finance Authority, Viticus Group Project Series 2022A, Rev., 4.00%, 12/1/2031 (c) | | |
Public Finance Authority, Wilson Preparatory Academy | | |
Series 2019A, Rev., 5.00%, 6/15/2039 (c) | | |
Series 2019A, Rev., 5.00%, 6/15/2049 (c) | | |
Wisconsin Health and Educational Facilities Authority, Ascension Senior Credit Group Series 2016 A, Rev., 5.00%, 11/15/2035 | | |
Wisconsin Health and Educational Facilities Authority, Forensic science and Protective Medicine Collaboration, Inc. Project Series 2024, Rev., 5.00%, 8/1/2027 (c) (e) | | |
Wisconsin Housing and Economic Development Authority Home Ownership Series 2024 A, Rev., GNMA / FNMA / FHLMC, 6.00%, 9/1/2054 | | |
| | |
Total Municipal Bonds
(Cost $166,895,711) | | |
| | |
Short-Term Investments — 9.1% |
Investment Companies — 9.1% |
JPMorgan Institutional Tax Free Money Market Fund Class IM Shares, 3.37% (g) (h)
(Cost $15,937,390) | | |
Total Investments — 100.1%
(Cost $182,833,101) | | |
Liabilities in Excess of Other Assets — (0.1)% | | |
| | |
Percentages indicated are based on net assets. |
| |
| Insured by Assured Guaranty Municipal Corp. |
| |
| |
| |
| Federal Home Loan Mortgage Corp. |
| Federal National Mortgage Association |
| Government National Mortgage Association |
| |
| |
| |
| |
| Variable Rate Demand Obligation |
| The date shown represents the earliest of the prerefunded date, next put date or final maturity date. |
| Variable or floating rate security, the interest rate of which adjusts periodically based on changes in current interest rates and prepayments on the underlying pool of assets. The interest rate shown is the current rate as of February 29, 2024. |
| Securities exempt from registration under Rule 144A or section 4(a)(2), of the Securities Act of 1933, as amended. |
| |
| All or a portion of the security is a when-issued security, delayed delivery security, or forward commitment. |
| Security is prerefunded or escrowed to maturity. |
| Investment in an affiliated fund, which is registered under the Investment Company Act of 1940, as amended, and is advised by J.P. Morgan Investment Management Inc. |
| The rate shown is the current yield as of February 29, 2024. |
JPMorgan Limited Duration Bond ETF
SCHEDULE OF PORTFOLIO INVESTMENTSAS OF February 29, 2024
| | |
Asset-Backed Securities — 37.7% |
ACRE Commercial Mortgage Ltd. Series 2021-FL4, Class A, 6.26%, 12/18/2037 (a) (b) | | |
American Credit Acceptance Receivables Trust Series 2023-1, Class A, 5.45%, 9/14/2026 (a) | | |
Ameriquest Mortgage Securities, Inc. Asset-Backed Pass-Through Certificates Series 2003-7, Class M1, 4.84%, 8/25/2033 (b) | | |
Amortizing Residential Collateral Trust Series 2002-BC9, Class M1, 7.09%, 12/25/2032 (b) | | |
| | |
Series 2020-SFR3, Class A, 1.36%, 9/17/2037 (a) | | |
Series 2021-SFR2, Class A, 1.53%, 8/17/2038 (a) | | |
Apidos CLO (Cayman Islands) Series 2019-31A, Class A1R, 6.68%, 4/15/2031 (a) (b) | | |
Arivo Acceptance Auto Loan Receivables Trust Series 2021-1A, Class A, 1.19%, 1/15/2027 (a) | | |
Auxilior Term Funding LLC Series 2023-1A, Class A2, 6.18%, 12/15/2028 (a) | | |
Ballyrock CLO Ltd. (Cayman Islands) | | |
Series 2020-2A, Class A1R, 6.59%, 10/20/2031 (a) (b) | | |
Series 2019-1A, Class A1R, 6.61%, 7/15/2032 (a) (b) | | |
Bear Stearns Asset-Backed Securities I Trust Series 2005-HE1, Class M2, 5.24%, 1/25/2035 (b) | | |
Bear Stearns Asset-Backed Securities Trust Series 2003-SD1, Class A, 6.34%, 12/25/2033 (b) | | |
BRE Grand Islander Timeshare Issuer LLC Series 2019-A, Class A, 3.28%, 9/26/2033 (a) | | |
BSPRT Issuer Ltd. (Cayman Islands) Series 2022-FL8, Class A, 6.82%, 2/15/2037 (a) (b) | | |
Business Jet Securities LLC | | |
Series 2020-1A, Class A, 2.98%, 11/15/2035 ‡ (a) | | |
Series 2021-1A, Class A, 2.16%, 4/15/2036 ‡ (a) | | |
Series 2022-1A, Class A, 4.46%, 6/15/2037 ‡ (a) | | |
BXG Receivables Note Trust Series 2018-A, Class A, 3.77%, 2/2/2034 (a) | | |
| | |
|
BXMT Ltd. (Cayman Islands) Series 2020-FL3, Class A, 6.84%, 11/15/2037 (a) (b) | | |
| | |
Series 2020-4, Class A3, 0.50%, 8/15/2025 | | |
Series 2022-2, Class A3, 3.49%, 2/16/2027 | | |
Carvana Auto Receivables Trust | | |
Series 2020-P1, Class A4, 0.61%, 10/8/2026 | | |
Series 2023-N4, Class A, 6.42%, 1/10/2028 (a) | | |
Centex Home Equity Loan Trust Series 2002-A, Class MV1, 6.29%, 1/25/2032 (b) | | |
CF Hippolyta Issuer LLC Series 2020-1, Class A1, 1.69%, 7/15/2060 (a) | | |
CoreVest American Finance Trust | | |
Series 2020-2, Class A, 3.38%, 5/15/2052 (a) | | |
Series 2020-4, Class A, 1.17%, 12/15/2052 (a) | | |
Countrywide Asset-Backed Certificates | | |
Series 2003-BC2, Class 2A1, 6.04%, 6/25/2033 (b) | | |
Series 2004-S1, Class M2, 5.58%, 2/25/2035 (c) | | |
CPS Auto Receivables Trust | | |
Series 2023-A, Class A, 5.54%, 3/16/2026 (a) | | |
Series 2022-C, Class A, 4.18%, 4/15/2030 (a) | | |
Credit Acceptance Auto Loan Trust Series 2023-3A, Class A, 6.39%, 8/15/2033 (a) | | |
Diamond Resorts Owner Trust Series 2021-1A, Class A, 1.51%, 11/21/2033 (a) | | |
DLLST LLC Series 2022-1A, Class A3, 3.40%, 1/21/2025 (a) | | |
| | |
Series 2022-2A, Class A, 2.88%, 6/15/2026 (a) | | |
Series 2021-1A, Class C, 0.84%, 10/15/2026 (a) | | |
Series 2023-1A, Class A, 5.48%, 4/15/2027 (a) | | |
Elmwood CLO Ltd. (Cayman Islands) Series 2020-2A, Class AR, 6.73%, 10/20/2034 (a) (b) | | |
Enterprise Fleet Financing LLC Series 2022-1, Class A2, 3.03%, 1/20/2028 (a) | | |
Exeter Automobile Receivables Trust Series 2023-4A, Class C, 6.51%, 8/15/2028 | | |
JPMorgan Limited Duration Bond ETF
SCHEDULE OF PORTFOLIO INVESTMENTSAS OF February 29, 2024 (continued)
| | |
Asset-Backed Securities — continued |
First Franklin Mortgage Loan Trust | | |
Series 2002-FF1, Class M1, 6.49%, 4/25/2032 (b) | | |
Series 2002-FF4, Class M1, 7.01%, 2/25/2033 (b) | | |
Series 2003-FFH1, Class M2, 8.06%, 9/25/2033 (b) | | |
Series 2004-FF8, Class M4, 7.04%, 10/25/2034 (b) | | |
FirstKey Homes Trust Series 2021-SFR1, Class A, 1.54%, 8/17/2038 (a) | | |
FS Rialto (Cayman Islands) Series 2021-FL3, Class A, 6.69%, 11/16/2036 (a) (b) | | |
Galaxy CLO Ltd. (Cayman Islands) Series 2013-15A, Class ARR, 6.55%, 10/15/2030 (a) (b) | | |
Goodgreen (Cayman Islands) | | |
Series 2018-1A, Class A, 3.93%, 10/15/2053 ‡ (a) (b) | | |
Series 2019-1A, Class A, 3.86%, 10/15/2054 ‡ (a) | | |
Goodgreen Trust Series 2017-2A, Class A, 3.26%, 10/15/2053 ‡ (a) | | |
GreenPoint Mortgage Funding Trust Series 2005-HE3, Class A, 5.61%, 9/15/2030 (b) | | |
HERO Funding (Cayman Islands) Series 2017-3A, Class A2, 3.95%, 9/20/2048 ‡ (a) | | |
Hilton Grand Vacations Trust | | |
Series 2018-AA, Class A, 3.54%, 2/25/2032 (a) | | |
Series 2022-2A, Class A, 4.30%, 1/25/2037 (a) | | |
Series 2020-AA, Class A, 2.74%, 2/25/2039 (a) | | |
LCM Ltd. (Cayman Islands) Series 29A, Class AR, 6.65%, 4/15/2031 (a) (b) | | |
Lendingpoint Asset Securitization Trust | | |
Series 2022-B, Class A, 4.77%, 10/15/2029 (a) | | |
Series 2022-C, Class A, 6.56%, 2/15/2030 (a) | | |
Lendmark Funding Trust Series 2022-1A, Class A, 5.12%, 7/20/2032 (a) | | |
LP LMS Asset Securitization Trust | | |
Series 2021-2A, Class A, 1.75%, 1/15/2029 (a) | | |
Series 2023-1A, Class A, 8.18%, 10/17/2033 (a) | | |
| | |
|
Mariner Finance Issuance Trust | | |
Series 2020-AA, Class A, 2.19%, 8/21/2034 (a) | | |
Series 2021-AA, Class A, 1.86%, 3/20/2036 (a) | | |
Marlin Receivables LLC Series 2022-1A, Class A2, 4.53%, 9/20/2025 (a) | | |
MF1 Ltd. (Cayman Islands) | | |
Series 2021-FL7, Class A, 6.51%, 10/16/2036 (a) (b) | | |
Series 2022-FL8, Class A, 6.67%, 2/19/2037 (a) (b) | | |
Neuberger Berman Loan Advisers CLO Ltd. (Cayman Islands) Series 2020-37A, Class AR, 6.55%, 7/20/2031 (a) (b) | | |
New Century Home Equity Loan Trust Series 2003-5, Class AII, 3.84%, 11/25/2033 (b) | | |
OCP CLO Ltd. (Cayman Islands) Series 2015-9A, Class A1R2, 6.57%, 1/15/2033 (a) (b) | | |
OneMain Financial Issuance Trust Series 2021-1A, Class A1, 1.55%, 6/16/2036 (a) | | |
Oportun Issuance Trust Series 2022-A, Class A, 5.05%, 6/9/2031 (a) | | |
Pagaya AI Technology in Housing Trust Series 2023-1, Class A, 3.60%, 10/25/2040 (a) | | |
Palmer Square Loan Funding Ltd. (Cayman Islands) | | |
Series 2021-3A, Class A1, 6.38%, 7/20/2029 (a) (b) | | |
Series 2021-4A, Class A1, 6.38%, 10/15/2029 (a) (b) | | |
Series 2022-2A, Class A1, 6.58%, 10/15/2030 (a) (b) | | |
PRET LLC Series 2021-NPL6, Class A1, 2.49%, 7/25/2051 (a) (c) | | |
| | |
Series 2021-SFR1, Class A, 1.05%, 4/17/2038 (a) | | |
Series 2021-SFR4, Class A, 1.56%, 5/17/2038 (a) | | |
Progress Residential Trust | | |
Series 2020-SFR3, Class A, 1.29%, 10/17/2027 (a) | | |
Series 2020-SFR2, Class A, 2.08%, 6/17/2037 (a) | | |
Series 2021-SFR8, Class A, 1.51%, 10/17/2038 (a) | | |
Series 2023-SFR1, Class A, 4.30%, 3/17/2040 (a) | | |
| | |
Asset-Backed Securities — continued |
Series 2024-SFR1, Class A, 3.35%, 2/17/2041 (a) | | |
PRPM LLC Series 2021-10, Class A1, 2.49%, 10/25/2026 (a) (c) | | |
RASC Trust Series 2003-KS4, Class MI2, 5.01%, 6/25/2033 (c) | | |
Santander Consumer Auto Receivables Trust Series 2021-AA, Class B, 0.71%, 8/17/2026 (a) | | |
Santander Drive Auto Receivables Trust Series 2022-4, Class A3, 4.14%, 2/16/2027 | | |
SCF Equipment Leasing LLC Series 2022-2A, Class A3, 6.50%, 10/21/2030 (a) | | |
Sierra Timeshare Receivables Funding LLC | | |
Series 2019-2A, Class A, 2.59%, 5/20/2036 (a) | | |
Series 2020-2A, Class A, 1.33%, 7/20/2037 (a) | | |
SoFi Professional Loan Program Trust | | |
Series 2021-B, Class AFX, 1.14%, 2/15/2047 (a) | | |
Series 2018-B, Class A2FX, 3.34%, 8/25/2047 (a) | | |
Structured Asset Investment Loan Trust Series 2003-BC2, Class A3, 6.14%, 4/25/2033 (b) | | |
Symphony CLO Ltd. (Cayman Islands) Series 2016-18A, Class A1RR, 6.68%, 7/23/2033 (a) (b) | | |
Tesla Auto Lease Trust Series 2021-B, Class A4, 0.63%, 9/22/2025 (a) | | |
Toyota Auto Receivables Owner Trust Series 2020-C, Class A4, 0.57%, 10/15/2025 | | |
Tricon American Homes Series 2020-SFR1, Class A, 1.50%, 7/17/2038 (a) | | |
Tricon American Homes Trust Series 2019-SFR1, Class A, 2.75%, 3/17/2038 (a) | | |
Upstart Securitization Trust | | |
Series 2022-4, Class A, 5.98%, 8/20/2032 (a) | | |
Series 2023-1, Class A, 6.59%, 2/20/2033 (a) | | |
US Auto Funding Trust Series 2022-1A, Class A, 3.98%, 4/15/2025 (a) | | |
VCAT LLC Series 2021-NPL1, Class A1, 5.29%, 12/26/2050 (a) (c) | | |
Verdant Receivables LLC Series 2023-1A, Class A2, 6.24%, 1/13/2031 (a) | | |
VOLT C LLC Series 2021-NPL9, Class A1, 1.99%, 5/25/2051 (a) (c) | | |
| | |
|
VOLT XCII LLC Series 2021-NPL1, Class A1, 4.89%, 2/27/2051 (a) (c) | | |
VOLT XCIII LLC Series 2021-NPL2, Class A1, 4.89%, 2/27/2051 (a) (c) | | |
VOLT XCIV LLC Series 2021-NPL3, Class A1, 2.24%, 2/27/2051 (a) (c) | | |
VOLT XCIX LLC Series 2021-NPL8, Class A1, 2.12%, 4/25/2051 (a) (c) | | |
VOLT XCV LLC Series 2021-NPL4, Class A1, 5.24%, 3/27/2051 (a) (c) | | |
VOLT XCVI LLC Series 2021-NPL5, Class A1, 5.12%, 3/27/2051 (a) (c) | | |
VOLT XCVII LLC Series 2021-NPL6, Class A1, 2.24%, 4/25/2051 (a) (c) | | |
Westgate Resorts LLC Series 2020-1A, Class A, 2.71%, 3/20/2034 (a) | | |
Westlake Automobile Receivables Trust | | |
Series 2022-3A, Class A2, 5.24%, 7/15/2025 (a) | | |
Series 2022-2A, Class A3, 3.75%, 4/15/2026 (a) | | |
Series 2023-3A, Class A3, 5.82%, 5/17/2027 (a) | | |
World Omni Auto Receivables Trust Series 2024-A, Class A4, 4.84%, 10/15/2029 | | |
World Omni Select Auto Trust Series 2020-A, Class B, 0.84%, 6/15/2026 | | |
Total Asset-Backed Securities
(Cost $282,000,935) | | |
Collateralized Mortgage Obligations — 28.8% |
| | |
Series 2004-J4, Class 1A6, 5.40%, 6/25/2034 (c) | | |
Series 2004-33, Class 3A3, 4.50%, 12/25/2034 (b) | | |
Banc of America Funding Trust Series 2006-1, Class 2A1, 5.50%, 1/25/2036 | | |
Banc of America Mortgage Trust Series 2004-D, Class 2A2, 4.60%, 5/25/2034 (b) | | |
Bear Stearns Asset-Backed Securities I Trust Series 2004-AC6, Class M1, 6.44%, 11/25/2034 (b) | | |
Connecticut Avenue Securities Trust | | |
Series 2021-R01, Class 1M1, 6.07%, 10/25/2041 (a) (b) | | |
Series 2021-R03, Class 1M1, 6.17%, 12/25/2041 (a) (b) | | |
Series 2022-R01, Class 1M1, 6.32%, 12/25/2041 (a) (b) | | |
JPMorgan Limited Duration Bond ETF
SCHEDULE OF PORTFOLIO INVESTMENTSAS OF February 29, 2024 (continued)
| | |
Collateralized Mortgage Obligations — continued |
Series 2022-R06, Class 1M1, 8.07%, 5/25/2042 (a) (b) | | |
Series 2022-R07, Class 1M1, 8.27%, 6/25/2042 (a) (b) | | |
Series 2022-R08, Class 1M1, 7.87%, 7/25/2042 (a) (b) | | |
Series 2024-R01, Class 1M1, 6.37%, 1/25/2044 (a) (b) | | |
Credit Suisse First Boston Mortgage Securities Corp. (Switzerland) | | |
Series 2005-5, Class 1A1, 5.00%, 7/25/2020 | | |
Series 2004-5, Class 4A1, 6.00%, 9/25/2034 | | |
CSFB Mortgage-Backed Pass-Through Certificates Series 2003-AR24, Class 2A4, 6.30%, 10/25/2033 (b) | | |
Deutsche Alt-A Securities, Inc. Mortgage Loan Trust Series 2005-1, Class 2A1, 3.74%, 2/25/2020 (b) | | |
FHLMC STACR REMIC Trust Series 2021-DNA3, Class M1, 6.07%, 10/25/2033 (a) (b) | | |
| | |
Series 1974, Class ZA, 7.00%, 7/15/2027 | | |
Series 3737, Class DG, 5.00%, 10/15/2030 | | |
Series 4120, Class KI, IO, 3.00%, 10/15/2032 | | |
Series 5000, Class CB, 1.25%, 1/25/2035 | | |
Series 3300, Class FA, 5.74%, 8/15/2035 (b) | | |
Series 3085, Class VS, IF, 6.96%, 12/15/2035 (b) | | |
Series 4867, Class WF, 5.65%, 4/15/2037 (b) | | |
Series 4350, Class AF, 5.81%, 12/15/2037 (b) | | |
Series 4350, Class FK, 5.55%, 6/15/2038 (b) | | |
Series 4515, Class FA, 5.83%, 8/15/2038 (b) | | |
Series 4350, Class KF, 5.81%, 1/15/2039 (b) | | |
Series 4448, Class TF, 5.56%, 5/15/2040 (b) | | |
Series 4480, Class FM, 5.47%, 6/15/2040 (b) | | |
Series 4457, Class KF, 5.42%, 10/15/2040 (b) | | |
| | |
|
Series 4363, Class FA, 5.36%, 9/15/2041 (b) | | |
Series 4413, Class WF, 5.49%, 10/15/2041 (b) | | |
Series 4559, Class AF, 5.83%, 3/15/2042 (b) | | |
Series 4074, Class FE, 5.84%, 7/15/2042 (b) | | |
Series 4150, Class F, 5.81%, 1/15/2043 (b) | | |
Series 4161, Class YF, 5.81%, 2/15/2043 (b) | | |
Series 4281, Class FB, 5.99%, 12/15/2043 (b) | | |
Series 4606, Class FL, 5.94%, 12/15/2044 (b) | | |
Series 4594, Class GN, 2.50%, 2/15/2045 | | |
Series 5072, Class QC, 1.00%, 10/25/2050 | | |
| | |
Series 343, Class F4, 5.81%, 10/15/2037 (b) | | |
Series 328, Class S4, IF, IO, 1.82%, 2/15/2038 (b) | | |
FHLMC, Structured Pass-Through Certificates, Whole Loan | | |
Series T-51, Class 1A, PO, 9/25/2042 | | |
Series T-54, Class 4A, 4.18%, 2/25/2043 (b) | | |
First Horizon Mortgage Pass-Through Trust Series 2004-AR6, Class 2A1, 4.73%, 12/25/2034 (b) | | |
Flagstar Mortgage Trust Series 2019-2, Class A2, 3.50%, 12/25/2049 (a) (b) | | |
FNMA Trust, Whole Loan Series 2004-W2, Class 4A, 4.24%, 2/25/2044 (b) | | |
FNMA, Grantor Trust, Whole Loan | | |
Series 2002-T6, Class A4, 5.11%, 3/25/2041 (b) | | |
Series 2001-T8, Class A1, 7.50%, 7/25/2041 | | |
| | |
Series G94-9, Class PJ, 6.50%, 8/17/2024 | | |
Series 2013-43, Class YH, 2.50%, 5/25/2033 | | |
Series 2004-17, Class BF, 5.79%, 1/25/2034 (b) | | |
Series 2006-3, Class SB, IF, IO, 1.26%, 7/25/2035 (b) | | |
Series 2006-16, Class HZ, 5.50%, 3/25/2036 | | |
| | |
Collateralized Mortgage Obligations — continued |
Series 2006-124, Class FC, 5.79%, 1/25/2037 (b) | | |
Series 2014-23, Class FA, 5.67%, 10/25/2039 (b) | | |
Series 2012-38, Class PA, 2.00%, 9/25/2041 | | |
Series 2012-93, Class ME, 2.50%, 1/25/2042 | | |
Series 2012-13, Class FA, 6.02%, 2/25/2042 (b) | | |
Series 2012-31, Class FB, 5.99%, 4/25/2042 (b) | | |
Series 2013-23, Class KJ, 2.25%, 5/25/2042 | | |
Series 2012-119, Class FB, 5.79%, 11/25/2042 (b) | | |
Series 2012-139, Class JA, 3.50%, 12/25/2042 | | |
Series 2013-6, Class FL, 5.84%, 2/25/2043 (b) | | |
Series 2014-49, Class AF, 5.68%, 8/25/2044 (b) | | |
Series 2015-42, Class BF, 5.77%, 6/25/2045 (b) | | |
Series 2016-25, Class LA, 3.00%, 7/25/2045 | | |
Series 2016-33, Class JA, 3.00%, 7/25/2045 | | |
Series 2015-91, Class AF, 5.53%, 12/25/2045 (b) | | |
Series 2016-58, Class SA, IO, 1.33%, 8/25/2046 (b) | | |
Series 2017-108, Class PA, 3.00%, 6/25/2047 | | |
Series 2017-104, Class LA, 3.00%, 11/25/2047 | | |
Series 2019-38, Class PC, 3.00%, 2/25/2048 | | |
Series 2019-77, Class FP, 5.99%, 1/25/2050 (b) | | |
Series 2014-66, Class WF, 5.81%, 10/25/2054 (b) | | |
Series 2019-74, Class BF, 5.99%, 12/25/2059 (b) | | |
FNMA, REMIC Trust, Whole Loan | | |
Series 2003-W4, Class 5A, 4.05%, 10/25/2042 (b) | | |
Series 2003-W15, Class 3A, 4.60%, 12/25/2042 (b) | | |
| | |
|
Series 2003-W1, Class 2A, 5.28%, 12/25/2042 (b) | | |
Series 2009-W1, Class A, 6.00%, 12/25/2049 | | |
| | |
Series 2011-158, Class EB, 4.00%, 12/20/2026 | | |
Series 2010-166, Class GP, 3.00%, 4/20/2039 | | |
Series 2012-61, Class FM, 5.84%, 5/16/2042 (b) | | |
Series 2012-H21, Class FA, 5.96%, 7/20/2062 (b) | | |
Series 2012-H29, Class FA, 5.98%, 10/20/2062 (b) | | |
Series 2013-H16, Class FA, 6.00%, 7/20/2063 (b) | | |
Series 2014-H07, Class FC, 6.06%, 5/20/2064 (b) | | |
Series 2014-H11, Class JA, 5.96%, 6/20/2064 (b) | | |
Series 2014-H17, Class FM, 5.94%, 8/20/2064 (b) | | |
Series 2015-H03, Class FD, 6.10%, 1/20/2065 (b) | | |
Series 2015-H04, Class FL, 5.93%, 2/20/2065 (b) | | |
Series 2015-H12, Class FJ, 5.89%, 5/20/2065 (b) | | |
Series 2015-H14, Class FB, 5.89%, 5/20/2065 (b) | | |
Series 2015-H12, Class FA, 5.94%, 5/20/2065 (b) | | |
Series 2015-H15, Class FB, 6.06%, 6/20/2065 (b) | | |
Series 2015-H19, Class FN, 5.90%, 7/20/2065 (b) | | |
Series 2015-H23, Class TA, 5.93%, 9/20/2065 (b) | | |
GSAA Trust Series 2004-CW1, Class 1A1, 5.50%, 4/1/2034 | | |
GSR Mortgage Loan Trust Series 2004-10F, Class 7A1, 5.50%, 9/25/2034 | | |
| | |
Series 2004-6, Class 1A2, 6.22%, 10/25/2034 (b) | | |
Series 2005-5, Class A1, 6.08%, 8/25/2035 (b) | | |
JPMorgan Limited Duration Bond ETF
SCHEDULE OF PORTFOLIO INVESTMENTSAS OF February 29, 2024 (continued)
| | |
Collateralized Mortgage Obligations — continued |
IndyMac INDA Mortgage Loan Trust Series 2007-AR1, Class 1A1, 3.72%, 3/25/2037 (b) | | |
JPMorgan Mortgage Trust Series 2003-A1, Class 1A1, 4.69%, 10/25/2033 (b) | | |
MASTR Adjustable Rate Mortgages Trust | | |
Series 2004-13, Class 2A1, 5.95%, 4/21/2034 (b) | | |
Series 2004-13, Class 3A7B, 6.80%, 11/21/2034 (b) | | |
MASTR Seasoned Securitization Trust Series 2003-1, Class 3A2, 5.84%, 2/25/2033 (b) | | |
Mellon Residential Funding Corp. Mortgage Pass-Through Certificates | | |
Series 2002-TBC1, Class B1, 6.43%, 9/15/2030 (b) | | |
Series 2002-TBC1, Class B2, 6.83%, 9/15/2030 (b) | | |
Series 2001-TBC1, Class B1, 6.31%, 11/15/2031 (b) | | |
Merrill Lynch Mortgage Investors Trust | | |
Series 2004-D, Class A1, 6.10%, 9/25/2029 (b) | | |
Series 2004-1, Class 2A3, 5.07%, 12/25/2034 (b) | | |
Metlife Securitization Trust | | |
Series 2017-1A, Class A, 3.00%, 4/25/2055 (a) (b) | | |
Series 2018-1A, Class A, 3.75%, 3/25/2057 (a) (b) | | |
Morgan Stanley Dean Witter Capital I, Inc. Trust | | |
Series 2003-HYB1, Class A4, 6.32%, 3/25/2033 (b) | | |
Series 2003-HYB1, Class B1, 6.32%, 3/25/2033 (b) | | |
Morgan Stanley Mortgage Loan Trust | | |
Series 2004-3, Class 4A, 5.64%, 4/25/2034 (b) | | |
Series 2004-5AR, Class 3A3, 5.54%, 7/25/2034 (b) | | |
Series 2004-5AR, Class 3A5, 5.54%, 7/25/2034 (b) | | |
Series 2004-11AR, Class 1A2A, 5.75%, 1/25/2035 (b) | | |
MRFC Mortgage Pass-Through Trust Series 2002-TBC2, Class B1, 6.28%, 8/15/2032 (b) | | |
| | |
|
NAAC Reperforming Loan REMIC Trust Certificates Series 2004-R3, Class AF, 5.89%, 2/25/2035 (a) (b) | | |
New Residential Mortgage Loan Trust Series 2018-4A, Class A1S, 6.19%, 1/25/2048 (a) (b) | | |
Nomura Asset Acceptance Corp. Alternative Loan Trust Series 2003-A3, Class A1, 5.50%, 8/25/2033 (c) | | |
Prime Mortgage Trust Series 2005-2, Class 2A1, 5.88%, 10/25/2032 (b) | | |
PRPM LLC Series 2020-6, Class A1, 5.36%, 11/25/2025 (a) (c) | | |
| | |
Series 2005-SA2, Class 2A2, 5.26%, 6/25/2035 (b) | | |
Series 2006-SA4, Class 2A1, 5.55%, 11/25/2036 (b) | | |
Seasoned Credit Risk Transfer Trust Series 2020-1, Class M55G, 3.00%, 8/25/2059 | | |
| | |
Series 11, Class A, 6.33%, 12/20/2032 (b) | | |
Series 2003-3, Class A2, 6.38%, 7/20/2033 (b) | | |
Series 2004-11, Class A2, 6.44%, 12/20/2034 (b) | | |
Structured Asset Mortgage Investments II Trust Series 2004-AR1, Class 1A1, 6.13%, 3/19/2034 (b) | | |
Structured Asset Mortgage Investments Trust Series 2002-AR2, Class A3, 6.18%, 7/19/2032 (b) | | |
Structured Asset Securities Corp. Mortgage Pass-Through Certificates | | |
Series 2003-24A, Class 2A, 6.97%, 7/25/2033 (b) | | |
Series 2003-40A, Class 4A, 7.75%, 1/25/2034 (b) | | |
Thornburg Mortgage Securities Trust Series 2004-4, Class 5A, 3.04%, 12/25/2044 (b) | | |
Towd Point Mortgage Trust Series 2018-4, Class A1, 3.00%, 6/25/2058 (a) (b) | | |
WaMu Mortgage Pass-Through Certificates Trust | | |
Series 2004-AR3, Class A1, 4.56%, 6/25/2034 (b) | | |
Series 2004-AR11, Class A, 5.96%, 10/25/2034 (b) | | |
Total Collateralized Mortgage Obligations
(Cost $217,092,157) | | |
| | |
Mortgage-Backed Securities — 10.1% |
FHLMC Gold Pools, Other Pool # U49009, 3.00%, 8/1/2028 | | |
| | |
Pool # RA2459, 4.00%, 4/1/2050 | | |
Pool # RA2904, 3.00%, 6/1/2050 | | |
Pool # RA2970, 2.50%, 7/1/2050 | | |
Pool # SD1787, 5.00%, 10/1/2052 | | |
Pool # SD8277, 5.50%, 12/1/2052 | | |
FNMA UMBS, 15 Year Pool # AD1969, 4.00%, 2/1/2025 | | |
| | |
Pool # MA1338, 3.00%, 2/1/2033 | | |
Pool # MA1401, 3.00%, 4/1/2033 | | |
Pool # MA1490, 3.00%, 7/1/2033 | | |
| | |
Pool # 995724, 6.00%, 4/1/2039 | | |
Pool # AD0588, 5.00%, 12/1/2039 | | |
Pool # AD9721, 5.50%, 8/1/2040 | | |
Pool # BM3048, 4.00%, 10/1/2042 | | |
Pool # AS4592, 4.00%, 2/1/2045 | | |
Pool # BM5560, 4.00%, 1/1/2046 | | |
Pool # CA0411, 4.00%, 9/1/2047 | | |
Pool # CA2489, 4.50%, 10/1/2048 | | |
Pool # BP7345, 3.00%, 6/1/2050 | | |
Pool # BQ7436, 3.00%, 9/1/2051 | | |
Pool # BQ7454, 3.00%, 12/1/2051 | | |
Pool # FS2898, 4.50%, 9/1/2052 | | |
Pool # FS3051, 5.00%, 10/1/2052 | | |
Pool # CB4839, 5.50%, 10/1/2052 | | |
FNMA, Other Pool # BK7908, 4.00%, 11/1/2048 | | |
GNMA I, 15 Year Pool # 723171, 4.50%, 10/15/2024 | | |
GNMA II, 30 Year Pool # CG5224, 3.50%, 8/20/2051 | | |
Total Mortgage-Backed Securities
(Cost $82,845,786) | | |
Commercial Mortgage-Backed Securities — 9.6% |
20 Times Square Trust Series 2018-20TS, Class A, 3.10%, 5/15/2035 (a) (b) | | |
BAMLL Commercial Mortgage Securities Trust Series 2015-200P, Class A, 3.22%, 4/14/2033 (a) | | |
BANK Series 2021-BN35, Class A2, 1.87%, 6/15/2064 | | |
| | |
|
Bayview Commercial Asset Trust | | |
Series 2005-2A, Class A2, 5.96%, 8/25/2035 (a) (b) | | |
Series 2005-2A, Class M1, 6.08%, 8/25/2035 (a) (b) | | |
Series 2007-3, Class A2, 5.87%, 7/25/2037 (a) (b) | | |
BBCMS Mortgage Trust Series 2020-C7, Class A2, 2.02%, 4/15/2053 | | |
BBCMS Trust Series 2015-VFM, Class A1, 2.47%, 3/10/2036 (a) | | |
BHMS Series 2018-ATLS, Class A, 6.86%, 7/15/2035 (a) (b) | | |
BX Series 2021-MFM1, Class A, 6.13%, 1/15/2034 (a) (b) | | |
| | |
Series 2021-BXMF, Class A, 6.07%, 10/15/2026 (a) (b) | | |
Series 2021-LBA, Class AJV, 6.23%, 2/15/2036 (a) (b) | | |
Commercial Mortgage Trust Series 2020-CBM, Class A1, 2.24%, 2/10/2037 (a) (b) | | |
FHLMC, Multi-Family Structured Credit Risk Series 2021-MN1, Class M1, 7.32%, 1/25/2051 (a) (b) | | |
FHLMC, Multi-Family Structured Pass-Through Certificates | | |
Series Q007, Class APT2, 3.47%, 10/25/2047 (b) | | |
Series Q013, Class APT1, 2.05%, 5/25/2050 (b) | | |
ILPT Commercial Mortgage Trust Series 2022-LPF2, Class A, 7.56%, 10/15/2039 (a) (b) | | |
OAKST Commercial Mortgage Trust Series 2023-NLP, Class A, 6.09%, 3/15/2040 (a) (b) | | |
One Bryant Park Trust Series 2019-OBP, Class A, 2.52%, 9/15/2054 (a) | | |
ONE Mortgage Trust Series 2021-PARK, Class A, 6.13%, 3/15/2036 (a) (b) | | |
SMR Mortgage Trust Series 2022-IND, Class A, 6.97%, 2/15/2039 (a) (b) | | |
STWD Mortgage Trust (Cayman Islands) Series 2021-LIH, Class B, 7.09%, 11/15/2036 (a) (b) | | |
UBS-BAMLL Trust Series 2012-WRM, Class A, 3.66%, 6/10/2030 (a) | | |
JPMorgan Limited Duration Bond ETF
SCHEDULE OF PORTFOLIO INVESTMENTSAS OF February 29, 2024 (continued)
| | |
Commercial Mortgage-Backed Securities — continued |
Wells Fargo Commercial Mortgage Trust Series 2021-SAVE, Class A, 6.58%, 2/15/2040 (a) (b) | | |
Total Commercial Mortgage-Backed Securities
(Cost $72,168,431) | | |
|
|
BNP Paribas SA (France) (SOFR + 1.00%), 1.32%, 1/13/2027 (a) (d) | | |
Sumitomo Mitsui Financial Group, Inc. (Japan) 0.95%, 1/12/2026 | | |
Truist Financial Corp. 1.20%, 8/5/2025 | | |
| | |
|
Credit Suisse AG (Switzerland) 7.95%, 1/9/2025 | | |
Diversified Telecommunication Services — 0.5% |
AT&T, Inc. 1.65%, 2/1/2028 | | |
Independent Power and Renewable Electricity Producers — 0.2% |
Southern Power Co. 0.90%, 1/15/2026 | | |
|
Protective Life Global Funding 1.17%, 7/15/2025 (a) | | |
Total Corporate Bonds
(Cost $28,665,620) | | |
| | |
Short-Term Investments — 9.8% |
Investment Companies — 9.8% |
JPMorgan Prime Money Market Fund Class IM Shares, 5.44% (e) (f)
(Cost $71,403,879) | | |
Total Investments — 99.7%
(Cost $754,176,808) | | |
Other Assets Less Liabilities — 0.3% | | |
| | |
Percentages indicated are based on net assets. |
| |
| Collateralized Loan Obligations |
| Federal Home Loan Mortgage Corp. |
| Federal National Mortgage Association |
| Government National Mortgage Association |
| Inverse Floaters represent securities that pay interest at a rate that increases (decreases) with a decline (incline) in a specified index or have an interest rate that adjusts periodically based on changes in current interest rates and prepayments on the underlying pool of assets. The interest rate shown is the rate in effect as of February 29, 2024. The rate may be subject to a cap and floor. |
| Interest Only represents the right to receive the monthly interest payments on an underlying pool of mortgage loans. The principal amount shown represents the par value on the underlying pool. The yields on these securities are subject to accelerated principal paydowns as a result of prepayment or refinancing of the underlying pool of mortgage instruments. As a result, interest income may be reduced considerably. |
| Principal Only represents the right to receive the principal portion only on an underlying pool of mortgage loans. The market value of these securities is extremely volatile in response to changes in market interest rates. As prepayments on the underlying mortgages of these securities increase, the yield on these securities increases. |
| Real Estate Mortgage Investment Conduit |
| Secured Overnight Financing Rate |
| Separate Trading of Registered Interest and Principal of Securities. The STRIPS Program lets investors hold and trade individual interest and principal components of eligible notes and bonds as separate securities. |
| Uniform Mortgage-Backed Securities |
| Value determined using significant unobservable inputs. |
| Securities exempt from registration under Rule 144A or section 4(a)(2), of the Securities Act of 1933, as amended. |
| Variable or floating rate security, the interest rate of which adjusts periodically based on changes in current interest rates and prepayments on the underlying pool of assets. The interest rate shown is the current rate as of February 29, 2024. |
| Step bond. Interest rate is a fixed rate for an initial period that either resets at a specific date or may reset in the future contingent upon a predetermined trigger. The interest rate shown is the current rate as of February 29, 2024. |
| Variable or floating rate security, linked to the referenced benchmark. The interest rate shown is the current rate as of February 29, 2024. |
| Investment in an affiliated fund, which is registered under the Investment Company Act of 1940, as amended, and is advised by J.P. Morgan Investment Management Inc. |
| The rate shown is the current yield as of February 29, 2024. |
JPMorgan Sustainable Municipal Income ETF
SCHEDULE OF PORTFOLIO INVESTMENTSAS OF February 29, 2024
| | |
Municipal Bonds — 87.2% (a) |
|
| | |
Series 2024, Rev., 5.00%, 10/1/2035 | | |
Series 2024, Rev., 5.25%, 10/1/2049 | | |
| | |
|
Alaska Housing Finance Corp., General Mortgage Series 2016A, Rev., 3.50%, 6/1/2046 | | |
|
Arizona Industrial Development Authority, Aliante and Skye Canyon Campus Project Series 2021A, Rev., 4.00%, 12/15/2051 (b) | | |
Arizona Industrial Development Authority, Doral Academy of Nevada - Pebble Campus Project Series 2020A, Rev., 4.00%, 7/15/2030 (b) | | |
Arizona Industrial Development Authority, Equitable School Revolving Fund LLC Series 2022A, Rev., 5.00%, 11/1/2037 | | |
Arizona Industrial Development Authority, KIPP Nashville Project | | |
Series 2022A, Rev., 5.00%, 7/1/2030 | | |
Series 2022A, Rev., 5.00%, 7/1/2031 | | |
Series 2022A, Rev., 5.00%, 7/1/2032 | | |
Arizona Industrial Development Authority, Macombs Facility Project Series 2021A, Rev., 4.00%, 7/1/2036 | | |
Industrial Development Authority of the County of Pima (The), La Posada at Pusch Ridge Project Series 2022B-3, Rev., 5.13%, 11/15/2029 (b) | | |
La Paz County Industrial Development Authority, Harmony Public School Project Series 2021A, Rev., 4.00%, 2/15/2041 | | |
Maricopa County Industrial Development Authority, Arizona Autism Charter School Project Series 2021A, Rev., 4.00%, 7/1/2041 (b) | | |
Maricopa County Industrial Development Authority, Banner Health Series A, Rev., 4.00%, 1/1/2041 | | |
Maricopa County Industrial Development Authority, HonorHealth Series 2019A, Rev., 5.00%, 9/1/2032 | | |
| | |
| | |
|
|
California Community Choice Financing Authority, Clean Energy Project | | |
Series 2023B-1, Rev., 5.00%, 8/1/2029 (c) | | |
Series 2024 A, Rev., 5.00%, 4/1/2032 (c) | | |
California Community Housing Agency, Fountains at Emerald Park Series 2021A-2, Rev., 4.00%, 8/1/2046 (b) | | |
California Community Housing Agency, Glendale Properties Series 2021A-2, Rev., 4.00%, 8/1/2047 (b) | | |
California Enterprise Development Authority, Riverside County, Rocketship Public Schools-Obligated Group No. 2 Series 2022A, Rev., 4.00%, 6/1/2027 (b) | | |
California Infrastructure and Economic Development Bank, Brightline West Passenger Rail Project Series 2020A, Rev., AMT, 3.95%, 1/30/2025 (b) (c) | | |
California Infrastructure and Economic Development Bank, California Academy of Science Series 2024A, Rev., 3.25%, 8/1/2029 (d) | | |
California Infrastructure and Economic Development Bank, Equitable School Revolving Fund LLC Series 2022B, Rev., 5.00%, 11/1/2034 | | |
California Municipal Finance Authority, Eisenhower Medical Center Series 2017B, Rev., 5.00%, 7/1/2026 | | |
California Pollution Control Financing Authority, Poseidon Resources Channelside LP Desalination Project | | |
Rev., AMT, 5.00%, 7/1/2036 (b) | | |
Rev., AMT, 5.00%, 7/1/2037 (b) | | |
Rev., AMT, 5.00%, 7/1/2038 (b) | | |
California Public Finance Authority, Enso Village Project Series 2021B-3, Rev., 2.13%, 11/15/2027 (b) | | |
California School Finance Authority, Green Dot Public Schools Project Series 2022A, Rev., 5.00%, 8/1/2032 (b) | | |
California School Finance Authority, Kipp SoCal Public Schools Series 2019A, Rev., 5.00%, 7/1/2039 (b) | | |
California Statewide Communities Development Authority, Emanate Health, Tax-Exempt Series 2020A, Rev., 3.00%, 4/1/2050 | | |
California Statewide Communities Development Authority, Front Porch Communities Series 2021A, Rev., 4.00%, 4/1/2039 | | |
JPMorgan Sustainable Municipal Income ETF
SCHEDULE OF PORTFOLIO INVESTMENTSAS OF February 29, 2024 (continued)
| | |
Municipal Bonds — continued |
|
CSCDA Community Improvement Authority, Essential Housing, Towne at Glendale Apartments Series 2022B, Rev., 5.00%, 9/1/2037 (b) | | |
River Islands Public Financing Authority, Facilities District No. 2003 Series 2022A-1, AGM, 5.00%, 9/1/2028 | | |
State of California, Department of Veterans Affairs, Farm and Home Purchase Program Series 2016B, Rev., 3.50%, 12/1/2045 | | |
| | |
|
Aspen Fire Protection District | | |
| | |
| | |
| | |
Colorado Educational and Cultural Facilities Authority, Aspen View Academy Project Rev., 4.00%, 5/1/2031 | | |
Colorado Educational and Cultural Facilities Authority, Global Village Academy Northglenn Project Rev., 4.00%, 12/1/2030 (b) | | |
Colorado Educational and Cultural Facilities Authority, Vega Collegiate Academy Project Series 2021A, Rev., 5.00%, 2/1/2034 (b) | | |
Colorado Housing and Finance Authority Series 2023L, Class III, Rev., GNMA COLL, 5.75%, 11/1/2053 | | |
Colorado Housing and Finance Authority, Single Family Mortgage | | |
Series 2019F, Rev., GNMA COLL, 4.25%, 11/1/2049 | | |
Series 2020H, Rev., GNMA COLL, 3.00%, 5/1/2050 | | |
Series 2020B, Rev., 3.75%, 5/1/2050 | | |
Dominion Water and Sanitation District | | |
| | |
| | |
| | |
|
Connecticut Housing Finance Authority, Housing Mortgage Finance Program | | |
Series A-1, Rev., 4.00%, 11/15/2045 | | |
Series A-1, Rev., 4.00%, 11/15/2047 | | |
Series D-1, Rev., GNMA / FNMA / FHLMC, 4.00%, 11/15/2047 | | |
| | |
|
|
Connecticut State Health and Educational Facilities Authority, Yale New Haven Health Series B, Rev., 1.80%, 7/1/2024 (c) | | |
Connecticut State Higher Education Supplemental Loan Authority, CHESLA Loan Program Series 2019B, Rev., AMT, 5.00%, 11/15/2027 | | |
Stamford Housing Authority, The Dogwoods Project Rev., BAN, 11.00%, 12/1/2027 (b) | | |
| | |
|
Delaware State Health Facilities Authority, Beebe Medical Center Project Rev., 5.00%, 6/1/2034 | | |
District of Columbia — 1.3% |
District of Columbia, Two Rivers Public Charter School, Inc. Rev., 5.00%, 6/1/2050 | | |
District of Columbia, Water and Sewer Authority, Public Utility, Subordinate Lien Series A, Rev., 5.00%, 10/1/2045 | | |
Total District of Columbia | | |
|
Florida Development Finance Corp., Central Charter School Project | | |
Series 2022, Rev., 5.25%, 8/15/2037 (b) | | |
Series 2022, Rev., 5.63%, 8/15/2042 (b) | | |
Florida Development Finance Corp., Educational Facilities, River City Science Academy Projects Series 2022B, Rev., 5.00%, 7/1/2031 | | |
Florida Development Finance Corp., Idea Florida, Inc., Jacksonville IV Project Rev., 5.25%, 6/15/2029 (b) | | |
Lee County Industrial Development Authority, Cypress Cove at Healthpeak Florida, Inc., Project Series 2022B2, Rev., 3.25%, 10/1/2026 | | |
Lee County School Board (The) | | |
Series A, COP, 5.00%, 8/1/2042 | | |
Series 2023A, COP, 4.00%, 8/1/2048 | | |
Lee Memorial Health System Series A-1, Rev., 5.00%, 4/1/2036 | | |
Middleton Community Development District A, City of Wildwood, Florida Special Assessment 5.85%, 5/1/2037 | | |
| | |
Municipal Bonds — continued |
|
Palm Beach County Health Facilities Authority, Jupiter Medical Center Series 2022, Rev., 5.00%, 11/1/2047 | | |
Palm Beach County School District Series 2023A, COP, 5.00%, 8/1/2040 | | |
Village Community Development District No. 15 4.25%, 5/1/2028 (b) | | |
| | |
|
Cherokee County Water and Sewer Authority | | |
Series 2023, Rev., 5.00%, 8/1/2035 | | |
Series 2023, Rev., 5.00%, 8/1/2036 | | |
Series 2023, Rev., 5.00%, 8/1/2037 | | |
Series 2023, Rev., 5.00%, 8/1/2039 | | |
Columbus Medical Center Hospital Authority, Piedmont Healthcare Inc., Project Series 2019B, Rev., 5.00%, 7/1/2029 (c) | | |
Gainesville and Hall County Hospital Authority, Northeast Georgia Health System, Inc., Project Series A, Rev., 5.00%, 2/15/2026 | | |
Georgia Housing and Finance Authority, Single Family Mortgage | | |
Series 2017A, Rev., 4.00%, 12/1/2047 | | |
Series 2017B, Rev., 4.00%, 12/1/2047 | | |
Main Street Natural Gas, Inc., Gas Supply Series 2022B, Rev., 5.00%, 6/1/2029 (c) | | |
| | |
|
City of Aurora, Single Family Mortgage | | |
Series 2007B, Rev., GNMA / FNMA / FHLMC, 5.45%, 12/1/2039 | | |
Series 2007-A, Rev., AMT, GNMA / FNMA / FHLMC, 5.50%, 12/1/2039 | | |
City of Chicago, Waterworks, Second Lien | | |
Series 2023B, Rev., AGM, 5.00%, 11/1/2035 | | |
Series 2023B, Rev., AGM, 5.00%, 11/1/2039 | | |
Series 2023B, Rev., AGM, 4.00%, 11/1/2040 | | |
Illinois Finance Authority, Lake Forest College | | |
Series 2022A, Rev., 5.00%, 10/1/2032 | | |
Series 2022A, Rev., 5.00%, 10/1/2035 | | |
Series 2022A, Rev., 5.50%, 10/1/2039 | | |
Illinois Finance Authority, Plymouth Place, Inc. | | |
Series 2022B-2, Rev., 5.25%, 3/25/2024 | | |
| | |
|
|
Series 2022B-1, Rev., 6.00%, 11/15/2027 | | |
Illinois Housing Development Authority Series 2024 A, Rev., GNMA / FNMA / FHLMC, 6.00%, 10/1/2054 (d) | | |
Illinois Housing Development Authority, Homeowner Mortgage Series C, Rev., 3.50%, 8/1/2046 | | |
State of Illinois Series 2023B, GO, 4.50%, 5/1/2048 | | |
Will County Forest Preservation District, Limited Tax | | |
| | |
| | |
| | |
Will County School District No. 86 Joliet | | |
Series 2024, GO, 5.00%, 3/1/2036 | | |
Series 2024, GO, 5.00%, 3/1/2037 | | |
Series 2024, GO, 5.00%, 3/1/2042 | | |
| | |
|
City of Goshen, Multi-Family, Green Oaks of Goshen Project Series 2021A, Rev., 5.00%, 8/1/2041 (b) | | |
City of Jeffersonville, Vivera Senior Living of Jeffersonville Project Series 2020A, Rev., 4.75%, 11/1/2030 (b) | | |
County of St. Joseph, Economic Development, St. Mary's College Project Series 2017A, Rev., 5.00%, 4/1/2026 | | |
Indiana Finance Authority, CHF- Tippecanoe LLC- Student Housing Project Series 2023A, Rev., 5.00%, 6/1/2053 | | |
Indiana Finance Authority, DePauw University Series 2022A, Rev., 5.00%, 7/1/2032 | | |
Indiana Housing and Community Development Authority, Single Family Mortgage Series 2020A, Rev., 3.75%, 1/1/2049 | | |
Indiana Housing and Community Development Authority, Vita of Marion Project Series 2021B, Rev., 4.00%, 4/1/2024 | | |
| | |
|
Iowa Finance Authority, Senior Living Facility, Sunrise Retirement Community Project | | |
| | |
| | |
| | |
JPMorgan Sustainable Municipal Income ETF
SCHEDULE OF PORTFOLIO INVESTMENTSAS OF February 29, 2024 (continued)
| | |
Municipal Bonds — continued |
|
| | |
Iowa Student Loan Liquidity Corp., Student Loan Series 2015A, Rev., AMT, 5.00%, 12/1/2025 | | |
| | |
|
City of Topeka, Kansas Health Care Facilities Series 2022B, Rev., 5.13%, 12/1/2026 | | |
|
Kentucky Public Energy Authority Series 2024A, Rev., 5.00%, 7/1/2030 (c) | | |
|
Louisiana Local Government Environmental Facilities and Community Development Authority, LCTCS Act 391 Project Rev., 5.00%, 10/1/2028 | | |
Louisiana Public Facilities Authority, Lincoln Preparatory School Project | | |
Series 2021A, Rev., 5.00%, 6/1/2031 (b) | | |
Series 2021A, Rev., 5.00%, 6/1/2041 (b) | | |
Louisiana Public Facilities Authority, Mentorship Steam Academy Project | | |
Series 2021A, Rev., 5.00%, 6/1/2036 (b) | | |
Series 2021A, Rev., 5.00%, 6/1/2042 (b) | | |
| | |
|
City of Portland, General Airport Rev., 5.00%, 1/1/2031 | | |
Maine State Housing Authority, Mortgage Purchase Series 2016A, Rev., 4.00%, 11/15/2045 | | |
| | |
|
County of Baltimore, Riderwood Village, Inc., Project | | |
| | |
| | |
Montgomery County Housing Opportunities Commission, Single Family Mortgage Series A, Rev., 4.00%, 7/1/2048 | | |
| | |
|
Massachusetts Clean Water Trust (The), Poll Program Rev., 5.25%, 8/1/2024 | | |
| | |
|
Massachusetts — continued |
Massachusetts Development Finance Agency, Boston Medical Center Issue | | |
Series 2023G, Rev., 5.25%, 7/1/2048 | | |
Series 2023G, Rev., 4.38%, 7/1/2052 | | |
Massachusetts Development Finance Agency, Salem Community Corp. | | |
| | |
| | |
| | |
| | |
| | |
| | |
Massachusetts Development Finance Agency, Southcoast Health System Obligated Group Issue | | |
Series 2021G, Rev., 5.00%, 7/1/2029 | | |
Series 2021G, Rev., 5.00%, 7/1/2030 | | |
Massachusetts Health and Educational Facilities Authority, Massachusetts Institute of Technology Series L, Rev., 5.25%, 7/1/2033 | | |
Massachusetts Housing Finance Agency, Single Family Housing | | |
Series 183, Rev., 3.50%, 12/1/2046 | | |
Series 214, Rev., GNMA / FNMA / FHLMC, 3.75%, 12/1/2049 | | |
| | |
|
City of Detroit, Unlimited Tax | | |
Series 2021A, GO, 5.00%, 4/1/2031 | | |
Series 2021A, GO, 5.00%, 4/1/2033 | | |
Series 2023A, GO, 6.00%, 5/1/2039 | | |
Eastern Michigan University Series 2017A, Rev., 5.00%, 3/1/2030 | | |
Michigan Finance Authority, Trinity Health Credit Group Series 2013MI-4, Rev., 4.00%, 12/1/2038 | | |
Michigan State Housing Development Authority, Single Family Mortgage Series B, Rev., AMT, 3.50%, 6/1/2047 | | |
| | |
|
City of Ramsey, PACT Charter School Project Series 2022A, Rev., 5.00%, 6/1/2032 | | |
City of Rochester, Mayo Clinic Series 2022, Rev., 4.00%, 11/15/2039 | | |
| | |
Municipal Bonds — continued |
|
Minneapolis-St. Paul Housing Finance Board, Single Family Mortgage, City Living Home Programs Series 2007A-2, Rev., GNMA / FNMA / FHLMC, 5.52%, 3/1/2041 | | |
Minnesota Housing Finance Agency Series 2022M, Rev., GNMA / FNMA / FHLMC COLL, 6.00%, 1/1/2053 | | |
Minnesota Housing Finance Agency, Non Profit Housing, State Appropriation | | |
| | |
| | |
| | |
Minnesota Housing Finance Agency, Residential Housing Finance Series 2017B, Rev., AMT, GNMA / FNMA / FHLMC COLL, 4.00%, 7/1/2047 | | |
| | |
|
Mississippi Home Corp., Single Family Mortgage Series 2019A, Rev., GNMA / FNMA / FHLMC, 4.00%, 12/1/2048 | | |
|
Health and Educational Facilities Authority of the State of Missouri, Mercy Health Series 2018A, Rev., 5.00%, 6/1/2031 | | |
Missouri Housing Development Commission, Single Family, First Place Homeownership Loan Program Series 2024 A, Rev., GNMA / FNMA / FHLMC, 5.75%, 5/1/2055 (d) | | |
Missouri State Environmental Improvement and Energy Resources Authority, Water Pollution Control and Drinking Water Series 2015 B, Rev., 5.00%, 7/1/2026 | | |
| | |
|
Madison County Hospital Authority No. 1, Faith Regional Health Services Project | | |
| | |
| | |
| | |
|
Carson City Nevada Hospital, Carson Tahoe Regional Healthcare Project | | |
| | |
| | |
| | |
| | |
|
|
City of Manchester, School Facilities Rev., NATL - RE, 5.50%, 6/1/2027 | | |
New Hampshire Business Finance Authority, Springpoint Senior Living Project | | |
| | |
| | |
| | |
|
Camden County Improvement Authority (The), Camden Prep High School Project | | |
Rev., 4.00%, 7/15/2027 (b) | | |
Rev., 5.00%, 7/15/2032 (b) | | |
Rev., 5.00%, 7/15/2042 (b) | | |
New Jersey Housing and Mortgage Finance Agency, Single Family Housing Series 2018A, Rev., 4.50%, 10/1/2048 | | |
| | |
|
New Mexico Mortgage Finance Authority, Single Family Mortgage Program Series 2019C, Class I, Rev., GNMA / FNMA / FHLMC, 4.00%, 1/1/2050 | | |
|
Build NYC Resource Corp., Global Community Charter School Series 2022A, Rev., 4.00%, 6/15/2032 | | |
Build NYC Resource Corp., Grand Concourse Academy Charter School | | |
Series 2022A, Rev., 3.40%, 7/1/2027 | | |
Series 2022A, Rev., 5.00%, 7/1/2042 | | |
Build NYC Resource Corp., Kipp NYC Public School Facilities - Canal West Project | | |
| | |
| | |
| | |
Monroe County Industrial Development Corp., Academy of Health Sciences Charter School Project Series 2022A, Rev., 5.00%, 7/1/2032 (b) | | |
New York City Transitional Finance Authority, Future Tax Secured, Fiscal Year 2024 Series 2024F, Subseries F-1, Rev., 5.25%, 2/1/2053 | | |
New York State Dormitory Authority Series 2024, Rev., 5.25%, 7/1/2049 (d) | | |
JPMorgan Sustainable Municipal Income ETF
SCHEDULE OF PORTFOLIO INVESTMENTSAS OF February 29, 2024 (continued)
| | |
Municipal Bonds — continued |
|
New York Transportation Development Corp., JFK International Airport New Terminal One Project Series 2023, Rev., AMT, AGM, 5.00%, 6/30/2049 | | |
State of New York Mortgage Agency, Homeowner Mortgage | | |
Series 197, Rev., 3.50%, 10/1/2044 | | |
Series 195, Rev., 4.00%, 10/1/2046 | | |
Westchester County Local Development Corp., Kendal on Hudson Project | | |
Series 2022B, Rev., 5.00%, 1/1/2027 | | |
Series 2022B, Rev., 5.00%, 1/1/2037 | | |
Series 2022B, Rev., 5.00%, 1/1/2041 | | |
Yonkers Economic Development Corp., Charter School of Educational Excellence Project Series 2020A, Rev., 4.00%, 10/15/2030 | | |
| | |
|
City of Charlotte Series 2023B, Rev., AMT, 5.00%, 7/1/2048 | | |
North Carolina Housing Finance Agency, Homeownership Series 43, Rev., GNMA / FNMA / FHLMC, 4.00%, 7/1/2050 | | |
| | |
|
North Dakota Housing Finance Agency, Home Mortgage Finance Program | | |
Series 2016D, Rev., 3.50%, 7/1/2046 | | |
Series 2015D, Rev., 4.00%, 7/1/2046 | | |
Series D, Rev., FHA, 4.00%, 1/1/2048 | | |
| | |
|
American Municipal Power, Inc., Solar Electricity Prepayment Project Series 2019A, Rev., 5.00%, 2/15/2035 | | |
Butler County Port Authority, Community First Solutions | | |
Series 2021A, Rev., 4.00%, 5/15/2038 | | |
Series 2021A, Rev., 4.00%, 5/15/2039 | | |
Series 2021A, Rev., 4.00%, 5/15/2040 | | |
Series 2021A, Rev., 4.00%, 5/15/2041 | | |
Jefferson County Port Authority, JSW Steel USA Ohio, Inc., Project Series 2023, Rev., 5.00%, 12/1/2028 (b) (c) | | |
Lakota Local School District Series A, GO, NATL - RE, 5.25%, 12/1/2025 | | |
| | |
|
|
Northeast Ohio Medical University | | |
Series 2021A, Rev., 5.00%, 12/1/2028 | | |
Series 2021A, Rev., 5.00%, 12/1/2030 | | |
Series 2022, Rev., 5.00%, 12/1/2034 | | |
Series 2021A, Rev., 4.00%, 12/1/2035 | | |
Series 2022, Rev., 5.00%, 12/1/2037 | | |
Ohio Higher Educational Facility Commission, Capital University 2022 Project Rev., 5.00%, 9/1/2030 | | |
Ohio Higher Educational Facility Commission, Kenyon College Rev., 4.00%, 7/1/2044 | | |
Ohio Housing Finance Agency, Mortgage-Backed Securities Program Series 2016D, Rev., GNMA / FNMA / FHLMC, 4.00%, 3/1/2047 | | |
Ohio Water Development Authority, Water Pollution Control Loan Fund Series 2020A, Rev., 5.00%, 12/1/2036 | | |
| | |
|
Oklahoma Water Resources Board, State Loan Program Series 2021D, Rev., 4.00%, 10/1/2046 | | |
|
Union County Hospital Facility Authority, Grande Ronde Hospital, Inc. Series 2022, Rev., 5.00%, 7/1/2035 | | |
|
Multi-Family Housing, Bond Pass-Through Certificates, Grand Reserve Apartments Series 8, Rev., 5.95%, 11/1/2035 (c) | | |
|
Allegheny County Hospital Development Authority, Pittsburgh Medical Center Series 2019A, Rev., 5.00%, 7/15/2033 | | |
Bucks County Water and Sewer Authority | | |
Series 2022A, Rev., AGM, 5.00%, 12/1/2037 | | |
Series 2022A, Rev., AGM, 5.00%, 12/1/2038 | | |
Series 2022A, Rev., AGM, 5.00%, 12/1/2039 | | |
Cambria County General Financing Authority, Mount Aloysius Project Series 2021TT-4, Rev., 4.00%, 11/1/2036 | | |
| | |
Municipal Bonds — continued |
|
Chester County Industrial Development Authority, Longwood Gardens Project | | |
| | |
| | |
Pennsylvania Economic Development Financing Authority, Presbyterian Senior Living Homes Series 2021, Rev., 4.00%, 7/1/2046 | | |
Pennsylvania Higher Educational Facilities Authority, University of Pennsylvania Health System Rev., 4.00%, 8/15/2034 | | |
Pennsylvania Housing Finance Agency, Single Family Mortgage | | |
Series 2016-121, Rev., 3.50%, 10/1/2046 | | |
Series 2017-122, Rev., AMT, 4.00%, 10/1/2046 | | |
Philadelphia Authority for Industrial Development, City Service Agreement, Affordable Housing Preservation Programs Project Rev., AGM, 5.00%, 12/1/2027 | | |
Philadelphia Authority for Industrial Development, Holy Family University Project Rev., 5.00%, 9/1/2026 | | |
Philadelphia Authority for Industrial Development, Russell Byers Charter School Project Series 2020A, Rev., 5.00%, 5/1/2030 | | |
Philadelphia Energy Authority (The), Philadelphia Street Lighting Project Series 2023A, Rev., 5.00%, 11/1/2043 | | |
| | |
|
Rhode Island Health and Educational Building Corp., Lifespan Obligated Group Series 2024, Rev., 5.00%, 5/15/2044 | | |
|
South Carolina State Housing Finance and Development Authority | | |
Series 2017A, Rev., 4.00%, 1/1/2047 | | |
Series 2017B, Rev., FHA, GNMA / FNMA / FHLMC, 4.00%, 7/1/2047 | | |
| | |
| | |
|
|
South Dakota Housing Development Authority, Homeownership Mortgage | | |
Series 2015D, Rev., 4.00%, 11/1/2045 | | |
Series 2019A, Rev., 4.00%, 5/1/2049 | | |
| | |
|
Metropolitan Government Nashville and Davidson County Health and Educational Facilities Board, Blakeford at Green Hills Series 2020A, Rev., 4.00%, 11/1/2038 | | |
Shelby County Health Educational and Housing Facilities Board, The Farms at Bailey Station Project Series 2019A, Rev., 5.75%, 10/1/2049 | | |
| | |
|
Arlington Higher Education Finance Corp. | | |
Series 2021A, Rev., 5.00%, 8/15/2027 | | |
Series 2021A, Rev., 5.00%, 8/15/2028 | | |
Series 2021A, Rev., 4.00%, 8/15/2029 | | |
Series 2021A, Rev., 4.00%, 8/15/2030 | | |
Series 2021A, Rev., 4.00%, 8/15/2031 | | |
Clifton Higher Education Finance Corp., Yes Prep Public School, Inc. Series 2023, Rev., PSF-GTD, 4.25%, 4/1/2048 | | |
Denton Independent School District | | |
Series 2023, GO, PSF-GTD, 5.00%, 8/15/2041 | | |
Series 2023, GO, PSF-GTD, 5.00%, 8/15/2043 | | |
Irving Hospital Authority, Baylor Scott and White Medical Center | | |
Series 2017A, Rev., 5.00%, 10/15/2026 | | |
Series 2017A, Rev., 5.00%, 10/15/2027 | | |
Newark Higher Education Finance Corp., The Hughen Center, Inc. | | |
Series 2022A, Rev., PSF-GTD, 5.00%, 8/15/2037 | | |
Series 2022A, Rev., PSF-GTD, 5.00%, 8/15/2042 | | |
State of Texas, Water Financial Assistance Series 2015D, GO, 5.00%, 5/15/2033 | | |
JPMorgan Sustainable Municipal Income ETF
SCHEDULE OF PORTFOLIO INVESTMENTSAS OF February 29, 2024 (continued)
| | |
Municipal Bonds — continued |
|
Texas State Affordable Housing Corp., Single Family Mortgage, Heroes Home Loan Program Series 2019A, Rev., GNMA COLL, 4.25%, 3/1/2049 | | |
Texas Water Development Board, State Water Implementation Fund Series 2019A, Rev., 4.00%, 10/15/2044 | | |
| | |
|
Utah Associated Municipal Power Systems, Horse Butte Wind Project Series 2017B, Rev., 5.00%, 9/1/2033 | | |
Utah Charter School Finance Authority, Wallace Stegner Academy | | |
Series 2022A, Rev., 5.25%, 6/15/2032 (b) | | |
Series 2022A, Rev., 5.63%, 6/15/2042 (b) | | |
Utah Housing Corp., Single Family Mortgage Series D-2, Class III, Rev., FHA, 4.00%, 1/1/2045 | | |
Utah Infrastructure Agency, Tax-Exempt Telecommunications Rev., 5.00%, 10/15/2032 | | |
Utah Transit Authority, Sales Tax Series 2006C, Rev., AGM, 5.25%, 6/15/2029 | | |
| | |
|
Vermont Housing Finance Agency, Multiple Purpose Series B, Rev., AMT, 3.75%, 11/1/2045 | | |
Vermont Student Assistance Corp., Education Loan | | |
Series 2016A, Rev., AMT, 5.00%, 6/15/2024 | | |
Series 2016A, Rev., AMT, 5.00%, 6/15/2025 | | |
| | |
|
Henrico County Economic Development Authority, Westminster Canterbury Richmond | | |
| | |
| | |
| | |
|
| | |
Series 2016A, Rev., 4.00%, 7/1/2039 | | |
Series 2016A, Rev., 4.00%, 7/1/2041 | | |
| | |
|
|
FYI Properties, State of Washington District Project Rev., 5.00%, 6/1/2039 | | |
King County Housing Authority, Highland Village Project | | |
| | |
| | |
| | |
| | |
North Thurston Public Schools, Unlimited Tax GO, 4.00%, 12/1/2036 | | |
Washington Health Care Facilities Authority, Multicare Health System Series 2017B, Rev., 5.00%, 8/15/2035 | | |
Washington State Housing Finance Commission, Seattle Academy of Arts and Science Project | | |
Series 2023, Rev., 5.00%, 7/1/2028 (b) | | |
Series 2023, Rev., 5.13%, 7/1/2033 (b) | | |
Washington State Housing Finance Commission, Single Family Program Series 2016 2A-R, Rev., AMT, 3.50%, 12/1/2046 | | |
| | |
|
West Virginia Hospital Finance Authority, University Health System Series 2023 A, Rev., 5.00%, 6/1/2040 | | |
West Virginia Hospital Finance Authority, Vandalia Health Group Series 2023B, Rev., AGM, 5.00%, 9/1/2040 | | |
| | |
|
Public Finance Authority, College Achieve Central Charter School Project | | |
Series 2021A, Rev., 5.00%, 6/15/2027 (b) | | |
Series 2021A, Rev., 5.00%, 6/15/2029 (b) | | |
Series 2021A, Rev., 5.00%, 6/15/2031 (b) | | |
Public Finance Authority, Coral Academy of Science Series 2021A, Rev., 4.00%, 7/1/2041 | | |
Public Finance Authority, Ripple Ranch, LLC Obligate Series 2021A, Rev., 5.25%, 12/1/2051 (b) | | |
Public Finance Authority, The Carmelite System, Inc., Obligated Group Rev., 3.25%, 1/1/2026 | | |
Public Finance Authority, The Franklin School of Innovation Rev., 5.00%, 1/1/2042 (b) | | |
| | |
Municipal Bonds — continued |
|
Public Finance Authority, Viticus Group Project Series 2022A, Rev., 4.00%, 12/1/2031 (b) | | |
Wisconsin Health and Educational Facilities Authority, Agnesian Healthcare, Inc. | | |
| | |
| | |
Wisconsin Health and Educational Facilities Authority, Franciscan Sisters of Christian Charity Sponsored Ministries, Inc. | | |
Series 2017A, Rev., 5.00%, 9/1/2025 (e) | | |
Series 2017A, Rev., 5.00%, 9/1/2027 (e) | | |
Wisconsin Health and Educational Facilities Authority, Milwaukee Regional Medical Center Thermal Service Rev., 5.00%, 4/1/2035 | | |
Wisconsin Health and Educational Facilities Authority, Three Pillars Senior Living Communities Series 2021A, Rev., 4.00%, 8/15/2041 | | |
Wisconsin Housing and Economic Development Authority Home Ownership Series 2024 A, Rev., GNMA / FNMA / FHLMC, 6.00%, 9/1/2054 | | |
| | |
|
Wyoming Community Development Authority Series 2017-5, Rev., 4.00%, 12/1/2046 | | |
Total Municipal Bonds
(Cost $192,528,347) | | |
| | |
Short-Term Investments — 15.4% |
Investment Companies — 15.4% |
JPMorgan Institutional Tax Free Money Market Fund Class IM Shares, 3.37% (f) (g)
(Cost $33,472,873) | | |
Total Investments — 102.6%
(Cost $226,001,220) | | |
Liabilities in Excess of Other Assets — (2.6)% | | |
| | |
Percentages indicated are based on net assets. |
| |
| Insured by Assured Guaranty Municipal Corp. |
| |
| |
| Connecticut Higher Education Supplemental Loan Authority |
| |
| Certificate of Participation |
| Federal Housing Administration |
| Federal Home Loan Mortgage Corp. |
| Federal National Mortgage Association |
| Government National Mortgage Association |
| |
| Insured by National Public Finance Guarantee Corp. |
| Permanent School Fund Guaranteed |
| |
| |
| The date shown represents the earliest of the prerefunded date, next put date or final maturity date. |
| Securities exempt from registration under Rule 144A or section 4(a)(2), of the Securities Act of 1933, as amended. |
| Variable or floating rate security, the interest rate of which adjusts periodically based on changes in current interest rates and prepayments on the underlying pool of assets. The interest rate shown is the current rate as of February 29, 2024. |
| All or a portion of the security is a when-issued security, delayed delivery security, or forward commitment. |
| Security is prerefunded or escrowed to maturity. |
| Investment in an affiliated fund, which is registered under the Investment Company Act of 1940, as amended, and is advised by J.P. Morgan Investment Management Inc. |
| The rate shown is the current yield as of February 29, 2024. |
STATEMENTS OF ASSETS AND LIABILITIESAS OF February 29, 2024
| JPMorgan
High Yield Municipal ETF | JPMorgan Limited
Duration Bond ETF | |
| | | |
Investments in non-affiliates, at value | | | |
Investments in affiliates, at value | | | |
| | | |
| | | |
Investment securities sold | | | |
| | | |
Interest from non-affiliates | | | |
Dividends from affiliates | | | |
| | | |
| | | |
| | | |
| | | |
Investment securities purchased | | | |
Investment securities purchased — delayed delivery securities | | | |
| | | |
| | | |
| | | |
Printing and mailing costs | | | |
Custodian and accounting fees | | | |
| | | |
| | | |
| | | |
SEE NOTES TO FINANCIAL STATEMENTS.
| J.P. Morgan Exchange-Traded Funds | |
| JPMorgan High Yield Municipal ETF | JPMorgan Limited Duration Bond ETF | |
| | | |
| | | |
Total distributable earnings (loss) | | | |
| | | |
Outstanding number of shares
(unlimited number of shares authorized - par value $0.0001) (a) (b) (c) | | | |
Net asset value, per share | | | |
Cost of investments in non-affiliates | | | |
Cost of investments in affiliates | | | |
(a)
JPMorgan High Yield Municipal ETF acquired all of the assets and liabilities of the JPMorgan High Yield Municipal Fund ("Predecessor Fund") in a reorganization that occurred as of the close of business on July 14, 2023. Performance and financial history of the Predecessor Fund’s Class R6 Shares have been adopted by JPMorgan High Yield Municipal ETF and will be used going forward. As a result, the information prior to close of business on July 14, 2023, reflects that of the Predecessor Fund's Class R6 Shares. The Predecessor Fund ceased operations as of the date of the reorganization. See Note 1.
(b)
JPMorgan Limited Duration Bond ETF acquired all of the assets and liabilities of the JPMorgan Limited Duration Bond Fund ("Predecessor Fund") in a reorganization that occurred as of the close of business on July 28, 2023. Performance and financial history of the Predecessor Fund’s Class R6 Shares have been adopted by JPMorgan Limited Duration Bond ETF and will be used going forward. As a result, the information prior to close of business on July 28, 2023, reflects that of the Predecessor Fund's Class R6 Shares. The Predecessor Fund ceased operations as of the date of the reorganization. See Note 1.
(c)
JPMorgan Sustainable Municipal Income ETF acquired all of the assets and liabilities of the JPMorgan Sustainable Municipal Income Fund ("Predecessor Fund") in a reorganization that occurred as of the close of business on July 14, 2023. Performance and financial history of the Predecessor Fund’s Class R6 Shares have been adopted by JPMorgan Sustainable Municipal Income ETF and will be used going forward. As a result, the information prior to close of business on July 14, 2023, reflects that of the Predecessor Fund's Class R6 Shares. The Predecessor Fund ceased operations as of the date of the reorganization. See Note 1.
SEE NOTES TO FINANCIAL STATEMENTS.
| J.P. Morgan Exchange-Traded Funds | |
STATEMENTS OF OPERATIONSFOR THE YEAR ENDED February 29, 2024
| JPMorgan
High Yield Municipal ETF (a) | JPMorgan Limited
Duration Bond ETF (b) | |
| | | |
Interest income from non-affiliates | | | |
Interest income from affiliates | | | |
Dividend income from affiliates | | | |
| | | |
| | | |
| | | |
| | | |
Distribution fees (See Note 3.C.) | | | |
Service fees (See Note 3.D.) | | | |
Custodian and accounting fees | | | |
Interest expense to non-affiliates | | | |
Interest expense to affiliates | | | |
| | | |
Trustees’ and Chief Compliance Officer’s fees | | | |
Printing and mailing costs | | | |
Registration and filing fees | | | |
Transfer agency fees (See Note 2.H.) | | | |
| | | |
| | | |
| | | |
Less expense reimbursements | | | |
| | | |
Net investment income (loss) | | | |
(a)
JPMorgan High Yield Municipal ETF acquired all of the assets and liabilities of the JPMorgan High Yield Municipal Fund ("Predecessor Fund") in a reorganization that occurred as of the close of business on July 14, 2023. Performance and financial history of the Predecessor Fund’s Class R6 Shares have been adopted by JPMorgan High Yield Municipal ETF and will be used going forward. As a result, the information prior to close of business on July 14, 2023, reflects that of the Predecessor Fund's Class R6 Shares. The Predecessor Fund ceased operations as of the date of the reorganization. See Note 1.
(b)
JPMorgan Limited Duration Bond ETF acquired all of the assets and liabilities of the JPMorgan Limited Duration Bond Fund ("Predecessor Fund") in a reorganization that occurred as of the close of business on July 28, 2023. Performance and financial history of the Predecessor Fund’s Class R6 Shares have been adopted by JPMorgan Limited Duration Bond ETF and will be used going forward. As a result, the information prior to close of business on July 28, 2023, reflects that of the Predecessor Fund's Class R6 Shares. The Predecessor Fund ceased operations as of the date of the reorganization. See Note 1.
(c)
JPMorgan Sustainable Municipal Income ETF acquired all of the assets and liabilities of the JPMorgan Sustainable Municipal Income Fund ("Predecessor Fund") in a reorganization that occurred as of the close of business on July 14, 2023. Performance and financial history of the Predecessor Fund’s Class R6 Shares have been adopted by JPMorgan Sustainable Municipal Income ETF and will be used going forward. As a result, the information prior to close of business on July 14, 2023, reflects that of the Predecessor Fund's Class R6 Shares. The Predecessor Fund ceased operations as of the date of the reorganization. See Note 1.
SEE NOTES TO FINANCIAL STATEMENTS.
| J.P. Morgan Exchange-Traded Funds | |
| JPMorgan High Yield Municipal ETF (a) | JPMorgan Limited Duration Bond ETF (b) | |
REALIZED/UNREALIZED GAINS (LOSSES): | | | |
Net realized gain (loss) on transactions from: | | | |
Investments in non-affiliates | | | |
Investments in affiliates | | | |
| | | |
| | | |
| | | |
Change in net unrealized appreciation/depreciation on: | | | |
Investments in non-affiliates | | | |
Investments in affiliates | | | |
| | | |
| | | |
Change in net unrealized appreciation/depreciation | | | |
Net realized/unrealized gains (losses) | | | |
Change in net assets resulting from operations | | | |
(a)
JPMorgan High Yield Municipal ETF acquired all of the assets and liabilities of the JPMorgan High Yield Municipal Fund ("Predecessor Fund") in a reorganization that occurred as of the close of business on July 14, 2023. Performance and financial history of the Predecessor Fund’s Class R6 Shares have been adopted by JPMorgan High Yield Municipal ETF and will be used going forward. As a result, the information prior to close of business on July 14, 2023, reflects that of the Predecessor Fund's Class R6 Shares. The Predecessor Fund ceased operations as of the date of the reorganization. See Note 1.
(b)
JPMorgan Limited Duration Bond ETF acquired all of the assets and liabilities of the JPMorgan Limited Duration Bond Fund ("Predecessor Fund") in a reorganization that occurred as of the close of business on July 28, 2023. Performance and financial history of the Predecessor Fund’s Class R6 Shares have been adopted by JPMorgan Limited Duration Bond ETF and will be used going forward. As a result, the information prior to close of business on July 28, 2023, reflects that of the Predecessor Fund's Class R6 Shares. The Predecessor Fund ceased operations as of the date of the reorganization. See Note 1.
(c)
JPMorgan Sustainable Municipal Income ETF acquired all of the assets and liabilities of the JPMorgan Sustainable Municipal Income Fund ("Predecessor Fund") in a reorganization that occurred as of the close of business on July 14, 2023. Performance and financial history of the Predecessor Fund’s Class R6 Shares have been adopted by JPMorgan Sustainable Municipal Income ETF and will be used going forward. As a result, the information prior to close of business on July 14, 2023, reflects that of the Predecessor Fund's Class R6 Shares. The Predecessor Fund ceased operations as of the date of the reorganization. See Note 1.
SEE NOTES TO FINANCIAL STATEMENTS.
| J.P. Morgan Exchange-Traded Funds | |
STATEMENTS OF CHANGES IN NET ASSETSFOR THE PERIODS INDICATED
| JPMorgan High Yield Municipal ETF | JPMorgan Limited Duration Bond ETF |
| Year Ended
February 29, 2024 (a) | Year Ended
February 28, 2023 (a) | Year Ended
February 29, 2024 (b) | |
CHANGE IN NET ASSETS RESULTING FROM OPERATIONS: | | | | |
Net investment income (loss) | | | | |
| | | | |
Distributions of capital gains received from investment company affiliates | | | | |
Change in net unrealized appreciation/ depreciation | | | | |
Change in net assets resulting from operations | | | | |
DISTRIBUTIONS TO SHAREHOLDERS: | | | | |
Total distributions to shareholders | | | | |
| | | | |
Change in net assets resulting from capital transactions | | | | |
| | | | |
| | | | |
| | | | |
| | | | |
(a)
JPMorgan High Yield Municipal ETF acquired all of the assets and liabilities of the JPMorgan High Yield Municipal Fund ("Predecessor Fund") in a reorganization that occurred as of the close of business on July 14, 2023. Performance and financial history of the Predecessor Fund’s Class R6 Shares have been adopted by JPMorgan High Yield Municipal ETF and will be used going forward. As a result, the information prior to close of business on July 14, 2023, reflects that of the Predecessor Fund's Class R6 Shares. The Predecessor Fund ceased operations as of the date of the reorganization. See Note 1.
(b)
JPMorgan Limited Duration Bond ETF acquired all of the assets and liabilities of the JPMorgan Limited Duration Bond Fund ("Predecessor Fund") in a reorganization that occurred as of the close of business on July 28, 2023. Performance and financial history of the Predecessor Fund’s Class R6 Shares have been adopted by JPMorgan Limited Duration Bond ETF and will be used going forward. As a result, the information prior to close of business on July 28, 2023, reflects that of the Predecessor Fund's Class R6 Shares. The Predecessor Fund ceased operations as of the date of the reorganization. See Note 1.
SEE NOTES TO FINANCIAL STATEMENTS.
| J.P. Morgan Exchange-Traded Funds | |
| JPMorgan Sustainable Municipal Income ETF |
| Year Ended
February 29, 2024 (a) | |
CHANGE IN NET ASSETS RESULTING FROM OPERATIONS: | | |
Net investment income (loss) | | |
| | |
Distributions of capital gains received from investment company affiliates | | |
Change in net unrealized appreciation/depreciation | | |
Change in net assets resulting from operations | | |
DISTRIBUTIONS TO SHAREHOLDERS: | | |
Total distributions to shareholders | | |
| | |
Change in net assets resulting from capital transactions | | |
| | |
| | |
| | |
| | |
(a)
JPMorgan Sustainable Municipal Income ETF acquired all of the assets and liabilities of the JPMorgan Sustainable Municipal Income Fund ("Predecessor Fund") in a reorganization that occurred as of the close of business on July 14, 2023. Performance and financial history of the Predecessor Fund’s Class R6 Shares have been adopted by JPMorgan Sustainable Municipal Income ETF and will be used going forward. As a result, the information prior to close of business on July 14, 2023, reflects that of the Predecessor Fund's Class R6 Shares. The Predecessor Fund ceased operations as of the date of the reorganization. See Note 1.
SEE NOTES TO FINANCIAL STATEMENTS.
| J.P. Morgan Exchange-Traded Funds | |
STATEMENTS OF CHANGES IN NET ASSETSFOR THE PERIODS INDICATED (continued)
| JPMorgan High Yield Municipal ETF | JPMorgan Limited Duration Bond ETF |
| Year Ended February 29, 2024(a) | Year Ended February 28, 2023(a) | Year Ended February 29, 2024(b) | |
CAPITAL TRANSACTIONS: (c) (d) | | | | |
Proceeds from shares issued | | | | |
| | | | |
| | | | |
Change in net assets resulting from capital transactions | | | | |
| | | | |
Proceeds from shares issued | | | | |
| | | | |
| | | | |
Change in net assets resulting from Class A capital transactions | | | | |
| | | | |
Proceeds from shares issued | | | | |
| | | | |
| | | | |
Change in net assets resulting from Class C capital transactions | | | | |
| | | | |
Proceeds from shares issued | | | | |
| | | | |
| | | | |
Change in net assets resulting from Class I capital transactions | | | | |
Total change in net assets resulting from capital transactions | | | | |
(a)
JPMorgan High Yield Municipal ETF acquired all of the assets and liabilities of the JPMorgan High Yield Municipal Fund ("Predecessor Fund") in a reorganization that occurred as of the close of business on July 14, 2023. Performance and financial history of the Predecessor Fund’s Class R6 Shares have been adopted by JPMorgan High Yield Municipal ETF and will be used going forward. As a result, the information prior to close of business on July 14, 2023, reflects that of the Predecessor Fund's Class R6 Shares. The Predecessor Fund ceased operations as of the date of the reorganization. See Note 1.
(b)
JPMorgan Limited Duration Bond ETF acquired all of the assets and liabilities of the JPMorgan Limited Duration Bond Fund ("Predecessor Fund") in a reorganization that occurred as of the close of business on July 28, 2023. Performance and financial history of the Predecessor Fund’s Class R6 Shares have been adopted by JPMorgan Limited Duration Bond ETF and will be used going forward. As a result, the information prior to close of business on July 28, 2023, reflects that of the Predecessor Fund's Class R6 Shares. The Predecessor Fund ceased operations as of the date of the reorganization. See Note 1.
(c)
Reflects reorganization from JPMorgan High Yield Municipal Fund on July 14, 2023. See Note 1.
(d)
Reflects reorganization from JPMorgan Limited Duration Bond Fund on July 28, 2023. See Note 1.
SEE NOTES TO FINANCIAL STATEMENTS.
| J.P. Morgan Exchange-Traded Funds | |
| JPMorgan High Yield Municipal ETF | JPMorgan Limited Duration Bond ETF |
| Year Ended February 29, 2024(a) | Year Ended February 28, 2023(a) | Year Ended February 29, 2024(b) | |
SHARE TRANSACTIONS: (c) (d) | | | | |
| | | | |
| | | | |
| | | | |
| | | | |
| | | | |
| | | | |
| | | | |
| | | | |
| | | | |
| | | | |
| | | | |
| | | | |
| | | | |
| | | | |
| | | | |
| | | | |
| | | | |
| | | | |
| | | | |
(a)
JPMorgan High Yield Municipal ETF acquired all of the assets and liabilities of the JPMorgan High Yield Municipal Fund ("Predecessor Fund") in a reorganization that occurred as of the close of business on July 14, 2023. Performance and financial history of the Predecessor Fund’s Class R6 Shares have been adopted by JPMorgan High Yield Municipal ETF and will be used going forward. As a result, the information prior to close of business on July 14, 2023, reflects that of the Predecessor Fund's Class R6 Shares. The Predecessor Fund ceased operations as of the date of the reorganization. See Note 1.
(b)
JPMorgan Limited Duration Bond ETF acquired all of the assets and liabilities of the JPMorgan Limited Duration Bond Fund ("Predecessor Fund") in a reorganization that occurred as of the close of business on July 28, 2023. Performance and financial history of the Predecessor Fund’s Class R6 Shares have been adopted by JPMorgan Limited Duration Bond ETF and will be used going forward. As a result, the information prior to close of business on July 28, 2023, reflects that of the Predecessor Fund's Class R6 Shares. The Predecessor Fund ceased operations as of the date of the reorganization. See Note 1.
(c)
Reflects reorganization from JPMorgan High Yield Municipal Fund on July 14, 2023. See Note 1.
(d)
Reflects reorganization from JPMorgan Limited Duration Bond Fund on July 28, 2023. See Note 1.
SEE NOTES TO FINANCIAL STATEMENTS.
| J.P. Morgan Exchange-Traded Funds | |
STATEMENTS OF CHANGES IN NET ASSETSFOR THE PERIODS INDICATED (continued)
| JPMorgan Sustainable Municipal Income ETF |
| Year Ended February 29, 2024(a) | |
CAPITAL TRANSACTIONS: (b) | | |
Proceeds from shares issued | | |
| | |
| | |
Change in net assets resulting from capital transactions | | |
| | |
Proceeds from shares issued | | |
| | |
| | |
Change in net assets resulting from Class A capital transactions | | |
| | |
Proceeds from shares issued | | |
| | |
| | |
Change in net assets resulting from Class C capital transactions | | |
| | |
Proceeds from shares issued | | |
| | |
| | |
Change in net assets resulting from Class I capital transactions | | |
Total change in net assets resulting from capital transactions | | |
(a)
JPMorgan Sustainable Municipal Income ETF acquired all of the assets and liabilities of the JPMorgan Sustainable Municipal Income Fund ("Predecessor Fund") in a reorganization that occurred as of the close of business on July 14, 2023. Performance and financial history of the Predecessor Fund’s Class R6 Shares have been adopted by JPMorgan Sustainable Municipal Income ETF and will be used going forward. As a result, the information prior to close of business on July 14, 2023, reflects that of the Predecessor Fund's Class R6 Shares. The Predecessor Fund ceased operations as of the date of the reorganization. See Note 1.
(b)
Reflects reorganization from JPMorgan Sustainable Municipal Income Fund on July 14, 2023. See Note 1.
SEE NOTES TO FINANCIAL STATEMENTS.
| J.P. Morgan Exchange-Traded Funds | |
| JPMorgan Sustainable Municipal Income ETF |
| Year Ended February 29, 2024(a) | |
| | |
| | |
| | |
| | |
| | |
| | |
| | |
| | |
| | |
| | |
| | |
| | |
| | |
| | |
| | |
| | |
| | |
| | |
| | |
| | |
(a)
JPMorgan Sustainable Municipal Income ETF acquired all of the assets and liabilities of the JPMorgan Sustainable Municipal Income Fund ("Predecessor Fund") in a reorganization that occurred as of the close of business on July 14, 2023. Performance and financial history of the Predecessor Fund’s Class R6 Shares have been adopted by JPMorgan Sustainable Municipal Income ETF and will be used going forward. As a result, the information prior to close of business on July 14, 2023, reflects that of the Predecessor Fund's Class R6 Shares. The Predecessor Fund ceased operations as of the date of the reorganization. See Note 1.
(b)
Reflects reorganization from JPMorgan Sustainable Municipal Income Fund on July 14, 2023. See Note 1.
SEE NOTES TO FINANCIAL STATEMENTS.
| J.P. Morgan Exchange-Traded Funds | |
FINANCIAL HIGHLIGHTSFOR THE PERIODS INDICATED
| Per share operating performance (a) |
| | | |
| Net
asset
value
beginning of
period | Net
investment
income
(loss)(b) | Net
realized
and unrealized
gains (losses)
on investments | Total
from
investment
operations | | | | Net asset
value,
end of
period |
JPMorgan High Yield Municipal ETF (e) | | | | | | | | |
Year Ended February 29, 2024 | | | | | | | | |
Year Ended February 28, 2023 | | | | | | | | |
Year Ended February 28, 2022 | | | | | | | | |
Year Ended February 28, 2021 | | | | | | | | |
Year Ended February 29, 2020 | | | | | | | | |
|
| Per share amounts reflect the conversion of the Predecessor Fund into the Fund as of the close of business on July 14, 2023. See Note 1. |
| Calculated based upon average shares outstanding. |
| Includes adjustments in accordance with accounting principles generally accepted in the United States of America and as such, the net asset values for financial reporting purposes and the returns based upon those net asset values may differ from the net asset values and returns for shareholder transactions. |
| JPMorgan High Yield Municipal ETF acquired all of the assets and liabilities of the JPMorgan High Yield Municipal Fund (“Predecessor Fund”) in a reorganization that occurred as of the close of business on July 14, 2023. Market price returns are calculated using the official closing price of the JPMorgan High Yield Municipal ETF on the listing exchange as of the time that the JPMorgan High Yield Municipal ETF's NAV is calculated. Prior to the JPMorgan High Yield Municipal ETF's listing on July 17, 2023, the NAV performance of the Class R6 Shares of the Predecessor Fund are used as proxy market price returns. |
| JPMorgan High Yield Municipal ETF (the “Fund”) acquired all of the assets and liabilities of the JPMorgan High Yield Municipal Fund (“Predecessor Fund”) in a reorganization that occurred as of the close of business on July 14, 2023. Performance and financial history of the Predecessor Fund’s Class R6 Shares have been adopted by the Fund and will be used going forward. As a result, the financial highlight information reflects that of the Predecessor Fund’s Class R6 Shares for the period March 1, 2019 up through the reorganization. |
SEE NOTES TO FINANCIAL STATEMENTS.
| J.P. Morgan Exchange-Traded Funds | |
| |
| | | | Ratios to average net assets |
| | Market
price
total
return(d) | | | Net
investment
income (loss) | Expenses
without waivers
and
reimbursements | |
| | | | | | | |
| | | | | | | |
| | | | | | | |
| | | | | | | |
| | | | | | | |
| | | | | | | |
SEE NOTES TO FINANCIAL STATEMENTS.
| J.P. Morgan Exchange-Traded Funds | |
FINANCIAL HIGHLIGHTSFOR THE PERIODS INDICATED (continued)
| Per share operating performance (a) |
| | | |
| Net
asset
value
beginning of
period | Net
investment
income
(loss)(b) | Net
realized
and unrealized
gains (losses)
on investments | Total
from
investment
operations | |
JPMorgan Limited Duration Bond ETF (f) | | | | | |
Year Ended February 29, 2024 | | | | | |
Year Ended February 28, 2023 | | | | | |
Year Ended February 28, 2022 | | | | | |
Year Ended February 28, 2021 | | | | | |
Year Ended February 29, 2020 | | | | | |
|
| Per share amounts reflect the conversion of the Predecessor Fund into the Fund as of the close of business on July 28, 2023. See Note 1. |
| Calculated based upon average shares outstanding. |
| Includes adjustments in accordance with accounting principles generally accepted in the United States of America and as such, the net asset values for financial reporting purposes and the returns based upon those net asset values may differ from the net asset values and returns for shareholder transactions. |
| JPMorgan Limited Duration Bond ETF acquired all of the assets and liabilities of the JPMorgan Limited Duration Bond Fund (“Predecessor Fund”) in a reorganization that occurred as of the close of business on July 28, 2023. Market price returns are calculated using the official closing price of the JPMorgan Limited Duration Bond ETF on the listing exchange as of the time that the JPMorgan Limited Duration Bond ETF's NAV is calculated. Prior to the JPMorgan Limited Duration Bond ETF's listing on July 31, 2023, the NAV performance of the Class R6 Shares of the Predecessor Fund are used as proxy market price returns. |
| Includes interest expense, if applicable, which is less than 0.005% unless otherwise noted. |
| JPMorgan Limited Duration Bond ETF (the “Fund”) acquired all of the assets and liabilities of the JPMorgan Limited Duration Bond Fund (“Predecessor Fund”) in a reorganization that occurred as of the close of business on July 28, 2023. Performance and financial history of the Predecessor Fund’s Class R6 Shares have been adopted by the Fund and will be used going forward. As a result, the financial highlight information reflects that of the Predecessor Fund’s Class R6 Shares for the period March 1, 2019 up through the reorganization. |
SEE NOTES TO FINANCIAL STATEMENTS.
| J.P. Morgan Exchange-Traded Funds | |
| |
| | | | | Ratios to average net assets |
Net asset
value,
end of
period | | | Market
price
total
return(d) | | | Net
investment
income (loss) | Expenses
without waivers
and
reimbursements | |
| | | | | | | | |
| | | | | | | | |
| | | | | | | | |
| | | | | | | | |
| | | | | | | | |
| | | | | | | | |
SEE NOTES TO FINANCIAL STATEMENTS.
| J.P. Morgan Exchange-Traded Funds | |
FINANCIAL HIGHLIGHTSFOR THE PERIODS INDICATED (continued)
| Per share operating performance (a) |
| | | |
| Net
asset
value
beginning of
period | Net
investment
income
(loss)(b) | Net
realized
and unrealized
gains (losses)
on investments | Total
from
investment
operations | |
JPMorgan Sustainable Municipal Income ETF (e) | | | | | |
Year Ended February 29, 2024 | | | | | |
Year Ended February 28, 2023 | | | | | |
Year Ended February 28, 2022 | | | | | |
Year Ended February 28, 2021 | | | | | |
Year Ended February 29, 2020 | | | | | |
|
| Per share amounts reflect the conversion of the Predecessor Fund into the Fund as of the close of business on July 14, 2023. See Note 1. |
| Calculated based upon average shares outstanding. |
| Includes adjustments in accordance with accounting principles generally accepted in the United States of America and as such, the net asset values for financial reporting purposes and the returns based upon those net asset values may differ from the net asset values and returns for shareholder transactions. |
| JPMorgan Sustainable Municipal Income ETF acquired all of the assets and liabilities of the JPMorgan Sustainable Municipal Income Fund (“Predecessor Fund”) in a reorganization that occurred as of the close of business on July 14, 2023. Market price returns are calculated using the official closing price of the JPMorgan Sustainable Municipal Income ETF on the listing exchange as of the time that the JPMorgan Sustainable Municipal Income ETF's NAV is calculated. Prior to the JPMorgan Sustainable Municipal Income ETF's listing on July 17, 2023, the NAV performance of the Class R6 Shares of the Predecessor Fund are used as proxy market price returns. |
| JPMorgan Sustainable Municipal Income ETF (the “Fund”) acquired all of the assets and liabilities of the JPMorgan Sustainable Municipal Income Fund (“Predecessor Fund”) in a reorganization that occurred as of the close of business on July 14, 2023. Performance and financial history of the Predecessor Fund’s Class R6 Shares have been adopted by the Fund and will be used going forward. As a result, the financial highlight information reflects that of the Predecessor Fund’s Class R6 Shares for the period March 1, 2019 up through the reorganization. |
SEE NOTES TO FINANCIAL STATEMENTS.
| J.P. Morgan Exchange-Traded Funds | |
| |
| | | | | Ratios to average net assets |
Net asset
value,
end of
period | | | Market
price
total
return(d) | | | Net
investment
income (loss) | Expenses
without waivers
and
reimbursements | |
| | | | | | | | |
| | | | | | | | |
| | | | | | | | |
| | | | | | | | |
| | | | | | | | |
| | | | | | | | |
SEE NOTES TO FINANCIAL STATEMENTS.
| J.P. Morgan Exchange-Traded Funds | |
NOTES TO FINANCIAL STATEMENTSAS OF February 29, 2024
1. Organization
J.P. Morgan Exchange-Traded Fund Trust (the “Trust”) was formed on February 25, 2010, and is governed by a Declaration of Trust as amended and restated February 19, 2014, and is registered under the Investment Company Act of 1940, as amended (the “1940 Act”), as an open-end management investment company. The following are 3 separate funds of the Trust (each, a "Fund" and collectively, the "Funds") covered by this report:
| Diversification Classification |
JPMorgan High Yield Municipal ETF | |
JPMorgan Limited Duration Bond ETF | |
JPMorgan Sustainable Municipal Income ETF | |
Pursuant to an Agreement and Plan of Reorganization and Liquidation previously approved by the Board of Trustees (the “Board”) of the applicable mutual fund trust, the following mutual funds (each, an “Acquired Fund” and collectively the “Acquired Funds”) were each reorganized into a newly created exchange-traded fund (each, a “Reorganization”) as of the close of business on the dates noted below (each, a “Closing Date”):
| | |
JPMorgan High Yield Municipal Fund | JPMorgan High Yield Municipal ETF | |
JPMorgan Limited Duration Bond Fund | JPMorgan Limited Duration Bond ETF | |
JPMorgan Sustainable Municipal Income Fund | JPMorgan Sustainable Municipal Income ETF | |
Following its Reorganization, each Acquired Fund’s performance (Class R6 Shares) and financial history were adopted by the new Fund. In connection with each Reorganization, each shareholder of an Acquired Fund (except as noted below) received shares of the surviving Fund equal in value to the number of shares of the Acquired Fund they owned on the Closing Date, including a cash payment in lieu of fractional shares of the Fund, which cash payment might have been taxable. Shareholders of an Acquired Fund who did not hold their shares through a brokerage account that could accept shares of the Fund on the Closing Date had their Acquired Funds shares liquidated, and such shareholders received cash equal in value to their Acquired Funds shares, which cash payment might have been taxable. Shareholders of an Acquired Fund who held their shares through a fund direct individual retirement account and did not take action prior to the applicable Reorganization had their Acquired Fund shares exchanged for Morgan Shares of the JPMorgan U.S. Government Money Market Fund equal in value to their Acquired Fund shares. Each Fund has the same investment adviser, investment objective and fundamental investment policies and substantially similar investment strategies as its Acquired Fund. Effective as of the close of business on its Closing Date, each Acquired Fund ceased operations in connection with the consummation of its Reorganization.
J.P. Morgan Investment Management Inc. (“JPMIM”), an indirect, wholly-owned subsidiary of JPMorgan Chase & Co. (“JPMorgan”), acts as adviser (the “Adviser”) and administrator (the “Administrator”) to the Funds.
Costs incurred by the Funds and the Acquired Funds associated with each Reorganization (including the legal costs associated with each Reorganization) were borne by the Adviser by waiving fees or reimbursing expenses to offset the costs incurred by each Fund or Acquired Fund associated with each Reorganization, including any brokerage fees and expenses incurred by the Fund or Acquired Fund related to the disposition and acquisition of assets as part of each Reorganization. Brokerage fees and expenses related to the disposition and acquisition of assets (including any disposition to raise cash to pay redemption proceeds) that were incurred in the ordinary course of business were borne by the Funds and the Acquired Funds. The management fee of each Fund is the same as the management fee of the corresponding Acquired Fund. The total annual fund operating expenses of each Fund are expected to be lower than the net expenses of each share class of the Acquired Fund after taking into consideration the expense limitation agreement the Adviser has entered into with the Funds for a term ending July 31, 2026. Each Reorganization did not result in the material change to the Acquired Funds' portfolio holdings. There are no material differences in accounting policies of the Acquired Funds as compared to those of the Funds. Each Fund did not purchase or sell securities following its Reorganization for purposes of realigning its investment portfolio. Accordingly, each Reorganization of an Acquired Fund did not affect the corresponding Fund’s portfolio turnover ratios for the year ended February 29, 2024.
The investment objective of JPMorgan High Yield Municipal ETF (“High Yield Municipal ETF”) is to seek a high level of current income exempt from federal income taxes.
The investment objective of JPMorgan Limited Duration Bond ETF (“Limited Duration Bond ETF”) is to seek a high level of current income consistent with low volatility of principal.
The investment objective of JPMorgan Sustainable Municipal Income ETF (“Sustainable Municipal Income ETF”) is to seek a current income exempt from federal income taxes.
| J.P. Morgan Exchange-Traded Funds | |
Shares of each Fund are listed and traded at market price on an exchange as follows:
| |
| |
Limited Duration Bond ETF | |
Sustainable Municipal Income ETF | |
Market prices for the Funds’ shares may be different from their net asset value (“NAV”).
The Funds issue and redeem their shares on a continuous basis, through JPMorgan Distribution Services, Inc. (the “Distributor” or “JPMDS”), an indirect, wholly-owned subsidiary of JPMorgan, at NAV in large blocks of shares, referred to as “Creation Units”. Creation Units are issued and redeemed in exchange for a basket of securities and/or cash. Shares are generally traded in the secondary market in amounts less than a Creation Unit at market prices that change throughout the day. Only individuals or institutions that have entered into an authorized participant agreement with the Distributor may do business directly with the Funds (each, an “Authorized Participant”).
2. Significant Accounting Policies
The following is a summary of significant accounting policies followed by the Funds in the preparation of their financial statements. The Funds are investment companies and, accordingly, follow the investment company accounting and reporting guidance of the Financial Accounting Standards Board (“FASB”) Accounting Standards Codification Topic 946 — Investment Companies, which is part of U.S. generally accepted accounting principles (“GAAP”). The preparation of financial statements in conformity with GAAP requires management to make estimates and assumptions that affect (i) the reported amounts of assets and liabilities, (ii) disclosure of contingent assets and liabilities at the date of the financial statements, and (iii) the reported amounts of increases and decreases in net assets from operations during the reporting period. Actual results could differ from those estimates.
A. Valuation of Investments— Investments are valued in accordance with GAAP and the Funds' valuation policies set forth by, and under the supervision and responsibility of, the Board of Trustees of the Trust (the "Board"), which established the following approach to valuation, as described more fully below: (i) investments for which market quotations are readily available shall be valued at their market value and (ii) all other investments for which market quotations are not readily available shall be valued at their fair value as determined in good faith by the Board.
Under Section 2(a)(41) of the 1940 Act, the Board is required to determine fair value for securities that do not have readily available market quotations. Under SEC Rule 2a-5 (Good Faith Determinations of Fair Value), the Board may designate the performance of these fair valuation determinations to a valuation designee. The Board has designated the Adviser as the “Valuation Designee” to perform fair valuation determinations for the Funds on behalf of the Board subject to appropriate oversight by the Board. The Adviser, as Valuation Designee, leverages the J.P. Morgan Asset Management Americas Valuation Committee (“AVC”) to help oversee and carry out the policies for the valuation of investments held in the Funds. The Adviser, as Valuation Designee, remains responsible for the valuation determinations.
This oversight by the AVC includes monitoring the appropriateness of fair values based on results of ongoing valuation oversight including, but not limited to, consideration of macro or security specific events, market events, and pricing vendor and broker due diligence. The Administrator is responsible for discussing and assessing the potential impacts to the fair values on an ongoing basis, and, at least on a quarterly basis, with the AVC and the Board.
A market-based approach is primarily used to value the Funds' investments. Investments for which market quotations are not readily available are fair valued using prices supplied by approved affiliated and/or unaffiliated pricing vendors or third party broker-dealers (collectively referred to as “Pricing Services”) or may be internally fair valued using methods set forth by the valuation policies approved by the Board. This may include the use of related or comparable assets or liabilities, recent transactions, market multiples, book values and other relevant information for the investment. An income-based valuation approach may be used in which the anticipated future cash flows of the investment are discounted to calculate the fair value. Discounts may also be applied due to the nature or duration of any restrictions on the disposition of the investments. Valuations may be based upon current market prices of securities that are comparable in coupon, rating, maturity and industry. It is possible that the estimated values may differ significantly from the values that would have been used had a ready market for the investments existed, and such differences could be material.
Fixed income instruments are valued based on prices received from Pricing Services. The Pricing Services use multiple valuation techniques to determine the valuation of fixed income instruments. In instances where sufficient market activity exists, the Pricing Services may utilize a market-based approach through which trades or quotes from market makers are used to determine the valuation of these instruments. In instances where sufficient market activity may not exist, the Pricing Services also utilize proprietary valuation models which may consider market transactions in comparable securities and the various relationships between securities in determining fair value and/or market characteristics in order to estimate the relevant cash flows, which are then discounted to calculate the fair values.
Investments in open-end investment companies (“Underlying Funds”) are valued at each Underlying Fund’s NAV per share as of the report date.
| J.P. Morgan Exchange-Traded Funds | |
NOTES TO FINANCIAL STATEMENTSAS OF February 29, 2024 (continued)
Futures contracts are generally valued on the basis of available market quotations. Swaps are valued utilizing market quotations from approved Pricing Services.
See the table on “Quantitative Information about Level 3 Fair Value Measurements” for information on the valuation techniques and inputs used to value level 3 securities held by Limited Duration Bond ETF at February 29, 2024.
Valuations reflected in this report are as of the report date. As a result, changes in valuation due to market events and/or issuer-related events after the report date and prior to issuance of the report are not reflected herein.
The various inputs that are used in determining the valuation of the Funds' investments are summarized into the three broad levels listed below.
•
Level 1 — Unadjusted inputs using quoted prices in active markets for identical investments.
•
Level 2 — Other significant observable inputs including, but not limited to, quoted prices for similar investments, inputs other than quoted prices that are observable for investments (such as interest rates, prepayment speeds, credit risk, etc.) or other market corroborated inputs.
•
Level 3 — Significant inputs based on the best information available in the circumstances, to the extent observable inputs are not available (including the Funds' assumptions in determining the fair value of investments).
A financial instrument’s level within the fair value hierarchy is based on the lowest level of any input, both individually and in the aggregate, that is significant to the fair value measurement. The inputs or methodology used for valuing instruments are not necessarily an indication of the risk associated with investing in those instruments.
The following tables represent each valuation input as presented on the Schedules of Portfolio Investments ("SOIs"):
| | | | |
| | Level 2
Other significant
observable inputs | Level 3
Significant
unobservable inputs | |
Investments in Securities | | | | |
| | | | |
| | | | |
| | | | |
Total Investments in Securities | | | | |
Limited Duration Bond ETF | | | | |
| | Level 2
Other significant
observable inputs | Level 3
Significant
unobservable inputs | |
Investments in Securities | | | | |
| | | | |
Collateralized Mortgage Obligations | | | | |
Commercial Mortgage-Backed Securities | | | | |
| | | | |
Mortgage-Backed Securities | | | | |
| | | | |
| | | | |
Total Investments in Securities | | | | |
Sustainable Municipal Income ETF | | | | |
| | Level 2
Other significant
observable inputs | Level 3
Significant
unobservable inputs | |
Investments in Securities | | | | |
| | | | |
| | | | |
| | | | |
Total Investments in Securities | | | | |
| J.P. Morgan Exchange-Traded Funds | |
The following is a summary of investments for which significant unobservable inputs (level 3) were used in determining fair value:
Limited Duration Bond ETF | Balance as of
February 28,
2023* | | Change in net
unrealized
appreciation
(depreciation) | Net
accretion
(amortization) | | | | | Balance as of
February 29,
2024 |
Investments in Securities: | | | | | | | | | |
| | | | | | | | | |
|
| Purchases include all purchases of securities and securities received in corporate actions. |
| Sales include all sales of securities, maturities, paydowns and securities tendered in corporate actions. |
| As of the close of business on July 28, 2023, JPMorgan Limited Duration Bond Fund (the "Acquired Fund"), a series of JPMorgan Trust II,
reorganized ("the Reorganization") into a newly created exchange-traded fund, JPMorgan Limited Duration Bond ETF (the "Fund"). Following the
Reorganization, the Acquired Fund's performance and financial history were adopted by the Fund. The table includes transactions from the
Acquired Fund for the period March 1, 2023 through July 28, 2023. |
The changes in net unrealized appreciation (depreciation) attributable to securities owned at February 29, 2024, which were valued using significant unobservable inputs (level 3), amounted to $400,739. This amount is included in Change in net unrealized appreciation/depreciation on investments in non-affiliates on the Statements of Operations.
The significant unobservable inputs used in the fair value measurement of the Funds' investments are listed below. Generally, a change in the assumptions used in any input in isolation may be accompanied by a change in another input. Significant changes in any of the unobservable inputs may significantly impact the fair value measurement. The impact is based on the relationship between each unobservable input and the fair value measurement. Significant increases (decreases) in enterprise multiples may increase (decrease) the fair value measurement. Significant increases (decreases) in the discount for lack of marketability, liquidity discount, probability of default, yield and default rate may decrease (increase) the fair value measurement. A significant change in the discount rate or prepayment rate (Constant Prepayment Rate or PSA Prepayment Model) may decrease or increase the fair value measurement.
Limited
Duration Bond ETF
Quantitative Information about Level 3 Fair Value Measurements
| Fair Value at February 29, 2024 | | | Range (Weighted Average) (a) |
| | | | |
| | | Yield (Discount Rate of Cash Flows) | |
| | | | |
| | | | |
| | | | |
| Unobservable inputs were weighted by the relative fair value of the instruments. |
B. Restricted Securities— Certain securities held by the Funds may be subject to legal or contractual restrictions on resale. Restricted securities generally are resold in transactions exempt from registration under the Securities Act of 1933, as amended (the “Securities Act”). Disposal of these securities may involve time-consuming negotiations and expense. Prompt sale at the current valuation may be difficult and could adversely affect the NAVs of the Funds.
As of February 29, 2024, the Funds had no investments in restricted securities other than securities sold to the Funds under Rule 144A and/or Regulation S under the Securities Act.
| J.P. Morgan Exchange-Traded Funds | |
NOTES TO FINANCIAL STATEMENTSAS OF February 29, 2024 (continued)
C. When-Issued Securities, Delayed Delivery Securities and Forward Commitments— High Yield Municipal ETF and Sustainable Municipal Income ETF purchased when-issued securities, including To-Be-Announced (“TBA”) securities, and entered into contracts to purchase or sell securities for a fixed price that may be settled a month or more after the trade date, or purchased delayed delivery securities which generally settle seven days after the trade date. When-issued securities are securities that have been authorized, but not issued in the market. A forward commitment involves entering into a contract to purchase or sell securities for a fixed price at a future date that may be settled a month or more after the trade date. A delayed delivery security is agreed upon in advance between the buyer and the seller of the security and is generally delivered beyond seven days of the agreed upon date. The purchase of securities on a when-issued, delayed delivery or forward commitment basis involves the risk that the value of the security to be purchased declines before the settlement date. The sale of securities on a forward commitment basis involves the risk that the value of the securities sold may increase before the settlement date. The Funds may be exposed to credit risk if the counterparty fails to perform under the terms of the transaction. Interest income for securities purchased on a when-issued, delayed delivery or forward commitment basis is not accrued until the settlement date.
High Yield Municipal ETF and Sustainable Municipal Income ETF had when-issued securities, delayed delivery securities or forward commitments outstanding as of February 29, 2024, which are shown as a Receivable for Investment securities sold — delayed delivery securities and/or a Payable for Investment securities purchased — delayed delivery securities, respectively, on the Statements of Assets and Liabilities. The values of these securities held at February 29, 2024 are detailed on the SOIs, if any.
D. Securities Lending — The Funds are authorized to engage in securities lending in order to generate additional income. The Funds are able to lend to approved borrowers. Citibank N.A. (“Citibank”) serves as lending agent for the Funds, pursuant to a Securities Lending Agency Agreement (the “Securities Lending Agency Agreement”). Securities loaned are collateralized by cash equal to at least 100% of the market value plus accrued interest on the securities lent, which is invested in an affiliated money market fund. The Funds retain the interest earned on cash collateral investments but are required to pay the borrower a rebate for the use of the cash collateral. In cases where the lent security is of high value to borrowers, there may be a negative rebate (i.e., a net payment from the borrower to the Funds). Upon termination of a loan, the Funds are required to return to the borrower an amount equal to the cash collateral, plus any rebate owed to the borrowers. The remaining maturities of the securities lending transactions are considered overnight and continuous. Loans are subject to termination by the Funds or the borrower at any time.
The net income earned on the securities lending (after payment of rebates and Citibank’s fee) is included on the Statements of Operations as Income from securities lending (net). The Funds also receive payments from the borrower during the period of the loan, equivalent to dividends and interest earned on the securities loaned, which are recorded as Dividend or Interest income, respectively, on the Statements of Operations.
Under the Securities Lending Agency Agreement, Citibank marks to market the loaned securities on a daily basis. In the event the cash received from the borrower is less than 102% of the value of the loaned securities (105% for loans of non-U.S. securities), Citibank requests additional cash from the borrower so as to maintain a collateralization level of at least 102% of the value of the loaned securities plus accrued interest (105% for loans of non-U.S. securities), subject to certain de minimis amounts.
The value of securities out on loan is recorded as an asset on the Statements of Assets and Liabilities. The value of the cash collateral received is recorded as a liability on the Statements of Assets and Liabilities and details of collateral investments are disclosed on the SOIs.
The Funds bear the risk of loss associated with the collateral investments and are not entitled to additional collateral from the borrower to cover any such losses. To the extent that the value of the collateral investments declines below the amount owed to a borrower, the Funds may incur losses that exceed the amount they earned on lending the security. Upon termination of a loan, the Funds may use leverage (borrow money) to repay the borrower for cash collateral posted if the Adviser does not believe that it is prudent to sell the collateral investments to fund the payment of this liability. Securities lending activity is subject to master netting arrangements.
Securities lending also involves counterparty risks, including the risk that the loaned securities may not be returned in a timely manner or at all. Subject to certain conditions, Citibank has agreed to indemnify the Funds from losses resulting from a borrower’s failure to return a loaned security.
The Funds did not lend out any securities during the year ended February 29, 2024.
| J.P. Morgan Exchange-Traded Funds | |
E. Investment Transactions with Affiliates— The Funds invested in Underlying Funds advised by the Adviser. An issuer which is under common control with a Fund may be considered an affiliate. For the purposes of the financial statements, the Funds assume the issuers listed in the tables below to be affiliated issuers. The Underlying Funds’ distributions may be reinvested into such Underlying Funds. Reinvestment amounts are included in the purchases at cost amounts in the tables below.
|
For the year ended February 29, 2024* |
| | | | | Change in
Unrealized
Appreciation/
(Depreciation) | | Shares at
February 29,
2024 | | Capital Gain
Distributions |
JPMorgan Institutional Tax Free Money Market Fund Class IM Shares, 3.37% (a) (b) | | | | | | | | | |
JPMorgan Institutional Tax Free Money Market Fund Class Institutional Shares, 3.28% (a) (b) | | | | | | | | | |
| | | | | | | | | |
|
| Investment in an affiliated fund, which is registered under the Investment Company Act of 1940, as amended, and is advised by J.P. Morgan Investment Management Inc. |
| The rate shown is the current yield as of February 29, 2024. |
| As of the close of business on July 14, 2023, JPMorgan High Yield Municipal Fund (the "Acquired Fund"), a series of JPMorgan Trust I, reorganized ("the Reorganization") into a newly created exchange-traded fund, JPMorgan High Yield Municipal ETF (the "Fund"). Following the Reorganization, the Acquired Fund's performance and financial history were adopted by the Fund. The table includes transactions from the Acquired Fund for the period March 1, 2023 through July 14, 2023. |
Limited Duration Bond ETF |
For the year ended February 29, 2024* |
| | | | | Change in
Unrealized
Appreciation/
(Depreciation) | | Shares at
February 29,
2024 | | Capital Gain
Distributions |
JPMorgan Prime Money Market Fund Class IM Shares, 5.44% (a) (b) | | | | | | | | | |
JPMorgan Prime Money Market Fund Class Institutional Shares, 5.35% (a) (b) | | | | | | | | | |
| | | | | | | | | |
|
| Investment in an affiliated fund, which is registered under the Investment Company Act of 1940, as amended, and is advised by J.P. Morgan Investment Management Inc. |
| The rate shown is the current yield as of February 29, 2024. |
| As of the close of business on July 28, 2023, JPMorgan Limited Duration Bond Fund (the "Acquired Fund"), a series of JPMorgan Trust II,
reorganized ("the Reorganization") into a newly created exchange-traded fund, JPMorgan Limited Duration Bond ETF (the "Fund"). Following the
Reorganization, the Acquired Fund's performance and financial history were adopted by the Fund. The table includes transactions from the
Acquired Fund for the period March 1, 2023 through July 28, 2023. |
| J.P. Morgan Exchange-Traded Funds | |
NOTES TO FINANCIAL STATEMENTSAS OF February 29, 2024 (continued)
Sustainable Municipal Income ETF |
For the year ended February 29, 2024* |
| | | | | Change in
Unrealized
Appreciation/
(Depreciation) | | Shares at
February 29,
2024 | | Capital Gain
Distributions |
JPMorgan Institutional Tax Free Money Market Fund Class IM Shares, 3.37% (a) (b) | | | | | | | | | |
|
| Investment in an affiliated fund, which is registered under the Investment Company Act of 1940, as amended, and is advised by J.P. Morgan Investment Management Inc. |
| The rate shown is the current yield as of February 29, 2024. |
| As of the close of business on July 14, 2023, JPMorgan Sustainable Municipal Income Fund (the "Acquired Fund"), a series of JPMorgan Trust II, reorganized ("the Reorganization") into a newly created exchange-traded fund, JPMorgan Sustainable Municipal Income ETF (the "Fund"). Following the Reorganization, the Acquired Fund's performance and financial history were adopted by the Fund. The table includes transactions from the Acquired Fund for the period March 1, 2023 through July 14, 2023. |
F. Derivatives — High Yield Municipal ETF and Sustainable Municipal Income ETF used derivative instruments including futures contracts and swaps, in connection with their respective investment strategy. Derivative instruments may be used as substitutes for securities in which the Funds can invest, to hedge portfolio investments or to generate income or gain to the Funds. Derivatives may also be used to manage duration, sector and yield curve exposures and credit and spread volatility.
The Funds may be subject to various risks from the use of derivatives, including the risk that changes in the value of a derivative may not correlate perfectly with the underlying asset, rate or index; counterparty credit risk related to derivatives counterparties’ failure to perform under contract terms; liquidity risk related to the potential lack of a liquid market for these contracts allowing the Funds to close out its position(s); and documentation risk relating to disagreement over contract terms. Investing in certain derivatives also results in a form of leverage and as such, the Funds' risk of loss associated with these instruments may exceed their value, as recorded on the Statements of Assets and Liabilities.
The Funds are party to various derivative contracts governed by International Swaps and Derivatives Association master agreements (“ISDA agreements”). The Funds' ISDA agreements, which are separately negotiated with each dealer counterparty, may contain provisions allowing, absent other considerations, a counterparty to exercise rights, to the extent not otherwise waived, against the Funds in the event the Funds' net assets decline over time by a pre-determined percentage or fall below a pre-determined floor. The ISDA agreements may also contain provisions allowing, absent other conditions, the Funds to exercise rights, to the extent not otherwise waived, against a counterparty (e.g., decline in a counterparty’s credit rating below a specified level). Such rights for both a counterparty and the Funds often include the ability to terminate (i.e., close out) open contracts at prices which may favor a counterparty, which could have an adverse effect on the Funds. The ISDA agreements give the Fund and a counterparty the right, upon an event of default, to close out all transactions traded under such agreements and to net amounts owed or due across all transactions and offset such net payable or receivable against collateral posted to a segregated account by one party for the benefit of the other.
Counterparty credit risk may be mitigated to the extent a counterparty posts additional collateral for mark to market gains to the Funds.
Notes F(1) - F(2) below describe the various derivatives used by the Funds.
(1) Futures Contracts— Sustainable Municipal Income ETF used treasury futures contracts to manage and hedge interest rate risk associated with portfolio investments. The Fund also purchased futures contracts to invest incoming cash in the market or sold futures in response to cash outflows, thereby simulating an invested position in the underlying index while maintaining a cash balance for liquidity.
Futures contracts provide for the delayed delivery of the underlying instrument at a fixed price or are settled for a cash amount based on the change in the value of the underlying instrument at a specific date in the future. Upon entering into a futures contract, the Fund is required to deposit with the broker, cash or securities in an amount equal to a certain percentage of the contract amount, which is referred to as the initial margin deposit. Subsequent payments, referred to as variation margin, are made or received by the Fund periodically and are based on changes in the market value of open futures contracts. Changes in the market value of open futures contracts are recorded as Change in net unrealized appreciation/depreciation on futures contracts on the Statements of Operations. Realized gains or losses, representing the difference between the value of the contract at the time it was opened and the value at the time it was closed, are reported on the Statements of Operations at the closing or expiration of the futures contract. Securities deposited as initial margin are designated on the SOI, while cash deposited, which is considered restricted, is recorded on the Statements of Assets and Liabilities. A receivable from and/or a payable to brokers for the daily variation margin is also recorded on the Statements of Assets and Liabilities.
The use of futures contracts exposes the Fund to interest rate risk. The Fund may be subject to the risk that the change in the value of the futures contract may not correlate perfectly with the underlying instrument. Use of long futures contracts subjects the Fund to risk of loss in excess of the
| J.P. Morgan Exchange-Traded Funds | |
amounts shown on the Statements of Assets and Liabilities, up to the notional amount of the futures contracts. Use of short futures contracts subjects the Fund to unlimited risk of loss. The Fund may enter into futures contracts only on exchanges or boards of trade. The exchange or board of trade acts as the counterparty to each futures transaction; therefore, the Fund's credit risk is limited to failure of the exchange or board of trade. Under some circumstances, futures exchanges may establish daily limits on the amount that the price of a futures contract can vary from the previous day’s settlement price, which could effectively prevent liquidation of positions.
The Fund's futures contracts are not subject to master netting arrangements (the right to close out all transactions traded with a counterparty and net amounts owed or due across transactions).
(2) Swaps— High Yield Municipal ETF and Sustainable Municipal Income ETF engaged in various swap transactions, to manage credit and interest rate (e.g., duration, yield curve) risks within their respective portfolios. The Funds also used swaps as alternatives to direct investments. Swap transactions are contracts negotiated over-the-counter (“OTC swaps”) between a fund and a counterparty or are centrally cleared (“centrally cleared swaps”) through a central clearinghouse managed by a Futures Commission Merchant (“FCM”) that exchange investment cash flows, assets, foreign currencies or market-linked returns at specified, future intervals.
Upfront payments made and/or received by the Fund are recorded as assets or liabilities, respectively, on the Statements of Assets and Liabilities and amortized over the term of the swap. The value of an OTC swap agreement is recorded as either an asset or a liability on the Statements of Assets and Liabilities at the beginning of the measurement period. Upon entering into a centrally cleared swap, the Fund is required to deposit with the FCM cash or securities, which is referred to as initial margin deposit. Securities deposited as initial margin are designated on the Schedule of Portfolio Investments, while cash deposited, which is considered restricted, is reported as Deposits at broker for centrally cleared swaps on the Statements of Assets and Liabilities. Daily changes in valuation of centrally cleared swaps, if any, are recorded as a variation margin receivable or payable on the Statements of Assets and Liabilities. The change in the value of swaps, including accruals of periodic amounts of interest to be paid or received on swaps, is reported as Change in net unrealized appreciation/depreciation on swaps on the Statements of Operations. A realized gain or loss is recorded upon payment or receipt of a periodic payment or payment made upon termination of a swap agreement.
The central clearinghouse acts as the counterparty to each centrally cleared swap transaction; therefore credit risk is limited to the failure of the clearinghouse.
The Funds’ OTC swap contracts are subject to master netting arrangements.
Credit Default Swaps
High Yield Municipal ETF and Sustainable Municipal Income ETF entered into credit default swaps to simulate long and/or short bond positions or to take an active long and/or short position with respect to the likelihood of a default or credit event by the issuer of the underlying reference obligation.
The underlying reference obligation may be a single issuer of corporate or sovereign debt, a basket of issuers or a credit index. A credit index is a list of credit instruments or exposures that reference a fixed number of obligors with shared characteristics that represents some part of the credit market as a whole. Index credit default swaps have standardized terms including a fixed spread and standard maturity dates. The composition of the obligations within a particular index changes periodically.
Credit default swaps involve one party, the protection buyer, making a stream of payments to another party, the protection seller, in exchange for the right to receive a contingent payment if there is a credit event related to the underlying reference obligation. In the event that the reference obligation matures prior to the termination date of the contract, a similar security will be substituted for the duration of the contract term. Credit events are defined under individual swap agreements and generally include bankruptcy, failure to pay, restructuring, repudiation/moratorium, obligation acceleration and obligation default.
If a credit event occurs, the Funds, as protection sellers, would be obligated to make a payment, which may be either: (i) a net cash settlement equal to the notional amount of the swap less the auction value of the reference obligation or (ii) the notional amount of the swap in exchange for the delivery of the reference obligation. Selling protection effectively adds leverage to a Fund’s portfolio up to the notional amount of swap agreements. The notional amount represents the maximum potential liability under a contract and is not reflected on the Statements of Assets and Liabilities. Potential liabilities under these contracts may be reduced by: the auction rates of the underlying reference obligations; upfront payments received at the inception of a swap; and net amounts received from credit default swaps purchased with the identical reference obligation.
(3) Summary of Derivatives Information—The following table presents the effect of derivatives on the Statements of Operations for the year ended February 29, 2024, by primary underlying risk exposure:
| | Sustainable Municipal
Income ETF |
Realized Gain (Loss) on Derivatives Recognized as a Result From Operations: |
Interest Rate Risk Exposure: |
| | |
| J.P. Morgan Exchange-Traded Funds | |
NOTES TO FINANCIAL STATEMENTSAS OF February 29, 2024 (continued)
| | Sustainable Municipal Income ETF |
|
| | |
Net Change in Unrealized Appreciation (Depreciation) on Derivatives Recognized as a Result of Operations: |
Interest Rate Risk Exposure: |
| | |
|
| | |
Derivatives Volume
The table below discloses the volume of the Funds' futures contracts and swaps activity during the year ended February 29, 2024. Please refer to the tables in the Summary of Derivatives Information for derivative-related gains and losses associated with volume activity:
| | Sustainable Municipal
Income ETF |
| | |
Average Notional Balance Short | | |
| | |
Average Notional Balance - Buy Protection | | |
G. Security Transactions and Investment Income — Investment transactions are accounted for on the trade date (the date the order to buy or sell is executed). Securities gains and losses are calculated on a specifically identified cost basis. Interest income is determined on the basis of coupon interest accrued using the effective interest method, which adjusts for amortization of premiums and accretion of discounts. Dividend income and distributions of net investment income and realized capital gains from the Underlying Funds, if any, are recorded on the ex-dividend date or when a Fund first learns of the dividend.
To the extent such information is publicly available, the Funds record distributions received in excess of income earned from underlying investments as a reduction of cost of investments and/or realized gain. Such amounts are based on estimates if actual amounts are not available and actual amounts of income, realized gain and return of capital may differ from the estimated amounts. The Funds adjust the estimated amounts of the components of distributions (and consequently their net investment income) as necessary, once the issuers provide information about the actual composition of the distributions.
H. Allocation of Income and Expenses— Expenses directly attributable to the Funds are charged directly to the Funds, while the expenses attributable to more than one fund of the Trust are allocated among the applicable funds.
Transfer agency fees charged to the Acquired Funds were class-specific expenses. The amount of the transfer agency fees charged to each share class of the Acquired Funds for the period March 1, 2023 through Closing Date were as follows:
| | | | | |
| | | | | |
| | | | | |
Limited Duration Bond ETF | | | | | |
| | | | | |
Sustainable Municipal Income ETF | | | | | |
| | | | | |
| J.P. Morgan Exchange-Traded Funds | |
I. Federal Income Taxes— Each Fund is treated as a separate taxable entity for Federal income tax purposes. Each Fund's policy is to comply with the provisions of the Internal Revenue Code (the “Code”) applicable to regulated investment companies and to distribute to shareholders all of its distributable net investment income and net realized capital gains on investments. Accordingly, no provision for Federal income tax is necessary. Management has reviewed the Funds' tax positions for all open tax years and has determined that as of February 29, 2024, no liability for Federal income tax is required in the Funds' financial statements for net unrecognized tax benefits. However, management’s conclusions may be subject to future review based on changes in, or the interpretation of, the accounting standards or tax laws and regulations. Each Fund's Federal tax returns for the prior three fiscal years remain subject to examination by the Internal Revenue Service.
J. Distributions to Shareholders— Distributions from net investment income, if any, are generally declared and paid at least monthly. Net realized capital gains, if any, are distributed by each Fund at least annually. The amount of distributions from net investment income and net realized capital gains is determined in accordance with Federal income tax regulations, which may differ from GAAP. To the extent these “book/tax” differences are permanent in nature (i.e., that they result from other than timing of recognition — “temporary differences”), such amounts are reclassified within the capital accounts based on their Federal tax basis treatment.
The following amounts were reclassified within the capital accounts:
| | Accumulated
undistributed
(distributions in
excess of)
net investment
income | Accumulated
net realized
gains (losses) |
| | | |
Limited Duration Bond ETF | | | |
Sustainable Municipal Income ETF | | | |
The reclassifications for the Fund relate primarily to tax adjustments on certain investments.
3. Fees and Other Transactions with Affiliates
A. Investment Advisory Fee— Pursuant to an Investment Advisory Agreement, the Adviser manages the investments of each Fund and for such services is paid a fee. The investment advisory fee is accrued daily and paid monthly at an annual rate based on each Fund’s respective average daily net assets. The annual rate for each Fund is as follows:
| |
| |
Limited Duration Bond ETF | |
Sustainable Municipal Income ETF | |
The Adviser waived investment advisory fees and/or reimbursed expenses as outlined in Note 3.G.
B. Administration Fee— Pursuant to an Administration Agreement, the Administrator provides certain administration services to each Fund. In consideration of these services, the Administrator receives a fee accrued daily and paid monthly at an annual rate of 0.075% of the first $10 billion of each Fund's respective average daily net assets, plus 0.050% of each Fund's respective average daily net assets between $10 billion and $20 billion, plus 0.025% of each Fund's respective average daily net assets between $20 billion and $25 billion, plus 0.010% of each Fund's respective average daily net assets in excess of $25 billion. For the year ended February 29, 2024, the effective rate was 0.075% of each Fund's average daily net assets, notwithstanding any fee waivers and/or expense reimbursements.
The Administrator waived administration fees as outlined in Note 3.G.
JPMorgan Chase Bank, N.A. (“JPMCB”), a wholly-owned subsidiary of JPMorgan, serves as the Funds' sub-administrator (the “Sub-administrator”). For its services as Sub-administrator, JPMCB receives a portion of the management fees payable to JPMIM.
C. Distribution Fees— Up through the Closing Date, pursuant to a distribution agreement with the Trust (the "Distribution Agreement"), JPMDS served as each Acquired Fund's principal underwriter and promoted and arranged for the sale of each Acquired Fund's shares.
Up through the Closing Date, each Acquired Fund's Board had adopted a Distribution Plan (the “Distribution Plan”) for Class A and Class C Shares of the Acquired Funds, as applicable, pursuant to Rule 12b-1 under the 1940 Act. Class I and Class R6 Shares of the Acquired Funds did not charge a
| J.P. Morgan Exchange-Traded Funds | |
NOTES TO FINANCIAL STATEMENTSAS OF February 29, 2024 (continued)
distribution fee. The Distribution Plan provided that the Acquired Funds shall pay, with respect to the applicable share classes, distribution fees, including payments to JPMDS, at annual rates of the average daily net assets as shown in the table below:
| | |
| | |
Limited Duration Bond ETF | | |
Sustainable Municipal Income ETF | | |
For the period March 1, 2023 through the Closing Date, JPMDS waived its distribution fee.
In addition, up through the Closing Date, JPMDS was entitled to receive the front-end sales charges from purchases of Class A Shares and the contingent deferred sales charge ("CDSC") from redemptions of Class C Shares (except for Class C Shares of JPMorgan Limited Duration Fund purchased prior to September 3, 2013) and certain Class A Shares of the Acquired Funds for which front-end sales charges have been waived. For the period March 1, 2023 through the Closing Date, JPMDS did not retain any front-end sales charges or CDSCs.
D. Service Fees—Up through the Closing Date, JPMorgan Trust I and JPMorgan Trust II, on behalf of JPMorgan High Yield Municipal Fund, JPMorgan Limited Duration Bond ETF and JPMorgan Sustainable Municipal Income ETF, respectively, had entered into a Shareholder Servicing Agreement with JPMDS under which JPMDS provided certain support services to fund shareholders. For performing these services, JPMDS received a fee with respect to all share classes of the Acquired Funds, except Class R6 Shares which did not charge a service fee, that was accrued daily and paid monthly equal to a percentage of the average daily net assets as shown in the table below:
| | | |
| | | |
Limited Duration Bond ETF | | | |
Sustainable Municipal Income ETF | | | |
Prior to the Closing Date, JPMDS had entered into shareholder services contracts with affiliated and unaffiliated financial intermediaries who provide shareholder services and other related services to their clients or customers who invested in the Acquired Funds. Pursuant to such contracts, JPMDS paid all or a portion of such fees earned to financial intermediaries for performing such services.
JPMDS waived service fees as outlined in Note 3.G.
E. Custodian, Accounting and Transfer Agent Fees— JPMCB provides portfolio custody, accounting and transfer agency services (effective as of the Closing Date) to the Funds. For performing these services, the Funds pay JPMCB transaction and asset-based fees that vary according to the number of transactions and positions, plus out-of-pocket expenses. The amounts paid directly to JPMCB by the Funds for custody and accounting services are included in Custodian and accounting fees on the Statements of Operations. The amounts paid directly to JPMCB by the Funds for transfer agency services are included in Transfer agency fees on the Statements of Operations.
Additionally, Authorized Participants generally pay transaction fees associated with the creation and redemption of Fund shares. These fees are used to offset certain custodian charges incurred by the Funds for these transactions.
Interest income earned on cash balances at the custodian, if any, is included in Interest income from affiliates on the Statements of Operations.
Interest expense paid to the custodian related to cash overdrafts, if any, is included in Interest expense to affiliates on the Statements of Operations.
F. Distribution Services— The Distributor or its agent distributes Creation Units for each Fund on an agency basis. The Distributor does not maintain a secondary market in shares of each Fund. JPMDS receives no fees for their distribution services under the distribution agreement with the Trust (the “Distribution Agreement”). Although the Trust does not pay any fees under the Distribution Agreement, JPMIM pays JPMDS for certain distribution related services.
G. Waivers and Reimbursements—The Adviser, Administrator and/or JPMDS had contractually agreed to waive fees and/or reimburse the Funds to the extent that total annual operating expenses (excluding acquired fund fees and expenses other than certain money market fund fees as described below, dividend and interest expenses related to short sales, interest, taxes, expenses related to litigation and potential litigation, expenses related to trustee elections and extraordinary expenses) exceed 0.35% of High Yield Municipal ETF's average net assets, 0.24% of Limited Duration ETF's average net assets and 0.18% of Sustainable Municipal Income ETF's average net assets.
Prior to the Closing Date, the Adviser, Administrator and/or JPMDS had contractually agreed to waive fees and/or reimburse the Funds to the extent that total annual operating expenses (excluding acquired fund fees and expenses other than certain money market fund fees as described below,
| J.P. Morgan Exchange-Traded Funds | |
dividend and interest expenses related to short sales, interest, taxes, expenses related to litigation and potential litigation, expenses related to trustee elections and extraordinary expenses) exceed the percentages of the Funds’ respective average daily net assets as shown in the table below:
| | | | |
| | | | |
Limited Duration Bond ETF | | | | |
Sustainable Municipal Income ETF | | | | |
For the year ended February 29, 2024, the Funds' service providers waived fees and/or reimbursed expenses for the Funds as follows. None of these parties expect the Funds to repay any such waived fees and/or reimbursed expenses in future years.
| | | |
| | | | | Contractual
Reimbursements | |
| | | | | | |
Limited Duration Bond ETF | | | | | | |
Sustainable Municipal Income ETF | | | | | | |
Additionally, the Funds may invest in one or more money market funds advised by the Adviser (affiliated money market funds). The Adviser, Administrator and/or JPMDS, as shareholder servicing agent, have contractually agreed to waive fees and/or reimburse expenses in an amount sufficient to offset the respective net fees each collects from the affiliated money market fund on the applicable Fund’s investment in such affiliated money market fund, except for investments of securities lending cash collateral. None of these parties expect the Funds to repay any such waived fees and/ or reimbursed expenses in future years.
The amounts of these waivers resulting from investments in these money market funds for the year ended February 29, 2024 were as follows:
| |
| |
Limited Duration Bond ETF | |
Sustainable Municipal Income ETF | |
JPMIM voluntarily agreed to reimburse the Funds for the Trustee Fees paid to one of the interested Trustees. For the year ended February 29, 2024, the amount of these reimbursements were as follows:
| |
| |
Limited Duration Bond ETF | |
Sustainable Municipal Income ETF | |
H. Other— Certain officers of the Trust are affiliated with the Adviser, the Administrator and JPMDS. Such officers, with the exception of the Chief Compliance Officer, receive no compensation from the Funds for serving in their respective roles.
The Board designated and appointed a Chief Compliance Officer to the Funds pursuant to Rule 38a-1 under the 1940 Act. The Funds, along with certain other affiliated funds, make reimbursement payments, on a pro-rata basis, to the Administrator for a portion of the fees associated with the office of the Chief Compliance Officer. Such fees are included in Trustees’ and Chief Compliance Officer’s fees on the Statements of Operations.
The Trust adopted a Trustee Deferred Compensation Plan (the “Plan”) which allows the independent Trustees to defer the receipt of all or a portion of compensation related to performance of their duties as Trustees. The deferred fees are invested in various J.P. Morgan Funds until distribution in accordance with the Plan.
During the year ended February 29, 2024, the Funds purchased securities from an underwriting syndicate in which the principal underwriter or members of the syndicate were affiliated with the Adviser.
The Securities and Exchange Commission ("SEC") has granted an exemptive order permitting the Funds to engage in principal transactions with J.P. Morgan Securities LLC, an affiliated broker, involving taxable money market instruments, subject to certain conditions.
| J.P. Morgan Exchange-Traded Funds | |
NOTES TO FINANCIAL STATEMENTSAS OF February 29, 2024 (continued)
4. Investment Transactions
During the year ended February 29, 2024, purchases and sales of investments (excluding short-term investments) were as follows:
| Purchases
(excluding
U.S. Government) | Sales
(excluding
U.S. Government) |
| | |
Limited Duration Bond ETF | | |
Sustainable Municipal Income ETF | | |
During the year ended February 29, 2024, the Funds delivered portfolio securities for the redemption of Fund shares (in-kind redemptions). Cash and portfolio securities were transferred for redemptions at fair value. For financial reporting purposes, the Funds recorded net realized gains and losses in connection with each in-kind redemption transaction.
5. Federal Income Tax Matters
For Federal income tax purposes, the estimated cost and unrealized appreciation (depreciation) in value of investments held at February 29, 2024 were as follows:
| | Gross
Unrealized
Appreciation | Gross
Unrealized
Depreciation | Net Unrealized
Appreciation
(Depreciation) |
| | | | |
Limited Duration Bond ETF | | | | |
Sustainable Municipal Income ETF | | | | |
The difference between book and tax basis appreciation (depreciation) on investments is primarily attributed to tax adjustments on certain investments.
The tax character of distributions paid during the year ended February 29, 2024 was as follows:
| | | |
| | | |
Limited Duration Bond ETF | | | |
Sustainable Municipal Income ETF | | | |
|
| Short-term gain distributions are treated as ordinary income for income tax purposes. |
The tax character of distributions paid during the year ended February 28, 2023 was as follows:
| | | |
| | | |
Limited Duration Bond ETF | | | |
Sustainable Municipal Income ETF | | | |
|
| Short-term gain distributions are treated as ordinary income for income tax purposes. |
| J.P. Morgan Exchange-Traded Funds | |
As of February 29, 2024, the estimated components of net assets (excluding paid-in-capital) on a tax basis were as follows:
| Current
Distributable
Ordinary
Income | Current
Distributable
Long-Term
Capital Gain
(Tax Basis Capital
Loss Carryover) | | Unrealized
Appreciation
(Depreciation) |
| | | | |
Limited Duration Bond ETF | | | | |
Sustainable Municipal Income ETF | | | | |
The cumulative timing differences primarily consist of post-October capital loss deferrals.
At February 29, 2024, the following Funds had net capital loss carryforwards which are available to offset future realized gains:
| Capital Loss Carryforward Character |
| | |
| | |
Limited Duration Bond ETF | | |
Sustainable Municipal Income ETF | | |
Net capital losses (gains) incurred after October 31, and within the taxable year are deemed to arise on the first business day of the Funds' next taxable year. For the year ended February 29, 2024, the Funds deferred to March 1, 2024 the following net capital losses (gains) of:
| Net Capital Losses (Gains) |
| | |
| | |
Limited Duration Bond ETF | | |
Sustainable Municipal Income ETF | | |
6. Capital Share Transactions
The Trust issues and redeems shares of the Funds only in Creation Units through the Distributor at NAV. Capital shares transactions detail can be found in the Statements of Changes in Net Assets.
Shares of the Funds may only be purchased or redeemed by Authorized Participants. Such Authorized Participants may from time to time hold, of record or beneficially, a substantial percentage of the Funds' shares outstanding and act as executing or clearing broker for investment transactions on behalf of the Funds. An Authorized Participant is either (1) a “Participating Party” or other participant in the clearing process through the Continuous Net Settlement System of the National Securities Clearing Corporation (“NSCC”); or (2) a DTC Participant; which, in either case, must have executed an agreement with the Distributor.
Creation Units of a Fund may be created in advance of receipt by the Trust of all or a portion of the applicable basket of equity securities and other instruments (“Deposit Instruments”) and cash as described in the Funds’ registration statement. In these instances, the initial Deposit Instruments and cash must be deposited in an amount equal to the sum of the cash amount, plus at least 105% for the Funds, of the market value of undelivered Deposit Instruments. A transaction fee may be imposed to offset transfer and other transaction costs associated with the purchase or redemption of Creation Units.
Authorized Participants transacting in Creation Units for cash may also pay a variable fee to compensate the relevant fund for market impact expenses relating to investing in portfolio securities. Such variable fees, if any, are included in “Proceeds from shares issued” in the Statements of Changes in Net Assets.
7. Borrowings
Effective November 1, 2022, the Funds rely upon an exemptive order granted by the SEC (the “Order”) permitting the establishment and operation of an Interfund Lending Facility (the “Facility”). The Facility allows the Funds to directly lend and borrow money to or from any other fund relying upon the Order at rates beneficial to both the borrowing and lending funds. Advances under the Facility are taken primarily for temporary or emergency purposes, including the meeting of redemption requests that otherwise might require the untimely disposition of securities, and are subject to each Fund's borrowing restrictions. The interfund loan rate is determined, as specified in the Order, by averaging the current repurchase agreement rate
| J.P. Morgan Exchange-Traded Funds | |
NOTES TO FINANCIAL STATEMENTSAS OF February 29, 2024 (continued)
and the current bank loan rate. The Order was granted to JPMorgan Trust II and may be relied upon by the Funds because the Funds and the series of JPMorgan Trust II are all investment companies in the same “group of investment companies” (as defined in Section 12(d)(1)(G) of the 1940 Act).
The Funds had no borrowings outstanding from another fund, or loans outstanding to another fund, during the year ended February 29, 2024.
The Trust and JPMCB have entered into a financing arrangement. Under this arrangement, JPMCB provides an unsecured, uncommitted credit facility in the aggregate amount of $100 million to certain of the J.P. Morgan Funds, including the Funds. Advances under the arrangement are taken primarily for temporary or emergency purposes, including the meeting of redemption requests that otherwise might require the untimely disposition of securities, and are subject to each Fund's borrowing restrictions. Interest on borrowings is payable at a rate determined by JPMCB at the time of borrowing. This agreement has been extended until October 29, 2024.
The Funds had no borrowings outstanding from the unsecured, uncommitted credit facility during the year ended February 29, 2024.
Effective August 8, 2023, the Trust, along with certain other trusts for J.P. Morgan Funds (“Borrowers”), has entered into an existing joint syndicated senior unsecured revolving credit facility totaling $1.5 billion (“Credit Facility”) with various lenders and The Bank of New York Mellon, as administrative agent for the lenders. Although the Trust is effectively part of the Credit Facility as of August 8, 2023, it is not eligible to draw on the Credit Facility, and will not incur costs associated with being a part of the Credit Facility, until on or about May 28, 2024.
This Credit Facility provides a source of funds to the Borrowers for temporary and emergency purposes, including the meeting of redemption requests that otherwise might require the untimely disposition of securities. Under the terms of the Credit Facility, a borrowing fund must have a minimum of $25 million in adjusted net asset value and not exceed certain adjusted net asset coverage ratios prior to and during the time in which any borrowings are outstanding. If a fund does not comply with the aforementioned requirements, the fund must remediate within three business days with respect to the $25 million minimum adjusted net asset value or within one business day with respect to certain asset coverage ratios or the administrative agent at the request of, or with the consent of, the lenders may terminate the Credit Facility and declare any outstanding borrowings to be due and payable immediately.
Interest associated with any borrowing under the Credit Facility is charged to the borrowing fund at a rate of interest equal to 1.00% (the “Applicable Margin”), plus the greater of the federal funds effective rate or the one-month Adjusted Secured Overnight Financing Rate (“SOFR”). Effective August 8, 2023, the Credit Facility has been amended and restated for a term of 364 days, unless extended.
The Funds did not utilize the Credit Facility during the year ended February 29, 2024.
8. Risks, Concentrations and Indemnifications
In the normal course of business, the Funds enter into contracts that contain a variety of representations which provide general indemnifications. Each Fund's maximum exposure under these arrangements is unknown. The amount of exposure would depend on future claims that may be brought against each Fund. However, based on experience, the Funds expect the risk of loss to be remote.
As of February 29, 2024, J.P. Morgan Investor Funds, which are affiliated fund of funds, each owned in the aggregate, shares representing more than 10% of the net assets of the Funds as follows:
| |
Limited Duration Bond ETF | |
Significant shareholder transactions by these shareholders may impact the Funds' performance and liquidity.
Disruptions to creations and redemptions, the existence of significant market volatility or potential lack of an active trading market for the shares (including through a trading halt), as well as other factors, may result in shares trading significantly above (at a premium) or below (at a discount) to the NAV or to the intraday value of the Funds’ holdings. During such periods, investors may incur significant losses if shares are sold.
Derivatives may be riskier than other types of investments because they may be more sensitive to changes in economic and market conditions and could result in losses that significantly exceed the Funds’ original investment. Many derivatives create leverage thereby causing the Funds to be more volatile than they would have been if they had not used derivatives. Derivatives also expose the Funds to counterparty risk (the risk that the derivative counterparty will not fulfill its contractual obligations), including credit risk of the derivative counterparty. The possible lack of a liquid secondary market for derivatives and the resulting inability of the Funds to sell or otherwise close a derivatives position could expose the Funds to losses and could make derivatives more difficult for the Fund to value accurately.
The Funds are subject to interest rate risk. Investments in bonds and other debt securities will change in value based on changes in interest rates. If rates increase, the value of these investments generally declines. Securities with greater interest rate sensitivity and longer maturities generally are subject to greater fluctuations in value. The Funds invest in variable and floating rate loans and other variable and floating rate securities. Although these investments are generally less sensitive to interest rate changes than fixed rate instruments, the value of floating rate loans and other securities may decline if their interest rates do not rise as quickly, or as much, as general interest rates. The Funds may face a heightened level of
| J.P. Morgan Exchange-Traded Funds | |
interest rate risk due to certain changes in monetary policy. It is difficult to predict the pace at which central banks or monetary authorities may increase interest rates or the timing, frequency, or magnitude of such increases. Any such changes could be sudden and could expose debt markets to significant volatility and reduced liquidity for Fund investments.
The Funds are subject to credit risk. The Funds' investments are subject to the risk that an issuer and/or a counterparty will fail to make payments when due or default completely. Prices of the Funds' investments may be adversely affected if any of the issuers or counterparties it is invested in are subject to an actual or perceived deterioration in their credit quality. Credit spreads may increase, which may reduce the market values of the Funds' securities. Credit spread risk is the risk that economic and market conditions or any actual or perceived credit deterioration may lead to an increase in the credit spreads (i.e., the difference in yield between two securities of similar maturity but different credit quality) and a decline in price of the issuer’s securities.
The Funds are also subject to counterparty credit risk, which is the risk that a counterparty fails to perform on agreements with the Funds.
High Yield Municipal ETF invests in high yield securities that are not rated or rated below investment grade (commonly known as “junk bonds”). These securities are considered to be high risk investments. Investments in lower-rated securities or unrated securities of comparable quality tend to be more sensitive to economic conditions than higher rated securities. Junk bonds involve a greater risk of default by the issuer because such securities are generally unsecured and are often subordinated to other creditors’ claims. The market price of these securities can change suddenly and unexpectedly. As a result, the Funds are intended for investors who are able and willing to assume a high degree of risk.
Sustainable Municipal Income ETF’s investment in securities whose use of proceeds, in the Adviser’s opinion, provide positive social or environmental benefits could cause it to perform differently compared to funds that do not have such a policy. Investing in securities whose use of proceeds, in the Adviser’s opinion, provide positive social or environmental benefits may result in the Fund forgoing opportunities to buy certain securities when it might otherwise be advantageous to do so, or selling securities when it might be otherwise disadvantageous for it to do so. In addition, there is a risk that the municipal bonds identified by the Adviser’s use of proceeds determination do not operate as expected when addressing positive social or environmental benefits. The Adviser’s assessment of the positive social or environmental impact of a municipal bond’s proceeds is made at the time of purchase and the actual use of proceeds by the issuer could vary over time, which could cause the Fund to be invested in bonds that do not comply with the Fund’s approach towards considering social or environmental characteristics. The factors that the Adviser considers in evaluating whether a security has positive social or environmental benefits may change over time. There are significant differences in interpretations of what it means to promote positive social or environmental benefits. While the Adviser believes its definitions are reasonable, the portfolio decisions it makes may differ with other’s views.
London Interbank Offered Rate ("LIBOR") was a leading floating rate benchmark used in loans, notes, derivatives and other instruments or investments. As a result of benchmark reforms, publication of most LIBOR settings has ceased. Some LIBOR settings continue to be published but only on a temporary, synthetic and non-representative basis. Regulated entities have generally ceased entering into new LIBOR contracts in connection with regulatory guidance or prohibitions. Public and private sector actors have worked to establish alternative reference rates to be used in place of LIBOR. There is no assurance that any such alternative reference rate will be similar to or produce the same value or economic equivalence as LIBOR or that it will have the same volume or liquidity as did LIBOR which may affect the value, volatility, liquidity or return on certain of the Funds' loans, notes, derivatives and other instruments or investments comprising some or all of the Funds' investments and result in costs incurred in connection with changing reference rates used for positions, closing out positions and entering into new trades. Certain of the Funds' investments may have transitioned from LIBOR or will transition from LIBOR in the future. The transition from LIBOR to alternative reference rates may result in operational issues for the Funds or their investments. No assurances can be given as to the impact of the LIBOR transition (and the timing of any such impact) on the Funds and their investments.
The Funds are subject to infectious disease epidemics/pandemics risk. For example, the outbreak of COVID-19 negatively affected economies, markets and individual companies throughout the world, including those in which the Funds invest. The effects of any future pandemic or other global event to business and market conditions may have a significant negative impact on the performance of a Fund's investments, increase a Fund's volatility, exacerbate other pre-existing political, social and economic risks to the Funds and negatively impact broad segments of businesses and populations. In addition, governments, their regulatory agencies, or self-regulatory organizations have taken or may take actions in response to a pandemic or other global event that affect the instruments in which the Funds invest, or the issuers of such instruments, in ways that could have a significant negative impact on a Fund’s investment performance. The ultimate impact of any pandemic or other global event and the extent to which the associated conditions and governmental responses impact a Fund will also depend on future developments, which are highly uncertain, difficult to accurately predict and subject to frequent changes.
| J.P. Morgan Exchange-Traded Funds | |
REPORT OF INDEPENDENT REGISTERED PUBLIC ACCOUNTING FIRM
To the Board of Trustees of J.P. Morgan Exchange-Traded Fund Trust and Shareholders of JPMorgan High Yield Municipal ETF, JPMorgan Limited Duration Bond ETF and JPMorgan Sustainable Municipal Income ETF
Opinions on the Financial Statements
We have audited the accompanying statements of assets and liabilities, including the schedules of portfolio investments, of JPMorgan High Yield Municipal ETF, JPMorgan Limited Duration Bond ETF and JPMorgan Sustainable Municipal Income ETF (three of the funds constituting J.P. Morgan Exchange-Traded Fund Trust, hereafter collectively referred to as the "Funds") as of February 29, 2024, the related statements of operations for the year ended February 29, 2024, the statements of changes in net assets for each of the two years in the period ended February 29, 2024, including the related notes, and the financial highlights for each of the five years in the period ended February 29, 2024 (collectively referred to as the “financial statements”). In our opinion, the financial statements present fairly, in all material respects, the financial position of each of the Funds as of February 29, 2024, the results of each of their operations for the year then ended, the changes in each of their net assets for each of the two years in the period ended February 29, 2024 and each of the financial highlights for each of the five years in the period ended February 29, 2024 in conformity with accounting principles generally accepted in the United States of America.
Basis for Opinions
These financial statements are the responsibility of the Funds’ management. Our responsibility is to express an opinion on the Funds’ financial statements based on our audits. We are a public accounting firm registered with the Public Company Accounting Oversight Board (United States) (PCAOB) and are required to be independent with respect to the Funds in accordance with the U.S. federal securities laws and the applicable rules and regulations of the Securities and Exchange Commission and the PCAOB.
We conducted our audits of these financial statements in accordance with the standards of the PCAOB. Those standards require that we plan and perform the audit to obtain reasonable assurance about whether the financial statements are free of material misstatement, whether due to error or fraud.
Our audits included performing procedures to assess the risks of material misstatement of the financial statements, whether due to error or fraud, and performing procedures that respond to those risks. Such procedures included examining, on a test basis, evidence regarding the amounts and disclosures in the financial statements. Our audits also included evaluating the accounting principles used and significant estimates made by management, as well as evaluating the overall presentation of the financial statements. Our procedures included confirmation of securities owned as of February 29, 2024 by correspondence with the custodian, transfer agent and brokers; when replies were not received from brokers, we performed other auditing procedures. We believe that our audits provide a reasonable basis for our opinions.
/s/ PricewaterhouseCoopers LLP
New York, New York
April 24, 2024
We have served as the auditor of one or more investment companies in the JPMorgan Funds complex since 1993.
| J.P. Morgan Exchange-Traded Funds | |
The Funds' Statement of Additional Information includes additional information about the Funds' Trustees and is available, without charge, upon request by calling 1-844-457-6383 or on the J.P. Morgan Funds’ website at www.jpmorganfunds.com.
Name (Year of Birth);
Positions With
the Funds (1) | Principal Occupation
During Past 5 Years | Number of
Funds in Fund
Complex Overseen
by Trustee (2) | Other Directorships Held
During the Past 5 Years |
| |
John F. Finn (1947); Chair
since 2020; Trustee since 1998. | Chairman, Gardner, Inc. (supply chain management company serving industrial and consumer markets) (serving in various roles 1974-present). | | Director, Greif, Inc. (GEF) (industrial package products and services) (2007-2023); Trustee, Columbus Association for the Performing Arts (1988-present). |
Stephen P. Fisher (1959);
Trustee since 2018. | Retired; Chairman and Chief Executive Officer, NYLIFE Distributors LLC (registered broker-dealer) (serving in various roles 2008-2013); Chairman, NYLIM Service Company LLC (transfer agent) (2008-2017); New York Life Investment Management LLC (registered investment adviser) (serving in various roles 2005-2017); Chairman, IndexIQ Advisors LLC (registered investment adviser for ETFs) (2014-2017); President, MainStay VP Funds Trust (2007-2017), MainStay DefinedTerm Municipal Opportunities Fund (2011-2017) and MainStay Funds Trust (2007-2017) (registered investment companies). | | |
Gary L. French (1951);
Trustee since 2014. | Real Estate Investor (2011-2020); Investment management industry Consultant and Expert Witness (2011-present); Senior Consultant for The Regulatory Fundamentals Group LLC (2011-2017). | | Independent Trustee, The China Fund, Inc. (2013-2019); Exchange Traded Concepts Trust II (2012-2014); Exchange Traded Concepts Trust I (2011-2014). |
Kathleen M. Gallagher (1958);
Trustee since 2018. | Retired; Chief Investment Officer — Benefit Plans, Ford Motor Company (serving in various roles 1985-2016). | | Non- Executive Director, Legal & General Investment Management (Holdings) (2018-present); Non-Executive Director, Legal & General Investment Management America (U.S. Holdings) (financial services and insurance) (2017-present); Advisory Board Member, State Street Global Advisors Total Portfolio Solutions (2017-present); Member, Client Advisory Council, Financial Engines, LLC (registered investment adviser) (2011-2016); Director, Ford Pension Funds Investment Management Ltd. (2007-2016). |
Robert J. Grassi (1957);
Trustee since 2014. | Sole Proprietor, Academy Hills Advisors LLC (2012-present); Pension Director, Corning Incorporated (2002-2012). | | |
| J.P. Morgan Exchange-Traded Funds | |
TRUSTEES(Unaudited) (continued)
Name (Year of Birth); Positions With the Funds (1) | Principal Occupation During Past 5 Years | Number of Funds in Fund Complex Overseen by Trustee (2) | Other Directorships Held During the Past 5 Years |
Independent Trustees (continued) | |
Frankie D. Hughes (1952);
Trustee since 2008. | President, Ashland Hughes Properties (property management) (2014-present); President and Chief Investment Officer, Hughes Capital Management, Inc. (fixed income asset management) (1993-2014). | | |
Raymond Kanner (1953);
Trustee since 2017. | Retired; Managing Director and Chief Investment Officer, IBM Retirement Funds (2007-2016). | | Advisory Board Member, Penso Advisors, LLC (2020-present); Advisory Board Member, Los Angeles Capital (2018-present); Advisory Board Member, State Street Global Advisors Total Portfolio Solutions (2017- present); Acting Executive Director, Committee on Investment of Employee Benefit Assets (CIEBA) (2016-2017); Advisory Board Member, Betterment for Business (robo advisor) (2016- 2017); Advisory Board Member, BlueStar Indexes (index creator) (2013-2017); Director, Emerging Markets Growth Fund (registered investment company) (1997-2016); Member, Russell Index Client Advisory Board (2001-2015). |
Thomas P. Lemke (1954);
Trustee since 2014. | | | (1) Independent Trustee of Advisors’ Inner Circle III fund platform, consisting of the following: (i) the Advisors’ Inner Circle Fund III, (ii) the Gallery Trust, (iii) the Schroder Series Trust, (iv) the Delaware Wilshire Private Markets Fund (since 2020), (v) Chiron Capital Allocation Fund Ltd., and (vi) formerly the Winton Diversified Opportunities Fund (2014-2018); and (2) Independent Trustee of the Symmetry Panoramic Trust (since 2018). |
Lawrence R. Maffia (1950);
Trustee since 2014. | Retired; Director and President, ICI Mutual Insurance Company (2006-2013). | | Director, ICI Mutual Insurance Company (1999-2013). |
Mary E. Martinez (1960); Vice
Chair since 2021; Trustee since 2013. | Associate, Special Properties, a Christie’s International Real Estate Affiliate (2010-present); Managing Director, Bank of America (asset management) (2007-2008); Chief Operating Officer, U.S. Trust Asset Management, U.S. Trust Company (asset management) (2003-2007); President, Excelsior Funds (registered investment companies) (2004-2005). | | |
Marilyn McCoy (1948);
Trustee since 1999. | Retired; Vice President of Administration and Planning, Northwestern University (1985-2023). | | |
| J.P. Morgan Exchange-Traded Funds | |
Name (Year of Birth); Positions With the Funds (1) | Principal Occupation During Past 5 Years | Number of Funds in Fund Complex Overseen by Trustee (2) | Other Directorships Held During the Past 5 Years |
Independent Trustees (continued) | |
Dr. Robert A. Oden, Jr. (1946); Trustee
since 1997. | Retired; President, Carleton College (2002-2010); President, Kenyon College (1995-2002). | | Trustee, The Coldwater Conservation Fund (2017-present); Trustee, American Museum of Fly Fishing (2013-present); Trustee and Vice Chair, Trout Unlimited (2017-2021); Trustee, Dartmouth- Hitchcock Medical Center (2011-2020). |
Marian U. Pardo* (1946);
Trustee since 2013. | Managing Director and Founder, Virtual Capital Management LLC (investment consulting) (2007-present); Managing Director, Credit Suisse Asset Management (portfolio manager) (2003-2006). | | Board Chair and Member, Board of Governors, Columbus Citizens Foundation (not-for-profit supporting philanthropic and cultural programs) (2006-present). |
Emily A. Youssouf (1951);
Trustee since 2014. | Adjunct Professor (2011-present) and Clinical Professor (2009-2011), NYU Schack Institute of Real Estate; Board Member and Member of the Audit Committee (2013–present), Chair of Finance Committee (2019-present), Member of Related Parties Committee (2013-2018) and Member of the Enterprise Risk Committee (2015-2018), PennyMac Financial Services, Inc.; Board Member (2005-2018), Chair of Capital Committee (2006-2016), Chair of Audit Committee (2005-2018), Member of Finance Committee (2005-2018) and Chair of IT Committee (2016-2018), NYC Health and Hospitals Corporation. | | Trustee, NYC School Construction Authority (2009-present); Board Member, NYS Job Development Authority (2008-present); Trustee and Chair of the Audit Committee of the Transit Center Foundation (2015-2019). |
| |
Robert F. Deutsch** (1957);
Trustee since 2014. | Retired; Head of ETF Business for JPMorgan Asset Management (2013-2017); Head of Global Liquidity Business for JPMorgan Asset Management (2003-2013). | | Treasurer and Director of the JUST Capital Foundation (2017-present). |
Nina O. Shenker** (1957);
Trustee since 2022. | Vice Chair (2017-2021), General Counsel and Managing Director (2008-2016), Associate General Counsel and Managing Director (2004-2008), J.P. Morgan Asset & Wealth Management. | | Director and Member of Legal and Human Resources Subcommittees, American Jewish Joint Distribution Committee (2018-present). |
|
| The year shown is the first year in which a Trustee became a member of any of the following: the JPMorgan Mutual Fund Board, the JPMorgan ETF Board, the heritage J.P. Morgan Funds or the heritage One Group Mutual Funds. Trustees serve an indefinite term, until resignation, retirement, removal or death. The Board's current retirement policy sets retirement at the end of the calendar year in which the Trustee attains the age of 75, provided that any Board member who was a member of the JPMorgan Mutual Fund Board prior to January 1, 2022 and was born prior to January 1, 1950 shall retire from the Board at the end of the calendar year in which the Trustee attains the age of 78. |
| A Fund Complex means two or more registered investment companies that hold themselves out to investors as related companies for purposes of investment and investor services or have a common investment adviser or have an investment adviser that is an affiliated person of the investment adviser of any of the other registered investment companies. The J.P. Morgan Funds Complex for which the Board of Trustees serves currently includes eight registered investment companies (167 J.P. Morgan Funds). |
| In connection with prior employment with JPMorgan Chase, Ms. Pardo was the recipient of non-qualified pension plan payments from JPMorgan Chase in the amount of approximately $2,055 per month, which she irrevocably waived effective January 1, 2013, and deferred compensation payments from JPMorgan Chase in the amount of approximately $7,294 per year, which ended in January 2013. In addition, Ms. Pardo receives payments from a fully-funded qualified plan, which is not an obligation of JPMorgan Chase. |
| J.P. Morgan Exchange-Traded Funds | |
TRUSTEES(Unaudited) (continued)
| Designation as an “Interested Trustee” is based on prior employment by the Adviser or an affiliate of the Adviser or interests in a control person of the Adviser. |
| The contact address for each of the Trustees is 277 Park Avenue, New York, NY 10172. |
| J.P. Morgan Exchange-Traded Funds | |
Name (Year of Birth),
Positions Held with
the Trust (Since) | Principal Occupations During Past 5 Years |
Brian S. Shlissel (1964),
President and Principal Executive
Officer (2021) | Managing Director and Chief Administrative Officer for J.P. Morgan pooled vehicles, J.P. Morgan Investment Management Inc. since 2014. |
Timothy J. Clemens (1975),
Treasurer and Principal Financial
Officer (2020) | Managing Director, J.P. Morgan Investment Management Inc. Mr. Clemens has been with J.P. Morgan Investment Management Inc. since 2013. |
Gregory S. Samuels (1980),
Secretary (2022) (formerly Assistant
Secretary 2014-2022) | Managing Director and Assistant General Counsel, JPMorgan Chase & Co. Mr. Samuels has been with JPMorgan Chase & Co. since 2010. |
Stephen M. Ungerman (1953),
Chief Compliance Officer (2014) | Managing Director, JPMorgan Chase & Co. Mr. Ungerman has been with JPMorgan Chase & Co. since 2000. |
Kiesha Astwood-Smith (1973),
Assistant Secretary (2021) | Vice President and Assistant General Counsel, JPMorgan Chase & Co. since June 2021; Senior Director and Counsel, Equitable Financial Life Insurance Company (formerly, AXA Equitable Life Insurance Company) from September 2015 through June 2021. |
Matthew Beck (1988),
Assistant Secretary (2021)* | Vice President and Assistant General Counsel, JPMorgan Chase & Co. since May 2021; Senior Legal Counsel, Ultimus Fund Solutions from May 2018 through May 2021; General Counsel, The Nottingham Company from April 2014 through May 2018. |
Elizabeth A. Davin (1964),
Assistant Secretary (2022)
(formerly Secretary 2018-2022)* | Executive Director and Assistant General Counsel, JPMorgan Chase & Co. Ms. Davin has been with JPMorgan Chase & Co. (formerly Bank One Corporation) since 2004. |
Jessica K. Ditullio (1962),
Assistant Secretary (2014)* | Executive Director and Assistant General Counsel, JPMorgan Chase & Co. Ms. Ditullio has been with JPMorgan Chase & Co. (formerly Bank One Corporation) since 1990. |
Anthony Geron (1971),
Assistant Secretary (2019) | Vice President and Assistant General Counsel, JPMorgan Chase & Co. since September 2018; Lead Director and Counsel, AXA Equitable Life Insurance Company from 2015 to 2018 and Senior Director and Counsel, AXA Equitable Life Insurance Company from 2014 to 2015. |
Carmine Lekstutis (1980),
Assistant Secretary (2014) | Executive Director and Assistant General Counsel, JPMorgan Chase & Co. Mr. Lekstutis has been with JPMorgan Chase & Co. since 2011. |
Max Vogel (1990),
Assistant Secretary (2021) | Vice President and Assistant General Counsel, JPMorgan Chase & Co. since June 2021; Associate, Proskauer Rose LLP (law firm) from March 2017 to June 2021. |
Zachary E. Vonnegut-Gabovitch
(1986),
Assistant Secretary (2017) | Executive Director and Assistant General Counsel, JPMorgan Chase & Co. Mr. Vonnegut-Gabovitch has been with JPMorgan Chase & Co. since September 2016. |
Frederick J. Cavaliere (1978),
Assistant Treasurer (2015)** | Executive Director, J.P. Morgan Investment Management Inc. Mr. Cavaliere has been with JPMorgan Chase & Co. since May 2006. |
Michael M. D’Ambrosio (1969),
Assistant Treasurer (2014) | Managing Director, J.P. Morgan Investment Management Inc. Mr. D’Ambrosio has been with J.P. Morgan Investment Management Inc. since 2012. |
Aleksandr Fleytekh (1972),
Assistant Treasurer (2023) | Executive Director, J.P. Morgan Investment Management Inc. Mr. Fleytekh has been with J.P. Morgan Investment Management Inc. since February 2012. |
Shannon Gaines (1977),
Assistant Treasurer (2019)* | Executive Director, J.P. Morgan Investment Management Inc. Mr. Gaines has been with J.P. Morgan Investment Management Inc. since January 2014. |
Jeffrey D. House (1972),
Assistant Treasurer (2023)* | Vice President, J.P. Morgan Investment Management Inc. Mr. House has been with J.P. Morgan Investment Management Inc. since July 2006. |
Michael Mannarino (1985),
Assistant Treasurer (2023) | Vice President, J.P. Morgan Investment Management Inc. Mr. Mannarino has been with J.P. Morgan Investment Management Inc. since 2014. |
| J.P. Morgan Exchange-Traded Funds | |
OFFICERS(Unaudited) (continued)
Nektarios E. Manolakakis (1972),
Assistant Treasurer (2020) | Executive Director, J.P. Morgan Investment Management Inc. since February 2021, formerly Vice President, J.P. Morgan Investment Management Inc. since 2014; Vice President, J.P. Morgan Corporate & Investment Bank 2010-2014. |
Todd McEwen (1981),
Assistant Treasurer (2020)* | Executive Director, J.P. Morgan Investment Management Inc. Mr. McEwen has been with J.P. Morgan Investment Management Inc. since 2010. |
Joseph Parascondola (1963),
Assistant Treasurer (2023)** | Executive Director, J.P. Morgan Investment Management Inc. Mr. Parascondola has been with J.P. Morgan Investment Management Inc. since 2006. |
Gillian I. Sands (1969),
Assistant Treasurer (2023) | Executive Director, J.P. Morgan Investment Management Inc. Ms. Sands has been with J.P. Morgan Investment Management Inc. since September 2012. |
|
The contact address for each of the officers, unless otherwise noted, is 277 Park Avenue, New York, NY 10172. |
| The contact address for the officer is 1111 Polaris Parkway, Columbus, OH 43240. |
| The contact address for the officer is 575 Washington Boulevard, Jersey City, NJ 07310. |
| J.P. Morgan Exchange-Traded Funds | |
SCHEDULE OF SHAREHOLDER EXPENSES(Unaudited)
Hypothetical $1,000 Investment
As a shareholder of the Funds, you incur two types of costs: (1) transaction costs, including brokerage commissions on your purchase and sales of Fund shares and (2) ongoing costs, including investment advisory fees, administration fees, and other fund expenses. The examples below are intended to help you understand your ongoing costs (in dollars) of investing in the Funds and to compare these ongoing costs with the ongoing costs of investing in other funds. The examples assume that you had a $1,000 investment at the beginning of the reporting period, September 1, 2023, and continued to hold your shares at the end of the reporting period, February 29, 2024.
Actual Expenses
For each Fund in the table below, the first line provides information about actual account values and actual expenses. You may use the information in this line, together with the amount you invested, to estimate the expenses that you paid over the period. Simply divide your account value by $1,000 (for example, an $8,600 account value divided by $1,000 = 8.6), then multiply the result by the number in the first line of each
Fund under the heading titled “Expenses Paid During the Period” to estimate the expenses you paid on your account during this period.
Hypothetical Example for Comparison Purposes
The second line of each Fund in the table below provides information about hypothetical account values and hypothetical expenses based on the actual expense ratio and an assumed rate of return of 5% per year before expenses, which is not the Fund's actual return. The hypothetical account values and expenses may not be used to estimate the actual ending account balance or expenses you paid for the period. You may use this information to compare the ongoing costs of investing in the Funds and other funds. To do so, compare this 5% hypothetical example with the 5% hypothetical examples that appear in the shareholder reports of the other funds. The examples also assume all dividends and distributions have been reinvested. The examples do not take into account brokerage commissions that you pay when purchasing or selling shares of a Fund.
| Beginning Account Value September 1, 2023 | Ending Account Value February 29, 2024 | | |
JPMorgan High Yield Municipal ETF | | | | |
| | | | |
| | | | |
JPMorgan Limited Duration Bond ETF | | | | |
| | | | |
| | | | |
JPMorgan Sustainable Municipal Income ETF | | | | |
| | | | |
| | | | |
|
| Expenses are equal to each Fund's annualized net expense ratio, multiplied by the average account value over the period, multiplied by 182/366 (to reflect the one-half year period). |
| J.P. Morgan Exchange-Traded Funds | |
LIQUIDITY RISK MANAGEMENT PROGRAM(Unaudited)
Each of the Funds covered in this report has adopted the J.P. Morgan Funds and J.P. Morgan Exchange-Traded Funds Amended and Restated Liquidity Risk Management Program (the “Program”) under Rule 22e-4 under the Investment Company Act of 1940, as amended (the “Liquidity Rule”). The Program seeks to assess, manage and review each Fund’s Liquidity Risk. “Liquidity Risk” is defined as the risk that a fund could not meet requests to redeem shares issued by the fund without significant dilution of remaining investors’ interests in the fund. Pursuant to an exemptive order (the “Exemptive Order”) from the Securities and Exchange Commission, the Program permits the Funds to use liquidity definitions and classification methodologies that differ from the requirements under the Liquidity Rule in some respects. Among other things, the Liquidity Rule requires that a written report be provided to the Board of Trustees (the “Board”) on an annual basis that addresses the operation of the Program and assesses the adequacy and effectiveness of its implementation, including the operation of any Highly Liquid Investment Minimum (“HLIM”), where applicable, and any material changes to the Program.1
The Board has appointed J.P. Morgan Asset Management’s Liquidity Risk Forum to be the program administrator for the Program (the “Program Administrator”). In addition to regular reporting at each of its quarterly meetings, on February 7, 2024, the Board reviewed the Program Administrator’s annual written report (the “Report”) concerning the operation of the Program for the period from January 1, 2023 through December 31, 2023 (the “Program Reporting Period”). The Report addressed the operation of the Program and assessed its adequacy and effectiveness of implementation, including, where applicable, the operation of a Fund’s HLIM. There were no material changes to the Program during the Program Reporting Period.
The Report summarized the operation of the Program and the information and factors considered by the Program Administrator in assessing whether the Program has been adequately
and effectively implemented with respect to each Fund. Such information and factors included, among other things: (1) the effectiveness of the Program with respect to the identification of each Fund that qualifies as an “In-Kind ETF” (as defined in the Liquidity Rule); (2) the liquidity risk framework used to assess, manage, and periodically review each Fund’s Liquidity Risk and the results of this assessment; (3) the methodology and inputs for classifying the investments of a Fund (other than an In-Kind ETF) into one of the required liquidity categories that reflect an estimate of the liquidity of those investments under current market conditions (and, for In-Kind ETFs, the methodology and inputs for determining whether any investments should be classified as “Illiquid Investments” (as defined or modified under the Program)); (4) whether a Fund (other than an In-Kind ETF) invested primarily in “Highly Liquid Investments” (as defined or modified under the Program), as well as whether an HLIM should be established for a Fund (other than an In-Kind ETF) and the procedures for monitoring any HLIM; (5) whether a Fund invested more than 15% of its assets in “Illiquid Investments” and the procedures for monitoring for this limit; and (6) specific liquidity events arising during the Program Reporting Period. The Report further summarized the conditions of the Exemptive Order and whether all applicable Funds were in compliance with the terms of the Exemptive Order.
Based on this review, the Report concluded that: (1) the Program continues to be reasonably designed to effectively assess and manage each Fund’s Liquidity Risk; and (2) the Program has been adequately and effectively implemented with respect to each Fund during the Program Reporting Period.
1 Effective July 24, 2024, the J.P. Morgan Funds will implement the Tailored Shareholder Reports for Mutual Funds and Exchanged-Traded Funds Rule. This rule rescinds the currently-required statement regarding the operation and effectiveness of a fund’s Liquidity Risk Management Program from the shareholder report.
| J.P. Morgan Exchange-Traded Funds | |
Certain tax information for the J.P. Morgan Funds is required to be provided to shareholders based upon the Funds' income and distributions for the taxable year ended February 29, 2024. The information and distributions reported in this letter may differ from the information and taxable distributions reported to the shareholders for the calendar year ending December 31, 2024. The information necessary to complete your income tax returns for the calendar year ending December 31, 2024 will be provided under separate cover.
Qualified Interest Income (QII)
Each Fund listed below paid the following amount, or maximum allowable amount, of ordinary distributions treated as qualified interest income for the fiscal year ended February 29, 2024:
| |
JPMorgan Limited Duration Bond ETF | |
Tax Exempt Income
Each Fund listed below had the following amount, or maximum allowable amount, of dividends paid from investment income that are exempt from federal income tax for the fiscal year ended February 29, 2024:
| |
JPMorgan High Yield Municipal ETF | |
JPMorgan Sustainable Municipal Income ETF | |
| J.P. Morgan Exchange-Traded Funds | |
THIS PAGE IS INTENTIONALLY LEFT BLANK
J.P. Morgan Exchange-Traded Funds are distributed by JPMorgan Distribution Services, Inc., an indirect, wholly-owned subsidiary of JPMorgan Chase & Co. Affiliates of JPMorgan Chase & Co. receive fees for providing various services to the Funds.
Contact J.P. Morgan Exchange-Traded Funds at 1-844-457-6383 (844-4JPM ETF) for a fund prospectus. You can also visit us at www.jpmorganfunds.com. Investors should carefully consider the investment objectives and risks as well as charges and expenses of the fund before investing. The prospectus contains this and other information about the fund. Read the prospectus carefully before investing.
Investors may obtain information about the Securities Investor Protection Corporation (SIPC), including the SIPC brochure, by visiting www.sipc.org or by calling SIPC at 202-371-8300.
Each Fund files a complete schedule of its fund holdings for the first and third quarters of its fiscal year with the SEC as an exhibit to its report on Form N-PORT. The Funds' Form N-PORT reports are available on the SEC’s website at http://www.sec.gov. Each Fund's quarterly holdings can be found by visiting the J.P. Morgan Funds’ website at www.jpmorganfunds.com.
Effective January 24, 2023, the SEC adopted rule and form amendments that will result in changes to the design and delivery of shareholder reports of mutual funds and ETFs, requiring them to transmit concise and visually engaging streamlined annual and semi-annual reports to shareholders that highlight key information. Other information, including financial statements, will no longer appear in a streamlined shareholder report but must be available online, delivered free of charge upon request, and filed on a semi-annual basis on Form N-CSR. The rule and form amendments have a compliance date of July 24, 2024.
A description of each Fund's policies and procedures with respect to the disclosure of each Fund's holdings is available in the prospectuses and Statements of Additional Information.
A copy of proxy policies and procedures is available without charge upon request by calling 1-844-457-6383 and on the Funds' website at www.jpmorganfunds.com. A description of such policies and procedures is on the SEC’s website at www.sec.gov. The Trustees have delegated the authority to vote proxies for securities owned by the Funds to the Adviser. A copy of the Funds' voting record for the most recent 12-month period ended June 30 is available on the SEC’s website at www.sec.gov or at the Funds' website at www.jpmorganfunds.com no later than August 31 of each year. The Funds' proxy voting record will include, among other things, a brief description of the matter voted on for each fund security, and will state how each vote was cast, for example, for or against the proposal.
J.P. Morgan Asset Management is the brand name for the asset management business of JPMorgan Chase & Co. and its affiliates worldwide.
© JPMorgan Chase & Co., 2024. All rights reserved. February 2024.
AN-CONVETF2-224
ITEM 2. CODE OF ETHICS.
Disclose whether, as of the end of the period covered by the report, the registrant has adopted a code of ethics that applies to the registrant’s principal executive officer, principal financial officer, principal accounting officer or controller, or persons performing similar functions, regardless of whether these individuals are employed by the registrant or a third party. If the registrant has not adopted such a code of ethics, explain why it has not done so.
The registrant must briefly describe the nature of any amendment, during the period covered by the report, to a provision of its code of ethics that applies to the registrant’s principal executive officer, principal financial officer, principal accounting officer or controller, or persons performing similar functions, regardless of whether these individuals are employed by the registrant or a third party, and that relates to any element of the code of ethics definition enumerated in paragraph (b) of this Item. The registrant must file a copy of any such amendment as an exhibit pursuant to Item 13(a)(1), unless the registrant has elected to satisfy paragraph (f) of this Item by positing its code of ethics on its website pursuant to paragraph (f)(2) of this Item, or by undertaking to provide its code of ethics to any person without charge, upon request, pursuant to paragraph (f)(3) of this Item.
If the registrant has, during the period covered by the report, granted a waiver, including an implicit waiver, from a provision of the code of ethics that applies to the registrant’s principal executive officer, principal financial officer, principal accounting officer or controller, or persons performing similar functions, regardless of whether these individuals are employed by the registrant or third party, that relates to one or more items set forth in paragraph (b) of this Item, the registrant must briefly describe the nature of the waiver, the name of the person to whom the waiver was granted, and the date of the waiver.
The Registrant has adopted a code of ethics that applies to the Registrant’s principal executive officer and principal financial officer. There were no amendments to the code of ethics or waivers granted with respect to the code of ethics in the period covered by the report.
ITEM 3. AUDIT COMMITTEE FINANCIAL EXPERT.
(a) (1) Disclose that the registrant’s board of directors has determined that the registrant either:
(i) Has at least one audit committee financial expert serving on its audit committee; or
(ii) Does not have an audit committee financial expert serving on its audit committee.
The Registrant’s Board of Trustees has determined that the Registrant has at least one audit committee financial expert serving on its audit committee. The Securities and Exchange Commission has stated that the designation or identification of a person as an audit committee financial expert pursuant to this Item 3 of Form N -CSR does not impose on such person any duties, obligations or liabilities that are greater than the duties, obligations and liabilities imposed on such person as a member of the Audit Committee and the Board of Trustees in the absence of such designation or identification.
(2) If the registrant provides the disclosure required by paragraph (a)(1)(i) of this Item, it must disclose the name of the audit committee financial expert and whether that person is “independent.” In order to be considered “independent” for purposes of this Item, a member of an audit committee may not, other than in his or her capacity as a member of the audit committee, the board of directors, or any other board committee:
| | (i) | Accept directly or indirectly any consulting, advisory, or other compensatory fee from the issuer; or |
| | (ii) | Be an “interested person” of the investment company as defined in Section 2(a)(19) of the Act (15 U.S.C. 80a -2(a)(19)). |
The Audit committee financial experts are Gary L. French, Kathleen M. Gallagher, Raymond Kanner and Lawrence R. Maffia, each of whom is not an “interested person” of the Registrant and is also “independent” as defined by the U.S. Securities and Exchange Commission for the purposes of the audit committee financial expert determination.
(3) If the registrant provides the disclosure required by paragraph (a)(1)(ii) of this Item, it must explain why it does not have an audit committee financial expert.
Not applicable.
ITEM 4. PRINCIPAL ACCOUNTANT FEES AND SERVICES.
(a) Disclose, under the caption Audit Fees, the aggregate fees billed for each of the last two fiscal years for professional services rendered by the principal accountant for the audit of the registrant’s annual financial statements or services that are normally provided by the accountant in connection with statutory and regulatory filings or engagements for those fiscal years.
AUDIT FEES
2024 – $1,343,673
2023 – $769,391
(b) Disclose, under the caption Audit -Related Fees, the aggregate fees billed in each of the last two fiscal years for assurance and related services by the principal accountant that are reasonably related to the performance of the audit of the registrant’s financial statements and are not reported under paragraph (a) of this Item. Registrants shall describe the nature of the services comprising the fees disclosed under this category.
AUDIT -RELATED FEES
2024 – $132,386
2023 – $85,431
Audit -related fees consist of security count procedures performed as required under Rule 17f -2 of the Investment Company Act of 1940 during the Registrant’s fiscal year.
(c) Disclose, under the caption Tax Fees, the aggregate fees billed in each of the last two fiscal years for professional services rendered by the principal accountant for tax compliance, tax advice, and tax planning. Registrants shall describe the nature of the services comprising the fees disclosed under this category.
TAX FEES
2024 – $314,718
2023 – $197,183
The tax fees consist of fees billed in connection with preparing the federal regulated investment company income tax returns for the Registrant for the tax years ended February 29, 2024 and 2023, respectively.
For the last fiscal year, no tax fees were required to be approved pursuant to paragraph (c)(7)(ii) of Rule 2 -01 of Regulation S -X.
(d) Disclose, under the caption All Other Fees, the aggregate fees billed in each of the last two fiscal years for products and services provided by the principal accountant, other than the services reported in paragraphs (a) through (c) of this Item. Registrants shall describe the nature of the services comprising the fees disclosed under this category.
ALL OTHER FEES
2024 – $0
2023 – $0
(e)(1) Disclose the audit committee’s pre -approval policies and procedures described in paragraph (c)(7) of Rule 2 -01 of Regulation S -X.
Pursuant to the Registrant’s Audit Committee Charter and written policies and procedures for the pre -approval of audit and non -audit services (the “Pre -approval Policy”), the Audit Committee pre -approves all audit and non -audit services performed by the Registrant’s independent public registered accounting firm for the Registrant. In addition, the Audit Committee pre -approves the auditor’s engagement for non -audit services with the Registrant’s investment adviser (not including a sub -adviser whose role is primarily portfolio management and is sub -contracted or overseen by another investment adviser) and any Service Affiliate in accordance with paragraph (c)(7)(ii) of Rule 2 -01 of Regulation S -X, if the engagement relates directly to the operations and financial reporting of the Registrant. Proposed services may be pre -approved either 1) without consideration of specific case -by - case services or 2) require the specific pre -approval of the Audit Committee. Therefore, initially the Pre -approval Policy listed a number of audit and non -audit services that have been approved by the Audit Committee, or which were not subject to pre - approval under the transition provisions of Sarbanes -Oxley Act of 2002 (the “Pre -approval List”). The Audit Committee annually reviews and pre -approves the services included on the Pre -approval List that may be provided by the independent public registered accounting firm without obtaining additional specific pre -approval of individual services from the Audit Committee. The Audit Committee adds to, or subtracts from, the list of general pre -approved services from time to time, based on subsequent determinations. All other audit and non -audit services not on the Pre -approval List must be specifically pre -approved by the Audit Committee.
One or more members of the Audit Committee may be appointed as the Committee’s delegate for the purposes of considering whether to approve such services. Any pre -approvals granted by the delegate will be reported, for informational purposes only, to the Audit Committee at its next scheduled meeting. The Audit Committee’s responsibilities to pre -approve services performed by the independent public registered accounting firm are not delegated to management.
(2) Disclose the percentage of services described in each of paragraphs (b) through (d) of this Item that were approved by the audit committee pursuant to paragraph (c)(7)(i)(C) of Rule 2 -01 of Regulation S -X.
2024 – 0.0%
2023 – 0.0%
(f) If greater than 50 percent, disclose the percentage of hours expended on the principal accountant’s engagement to audit the registrant’s financial statements for the most recent fiscal year that were attributed to work performed by persons other than the principal accountant’s full -time, permanent employees.
Not applicable.
(g) Disclose the aggregate non -audit fees billed by the registrant’s accountant for services rendered to the registrant, and rendered to the registrant’s investment adviser (not including any sub -adviser whose role is primarily portfolio management and is subcontracted with or overseen by another investment adviser), and any entity controlling, controlled by, or under common control with the adviser that provides ongoing services to the registrant for each of the last two fiscal years of the registrant.
The aggregate non -audit fees billed by the independent registered public accounting firm for services rendered to the Registrant, and rendered to Service Affiliates, for the last two calendar year ends were:
2023 – $35.4 million
2022 – $31.6 million
(h) Disclose whether the registrant’s audit committee of the board of directors has considered whether the provision of non -audit services that were rendered to the registrant’s investment adviser (not including any subadviser whose role is primarily portfolio management and is subcontracted with or overseen by another investment adviser), and any entity controlling, controlled by, or under common control with the investment adviser that provides ongoing services to the registrant that were not pre -approved pursuant to paragraph (c)(7)(ii) of Rule 2 -01 of Regulation S -X is compatible with maintaining the principal accountant’s independence.
The Registrant’s Audit Committee has considered whether the provision of the non -audit services that were rendered to Service Affiliates that were not pre -approved (not requiring pre -approval) is compatible with maintaining the independent public registered accounting firm’s independence. All services provided by the independent public registered accounting firm to the Registrant or to Service Affiliates that were required to be pre -approved were pre -approved as required.
(i) A registrant identified by the Commission pursuant to Section 104(i)(2)(A) of the Sarbanes-Oxley Act of 2002 (15 U.S.C. 7214(i)(2)(A)), as having retained, for the preparation of the audit report on its financial statements included in the Form NCSR, a registered public accounting firm that has a branch or office that is located in a foreign jurisdiction and that the Public Company Accounting Oversight Board has determined it is unable to inspect or investigate completely because of a position taken by an authority in the foreign jurisdiction must electronically submit to the Commission on a supplemental basis documentation that establishes that the registrant is not owned or controlled by a governmental entity in the foreign jurisdiction. The registrant must submit this documentation on or before the due date for this form. A registrant that is owned or controlled by a foreign governmental entity is not required to submit such documentation.
Not applicable.
(j) A registrant that is a foreign issuer, as defined in 17 CFR 240.3b-4, identified by the Commission pursuant to Section 104(i)(2)(A) of the Sarbanes-Oxley Act of 2002 (15 U.S.C. 7214(i)(2)(A)), as having retained, for the preparation of the audit report on its financial statements included in the Form N-CSR, a registered public accounting firm that has a branch or office that is located in a foreign jurisdiction and that the Public Company Accounting Oversight Board has determined it is unable to inspect or investigate completely because of a position taken by an authority in the foreign jurisdiction, for each year in which the registrant is so identified, must provide the below disclosures. Also, any such identified foreign issuer that uses a variable-interest entity or any similar structure that results in additional foreign entities being consolidated in the financial statements of the registrant is required to provide the below disclosures for itself and its consolidated foreign operating entity or entities. A registrant must disclose:
| | (1) | That, for the immediately preceding annual financial statement period, a registered public accounting firm that the PCAOB was unable to inspect or investigate completely, because of a position taken by an authority in the foreign jurisdiction, issued an audit report for the registrant; |
| | (2) | The percentage of shares of the registrant owned by governmental entities in the foreign jurisdiction in which the registrant is incorporated or otherwise organized; |
| | (3) | Whether governmental entities in the applicable foreign jurisdiction with respect to that registered public accounting firm have a controlling financial interest with respect to the registrant; |
| | (4) | The name of each official of the Chinese Communist Party who is a member of the board of directors of the registrant or the operating entity with respect to the registrant; and |
| | (5) | Whether the articles of incorporation of the registrant (or equivalent organizing document) contains any charter of the Chinese Communist Party, including the text of any such charter. |
Not applicable.
ITEM 5. AUDIT COMMITTEE OF LISTED REGISTRANTS.
(a) If the registrant is a listed issuer as defined in Rule 10A -3 under the Exchange Act (17CFR 240.10A -3), state whether or not the registrant has a separately -designated standing audit committee established in accordance with Section 3(a)(58)(A) of the Exchange Act (15 U.S.C. 78c(a)(58)(A)). If the registrant has such a committee, however designated, identify each committee member. If the entire board of directors is acting as the registrant’s audit committee as specified in Section 3(a)(58)(B) of the Exchange Act (15
U.S.C. 78c(a)(58)(B)), so state.
The registrant has a separately designated Audit Committee established in accordance with Section 3(a)(58)(A) of the Exchange Act. The members of the Audit Committee are Gary L. French, Kathleen M. Gallagher, Raymond Kanner and Lawrence R. Maffia.
(b) If applicable, provide the disclosure required by Rule 10A -3(d) under the Exchange Act (17CFR 240.10A -3(d)) regarding an exemption from the listing standards for all audit committees.
Not applicable.
ITEM 6. SCHEDULE OF INVESTMENTS.
File Schedule I – Investments in securities of unaffiliated issuers as of the close of the reporting period as set forth in Section 210.12 -12 of Regulation S -X, unless the schedule is included as part of the report to shareholders filed under Item 1 of this Form.
Included in Item 1.
ITEM 7. DISCLOSURE OF PROXY VOTING POLICIES AND PROCEDURES FOR CLOSED -END MANAGEMENT INVESTMENT COMPANIES.
A closed -end management investment company that is filing an annual report on this Form N -CSR must, unless it invests exclusively in non -voting securities, describe the policies and procedures that it uses to determine how to vote proxies relating to portfolio securities, including the procedures that the company uses when a vote presents a conflict between the interests of its shareholders, on the one hand, and those of the company’s investment adviser; principal underwriter; or any affiliated person (as defined in Section 2(a)(3) of the Investment Company Act of 1940 (15 U.S.C. 80a -2(a)(3)) and the rules thereunder) of the company, its investment adviser, or its principal underwriter, on the other. Include any policies and procedures of the company’s investment adviser, or any other third party, that the company uses, or that are used on the company’s behalf, to determine how to vote proxies relating to portfolio securities.
Not applicable.
ITEM 8. PORTFOLIO MANAGERS OF CLOSED -END MANAGEMENT INVESTMENT COMPANIES.
Not applicable.
ITEM 9. PURCHASE OF EQUITY SECURITIES BY CLOSED -END MANAGEMENT INVESTMENT COMPANY AND AFFILIATED PURCHASERS.
(a) If the registrant is a closed -end management investment company, provide the information specified in paragraph (b) of this Item with respect to any purchase made by or on behalf of the registrant or any “affiliated purchaser,” as defined in Rule 10b -18(a)(3) under the Exchange Act (17 CFR 240.10b -18(a)(3)), of shares or other units of any class of the registrant’s equity securities that is registered by the registrant pursuant to Section 12 of the Exchange Act (15 U.S.C. 781).
Not applicable.
ITEM 10. SUBMISSION OF MATTERS TO A VOTE OF SECURITY HOLDERS.
Describe any material changes to the procedures by which shareholders may recommend nominees to the registrant’s board of directors, where those changes were implemented after the registrant last provided disclosure in response to the requirements of Item 7(d)(2)(ii)(G) of Schedule 14A (17 CFR 240.14a -101), or this Item.
No material changes to report.
ITEM 11. CONTROLS AND PROCEDURES.
(a) Disclose the conclusions of the registrant’s principal executive and principal financial officers, or persons performing similar functions, regarding the effectiveness of the registrant’s disclosure controls and procedures (as defined in Rule 30a -3(c) under the Act (17 CFR 270.30a -3(c))) as of a date within 90 days of the filing date of the report that includes the disclosure required by this paragraph, based on the evaluation of these controls and procedures required by Rule 30a -3(b) under the Act (17 CFR 270.30a -3(b)) and Rules 13a -15(b) or 15d -15(b) under the Exchange Act (17 CFR 240.13a -15(b) or 240.15d -15(b)).
The Registrant’s principal executive and principal financial officers have concluded, based on their evaluation of the Registrant’s disclosure controls and procedures as of a date within 90 days of the filing date of this report, that the Registrant’s disclosure controls and procedures are reasonably designed to ensure that information required to be disclosed by the Registrant on Form N -CSR is recorded, processed, summarized and reported within the required time periods and that information required to be disclosed by the Registrant in the reports that it files or submits on Form N -CSR is accumulated and communicated to the Registrant’s management, including its principal executive and principal financial officers, as appropriate to allow timely decisions regarding required disclosure.
(b) Disclose any change in the registrant’s internal control over financial reporting (as defined in Rule 30a -3(d) under the Act (17 CFR 270.30a -3(d)) that occurred during the period covered by this report that has materially affected, or is reasonably likely to materially affect, the registrant’s internal control over financial reporting.
There were no changes in the Registrant’s internal control over financial reporting that occurred during the reporting period covered by this report that have materially affected, or are reasonably likely to materially affect, the Registrant’s internal control over financial reporting.
ITEM 12. DISCLOSURE OF SECURITIES LENDING ACTIVITIES FOR CLOSED-END MANAGEMENT INVESTMENT COMPANIES.
Not applicable.
ITEM 13. EXHIBITS.
| | (a) | File the exhibits listed below as part of this Form. Letter or number the exhibits in the sequence indicated. |
(1) Any code of ethics, or amendment thereto, that is the subject of the disclosure required by Item 2, to the extent that the registrant intends to satisfy the Item 2 requirements through filing of an exhibit.
Code of Ethics applicable to its Principal Executive and Principal Financial Officers pursuant to Section 406 of the Sarbanes-Oxley Act of 2002 attached hereto.
(2) A separate certification for each principal executive officer and principal financial officer of the registrant as required by Rule 30a-2(a) under the Act (17 CFR 270.30a-2), exactly as set forth below:
Certifications pursuant to Rule 30a-2(a) under the Investment Company Act of 1940 are attached hereto.
(1) Any written solicitation to purchase securities under Rule 23c-1 under the Act (17 CFR 270.23c-1) sent or given during the period covered by the report by or on behalf of the registrant to 10 or more persons.
Not applicable.
(2) Change in the registrant’s independent public accountant. Provide the information called for by Item 4 of Form 8-K under the Exchange Act (17 CFR 249.308). Unless otherwise specified by Item 4, or related to and necessary for a complete understanding of information not previously disclosed, the information should relate to events occurring during the reporting period.
Not applicable.
| | (b) | A separate or combined certification for each principal executive officer and principal officer of the registrant as required by Rule 30a-2(b) under the Act of 1940. |
Certifications pursuant to Rule 30a -2(b) under the Investment Company Act of 1940 are attached hereto.
SIGNATURES
Pursuant to the requirements of the Securities Exchange Act of 1934 and the Investment Company Act of 1940, the registrant has duly caused this report to be signed on its behalf by the undersigned, thereunto duly authorized.
J.P. Morgan Exchange-Traded Fund Trust
| | |
By: | | /s/ Brian S. Shlissel |
| | Brian S. Shlissel |
| | President and Principal Executive Officer. |
| | May 6, 2024 |
Pursuant to the requirements of the Securities Exchange Act of 1934 and the Investment Company Act of 1940, this report has been signed below by the following persons on behalf of the registrant and in the capacities and on the dates indicated.
| | |
By: | | /s/ Brian S. Shlissel |
| | Brian S. Shlissel |
| | President and Principal Executive Officer |
| | May 6, 2024 |
| |
By: | | /s/ Timothy J. Clemens |
| | Timothy J. Clemens |
| | Treasurer and Principal Financial Officer |
| | May 6, 2024 |