0001485894 jpeft:C000141386Member country:CN 2024-10-31
UNITED STATES
SECURITIES AND EXCHANGE COMMISSION
Washington, D.C. 20549
FORM N-CSR
CERTIFIED SHAREHOLDER REPORT OF REGISTERED MANAGEMENT INVESTMENT COMPANIES
Investment Company Act file number
J.P. Morgan Exchange-Traded Fund Trust
(Exact name of registrant as specified in charter)
277 Park Avenue
New York, NY 10172
(Address of principal executive offices) (Zip code)
Gregory S. Samuels
J.P. Morgan Investment Management Inc.
277 Park Avenue
New York, NY 10172
(Name and Address of Agent for Service)
| With copies to: |
Elizabeth A. Davin, Esq.
JPMorgan Chase & Co.
1111 Polaris Parkway
Columbus, OH 43240 | Jon S. Rand, Esq.
Dechert LLP
1905 Avenue of the Americas
New York, NY 10036 |
Registrant's telephone number, including area code:
Date of reporting period:
Item 1. Report to Stockholders.
a.) The following is a copy of the report transmitted to shareholders pursuant to Rule 30e-1 under the Investment Company Act of 1940 (17 CFR 270.30e-1).
b.) A copy of the notice transmitted to shareholders in reliance on Rule 30e-3 under the 1940 Act that contains disclosures specified by paragraph (c)(3) of that rule is included in the Annual Report. Not Applicable. Notices do not incorporate disclosures from the shareholder reports.
ANNUAL SHAREHOLDER REPORT | October 31, 2024 (Unaudited)
JPMorgan Active China ETF
Ticker: JCHI - NYSE Arca, Inc.
ANNUAL SHAREHOLDER REPORT
This annual shareholder report contains important information about the JPMorgan Active China ETF (the "Fund") for the period of November 1, 2023 to October 31, 2024. You can find additional information about the Fund at www.jpmorganfunds.com/funddocuments. You can also request this information by contacting us at 1-844-457-6383 or by sending an e-mail request to jpm.xf@jpmorgan.com or by asking any financial intermediary that offers shares of the Fund.
What were the Fund costs for the last year?
(based on a hypothetical $10,000 investment)
| Fund | Costs of a
$10,000 investment | Costs paid as a percentage
of a $10,000 investment |
| JPMorgan Active China ETF | $70 | 0.65% |
How did the Fund Perform?
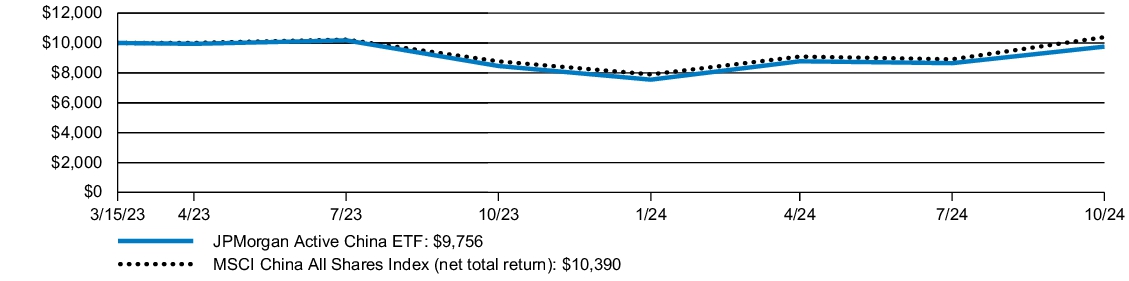
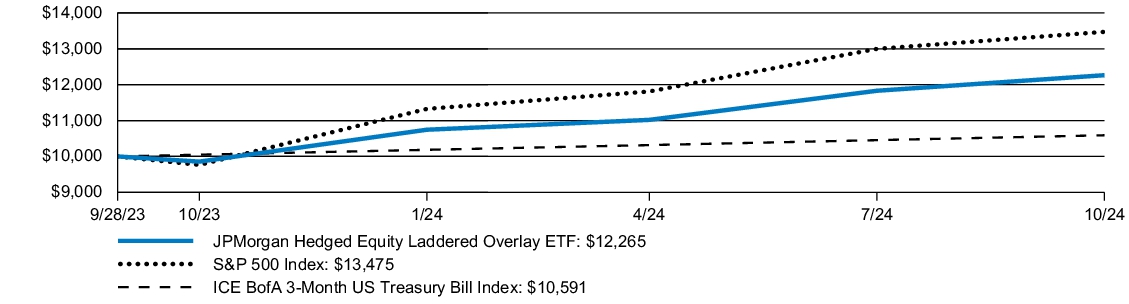
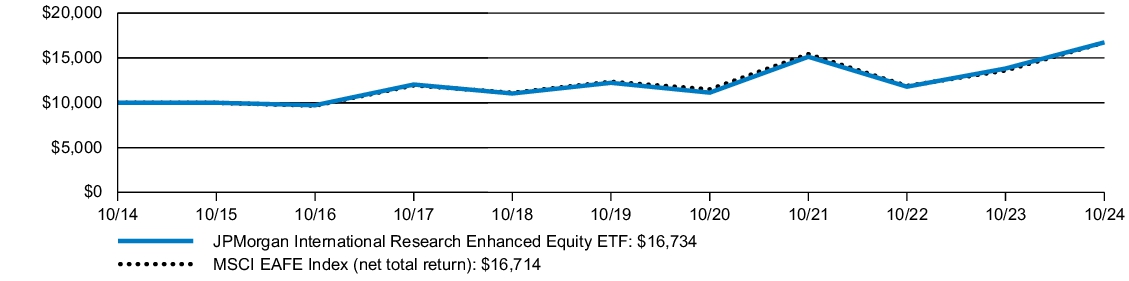
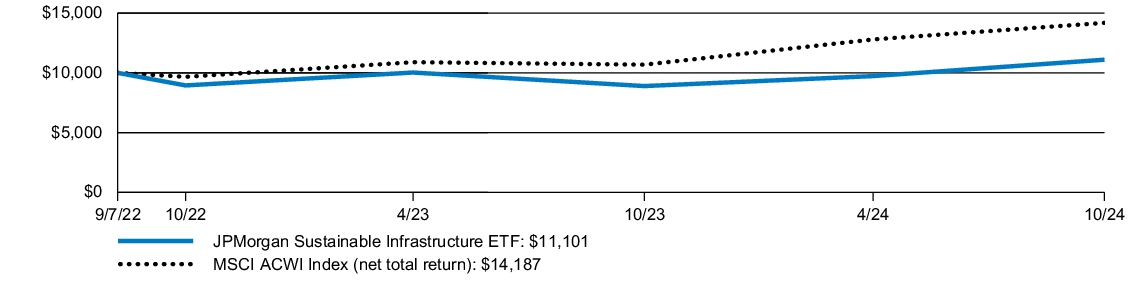
The JPMorgan Active China ETF returned 15.31% for the year ended October 31, 2024. The MSCI China All Shares Index (net total return) returned 18.47% for the year ended October 31, 2024.
The Fund's stock selection in the communication services and industrials sectors detracted from relative performance.
The Fund's stock selection in the real estate and consumer staples sectors contributed positively to the overall performance.
| AVERAGE ANNUAL TOTAL RETURNS | INCEPTION
DATE | 1 YEAR | | SINCE
INCEPTION | |
| JPMorgan Active China ETF - Net Asset Value | March 15, 2023 | 15.31 | % | (1.51 | )% |
| MSCI China All Shares Index (net total return) | | 18.47 | | 2.38 | |
The performance quoted is past performance and is not a guarantee of future results. Exchange-traded funds are subject to certain market risks. Investment returns and principal value of an investment will fluctuate so that an investor’s shares, when sold or redeemed, may be worth more or less than their original cost. Current performance may be higher or lower than the performance data shown. Updated performance information is available by visiting www.jpmorganfunds.com or by calling 1-844-457-6383.
The graph illustrates comparative performance for $10,000 invested in shares of the JPMorgan Active China ETF and the MSCI China All Shares Index (net total return) from March 15, 2023 to October 31, 2024. The performance of the Fund reflects the deduction of Fund expenses and assumes reinvestment of all dividends and capital gain distributions, if any. The performance of the MSCI China All Shares Index (net total return) does not reflect the deduction of expenses associated with an exchange-traded fund and has been adjusted to reflect reinvestment of all dividends and capital gain distributions of the securities included in the Index, if applicable. The MSCI China All Shares Index (net total return) is a free float-adjusted market capitalization weighted index that is designed to measure the performance of large- and mid-cap Chinese securities represented across China A-shares, B-shares, H-shares, Redchips, P-chips and foreign listings (e.g. ADRs). The index aims to reflect the opportunity set of China share classes listed in Hong Kong, Shanghai, Shenzhen and outside of China. It is based on the concept of the integrated MSCI China equity universe with China A-shares included. Net total return figures assume the reinvestment of dividends after deduction of withholding tax, applying the maximum rate to nonresident individual investors who do not benefit from double taxation treaties. Investors cannot invest directly in an index.
Performance shown in this section does not reflect the deduction of taxes that a shareholder may pay on Fund distributions or on gains resulting from redemption or sale of Fund shares.
International investing involves a greater degree of risk and increased volatility. Changes in currency exchange rates and differences in accounting and taxation policies outside the United States can raise or lower returns. Also, some overseas markets may not be as politically and economically stable as the United States and other nations.
The returns shown are based on net asset values calculated for shareholder transactions and may differ from the returns shown in the financial highlights, which reflect adjustments made to the net asset values in accordance with accounting principles generally accepted in the United States of America.
Source: MSCI. The MSCI information may only be used for your internal use, may not be reproduced or redisseminated in any form and may not be used as a basis for or a component of any financial instruments or products or indices. None of the MSCI information is intended to constitute investment advice or a recommendation to make (or refrain from making) any kind of investment decision and may not be relied on as such. Historical data and analysis should not be taken as an indication or guarantee of any future performance analysis, forecast, or prediction. The MSCI information is provided on an "as is" basis and the user of this information assumes the entire risk of any use made of this information. MSCI, each of its affiliates and each other person involved in or related to compiling, computing or creating any MSCI information (collectively, the "MSCI Parties") expressly disclaims all warranties (including, without limitation, any warranties of originality, accuracy, completeness, timeliness, non-infringement, merchantability and fitness for a particular purpose) with respect to this information. Without limiting any of the foregoing, in no event shall any MSCI Party have any liability for any direct, indirect, special, incidental, punitive, consequential (including, without limitation, lost profits) or any other damages. (www.msci.com)
| Fund net assets | $11,916,262 | |
| Total number of portfolio holdings | 49 | |
| Portfolio turnover rate | 42 | % |
| Total advisory fees paid | $69,207 | |
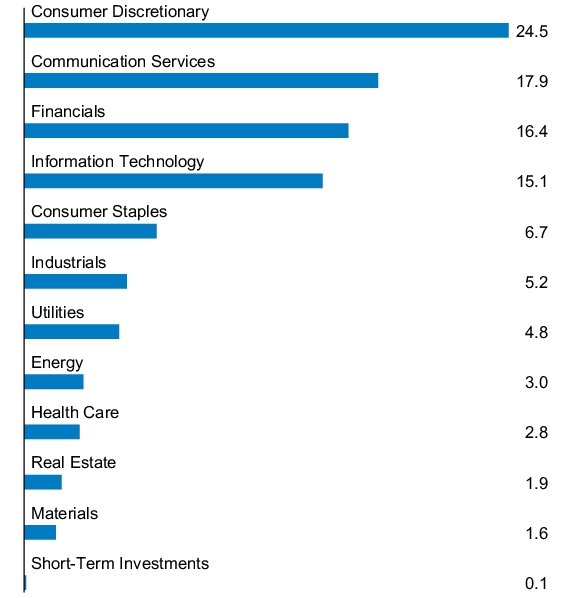
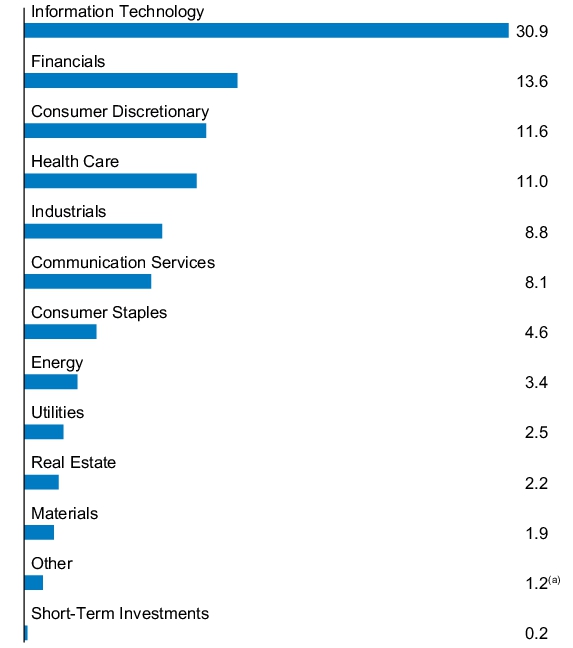
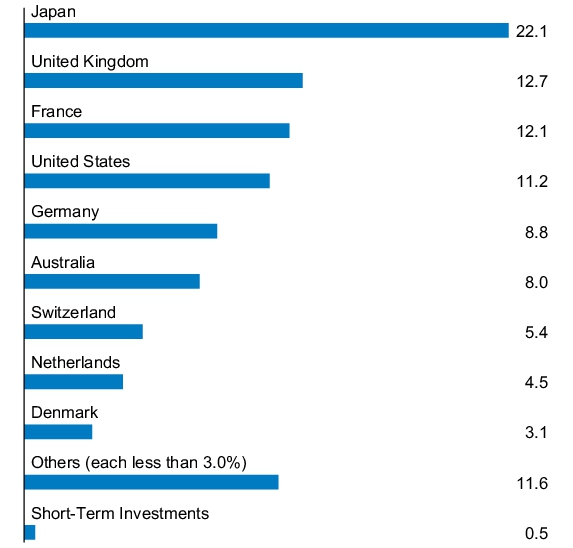
PORTFOLIO COMPOSITION - SECTOR
(% of Total Investments)
Availability of Additional Information
At www.jpmorganfunds.com/funddocuments, you can find additional information about the Fund, including the Fund’s:
Prospectus
Financial information
Fund holdings
Proxy voting information
You can also request this information by contacting us at 1-844-457-6383.
ANNUAL SHAREHOLDER REPORT | October 31, 2024 (Unaudited)
JPMorgan ActiveBuilders Emerging Markets Equity ETF
Ticker: JEMA - Cboe BZX Exchange, Inc.
ANNUAL SHAREHOLDER REPORT
This annual shareholder report contains important information about the JPMorgan ActiveBuilders Emerging Markets Equity ETF (the "Fund") for the period of November 1, 2023 to October 31, 2024. You can find additional information about the Fund at www.jpmorganfunds.com/funddocuments. You can also request this information by contacting us at 1-844-457-6383 or by sending an e-mail request to jpm.xf@jpmorgan.com or by asking any financial intermediary that offers shares of the Fund.
What were the Fund costs for the last year?
(based on a hypothetical $10,000 investment)
| Fund | Costs of a
$10,000 investment | Costs paid as a percentage
of a $10,000 investment |
| JPMorgan ActiveBuilders Emerging Markets Equity ETF | $37 | 0.34% |
How did the Fund Perform?
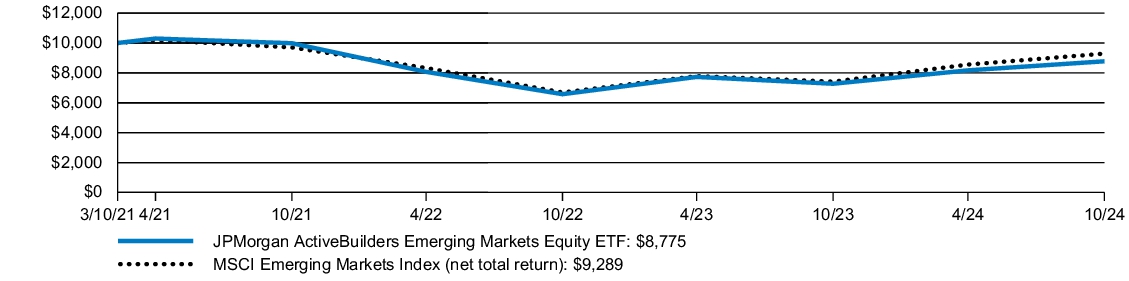
The JPMorgan ActiveBuilders Emerging Markets Equity ETF returned 20.67% for the year ended October 31, 2024. The MSCI Emerging Markets Index (net total return) (the "Index") returned 25.32% for the year ended October 31, 2024.
The Fund's holdings in China detracted from performance relative to the Index.
Stock selection in India also detracted from performance relative to the Index.
The Fund's stock selection in South Africa contributed to performance relative to the Index.
Exposure to Argentina also added to the Fund’s positive performance, reflecting favorable market conditions and investment decisions.
| AVERAGE ANNUAL TOTAL RETURNS | INCEPTION
DATE | 1 YEAR | | SINCE
INCEPTION | |
| JPMorgan ActiveBuilders Emerging Markets Equity ETF - Net Asset Value | March 10, 2021 | 20.67 | % | (3.52 | )% |
| MSCI Emerging Markets Index (net total return) | | 25.32 | | (2.01 | ) |
The performance quoted is past performance and is not a guarantee of future results. Exchange-traded funds are subject to certain market risks. Investment returns and principal value of an investment will fluctuate so that an investor’s shares, when sold or redeemed, may be worth more or less than their original cost. Current performance may be higher or lower than the performance data shown. Updated performance information is available by visiting www.jpmorganfunds.com or by calling 1-844-457-6383.
The graph illustrates comparative performance for $10,000 invested in shares of the JPMorgan ActiveBuilders Emerging Markets Equity ETF and the MSCI Emerging Markets Index (net total return) from March 10, 2021 to October 31, 2024. The performance of the Fund reflects the deduction of Fund expenses and assumes reinvestment of all dividends and capital gain distributions, if any. The performance of the MSCI Emerging Markets Index (net total return) does not reflect the deduction of expenses associated with an exchange-traded fund and has been adjusted to reflect reinvestment of all dividends and capital gain distributions of the securities included in the benchmark, if applicable. The MSCI Emerging Markets Index (net total return) is a free float-adjusted market capitalization-weighted index that is designed to measure the performance of large- and mid-cap stocks in emerging markets. Net total return figures assume the reinvestment of dividends after deduction of withholding tax, applying the maximum rate to nonresident individual investors who do not benefit from double taxation treaties. Investors cannot invest directly in an index.
Performance shown in this section does not reflect the deduction of taxes that a shareholder may pay on Fund distributions or on gains resulting from redemption or sale of Fund shares.
International investing involves a greater degree of risk and increased volatility. Changes in currency exchange rates and differences in accounting and taxation policies outside the United States can raise or lower returns. Also, some overseas markets may not be as politically and economically stable as the United States and other nations.
The returns shown are based on net asset values calculated for shareholder transactions and may differ from the returns shown in the financial highlights, which reflect adjustments made to the net asset values in accordance with accounting principles generally accepted in the United States of America.
Source: MSCI. The MSCI information may only be used for your internal use, may not be reproduced or redisseminated in any form and may not be used as a basis for or a component of any financial instruments or products or indices. None of the MSCI information is intended to constitute investment advice or a recommendation to make (or refrain from making) any kind of investment decision and may not be relied on as such. Historical data and analysis should not be taken as an indication or guarantee of any future performance analysis, forecast, or prediction. The MSCI information is provided on an "as is" basis and the user of this information assumes the entire risk of any use made of this information. MSCI, each of its affiliates and each other person involved in or related to compiling, computing or creating any MSCI information (collectively, the "MSCI Parties") expressly disclaims all warranties (including, without limitation, any warranties of originality, accuracy, completeness, timeliness, non-infringement, merchantability and fitness for a particular purpose) with respect to this information. Without limiting any of the foregoing, in no event shall any MSCI Party have any liability for any direct, indirect, special, incidental, punitive, consequential (including, without limitation, lost profits) or any other damages. (www.msci.com)
| Fund net assets | $1,050,643,348 | |
| Total number of portfolio holdings | 511 | |
| Portfolio turnover rate | 50 | % |
| Total advisory fees paid | $3,293,123 | |
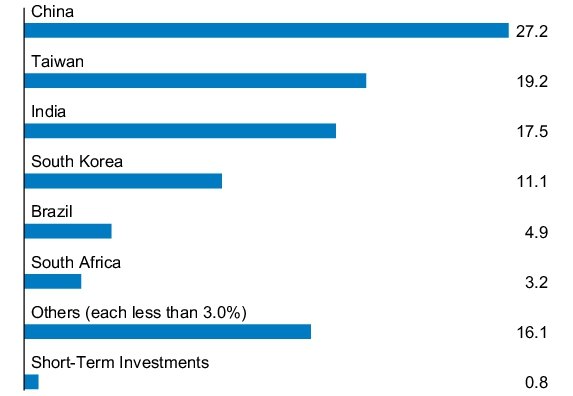
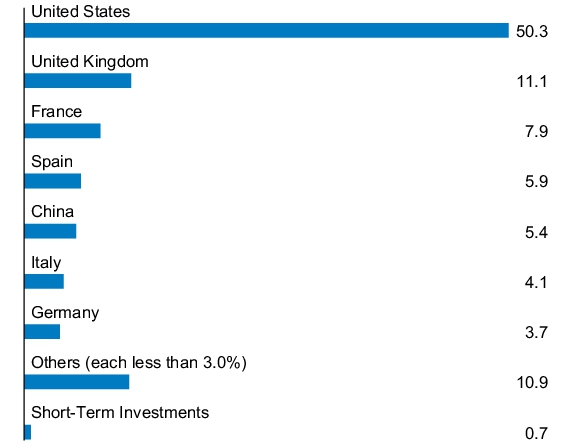
PORTFOLIO COMPOSITION - COUNTRY
(% of Total Investments)
Availability of Additional Information
At www.jpmorganfunds.com/funddocuments, you can find additional information about the Fund, including the Fund’s:
Prospectus
Financial information
Fund holdings
Proxy voting information
You can also request this information by contacting us at 1-844-457-6383.
ANNUAL SHAREHOLDER REPORT | October 31, 2024 (Unaudited)
JPMorgan Active Developing Markets Equity ETF
Ticker: JADE - NYSE Arca, Inc.
ANNUAL SHAREHOLDER REPORT
This annual shareholder report contains important information about the JPMorgan Active Developing Markets Equity ETF (the "Fund") for the period of May 16, 2024 (fund inception) to October 31, 2024. You can find additional information about the Fund at www.jpmorganfunds.com/funddocuments. You can also request this information by contacting us at 1-844-457-6383 or by sending an e-mail request to jpm.xf@jpmorgan.com or by asking any financial intermediary that offers shares of the Fund.
What were the Fund costs for the last year?
(based on a hypothetical $10,000 investment)
| Fund | Costs of a
$10,000 investment | Costs paid as a percentage
of a $10,000 investment* |
| JPMorgan Active Developing Markets Equity ETF | $30 | 0.65% |
| * | This charge is annualized. |
How did the Fund Perform?
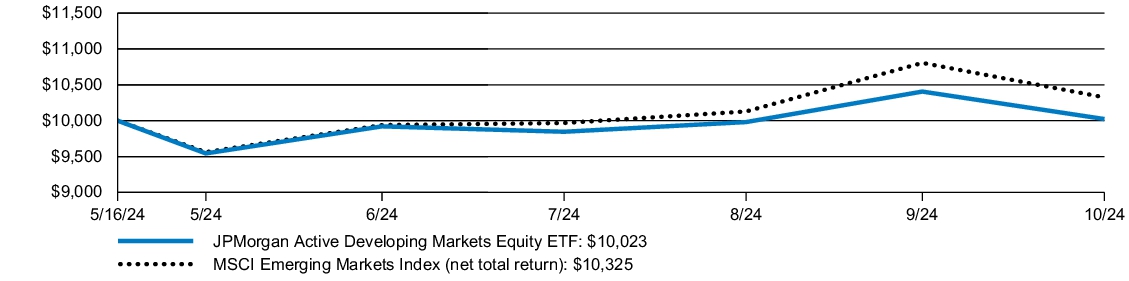
The JPMorgan Active Developing Markets Equity ETF returned 0.23% for the period from Fund inception to October 31, 2024. The MSCI Emerging Markets Index (net total return) (the "Index") returned 3.25% for the period.
The Fund's holdings in China detracted from performance relative to the Index.
Stock selection in Taiwan also detracted from relative performance.
The Fund's stock selection in South Africa contributed to performance relative to the Index.
Stock selection in Brazil also aided performance.
| AVERAGE ANNUAL TOTAL RETURNS | INCEPTION
DATE | SINCE
INCEPTION* | |
| JPMorgan Active Developing Markets Equity ETF - Net Asset Value | May 16, 2024 | 0.23 | % |
| MSCI Emerging Markets Index (net total return) | | 3.25 | |
The performance quoted is past performance and is not a guarantee of future results. Exchange-traded funds are subject to certain market risks. Investment returns and principal value of an investment will fluctuate so that an investor’s shares, when sold or redeemed, may be worth more or less than their original cost. Current performance may be higher or lower than the performance data shown. Updated performance information is available by visiting www.jpmorganfunds.com or by calling 1-844-457-6383.
The graph illustrates comparative performance for $10,000 invested in shares of the JPMorgan Active Developing Markets Equity ETF and the MSCI Emerging Markets Index (net total return) from May 16, 2024 to October 31, 2024. The performance of the Fund reflects the deduction of Fund expenses and assumes reinvestment of all dividends and capital gain distributions, if any. The performance of the MSCI Emerging Markets Index (net total return) does not reflect the deduction of expenses associated with an exchange-traded fund and has been adjusted to reflect reinvestment of all dividends and capital gain distributions of the securities included in the benchmark, if applicable. The MSCI Emerging Markets Index (net total return) is a free float-adjusted market capitalization-weighted index that is designed to measure the performance of large- and mid-cap stocks in emerging markets. Net total return figures assume the reinvestment of dividends after deduction of withholding tax, applying the maximum rate to nonresident individual investors who do not benefit from double taxation treaties. Investors cannot invest directly in an index.
Performance shown in this section does not reflect the deduction of taxes that a shareholder may pay on Fund distributions or on gains resulting from redemption or sale of Fund shares.
International investing involves a greater degree of risk and increased volatility. Changes in currency exchange rates and differences in accounting and taxation policies outside the United States can raise or lower returns. Also, some overseas markets may not be as politically and economically stable as the United States and other nations.
The returns shown are based on net asset values calculated for shareholder transactions and may differ from the returns shown in the financial highlights, which reflect adjustments made to the net asset values in accordance with accounting principles generally accepted in the United States of America.
Source: MSCI. The MSCI information may only be used for your internal use, may not be reproduced or redisseminated in any form and may not be used as a basis for or a component of any financial instruments or products or indices. None of the MSCI information is intended to constitute investment advice or a recommendation to make (or refrain from making) any kind of investment decision and may not be relied on as such. Historical data and analysis should not be taken as an indication or guarantee of any future performance analysis, forecast, or prediction. The MSCI information is provided on an "as is" basis and the user of this information assumes the entire risk of any use made of this information. MSCI, each of its affiliates and each other person involved in or related to compiling, computing or creating any MSCI information (collectively, the "MSCI Parties") expressly disclaims all warranties (including, without limitation, any warranties of originality, accuracy, completeness, timeliness, non-infringement, merchantability and fitness for a particular purpose) with respect to this information. Without limiting any of the foregoing, in no event shall any MSCI Party have any liability for any direct, indirect, special, incidental, punitive, consequential (including, without limitation, lost profits) or any other damages. (www.msci.com)
| Fund net assets | $14,433,132 | |
| Total number of portfolio holdings | 129 | |
| Portfolio turnover rate | 15 | % |
| Total advisory fees paid | $41,907 | |
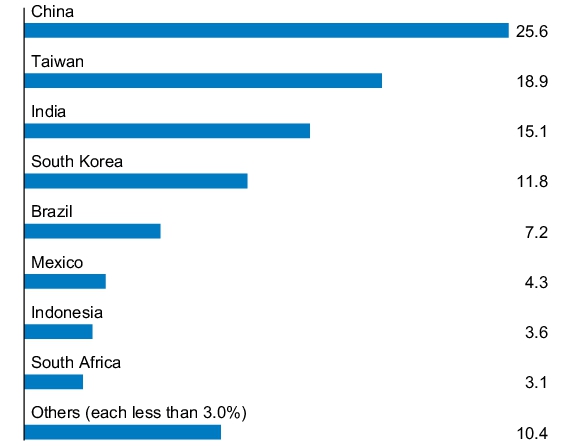
PORTFOLIO COMPOSITION - COUNTRY
(% of Total Investments)
Availability of Additional Information
At www.jpmorganfunds.com/funddocuments, you can find additional information about the Fund, including the Fund’s:
Prospectus
Financial information
Fund holdings
Proxy voting information
You can also request this information by contacting us at 1-844-457-6383.
ANNUAL SHAREHOLDER REPORT | October 31, 2024 (Unaudited)
JPMorgan BetaBuilders Canada ETF
Ticker: BBCA - Cboe BZX Exchange, Inc.
ANNUAL SHAREHOLDER REPORT
This annual shareholder report contains important information about the JPMorgan BetaBuilders Canada ETF (the "Fund") for the period of November 1, 2023 to October 31, 2024. You can find additional information about the Fund at www.jpmorganfunds.com/funddocuments. You can also request this information by contacting us at 1-844-457-6383 or by sending an e-mail request to jpm.xf@jpmorgan.com or by asking any financial intermediary that offers shares of the Fund.
What were the Fund costs for the last year?
(based on a hypothetical $10,000 investment)
| Fund | Costs of a
$10,000 investment | Costs paid as a percentage
of a $10,000 investment |
| JPMorgan BetaBuilders Canada ETF | $22 | 0.19% |
How did the Fund Perform?
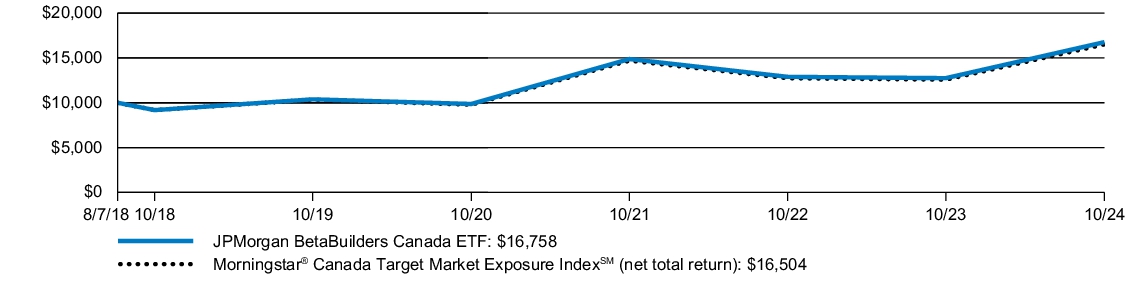
The JPMorgan BetaBuilders Canada ETF returned 31.51% for the year ended October 31, 2024. The Morningstar® Canada Target Market Exposure IndexSM (net total return) (the "Index") returned 31.31% for the year ended October 31, 2024.
The Fund performed in line with the Index, before considering the effects of differences in the Fund’s net asset value calculations versus the Index’s valuation calculations and the timing of foreign exchange rate calculations, as well as operating expenses, fees and tax management of the Fund’s portfolio.
On an absolute basis, the Fund’s largest contributors to returns were its allocations to the financials and information technology sectors, while the sole detractor from returns was its allocation to the health care sector.
| AVERAGE ANNUAL TOTAL RETURNS | INCEPTION
DATE | 1 YEAR | | 5 YEAR | | SINCE
INCEPTION | |
| JPMorgan BetaBuilders Canada ETF - Net Asset Value | August 7, 2018 | 31.51 | % | 10.05 | % | 8.64 | % |
| Morningstar® Canada Target Market Exposure IndexSM (net total return) | | 31.31 | | 9.79 | | 8.37 | |
The performance quoted is past performance and is not a guarantee of future results. Exchange-traded funds are subject to certain market risks. Investment returns and principal value of an investment will fluctuate so that an investor’s shares, when sold or redeemed, may be worth more or less than their original cost. Current performance may be higher or lower than the performance data shown. Updated performance information is available by visiting www.jpmorganfunds.com or by calling 1-844-457-6383.
The graph illustrates comparative performance for $10,000 invested in shares of the JPMorgan BetaBuilders Canada ETF and Morningstar® Canada Target Market Exposure IndexSM (net total return) from August 7, 2018 to October 31, 2024. The performance of the Fund reflects the deduction of Fund expenses and assumes reinvestment of all dividends and capital gain distributions, if any. The performance of the Morningstar® Canada Target Market Exposure IndexSM (net total return) does not reflect the deduction of expenses associated with an exchange-traded fund and has been adjusted to reflect reinvestment of all dividends and capital gain distributions of the securities included in the index, if applicable. The Morningstar® Canada Target Market Exposure IndexSM (net total return) is a rules-based, float-adjusted market capitalization-weighted index designed to cover 85% of the equity float-adjusted market capitalization of the Canadian equity markets. Net total return figures assume the reinvestment of dividends after deduction of withholding tax, applying the maximum rate to nonresident individual investors who do not benefit from double taxation treaties. Investors cannot invest directly in an index.
For periods presented prior to November 1, 2019, the date on which a unitary fee structure was adopted, Fund performance reflects the waiver of the Fund’s fees and reimbursement of expenses for certain periods since the inception date. Without these waivers and reimbursements, performance would have been lower. Also, performance shown in this section does not reflect the deduction of taxes that a shareholder may pay on Fund distributions or on gains resulting from redemption or sale of Fund shares.
The returns shown are based on net asset values calculated for shareholder transactions and may differ from the returns shown in the financial highlights, which reflect adjustments made to the net asset values in accordance with accounting principles generally accepted in the United States of America.
| Fund net assets | $7,177,674,131 | |
| Total number of portfolio holdings | 80 | |
| Portfolio turnover rate | 3 | % |
| Total advisory fees paid | $13,050,370 | |
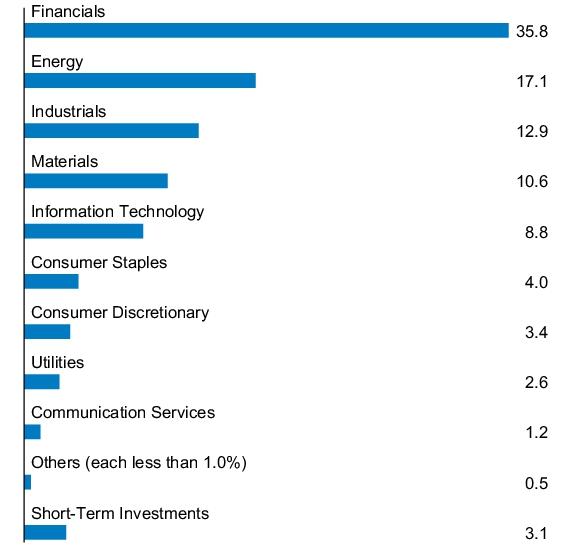
PORTFOLIO COMPOSITION - SECTOR
(% of Total Investments)
Availability of Additional Information
At www.jpmorganfunds.com/funddocuments, you can find additional information about the Fund, including the Fund’s:
Prospectus
Financial information
Fund holdings
Proxy voting information
You can also request this information by contacting us at 1-844-457-6383.
ANNUAL SHAREHOLDER REPORT | October 31, 2024 (Unaudited)
JPMorgan BetaBuilders Developed Asia Pacific ex-Japan ETF
Ticker: BBAX - Cboe BZX Exchange, Inc.
ANNUAL SHAREHOLDER REPORT
This annual shareholder report contains important information about the JPMorgan BetaBuilders Developed Asia Pacific ex-Japan ETF (the "Fund") for the period of November 1, 2023 to October 31, 2024. You can find additional information about the Fund at www.jpmorganfunds.com/funddocuments. You can also request this information by contacting us at 1-844-457-6383 or by sending an e-mail request to jpm.xf@jpmorgan.com or by asking any financial intermediary that offers shares of the Fund.
What were the Fund costs for the last year?
(based on a hypothetical $10,000 investment)
| Fund | Costs of a
$10,000 investment | Costs paid as a percentage
of a $10,000 investment |
| JPMorgan BetaBuilders Developed Asia Pacific ex-Japan ETF | $21 | 0.19% |
How did the Fund Perform?
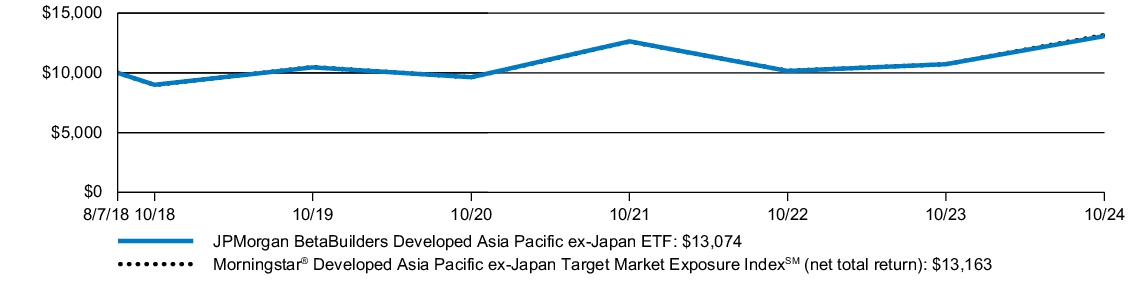
The JPMorgan BetaBuilders Developed Asia Pacific ex-Japan ETF returned 21.92% for the year ended October 31, 2024. The Morningstar® Developed Asia Pacific ex-Japan Target Market Exposure IndexSM (net total return) (the "Index") returned 22.76% for the year ended October 31, 2024.
The Fund performed in line with the Index, before considering the effects of differences in the Fund’s net asset value calculations versus the Index’s valuation calculations and in the timing of foreign exchange rate calculations, as well as operating expenses, fees and tax management of the Fund’s portfolio.
From a sector perspective on an absolute basis, the Fund’s largest contributors to returns were its allocations to the financials and real estate sectors, while its largest detractors from returns were its allocations to the energy and consumer staples sectors.
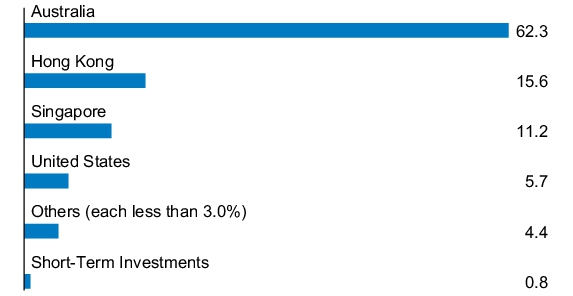
From a country perspective on an absolute basis, the Fund’s largest contributors to returns were its allocations to Australia and Singapore, while its exposures to New Zealand and Hong Kong were the smallest contributors. No country detracted from absolute performance.
| AVERAGE ANNUAL TOTAL RETURNS | INCEPTION
DATE | 1 YEAR | | 5 YEAR | | SINCE
INCEPTION | |
| JPMorgan BetaBuilders Developed Asia Pacific ex-Japan ETF - Net Asset Value | August 7, 2018 | 21.92 | % | 4.56 | % | 4.39 | % |
| Morningstar® Developed Asia Pacific ex-Japan Target Market Exposure IndexSM (net total return) | | 22.76 | | 4.65 | | 4.51 | |
The performance quoted is past performance and is not a guarantee of future results. Exchange-traded funds are subject to certain market risks. Investment returns and principal value of an investment will fluctuate so that an investor’s shares, when sold or redeemed, may be worth more or less than their original cost. Current performance may be higher or lower than the performance data shown. Updated performance information is available by visiting www.jpmorganfunds.com or by calling 1-844-457-6383.
The graph illustrates comparative performance for $10,000 invested in shares of the JPMorgan BetaBuilders Developed Asia Pacific ex-Japan ETF and Morningstar® Developed Asia Pacific ex-Japan Target Market Exposure IndexSM (net total return) from August 7, 2018 to October 31, 2024. The performance of the Fund reflects the deduction of Fund expenses and assumes reinvestment of all dividends and capital gain distributions, if any. The performance of the Morningstar® Developed Asia Pacific ex-Japan Target Market Exposure IndexSM (net total return) does not reflect the deduction of expenses associated with an exchange-traded fund and has been adjusted to reflect reinvestment of all dividends and capital gain distributions of the securities included in the index, if applicable. The Morningstar® Developed Asia Pacific ex-Japan Target Market Exposure IndexSM (net total return) is a rules-based, float-adjusted market capitalization-weighted index designed to cover 85% of the equity float-adjusted market capitalization of the Developed Asia Pacific ex-Japan equity markets. Net total return figures assume the reinvestment of dividends after deduction of withholding tax, applying the maximum rate to nonresident individual investors who do not benefit from double taxation treaties. Investors cannot invest directly in an index.
For periods presented prior to November 1, 2019, the date on which a unitary fee structure was adopted, Fund performance reflects the waiver of the Fund’s fees and reimbursement of expenses for certain periods since the inception date. Without these waivers and reimbursements, performance would have been lower. Also, performance shown in this section does not reflect the deduction of taxes that a shareholder may pay on Fund distributions or on gains resulting from redemption or sale of Fund shares.
The returns shown are based on net asset values calculated for shareholder transactions and may differ from the returns shown in the financial highlights, which reflect adjustments made to the net asset values in accordance with accounting principles generally accepted in the United States of America.
| Fund net assets | $4,650,001,759 | |
| Total number of portfolio holdings | 112 | |
| Portfolio turnover rate | 4 | % |
| Total advisory fees paid | $8,521,830 | |
PORTFOLIO COMPOSITION - COUNTRY
(% of Total Investments)
Availability of Additional Information
At www.jpmorganfunds.com/funddocuments, you can find additional information about the Fund, including the Fund’s:
Prospectus
Financial information
Fund holdings
Proxy voting information
You can also request this information by contacting us at 1-844-457-6383.
ANNUAL SHAREHOLDER REPORT | October 31, 2024 (Unaudited)
JPMorgan BetaBuilders Emerging Markets Equity ETF
Ticker: BBEM - Cboe BZX Exchange, Inc.
ANNUAL SHAREHOLDER REPORT
This annual shareholder report contains important information about the JPMorgan BetaBuilders Emerging Markets Equity ETF (the "Fund") for the period of November 1, 2023 to October 31, 2024. You can find additional information about the Fund at www.jpmorganfunds.com/funddocuments. You can also request this information by contacting us at 1-844-457-6383 or by sending an e-mail request to jpm.xf@jpmorgan.com or by asking any financial intermediary that offers shares of the Fund.
What were the Fund costs for the last year?
(based on a hypothetical $10,000 investment)
| Fund | Costs of a
$10,000 investment | Costs paid as a percentage
of a $10,000 investment |
| JPMorgan BetaBuilders Emerging Markets Equity ETF | $17 | 0.15% |
How did the Fund Perform?
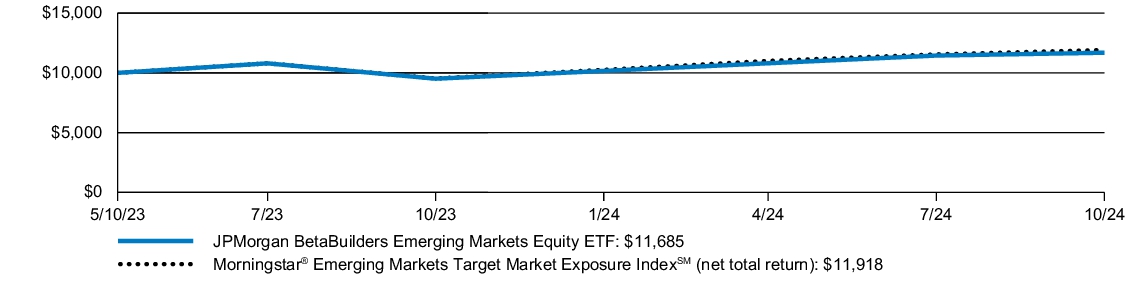
The JPMorgan BetaBuilders Emerging Markets Equity ETF returned 22.84% for the year ended October 31, 2024. The Morningstar® Emerging Markets Target Market Exposure IndexSM (net total return) (the "Index") returned 25.04% for the year ended October 31, 2024.
The Fund performed in line with the Index, before considering the effects of differences in the Fund’s net asset value calculations versus the Index’s valuation calculations and in the timing of foreign exchange rate calculations, as well as operating expenses, fees and tax management of the Fund’s portfolio.
From a sector perspective on an absolute basis, the Fund’s largest contributors to returns were its allocations to the information technology and financials sectors, while its exposures to the real estate and consumer staples sectors were the smallest contributors. No sector detracted from absolute performance.
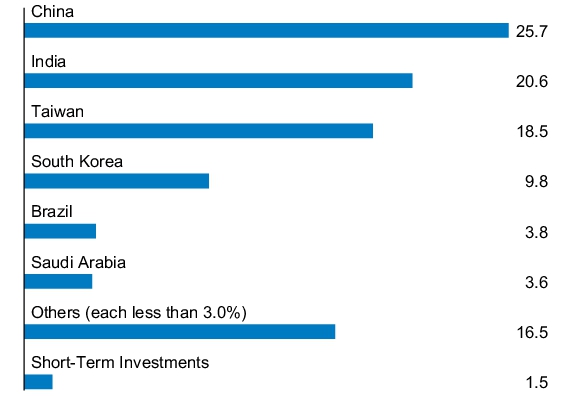
From a country perspective on an absolute basis, the Fund’s largest contributors to returns were its allocations to Taiwan and India, while its exposures to the Czech Republic and Egypt were the smallest contributors. No country detracted from absolute performance.
| AVERAGE ANNUAL TOTAL RETURNS | INCEPTION
DATE | 1 YEAR | | SINCE
INCEPTION | |
| JPMorgan BetaBuilders Emerging Markets Equity ETF - Net Asset Value | May 10, 2023 | 22.84 | % | 11.12 | % |
| Morningstar® Emerging Markets Target Market Exposure IndexSM (net total return) | | 25.04 | | 12.65 | |
The performance quoted is past performance and is not a guarantee of future results. Exchange-traded funds are subject to certain market risks. Investment returns and principal value of an investment will fluctuate so that an investor’s shares, when sold or redeemed, may be worth more or less than their original cost. Current performance may be higher or lower than the performance data shown. Updated performance information is available by visiting www.jpmorganfunds.com or by calling 1-844-457-6383.
The graph illustrates comparative performance for $10,000 invested in shares of the JPMorgan BetaBuilders Emerging Markets Equity ETF and Morningstar® Emerging Markets Target Market Exposure IndexSM (net total return) from May 10, 2023 to October 31, 2024. The performance of the Fund reflects the deduction of Fund expenses and assumes reinvestment of all dividends and capital gain distributions, if any. The performance of the Morningstar® Emerging Markets Target Market Exposure IndexSM (net total return) does not reflect the deduction of expenses associated with an exchange-traded fund and has been adjusted to reflect reinvestment of all dividends and capital gain distributions of the securities included in the index, if applicable. The Morningstar® Emerging Markets Target Market Exposure IndexSM (net total return) is a rules based, float market capitalization-weighted index designed to provide exposure to large and mid-cap stocks in emerging markets representing the top 85% of the investable universe by float-adjusted market capitalization. Net total return figures assume the reinvestment of dividends after deduction of withholding tax, applying the maximum rate to nonresident individual investors who do not benefit from double taxation treaties. Investors cannot invest directly in an index.
Performance shown in this section does not reflect the deduction of taxes that a shareholder may pay on Fund distributions or on gains resulting from redemption or sale of Fund shares.
The returns shown are based on net asset values calculated for shareholder transactions and may differ from the returns shown in the financial highlights, which reflect adjustments made to the net asset values in accordance with accounting principles generally accepted in the United States of America.
| Fund net assets | $610,935,381 | |
| Total number of portfolio holdings | 1,105 | |
| Portfolio turnover rate | 14 | % |
| Total advisory fees paid | $868,580 | |
PORTFOLIO COMPOSITION - COUNTRY
(% of Total Investments)
Availability of Additional Information
At www.jpmorganfunds.com/funddocuments, you can find additional information about the Fund, including the Fund’s:
Prospectus
Financial information
Fund holdings
Proxy voting information
You can also request this information by contacting us at 1-844-457-6383.
ANNUAL SHAREHOLDER REPORT | October 31, 2024 (Unaudited)
JPMorgan BetaBuilders Europe ETF
Ticker: BBEU - Cboe BZX Exchange, Inc.
ANNUAL SHAREHOLDER REPORT
This annual shareholder report contains important information about the JPMorgan BetaBuilders Europe ETF (the "Fund") for the period of November 1, 2023 to October 31, 2024. You can find additional information about the Fund at www.jpmorganfunds.com/funddocuments. You can also request this information by contacting us at 1-844-457-6383 or by sending an e-mail request to jpm.xf@jpmorgan.com or by asking any financial intermediary that offers shares of the Fund.
This report describes changes to the Fund that occurred during the reporting period.
What were the Fund costs for the last year?
(based on a hypothetical $10,000 investment)
| Fund | Costs of a
$10,000 investment | Costs paid as a percentage
of a $10,000 investment |
| JPMorgan BetaBuilders Europe ETF | $10 | 0.09% |
How did the Fund Perform?
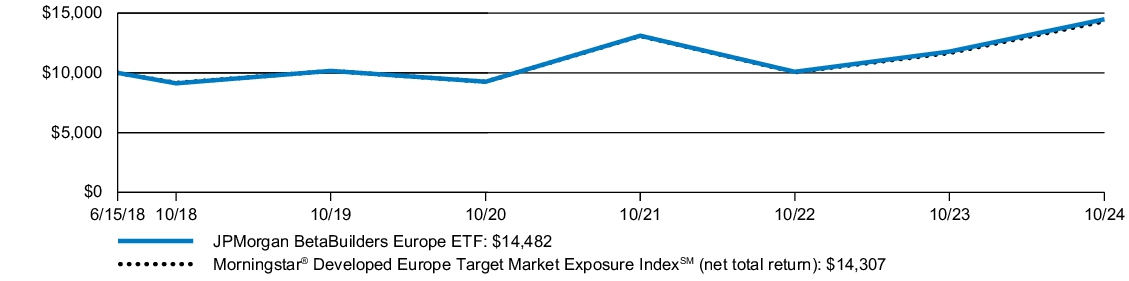
The JPMorgan BetaBuilders Europe ETF returned 22.93% for the year ended October 31, 2024. The Morningstar® Developed Europe Target Market Exposure IndexSM (net total return) (the "Index") returned 22.72% for the year ended October 31, 2024.
The Fund performed in line with the Index, before considering the effects of differences in the Fund’s net asset value calculations versus the Index’s valuation calculations and in the timing of foreign exchange rate calculations, as well as operating expenses, fees and tax management of the Fund’s portfolio.
From a sector perspective on an absolute basis, the Fund’s largest contributors to returns were its allocations to the financials and industrials sectors, while the sole detractor from returns was its allocation to the energy sector.
From a country perspective on an absolute basis, the Fund’s largest contributors to returns were its allocations to Germany and the United Kingdom, while the sole detractor from returns was its allocation to Portugal.
| AVERAGE ANNUAL TOTAL RETURNS | INCEPTION
DATE | 1 YEAR | | 5 YEAR | | SINCE
INCEPTION | |
| JPMorgan BetaBuilders Europe ETF - Net Asset Value | June 15, 2018 | 22.93 | % | 7.33 | % | 5.98 | % |
| Morningstar® Developed Europe Target Market Exposure IndexSM (net total return) | | 22.72 | | 7.08 | | 5.78 | |
The performance quoted is past performance and is not a guarantee of future results. Exchange-traded funds are subject to certain market risks. Investment returns and principal value of an investment will fluctuate so that an investor’s shares, when sold or redeemed, may be worth more or less than their original cost. Current performance may be higher or lower than the performance data shown. Updated performance information is available by visiting www.jpmorganfunds.com or by calling 1-844-457-6383.
The graph illustrates comparative performance for $10,000 invested in shares of the JPMorgan BetaBuilders Europe ETF and Morningstar® Developed Europe Target Market Exposure IndexSM (net total return) from June 15, 2018 to October 31, 2024. The performance of the Fund reflects the deduction of Fund expenses and assumes reinvestment of all dividends and capital gain distributions, if any. The performance of the Morningstar® Developed Europe Target Market Exposure IndexSM (net total return) does not reflect the deduction of expenses associated with an exchange-traded fund and has been adjusted to reflect reinvestment of all dividends and capital gain distributions of the securities included in the index, if applicable. Morningstar® Developed Europe Target Market Exposure IndexSM (net total return) is a rules-based, float-adjusted market capitalization-weighted index designed to cover 85% of the equity float-adjusted market capitalization of the Developed Europe equity markets. Net total return figures assume the reinvestment of dividends after deduction of withholding tax, applying the maximum rate to nonresident individual investors who do not benefit from double taxation treaties. Investors cannot invest directly in an index.
For periods presented prior to November 1, 2019, the date on which a unitary fee structure was adopted, Fund performance reflects the waiver of the Fund’s fees and reimbursement of expenses for certain periods since the inception date. Without these waivers and reimbursements, performance would have been lower. Also, performance shown in this section does not reflect the deduction of taxes that a shareholder may pay on Fund distributions or on gains resulting from redemption or sale of Fund shares.
The returns shown are based on net asset values calculated for shareholder transactions and may differ from the returns shown in the financial highlights, which reflect adjustments made to the net asset values in accordance with accounting principles generally accepted in the United States of America.
| Fund net assets | $6,676,826,411 | |
| Total number of portfolio holdings | 426 | |
| Portfolio turnover rate | 7 | % |
| Total advisory fees paid | $6,333,098 | |
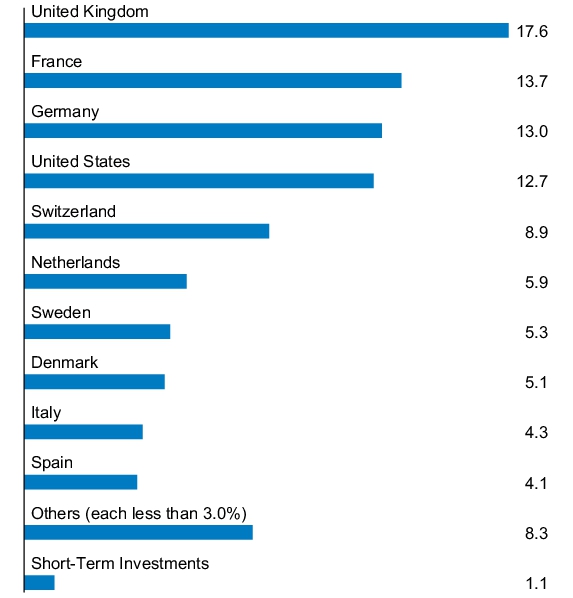
PORTFOLIO COMPOSITION - COUNTRY
(% of Total Investments)
Material changes to the Fund during the period
The Fund added “Industrials Sector Risk” disclosure to its summary prospectus as of March 1, 2024. This disclosure was added in light of larger concentrations of portfolio securities in this sector.
This is a summary of certain changes to the Fund since November 1, 2023. For more complete information, you may review the Fund’s prospectus at www.jpmorganfunds.com/funddocuments or upon request at 1-844-457-6383.
Availability of Additional Information
At www.jpmorganfunds.com/funddocuments, you can find additional information about the Fund, including the Fund’s:
Prospectus
Financial information
Fund holdings
Proxy voting information
You can also request this information by contacting us at 1-844-457-6383.
ANNUAL SHAREHOLDER REPORT | October 31, 2024 (Unaudited)
JPMorgan BetaBuilders International Equity ETF
Ticker: BBIN - Cboe BZX Exchange, Inc.
ANNUAL SHAREHOLDER REPORT
This annual shareholder report contains important information about the JPMorgan BetaBuilders International Equity ETF (the "Fund") for the period of November 1, 2023 to October 31, 2024. You can find additional information about the Fund at www.jpmorganfunds.com/funddocuments. You can also request this information by contacting us at 1-844-457-6383 or by sending an e-mail request to jpm.xf@jpmorgan.com or by asking any financial intermediary that offers shares of the Fund.
What were the Fund costs for the last year?
(based on a hypothetical $10,000 investment)
| Fund | Costs of a
$10,000 investment | Costs paid as a percentage
of a $10,000 investment |
| JPMorgan BetaBuilders International Equity ETF | $8 | 0.07% |
How did the Fund Perform?
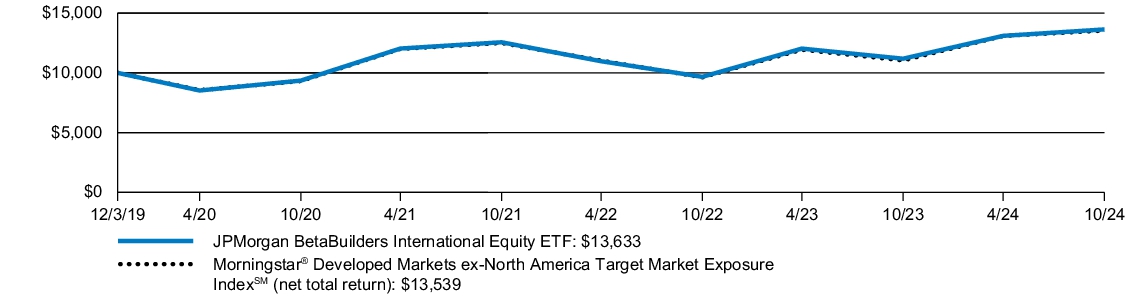
The JPMorgan BetaBuilders International Equity ETF returned 21.88% for the year ended October 31, 2024. The Morningstar® Developed Markets ex-North America Target Market Exposure IndexSM (net total return) (the "Index") returned 22.65% for the year ended October 31, 2024.
The Fund performed in line with the Index, before considering the effects of differences in the Fund’s net asset value calculations versus the Index’s valuation calculations and in the timing of foreign exchange rate calculations, as well as operating expenses, fees and tax management of the Fund’s portfolio.
From a sector perspective on an absolute basis, the Fund’s largest contributors to returns were its allocations to the financials and industrials sectors, while the sole detractor from returns was its allocation to the energy sector.
From a country perspective on an absolute basis, the Fund’s largest contributors to returns were its allocations to Japan and Germany, while the sole detractor from returns was its allocation to Portugal.
| AVERAGE ANNUAL TOTAL RETURNS | INCEPTION
DATE | 1 YEAR | | SINCE
INCEPTION | |
| JPMorgan BetaBuilders International Equity ETF - Net Asset Value | December 3, 2019 | 21.88 | % | 6.51 | % |
| Morningstar® Developed Markets ex-North America Target Market Exposure IndexSM (net total return) | | 22.65 | | 6.37 | |
The performance quoted is past performance and is not a guarantee of future results. Exchange-traded funds are subject to certain market risks. Investment returns and principal value of an investment will fluctuate so that an investor’s shares, when sold or redeemed, may be worth more or less than their original cost. Current performance may be higher or lower than the performance data shown. Updated performance information is available by visiting www.jpmorganfunds.com or by calling 1-844-457-6383.
The graph illustrates comparative performance for $10,000 invested in shares of the JPMorgan BetaBuilders International Equity ETF and Morningstar® Developed Markets ex-North America Target Market Exposure IndexSM (net total return) from December 3, 2019 to October 31, 2024. The performance of the Fund reflects the deduction of Fund expenses and assumes reinvestment of all dividends and capital gain distributions, if any. The performance of the Morningstar® Developed Markets ex-North America Target Market Exposure IndexSM (net total return) does not reflect the deduction of expenses associated with an exchange-traded fund and has been adjusted to reflect reinvestment of all dividends and capital gain distributions of the securities included in the index, if applicable. The Morningstar® Developed Markets ex-North America Target Market Exposure IndexSM (net total return) is a rules-based, float-adjusted market capitalization-weighted index designed to cover 85% of the equity float-adjusted market capitalization of the Developed Markets ex-North America equity markets. Net total return figures assume the reinvestment of dividends after deduction of withholding tax, applying the maximum rate to nonresident individual investors who do not benefit from double taxation treaties. Investors cannot invest directly in an index. Also, performance shown in this section does not reflect the deduction of taxes that a shareholder may pay on Fund distributions or on gains resulting from redemption or sale of Fund shares.
Performance shown in this section does not reflect the deduction of taxes that a shareholder may pay on Fund distributions or on gains resulting from redemption or sale of Fund shares.
The returns shown are based on net asset values calculated for shareholder transactions and may differ from the returns shown in the financial highlights, which reflect adjustments made to the net asset values in accordance with accounting principles generally accepted in the United States of America.
| Fund net assets | $4,768,017,540 | |
| Total number of portfolio holdings | 768 | |
| Portfolio turnover rate | 5 | % |
| Total advisory fees paid | $2,908,845 | |
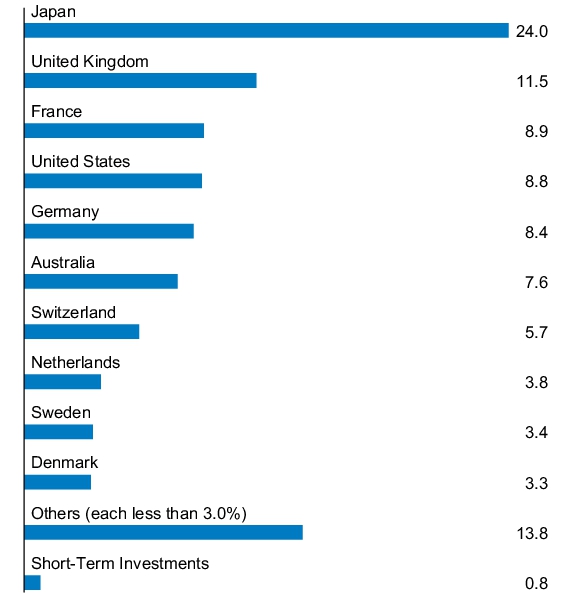
PORTFOLIO COMPOSITION - COUNTRY
(% of Total Investments)
Availability of Additional Information
At www.jpmorganfunds.com/funddocuments, you can find additional information about the Fund, including the Fund’s:
Prospectus
Financial information
Fund holdings
Proxy voting information
You can also request this information by contacting us at 1-844-457-6383.
ANNUAL SHAREHOLDER REPORT | October 31, 2024 (Unaudited)
JPMorgan BetaBuilders Japan ETF
Ticker: BBJP - Cboe BZX Exchange, Inc.
ANNUAL SHAREHOLDER REPORT
This annual shareholder report contains important information about the JPMorgan BetaBuilders Japan ETF (the "Fund") for the period of November 1, 2023 to October 31, 2024. You can find additional information about the Fund at www.jpmorganfunds.com/funddocuments. You can also request this information by contacting us at 1-844-457-6383 or by sending an e-mail request to jpm.xf@jpmorgan.com or by asking any financial intermediary that offers shares of the Fund.
What were the Fund costs for the last year?
(based on a hypothetical $10,000 investment)
| Fund | Costs of a
$10,000 investment | Costs paid as a percentage
of a $10,000 investment |
| JPMorgan BetaBuilders Japan ETF | $21 | 0.19% |
How did the Fund Perform?
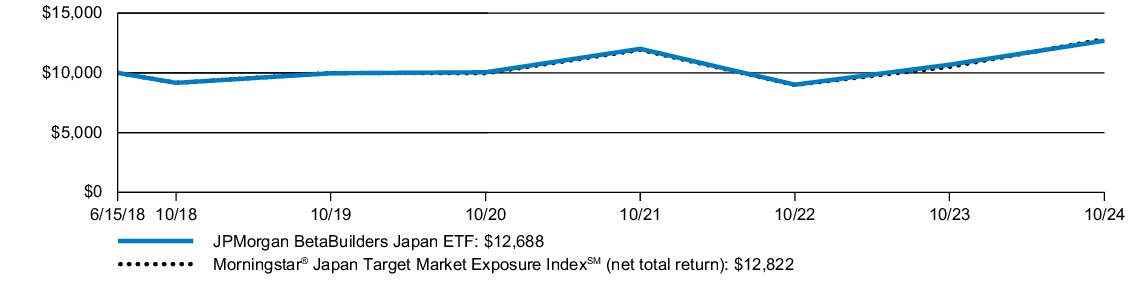
The JPMorgan BetaBuilders Japan ETF returned 18.79% for the year ended October 31, 2024. The Morningstar® Japan Target Market Exposure IndexSM (net total return) (the "Index") returned 22.13% for the year ended October 31, 2024.
The Fund performed in line with the Index, before considering the effects of differences in the Fund’s net asset value calculations versus the Index’s valuation calculations and in the timing of foreign exchange rate calculations, as well as operating expenses, fees and tax management of the Fund’s portfolio.
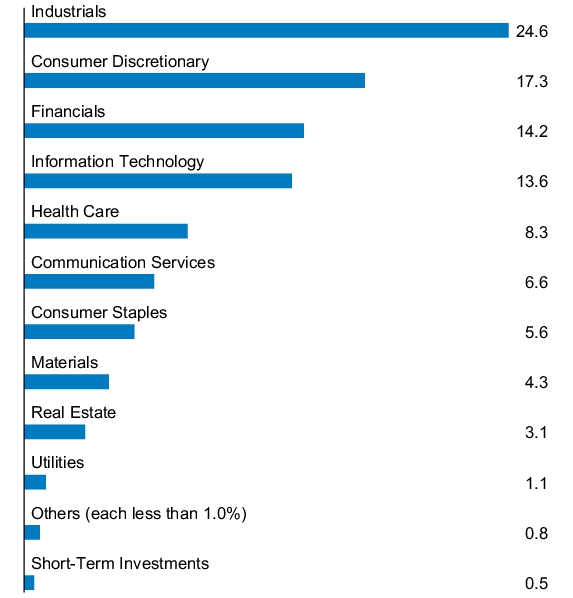
On an absolute basis, the Fund’s largest contributors to returns were its allocations to the industrials and financials sectors, while its exposures to the utilities and energy sectors were the smallest contributors. No sector detracted from absolute performance.
| AVERAGE ANNUAL TOTAL RETURNS | INCEPTION
DATE | 1 YEAR | | 5 YEAR | | SINCE
INCEPTION | |
| JPMorgan BetaBuilders Japan ETF - Net Asset Value | June 15, 2018 | 18.79 | % | 4.95 | % | 3.80 | % |
| Morningstar® Japan Target Market Exposure IndexSM (net total return) | | 22.13 | | 5.12 | | 3.98 | |
The performance quoted is past performance and is not a guarantee of future results. Exchange-traded funds are subject to certain market risks. Investment returns and principal value of an investment will fluctuate so that an investor’s shares, when sold or redeemed, may be worth more or less than their original cost. Current performance may be higher or lower than the performance data shown. Updated performance information is available by visiting www.jpmorganfunds.com or by calling 1-844-457-6383.
The graph illustrates comparative performance for $10,000 invested in shares of the JPMorgan BetaBuilders Japan ETF and Morningstar® Japan Target Market Exposure IndexSM (net total return) from June 15, 2018 to October 31, 2024. The performance of the Fund reflects the deduction of Fund expenses and assumes reinvestment of all dividends and capital gain distributions, if any. The performance of the Morningstar® Japan Target Market Exposure IndexSM (net total return) does not reflect the deduction of expenses associated with an exchange-traded fund and has been adjusted to reflect reinvestment of all dividends and capital gain distributions of the securities included in the index, if applicable. Morningstar® Japan Target Market Exposure IndexSM (net total return) is a rule based, float-adjusted market capitalization-weighted index designed to cover 85% of the equity float-adjusted market capitalization of the Japanese equity markets. Net total return figures assume the reinvestment of dividends after deduction of withholding tax, applying the maximum rate to nonresident individual investors who do not benefit from double taxation treaties. Investors cannot invest directly in an index.
For periods presented prior to November 1, 2019, the date on which a unitary fee structure was adopted, Fund performance reflects the waiver of the Fund’s fees and reimbursement of expenses for certain periods since the inception date. Without these waivers and reimbursements, performance would have been lower. Also, performance shown in this section does not reflect the deduction of taxes that a shareholder may pay on Fund distributions or on gains resulting from redemption or sale of Fund shares.
The returns shown are based on net asset values calculated for shareholder transactions and may differ from the returns shown in the financial highlights, which reflect adjustments made to the net asset values in accordance with accounting principles generally accepted in the United States of America.
| Fund net assets | $11,774,922,485 | |
| Total number of portfolio holdings | 226 | |
| Portfolio turnover rate | 5 | % |
| Total advisory fees paid | $21,274,025 | |
PORTFOLIO COMPOSITION - SECTOR
(% of Total Investments)
Availability of Additional Information
At www.jpmorganfunds.com/funddocuments, you can find additional information about the Fund, including the Fund’s:
Prospectus
Financial information
Fund holdings
Proxy voting information
You can also request this information by contacting us at 1-844-457-6383.
ANNUAL SHAREHOLDER REPORT | October 31, 2024 (Unaudited)
JPMorgan BetaBuilders U.S. Equity ETF
Ticker: BBUS - Cboe BZX Exchange, Inc.
ANNUAL SHAREHOLDER REPORT
This annual shareholder report contains important information about the JPMorgan BetaBuilders U.S. Equity ETF (the "Fund") for the period of November 1, 2023 to October 31, 2024. You can find additional information about the Fund at www.jpmorganfunds.com/funddocuments. You can also request this information by contacting us at 1-844-457-6383 or by sending an e-mail request to jpm.xf@jpmorgan.com or by asking any financial intermediary that offers shares of the Fund.
What were the Fund costs for the last year?
(based on a hypothetical $10,000 investment)
| Fund | Costs of a
$10,000 investment | Costs paid as a percentage
of a $10,000 investment |
| JPMorgan BetaBuilders U.S. Equity ETF | $2 | 0.02% |
How did the Fund Perform?
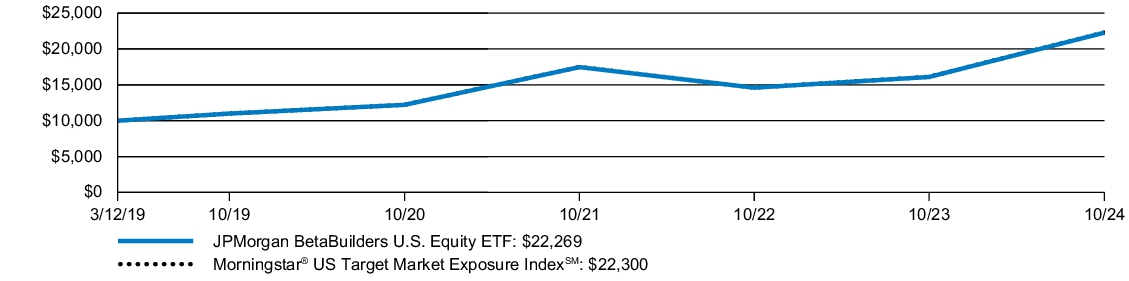
The JPMorgan BetaBuilders U.S. Equity ETF returned 38.35% for the year ended October 31, 2024. The Morningstar® US Target Market Exposure IndexSM (the "Index") returned 38.35% for the year ended October 31, 2024.
The Fund performed in line with the Index, before considering the effects of operating expenses, fees and tax management of the Fund’s portfolio.
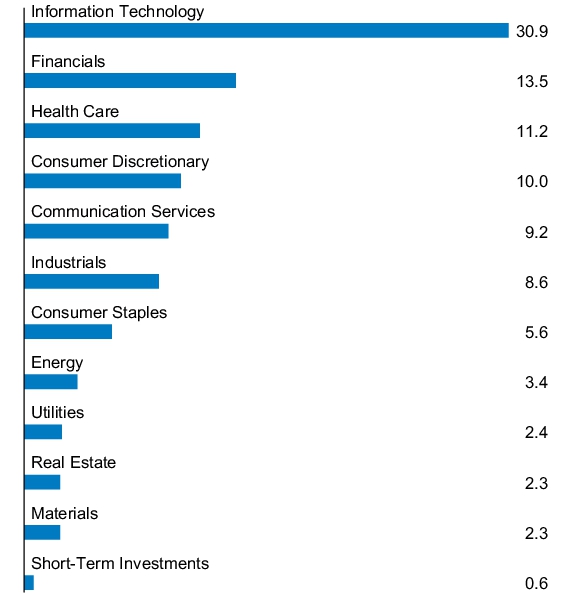
On an absolute basis, the Fund’s largest contributors to returns were its allocations to the information technology and financials sectors, while its exposures to the energy and materials sectors were the smallest contributors. No sector detracted from absolute performance.
| AVERAGE ANNUAL TOTAL RETURNS | INCEPTION
DATE | 1 YEAR | | 5 YEAR | | SINCE
INCEPTION | |
| JPMorgan BetaBuilders U.S. Equity ETF - Net Asset Value | March 12, 2019 | 38.35 | % | 15.16 | % | 15.26 | % |
| Morningstar® US Target Market Exposure IndexSM | | 38.35 | | 15.19 | | 15.30 | |
The performance quoted is past performance and is not a guarantee of future results. Exchange-traded funds are subject to certain market risks. Investment returns and principal value of an investment will fluctuate so that an investor’s shares, when sold or redeemed, may be worth more or less than their original cost. Current performance may be higher or lower than the performance data shown. Updated performance information is available by visiting www.jpmorganfunds.com or by calling 1-844-457-6383.
The graph illustrates comparative performance for $10,000 invested in shares of the JPMorgan BetaBuilders U.S. Equity ETF and the Morningstar® US Target Market Exposure IndexSM from March 12, 2019 to October 31, 2024. The performance of the Fund reflects the deduction of Fund expenses and assumes reinvestment of all dividends and capital gain distributions, if any. The performance of the Morningstar® US Target Market Exposure IndexSM does not reflect the deduction of expenses associated with an exchange-traded fund and has been adjusted to reflect reinvestment of all dividends and capital gain distributions of the securities included in the index, if applicable. Morningstar® US Target Market Exposure IndexSM is a free float-adjusted market capitalization-weighted index which consists of stocks traded primarily on the U.S. stock exchanges. Investors cannot invest directly in an index.
Performance shown in this section does not reflect the deduction of taxes that a shareholder may pay on Fund distributions or on gains resulting from redemption or sale of Fund shares.
The returns shown are based on net asset values calculated for shareholder transactions and may differ from the returns shown in the financial highlights, which reflect adjustments made to the net asset values in accordance with accounting principles generally accepted in the United States of America.
| Fund net assets | $4,014,252,721 | |
| Total number of portfolio holdings | 558 | |
| Portfolio turnover rate | 3 | % |
| Total advisory fees paid | $612,905 | |
PORTFOLIO COMPOSITION - SECTOR
(% of Total Investments)
Availability of Additional Information
At www.jpmorganfunds.com/funddocuments, you can find additional information about the Fund, including the Fund’s:
Prospectus
Financial information
Fund holdings
Proxy voting information
You can also request this information by contacting us at 1-844-457-6383.
ANNUAL SHAREHOLDER REPORT | October 31, 2024 (Unaudited)
JPMorgan BetaBuilders U.S. Mid Cap Equity ETF
Ticker: BBMC - NYSE Arca, Inc.
ANNUAL SHAREHOLDER REPORT
This annual shareholder report contains important information about the JPMorgan BetaBuilders U.S. Mid Cap Equity ETF (the "Fund") for the period of November 1, 2023 to October 31, 2024. You can find additional information about the Fund at www.jpmorganfunds.com/funddocuments. You can also request this information by contacting us at 1-844-457-6383 or by sending an e-mail request to jpm.xf@jpmorgan.com or by asking any financial intermediary that offers shares of the Fund.
This report describes changes to the Fund that occurred during the reporting period.
What were the Fund costs for the last year?
(based on a hypothetical $10,000 investment)
| Fund | Costs of a
$10,000 investment | Costs paid as a percentage
of a $10,000 investment |
| JPMorgan BetaBuilders U.S. Mid Cap Equity ETF | $8 | 0.07% |
How did the Fund Perform?
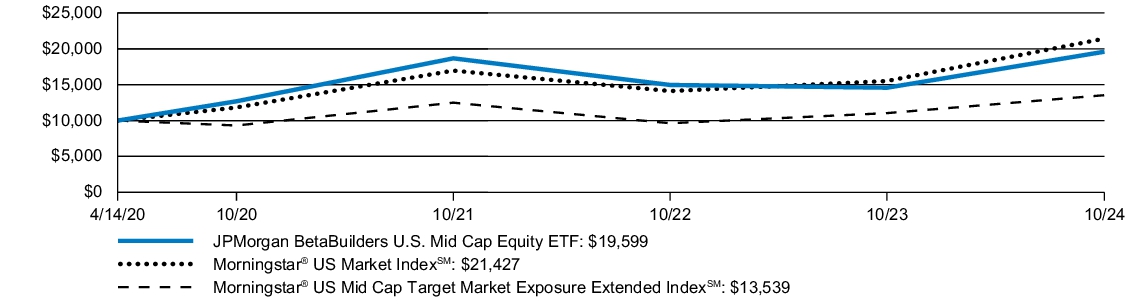
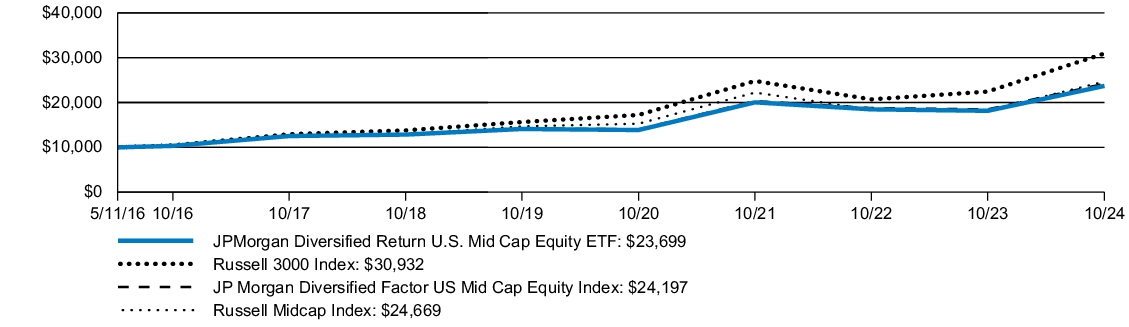
The JPMorgan BetaBuilders U.S. Mid Cap Equity ETF returned 34.43% for the year ended October 31, 2024. The Morningstar® US Market IndexSM returned 38.09% and the Morningstar® US Mid Cap Target Market Exposure Extended IndexSM (the "Index") returned 34.49% for the year ended October 31, 2024.
The Fund performed in line with the Index, before considering the effects of operating expenses, fees and tax management of the Fund’s portfolio.
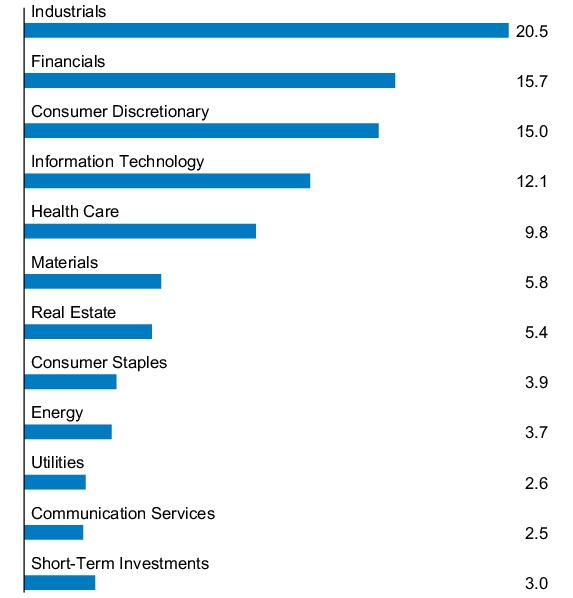
On an absolute basis, the Fund’s largest contributors to returns were its allocations to the industrials and financials sectors, while its sole detractor from returns was its allocation to the energy sector.
| AVERAGE ANNUAL TOTAL RETURNS | INCEPTION
DATE | 1 YEAR | | SINCE
INCEPTION | |
| JPMorgan BetaBuilders U.S. Mid Cap Equity ETF - Net Asset Value | April 14, 2020 | 34.43 | % | 15.95 | % |
| Morningstar® US Market IndexSM | | 38.09 | | 18.26 | |
| Morningstar® US Mid Cap Target Market Exposure Extended IndexSM | | 34.49 | | 15.99 | |
The performance quoted is past performance and is not a guarantee of future results. Exchange-traded funds are subject to certain market risks. Investment returns and principal value of an investment will fluctuate so that an investor’s shares, when sold or redeemed, may be worth more or less than their original cost. Current performance may be higher or lower than the performance data shown. Updated performance information is available by visiting www.jpmorganfunds.com or by calling 1-844-457-6383.
The graph illustrates comparative performance for $10,000 invested in shares of the JPMorgan BetaBuilders U.S. Mid Cap Equity ETF, Morningstar® US Market IndexSM and Morningstar® US Mid Cap Target Market Exposure Extended IndexSM from April 14, 2020 to October 31, 2024. The performance of the Fund reflects the deduction of Fund expenses and assumes reinvestment of all dividends and capital gain distributions, if any. The performance of the Morningstar® US Market IndexSM and Morningstar® US Mid Cap Target Market Exposure Extended IndexSM do not reflect the deduction of expenses associated with an exchange-traded fund and has been adjusted to reflect reinvestment of all dividends and capital gain distributions of the securities included in the index, if applicable. The Morningstar® US Market IndexSM is a float market capitalization-weighted index designed to provide exposure to large- , mid- and small- cap U.S. stocks representing the top 97% of the investable universe by market capitalization. The Morningstar® US Mid Cap Target Market Exposure Extended IndexSM is a free float adjusted market capitalization weighted index that consists of mid cap U.S. equity securities. Investors cannot invest directly in an index. As a result of new regulatory requirements, effective July 24, 2024, the Fund’s regulatory index has changed from the Index, as defined above, to the Morningstar® US Market IndexSM, a broad-based securities market index. In addition to the Fund’s performance, the tables in this section include performance of the new regulatory index and the Index.
Performance shown in this section does not reflect the deduction of taxes that a shareholder may pay on Fund distributions or on gains resulting from redemption or sale of Fund shares.
The returns shown are based on net asset values calculated for shareholder transactions and may differ from the returns shown in the financial highlights, which reflect adjustments made to the net asset values in accordance with accounting principles generally accepted in the United States of America.
| Fund net assets | $1,763,249,803 | |
| Total number of portfolio holdings | 595 | |
| Portfolio turnover rate | 13 | % |
| Total advisory fees paid | $1,148,824 | |
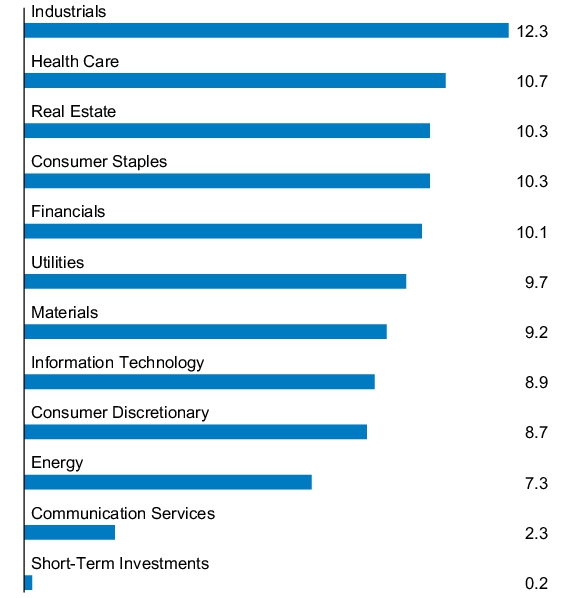
PORTFOLIO COMPOSITION - SECTOR
(% of Total Investments)
Material changes to the Fund during the period
The Fund added “Consumer Discretionary Sector Risk” disclosure to its summary prospectus as of March 1, 2024. This disclosure was added in light of larger concentrations of portfolio securities in this sector.
This is a summary of certain changes to the Fund since November 1, 2023. For more complete information, you may review the Fund’s prospectus at www.jpmorganfunds.com/funddocuments or upon request at 1-844-457-6383.
Availability of Additional Information
At www.jpmorganfunds.com/funddocuments, you can find additional information about the Fund, including the Fund’s:
Prospectus
Financial information
Fund holdings
Proxy voting information
You can also request this information by contacting us at 1-844-457-6383.
ANNUAL SHAREHOLDER REPORT | October 31, 2024 (Unaudited)
JPMorgan BetaBuilders U.S. Small Cap Equity ETF
Ticker: BBSC - NYSE Arca, Inc.
ANNUAL SHAREHOLDER REPORT
This annual shareholder report contains important information about the JPMorgan BetaBuilders U.S. Small Cap Equity ETF (the "Fund") for the period of November 1, 2023 to October 31, 2024. You can find additional information about the Fund at www.jpmorganfunds.com/funddocuments. You can also request this information by contacting us at 1-844-457-6383 or by sending an e-mail request to jpm.xf@jpmorgan.com or by asking any financial intermediary that offers shares of the Fund.
What were the Fund costs for the last year?
(based on a hypothetical $10,000 investment)
| Fund | Costs of a
$10,000 investment | Costs paid as a percentage
of a $10,000 investment |
| JPMorgan BetaBuilders U.S. Small Cap Equity ETF | $11 | 0.09% |
How did the Fund Perform?
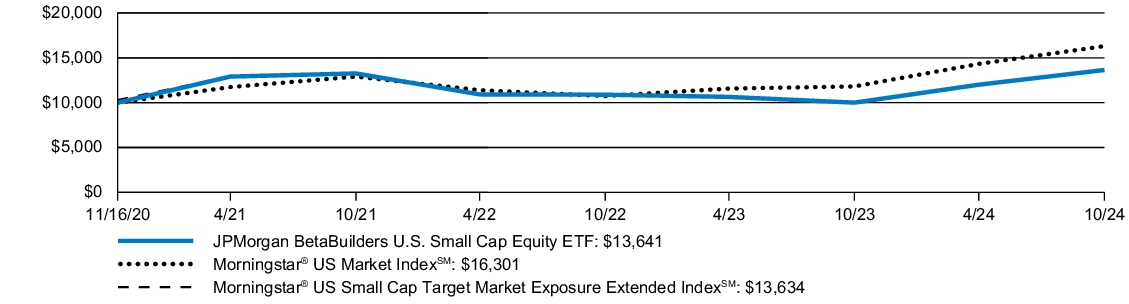
The JPMorgan BetaBuilders U.S. Small Cap Equity ETF returned 36.40% for the year ended October 31, 2024. The Morningstar® US Market IndexSM returned 38.35% and the Morningstar® US Small Cap Target Market Exposure Extended IndexSM (the "Index") returned 36.40% for the year ended October 31, 2024.
The Fund performed in line with the Index, before considering the effects of operating expenses, fees and tax management of the Fund’s portfolio.
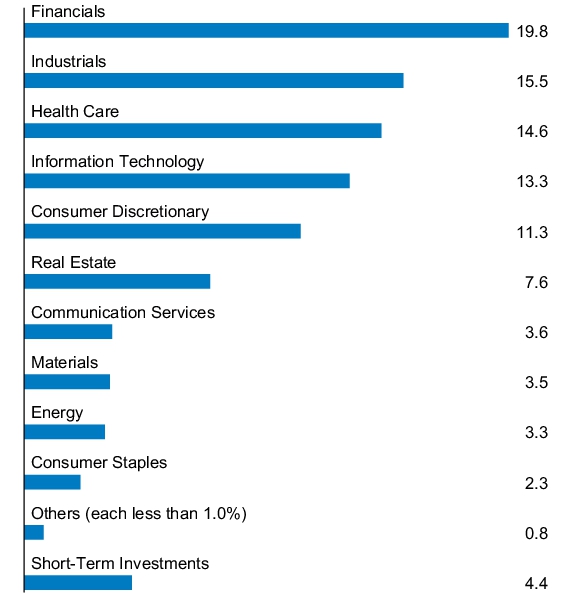
On an absolute basis, the Fund’s largest contributors to returns were its allocations to the financials and industrials sectors, while the sole detractor from returns was its allocation to the energy sector.
| AVERAGE ANNUAL TOTAL RETURNS | INCEPTION
DATE | 1 YEAR | | SINCE
INCEPTION | |
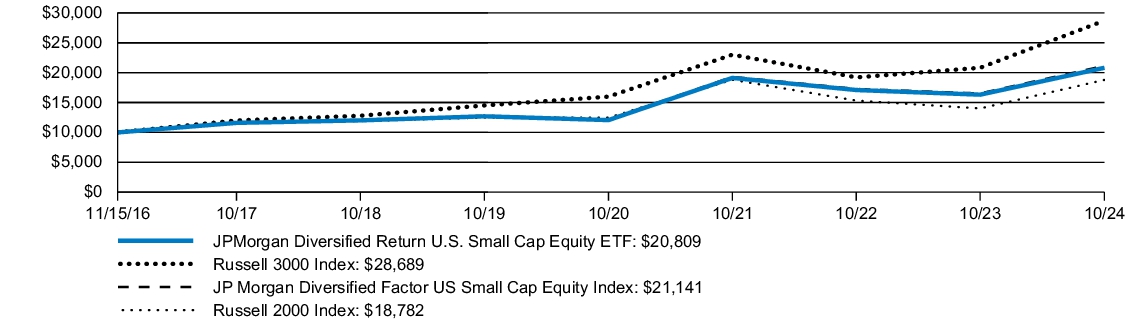
| JPMorgan BetaBuilders U.S. Small Cap Equity ETF - Net Asset Value | November 16, 2020 | 36.40 | % | 8.16 | % |
| Morningstar® US Market IndexSM | | 38.35 | | 13.41 | |
| Morningstar® US Small Cap Target Market Exposure Extended IndexSM | | 36.40 | | 8.15 | |
The performance quoted is past performance and is not a guarantee of future results. Exchange-traded funds are subject to certain market risks. Investment returns and principal value of an investment will fluctuate so that an investor’s shares, when sold or redeemed, may be worth more or less than their original cost. Current performance may be higher or lower than the performance data shown. Updated performance information is available by visiting www.jpmorganfunds.com or by calling 1-844-457-6383.
The graph illustrates comparative performance for $10,000 invested in shares of the JPMorgan BetaBuilders U.S. Small Cap Equity ETF, Morningstar® US Market IndexSM and Morningstar® US Small Cap Target Market Exposure Extended IndexSM from November 16, 2020 to October 31, 2024. The performance of the Fund reflects the deduction of Fund expenses and assumes reinvestment of all dividends and capital gain distributions, if any. The performance of the Morningstar® US Market IndexSM and Morningstar® US Small Cap Target Market Exposure Extended IndexSM do not reflect the deduction of expenses associated with an exchange-traded fund and has been adjusted to reflect reinvestment of all dividends and capital gain distributions of the securities included in the index, if applicable. The Morningstar® US Market IndexSM is a float market capitalization-weighted index designed to provide exposure to large- , mid- and small- cap U.S. stocks representing the top 97% of the investable universe by market capitalization. The Morningstar® US Small Cap Target Market Exposure Extended IndexSM is a free float-adjusted market capitalization-weighted index that consists of small cap U.S. equity securities. Investors cannot invest directly in an index. As a result of new regulatory requirements, effective July 24, 2024, the Fund’s regulatory index has changed from the Index, as defined above, to the Morningstar® US Market IndexSM, a broad-based securities market index. In addition to the Fund’s performance, the tables in this section include performance of the new regulatory index and the Index.
Performance shown in this section does not reflect the deduction of taxes that a shareholder may pay on Fund distributions or on gains resulting from redemption or sale of Fund shares.
The returns shown are based on net asset values calculated for shareholder transactions and may differ from the returns shown in the financial highlights, which reflect adjustments made to the net asset values in accordance with accounting principles generally accepted in the United States of America.
| Fund net assets | $511,426,837 | |
| Total number of portfolio holdings | 786 | |
| Portfolio turnover rate | 20 | % |
| Total advisory fees paid | $516,569 | |
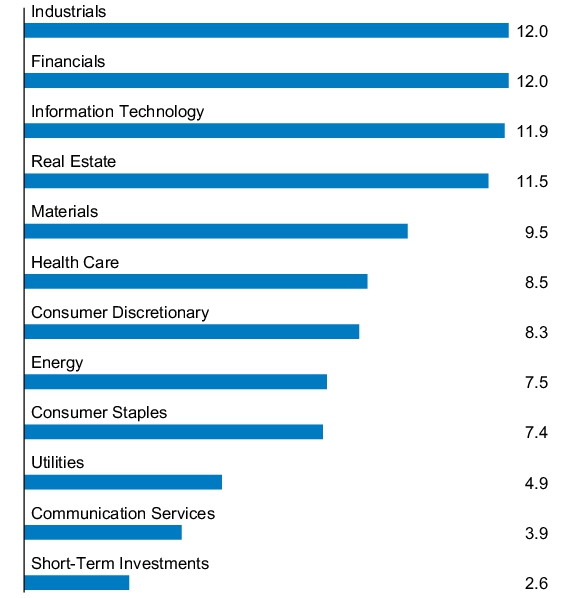
PORTFOLIO COMPOSITION - SECTOR
(% of Total Investments)
Availability of Additional Information
At www.jpmorganfunds.com/funddocuments, you can find additional information about the Fund, including the Fund’s:
Prospectus
Financial information
Fund holdings
Proxy voting information
You can also request this information by contacting us at 1-844-457-6383.
ANNUAL SHAREHOLDER REPORT | October 31, 2024 (Unaudited)
JPMorgan Carbon Transition U.S. Equity ETF
Ticker: JCTR - NYSE Arca, Inc.
ANNUAL SHAREHOLDER REPORT
This annual shareholder report contains important information about the JPMorgan Carbon Transition U.S. Equity ETF (the "Fund") for the period of November 1, 2023 to October 31, 2024. You can find additional information about the Fund at www.jpmorganfunds.com/funddocuments. You can also request this information by contacting us at 1-844-457-6383 or by sending an e-mail request to jpm.xf@jpmorgan.com or by asking any financial intermediary that offers shares of the Fund.
What were the Fund costs for the last year?
(based on a hypothetical $10,000 investment)
| Fund | Costs of a
$10,000 investment | Costs paid as a percentage
of a $10,000 investment |
| JPMorgan Carbon Transition U.S. Equity ETF | $18 | 0.15% |
How did the Fund Perform?
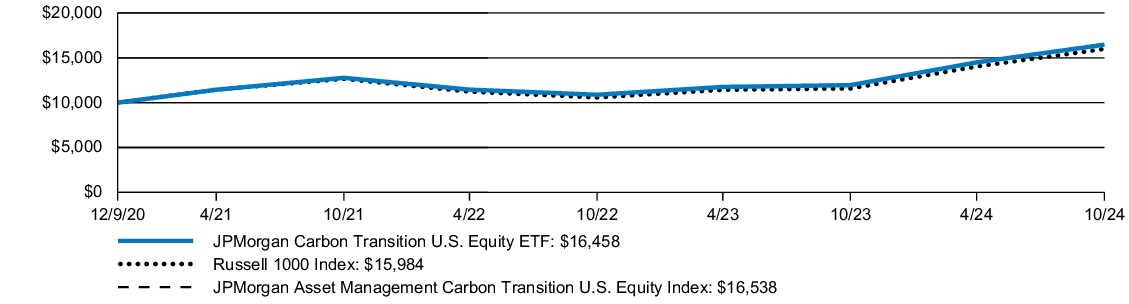
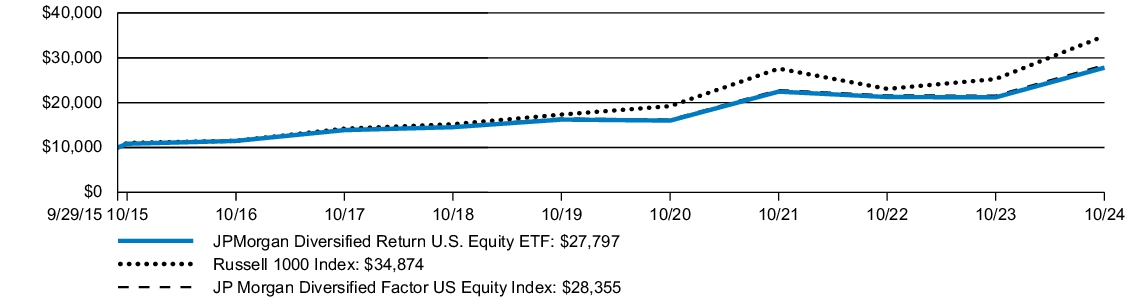
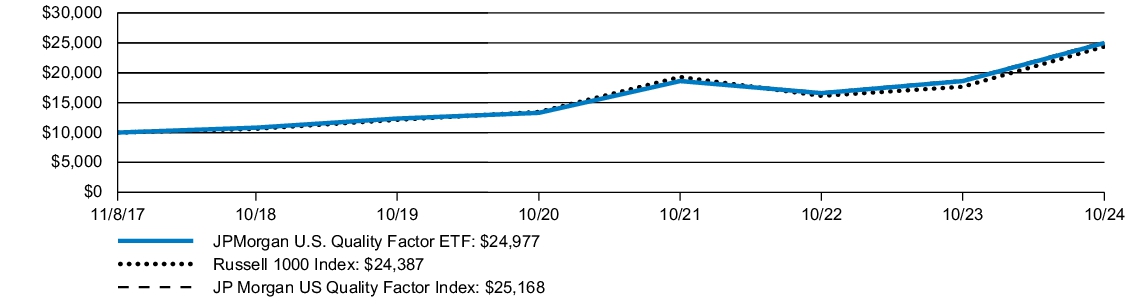
The JPMorgan Carbon Transition U.S. Equity ETF returned 37.71% for the year ended October 31, 2024. The Russell 1000 Index returned 38.07% and the JPMorgan Asset Management Carbon Transition U.S. Equity Index (the "Index") returned 37.80% for the year ended October 31, 2024.
The Fund seeks investment results that closely correspond, before fees and expenses, to the performance of the Index. The Fund performed in line with the Index, before considering operating expenses, fees and tax management of the Fund’s portfolio.
On a relative basis to the Russell 1000 Index, the Fund’s largest contributor to returns was its security selection within the industrials and health care sectors, while its security selection within the utilities and consumer staples sectors was the largest detractor.
| AVERAGE ANNUAL TOTAL RETURNS | INCEPTION
DATE | 1 YEAR | | SINCE
INCEPTION | |
| JPMorgan Carbon Transition U.S. Equity ETF - Net Asset Value | December 9, 2020 | 37.71 | % | 13.65 | % |
| Russell 1000 Index | | 38.07 | | 12.81 | |
| JPMorgan Asset Management Carbon Transition U.S. Equity Index | | 37.80 | | 13.80 | |
The performance quoted is past performance and is not a guarantee of future results. Exchange-traded funds are subject to certain market risks. Investment returns and principal value of an investment will fluctuate so that an investor’s shares, when sold or redeemed, may be worth more or less than their original cost. Current performance may be higher or lower than the performance data shown. Updated performance information is available by visiting www.jpmorganfunds.com or by calling 1-844-457-6383.
The graph illustrates comparative performance for $10,000 invested in shares of the JPMorgan Carbon Transition U.S. Equity ETF, the Russell 1000 Index and the JPMorgan Asset Management Carbon Transition U.S. Equity Index from December 9, 2020 to October 31 2024. The performance of the Fund reflects the deduction of Fund expenses and assumes reinvestment of all dividends and capital gain distributions, if any. The performance of the Russell 1000 Index and JPMorgan Asset Management Carbon Transition U.S. Equity Index does not reflect the deduction of expenses associated with an exchange-traded fund and has been adjusted to reflect reinvestment of all dividends and capital gain distributions of the securities included in the index, if applicable. The Russell 1000 Index is a market capitalization weighted index, which measures the performance of the 1,000 largest companies in the Russell 3000 Index. The JPMorgan Asset Management Carbon Transition U.S. Equity Index is a rules-based, proprietary index designed to achieve a meaningful reduction in carbon intensity without relying on significant exclusions or sector deviations. It is a proprietary index designed to reflect the performance of a subset of the U.S. large and midcap companies in developed markets that, based on the index rules, are determined to be best positioned to benefit from a transition to a low-carbon economy. Investors cannot invest directly in an index. As a result of new regulatory requirements, effective July 24, 2024, the Fund’s regulatory index has changed from the Index, as defined above, to the Russell 1000 Index, a broad-based securities market index. In addition to the Fund’s performance, the tables in this section include performance of the new regulatory index and the Index.
Performance shown in this section does not reflect the deduction of taxes that a shareholder may pay on Fund distributions or on gains resulting from redemption or sale of Fund shares.
The returns shown are based on net asset values calculated for shareholder transactions and may differ from the returns shown in the financial highlights, which reflect adjustments made to the net asset values in accordance with accounting principles generally accepted in the United States of America.
Frank Russell Company is the source and owner of the Russell Index data contained or reflected in this material and all trademarks and copyrights related thereto. Frank Russell Company is not responsible for the formatting or configuration of this material or for any inaccuracy in the adviser's presentation thereof.
| Fund net assets | $7,673,782 | |
| Total number of portfolio holdings | 435 | |
| Portfolio turnover rate | 16 | % |
| Total advisory fees paid | $8,064 | |
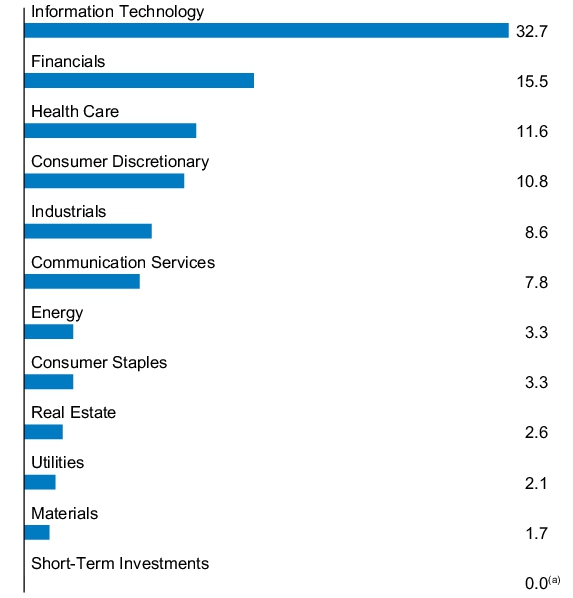
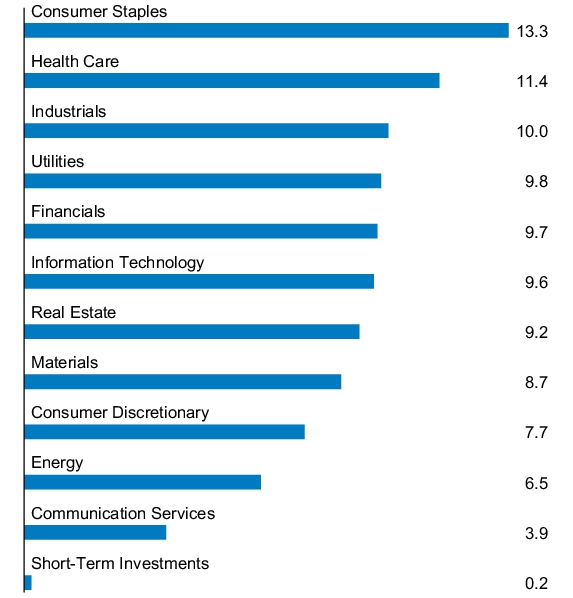
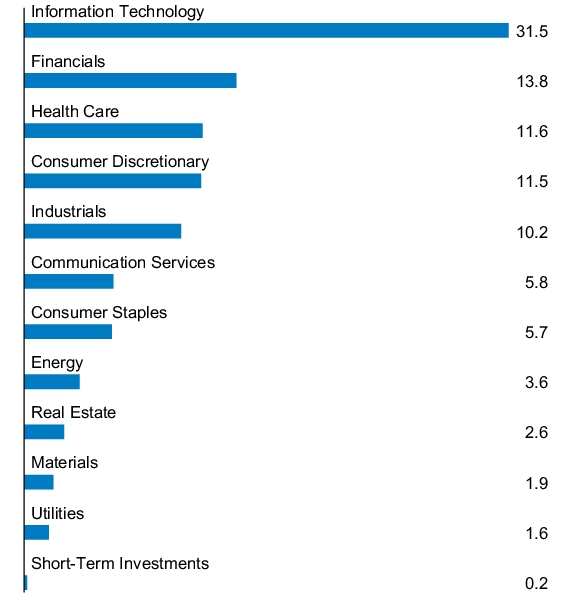
PORTFOLIO COMPOSITION - SECTOR
(% of Total Investments)
| (a) | Amount rounds to less than 0.1%. |
Availability of Additional Information
At www.jpmorganfunds.com/funddocuments, you can find additional information about the Fund, including the Fund’s:
Prospectus
Financial information
Fund holdings
Proxy voting information
You can also request this information by contacting us at 1-844-457-6383.
ANNUAL SHAREHOLDER REPORT | October 31, 2024 (Unaudited)
JPMorgan Climate Change Solutions ETF
Ticker: TEMP - NYSE Arca, Inc.
ANNUAL SHAREHOLDER REPORT
This annual shareholder report contains important information about the JPMorgan Climate Change Solutions ETF (the "Fund") for the period of November 1, 2023 to October 31, 2024. You can find additional information about the Fund at www.jpmorganfunds.com/funddocuments. You can also request this information by contacting us at 1-844-457-6383 or by sending an e-mail request to jpm.xf@jpmorgan.com or by asking any financial intermediary that offers shares of the Fund.
This report describes changes to the Fund that occurred during the reporting period.
What were the Fund costs for the last year?
(based on a hypothetical $10,000 investment)
| Fund | Costs of a
$10,000 investment | Costs paid as a percentage
of a $10,000 investment |
| JPMorgan Climate Change Solutions ETF | $59 | 0.49% |
How did the Fund Perform?
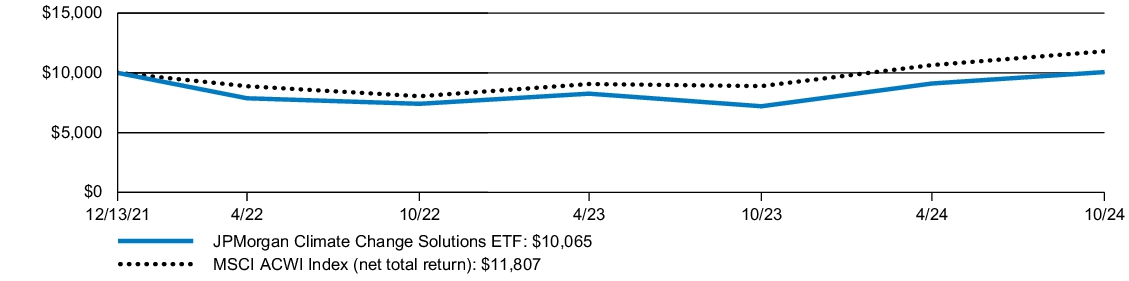
The JPMorgan Climate Change Solutions ETF returned 39.65% for the year ended October 31, 2024. The MSCI ACWI Index (net total return) (the "Index") returned 32.79% for the year ended October 31, 2024.
The Fund’s security selection in the industrials sector contributed to performance relative to the Index.
The Fund’s security selection in the information technology sector detracted from performance relative to the Index.
| AVERAGE ANNUAL TOTAL RETURNS | INCEPTION
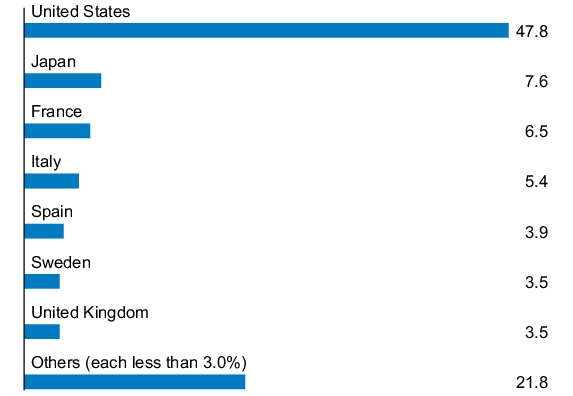
DATE | 1 YEAR | | SINCE
INCEPTION | |
| JPMorgan Climate Change Solutions ETF - Net Asset Value | December 13, 2021 | 39.65 | % | 0.23 | % |
| MSCI ACWI Index (net total return) | | 32.79 | | 5.93 | |
The performance quoted is past performance and is not a guarantee of future results. Exchange-traded funds are subject to certain market risks. Investment returns and principal value of an investment will fluctuate so that an investor’s shares, when sold or redeemed, may be worth more or less than their original cost. Current performance may be higher or lower than the performance data shown. Updated performance information is available by visiting www.jpmorganfunds.com or by calling 1-844-457-6383.
The graph illustrates comparative performance for $10,000 invested in shares of the JPMorgan Climate Change Solutions ETF and the MSCI ACWI Index (net total return) from December 13, 2021 to October 31, 2024. The performance of the Fund reflects the deduction of Fund expenses and assumes reinvestment of all dividends and capital gain distributions, if any. The performance of the MSCI ACWI Index (net total return) does not reflect the deduction of expenses associated with an exchange-traded fund and has been adjusted to reflect reinvestment of all dividends and capital gain distributions of the securities included in the Index, if applicable. The MSCI ACWI Index (net total return) is a free float-adjusted market capitalization-weighted index that is designed to measure the performance of large- and mid-cap stocks in developed and emerging markets. Net total return figures assume the reinvestment of dividends after deduction of withholding tax, applying the maximum rate to nonresident individual investors who do not benefit from double taxation treaties. Investors cannot invest directly in an index.
Performance shown in this section does not reflect the deduction of taxes that a shareholder may pay on Fund distributions or on gains resulting from redemption or sale of Fund shares.
International investing involves a greater degree of risk and increased volatility. Changes in currency exchange rates and differences in accounting and taxation policies outside the United States can raise or lower returns. Also, some overseas markets may not be as politically and economically stable as the United States and other nations.
The returns shown are based on net asset values calculated for shareholder transactions and may differ from the returns shown in the financial highlights, which reflect adjustments made to the net asset values in accordance with accounting principles generally accepted in the United States of America.
Source: MSCI. The MSCI information may only be used for your internal use, may not be reproduced or redisseminated in any form and may not be used as a basis for or a component of any financial instruments or products or indices. None of the MSCI information is intended to constitute investment advice or a recommendation to make (or refrain from making) any kind of investment decision and may not be relied on as such. Historical data and analysis should not be taken as an indication or guarantee of any future performance analysis, forecast, or prediction. The MSCI information is provided on an "as is" basis and the user of this information assumes the entire risk of any use made of this information. MSCI, each of its affiliates and each other person involved in or related to compiling, computing or creating any MSCI information (collectively, the "MSCI Parties") expressly disclaims all warranties (including, without limitation, any warranties of originality, accuracy, completeness, timeliness, non-infringement, merchantability and fitness for a particular purpose) with respect to this information. Without limiting any of the foregoing, in no event shall any MSCI Party have any liability for any direct, indirect, special, incidental, punitive, consequential (including, without limitation, lost profits) or any other damages. (www.msci.com)
| Fund net assets | $15,353,300 | |
| Total number of portfolio holdings | 63 | |
| Portfolio turnover rate | 51 | % |
| Total advisory fees paid | $104,577 | |
PORTFOLIO COMPOSITION - COUNTRY
(% of Total Investments)
Material changes to the Fund during the period
Effective December 13, 2024, the Fund was classified as a diversified investment company rather than a non-diversified investment company.
This is a summary of certain changes to the Fund since November 1, 2023. For more complete information, you may review the Fund’s prospectus at www.jpmorganfunds/com/funddocuments or upon request at 1-844-457-6383.
Availability of Additional Information
At www.jpmorganfunds.com/funddocuments, you can find additional information about the Fund, including the Fund’s:
Prospectus
Financial information
Fund holdings
Proxy voting information
You can also request this information by contacting us at 1-844-457-6383.
ANNUAL SHAREHOLDER REPORT | October 31, 2024 (Unaudited)
JPMorgan Diversified Return Emerging Markets Equity ETF
Ticker: JPEM - NYSE Arca, Inc.
ANNUAL SHAREHOLDER REPORT
This annual shareholder report contains important information about the JPMorgan Diversified Return Emerging Markets Equity ETF (the "Fund") for the period of November 1, 2023 to October 31, 2024. You can find additional information about the Fund at www.jpmorganfunds.com/funddocuments. You can also request this information by contacting us at 1-844-457-6383 or by sending an e-mail request to jpm.xf@jpmorgan.com or by asking any financial intermediary that offers shares of the Fund.
What were the Fund costs for the last year?
(based on a hypothetical $10,000 investment)
| Fund | Costs of a
$10,000 investment | Costs paid as a percentage
of a $10,000 investment |
| JPMorgan Diversified Return Emerging Markets Equity ETF | $48 | 0.44% |
How did the Fund Perform?
The JPMorgan Diversified Return Emerging Markets Equity ETF returned 16.71% for the year ended October 31, 2024. The FTSE Emerging Index (net total return) returned 27.71% and the JP Morgan Diversified Factor Emerging Markets Equity Index (net total return) (the "Index") returned 18.13% for the year ended October 31, 2024.
The Fund seeks investment results that closely correspond, before fees and expenses, to the performance of the Index. The Fund generated a positive absolute return for the twelve months ended October 31, 2024, and differences in net asset value calculations and foreign exchange pricing between the Index and the Fund, and fees and operating expenses incurred by the Fund were responsible for the performance variance.
On a relative basis to the FTSE Emerging Index, the Fund’s and the Index's largest detractors from returns were their underweight positions in the information technology sector and its multi-factor security selection within Asia Pacific ex-China, while their largest contributors to returns were their underweight positions in China and its security selection within Latin America.
| AVERAGE ANNUAL TOTAL RETURNS | INCEPTION
DATE | 1 YEAR | | 5 YEAR | | SINCE
INCEPTION | |
| JPMorgan Diversified Return Emerging Markets Equity ETF - Net Asset Value | January 7, 2015 | 16.71 | % | 4.02 | % | 4.14 | % |
| FTSE Emerging Index (net total return) | | 27.71 | | 5.00 | | 4.82 | |
| JP Morgan Diversified Factor Emerging Markets Equity Index (net total return) | | 18.13 | | 4.69 | | 4.96 | |
The performance quoted is past performance and is not a guarantee of future results. Exchange-traded funds are subject to certain market risks. Investment returns and principal value of an investment will fluctuate so that an investor’s shares, when sold or redeemed, may be worth more or less than their original cost. Current performance may be higher or lower than the performance data shown. Updated performance information is available by visiting www.jpmorganfunds.com or by calling 1-844-457-6383.
The graph illustrates comparative performance for $10,000 invested in shares of the JPMorgan Diversified Return Emerging Markets Equity ETF, the FTSE Emerging Index and the JP Morgan Diversified Factor Emerging Markets Equity Index (net total return) from January 7, 2015 to October 31, 2024. The performance of the Fund reflects the deduction of Fund expenses and assumes reinvestment of all dividends and capital gain distributions, if any. The performance of the FTSE Emerging Index (net total return) and the JP Morgan Diversified Factor Emerging Markets Equity Index (net total return) does not reflect the deduction of expenses associated with an exchange-traded fund and has been adjusted to reflect reinvestment of all dividends and capital gain distributions of the securities included in the index, if applicable. The Fund’s adviser is a sponsor of the JP Morgan Diversified Factor Emerging Markets Equity Index (net total return) and developed the proprietary factors on which the index is based. FTSE Russell, the benchmark administrator, administers, calculates and governs the JP Morgan Diversified Factor Emerging Markets Equity Index (net total return). The FTSE Emerging Index (net total return) provides investors with a comprehensive means of measuring the performance of the most liquid companies in the emerging markets. Net total return figures assume the reinvestment of dividends after deduction of withholding tax, applying the maximum rate to nonresident individual investors who do not benefit from double taxation treaties. JP Morgan Diversified Factor Emerging Markets Equity Index (net total return) is comprised of large- and mid-cap equity securities selected from the FTSE Emerging Index (net total return). The index is designed to reflect the performance of emerging market securities representing the following diversified set of factors: value, momentum and quality. Investors cannot invest directly in an index. As a result of new regulatory requirements, effective July 24, 2024, the Fund’s regulatory index has changed from the Index, as defined above, to the FTSE Emerging Index, a broad-based securities market index. In addition to the Fund’s performance, the tables in this section include performance of the new regulatory index and the Index.
For periods presented prior to November 1, 2019, the date on which a unitary fee structure was adopted, Fund performance reflects the waiver of the Fund’s fees and reimbursement of expenses for certain periods since the inception date. Without these waivers and reimbursements, performance would have been lower. Also, performance shown in this section does not reflect the deduction of taxes that a shareholder may pay on Fund distributions or on gains resulting from redemption or sale of Fund shares.
The returns shown are based on net asset values calculated for shareholder transactions and may differ from the returns shown in the financial highlights, which reflect adjustments made to the net asset values in accordance with accounting principles generally accepted in the United States of America.
| Fund net assets | $322,419,915 | |
| Total number of portfolio holdings | 543 | |
| Portfolio turnover rate | 28 | % |
| Total advisory fees paid | $1,378,704 | |
PORTFOLIO COMPOSITION - COUNTRY
(% of Total Investments)
Availability of Additional Information
At www.jpmorganfunds.com/funddocuments, you can find additional information about the Fund, including the Fund’s:
Prospectus
Financial information
Fund holdings
Proxy voting information
You can also request this information by contacting us at 1-844-457-6383.
ANNUAL SHAREHOLDER REPORT | October 31, 2024 (Unaudited)
JPMorgan Diversified Return International Equity ETF
Ticker: JPIN - NYSE Arca, Inc.
ANNUAL SHAREHOLDER REPORT
This annual shareholder report contains important information about the JPMorgan Diversified Return International Equity ETF (the "Fund") for the period of November 1, 2023 to October 31, 2024. You can find additional information about the Fund at www.jpmorganfunds.com/funddocuments. You can also request this information by contacting us at 1-844-457-6383 or by sending an e-mail request to jpm.xf@jpmorgan.com or by asking any financial intermediary that offers shares of the Fund.
What were the Fund costs for the last year?
(based on a hypothetical $10,000 investment)
| Fund | Costs of a
$10,000 investment | Costs paid as a percentage
of a $10,000 investment |
| JPMorgan Diversified Return International Equity ETF | $41 | 0.37% |
How did the Fund Perform?
The JPMorgan Diversified Return International Equity ETF returned 20.93% for the year ended October 31, 2024. The FTSE Developed ex North America Index (net total return) returned 22.21% and the JP Morgan Diversified Factor International Equity Index (net total return) (the "Index") returned 22.12% for the year ended October 31, 2024.
The Fund seeks investment results that closely correspond, before fees and expenses, to the performance of the Index. The Fund performed in line with the Index, before considering the effects of differences in the Fund’s net asset value calculations versus the Index’s valuation calculations, as well as differences due to specific trading limits, the Fund’s small cash allocation and fees and operating expenses incurred by the Fund.
On a relative basis to the FTSE Developed ex-North America Index, the Fund’s and the Index's largest contributor to returns was their multi-factor security selection in Asia Pacific ex-Japan and within the consumer discretionary sector, while their largest detractors from returns were an underweight position in the financials sector and their multi-factor security selection within Europe ex-United Kingdom.
| AVERAGE ANNUAL TOTAL RETURNS | INCEPTION
DATE | 1 YEAR | | 5 YEAR | | SINCE
INCEPTION | |
| JPMorgan Diversified Return International Equity ETF - Net Asset Value | November 5, 2014 | 20.93 | % | 4.68 | % | 4.47 | % |
| FTSE Developed ex North America Index (net total return) | | 22.21 | | 6.08 | | 5.30 | |
| JP Morgan Diversified Factor International Equity Index (net total return) | | 22.12 | | 4.97 | | 4.81 | |
The performance quoted is past performance and is not a guarantee of future results. Exchange-traded funds are subject to certain market risks. Investment returns and principal value of an investment will fluctuate so that an investor’s shares, when sold or redeemed, may be worth more or less than their original cost. Current performance may be higher or lower than the performance data shown. Updated performance information is available by visiting www.jpmorganfunds.com or by calling 1-844-457-6383.
The graph illustrates comparative performance for $10,000 invested in shares of the JPMorgan Diversified Return International Equity ETF, the FTSE Developed ex North America Index (net total return) and the JP Morgan Diversified Factor International Equity Index (net total return) from November 5, 2014 to October 31, 2024. The performance of the Fund reflects the deduction of Fund expenses and assumes reinvestment of all dividends and capital gain distributions, if any. The performance of the FTSE Developed ex North America Index (net total return) and the JP Morgan Diversified Factor International Equity Index (net total return) does not reflect the deduction of expenses associated with an exchange-traded fund and has been adjusted to reflect reinvestment of all dividends and capital gain distributions of the securities included in the index, if applicable. The Fund’s adviser is a sponsor of the JP Morgan Diversified Factor International Equity Index (net total return) and developed the proprietary factors on which the index is based. FTSE Russell, the benchmark administrator, administers, calculates and governs the JP Morgan Diversified Factor International Equity Index (net total return). The FTSE Developed ex North America Index (net total return) is part of a range of indices designed to help investors benchmark their international investments. The index comprises large- and mid-cap stocks providing coverage of developed markets, excluding the US and Canada. The index is derived from the FTSE Global Equity Index Series (GEIS), which covers 98% of the world's investable market capitalization. Net total return figures assume the reinvestment of dividends after deduction of withholding tax, applying the maximum rate to nonresident individual investors who do not benefit from double taxation treaties. JP Morgan Diversified Factor International Equity Index (net total return) is comprised of large- and mid-cap equity securities selected from the FTSE Developed ex North America Index (net total return). The index is designed to reflect the performance of stocks representing the following diversified set of factors: value, momentum and quality. Investors cannot invest directly in an index. As a result of new regulatory requirements, effective July 24, 2024, the Fund’s regulatory index has changed from the Index, as defined above, to the FTSE Developed ex North America Index (net total return), a broad-based securities market index. In addition to the Fund’s performance, the tables in this section include performance of the new regulatory index and the Index.
For periods presented prior to November 1, 2019, the date on which a unitary fee structure was adopted, Fund performance reflects the waiver of the Fund’s fees and reimbursement of expenses for certain periods since the inception date. Without these waivers and reimbursements, performance would have been lower. Also, performance shown in this section does not reflect the deduction of taxes that a shareholder may pay on Fund distributions or on gains resulting from redemption or sale of Fund shares.
The returns shown are based on net asset values calculated for shareholder transactions and may differ from the returns shown in the financial highlights, which reflect adjustments made to the net asset values in accordance with accounting principles generally accepted in the United States of America.
| Fund net assets | $339,399,985 | |
| Total number of portfolio holdings | 466 | |
| Portfolio turnover rate | 26 | % |
| Total advisory fees paid | $1,361,735 | |
PORTFOLIO COMPOSITION - COUNTRY
(% of Total Investments)
Availability of Additional Information
At www.jpmorganfunds.com/funddocuments, you can find additional information about the Fund, including the Fund’s:
Prospectus
Financial information
Fund holdings
Proxy voting information
You can also request this information by contacting us at 1-844-457-6383.
ANNUAL SHAREHOLDER REPORT | October 31, 2024 (Unaudited)
JPMorgan Diversified Return U.S. Equity ETF
Ticker: JPUS - NYSE Arca, Inc.
ANNUAL SHAREHOLDER REPORT
This annual shareholder report contains important information about the JPMorgan Diversified Return U.S. Equity ETF (the "Fund") for the period of November 1, 2023 to October 31, 2024. You can find additional information about the Fund at www.jpmorganfunds.com/funddocuments. You can also request this information by contacting us at 1-844-457-6383 or by sending an e-mail request to jpm.xf@jpmorgan.com or by asking any financial intermediary that offers shares of the Fund.
What were the Fund costs for the last year?
(based on a hypothetical $10,000 investment)
| Fund | Costs of a
$10,000 investment | Costs paid as a percentage
of a $10,000 investment |
| JPMorgan Diversified Return U.S. Equity ETF | $21 | 0.18% |
How did the Fund Perform?
The JPMorgan Diversified Return U.S. Equity ETF returned 31.24% for the year ended October 31, 2024. The Russell 1000 Index returned 38.07% and the JP Morgan Diversified Factor US Equity Index (the "Index") returned 31.48% for the year ended October 31, 2024.
The Fund seeks investment results that closely correspond, before fees and expenses, to the performance of the Index. The Fund performed in line with the Index, before considering operating expenses, fees and tax management of the Fund’s portfolio.
On a relative basis to the Russell 1000 Index, the Fund’s and the Index's largest detractors from returns were their underweight positions in the information technology sector and an overweight position in the consumer staples sector, while their largest contributor to returns was their multi-factor security selection within the consumer discretionary and real estate sectors.
| AVERAGE ANNUAL TOTAL RETURNS | INCEPTION
DATE | 1 YEAR | | 5 YEAR | | SINCE
INCEPTION | |
| JPMorgan Diversified Return U.S. Equity ETF - Net Asset Value | September 29, 2015 | 31.24 | % | 11.37 | % | 11.91 | % |
| Russell 1000 Index | | 38.07 | | 15.00 | | 14.74 | |
| JP Morgan Diversified Factor US Equity Index | | 31.48 | | 11.52 | | 12.15 | |
The performance quoted is past performance and is not a guarantee of future results. Exchange-traded funds are subject to certain market risks. Investment returns and principal value of an investment will fluctuate so that an investor’s shares, when sold or redeemed, may be worth more or less than their original cost. Current performance may be higher or lower than the performance data shown. Updated performance information is available by visiting www.jpmorganfunds.com or by calling 1-844-457-6383.
The graph illustrates comparative performance for $10,000 invested in shares of the JPMorgan Diversified Return U.S. Equity ETF, the Russell 1000 Index and the JP Morgan Diversified Factor US Equity Index from September 29, 2015 to October 31, 2024. The performance of the Fund reflects the deduction of Fund expenses and assumes reinvestment of all dividends and capital gain distributions, if any. The performance of the Russell 1000 Index and the JP Morgan Diversified Factor US Equity Index does not reflect the deduction of expenses associated with an exchange-traded fund and has been adjusted to reflect reinvestment of all dividends and capital gain distributions of the securities included in the index, if applicable. The Fund’s adviser is a sponsor of the JP Morgan Diversified Factor US Equity Index and developed the proprietary factors on which the index is based. FTSE Russell, the benchmark administrator, administers, calculates and governs the JP Morgan Diversified Factor US Equity Index. The Russell 1000 Index is a market capitalization-weighted index, which measures the performance of the 1,000 largest companies in the Russell 3000 Index. JP Morgan Diversified Factor US Equity Index is comprised of U.S. large and mid-cap equity securities selected from the constituents of the Russell 1000 Index. The index is designed to reflect the performance of stocks representing the following diversified set of factors: value, momentum and quality. Investors cannot invest directly in an index. As a result of new regulatory requirements, effective July 24, 2024, the Fund’s regulatory index has changed from the Index, as defined above, to the Russell 1000 Index, a broad-based securities market index. In addition to the Fund’s performance, the tables in this section include performance of the new regulatory index and the Index.
For periods presented prior to November 1, 2019, the date on which a unitary fee structure was adopted, Fund performance reflects the waiver of the Fund’s fees and reimbursement of expenses for certain periods since the inception date. Without these waivers and reimbursements, performance would have been lower. Also, performance shown in this section does not reflect the deduction of taxes that a shareholder may pay on Fund distributions or on gains resulting from redemption or sale of Fund shares.
The returns shown are based on net asset values calculated for shareholder transactions and may differ from the returns shown in the financial highlights, which reflect adjustments made to the net asset values in accordance with accounting principles generally accepted in the United States of America.
Frank Russell Company is the source and owner of the Russell Index data contained or reflected in this material and all trademarks and copyrights related thereto. Frank Russell Company is not responsible for the formatting or configuration of this material or for any inaccuracy in the adviser's presentation thereof.
| Fund net assets | $436,820,675 | |
| Total number of portfolio holdings | 365 | |
| Portfolio turnover rate | 25 | % |
| Total advisory fees paid | $780,507 | |
PORTFOLIO COMPOSITION - SECTOR
(% of Total Investments)
Availability of Additional Information
At www.jpmorganfunds.com/funddocuments, you can find additional information about the Fund, including the Fund’s:
Prospectus
Financial information
Fund holdings
Proxy voting information
You can also request this information by contacting us at 1-844-457-6383.
ANNUAL SHAREHOLDER REPORT | October 31, 2024 (Unaudited)
JPMorgan Diversified Return U.S. Mid Cap Equity ETF
Ticker: JPME - NYSE Arca, Inc.
ANNUAL SHAREHOLDER REPORT
This annual shareholder report contains important information about the JPMorgan Diversified Return U.S. Mid Cap Equity ETF (the "Fund") for the period of November 1, 2023 to October 31, 2024. You can find additional information about the Fund at www.jpmorganfunds.com/funddocuments. You can also request this information by contacting us at 1-844-457-6383 or by sending an e-mail request to jpm.xf@jpmorgan.com or by asking any financial intermediary that offers shares of the Fund.
What were the Fund costs for the last year?
(based on a hypothetical $10,000 investment)
| Fund | Costs of a
$10,000 investment | Costs paid as a percentage
of a $10,000 investment |
| JPMorgan Diversified Return U.S. Mid Cap Equity ETF | $28 | 0.24% |
How did the Fund Perform?
The JPMorgan Diversified Return U.S. Mid Cap Equity ETF returned 30.59% for the year ended October 31, 2024. The Russell 3000 Index returned 37.86%, the JP Morgan Diversified Factor US Mid Cap Equity Index (the "Index") returned 30.93%, and the Russell Midcap Index returned 35.39% for the year ended October 31, 2024.
The Fund seeks investment results that closely correspond, before fees and expenses, to the performance of the Index. The Fund performed in line with the Index, before considering operating expenses, fees and tax management of the Fund’s portfolio.
On a relative basis to the Russell Midcap Index, the Fund’s and the Index's largest detractors from returns were their overweight positions in the consumer staples sector and its multi-factor security selection within the financials sector, while their largest contributor to returns was their multi-factor security selection within the consumer discretionary and health care sectors.
| AVERAGE ANNUAL TOTAL RETURNS | INCEPTION
DATE | 1 YEAR | | 5 YEAR | | SINCE
INCEPTION | |
| JPMorgan Diversified Return U.S. Mid Cap Equity ETF - Net Asset Value | May 11, 2016 | 30.59 | % | 10.95 | % | 10.72 | % |
| Russell 3000 Index | | 37.86 | | 14.60 | | 14.26 | |
| JP Morgan Diversified Factor US Mid Cap Equity Index | | 30.93 | | 11.20 | | 11.00 | |
| Russell Midcap Index | | 35.39 | | 10.94 | | 11.25 | |
The performance quoted is past performance and is not a guarantee of future results. Exchange-traded funds are subject to certain market risks. Investment returns and principal value of an investment will fluctuate so that an investor’s shares, when sold or redeemed, may be worth more or less than their original cost. Current performance may be higher or lower than the performance data shown. Updated performance information is available by visiting www.jpmorganfunds.com or by calling 1-844-457-6383.
The graph illustrates comparative performance for $10,000 invested in shares of the JPMorgan Diversified Return U.S. Mid Cap Equity ETF, the Russell 3000 Index, JP Morgan Diversified Factor US Mid Cap Equity Index and the Russell Midcap Index from May 11, 2016 to October 31, 2024. The performance of the Fund reflects the deduction of Fund expenses and assumes reinvestment of all dividends and capital gain distributions, if any. The performance of the Russell 3000 Index, JP Morgan Diversified Factor US Mid Cap Equity Index and Russell Midcap Index does not reflect the deduction of expenses associated with an exchange-traded fund and has been adjusted to reflect reinvestment of all dividends and capital gain distributions of the securities included in the index, if applicable. The Fund’s adviser is a sponsor of the JP Morgan Diversified Factor US Mid Cap Equity Index and developed the proprietary factors on which the index is based. FTSE Russell, the benchmark administrator, administers, calculates and governs the JP Morgan Diversified Factor US Mid Cap Equity Index. The Russell 3000 Index is an unmanaged index measuring the performance of the 3,000 largest U.S. companies based on total market capitalization, which represents approximately 98% of the investable U.S. equity market. The JP Morgan Diversified Factor US Mid Cap Equity Index is comprised of U.S. mid-cap equity securities selected from the Russell Midcap Index. The index is designed to reflect the performance of stocks representing the following diversified set of factors: value, momentum and quality. The Russell Midcap Index is a market capitalization-weighted index which measures the performance of the 800 smallest companies in the Russell 1000 Index. Investors cannot invest directly in an index. As a result of new regulatory requirements, effective July 24, 2024, the Fund’s regulatory index has changed from the Index, as defined above, to the Russell 3000 Index, a broad-based securities market index. In addition to the Fund’s performance, the tables in this section include performance of the new regulatory index, the Index and an additional supplemental index.
For periods presented prior to November 1, 2019, the date on which a unitary fee structure was adopted, Fund performance reflects the waiver of the Fund’s fees and reimbursement of expenses for certain periods since the inception date. Without these waivers and reimbursements, performance would have been lower. Also, performance shown in this section does not reflect the deduction of taxes that a shareholder may pay on Fund distributions or on gains resulting from redemption or sale of Fund shares.
The returns shown are based on net asset values calculated for shareholder transactions and may differ from the returns shown in the financial highlights, which reflect adjustments made to the net asset values in accordance with accounting principles generally accepted in the United States of America.
Frank Russell Company is the source and owner of the Russell Index data contained or reflected in this material and all trademarks and copyrights related thereto. Frank Russell Company is not responsible for the formatting or configuration of this material or for any inaccuracy in the adviser's presentation thereof.
| Fund net assets | $407,691,100 | |
| Total number of portfolio holdings | 352 | |
| Portfolio turnover rate | 25 | % |
| Total advisory fees paid | $901,421 | |
PORTFOLIO COMPOSITION - SECTOR
(% of Total Investments)
Availability of Additional Information
At www.jpmorganfunds.com/funddocuments, you can find additional information about the Fund, including the Fund’s:
Prospectus
Financial information
Fund holdings
Proxy voting information
You can also request this information by contacting us at 1-844-457-6383.
ANNUAL SHAREHOLDER REPORT | October 31, 2024 (Unaudited)
JPMorgan Diversified Return U.S. Small Cap Equity ETF
Ticker: JPSE - NYSE Arca, Inc.
ANNUAL SHAREHOLDER REPORT
This annual shareholder report contains important information about the JPMorgan Diversified Return U.S. Small Cap Equity ETF (the "Fund") for the period of November 1, 2023 to October 31, 2024. You can find additional information about the Fund at www.jpmorganfunds.com/funddocuments. You can also request this information by contacting us at 1-844-457-6383 or by sending an e-mail request to jpm.xf@jpmorgan.com or by asking any financial intermediary that offers shares of the Fund.
What were the Fund costs for the last year?
(based on a hypothetical $10,000 investment)
| Fund | Costs of a
$10,000 investment | Costs paid as a percentage
of a $10,000 investment |
| JPMorgan Diversified Return U.S. Small Cap Equity ETF | $33 | 0.29% |
How did the Fund Perform?
The JPMorgan Diversified Return U.S. Small Cap Equity ETF returned 27.56% for the year ended October 31, 2024. The Russell 3000 Index returned 37.86%, the JP Morgan Diversified Factor US Small Cap Equity Index (the "Index") returned 27.92%, and the Russell 2000 Index returned 34.07% for the year ended October 31, 2024.
The Fund seeks investment results that closely correspond, before fees and expenses, to the performance of the Index. The Fund performed in line with the Index, before considering operating expenses, fees and tax management of the Fund’s portfolio.
On a relative basis to the Russell 2000 Index, the Fund’s and the Index's largest detractor from returns was their multi-factor security selection within the industrials and basic materials sectors, while their largest contributors to returns were their multi-factor security selection within the energy sector and an overweight position in the telecommunications sector.
| AVERAGE ANNUAL TOTAL RETURNS | INCEPTION
DATE | 1 YEAR | | 5 YEAR | | SINCE
INCEPTION | |
| JPMorgan Diversified Return U.S. Small Cap Equity ETF - Net Asset Value | November 15, 2016 | 27.56 | % | 10.39 | % | 9.64 | % |
| Russell 3000 Index | | 37.86 | | 14.60 | | 14.16 | |
| JP Morgan Diversified Factor US Small Cap Equity Index | | 27.92 | | 10.57 | | 9.86 | |
| Russell 2000 Index | | 34.07 | | 8.50 | | 8.24 | |
The performance quoted is past performance and is not a guarantee of future results. Exchange-traded funds are subject to certain market risks. Investment returns and principal value of an investment will fluctuate so that an investor’s shares, when sold or redeemed, may be worth more or less than their original cost. Current performance may be higher or lower than the performance data shown. Updated performance information is available by visiting www.jpmorganfunds.com or by calling 1-844-457-6383.
The graph illustrates comparative performance for $10,000 invested in shares of the JPMorgan Diversified Return U.S. Small Cap Equity ETF, the Russell 3000 Index, the JP Morgan Diversified Factor US Small Cap Equity Index and the Russell 2000 Index from November 15, 2016 to October 31, 2024. The performance of the Fund reflects the deduction of Fund expenses and assumes reinvestment of all dividends and capital gain distributions, if any. The performance of the Russell 3000 Index, JP Morgan Diversified Factor US Small Cap Equity Index and Russell 2000 Index does not reflect the deduction of expenses associated with an exchange-traded fund and has been adjusted to reflect reinvestment of all dividends and capital gain distributions of the securities included in the index, if applicable. The Fund’s adviser is a sponsor of the JP Morgan Diversified Factor US Small Cap Equity Index and developed the proprietary factors on which the index is based. FTSE Russell, the benchmark administrator, administers, calculates and governs the JP Morgan Diversified Factor US Small Cap Equity Index. The Russell 3000 Index is an unmanaged index measuring the performance of the 3,000 largest U.S. companies based on total market capitalization, which represents approximately 98% of the investable U.S. equity market. The JP Morgan Diversified Factor US Small Cap Equity Index is comprised of U.S. small cap equity securities selected from the Russell 2000 Index. The index is designed to reflect the performance of stocks representing the following diversified set of factors: value, momentum and quality. The Russell 2000 Index is an unmanaged index, measuring performance of the 2000 smallest stocks (on the basis of capitalization) in the Russell 3000 Index. Investors cannot invest directly in an index. As a result of new regulatory requirements, effective July 24, 2024, the Fund’s regulatory index has changed from the Index, as defined above, to the Russell 3000 Index, a broad-based securities market index. In addition to the Fund’s performance, the tables in this section include performance of the new regulatory index, the Index and an additional supplemental index.
For periods presented prior to November 1, 2019, the date on which a unitary fee structure was adopted, Fund performance reflects the waiver of the Fund’s fees and reimbursement of expenses for certain periods since the inception date. Without these waivers and reimbursements, performance would have been lower. Also, performance shown in this section does not reflect the deduction of taxes that a shareholder may pay on Fund distributions or on gains resulting from redemption or sale of Fund shares.
The returns shown are based on net asset values calculated for shareholder transactions and may differ from the returns shown in the financial highlights, which reflect adjustments made to the net asset values in accordance with accounting principles generally accepted in the United States of America.
Frank Russell Company is the source and owner of the Russell Index data contained or reflected in this material and all trademarks and copyrights related thereto. Frank Russell Company is not responsible for the formatting or configuration of this material or for any inaccuracy in the adviser's presentation thereof.
| Fund net assets | $497,805,298 | |
| Total number of portfolio holdings | 558 | |
| Portfolio turnover rate | 28 | % |
| Total advisory fees paid | $1,370,591 | |
PORTFOLIO COMPOSITION - SECTOR
(% of Total Investments)
Availability of Additional Information
At www.jpmorganfunds.com/funddocuments, you can find additional information about the Fund, including the Fund’s:
Prospectus
Financial information
Fund holdings
Proxy voting information
You can also request this information by contacting us at 1-844-457-6383.
ANNUAL SHAREHOLDER REPORT | October 31, 2024 (Unaudited)
JPMorgan Dividend Leaders ETF
Ticker: JDIV - NYSE Arca, Inc.
ANNUAL SHAREHOLDER REPORT
This annual shareholder report contains important information about the JPMorgan Dividend Leaders ETF (the "Fund") for the period of September 25, 2024 (fund inception) to October 31, 2024. You can find additional information about the Fund at www.jpmorganfunds.com/funddocuments. You can also request this information by contacting us at 1-844-457-6383 or by sending an e-mail request to jpm.xf@jpmorgan.com or by asking any financial intermediary that offers shares of the Fund.
What were the Fund costs for the last year?
(based on a hypothetical $10,000 investment)
| Fund | Costs of a
$10,000 investment | Costs paid as a percentage
of a $10,000 investment* |
| JPMorgan Dividend Leaders ETF | $5 | 0.47% |
| * | This charge is annualized. |
How did the Fund Perform?
The JPMorgan Dividend Leaders ETF returned -1.88% for the period from Fund inception to October 31, 2024. The MSCI ACWI Index (net total return) (the "Index") returned -1.24% for the period.
The Fund’s security selection in the automobile and consumer staples sectors detracted from performance relative to the Index.
The Fund’s security selection in the financial services and pharmaceuticals/medical technology sectors contributed to performance relative to the Index.
| AVERAGE ANNUAL TOTAL RETURNS | INCEPTION
DATE | SINCE
INCEPTION* | |
| JPMorgan Dividend Leaders ETF - Net Asset Value | September 25, 2024 | (1.88 | )% |
| MSCI ACWI Index (net total return) | | (1.24 | ) |
The performance quoted is past performance and is not a guarantee of future results. Exchange-traded funds are subject to certain market risks. Investment returns and principal value of an investment will fluctuate so that an investor’s shares, when sold or redeemed, may be worth more or less than their original cost. Current performance may be higher or lower than the performance data shown. Updated performance information is available by visiting www.jpmorganfunds.com or by calling 1-844-457-6383.
The graph illustrates comparative performance for $10,000 invested in shares of the JPMorgan Dividend Leaders ETF and the MSCI ACWI Index (net total return) from September 25, 2024 to October 31, 2024. The performance of the Fund reflects the deduction of Fund expenses and assumes reinvestment of all dividends and capital gain distributions, if any. The performance of the MSCI ACWI Index (net total return) does not reflect the deduction of expenses associated with an exchange-traded fund and approximates the minimum possible dividend reinvestment of these securities included in the benchmark, if applicable. The MSCI ACWI Index (net total return) is a free float-adjusted market capitalization weighted index that is designed to measure the performance of large- and mid- cap stocks in developed and emerging markets. Net total return figures assume the reinvestment of dividends after deduction of withholding tax, applying the maximum rate to nonresident individual investors who do not benefit from double taxation treaties. Investors cannot invest directly in an index.
Performance shown in this section does not reflect the deduction of taxes that a shareholder may pay on Fund distributions or on gains resulting from redemption or sale of Fund shares.
International investing involves a greater degree of risk and increased volatility. Changes in currency exchange rates and differences in accounting and taxation policies outside the United States can raise or lower returns. Also, some overseas markets may not be as politically and economically stable as the United States and other nations.
The returns shown are based on net asset values calculated for shareholder transactions and may differ from the returns shown in the financial highlights, which reflect adjustments made to the net asset values in accordance with accounting principles generally accepted in the United States of America.
Source: MSCI. The MSCI information may only be used for your internal use, may not be reproduced or redisseminated in any form and may not be used as a basis for or a component of any financial instruments or products or indices. None of the MSCI information is intended to constitute investment advice or a recommendation to make (or refrain from making) any kind of investment decision and may not be relied on as such. Historical data and analysis should not be taken as an indication or guarantee of any future performance analysis, forecast, or prediction. The MSCI information is provided on an "as is" basis and the user of this information assumes the entire risk of any use made of this information. MSCI, each of its affiliates and each other person involved in or related to compiling, computing or creating any MSCI information (collectively, the "MSCI Parties") expressly disclaims all warranties (including, without limitation, any warranties of originality, accuracy, completeness, timeliness, non-infringement, merchantability and fitness for a particular purpose) with respect to this information. Without limiting any of the foregoing, in no event shall any MSCI Party have any liability for any direct, indirect, special, incidental, punitive, consequential (including, without limitation, lost profits) or any other damages. (www.msci.com)
| Fund net assets | $5,887,482 | |
| Total number of portfolio holdings | 77 | |
| Portfolio turnover rate | 7 | % |
| Total advisory fees paid | $2,672 | |
PORTFOLIO COMPOSITION - COUNTRY
(% of Total Investments)
Availability of Additional Information
At www.jpmorganfunds.com/funddocuments, you can find additional information about the Fund, including the Fund’s:
Prospectus
Financial information
Fund holdings
Proxy voting information
You can also request this information by contacting us at 1-844-457-6383.
ANNUAL SHAREHOLDER REPORT | October 31, 2024 (Unaudited)
JPMorgan Global Select Equity ETF
Ticker: JGLO - The NASDAQ Stock Market® LLC
ANNUAL SHAREHOLDER REPORT
This annual shareholder report contains important information about the JPMorgan Global Select Equity ETF (the "Fund") for the period of November 1, 2023 to October 31, 2024. You can find additional information about the Fund at www.jpmorganfunds.com/funddocuments. You can also request this information by contacting us at 1-844-457-6383 or by sending an e-mail request to jpm.xf@jpmorgan.com or by asking any financial intermediary that offers shares of the Fund.
What were the Fund costs for the last year?
(based on a hypothetical $10,000 investment)
| Fund | Costs of a
$10,000 investment | Costs paid as a percentage
of a $10,000 investment |
| JPMorgan Global Select Equity ETF | $55 | 0.47% |
How did the Fund Perform?
The JPMorgan Global Select Equity ETF returned 33.57% for the year ended October 31, 2024. The MSCI World Index (net total return) (the "Index") returned 33.68% for the year ended October 31, 2024.
The Fund’s security selection in the retail and industrial cyclical sectors detracted from performance relative to the Index.
The Fund’s security selection in the technology (semiconductors & hardware) and media sectors contributed to performance relative to the Index.
| AVERAGE ANNUAL TOTAL RETURNS | INCEPTION
DATE | 1 YEAR | | SINCE
INCEPTION | |
| JPMorgan Global Select Equity ETF - Net Asset Value | September 13, 2023 | 33.57 | % | 24.52 | % |
| MSCI World Index (net total return) | | 33.68 | | 22.15 | |
The performance quoted is past performance and is not a guarantee of future results. Exchange-traded funds are subject to certain market risks. Investment returns and principal value of an investment will fluctuate so that an investor’s shares, when sold or redeemed, may be worth more or less than their original cost. Current performance may be higher or lower than the performance data shown. Updated performance information is available by visiting www.jpmorganfunds.com or by calling 1-844-457-6383.
The graph illustrates comparative performance for $10,000 invested in shares of the JPMorgan Global Select Equity ETF and the MSCI World Index (net total return) from September 13, 2023 to October 31, 2024. The performance of the Fund reflects the deduction of Fund expenses and assumes reinvestment of all dividends and capital gain distributions, if any. The performance of the MSCI World Index (net total return) does not reflect the deduction of expenses associated with an exchange-traded fund and has been adjusted to reflect reinvestment of all dividends and capital gain distributions of the securities included in the Index, if applicable. The MSCI World Index (net total return) is a free float-adjusted market capitalization weighted index that is designed to measure the performance of large- and mid- cap stocks in developed markets. Net total return figures assume the reinvestment of dividends after deduction of withholding tax, applying the maximum rate to nonresident individual investors who do not benefit from double taxation treaties. Investors cannot invest directly in an index.
Performance shown in this section does not reflect the deduction of taxes that a shareholder may pay on Fund distributions or on gains resulting from redemption or sale of Fund shares.
International investing involves a greater degree of risk and increased volatility. Changes in currency exchange rates and differences in accounting and taxation policies outside the United States can raise or lower returns. Also, some overseas markets may not be as politically and economically stable as the United States and other nations.
The returns shown are based on net asset values calculated for shareholder transactions and may differ from the returns shown in the financial highlights, which reflect adjustments made to the net asset values in accordance with accounting principles generally accepted in the United States of America.
Source: MSCI. The MSCI information may only be used for your internal use, may not be reproduced or redisseminated in any form and may not be used as a basis for or a component of any financial instruments or products or indices. None of the MSCI information is intended to constitute investment advice or a recommendation to make (or refrain from making) any kind of investment decision and may not be relied on as such. Historical data and analysis should not be taken as an indication or guarantee of any future performance analysis, forecast, or prediction. The MSCI information is provided on an "as is" basis and the user of this information assumes the entire risk of any use made of this information. MSCI, each of its affiliates and each other person involved in or related to compiling, computing or creating any MSCI information (collectively, the "MSCI Parties") expressly disclaims all warranties (including, without limitation, any warranties of originality, accuracy, completeness, timeliness, non-infringement, merchantability and fitness for a particular purpose) with respect to this information. Without limiting any of the foregoing, in no event shall any MSCI Party have any liability for any direct, indirect, special, incidental, punitive, consequential (including, without limitation, lost profits) or any other damages. (www.msci.com)
| Fund net assets | $4,857,897,209 | |
| Total number of portfolio holdings | 79 | |
| Portfolio turnover rate | 103 | % |
| Total advisory fees paid | $12,263,749 | |
PORTFOLIO COMPOSITION - COUNTRY
(% of Total Investments)
Availability of Additional Information
At www.jpmorganfunds.com/funddocuments, you can find additional information about the Fund, including the Fund’s:
Prospectus
Financial information
Fund holdings
Proxy voting information
You can also request this information by contacting us at 1-844-457-6383.
ANNUAL SHAREHOLDER REPORT | October 31, 2024 (Unaudited)
JPMorgan Healthcare Leaders ETF
Ticker: JDOC - The NASDAQ Stock Market® LLC
ANNUAL SHAREHOLDER REPORT
This annual shareholder report contains important information about the JPMorgan Healthcare Leaders ETF (the "Fund") for the period of November 1, 2023 (fund inception) to October 31, 2024. You can find additional information about the Fund at www.jpmorganfunds.com/funddocuments. You can also request this information by contacting us at 1-844-457-6383 or by sending an e-mail request to jpm.xf@jpmorgan.com or by asking any financial intermediary that offers shares of the Fund.
What were the Fund costs for the last year?
(based on a hypothetical $10,000 investment)
| Fund | Costs of a
$10,000 investment | Costs paid as a percentage
of a $10,000 investment* |
| JPMorgan Healthcare Leaders ETF | $71 | 0.65% |
| * | This charge is annualized. |
How did the Fund Perform?
The JPMorgan Healthcare Leaders ETF returned 20.51% for the period from Fund inception to October 31, 2024. The MSCI World Index (net total return) returned 32.30% and the MSCI World Healthcare Index (net total return) (the "Index") returned 19.36% for the period.
The Fund’s security selection in the pharmaceuticals and medical technology sectors contributed to performance relative to the Index.
The Fund’s security selection in the health care services sector detracted from performance relative to the Index.
| AVERAGE ANNUAL TOTAL RETURNS | INCEPTION
DATE | SINCE
INCEPTION* | |
| JPMorgan Healthcare Leaders ETF - Net Asset Value | November 1, 2023 | 20.51 | % |
| MSCI World Index (net total return) | | 32.30 | |
| MSCI World Healthcare Index (net total return) | | 19.36 | |
The performance quoted is past performance and is not a guarantee of future results. Exchange-traded funds are subject to certain market risks. Investment returns and principal value of an investment will fluctuate so that an investor’s shares, when sold or redeemed, may be worth more or less than their original cost. Current performance may be higher or lower than the performance data shown. Updated performance information is available by visiting www.jpmorganfunds.com or by calling 1-844-457-6383.
The graph illustrates comparative performance for $10,000 invested in shares of the JPMorgan Healthcare Leaders ETF, the MSCI World Index (net total return) and the MSCI World Healthcare Index (net total return) from November 1, 2023 to October 31, 2024. The performance of the Fund reflects the deduction of Fund expenses and assumes reinvestment of all dividends and capital gain distributions, if any. The performance of the MSCI World Index (net total return) and the MSCI World Healthcare Index (net total return) does not reflect the deduction of expenses associated with an exchange-traded fund and has been adjusted to reflect reinvestment of all dividends and capital gain distributions of the securities included in the benchmarks, if applicable. The MSCI World Index (net total return) is a free float-adjusted market capitalization weighted index that is designed to measure the performance of large- and mid- cap stocks in developed markets. Net total return figures assume the reinvestment of dividends after deduction of withholding tax, applying the maximum rate to nonresident individual investors who do not benefit from double taxation treaties. The MSCI World Healthcare Index (net total return) is a free float-adjusted market capitalization weighted index that is designed to measure the performance of large- and mid- cap health care stocks in developed markets. Net total return figures assume the reinvestment of dividends after deduction of withholding tax, applying the maximum rate to nonresident individual investors who do not benefit from double taxation treaties. Investors cannot invest directly in an index. As a result of new regulatory requirements, effective July 24, 2024, the Fund's regulatory index has changed from the Index, as defined above, to the MSCI World Index (net total return), a broad-based securities market index. In addition to the Fund's performance, the tables in this section include performance of the new regulatory index and the Index.
Performance shown in this section does not reflect the deduction of taxes that a shareholder may pay on Fund distributions or on gains resulting from redemption or sale of Fund shares.
International investing involves a greater degree of risk and increased volatility. Changes in currency exchange rates and differences in accounting and taxation policies outside the United States can raise or lower returns. Also, some overseas markets may not be as politically and economically stable as the United States and other nations.
The returns shown are based on net asset values calculated for shareholder transactions and may differ from the returns shown in the financial highlights, which reflect adjustments made to the net asset values in accordance with accounting principles generally accepted in the United States of America.
Source: MSCI. The MSCI information may only be used for your internal use, may not be reproduced or redisseminated in any form and may not be used as a basis for or a component of any financial instruments or products or indices. None of the MSCI information is intended to constitute investment advice or a recommendation to make (or refrain from making) any kind of investment decision and may not be relied on as such. Historical data and analysis should not be taken as an indication or guarantee of any future performance analysis, forecast, or prediction. The MSCI information is provided on an "as is" basis and the user of this information assumes the entire risk of any use made of this information. MSCI, each of its affiliates and each other person involved in or related to compiling, computing or creating any MSCI information (collectively, the "MSCI Parties") expressly disclaims all warranties (including, without limitation, any warranties of originality, accuracy, completeness, timeliness, non-infringement, merchantability and fitness for a particular purpose) with respect to this information. Without limiting any of the foregoing, in no event shall any MSCI Party have any liability for any direct, indirect, special, incidental, punitive, consequential (including, without limitation, lost profits) or any other damages. (www.msci.com)
| Fund net assets | $7,220,835 | |
| Total number of portfolio holdings | 57 | |
| Portfolio turnover rate | 55 | % |
| Total advisory fees paid | $56,397 | |
PORTFOLIO COMPOSITION - COUNTRY
(% of Total Investments)
Availability of Additional Information
At www.jpmorganfunds.com/funddocuments, you can find additional information about the Fund, including the Fund’s:
Prospectus
Financial information
Fund holdings
Proxy voting information
You can also request this information by contacting us at 1-844-457-6383.
ANNUAL SHAREHOLDER REPORT | October 31, 2024 (Unaudited)
JPMorgan Hedged Equity Laddered Overlay ETF
Ticker: HELO - NYSE Arca, Inc.
ANNUAL SHAREHOLDER REPORT
This annual shareholder report contains important information about the JPMorgan Hedged Equity Laddered Overlay ETF (the "Fund") for the period of November 1, 2023 to October 31, 2024. You can find additional information about the Fund at www.jpmorganfunds.com/funddocuments. You can also request this information by contacting us at 1-844-457-6383 or by sending an e-mail request to jpm.xf@jpmorgan.com or by asking any financial intermediary that offers shares of the Fund.
What were the Fund costs for the last year?
(based on a hypothetical $10,000 investment)
| Fund | Costs of a
$10,000 investment | Costs paid as a percentage
of a $10,000 investment |
| JPMorgan Hedged Equity Laddered Overlay ETF | $56 | 0.50% |
How did the Fund Perform?
The JPMorgan Hedged Equity Laddered Overlay ETF returned 24.45% for the year ended October 31, 2024. The S&P 500 Index returned 38.02% and the ICE BofA 3-Month US Treasury Bill Index (the "Index") returned 5.39% for the year ended October 31, 2024.
The Fund captured 64% of the Index’s positive return with 50% of its volatility during the period.
The Fund’s security selection in the basic materials and telecommunications sectors detracted from performance, relative to the Index.
The Fund’s security selection in the hardware & semiconductors and pharmaceutical/medical technology sectors contributed to performance relative to the Index.
The technology - hardware & semiconductors and pharmaceutical/medical technology sectors added the most value.
The basic materials and telecommunications sectors weighed the most on performance.
| AVERAGE ANNUAL TOTAL RETURNS | INCEPTION
DATE | 1 YEAR | | SINCE
INCEPTION | |
| JPMorgan Hedged Equity Laddered Overlay ETF - Net Asset Value | September 28, 2023 | 24.45 | % | 20.60 | % |
| S&P 500 Index | | 38.02 | | 31.51 | |
| ICE BofA 3-Month US Treasury Bill Index | | 5.39 | | 5.41 | |
The performance quoted is past performance and is not a guarantee of future results. Exchange-traded funds are subject to certain market risks. Investment returns and principal value of an investment will fluctuate so that an investor’s shares, when sold or redeemed, may be worth more or less than their original cost. Current performance may be higher or lower than the performance data shown. Updated performance information is available by visiting www.jpmorganfunds.com or by calling 1-844-457-6383.
The graph illustrates comparative performance for $10,000 invested in shares of the JPMorgan Hedged Equity Laddered Overlay ETF, the S&P 500 Index and the ICE BofA 3-Month US Treasury Bill Index from September 28, 2023 to October 31, 2024. The performance of the Fund reflects the deduction of Fund expenses and assumes reinvestment of all dividends and capital gain distributions, if any. The performance of the S&P 500 Index and the ICE BofA 3-Month US Treasury Bill Index does not reflect the deduction of expenses associated with an exchange-traded fund and approximates the minimum possible dividend reinvestment of the securities included in the benchmarks, if applicable. The S&P 500 Index is an unmanaged index generally representative of the performance of large companies in the U.S. stock market. The ICE BofA 3-Month US Treasury Bill Index is comprised of a single issue purchased at the beginning of the month and held for a full month. Each month the ICE BofA 3-Month US Treasury Bill Index is rebalanced and the issue selected is the outstanding Treasury Bill that matures closest to, but not beyond, 3 months from the rebalancing date. Investors cannot invest directly in an index.
Performance shown in this section does not reflect the deduction of taxes that a shareholder may pay on Fund distributions or on gains resulting from redemption or sale of Fund shares.
The returns shown are based on net asset values calculated for shareholder transactions and may differ from the returns shown in the financial highlights, which reflect adjustments made to the net asset values in accordance with accounting principles generally accepted in the United States of America.
The S&P 500 Index (“Index”) is a product of S&P Dow Jones Indices LLC and/or its affiliates and have been licensed for use by the adviser. Copyright © 2023. S&P Dow Jones Indices LLC, a subsidiary of S&P Global, Inc., and/or its affiliates. All rights reserved. Redistribution or reproduction in whole or in part are prohibited without written permission of S&P Dow Jones Indices LLC. For more information on any of S&P Dow Jones Indices LLC’s indices please visit www.spdji.com. S&P® is a registered trademark of Standard & Poor’s Financial Services LLC and Dow Jones® is a registered trademark of Dow Jones Trademark Holdings LLC. Neither S&P Dow Jones Indices LLC, Dow Jones Trademark Holdings LLC, their affiliates nor their third party licensors make any representation or warranty, express or implied, as to the ability of any index to accurately represent the asset class or market sector that it purports to represent and neither S&P Dow Jones Indices LLC, Dow Jones Trademark Holdings LLC, their affiliates nor their third party licensors shall have any liability for any errors, omissions, or interruptions of any index or the data included therein.
Source ICE Data Indices, LLC is used with permission. ICE® is a registered trademark of ICE Data Indices, LLC or its affiliates and BofA® is a registered trademark of Bank of America Corporation licensed by Bank of America Corporation and its affiliates ("BofA"), and may not be used without BofA's prior written approval. The index data referenced herein is the property of ICE Data Indices, LLC, its affiliates (“ICE Data”) and/or its third party suppliers and has been licensed for use by J.P. Morgan Investment Management, Inc. ICE Data and its Third Party Suppliers accept no liability in connection with the use of such index data or marks. See prospectus for a full copy of the Disclaimer.
| Fund net assets | $1,842,881,793 | |
| Total number of portfolio holdings | 174 | |
| Portfolio turnover rate | 30 | % |
| Total advisory fees paid | $3,606,722 | |
PORTFOLIO COMPOSITION - SECTOR
(% of Total Investments)
Availability of Additional Information
At www.jpmorganfunds.com/funddocuments, you can find additional information about the Fund, including the Fund’s:
Prospectus
Financial information
Fund holdings
Proxy voting information
You can also request this information by contacting us at 1-844-457-6383.
ANNUAL SHAREHOLDER REPORT | October 31, 2024 (Unaudited)
JPMorgan International Growth ETF
Ticker: JIG - NYSE Arca, Inc.
ANNUAL SHAREHOLDER REPORT
This annual shareholder report contains important information about the JPMorgan International Growth ETF (the "Fund") for the period of November 1, 2023 to October 31, 2024. You can find additional information about the Fund at www.jpmorganfunds.com/funddocuments. You can also request this information by contacting us at 1-844-457-6383 or by sending an e-mail request to jpm.xf@jpmorgan.com or by asking any financial intermediary that offers shares of the Fund.
What were the Fund costs for the last year?
(based on a hypothetical $10,000 investment)
| Fund | Costs of a
$10,000 investment | Costs paid as a percentage
of a $10,000 investment |
| JPMorgan International Growth ETF | $62 | 0.55% |
How did the Fund Perform?
The JPMorgan International Growth ETF returned 25.64% for the year ended October 31, 2024. The MSCI ACWI ex USA Index (net total return) returned 24.33% and the MSCI ACWI ex USA Growth Index (net total return) (the "Index") returned 25.18% for the year ended October 31, 2024.
The Fund’s security selection in the information technology and financials sectors contributed to performance relative to the Index.
The Fund’s security selection in the consumer discretionary and utilities sectors detracted from performance relative to the Index.
| AVERAGE ANNUAL TOTAL RETURNS | INCEPTION
DATE | 1 YEAR | | SINCE
INCEPTION | |
| JPMorgan International Growth ETF - Net Asset Value | May 20, 2020 | 25.64 | % | 5.95 | % |
| MSCI ACWI ex USA Index (net total return) | | 24.33 | | 9.70 | |
| MSCI ACWI ex USA Growth Index (net total return) | | 25.18 | | 6.76 | |
The performance quoted is past performance and is not a guarantee of future results. Exchange-traded funds are subject to certain market risks. Investment returns and principal value of an investment will fluctuate so that an investor’s shares, when sold or redeemed, may be worth more or less than their original cost. Current performance may be higher or lower than the performance data shown. Updated performance information is available by visiting www.jpmorganfunds.com or by calling 1-844-457-6383.
The graph illustrates comparative performance for $10,000 invested in shares of the JPMorgan International Growth ETF, the MSCI ACWI ex USA Index (net total return) and the MSCI ACWI ex USA Growth Index (net total return) from May 20, 2020 to October 31, 2024. The performance of the Fund reflects the deduction of Fund expenses and assumes reinvestment of all dividends and capital gain distributions, if any. The performance of the MSCI ACWI ex USA Index (net total return) and the MSCI ACWI ex USA Growth Index (net total return) does not reflect the deduction of expenses associated with an exchange-traded fund and approximates the minimum possible dividend reinvestment of the securities included in the benchmarks, if applicable. The MSCI ACWI ex USA Index (net total return) is a free float-adjusted market capitalization weighted index that is designed to measure the performance of large- and mid- cap stocks in developed and emerging markets, excluding the U.S.. Net total return figures assume the reinvestment of dividends after deduction of withholding tax, applying the maximum rate to nonresident individual investors who do not benefit from double taxation treaties. The MSCI ACWI ex USA Growth Index (net total return) is a free float-adjusted market capitalization-weighted index that is designed to measure the performance of growth-oriented large- and mid-cap stocks in developed and emerging markets, excluding the U.S. Net total return figures assume the reinvestment of dividends after deduction of withholding tax, applying the maximum rate to nonresident individual investors who do not benefit from double taxation treaties. Investors cannot invest directly in an index. As a result of new regulatory requirements, effective July 24, 2024, the Fund's regulatory index has changed from the Index, as defined above, to the MSCI ACWI ex USA Index (net total return), a broad-based securities market index. In addition to the Fund's performance, the tables in this section include performance of the new regulatory index and the Index.
Performance shown in this section does not reflect the deduction of taxes that a shareholder may pay on Fund distributions or on gains resulting from redemption or sale of Fund shares.
International investing involves a greater degree of risk and increased volatility. Changes in currency exchange rates and differences in accounting and taxation policies outside the United States can raise or lower returns. Also, some overseas markets may not be as politically and economically stable as the United States and other nations.
The returns shown are based on net asset values calculated for shareholder transactions and may differ from the returns shown in the financial highlights, which reflect adjustments made to the net asset values in accordance with accounting principles generally accepted in the United States of America.
Source: MSCI. The MSCI information may only be used for your internal use, may not be reproduced or redisseminated in any form and may not be used as a basis for or a component of any financial instruments or products or indices. None of the MSCI information is intended to constitute investment advice or a recommendation to make (or refrain from making) any kind of investment decision and may not be relied on as such. Historical data and analysis should not be taken as an indication or guarantee of any future performance analysis, forecast, or prediction. The MSCI information is provided on an "as is" basis and the user of this information assumes the entire risk of any use made of this information. MSCI, each of its affiliates and each other person involved in or related to compiling, computing or creating any MSCI information (collectively, the "MSCI Parties") expressly disclaims all warranties (including, without limitation, any warranties of originality, accuracy, completeness, timeliness, non-infringement, merchantability and fitness for a particular purpose) with respect to this information. Without limiting any of the foregoing, in no event shall any MSCI Party have any liability for any direct, indirect, special, incidental, punitive, consequential (including, without limitation, lost profits) or any other damages. (www.msci.com)
| Fund net assets | $107,863,453 | |
| Total number of portfolio holdings | 78 | |
| Portfolio turnover rate | 51 | % |
| Total advisory fees paid | $492,619 | |
PORTFOLIO COMPOSITION - COUNTRY
(% of Total Investments)
Availability of Additional Information
At www.jpmorganfunds.com/funddocuments, you can find additional information about the Fund, including the Fund’s:
Prospectus
Financial information
Fund holdings
Proxy voting information
You can also request this information by contacting us at 1-844-457-6383.
ANNUAL SHAREHOLDER REPORT | October 31, 2024 (Unaudited)
JPMorgan International Research Enhanced Equity ETF
Ticker: JIRE - NYSE Arca, Inc.
ANNUAL SHAREHOLDER REPORT
This annual shareholder report contains important information about the JPMorgan International Research Enhanced Equity ETF (the "Fund") for the period of November 1, 2023 to October 31, 2024. You can find additional information about the Fund at www.jpmorganfunds.com/funddocuments. You can also request this information by contacting us at 1-844-457-6383 or by sending an e-mail request to jpm.xf@jpmorgan.com or by asking any financial intermediary that offers shares of the Fund.
What were the Fund costs for the last year?
(based on a hypothetical $10,000 investment)
| Fund | Costs of a
$10,000 investment | Costs paid as a percentage
of a $10,000 investment |
| JPMorgan International Research Enhanced Equity ETF | $26 | 0.24% |
How did the Fund Perform?
The JPMorgan International Research Enhanced Equity ETF returned 21.10% for the year ended October 31, 2024. The MSCI EAFE Index (net total return) (the "Index") returned 22.97% for the year ended October 31, 2024.
The Fund’s security selection in the consumer staples and technology-software sectors detracted from performance relative to the Index.
The Fund’s security selection in the basic industries and consumer cyclical & services sectors contributed to performance relative to the Index.
| AVERAGE ANNUAL TOTAL RETURNS | INCEPTION
DATE | 1 YEAR | | 5 YEAR | | 10 YEAR | |
| JPMorgan International Research Enhanced Equity ETF - Net Asset Value | October 28, 1992* | 21.10 | % | 6.48 | % | 5.28 | % |
| MSCI EAFE Index (net total return) | | 22.97 | | 6.24 | | 5.27 | |
| * | Inception date for Class R6 Shares of the Predecessor Fund (as defined below). |
The performance quoted is past performance and is not a guarantee of future results. Exchange-traded funds are subject to certain market risks. Investment returns and principal value of an investment will fluctuate so that an investor’s shares, when sold or redeemed, may be worth more or less than their original cost. Current performance may be higher or lower than the performance data shown. Updated performance information is available by visiting www.jpmorganfunds.com or by calling 1-844-457-6383.
JPMorgan International Research Enhanced Equity ETF (the “Fund”) acquired the assets and liabilities of the JPMorgan International Research Enhanced Equity Fund (“Predecessor Fund”) in a reorganization that occurred as of the close of business on June 10, 2022. Performance and financial history of the Predecessor Fund’s Class R6 Shares have been adopted by the Fund and will be used going forward. As a result, the performance for the Fund prior to close of business on June 10, 2022 is the performance of the Predecessor Fund’s Class R6 Shares. Inception date for the Predecessor Fund’s Class R6 Shares is November 1, 2017. Returns for the Predecessor Fund’s Class R6 Shares prior to their inception date are based on the performance of the Predecessors Fund’s Class I Shares. The actual returns of the Predecessor Fund’s Class R6 Shares would have been different than those shown because the Predecessor Fund’s Class R6 Shares had different expenses than the Predecessor Fund’s Class I Shares. Inception date for the Predecessor Fund’s Class I Shares is October 28, 1992.
Performance for the Fund’s shares has not been adjusted to reflect the Fund’s shares’ lower expenses than those of the Predecessor Fund’s Class R6 Shares and Class I Shares. Had the Predecessor Fund been structured as an exchange-traded fund (“ETF”), its performance may have differed. Performance for the Predecessor Fund is based on the net asset value ("NAV") per share of the Predecessor Fund Shares rather than on market-determined prices. Prior to the Fund’s listing on June 13, 2022, the NAV performance of the Fund and the Class R6 Shares of the Predecessor Fund are used as proxy market price returns.
The graph illustrates comparative performance for $10,000 invested in shares of the Fund and the MSCI EAFE Index (net total return) from October 31, 2014 to October 31, 2024. The performance of the Fund assumes reinvestment of all dividends and capital gain distributions, if any. The performance of the MSCI EAFE Index (net total return) does not reflect the deduction of expenses associated with an ETF and approximates the minimum possible dividend reinvestment of the securities included in the benchmark, if applicable. The MSCI EAFE Index (net total return) is a free float-adjusted market capitalization weighted index that is designed to measure the performance of large- and mid- cap stocks in developed markets, excluding the U.S. and Canada. Net total return figures assume the reinvestment of dividends after deduction of withholding tax, applying the maximum rate to nonresident individual investors who do not benefit from double taxation treaties. Investors cannot invest directly in an index.
Fund performance may reflect the waiver of the Fund’s fees and reimbursement of expenses for certain periods since the applicable inception date. Without these waivers and reimbursements, performance would have been lower. Also, performance shown in this section does not reflect the deduction of taxes that a shareholder would pay on Fund distributions or on gains resulting from redemption or sale of Fund shares.
The returns shown are based on net asset values calculated for shareholder transactions and may differ from the returns shown in the financial highlights, which reflect adjustments made to the net asset values in accordance with accounting principles generally accepted in the United States of America.
Source: MSCI. The MSCI information may only be used for your internal use, may not be reproduced or redisseminated in any form and may not be used as a basis for or a component of any financial instruments or products or indices. None of the MSCI information is intended to constitute investment advice or a recommendation to make (or refrain from making) any kind of investment decision and may not be relied on as such. Historical data and analysis should not be taken as an indication or guarantee of any future performance analysis, forecast, or prediction. The MSCI information is provided on an "as is" basis and the user of this information assumes the entire risk of any use made of this information. MSCI, each of its affiliates and each other person involved in or related to compiling, computing or creating any MSCI information (collectively, the "MSCI Parties") expressly disclaims all warranties (including, without limitation, any warranties of originality, accuracy, completeness, timeliness, non-infringement, merchantability and fitness for a particular purpose) with respect to this information. Without limiting any of the foregoing, in no event shall any MSCI Party have any liability for any direct, indirect, special, incidental, punitive, consequential (including, without limitation, lost profits) or any other damages. (www.msci.com)
| Fund net assets | $6,503,810,493 | |
| Total number of portfolio holdings | 198 | |
| Portfolio turnover rate | 19 | % |
| Total advisory fees paid | $12,387,024 | |
PORTFOLIO COMPOSITION - COUNTRY
(% of Total Investments)
Availability of Additional Information
At www.jpmorganfunds.com/funddocuments, you can find additional information about the Fund, including the Fund’s:
Prospectus
Financial information
Fund holdings
Proxy voting information
You can also request this information by contacting us at 1-844-457-6383.
ANNUAL SHAREHOLDER REPORT | October 31, 2024 (Unaudited)
JPMorgan International Value ETF
Ticker: JIVE - The NASDAQ Stock Market® LLC
ANNUAL SHAREHOLDER REPORT
This annual shareholder report contains important information about the JPMorgan International Value ETF (the "Fund") for the period of November 1, 2023 to October 31, 2024. You can find additional information about the Fund at www.jpmorganfunds.com/funddocuments. You can also request this information by contacting us at 1-844-457-6383 or by sending an e-mail request to jpm.xf@jpmorgan.com or by asking any financial intermediary that offers shares of the Fund.
What were the Fund costs for the last year?
(based on a hypothetical $10,000 investment)
| Fund | Costs of a
$10,000 investment | Costs paid as a percentage
of a $10,000 investment |
| JPMorgan International Value ETF | $62 | 0.55% |
How did the Fund Perform?
The JPMorgan International Value ETF returned 25.35% for the year ended October 31, 2024. The MSCI ACWI ex USA Index (net total return) returned 24.33% and the MSCI ACWI ex USA Value Index (net total return) (the "Index") returned 23.56% for the year ended October 31, 2024.
The Fund’s security selection in the banks and insurance sectors contributed to performance relative to the Index.
The Fund’s security selection in the energy sector and no exposure to the software & services sector detracted from performance relative to the Index.
Fund Performance
| AVERAGE ANNUAL TOTAL RETURNS | INCEPTION
DATE | 1 YEAR | | SINCE
INCEPTION | |
| JPMorgan International Value ETF - Net Asset Value | September 13, 2023 | 25.35 | % | 17.61 | % |
| MSCI ACWI ex USA Index (net total return) | | 24.33 | | 14.54 | |
| MSCI ACWI ex USA Value Index (net total return) | | 23.56 | | 14.67 | |
The performance quoted is past performance and is not a guarantee of future results. Exchange-traded funds are subject to certain market risks. Investment returns and principal value of an investment will fluctuate so that an investor’s shares, when sold or redeemed, may be worth more or less than their original cost. Current performance may be higher or lower than the performance data shown. Updated performance information is available by visiting www.jpmorganfunds.com or by calling 1-844-457-6383.
The graph illustrates comparative performance for $10,000 invested in shares of the JPMorgan International Value ETF, the MSCI ACWI ex USA Index (net total return) and the MSCI ACWI ex USA Value Index (net total return) from September 13, 2023 to October 31, 2024. The performance of the Fund reflects the deduction of Fund expenses and assumes reinvestment of all dividends and capital gain distributions, if any. The performance of the MSCI ACWI ex USA Index (net total return) and the MSCI ACWI ex USA Value Index (net total return) does not reflect the deduction of expenses associated with an exchange-traded fund and approximates the minimum possible dividend reinvestment of these securities included in the benchmarks, if applicable. The MSCI ACWI ex USA Index (net total return) is a free float-adjusted market capitalization weighted index that is designed to measure the performance of large- and mid- cap stocks in developed and emerging markets, excluding the U.S. Net total return figures assume the reinvestment of dividends after deduction of withholding tax, applying the maximum rate to nonresident individual investors who do not benefit from double taxation treaties. The MSCI ACWI ex USA Value Index (net total return) captures large- and mid- cap securities exhibiting overall value style characteristics across 22 Developed and 24 Emerging Markets countries. The value investment style characteristics for index construction are defined using three variables: book value to price, 12-month forward earnings to price and dividend yield. Investors cannot invest directly in an index. As a result of new regulatory requirements, effective July 24, 2024, the Fund's regulatory index has changed from the Index, as defined above, to the MSCI ACWI ex USA Index (net total return), a broad-based securities market index. In addition to the Fund's performance, the tables in this section include performance of the new regulatory index and the Index.
Performance shown in this section does not reflect the deduction of taxes that a shareholder may pay on Fund distributions or on gains resulting from redemption or sale of Fund shares.
International investing involves a greater degree of risk and increased volatility. Changes in currency exchange rates and differences in accounting and taxation policies outside the United States can raise or lower returns. Also, some overseas markets may not be as politically and economically stable as the United States and other nations.
The returns shown are based on net asset values calculated for shareholder transactions and may differ from the returns shown in the financial highlights, which reflect adjustments made to the net asset values in accordance with accounting principles generally accepted in the United States of America.
Source: MSCI. The MSCI information may only be used for your internal use, may not be reproduced or redisseminated in any form and may not be used as a basis for or a component of any financial instruments or products or indices. None of the MSCI information is intended to constitute investment advice or a recommendation to make (or refrain from making) any kind of investment decision and may not be relied on as such. Historical data and analysis should not be taken as an indication or guarantee of any future performance analysis, forecast, or prediction. The MSCI information is provided on an "as is" basis and the user of this information assumes the entire risk of any use made of this information. MSCI, each of its affiliates and each other person involved in or related to compiling, computing or creating any MSCI information (collectively, the "MSCI Parties") expressly disclaims all warranties (including, without limitation, any warranties of originality, accuracy, completeness, timeliness, non-infringement, merchantability and fitness for a particular purpose) with respect to this information. Without limiting any of the foregoing, in no event shall any MSCI Party have any liability for any direct, indirect, special, incidental, punitive, consequential (including, without limitation, lost profits) or any other damages. (www.msci.com)
| Fund net assets | $103,038,901 | |
| Total number of portfolio holdings | 329 | |
| Portfolio turnover rate | 55 | % |
| Total advisory fees paid | $198,365 | |
PORTFOLIO COMPOSITION - COUNTRY
(% of Total Investments)
Availability of Additional Information
At www.jpmorganfunds.com/funddocuments, you can find additional information about the Fund, including the Fund’s:
Prospectus
Financial information
Fund holdings
Proxy voting information
You can also request this information by contacting us at 1-844-457-6383.
ANNUAL SHAREHOLDER REPORT | October 31, 2024 (Unaudited)
JPMorgan Sustainable Infrastructure ETF
Ticker: BLLD - The NASDAQ Stock Market® LLC
ANNUAL SHAREHOLDER REPORT
This annual shareholder report contains important information about the JPMorgan Sustainable Infrastructure ETF (the "Fund") for the period of November 1, 2023 to October 31, 2024. You can find additional information about the Fund at www.jpmorganfunds.com/funddocuments. You can also request this information by contacting us at 1-844-457-6383 or by sending an e-mail request to jpm.xf@jpmorgan.com or by asking any financial intermediary that offers shares of the Fund.
What were the Fund costs for the last year?
(based on a hypothetical $10,000 investment)
| Fund | Costs of a
$10,000 investment | Costs paid as a percentage
of a $10,000 investment |
| JPMorgan Sustainable Infrastructure ETF | $55 | 0.49% |
How did the Fund Perform?
The JPMorgan Sustainable Infrastructure ETF returned 24.78% for the year ended October 31, 2024. The MSCI ACWI Index (net total return) (the "Index") returned 32.79% for the year ended October 31, 2024.
The Fund’s security selection in the utilities and information technology sectors detracted from performance relative to the Index.
The Fund’s security selection in the health care and energy sectors contributed to performance relative to the Index.
| AVERAGE ANNUAL TOTAL RETURNS | INCEPTION
DATE | 1 YEAR | | SINCE
INCEPTION | |
| JPMorgan Sustainable Infrastructure ETF - Net Asset Value | September 7, 2022 | 24.78 | % | 4.98 | % |
| MSCI ACWI Index (net total return) | | 32.79 | | 17.69 | |
The performance quoted is past performance and is not a guarantee of future results. Exchange-traded funds are subject to certain market risks. Investment returns and principal value of an investment will fluctuate so that an investor’s shares, when sold or redeemed, may be worth more or less than their original cost. Current performance may be higher or lower than the performance data shown. Updated performance information is available by visiting www.jpmorganfunds.com or by calling 1-844-457-6383.
The graph illustrates comparative performance for $10,000 invested in shares of the JPMorgan Sustainable Infrastructure ETF and the MSCI ACWI Index (net total return) from September 7, 2022 to October 31, 2024. The performance of the Fund reflects the deduction of Fund expenses and assumes reinvestment of all dividends and capital gain distributions, if any. The performance of the MSCI ACWI Index (net total return) does not reflect the deduction of expenses associated with an exchange-traded fund and has been adjusted to reflect reinvestment of all dividends and capital gain distributions of the securities included in the Index, if applicable. The MSCI ACWI Index (net total return) is a free float-adjusted market capitalization-weighted index that is designed to measure the performance of large- and mid-cap stocks in developed and emerging markets. Net total return figures assume the reinvestment of dividends after deduction of withholding tax, applying the maximum rate to nonresident individual investors who do not benefit from double taxation treaties. Investors cannot invest directly in an index.
Performance shown in this section does not reflect the deduction of taxes that a shareholder may pay on Fund distributions or on gains resulting from redemption or sale of Fund shares.
International investing involves a greater degree of risk and increased volatility. Changes in currency exchange rates and differences in accounting and taxation policies outside the United States can raise or lower returns. Also, some overseas markets may not be as politically and economically stable as the United States and other nations.
The returns shown are based on net asset values calculated for shareholder transactions and may differ from the returns shown in the financial highlights, which reflect adjustments made to the net asset values in accordance with accounting principles generally accepted in the United States of America.
Source: MSCI. The MSCI information may only be used for your internal use, may not be reproduced or redisseminated in any form and may not be used as a basis for or a component of any financial instruments or products or indices. None of the MSCI information is intended to constitute investment advice or a recommendation to make (or refrain from making) any kind of investment decision and may not be relied on as such. Historical data and analysis should not be taken as an indication or guarantee of any future performance analysis, forecast, or prediction. The MSCI information is provided on an "as is" basis and the user of this information assumes the entire risk of any use made of this information. MSCI, each of its affiliates and each other person involved in or related to compiling, computing or creating any MSCI information (collectively, the "MSCI Parties") expressly disclaims all warranties (including, without limitation, any warranties of originality, accuracy, completeness, timeliness, non-infringement, merchantability and fitness for a particular purpose) with respect to this information. Without limiting any of the foregoing, in no event shall any MSCI Party have any liability for any direct, indirect, special, incidental, punitive, consequential (including, without limitation, lost profits) or any other damages. (www.msci.com)
| Fund net assets | $22,111,123 | |
| Total number of portfolio holdings | 62 | |
| Portfolio turnover rate | 51 | % |
| Total advisory fees paid | $122,083 | |
PORTFOLIO COMPOSITION - COUNTRY
(% of Total Investments)
Availability of Additional Information
At www.jpmorganfunds.com/funddocuments, you can find additional information about the Fund, including the Fund’s:
Prospectus
Financial information
Fund holdings
Proxy voting information
You can also request this information by contacting us at 1-844-457-6383.
ANNUAL SHAREHOLDER REPORT | October 31, 2024 (Unaudited)
JPMorgan U.S. Momentum Factor ETF
Ticker: JMOM - NYSE Arca, Inc.
ANNUAL SHAREHOLDER REPORT
This annual shareholder report contains important information about the JPMorgan U.S. Momentum Factor ETF (the "Fund") for the period of November 1, 2023 to October 31, 2024. You can find additional information about the Fund at www.jpmorganfunds.com/funddocuments. You can also request this information by contacting us at 1-844-457-6383 or by sending an e-mail request to jpm.xf@jpmorgan.com or by asking any financial intermediary that offers shares of the Fund.
What were the Fund costs for the last year?
(based on a hypothetical $10,000 investment)
| Fund | Costs of a
$10,000 investment | Costs paid as a percentage
of a $10,000 investment |
| JPMorgan U.S. Momentum Factor ETF | $15 | 0.12% |
How did the Fund Perform?
The JPMorgan U.S. Momentum Factor ETF returned 43.86% for the year ended October 31, 2024. The Russell 1000 Index returned 38.07%, the JP Morgan US Momentum Factor Index (the "Index") returned 43.93%, and the Russell 1000 Growth Index returned 43.77% for the year ended October 31, 2024.
The Fund seeks investment results that closely correspond, before fees and expenses, to the performance of the Index. The Fund performed in line with the Index, before considering operating expenses, fees and tax management of the Fund’s portfolio.
On a relative basis to the Russell 1000 Index, the Fund’s and the Index's largest contributor to returns was their security selection within the industrials and consumer discretionary sectors, while their largest detractor from returns was their security selection within the financials and information technology sectors.
| AVERAGE ANNUAL TOTAL RETURNS | INCEPTION
DATE | 1 YEAR | | 5 YEAR | | SINCE
INCEPTION | |
| JPMorgan U.S. Momentum Factor ETF - Net Asset Value | November 8, 2017 | 43.86 | % | 15.67 | % | 13.79 | % |
| Russell 1000 Index | | 38.07 | | 15.00 | | 13.63 | |
| JP Morgan US Momentum Factor Index | | 43.93 | | 15.80 | | 13.93 | |
| Russell 1000 Growth Index | | 43.77 | | 19.00 | | 17.38 | |
The performance quoted is past performance and is not a guarantee of future results. Exchange-traded funds are subject to certain market risks. Investment returns and principal value of an investment will fluctuate so that an investor’s shares, when sold or redeemed, may be worth more or less than their original cost. Current performance may be higher or lower than the performance data shown. Updated performance information is available by visiting www.jpmorganfunds.com or by calling 1-844-457-6383.
The graph illustrates comparative performance for $10,000 invested in shares of the JPMorgan U.S. Momentum Factor ETF, the Russell 1000 Index, the JP Morgan US Momentum Factor Index and the Russell 1000 Growth Index from November 8, 2017 to October 31, 2024. The performance of the Fund reflects the deduction of Fund expenses and assumes reinvestment of all dividends and capital gain distributions, if any. The performance of the Russell 1000 Index, JP Morgan US Momentum Factor Index and Russell 1000 Growth Index does not reflect the deduction of expenses associated with an exchange-traded fund and has been adjusted to reflect reinvestment of all dividends and capital gain distributions of the securities included in the index, if applicable. The Fund’s adviser is a sponsor of the JP Morgan US Momentum Factor Index and developed the proprietary factors on which the index is based. FTSE International Limited, the benchmark administrator, administers, calculates and governs the JP Morgan US Momentum Factor Index. The Russell 1000 Index is a market capitalization-weighted index, which measures the performance of the 1,000 largest companies in the Russell 3000 Index. The JP Morgan US Momentum Factor Index contains U.S. large- and mid-cap equity securities selected from the Russell 1000 Index, using a rules-based risk allocation and factor selection process. It is designed to reflect a subset of U.S. securities selected utilizing a momentum factor to identify companies that have had better recent performance compared to other securities without undue concentration in individual securities. The Russell 1000 Growth Index is an unmanaged index measuring the performance of those Russell 1000 companies with higher price-to-book ratios and higher forecasted growth values. Investors cannot invest directly in an index. As a result of new regulatory requirements, effective July 24, 2024, the Fund’s regulatory index has changed from the Index, as defined above, to the Russell 1000 Index, a broad-based securities market index. In addition to the Fund’s performance, the tables in this section include performance of the new regulatory index, the Index and an additional supplemental index.
For periods presented prior to November 1, 2019, the date on which a unitary fee structure was adopted, Fund performance reflects the waiver of the Fund’s fees and reimbursement of expenses for certain periods since the inception date. Without these waivers and reimbursements, performance would have been lower. Also, performance shown in this section does not reflect the deduction of taxes that a shareholder may pay on Fund distributions or on gains resulting from redemption or sale of Fund shares.
The returns shown are based on net asset values calculated for shareholder transactions and may differ from the returns shown in the financial highlights, which reflect adjustments made to the net asset values in accordance with accounting principles generally accepted in the United States of America.
Frank Russell Company is the source and owner of the Russell Index data contained or reflected in this material and all trademarks and copyrights related thereto. Frank Russell Company is not responsible for the formatting or configuration of this material or for any inaccuracy in the adviser's presentation thereof.
| Fund net assets | $1,159,170,843 | |
| Total number of portfolio holdings | 280 | |
| Portfolio turnover rate | 40 | % |
| Total advisory fees paid | $949,805 | |
PORTFOLIO COMPOSITION - SECTOR
(% of Total Investments)
Availability of Additional Information
At www.jpmorganfunds.com/funddocuments, you can find additional information about the Fund, including the Fund’s:
Prospectus
Financial information
Fund holdings
Proxy voting information
You can also request this information by contacting us at 1-844-457-6383.
ANNUAL SHAREHOLDER REPORT | October 31, 2024 (Unaudited)
JPMorgan U.S. Quality Factor ETF
Ticker: JQUA - NYSE Arca, Inc.
ANNUAL SHAREHOLDER REPORT
This annual shareholder report contains important information about the JPMorgan U.S. Quality Factor ETF (the "Fund") for the period of November 1, 2023 to October 31, 2024. You can find additional information about the Fund at www.jpmorganfunds.com/funddocuments. You can also request this information by contacting us at 1-844-457-6383 or by sending an e-mail request to jpm.xf@jpmorgan.com or by asking any financial intermediary that offers shares of the Fund.
What were the Fund costs for the last year?
(based on a hypothetical $10,000 investment)
| Fund | Costs of a
$10,000 investment | Costs paid as a percentage
of a $10,000 investment |
| JPMorgan U.S. Quality Factor ETF | $14 | 0.12% |
How did the Fund Perform?
The JPMorgan U.S. Quality Factor ETF returned 34.23% for the year ended October 31, 2024. The Russell 1000 Index returned 38.07% and the JP Morgan US Quality Factor Index (the "Index") returned 34.21% for the year ended October 31, 2024.
The Fund seeks investment results that closely correspond, before fees and expenses, to the performance of the Index. The Fund performed in line with the Index, before considering operating expenses, fees and tax management of the Fund’s portfolio.
On a relative basis to the Russell 1000 Index, the Fund’s and the Index's largest detractor from returns was their security selection within the financials and industrials sectors, while their largest contributor to returns was their security selection within the consumer staples and health care sectors.
| AVERAGE ANNUAL TOTAL RETURNS | INCEPTION
DATE | 1 YEAR | | 5 YEAR | | SINCE
INCEPTION | |
| JPMorgan U.S. Quality Factor ETF - Net Asset Value | November 8, 2017 | 34.23 | % | 15.14 | % | 14.02 | % |
| Russell 1000 Index | | 38.07 | | 15.00 | | 13.63 | |
| JP Morgan US Quality Factor Index | | 34.21 | | 15.22 | | 14.14 | |
The performance quoted is past performance and is not a guarantee of future results. Exchange-traded funds are subject to certain market risks. Investment returns and principal value of an investment will fluctuate so that an investor’s shares, when sold or redeemed, may be worth more or less than their original cost. Current performance may be higher or lower than the performance data shown. Updated performance information is available by visiting www.jpmorganfunds.com or by calling 1-844-457-6383.
The graph illustrates comparative performance for $10,000 invested in shares of the JPMorgan U.S. Quality Factor ETF, the Russell 1000 Index and the JP Morgan US Quality Factor Index from November 8, 2017 to October 31, 2024. The performance of the Fund reflects the deduction of Fund expenses and assumes reinvestment of all dividends and capital gain distributions, if any. The performance of the Russell 1000 Index and JP Morgan US Quality Factor Index does not reflect the deduction of expenses associated with an exchange-traded fund and has been adjusted to reflect reinvestment of all dividends and capital gain distributions of the securities included in the index, if applicable. The Fund’s adviser is a sponsor of the JP Morgan US Quality Factor Index and developed the proprietary factors on which the index is based. FTSE International Limited, the benchmark administrator, administers, calculates and governs the JP Morgan US Quality Factor Index. The Russell 1000 Index is a market capitalization-weighted index, which measures the performance of the 1,000 largest companies in the Russell 3000 Index. The JP Morgan US Quality Factor Index contains U.S. large- and mid-cap equity securities selected from the Russell 1000 Index, using a rules-based risk allocation and factor selection process. It is designed to reflect a sub-set of U.S. securities selected utilizing a quality factor to identifying higher quality companies as measured by profitability, solvency, and earnings quality without undue concentration in individual securities. Investors cannot invest directly in an index. As a result of new regulatory requirements, effective July 24, 2024, the Fund’s regulatory index has changed from the Index, as defined above, to the Russell 1000 Index, a broad-based securities market index. In addition to the Fund’s performance, the tables in this section include performance of the new regulatory index and the Index.
For periods presented prior to November 1, 2019, the date on which a unitary fee structure was adopted, Fund performance reflects the waiver of the Fund’s fees and reimbursement of expenses for certain periods since the inception date. Without these waivers and reimbursements, performance would have been lower. Also, performance shown in this section does not reflect the deduction of taxes that a shareholder may pay on Fund distributions or on gains resulting from redemption or sale of Fund shares.
The returns shown are based on net asset values calculated for shareholder transactions and may differ from the returns shown in the financial highlights, which reflect adjustments made to the net asset values in accordance with accounting principles generally accepted in the United States of America.
Frank Russell Company is the source and owner of the Russell Index data contained or reflected in this material and all trademarks and copyrights related thereto. Frank Russell Company is not responsible for the formatting or configuration of this material or for any inaccuracy in the adviser's presentation thereof.
| Fund net assets | $5,024,521,643 | |
| Total number of portfolio holdings | 284 | |
| Portfolio turnover rate | 21 | % |
| Total advisory fees paid | $4,813,488 | |
PORTFOLIO COMPOSITION - SECTOR
(% of Total Investments)
Availability of Additional Information
At www.jpmorganfunds.com/funddocuments, you can find additional information about the Fund, including the Fund’s:
Prospectus
Financial information
Fund holdings
Proxy voting information
You can also request this information by contacting us at 1-844-457-6383.
ANNUAL SHAREHOLDER REPORT | October 31, 2024 (Unaudited)
JPMorgan U.S. Value Factor ETF
Ticker: JVAL - NYSE Arca, Inc.
ANNUAL SHAREHOLDER REPORT
This annual shareholder report contains important information about the JPMorgan U.S. Value Factor ETF (the "Fund") for the period of November 1, 2023 to October 31, 2024. You can find additional information about the Fund at www.jpmorganfunds.com/funddocuments. You can also request this information by contacting us at 1-844-457-6383 or by sending an e-mail request to jpm.xf@jpmorgan.com or by asking any financial intermediary that offers shares of the Fund.
What were the Fund costs for the last year?
(based on a hypothetical $10,000 investment)
| Fund | Costs of a
$10,000 investment | Costs paid as a percentage
of a $10,000 investment |
| JPMorgan U.S. Value Factor ETF | $14 | 0.12% |
How did the Fund Perform?
The JPMorgan U.S. Value Factor ETF returned 32.01% for the year ended October 31, 2024. The Russell 1000 Index returned 38.07%, the JP Morgan US Value Factor Index (the "Index") returned 32.01%, and the Russell 1000 Value Index returned 30.98% for the year ended October 31, 2024.
The Fund seeks investment results that closely correspond, before fees and expenses, to the performance of the Index. The Fund performed in line with the Index, before considering operating expenses, fees and tax management of the Fund’s portfolio.
On a relative basis to the Russell 1000 Index, the Fund’s and the Index's largest detractor from returns was their security selection within the technology and health care sectors, while their largest contributor to returns was their security selection within the financials and real estate sectors.
| AVERAGE ANNUAL TOTAL RETURNS | INCEPTION
DATE | 1 YEAR | | 5 YEAR | | SINCE
INCEPTION | |
| JPMorgan U.S. Value Factor ETF - Net Asset Value | November 8, 2017 | 32.01 | % | 12.31 | % | 10.80 | % |
| Russell 1000 Index | | 38.07 | | 15.00 | | 13.63 | |
| JP Morgan US Value Factor Index | | 32.01 | | 12.42 | | 11.02 | |
| Russell 1000 Value Index | | 30.98 | | 10.14 | | 9.23 | |
The performance quoted is past performance and is not a guarantee o f future results. Exchange-traded funds are subject to certain market risks. Investment returns and principal value of an investment will fluctuate so that an investor’s shares, when sold or redeemed, may be worth more or less than their original cost. Current performance may be higher or lower than the performance data shown. Updated performance information is available by visiting www.jpmorganfunds.com or by calling 1-844-457-6383.
The graph illustrates comparative performance for $10,000 invested in shares of the JPMorgan U.S. Value Factor ETF, the Russell 1000 Index, the JP Morgan US Value Factor Index and the Russell 1000 Value Index from November 8, 2017 to October 31, 2024. The performance of the Fund reflects the deduction of Fund expenses and assumes reinvestment of all dividends and capital gain distributions, if any. The performance of the Russell 1000 Index, JP Morgan US Value Factor Index and Russell 1000 Value Index does not reflect the deduction of expenses associated with an exchange-traded fund and has been adjusted to reflect reinvestment of all dividends and capital gain distributions of the securities included in the index, if applicable. The Fund’s adviser is a sponsor of the JP Morgan US Value Factor Index and developed the proprietary factors on which the index is based. FTSE International Limited, the benchmark administrator, administers, calculates and governs the JP Morgan US Value Factor Index. The Russell 1000 Index is a market capitalization-weighted index, which measures the performance of the 1,000 largest companies in the Russell 3000 Index. The JP Morgan US Value Factor Index contains U.S. large- and mid-cap equity securities selected from the Russell 1000 Index, using a rules-based risk allocation and factor selection process. It is designed to reflect a sub-set of U.S. securities selected utilizing a value factor to identify companies with attractive valuations without undue concentration in individual securities. The Russell 1000 Value Index is an unmanaged index measuring the performance of those Russell 1000 companies with lower price-to-book ratios and lower forecasted growth values. Investors cannot invest directly in an index. As a result of new regulatory requirements, effective July 24, 2024, the Fund’s regulatory index has changed from the Index, as defined above, to the Russell 1000 Index, a broad-based securities market index. In addition to the Fund’s performance, the tables in this section include performance of the new regulatory index, the Index and an additional supplemental index.
For periods presented prior to November 1, 2019, the date on which a unitary fee structure was adopted, Fund performance reflects the waiver of the Fund’s fees and reimbursement of expenses for certain periods since the inception date. Without these waivers and reimbursements, performance would have been lower. Also, performance shown in this section does not reflect the deduction of taxes that a shareholder may pay on Fund distributions or on gains resulting from redemption or sale of Fund shares.
The returns shown are based on net asset values calculated for shareholder transactions and may differ from the returns shown in the financial highlights, which reflect adjustments made to the net asset values in accordance with accounting principles generally accepted in the United States of America.
Frank Russell Company is the source and owner of the Russell Index data contained or reflected in this material and all trademarks and copyrights related thereto. Frank Russell Company is not responsible for the formatting or configuration of this material or for any inaccuracy in the adviser's presentation thereof.
| Fund net assets | $676,817,043 | |
| Total number of portfolio holdings | 374 | |
| Portfolio turnover rate | 26 | % |
| Total advisory fees paid | $893,468 | |
PORTFOLIO COMPOSITION - SECTOR
(% of Total Investments)
Availability of Additional Information
At www.jpmorganfunds.com/funddocuments, you can find additional information about the Fund, including the Fund’s:
Prospectus
Financial information
Fund holdings
Proxy voting information
You can also request this information by contacting us at 1-844-457-6383.
ITEM 2. CODE OF ETHICS.
Disclose whether, as of the end of the period covered by the report, the registrant has adopted a code of ethics that applies to the registrant’s principal executive officer, principal financial officer, principal accounting officer or controller, or persons performing similar functions, regardless of whether these individuals are employed by the registrant or a third party. If the registrant has not adopted such a code of ethics, explain why it has not done so.
The registrant must briefly describe the nature of any amendment, during the period covered by the report, to a provision of its code of ethics that applies to the registrant’s principal executive officer, principal financial officer, principal accounting officer or controller, or persons performing similar functions, regardless of whether these individuals are employed by the registrant or a third party, and that relates to any element of the code of ethics definition enumerated in paragraph (b) of this Item. The registrant must file a copy of any such amendment as an exhibit pursuant to Item 13(a)(1), unless the registrant has elected to satisfy paragraph (f) of this Item by positing its code of ethics on its website pursuant to paragraph (f)(2) of this Item, or by undertaking to provide its code of ethics to any person without charge, upon request, pursuant to paragraph (f)(3) of this Item.
If the registrant has, during the period covered by the report, granted a waiver, including an implicit waiver, from a provision of the code of ethics that applies to the registrant’s principal executive officer, principal financial officer, principal accounting officer or controller, or persons performing similar functions, regardless of whether these individuals are employed by the registrant or third party, that relates to one or more items set forth in paragraph (b) of this Item, the registrant must briefly describe the nature of the waiver, the name of the person to whom the waiver was granted, and the date of the waiver.
The Registrant has adopted a code of ethics that applies to the Registrant’s principal executive officer and principal financial officer. There were no amendments to the code of ethics or waivers granted with respect to the code of ethics in the period covered by the report.
ITEM 3. AUDIT COMMITTEE FINANCIAL EXPERT.
(a) (1) Disclose that the registrant’s board of directors has determined that the registrant either:
(i) Has at least one audit committee financial expert serving on its audit committee; or
(ii) Does not have an audit committee financial expert serving on its audit committee.
The Registrant’s Board of Trustees has determined that the Registrant has at least one audit committee financial expert serving on its audit committee. The Securities and Exchange Commission has stated that the designation or identification of a person as an audit committee financial expert pursuant to this Item 3 of Form N-CSR does not impose on such person any duties, obligations or liabilities that are greater than the duties, obligations and liabilities imposed on such person as a member of the Audit Committee and the Board of Trustees in the absence of such designation or identification.
(2) If the registrant provides the disclosure required by paragraph (a)(1)(i) of this Item, it must disclose the name of the audit committee financial expert and whether that person is “independent.” In order to be considered “independent” for purposes of this Item, a member of an audit committee may not, other than in his or her capacity as a member of the audit committee, the board of directors, or any other board committee:
(i) Accept directly or indirectly any consulting, advisory, or other compensatory fee from the issuer; or
(ii) Be an “interested person” of the investment company as defined in Section 2(a)(19) of the Act (15 U.S.C. 80a-2(a)(19)).
The Audit committee financial experts are Gary L. French, Kathleen M. Gallagher, Raymond Kanner and Lawrence R. Maffia, each of whom is not an “interested person” of the Registrant and is also “independent” as defined by the U.S. Securities and Exchange Commission for the purposes of the audit committee financial expert determination.
(3) If the registrant provides the disclosure required by paragraph (a)(1)(ii) of this Item, it must explain why it does not have an audit committee financial expert.
Not applicable.
ITEM 4. PRINCIPAL ACCOUNTANT FEES AND SERVICES.
(a) Disclose, under the caption Audit Fees, the aggregate fees billed for each of the last two fiscal years for professional services rendered by the principal accountant for the audit of the registrant’s annual financial statements or services that are normally provided by the accountant in connection with statutory and regulatory filings or engagements for those fiscal years.
|
AUDIT FEES 2024 – $949,926 2023 – $863,957 |
(b) Disclose, under the caption Audit-Related Fees, the aggregate fees billed in each of the last two fiscal years for assurance and related services by the principal accountant that are reasonably related to the performance of the audit of the registrant’s financial statements and are not reported under paragraph (a) of this Item. Registrants shall describe the nature of the services comprising the fees disclosed under this category.
|
AUDIT-RELATED FEES |
2024 – $226,308 |
2023 – $220,032 |
Audit-related fees consists of security count procedures performed as required under Rule 17f-2 of the Investment Company Act of 1940 during the Registrant’s fiscal year.
(c) Disclose, under the caption Tax Fees, the aggregate fees billed in each of the last two fiscal years for professional services rendered by the principal accountant for tax compliance, tax advice, and tax planning. Registrants shall describe the nature of the services comprising the fees disclosed under this category.
|
TAX FEES 2024 – $336,340 2023 – $331,063 |
The tax fees consist of fees billed in connection with preparing the federal regulated investment company income tax returns for the Registrant for the tax years ended October 31, 2024 and 2023, respectively.
For the last fiscal year, no tax fees were required to be approved pursuant to paragraph (c)(7)(ii) of Rule 2-01 of Regulation S-X.
(d) Disclose, under the caption All Other Fees, the aggregate fees billed in each of the last two fiscal years for products and services provided by the principal accountant, other than the services reported in paragraphs (a) through (c) of this Item. Registrants shall describe the nature of the services comprising the fees disclosed under this category.
|
ALL OTHER FEES |
2024 – $0 |
| 2023 – $0 |
(e) (1) Disclose the audit committee’s pre-approval policies and procedures described in paragraph (c)(7) of Rule 2-01 of Regulation S-X.
Pursuant to the Registrant’s Audit Committee Charter and written policies and procedures for the pre-approval of audit and non-audit services (the “Pre-approval Policy”), the Audit Committee pre-approves all audit and non-audit services performed by the Registrant’s independent public registered accounting firm for the Registrant. In addition, the Audit Committee pre-approves the auditor’s engagement for non-audit services with the Registrant’s investment adviser (not including a sub-adviser whose role is primarily portfolio management and is sub-contracted or overseen by another investment adviser) and any Service Affiliate in accordance with paragraph (c)(7)(ii) of Rule 2-01 of Regulation S-X, if the engagement relates directly to the operations and financial reporting of the Registrant. Proposed services may be pre-approved either 1) without consideration of specific case-by-case services or 2) require the specific pre-approval of the Audit Committee. Therefore, initially the Pre-approval Policy listed a number of audit and non-audit services that have been approved by the Audit Committee, or which were not subject to pre-approval under the transition provisions of Sarbanes-Oxley Act of 2002 (the
“Pre-approval List”). The Audit Committee annually reviews and pre-approves the services included on the Pre-approval List that may be provided by the independent public registered accounting firm without obtaining additional specific pre-approval of individual services from the Audit Committee. The Audit Committee adds to, or subtracts from, the list of general pre-approved services from time to time, based on subsequent determinations. All other audit and non-audit services not on the Pre-approval List must be specifically pre-approved by the Audit Committee.
One or more members of the Audit Committee may be appointed as the Committee’s delegate for the purposes of considering whether to approve such services. Any pre-approvals granted by the delegate will be reported, for informational purposes only, to the Audit Committee at its next scheduled meeting. The Audit Committee’s responsibilities to pre-approve services performed by the independent public registered accounting firm are not delegated to management.
(2) Disclose the percentage of services described in each of paragraphs (b) through (d) of this Item that were approved by the audit committee pursuant to paragraph (c)(7)(i)(C) of Rule 2-01 of Regulation S-X.
(f) If greater than 50 percent, disclose the percentage of hours expended on the principal accountant’s engagement to audit the registrant’s financial statements for the most recent fiscal year that were attributed to work performed by persons other than the principal accountant’s full-time, permanent employees.
Not applicable
(g) Disclose the aggregate non-audit fees billed by the registrant’s accountant for services rendered to the registrant, and rendered to the registrant’s investment adviser (not including any sub-adviser whose role is primarily portfolio management and is subcontracted with or overseen by another investment adviser), and any entity controlling, controlled by, or under common control with the adviser that provides ongoing services to the registrant for each of the last two fiscal years of the registrant.
The aggregate non-audit fees billed by the independent registered public accounting firm for services rendered to the Registrant, and rendered to Service Affiliates, for the last two calendar year ends were:
| | | | |
2023 – $35.5 million 2022 – $32.2 million | | | | |
(h) Disclose whether the registrant’s audit committee of the board of directors has considered whether the provision of non-audit services that were rendered to the registrant’s investment adviser (not including any subadvisor whose role is primarily portfolio management and is subcontracted with or overseen by another investment adviser), and any entity controlling, controlled by, or under common control with the investment adviser that provides ongoing services to the registrant that were not pre-approved pursuant to paragraph (c)(7)(ii) of Rule 2-01 of Regulation S-X is compatible with maintaining the principal accountant’s independence.
The Registrant’s Audit Committee has considered whether the provision of the non-audit services that were rendered to Service Affiliates that were not pre-approved (not requiring pre-approval) is compatible with maintaining the independent public registered accounting firm’s independence. All services provided by the independent public registered accounting firm to the Registrant or to Service Affiliates that were required to be pre-approved were pre-approved as required.
(i) A registrant identified by the Commission pursuant to Section 104(i)(2)(A) of the Sarbanes-Oxley Act of 2002 (15 U.S.C. 7214(i)(2)(A)), as having retained, for the preparation of the audit report on its financial statements included in the Form NCSR, a registered public accounting firm that has a branch or office that is located in a foreign jurisdiction and that the Public Company Accounting Oversight Board has determined it is unable to inspect or investigate completely because of a position taken by an authority in the foreign jurisdiction must electronically submit to the Commission on a supplemental basis documentation that establishes that the registrant is not owned or controlled by a governmental entity in the foreign jurisdiction. The registrant must submit this documentation on or before the due date for this form. A registrant that is owned or controlled by a foreign governmental entity is not required to submit such documentation.
Not applicable.
(j) A registrant that is a foreign issuer, as defined in 17 CFR 240.3b-4, identified by the Commission pursuant to Section 104(i)(2)(A) of the Sarbanes-Oxley Act of 2002 (15 U.S.C. 7214(i)(2)(A)), as having retained, for the preparation of the audit report on its financial statements included in the Form N-CSR, a registered public accounting firm that has a branch or office that is located in a foreign jurisdiction and that the Public Company Accounting Oversight Board has determined it is unable to inspect or investigate completely because of a position taken by an authority in the foreign jurisdiction, for each year in which the registrant is so identified, must
provide the below disclosures. Also, any such identified foreign issuer that uses a variable-interest entity or any similar structure that results in additional foreign entities being consolidated in the financial statements of the registrant is required to provide the below disclosures for itself and its consolidated foreign operating entity or entities. A registrant must disclose:
| | (1) | That, for the immediately preceding annual financial statement period, a registered public accounting firm that the PCAOB was unable to inspect or investigate completely, because of a position taken by an authority in the foreign jurisdiction, issued an audit report for the registrant; |
| | (2) | The percentage of shares of the registrant owned by governmental entities in the foreign jurisdiction in which the registrant is incorporated or otherwise organized; |
| | (3) | Whether governmental entities in the applicable foreign jurisdiction with respect to that registered public accounting firm have a controlling financial interest with respect to the registrant; |
| | (4) | The name of each official of the Chinese Communist Party who is a member of the board of directors of the registrant or the operating entity with respect to the registrant; and |
| | (5) | Whether the articles of incorporation of the registrant (or equivalent organizing document) contains any charter of the Chinese Communist Party, including the text of any such charter. |
Not applicable.
ITEM 5. AUDIT COMMITTEE OF LISTED REGISTRANTS.
(a) If the registrant is a listed issuer as defined in Rule 10A-3 under the Exchange Act (17CFR 240.10A-3), state whether or not the registrant has a separately-designated standing audit committee established in accordance with Section 3(a)(58)(A) of the Exchange Act (15 U.S.C. 78c(a)(58)(A)). If the registrant has such a committee, however designated, identify each committee member. If the entire board of directors is acting as the registrant’s audit committee as specified in Section 3(a)(58)(B) of the Exchange Act (15 U.S.C. 78c(a)(58)(B)), so state.
(b) If applicable, provide the disclosure required by Rule 10A-3(d) under the Exchange Act (17CFR 240.10A-3(d)) regarding an exemption from the listing standards for all audit committees.
Not applicable.
ITEM 6. INVESTMENTS.
File Schedule I – Investments in securities of unaffiliated issuers as of the close of the reporting period as set forth in Section 210.12-12 of Regulation S-X, unless the schedule is included as part of the report to shareholders filed under Item 1 of this Form.
Included in Item 1.
ITEM 7. FINANCIAL STATEMENTS AND FINANCIAL HIGHLIGHTS FOR OPEN-END MANAGEMENT INVESTMENT COMPANIES
Annual Financial Statements
J.P. Morgan Exchange-Traded Funds
October 31, 2024
| | |
JPMorgan BetaBuilders Canada ETF | | |
JPMorgan BetaBuilders Developed Asia Pacific ex-Japan ETF | | |
JPMorgan BetaBuilders Emerging Markets Equity ETF | | |
JPMorgan BetaBuilders Europe ETF | | |
JPMorgan BetaBuilders International Equity ETF | | |
JPMorgan BetaBuilders Japan ETF | | |
JPMorgan BetaBuilders U.S. Equity ETF | | |
JPMorgan BetaBuilders U.S. Mid Cap Equity ETF | | |
JPMorgan BetaBuilders U.S. Small Cap Equity ETF | | |
JPMorgan Carbon Transition U.S. Equity ETF | | |
JPMorgan Diversified Return Emerging Markets Equity ETF | | |
JPMorgan Diversified Return International Equity ETF | | |
JPMorgan Diversified Return U.S. Equity ETF | | |
JPMorgan Diversified Return U.S. Mid Cap Equity ETF | | |
JPMorgan Diversified Return U.S. Small Cap Equity ETF | | |
JPMorgan U.S. Momentum Factor ETF | | |
JPMorgan U.S. Quality Factor ETF | | |
JPMorgan U.S. Value Factor ETF | | |
CONTENTS
Investments in a Fund are not deposits or obligations of, or guaranteed or endorsed by, any bank and are not insured or guaranteed by the FDIC, the Federal Reserve Board or any other government agency. You could lose money if you sell when a Fund’s share price is lower than when you invested.
Past performance is no guarantee of future performance. The general market views expressed in this report are opinions based on market and other conditions through the end of the reporting period and are subject to change without notice. These views are not intended to predict the future performance of a Fund or the securities markets.
Prospective investors should refer to the Funds’ prospectus for a discussion of the Funds’ investment objectives, strategies and risks. Call J.P. Morgan Exchange-Traded Funds at (844) 457-6383 for a prospectus containing more complete information about a Fund, including management fees and other expenses. Please read it carefully before investing.
Shares are bought and sold throughout the day on an exchange at market price (not at net asset value) through a brokerage account, and are not individually subscribed and redeemed from a Fund. Shares may only be subscribed and redeemed directly from a Fund by Authorized Participants, in very large creation/redemption units. Brokerage commissions will reduce returns.
JPMorgan BetaBuilders Canada ETF
SCHEDULE OF PORTFOLIO INVESTMENTSAS OF October 31, 2024
| | |
|
Aerospace & Defense — 0.3% |
| | |
Automobile Components — 0.5% |
Magna International, Inc. | | |
|
| | |
Bank of Nova Scotia (The) | | |
Canadian Imperial Bank of Commerce (a) | | |
| | |
| | |
Toronto-Dominion Bank (The) | | |
| | |
|
Canadian Tire Corp. Ltd., Class A (a) | | |
| | |
| | |
|
Brookfield Asset Management Ltd., Class A | | |
| | |
| | |
| | |
| | |
|
| | |
Commercial Services & Supplies — 3.4% |
| | |
| | |
| | |
| | |
Construction & Engineering — 1.5% |
| | |
| | |
| | |
Consumer Staples Distribution & Retail — 3.8% |
Alimentation Couche-Tard, Inc. | | |
| | |
| | |
| | |
| | |
Containers & Packaging — 0.4% |
CCL Industries, Inc., Class B | | |
| | |
|
Diversified Telecommunication Services — 0.5% |
| | |
| | |
| | |
Electric Utilities — 2.0% |
| | |
| | |
| | |
| | |
|
| | |
|
| | |
Ground Transportation — 6.7% |
Canadian National Railway Co. | | |
Canadian Pacific Kansas City Ltd. | | |
| | |
| | |
Hotels, Restaurants & Leisure — 1.0% |
Restaurant Brands International, Inc. | | |
Independent Power and Renewable Electricity Producers — 0.2% |
Brookfield Renewable Corp. | | |
|
Fairfax Financial Holdings Ltd. | | |
| | |
| | |
| | |
| | |
| | |
| | |
| | |
|
| | |
| | |
| | |
|
| | |
| | |
First Quantum Minerals Ltd. * | | |
| | |
Ivanhoe Mines Ltd., Class A * | | |
| | |
SEE NOTES TO FINANCIAL STATEMENTS.
| J.P. Morgan Exchange-Traded Funds | |
JPMorgan BetaBuilders Canada ETF
SCHEDULE OF PORTFOLIO INVESTMENTSAS OF October 31, 2024 (continued)
| | |
Common Stocks — continued |
Metals & Mining — continued |
| | |
Teck Resources Ltd., Class B | | |
Wheaton Precious Metals Corp. | | |
| | |
|
Canadian Utilities Ltd., Class A | | |
Oil, Gas & Consumable Fuels — 17.5% |
| | |
| | |
Canadian Natural Resources Ltd. | | |
| | |
| | |
| | |
| | |
| | |
| | |
| | |
| | |
| | |
Paper & Forest Products — 0.2% |
West Fraser Timber Co. Ltd. | | |
Passenger Airlines — 0.1% |
| | |
Professional Services — 1.1% |
| | |
Real Estate Management & Development — 0.4% |
| | |
|
Canadian Apartment Properties | | |
|
Constellation Software, Inc. | | |
| | |
| | |
Textiles, Apparel & Luxury Goods — 0.4% |
| | |
Trading Companies & Distributors — 0.2% |
Finning International, Inc. | | |
| | |
|
Wireless Telecommunication Services — 0.6% |
Rogers Communications, Inc., Class B (a) | | |
Total Common Stocks
(Cost $5,487,417,829) | | |
| | |
|
|
Constellation Software, Inc., Zero Coupon, 3/31/2040 ‡ *
(Cost $-) | | |
| | |
Short-Term Investments — 3.2% |
Investment of Cash Collateral from Securities Loaned — 3.2% |
JPMorgan Securities Lending Money Market Fund Agency SL Class Shares, 4.85% (c) (d)(Cost $227,654,452) | | |
Total Investments — 102.3%
(Cost $5,715,072,281) | | |
Liabilities in Excess of Other Assets — (2.3)% | | |
| | |
Percentages indicated are based on net assets. |
| |
| Real Estate Investment Trust |
| Amount rounds to less than 0.1% of net assets. |
| Value determined using significant unobservable inputs. | |
| Non-income producing security. | |
| The security or a portion of this security is on loan at October 31, 2024. The total value of securities on loan at October 31, 2024 is $214,630,911. | |
| Security exempt from registration pursuant to Regulation S under the Securities Act of 1933, as amended. Regulation S applies to securities offerings that are made outside of the United States and do not involve direct selling efforts in the United States and as such may have restrictions on resale. | |
| Investment in an affiliated fund, which is registered under the Investment Company Act of 1940, as amended, and is advised by J.P. Morgan Investment Management Inc. | |
| The rate shown is the current yield as of October 31, 2024. | |
SEE NOTES TO FINANCIAL STATEMENTS.
| J.P. Morgan Exchange-Traded Funds | |
Futures contracts outstanding as of October 31, 2024:
| | | | | VALUE AND
UNREALIZED
APPRECIATION
(DEPRECIATION) ($) |
| | | | | |
| | | | | |
SEE NOTES TO FINANCIAL STATEMENTS.
| J.P. Morgan Exchange-Traded Funds | |
JPMorgan BetaBuilders Developed Asia Pacific ex-Japan ETF
SCHEDULE OF PORTFOLIO INVESTMENTSAS OF October 31, 2024
| | |
|
|
| | |
| | |
| | |
| | |
| | |
| | |
| | |
| | |
| | |
| | |
| | |
| | |
Commonwealth Bank of Australia | | |
| | |
| | |
| | |
| | |
| | |
| | |
Insurance Australia Group Ltd. | | |
| | |
| | |
| | |
Mineral Resources Ltd. (a) | | |
| | |
National Australia Bank Ltd. | | |
Northern Star Resources Ltd. | | |
| | |
| | |
Pilbara Minerals Ltd. * (a) | | |
| | |
| | |
| | |
| | |
| | |
| | |
| | |
| | |
| | |
Seven Group Holdings Ltd. (a) | | |
| | |
| | |
| | |
| | |
| | |
|
|
| | |
| | |
| | |
Treasury Wine Estates Ltd. | | |
| | |
Washington H Soul Pattinson & Co. Ltd. (a) | | |
| | |
| | |
| | |
Woodside Energy Group Ltd. | | |
| | |
| | |
| | |
|
Budweiser Brewing Co. APAC Ltd. (b) | | |
| | |
Wharf Holdings Ltd. (The) (a) | | |
Wilmar International Ltd. | | |
Wuxi Biologics Cayman, Inc. * (b) | | |
| | |
|
| | |
| | |
CK Infrastructure Holdings Ltd. | | |
| | |
Hang Lung Properties Ltd. | | |
| | |
Henderson Land Development Co. Ltd. | | |
| | |
Hong Kong & China Gas Co. Ltd. | | |
Hong Kong Exchanges & Clearing Ltd. | | |
Jardine Matheson Holdings Ltd. | | |
| | |
| | |
Power Assets Holdings Ltd. | | |
| | |
Sun Hung Kai Properties Ltd. | | |
Swire Pacific Ltd., Class A | | |
Swire Pacific Ltd., Class B | | |
| | |
Techtronic Industries Co. Ltd. | | |
SEE NOTES TO FINANCIAL STATEMENTS.
| J.P. Morgan Exchange-Traded Funds | |
| | |
Common Stocks — continued |
|
| | |
Wharf Real Estate Investment Co. Ltd. | | |
| | |
|
Galaxy Entertainment Group Ltd. | | |
| | |
| | |
|
Auckland International Airport Ltd. | | |
| | |
Fisher & Paykel Healthcare Corp. Ltd. | | |
| | |
| | |
| | |
| | |
|
CapitaLand Ascendas, REIT | | |
CapitaLand Integrated Commercial Trust, REIT | | |
CapitaLand Investment Ltd. | | |
| | |
| | |
| | |
Jardine Cycle & Carriage Ltd. | | |
| | |
Mapletree Pan Asia Commercial Trust, REIT | | |
Oversea-Chinese Banking Corp. Ltd. | | |
| | |
| | |
Singapore Technologies Engineering Ltd. | | |
Singapore Telecommunications Ltd. | | |
United Overseas Bank Ltd. | | |
| | |
|
CK Hutchison Holdings Ltd. | | |
|
| | |
James Hardie Industries plc, CHDI * | | |
| | |
Total Common Stocks
(Cost $4,541,173,014) | | |
| | |
Short-Term Investments — 0.7% |
Investment of Cash Collateral from Securities Loaned — 0.7% |
JPMorgan Securities Lending Money Market Fund Agency SL Class Shares, 4.85% (c) (d)(Cost $35,199,421) | | |
Total Investments — 100.2%
(Cost $4,576,372,435) | | |
Liabilities in Excess of Other Assets — (0.2)% | | |
| | |
Percentages indicated are based on net assets. |
| |
| |
| Clearing House Electronic Subregister System (CHESS) Depository Interest |
| Real Estate Investment Trust |
| Non-income producing security. |
| The security or a portion of this security is on loan at October 31, 2024. The total value of securities on loan at October 31, 2024 is $33,015,720. |
| Security exempt from registration pursuant to Regulation S under the Securities Act of 1933, as amended. Regulation S applies to securities offerings that are made outside of the United States and do not involve direct selling efforts in the United States and as such may have restrictions on resale. |
| Investment in an affiliated fund, which is registered under the Investment Company Act of 1940, as amended, and is advised by J.P. Morgan Investment Management Inc. |
| The rate shown is the current yield as of October 31, 2024. |
SEE NOTES TO FINANCIAL STATEMENTS.
| J.P. Morgan Exchange-Traded Funds | |
JPMorgan BetaBuilders Developed Asia Pacific ex-Japan ETF
SCHEDULE OF PORTFOLIO INVESTMENTSAS OF October 31, 2024 (continued)
Summary of Investments by Industry, October 31, 2024
The following table represents the portfolio investments of the Fund by industry classifications as a percentage of total investments:
| PERCENT OF
TOTAL
INVESTMENTS |
| |
| |
| |
| |
| |
Real Estate Management & Development | |
Hotels, Restaurants & Leisure | |
| |
| |
Oil, Gas & Consumable Fuels | |
| |
Consumer Staples Distribution & Retail | |
| |
Diversified Telecommunication Services | |
Transportation Infrastructure | |
| |
Health Care Equipment & Supplies | |
| |
| |
Others (each less than 1.0%) | |
| |
Futures contracts outstanding as of October 31, 2024:
| | | | | VALUE AND
UNREALIZED
APPRECIATION
(DEPRECIATION) ($) |
| | | | | |
| | | | | |
| | | | | |
| | | | | |
| |
| |
| Morgan Stanley Capital International |
| |
| Australian Securities Exchange |
SEE NOTES TO FINANCIAL STATEMENTS.
| J.P. Morgan Exchange-Traded Funds | |
JPMorgan BetaBuilders Emerging Markets Equity ETF
SCHEDULE OF PORTFOLIO INVESTMENTSAS OF October 31, 2024
| | |
|
|
Yancoal Australia Ltd. (a) | | |
|
| | |
| | |
B3 SA - Brasil Bolsa Balcao | | |
| | |
Banco Bradesco SA (Preference) | | |
| | |
| | |
Banco Santander Brasil SA | | |
BB Seguridade Participacoes SA | | |
Caixa Seguridade Participacoes S/A | | |
| | |
Centrais Eletricas Brasileiras SA | | |
Cia de Saneamento Basico do Estado de Sao Paulo SABESP | | |
Cia Energetica de Minas Gerais | | |
Cia Energetica de Minas Gerais (Preference) | | |
Cia Paranaense de Energia - Copel | | |
Cia Paranaense de Energia - Copel (Preference) | | |
Cia Siderurgica Nacional SA | | |
| | |
| | |
| | |
| | |
| | |
| | |
Hapvida Participacoes e Investimentos SA * (a) | | |
| | |
Itau Unibanco Holding SA (Preference) | | |
| | |
| | |
| | |
| | |
| | |
| | |
| | |
| | |
Petroleo Brasileiro SA (Preference) | | |
| | |
| | |
Rede D'Or Sao Luiz SA (a) | | |
| | |
Sendas Distribuidora SA * | | |
| | |
|
|
| | |
| | |
| | |
| | |
| | |
| | |
| | |
|
| | |
Banco de Credito e Inversiones SA | | |
| | |
| | |
Cia Sud Americana de Vapores SA | | |
| | |
| | |
| | |
| | |
| | |
| | |
Sociedad Quimica y Minera de Chile SA (Preference), Class B | | |
| | |
|
360 Security Technology, Inc., Class A | | |
37 Interactive Entertainment Network Technology Group Co. Ltd. | | |
AAC Technologies Holdings, Inc. | | |
AECC Aviation Power Co. Ltd., Class A | | |
Agricultural Bank of China Ltd., Class H | | |
Airtac International Group | | |
| | |
Alibaba Group Holding Ltd. | | |
Alibaba Health Information Technology Ltd. * | | |
Aluminum Corp. of China Ltd., Class A | | |
Aluminum Corp. of China Ltd., Class H | | |
Anhui Conch Cement Co. Ltd., Class A | | |
Anhui Conch Cement Co. Ltd., Class H | | |
Anhui Gujing Distillery Co. Ltd., Class A | | |
Anhui Gujing Distillery Co. Ltd., Class B | | |
Anhui Jianghuai Automobile Group Corp. Ltd., Class A | | |
Anjoy Foods Group Co. Ltd., Class A | | |
ANTA Sports Products Ltd. | | |
APT Medical, Inc., Class A | | |
SEE NOTES TO FINANCIAL STATEMENTS.
| J.P. Morgan Exchange-Traded Funds | |
JPMorgan BetaBuilders Emerging Markets Equity ETF
SCHEDULE OF PORTFOLIO INVESTMENTSAS OF October 31, 2024 (continued)
| | |
Common Stocks — continued |
|
Asymchem Laboratories Tianjin Co. Ltd., Class A | | |
Atour Lifestyle Holdings Ltd., ADR | | |
Avary Holding Shenzhen Co. Ltd., Class A | | |
BAIC BluePark New Energy Technology Co. Ltd., Class A * | | |
| | |
Bank of Beijing Co. Ltd., Class A | | |
Bank of China Ltd., Class H | | |
Bank of Communications Co. Ltd., Class A | | |
Bank of Communications Co. Ltd., Class H | | |
Bank of Hangzhou Co. Ltd., Class A | | |
Bank of Jiangsu Co. Ltd., Class A | | |
Bank of Nanjing Co. Ltd., Class A | | |
Bank of Ningbo Co. Ltd., Class A | | |
Bank of Shanghai Co. Ltd., Class A | | |
Baoshan Iron & Steel Co. Ltd., Class A | | |
| | |
Beijing Enterprises Holdings Ltd. | | |
Beijing Enterprises Water Group Ltd. | | |
Beijing Kingsoft Office Software, Inc., Class A | | |
Beijing Roborock Technology Co. Ltd., Class A | | |
Beijing Wantai Biological Pharmacy Enterprise Co. Ltd., Class A | | |
Beijing-Shanghai High Speed Railway Co. Ltd., Class A | | |
Bilibili, Inc., Class Z * | | |
| | |
BOC Hong Kong Holdings Ltd. | | |
BOE Technology Group Co. Ltd., Class A | | |
Bosideng International Holdings Ltd. | | |
| | |
| | |
BYD Electronic International Co. Ltd. | | |
C&D International Investment Group Ltd. | | |
Cambricon Technologies Corp. Ltd., Class A * | | |
CGN Power Co. Ltd., Class A | | |
CGN Power Co. Ltd., Class H (a) | | |
Changchun High-Tech Industry Group Co. Ltd. | | |
Changzhou Xingyu Automotive Lighting Systems Co. Ltd., Class A | | |
China Baoan Group Co. Ltd., Class A | | |
China CITIC Bank Corp. Ltd., Class A | | |
China CITIC Bank Corp. Ltd., Class H | | |
China Coal Energy Co. Ltd., Class H | | |
China Construction Bank Corp., Class H | | |
| | |
|
|
China CSSC Holdings Ltd., Class A | | |
China Eastern Airlines Corp. Ltd., Class A * | | |
China Everbright Bank Co. Ltd., Class A | | |
China Everbright Environment Group Ltd. | | |
| | |
China First Heavy Industries Co. Ltd., Class A * | | |
China Galaxy Securities Co. Ltd., Class A | | |
China Galaxy Securities Co. Ltd., Class H | | |
| | |
China Great Wall Securities Co. Ltd., Class A | | |
China Hongqiao Group Ltd. | | |
China International Capital Corp. Ltd., Class A | | |
China International Capital Corp. Ltd., Class H (a) | | |
China Jushi Co. Ltd., Class A | | |
China Life Insurance Co. Ltd., Class H | | |
China Literature Ltd. * (a) | | |
China Longyuan Power Group Corp. Ltd., Class A | | |
China Longyuan Power Group Corp. Ltd., Class H | | |
China Medical System Holdings Ltd. | | |
China Mengniu Dairy Co. Ltd. | | |
China Merchants Bank Co. Ltd., Class A | | |
China Merchants Bank Co. Ltd., Class H | | |
China Merchants Energy Shipping Co. Ltd., Class A | | |
China Merchants Expressway Network & Technology Holdings Co. Ltd., Class A | | |
China Merchants Port Holdings Co. Ltd. | | |
China Merchants Shekou Industrial Zone Holdings Co. Ltd., Class A | | |
China Minsheng Banking Corp. Ltd., Class A | | |
China Minsheng Banking Corp. Ltd., Class H | | |
China National Nuclear Power Co. Ltd., Class A | | |
China Northern Rare Earth Group High-Tech Co. Ltd., Class A | | |
China Oilfield Services Ltd., Class H | | |
China Overseas Land & Investment Ltd. | | |
China Pacific Insurance Group Co. Ltd., Class A | | |
China Pacific Insurance Group Co. Ltd., Class H | | |
China Petroleum & Chemical Corp., Class A | | |
China Petroleum & Chemical Corp., Class H | | |
China Power International Development Ltd. | | |
China Railway Group Ltd., Class A | | |
China Railway Group Ltd., Class H | | |
SEE NOTES TO FINANCIAL STATEMENTS.
| J.P. Morgan Exchange-Traded Funds | |
| | |
Common Stocks — continued |
|
China Railway Signal & Communication Corp. Ltd., Class H (a) | | |
China Resources Beer Holdings Co. Ltd. | | |
China Resources Gas Group Ltd. | | |
China Resources Land Ltd. | | |
China Resources Microelectronics Ltd., Class A | | |
China Resources Mixc Lifestyle Services Ltd. (a) | | |
China Resources Pharmaceutical Group Ltd. (a) | | |
China Resources Power Holdings Co. Ltd. | | |
China Resources Sanjiu Medical & Pharmaceutical Co. Ltd., Class A | | |
China Shenhua Energy Co. Ltd., Class A | | |
China Shenhua Energy Co. Ltd., Class H | | |
China Southern Airlines Co. Ltd., Class A * | | |
China Suntien Green Energy Corp. Ltd., Class A | | |
China Taiping Insurance Holdings Co. Ltd. | | |
China Three Gorges Renewables Group Co. Ltd., Class A | | |
China Tourism Group Duty Free Corp. Ltd., Class A | | |
China Tourism Group Duty Free Corp. Ltd., Class H (a) | | |
China Tower Corp. Ltd., Class H (a) | | |
China Vanke Co. Ltd., Class A * | | |
China Vanke Co. Ltd., Class H * | | |
China Yangtze Power Co. Ltd., Class A | | |
Chongqing Changan Automobile Co. Ltd., Class A | | |
Chongqing Rural Commercial Bank Co. Ltd., Class H | | |
Chow Tai Fook Jewellery Group Ltd. | | |
| | |
CITIC Securities Co. Ltd., Class A | | |
CITIC Securities Co. Ltd., Class H | | |
| | |
| | |
COSCO SHIPPING Energy Transportation Co. Ltd., Class H | | |
COSCO SHIPPING Holdings Co. Ltd., Class A | | |
COSCO SHIPPING Holdings Co. Ltd., Class H | | |
Country Garden Holdings Co. Ltd. ‡ * | | |
Country Garden Services Holdings Co. Ltd. | | |
CSPC Pharmaceutical Group Ltd. | | |
East Buy Holding Ltd. * (a) | | |
Eastroc Beverage Group Co. Ltd., Class A | | |
| | |
| | |
|
|
ENN Natural Gas Co. Ltd., Class A | | |
Everbright Securities Co. Ltd., Class A | | |
Everdisplay Optronics Shanghai Co. Ltd., Class A * | | |
Flat Glass Group Co. Ltd., Class A | | |
Flat Glass Group Co. Ltd., Class H | | |
Focus Media Information Technology Co. Ltd., Class A | | |
Foshan Haitian Flavouring & Food Co. Ltd., Class A | | |
| | |
Founder Securities Co. Ltd., Class A | | |
Foxconn Industrial Internet Co. Ltd., Class A | | |
Full Truck Alliance Co. Ltd., ADR | | |
Fuyao Glass Industry Group Co. Ltd., Class A | | |
Fuyao Glass Industry Group Co. Ltd., Class H (a) | | |
Ganfeng Lithium Group Co. Ltd. (a) | | |
Ganfeng Lithium Group Co. Ltd., Class A | | |
GCL Technology Holdings Ltd. * | | |
GD Power Development Co. Ltd., Class A | | |
Geely Automobile Holdings Ltd. | | |
Genscript Biotech Corp. * | | |
GF Securities Co. Ltd., Class H | | |
Giant Biogene Holding Co. Ltd. (a) | | |
GigaDevice Semiconductor, Inc., Class A * | | |
Great Wall Motor Co. Ltd., Class H | | |
Gree Electric Appliances, Inc. of Zhuhai, Class A | | |
Guangdong Construction Engineering Group Co. Ltd., Class A | | |
Guangdong Haid Group Co. Ltd., Class A | | |
Guangdong Investment Ltd. | | |
Guoyuan Securities Co. Ltd., Class A | | |
| | |
Haidilao International Holding Ltd. (a) | | |
Haier Smart Home Co. Ltd., Class A | | |
Haier Smart Home Co. Ltd., Class H | | |
Hainan Airlines Holding Co. Ltd., Class A * | | |
Haitian International Holdings Ltd. | | |
Haitong Securities Co. Ltd., Class A | | |
Hangzhou First Applied Material Co. Ltd., Class A | | |
Hansoh Pharmaceutical Group Co. Ltd. (a) | | |
Henan Shenhuo Coal Industry & Electricity Power Co. Ltd., Class A | | |
Hengan International Group Co. Ltd. | | |
SEE NOTES TO FINANCIAL STATEMENTS.
| J.P. Morgan Exchange-Traded Funds | |
JPMorgan BetaBuilders Emerging Markets Equity ETF
SCHEDULE OF PORTFOLIO INVESTMENTSAS OF October 31, 2024 (continued)
| | |
Common Stocks — continued |
|
Hengli Petrochemical Co. Ltd., Class A | | |
Hisense Home Appliances Group Co. Ltd. | | |
Hua Hong Semiconductor Ltd. (a) | | |
Huadian Power International Corp. Ltd., Class A | | |
Huadian Power International Corp. Ltd., Class H | | |
Huadong Medicine Co. Ltd., Class A | | |
Hualan Biological Engineering, Inc., Class A | | |
Huaneng Power International, Inc., Class A | | |
Huaneng Power International, Inc., Class H | | |
Huatai Securities Co. Ltd., Class A | | |
Huatai Securities Co. Ltd., Class H (a) | | |
Huaxia Bank Co. Ltd., Class A | | |
Huayu Automotive Systems Co. Ltd., Class A | | |
Huizhou Desay Sv Automotive Co. Ltd., Class A | | |
Hundsun Technologies, Inc., Class A | | |
Hygeia Healthcare Holdings Co. Ltd. * (a) | | |
IEIT Systems Co. Ltd., Class A | | |
Iflytek Co. Ltd., Class A | | |
Industrial & Commercial Bank of China Ltd., Class H | | |
Industrial Bank Co. Ltd., Class A | | |
Inner Mongolia Yili Industrial Group Co. Ltd., Class A | | |
Inner Mongolia Yitai Coal Co. Ltd., Class B | | |
Innovent Biologics, Inc. * (a) | | |
| | |
JA Solar Technology Co. Ltd., Class A | | |
JD Health International, Inc. * (a) | | |
| | |
| | |
Jiangsu Eastern Shenghong Co. Ltd., Class A | | |
Jiangsu Expressway Co. Ltd., Class H | | |
Jiangsu Hengli Hydraulic Co. Ltd., Class A | | |
Jiangsu Hengrui Pharmaceuticals Co. Ltd., Class A | | |
Jiangsu King's Luck Brewery JSC Ltd., Class A | | |
Jiangsu Yanghe Distillery Co. Ltd., Class A | | |
Jiangsu Yuyue Medical Equipment & Supply Co. Ltd., Class A | | |
Jiangsu Zhongtian Technology Co. Ltd., Class A | | |
Jiangxi Copper Co. Ltd., Class A | | |
Jiangxi Copper Co. Ltd., Class H | | |
Jinko Solar Co. Ltd., Class A | | |
Jointown Pharmaceutical Group Co. Ltd., Class A | | |
KE Holdings, Inc., Class A | | |
| | |
|
|
| | |
Kingdee International Software Group Co. Ltd. * | | |
| | |
Kuaishou Technology * (a) | | |
| | |
Kweichow Moutai Co. Ltd., Class A | | |
| | |
| | |
| | |
Liaoning Cheng Da Co. Ltd., Class A | | |
Liaoning Port Co. Ltd., Class A | | |
Lingyi iTech Guangdong Co., Class A | | |
Longfor Group Holdings Ltd. (a) | | |
LONGi Green Energy Technology Co. Ltd., Class A | | |
Lotus Technology, Inc. * (b) | | |
Luxshare Precision Industry Co. Ltd., Class A | | |
Luzhou Laojiao Co. Ltd., Class A | | |
| | |
MINISO Group Holding Ltd. | | |
| | |
Montage Technology Co. Ltd., Class A | | |
Muyuan Foods Co. Ltd., Class A * | | |
NARI Technology Co. Ltd., Class A | | |
National Silicon Industry Group Co. Ltd., Class A | | |
NAURA Technology Group Co. Ltd., Class A | | |
| | |
New China Life Insurance Co. Ltd., Class A | | |
New China Life Insurance Co. Ltd., Class H | | |
New Oriental Education & Technology Group, Inc. | | |
Ningbo Deye Technology Co. Ltd., Class A | | |
Ningbo Tuopu Group Co. Ltd., Class A | | |
Ningxia Baofeng Energy Group Co. Ltd., Class A | | |
| | |
Nongfu Spring Co. Ltd., Class H (a) | | |
Oriental Pearl Group Co. Ltd., Class A | | |
Pangang Group Vanadium Titanium & Resources Co. Ltd., Class A * | | |
PDD Holdings, Inc., ADR * | | |
People's Insurance Co. Group of China Ltd. (The), Class H | | |
PetroChina Co. Ltd., Class H | | |
PICC Property & Casualty Co. Ltd., Class H | | |
Ping An Bank Co. Ltd., Class A | | |
SEE NOTES TO FINANCIAL STATEMENTS.
| J.P. Morgan Exchange-Traded Funds | |
| | |
Common Stocks — continued |
|
Ping An Insurance Group Co. of China Ltd., Class A | | |
Ping An Insurance Group Co. of China Ltd., Class H | | |
Poly Developments and Holdings Group Co. Ltd., Class A | | |
Pop Mart International Group Ltd. (a) | | |
Postal Savings Bank of China Co. Ltd., Class A | | |
Postal Savings Bank of China Co. Ltd., Class H (a) | | |
Power Construction Corp. of China Ltd., Class A | | |
Qingdao Rural Commercial Bank Corp., Class A | | |
Qinghai Salt Lake Industry Co. Ltd., Class A * | | |
Rongsheng Petrochemical Co. Ltd., Class A | | |
Sailun Group Co. Ltd., Class A | | |
Sanan Optoelectronics Co. Ltd., Class A | | |
Sany Heavy Equipment International Holdings Co. Ltd. | | |
Sany Heavy Industry Co. Ltd., Class A | | |
SDIC Power Holdings Co. Ltd., Class A | | |
Seres Group Co. Ltd., Class A * | | |
SF Holding Co. Ltd., Class A | | |
Shaanxi Beiyuan Chemical Industry Group Co. Ltd., Class A | | |
Shaanxi Coal Industry Co. Ltd., Class A | | |
Shandong Gold Mining Co. Ltd., Class A | | |
Shandong Gold Mining Co. Ltd., Class H (a) | | |
Shandong Hi-Speed Holdings Group Ltd. * | | |
Shandong Nanshan Aluminum Co. Ltd., Class A | | |
Shandong Weigao Group Medical Polymer Co. Ltd., Class H | | |
Shanghai Baosight Software Co. Ltd., Class A | | |
Shanghai Baosight Software Co. Ltd., Class B | | |
Shanghai Fosun Pharmaceutical Group Co. Ltd., Class A | | |
Shanghai Fudan Microelectronics Group Co. Ltd., Class H | | |
Shanghai International Airport Co. Ltd., Class A | | |
Shanghai Lujiazui Finance & Trade Zone Development Co. Ltd., Class B | | |
Shanghai Pharmaceuticals Holding Co. Ltd., Class H | | |
Shanghai Pudong Development Bank Co. Ltd., Class A | | |
Shanghai Rural Commercial Bank Co. Ltd., Class A | | |
| | |
|
|
Shanxi Coking Coal Energy Group Co. Ltd., Class A | | |
Shanxi Lu'an Environmental Energy Development Co. Ltd., Class A | | |
Shanxi Xinghuacun Fen Wine Factory Co. Ltd., Class A | | |
Shenwan Hongyuan Group Co. Ltd., Class A | | |
Shenzhen Transsion Holdings Co. Ltd., Class A | | |
Shenzhou International Group Holdings Ltd. | | |
Sichuan Chuantou Energy Co. Ltd., Class A | | |
Sieyuan Electric Co. Ltd., Class A | | |
| | |
Sinopec Oilfield Service Corp., Class A * | | |
Sinopharm Group Co. Ltd., Class H | | |
| | |
| | |
Smoore International Holdings Ltd. (a) | | |
StarPower Semiconductor Ltd., Class A | | |
Sunny Optical Technology Group Co. Ltd. | | |
TAL Education Group, ADR * | | |
| | |
TCL Technology Group Corp., Class A | | |
TCL Zhonghuan Renewable Energy Technology Co. Ltd., Class A | | |
| | |
Tencent Music Entertainment Group, Class A | | |
Tianqi Lithium Corp., Class A | | |
Tingyi Cayman Islands Holding Corp. | | |
Tongcheng Travel Holdings Ltd. (a) | | |
Tonghua Dongbao Pharmaceutical Co. Ltd., Class A | | |
Tongwei Co. Ltd., Class A | | |
Topsports International Holdings Ltd. (a) | | |
Trina Solar Co. Ltd., Class A | | |
| | |
Tsingtao Brewery Co. Ltd. | | |
| | |
Unigroup Guoxin Microelectronics Co. Ltd., Class A | | |
Uni-President China Holdings Ltd. | | |
Unisplendour Corp. Ltd., Class A | | |
Vipshop Holdings Ltd., ADR | | |
Wanhua Chemical Group Co. Ltd., Class A | | |
Want Want China Holdings Ltd. | | |
Weichai Power Co. Ltd., Class A | | |
SEE NOTES TO FINANCIAL STATEMENTS.
| J.P. Morgan Exchange-Traded Funds | |
JPMorgan BetaBuilders Emerging Markets Equity ETF
SCHEDULE OF PORTFOLIO INVESTMENTSAS OF October 31, 2024 (continued)
| | |
Common Stocks — continued |
|
Weichai Power Co. Ltd., Class H | | |
Will Semiconductor Co. Ltd., Class A | | |
Wuliangye Yibin Co. Ltd., Class A | | |
WUS Printed Circuit Kunshan Co. Ltd., Class A | | |
WuXi AppTec Co. Ltd., Class A | | |
WuXi AppTec Co. Ltd., Class H (a) | | |
XCMG Construction Machinery Co. Ltd., Class A | | |
Xiamen Faratronic Co. Ltd., Class A | | |
Xiamen Tungsten Co. Ltd., Class A | | |
Xinjiang Daqo New Energy Co. Ltd., Class A | | |
Xinyi Glass Holdings Ltd. | | |
Xinyi Solar Holdings Ltd. | | |
| | |
Yadea Group Holdings Ltd. (a) | | |
Yangzijiang Shipbuilding Holdings Ltd. | | |
Yankuang Energy Group Co. Ltd., Class A | | |
Yankuang Energy Group Co. Ltd., Class H | | |
Yifeng Pharmacy Chain Co. Ltd., Class A | | |
Yongan Futures Co. Ltd., Class A | | |
YTO Express Group Co. Ltd., Class A | | |
| | |
| | |
Zhangzhou Pientzehuang Pharmaceutical Co. Ltd., Class A | | |
Zhaojin Mining Industry Co. Ltd., Class H | | |
Zhejiang China Commodities City Group Co. Ltd., Class A | | |
Zhejiang Juhua Co. Ltd., Class A | | |
Zhejiang Leapmotor Technology Co. Ltd. * (a) | | |
Zhejiang Sanhua Intelligent Controls Co. Ltd., Class A | | |
Zhejiang Zheneng Electric Power Co. Ltd., Class A | | |
ZhongAn Online P&C Insurance Co. Ltd., Class H * (a) | | |
Zhongsheng Group Holdings Ltd. | | |
Zhuzhou CRRC Times Electric Co. Ltd., Class H | | |
Zijin Mining Group Co. Ltd., Class A | | |
Zijin Mining Group Co. Ltd., Class H | | |
| | |
Zoomlion Heavy Industry Science and Technology Co. Ltd., Class H | | |
| | |
| | |
|
|
| | |
| | |
| | |
|
| | |
Bancolombia SA (Preference) | | |
| | |
Grupo de Inversiones Suramericana SA (Preference) | | |
Grupo Energia Bogota SA ESP | | |
Interconexion Electrica SA ESP | | |
| | |
|
| | |
| | |
| | |
|
Commercial International Bank - Egypt (CIB) | | |
|
Eurobank Ergasias Services and Holdings SA | | |
Hellenic Telecommunications Organization SA | | |
| | |
Metlen Energy & Metals SA | | |
Motor Oil Hellas Corinth Refineries SA | | |
National Bank of Greece SA | | |
| | |
Piraeus Financial Holdings SA | | |
| | |
| | |
|
J&T Global Express Ltd. * | | |
Kingboard Laminates Holdings Ltd. | | |
Nine Dragons Paper Holdings Ltd. * | | |
Orient Overseas International Ltd. | | |
Sino Biopharmaceutical Ltd. | | |
| | |
|
MOL Hungarian Oil & Gas plc | | |
| | |
| | |
| | |
SEE NOTES TO FINANCIAL STATEMENTS.
| J.P. Morgan Exchange-Traded Funds | |
| | |
Common Stocks — continued |
|
| | |
| | |
Adani Energy Solutions Ltd. * | | |
| | |
Adani Green Energy Ltd. * | | |
Adani Ports & Special Economic Zone Ltd. | | |
| | |
| | |
Aditya Birla Capital Ltd. * | | |
| | |
| | |
Apollo Hospitals Enterprise Ltd. | | |
| | |
| | |
| | |
AU Small Finance Bank Ltd. (a) | | |
| | |
Avenue Supermarts Ltd. * (a) | | |
| | |
| | |
| | |
| | |
Balkrishna Industries Ltd. | | |
| | |
| | |
| | |
| | |
| | |
| | |
Bharat Heavy Electricals Ltd. | | |
Bharat Petroleum Corp. Ltd. | | |
| | |
| | |
| | |
Britannia Industries Ltd. | | |
| | |
CG Power & Industrial Solutions Ltd. | | |
Cholamandalam Investment and Finance Co. Ltd. | | |
| | |
| | |
Colgate-Palmolive India Ltd. | | |
Container Corp. of India Ltd. | | |
| | |
| | |
| | |
|
|
| | |
| | |
Dr Reddy's Laboratories Ltd. | | |
| | |
Embassy Office Parks, REIT | | |
FSN E-Commerce Ventures Ltd. * | | |
| | |
Godrej Consumer Products Ltd. | | |
| | |
| | |
| | |
| | |
HDFC Asset Management Co. Ltd. (a) | | |
| | |
HDFC Life Insurance Co. Ltd. (a) | | |
| | |
| | |
Hindustan Aeronautics Ltd. (a) | | |
Hindustan Petroleum Corp. Ltd. | | |
| | |
| | |
ICICI Lombard General Insurance Co. Ltd. (a) | | |
ICICI Prudential Life Insurance Co. Ltd. (a) | | |
| | |
| | |
Indian Hotels Co. Ltd. (The) | | |
| | |
Indian Railway Catering & Tourism Corp. Ltd. | | |
Indian Railway Finance Corp. Ltd. (a) | | |
Indian Renewable Energy Development Agency Ltd. * | | |
| | |
| | |
| | |
| | |
| | |
InterGlobe Aviation Ltd. * (a) | | |
| | |
| | |
Jindal Steel & Power Ltd. | | |
Jio Financial Services Ltd. * | | |
| | |
| | |
| | |
| | |
SEE NOTES TO FINANCIAL STATEMENTS.
| J.P. Morgan Exchange-Traded Funds | |
JPMorgan BetaBuilders Emerging Markets Equity ETF
SCHEDULE OF PORTFOLIO INVESTMENTSAS OF October 31, 2024 (continued)
| | |
Common Stocks — continued |
|
L&T Technology Services Ltd. (a) | | |
| | |
| | |
| | |
| | |
Macrotech Developers Ltd. (a) | | |
| | |
| | |
| | |
| | |
Max Healthcare Institute Ltd. | | |
| | |
| | |
| | |
| | |
| | |
| | |
| | |
| | |
Oil & Natural Gas Corp. Ltd. | | |
| | |
Oracle Financial Services Software Ltd. | | |
| | |
| | |
| | |
| | |
| | |
| | |
| | |
| | |
| | |
| | |
Power Grid Corp. of India Ltd. | | |
Prestige Estates Projects Ltd. | | |
Procter & Gamble Hygiene & Health Care Ltd. | | |
| | |
Rail Vikas Nigam Ltd. (a) | | |
| | |
| | |
Samvardhana Motherson International Ltd. | | |
SBI Cards & Payment Services Ltd. | | |
SBI Life Insurance Co. Ltd. (a) | | |
| | |
| | |
| | |
|
|
| | |
| | |
Solar Industries India Ltd. | | |
Sona Blw Precision Forgings Ltd. (a) | | |
| | |
Star Health & Allied Insurance Co. Ltd. * | | |
| | |
Steel Authority of India Ltd. | | |
Sun Pharmaceutical Industries Ltd. | | |
| | |
| | |
| | |
| | |
Tata Consultancy Services Ltd. | | |
Tata Consumer Products Ltd. | | |
| | |
| | |
Tata Power Co. Ltd. (The) | | |
| | |
| | |
| | |
Torrent Pharmaceuticals Ltd. | | |
| | |
Tube Investments of India Ltd. | | |
| | |
| | |
| | |
| | |
| | |
| | |
| | |
| | |
| | |
| | |
| | |
| | |
| | |
| | |
| | |
| | |
|
Adaro Energy Indonesia Tbk. PT | | |
Amman Mineral Internasional PT * | | |
| | |
SEE NOTES TO FINANCIAL STATEMENTS.
| J.P. Morgan Exchange-Traded Funds | |
| | |
Common Stocks — continued |
|
Astra International Tbk. PT | | |
Bank Central Asia Tbk. PT | | |
Bank Mandiri Persero Tbk. PT | | |
Bank Negara Indonesia Persero Tbk. PT | | |
Bank Rakyat Indonesia Persero Tbk. PT | | |
| | |
Charoen Pokphand Indonesia Tbk. PT | | |
GoTo Gojek Tokopedia Tbk. PT * | | |
Indah Kiat Pulp & Paper Tbk. PT | | |
Indofood CBP Sukses Makmur Tbk. PT | | |
Indofood Sukses Makmur Tbk. PT | | |
| | |
| | |
Merdeka Battery Materials Tbk. PT * | | |
Merdeka Copper Gold Tbk. PT * | | |
Mitra Keluarga Karyasehat Tbk. PT (a) | | |
Pantai Indah Kapuk Dua Tbk. PT | | |
Petrindo Jaya Kreasi Tbk. PT * | | |
Sarana Menara Nusantara Tbk. PT | | |
Sumber Alfaria Trijaya Tbk. PT | | |
Telkom Indonesia Persero Tbk. PT | | |
Unilever Indonesia Tbk. PT | | |
| | |
| | |
| | |
|
Agility Public Warehousing Co. KSC | | |
| | |
| | |
Kuwait Finance House KSCP | | |
| | |
Mobile Telecommunications Co. KSCP | | |
National Bank of Kuwait SAKP | | |
| | |
|
| | |
|
| | |
| | |
| | |
| | |
| | |
| | |
| | |
|
|
| | |
| | |
Hong Leong Financial Group Bhd. | | |
| | |
| | |
KLCCP Stapled Group, REIT | | |
| | |
| | |
Malaysia Airports Holdings Bhd. | | |
| | |
| | |
| | |
| | |
Petronas Chemicals Group Bhd. | | |
| | |
| | |
| | |
Press Metal Aluminium Holdings Bhd. | | |
| | |
| | |
| | |
| | |
| | |
| | |
| | |
| | |
| | |
YTL Power International Bhd. | | |
| | |
|
| | |
Arca Continental SAB de CV | | |
| | |
| | |
Coca-Cola Femsa SAB de CV | | |
Corporativo Fragua SAB de CV | | |
El Puerto de Liverpool SAB de CV, Class C1 | | |
Fibra Uno Administracion SA de CV, REIT | | |
Fomento Economico Mexicano SAB de CV | | |
| | |
Grupo Aeroportuario del Pacifico SAB de CV, Class B | | |
Grupo Aeroportuario del Sureste SAB de CV, Class B | | |
SEE NOTES TO FINANCIAL STATEMENTS.
| J.P. Morgan Exchange-Traded Funds | |
JPMorgan BetaBuilders Emerging Markets Equity ETF
SCHEDULE OF PORTFOLIO INVESTMENTSAS OF October 31, 2024 (continued)
| | |
Common Stocks — continued |
|
| | |
| | |
Grupo Comercial Chedraui SA de CV | | |
Grupo Elektra SAB de CV ‡ | | |
Grupo Financiero Banorte SAB de CV, Class O | | |
Grupo Financiero Inbursa SAB de CV, Class O * | | |
| | |
Industrias Penoles SAB de CV * | | |
Kimberly-Clark de Mexico SAB de CV, Class A | | |
Operadora De Sites Mexicanos SAB de CV | | |
Orbia Advance Corp. SAB de CV | | |
Promotora y Operadora de Infraestructura SAB de CV | | |
Wal-Mart de Mexico SAB de CV | | |
| | |
|
| | |
| | |
| | |
|
Aboitiz Equity Ventures, Inc. | | |
| | |
| | |
| | |
Bank of the Philippine Islands | | |
| | |
GT Capital Holdings, Inc. | | |
International Container Terminal Services, Inc. | | |
| | |
| | |
| | |
Metropolitan Bank & Trust Co. | | |
| | |
| | |
| | |
| | |
| | |
| | |
|
Commercial Bank PSQC (The) | | |
| | |
| | |
| | |
| | |
|
|
Mesaieed Petrochemical Holding Co. | | |
| | |
Qatar Electricity & Water Co. QSC | | |
| | |
Qatar Gas Transport Co. Ltd. | | |
Qatar International Islamic Bank QSC | | |
| | |
| | |
| | |
|
| | |
| | |
Advanced Petrochemical Co. * | | |
| | |
| | |
| | |
| | |
Arabian Internet & Communications Services Co. | | |
| | |
| | |
Bupa Arabia for Cooperative Insurance Co. | | |
Co. for Cooperative Insurance (The) | | |
Dr Sulaiman Al Habib Medical Services Group Co. | | |
| | |
| | |
| | |
Mouwasat Medical Services Co. | | |
| | |
Rabigh Refining & Petrochemical Co. * | | |
| | |
| | |
Sahara International Petrochemical Co. | | |
SAL Saudi Logistics Services | | |
Saudi Arabian Mining Co. * | | |
Saudi Arabian Oil Co. (a) | | |
Saudi Aramco Base Oil Co. | | |
| | |
Saudi Basic Industries Corp. | | |
| | |
Saudi Industrial Investment Group | | |
Saudi Investment Bank (The) | | |
Saudi Kayan Petrochemical Co. * | | |
Saudi National Bank (The) | | |
SEE NOTES TO FINANCIAL STATEMENTS.
| J.P. Morgan Exchange-Traded Funds | |
| | |
Common Stocks — continued |
|
Saudi Tadawul Group Holding Co. | | |
| | |
| | |
Yanbu National Petrochemical Co. | | |
| | |
|
| | |
African Rainbow Minerals Ltd. | | |
Anglo American Platinum Ltd. | | |
Aspen Pharmacare Holdings Ltd. | | |
| | |
| | |
Capitec Bank Holdings Ltd. | | |
| | |
| | |
| | |
| | |
| | |
Harmony Gold Mining Co. Ltd. | | |
Impala Platinum Holdings Ltd. * | | |
| | |
| | |
| | |
| | |
| | |
Northam Platinum Holdings Ltd. | | |
| | |
| | |
| | |
| | |
| | |
| | |
| | |
Sibanye Stillwater Ltd. * | | |
| | |
| | |
| | |
| | |
|
| | |
| | |
| | |
| | |
| | |
|
|
| | |
| | |
| | |
| | |
| | |
Doosan Enerbility Co. Ltd. * | | |
| | |
| | |
Ecopro Materials Co. Ltd. * | | |
| | |
Hana Financial Group, Inc. | | |
| | |
Hankook Tire & Technology Co. Ltd. | | |
| | |
Hanmi Semiconductor Co. Ltd. | | |
Hanwha Aerospace Co. Ltd. | | |
| | |
| | |
| | |
HD Hyundai Electric Co. Ltd. | | |
HD Hyundai Heavy Industries Co. Ltd. * | | |
HD Korea Shipbuilding & Offshore Engineering Co. Ltd. * | | |
| | |
| | |
| | |
Hyundai Engineering & Construction Co. Ltd. | | |
| | |
| | |
| | |
Hyundai Motor Co. (Preference) | | |
Hyundai Motor Co. (Preference) | | |
| | |
| | |
| | |
| | |
| | |
| | |
| | |
| | |
| | |
| | |
Korea Aerospace Industries Ltd. | | |
Korea Electric Power Corp. * | | |
Korea Investment Holdings Co. Ltd. | | |
SEE NOTES TO FINANCIAL STATEMENTS.
| J.P. Morgan Exchange-Traded Funds | |
JPMorgan BetaBuilders Emerging Markets Equity ETF
SCHEDULE OF PORTFOLIO INVESTMENTSAS OF October 31, 2024 (continued)
| | |
Common Stocks — continued |
|
| | |
Korean Air Lines Co. Ltd. | | |
| | |
| | |
| | |
Kumho Petrochemical Co. Ltd. | | |
| | |
| | |
LG Chem Ltd. (Preference) | | |
| | |
| | |
| | |
LG Energy Solution Ltd. * | | |
| | |
| | |
| | |
Meritz Financial Group, Inc. | | |
Mirae Asset Securities Co. Ltd. | | |
| | |
| | |
| | |
| | |
| | |
| | |
| | |
Posco International Corp. | | |
Samsung Biologics Co. Ltd. * (a) | | |
| | |
| | |
Samsung Electro-Mechanics Co. Ltd. | | |
Samsung Electronics Co. Ltd. | | |
Samsung Electronics Co. Ltd. (Preference) | | |
Samsung Fire & Marine Insurance Co. Ltd. | | |
Samsung Heavy Industries Co. Ltd. * | | |
Samsung Life Insurance Co. Ltd. | | |
| | |
| | |
Samsung Securities Co. Ltd. | | |
Shinhan Financial Group Co. Ltd. | | |
SK Biopharmaceuticals Co. Ltd. * | | |
| | |
| | |
SK IE Technology Co. Ltd. * (a) | | |
| | |
| | |
|
|
| | |
| | |
| | |
| | |
| | |
Woori Financial Group, Inc. | | |
| | |
| | |
|
| | |
| | |
| | |
| | |
ASE Technology Holding Co. Ltd. | | |
| | |
Asia Vital Components Co. Ltd. | | |
| | |
| | |
Catcher Technology Co. Ltd. | | |
Cathay Financial Holding Co. Ltd. | | |
Chailease Holding Co. Ltd. | | |
Chang Hwa Commercial Bank Ltd. | | |
Cheng Shin Rubber Industry Co. Ltd. | | |
Chicony Electronics Co. Ltd. | | |
| | |
| | |
Chunghwa Telecom Co. Ltd. | | |
| | |
CTBC Financial Holding Co. Ltd. | | |
| | |
| | |
E.Sun Financial Holding Co. Ltd. | | |
| | |
| | |
| | |
| | |
Evergreen Marine Corp. Taiwan Ltd. | | |
Far Eastern New Century Corp. | | |
Far EasTone Telecommunications Co. Ltd. | | |
Feng TAY Enterprise Co. Ltd. | | |
First Financial Holding Co. Ltd. | | |
Formosa Chemicals & Fibre Corp. | | |
Formosa Petrochemical Corp. | | |
| | |
SEE NOTES TO FINANCIAL STATEMENTS.
| J.P. Morgan Exchange-Traded Funds | |
| | |
Common Stocks — continued |
|
Fortune Electric Co. Ltd. | | |
Foxconn Technology Co. Ltd. | | |
Fubon Financial Holding Co. Ltd. | | |
Giant Manufacturing Co. Ltd. | | |
Gigabyte Technology Co. Ltd. | | |
| | |
| | |
Highwealth Construction Corp. | | |
| | |
Hon Hai Precision Industry Co. Ltd. | | |
| | |
Hua Nan Financial Holdings Co. Ltd. | | |
| | |
| | |
KGI Financial Holding Co. Ltd. | | |
Largan Precision Co. Ltd. | | |
| | |
| | |
| | |
Mega Financial Holding Co. Ltd. | | |
Micro-Star International Co. Ltd. | | |
| | |
| | |
Nan Ya Printed Circuit Board Corp. | | |
| | |
Nien Made Enterprise Co. Ltd. | | |
Novatek Microelectronics Corp. | | |
Oneness Biotech Co. Ltd. * | | |
| | |
| | |
| | |
| | |
Powerchip Semiconductor Manufacturing Corp. * | | |
Powertech Technology, Inc. | | |
President Chain Store Corp. | | |
| | |
Radiant Opto-Electronics Corp. | | |
Realtek Semiconductor Corp. | | |
Ruentex Development Co. Ltd. | | |
Shanghai Commercial & Savings Bank Ltd. (The) | | |
Shihlin Electric & Engineering Corp. | | |
Shin Kong Financial Holding Co. Ltd. * | | |
Simplo Technology Co. Ltd. | | |
Sino-American Silicon Products, Inc. | | |
| | |
|
|
SinoPac Financial Holdings Co. Ltd. | | |
Synnex Technology International Corp. | | |
Taishin Financial Holding Co. Ltd. | | |
| | |
Taiwan Cooperative Financial Holding Co. Ltd. | | |
| | |
Taiwan Semiconductor Manufacturing Co. Ltd. | | |
| | |
TCC Group Holdings Co. Ltd. | | |
Teco Electric and Machinery Co. Ltd. | | |
| | |
Unimicron Technology Corp. | | |
Uni-President Enterprises Corp. | | |
United Microelectronics Corp. | | |
Vanguard International Semiconductor Corp. | | |
Voltronic Power Technology Corp. | | |
| | |
| | |
Winbond Electronics Corp. * | | |
| | |
| | |
| | |
WT Microelectronics Co. Ltd. | | |
| | |
Yang Ming Marine Transport Corp. | | |
Yuanta Financial Holding Co. Ltd. | | |
Zhen Ding Technology Holding Ltd. | | |
| | |
|
Advanced Info Service PCL, NVDR | | |
Airports of Thailand PCL, NVDR | | |
Asset World Corp. PCL, NVDR | | |
| | |
Bangkok Dusit Medical Services PCL, NVDR | | |
Bangkok Expressway & Metro PCL, NVDR | | |
BTS Group Holdings PCL, NVDR * | | |
Bumrungrad Hospital PCL, NVDR | | |
Central Pattana PCL, NVDR | | |
Central Retail Corp. PCL, NVDR | | |
Charoen Pokphand Foods PCL, NVDR | | |
| | |
| | |
Delta Electronics Thailand PCL, NVDR | | |
Energy Absolute PCL, NVDR | | |
SEE NOTES TO FINANCIAL STATEMENTS.
| J.P. Morgan Exchange-Traded Funds | |
JPMorgan BetaBuilders Emerging Markets Equity ETF
SCHEDULE OF PORTFOLIO INVESTMENTSAS OF October 31, 2024 (continued)
| | |
Common Stocks — continued |
|
Global Power Synergy PCL, NVDR | | |
Gulf Energy Development PCL, NVDR | | |
Home Product Center PCL, NVDR | | |
Indorama Ventures PCL, NVDR | | |
Intouch Holdings PCL, NVDR | | |
| | |
Krung Thai Bank PCL, NVDR | | |
| | |
Minor International PCL, NVDR | | |
Muangthai Capital PCL, NVDR | | |
PTT Exploration & Production PCL, NVDR | | |
PTT Global Chemical PCL, NVDR | | |
PTT Oil & Retail Business PCL, NVDR | | |
| | |
| | |
| | |
Siam Cement PCL (The), NVDR | | |
Siam Global House PCL, NVDR | | |
Thai Life Insurance PCL, NVDR | | |
Tisco Financial Group PCL, NVDR | | |
TMBThanachart Bank PCL, NVDR | | |
| | |
| | |
|
| | |
| | |
Aselsan Elektronik Sanayi ve Ticaret A/S | | |
BIM Birlesik Magazalar A/S | | |
Borusan Birlesik Boru Fabrikalari Sanayi ve Ticaret A/S * | | |
| | |
Eregli Demir ve Celik Fabrikalari TAS | | |
| | |
Haci Omer Sabanci Holding A/S | | |
| | |
Sasa Polyester Sanayi A/S * | | |
Tofas Turk Otomobil Fabrikasi A/S | | |
| | |
Turkcell Iletisim Hizmetleri A/S | | |
Turkiye Garanti Bankasi A/S | | |
Turkiye Is Bankasi A/S, Class C | | |
Turkiye Petrol Rafinerileri A/S | | |
| | |
|
|
Turkiye Sise ve Cam Fabrikalari A/S | | |
Yapi ve Kredi Bankasi A/S | | |
| | |
United Arab Emirates — 2.4% |
Abu Dhabi Commercial Bank PJSC | | |
Abu Dhabi Islamic Bank PJSC | | |
Abu Dhabi National Oil Co. for Distribution PJSC | | |
Abu Dhabi Ports Co. PJSC * | | |
| | |
ADNOC Logistics & Services | | |
| | |
Alpha Dhabi Holding PJSC * | | |
Americana Restaurants International plc - Foreign Co. | | |
Dubai Electricity & Water Authority PJSC | | |
| | |
| | |
| | |
| | |
Emirates Telecommunications Group Co. PJSC | | |
First Abu Dhabi Bank PJSC | | |
International Holding Co. PJSC * | | |
| | |
| | |
Pure Health Holding PJSC * | | |
| | |
| | |
|
| | |
Total Common Stocks
(Cost $535,086,259) | | |
Short-Term Investments — 1.5% |
Investment Companies — 1.5% |
JPMorgan U.S. Government Money Market Fund Class IM Shares, 4.80% (c) (d)
(Cost $9,314,174) | | |
Investment of Cash Collateral from Securities Loaned — 0.0% ^ |
JPMorgan Securities Lending Money Market Fund Agency SL Class Shares, 4.85% (c) (d)(Cost $47,125) | | |
Total Short-Term Investments
(Cost $9,361,299) | | |
SEE NOTES TO FINANCIAL STATEMENTS.
| J.P. Morgan Exchange-Traded Funds | |
| | |
Total Investments — 100.6%
(Cost $544,447,558) | | |
Liabilities in Excess of Other Assets — (0.6)% | | |
| | |
Percentages indicated are based on net assets. |
| |
| American Depositary Receipt |
| |
| Non-Voting Depositary Receipt |
| Public Joint Stock Company |
| A special type of equity investment that shares in the earnings of the company, has limited voting rights, and may have a dividend preference. Preference shares may also have liquidation preference. |
| Limited liability company |
| Real Estate Investment Trust |
| Limited partnership with share capital |
| Amount rounds to less than 0.1% of net assets. |
| Value determined using significant unobservable inputs. | |
| Non-income producing security. | |
| Security exempt from registration pursuant to Regulation S under the Securities Act of 1933, as amended. Regulation S applies to securities offerings that are made outside of the United States and do not involve direct selling efforts in the United States and as such may have restrictions on resale. | |
| The security or a portion of this security is on loan at October 31, 2024. The total value of securities on loan at October 31, 2024 is $44,926. | |
| Investment in an affiliated fund, which is registered under the Investment Company Act of 1940, as amended, and is advised by J.P. Morgan Investment Management Inc. | |
| The rate shown is the current yield as of October 31, 2024. | |
Summary of Investments by Industry, October 31, 2024
The following table represents the portfolio investments of the Fund by industry classifications as a percentage of total investments:
| PERCENT OF
TOTAL
INVESTMENTS |
| |
Semiconductors & Semiconductor Equipment | |
Oil, Gas & Consumable Fuels | |
| |
Technology Hardware, Storage & Peripherals | |
Interactive Media & Services | |
| |
| |
| |
Electronic Equipment, Instruments & Components | |
Hotels, Restaurants & Leisure | |
| |
| |
| |
Wireless Telecommunication Services | |
| |
| |
Real Estate Management & Development | |
| |
| |
Independent Power and Renewable Electricity Producers | |
| |
| |
Consumer Staples Distribution & Retail | |
Diversified Telecommunication Services | |
| |
Others (each less than 1.0%) | |
| |
SEE NOTES TO FINANCIAL STATEMENTS.
| J.P. Morgan Exchange-Traded Funds | |
JPMorgan BetaBuilders Emerging Markets Equity ETF
SCHEDULE OF PORTFOLIO INVESTMENTSAS OF October 31, 2024 (continued)
Futures contracts outstanding as of October 31, 2024:
| | | | | VALUE AND
UNREALIZED
APPRECIATION
(DEPRECIATION) ($) |
| | | | | |
MSCI Emerging Markets E-Mini Index | | | | | |
| |
| Morgan Stanley Capital International |
| |
SEE NOTES TO FINANCIAL STATEMENTS.
| J.P. Morgan Exchange-Traded Funds | |
JPMorgan BetaBuilders Europe ETF
SCHEDULE OF PORTFOLIO INVESTMENTSAS OF October 31, 2024
| | |
|
|
| | |
| | |
| | |
|
| | |
| | |
| | |
| | |
| | |
| | |
Raiffeisen Bank International AG | | |
| | |
| | |
| | |
Vienna Insurance Group AG Wiener Versicherung Gruppe | | |
| | |
| | |
|
Ackermans & van Haaren NV | | |
| | |
| | |
| | |
| | |
| | |
| | |
Groupe Bruxelles Lambert NV | | |
| | |
| | |
| | |
| | |
| | |
Warehouses De Pauw CVA, REIT | | |
| | |
|
| | |
|
| | |
|
| | |
|
AP Moller - Maersk A/S, Class A | | |
| | |
|
|
AP Moller - Maersk A/S, Class B | | |
| | |
| | |
| | |
| | |
| | |
| | |
Novo Nordisk A/S, Class B | | |
| | |
| | |
| | |
| | |
Vestas Wind Systems A/S * | | |
| | |
|
| | |
| | |
| | |
| | |
| | |
| | |
| | |
| | |
| | |
| | |
| | |
| | |
| | |
| | |
| | |
| | |
| | |
|
| | |
| | |
| | |
| | |
| | |
| | |
| | |
| | |
| | |
| | |
SEE NOTES TO FINANCIAL STATEMENTS.
| J.P. Morgan Exchange-Traded Funds | |
JPMorgan BetaBuilders Europe ETF
SCHEDULE OF PORTFOLIO INVESTMENTSAS OF October 31, 2024 (continued)
| | |
Common Stocks — continued |
|
| | |
| | |
| | |
Cie Generale des Etablissements Michelin SCA | | |
| | |
| | |
| | |
| | |
| | |
| | |
| | |
| | |
| | |
| | |
| | |
| | |
| | |
| | |
LVMH Moet Hennessy Louis Vuitton SE | | |
| | |
| | |
| | |
| | |
| | |
| | |
| | |
| | |
| | |
| | |
| | |
| | |
| | |
|
| | |
| | |
| | |
| | |
Bayerische Motoren Werke AG | | |
Bayerische Motoren Werke AG (Preference) | | |
| | |
| | |
Carl Zeiss Meditec AG (b) | | |
| | |
| | |
| | |
|
|
| | |
| | |
Deutsche Bank AG (Registered) | | |
| | |
Deutsche Lufthansa AG (Registered) (b) | | |
| | |
Deutsche Telekom AG (Registered) | | |
Dr Ing hc F Porsche AG (Preference) (a) | | |
| | |
| | |
Fresenius SE & Co. KGaA * | | |
| | |
| | |
| | |
Henkel AG & Co. KGaA (Preference) | | |
| | |
| | |
| | |
| | |
Muenchener Rueckversicherungs-Gesellschaft AG (Registered) | | |
| | |
| | |
| | |
Sartorius AG (Preference) (b) | | |
| | |
| | |
Siemens Healthineers AG (a) | | |
| | |
| | |
Volkswagen AG (Preference) | | |
| | |
| | |
|
| | |
|
| | |
| | |
| | |
|
| | |
| | |
| | |
SEE NOTES TO FINANCIAL STATEMENTS.
| J.P. Morgan Exchange-Traded Funds | |
| | |
Common Stocks — continued |
|
| | |
| | |
| | |
| | |
| | |
| | |
| | |
| | |
FinecoBank Banca Fineco SpA | | |
| | |
| | |
Infrastrutture Wireless Italiane SpA (a) | | |
| | |
| | |
Mediobanca Banca di Credito Finanziario SpA | | |
| | |
| | |
| | |
| | |
| | |
Recordati Industria Chimica e Farmaceutica SpA | | |
| | |
| | |
| | |
Terna - Rete Elettrica Nazionale | | |
| | |
| | |
|
Hikma Pharmaceuticals plc | | |
|
| | |
CVC Capital Partners plc * (a) | | |
| | |
| | |
|
| | |
|
| | |
| | |
| | |
| | |
| | |
| | |
|
|
| | |
| | |
| | |
| | |
| | |
| | |
| | |
Koninklijke Ahold Delhaize NV | | |
| | |
| | |
| | |
| | |
| | |
| | |
|
| | |
| | |
AutoStore Holdings Ltd. * (a) | | |
| | |
| | |
Gjensidige Forsikring ASA (b) | | |
| | |
| | |
| | |
| | |
| | |
| | |
| | |
| | |
| | |
| | |
| | |
|
| | |
Bank Polska Kasa Opieki SA | | |
| | |
| | |
| | |
| | |
| | |
Powszechna Kasa Oszczednosci Bank Polski SA | | |
SEE NOTES TO FINANCIAL STATEMENTS.
| J.P. Morgan Exchange-Traded Funds | |
JPMorgan BetaBuilders Europe ETF
SCHEDULE OF PORTFOLIO INVESTMENTSAS OF October 31, 2024 (continued)
| | |
Common Stocks — continued |
|
Powszechny Zaklad Ubezpieczen SA | | |
| | |
| | |
|
| | |
| | |
| | |
| | |
|
| | |
|
| | |
|
| | |
|
ACS Actividades de Construccion y Servicios SA | | |
| | |
| | |
Banco Bilbao Vizcaya Argentaria SA | | |
| | |
| | |
| | |
| | |
| | |
| | |
Industria de Diseno Textil SA (b) | | |
| | |
| | |
| | |
| | |
| | |
|
| | |
| | |
| | |
| | |
| | |
| | |
| | |
| | |
| | |
| | |
|
|
| | |
| | |
| | |
| | |
| | |
Fastighets AB Balder, Class B * (b) | | |
| | |
H & M Hennes & Mauritz AB, Class B (b) | | |
| | |
| | |
Husqvarna AB, Class B (b) | | |
Industrivarden AB, Class A | | |
Industrivarden AB, Class C (b) | | |
| | |
Investment AB Latour, Class B | | |
| | |
| | |
L E Lundbergforetagen AB, Class B | | |
| | |
Nibe Industrier AB, Class B | | |
| | |
| | |
| | |
| | |
| | |
Securitas AB, Class B (b) | | |
Skandinaviska Enskilda Banken AB, Class A | | |
Skandinaviska Enskilda Banken AB, Class C | | |
| | |
| | |
| | |
| | |
| | |
Svenska Cellulosa AB SCA, Class A | | |
Svenska Cellulosa AB SCA, Class B | | |
Svenska Handelsbanken AB, Class A | | |
Svenska Handelsbanken AB, Class B (b) | | |
| | |
Swedish Orphan Biovitrum AB * | | |
| | |
Telefonaktiebolaget LM Ericsson, Class A | | |
Telefonaktiebolaget LM Ericsson, Class B | | |
| | |
| | |
SEE NOTES TO FINANCIAL STATEMENTS.
| J.P. Morgan Exchange-Traded Funds | |
| | |
Common Stocks — continued |
|
| | |
| | |
Volvo Car AB, Class B * (b) | | |
| | |
|
| | |
Chocoladefabriken Lindt & Spruengli AG | | |
Chocoladefabriken Lindt & Spruengli AG (Registered) | | |
Cie Financiere Richemont SA (Registered) | | |
| | |
EMS-Chemie Holding AG (Registered) | | |
| | |
| | |
| | |
| | |
Kuehne + Nagel International AG (Registered) | | |
Lonza Group AG (Registered) | | |
| | |
Partners Group Holding AG | | |
| | |
| | |
Schindler Holding AG (Registered) | | |
| | |
| | |
Sonova Holding AG (Registered) | | |
Straumann Holding AG (Registered) | | |
| | |
Swatch Group AG (The) (Registered) | | |
Swiss Life Holding AG (Registered) | | |
| | |
UBS Group AG (Registered) | | |
Zurich Insurance Group AG | | |
| | |
United Arab Emirates — 0.0% |
| | |
|
| | |
| | |
| | |
Associated British Foods plc | | |
| | |
Auto Trader Group plc (a) | | |
| | |
|
United Kingdom — continued |
| | |
B&M European Value Retail SA | | |
| | |
| | |
| | |
Berkeley Group Holdings plc | | |
British American Tobacco plc | | |
| | |
| | |
| | |
| | |
Coca-Cola Europacific Partners plc | | |
| | |
| | |
| | |
| | |
| | |
| | |
| | |
Flutter Entertainment plc * | | |
| | |
| | |
| | |
| | |
| | |
| | |
| | |
InterContinental Hotels Group plc | | |
Intermediate Capital Group plc | | |
International Consolidated Airlines Group SA | | |
| | |
| | |
| | |
| | |
Land Securities Group plc, REIT | | |
Legal & General Group plc | | |
| | |
London Stock Exchange Group plc | | |
| | |
| | |
| | |
| | |
| | |
| | |
SEE NOTES TO FINANCIAL STATEMENTS.
| J.P. Morgan Exchange-Traded Funds | |
JPMorgan BetaBuilders Europe ETF
SCHEDULE OF PORTFOLIO INVESTMENTSAS OF October 31, 2024 (continued)
| | |
Common Stocks — continued |
United Kingdom — continued |
| | |
Phoenix Group Holdings plc | | |
Reckitt Benckiser Group plc | | |
| | |
| | |
| | |
Rolls-Royce Holdings plc * | | |
| | |
| | |
| | |
| | |
| | |
| | |
| | |
| | |
| | |
| | |
| | |
| | |
United Utilities Group plc | | |
| | |
| | |
| | |
| | |
| | |
| | |
|
| | |
| | |
| | |
| | |
| | |
| | |
| | |
| | |
| | |
| | |
| | |
| | |
| | |
| | |
| | |
| | |
|
United States — continued |
| | |
| | |
| | |
Total Common Stocks
(Cost $6,476,980,194) | | |
Short-Term Investments — 1.1% |
Investment of Cash Collateral from Securities Loaned — 1.1% |
JPMorgan Securities Lending Money Market Fund Agency SL Class Shares, 4.85% (c) (d)(Cost $75,600,705) | | |
Total Investments — 100.2%
(Cost $6,552,580,899) | | |
Liabilities in Excess of Other Assets — (0.2)% | | |
| | |
Percentages indicated are based on net assets. |
| |
| Certificaten Van Aandelen (Dutch Certificate) |
| |
| A special type of equity investment that shares in the earnings of the company, has limited voting rights, and may have a dividend preference. Preference shares may also have liquidation preference. |
| Real Estate Investment Trust |
| Limited partnership with share capital |
| |
| Amount rounds to less than 0.1% of net assets. |
| Value determined using significant unobservable inputs. | |
| Non-income producing security. | |
| Security exempt from registration pursuant to Regulation S under the Securities Act of 1933, as amended. Regulation S applies to securities offerings that are made outside of the United States and do not involve direct selling efforts in the United States and as such may have restrictions on resale. | |
| The security or a portion of this security is on loan at October 31, 2024. The total value of securities on loan at October 31, 2024 is $70,146,036. | |
| Investment in an affiliated fund, which is registered under the Investment Company Act of 1940, as amended, and is advised by J.P. Morgan Investment Management Inc. | |
| The rate shown is the current yield as of October 31, 2024. | |
SEE NOTES TO FINANCIAL STATEMENTS.
| J.P. Morgan Exchange-Traded Funds | |
Summary of Investments by Industry, October 31, 2024
The following table represents the portfolio investments of the Fund by industry classifications as a percentage of total investments:
| PERCENT OF
TOTAL
INVESTMENTS |
| |
| |
| |
Oil, Gas & Consumable Fuels | |
Textiles, Apparel & Luxury Goods | |
| |
| |
| |
| |
Semiconductors & Semiconductor Equipment | |
| |
| |
| |
| |
Diversified Telecommunication Services | |
Health Care Equipment & Supplies | |
| |
| |
| |
| |
| |
Hotels, Restaurants & Leisure | |
| |
| |
| |
| |
Construction & Engineering | |
Others (each less than 1.0%) | |
| |
SEE NOTES TO FINANCIAL STATEMENTS.
| J.P. Morgan Exchange-Traded Funds | |
JPMorgan BetaBuilders Europe ETF
SCHEDULE OF PORTFOLIO INVESTMENTSAS OF October 31, 2024 (continued)
Futures contracts outstanding as of October 31, 2024:
| | | | | VALUE AND
UNREALIZED
APPRECIATION
(DEPRECIATION) ($) |
| | | | | |
| | | | | |
| | | | | |
| | | | | |
| |
| |
| Financial Times and the London Stock Exchange |
| |
SEE NOTES TO FINANCIAL STATEMENTS.
| J.P. Morgan Exchange-Traded Funds | |
JPMorgan BetaBuilders International Equity ETF
SCHEDULE OF PORTFOLIO INVESTMENTSAS OF October 31, 2024
| | |
|
|
| | |
| | |
| | |
| | |
| | |
| | |
| | |
| | |
| | |
| | |
| | |
| | |
Commonwealth Bank of Australia | | |
| | |
| | |
| | |
| | |
| | |
| | |
| | |
Insurance Australia Group Ltd. | | |
| | |
| | |
| | |
| | |
| | |
National Australia Bank Ltd. | | |
Northern Star Resources Ltd. | | |
| | |
| | |
Pilbara Minerals Ltd. * (a) | | |
| | |
| | |
| | |
| | |
| | |
| | |
| | |
| | |
| | |
| | |
Seven Group Holdings Ltd. | | |
| | |
| | |
| | |
|
|
| | |
| | |
| | |
| | |
| | |
Treasury Wine Estates Ltd. | | |
| | |
Washington H Soul Pattinson & Co. Ltd. (a) | | |
| | |
| | |
| | |
Woodside Energy Group Ltd. | | |
| | |
| | |
| | |
|
| | |
| | |
| | |
| | |
| | |
| | |
Raiffeisen Bank International AG | | |
| | |
| | |
| | |
Vienna Insurance Group AG Wiener Versicherung Gruppe | | |
| | |
| | |
|
Ackermans & van Haaren NV | | |
| | |
| | |
| | |
| | |
| | |
| | |
Groupe Bruxelles Lambert NV | | |
| | |
| | |
| | |
| | |
SEE NOTES TO FINANCIAL STATEMENTS.
| J.P. Morgan Exchange-Traded Funds | |
JPMorgan BetaBuilders International Equity ETF
SCHEDULE OF PORTFOLIO INVESTMENTSAS OF October 31, 2024 (continued)
| | |
Common Stocks — continued |
|
| | |
Warehouses De Pauw CVA, REIT | | |
| | |
|
| | |
|
| | |
|
Budweiser Brewing Co. APAC Ltd. (b) | | |
| | |
| | |
Wharf Holdings Ltd. (The) | | |
Wilmar International Ltd. | | |
Wuxi Biologics Cayman, Inc. * (b) | | |
| | |
|
AP Moller - Maersk A/S, Class A | | |
AP Moller - Maersk A/S, Class B | | |
| | |
| | |
| | |
| | |
| | |
| | |
Novo Nordisk A/S, Class B | | |
| | |
| | |
| | |
| | |
Vestas Wind Systems A/S * | | |
| | |
|
| | |
| | |
| | |
| | |
| | |
| | |
| | |
| | |
| | |
| | |
| | |
|
|
| | |
| | |
| | |
| | |
| | |
| | |
| | |
|
| | |
| | |
| | |
| | |
| | |
| | |
| | |
| | |
| | |
| | |
| | |
| | |
| | |
Cie Generale des Etablissements Michelin SCA | | |
| | |
| | |
| | |
| | |
| | |
| | |
| | |
| | |
| | |
| | |
| | |
| | |
| | |
| | |
LVMH Moet Hennessy Louis Vuitton SE | | |
| | |
| | |
| | |
| | |
| | |
| | |
| | |
SEE NOTES TO FINANCIAL STATEMENTS.
| J.P. Morgan Exchange-Traded Funds | |
| | |
Common Stocks — continued |
|
| | |
| | |
| | |
| | |
| | |
| | |
|
| | |
| | |
| | |
| | |
Bayerische Motoren Werke AG | | |
Bayerische Motoren Werke AG (Preference) | | |
| | |
| | |
| | |
| | |
| | |
| | |
| | |
Deutsche Bank AG (Registered) | | |
| | |
Deutsche Lufthansa AG (Registered) | | |
| | |
Deutsche Telekom AG (Registered) | | |
Dr Ing hc F Porsche AG (Preference) (b) | | |
| | |
| | |
Fresenius SE & Co. KGaA * | | |
| | |
| | |
| | |
Henkel AG & Co. KGaA (Preference) | | |
| | |
| | |
| | |
| | |
Muenchener Rueckversicherungs-Gesellschaft AG (Registered) | | |
| | |
| | |
| | |
Sartorius AG (Preference) | | |
| | |
| | |
|
|
| | |
Siemens Healthineers AG (b) | | |
| | |
| | |
Volkswagen AG (Preference) | | |
| | |
| | |
|
| | |
| | |
CK Infrastructure Holdings Ltd. | | |
| | |
Hang Lung Properties Ltd. | | |
| | |
Henderson Land Development Co. Ltd. | | |
| | |
Hong Kong & China Gas Co. Ltd. | | |
Hong Kong Exchanges & Clearing Ltd. | | |
Jardine Matheson Holdings Ltd. | | |
| | |
| | |
Power Assets Holdings Ltd. | | |
| | |
| | |
Sun Hung Kai Properties Ltd. | | |
Swire Pacific Ltd., Class A | | |
Swire Pacific Ltd., Class B | | |
| | |
Techtronic Industries Co. Ltd. | | |
| | |
Wharf Real Estate Investment Co. Ltd. | | |
| | |
|
| | |
| | |
| | |
|
| | |
| | |
| | |
| | |
| | |
Israel Discount Bank Ltd., Class A | | |
SEE NOTES TO FINANCIAL STATEMENTS.
| J.P. Morgan Exchange-Traded Funds | |
JPMorgan BetaBuilders International Equity ETF
SCHEDULE OF PORTFOLIO INVESTMENTSAS OF October 31, 2024 (continued)
| | |
Common Stocks — continued |
|
Mizrahi Tefahot Bank Ltd. | | |
| | |
Teva Pharmaceutical Industries Ltd. * | | |
| | |
|
| | |
| | |
| | |
| | |
| | |
| | |
| | |
| | |
| | |
| | |
| | |
FinecoBank Banca Fineco SpA | | |
| | |
| | |
Infrastrutture Wireless Italiane SpA (b) | | |
| | |
| | |
Mediobanca Banca di Credito Finanziario SpA | | |
| | |
| | |
| | |
| | |
| | |
Recordati Industria Chimica e Farmaceutica SpA | | |
| | |
| | |
| | |
Terna - Rete Elettrica Nazionale | | |
| | |
| | |
|
| | |
| | |
| | |
| | |
| | |
| | |
| | |
| | |
|
|
| | |
Asahi Group Holdings Ltd. | | |
| | |
| | |
| | |
| | |
Bandai Namco Holdings, Inc. | | |
| | |
| | |
| | |
| | |
Central Japan Railway Co. | | |
| | |
Chubu Electric Power Co., Inc. | | |
Chugai Pharmaceutical Co. Ltd. | | |
Concordia Financial Group Ltd. | | |
Dai Nippon Printing Co. Ltd. | | |
| | |
Dai-ichi Life Holdings, Inc. | | |
| | |
| | |
Daito Trust Construction Co. Ltd. | | |
Daiwa House Industry Co. Ltd. | | |
Daiwa Securities Group, Inc. | | |
| | |
| | |
| | |
| | |
| | |
| | |
| | |
| | |
| | |
| | |
| | |
Fukuoka Financial Group, Inc. | | |
| | |
| | |
Hankyu Hanshin Holdings, Inc. | | |
| | |
Hitachi Construction Machinery Co. Ltd. | | |
| | |
| | |
| | |
SEE NOTES TO FINANCIAL STATEMENTS.
| J.P. Morgan Exchange-Traded Funds | |
| | |
Common Stocks — continued |
|
| | |
| | |
| | |
| | |
| | |
| | |
| | |
| | |
Japan Exchange Group, Inc. | | |
Japan Metropolitan Fund Invest, REIT | | |
| | |
Japan Post Holdings Co. Ltd. | | |
Japan Post Insurance Co. Ltd. | | |
Japan Real Estate Investment Corp., REIT | | |
| | |
| | |
| | |
Kansai Electric Power Co., Inc. (The) | | |
| | |
Kawasaki Heavy Industries Ltd. | | |
Kawasaki Kisen Kaisha Ltd. | | |
| | |
Keisei Electric Railway Co. Ltd. | | |
| | |
| | |
Kintetsu Group Holdings Co. Ltd. | | |
| | |
| | |
Koito Manufacturing Co. Ltd. | | |
| | |
| | |
| | |
Kurita Water Industries Ltd. | | |
| | |
Kyoto Financial Group, Inc. | | |
| | |
| | |
| | |
| | |
| | |
| | |
| | |
| | |
McDonald's Holdings Co. Japan Ltd. | | |
| | |
|
|
| | |
| | |
| | |
Mitsubishi Chemical Group Corp. | | |
| | |
Mitsubishi Electric Corp. | | |
Mitsubishi Estate Co. Ltd. | | |
Mitsubishi HC Capital, Inc. | | |
Mitsubishi Heavy Industries Ltd. | | |
| | |
Mitsubishi UFJ Financial Group, Inc. | | |
| | |
| | |
| | |
| | |
Mizuho Financial Group, Inc. | | |
| | |
MS&AD Insurance Group Holdings, Inc. | | |
Murata Manufacturing Co. Ltd. | | |
| | |
| | |
| | |
| | |
| | |
Nippon Building Fund, Inc., REIT | | |
Nippon Express Holdings, Inc. | | |
Nippon Paint Holdings Co. Ltd. | | |
Nippon Prologis REIT, Inc., REIT (a) | | |
Nippon Sanso Holdings Corp. | | |
| | |
Nippon Telegraph & Telephone Corp. | | |
| | |
| | |
| | |
Nissin Foods Holdings Co. Ltd. | | |
| | |
| | |
| | |
| | |
Nomura Real Estate Holdings, Inc. | | |
Nomura Real Estate Master Fund, Inc., REIT | | |
Nomura Research Institute Ltd. | | |
| | |
| | |
SEE NOTES TO FINANCIAL STATEMENTS.
| J.P. Morgan Exchange-Traded Funds | |
JPMorgan BetaBuilders International Equity ETF
SCHEDULE OF PORTFOLIO INVESTMENTSAS OF October 31, 2024 (continued)
| | |
Common Stocks — continued |
|
| | |
Odakyu Electric Railway Co. Ltd. | | |
| | |
| | |
Ono Pharmaceutical Co. Ltd. | | |
| | |
| | |
| | |
| | |
| | |
| | |
Pan Pacific International Holdings Corp. | | |
| | |
| | |
Recruit Holdings Co. Ltd. | | |
Renesas Electronics Corp. | | |
| | |
| | |
| | |
| | |
| | |
| | |
| | |
| | |
Sekisui Chemical Co. Ltd. | | |
| | |
Seven & i Holdings Co. Ltd. | | |
| | |
| | |
| | |
| | |
Shin-Etsu Chemical Co. Ltd. | | |
| | |
| | |
| | |
| | |
| | |
| | |
| | |
| | |
Square Enix Holdings Co. Ltd. | | |
| | |
| | |
| | |
| | |
|
|
Sumitomo Electric Industries Ltd. | | |
Sumitomo Metal Mining Co. Ltd. | | |
Sumitomo Mitsui Financial Group, Inc. | | |
Sumitomo Mitsui Trust Group, Inc. | | |
Sumitomo Realty & Development Co. Ltd. | | |
Suntory Beverage & Food Ltd. | | |
| | |
| | |
| | |
| | |
Takeda Pharmaceutical Co. Ltd. | | |
| | |
| | |
| | |
| | |
| | |
Tokio Marine Holdings, Inc. | | |
| | |
Tokyo Electric Power Co. Holdings, Inc. * | | |
| | |
| | |
| | |
Tokyu Fudosan Holdings Corp. | | |
| | |
| | |
| | |
| | |
| | |
| | |
| | |
| | |
| | |
| | |
| | |
| | |
| | |
| | |
| | |
| | |
| | |
| | |
| | |
|
Hikma Pharmaceuticals plc | | |
SEE NOTES TO FINANCIAL STATEMENTS.
| J.P. Morgan Exchange-Traded Funds | |
| | |
Common Stocks — continued |
|
| | |
CVC Capital Partners plc * (b) | | |
| | |
| | |
|
Galaxy Entertainment Group Ltd. | | |
| | |
| | |
|
| | |
|
| | |
| | |
| | |
| | |
| | |
| | |
| | |
| | |
| | |
| | |
| | |
| | |
Koninklijke Ahold Delhaize NV | | |
| | |
| | |
| | |
| | |
| | |
| | |
|
Auckland International Airport Ltd. | | |
| | |
Fisher & Paykel Healthcare Corp. Ltd. | | |
| | |
| | |
| | |
| | |
|
| | |
| | |
AutoStore Holdings Ltd. * (b) | | |
| | |
|
|
| | |
| | |
Gjensidige Forsikring ASA | | |
| | |
| | |
| | |
| | |
| | |
| | |
| | |
| | |
| | |
| | |
| | |
|
| | |
Bank Polska Kasa Opieki SA | | |
| | |
| | |
| | |
| | |
| | |
Powszechna Kasa Oszczednosci Bank Polski SA | | |
Powszechny Zaklad Ubezpieczen SA | | |
| | |
| | |
|
| | |
| | |
| | |
| | |
|
| | |
|
CapitaLand Ascendas, REIT | | |
CapitaLand Integrated Commercial Trust, REIT | | |
CapitaLand Investment Ltd. | | |
| | |
| | |
| | |
Jardine Cycle & Carriage Ltd. | | |
| | |
SEE NOTES TO FINANCIAL STATEMENTS.
| J.P. Morgan Exchange-Traded Funds | |
JPMorgan BetaBuilders International Equity ETF
SCHEDULE OF PORTFOLIO INVESTMENTSAS OF October 31, 2024 (continued)
| | |
Common Stocks — continued |
|
Mapletree Pan Asia Commercial Trust, REIT | | |
Oversea-Chinese Banking Corp. Ltd. | | |
| | |
| | |
Singapore Technologies Engineering Ltd. | | |
Singapore Telecommunications Ltd. | | |
| | |
United Overseas Bank Ltd. | | |
| | |
|
| | |
|
ACS Actividades de Construccion y Servicios SA | | |
| | |
| | |
Banco Bilbao Vizcaya Argentaria SA | | |
| | |
| | |
| | |
| | |
| | |
| | |
Industria de Diseno Textil SA | | |
| | |
| | |
| | |
| | |
| | |
|
| | |
| | |
| | |
| | |
| | |
| | |
| | |
| | |
| | |
| | |
| | |
| | |
| | |
| | |
|
|
| | |
Fastighets AB Balder, Class B * | | |
| | |
H & M Hennes & Mauritz AB, Class B (a) | | |
| | |
| | |
Husqvarna AB, Class B (a) | | |
Industrivarden AB, Class A | | |
Industrivarden AB, Class C | | |
| | |
Investment AB Latour, Class B | | |
| | |
| | |
L E Lundbergforetagen AB, Class B | | |
| | |
Nibe Industrier AB, Class B | | |
| | |
| | |
| | |
| | |
| | |
| | |
Skandinaviska Enskilda Banken AB, Class A | | |
Skandinaviska Enskilda Banken AB, Class C | | |
| | |
| | |
| | |
| | |
| | |
Svenska Cellulosa AB SCA, Class A | | |
Svenska Cellulosa AB SCA, Class B | | |
Svenska Handelsbanken AB, Class A | | |
Svenska Handelsbanken AB, Class B (a) | | |
| | |
Swedish Orphan Biovitrum AB * | | |
| | |
Telefonaktiebolaget LM Ericsson, Class A | | |
Telefonaktiebolaget LM Ericsson, Class B | | |
| | |
| | |
| | |
| | |
Volvo Car AB, Class B * (a) | | |
| | |
SEE NOTES TO FINANCIAL STATEMENTS.
| J.P. Morgan Exchange-Traded Funds | |
| | |
Common Stocks — continued |
|
| | |
Chocoladefabriken Lindt & Spruengli AG | | |
Chocoladefabriken Lindt & Spruengli AG (Registered) | | |
Cie Financiere Richemont SA (Registered) | | |
| | |
EMS-Chemie Holding AG (Registered) | | |
| | |
| | |
| | |
| | |
Kuehne + Nagel International AG (Registered) | | |
Lonza Group AG (Registered) | | |
| | |
Partners Group Holding AG | | |
| | |
| | |
Schindler Holding AG (Registered) | | |
| | |
| | |
Sonova Holding AG (Registered) | | |
Straumann Holding AG (Registered) | | |
| | |
Swatch Group AG (The) (Registered) | | |
Swiss Life Holding AG (Registered) | | |
| | |
UBS Group AG (Registered) | | |
Zurich Insurance Group AG | | |
| | |
United Arab Emirates — 0.0% |
| | |
|
| | |
| | |
| | |
Associated British Foods plc | | |
| | |
Auto Trader Group plc (b) | | |
| | |
B&M European Value Retail SA | | |
| | |
| | |
| | |
Berkeley Group Holdings plc | | |
| | |
|
United Kingdom — continued |
British American Tobacco plc | | |
| | |
| | |
| | |
| | |
CK Hutchison Holdings Ltd. | | |
Coca-Cola Europacific Partners plc | | |
| | |
| | |
| | |
| | |
| | |
| | |
| | |
Flutter Entertainment plc * | | |
| | |
| | |
| | |
| | |
| | |
| | |
| | |
InterContinental Hotels Group plc | | |
Intermediate Capital Group plc | | |
International Consolidated Airlines Group SA | | |
| | |
| | |
| | |
| | |
Land Securities Group plc, REIT | | |
Legal & General Group plc | | |
| | |
London Stock Exchange Group plc | | |
| | |
| | |
| | |
| | |
| | |
| | |
| | |
Phoenix Group Holdings plc | | |
Reckitt Benckiser Group plc | | |
| | |
| | |
SEE NOTES TO FINANCIAL STATEMENTS.
| J.P. Morgan Exchange-Traded Funds | |
JPMorgan BetaBuilders International Equity ETF
SCHEDULE OF PORTFOLIO INVESTMENTSAS OF October 31, 2024 (continued)
| | |
Common Stocks — continued |
United Kingdom — continued |
| | |
Rolls-Royce Holdings plc * | | |
| | |
| | |
| | |
| | |
| | |
| | |
| | |
| | |
| | |
| | |
| | |
| | |
United Utilities Group plc | | |
| | |
| | |
| | |
| | |
| | |
| | |
|
| | |
| | |
| | |
| | |
| | |
| | |
| | |
| | |
James Hardie Industries plc, CHDI * | | |
| | |
| | |
| | |
| | |
| | |
| | |
| | |
| | |
| | |
| | |
| | |
Total Common Stocks
(Cost $4,174,055,529) | | |
| | |
Short-Term Investments — 0.8% |
Investment Companies — 0.4% |
JPMorgan U.S. Government Money Market Fund Class IM Shares, 4.80% (c) (d)
(Cost $19,826,097) | | |
Investment of Cash Collateral from Securities Loaned — 0.4% |
JPMorgan Securities Lending Money Market Fund Agency SL Class Shares, 4.85% (c) (d)(Cost $15,951,317) | | |
Total Short-Term Investments
(Cost $35,777,414) | | |
Total Investments — 99.9%
(Cost $4,209,832,943) | | |
Other Assets in Excess of Liabilities — 0.1% | | |
| | |
Percentages indicated are based on net assets. |
| |
| |
| Clearing House Electronic Subregister System (CHESS) Depository Interest |
| Certificaten Van Aandelen (Dutch Certificate) |
| |
| A special type of equity investment that shares in the earnings of the company, has limited voting rights, and may have a dividend preference. Preference shares may also have liquidation preference. |
| Real Estate Investment Trust |
| Limited partnership with share capital |
| |
| Amount rounds to less than 0.1% of net assets. |
| Value determined using significant unobservable inputs. | |
| Non-income producing security. | |
| The security or a portion of this security is on loan at October 31, 2024. The total value of securities on loan at October 31, 2024 is $14,623,602. | |
| Security exempt from registration pursuant to Regulation S under the Securities Act of 1933, as amended. Regulation S applies to securities offerings that are made outside of the United States and do not involve direct selling efforts in the United States and as such may have restrictions on resale. | |
| Investment in an affiliated fund, which is registered under the Investment Company Act of 1940, as amended, and is advised by J.P. Morgan Investment Management Inc. | |
| The rate shown is the current yield as of October 31, 2024. | |
SEE NOTES TO FINANCIAL STATEMENTS.
| J.P. Morgan Exchange-Traded Funds | |
Summary of Investments by Industry, October 31, 2024
The following table represents the portfolio investments of the Fund by industry classifications as a percentage of total investments:
| PERCENT OF
TOTAL
INVESTMENTS |
| |
| |
| |
Oil, Gas & Consumable Fuels | |
| |
Semiconductors & Semiconductor Equipment | |
| |
| |
| |
| |
Textiles, Apparel & Luxury Goods | |
| |
| |
| |
Health Care Equipment & Supplies | |
Trading Companies & Distributors | |
| |
| |
| |
| |
Diversified Telecommunication Services | |
| |
Hotels, Restaurants & Leisure | |
| |
Electronic Equipment, Instruments & Components | |
| |
Consumer Staples Distribution & Retail | |
Real Estate Management & Development | |
| |
Wireless Telecommunication Services | |
| |
Others (each less than 1.0%) | |
| |
SEE NOTES TO FINANCIAL STATEMENTS.
| J.P. Morgan Exchange-Traded Funds | |
JPMorgan BetaBuilders International Equity ETF
SCHEDULE OF PORTFOLIO INVESTMENTSAS OF October 31, 2024 (continued)
Futures contracts outstanding as of October 31, 2024:
| | | | | VALUE AND
UNREALIZED
APPRECIATION
(DEPRECIATION) ($) |
| | | | | |
| | | | | |
| |
| Europe, Australasia and Far East |
| Morgan Stanley Capital International |
| |
SEE NOTES TO FINANCIAL STATEMENTS.
| J.P. Morgan Exchange-Traded Funds | |
JPMorgan BetaBuilders Japan ETF
SCHEDULE OF PORTFOLIO INVESTMENTSAS OF October 31, 2024
| | |
|
Air Freight & Logistics — 0.3% |
Nippon Express Holdings, Inc. | | |
| | |
| | |
| | |
Automobile Components — 1.9% |
| | |
| | |
| | |
Koito Manufacturing Co. Ltd. | | |
| | |
Sumitomo Electric Industries Ltd. | | |
| | |
|
| | |
| | |
| | |
| | |
Nissan Motor Co. Ltd. (a) | | |
| | |
| | |
| | |
| | |
| | |
|
| | |
Concordia Financial Group Ltd. | | |
Fukuoka Financial Group, Inc. | | |
| | |
Kyoto Financial Group, Inc. | | |
Mitsubishi UFJ Financial Group, Inc. | | |
Mizuho Financial Group, Inc. | | |
| | |
Sumitomo Mitsui Financial Group, Inc. | | |
Sumitomo Mitsui Trust Group, Inc. | | |
| | |
|
Asahi Group Holdings Ltd. | | |
| | |
Suntory Beverage & Food Ltd. (a) | | |
| | |
| | |
|
|
Pan Pacific International Holdings Corp. | | |
| | |
| | |
|
| | |
| | |
| | |
| | |
|
Daiwa Securities Group, Inc. | | |
Japan Exchange Group, Inc. | | |
| | |
| | |
| | |
|
| | |
Mitsubishi Chemical Group Corp. | | |
| | |
Nippon Paint Holdings Co. Ltd. (a) | | |
Nippon Sanso Holdings Corp. | | |
| | |
| | |
Shin-Etsu Chemical Co. Ltd. | | |
| | |
| | |
| | |
Commercial Services & Supplies — 0.8% |
Dai Nippon Printing Co. Ltd. | | |
| | |
| | |
| | |
Construction & Engineering — 0.7% |
| | |
| | |
| | |
| | |
| | |
Consumer Finance — 0.0% ^ |
| | |
Consumer Staples Distribution & Retail — 1.6% |
| | |
SEE NOTES TO FINANCIAL STATEMENTS.
| J.P. Morgan Exchange-Traded Funds | |
JPMorgan BetaBuilders Japan ETF
SCHEDULE OF PORTFOLIO INVESTMENTSAS OF October 31, 2024 (continued)
| | |
Common Stocks — continued |
Consumer Staples Distribution & Retail — continued |
| | |
| | |
Seven & i Holdings Co. Ltd. | | |
| | |
|
Nomura Real Estate Master Fund, Inc. | | |
Diversified Telecommunication Services — 0.7% |
Nippon Telegraph & Telephone Corp. | | |
Electric Utilities — 0.6% |
Chubu Electric Power Co., Inc. | | |
Kansai Electric Power Co., Inc. (The) | | |
Tokyo Electric Power Co. Holdings, Inc. * | | |
| | |
Electrical Equipment — 1.6% |
| | |
Mitsubishi Electric Corp. | | |
| | |
| | |
Electronic Equipment, Instruments & Components — 4.5% |
| | |
| | |
| | |
| | |
Murata Manufacturing Co. Ltd. | | |
| | |
| | |
| | |
| | |
| | |
|
| | |
| | |
| | |
| | |
Square Enix Holdings Co. Ltd. | | |
| | |
| | |
Financial Services — 0.8% |
Mitsubishi HC Capital, Inc. | | |
| | |
|
Financial Services — continued |
| | |
| | |
| | |
|
| | |
| | |
| | |
Nissin Foods Holdings Co. Ltd. | | |
| | |
| | |
| | |
|
| | |
| | |
| | |
Ground Transportation — 2.0% |
Central Japan Railway Co. | | |
| | |
Hankyu Hanshin Holdings, Inc. | | |
Keisei Electric Railway Co. Ltd. | | |
Kintetsu Group Holdings Co. Ltd. | | |
Odakyu Electric Railway Co. Ltd. | | |
| | |
| | |
| | |
| | |
Health Care Equipment & Supplies — 2.7% |
| | |
| | |
| | |
| | |
| | |
| | |
Health Care Technology — 0.1% |
| | |
Hotels, Restaurants & Leisure — 0.9% |
McDonald's Holdings Co. Japan Ltd. | | |
| | |
| | |
| | |
SEE NOTES TO FINANCIAL STATEMENTS.
| J.P. Morgan Exchange-Traded Funds | |
| | |
Common Stocks — continued |
Household Durables — 3.5% |
| | |
Sekisui Chemical Co. Ltd. | | |
| | |
| | |
| | |
Household Products — 0.3% |
| | |
Industrial Conglomerates — 3.0% |
| | |
| | |
| | |
|
| | |
Nippon Prologis REIT, Inc. | | |
| | |
|
Dai-ichi Life Holdings, Inc. | | |
Japan Post Holdings Co. Ltd. | | |
Japan Post Insurance Co. Ltd. | | |
MS&AD Insurance Group Holdings, Inc. | | |
| | |
| | |
Tokio Marine Holdings, Inc. | | |
| | |
Interactive Media & Services — 0.2% |
| | |
|
| | |
| | |
Nomura Research Institute Ltd. | | |
| | |
| | |
| | |
| | |
| | |
| | |
|
Bandai Namco Holdings, Inc. | | |
| | |
| | |
| | |
|
|
| | |
| | |
Hitachi Construction Machinery Co. Ltd. | | |
| | |
Kawasaki Heavy Industries Ltd. | | |
| | |
| | |
Kurita Water Industries Ltd. | | |
| | |
| | |
| | |
Mitsubishi Heavy Industries Ltd. | | |
| | |
| | |
| | |
| | |
| | |
Marine Transportation — 0.8% |
Kawasaki Kisen Kaisha Ltd. (a) | | |
Mitsui OSK Lines Ltd. (a) | | |
| | |
| | |
|
| | |
|
| | |
| | |
Sumitomo Metal Mining Co. Ltd. | | |
| | |
|
Japan Real Estate Investment Corp. | | |
Nippon Building Fund, Inc. | | |
| | |
Oil, Gas & Consumable Fuels — 0.9% |
| | |
| | |
| | |
| | |
SEE NOTES TO FINANCIAL STATEMENTS.
| J.P. Morgan Exchange-Traded Funds | |
JPMorgan BetaBuilders Japan ETF
SCHEDULE OF PORTFOLIO INVESTMENTSAS OF October 31, 2024 (continued)
| | |
Common Stocks — continued |
Passenger Airlines — 0.1% |
| | |
| | |
| | |
Personal Care Products — 0.7% |
| | |
| | |
| | |
|
| | |
Chugai Pharmaceutical Co. Ltd. | | |
| | |
| | |
| | |
Ono Pharmaceutical Co. Ltd. | | |
| | |
| | |
Takeda Pharmaceutical Co. Ltd. | | |
| | |
Professional Services — 2.3% |
Recruit Holdings Co. Ltd. | | |
Real Estate Management & Development — 2.3% |
Daito Trust Construction Co. Ltd. | | |
Daiwa House Industry Co. Ltd. | | |
| | |
Mitsubishi Estate Co. Ltd. | | |
| | |
Nomura Real Estate Holdings, Inc. | | |
Sumitomo Realty & Development Co. Ltd. | | |
Tokyu Fudosan Holdings Corp. | | |
| | |
|
Japan Metropolitan Fund Invest | | |
Semiconductors & Semiconductor Equipment — 4.4% |
| | |
| | |
| | |
Renesas Electronics Corp. | | |
| | |
| | |
| | |
| | |
| | |
| | |
|
|
| | |
| | |
| | |
|
| | |
| | |
| | |
| | |
| | |
Technology Hardware, Storage & Peripherals — 1.9% |
| | |
| | |
| | |
| | |
| | |
| | |
Textiles, Apparel & Luxury Goods — 0.3% |
| | |
|
| | |
Trading Companies & Distributors — 6.8% |
| | |
| | |
| | |
| | |
| | |
| | |
| | |
| | |
| | |
Wireless Telecommunication Services — 3.4% |
| | |
| | |
| | |
| | |
Total Common Stocks
(Cost $11,087,142,678) | | |
Short-Term Investments — 0.5% |
Investment of Cash Collateral from Securities Loaned — 0.5% |
JPMorgan Securities Lending Money Market Fund Agency SL Class Shares, 4.85% (b) (c)(Cost $63,807,415) | | |
SEE NOTES TO FINANCIAL STATEMENTS.
| J.P. Morgan Exchange-Traded Funds | |
| | |
Total Investments — 99.2%
(Cost $11,150,950,093) | | |
Other Assets in Excess of Liabilities — 0.8% | | |
| | |
Percentages indicated are based on net assets. |
| |
| Real Estate Investment Trust |
| Amount rounds to less than 0.1% of net assets. |
| Non-income producing security. | |
| The security or a portion of this security is on loan at October 31, 2024. The total value of securities on loan at October 31, 2024 is $59,851,638. | |
| Investment in an affiliated fund, which is registered under the Investment Company Act of 1940, as amended, and is advised by J.P. Morgan Investment Management Inc. | |
| The rate shown is the current yield as of October 31, 2024. | |
Futures contracts outstanding as of October 31, 2024:
| | | | | VALUE AND
UNREALIZED
APPRECIATION
(DEPRECIATION) ($) |
| | | | | |
| | | | | |
SEE NOTES TO FINANCIAL STATEMENTS.
| J.P. Morgan Exchange-Traded Funds | |
JPMorgan BetaBuilders U.S. Equity ETF
SCHEDULE OF PORTFOLIO INVESTMENTSAS OF October 31, 2024
| | |
|
Aerospace & Defense — 1.9% |
| | |
| | |
| | |
| | |
| | |
| | |
| | |
Huntington Ingalls Industries, Inc. | | |
L3Harris Technologies, Inc. | | |
| | |
| | |
| | |
| | |
| | |
| | |
Air Freight & Logistics — 0.3% |
Expeditors International of Washington, Inc. | | |
| | |
United Parcel Service, Inc., Class B | | |
| | |
Automobile Components — 0.0% ^ |
| | |
|
| | |
| | |
| | |
| | |
|
| | |
| | |
Citizens Financial Group, Inc. | | |
| | |
| | |
First Citizens BancShares, Inc., Class A | | |
Huntington Bancshares, Inc. | | |
| | |
| | |
| | |
PNC Financial Services Group, Inc. (The) | | |
| | |
| | |
| | |
|
|
| | |
| | |
| | |
|
Brown-Forman Corp., Class A | | |
Brown-Forman Corp., Class B | | |
| | |
Constellation Brands, Inc., Class A | | |
| | |
Molson Coors Beverage Co., Class B | | |
| | |
| | |
| | |
|
| | |
Alnylam Pharmaceuticals, Inc. * | | |
| | |
| | |
BioMarin Pharmaceutical, Inc. * | | |
| | |
| | |
| | |
| | |
Neurocrine Biosciences, Inc. * | | |
Regeneron Pharmaceuticals, Inc. * | | |
Vertex Pharmaceuticals, Inc. * | | |
| | |
|
| | |
Coupang, Inc. (South Korea) * | | |
| | |
MercadoLibre, Inc. (Brazil) * | | |
| | |
|
| | |
Builders FirstSource, Inc. * | | |
| | |
Johnson Controls International plc | | |
Lennox International, Inc. | | |
| | |
SEE NOTES TO FINANCIAL STATEMENTS.
| J.P. Morgan Exchange-Traded Funds | |
| | |
Common Stocks — continued |
Building Products — continued |
| | |
| | |
| | |
|
Ameriprise Financial, Inc. | | |
| | |
Bank of New York Mellon Corp. (The) | | |
| | |
| | |
Carlyle Group, Inc. (The) | | |
Charles Schwab Corp. (The) | | |
| | |
Coinbase Global, Inc., Class A * | | |
FactSet Research Systems, Inc. | | |
| | |
Goldman Sachs Group, Inc. (The) | | |
Intercontinental Exchange, Inc. | | |
| | |
LPL Financial Holdings, Inc. | | |
| | |
| | |
| | |
| | |
| | |
Raymond James Financial, Inc. | | |
| | |
| | |
T. Rowe Price Group, Inc. | | |
| | |
|
Air Products and Chemicals, Inc. | | |
| | |
| | |
CF Industries Holdings, Inc. | | |
| | |
| | |
| | |
| | |
| | |
International Flavors & Fragrances, Inc. | | |
| | |
LyondellBasell Industries NV, Class A | | |
| | |
| | |
|
|
| | |
Sherwin-Williams Co. (The) | | |
| | |
| | |
Commercial Services & Supplies — 0.5% |
| | |
| | |
| | |
| | |
| | |
| | |
| | |
Communications Equipment — 0.8% |
| | |
| | |
| | |
| | |
| | |
| | |
Construction & Engineering — 0.1% |
| | |
Construction Materials — 0.3% |
| | |
Martin Marietta Materials, Inc. | | |
| | |
| | |
|
| | |
Capital One Financial Corp. | | |
Discover Financial Services | | |
| | |
| | |
Consumer Staples Distribution & Retail — 1.9% |
Albertsons Cos., Inc., Class A | | |
| | |
| | |
| | |
| | |
| | |
| | |
SEE NOTES TO FINANCIAL STATEMENTS.
| J.P. Morgan Exchange-Traded Funds | |
JPMorgan BetaBuilders U.S. Equity ETF
SCHEDULE OF PORTFOLIO INVESTMENTSAS OF October 31, 2024 (continued)
| | |
Common Stocks — continued |
Consumer Staples Distribution & Retail — continued |
Walgreens Boots Alliance, Inc. | | |
| | |
| | |
Containers & Packaging — 0.3% |
| | |
| | |
| | |
| | |
| | |
Packaging Corp. of America | | |
| | |
| | |
|
| | |
| | |
| | |
| | |
Diversified REITs — 0.0% ^ |
| | |
Diversified Telecommunication Services — 0.7% |
| | |
Verizon Communications, Inc. | | |
| | |
Electric Utilities — 1.6% |
| | |
American Electric Power Co., Inc. | | |
| | |
Constellation Energy Corp. | | |
| | |
| | |
| | |
| | |
| | |
| | |
| | |
| | |
| | |
| | |
| | |
| | |
| | |
| | |
| | |
|
Electrical Equipment — 0.8% |
| | |
| | |
| | |
| | |
| | |
Rockwell Automation, Inc. | | |
Vertiv Holdings Co., Class A | | |
| | |
Electronic Equipment, Instruments & Components — 0.6% |
| | |
| | |
| | |
| | |
Keysight Technologies, Inc. * | | |
TE Connectivity plc (Switzerland) | | |
Teledyne Technologies, Inc. * | | |
| | |
Zebra Technologies Corp., Class A * | | |
| | |
Energy Equipment & Services — 0.2% |
| | |
| | |
| | |
| | |
|
| | |
Liberty Media Corp-Liberty Formula One, Class A * | | |
Liberty Media Corp-Liberty Formula One, Class C * | | |
Live Nation Entertainment, Inc. * | | |
| | |
| | |
Take-Two Interactive Software, Inc. * | | |
| | |
Warner Bros Discovery, Inc. * | | |
| | |
Financial Services — 4.3% |
Apollo Global Management, Inc. | | |
Berkshire Hathaway, Inc., Class B * | | |
| | |
Corebridge Financial, Inc. | | |
| | |
SEE NOTES TO FINANCIAL STATEMENTS.
| J.P. Morgan Exchange-Traded Funds | |
| | |
Common Stocks — continued |
Financial Services — continued |
| | |
Fidelity National Information Services, Inc. | | |
| | |
| | |
Jack Henry & Associates, Inc. | | |
Mastercard, Inc., Class A | | |
| | |
| | |
| | |
|
Archer-Daniels-Midland Co. | | |
| | |
| | |
| | |
| | |
| | |
| | |
| | |
| | |
| | |
Lamb Weston Holdings, Inc. | | |
McCormick & Co., Inc. (Non-Voting) | | |
Mondelez International, Inc., Class A | | |
Tyson Foods, Inc., Class A | | |
| | |
|
| | |
Ground Transportation — 0.9% |
| | |
JB Hunt Transport Services, Inc. | | |
| | |
Old Dominion Freight Line, Inc. | | |
Uber Technologies, Inc. * | | |
| | |
| | |
Health Care Equipment & Supplies — 2.3% |
| | |
| | |
Baxter International, Inc. | | |
| | |
Boston Scientific Corp. * | | |
Cooper Cos., Inc. (The) * | | |
| | |
| | |
|
Health Care Equipment & Supplies — continued |
Edwards Lifesciences Corp. * | | |
GE HealthCare Technologies, Inc. | | |
| | |
IDEXX Laboratories, Inc. * | | |
| | |
Intuitive Surgical, Inc. * | | |
| | |
| | |
| | |
| | |
| | |
Zimmer Biomet Holdings, Inc. | | |
| | |
Health Care Providers & Services — 2.2% |
| | |
| | |
| | |
| | |
| | |
| | |
| | |
| | |
| | |
| | |
Molina Healthcare, Inc. * | | |
| | |
| | |
Universal Health Services, Inc., Class B | | |
| | |
|
Alexandria Real Estate Equities, Inc. | | |
Healthpeak Properties, Inc. | | |
| | |
| | |
| | |
Health Care Technology — 0.1% |
Veeva Systems, Inc., Class A * | | |
Hotel & Resort REITs — 0.0% ^ |
Host Hotels & Resorts, Inc. | | |
Hotels, Restaurants & Leisure — 2.0% |
| | |
| | |
SEE NOTES TO FINANCIAL STATEMENTS.
| J.P. Morgan Exchange-Traded Funds | |
JPMorgan BetaBuilders U.S. Equity ETF
SCHEDULE OF PORTFOLIO INVESTMENTSAS OF October 31, 2024 (continued)
| | |
Common Stocks — continued |
Hotels, Restaurants & Leisure — continued |
| | |
Chipotle Mexican Grill, Inc. * | | |
| | |
| | |
DoorDash, Inc., Class A * | | |
| | |
Hilton Worldwide Holdings, Inc. | | |
| | |
Marriott International, Inc., Class A | | |
| | |
MGM Resorts International * | | |
Royal Caribbean Cruises Ltd. | | |
| | |
| | |
| | |
| | |
Household Durables — 0.4% |
| | |
| | |
| | |
| | |
| | |
| | |
| | |
Household Products — 1.1% |
Church & Dwight Co., Inc. | | |
| | |
| | |
| | |
Procter & Gamble Co. (The) | | |
| | |
Independent Power and Renewable Electricity Producers — 0.1% |
| | |
| | |
| | |
Industrial Conglomerates — 0.4% |
| | |
Honeywell International, Inc. | | |
| | |
|
| | |
| | |
|
|
| | |
| | |
American Financial Group, Inc. | | |
American International Group, Inc. | | |
| | |
Arch Capital Group Ltd. * | | |
| | |
| | |
| | |
Cincinnati Financial Corp. | | |
| | |
Fidelity National Financial, Inc. | | |
Hartford Financial Services Group, Inc. (The) | | |
| | |
| | |
Marsh & McLennan Cos., Inc. | | |
| | |
Principal Financial Group, Inc. | | |
| | |
Prudential Financial, Inc. | | |
Reinsurance Group of America, Inc. | | |
Travelers Cos., Inc. (The) | | |
| | |
| | |
| | |
Interactive Media & Services — 6.4% |
| | |
| | |
Meta Platforms, Inc., Class A | | |
Pinterest, Inc., Class A * | | |
| | |
| | |
|
Accenture plc, Class A (Ireland) | | |
Akamai Technologies, Inc. * | | |
Cloudflare, Inc., Class A * | | |
Cognizant Technology Solutions Corp., Class A | | |
| | |
| | |
| | |
International Business Machines Corp. | | |
| | |
| | |
SEE NOTES TO FINANCIAL STATEMENTS.
| J.P. Morgan Exchange-Traded Funds | |
| | |
Common Stocks — continued |
|
Snowflake, Inc., Class A * | | |
| | |
| | |
| | |
Life Sciences Tools & Services — 1.2% |
Agilent Technologies, Inc. | | |
| | |
| | |
Charles River Laboratories International, Inc. * | | |
| | |
| | |
| | |
Mettler-Toledo International, Inc. * | | |
| | |
Thermo Fisher Scientific, Inc. | | |
| | |
West Pharmaceutical Services, Inc. | | |
| | |
|
| | |
| | |
| | |
| | |
| | |
| | |
| | |
Illinois Tool Works, Inc. | | |
| | |
| | |
| | |
| | |
| | |
| | |
Stanley Black & Decker, Inc. | | |
Westinghouse Air Brake Technologies Corp. | | |
| | |
| | |
|
Charter Communications, Inc., Class A * | | |
| | |
| | |
| | |
| | |
|
|
Interpublic Group of Cos., Inc. (The) | | |
| | |
| | |
| | |
Sirius XM Holdings, Inc. (b) | | |
Trade Desk, Inc. (The), Class A * | | |
| | |
|
| | |
| | |
| | |
Southern Copper Corp. (Mexico) | | |
| | |
| | |
Mortgage Real Estate Investment Trusts (REITs) — 0.0% ^ |
Annaly Capital Management, Inc. | | |
|
| | |
| | |
| | |
Consolidated Edison, Inc. | | |
| | |
| | |
| | |
Public Service Enterprise Group, Inc. | | |
| | |
| | |
| | |
|
| | |
Oil, Gas & Consumable Fuels — 3.2% |
| | |
| | |
| | |
| | |
| | |
| | |
| | |
| | |
| | |
| | |
| | |
SEE NOTES TO FINANCIAL STATEMENTS.
| J.P. Morgan Exchange-Traded Funds | |
JPMorgan BetaBuilders U.S. Equity ETF
SCHEDULE OF PORTFOLIO INVESTMENTSAS OF October 31, 2024 (continued)
| | |
Common Stocks — continued |
Oil, Gas & Consumable Fuels — continued |
| | |
| | |
| | |
Occidental Petroleum Corp. | | |
| | |
| | |
| | |
| | |
| | |
Williams Cos., Inc. (The) | | |
| | |
Passenger Airlines — 0.2% |
| | |
| | |
United Airlines Holdings, Inc. * | | |
| | |
Personal Care Products — 0.1% |
Estee Lauder Cos., Inc. (The), Class A | | |
| | |
| | |
|
| | |
| | |
| | |
| | |
| | |
Royalty Pharma plc, Class A | | |
| | |
| | |
| | |
Professional Services — 0.8% |
Automatic Data Processing, Inc. | | |
Booz Allen Hamilton Holding Corp. | | |
Broadridge Financial Solutions, Inc. | | |
| | |
| | |
| | |
| | |
| | |
| | |
SS&C Technologies Holdings, Inc. | | |
| | |
|
Professional Services — continued |
| | |
| | |
| | |
Real Estate Management & Development — 0.2% |
CBRE Group, Inc., Class A * | | |
| | |
Zillow Group, Inc., Class A * | | |
Zillow Group, Inc., Class C * | | |
| | |
|
AvalonBay Communities, Inc. | | |
| | |
Equity LifeStyle Properties, Inc. | | |
| | |
Essex Property Trust, Inc. | | |
| | |
Mid-America Apartment Communities, Inc. | | |
| | |
| | |
| | |
|
| | |
| | |
| | |
Simon Property Group, Inc. | | |
| | |
Semiconductors & Semiconductor Equipment — 11.0% |
Advanced Micro Devices, Inc. * | | |
| | |
| | |
| | |
| | |
| | |
| | |
| | |
| | |
| | |
| | |
Microchip Technology, Inc. | | |
| | |
Monolithic Power Systems, Inc. | | |
| | |
SEE NOTES TO FINANCIAL STATEMENTS.
| J.P. Morgan Exchange-Traded Funds | |
| | |
Common Stocks — continued |
Semiconductors & Semiconductor Equipment — continued |
NXP Semiconductors NV (China) | | |
| | |
| | |
| | |
| | |
| | |
| | |
| | |
|
| | |
| | |
| | |
Atlassian Corp., Class A * | | |
| | |
Bentley Systems, Inc., Class B | | |
Cadence Design Systems, Inc. * | | |
Crowdstrike Holdings, Inc., Class A * | | |
| | |
| | |
| | |
| | |
| | |
| | |
| | |
| | |
| | |
| | |
Palantir Technologies, Inc., Class A * | | |
Palo Alto Networks, Inc. * | | |
| | |
| | |
| | |
| | |
| | |
Tyler Technologies, Inc. * | | |
| | |
| | |
Zoom Video Communications, Inc., Class A * | | |
| | |
| | |
|
| | |
| | |
| | |
|
Specialized REITs — continued |
Digital Realty Trust, Inc. | | |
| | |
Extra Space Storage, Inc. | | |
| | |
| | |
| | |
| | |
| | |
| | |
|
| | |
| | |
Burlington Stores, Inc. * | | |
| | |
| | |
| | |
O'Reilly Automotive, Inc. * | | |
| | |
| | |
| | |
| | |
| | |
Technology Hardware, Storage & Peripherals — 6.9% |
| | |
Dell Technologies, Inc., Class C | | |
Hewlett Packard Enterprise Co. | | |
| | |
| | |
Seagate Technology Holdings plc | | |
Super Micro Computer, Inc. * (b) | | |
| | |
| | |
Textiles, Apparel & Luxury Goods — 0.3% |
| | |
Lululemon Athletica, Inc. * | | |
| | |
| | |
|
| | |
Philip Morris International, Inc. | | |
| | |
SEE NOTES TO FINANCIAL STATEMENTS.
| J.P. Morgan Exchange-Traded Funds | |
JPMorgan BetaBuilders U.S. Equity ETF
SCHEDULE OF PORTFOLIO INVESTMENTSAS OF October 31, 2024 (continued)
| | |
Common Stocks — continued |
Trading Companies & Distributors — 0.4% |
| | |
Ferguson Enterprises, Inc. | | |
| | |
| | |
| | |
| | |
|
American Water Works Co., Inc. | | |
Wireless Telecommunication Services — 0.2% |
| | |
Total Common Stocks
(Cost $3,156,908,090) | | |
| | |
|
Health Care Equipment & Supplies — 0.0% ^ |
ABIOMED, Inc., CVR ‡ *
(Cost $1,764) | | |
| | |
Short-Term Investments — 0.6% |
Investment Companies — 0.5% |
JPMorgan U.S. Government Money Market Fund Class IM Shares, 4.80% (c) (d)
(Cost $19,442,351) | | |
Investment of Cash Collateral from Securities Loaned — 0.1% |
JPMorgan Securities Lending Money Market Fund Agency SL Class Shares, 4.85% (c) (d)
(Cost $2,976,209) | | |
Total Short-Term Investments
(Cost $22,418,560) | | |
Total Investments — 100.0%
(Cost $3,179,328,414) | | |
Liabilities in Excess of Other Assets — (0.0)% ^ | | |
| | |
Percentages indicated are based on net assets. |
| |
| |
| Real Estate Investment Trust |
| Amount rounds to less than 0.1% of net assets. |
| Value determined using significant unobservable inputs. | |
| Non-income producing security. | |
| Investment in affiliate. This security is included in an index in which the Fund, as an index fund, tracks. | |
| The security or a portion of this security is on loan at October 31, 2024. The total value of securities on loan at October 31, 2024 is $2,733,380. | |
| Investment in an affiliated fund, which is registered under the Investment Company Act of 1940, as amended, and is advised by J.P. Morgan Investment Management Inc. | |
| The rate shown is the current yield as of October 31, 2024. | |
SEE NOTES TO FINANCIAL STATEMENTS.
| J.P. Morgan Exchange-Traded Funds | |
Futures contracts outstanding as of October 31, 2024:
| | | | | VALUE AND
UNREALIZED
APPRECIATION
(DEPRECIATION) ($) |
| | | | | |
| | | | | |
SEE NOTES TO FINANCIAL STATEMENTS.
| J.P. Morgan Exchange-Traded Funds | |
JPMorgan BetaBuilders U.S. Mid Cap Equity ETF
SCHEDULE OF PORTFOLIO INVESTMENTSAS OF October 31, 2024
| | |
|
Aerospace & Defense — 1.2% |
| | |
| | |
| | |
| | |
Loar Holdings, Inc. * (a) | | |
Spirit AeroSystems Holdings, Inc., Class A * | | |
| | |
| | |
Air Freight & Logistics — 0.5% |
CH Robinson Worldwide, Inc. | | |
| | |
| | |
Automobile Components — 0.9% |
| | |
| | |
| | |
| | |
Goodyear Tire & Rubber Co. (The) * | | |
| | |
| | |
| | |
|
| | |
| | |
Rivian Automotive, Inc., Class A * (a) | | |
| | |
| | |
|
| | |
| | |
| | |
Columbia Banking System, Inc. | | |
| | |
Commerce Bancshares, Inc. | | |
Cullen/Frost Bankers, Inc. | | |
First Financial Bankshares, Inc. | | |
| | |
| | |
| | |
| | |
| | |
| | |
| | |
|
|
Pinnacle Financial Partners, Inc. | | |
Popular, Inc. (Puerto Rico) | | |
Prosperity Bancshares, Inc. | | |
| | |
| | |
| | |
| | |
| | |
| | |
| | |
| | |
| | |
| | |
| | |
|
Boston Beer Co., Inc. (The), Class A * | | |
| | |
Coca-Cola Consolidated, Inc. | | |
| | |
| | |
|
ACADIA Pharmaceuticals, Inc. * | | |
| | |
Amicus Therapeutics, Inc. * | | |
Apellis Pharmaceuticals, Inc. * | | |
Arrowhead Pharmaceuticals, Inc. * | | |
Blueprint Medicines Corp. * | | |
CRISPR Therapeutics AG (Switzerland) * (a) | | |
| | |
| | |
Halozyme Therapeutics, Inc. * | | |
| | |
Ionis Pharmaceuticals, Inc. * | | |
Madrigal Pharmaceuticals, Inc. * | | |
| | |
REVOLUTION Medicines, Inc. * | | |
| | |
Sarepta Therapeutics, Inc. * | | |
Ultragenyx Pharmaceutical, Inc. * | | |
United Therapeutics Corp. * | | |
| | |
Viking Therapeutics, Inc. * | | |
| | |
SEE NOTES TO FINANCIAL STATEMENTS.
| J.P. Morgan Exchange-Traded Funds | |
| | |
Common Stocks — continued |
|
| | |
| | |
| | |
Ollie's Bargain Outlet Holdings, Inc. * | | |
| | |
|
| | |
| | |
Advanced Drainage Systems, Inc. | | |
Armstrong World Industries, Inc. | | |
| | |
| | |
Fortune Brands Innovations, Inc. | | |
Simpson Manufacturing Co., Inc. | | |
| | |
| | |
Zurn Elkay Water Solutions Corp. | | |
| | |
|
Affiliated Managers Group, Inc. | | |
| | |
| | |
| | |
| | |
Freedom Holding Corp. (Kazakhstan) * (a) | | |
| | |
Interactive Brokers Group, Inc., Class A | | |
| | |
Janus Henderson Group plc | | |
Jefferies Financial Group, Inc. | | |
MarketAxess Holdings, Inc. | | |
| | |
Robinhood Markets, Inc., Class A * | | |
| | |
| | |
Tradeweb Markets, Inc., Class A | | |
| | |
|
Arcadium Lithium plc (Argentina) * | | |
| | |
| | |
Axalta Coating Systems Ltd. * | | |
| | |
| | |
|
|
| | |
| | |
| | |
| | |
| | |
| | |
| | |
| | |
| | |
| | |
Scotts Miracle-Gro Co. (The) | | |
Sensient Technologies Corp. | | |
| | |
Commercial Services & Supplies — 1.1% |
Casella Waste Systems, Inc., Class A * | | |
| | |
| | |
| | |
| | |
| | |
Communications Equipment — 0.4% |
| | |
Lumentum Holdings, Inc. * | | |
| | |
Construction & Engineering — 2.5% |
| | |
| | |
| | |
Comfort Systems USA, Inc. | | |
| | |
| | |
| | |
MDU Resources Group, Inc. | | |
| | |
WillScot Holdings Corp. * | | |
| | |
Construction Materials — 0.4% |
| | |
Summit Materials, Inc., Class A * | | |
| | |
|
| | |
SEE NOTES TO FINANCIAL STATEMENTS.
| J.P. Morgan Exchange-Traded Funds | |
JPMorgan BetaBuilders U.S. Mid Cap Equity ETF
SCHEDULE OF PORTFOLIO INVESTMENTSAS OF October 31, 2024 (continued)
| | |
Common Stocks — continued |
Consumer Finance — continued |
Credit Acceptance Corp. * | | |
| | |
| | |
| | |
SoFi Technologies, Inc. * | | |
| | |
Consumer Staples Distribution & Retail — 1.9% |
BJ's Wholesale Club Holdings, Inc. * | | |
Casey's General Stores, Inc. | | |
| | |
Performance Food Group Co. * | | |
Sprouts Farmers Market, Inc. * | | |
| | |
| | |
Containers & Packaging — 1.2% |
| | |
| | |
Graphic Packaging Holding Co. | | |
| | |
| | |
| | |
| | |
| | |
Diversified Consumer Services — 1.2% |
| | |
Bright Horizons Family Solutions, Inc. * | | |
| | |
Grand Canyon Education, Inc. * | | |
| | |
Service Corp. International | | |
| | |
|
Essential Properties Realty Trust, Inc. | | |
Diversified Telecommunication Services — 0.5% |
Cogent Communications Holdings, Inc. | | |
Frontier Communications Parent, Inc. * | | |
Iridium Communications, Inc. | | |
Liberty Global Ltd., Class A (Belgium) * | | |
Liberty Global Ltd., Class C (Belgium) * | | |
| | |
Electric Utilities — 1.0% |
| | |
| | |
|
Electric Utilities — continued |
| | |
| | |
| | |
Pinnacle West Capital Corp. | | |
Portland General Electric Co. | | |
| | |
| | |
Electrical Equipment — 1.6% |
| | |
| | |
Bloom Energy Corp., Class A * (a) | | |
| | |
| | |
NEXTracker, Inc., Class A * | | |
| | |
| | |
Sensata Technologies Holding plc | | |
| | |
Electronic Equipment, Instruments & Components — 2.7% |
Advanced Energy Industries, Inc. | | |
Arrow Electronics, Inc. * | | |
| | |
| | |
| | |
| | |
| | |
| | |
Insight Enterprises, Inc. * | | |
| | |
| | |
| | |
| | |
| | |
| | |
| | |
| | |
Energy Equipment & Services — 0.8% |
| | |
| | |
| | |
Patterson-UTI Energy, Inc. | | |
| | |
SEE NOTES TO FINANCIAL STATEMENTS.
| J.P. Morgan Exchange-Traded Funds | |
| | |
Common Stocks — continued |
Energy Equipment & Services — continued |
| | |
Weatherford International plc | | |
| | |
|
Endeavor Group Holdings, Inc., Class A (a) | | |
Madison Square Garden Sports Corp. * | | |
| | |
| | |
TKO Group Holdings, Inc. * | | |
Warner Music Group Corp., Class A | | |
| | |
Financial Services — 2.4% |
| | |
| | |
| | |
Euronet Worldwide, Inc. * | | |
| | |
Jackson Financial, Inc., Class A | | |
| | |
| | |
PennyMac Financial Services, Inc. | | |
| | |
| | |
Shift4 Payments, Inc., Class A * | | |
| | |
| | |
| | |
| | |
| | |
|
Darling Ingredients, Inc. * | | |
| | |
| | |
| | |
| | |
| | |
| | |
| | |
| | |
Simply Good Foods Co. (The) * | | |
| | |
| | |
|
|
| | |
New Jersey Resources Corp. | | |
| | |
Southwest Gas Holdings, Inc. | | |
| | |
| | |
| | |
Ground Transportation — 1.6% |
| | |
Knight-Swift Transportation Holdings, Inc. | | |
| | |
| | |
| | |
| | |
| | |
| | |
| | |
| | |
Health Care Equipment & Supplies — 2.0% |
| | |
| | |
| | |
Globus Medical, Inc., Class A * | | |
| | |
Inspire Medical Systems, Inc. * | | |
iRhythm Technologies, Inc. * | | |
Lantheus Holdings, Inc. * | | |
| | |
Merit Medical Systems, Inc. * | | |
| | |
| | |
| | |
| | |
| | |
Health Care Providers & Services — 2.3% |
Acadia Healthcare Co., Inc. * | | |
| | |
| | |
| | |
| | |
| | |
| | |
| | |
SEE NOTES TO FINANCIAL STATEMENTS.
| J.P. Morgan Exchange-Traded Funds | |
JPMorgan BetaBuilders U.S. Mid Cap Equity ETF
SCHEDULE OF PORTFOLIO INVESTMENTSAS OF October 31, 2024 (continued)
| | |
Common Stocks — continued |
Health Care Providers & Services — continued |
Option Care Health, Inc. * | | |
| | |
| | |
| | |
Select Medical Holdings Corp. | | |
| | |
| | |
| | |
|
Healthcare Realty Trust, Inc. | | |
Medical Properties Trust, Inc. (a) | | |
Omega Healthcare Investors, Inc. | | |
| | |
Health Care Technology — 0.2% |
Doximity, Inc., Class A * | | |
Evolent Health, Inc., Class A * | | |
| | |
Hotel & Resort REITs — 0.3% |
Apple Hospitality REIT, Inc. | | |
Ryman Hospitality Properties, Inc. | | |
| | |
Hotels, Restaurants & Leisure — 3.9% |
| | |
| | |
Caesars Entertainment, Inc. * | | |
| | |
Choice Hotels International, Inc. (a) | | |
| | |
DraftKings, Inc., Class A * | | |
Hilton Grand Vacations, Inc. * | | |
Hyatt Hotels Corp., Class A | | |
Life Time Group Holdings, Inc. * | | |
| | |
Marriott Vacations Worldwide Corp. | | |
Norwegian Cruise Line Holdings Ltd. * | | |
Penn Entertainment, Inc. * | | |
Planet Fitness, Inc., Class A * | | |
| | |
| | |
United Parks & Resorts, Inc. * | | |
| | |
| | |
| | |
|
Hotels, Restaurants & Leisure — continued |
| | |
Wyndham Hotels & Resorts, Inc. | | |
| | |
Household Durables — 2.1% |
| | |
Installed Building Products, Inc. | | |
| | |
| | |
Mohawk Industries, Inc. * | | |
| | |
Taylor Morrison Home Corp. * | | |
Tempur Sealy International, Inc. | | |
| | |
| | |
| | |
Worthington Enterprises, Inc. | | |
| | |
Household Products — 0.0% ^ |
Reynolds Consumer Products, Inc. | | |
Independent Power and Renewable Electricity Producers — 0.2% |
| | |
Clearway Energy, Inc., Class C | | |
| | |
| | |
|
Americold Realty Trust, Inc. | | |
EastGroup Properties, Inc. | | |
First Industrial Realty Trust, Inc. | | |
Rexford Industrial Realty, Inc. | | |
| | |
| | |
| | |
|
| | |
| | |
Axis Capital Holdings Ltd. | | |
Brighthouse Financial, Inc. * | | |
| | |
Erie Indemnity Co., Class A | | |
First American Financial Corp. | | |
| | |
Hanover Insurance Group, Inc. (The) | | |
SEE NOTES TO FINANCIAL STATEMENTS.
| J.P. Morgan Exchange-Traded Funds | |
| | |
Common Stocks — continued |
|
| | |
Kinsale Capital Group, Inc. | | |
| | |
Old Republic International Corp. | | |
| | |
RenaissanceRe Holdings Ltd. (Bermuda) | | |
| | |
Ryan Specialty Holdings, Inc. | | |
Selective Insurance Group, Inc. | | |
| | |
White Mountains Insurance Group Ltd. | | |
| | |
Interactive Media & Services — 0.5% |
| | |
| | |
Trump Media & Technology Group Corp. * (a) | | |
ZoomInfo Technologies, Inc. * | | |
| | |
|
| | |
| | |
| | |
| | |
|
| | |
| | |
| | |
| | |
| | |
Topgolf Callaway Brands Corp. * | | |
| | |
| | |
Life Sciences Tools & Services — 0.9% |
10X Genomics, Inc., Class A * | | |
| | |
Bio-Rad Laboratories, Inc., Class A * | | |
| | |
| | |
| | |
| | |
| | |
| | |
|
|
| | |
Allison Transmission Holdings, Inc. | | |
| | |
| | |
| | |
| | |
| | |
| | |
Franklin Electric Co., Inc. | | |
Gates Industrial Corp. plc * | | |
| | |
| | |
| | |
John Bean Technologies Corp. | | |
Lincoln Electric Holdings, Inc. | | |
| | |
| | |
| | |
| | |
| | |
| | |
| | |
| | |
| | |
Watts Water Technologies, Inc., Class A | | |
| | |
Marine Transportation — 0.2% |
| | |
|
Liberty Broadband Corp., Class A * | | |
Liberty Broadband Corp., Class C * | | |
New York Times Co. (The), Class A | | |
Nexstar Media Group, Inc. | | |
Paramount Global, Class B (a) | | |
| | |
|
| | |
| | |
| | |
| | |
| | |
| | |
| | |
SEE NOTES TO FINANCIAL STATEMENTS.
| J.P. Morgan Exchange-Traded Funds | |
JPMorgan BetaBuilders U.S. Mid Cap Equity ETF
SCHEDULE OF PORTFOLIO INVESTMENTSAS OF October 31, 2024 (continued)
| | |
Common Stocks — continued |
Metals & Mining — continued |
| | |
United States Steel Corp. | | |
| | |
Mortgage Real Estate Investment Trusts (REITs) — 0.6% |
AGNC Investment Corp. (a) | | |
Blackstone Mortgage Trust, Inc., Class A (a) | | |
| | |
Starwood Property Trust, Inc. | | |
| | |
|
| | |
| | |
Northwestern Energy Group, Inc. | | |
| | |
|
| | |
| | |
| | |
Oil, Gas & Consumable Fuels — 3.0% |
| | |
| | |
California Resources Corp. | | |
| | |
| | |
| | |
| | |
| | |
| | |
Magnolia Oil & Gas Corp., Class A | | |
| | |
| | |
New Fortress Energy, Inc. (a) | | |
| | |
PBF Energy, Inc., Class A | | |
| | |
| | |
| | |
| | |
| | |
Paper & Forest Products — 0.2% |
| | |
| | |
|
Passenger Airlines — 0.4% |
| | |
American Airlines Group, Inc. * | | |
| | |
Personal Care Products — 0.5% |
| | |
| | |
| | |
| | |
| | |
|
Axsome Therapeutics, Inc. * | | |
| | |
Elanco Animal Health, Inc. * | | |
Intra-Cellular Therapies, Inc. * | | |
Jazz Pharmaceuticals plc * | | |
| | |
| | |
Prestige Consumer Healthcare, Inc. * | | |
| | |
Professional Services — 2.6% |
| | |
CACI International, Inc., Class A * | | |
| | |
| | |
Dun & Bradstreet Holdings, Inc. | | |
ExlService Holdings, Inc. * | | |
| | |
| | |
| | |
| | |
| | |
| | |
| | |
| | |
| | |
Paylocity Holding Corp. * | | |
| | |
Science Applications International Corp. | | |
| | |
| | |
SEE NOTES TO FINANCIAL STATEMENTS.
| J.P. Morgan Exchange-Traded Funds | |
| | |
Common Stocks — continued |
Real Estate Management & Development — 0.4% |
Howard Hughes Holdings, Inc. * | | |
Jones Lang LaSalle, Inc. * | | |
| | |
|
American Homes 4 Rent, Class A | | |
Independence Realty Trust, Inc. | | |
| | |
|
| | |
Brixmor Property Group, Inc. | | |
Federal Realty Investment Trust | | |
| | |
| | |
Phillips Edison & Co., Inc. | | |
| | |
Semiconductors & Semiconductor Equipment — 1.9% |
Allegro MicroSystems, Inc. (Japan) * | | |
| | |
| | |
Axcelis Technologies, Inc. * | | |
| | |
| | |
Lattice Semiconductor Corp. * | | |
MACOM Technology Solutions Holdings, Inc. * | | |
| | |
| | |
| | |
| | |
Silicon Laboratories, Inc. * | | |
SolarEdge Technologies, Inc. * (a) | | |
| | |
| | |
| | |
| | |
|
Altair Engineering, Inc., Class A * | | |
AppLovin Corp., Class A * | | |
| | |
| | |
| | |
| | |
CCC Intelligent Solutions Holdings, Inc. * | | |
| | |
|
|
Confluent, Inc., Class A * | | |
Dolby Laboratories, Inc., Class A | | |
DoubleVerify Holdings, Inc. * | | |
| | |
| | |
| | |
| | |
| | |
Guidewire Software, Inc. * | | |
Informatica, Inc., Class A * | | |
Instructure Holdings, Inc. * | | |
Manhattan Associates, Inc. * | | |
MicroStrategy, Inc., Class A * (a) | | |
| | |
| | |
Procore Technologies, Inc. * | | |
| | |
| | |
SentinelOne, Inc., Class A * | | |
Smartsheet, Inc., Class A * | | |
| | |
| | |
| | |
| | |
| | |
| | |
|
| | |
| | |
Gaming and Leisure Properties, Inc. | | |
Lamar Advertising Co., Class A | | |
National Storage Affiliates Trust | | |
| | |
| | |
| | |
|
Abercrombie & Fitch Co., Class A * | | |
Academy Sports & Outdoors, Inc. | | |
| | |
Asbury Automotive Group, Inc. * | | |
| | |
| | |
| | |
SEE NOTES TO FINANCIAL STATEMENTS.
| J.P. Morgan Exchange-Traded Funds | |
JPMorgan BetaBuilders U.S. Mid Cap Equity ETF
SCHEDULE OF PORTFOLIO INVESTMENTSAS OF October 31, 2024 (continued)
| | |
Common Stocks — continued |
Specialty Retail — continued |
Dick's Sporting Goods, Inc. | | |
| | |
Floor & Decor Holdings, Inc., Class A * | | |
GameStop Corp., Class A * (a) | | |
| | |
| | |
Lithia Motors, Inc., Class A | | |
| | |
Penske Automotive Group, Inc. | | |
| | |
| | |
| | |
| | |
| | |
Technology Hardware, Storage & Peripherals — 0.4% |
Pure Storage, Inc., Class A * | | |
Textiles, Apparel & Luxury Goods — 1.4% |
| | |
| | |
| | |
| | |
| | |
Skechers U.S.A., Inc., Class A * | | |
| | |
Under Armour, Inc., Class A * | | |
Under Armour, Inc., Class C * | | |
| | |
| | |
Trading Companies & Distributors — 1.9% |
| | |
Applied Industrial Technologies, Inc. | | |
Beacon Roofing Supply, Inc. * | | |
Core & Main, Inc., Class A * | | |
| | |
| | |
| | |
MSC Industrial Direct Co., Inc., Class A | | |
Rush Enterprises, Inc., Class A | | |
Rush Enterprises, Inc., Class B | | |
SiteOne Landscape Supply, Inc. * | | |
WESCO International, Inc. | | |
| | |
| | |
|
|
American States Water Co. | | |
California Water Service Group | | |
Essential Utilities, Inc. | | |
| | |
Total Common Stocks
(Cost $1,516,499,644) | | |
Short-Term Investments — 3.1% |
Investment Companies — 0.5% |
JPMorgan U.S. Government Money Market Fund Class IM Shares, 4.80% (b) (c)
(Cost $8,076,683) | | |
Investment of Cash Collateral from Securities Loaned — 2.6% |
JPMorgan Securities Lending Money Market Fund Agency SL Class Shares, 4.85% (b) (c)
(Cost $46,831,039) | | |
Total Short-Term Investments
(Cost $54,907,722) | | |
Total Investments — 102.6%
(Cost $1,571,407,366) | | |
Liabilities in Excess of Other Assets — (2.6)% | | |
| | |
Percentages indicated are based on net assets. |
| |
| Real Estate Investment Trust |
| Amount rounds to less than 0.1% of net assets. |
| Non-income producing security. | |
| The security or a portion of this security is on loan at October 31, 2024. The total value of securities on loan at October 31, 2024 is $44,757,999. | |
| Investment in an affiliated fund, which is registered under the Investment Company Act of 1940, as amended, and is advised by J.P. Morgan Investment Management Inc. | |
| The rate shown is the current yield as of October 31, 2024. | |
SEE NOTES TO FINANCIAL STATEMENTS.
| J.P. Morgan Exchange-Traded Funds | |
Futures contracts outstanding as of October 31, 2024:
| | | | | VALUE AND
UNREALIZED
APPRECIATION
(DEPRECIATION) ($) |
| | | | | |
S&P MidCap 400 E-Mini Index | | | | | |
SEE NOTES TO FINANCIAL STATEMENTS.
| J.P. Morgan Exchange-Traded Funds | |
JPMorgan BetaBuilders U.S. Small Cap Equity ETF
SCHEDULE OF PORTFOLIO INVESTMENTSAS OF October 31, 2024
| | |
|
Aerospace & Defense — 1.5% |
| | |
| | |
| | |
Kratos Defense & Security Solutions, Inc. * | | |
| | |
| | |
Rocket Lab USA, Inc. * (a) | | |
| | |
| | |
Air Freight & Logistics — 0.2% |
Air Transport Services Group, Inc. * | | |
| | |
| | |
Automobile Components — 1.8% |
American Axle & Manufacturing Holdings, Inc. * | | |
| | |
| | |
Fox Factory Holding Corp. * | | |
Garrett Motion, Inc. (Switzerland) * | | |
| | |
| | |
Mobileye Global, Inc., Class A (Israel) * (a) | | |
Modine Manufacturing Co. * | | |
| | |
| | |
| | |
Standard Motor Products, Inc. | | |
| | |
| | |
|
Winnebago Industries, Inc. | | |
|
| | |
Amalgamated Financial Corp. | | |
| | |
| | |
| | |
Atlantic Union Bankshares Corp. | | |
| | |
| | |
| | |
| | |
| | |
| | |
| | |
Berkshire Hills Bancorp, Inc. | | |
| | |
| | |
| | |
Columbia Financial, Inc. * | | |
Community Financial System, Inc. | | |
| | |
|
|
Community Trust Bancorp, Inc. | | |
Customers Bancorp, Inc. * | | |
| | |
Dime Community Bancshares, Inc. | | |
| | |
Enterprise Financial Services Corp. | | |
| | |
| | |
First BanCorp (Puerto Rico) | | |
| | |
First Commonwealth Financial Corp. | | |
| | |
| | |
First Interstate BancSystem, Inc., Class A | | |
| | |
Flagstar Financial, Inc. (a) | | |
| | |
German American Bancorp, Inc. | | |
Heartland Financial USA, Inc. | | |
| | |
| | |
| | |
Independent Bank Group, Inc. | | |
International Bancshares Corp. | | |
| | |
Live Oak Bancshares, Inc. | | |
National Bank Holdings Corp., Class A | | |
| | |
| | |
Northwest Bancshares, Inc. | | |
OceanFirst Financial Corp. | | |
OFG Bancorp (Puerto Rico) | | |
| | |
Pacific Premier Bancorp, Inc. | | |
| | |
| | |
| | |
| | |
Provident Financial Services, Inc. | | |
| | |
Republic Bancorp, Inc., Class A | | |
| | |
Sandy Spring Bancorp, Inc. | | |
Seacoast Banking Corp. of Florida | | |
ServisFirst Bancshares, Inc. | | |
Simmons First National Corp., Class A | | |
Southside Bancshares, Inc. | | |
| | |
Stock Yards Bancorp, Inc. | | |
Texas Capital Bancshares, Inc. * | | |
| | |
| | |
Triumph Financial, Inc. * | | |
| | |
SEE NOTES TO FINANCIAL STATEMENTS.
| J.P. Morgan Exchange-Traded Funds | |
| | |
Common Stocks — continued |
|
United Community Banks, Inc. | | |
| | |
| | |
| | |
| | |
| | |
| | |
|
Duckhorn Portfolio, Inc. (The) * | | |
| | |
Vita Coco Co., Inc. (The) * | | |
| | |
|
Agios Pharmaceuticals, Inc. * | | |
Akero Therapeutics, Inc. * | | |
Apogee Therapeutics, Inc. * | | |
| | |
Arcus Biosciences, Inc. * | | |
| | |
Aurinia Pharmaceuticals, Inc. (Canada) * | | |
Beam Therapeutics, Inc. * | | |
BioCryst Pharmaceuticals, Inc. * | | |
| | |
| | |
Catalyst Pharmaceuticals, Inc. * | | |
Celldex Therapeutics, Inc. * | | |
| | |
Crinetics Pharmaceuticals, Inc. * | | |
Day One Biopharmaceuticals, Inc. * | | |
Denali Therapeutics, Inc. * | | |
| | |
Dynavax Technologies Corp. * | | |
Dyne Therapeutics, Inc. * | | |
| | |
Ideaya Biosciences, Inc. * | | |
| | |
| | |
Intellia Therapeutics, Inc. * | | |
Iovance Biotherapeutics, Inc. * | | |
Ironwood Pharmaceuticals, Inc. * | | |
Keros Therapeutics, Inc. * | | |
| | |
| | |
Kymera Therapeutics, Inc. * | | |
| | |
Nuvalent, Inc., Class A * | | |
OmniAb Operations, Inc. ‡ * | | |
Protagonist Therapeutics, Inc. * | | |
Prothena Corp. plc (Ireland) * | | |
| | |
Recursion Pharmaceuticals, Inc., Class A * (a) | | |
| | |
Relay Therapeutics, Inc. * | | |
| | |
|
Biotechnology — continued |
Rhythm Pharmaceuticals, Inc. * | | |
Rocket Pharmaceuticals, Inc. * | | |
Sage Therapeutics, Inc. * | | |
Sana Biotechnology, Inc. * | | |
SpringWorks Therapeutics, Inc. * (a) | | |
Spyre Therapeutics, Inc. * | | |
Summit Therapeutics, Inc. * (a) | | |
Syndax Pharmaceuticals, Inc. * | | |
Tango Therapeutics, Inc. * | | |
| | |
| | |
Vera Therapeutics, Inc. * | | |
| | |
| | |
Vir Biotechnology, Inc. * | | |
Viridian Therapeutics, Inc. * | | |
| | |
Zentalis Pharmaceuticals, Inc. * | | |
| | |
|
| | |
| | |
Savers Value Village, Inc. * | | |
| | |
|
American Woodmark Corp. * | | |
| | |
| | |
| | |
Gibraltar Industries, Inc. * | | |
| | |
| | |
Janus International Group, Inc. * | | |
| | |
| | |
Quanex Building Products Corp. | | |
Resideo Technologies, Inc. * | | |
| | |
| | |
|
Artisan Partners Asset Management, Inc., Class A | | |
B. Riley Financial, Inc. (a) | | |
| | |
Brightsphere Investment Group, Inc. | | |
DigitalBridge Group, Inc. (a) | | |
Donnelley Financial Solutions, Inc. * | | |
Hamilton Lane, Inc., Class A | | |
| | |
| | |
PJT Partners, Inc., Class A | | |
StepStone Group, Inc., Class A | | |
SEE NOTES TO FINANCIAL STATEMENTS.
| J.P. Morgan Exchange-Traded Funds | |
JPMorgan BetaBuilders U.S. Small Cap Equity ETF
SCHEDULE OF PORTFOLIO INVESTMENTSAS OF October 31, 2024 (continued)
| | |
Common Stocks — continued |
Capital Markets — continued |
| | |
| | |
Victory Capital Holdings, Inc., Class A | | |
Virtu Financial, Inc., Class A | | |
Virtus Investment Partners, Inc. | | |
| | |
| | |
|
| | |
| | |
Ginkgo Bioworks Holdings, Inc. * (a) | | |
| | |
| | |
| | |
| | |
Minerals Technologies, Inc. | | |
| | |
PureCycle Technologies, Inc. * (a) | | |
| | |
| | |
| | |
Commercial Services & Supplies — 2.4% |
| | |
ACV Auctions, Inc., Class A * | | |
| | |
BrightView Holdings, Inc. * | | |
| | |
| | |
| | |
| | |
Driven Brands Holdings, Inc. * | | |
| | |
Healthcare Services Group, Inc. * | | |
| | |
Matthews International Corp., Class A | | |
| | |
Montrose Environmental Group, Inc. * | | |
| | |
| | |
| | |
| | |
| | |
| | |
Communications Equipment — 0.8% |
| | |
Digi International, Inc. * | | |
| | |
| | |
| | |
| | |
| | |
|
Communications Equipment — continued |
| | |
| | |
| | |
Construction & Engineering — 1.7% |
Ameresco, Inc., Class A * | | |
Centuri Holdings, Inc. * (a) | | |
Construction Partners, Inc., Class A * | | |
| | |
Granite Construction, Inc. | | |
| | |
| | |
| | |
Sterling Infrastructure, Inc. * | | |
| | |
Construction Materials — 0.4% |
| | |
United States Lime & Minerals, Inc. | | |
| | |
|
Bread Financial Holdings, Inc. | | |
Encore Capital Group, Inc. * | | |
Enova International, Inc. * | | |
| | |
| | |
| | |
| | |
Upstart Holdings, Inc. * (a) | | |
| | |
| | |
Consumer Staples Distribution & Retail — 0.6% |
| | |
Chefs' Warehouse, Inc. (The) * | | |
Grocery Outlet Holding Corp. * | | |
Ingles Markets, Inc., Class A | | |
| | |
| | |
| | |
Containers & Packaging — 0.2% |
| | |
| | |
| | |
| | |
| | |
|
GigaCloud Technology, Inc., Class A (Hong Kong) * (a) | | |
Diversified Consumer Services — 1.5% |
Adtalem Global Education, Inc. * | | |
| | |
| | |
SEE NOTES TO FINANCIAL STATEMENTS.
| J.P. Morgan Exchange-Traded Funds | |
| | |
Common Stocks — continued |
Diversified Consumer Services — continued |
Graham Holdings Co., Class B | | |
Laureate Education, Inc., Class A | | |
| | |
OneSpaWorld Holdings Ltd. (Bahamas) | | |
Strategic Education, Inc. | | |
| | |
| | |
| | |
|
Alexander & Baldwin, Inc. | | |
American Assets Trust, Inc. | | |
Broadstone Net Lease, Inc. | | |
Empire State Realty Trust, Inc., Class A | | |
| | |
| | |
Diversified Telecommunication Services — 0.6% |
| | |
Liberty Latin America Ltd., Class A (Puerto Rico) * | | |
Liberty Latin America Ltd., Class C (Puerto Rico) * | | |
Lumen Technologies, Inc. * | | |
Shenandoah Telecommunications Co. | | |
| | |
Electric Utilities — 0.3% |
Hawaiian Electric Industries, Inc. * | | |
| | |
| | |
Electrical Equipment — 0.8% |
Array Technologies, Inc. * | | |
| | |
| | |
| | |
| | |
Shoals Technologies Group, Inc., Class A * | | |
| | |
| | |
| | |
Electronic Equipment, Instruments & Components — 2.4% |
Benchmark Electronics, Inc. | | |
| | |
| | |
| | |
| | |
| | |
Mirion Technologies, Inc. * | | |
Napco Security Technologies, Inc. | | |
| | |
| | |
| | |
| | |
| | |
|
Electronic Equipment, Instruments & Components — continued |
| | |
| | |
| | |
Vishay Intertechnology, Inc. | | |
| | |
Energy Equipment & Services — 1.3% |
| | |
| | |
| | |
Helix Energy Solutions Group, Inc. * | | |
Kodiak Gas Services, Inc. | | |
| | |
| | |
Oceaneering International, Inc. * | | |
| | |
| | |
| | |
| | |
|
AMC Entertainment Holdings, Inc., Class A * (a) | | |
Atlanta Braves Holdings, Inc., Class A * | | |
Atlanta Braves Holdings, Inc., Class C * | | |
Cinemark Holdings, Inc. * | | |
| | |
Liberty Media Corp-Liberty Live, Class A * | | |
Liberty Media Corp-Liberty Live, Class C * | | |
Lions Gate Entertainment Corp., Class A * | | |
Lions Gate Entertainment Corp., Class B * | | |
Madison Square Garden Entertainment Corp. * | | |
Sphere Entertainment Co. * | | |
| | |
Financial Services — 1.9% |
AvidXchange Holdings, Inc. * | | |
| | |
Compass Diversified Holdings | | |
EVERTEC, Inc. (Puerto Rico) | | |
Federal Agricultural Mortgage Corp., Class C | | |
HA Sustainable Infrastructure Capital, Inc. | | |
| | |
| | |
| | |
NMI Holdings, Inc., Class A * | | |
| | |
| | |
Rocket Cos., Inc., Class A * | | |
| | |
| | |
|
| | |
| | |
Fresh Del Monte Produce, Inc. | | |
SEE NOTES TO FINANCIAL STATEMENTS.
| J.P. Morgan Exchange-Traded Funds | |
JPMorgan BetaBuilders U.S. Small Cap Equity ETF
SCHEDULE OF PORTFOLIO INVESTMENTSAS OF October 31, 2024 (continued)
| | |
Common Stocks — continued |
Food Products — continued |
| | |
Tootsie Roll Industries, Inc. | | |
| | |
| | |
| | |
| | |
|
Chesapeake Utilities Corp. | | |
Northwest Natural Holding Co. | | |
| | |
Ground Transportation — 0.8% |
| | |
| | |
Hertz Global Holdings, Inc. * (a) | | |
| | |
| | |
Schneider National, Inc., Class B | | |
| | |
| | |
Health Care Equipment & Supplies — 3.4% |
Alphatec Holdings, Inc. * | | |
| | |
| | |
| | |
| | |
Establishment Labs Holdings, Inc. (Costa Rica) * | | |
| | |
| | |
| | |
| | |
Integra LifeSciences Holdings Corp. * | | |
| | |
| | |
| | |
| | |
| | |
| | |
PROCEPT BioRobotics Corp. * | | |
| | |
| | |
Tandem Diabetes Care, Inc. * | | |
TransMedics Group, Inc. * | | |
| | |
| | |
Health Care Providers & Services — 2.4% |
| | |
| | |
| | |
Alignment Healthcare, Inc. * | | |
| | |
AMN Healthcare Services, Inc. * | | |
| | |
|
Health Care Providers & Services — continued |
| | |
BrightSpring Health Services, Inc. * | | |
Brookdale Senior Living, Inc. * | | |
| | |
Hims & Hers Health, Inc. * | | |
LifeStance Health Group, Inc. * | | |
National HealthCare Corp. | | |
| | |
| | |
| | |
| | |
| | |
| | |
Pediatrix Medical Group, Inc. * | | |
Privia Health Group, Inc. * | | |
| | |
US Physical Therapy, Inc. | | |
| | |
|
| | |
| | |
National Health Investors, Inc. | | |
Sabra Health Care REIT, Inc. | | |
| | |
Health Care Technology — 0.4% |
| | |
Definitive Healthcare Corp. * | | |
| | |
| | |
| | |
| | |
| | |
Hotel & Resort REITs — 0.8% |
DiamondRock Hospitality Co. | | |
Park Hotels & Resorts, Inc. | | |
| | |
| | |
| | |
Sunstone Hotel Investors, Inc. | | |
Xenia Hotels & Resorts, Inc. | | |
| | |
Hotels, Restaurants & Leisure — 2.3% |
| | |
| | |
Bowlero Corp., Class A (a) | | |
Brinker International, Inc. * | | |
Cheesecake Factory, Inc. (The) | | |
Cracker Barrel Old Country Store, Inc. (a) | | |
Dave & Buster's Entertainment, Inc. * | | |
| | |
Dutch Bros, Inc., Class A * | | |
SEE NOTES TO FINANCIAL STATEMENTS.
| J.P. Morgan Exchange-Traded Funds | |
| | |
Common Stocks — continued |
Hotels, Restaurants & Leisure — continued |
| | |
First Watch Restaurant Group, Inc. * | | |
Global Business Travel Group I * (a) | | |
Golden Entertainment, Inc. | | |
| | |
| | |
Monarch Casino & Resort, Inc. | | |
Papa John's International, Inc. | | |
Portillo's, Inc., Class A * (a) | | |
Red Rock Resorts, Inc., Class A | | |
| | |
Shake Shack, Inc., Class A * | | |
Sweetgreen, Inc., Class A * | | |
Target Hospitality Corp. * | | |
| | |
Household Durables — 1.7% |
| | |
Century Communities, Inc. | | |
Green Brick Partners, Inc. * | | |
| | |
| | |
| | |
| | |
| | |
| | |
| | |
Vizio Holding Corp., Class A * (a) | | |
| | |
Household Products — 0.7% |
Central Garden & Pet Co. * | | |
Central Garden & Pet Co., Class A * | | |
| | |
Spectrum Brands Holdings, Inc. | | |
| | |
| | |
|
Innovative Industrial Properties, Inc. | | |
| | |
| | |
|
| | |
Baldwin Insurance Group, Inc. (The), Class A * | | |
CNO Financial Group, Inc. | | |
| | |
F&G Annuities & Life, Inc. | | |
Genworth Financial, Inc., Class A * | | |
Goosehead Insurance, Inc., Class A * | | |
Horace Mann Educators Corp. | | |
| | |
| | |
Oscar Health, Inc., Class A * | | |
| | |
|
|
| | |
| | |
Safety Insurance Group, Inc. | | |
SiriusPoint Ltd. (Sweden) * | | |
Skyward Specialty Insurance Group, Inc. * | | |
Stewart Information Services Corp. | | |
| | |
| | |
Interactive Media & Services — 1.0% |
| | |
| | |
| | |
| | |
| | |
| | |
| | |
| | |
ZipRecruiter, Inc., Class A * | | |
| | |
|
DigitalOcean Holdings, Inc. * | | |
| | |
Grid Dynamics Holdings, Inc. * | | |
| | |
|
Malibu Boats, Inc., Class A * | | |
Peloton Interactive, Inc., Class A * | | |
Smith & Wesson Brands, Inc. | | |
| | |
| | |
| | |
Life Sciences Tools & Services — 0.2% |
Cytek Biosciences, Inc. * | | |
| | |
Maravai LifeSciences Holdings, Inc., Class A * | | |
| | |
| | |
|
| | |
Albany International Corp., Class A | | |
| | |
Atmus Filtration Technologies, Inc. | | |
| | |
| | |
| | |
| | |
| | |
| | |
Greenbrier Cos., Inc. (The) | | |
Helios Technologies, Inc. | | |
Hillman Solutions Corp. * | | |
SEE NOTES TO FINANCIAL STATEMENTS.
| J.P. Morgan Exchange-Traded Funds | |
JPMorgan BetaBuilders U.S. Small Cap Equity ETF
SCHEDULE OF PORTFOLIO INVESTMENTSAS OF October 31, 2024 (continued)
| | |
Common Stocks — continued |
|
| | |
| | |
| | |
Mueller Water Products, Inc., Class A | | |
| | |
Standex International Corp. | | |
| | |
| | |
| | |
| | |
| | |
Marine Transportation — 0.3% |
| | |
|
| | |
| | |
Integral Ad Science Holding Corp. * | | |
John Wiley & Sons, Inc., Class A | | |
| | |
| | |
| | |
| | |
| | |
| | |
|
Alpha Metallurgical Resources, Inc. | | |
| | |
Carpenter Technology Corp. | | |
| | |
| | |
| | |
| | |
| | |
| | |
| | |
| | |
| | |
Mortgage Real Estate Investment Trusts (REITs) — 1.0% |
Apollo Commercial Real Estate Finance, Inc. | | |
Arbor Realty Trust, Inc. (a) | | |
ARMOUR Residential REIT, Inc. (a) | | |
Brightspire Capital, Inc. | | |
| | |
Claros Mortgage Trust, Inc. | | |
Franklin BSP Realty Trust, Inc. | | |
| | |
| | |
PennyMac Mortgage Investment Trust | | |
| | |
| | |
|
Mortgage Real Estate Investment Trusts (REITs) — continued |
| | |
Two Harbors Investment Corp. | | |
| | |
|
| | |
| | |
| | |
Easterly Government Properties, Inc. | | |
| | |
Highwoods Properties, Inc. | | |
Hudson Pacific Properties, Inc. | | |
| | |
| | |
Piedmont Office Realty Trust, Inc., Class A | | |
| | |
| | |
| | |
Oil, Gas & Consumable Fuels — 2.1% |
| | |
| | |
| | |
| | |
| | |
Granite Ridge Resources, Inc. | | |
| | |
| | |
International Seaways, Inc. | | |
| | |
Kosmos Energy Ltd. (Ghana) * | | |
| | |
| | |
Par Pacific Holdings, Inc. * | | |
| | |
| | |
| | |
| | |
| | |
| | |
Paper & Forest Products — 0.2% |
| | |
Passenger Airlines — 0.6% |
| | |
| | |
Joby Aviation, Inc. * (a) | | |
| | |
Sun Country Airlines Holdings, Inc. * | | |
| | |
Personal Care Products — 0.2% |
Edgewell Personal Care Co. | | |
SEE NOTES TO FINANCIAL STATEMENTS.
| J.P. Morgan Exchange-Traded Funds | |
| | |
Common Stocks — continued |
Personal Care Products — continued |
| | |
USANA Health Sciences, Inc. * | | |
| | |
|
Amneal Pharmaceuticals, Inc. * | | |
Amphastar Pharmaceuticals, Inc. * | | |
ANI Pharmaceuticals, Inc. * | | |
| | |
Avadel Pharmaceuticals plc, ADR * | | |
Cassava Sciences, Inc. * (a) | | |
Corcept Therapeutics, Inc. * | | |
Edgewise Therapeutics, Inc. * | | |
Harmony Biosciences Holdings, Inc. * | | |
| | |
Ligand Pharmaceuticals, Inc. * | | |
Neumora Therapeutics, Inc. * | | |
Pacira BioSciences, Inc. * | | |
Pliant Therapeutics, Inc. * | | |
Supernus Pharmaceuticals, Inc. * | | |
Tilray Brands, Inc. (Canada) * (a) | | |
| | |
Professional Services — 1.8% |
| | |
CSG Systems International, Inc. | | |
First Advantage Corp. * (a) | | |
Huron Consulting Group, Inc. * | | |
| | |
Kelly Services, Inc., Class A | | |
| | |
| | |
| | |
| | |
UL Solutions, Inc., Class A | | |
| | |
| | |
| | |
Real Estate Management & Development — 0.9% |
| | |
Cushman & Wakefield plc * | | |
eXp World Holdings, Inc. (a) | | |
| | |
Kennedy-Wilson Holdings, Inc. | | |
| | |
Newmark Group, Inc., Class A | | |
Opendoor Technologies, Inc. * | | |
| | |
| | |
|
Apartment Investment and Management Co., Class A * | | |
| | |
| | |
|
Residential REITs — continued |
| | |
NexPoint Residential Trust, Inc. | | |
| | |
| | |
|
| | |
| | |
CBL & Associates Properties, Inc. | | |
| | |
InvenTrust Properties Corp. | | |
| | |
Retail Opportunity Investments Corp. | | |
| | |
| | |
| | |
| | |
| | |
Semiconductors & Semiconductor Equipment — 2.2% |
| | |
| | |
Credo Technology Group Holding Ltd. * | | |
| | |
| | |
| | |
indie Semiconductor, Inc., Class A (China) * | | |
Kulicke & Soffa Industries, Inc. (Singapore) | | |
| | |
Navitas Semiconductor Corp. * (a) | | |
| | |
| | |
| | |
| | |
Ultra Clean Holdings, Inc. * | | |
Veeco Instruments, Inc. * | | |
| | |
|
| | |
| | |
| | |
| | |
Alarm.com Holdings, Inc. * | | |
Alkami Technology, Inc. * | | |
Amplitude, Inc., Class A * | | |
Appfolio, Inc., Class A * | | |
| | |
| | |
Aurora Innovation, Inc. * | | |
| | |
| | |
C3.ai, Inc., Class A * (a) | | |
Cipher Mining, Inc. * (a) | | |
| | |
SEE NOTES TO FINANCIAL STATEMENTS.
| J.P. Morgan Exchange-Traded Funds | |
JPMorgan BetaBuilders U.S. Small Cap Equity ETF
SCHEDULE OF PORTFOLIO INVESTMENTSAS OF October 31, 2024 (continued)
| | |
Common Stocks — continued |
|
Clear Secure, Inc., Class A | | |
Clearwater Analytics Holdings, Inc., Class A * | | |
CommVault Systems, Inc. * | | |
E2open Parent Holdings, Inc. * | | |
Freshworks, Inc., Class A * | | |
HashiCorp, Inc., Class A * | | |
| | |
| | |
| | |
| | |
| | |
LiveRamp Holdings, Inc. * | | |
MARA Holdings, Inc. * (a) | | |
| | |
| | |
| | |
| | |
| | |
| | |
| | |
| | |
| | |
| | |
RingCentral, Inc., Class A * | | |
Riot Platforms, Inc. * (a) | | |
| | |
SoundHound AI, Inc. * (a) | | |
Sprinklr, Inc., Class A * | | |
Sprout Social, Inc., Class A * | | |
| | |
| | |
| | |
Zeta Global Holdings Corp., Class A * | | |
| | |
| | |
|
Four Corners Property Trust, Inc. | | |
| | |
| | |
| | |
| | |
|
American Eagle Outfitters, Inc. | | |
| | |
Boot Barn Holdings, Inc. * | | |
| | |
| | |
Camping World Holdings, Inc., Class A | | |
| | |
| | |
| | |
| | |
| | |
| | |
|
Specialty Retail — continued |
National Vision Holdings, Inc. * | | |
| | |
| | |
Sally Beauty Holdings, Inc. * | | |
Sonic Automotive, Inc., Class A | | |
| | |
| | |
Victoria's Secret & Co. * | | |
Warby Parker, Inc., Class A * | | |
| | |
| | |
| | |
Technology Hardware, Storage & Peripherals — 0.3% |
| | |
| | |
| | |
| | |
Textiles, Apparel & Luxury Goods — 1.2% |
| | |
| | |
G-III Apparel Group Ltd. * | | |
| | |
| | |
Levi Strauss & Co., Class A | | |
| | |
| | |
Wolverine World Wide, Inc. | | |
| | |
|
| | |
Trading Companies & Distributors — 1.1% |
| | |
Custom Truck One Source, Inc. * | | |
Distribution Solutions Group, Inc. * | | |
| | |
| | |
| | |
H&E Equipment Services, Inc. | | |
| | |
| | |
| | |
|
| | |
| | |
| | |
Wireless Telecommunication Services — 0.3% |
| | |
SEE NOTES TO FINANCIAL STATEMENTS.
| J.P. Morgan Exchange-Traded Funds | |
| | |
Common Stocks — continued |
Wireless Telecommunication Services — continued |
Telephone and Data Systems, Inc. | | |
United States Cellular Corp. * | | |
| | |
Total Common Stocks
(Cost $471,367,692) | | |
| | |
|
|
| | |
Mirati Therapeutics, Inc., CVR ‡ * | | |
Total Rights
(Cost $29,066) | | |
| | |
Short-Term Investments — 4.6% |
Investment Companies — 0.8% |
JPMorgan U.S. Government Money Market Fund Class IM Shares, 4.80% (c) (d)
(Cost $4,153,660) | | |
Investment of Cash Collateral from Securities Loaned — 3.8% |
JPMorgan Securities Lending Money Market Fund Agency SL Class Shares, 4.85% (c) (d)
(Cost $19,349,471) | | |
Total Short-Term Investments
(Cost $23,503,131) | | |
Total Investments — 103.7%
(Cost $494,899,889) | | |
Liabilities in Excess of Other Assets — (3.7)% | | |
| | |
Percentages indicated are based on net assets. |
| |
| American Depositary Receipt |
| |
| Real Estate Investment Trust |
| Amount rounds to less than 0.1% of net assets. |
| Value determined using significant unobservable inputs. | |
| Non-income producing security. | |
| The security or a portion of this security is on loan at October 31, 2024. The total value of securities on loan at October 31, 2024 is $17,904,280. | |
| Security exempt from registration pursuant to Regulation S under the Securities Act of 1933, as amended. Regulation S applies to securities offerings that are made outside of the United States and do not involve direct selling efforts in the United States and as such may have restrictions on resale. | |
| Investment in an affiliated fund, which is registered under the Investment Company Act of 1940, as amended, and is advised by J.P. Morgan Investment Management Inc. | |
| The rate shown is the current yield as of October 31, 2024. | |
Futures contracts outstanding as of October 31, 2024:
| | | | | VALUE AND
UNREALIZED
APPRECIATION
(DEPRECIATION) ($) |
| | | | | |
Russell 2000 E-Mini Index | | | | | |
SEE NOTES TO FINANCIAL STATEMENTS.
| J.P. Morgan Exchange-Traded Funds | |
JPMorgan Carbon Transition U.S. Equity ETF
SCHEDULE OF PORTFOLIO INVESTMENTSAS OF October 31, 2024
| | |
|
Aerospace & Defense — 0.0% ^ |
| | |
Air Freight & Logistics — 0.1% |
CH Robinson Worldwide, Inc. | | |
Expeditors International of Washington, Inc. | | |
| | |
Automobile Components — 0.0% ^ |
| | |
|
| | |
|
| | |
| | |
NU Holdings Ltd., Class A (Brazil) * | | |
| | |
| | |
|
Brown-Forman Corp., Class B | | |
Constellation Brands, Inc., Class A | | |
| | |
Molson Coors Beverage Co., Class B | | |
| | |
| | |
|
| | |
Alnylam Pharmaceuticals, Inc. * | | |
| | |
| | |
| | |
Ionis Pharmaceuticals, Inc. * | | |
| | |
| | |
Regeneron Pharmaceuticals, Inc. * | | |
Vertex Pharmaceuticals, Inc. * | | |
| | |
|
| | |
| | |
| | |
| | |
|
| | |
| | |
|
Building Products — continued |
| | |
| | |
| | |
Lennox International, Inc. | | |
| | |
Simpson Manufacturing Co., Inc. | | |
| | |
| | |
|
Affiliated Managers Group, Inc. | | |
| | |
| | |
| | |
Cboe Global Markets, Inc. | | |
Charles Schwab Corp. (The) | | |
| | |
Goldman Sachs Group, Inc. (The) | | |
Interactive Brokers Group, Inc., Class A | | |
Intercontinental Exchange, Inc. | | |
Jefferies Financial Group, Inc. | | |
| | |
LPL Financial Holdings, Inc. | | |
MarketAxess Holdings, Inc. | | |
| | |
| | |
| | |
| | |
| | |
Robinhood Markets, Inc., Class A * | | |
| | |
| | |
Tradeweb Markets, Inc., Class A | | |
XP, Inc., Class A (Brazil) | | |
| | |
|
| | |
| | |
| | |
| | |
| | |
| | |
| | |
International Flavors & Fragrances, Inc. | | |
SEE NOTES TO FINANCIAL STATEMENTS.
| J.P. Morgan Exchange-Traded Funds | |
| | |
Common Stocks — continued |
|
| | |
Scotts Miracle-Gro Co. (The) | | |
Sherwin-Williams Co. (The) | | |
| | |
Commercial Services & Supplies — 1.2% |
| | |
| | |
| | |
| | |
| | |
| | |
| | |
| | |
| | |
| | |
| | |
Communications Equipment — 1.5% |
| | |
| | |
| | |
| | |
| | |
Construction & Engineering — 0.1% |
| | |
| | |
| | |
|
| | |
| | |
Capital One Financial Corp. | | |
Discover Financial Services | | |
| | |
| | |
| | |
Consumer Staples Distribution & Retail — 1.5% |
Albertsons Cos., Inc., Class A | | |
Casey's General Stores, Inc. | | |
| | |
| | |
Performance Food Group Co. * | | |
| | |
| | |
| | |
|
Consumer Staples Distribution & Retail — continued |
Walgreens Boots Alliance, Inc. | | |
| | |
| | |
Containers & Packaging — 0.1% |
| | |
|
| | |
| | |
| | |
Diversified REITs — 0.0% ^ |
| | |
Diversified Telecommunication Services — 0.4% |
| | |
Iridium Communications, Inc. | | |
Liberty Global Ltd., Class C (Belgium) * | | |
Verizon Communications, Inc. | | |
| | |
Electric Utilities — 1.1% |
| | |
| | |
| | |
| | |
| | |
| | |
| | |
| | |
Electrical Equipment — 0.7% |
| | |
| | |
| | |
| | |
| | |
| | |
Rockwell Automation, Inc. | | |
| | |
Electronic Equipment, Instruments & Components — 0.4% |
| | |
| | |
Keysight Technologies, Inc. * | | |
Teledyne Technologies, Inc. * | | |
| | |
SEE NOTES TO FINANCIAL STATEMENTS.
| J.P. Morgan Exchange-Traded Funds | |
JPMorgan Carbon Transition U.S. Equity ETF
SCHEDULE OF PORTFOLIO INVESTMENTSAS OF October 31, 2024 (continued)
| | |
Common Stocks — continued |
Electronic Equipment, Instruments & Components — continued |
| | |
Zebra Technologies Corp., Class A * | | |
| | |
Energy Equipment & Services — 0.7% |
| | |
| | |
Weatherford International plc | | |
| | |
|
| | |
Liberty Media Corp-Liberty Formula One, Class C * | | |
Live Nation Entertainment, Inc. * | | |
| | |
| | |
Take-Two Interactive Software, Inc. * | | |
| | |
| | |
Financial Services — 5.0% |
| | |
Apollo Global Management, Inc. | | |
Berkshire Hathaway, Inc., Class B * | | |
| | |
Fidelity National Information Services, Inc. | | |
| | |
| | |
Jack Henry & Associates, Inc. | | |
Mastercard, Inc., Class A | | |
| | |
| | |
| | |
| | |
| | |
| | |
|
Archer-Daniels-Midland Co. | | |
| | |
| | |
| | |
| | |
| | |
| | |
| | |
| | |
|
Food Products — continued |
| | |
| | |
| | |
| | |
Lamb Weston Holdings, Inc. | | |
McCormick & Co., Inc. (Non-Voting) | | |
| | |
Tyson Foods, Inc., Class A | | |
| | |
|
| | |
| | |
| | |
Ground Transportation — 0.6% |
| | |
| | |
Uber Technologies, Inc. * | | |
| | |
| | |
Health Care Equipment & Supplies — 2.6% |
| | |
Boston Scientific Corp. * | | |
| | |
Edwards Lifesciences Corp. * | | |
| | |
| | |
IDEXX Laboratories, Inc. * | | |
| | |
Intuitive Surgical, Inc. * | | |
| | |
| | |
| | |
| | |
Health Care Providers & Services — 2.5% |
| | |
| | |
| | |
| | |
| | |
| | |
| | |
| | |
SEE NOTES TO FINANCIAL STATEMENTS.
| J.P. Morgan Exchange-Traded Funds | |
| | |
Common Stocks — continued |
Health Care REITs — 0.0% ^ |
Medical Properties Trust, Inc. | | |
Omega Healthcare Investors, Inc. | | |
| | |
Health Care Technology — 0.1% |
| | |
Veeva Systems, Inc., Class A * | | |
| | |
Hotels, Restaurants & Leisure — 2.5% |
| | |
| | |
Chipotle Mexican Grill, Inc. * | | |
Choice Hotels International, Inc. | | |
| | |
Hilton Worldwide Holdings, Inc. | | |
Marriott International, Inc., Class A | | |
| | |
Planet Fitness, Inc., Class A * | | |
| | |
| | |
| | |
| | |
Household Durables — 0.5% |
| | |
| | |
| | |
| | |
| | |
Household Products — 0.3% |
Church & Dwight Co., Inc. | | |
| | |
| | |
| | |
Independent Power and Renewable Electricity Producers — 0.0% ^ |
Clearway Energy, Inc., Class C | | |
|
| | |
Rexford Industrial Realty, Inc. | | |
| | |
| | |
|
| | |
| | |
|
|
American International Group, Inc. | | |
| | |
Arch Capital Group Ltd. * | | |
| | |
Axis Capital Holdings Ltd. | | |
Brighthouse Financial, Inc. * | | |
| | |
| | |
Hartford Financial Services Group, Inc. (The) | | |
Marsh & McLennan Cos., Inc. | | |
| | |
| | |
| | |
Prudential Financial, Inc. | | |
Reinsurance Group of America, Inc. | | |
RenaissanceRe Holdings Ltd. (Bermuda) | | |
Travelers Cos., Inc. (The) | | |
| | |
| | |
Interactive Media & Services — 5.2% |
| | |
| | |
Meta Platforms, Inc., Class A | | |
Pinterest, Inc., Class A * | | |
ZoomInfo Technologies, Inc. * | | |
| | |
|
Accenture plc, Class A (Ireland) | | |
Cloudflare, Inc., Class A * | | |
| | |
| | |
| | |
International Business Machines Corp. | | |
| | |
| | |
| | |
| | |
|
| | |
| | |
| | |
SEE NOTES TO FINANCIAL STATEMENTS.
| J.P. Morgan Exchange-Traded Funds | |
JPMorgan Carbon Transition U.S. Equity ETF
SCHEDULE OF PORTFOLIO INVESTMENTSAS OF October 31, 2024 (continued)
| | |
Common Stocks — continued |
Life Sciences Tools & Services — 1.0% |
Agilent Technologies, Inc. | | |
| | |
| | |
Mettler-Toledo International, Inc. * | | |
| | |
Thermo Fisher Scientific, Inc. | | |
| | |
| | |
|
| | |
| | |
| | |
| | |
| | |
| | |
| | |
| | |
Illinois Tool Works, Inc. | | |
| | |
| | |
| | |
| | |
| | |
| | |
| | |
Westinghouse Air Brake Technologies Corp. | | |
| | |
| | |
|
| | |
| | |
Interpublic Group of Cos., Inc. (The) | | |
| | |
| | |
| | |
|
| | |
Southern Copper Corp. (Mexico) | | |
| | |
Mortgage Real Estate Investment Trusts (REITs) — 0.1% |
| | |
| | |
|
Mortgage Real Estate Investment Trusts (REITs) — continued |
Annaly Capital Management, Inc. | | |
Starwood Property Trust, Inc. | | |
| | |
|
| | |
Consolidated Edison, Inc. | | |
| | |
Public Service Enterprise Group, Inc. | | |
| | |
| | |
|
| | |
Oil, Gas & Consumable Fuels — 2.7% |
| | |
| | |
| | |
| | |
| | |
| | |
New Fortress Energy, Inc. | | |
| | |
| | |
Williams Cos., Inc. (The) | | |
| | |
Personal Care Products — 0.1% |
| | |
| | |
Estee Lauder Cos., Inc. (The), Class A | | |
| | |
|
| | |
| | |
| | |
| | |
| | |
Professional Services — 1.4% |
Automatic Data Processing, Inc. | | |
Booz Allen Hamilton Holding Corp. | | |
| | |
Dun & Bradstreet Holdings, Inc. | | |
| | |
| | |
SEE NOTES TO FINANCIAL STATEMENTS.
| J.P. Morgan Exchange-Traded Funds | |
| | |
Common Stocks — continued |
Professional Services — continued |
| | |
| | |
| | |
Paylocity Holding Corp. * | | |
| | |
| | |
| | |
| | |
Real Estate Management & Development — 0.4% |
CBRE Group, Inc., Class A * | | |
| | |
Jones Lang LaSalle, Inc. * | | |
Zillow Group, Inc., Class C * | | |
| | |
|
American Homes 4 Rent, Class A | | |
AvalonBay Communities, Inc. | | |
Equity LifeStyle Properties, Inc. | | |
Essex Property Trust, Inc. | | |
| | |
| | |
|
Brixmor Property Group, Inc. | | |
Federal Realty Investment Trust | | |
| | |
| | |
| | |
Simon Property Group, Inc. | | |
| | |
Semiconductors & Semiconductor Equipment — 11.0% |
Advanced Micro Devices, Inc. * | | |
| | |
| | |
| | |
| | |
| | |
| | |
| | |
| | |
Lattice Semiconductor Corp. * | | |
| | |
| | |
| | |
|
Semiconductors & Semiconductor Equipment — continued |
| | |
| | |
| | |
| | |
| | |
| | |
| | |
|
| | |
| | |
Atlassian Corp., Class A * | | |
| | |
Bentley Systems, Inc., Class B | | |
Cadence Design Systems, Inc. * | | |
Confluent, Inc., Class A * | | |
| | |
Dolby Laboratories, Inc., Class A | | |
DoubleVerify Holdings, Inc. * | | |
| | |
| | |
Guidewire Software, Inc. * | | |
| | |
| | |
| | |
| | |
Palantir Technologies, Inc., Class A * | | |
Palo Alto Networks, Inc. * | | |
| | |
| | |
| | |
| | |
| | |
| | |
Tyler Technologies, Inc. * | | |
| | |
| | |
| | |
| | |
|
| | |
| | |
| | |
Digital Realty Trust, Inc. | | |
SEE NOTES TO FINANCIAL STATEMENTS.
| J.P. Morgan Exchange-Traded Funds | |
JPMorgan Carbon Transition U.S. Equity ETF
SCHEDULE OF PORTFOLIO INVESTMENTSAS OF October 31, 2024 (continued)
| | |
Common Stocks — continued |
Specialized REITs — continued |
Extra Space Storage, Inc. | | |
| | |
| | |
| | |
| | |
|
| | |
| | |
| | |
Floor & Decor Holdings, Inc., Class A * | | |
GameStop Corp., Class A * | | |
| | |
Lithia Motors, Inc., Class A | | |
| | |
Penske Automotive Group, Inc. | | |
| | |
| | |
| | |
| | |
| | |
| | |
| | |
| | |
Technology Hardware, Storage & Peripherals — 6.8% |
| | |
Pure Storage, Inc., Class A * | | |
Super Micro Computer, Inc. * | | |
| | |
Textiles, Apparel & Luxury Goods — 0.8% |
| | |
| | |
| | |
| | |
Lululemon Athletica, Inc. * | | |
| | |
| | |
Skechers U.S.A., Inc., Class A * | | |
| | |
| | |
| | |
| | |
|
Trading Companies & Distributors — 0.6% |
| | |
Ferguson Enterprises, Inc. | | |
| | |
WESCO International, Inc. | | |
| | |
| | |
|
American Water Works Co., Inc. | | |
Essential Utilities, Inc. | | |
| | |
Total Common Stocks
(Cost $7,354,411) | | |
Short-Term Investments — 0.0% ^ |
Investment Companies — 0.0% ^ |
JPMorgan U.S. Government Money Market Fund Class IM Shares, 4.80% (a) (b)
(Cost $3,215) | | |
Total Investments — 99.9%
(Cost $7,357,626) | | |
Other Assets in Excess of Liabilities — 0.1% | | |
| | |
Percentages indicated are based on net assets. |
| |
| Real Estate Investment Trust |
| Amount rounds to less than 0.1% of net assets. |
| Non-income producing security. | |
| Investment in an affiliated fund, which is registered under the Investment Company Act of 1940, as amended, and is advised by J.P. Morgan Investment Management Inc. | |
| The rate shown is the current yield as of October 31, 2024. | |
SEE NOTES TO FINANCIAL STATEMENTS.
| J.P. Morgan Exchange-Traded Funds | |
JPMorgan Diversified Return Emerging Markets Equity ETF
SCHEDULE OF PORTFOLIO INVESTMENTSAS OF October 31, 2024
| | |
|
|
| | |
| | |
| | |
BB Seguridade Participacoes SA | | |
Bradespar SA (Preference) | | |
Caixa Seguridade Participacoes S/A | | |
Centrais Eletricas Brasileiras SA | | |
Cia de Saneamento Basico do Estado de Sao Paulo SABESP | | |
Cia Energetica de Minas Gerais (Preference) | | |
Cia Paranaense de Energia - Copel (Preference) | | |
| | |
| | |
CTEEP-Cia de Transmissao de Energia Eletrica Paulista (Preference) | | |
| | |
| | |
| | |
| | |
GPS Participacoes e Empreendimentos SA (a) | | |
Itau Unibanco Holding SA (Preference) | | |
| | |
| | |
Marfrig Global Foods SA * | | |
Metalurgica Gerdau SA (Preference) | | |
| | |
Petroleo Brasileiro SA (Preference) | | |
| | |
| | |
Santos Brasil Participacoes SA | | |
| | |
| | |
| | |
| | |
| | |
Transmissora Alianca de Energia Eletrica S/A | | |
Usinas Siderurgicas de Minas Gerais S (Preference) | | |
| | |
| | |
| | |
| | |
|
| | |
| | |
|
|
| | |
| | |
Cia Cervecerias Unidas SA | | |
Cia Sud Americana de Vapores SA | | |
| | |
Embotelladora Andina SA (Preference), Class B | | |
| | |
| | |
| | |
| | |
| | |
| | |
|
| | |
Agricultural Bank of China Ltd., Class A | | |
An Hui Wenergy Co. Ltd., Class A | | |
Anhui Conch Cement Co. Ltd., Class H | | |
Anhui Expressway Co. Ltd., Class A | | |
ANTA Sports Products Ltd. | | |
BAIC Motor Corp. Ltd., Class H (b) | | |
Bank of Beijing Co. Ltd., Class A | | |
Bank of Changsha Co. Ltd., Class A | | |
Bank of China Ltd., Class H | | |
Bank of Communications Co. Ltd., Class A | | |
Bank of Shanghai Co. Ltd., Class A | | |
Baoshan Iron & Steel Co. Ltd., Class A | | |
Beijing Enterprises Holdings Ltd. | | |
Bosideng International Holdings Ltd. | | |
Brilliance China Automotive Holdings Ltd. | | |
BYD Electronic International Co. Ltd. | | |
CGN Power Co. Ltd., Class H (b) | | |
Chengdu Kanghong Pharmaceutical Group Co. Ltd., Class A | | |
China CITIC Bank Corp. Ltd., Class H | | |
China Coal Energy Co. Ltd., Class H | | |
China Communications Services Corp. Ltd., Class H | | |
China Construction Bank Corp., Class H | | |
China Everbright Bank Co. Ltd., Class H | | |
| | |
China Hongqiao Group Ltd. | | |
China International Marine Containers Group Co. Ltd., Class A | | |
China Lesso Group Holdings Ltd. | | |
SEE NOTES TO FINANCIAL STATEMENTS.
| J.P. Morgan Exchange-Traded Funds | |
JPMorgan Diversified Return Emerging Markets Equity ETF
SCHEDULE OF PORTFOLIO INVESTMENTSAS OF October 31, 2024 (continued)
| | |
Common Stocks — continued |
|
China Medical System Holdings Ltd. | | |
China Merchants Energy Shipping Co. Ltd., Class A | | |
China Merchants Port Group Co. Ltd., Class A | | |
China Merchants Port Holdings Co. Ltd. | | |
China National Accord Medicines Corp. Ltd., Class A | | |
China National Chemical Engineering Co. Ltd., Class A | | |
China National Medicines Corp. Ltd., Class A | | |
China Petroleum & Chemical Corp., Class H | | |
China Resources Pharmaceutical Group Ltd. (b) | | |
China Resources Power Holdings Co. Ltd. | | |
China Resources Sanjiu Medical & Pharmaceutical Co. Ltd., Class A | | |
China Shenhua Energy Co. Ltd., Class H | | |
China South Publishing & Media Group Co. Ltd., Class A | | |
China United Network Communications Ltd., Class A | | |
China XD Electric Co. Ltd., Class A | | |
China Yangtze Power Co. Ltd., Class A | | |
Chinese Universe Publishing and Media Group Co. Ltd., Class A | | |
Chongqing Changan Automobile Co. Ltd., Class A | | |
Chongqing Rural Commercial Bank Co. Ltd., Class H | | |
| | |
COFCO Sugar Holding Co. Ltd., Class A | | |
COSCO SHIPPING Energy Transportation Co. Ltd., Class H | | |
COSCO SHIPPING Holdings Co. Ltd., Class H | | |
COSCO SHIPPING Ports Ltd. | | |
| | |
CSPC Pharmaceutical Group Ltd. | | |
Daqin Railway Co. Ltd., Class A | | |
Datang International Power Generation Co. Ltd., Class H | | |
Dong-E-E-Jiao Co. Ltd., Class A | | |
Dongfeng Motor Group Co. Ltd., Class H | | |
Dongguan Development Holdings Co. Ltd., Class A | | |
| | |
ENN Natural Gas Co. Ltd., Class A | | |
Foxconn Industrial Internet Co. Ltd., Class A | | |
| | |
|
|
Fujian Funeng Co. Ltd., Class A | | |
GD Power Development Co. Ltd., Class A | | |
Great Wall Motor Co. Ltd., Class H | | |
Gree Electric Appliances, Inc. of Zhuhai, Class A | | |
Guangdong Baolihua New Energy Stock Co. Ltd., Class A | | |
Guangdong South New Media Co. Ltd., Class A | | |
Guangxi Guiguan Electric Power Co. Ltd., Class A | | |
Guangxi Liugong Machinery Co. Ltd., Class A | | |
Guangzhou Baiyunshan Pharmaceutical Holdings Co. Ltd., Class H | | |
Haitian International Holdings Ltd. | | |
Heilongjiang Agriculture Co. Ltd., Class A | | |
Henan Shuanghui Investment & Development Co. Ltd., Class A | | |
Hengan International Group Co. Ltd. | | |
| | |
Huadian Power International Corp. Ltd., Class H | | |
Huaibei Mining Holdings Co. Ltd., Class A | | |
Huaihe Energy Group Co. Ltd., Class A | | |
Huapont Life Sciences Co. Ltd., Class A | | |
Huaxia Bank Co. Ltd., Class A | | |
Huaxin Cement Co. Ltd., Class H | | |
Huayu Automotive Systems Co. Ltd., Class A | | |
Hubei Jumpcan Pharmaceutical Co. Ltd., Class A | | |
Hunan Valin Steel Co. Ltd., Class A | | |
Industrial & Commercial Bank of China Ltd., Class H | | |
Inner Mongolia Dian Tou Energy Corp. Ltd., Class A | | |
Inner Mongolia ERDOS Resources Co. Ltd., Class A | | |
Inner Mongolia MengDian HuaNeng Thermal Power Corp. Ltd., Class A | | |
Inner Mongolia Yitai Coal Co. Ltd., Class B | | |
Jiangling Motors Corp. Ltd., Class A | | |
Jiangsu Expressway Co. Ltd., Class A | | |
Jiangsu Hengli Hydraulic Co. Ltd., Class A | | |
Jiangsu Phoenix Publishing & Media Corp. Ltd., Class A | | |
Jiangsu Yuyue Medical Equipment & Supply Co. Ltd., Class A | | |
Jiangsu Zhongtian Technology Co. Ltd., Class A | | |
SEE NOTES TO FINANCIAL STATEMENTS.
| J.P. Morgan Exchange-Traded Funds | |
| | |
Common Stocks — continued |
|
Joincare Pharmaceutical Group Industry Co. Ltd., Class A | | |
Jointown Pharmaceutical Group Co. Ltd., Class A | | |
| | |
KingClean Electric Co. Ltd., Class A * | | |
| | |
Kweichow Moutai Co. Ltd., Class A | | |
Lao Feng Xiang Co. Ltd., Class A | | |
| | |
Livzon Pharmaceutical Group, Inc., Class A | | |
Meihua Holdings Group Co. Ltd., Class A | | |
Nanjing Iron & Steel Co. Ltd., Class A | | |
Ningbo Sanxing Medical Electric Co. Ltd., Class A | | |
Offshore Oil Engineering Co. Ltd., Class A | | |
PetroChina Co. Ltd., Class A | | |
Qingdao Port International Co. Ltd., Class A | | |
Qinhuangdao Port Co. Ltd., Class A | | |
Shaanxi Coal Industry Co. Ltd., Class A | | |
Shandong Nanshan Aluminum Co. Ltd., Class A | | |
Shandong Publishing & Media Co. Ltd., Class A | | |
Shandong Weigao Group Medical Polymer Co. Ltd., Class H | | |
Shanghai Huayi Group Co. Ltd., Class A | | |
Shanghai International Port Group Co. Ltd., Class A | | |
Shanghai Mechanical and Electrical Industry Co. Ltd., Class A | | |
Shanghai Pharmaceuticals Holding Co. Ltd., Class H | | |
Shanghai Rural Commercial Bank Co. Ltd., Class A | | |
Shanghai Tunnel Engineering Co. Ltd., Class A | | |
Shanjin International Gold Co. Ltd., Class A | | |
Shanxi Coal International Energy Group Co. Ltd., Class A | | |
Shanxi Coking Coal Energy Group Co. Ltd., Class A | | |
Shanxi Lu'an Environmental Energy Development Co. Ltd., Class A | | |
Shenergy Co. Ltd., Class A | | |
Shenzhen Aisidi Co. Ltd., Class A | | |
Shenzhen Expressway Corp. Ltd. | | |
Shenzhen Mindray Bio-Medical Electronics Co. Ltd., Class A | | |
| | |
|
|
Shenzhen Salubris Pharmaceuticals Co. Ltd., Class A | | |
Shenzhen Transsion Holdings Co. Ltd., Class A | | |
Sichuan Biokin Pharmaceutical Co. Ltd., Class A * | | |
Sichuan Kelun Pharmaceutical Co. Ltd., Class A | | |
Sinoma International Engineering Co., Class A | | |
Sinopharm Group Co. Ltd., Class H | | |
| | |
| | |
TangShan Port Group Co. Ltd., Class A | | |
Tasly Pharmaceutical Group Co. Ltd., Class A | | |
Tian Di Science & Technology Co. Ltd., Class A | | |
Tianhe Chemicals Group Ltd. ‡ * | | |
Tianjin Port Co. Ltd., Class A | | |
Triangle Tyre Co. Ltd., Class A | | |
Uni-President China Holdings Ltd. | | |
Wanxiang Qianchao Co. Ltd., Class A | | |
Weichai Power Co. Ltd., Class A | | |
Wuliangye Yibin Co. Ltd., Class A | | |
Xiamen C & D, Inc., Class A | | |
Xinhua Winshare Publishing and Media Co. Ltd., Class A | | |
Yangzijiang Shipbuilding Holdings Ltd. | | |
Yankuang Energy Group Co. Ltd., Class H | | |
Yonfer Agricultural Technology Co. Ltd. | | |
Youngor Fashion Co. Ltd., Class A | | |
Yunnan Baiyao Group Co. Ltd., Class A | | |
Yunnan Yuntianhua Co. Ltd., Class A | | |
Yutong Bus Co. Ltd., Class A | | |
Zhejiang Conba Pharmaceutical Co. Ltd., Class A | | |
Zhejiang Expressway Co. Ltd., Class H | | |
Zhejiang Sanhua Intelligent Controls Co. Ltd., Class A | | |
Zhejiang Semir Garment Co. Ltd., Class A | | |
Zhejiang Weixing New Building Materials Co. Ltd., Class A | | |
Zhejiang Zheneng Electric Power Co. Ltd., Class A | | |
Zhengzhou Coal Mining Machinery Group Co. Ltd., Class A | | |
Zhongjin Gold Corp. Ltd., Class A | | |
SEE NOTES TO FINANCIAL STATEMENTS.
| J.P. Morgan Exchange-Traded Funds | |
JPMorgan Diversified Return Emerging Markets Equity ETF
SCHEDULE OF PORTFOLIO INVESTMENTSAS OF October 31, 2024 (continued)
| | |
Common Stocks — continued |
|
Zhongsheng Group Holdings Ltd. | | |
Zoomlion Heavy Industry Science and Technology Co. Ltd., Class H | | |
| | |
|
Bancolombia SA (Preference) | | |
|
| | |
Moneta Money Bank A/S (b) | | |
| | |
|
Commercial International Bank - Egypt (CIB) | | |
|
Eurobank Ergasias Services and Holdings SA | | |
Hellenic Telecommunications Organization SA | | |
HELLENiQ ENERGY Holdings S.A. | | |
| | |
Metlen Energy & Metals SA | | |
Motor Oil Hellas Corinth Refineries SA | | |
National Bank of Greece SA | | |
| | |
Piraeus Financial Holdings SA | | |
| | |
| | |
|
Magyar Telekom Telecommunications plc | | |
MOL Hungarian Oil & Gas plc | | |
| | |
| | |
|
| | |
| | |
| | |
Bajaj Holdings & Investment Ltd. | | |
| | |
Bharat Petroleum Corp. Ltd. | | |
| | |
| | |
| | |
| | |
Colgate-Palmolive India Ltd. | | |
| | |
| | |
|
|
| | |
Dr Reddy's Laboratories Ltd. | | |
| | |
Glenmark Pharmaceuticals Ltd. | | |
| | |
| | |
Hindustan Petroleum Corp. Ltd. | | |
| | |
| | |
ICICI Lombard General Insurance Co. Ltd. (b) | | |
| | |
| | |
| | |
| | |
Jindal Steel & Power Ltd. | | |
| | |
| | |
| | |
| | |
| | |
| | |
Oil & Natural Gas Corp. Ltd. | | |
| | |
| | |
| | |
Power Grid Corp. of India Ltd. | | |
| | |
| | |
Steel Authority of India Ltd. | | |
Sun Pharmaceutical Industries Ltd. | | |
Tata Consultancy Services Ltd. | | |
| | |
Tata Power Co. Ltd. (The) | | |
| | |
| | |
| | |
| | |
| | |
| | |
| | |
| | |
| | |
|
Adaro Energy Indonesia Tbk. PT | | |
SEE NOTES TO FINANCIAL STATEMENTS.
| J.P. Morgan Exchange-Traded Funds | |
| | |
Common Stocks — continued |
|
Astra International Tbk. PT | | |
Bank Central Asia Tbk. PT | | |
Bank Mandiri Persero Tbk. PT | | |
| | |
| | |
Indofood CBP Sukses Makmur Tbk. PT | | |
Indofood Sukses Makmur Tbk. PT | | |
| | |
Perusahaan Gas Negara Tbk. PT | | |
Sarana Menara Nusantara Tbk. PT | | |
Sumber Alfaria Trijaya Tbk. PT | | |
Telkom Indonesia Persero Tbk. PT | | |
Unilever Indonesia Tbk. PT | | |
| | |
| | |
| | |
| | |
|
| | |
Agility Public Warehousing Co. KSC | | |
Mobile Telecommunications Co. KSCP | | |
National Bank of Kuwait SAKP | | |
| | |
|
| | |
| | |
| | |
| | |
| | |
Hong Leong Financial Group Bhd. | | |
| | |
| | |
| | |
| | |
Petronas Chemicals Group Bhd. | | |
| | |
| | |
| | |
| | |
| | |
| | |
| | |
|
|
| | |
YTL Power International Bhd. | | |
| | |
|
| | |
| | |
| | |
Arca Continental SAB de CV | | |
| | |
| | |
Coca-Cola Femsa SAB de CV | | |
El Puerto de Liverpool SAB de CV, Class C1 | | |
Fibra Uno Administracion SA de CV, REIT | | |
Fomento Economico Mexicano SAB de CV | | |
| | |
Grupo Aeroportuario del Centro Norte SAB de CV | | |
Grupo Aeroportuario del Sureste SAB de CV, Class B | | |
| | |
| | |
Grupo Financiero Banorte SAB de CV, Class O | | |
| | |
Kimberly-Clark de Mexico SAB de CV, Class A | | |
Megacable Holdings SAB de CV | | |
Orbia Advance Corp. SAB de CV | | |
Prologis Property Mexico SA de CV, REIT | | |
Promotora y Operadora de Infraestructura SAB de CV | | |
Qualitas Controladora SAB de CV | | |
Wal-Mart de Mexico SAB de CV | | |
| | |
|
| | |
| | |
| | |
Puregold Price Club, Inc. | | |
| | |
|
| | |
Mesaieed Petrochemical Holding Co. | | |
| | |
Qatar Electricity & Water Co. QSC | | |
SEE NOTES TO FINANCIAL STATEMENTS.
| J.P. Morgan Exchange-Traded Funds | |
JPMorgan Diversified Return Emerging Markets Equity ETF
SCHEDULE OF PORTFOLIO INVESTMENTSAS OF October 31, 2024 (continued)
| | |
Common Stocks — continued |
|
| | |
Qatar Gas Transport Co. Ltd. | | |
Qatar International Islamic Bank QSC | | |
| | |
| | |
|
| | |
|
| | |
Federal Grid Co. - Rosseti PJSC ‡ * | | |
GMK Norilskiy Nickel PAO ‡ | | |
| | |
| | |
| | |
| | |
Magnitogorsk Iron & Steel Works PJSC ‡ | | |
Mobile TeleSystems PJSC ‡ | | |
| | |
| | |
| | |
| | |
Sberbank of Russia PJSC ‡ | | |
| | |
| | |
Surgutneftegas PJSC (Preference) ‡ | | |
| | |
| | |
| | |
|
Abdullah Al Othaim Markets Co. | | |
| | |
| | |
Catrion Catering Holding Co. | | |
Dr Sulaiman Al Habib Medical Services Group Co. | | |
| | |
| | |
Jamjoom Pharmaceuticals Factory Co. | | |
| | |
Mouwasat Medical Services Co. | | |
| | |
| | |
Sahara International Petrochemical Co. | | |
| | |
|
|
SAL Saudi Logistics Services | | |
Saudi Arabian Mining Co. * | | |
Saudi Arabian Oil Co. (b) | | |
Saudi Aramco Base Oil Co. | | |
| | |
Saudi Investment Bank (The) | | |
| | |
| | |
|
African Rainbow Minerals Ltd. | | |
Aspen Pharmacare Holdings Ltd. | | |
| | |
| | |
| | |
| | |
Foschini Group Ltd. (The) | | |
Harmony Gold Mining Co. Ltd. | | |
Impala Platinum Holdings Ltd. * | | |
| | |
| | |
| | |
| | |
| | |
| | |
| | |
| | |
Sibanye Stillwater Ltd. * | | |
| | |
| | |
| | |
| | |
|
| | |
| | |
Catcher Technology Co. Ltd. | | |
Cheng Shin Rubber Industry Co. Ltd. | | |
Chicony Electronics Co. Ltd. | | |
| | |
| | |
Chunghwa Telecom Co. Ltd. | | |
CTBC Financial Holding Co. Ltd. | | |
E.Sun Financial Holding Co. Ltd. | | |
| | |
SEE NOTES TO FINANCIAL STATEMENTS.
| J.P. Morgan Exchange-Traded Funds | |
| | |
Common Stocks — continued |
|
| | |
Evergreen Marine Corp. Taiwan Ltd. | | |
Far EasTone Telecommunications Co. Ltd. | | |
Feng TAY Enterprise Co. Ltd. | | |
First Financial Holding Co. Ltd. | | |
| | |
Fubon Financial Holding Co. Ltd. | | |
Giant Manufacturing Co. Ltd. | | |
| | |
Mega Financial Holding Co. Ltd. | | |
Nien Made Enterprise Co. Ltd. | | |
Novatek Microelectronics Corp. | | |
| | |
Powertech Technology, Inc. | | |
President Chain Store Corp. | | |
SinoPac Financial Holdings Co. Ltd. | | |
Taiwan Cooperative Financial Holding Co. Ltd. | | |
Taiwan Fertilizer Co. Ltd. | | |
| | |
Taiwan Semiconductor Manufacturing Co. Ltd. | | |
Uni-President Enterprises Corp. | | |
Yuanta Financial Holding Co. Ltd. | | |
| | |
|
Advanced Info Service PCL | | |
| | |
| | |
| | |
Digital Telecommunications Infrastructure Fund, Class F | | |
Electricity Generating PCL | | |
Intouch Holdings PCL, NVDR | | |
| | |
Minor International PCL, NVDR | | |
| | |
PTT Exploration & Production PCL | | |
| | |
| | |
| | |
Thai Union Group PCL, Class F | | |
TMBThanachart Bank PCL, NVDR | | |
| | |
|
AG Anadolu Grubu Holding A/S | | |
| | |
|
|
Ahlatci Dogal Gaz Dagitim Enerji ve Yatirim A/S | | |
| | |
| | |
| | |
| | |
Alfa Solar Enerji Sanayi ve Ticaret A/S | | |
Anadolu Efes Biracilik ve Malt Sanayii A/S | | |
Aselsan Elektronik Sanayi ve Ticaret A/S | | |
Astor Transformator Enerji Turizm Insaat ve Petrol Sanayi Ticaret A/S | | |
| | |
BIM Birlesik Magazalar A/S | | |
Borusan Birlesik Boru Fabrikalari Sanayi ve Ticaret A/S * | | |
| | |
Cimsa Cimento Sanayi ve Ticaret A/S | | |
| | |
Dogan Sirketler Grubu Holding A/S | | |
Dogus Otomotiv Servis ve Ticaret A/S | | |
EGE Endustri ve Ticaret A/S | | |
EIS Eczacibasi Ilac ve Sinai ve Finansal Yatirimlar Sanayi ve Ticaret A/S | | |
| | |
Enka Insaat ve Sanayi A/S | | |
| | |
Haci Omer Sabanci Holding A/S | | |
Is Gayrimenkul Yatirim Ortakligi A/S, REIT * | | |
Is Yatirim Menkul Degerler A/S | | |
| | |
Konya Cimento Sanayii A/S * | | |
Mavi Giyim Sanayi ve Ticaret A/S, Class B (b) | | |
| | |
| | |
MLP Saglik Hizmetleri A/S * (b) | | |
| | |
ODAS Elektrik Uretim ve Sanayi Ticaret A/S * | | |
Oyak Cimento Fabrikalari A/S * | | |
Pegasus Hava Tasimaciligi A/S * | | |
Sok Marketler Ticaret A/S | | |
TAV Havalimanlari Holding A/S * | | |
| | |
Torunlar Gayrimenkul Yatirim Ortakligi A/S, REIT | | |
| | |
Turk Telekomunikasyon A/S * | | |
SEE NOTES TO FINANCIAL STATEMENTS.
| J.P. Morgan Exchange-Traded Funds | |
JPMorgan Diversified Return Emerging Markets Equity ETF
SCHEDULE OF PORTFOLIO INVESTMENTSAS OF October 31, 2024 (continued)
| | |
Common Stocks — continued |
|
Turk Traktor ve Ziraat Makineleri A/S | | |
Turkcell Iletisim Hizmetleri A/S | | |
Turkiye Is Bankasi A/S, Class C | | |
Turkiye Petrol Rafinerileri A/S | | |
Ulker Biskuvi Sanayi A/S * | | |
Yapi ve Kredi Bankasi A/S | | |
Zorlu Enerji Elektrik Uretim A/S * | | |
| | |
United Arab Emirates — 2.8% |
Abu Dhabi Commercial Bank PJSC | | |
Abu Dhabi Islamic Bank PJSC | | |
Abu Dhabi National Oil Co. for Distribution PJSC | | |
Abu Dhabi Ports Co. PJSC * | | |
ADNOC Logistics & Services | | |
| | |
| | |
Dubai Electricity & Water Authority PJSC | | |
| | |
| | |
| | |
| | |
Emirates Telecommunications Group Co. PJSC | | |
| | |
| | |
| | |
|
| | |
|
| | |
| | |
| | |
Total Common Stocks
(Cost $290,853,816) | | |
Short-Term Investments — 0.4% |
Investment Companies — 0.4% |
JPMorgan U.S. Government Money Market Fund Class IM Shares, 4.80% (c) (d)
(Cost $1,185,453) | | |
| | |
Total Investments — 100.3%
(Cost $292,039,269) | | |
Liabilities in Excess of Other Assets — (0.3)% | | |
| | |
Percentages indicated are based on net assets. |
| |
| American Depositary Receipt |
| |
| Non-Voting Depositary Receipt |
| Public Joint Stock Company |
| A special type of equity investment that shares in the earnings of the company, has limited voting rights, and may have a dividend preference. Preference shares may also have liquidation preference. |
| Limited liability company |
| Real Estate Investment Trust |
| Amount rounds to less than 0.1% of net assets. |
| Value determined using significant unobservable inputs. | |
| Non-income producing security. | |
| Securities exempt from registration under Rule 144A or section 4(a)(2), of the Securities Act of 1933, as amended. | |
| Security exempt from registration pursuant to Regulation S under the Securities Act of 1933, as amended. Regulation S applies to securities offerings that are made outside of the United States and do not involve direct selling efforts in the United States and as such may have restrictions on resale. | |
| Investment in an affiliated fund, which is registered under the Investment Company Act of 1940, as amended, and is advised by J.P. Morgan Investment Management Inc. | |
| The rate shown is the current yield as of October 31, 2024. | |
SEE NOTES TO FINANCIAL STATEMENTS.
| J.P. Morgan Exchange-Traded Funds | |
Summary of Investments by Industry, October 31, 2024
The following table represents the portfolio investments of the Fund by industry classifications as a percentage of total investments:
| PERCENT OF
TOTAL
INVESTMENTS |
| |
Oil, Gas & Consumable Fuels | |
| |
Wireless Telecommunication Services | |
| |
| |
| |
Independent Power and Renewable Electricity Producers | |
Diversified Telecommunication Services | |
| |
Transportation Infrastructure | |
Consumer Staples Distribution & Retail | |
| |
| |
| |
Semiconductors & Semiconductor Equipment | |
| |
| |
| |
Textiles, Apparel & Luxury Goods | |
| |
Real Estate Management & Development | |
| |
| |
| |
| |
Construction & Engineering | |
| |
| |
| |
Others (each less than 1.0%) | |
| |
SEE NOTES TO FINANCIAL STATEMENTS.
| J.P. Morgan Exchange-Traded Funds | |
JPMorgan Diversified Return Emerging Markets Equity ETF
SCHEDULE OF PORTFOLIO INVESTMENTSAS OF October 31, 2024 (continued)
Futures contracts outstanding as of October 31, 2024:
| | | | | VALUE AND
UNREALIZED
APPRECIATION
(DEPRECIATION) ($) |
| | | | | |
MSCI Emerging Markets E-Mini Index | | | | | |
| |
| Morgan Stanley Capital International |
| |
SEE NOTES TO FINANCIAL STATEMENTS.
| J.P. Morgan Exchange-Traded Funds | |
JPMorgan Diversified Return International Equity ETF
SCHEDULE OF PORTFOLIO INVESTMENTSAS OF October 31, 2024
| | |
|
|
| | |
| | |
| | |
| | |
| | |
| | |
| | |
| | |
| | |
| | |
| | |
| | |
| | |
| | |
| | |
| | |
| | |
| | |
| | |
Harvey Norman Holdings Ltd. (a) | | |
| | |
| | |
| | |
| | |
| | |
| | |
Northern Star Resources Ltd. | | |
| | |
| | |
Pilbara Minerals Ltd. * (a) | | |
| | |
| | |
| | |
| | |
| | |
| | |
Seven Group Holdings Ltd. | | |
| | |
| | |
| | |
| | |
| | |
Treasury Wine Estates Ltd. | | |
| | |
| | |
|
|
| | |
| | |
| | |
Woodside Energy Group Ltd. | | |
| | |
| | |
| | |
|
| | |
| | |
| | |
|
| | |
| | |
| | |
|
| | |
|
| | |
|
| | |
|
| | |
|
AAC Technologies Holdings, Inc. | | |
Budweiser Brewing Co. APAC Ltd. (b) | | |
Chow Tai Fook Jewellery Group Ltd. | | |
| | |
SITC International Holdings Co. Ltd. | | |
Wilmar International Ltd. | | |
Xinyi Glass Holdings Ltd. | | |
| | |
|
| | |
Novo Nordisk A/S, Class B | | |
| | |
|
| | |
| | |
| | |
SEE NOTES TO FINANCIAL STATEMENTS.
| J.P. Morgan Exchange-Traded Funds | |
JPMorgan Diversified Return International Equity ETF
SCHEDULE OF PORTFOLIO INVESTMENTSAS OF October 31, 2024 (continued)
| | |
Common Stocks — continued |
|
| | |
| | |
| | |
|
| | |
| | |
| | |
| | |
Cie Generale des Etablissements Michelin SCA | | |
| | |
| | |
| | |
| | |
| | |
| | |
| | |
| | |
| | |
| | |
| | |
Unibail-Rodamco-Westfield, REIT | | |
| | |
| | |
| | |
|
Bayerische Motoren Werke AG | | |
| | |
| | |
| | |
Deutsche Telekom AG (Registered) | | |
| | |
| | |
Fresenius Medical Care AG | | |
| | |
| | |
| | |
| | |
| | |
|
| | |
CK Infrastructure Holdings Ltd. | | |
| | |
Henderson Land Development Co. Ltd. | | |
| | |
|
|
Hong Kong & China Gas Co. Ltd. | | |
Hutchison Port Holdings Trust | | |
Orient Overseas International Ltd. | | |
| | |
Power Assets Holdings Ltd. | | |
Sun Hung Kai Properties Ltd. | | |
Swire Pacific Ltd., Class A | | |
United Energy Group Ltd. (a) | | |
| | |
Yue Yuen Industrial Holdings Ltd. | | |
| | |
|
| | |
|
| | |
| | |
| | |
| | |
| | |
| | |
| | |
Infrastrutture Wireless Italiane SpA (b) | | |
| | |
| | |
Recordati Industria Chimica e Farmaceutica SpA | | |
Terna - Rete Elettrica Nazionale | | |
| | |
| | |
|
Activia Properties, Inc., REIT | | |
Advance Residence Investment Corp., REIT | | |
| | |
AEON REIT Investment Corp., REIT | | |
| | |
Asahi Group Holdings Ltd. | | |
| | |
| | |
Canon Marketing Japan, Inc. | | |
| | |
| | |
Chubu Electric Power Co., Inc. | | |
Chugai Pharmaceutical Co. Ltd. | | |
| | |
SEE NOTES TO FINANCIAL STATEMENTS.
| J.P. Morgan Exchange-Traded Funds | |
| | |
Common Stocks — continued |
|
Cosmo Energy Holdings Co. Ltd. | | |
| | |
Daito Trust Construction Co. Ltd. | | |
Daiwa Securities Group, Inc. | | |
| | |
| | |
Electric Power Development Co. Ltd. | | |
| | |
Fuji Media Holdings, Inc. | | |
| | |
Hachijuni Bank Ltd. (The) | | |
| | |
| | |
| | |
| | |
| | |
Invincible Investment Corp., REIT | | |
| | |
| | |
Japan Metropolitan Fund Invest, REIT | | |
Japan Post Holdings Co. Ltd. | | |
Japan Post Insurance Co. Ltd. | | |
Japan Real Estate Investment Corp., REIT | | |
| | |
| | |
| | |
Kansai Electric Power Co., Inc. (The) | | |
| | |
Kawasaki Kisen Kaisha Ltd. (a) | | |
| | |
| | |
| | |
| | |
| | |
| | |
| | |
Kyushu Electric Power Co., Inc. | | |
| | |
| | |
| | |
Mebuki Financial Group, Inc. | | |
| | |
| | |
Mitsubishi Chemical Group Corp. | | |
| | |
|
|
| | |
Mitsubishi Gas Chemical Co., Inc. | | |
Mitsubishi HC Capital, Inc. | | |
Mitsubishi UFJ Financial Group, Inc. | | |
| | |
| | |
Mitsui Mining & Smelting Co. Ltd. | | |
Morinaga Milk Industry Co. Ltd. | | |
MS&AD Insurance Group Holdings, Inc. | | |
| | |
| | |
| | |
| | |
| | |
Nippon Telegraph & Telephone Corp. | | |
| | |
Nisshin Seifun Group, Inc. | | |
Nissin Foods Holdings Co. Ltd. | | |
| | |
| | |
| | |
Nomura Real Estate Holdings, Inc. | | |
Nomura Real Estate Master Fund, Inc., REIT | | |
| | |
Ono Pharmaceutical Co. Ltd. | | |
Open House Group Co. Ltd. | | |
| | |
| | |
| | |
Rohto Pharmaceutical Co. Ltd. | | |
| | |
Santen Pharmaceutical Co. Ltd. | | |
| | |
Sapporo Holdings Ltd. (a) | | |
Sawai Group Holdings Co. Ltd. | | |
| | |
| | |
| | |
Sekisui Chemical Co. Ltd. | | |
| | |
Sekisui House REIT, Inc., REIT | | |
| | |
| | |
Ship Healthcare Holdings, Inc. | | |
SEE NOTES TO FINANCIAL STATEMENTS.
| J.P. Morgan Exchange-Traded Funds | |
JPMorgan Diversified Return International Equity ETF
SCHEDULE OF PORTFOLIO INVESTMENTSAS OF October 31, 2024 (continued)
| | |
Common Stocks — continued |
|
Skylark Holdings Co. Ltd. (a) | | |
| | |
| | |
| | |
| | |
| | |
Sumitomo Mitsui Financial Group, Inc. | | |
Suntory Beverage & Food Ltd. (a) | | |
| | |
Takeda Pharmaceutical Co. Ltd. | | |
| | |
| | |
Tohoku Electric Power Co., Inc. | | |
| | |
| | |
| | |
Tokyu Fudosan Holdings Corp. | | |
| | |
| | |
| | |
| | |
| | |
| | |
| | |
United Urban Investment Corp., REIT | | |
| | |
| | |
Yamaguchi Financial Group, Inc. | | |
| | |
| | |
Yokohama Rubber Co. Ltd. (The) | | |
| | |
|
Hikma Pharmaceuticals plc | | |
|
| | |
|
| | |
|
| | |
|
ABN AMRO Bank NV, CVA (b) | | |
| | |
| | |
|
|
| | |
BE Semiconductor Industries NV | | |
| | |
Koninklijke Ahold Delhaize NV | | |
| | |
| | |
| | |
| | |
| | |
|
Fisher & Paykel Healthcare Corp. Ltd. | | |
| | |
| | |
|
| | |
| | |
| | |
| | |
| | |
| | |
| | |
| | |
| | |
|
| | |
|
| | |
| | |
| | |
|
| | |
|
CapitaLand Ascendas, REIT | | |
CapitaLand Integrated Commercial Trust, REIT | | |
| | |
| | |
| | |
Jardine Cycle & Carriage Ltd. | | |
| | |
Mapletree Pan Asia Commercial Trust, REIT | | |
Oversea-Chinese Banking Corp. Ltd. | | |
| | |
SEE NOTES TO FINANCIAL STATEMENTS.
| J.P. Morgan Exchange-Traded Funds | |
| | |
Common Stocks — continued |
|
| | |
Singapore Telecommunications Ltd. | | |
| | |
| | |
| | |
| | |
|
| | |
|
| | |
| | |
| | |
| | |
| | |
| | |
| | |
| | |
| | |
Hana Financial Group, Inc. | | |
Hankook Tire & Technology Co. Ltd. | | |
| | |
Hanwha Aerospace Co. Ltd. | | |
| | |
Hanwha Industrial Solutions Co. Ltd. * | | |
| | |
HD Hyundai Electric Co. Ltd. | | |
HD Hyundai Infracore Co. Ltd. | | |
HD Korea Shipbuilding & Offshore Engineering Co. Ltd. * | | |
| | |
| | |
| | |
| | |
Korea Electric Power Corp. * | | |
| | |
Korea Investment Holdings Co. Ltd. | | |
Korean Air Lines Co. Ltd. | | |
| | |
| | |
| | |
| | |
| | |
| | |
NH Investment & Securities Co. Ltd. | | |
| | |
|
|
| | |
| | |
| | |
Posco International Corp. | | |
| | |
Samsung Electronics Co. Ltd. | | |
Samsung Fire & Marine Insurance Co. Ltd. | | |
| | |
Samsung Securities Co. Ltd. | | |
| | |
| | |
| | |
Woori Financial Group, Inc. | | |
| | |
| | |
|
| | |
| | |
| | |
| | |
Industria de Diseno Textil SA | | |
Merlin Properties Socimi SA, REIT | | |
| | |
| | |
| | |
| | |
| | |
|
| | |
| | |
Fastighets AB Balder, Class B * (a) | | |
| | |
H & M Hennes & Mauritz AB, Class B (a) | | |
| | |
| | |
Securitas AB, Class B (a) | | |
| | |
| | |
| | |
Telefonaktiebolaget LM Ericsson, Class B | | |
| | |
| | |
| | |
SEE NOTES TO FINANCIAL STATEMENTS.
| J.P. Morgan Exchange-Traded Funds | |
JPMorgan Diversified Return International Equity ETF
SCHEDULE OF PORTFOLIO INVESTMENTSAS OF October 31, 2024 (continued)
| | |
Common Stocks — continued |
|
| | |
Kuehne + Nagel International AG (Registered) | | |
Logitech International SA (Registered) | | |
| | |
PSP Swiss Property AG (Registered) | | |
| | |
Sonova Holding AG (Registered) | | |
Swiss Prime Site AG (Registered) | | |
| | |
| | |
|
| | |
|
| | |
| | |
Associated British Foods plc | | |
| | |
Auto Trader Group plc (b) | | |
| | |
B&M European Value Retail SA | | |
| | |
| | |
| | |
Berkeley Group Holdings plc | | |
British American Tobacco plc | | |
British Land Co. plc (The), REIT | | |
| | |
| | |
| | |
| | |
CK Hutchison Holdings Ltd. | | |
| | |
| | |
| | |
| | |
| | |
| | |
| | |
| | |
| | |
InterContinental Hotels Group plc | | |
Intermediate Capital Group plc | | |
International Consolidated Airlines Group SA | | |
| | |
| | |
|
United Kingdom — continued |
| | |
| | |
Land Securities Group plc, REIT | | |
Legal & General Group plc | | |
| | |
Marks & Spencer Group plc | | |
| | |
| | |
| | |
| | |
| | |
| | |
| | |
Rolls-Royce Holdings plc * | | |
| | |
| | |
| | |
| | |
| | |
| | |
| | |
| | |
UNITE Group plc (The), REIT | | |
United Utilities Group plc | | |
| | |
| | |
| | |
| | |
| | |
|
| | |
| | |
| | |
| | |
| | |
| | |
| | |
| | |
| | |
| | |
| | |
| | |
SEE NOTES TO FINANCIAL STATEMENTS.
| J.P. Morgan Exchange-Traded Funds | |
| | |
Common Stocks — continued |
United States — continued |
| | |
| | |
| | |
Total Common Stocks
(Cost $326,597,740) | | |
Short-Term Investments — 1.3% |
Investment Companies — 0.1% |
JPMorgan Prime Money Market Fund Class IM Shares, 4.90% (c) (d)
(Cost $476,611) | | |
Investment of Cash Collateral from Securities Loaned — 1.2% |
JPMorgan Securities Lending Money Market Fund Agency SL Class Shares, 4.85% (c) (d)(Cost $3,907,539) | | |
Total Short-Term Investments
(Cost $4,384,150) | | |
Total Investments — 100.6%
(Cost $330,981,890) | | |
Liabilities in Excess of Other Assets — (0.6)% | | |
| | |
Percentages indicated are based on net assets. |
| |
| |
| Certificaten Van Aandelen (Dutch Certificate) |
| |
| Real Estate Investment Trust |
| Limited partnership with share capital |
| |
| Amount rounds to less than 0.1% of net assets. |
| Value determined using significant unobservable inputs. | |
| Non-income producing security. | |
| The security or a portion of this security is on loan at October 31, 2024. The total value of securities on loan at October 31, 2024 is $3,667,019. | |
| Security exempt from registration pursuant to Regulation S under the Securities Act of 1933, as amended. Regulation S applies to securities offerings that are made outside of the United States and do not involve direct selling efforts in the United States and as such may have restrictions on resale. | |
| Investment in an affiliated fund, which is registered under the Investment Company Act of 1940, as amended, and is advised by J.P. Morgan Investment Management Inc. | |
| The rate shown is the current yield as of October 31, 2024. | |
SEE NOTES TO FINANCIAL STATEMENTS.
| J.P. Morgan Exchange-Traded Funds | |
JPMorgan Diversified Return International Equity ETF
SCHEDULE OF PORTFOLIO INVESTMENTSAS OF October 31, 2024 (continued)
Summary of Investments by Industry, October 31, 2024
The following table represents the portfolio investments of the Fund by industry classifications as a percentage of total investments:
| PERCENT OF
TOTAL
INVESTMENTS |
| |
| |
| |
Oil, Gas & Consumable Fuels | |
| |
Diversified Telecommunication Services | |
| |
Consumer Staples Distribution & Retail | |
Real Estate Management & Development | |
| |
Trading Companies & Distributors | |
| |
| |
Technology Hardware, Storage & Peripherals | |
| |
| |
| |
| |
Wireless Telecommunication Services | |
Health Care Equipment & Supplies | |
| |
Semiconductors & Semiconductor Equipment | |
| |
| |
| |
| |
| |
| |
| |
| |
| |
| |
| |
| |
Health Care Providers & Services | |
| |
Interactive Media & Services | |
Construction & Engineering | |
| |
Hotels, Restaurants & Leisure | |
| |
Others (each less than 1.0%) | |
| |
SEE NOTES TO FINANCIAL STATEMENTS.
| J.P. Morgan Exchange-Traded Funds | |
Futures contracts outstanding as of October 31, 2024:
| | | | | VALUE AND
UNREALIZED
APPRECIATION
(DEPRECIATION) ($) |
| | | | | |
| | | | | |
| |
| Europe, Australasia and Far East |
| Morgan Stanley Capital International |
| |
SEE NOTES TO FINANCIAL STATEMENTS.
| J.P. Morgan Exchange-Traded Funds | |
JPMorgan Diversified Return U.S. Equity ETF
SCHEDULE OF PORTFOLIO INVESTMENTSAS OF October 31, 2024
| | |
|
Aerospace & Defense — 0.7% |
| | |
| | |
| | |
Automobiles & Parts — 0.6% |
| | |
| | |
| | |
| | |
|
| | |
Citizens Financial Group, Inc. | | |
Discover Financial Services | | |
| | |
First Citizens BancShares, Inc., Class A | | |
Huntington Bancshares, Inc. | | |
| | |
Popular, Inc. (Puerto Rico) | | |
| | |
| | |
| | |
|
Boston Beer Co., Inc. (The), Class A * | | |
| | |
Coca-Cola Consolidated, Inc. | | |
Constellation Brands, Inc., Class A | | |
| | |
Molson Coors Beverage Co., Class B | | |
| | |
| | |
| | |
|
| | |
| | |
CF Industries Holdings, Inc. | | |
| | |
| | |
| | |
| | |
International Flavors & Fragrances, Inc. | | |
| | |
LyondellBasell Industries NV, Class A | | |
| | |
| | |
|
|
| | |
| | |
Scotts Miracle-Gro Co. (The) (a) | | |
| | |
| | |
Construction & Materials — 2.4% |
| | |
Builders FirstSource, Inc. * | | |
| | |
| | |
| | |
Fortune Brands Innovations, Inc. | | |
| | |
| | |
| | |
| | |
| | |
|
Grand Canyon Education, Inc. * | | |
| | |
Service Corp. International | | |
| | |
|
American Electric Power Co., Inc. | | |
Brookfield Renewable Corp. | | |
Clearway Energy, Inc., Class C | | |
| | |
Consolidated Edison, Inc. | | |
Constellation Energy Corp. | | |
| | |
| | |
| | |
| | |
| | |
| | |
| | |
| | |
| | |
| | |
Pinnacle West Capital Corp. | | |
| | |
Public Service Enterprise Group, Inc. | | |
| | |
SEE NOTES TO FINANCIAL STATEMENTS.
| J.P. Morgan Exchange-Traded Funds | |
| | |
Common Stocks — continued |
|
| | |
| | |
| | |
Electronic & Electrical Equipment — 0.4% |
| | |
| | |
| | |
Finance & Credit Services — 0.9% |
| | |
| | |
| | |
| | |
| | |
|
Archer-Daniels-Midland Co. | | |
| | |
| | |
| | |
| | |
| | |
| | |
| | |
| | |
| | |
| | |
| | |
| | |
| | |
Mondelez International, Inc., Class A | | |
| | |
| | |
Tyson Foods, Inc., Class A | | |
| | |
| | |
Gas, Water & Multi-utilities — 2.3% |
| | |
| | |
| | |
| | |
| | |
| | |
|
Gas, Water & Multi-utilities — continued |
| | |
| | |
| | |
General Industrials — 2.2% |
| | |
| | |
Illinois Tool Works, Inc. | | |
| | |
Packaging Corp. of America | | |
| | |
| | |
| | |
| | |
Health Care Providers — 2.7% |
| | |
| | |
| | |
| | |
| | |
Molina Healthcare, Inc. * | | |
| | |
| | |
Universal Health Services, Inc., Class B | | |
| | |
Household Goods & Home Construction — 1.9% |
| | |
| | |
| | |
| | |
| | |
| | |
| | |
Industrial Engineering — 0.7% |
| | |
| | |
| | |
Industrial Materials — 0.7% |
| | |
| | |
| | |
SEE NOTES TO FINANCIAL STATEMENTS.
| J.P. Morgan Exchange-Traded Funds | |
JPMorgan Diversified Return U.S. Equity ETF
SCHEDULE OF PORTFOLIO INVESTMENTSAS OF October 31, 2024 (continued)
| | |
Common Stocks — continued |
Industrial Metals & Mining — 2.9% |
| | |
| | |
| | |
| | |
| | |
| | |
Southern Copper Corp. (Mexico) | | |
| | |
| | |
United States Steel Corp. | | |
| | |
Industrial Support Services — 2.7% |
Accenture plc, Class A (Ireland) | | |
Booz Allen Hamilton Holding Corp. | | |
Capital One Financial Corp. | | |
Core & Main, Inc., Class A * | | |
MSC Industrial Direct Co., Inc., Class A | | |
| | |
| | |
| | |
| | |
| | |
Industrial Transportation — 1.0% |
Allison Transmission Holdings, Inc. | | |
| | |
| | |
| | |
| | |
| | |
| | |
Investment Banking & Brokerage Services — 1.7% |
Ameriprise Financial, Inc. | | |
Apollo Global Management, Inc. | | |
Berkshire Hathaway, Inc., Class B * | | |
Cboe Global Markets, Inc. | | |
Jefferies Financial Group, Inc. | | |
Principal Financial Group, Inc. | | |
| | |
Virtu Financial, Inc., Class A | | |
| | |
|
| | |
| | |
|
Leisure Goods — continued |
| | |
| | |
| | |
|
| | |
Prudential Financial, Inc. | | |
| | |
| | |
|
Interpublic Group of Cos., Inc. (The) | | |
Nexstar Media Group, Inc. | | |
| | |
Medical Equipment & Services — 3.4% |
| | |
| | |
| | |
GE HealthCare Technologies, Inc. | | |
| | |
| | |
| | |
| | |
| | |
| | |
| | |
| | |
Thermo Fisher Scientific, Inc. | | |
West Pharmaceutical Services, Inc. | | |
| | |
Mortgage Real Estate Investment Trusts — 0.5% |
| | |
Starwood Property Trust, Inc. | | |
| | |
Non-life Insurance — 2.7% |
American Financial Group, Inc. | | |
Arch Capital Group Ltd. * | | |
| | |
| | |
| | |
Fidelity National Financial, Inc. | | |
Hartford Financial Services Group, Inc. (The) | | |
Marsh & McLennan Cos., Inc. | | |
Old Republic International Corp. | | |
SEE NOTES TO FINANCIAL STATEMENTS.
| J.P. Morgan Exchange-Traded Funds | |
| | |
Common Stocks — continued |
Non-life Insurance — continued |
| | |
Reinsurance Group of America, Inc. | | |
| | |
| | |
Non-Renewable Energy — 6.5% |
| | |
| | |
| | |
| | |
| | |
| | |
| | |
| | |
| | |
| | |
| | |
| | |
| | |
| | |
| | |
Occidental Petroleum Corp. | | |
| | |
| | |
| | |
| | |
| | |
| | |
Williams Cos., Inc. (The) | | |
| | |
Personal Care, Drug & Grocery Stores — 5.5% |
Albertsons Cos., Inc., Class A | | |
Casey's General Stores, Inc. | | |
| | |
Church & Dwight Co., Inc. | | |
| | |
| | |
| | |
| | |
| | |
| | |
| | |
Performance Food Group Co. * | | |
Procter & Gamble Co. (The) | | |
| | |
|
Personal Care, Drug & Grocery Stores — continued |
Spectrum Brands Holdings, Inc. | | |
| | |
Vitamin Oldco Holdings, Inc. ‡ * | | |
| | |
|
| | |
| | |
| | |
Pharmaceuticals, Biotechnology & Marijuana Producers — 4.1% |
| | |
| | |
| | |
| | |
| | |
| | |
| | |
| | |
| | |
Regeneron Pharmaceuticals, Inc. * | | |
United Therapeutics Corp. * | | |
Vertex Pharmaceuticals, Inc. * | | |
| | |
| | |
| | |
Precious Metals & Mining — 0.3% |
| | |
| | |
| | |
Real Estate Investment & Services — 0.5% |
CBRE Group, Inc., Class A * | | |
Jones Lang LaSalle, Inc. * | | |
| | |
Real Estate Investment Trusts — 8.7% |
AvalonBay Communities, Inc. | | |
Brixmor Property Group, Inc. | | |
| | |
| | |
| | |
EastGroup Properties, Inc. | | |
| | |
| | |
Essex Property Trust, Inc. | | |
SEE NOTES TO FINANCIAL STATEMENTS.
| J.P. Morgan Exchange-Traded Funds | |
JPMorgan Diversified Return U.S. Equity ETF
SCHEDULE OF PORTFOLIO INVESTMENTSAS OF October 31, 2024 (continued)
| | |
Common Stocks — continued |
Real Estate Investment Trusts — continued |
Federal Realty Investment Trust | | |
First Industrial Realty Trust, Inc. | | |
Gaming and Leisure Properties, Inc. | | |
Highwoods Properties, Inc. | | |
Host Hotels & Resorts, Inc. | | |
| | |
| | |
| | |
Lamar Advertising Co., Class A | | |
Mid-America Apartment Communities, Inc. | | |
National Storage Affiliates Trust | | |
| | |
Omega Healthcare Investors, Inc. | | |
Park Hotels & Resorts, Inc. | | |
| | |
| | |
| | |
Simon Property Group, Inc. | | |
| | |
| | |
| | |
| | |
| | |
| | |
| | |
|
| | |
| | |
Dick's Sporting Goods, Inc. | | |
| | |
| | |
| | |
| | |
O'Reilly Automotive, Inc. * | | |
Penske Automotive Group, Inc. | | |
| | |
| | |
| | |
| | |
| | |
| | |
Software & Computer Services — 4.1% |
| | |
| | |
|
Software & Computer Services — continued |
| | |
| | |
CACI International, Inc., Class A * | | |
Cadence Design Systems, Inc. * | | |
Cognizant Technology Solutions Corp., Class A | | |
Dolby Laboratories, Inc., Class A | | |
| | |
| | |
Hewlett Packard Enterprise Co. | | |
International Business Machines Corp. | | |
| | |
| | |
Meta Platforms, Inc., Class A | | |
| | |
| | |
Science Applications International Corp. | | |
SS&C Technologies Holdings, Inc. | | |
| | |
Technology Hardware & Equipment — 4.0% |
| | |
| | |
| | |
| | |
| | |
| | |
| | |
| | |
| | |
| | |
| | |
| | |
| | |
| | |
Telecommunications Equipment — 2.3% |
| | |
| | |
| | |
| | |
| | |
| | |
| | |
Telecommunications Service Providers — 2.6% |
| | |
SEE NOTES TO FINANCIAL STATEMENTS.
| J.P. Morgan Exchange-Traded Funds | |
| | |
Common Stocks — continued |
Telecommunications Service Providers — continued |
Charter Communications, Inc., Class A * | | |
| | |
Frontier Communications Parent, Inc. * | | |
Iridium Communications, Inc. | | |
Liberty Global Ltd., Class C (Belgium) * | | |
| | |
| | |
Verizon Communications, Inc. | | |
| | |
|
| | |
Philip Morris International, Inc. | | |
| | |
|
| | |
| | |
| | |
| | |
Waste & Disposal Services — 1.2% |
| | |
| | |
| | |
| | |
Total Common Stocks
(Cost $350,689,333) | | |
| | |
Short-Term Investments — 0.2% |
Investment Companies — 0.2% |
JPMorgan U.S. Government Money Market Fund Class IM Shares, 4.80% (b) (c)(Cost $712,498) | | |
Investment of Cash Collateral from Securities Loaned — 0.0% ^ |
JPMorgan Securities Lending Money Market Fund Agency SL Class Shares, 4.85% (b) (c)(Cost $182,000) | | |
Total Short-Term Investments
(Cost $894,498) | | |
Total Investments — 99.9%
(Cost $351,583,831) | | |
Other Assets in Excess of Liabilities — 0.1% | | |
| | |
Percentages indicated are based on net assets. |
| Amount rounds to less than 0.1% of net assets. |
| Value determined using significant unobservable inputs. | |
| Non-income producing security. | |
| The security or a portion of this security is on loan at October 31, 2024. The total value of securities on loan at October 31, 2024 is $173,960. | |
| Investment in an affiliated fund, which is registered under the Investment Company Act of 1940, as amended, and is advised by J.P. Morgan Investment Management Inc. | |
| The rate shown is the current yield as of October 31, 2024. | |
Futures contracts outstanding as of October 31, 2024:
| | | | | VALUE AND
UNREALIZED
APPRECIATION
(DEPRECIATION) ($) |
| | | | | |
| | | | | |
SEE NOTES TO FINANCIAL STATEMENTS.
| J.P. Morgan Exchange-Traded Funds | |
JPMorgan Diversified Return U.S. Mid Cap Equity ETF
SCHEDULE OF PORTFOLIO INVESTMENTSAS OF October 31, 2024
| | |
|
Aerospace & Defense — 0.1% |
| | |
Automobiles & Parts — 0.8% |
| | |
| | |
| | |
| | |
|
Citizens Financial Group, Inc. | | |
| | |
Discover Financial Services | | |
| | |
First Citizens BancShares, Inc., Class A | | |
| | |
Huntington Bancshares, Inc. | | |
| | |
| | |
Popular, Inc. (Puerto Rico) | | |
Prosperity Bancshares, Inc. | | |
| | |
| | |
| | |
|
Boston Beer Co., Inc. (The), Class A * | | |
Coca-Cola Consolidated, Inc. | | |
Molson Coors Beverage Co., Class B | | |
| | |
|
| | |
| | |
CF Industries Holdings, Inc. | | |
| | |
| | |
| | |
| | |
| | |
International Flavors & Fragrances, Inc. | | |
LyondellBasell Industries NV, Class A | | |
| | |
| | |
| | |
| | |
|
|
Scotts Miracle-Gro Co. (The) | | |
| | |
| | |
Construction & Materials — 3.4% |
| | |
| | |
Builders FirstSource, Inc. * | | |
| | |
| | |
| | |
Fortune Brands Innovations, Inc. | | |
| | |
| | |
| | |
| | |
| | |
|
| | |
Service Corp. International | | |
| | |
|
| | |
Brookfield Renewable Corp. | | |
Clearway Energy, Inc., Class C | | |
| | |
Consolidated Edison, Inc. | | |
| | |
| | |
| | |
| | |
| | |
| | |
| | |
| | |
| | |
| | |
Pinnacle West Capital Corp. | | |
| | |
Public Service Enterprise Group, Inc. | | |
| | |
| | |
| | |
SEE NOTES TO FINANCIAL STATEMENTS.
| J.P. Morgan Exchange-Traded Funds | |
| | |
Common Stocks — continued |
Electronic & Electrical Equipment — 1.4% |
| | |
| | |
| | |
| | |
| | |
Keysight Technologies, Inc. * | | |
| | |
| | |
Finance & Credit Services — 1.1% |
| | |
| | |
| | |
| | |
| | |
|
Archer-Daniels-Midland Co. | | |
| | |
| | |
| | |
| | |
| | |
| | |
| | |
| | |
| | |
| | |
| | |
| | |
| | |
McCormick & Co., Inc. (Non-Voting) | | |
| | |
| | |
Tyson Foods, Inc., Class A | | |
| | |
| | |
Gas, Water & Multi-utilities — 2.0% |
| | |
| | |
| | |
| | |
| | |
| | |
| | |
| | |
|
General Industrials — 1.2% |
| | |
| | |
Packaging Corp. of America | | |
| | |
| | |
| | |
| | |
Health Care Providers — 3.3% |
Acadia Healthcare Co., Inc. * | | |
| | |
| | |
| | |
| | |
| | |
Molina Healthcare, Inc. * | | |
| | |
| | |
Universal Health Services, Inc., Class B | | |
Veeva Systems, Inc., Class A * | | |
| | |
Household Goods & Home Construction — 1.9% |
| | |
| | |
| | |
| | |
| | |
| | |
Industrial Engineering — 1.5% |
| | |
| | |
Lincoln Electric Holdings, Inc. | | |
| | |
| | |
| | |
Industrial Materials — 0.8% |
| | |
| | |
| | |
| | |
Industrial Metals & Mining — 2.9% |
| | |
| | |
SEE NOTES TO FINANCIAL STATEMENTS.
| J.P. Morgan Exchange-Traded Funds | |
JPMorgan Diversified Return U.S. Mid Cap Equity ETF
SCHEDULE OF PORTFOLIO INVESTMENTSAS OF October 31, 2024 (continued)
| | |
Common Stocks — continued |
Industrial Metals & Mining — continued |
| | |
| | |
| | |
| | |
| | |
United States Steel Corp. | | |
| | |
Industrial Support Services — 2.1% |
| | |
Booz Allen Hamilton Holding Corp. | | |
Core & Main, Inc., Class A * | | |
MSC Industrial Direct Co., Inc., Class A | | |
| | |
| | |
| | |
| | |
| | |
| | |
Industrial Transportation — 1.2% |
Allison Transmission Holdings, Inc. | | |
Expeditors International of Washington, Inc. | | |
| | |
| | |
| | |
Investment Banking & Brokerage Services — 1.4% |
Ameriprise Financial, Inc. | | |
Cboe Global Markets, Inc. | | |
Jefferies Financial Group, Inc. | | |
Principal Financial Group, Inc. | | |
Virtu Financial, Inc., Class A | | |
| | |
|
| | |
| | |
| | |
| | |
| | |
|
| | |
| | |
| | |
| | |
| | |
|
|
Interpublic Group of Cos., Inc. (The) | | |
Liberty Media Corp-Liberty Live, Class A * | | |
Nexstar Media Group, Inc. | | |
| | |
| | |
Medical Equipment & Services — 4.0% |
Agilent Technologies, Inc. | | |
| | |
| | |
Cooper Cos., Inc. (The) * | | |
| | |
| | |
GE HealthCare Technologies, Inc. | | |
| | |
| | |
| | |
| | |
| | |
| | |
| | |
| | |
| | |
| | |
West Pharmaceutical Services, Inc. | | |
| | |
Mortgage Real Estate Investment Trusts — 0.6% |
Annaly Capital Management, Inc. | | |
| | |
Starwood Property Trust, Inc. | | |
| | |
Non-life Insurance — 3.2% |
American Financial Group, Inc. | | |
Arch Capital Group Ltd. * | | |
| | |
| | |
Axis Capital Holdings Ltd. | | |
| | |
| | |
| | |
Fidelity National Financial, Inc. | | |
Hartford Financial Services Group, Inc. (The) | | |
| | |
Old Republic International Corp. | | |
SEE NOTES TO FINANCIAL STATEMENTS.
| J.P. Morgan Exchange-Traded Funds | |
| | |
Common Stocks — continued |
Non-life Insurance — continued |
Reinsurance Group of America, Inc. | | |
White Mountains Insurance Group Ltd. | | |
| | |
Non-Renewable Energy — 7.3% |
| | |
| | |
| | |
| | |
| | |
| | |
| | |
| | |
| | |
| | |
| | |
| | |
| | |
| | |
| | |
| | |
| | |
| | |
| | |
| | |
| | |
Williams Cos., Inc. (The) | | |
| | |
Personal Care, Drug & Grocery Stores — 3.7% |
Albertsons Cos., Inc., Class A | | |
Casey's General Stores, Inc. | | |
| | |
Church & Dwight Co., Inc. | | |
| | |
Grocery Outlet Holding Corp. * | | |
| | |
| | |
Performance Food Group Co. * | | |
Reynolds Consumer Products, Inc. | | |
Spectrum Brands Holdings, Inc. | | |
| | |
Vitamin Oldco Holdings, Inc. ‡ * | | |
| | |
| | |
|
|
| | |
| | |
| | |
| | |
Pharmaceuticals, Biotechnology & Marijuana Producers — 3.0% |
| | |
| | |
Elanco Animal Health, Inc. * | | |
| | |
| | |
| | |
Jazz Pharmaceuticals plc * | | |
| | |
Neurocrine Biosciences, Inc. * | | |
Royalty Pharma plc, Class A | | |
United Therapeutics Corp. * | | |
| | |
| | |
Precious Metals & Mining — 0.3% |
| | |
Real Estate Investment & Services — 0.9% |
CBRE Group, Inc., Class A * | | |
Jones Lang LaSalle, Inc. * | | |
| | |
Real Estate Investment Trusts — 9.5% |
American Homes 4 Rent, Class A | | |
AvalonBay Communities, Inc. | | |
Brixmor Property Group, Inc. | | |
| | |
| | |
| | |
EastGroup Properties, Inc. | | |
| | |
| | |
Essex Property Trust, Inc. | | |
Federal Realty Investment Trust | | |
First Industrial Realty Trust, Inc. | | |
Gaming and Leisure Properties, Inc. | | |
Highwoods Properties, Inc. | | |
Host Hotels & Resorts, Inc. | | |
| | |
| | |
| | |
SEE NOTES TO FINANCIAL STATEMENTS.
| J.P. Morgan Exchange-Traded Funds | |
JPMorgan Diversified Return U.S. Mid Cap Equity ETF
SCHEDULE OF PORTFOLIO INVESTMENTSAS OF October 31, 2024 (continued)
| | |
Common Stocks — continued |
Real Estate Investment Trusts — continued |
Lamar Advertising Co., Class A | | |
Mid-America Apartment Communities, Inc. | | |
National Storage Affiliates Trust | | |
| | |
Omega Healthcare Investors, Inc. | | |
Park Hotels & Resorts, Inc. | | |
| | |
| | |
Rexford Industrial Realty, Inc. | | |
Simon Property Group, Inc. | | |
| | |
| | |
| | |
| | |
| | |
|
| | |
| | |
Dick's Sporting Goods, Inc. | | |
| | |
| | |
Penske Automotive Group, Inc. | | |
| | |
| | |
| | |
| | |
| | |
Software & Computer Services — 5.3% |
Akamai Technologies, Inc. * | | |
| | |
| | |
AppLovin Corp., Class A * | | |
CACI International, Inc., Class A * | | |
| | |
Dolby Laboratories, Inc., Class A | | |
| | |
| | |
Hewlett Packard Enterprise Co. | | |
| | |
Manhattan Associates, Inc. * | | |
| | |
Science Applications International Corp. | | |
| | |
|
Software & Computer Services — continued |
SS&C Technologies Holdings, Inc. | | |
Tyler Technologies, Inc. * | | |
| | |
Technology Hardware & Equipment — 3.7% |
| | |
| | |
| | |
| | |
| | |
| | |
Microchip Technology, Inc. | | |
Monolithic Power Systems, Inc. | | |
| | |
| | |
| | |
| | |
| | |
| | |
| | |
Telecommunications Equipment — 1.4% |
| | |
| | |
Lumentum Holdings, Inc. * | | |
| | |
| | |
Telecommunications Service Providers — 1.6% |
Charter Communications, Inc., Class A * | | |
Frontier Communications Parent, Inc. * | | |
Iridium Communications, Inc. | | |
Liberty Broadband Corp., Class C * | | |
Liberty Global Ltd., Class C (Belgium) * | | |
| | |
| | |
|
| | |
| | |
MGM Resorts International * | | |
| | |
| | |
| | |
| | |
SEE NOTES TO FINANCIAL STATEMENTS.
| J.P. Morgan Exchange-Traded Funds | |
| | |
Common Stocks — continued |
Waste & Disposal Services — 0.7% |
| | |
| | |
| | |
Total Common Stocks
(Cost $348,351,901) | | |
Short-Term Investments — 0.2% |
Investment Companies — 0.1% |
JPMorgan U.S. Government Money Market Fund Class IM Shares, 4.80% (b) (c)(Cost $515,360) | | |
Investment of Cash Collateral from Securities Loaned — 0.1% |
JPMorgan Securities Lending Money Market Fund Agency SL Class Shares, 4.85% (b) (c)(Cost $167,244) | | |
Total Short-Term Investments
(Cost $682,604) | | |
Total Investments — 100.0%
(Cost $349,034,505) | | |
Other Assets in Excess of Liabilities — 0.0% ^ | | |
| | |
Percentages indicated are based on net assets. |
| Amount rounds to less than 0.1% of net assets. |
| Value determined using significant unobservable inputs. | |
| Non-income producing security. | |
| The security or a portion of this security is on loan at October 31, 2024. The total value of securities on loan at October 31, 2024 is $156,563. | |
| Investment in an affiliated fund, which is registered under the Investment Company Act of 1940, as amended, and is advised by J.P. Morgan Investment Management Inc. | |
| The rate shown is the current yield as of October 31, 2024. | |
Futures contracts outstanding as of October 31, 2024:
| | | | | VALUE AND
UNREALIZED
APPRECIATION
(DEPRECIATION) ($) |
| | | | | |
S&P MidCap 400 E-Mini Index | | | | | |
SEE NOTES TO FINANCIAL STATEMENTS.
| J.P. Morgan Exchange-Traded Funds | |
JPMorgan Diversified Return U.S. Small Cap Equity ETF
SCHEDULE OF PORTFOLIO INVESTMENTSAS OF October 31, 2024
| | |
|
Aerospace & Defense — 0.2% |
| | |
National Presto Industries, Inc. | | |
| | |
Automobiles & Parts — 0.2% |
| | |
| | |
| | |
| | |
|
| | |
| | |
Atlantic Union Bankshares Corp. | | |
| | |
| | |
Bank of NT Butterfield & Son Ltd. (The) (Bermuda) | | |
| | |
| | |
Community Trust Bancorp, Inc. | | |
First BanCorp (Puerto Rico) | | |
| | |
First Commonwealth Financial Corp. | | |
| | |
| | |
| | |
| | |
| | |
| | |
| | |
| | |
International Bancshares Corp. | | |
| | |
Northwest Bancshares, Inc. | | |
OceanFirst Financial Corp. | | |
OFG Bancorp (Puerto Rico) | | |
| | |
| | |
| | |
Republic Bancorp, Inc., Class A | | |
Simmons First National Corp., Class A | | |
| | |
| | |
| | |
| | |
| | |
|
|
| | |
| | |
| | |
|
| | |
| | |
| | |
Vita Coco Co., Inc. (The) * | | |
| | |
|
| | |
| | |
Arcadium Lithium plc (Argentina) * | | |
| | |
| | |
| | |
| | |
| | |
| | |
| | |
| | |
| | |
| | |
| | |
Rayonier Advanced Materials, Inc. * | | |
Sensient Technologies Corp. | | |
| | |
| | |
| | |
Construction & Materials — 3.0% |
American Woodmark Corp. * | | |
| | |
| | |
BlueLinx Holdings, Inc. * | | |
| | |
| | |
| | |
| | |
| | |
Installed Building Products, Inc. | | |
| | |
Mueller Water Products, Inc., Class A | | |
| | |
SEE NOTES TO FINANCIAL STATEMENTS.
| J.P. Morgan Exchange-Traded Funds | |
| | |
Common Stocks — continued |
Construction & Materials — continued |
Quanex Building Products Corp. | | |
Sterling Infrastructure, Inc. * | | |
| | |
|
| | |
| | |
Laureate Education, Inc., Class A | | |
| | |
| | |
Strategic Education, Inc. | | |
| | |
| | |
|
| | |
Hawaiian Electric Industries, Inc. * | | |
| | |
Northwestern Energy Group, Inc. | | |
NuScale Power Corp. * (a) | | |
| | |
Portland General Electric Co. | | |
| | |
| | |
Electronic & Electrical Equipment — 0.9% |
| | |
| | |
| | |
Watts Water Technologies, Inc., Class A | | |
| | |
Finance & Credit Services — 1.7% |
| | |
Enova International, Inc. * | | |
Federal Agricultural Mortgage Corp., Class C | | |
| | |
| | |
| | |
PennyMac Financial Services, Inc. | | |
| | |
| | |
|
| | |
| | |
| | |
| | |
|
Food Producers — continued |
| | |
Fresh Del Monte Produce, Inc. | | |
| | |
Hain Celestial Group, Inc. (The) * | | |
| | |
| | |
John B Sanfilippo & Son, Inc. | | |
| | |
| | |
Nature's Sunshine Products, Inc. * | | |
Simply Good Foods Co. (The) * | | |
| | |
| | |
USANA Health Sciences, Inc. * | | |
| | |
| | |
| | |
| | |
Gas, Water & Multi-utilities — 3.6% |
American States Water Co. | | |
Aris Water Solutions, Inc., Class A | | |
| | |
| | |
Brookfield Infrastructure Corp., Class A (Canada) | | |
California Water Service Group | | |
Chesapeake Utilities Corp. | | |
Consolidated Water Co. Ltd., Class D | | |
Excelerate Energy, Inc., Class A | | |
| | |
New Jersey Resources Corp. | | |
Northwest Natural Holding Co. | | |
| | |
| | |
Southwest Gas Holdings, Inc. | | |
| | |
| | |
General Industrials — 1.5% |
| | |
| | |
| | |
| | |
| | |
| | |
SEE NOTES TO FINANCIAL STATEMENTS.
| J.P. Morgan Exchange-Traded Funds | |
JPMorgan Diversified Return U.S. Small Cap Equity ETF
SCHEDULE OF PORTFOLIO INVESTMENTSAS OF October 31, 2024 (continued)
| | |
Common Stocks — continued |
General Industrials — continued |
| | |
| | |
Standex International Corp. | | |
| | |
| | |
Health Care Providers — 2.7% |
| | |
| | |
| | |
| | |
Healthcare Services Group, Inc. * | | |
| | |
| | |
National HealthCare Corp. | | |
Option Care Health, Inc. * | | |
Pennant Group, Inc. (The) * | | |
| | |
Select Medical Holdings Corp. | | |
| | |
US Physical Therapy, Inc. | | |
| | |
Household Goods & Home Construction — 3.6% |
| | |
Central Garden & Pet Co., Class A * | | |
Century Communities, Inc. | | |
CompX International, Inc. | | |
Ethan Allen Interiors, Inc. | | |
Green Brick Partners, Inc. * | | |
| | |
Hovnanian Enterprises, Inc., Class A * | | |
| | |
| | |
| | |
| | |
| | |
| | |
| | |
Taylor Morrison Home Corp. * | | |
| | |
Worthington Enterprises, Inc. | | |
| | |
Industrial Engineering — 0.8% |
Albany International Corp., Class A | | |
| | |
|
Industrial Engineering — continued |
| | |
| | |
Franklin Electric Co., Inc. | | |
| | |
| | |
| | |
Industrial Materials — 1.8% |
| | |
| | |
| | |
| | |
Minerals Technologies, Inc. | | |
| | |
| | |
| | |
| | |
| | |
Industrial Metals & Mining — 3.3% |
Carpenter Technology Corp. | | |
| | |
| | |
| | |
| | |
GrafTech International Ltd. * (a) | | |
Haynes International, Inc. | | |
| | |
| | |
| | |
| | |
Piedmont Lithium, Inc. * (a) | | |
| | |
| | |
Universal Stainless & Alloy Products, Inc. * | | |
| | |
| | |
Industrial Support Services — 2.5% |
| | |
Applied Industrial Technologies, Inc. | | |
| | |
| | |
| | |
Cross Country Healthcare, Inc. * | | |
Donnelley Financial Solutions, Inc. * | | |
SEE NOTES TO FINANCIAL STATEMENTS.
| J.P. Morgan Exchange-Traded Funds | |
| | |
Common Stocks — continued |
Industrial Support Services — continued |
| | |
EVERTEC, Inc. (Puerto Rico) | | |
Heidrick & Struggles International, Inc. | | |
| | |
| | |
| | |
| | |
Resources Connection, Inc. | | |
Target Hospitality Corp. * | | |
| | |
| | |
| | |
| | |
Industrial Transportation — 3.1% |
| | |
Ardmore Shipping Corp. (Ireland) | | |
| | |
| | |
| | |
| | |
| | |
| | |
Genco Shipping & Trading Ltd. | | |
| | |
International Seaways, Inc. | | |
| | |
| | |
Nordic American Tankers Ltd. (a) | | |
Scorpio Tankers, Inc. (Monaco) | | |
Teekay Corp. Ltd. (Bermuda) * | | |
Teekay Tankers Ltd., Class A (Canada) | | |
| | |
| | |
| | |
Investment Banking & Brokerage Services — 1.3% |
Artisan Partners Asset Management, Inc., Class A | | |
Brightsphere Investment Group, Inc. | | |
| | |
Hamilton Lane, Inc., Class A | | |
| | |
| | |
Victory Capital Holdings, Inc., Class A | | |
| | |
|
Investment Banking & Brokerage Services — continued |
Virtus Investment Partners, Inc. | | |
| | |
| | |
|
Camping World Holdings, Inc., Class A | | |
| | |
Smith & Wesson Brands, Inc. | | |
| | |
Winnebago Industries, Inc. | | |
| | |
|
CNO Financial Group, Inc. | | |
Genworth Financial, Inc., Class A * | | |
Jackson Financial, Inc., Class A | | |
| | |
|
| | |
| | |
| | |
| | |
Medical Equipment & Services — 2.4% |
| | |
Anika Therapeutics, Inc. * | | |
| | |
| | |
| | |
| | |
| | |
Lantheus Holdings, Inc. * | | |
Merit Medical Systems, Inc. * | | |
| | |
| | |
| | |
OraSure Technologies, Inc. * | | |
| | |
| | |
| | |
| | |
| | |
| | |
| | |
| | |
SEE NOTES TO FINANCIAL STATEMENTS.
| J.P. Morgan Exchange-Traded Funds | |
JPMorgan Diversified Return U.S. Small Cap Equity ETF
SCHEDULE OF PORTFOLIO INVESTMENTSAS OF October 31, 2024 (continued)
| | |
Common Stocks — continued |
Mortgage Real Estate Investment Trusts — 1.1% |
Apollo Commercial Real Estate Finance, Inc. | | |
Ellington Financial, Inc. (a) | | |
| | |
| | |
PennyMac Mortgage Investment Trust | | |
| | |
| | |
TPG RE Finance Trust, Inc. | | |
Two Harbors Investment Corp. | | |
| | |
Non-life Insurance — 1.3% |
| | |
| | |
| | |
Horace Mann Educators Corp. | | |
NMI Holdings, Inc., Class A * | | |
Safety Insurance Group, Inc. | | |
Stewart Information Services Corp. | | |
| | |
Non-Renewable Energy — 6.8% |
Alpha Metallurgical Resources, Inc. | | |
| | |
| | |
| | |
| | |
California Resources Corp. | | |
| | |
| | |
Comstock Resources, Inc. (a) | | |
| | |
| | |
| | |
| | |
| | |
Helix Energy Solutions Group, Inc. * | | |
| | |
Kodiak Gas Services, Inc. | | |
| | |
Magnolia Oil & Gas Corp., Class A | | |
| | |
| | |
Newpark Resources, Inc. * | | |
| | |
| | |
|
Non-Renewable Energy — continued |
Par Pacific Holdings, Inc. * | | |
Patterson-UTI Energy, Inc. | | |
PBF Energy, Inc., Class A | | |
| | |
Ramaco Resources, Inc., Class A | | |
| | |
| | |
Select Water Solutions, Inc. | | |
| | |
| | |
Solaris Energy Infrastructure, Inc., Class A | | |
| | |
| | |
| | |
| | |
| | |
Personal Care, Drug & Grocery Stores — 2.2% |
| | |
Chefs' Warehouse, Inc. (The) * | | |
Edgewell Personal Care Co. | | |
| | |
Ingles Markets, Inc., Class A | | |
Nu Skin Enterprises, Inc., Class A | | |
| | |
Sprouts Farmers Market, Inc. * | | |
United Natural Foods, Inc. * | | |
| | |
| | |
| | |
|
G-III Apparel Group Ltd. * | | |
| | |
| | |
| | |
| | |
| | |
| | |
| | |
Pharmaceuticals & Biotechnology — 0.00% ^ |
OmniAb Operations, Inc. ‡ * | | |
| | |
| | |
SEE NOTES TO FINANCIAL STATEMENTS.
| J.P. Morgan Exchange-Traded Funds | |
| | |
Common Stocks — continued |
Pharmaceuticals, Biotechnology & Marijuana Producers — 3.6% |
| | |
Amphastar Pharmaceuticals, Inc. * | | |
ANI Pharmaceuticals, Inc. * | | |
| | |
Arcturus Therapeutics Holdings, Inc. * | | |
Castle Biosciences, Inc. * | | |
Catalyst Pharmaceuticals, Inc. * | | |
Collegium Pharmaceutical, Inc. * | | |
Corcept Therapeutics, Inc. * | | |
Dynavax Technologies Corp. * | | |
Harmony Biosciences Holdings, Inc. * | | |
| | |
Ironwood Pharmaceuticals, Inc. * | | |
Ligand Pharmaceuticals, Inc. * | | |
Pacira BioSciences, Inc. * | | |
| | |
Prestige Consumer Healthcare, Inc. * | | |
Supernus Pharmaceuticals, Inc. * | | |
Vanda Pharmaceuticals, Inc. * | | |
| | |
Precious Metals & Mining — 0.7% |
| | |
| | |
SSR Mining, Inc. (Canada) | | |
| | |
Real Estate Investment & Services — 1.3% |
Anywhere Real Estate, Inc. * | | |
Cushman & Wakefield plc * | | |
DigitalBridge Group, Inc. (a) | | |
eXp World Holdings, Inc. (a) | | |
| | |
Newmark Group, Inc., Class A | | |
| | |
| | |
| | |
Real Estate Investment Trusts — 11.5% |
| | |
Alexander & Baldwin, Inc. | | |
American Assets Trust, Inc. | | |
Apartment Investment and Management Co., Class A * | | |
Apple Hospitality REIT, Inc. | | |
Ares Commercial Real Estate Corp. | | |
| | |
|
Real Estate Investment Trusts — continued |
| | |
Broadstone Net Lease, Inc. | | |
| | |
Community Healthcare Trust, Inc. | | |
| | |
Curbline Properties Corp. * | | |
DiamondRock Hospitality Co. | | |
| | |
Easterly Government Properties, Inc. | | |
Empire State Realty Trust, Inc., Class A | | |
| | |
Essential Properties Realty Trust, Inc. | | |
Four Corners Property Trust, Inc. | | |
| | |
| | |
HA Sustainable Infrastructure Capital, Inc. | | |
Hudson Pacific Properties, Inc. | | |
Independence Realty Trust, Inc. | | |
Innovative Industrial Properties, Inc. | | |
InvenTrust Properties Corp. | | |
| | |
| | |
| | |
| | |
National Health Investors, Inc. | | |
| | |
| | |
| | |
Phillips Edison & Co., Inc. | | |
Piedmont Office Realty Trust, Inc., Class A | | |
| | |
Retail Opportunity Investments Corp. | | |
| | |
Ryman Hospitality Properties, Inc. | | |
Sabra Health Care REIT, Inc. | | |
| | |
| | |
SL Green Realty Corp. (a) | | |
| | |
Summit Hotel Properties, Inc. | | |
Sunstone Hotel Investors, Inc. | | |
| | |
| | |
| | |
SEE NOTES TO FINANCIAL STATEMENTS.
| J.P. Morgan Exchange-Traded Funds | |
JPMorgan Diversified Return U.S. Small Cap Equity ETF
SCHEDULE OF PORTFOLIO INVESTMENTSAS OF October 31, 2024 (continued)
| | |
Common Stocks — continued |
Real Estate Investment Trusts — continued |
| | |
| | |
Xenia Hotels & Resorts, Inc. | | |
| | |
|
American Superconductor Corp. * | | |
REX American Resources Corp. * | | |
| | |
|
Abercrombie & Fitch Co., Class A * | | |
Academy Sports & Outdoors, Inc. | | |
American Eagle Outfitters, Inc. | | |
Asbury Automotive Group, Inc. * | | |
| | |
| | |
| | |
| | |
Haverty Furniture Cos., Inc. | | |
| | |
| | |
| | |
| | |
| | |
| | |
Software & Computer Services — 3.8% |
| | |
| | |
Alarm.com Holdings, Inc. * | | |
| | |
| | |
Clear Secure, Inc., Class A | | |
CommVault Systems, Inc. * | | |
Consensus Cloud Solutions, Inc. * | | |
CSG Systems International, Inc. | | |
| | |
| | |
| | |
| | |
| | |
| | |
| | |
| | |
| | |
| | |
|
Software & Computer Services — continued |
| | |
| | |
| | |
| | |
| | |
| | |
Technology Hardware & Equipment — 5.7% |
| | |
Advanced Energy Industries, Inc. | | |
Alpha & Omega Semiconductor Ltd. * | | |
Axcelis Technologies, Inc. * | | |
Benchmark Electronics, Inc. | | |
| | |
| | |
| | |
| | |
| | |
| | |
| | |
Insight Enterprises, Inc. * | | |
Kulicke & Soffa Industries, Inc. (Singapore) | | |
| | |
Methode Electronics, Inc. | | |
| | |
| | |
| | |
| | |
| | |
| | |
| | |
| | |
| | |
| | |
Ultra Clean Holdings, Inc. * | | |
Vishay Intertechnology, Inc. | | |
| | |
| | |
Telecommunications Equipment — 2.8% |
Applied Optoelectronics, Inc. * | | |
| | |
| | |
| | |
CommScope Holding Co., Inc. * | | |
SEE NOTES TO FINANCIAL STATEMENTS.
| J.P. Morgan Exchange-Traded Funds | |
| | |
Common Stocks — continued |
Telecommunications Equipment — continued |
Digi International, Inc. * | | |
EchoStar Corp., Class A * | | |
| | |
| | |
| | |
| | |
Lightwave Logic, Inc. * (a) | | |
| | |
Ribbon Communications, Inc. * | | |
| | |
| | |
Telecommunications Service Providers — 2.9% |
| | |
| | |
| | |
Cogent Communications Holdings, Inc. | | |
Consolidated Communications Holdings, Inc. * | | |
| | |
| | |
| | |
| | |
Liberty Latin America Ltd., Class C (Puerto Rico) * | | |
Lumen Technologies, Inc. * | | |
Shenandoah Telecommunications Co. | | |
Telephone and Data Systems, Inc. | | |
| | |
| | |
| | |
|
Turning Point Brands, Inc. | | |
| | |
| | |
|
Biglari Holdings, Inc., Class B * | | |
| | |
International Game Technology plc | | |
| | |
| | |
| | |
|
Waste & Disposal Services — 0.3% |
Casella Waste Systems, Inc., Class A * | | |
Total Common Stocks
(Cost $457,666,772) | | |
Short-Term Investments — 2.7% |
Investment Companies — 0.2% |
JPMorgan U.S. Government Money Market Fund Class IM Shares, 4.80% (b) (c)(Cost $773,904) | | |
Investment of Cash Collateral from Securities Loaned — 2.5% |
JPMorgan Securities Lending Money Market Fund Agency SL Class Shares, 4.85% (b) (c)(Cost $12,534,155) | | |
Total Short-Term Investments
(Cost $13,308,059) | | |
Total Investments — 102.5%
(Cost $470,974,831) | | |
Liabilities in Excess of Other Assets — (2.5)% | | |
| | |
Percentages indicated are based on net assets. |
| |
| Real Estate Investment Trust |
| Amount rounds to less than 0.1% of net assets. |
| Value determined using significant unobservable inputs. | |
| Non-income producing security. | |
| The security or a portion of this security is on loan at October 31, 2024. The total value of securities on loan at October 31, 2024 is $11,503,685. | |
| Investment in an affiliated fund, which is registered under the Investment Company Act of 1940, as amended, and is advised by J.P. Morgan Investment Management Inc. | |
| The rate shown is the current yield as of October 31, 2024. | |
SEE NOTES TO FINANCIAL STATEMENTS.
| J.P. Morgan Exchange-Traded Funds | |
JPMorgan Diversified Return U.S. Small Cap Equity ETF
SCHEDULE OF PORTFOLIO INVESTMENTSAS OF October 31, 2024 (continued)
Futures contracts outstanding as of October 31, 2024:
| | | | | VALUE AND
UNREALIZED
APPRECIATION
(DEPRECIATION) ($) |
| | | | | |
Russell 2000 E-Mini Index | | | | | |
SEE NOTES TO FINANCIAL STATEMENTS.
| J.P. Morgan Exchange-Traded Funds | |
JPMorgan U.S. Momentum Factor ETF
SCHEDULE OF PORTFOLIO INVESTMENTSAS OF October 31, 2024
| | |
|
Aerospace & Defense — 3.3% |
| | |
| | |
| | |
| | |
| | |
| | |
| | |
Huntington Ingalls Industries, Inc. | | |
| | |
| | |
| | |
Automobiles & Parts — 0.1% |
| | |
|
First Citizens BancShares, Inc., Class A | | |
|
| | |
Coca-Cola Consolidated, Inc. | | |
| | |
|
| | |
International Flavors & Fragrances, Inc. | | |
| | |
| | |
| | |
Construction & Materials — 2.4% |
| | |
Armstrong World Industries, Inc. | | |
| | |
| | |
| | |
Lennox International, Inc. | | |
| | |
| | |
| | |
| | |
| | |
| | |
|
| | |
Grand Canyon Education, Inc. * | | |
| | |
| | |
|
Consumer Services — continued |
| | |
Uber Technologies, Inc. * | | |
| | |
|
Consolidated Edison, Inc. | | |
Constellation Energy Corp. | | |
| | |
| | |
Public Service Enterprise Group, Inc. | | |
| | |
| | |
| | |
Electronic & Electrical Equipment — 0.7% |
| | |
| | |
| | |
| | |
| | |
| | |
Finance & Credit Services — 0.5% |
| | |
| | |
| | |
| | |
| | |
|
| | |
| | |
| | |
| | |
| | |
| | |
| | |
Gas, Water & Multi-utilities — 0.3% |
| | |
| | |
| | |
General Industrials — 1.6% |
| | |
| | |
SEE NOTES TO FINANCIAL STATEMENTS.
| J.P. Morgan Exchange-Traded Funds | |
JPMorgan U.S. Momentum Factor ETF
SCHEDULE OF PORTFOLIO INVESTMENTSAS OF October 31, 2024 (continued)
| | |
Common Stocks — continued |
General Industrials — continued |
| | |
| | |
| | |
Health Care Providers — 2.6% |
| | |
| | |
| | |
Molina Healthcare, Inc. * | | |
| | |
| | |
Universal Health Services, Inc., Class B | | |
| | |
Household Goods & Home Construction — 1.1% |
| | |
| | |
| | |
Tempur Sealy International, Inc. | | |
| | |
| | |
Industrial Engineering — 0.8% |
| | |
Industrial Metals & Mining — 0.5% |
| | |
Southern Copper Corp. (Mexico) | | |
| | |
| | |
| | |
Industrial Support Services — 2.8% |
| | |
Booz Allen Hamilton Holding Corp. | | |
| | |
Core & Main, Inc., Class A * | | |
| | |
| | |
| | |
| | |
| | |
Industrial Transportation — 1.5% |
Allison Transmission Holdings, Inc. | | |
| | |
| | |
| | |
|
Industrial Transportation — continued |
| | |
| | |
| | |
Investment Banking & Brokerage Services — 5.8% |
Ameriprise Financial, Inc. | | |
| | |
Bank of New York Mellon Corp. (The) | | |
Berkshire Hathaway, Inc., Class B * | | |
Broadridge Financial Solutions, Inc. | | |
Cboe Global Markets, Inc. | | |
Coinbase Global, Inc., Class A * | | |
| | |
Goldman Sachs Group, Inc. (The) | | |
Interactive Brokers Group, Inc., Class A | | |
Intercontinental Exchange, Inc. | | |
Jefferies Financial Group, Inc. | | |
| | |
| | |
Tradeweb Markets, Inc., Class A | | |
| | |
|
| | |
Corebridge Financial, Inc. | | |
| | |
| | |
| | |
|
Liberty Media Corp-Liberty Formula One, Class C * | | |
| | |
| | |
Trade Desk, Inc. (The), Class A * | | |
| | |
Medical Equipment & Services — 3.5% |
Boston Scientific Corp. * | | |
| | |
Intuitive Surgical, Inc. * | | |
| | |
Thermo Fisher Scientific, Inc. | | |
| | |
Non-life Insurance — 3.2% |
| | |
SEE NOTES TO FINANCIAL STATEMENTS.
| J.P. Morgan Exchange-Traded Funds | |
| | |
Common Stocks — continued |
Non-life Insurance — continued |
Arch Capital Group Ltd. * | | |
| | |
| | |
| | |
| | |
Hartford Financial Services Group, Inc. (The) | | |
Old Republic International Corp. | | |
| | |
Reinsurance Group of America, Inc. | | |
Ryan Specialty Holdings, Inc. | | |
| | |
Non-Renewable Energy — 3.5% |
| | |
| | |
| | |
| | |
| | |
| | |
| | |
TechnipFMC plc (United Kingdom) | | |
| | |
| | |
Weatherford International plc | | |
Williams Cos., Inc. (The) | | |
| | |
Personal Care, Drug & Grocery Stores — 2.1% |
Casey's General Stores, Inc. | | |
| | |
Church & Dwight Co., Inc. | | |
| | |
| | |
| | |
Procter & Gamble Co. (The) | | |
Spectrum Brands Holdings, Inc. | | |
Vitamin Oldco Holdings, Inc. ‡ * | | |
| | |
|
| | |
Pharmaceuticals, Biotechnology & Marijuana Producers — 4.5% |
| | |
| | |
| | |
| | |
| | |
|
Pharmaceuticals, Biotechnology & Marijuana Producers — continued |
| | |
| | |
Vertex Pharmaceuticals, Inc. * | | |
Viking Therapeutics, Inc. * | | |
| | |
Real Estate Investment & Services — 0.5% |
CBRE Group, Inc., Class A * | | |
Jones Lang LaSalle, Inc. * | | |
| | |
Real Estate Investment Trusts — 2.3% |
Digital Realty Trust, Inc. | | |
| | |
Essex Property Trust, Inc. | | |
| | |
| | |
Lamar Advertising Co., Class A | | |
National Storage Affiliates Trust | | |
Omega Healthcare Investors, Inc. | | |
Simon Property Group, Inc. | | |
| | |
| | |
| | |
| | |
|
| | |
| | |
| | |
| | |
| | |
Dick's Sporting Goods, Inc. | | |
| | |
| | |
| | |
O'Reilly Automotive, Inc. * | | |
Penske Automotive Group, Inc. | | |
| | |
| | |
| | |
| | |
| | |
Software & Computer Services — 18.3% |
| | |
SEE NOTES TO FINANCIAL STATEMENTS.
| J.P. Morgan Exchange-Traded Funds | |
JPMorgan U.S. Momentum Factor ETF
SCHEDULE OF PORTFOLIO INVESTMENTSAS OF October 31, 2024 (continued)
| | |
Common Stocks — continued |
Software & Computer Services — continued |
Appfolio, Inc., Class A * | | |
AppLovin Corp., Class A * | | |
| | |
Bentley Systems, Inc., Class B | | |
CACI International, Inc., Class A * | | |
Crowdstrike Holdings, Inc., Class A * | | |
DoorDash, Inc., Class A * | | |
| | |
| | |
| | |
| | |
| | |
Guidewire Software, Inc. * | | |
Hewlett Packard Enterprise Co. | | |
Informatica, Inc., Class A * | | |
International Business Machines Corp. | | |
| | |
| | |
| | |
Manhattan Associates, Inc. * | | |
Meta Platforms, Inc., Class A | | |
| | |
MicroStrategy, Inc., Class A * | | |
| | |
| | |
Palantir Technologies, Inc., Class A * | | |
Palo Alto Networks, Inc. * | | |
| | |
| | |
| | |
| | |
Science Applications International Corp. | | |
| | |
SS&C Technologies Holdings, Inc. | | |
| | |
Tyler Technologies, Inc. * | | |
| | |
| | |
Technology Hardware & Equipment — 16.4% |
Advanced Micro Devices, Inc. * | | |
| | |
| | |
| | |
| | |
| | |
|
Technology Hardware & Equipment — continued |
| | |
| | |
| | |
| | |
| | |
Dell Technologies, Inc., Class C | | |
| | |
| | |
| | |
MACOM Technology Solutions Holdings, Inc. * | | |
| | |
| | |
Monolithic Power Systems, Inc. | | |
| | |
| | |
| | |
Pure Storage, Inc., Class A * | | |
| | |
Super Micro Computer, Inc. * (a) | | |
| | |
| | |
| | |
| | |
Vertiv Holdings Co., Class A | | |
| | |
| | |
Telecommunications Equipment — 1.2% |
| | |
| | |
| | |
| | |
Telecommunications Service Providers — 0.9% |
| | |
Frontier Communications Parent, Inc. * | | |
| | |
| | |
|
Philip Morris International, Inc. | | |
|
| | |
| | |
Chipotle Mexican Grill, Inc. * | | |
DraftKings, Inc., Class A * | | |
SEE NOTES TO FINANCIAL STATEMENTS.
| J.P. Morgan Exchange-Traded Funds | |
| | |
Common Stocks — continued |
Travel & Leisure — continued |
Hilton Worldwide Holdings, Inc. | | |
Hyatt Hotels Corp., Class A | | |
Royal Caribbean Cruises Ltd. | | |
| | |
| | |
Waste & Disposal Services — 0.8% |
| | |
| | |
| | |
Total Common Stocks
(Cost $1,021,775,446) | | |
Short-Term Investments — 0.3% |
Investment Companies — 0.2% |
JPMorgan U.S. Government Money Market Fund Class IM Shares, 4.80% (b) (c)(Cost $2,150,007) | | |
Investment of Cash Collateral from Securities Loaned — 0.1% |
JPMorgan Securities Lending Money Market Fund Agency SL Class Shares, 4.85% (b) (c)(Cost $1,591,982) | | |
Total Short-Term Investments
(Cost $3,741,989) | | |
Total Investments — 100.1%
(Cost $1,025,517,435) | | |
Liabilities in Excess of Other Assets — (0.1)% | | |
| | |
Percentages indicated are based on net assets. |
| Amount rounds to less than 0.1% of net assets. |
| Value determined using significant unobservable inputs. | |
| Non-income producing security. | |
| The security or a portion of this security is on loan at October 31, 2024. The total value of securities on loan at October 31, 2024 is $1,363,018. | |
| Investment in an affiliated fund, which is registered under the Investment Company Act of 1940, as amended, and is advised by J.P. Morgan Investment Management Inc. | |
| The rate shown is the current yield as of October 31, 2024. | |
Futures contracts outstanding as of October 31, 2024:
| | | | | VALUE AND
UNREALIZED
APPRECIATION
(DEPRECIATION) ($) |
| | | | | |
S&P 500 Micro E-Mini Index | | | | | |
SEE NOTES TO FINANCIAL STATEMENTS.
| J.P. Morgan Exchange-Traded Funds | |
JPMorgan U.S. Quality Factor ETF
SCHEDULE OF PORTFOLIO INVESTMENTSAS OF October 31, 2024
| | |
|
Aerospace & Defense — 0.6% |
| | |
Automobiles & Parts — 0.1% |
| | |
|
Commerce Bancshares, Inc. | | |
|
| | |
Coca-Cola Consolidated, Inc. | | |
| | |
|
CF Industries Holdings, Inc. | | |
| | |
| | |
| | |
Construction & Materials — 1.4% |
| | |
| | |
Advanced Drainage Systems, Inc. | | |
Builders FirstSource, Inc. * | | |
| | |
| | |
| | |
| | |
| | |
|
| | |
| | |
Grand Canyon Education, Inc. * | | |
| | |
| | |
| | |
|
Consolidated Edison, Inc. | | |
| | |
| | |
| | |
Public Service Enterprise Group, Inc. | | |
| | |
Electronic & Electrical Equipment — 0.9% |
| | |
| | |
| | |
|
Electronic & Electrical Equipment — continued |
Keysight Technologies, Inc. * | | |
Mettler-Toledo International, Inc. * | | |
| | |
Finance & Credit Services — 1.2% |
FactSet Research Systems, Inc. | | |
| | |
| | |
| | |
|
| | |
Gas, Water & Multi-utilities — 0.7% |
| | |
| | |
| | |
| | |
| | |
General Industrials — 0.9% |
| | |
Illinois Tool Works, Inc. | | |
| | |
| | |
Health Care Providers — 0.6% |
| | |
| | |
| | |
| | |
| | |
Household Goods & Home Construction — 0.6% |
| | |
| | |
| | |
| | |
Industrial Engineering — 0.5% |
| | |
Lincoln Electric Holdings, Inc. | | |
| | |
| | |
Industrial Metals & Mining — 0.4% |
| | |
SEE NOTES TO FINANCIAL STATEMENTS.
| J.P. Morgan Exchange-Traded Funds | |
| | |
Common Stocks — continued |
Industrial Metals & Mining — continued |
| | |
Southern Copper Corp. (Mexico) | | |
| | |
Industrial Support Services — 6.9% |
Accenture plc, Class A (Ireland) | | |
Automatic Data Processing, Inc. | | |
| | |
Core & Main, Inc., Class A * | | |
Jack Henry & Associates, Inc. | | |
Mastercard, Inc., Class A | | |
MSC Industrial Direct Co., Inc., Class A | | |
| | |
| | |
| | |
| | |
| | |
| | |
Industrial Transportation — 1.4% |
Allison Transmission Holdings, Inc. | | |
CH Robinson Worldwide, Inc. | | |
Expeditors International of Washington, Inc. | | |
| | |
| | |
United Parcel Service, Inc., Class B | | |
| | |
Investment Banking & Brokerage Services — 4.3% |
Ameriprise Financial, Inc. | | |
Berkshire Hathaway, Inc., Class B * | | |
| | |
Broadridge Financial Solutions, Inc. | | |
Cboe Global Markets, Inc. | | |
Intercontinental Exchange, Inc. | | |
| | |
| | |
Virtu Financial, Inc., Class A | | |
| | |
|
| | |
| | |
| | |
| | |
| | |
|
|
| | |
| | |
| | |
|
Sirius XM Holdings, Inc. (a) | | |
Medical Equipment & Services — 3.5% |
| | |
Agilent Technologies, Inc. | | |
| | |
| | |
Edwards Lifesciences Corp. * | | |
| | |
IDEXX Laboratories, Inc. * | | |
| | |
| | |
| | |
| | |
| | |
| | |
| | |
Non-life Insurance — 4.1% |
American Financial Group, Inc. | | |
| | |
Arch Capital Group Ltd. * | | |
| | |
| | |
| | |
Fidelity National Financial, Inc. | | |
Hartford Financial Services Group, Inc. (The) | | |
Marsh & McLennan Cos., Inc. | | |
| | |
| | |
Travelers Cos., Inc. (The) | | |
| | |
| | |
Non-Renewable Energy — 3.6% |
| | |
| | |
| | |
| | |
| | |
| | |
SEE NOTES TO FINANCIAL STATEMENTS.
| J.P. Morgan Exchange-Traded Funds | |
JPMorgan U.S. Quality Factor ETF
SCHEDULE OF PORTFOLIO INVESTMENTSAS OF October 31, 2024 (continued)
| | |
Common Stocks — continued |
Non-Renewable Energy — continued |
| | |
| | |
| | |
Personal Care, Drug & Grocery Stores — 2.8% |
| | |
Church & Dwight Co., Inc. | | |
| | |
| | |
| | |
| | |
Procter & Gamble Co. (The) | | |
| | |
|
| | |
| | |
Lululemon Athletica, Inc. * | | |
| | |
Skechers U.S.A., Inc., Class A * | | |
| | |
Pharmaceuticals, Biotechnology & Marijuana Producers — 7.1% |
| | |
| | |
| | |
Jazz Pharmaceuticals plc * | | |
| | |
| | |
| | |
Regeneron Pharmaceuticals, Inc. * | | |
Royalty Pharma plc, Class A | | |
United Therapeutics Corp. * | | |
| | |
| | |
Real Estate Investment Trusts — 2.6% |
| | |
| | |
| | |
| | |
Equity LifeStyle Properties, Inc. | | |
| | |
Extra Space Storage, Inc. | | |
Gaming and Leisure Properties, Inc. | | |
Host Hotels & Resorts, Inc. | | |
| | |
|
Real Estate Investment Trusts — continued |
Lamar Advertising Co., Class A | | |
Mid-America Apartment Communities, Inc. | | |
| | |
Simon Property Group, Inc. | | |
| | |
| | |
|
| | |
| | |
Dick's Sporting Goods, Inc. | | |
| | |
O'Reilly Automotive, Inc. * | | |
| | |
| | |
| | |
| | |
| | |
| | |
| | |
| | |
Software & Computer Services — 22.9% |
| | |
Akamai Technologies, Inc. * | | |
| | |
| | |
| | |
AppLovin Corp., Class A * | | |
| | |
Atlassian Corp., Class A * | | |
Bentley Systems, Inc., Class B | | |
Cadence Design Systems, Inc. * | | |
CCC Intelligent Solutions Holdings, Inc. * | | |
Cognizant Technology Solutions Corp., Class A | | |
Crowdstrike Holdings, Inc., Class A * | | |
| | |
| | |
Dolby Laboratories, Inc., Class A | | |
DoorDash, Inc., Class A * | | |
DoubleVerify Holdings, Inc. * | | |
| | |
| | |
| | |
| | |
SEE NOTES TO FINANCIAL STATEMENTS.
| J.P. Morgan Exchange-Traded Funds | |
| | |
Common Stocks — continued |
Software & Computer Services — continued |
| | |
| | |
| | |
| | |
Guidewire Software, Inc. * | | |
Hewlett Packard Enterprise Co. | | |
International Business Machines Corp. | | |
| | |
| | |
Manhattan Associates, Inc. * | | |
| | |
Meta Platforms, Inc., Class A | | |
| | |
| | |
| | |
| | |
Palantir Technologies, Inc., Class A * | | |
Palo Alto Networks, Inc. * | | |
| | |
| | |
Pinterest, Inc., Class A * | | |
Procore Technologies, Inc. * | | |
RingCentral, Inc., Class A * | | |
| | |
| | |
Science Applications International Corp. | | |
| | |
Smartsheet, Inc., Class A * | | |
Snowflake, Inc., Class A * | | |
SS&C Technologies Holdings, Inc. | | |
| | |
| | |
| | |
| | |
Tyler Technologies, Inc. * | | |
| | |
| | |
| | |
Zoom Video Communications, Inc., Class A * | | |
ZoomInfo Technologies, Inc. * | | |
| | |
| | |
Technology Hardware & Equipment — 12.2% |
| | |
| | |
|
Technology Hardware & Equipment — continued |
| | |
| | |
| | |
| | |
| | |
| | |
| | |
| | |
| | |
| | |
| | |
| | |
Lattice Semiconductor Corp. * | | |
MACOM Technology Solutions Holdings, Inc. * | | |
| | |
Microchip Technology, Inc. | | |
Monolithic Power Systems, Inc. | | |
| | |
| | |
Pure Storage, Inc., Class A * | | |
| | |
| | |
| | |
| | |
| | |
Vertiv Holdings Co., Class A | | |
| | |
Telecommunications Equipment — 1.3% |
| | |
| | |
| | |
Telecommunications Service Providers — 0.8% |
| | |
Verizon Communications, Inc. | | |
| | |
|
| | |
|
| | |
| | |
| | |
Choice Hotels International, Inc. (a) | | |
| | |
SEE NOTES TO FINANCIAL STATEMENTS.
| J.P. Morgan Exchange-Traded Funds | |
JPMorgan U.S. Quality Factor ETF
SCHEDULE OF PORTFOLIO INVESTMENTSAS OF October 31, 2024 (continued)
| | |
Common Stocks — continued |
Travel & Leisure — continued |
| | |
Madison Square Garden Sports Corp. * | | |
Marriott International, Inc., Class A | | |
| | |
| | |
Wyndham Hotels & Resorts, Inc. | | |
| | |
| | |
Waste & Disposal Services — 1.1% |
| | |
| | |
| | |
| | |
Total Common Stocks
(Cost $4,477,615,275) | | |
Short-Term Investments — 0.2% |
Investment Companies — 0.1% |
JPMorgan U.S. Government Money Market Fund Class IM Shares, 4.80% (b) (c)(Cost $4,594,496) | | |
| | |
|
Investment of Cash Collateral from Securities Loaned — 0.1% |
JPMorgan Securities Lending Money Market Fund Agency SL Class Shares, 4.85% (b) (c)(Cost $6,177,185) | | |
Total Short-Term Investments
(Cost $10,771,681) | | |
Total Investments — 100.1%
(Cost $4,488,386,956) | | |
Liabilities in Excess of Other Assets — (0.1)% | | |
| | |
Percentages indicated are based on net assets. |
| Non-income producing security. |
| The security or a portion of this security is on loan at October 31, 2024. The total value of securities on loan at October 31, 2024 is $5,918,394. |
| Investment in an affiliated fund, which is registered under the Investment Company Act of 1940, as amended, and is advised by J.P. Morgan Investment Management Inc. |
| The rate shown is the current yield as of October 31, 2024. |
Futures contracts outstanding as of October 31, 2024:
| | | | | VALUE AND
UNREALIZED
APPRECIATION
(DEPRECIATION) ($) |
| | | | | |
| | | | | |
SEE NOTES TO FINANCIAL STATEMENTS.
| J.P. Morgan Exchange-Traded Funds | |
JPMorgan U.S. Value Factor ETF
SCHEDULE OF PORTFOLIO INVESTMENTSAS OF October 31, 2024
| | |
|
Aerospace & Defense — 1.5% |
| | |
Huntington Ingalls Industries, Inc. | | |
L3Harris Technologies, Inc. | | |
| | |
| | |
| | |
Automobiles & Parts — 1.7% |
| | |
| | |
| | |
| | |
| | |
| | |
| | |
| | |
| | |
|
| | |
| | |
| | |
| | |
Citizens Financial Group, Inc. | | |
Columbia Banking System, Inc. | | |
| | |
| | |
| | |
| | |
| | |
Huntington Bancshares, Inc. | | |
| | |
| | |
PNC Financial Services Group, Inc. (The) | | |
Popular, Inc. (Puerto Rico) | | |
Prosperity Bancshares, Inc. | | |
| | |
| | |
| | |
| | |
| | |
| | |
| | |
| | |
| | |
|
|
Molson Coors Beverage Co., Class B | | |
|
| | |
CF Industries Holdings, Inc. | | |
| | |
| | |
LyondellBasell Industries NV, Class A | | |
| | |
| | |
Construction & Materials — 1.5% |
| | |
Builders FirstSource, Inc. * | | |
| | |
Fortune Brands Innovations, Inc. | | |
| | |
MDU Resources Group, Inc. | | |
| | |
| | |
|
| | |
Grand Canyon Education, Inc. * | | |
| | |
Service Corp. International | | |
| | |
| | |
|
| | |
Brookfield Renewable Corp. | | |
Clearway Energy, Inc., Class C | | |
Consolidated Edison, Inc. | | |
| | |
| | |
| | |
| | |
| | |
Pinnacle West Capital Corp. | | |
| | |
| | |
Electronic & Electrical Equipment — 1.3% |
| | |
Johnson Controls International plc | | |
| | |
SEE NOTES TO FINANCIAL STATEMENTS.
| J.P. Morgan Exchange-Traded Funds | |
JPMorgan U.S. Value Factor ETF
SCHEDULE OF PORTFOLIO INVESTMENTSAS OF October 31, 2024 (continued)
| | |
Common Stocks — continued |
Electronic & Electrical Equipment — continued |
| | |
Sensata Technologies Holding plc | | |
WESCO International, Inc. | | |
| | |
Finance & Credit Services — 0.6% |
| | |
| | |
| | |
| | |
|
Archer-Daniels-Midland Co. | | |
| | |
| | |
| | |
| | |
| | |
| | |
| | |
| | |
| | |
| | |
Tyson Foods, Inc., Class A | | |
| | |
Gas, Water & Multi-utilities — 0.4% |
| | |
| | |
| | |
General Industrials — 2.6% |
| | |
| | |
| | |
| | |
| | |
| | |
Graphic Packaging Holding Co. | | |
Packaging Corp. of America | | |
| | |
| | |
| | |
| | |
| | |
| | |
|
Health Care Providers — 3.7% |
| | |
| | |
| | |
| | |
| | |
| | |
| | |
| | |
Universal Health Services, Inc., Class B | | |
| | |
Household Goods & Home Construction — 1.8% |
| | |
| | |
| | |
| | |
| | |
| | |
| | |
| | |
| | |
Industrial Engineering — 2.3% |
| | |
| | |
| | |
| | |
| | |
| | |
Stanley Black & Decker, Inc. | | |
| | |
Industrial Materials — 0.3% |
| | |
Industrial Metals & Mining — 0.6% |
| | |
| | |
| | |
| | |
Industrial Support Services — 2.1% |
| | |
Capital One Financial Corp. | | |
Fidelity National Information Services, Inc. | | |
Gates Industrial Corp. plc * | | |
| | |
SEE NOTES TO FINANCIAL STATEMENTS.
| J.P. Morgan Exchange-Traded Funds | |
| | |
Common Stocks — continued |
Industrial Support Services — continued |
| | |
| | |
MSC Industrial Direct Co., Inc., Class A | | |
| | |
| | |
| | |
| | |
Industrial Transportation — 1.6% |
| | |
Allison Transmission Holdings, Inc. | | |
| | |
| | |
| | |
| | |
Schneider National, Inc., Class B | | |
| | |
Investment Banking & Brokerage Services — 1.8% |
Bank of New York Mellon Corp. (The) | | |
| | |
| | |
Janus Henderson Group plc | | |
Jefferies Financial Group, Inc. | | |
Principal Financial Group, Inc. | | |
| | |
| | |
| | |
|
| | |
| | |
| | |
| | |
| | |
| | |
|
Corebridge Financial, Inc. | | |
| | |
Prudential Financial, Inc. | | |
| | |
| | |
|
| | |
Interpublic Group of Cos., Inc. (The) | | |
| | |
|
|
| | |
Nexstar Media Group, Inc. | | |
| | |
Paramount Global, Class B (a) | | |
Sirius XM Holdings, Inc. (a) | | |
| | |
Medical Equipment & Services — 1.7% |
Baxter International, Inc. | | |
| | |
| | |
| | |
| | |
| | |
| | |
| | |
| | |
Zimmer Biomet Holdings, Inc. | | |
| | |
Mortgage Real Estate Investment Trusts — 0.6% |
AGNC Investment Corp. (a) | | |
Annaly Capital Management, Inc. | | |
| | |
Starwood Property Trust, Inc. | | |
| | |
Non-life Insurance — 1.2% |
American International Group, Inc. | | |
| | |
Axis Capital Holdings Ltd. | | |
First American Financial Corp. | | |
Old Republic International Corp. | | |
Reinsurance Group of America, Inc. | | |
| | |
Non-Renewable Energy — 3.5% |
| | |
| | |
| | |
| | |
| | |
| | |
| | |
| | |
| | |
SEE NOTES TO FINANCIAL STATEMENTS.
| J.P. Morgan Exchange-Traded Funds | |
JPMorgan U.S. Value Factor ETF
SCHEDULE OF PORTFOLIO INVESTMENTSAS OF October 31, 2024 (continued)
| | |
Common Stocks — continued |
Non-Renewable Energy — continued |
| | |
| | |
| | |
| | |
| | |
| | |
Personal Care, Drug & Grocery Stores — 1.0% |
Albertsons Cos., Inc., Class A | | |
| | |
| | |
Spectrum Brands Holdings, Inc. | | |
| | |
|
| | |
| | |
| | |
| | |
| | |
| | |
| | |
Pharmaceuticals, Biotechnology & Marijuana Producers — 5.4% |
| | |
| | |
| | |
| | |
Jazz Pharmaceuticals plc * | | |
| | |
| | |
| | |
| | |
| | |
Royalty Pharma plc, Class A | | |
United Therapeutics Corp. * | | |
| | |
| | |
Real Estate Investment Trusts — 2.7% |
Brixmor Property Group, Inc. | | |
| | |
| | |
| | |
Gaming and Leisure Properties, Inc. | | |
Highwoods Properties, Inc. | | |
| | |
|
Real Estate Investment Trusts — continued |
Host Hotels & Resorts, Inc. | | |
| | |
| | |
Medical Properties Trust, Inc. (a) | | |
| | |
Omega Healthcare Investors, Inc. | | |
Park Hotels & Resorts, Inc. | | |
| | |
Simon Property Group, Inc. | | |
| | |
| | |
| | |
|
| | |
| | |
| | |
| | |
| | |
Dick's Sporting Goods, Inc. | | |
| | |
| | |
| | |
| | |
| | |
Lithia Motors, Inc., Class A | | |
| | |
| | |
| | |
Penske Automotive Group, Inc. | | |
| | |
| | |
| | |
| | |
Software & Computer Services — 19.7% |
Akamai Technologies, Inc. * | | |
| | |
| | |
| | |
AppLovin Corp., Class A * | | |
| | |
Bentley Systems, Inc., Class B | | |
CACI International, Inc., Class A * | | |
CCC Intelligent Solutions Holdings, Inc. * | | |
SEE NOTES TO FINANCIAL STATEMENTS.
| J.P. Morgan Exchange-Traded Funds | |
| | |
Common Stocks — continued |
Software & Computer Services — continued |
| | |
Cognizant Technology Solutions Corp., Class A | | |
| | |
| | |
Dolby Laboratories, Inc., Class A | | |
DoubleVerify Holdings, Inc. * | | |
| | |
Dun & Bradstreet Holdings, Inc. | | |
| | |
| | |
| | |
| | |
| | |
| | |
| | |
Hewlett Packard Enterprise Co. | | |
| | |
Informatica, Inc., Class A * | | |
International Business Machines Corp. | | |
| | |
| | |
| | |
| | |
| | |
Meta Platforms, Inc., Class A | | |
| | |
| | |
| | |
| | |
| | |
| | |
| | |
| | |
| | |
Science Applications International Corp. | | |
SS&C Technologies Holdings, Inc. | | |
| | |
| | |
| | |
| | |
| | |
| | |
| | |
|
Software & Computer Services — continued |
Zoom Video Communications, Inc., Class A * | | |
ZoomInfo Technologies, Inc. * | | |
| | |
Technology Hardware & Equipment — 14.9% |
Allegro MicroSystems, Inc. (Japan) * | | |
| | |
| | |
| | |
| | |
| | |
Arrow Electronics, Inc. * | | |
| | |
| | |
| | |
| | |
| | |
Dell Technologies, Inc., Class C | | |
| | |
GLOBALFOUNDRIES, Inc. * (a) | | |
| | |
| | |
| | |
| | |
| | |
| | |
| | |
Microchip Technology, Inc. | | |
| | |
| | |
| | |
| | |
| | |
| | |
| | |
| | |
| | |
| | |
Vertiv Holdings Co., Class A | | |
| | |
Telecommunications Equipment — 0.7% |
| | |
Telecommunications Service Providers — 1.4% |
| | |
SEE NOTES TO FINANCIAL STATEMENTS.
| J.P. Morgan Exchange-Traded Funds | |
JPMorgan U.S. Value Factor ETF
SCHEDULE OF PORTFOLIO INVESTMENTSAS OF October 31, 2024 (continued)
| | |
Common Stocks — continued |
Telecommunications Service Providers — continued |
| | |
Verizon Communications, Inc. | | |
| | |
|
| | |
Philip Morris International, Inc. | | |
| | |
|
| | |
| | |
| | |
| | |
| | |
Marriott Vacations Worldwide Corp. | | |
MGM Resorts International * | | |
| | |
United Airlines Holdings, Inc. * | | |
| | |
| | |
Wyndham Hotels & Resorts, Inc. | | |
| | |
Total Common Stocks
(Cost $632,641,380) | | |
| | |
Short-Term Investments — 0.8% |
Investment Companies — 0.1% |
JPMorgan U.S. Government Money Market Fund Class IM Shares, 4.80% (b) (c)(Cost $407,337) | | |
Investment of Cash Collateral from Securities Loaned — 0.7% |
JPMorgan Securities Lending Money Market Fund Agency SL Class Shares, 4.85% (b) (c)(Cost $5,014,297) | | |
Total Short-Term Investments
(Cost $5,421,634) | | |
Total Investments — 100.6%
(Cost $638,063,014) | | |
Liabilities in Excess of Other Assets — (0.6)% | | |
| | |
Percentages indicated are based on net assets. |
| Non-income producing security. |
| The security or a portion of this security is on loan at October 31, 2024. The total value of securities on loan at October 31, 2024 is $4,755,611. |
| Investment in an affiliated fund, which is registered under the Investment Company Act of 1940, as amended, and is advised by J.P. Morgan Investment Management Inc. |
| The rate shown is the current yield as of October 31, 2024. |
Futures contracts outstanding as of October 31, 2024:
| | | | | VALUE AND
UNREALIZED
APPRECIATION
(DEPRECIATION) ($) |
| | | | | |
| | | | | |
SEE NOTES TO FINANCIAL STATEMENTS.
| J.P. Morgan Exchange-Traded Funds | |
STATEMENTS OF ASSETS AND LIABILITIESAS OF October 31, 2024
| JPMorgan
BetaBuilders
Canada ETF | JPMorgan
BetaBuilders
Developed Asia
Pacific ex-Japan ETF | JPMorgan
BetaBuilders
Emerging Markets
Equity ETF | JPMorgan
BetaBuilders
Europe ETF |
| | | | |
Investments in non-affiliates, at value | | | | |
Investments in affiliates, at value | | | | |
Investments of cash collateral received from securities loaned, at value (See Note 2.C.) | | | | |
| | | | |
Foreign currency, at value | | | | |
Deposits at broker for futures contracts | | | | |
| | | | |
Dividends from non-affiliates | | | | |
Dividends from affiliates | | | | |
| | | | |
Securities lending income (See Note 2.C.) | | | | |
| | | | |
| | | | |
| | | | |
| | | | |
Collateral received on securities loaned (See Note 2.C.) | | | | |
Variation margin on futures contracts | | | | |
| | | | |
Management fees (See Note 3.A.) | | | | |
Deferred foreign capital gains tax | | | | |
| | | | |
| | | | |
| | | | |
| | | | |
Total distributable earnings (loss) | | | | |
| | | | |
Outstanding number of shares
(unlimited number of shares authorized - par value $0.0001) | | | | |
Net asset value, per share | | | | |
Cost of investments in non-affiliates | | | | |
Cost of investments in affiliates | | | | |
| | | | |
Investment securities on loan, at value (See Note 2.C.) | | | | |
Cost of investment of cash collateral (See Note 2.C.) | | | | |
SEE NOTES TO FINANCIAL STATEMENTS.
| J.P. Morgan Exchange-Traded Funds | |
STATEMENTS OF ASSETS AND LIABILITIESAS OF October 31, 2024 (continued)
| JPMorgan
BetaBuilders
International
Equity ETF | JPMorgan
BetaBuilders
Japan ETF | JPMorgan
BetaBuilders
U.S. Equity ETF | JPMorgan
BetaBuilders U.S.
Mid Cap Equity
ETF |
| | | | |
Investments in non-affiliates, at value | | | | |
Investments in affiliates, at value | | | | |
Investments of cash collateral received from securities loaned, at value (See Note 2.C.) | | | | |
| | | | |
Foreign currency, at value | | | | |
Deposits at broker for futures contracts | | | | |
| | | | |
Investment securities sold | | | | |
| | | | |
Dividends from non-affiliates | | | | |
Dividends from affiliates | | | | |
| | | | |
Securities lending income (See Note 2.C.) | | | | |
| | | | |
| | | | |
| | | | |
Investment securities purchased | | | | |
Collateral received on securities loaned (See Note 2.C.) | | | | |
| | | | |
Variation margin on futures contracts | | | | |
| | | | |
Management fees (See Note 3.A.) | | | | |
| | | | |
| | | | |
| | | | |
| | | | |
Total distributable earnings (loss) | | | | |
| | | | |
Outstanding number of shares
(unlimited number of shares authorized - par value $0.0001) | | | | |
Net asset value, per share | | | | |
Cost of investments in non-affiliates | | | | |
Cost of investments in affiliates | | | | |
| | | | |
Investment securities on loan, at value (See Note 2.C.) | | | | |
Cost of investment of cash collateral (See Note 2.C.) | | | | |
SEE NOTES TO FINANCIAL STATEMENTS.
| J.P. Morgan Exchange-Traded Funds | |
| JPMorgan
BetaBuilders U.S.
Small Cap
Equity ETF | JPMorgan
Carbon
Transition U.S.
Equity ETF | JPMorgan
Diversified
Return
Emerging
Markets Equity
ETF | JPMorgan
Diversified Return
International
Equity ETF |
| | | | |
Investments in non-affiliates, at value | | | | |
Investments in affiliates, at value | | | | |
Investments of cash collateral received from securities loaned, at value (See Note 2.C.) | | | | |
| | | | |
Foreign currency, at value | | | | |
Deposits at broker for futures contracts | | | | |
| | | | |
Investment securities sold | | | | |
| | | | |
Dividends from non-affiliates | | | | |
Dividends from affiliates | | | | |
| | | | |
Securities lending income (See Note 2.C.) | | | | |
| | | | |
| | | | |
| | | | |
| | | | |
Investment securities purchased | | | | |
Collateral received on securities loaned (See Note 2.C.) | | | | |
| | | | |
Variation margin on futures contracts | | | | |
| | | | |
Management fees (See Note 3.A.) | | | | |
Deferred foreign capital gains tax | | | | |
| | | | |
| | | | |
| | | | |
| | | | |
Total distributable earnings (loss) | | | | |
| | | | |
Outstanding number of shares
(unlimited number of shares authorized - par value $0.0001) | | | | |
Net asset value, per share | | | | |
Cost of investments in non-affiliates | | | | |
Cost of investments in affiliates | | | | |
| | | | |
Investment securities on loan, at value (See Note 2.C.) | | | | |
Cost of investment of cash collateral (See Note 2.C.) | | | | |
SEE NOTES TO FINANCIAL STATEMENTS.
| J.P. Morgan Exchange-Traded Funds | |
STATEMENTS OF ASSETS AND LIABILITIESAS OF October 31, 2024 (continued)
| JPMorgan
Diversified
Return U.S.
Equity ETF | JPMorgan
Diversified
Return U.S. Mid
Cap Equity ETF | JPMorgan
Diversified
Return U.S. Small
Cap Equity ETF | JPMorgan U.S.
Momentum
Factor ETF |
| | | | |
Investments in non-affiliates, at value | | | | |
Investments in affiliates, at value | | | | |
Investments of cash collateral received from securities loaned, at value (See Note 2.C.) | | | | |
| | | | |
Deposits at broker for futures contracts | | | | |
| | | | |
Investment securities sold | | | | |
| | | | |
Dividends from non-affiliates | | | | |
Dividends from affiliates | | | | |
Securities lending income (See Note 2.C.) | | | | |
| | | | |
| | | | |
| | | | |
Collateral received on securities loaned (See Note 2.C.) | | | | |
| | | | |
Variation margin on futures contracts | | | | |
| | | | |
Management fees (See Note 3.A.) | | | | |
| | | | |
| | | | |
| | | | |
| | | | |
Total distributable earnings (loss) | | | | |
| | | | |
Outstanding number of shares
(unlimited number of shares authorized - par value $0.0001) | | | | |
Net asset value, per share | | | | |
Cost of investments in non-affiliates | | | | |
Cost of investments in affiliates | | | | |
Investment securities on loan, at value (See Note 2.C.) | | | | |
Cost of investment of cash collateral (See Note 2.C.) | | | | |
SEE NOTES TO FINANCIAL STATEMENTS.
| J.P. Morgan Exchange-Traded Funds | |
| JPMorgan U.S.
Quality Factor
ETF | JPMorgan U.S.
Value Factor
ETF |
| | |
Investments in non-affiliates, at value | | |
Investments in affiliates, at value | | |
Investments of cash collateral received from securities loaned, at value (See Note 2.C.) | | |
| | |
Deposits at broker for futures contracts | | |
| | |
| | |
Dividends from non-affiliates | | |
Dividends from affiliates | | |
Securities lending income (See Note 2.C.) | | |
| | |
| | |
| | |
Collateral received on securities loaned (See Note 2.C.) | | |
| | |
Variation margin on futures contracts | | |
| | |
Management fees (See Note 3.A.) | | |
| | |
| | |
| | |
| | |
Total distributable earnings (loss) | | |
| | |
Outstanding number of shares
(unlimited number of shares authorized - par value $0.0001) | | |
Net asset value, per share | | |
Cost of investments in non-affiliates | | |
Cost of investments in affiliates | | |
Investment securities on loan, at value (See Note 2.C.) | | |
Cost of investment of cash collateral (See Note 2.C.) | | |
SEE NOTES TO FINANCIAL STATEMENTS.
| J.P. Morgan Exchange-Traded Funds | |
STATEMENTS OF OPERATIONSFOR THE YEAR ENDED October 31, 2024
| JPMorgan
BetaBuilders
Canada ETF | JPMorgan
BetaBuilders
Developed Asia
Pacific ex-Japan ETF | JPMorgan
BetaBuilders
Emerging Markets
Equity ETF | |
| | | | |
Interest income from non-affiliates | | | | |
Interest income from affiliates | | | | |
Dividend income from non-affiliates | | | | |
Dividend income from affiliates | | | | |
Income from securities lending (net) (See Note 2.C.) | | | | |
Foreign taxes withheld (net) | | | | |
| | | | |
| | | | |
Management fees (See Note 3.A.) | | | | |
Interest expense to non-affiliates | | | | |
Interest expense to affiliates | | | | |
| | | | |
Net investment income (loss) | | | | |
REALIZED/UNREALIZED GAINS (LOSSES): | | | | |
Net realized gain (loss) on transactions from: | | | | |
Investments in non-affiliates | | | | |
In-kind redemptions of investments in non-affiliates (See Note 4) | | | | |
| | | | |
Foreign currency transactions | | | | |
| | | | |
Change in net unrealized appreciation/depreciation on: | | | | |
Investments in non-affiliates | | | | |
| | | | |
Foreign currency translations | | | | |
Change in net unrealized appreciation/depreciation | | | | |
Net realized/unrealized gains (losses) | | | | |
Change in net assets resulting from operations | | | | |
(a)
Net of foreign capital gains tax of $(379,750).
(b)
Net of change in foreign capital gains tax of $(4,468,966).
SEE NOTES TO FINANCIAL STATEMENTS.
| J.P. Morgan Exchange-Traded Funds | |
| JPMorgan
BetaBuilders
International
Equity ETF | JPMorgan
BetaBuilders
Japan ETF | JPMorgan
BetaBuilders
U.S. Equity ETF | JPMorgan
BetaBuilders U.S.
Mid Cap Equity
ETF |
| | | | |
Interest income from non-affiliates | | | | |
Interest income from affiliates | | | | |
Dividend income from non-affiliates | | | | |
Dividend income from affiliates | | | | |
Income from securities lending (net) (See Note 2.C.) | | | | |
Foreign taxes withheld (net) | | | | |
| | | | |
| | | | |
Management fees (See Note 3.A.) | | | | |
Interest expense to non-affiliates | | | | |
Interest expense to affiliates | | | | |
| | | | |
Net investment income (loss) | | | | |
REALIZED/UNREALIZED GAINS (LOSSES): | | | | |
Net realized gain (loss) on transactions from: | | | | |
Investments in non-affiliates | | | | |
Investments in affiliates | | | | |
In-kind redemptions of investments in non-affiliates (See Note 4) | | | | |
In-kind redemptions of investments in affiliates (See Note 4) | | | | |
| | | | |
Foreign currency transactions | | | | |
| | | | |
Change in net unrealized appreciation/depreciation on: | | | | |
Investments in non-affiliates | | | | |
Investments in affiliates | | | | |
| | | | |
Foreign currency translations | | | | |
Change in net unrealized appreciation/depreciation | | | | |
Net realized/unrealized gains (losses) | | | | |
Change in net assets resulting from operations | | | | |
SEE NOTES TO FINANCIAL STATEMENTS.
| J.P. Morgan Exchange-Traded Funds | |
STATEMENTS OF OPERATIONSFOR THE YEAR ENDED October 31, 2024 (continued)
| JPMorgan
BetaBuilders U.S.
Small Cap
Equity ETF | JPMorgan
Carbon
Transition U.S.
Equity ETF | JPMorgan
Diversified
Return
Emerging
Markets Equity
ETF | JPMorgan
Diversified Return
International
|
| | | | |
Interest income from non-affiliates | | | | |
Interest income from affiliates | | | | |
Dividend income from non-affiliates | | | | |
Dividend income from affiliates | | | | |
Non-cash dividend income from non-affiliates | | | | |
Income from securities lending (net) (See Note 2.C.) | | | | |
Foreign taxes withheld (net) | | | | |
| | | | |
| | | | |
Management fees (See Note 3.A.) | | | | |
Interest expense to non-affiliates | | | | |
Interest expense to affiliates | | | | |
| | | | |
Net investment income (loss) | | | | |
REALIZED/UNREALIZED GAINS (LOSSES): | | | | |
Net realized gain (loss) on transactions from: | | | | |
Investments in non-affiliates | | | | |
Investments in affiliates | | | | |
In-kind redemptions of investments in non-affiliates (See Note 4) | | | | |
| | | | |
Foreign currency transactions | | | | |
Forward foreign currency exchange contracts | | | | |
| | | | |
Change in net unrealized appreciation/depreciation on: | | | | |
Investments in non-affiliates | | | | |
Investments in affiliates | | | | |
| | | | |
Foreign currency translations | | | | |
Change in net unrealized appreciation/depreciation | | | | |
Net realized/unrealized gains (losses) | | | | |
Change in net assets resulting from operations | | | | |
(a)
Net of foreign capital gains tax of $(396,806).
(b)
Net of change in foreign capital gains tax of $(1,314,455).
SEE NOTES TO FINANCIAL STATEMENTS.
| J.P. Morgan Exchange-Traded Funds | |
| JPMorgan
Diversified
Return U.S.
Equity ETF | JPMorgan
Diversified
Return U.S. Mid
Cap Equity ETF | JPMorgan
Diversified
Return U.S. Small
Cap Equity ETF | JPMorgan U.S.
Momentum
Factor ETF |
| | | | |
Interest income from non-affiliates | | | | |
Interest income from affiliates | | | | |
Dividend income from non-affiliates | | | | |
Dividend income from affiliates | | | | |
Non-cash dividend income from non-affiliates | | | | |
Income from securities lending (net) (See Note 2.C.) | | | | |
| | | | |
| | | | |
Management fees (See Note 3.A.) | | | | |
Interest expense to affiliates | | | | |
| | | | |
Net investment income (loss) | | | | |
REALIZED/UNREALIZED GAINS (LOSSES): | | | | |
Net realized gain (loss) on transactions from: | | | | |
Investments in non-affiliates | | | | |
In-kind redemptions of investments in non-affiliates (See Note 4) | | | | |
| | | | |
| | | | |
Change in net unrealized appreciation/depreciation on: | | | | |
Investments in non-affiliates | | | | |
Investments in affiliates | | | | |
| | | | |
Change in net unrealized appreciation/depreciation | | | | |
Net realized/unrealized gains (losses) | | | | |
Change in net assets resulting from operations | | | | |
SEE NOTES TO FINANCIAL STATEMENTS.
| J.P. Morgan Exchange-Traded Funds | |
STATEMENTS OF OPERATIONSFOR THE YEAR ENDED October 31, 2024 (continued)
| JPMorgan U.S.
Quality Factor
ETF | JPMorgan U.S.
Value Factor
ETF |
| | |
Interest income from non-affiliates | | |
Interest income from affiliates | | |
Dividend income from non-affiliates | | |
Dividend income from affiliates | | |
Income from securities lending (net) (See Note 2.C.) | | |
| | |
| | |
Management fees (See Note 3.A.) | | |
Interest expense to affiliates | | |
| | |
Net investment income (loss) | | |
REALIZED/UNREALIZED GAINS (LOSSES): | | |
Net realized gain (loss) on transactions from: | | |
Investments in non-affiliates | | |
In-kind redemptions of investments in non-affiliates (See Note 4) | | |
| | |
| | |
Change in net unrealized appreciation/depreciation on: | | |
Investments in non-affiliates | | |
Investments in affiliates | | |
| | |
Change in net unrealized appreciation/depreciation | | |
Net realized/unrealized gains (losses) | | |
Change in net assets resulting from operations | | |
SEE NOTES TO FINANCIAL STATEMENTS.
| J.P. Morgan Exchange-Traded Funds | |
STATEMENTS OF CHANGES IN NET ASSETSFOR THE PERIODS INDICATED
| JPMorgan BetaBuilders
Canada ETF | JPMorgan BetaBuilders Developed
Asia Pacific ex-Japan ETF |
| Year Ended
October 31, 2024 | Year Ended
October 31, 2023 | Year Ended
October 31, 2024 | Year Ended
October 31, 2023 |
CHANGE IN NET ASSETS RESULTING FROM OPERATIONS: | | | | |
Net investment income (loss) | | | | |
| | | | |
Change in net unrealized appreciation/depreciation | | | | |
Change in net assets resulting from operations | | | | |
DISTRIBUTIONS TO SHAREHOLDERS: | | | | |
Total distributions to shareholders | | | | |
| | | | |
Change in net assets resulting from capital transactions | | | | |
| | | | |
| | | | |
| | | | |
| | | | |
| | | | |
Proceeds from shares issued | | | | |
| | | | |
Total change in net assets resulting from capital transactions | | | | |
| | | | |
| | | | |
| | | | |
Net increase (decrease) in shares from share transactions | | | | |
SEE NOTES TO FINANCIAL STATEMENTS.
| J.P. Morgan Exchange-Traded Funds | |
STATEMENTS OF CHANGES IN NET ASSETSFOR THE PERIODS INDICATED (continued)
| JPMorgan BetaBuilders
Emerging Markets Equity ETF | JPMorgan BetaBuilders
Europe ETF |
| Year Ended
October 31, 2024 | Period Ended
October 31, 2023 (a) | Year Ended
October 31, 2024 | |
CHANGE IN NET ASSETS RESULTING FROM OPERATIONS: | | | | |
Net investment income (loss) | | | | |
| | | | |
Change in net unrealized appreciation/depreciation | | | | |
Change in net assets resulting from operations | | | | |
DISTRIBUTIONS TO SHAREHOLDERS: | | | | |
Total distributions to shareholders | | | | |
| | | | |
Change in net assets resulting from capital transactions | | | | |
| | | | |
| | | | |
| | | | |
| | | | |
| | | | |
Proceeds from shares issued | | | | |
| | | | |
Total change in net assets resulting from capital transactions | | | | |
| | | | |
| | | | |
| | | | |
Net increase in shares from share transactions | | | | |
(a)
Commencement of operations was May 10, 2023.
SEE NOTES TO FINANCIAL STATEMENTS.
| J.P. Morgan Exchange-Traded Funds | |
| JPMorgan BetaBuilders
International Equity ETF | JPMorgan BetaBuilders
Japan ETF |
| Year Ended
October 31, 2024 | Year Ended
October 31, 2023 | Year Ended
October 31, 2024 | Year Ended
October 31, 2023 |
CHANGE IN NET ASSETS RESULTING FROM OPERATIONS: | | | | |
Net investment income (loss) | | | | |
| | | | |
Change in net unrealized appreciation/depreciation | | | | |
Change in net assets resulting from operations | | | | |
DISTRIBUTIONS TO SHAREHOLDERS: | | | | |
Total distributions to shareholders | | | | |
| | | | |
Change in net assets resulting from capital transactions | | | | |
| | | | |
| | | | |
| | | | |
| | | | |
| | | | |
Proceeds from shares issued | | | | |
| | | | |
Total change in net assets resulting from capital transactions | | | | |
| | | | |
| | | | |
| | | | |
Net increase in shares from share transactions | | | | |
SEE NOTES TO FINANCIAL STATEMENTS.
| J.P. Morgan Exchange-Traded Funds | |
STATEMENTS OF CHANGES IN NET ASSETSFOR THE PERIODS INDICATED (continued)
| JPMorgan BetaBuilders
U.S. Equity ETF | JPMorgan BetaBuilders U.S.
Mid Cap Equity ETF |
| Year Ended
October 31, 2024 | Year Ended
October 31, 2023 | Year Ended
October 31, 2024 | Year Ended
October 31, 2023 |
CHANGE IN NET ASSETS RESULTING FROM OPERATIONS: | | | | |
Net investment income (loss) | | | | |
| | | | |
Change in net unrealized appreciation/depreciation | | | | |
Change in net assets resulting from operations | | | | |
DISTRIBUTIONS TO SHAREHOLDERS: | | | | |
Total distributions to shareholders | | | | |
| | | | |
Change in net assets resulting from capital transactions | | | | |
| | | | |
| | | | |
| | | | |
| | | | |
| | | | |
Proceeds from shares issued | | | | |
| | | | |
Total change in net assets resulting from capital transactions | | | | |
| | | | |
| | | | |
| | | | |
Net increase (decrease) in shares from share transactions | | | | |
SEE NOTES TO FINANCIAL STATEMENTS.
| J.P. Morgan Exchange-Traded Funds | |
| JPMorgan BetaBuilders U.S. Small
Cap Equity ETF | JPMorgan Carbon Transition
U.S. Equity ETF |
| Year Ended
October 31, 2024 | Year Ended
October 31, 2023 | Year Ended
October 31, 2024 | Year Ended
October 31, 2023 |
CHANGE IN NET ASSETS RESULTING FROM OPERATIONS: | | | | |
Net investment income (loss) | | | | |
| | | | |
Change in net unrealized appreciation/depreciation | | | | |
Change in net assets resulting from operations | | | | |
DISTRIBUTIONS TO SHAREHOLDERS: | | | | |
Total distributions to shareholders | | | | |
| | | | |
Change in net assets resulting from capital transactions | | | | |
| | | | |
| | | | |
| | | | |
| | | | |
| | | | |
Proceeds from shares issued | | | | |
| | | | |
Total change in net assets resulting from capital transactions | | | | |
| | | | |
| | | | |
| | | | |
Net increase (decrease) in shares from share transactions | | | | |
SEE NOTES TO FINANCIAL STATEMENTS.
| J.P. Morgan Exchange-Traded Funds | |
STATEMENTS OF CHANGES IN NET ASSETSFOR THE PERIODS INDICATED (continued)
| JPMorgan Diversified Return
Emerging Markets Equity ETF | JPMorgan Diversified Return
International Equity ETF |
| Year Ended
October 31, 2024 | Year Ended
October 31, 2023 | Year Ended
October 31, 2024 | Year Ended
October 31, 2023 |
CHANGE IN NET ASSETS RESULTING FROM OPERATIONS: | | | | |
Net investment income (loss) | | | | |
| | | | |
Change in net unrealized appreciation/depreciation | | | | |
Change in net assets resulting from operations | | | | |
DISTRIBUTIONS TO SHAREHOLDERS: | | | | |
Total distributions to shareholders | | | | |
| | | | |
Change in net assets resulting from capital transactions | | | | |
| | | | |
| | | | |
| | | | |
| | | | |
| | | | |
Proceeds from shares issued | | | | |
| | | | |
Total change in net assets resulting from capital transactions | | | | |
| | | | |
| | | | |
| | | | |
Net increase (decrease) in shares from share transactions | | | | |
SEE NOTES TO FINANCIAL STATEMENTS.
| J.P. Morgan Exchange-Traded Funds | |
| JPMorgan Diversified Return
U.S. Equity ETF | JPMorgan Diversified Return
U.S. Mid Cap Equity ETF |
| Year Ended
October 31, 2024 | Year Ended
October 31, 2023 | Year Ended
October 31, 2024 | Year Ended
October 31, 2023 |
CHANGE IN NET ASSETS RESULTING FROM OPERATIONS: | | | | |
Net investment income (loss) | | | | |
| | | | |
Change in net unrealized appreciation/depreciation | | | | |
Change in net assets resulting from operations | | | | |
DISTRIBUTIONS TO SHAREHOLDERS: | | | | |
Total distributions to shareholders | | | | |
| | | | |
Change in net assets resulting from capital transactions | | | | |
| | | | |
| | | | |
| | | | |
| | | | |
| | | | |
Proceeds from shares issued | | | | |
| | | | |
Total change in net assets resulting from capital transactions | | | | |
| | | | |
| | | | |
| | | | |
Net increase (decrease) in shares from share transactions | | | | |
SEE NOTES TO FINANCIAL STATEMENTS.
| J.P. Morgan Exchange-Traded Funds | |
STATEMENTS OF CHANGES IN NET ASSETSFOR THE PERIODS INDICATED (continued)
| JPMorgan Diversified Return
U.S. Small Cap Equity ETF | JPMorgan
U.S. Momentum Factor ETF |
| Year Ended
October 31, 2024 | Year Ended
October 31, 2023 | Year Ended
October 31, 2024 | Year Ended
October 31, 2023 |
CHANGE IN NET ASSETS RESULTING FROM OPERATIONS: | | | | |
Net investment income (loss) | | | | |
| | | | |
Change in net unrealized appreciation/depreciation | | | | |
Change in net assets resulting from operations | | | | |
DISTRIBUTIONS TO SHAREHOLDERS: | | | | |
Total distributions to shareholders | | | | |
| | | | |
Change in net assets resulting from capital transactions | | | | |
| | | | |
| | | | |
| | | | |
| | | | |
| | | | |
Proceeds from shares issued | | | | |
| | | | |
Total change in net assets resulting from capital transactions | | | | |
| | | | |
| | | | |
| | | | |
Net increase in shares from share transactions | | | | |
SEE NOTES TO FINANCIAL STATEMENTS.
| J.P. Morgan Exchange-Traded Funds | |
| JPMorgan
U.S. Quality Factor ETF | JPMorgan
U.S. Value Factor ETF |
| Year Ended
October 31, 2024 | Year Ended
October 31, 2023 | Year Ended
October 31, 2024 | Year Ended
October 31, 2023 |
CHANGE IN NET ASSETS RESULTING FROM OPERATIONS: | | | | |
Net investment income (loss) | | | | |
| | | | |
Change in net unrealized appreciation/depreciation | | | | |
Change in net assets resulting from operations | | | | |
DISTRIBUTIONS TO SHAREHOLDERS: | | | | |
Total distributions to shareholders | | | | |
| | | | |
Change in net assets resulting from capital transactions | | | | |
| | | | |
| | | | |
| | | | |
| | | | |
| | | | |
Proceeds from shares issued | | | | |
| | | | |
Total change in net assets resulting from capital transactions | | | | |
| | | | |
| | | | |
| | | | |
Net increase (decrease) in shares from share transactions | | | | |
SEE NOTES TO FINANCIAL STATEMENTS.
| J.P. Morgan Exchange-Traded Funds | |
FINANCIAL HIGHLIGHTSFOR THE PERIODS INDICATED
| Per share operating performance |
| | | |
| Net asset
value,
beginning
of period | Net investment
income
(loss) (b) | Net realized
and unrealized
gains
(losses)
on investments | Total from
investment
operations | |
JPMorgan BetaBuilders Canada ETF | | | | | |
Year Ended October 31, 2024 | | | | | |
Year Ended October 31, 2023 | | | | | |
Year Ended October 31, 2022 | | | | | |
Year Ended October 31, 2021 (f) | | | | | |
Year Ended October 31, 2020 (f) | | | | | |
JPMorgan BetaBuilders Developed Asia Pacific ex-Japan ETF | | | | | |
Year Ended October 31, 2024 | | | | | |
Year Ended October 31, 2023 | | | | | |
Year Ended October 31, 2022 | | | | | |
Year Ended October 31, 2021 (f) | | | | | |
Year Ended October 31, 2020 (f) | | | | | |
JPMorgan BetaBuilders Emerging Markets Equity ETF | | | | | |
Year Ended October 31, 2024 | | | | | |
May 10, 2023 (g) through October 31, 2023 | | | | | |
JPMorgan BetaBuilders Europe ETF | | | | | |
Year Ended October 31, 2024 | | | | | |
Year Ended October 31, 2023 | | | | | |
Year Ended October 31, 2022 | | | | | |
Year Ended October 31, 2021 (f) | | | | | |
Year Ended October 31, 2020 (f) | | | | | |
|
| Annualized for periods less than one year, unless otherwise noted. |
| Calculated based upon average shares outstanding. |
| Not annualized for periods less than one year. |
| Includes adjustments in accordance with accounting principles generally accepted in the United States of America and as such, the net asset values for financial reporting purposes and the returns based upon those net asset values may differ from the net asset values and returns for shareholder transactions. |
| Prior to December 9, 2019, the market price return was calculated assuming an initial investment made at the market price at the beginning of the reporting period, reinvestment of all dividends and distributions at the market price during the period, and sale at the market price on the last day of the period. The price used to calculate the market price return was the midpoint of the bid/ask spread at the close of business on the listing exchange of the Fund. Effective December 9, 2019, the closing price was used to calculate the market price return; however, any prices used in the calculation for the market price return prior to December 9, 2019, would have used the midpoint of the bid/ask spread at the close of business on the exchange. |
| Per share amounts reflects a 1:2 reverse stock split that occurred on April 12, 2021. |
| Commencement of operations. |
SEE NOTES TO FINANCIAL STATEMENTS.
| J.P. Morgan Exchange-Traded Funds | |
| |
| | | | | Ratios to average net assets (a) | |
Net asset
value,
end of
period | | | Market
price
total
return (c)(e) | | | Net
investment
income
(loss) | Portfolio
turnover
rate (c) |
| | | | | | | |
| | | | | | | |
| | | | | | | |
| | | | | | | |
| | | | | | | |
| | | | | | | |
| | | | | | | |
| | | | | | | |
| | | | | | | |
| | | | | | | |
| | | | | | | |
| | | | | | | |
| | | | | | | |
| | | | | | | |
| | | | | | | |
| | | | | | | |
| | | | | | | |
| | | | | | | |
| | | | | | | |
| | | | | | | |
| | | | | | | |
SEE NOTES TO FINANCIAL STATEMENTS.
| J.P. Morgan Exchange-Traded Funds | |
FINANCIAL HIGHLIGHTSFOR THE PERIODS INDICATED (continued)
| Per share operating performance |
| | | |
| Net asset
value,
beginning
of period | Net investment
income
(loss) (b) | Net realized
and unrealized
gains
(losses)
on investments | Total from
investment
operations | |
JPMorgan BetaBuilders International Equity ETF | | | | | |
Year Ended October 31, 2024 | | | | | |
Year Ended October 31, 2023 | | | | | |
Year Ended October 31, 2022 | | | | | |
Year Ended October 31, 2021 | | | | | |
December 3, 2019 (f) through October 31, 2020 | | | | | |
JPMorgan BetaBuilders Japan ETF | | | | | |
Year Ended October 31, 2024 | | | | | |
Year Ended October 31, 2023 | | | | | |
Year Ended October 31, 2022 | | | | | |
Year Ended October 31, 2021 (i) | | | | | |
Year Ended October 31, 2020 (i) | | | | | |
JPMorgan BetaBuilders U.S. Equity ETF | | | | | |
Year Ended October 31, 2024 | | | | | |
Year Ended October 31, 2023 | | | | | |
Year Ended October 31, 2022 | | | | | |
Year Ended October 31, 2021 | | | | | |
Year Ended October 31, 2020 | | | | | |
JPMorgan BetaBuilders U.S. Mid Cap Equity ETF | | | | | |
Year Ended October 31, 2024 | | | | | |
Year Ended October 31, 2023 | | | | | |
Year Ended October 31, 2022 | | | | | |
Year Ended October 31, 2021 | | | | | |
April 14, 2020 (f) through October 31, 2020 | | | | | |
|
| Annualized for periods less than one year, unless otherwise noted. |
| Calculated based upon average shares outstanding. |
| Not annualized for periods less than one year. |
| Includes adjustments in accordance with accounting principles generally accepted in the United States of America and as such, the net asset values for financial reporting purposes and the returns based upon those net asset values may differ from the net asset values and returns for shareholder transactions. |
| Prior to December 9, 2019, the market price return was calculated assuming an initial investment made at the market price at the beginning of the reporting period, reinvestment of all dividends and distributions at the market price during the period, and sale at the market price on the last day of the period. The price used to calculate the market price return was the midpoint of the bid/ask spread at the close of business on the listing exchange of the Fund. Effective December 9, 2019, the closing price was used to calculate the market price return; however, any prices used in the calculation for the market price return prior to December 9, 2019, would have used the midpoint of the bid/ask spread at the close of business on the exchange. |
| Commencement of operations. |
| Calculation of the net realized and unrealized gains (losses) per share does not correlate with the Fund’s net realized and unrealized gains (losses) presented in the Statements of Operations due to the timing of capital transactions in relation to the fluctuating market values of the Fund’s investments. |
| Since the shares of the Fund did not trade in the secondary market until the day after the Fund’s inception, for the period from the inception to the first day of secondary market trading, the net asset value is used as a proxy for the secondary market trading price to calculate the market returns. |
| Per share amounts reflects a 1:2 reverse stock split that occurred on April 12, 2021. |
SEE NOTES TO FINANCIAL STATEMENTS.
| J.P. Morgan Exchange-Traded Funds | |
| |
| | | | | Ratios to average net assets (a) | |
Net asset
value,
end of
period | | | Market
price
total
return (c)(e) | | | Net
investment
income
(loss) | Portfolio
turnover
rate (c) |
| | | | | | | |
| | | | | | | |
| | | | | | | |
| | | | | | | |
| | | | | | | |
| | | | | | | |
| | | | | | | |
| | | | | | | |
| | | | | | | |
| | | | | | | |
| | | | | | | |
| | | | | | | |
| | | | | | | |
| | | | | | | |
| | | | | | | |
| | | | | | | |
| | | | | | | |
| | | | | | | |
| | | | | | | |
| | | | | | | |
| | | | | | | |
| | | | | | | |
| | | | | | | |
| | | | | | | |
SEE NOTES TO FINANCIAL STATEMENTS.
| J.P. Morgan Exchange-Traded Funds | |
FINANCIAL HIGHLIGHTSFOR THE PERIODS INDICATED (continued)
| Per share operating performance |
| | | |
| Net asset
value,
beginning
of period | Net investment
income
(loss) (b) | Net realized
and unrealized
gains
(losses)
on investments | Total from
investment
operations | |
JPMorgan BetaBuilders U.S. Small Cap Equity ETF | | | | | |
Year Ended October 31, 2024 | | | | | |
Year Ended October 31, 2023 | | | | | |
Year Ended October 31, 2022 | | | | | |
November 16, 2020 (f) through October 31, 2021 | | | | | |
JPMorgan Carbon Transition U.S. Equity ETF | | | | | |
Year Ended October 31, 2024 | | | | | |
Year Ended October 31, 2023 | | | | | |
Year Ended October 31, 2022 | | | | | |
December 9, 2020 (f) through October 31, 2021 | | | | | |
JPMorgan Diversified Return Emerging Markets Equity ETF | | | | | |
Year Ended October 31, 2024 | | | | | |
Year Ended October 31, 2023 | | | | | |
Year Ended October 31, 2022 | | | | | |
Year Ended October 31, 2021 | | | | | |
Year Ended October 31, 2020 | | | | | |
JPMorgan Diversified Return International Equity ETF | | | | | |
Year Ended October 31, 2024 | | | | | |
Year Ended October 31, 2023 | | | | | |
Year Ended October 31, 2022 | | | | | |
Year Ended October 31, 2021 | | | | | |
Year Ended October 31, 2020 | | | | | |
|
| Annualized for periods less than one year, unless otherwise noted. |
| Calculated based upon average shares outstanding. |
| Not annualized for periods less than one year. |
| Includes adjustments in accordance with accounting principles generally accepted in the United States of America and as such, the net asset values for financial reporting purposes and the returns based upon those net asset values may differ from the net asset values and returns for shareholder transactions. |
| Prior to December 9, 2019, the market price return was calculated assuming an initial investment made at the market price at the beginning of the reporting period, reinvestment of all dividends and distributions at the market price during the period, and sale at the market price on the last day of the period. The price used to calculate the market price return was the midpoint of the bid/ask spread at the close of business on the listing exchange of the Fund. Effective December 9, 2019, the closing price was used to calculate the market price return; however, any prices used in the calculation for the market price return prior to December 9, 2019, would have used the midpoint of the bid/ask spread at the close of business on the exchange. |
| Commencement of operations. |
| Since the shares of the Fund did not trade in the secondary market until the day after the Fund’s inception, for the period from the inception to the first day of secondary market trading, the net asset value is used as a proxy for the secondary market trading price to calculate the market returns. |
SEE NOTES TO FINANCIAL STATEMENTS.
| J.P. Morgan Exchange-Traded Funds | |
| |
| | | | | Ratios to average net assets (a) | |
Net asset
value,
end of
period | | | Market
price
total
return (c)(e) | | | Net
investment
income
(loss) | Portfolio
turnover
rate (c) |
| | | | | | | |
| | | | | | | |
| | | | | | | |
| | | | | | | |
| | | | | | | |
| | | | | | | |
| | | | | | | |
| | | | | | | |
| | | | | | | |
| | | | | | | |
| | | | | | | |
| | | | | | | |
| | | | | | | |
| | | | | | | |
| | | | | | | |
| | | | | | | |
| | | | | | | |
| | | | | | | |
| | | | | | | |
| | | | | | | |
| | | | | | | |
| | | | | | | |
SEE NOTES TO FINANCIAL STATEMENTS.
| J.P. Morgan Exchange-Traded Funds | |
FINANCIAL HIGHLIGHTSFOR THE PERIODS INDICATED (continued)
| Per share operating performance |
| | | |
| Net asset
value,
beginning
of period | Net investment
income
(loss) (a) | Net realized
and unrealized
gains
(losses)
on investments | Total from
investment
operations | |
JPMorgan Diversified Return U.S. Equity ETF | | | | | |
Year Ended October 31, 2024 | | | | | |
Year Ended October 31, 2023 | | | | | |
Year Ended October 31, 2022 | | | | | |
Year Ended October 31, 2021 | | | | | |
Year Ended October 31, 2020 | | | | | |
JPMorgan Diversified Return U.S. Mid Cap Equity ETF | | | | | |
Year Ended October 31, 2024 | | | | | |
Year Ended October 31, 2023 | | | | | |
Year Ended October 31, 2022 | | | | | |
Year Ended October 31, 2021 | | | | | |
Year Ended October 31, 2020 | | | | | |
JPMorgan Diversified Return U.S. Small Cap Equity ETF | | | | | |
Year Ended October 31, 2024 | | | | | |
Year Ended October 31, 2023 | | | | | |
Year Ended October 31, 2022 | | | | | |
Year Ended October 31, 2021 | | | | | |
Year Ended October 31, 2020 | | | | | |
|
| Calculated based upon average shares outstanding. |
| Includes adjustments in accordance with accounting principles generally accepted in the United States of America and as such, the net asset values for financial reporting purposes and the returns based upon those net asset values may differ from the net asset values and returns for shareholder transactions. |
| Prior to December 9, 2019, the market price return was calculated assuming an initial investment made at the market price at the beginning of the reporting period, reinvestment of all dividends and distributions at the market price during the period, and sale at the market price on the last day of the period. The price used to calculate the market price return was the midpoint of the bid/ask spread at the close of business on the listing exchange of the Fund. Effective December 9, 2019, the closing price was used to calculate the market price return; however, any prices used in the calculation for the market price return prior to December 9, 2019, would have used the midpoint of the bid/ask spread at the close of business on the exchange. |
SEE NOTES TO FINANCIAL STATEMENTS.
| J.P. Morgan Exchange-Traded Funds | |
| |
| | | | | Ratios to average net assets | |
Net asset
value,
end of
period | | | Market
price
total
return (c) | | | Net
investment
income
(loss) | |
| | | | | | | |
| | | | | | | |
| | | | | | | |
| | | | | | | |
| | | | | | | |
| | | | | | | |
| | | | | | | |
| | | | | | | |
| | | | | | | |
| | | | | | | |
| | | | | | | |
| | | | | | | |
| | | | | | | |
| | | | | | | |
| | | | | | | |
| | | | | | | |
| | | | | | | |
| | | | | | | |
SEE NOTES TO FINANCIAL STATEMENTS.
| J.P. Morgan Exchange-Traded Funds | |
FINANCIAL HIGHLIGHTSFOR THE PERIODS INDICATED (continued)
| Per share operating performance |
| | | |
| Net asset
value,
beginning
of period | Net investment
income
(loss) (a) | Net realized
and unrealized
gains
(losses)
on investments | Total from
investment
operations | |
JPMorgan U.S. Momentum Factor ETF | | | | | |
Year Ended October 31, 2024 | | | | | |
Year Ended October 31, 2023 | | | | | |
Year Ended October 31, 2022 | | | | | |
Year Ended October 31, 2021 | | | | | |
Year Ended October 31, 2020 | | | | | |
JPMorgan U.S. Quality Factor ETF | | | | | |
Year Ended October 31, 2024 | | | | | |
Year Ended October 31, 2023 | | | | | |
Year Ended October 31, 2022 | | | | | |
Year Ended October 31, 2021 | | | | | |
Year Ended October 31, 2020 | | | | | |
JPMorgan U.S. Value Factor ETF | | | | | |
Year Ended October 31, 2024 | | | | | |
Year Ended October 31, 2023 | | | | | |
Year Ended October 31, 2022 | | | | | |
Year Ended October 31, 2021 | | | | | |
Year Ended October 31, 2020 | | | | | |
|
| Calculated based upon average shares outstanding. |
| Includes adjustments in accordance with accounting principles generally accepted in the United States of America and as such, the net asset values for financial reporting purposes and the returns based upon those net asset values may differ from the net asset values and returns for shareholder transactions. |
| Prior to December 9, 2019, the market price return was calculated assuming an initial investment made at the market price at the beginning of the reporting period, reinvestment of all dividends and distributions at the market price during the period, and sale at the market price on the last day of the period. The price used to calculate the market price return was the midpoint of the bid/ask spread at the close of business on the listing exchange of the Fund. Effective December 9, 2019, the closing price was used to calculate the market price return; however, any prices used in the calculation for the market price return prior to December 9, 2019, would have used the midpoint of the bid/ask spread at the close of business on the exchange. |
SEE NOTES TO FINANCIAL STATEMENTS.
| J.P. Morgan Exchange-Traded Funds | |
| |
| | | | | Ratios to average net assets | |
Net asset
value,
end of
period | | | Market
price
total
return (c) | | | Net
investment
income
(loss) | |
| | | | | | | |
| | | | | | | |
| | | | | | | |
| | | | | | | |
| | | | | | | |
| | | | | | | |
| | | | | | | |
| | | | | | | |
| | | | | | | |
| | | | | | | |
| | | | | | | |
| | | | | | | |
| | | | | | | |
| | | | | | | |
| | | | | | | |
| | | | | | | |
| | | | | | | |
| | | | | | | |
SEE NOTES TO FINANCIAL STATEMENTS.
| J.P. Morgan Exchange-Traded Funds | |
NOTES TO FINANCIAL STATEMENTSAS OF October 31, 2024
1. Organization
J.P. Morgan Exchange-Traded Fund Trust (the “Trust”) was formed on February 25, 2010, and is governed by a Declaration of Trust as amended and restated February 19, 2014, and is registered under the Investment Company Act of 1940, as amended (the “1940 Act”), as an open-end management investment company.
The following are 18 separate funds of the Trust (each, a "Fund" and collectively, the "Funds") covered by this report:
| Diversification Classification |
JPMorgan BetaBuilders Canada ETF | |
JPMorgan BetaBuilders Developed Asia Pacific ex-Japan ETF | |
JPMorgan BetaBuilders Emerging Markets Equity ETF | |
JPMorgan BetaBuilders Europe ETF | |
JPMorgan BetaBuilders International Equity ETF | |
JPMorgan BetaBuilders Japan ETF | |
JPMorgan BetaBuilders U.S. Equity ETF | |
JPMorgan BetaBuilders U.S. Mid Cap Equity ETF | |
JPMorgan BetaBuilders U.S. Small Cap Equity ETF | |
JPMorgan Carbon Transition U.S. Equity ETF | |
JPMorgan Diversified Return Emerging Markets Equity ETF | |
JPMorgan Diversified Return International Equity ETF | |
JPMorgan Diversified Return U.S. Equity ETF | |
JPMorgan Diversified Return U.S. Mid Cap Equity ETF | |
JPMorgan Diversified Return U.S. Small Cap Equity ETF | |
JPMorgan U.S. Momentum Factor ETF | |
JPMorgan U.S. Quality Factor ETF | |
JPMorgan U.S. Value Factor ETF | |
The investment objective of JPMorgan BetaBuilders Canada ETF (“BetaBuilders Canada ETF”) is to seek investment results that closely correspond, before fees and expenses, to the performance of the Morningstar® Canada Target Market Exposure IndexSM.
The investment objective of JPMorgan BetaBuilders Developed Asia Pacific ex-Japan ETF (“BetaBuilders Developed Asia Pacific ex-Japan ETF”) is to seek investment results that closely correspond, before fees and expenses, to the performance of the Morningstar® Developed Asia Pacific ex-Japan Target Market Exposure IndexSM.
The investment objective of JPMorgan BetaBuilders Emerging Markets Equity ETF (“BetaBuilders Emerging Markets Equity ETF”) is to seek investment results that closely correspond, before fees and expenses, to the performance of the Morningstar® Emerging Markets Target Market Exposure IndexSM.
The investment objective of JPMorgan BetaBuilders Europe ETF (“BetaBuilders Europe ETF”) is to seek investment results that closely correspond, before fees and expenses, to the performance of the Morningstar® Developed Europe Target Market Exposure IndexSM.
The investment objective of JPMorgan BetaBuilders International Equity ETF (“BetaBuilders International Equity ETF”) is to seek investment results that closely correspond, before fees and expenses, to the performance of the Morningstar® Developed Markets ex-North America Target Market Exposure IndexSM.
The investment objective of JPMorgan BetaBuilders Japan ETF (“BetaBuilders Japan ETF”) is to seek investment results that closely correspond, before fees and expenses, to the performance of the Morningstar® Japan Target Market Exposure IndexSM.
The investment objective of JPMorgan BetaBuilders U.S. Equity ETF (“BetaBuilders U.S. Equity ETF”) is to seek investment results that closely correspond, before fees and expenses, to the performance of the Morningstar® US Target Market Exposure IndexSM.
The investment objective of JPMorgan BetaBuilders U.S. Mid Cap Equity ETF (“BetaBuilders U.S. Mid Cap Equity ETF”) is to seek investment results that closely correspond, before fees and expenses, to the performance of the Morningstar® US Mid Cap Target Market Exposure Extended IndexSM.
The investment objective of JPMorgan BetaBuilders U.S. Small Cap Equity ETF (“BetaBuilders U.S. Small Cap Equity ETF”) is to seek investment results that closely correspond, before fees and expenses, to the performance of the Morningstar® US Small Cap Target Market Exposure Extended IndexSM.
The investment objective of JPMorgan Carbon Transition U.S. Equity ETF (“Carbon Transition U.S. Equity ETF”) is to seek investment results that closely correspond, before fees and expenses, to the performance of the JPMorgan Asset Management Carbon Transition U.S. Equity Index.
| J.P. Morgan Exchange-Traded Funds | |
The investment objective of JPMorgan Diversified Return Emerging Markets Equity ETF (“Emerging Markets Equity ETF”) is to seek investment results that closely correspond, before fees and expenses, to the performance of the JP Morgan Diversified Factor Emerging Markets Equity Index.
The investment objective of JPMorgan Diversified Return International Equity ETF (“International Equity ETF”) is to seek investment results that closely correspond, before fees and expenses, to the performance of the JP Morgan Diversified Factor International Equity Index.
The investment objective of JPMorgan Diversified Return U.S. Equity ETF (“U.S. Equity ETF”) is to seek investment results that closely correspond, before fees and expenses, to the performance of the JP Morgan Diversified Factor US Equity Index.
The investment objective of JPMorgan Diversified Return U.S. Mid Cap Equity ETF (“U.S. Mid Cap Equity ETF”) is to seek investment results that closely correspond, before fees and expenses, to the performance of the JP Morgan Diversified Factor US Mid Cap Equity Index.
The investment objective of JPMorgan Diversified Return U.S. Small Cap Equity ETF (“U.S. Small Cap Equity ETF”) is to seek investment results that closely correspond, before fees and expenses, to the performance of the JP Morgan Diversified Factor US Small Cap Equity Index.
The investment objective of JPMorgan U.S. Momentum Factor ETF (“U.S. Momentum Factor ETF”) is to seek investment results that closely correspond, before fees and expenses, to the performance of the JP Morgan US Momentum Factor Index.
The investment objective of JPMorgan U.S. Quality Factor ETF (“U.S. Quality Factor ETF”) is to seek investment results that closely correspond, before fees and expenses, to the performance of the JP Morgan US Quality Factor Index.
The investment objective of JPMorgan U.S. Value Factor ETF (“U.S. Value Factor ETF”) is to seek investment results that closely correspond, before fees and expenses, to the performance of the JP Morgan US Value Factor Index.
J.P. Morgan Investment Management Inc. (“JPMIM”), an indirect, wholly-owned subsidiary of JPMorgan Chase & Co. (“JPMorgan”), acts as adviser (the “Adviser”) and administrator (the “Administrator”) to the Funds.
Shares of each Fund are listed and traded at market price on an exchange as follows:
| |
| |
BetaBuilders Developed Asia Pacific ex-Japan ETF | |
BetaBuilders Emerging Markets Equity ETF | |
| |
BetaBuilders International Equity ETF | |
| |
BetaBuilders U.S. Equity ETF | |
BetaBuilders U.S. Mid Cap Equity ETF | |
BetaBuilders U.S. Small Cap Equity ETF | |
Carbon Transition U.S. Equity ETF | |
Emerging Markets Equity ETF | |
| |
| |
| |
U.S. Small Cap Equity ETF | |
| |
| |
| |
Market prices for the Funds’ shares may be different from their net asset value (“NAV”).
The Funds issue and redeem their shares on a continuous basis, through JPMorgan Distribution Services, Inc. (the “Distributor” or “JPMDS”), an indirect, wholly-owned subsidiary of JPMorgan, at NAV in large blocks of shares, referred to as “Creation Units”. Creation Units are issued and redeemed in exchange for a basket of securities and/or cash. Shares are generally traded in the secondary market in amounts less than a Creation Unit at market prices that change throughout the day. Only individuals or institutions that have entered into an authorized participant agreement with the Distributor may do business directly with the Funds (each, an “Authorized Participant”).
2. Significant Accounting Policies
The following is a summary of significant accounting policies followed by the Funds in the preparation of their financial statements. The Funds are investment companies and, accordingly, follow the investment company accounting and reporting guidance of the Financial Accounting Standards Board (“FASB”) Accounting Standards Codification Topic 946 — Investment Companies, which is part of U.S. generally accepted accounting principles
| J.P. Morgan Exchange-Traded Funds | |
NOTES TO FINANCIAL STATEMENTSAS OF October 31, 2024 (continued)
(“GAAP”). The preparation of financial statements in conformity with GAAP requires management to make estimates and assumptions that affect (i) the reported amounts of assets and liabilities, (ii) disclosure of contingent assets and liabilities at the date of the financial statements, and (iii) the reported amounts of increases and decreases in net assets from operations during the reporting period. Actual results could differ from those estimates.
A. Valuation of Investments— Investments are valued in accordance with GAAP and the Funds' valuation policies set forth by, and under the supervision and responsibility of, the Board of Trustees of the Trust (the "Board"), which established the following approach to valuation, as described more fully below: (i) investments for which market quotations are readily available shall be valued at their market value and (ii) all other investments for which market quotations are not readily available shall be valued at their fair value as determined in good faith by the Board.
Under Section 2(a)(41) of the 1940 Act, the Board is required to determine fair value for securities that do not have readily available market quotations. Under Securities and Exchange Commission ("SEC") Rule 2a-5 (Good Faith Determinations of Fair Value), the Board may designate the performance of these fair valuation determinations to a valuation designee. The Board has designated the Adviser as the “Valuation Designee” to perform fair valuation determinations for the Funds on behalf of the Board subject to appropriate oversight by the Board. The Adviser, as Valuation Designee, leverages the J.P. Morgan Asset Management Americas Valuation Committee (“AVC”) to help oversee and carry out the policies for the valuation of investments held in the Funds. The Adviser, as Valuation Designee, remains responsible for the valuation determinations.
This oversight by the AVC includes monitoring the appropriateness of fair values based on results of ongoing valuation oversight including, but not limited to, consideration of macro or security specific events, market events, and pricing vendor and broker due diligence. The Administrator is responsible for discussing and assessing the potential impacts to the fair values on an ongoing basis, and, at least on a quarterly basis, with the AVC and the Board.
A market-based approach is primarily used to value the Funds' investments. Investments for which market quotations are not readily available are fair valued using prices supplied by approved affiliated and/or unaffiliated pricing vendors or third party broker-dealers (collectively referred to as “Pricing Services”) or may be internally fair valued using methods set forth by the valuation policies approved by the Board. This may include the use of related or comparable assets or liabilities, recent transactions, market multiples, book values and other relevant information for the investment. An income-based valuation approach may be used in which the anticipated future cash flows of the investment are discounted to calculate the fair value. Discounts may also be applied due to the nature or duration of any restrictions on the disposition of the investments. Valuations may be based upon current market prices of securities that are comparable in coupon, rating, maturity and industry. It is possible that the estimated values may differ significantly from the values that would have been used had a ready market for the investments existed, and such differences could be material.
Equities and other exchange-traded instruments are valued at the last sale price or official market closing price on the primary exchange on which the instrument is traded before the NAVs of the Funds are calculated on a valuation date. Certain foreign equity instruments are valued by applying international fair value factors provided by approved Pricing Services. The factors seek to adjust the local closing price for movements of local markets post-closing, but prior to the time the NAVs are calculated.
Investments in open-end investment companies (“Underlying Funds”) are valued at each Underlying Fund’s NAV per share as of the report date.
Futures contracts are generally valued on the basis of available market quotations.
Valuations reflected in this report are as of the report date. As a result, changes in valuation due to market events and/or issuer-related events after the report date and prior to issuance of the report are not reflected herein.
The various inputs that are used in determining the valuation of the Funds' investments are summarized into the three broad levels listed below.
•
Level 1 — Unadjusted inputs using quoted prices in active markets for identical investments.
•
Level 2 — Other significant observable inputs including, but not limited to, quoted prices for similar investments, inputs other than quoted prices that are observable for investments (such as interest rates, prepayment speeds, credit risk, etc.) or other market corroborated inputs.
•
Level 3 — Significant inputs based on the best information available in the circumstances, to the extent observable inputs are not available (including the Funds' assumptions in determining the fair value of investments).
A financial instrument’s level within the fair value hierarchy is based on the lowest level of any input, both individually and in the aggregate, that is significant to the fair value measurement. The inputs or methodology used for valuing instruments are not necessarily an indication of the risk associated with investing in those instruments.
| J.P. Morgan Exchange-Traded Funds | |
The following tables represent each valuation input as presented on the Schedules of Portfolio Investments ("SOIs"):
| | | | |
| | Level 2
Other significant
observable inputs | Level 3
Significant
unobservable inputs | |
Investments in Securities | | | | |
| | | | |
| | | | |
| | | | |
Investment of Cash Collateral from Securities Loaned | | | | |
Total Investments in Securities | | | | |
Appreciation in Other Financial Instruments | | | | |
| | | | |
BetaBuilders Developed Asia Pacific ex-Japan ETF | | |
| | Level 2
Other significant
observable inputs | Level 3
Significant
unobservable inputs | |
Investments in Securities | | | | |
| | | | |
| | | | |
| | | | |
| | | | |
| | | | |
| | | | |
| | | | |
| | | | |
| | | | |
| | | | |
| | | | |
Investment of Cash Collateral from Securities Loaned | | | | |
Total Investments in Securities | | | | |
Depreciation in Other Financial Instruments | | | | |
| | | | |
BetaBuilders Emerging Markets Equity ETF | | |
| | Level 2
Other significant
observable inputs | Level 3
Significant
unobservable inputs | |
Investments in Securities | | | | |
| | | | |
| | | | |
| | | | |
| | | | |
| | | | |
| | | | |
| | | | |
| J.P. Morgan Exchange-Traded Funds | |
NOTES TO FINANCIAL STATEMENTSAS OF October 31, 2024 (continued)
BetaBuilders Emerging Markets Equity ETF (continued) | | |
| | Level 2 Other significant observable inputs | Level 3 Significant unobservable inputs | |
| | | | |
| | | | |
| | | | |
| | | | |
| | | | |
| | | | |
| | | | |
| | | | |
| | | | |
| | | | |
| | | | |
| | | | |
| | | | |
| | | | |
| | | | |
| | | | |
| | | | |
| | | | |
| | | | |
| | | | |
| | | | |
| | | | |
| | | | |
| | | | |
Investment of Cash Collateral from Securities Loaned | | | | |
Total Short-Term Investments | | | | |
Total Investments in Securities | | | | |
Appreciation in Other Financial Instruments | | | | |
| | | | |
There were no significant transfers into or out of level 3 for the year ended October 31, 2024.
| | |
| | Level 2
Other significant
observable inputs | Level 3
Significant
unobservable inputs | |
Investments in Securities | | | | |
| | | | |
| | | | |
| | | | |
| | | | |
| | | | |
| | | | |
| | | | |
| | | | |
| | | | |
| | | | |
| | | | |
| J.P. Morgan Exchange-Traded Funds | |
BetaBuilders Europe ETF (continued) | | |
| | Level 2 Other significant observable inputs | Level 3 Significant unobservable inputs | |
| | | | |
| | | | |
| | | | |
| | | | |
| | | | |
| | | | |
| | | | |
| | | | |
| | | | |
| | | | |
| | | | |
| | | | |
| | | | |
| | | | |
| | | | |
| | | | |
| | | | |
| | | | |
| | | | |
| | | | |
| | | | |
Investment of Cash Collateral from Securities Loaned | | | | |
Total Investments in Securities | | | | |
Depreciation in Other Financial Instruments | | | | |
| | | | |
BetaBuilders International Equity ETF | | |
| | Level 2
Other significant
observable inputs | Level 3
Significant
unobservable inputs | |
Investments in Securities | | | | |
| | | | |
| | | | |
| | | | |
| | | | |
| | | | |
| | | | |
| | | | |
| | | | |
| | | | |
| | | | |
| | | | |
| | | | |
| | | | |
| | | | |
| J.P. Morgan Exchange-Traded Funds | |
NOTES TO FINANCIAL STATEMENTSAS OF October 31, 2024 (continued)
BetaBuilders International Equity ETF (continued) | | |
| | Level 2 Other significant observable inputs | Level 3 Significant unobservable inputs | |
| | | | |
| | | | |
| | | | |
| | | | |
| | | | |
| | | | |
| | | | |
| | | | |
| | | | |
| | | | |
| | | | |
| | | | |
| | | | |
| | | | |
| | | | |
| | | | |
| | | | |
| | | | |
| | | | |
| | | | |
| | | | |
| | | | |
| | | | |
Investment of Cash Collateral from Securities Loaned | | | | |
Total Short-Term Investments | | | | |
Total Investments in Securities | | | | |
Depreciation in Other Financial Instruments | | | | |
| | | | |
| | | | |
| | Level 2
Other significant
observable inputs | Level 3
Significant
unobservable inputs | |
Investments in Securities | | | | |
| | | | |
| | | | |
| | | | |
| | | | |
| | | | |
| | | | |
| | | | |
| | | | |
| | | | |
| | | | |
| J.P. Morgan Exchange-Traded Funds | |
BetaBuilders Japan ETF (continued) | | | | |
| | Level 2 Other significant observable inputs | Level 3 Significant unobservable inputs | |
Commercial Services & Supplies | | | | |
Construction & Engineering | | | | |
| | | | |
Consumer Staples Distribution & Retail | | | | |
| | | | |
Diversified Telecommunication Services | | | | |
| | | | |
| | | | |
Electronic Equipment, Instruments & Components | | | | |
| | | | |
| | | | |
| | | | |
| | | | |
| | | | |
Health Care Equipment & Supplies | | | | |
| | | | |
Hotels, Restaurants & Leisure | | | | |
| | | | |
| | | | |
| | | | |
| | | | |
| | | | |
Interactive Media & Services | | | | |
| | | | |
| | | | |
| | | | |
| | | | |
| | | | |
| | | | |
| | | | |
Oil, Gas & Consumable Fuels | | | | |
| | | | |
| | | | |
| | | | |
| | | | |
Real Estate Management & Development | | | | |
| | | | |
Semiconductors & Semiconductor Equipment | | | | |
| | | | |
| | | | |
Technology Hardware, Storage & Peripherals | | | | |
Textiles, Apparel & Luxury Goods | | | | |
| | | | |
Trading Companies & Distributors | | | | |
Wireless Telecommunication Services | | | | |
| | | | |
| J.P. Morgan Exchange-Traded Funds | |
NOTES TO FINANCIAL STATEMENTSAS OF October 31, 2024 (continued)
BetaBuilders Japan ETF (continued) | | | | |
| | Level 2 Other significant observable inputs | Level 3 Significant unobservable inputs | |
| | | | |
Investment of Cash Collateral from Securities Loaned | | | | |
Total Investments in Securities | | | | |
Depreciation in Other Financial Instruments | | | | |
| | | | |
BetaBuilders U.S. Equity ETF | | | | |
| | Level 2
Other significant
observable inputs | Level 3
Significant
unobservable inputs | |
Investments in Securities | | | | |
| | | | |
| | | | |
| | | | |
| | | | |
Investment of Cash Collateral from Securities Loaned | | | | |
Total Short-Term Investments | | | | |
Total Investments in Securities | | | | |
Appreciation in Other Financial Instruments | | | | |
| | | | |
BetaBuilders U.S. Mid Cap Equity ETF | | | | |
| | Level 2
Other significant
observable inputs | Level 3
Significant
unobservable inputs | |
Total Investments in Securities (a) | | | | |
Appreciation in Other Financial Instruments | | | | |
| | | | |
|
| Please refer to the SOI for specifics of portfolio holdings. |
BetaBuilders U.S. Small Cap Equity ETF | | | | |
| | Level 2
Other significant
observable inputs | Level 3
Significant
unobservable inputs | |
Investments in Securities | | | | |
| | | | |
| | | | |
| | | | |
| | | | |
Investment of Cash Collateral from Securities Loaned | | | | |
Total Short-Term Investments | | | | |
Total Investments in Securities | | | | |
| J.P. Morgan Exchange-Traded Funds | |
BetaBuilders U.S. Small Cap Equity ETF (continued) | | | | |
| | Level 2 Other significant observable inputs | Level 3 Significant unobservable inputs | |
Depreciation in Other Financial Instruments | | | | |
| | | | |
Carbon Transition U.S. Equity ETF | | | | |
| | Level 2
Other significant
observable inputs | Level 3
Significant
unobservable inputs | |
Total Investments in Securities (a) | | | | |
|
| Please refer to the SOI for specifics of portfolio holdings. |
Emerging Markets Equity ETF | | |
| | Level 2
Other significant
observable inputs | Level 3
Significant
unobservable inputs | |
Investments in Securities | | | | |
| | | | |
| | | | |
| | | | |
| | | | |
| | | | |
| | | | |
| | | | |
| | | | |
| | | | |
| | | | |
| | | | |
| | | | |
| | | | |
| | | | |
| | | | |
| | | | |
| | | | |
| | | | |
| | | | |
| | | | |
| | | | |
| | | | |
| | | | |
| | | | |
| | | | |
| | | | |
| | | | |
| | | | |
| | | | |
| J.P. Morgan Exchange-Traded Funds | |
NOTES TO FINANCIAL STATEMENTSAS OF October 31, 2024 (continued)
Emerging Markets Equity ETF (continued) | | |
| | Level 2 Other significant observable inputs | Level 3 Significant unobservable inputs | |
Total Investments in Securities | | | | |
Depreciation in Other Financial Instruments | | | | |
| | | | |
| | |
| | Level 2
Other significant
observable inputs | Level 3
Significant
unobservable inputs | |
Investments in Securities | | | | |
| | | | |
| | | | |
| | | | |
| | | | |
| | | | |
| | | | |
| | | | |
| | | | |
| | | | |
| | | | |
| | | | |
| | | | |
| | | | |
| | | | |
| | | | |
| | | | |
| | | | |
| | | | |
| | | | |
| | | | |
| | | | |
| | | | |
| | | | |
| | | | |
| | | | |
| | | | |
| | | | |
| | | | |
| | | | |
| | | | |
| | | | |
| | | | |
| | | | |
| | | | |
| | | | |
| | | | |
| | | | |
| J.P. Morgan Exchange-Traded Funds | |
International Equity ETF (continued) | | |
| | Level 2 Other significant observable inputs | Level 3 Significant unobservable inputs | |
| | | | |
| | | | |
Investment of Cash Collateral from Securities Loaned | | | | |
Total Short-Term Investments | | | | |
Total Investments in Securities | | | | |
Depreciation in Other Financial Instruments | | | | |
| | | | |
| | |
| | Level 2
Other significant
observable inputs | Level 3
Significant
unobservable inputs | |
Total Investments in Securities (a) | | | | |
Depreciation in Other Financial Instruments | | | | |
| | | | |
|
| Please refer to the SOI for specifics of portfolio holdings. |
| |
| | |
| | Level 2
Other significant
observable inputs | Level 3
Significant
unobservable inputs | |
Total Investments in Securities (a) | | | | |
Depreciation in Other Financial Instruments | | | | |
| | | | |
|
| Please refer to the SOI for specifics of portfolio holdings. |
| |
U.S. Small Cap Equity ETF | | |
| | Level 2
Other significant
observable inputs | Level 3
Significant
unobservable inputs | |
Investments in Securities | | | | |
| | | | |
| | | | |
| | | | |
| | | | |
| | | | |
| | | | |
| | | | |
| | | | |
| | | | |
Electronic & Electrical Equipment | | | | |
| J.P. Morgan Exchange-Traded Funds | |
NOTES TO FINANCIAL STATEMENTSAS OF October 31, 2024 (continued)
U.S. Small Cap Equity ETF (continued) | | |
| | Level 2 Other significant observable inputs | Level 3 Significant unobservable inputs | |
Finance & Credit Services | | | | |
| | | | |
Gas, Water & Multi-utilities | | | | |
| | | | |
| | | | |
Household Goods & Home Construction | | | | |
| | | | |
| | | | |
Industrial Metals & Mining | | | | |
Industrial Support Services | | | | |
Industrial Transportation | | | | |
Investment Banking & Brokerage Services | | | | |
| | | | |
| | | | |
| | | | |
Medical Equipment & Services | | | | |
Mortgage Real Estate Investment Trusts | | | | |
| | | | |
| | | | |
Personal Care, Drug & Grocery Stores | | | | |
| | | | |
Pharmaceuticals & Biotechnology | | | | |
Pharmaceuticals, Biotechnology & Marijuana Producers | | | | |
| | | | |
Real Estate Investment & Services | | | | |
Real Estate Investment Trusts | | | | |
| | | | |
| | | | |
Software & Computer Services | | | | |
Technology Hardware & Equipment | | | | |
Telecommunications Equipment | | | | |
Telecommunications Service Providers | | | | |
| | | | |
| | | | |
Waste & Disposal Services | | | | |
| | | | |
| | | | |
| | | | |
Investment of Cash Collateral from Securities Loaned | | | | |
Total Short-Term Investments | | | | |
Total Investments in Securities | | | | |
Depreciation in Other Financial Instruments | | | | |
| | | | |
| J.P. Morgan Exchange-Traded Funds | |
| | |
| | Level 2
Other significant
observable inputs | Level 3
Significant
unobservable inputs | |
Total Investments in Securities (a) | | | | |
Depreciation in Other Financial Instruments | | | | |
| | | | |
|
| Please refer to the SOI for specifics of portfolio holdings. |
| |
| | |
| | Level 2
Other significant
observable inputs | Level 3
Significant
unobservable inputs | |
Total Investments in Securities (a) | | | | |
Depreciation in Other Financial Instruments | | | | |
| | | | |
|
| Please refer to the SOI for specifics of portfolio holdings. |
| | |
| | Level 2
Other significant
observable inputs | Level 3
Significant
unobservable inputs | |
Total Investments in Securities (a) | | | | |
Appreciation in Other Financial Instruments | | | | |
| | | | |
|
| Please refer to the SOI for specifics of portfolio holdings. |
B. Restricted Securities— Certain securities held by the Funds may be subject to legal or contractual restrictions on resale. Restricted securities generally are resold in transactions exempt from registration under the Securities Act of 1933, as amended (the “Securities Act”). Disposal of these securities may involve time-consuming negotiations and expense. Prompt sale at the current valuation may be difficult and could adversely affect the NAVs of the Funds.
As of October 31, 2024, the Funds had no investments in restricted securities other than securities sold to the Funds under Rule 144A and/or Regulation S under the Securities Act.
C. Securities Lending — The Funds are authorized to engage in securities lending in order to generate additional income. The Funds are able to lend to approved borrowers. Citibank N.A. (“Citibank”) serves as lending agent for the Funds, pursuant to a Securities Lending Agency Agreement (the “Securities Lending Agency Agreement”). Securities loaned are collateralized by cash equal to at least 100% of the market value plus accrued interest on the securities lent, which is invested in the Class IM Shares of the JPMorgan U.S. Government Money Market Fund and the Agency SL Class Shares of the JPMorgan Securities Lending Money Market Fund. The Funds retain the interest earned on cash collateral investments but are required to pay the borrower a rebate for the use of the cash collateral. In cases where the lent security is of high value to borrowers, there may be a negative rebate (i.e., a net payment from the borrower to the Funds). Upon termination of a loan, the Funds are required to return to the borrower an amount equal to the cash collateral, plus any rebate owed to the borrowers. The remaining maturities of the securities lending transactions are considered overnight and continuous. Loans are subject to termination by the Funds or the borrower at any time.
The net income earned on the securities lending (after payment of rebates and Citibank’s fee) is included on the Statements of Operations as Income from securities lending (net). The Funds also receive payments from the borrower during the period of the loan, equivalent to dividends and interest earned on the securities loaned, which are recorded as Dividend or Interest income, respectively, on the Statements of Operations.
Under the Securities Lending Agency Agreement, Citibank marks to market the loaned securities on a daily basis. In the event the cash received from the borrower is less than 102% of the value of the loaned securities (105% for loans of non-U.S. securities), Citibank requests additional cash from
| J.P. Morgan Exchange-Traded Funds | |
NOTES TO FINANCIAL STATEMENTSAS OF October 31, 2024 (continued)
the borrower so as to maintain a collateralization level of at least 102% of the value of the loaned securities plus accrued interest (105% for loans of non-U.S. securities), subject to certain de minimis amounts.
The value of securities out on loan is recorded as an asset on the Statements of Assets and Liabilities. The value of the cash collateral received is recorded as a liability on the Statements of Assets and Liabilities and details of collateral investments are disclosed on the SOIs.
The Funds bear the risk of loss associated with the collateral investments and are not entitled to additional collateral from the borrower to cover any such losses. To the extent that the value of the collateral investments declines below the amount owed to a borrower, the Funds may incur losses that exceed the amount they earned on lending the security. Upon termination of a loan, the Funds may use leverage (borrow money) to repay the borrower for cash collateral posted if the Adviser does not believe that it is prudent to sell the collateral investments to fund the payment of this liability. Securities lending activity is subject to master netting arrangements.
The following table presents for each lending Fund, the value of the securities on loan with Citibank, net of amounts available for offset under the master netting arrangements and any related collateral received or posted by the Funds as of October 31, 2024.
| Investment Securities
on Loan, at value,
Presented on the
Statements of Assets
and Liabilities | Cash Collateral
Posted by Borrower* | Net Amount Due
to Counterparty
(not less than zero) |
| | | |
BetaBuilders Developed Asia Pacific ex-Japan ETF | | | |
BetaBuilders Emerging Markets Equity ETF | | | |
| | | |
BetaBuilders International Equity ETF | | | |
| | | |
BetaBuilders U.S. Equity ETF | | | |
BetaBuilders U.S. Mid Cap Equity ETF | | | |
BetaBuilders U.S. Small Cap Equity ETF | | | |
| | | |
| | | |
| | | |
U.S. Small Cap Equity ETF | | | |
| | | |
| | | |
| | | |
|
| Collateral posted reflects the value of securities on loan and does not include any additional amounts received from the borrower. |
Securities lending also involves counterparty risks, including the risk that the loaned securities may not be returned in a timely manner or at all. Subject to certain conditions, Citibank has agreed to indemnify the Funds from losses resulting from a borrower’s failure to return a loaned security.
| J.P. Morgan Exchange-Traded Funds | |
JPMIM voluntarily waived management fees charged to the Funds to reduce the impact of the cash collateral investment in the JPMorgan U.S. Government Money Market Fund from 0.13% to 0.06%. For the year ended October 31, 2024, JPMIM waived fees associated with the Funds' investment in the JPMorgan U.S. Government Money Market Fund as follows:
| |
BetaBuilders Developed Asia Pacific ex-Japan ETF | |
BetaBuilders Emerging Markets Equity ETF | |
| |
BetaBuilders International Equity ETF | |
| |
BetaBuilders U.S. Equity ETF | |
BetaBuilders U.S. Mid Cap Equity ETF | |
BetaBuilders U.S. Small Cap Equity ETF | |
Emerging Markets Equity ETF | |
| |
| |
| |
U.S. Small Cap Equity ETF | |
| |
| |
| |
The above waiver is included in the determination of earnings on cash collateral investment and in the calculation of Citibank’s compensation and is included on the Statements of Operations as Income from securities lending (net).
Carbon Transition U.S. Equity ETF did not lend out any securities during the year ended October 31, 2024. Emerging Markets Equity ETF did not have any securities out on loan at October 31, 2024.
D. Investment Transactions with Affiliates— The Funds invested in Underlying Funds advised by the Adviser. An issuer which is under common control with a Fund may be considered an affiliate. For the purposes of the financial statements, the Funds assume the issuers listed in the tables below to be affiliated issuers. The Underlying Funds’ distributions may be reinvested into such Underlying Funds. Reinvestment amounts are included in the purchases at cost amounts in the tables below.
|
For the year ended October 31, 2024 |
| | | | | Change in
Unrealized
Appreciation/
(Depreciation) | | | | Capital Gain
Distributions |
JPMorgan Securities Lending Money Market Fund Agency SL Class Shares, 4.85% (a) (b) | | | | | | | | | |
JPMorgan U.S. Government Money Market Fund Class IM Shares, 4.80% (a) (b) | | | | | | | | | |
| | | | | | | | | |
|
| Investment in an affiliated fund, which is registered under the Investment Company Act of 1940, as amended, and is advised by J.P. Morgan Investment Management Inc. |
| The rate shown is the current yield as of October 31, 2024. |
| J.P. Morgan Exchange-Traded Funds | |
NOTES TO FINANCIAL STATEMENTSAS OF October 31, 2024 (continued)
| Amount is included on the Statements of Operations as Income from securities lending (net) (after payments of rebates and Citibank’s fee). |
BetaBuilders Developed Asia Pacific ex-Japan ETF |
For the year ended October 31, 2024 |
| | | | | Change in
Unrealized
Appreciation/
(Depreciation) | | | | Capital Gain
Distributions |
JPMorgan Securities Lending Money Market Fund Agency SL Class Shares, 4.85% (a) (b) | | | | | | | | | |
JPMorgan U.S. Government Money Market Fund Class IM Shares, 4.80% (a) (b) | | | | | | | | | |
| | | | | | | | | |
|
| Investment in an affiliated fund, which is registered under the Investment Company Act of 1940, as amended, and is advised by J.P. Morgan Investment Management Inc. |
| The rate shown is the current yield as of October 31, 2024. |
| Amount is included on the Statements of Operations as Income from securities lending (net) (after payments of rebates and Citibank’s fee). |
BetaBuilders Emerging Markets Equity ETF |
For the year ended October 31, 2024 |
| | | | | Change in
Unrealized
Appreciation/
(Depreciation) | | | | Capital Gain
Distributions |
JPMorgan Securities Lending Money Market Fund Agency SL Class Shares, 4.85% (a) (b) | | | | | | | | | |
JPMorgan U.S. Government Money Market Fund Class IM Shares, 4.80% (a) (b) | | | | | | | | | |
JPMorgan U.S. Government Money Market Fund Class IM Shares, 4.80% (a) (b) | | | | | | | | | |
| | | | | | | | | |
|
| Investment in an affiliated fund, which is registered under the Investment Company Act of 1940, as amended, and is advised by J.P. Morgan Investment Management Inc. |
| The rate shown is the current yield as of October 31, 2024. |
| Amount is included on the Statements of Operations as Income from securities lending (net) (after payments of rebates and Citibank’s fee). |
| J.P. Morgan Exchange-Traded Funds | |
|
For the year ended October 31, 2024 |
| | | | | Change in
Unrealized
Appreciation/
(Depreciation) | | | | Capital Gain
Distributions |
JPMorgan Securities Lending Money Market Fund Agency SL Class Shares, 4.85% (a) (b) | | | | | | | | | |
JPMorgan U.S. Government Money Market Fund Class IM Shares, 4.80% (a) (b) | | | | | | | | | |
| | | | | | | | | |
|
| Investment in an affiliated fund, which is registered under the Investment Company Act of 1940, as amended, and is advised by J.P. Morgan Investment Management Inc. |
| The rate shown is the current yield as of October 31, 2024. |
| Amount is included on the Statements of Operations as Income from securities lending (net) (after payments of rebates and Citibank’s fee). |
BetaBuilders International Equity ETF |
For the year ended October 31, 2024 |
| | | | | Change in
Unrealized
Appreciation/
(Depreciation) | | | | Capital Gain
Distributions |
JPMorgan Securities Lending Money Market Fund Agency SL Class Shares, 4.85% (a) (b) | | | | | | | | | |
JPMorgan U.S. Government Money Market Fund Class IM Shares, 4.80% (a) (b) | | | | | | | | | |
JPMorgan U.S. Government Money Market Fund Class IM Shares, 4.80% (a) (b) | | | | | | | | | |
| | | | | | | | | |
|
| Investment in an affiliated fund, which is registered under the Investment Company Act of 1940, as amended, and is advised by J.P. Morgan Investment Management Inc. |
| The rate shown is the current yield as of October 31, 2024. |
| Amount is included on the Statements of Operations as Income from securities lending (net) (after payments of rebates and Citibank’s fee). |
| J.P. Morgan Exchange-Traded Funds | |
NOTES TO FINANCIAL STATEMENTSAS OF October 31, 2024 (continued)
|
For the year ended October 31, 2024 |
| | | | | Change in
Unrealized
Appreciation/
(Depreciation) | | | | Capital Gain
Distributions |
JPMorgan Securities Lending Money Market Fund Agency SL Class Shares, 4.85% (a) (b) | | | | | | | | | |
JPMorgan U.S. Government Money Market Fund Class IM Shares, 4.80% (a) (b) | | | | | | | | | |
| | | | | | | | | |
|
| Investment in an affiliated fund, which is registered under the Investment Company Act of 1940, as amended, and is advised by J.P. Morgan Investment Management Inc. |
| The rate shown is the current yield as of October 31, 2024. |
| Amount is included on the Statements of Operations as Income from securities lending (net) (after payments of rebates and Citibank’s fee). |
BetaBuilders U.S. Equity ETF |
For the year ended October 31, 2024 |
| | | | | Change in
Unrealized
Appreciation/
(Depreciation) | | | | Capital Gain
Distributions |
| | | | | | | | | |
JPMorgan Securities Lending Money Market Fund Agency SL Class Shares, 4.85% (b) (c) | | | | | | | | | |
JPMorgan U.S. Government Money Market Fund Class IM Shares, 4.80% (b) (c) | | | | | | | | | |
JPMorgan U.S. Government Money Market Fund Class IM Shares, 4.80% (b) (c) | | | | | | | | | |
| | | | | | | | | |
|
| Investment in affiliate. This security is included in an index in which the Fund, as an index fund, tracks. |
| Investment in an affiliated fund, which is registered under the Investment Company Act of 1940, as amended, and is advised by J.P. Morgan Investment Management Inc. |
| The rate shown is the current yield as of October 31, 2024. |
| Amount is included on the Statements of Operations as Income from securities lending (net) (after payments of rebates and Citibank’s fee). |
BetaBuilders U.S. Mid Cap Equity ETF |
For the year ended October 31, 2024 |
| | | | | Change in
Unrealized
Appreciation/
(Depreciation) | | | | Capital Gain
Distributions |
JPMorgan Securities Lending Money Market Fund Agency SL Class Shares, 4.85% (a) (b) | | | | | | | | | |
| J.P. Morgan Exchange-Traded Funds | |
BetaBuilders U.S. Mid Cap Equity ETF (continued) |
For the year ended October 31, 2024 |
| | | | | Change in Unrealized Appreciation/ (Depreciation) | | | | Capital Gain Distributions |
JPMorgan U.S. Government Money Market Fund Class IM Shares, 4.80% (a) (b) | | | | | | | | | |
JPMorgan U.S. Government Money Market Fund Class IM Shares, 4.80% (a) (b) | | | | | | | | | |
| | | | | | | | | |
|
| Investment in an affiliated fund, which is registered under the Investment Company Act of 1940, as amended, and is advised by J.P. Morgan Investment Management Inc. |
| The rate shown is the current yield as of October 31, 2024. |
| Amount is included on the Statements of Operations as Income from securities lending (net) (after payments of rebates and Citibank’s fee). |
BetaBuilders U.S. Small Cap Equity ETF |
For the year ended October 31, 2024 |
| | | | | Change in
Unrealized
Appreciation/
(Depreciation) | | | | Capital Gain
Distributions |
JPMorgan Securities Lending Money Market Fund Agency SL Class Shares, 4.85% (a) (b) | | | | | | | | | |
JPMorgan U.S. Government Money Market Fund Class IM Shares, 4.80% (a) (b) | | | | | | | | | |
JPMorgan U.S. Government Money Market Fund Class IM Shares, 4.80% (a) (b) | | | | | | | | | |
| | | | | | | | | |
|
| Investment in an affiliated fund, which is registered under the Investment Company Act of 1940, as amended, and is advised by J.P. Morgan Investment Management Inc. |
| The rate shown is the current yield as of October 31, 2024. |
| Amount is included on the Statements of Operations as Income from securities lending (net) (after payments of rebates and Citibank’s fee). |
| J.P. Morgan Exchange-Traded Funds | |
NOTES TO FINANCIAL STATEMENTSAS OF October 31, 2024 (continued)
Carbon Transition U.S. Equity ETF |
For the year ended October 31, 2024 |
| | | | | Change in
Unrealized
Appreciation/
(Depreciation) | | | | Capital Gain
Distributions |
JPMorgan U.S. Government Money Market Fund Class IM Shares, 4.80% (a) (b) | | | | | | | | | |
|
| Investment in an affiliated fund, which is registered under the Investment Company Act of 1940, as amended, and is advised by J.P. Morgan Investment Management Inc. |
| The rate shown is the current yield as of October 31, 2024. |
Emerging Markets Equity ETF |
For the year ended October 31, 2024 |
| | | | | Change in
Unrealized
Appreciation/
(Depreciation) | | | | Capital Gain
Distributions |
JPMorgan Securities Lending Money Market Fund Agency SL Class Shares, 4.85% (a) (b) | | | | | | | | | |
JPMorgan U.S. Government Money Market Fund Class IM Shares, 4.80% (a) (b) | | | | | | | | | |
JPMorgan U.S. Government Money Market Fund Class IM Shares, 4.80% (a) (b) | | | | | | | | | |
| | | | | | | | | |
|
| Investment in an affiliated fund, which is registered under the Investment Company Act of 1940, as amended, and is advised by J.P. Morgan Investment Management Inc. |
| The rate shown is the current yield as of October 31, 2024. |
| Amount is included on the Statements of Operations as Income from securities lending (net) (after payments of rebates and Citibank’s fee). |
|
For the year ended October 31, 2024 |
| | | | | Change in
Unrealized
Appreciation/
(Depreciation) | | | | Capital Gain
Distributions |
JPMorgan Prime Money Market Fund Class IM Shares, 4.90% (a) (b) | | | | | | | | | |
JPMorgan Securities Lending Money Market Fund Agency SL Class Shares, 4.85% (a) (b) | | | | | | | | | |
JPMorgan U.S. Government Money Market Fund Class IM Shares, 4.80% (a) (b) | | | | | | | | | |
| | | | | | | | | |
|
| Investment in an affiliated fund, which is registered under the Investment Company Act of 1940, as amended, and is advised by J.P. Morgan Investment Management Inc. |
| The rate shown is the current yield as of October 31, 2024. |
| Amount is included on the Statements of Operations as Income from securities lending (net) (after payments of rebates and Citibank’s fee). |
| J.P. Morgan Exchange-Traded Funds | |
|
For the year ended October 31, 2024 |
| | | | | Change in
Unrealized
Appreciation/
(Depreciation) | | | | Capital Gain
Distributions |
JPMorgan Securities Lending Money Market Fund Agency SL Class Shares, 4.85% (a) (b) | | | | | | | | | |
JPMorgan U.S. Government Money Market Fund Class IM Shares, 4.80% (a) (b) | | | | | | | | | |
JPMorgan U.S. Government Money Market Fund Class IM Shares, 4.80% (a) (b) | | | | | | | | | |
| | | | | | | | | |
|
| Investment in an affiliated fund, which is registered under the Investment Company Act of 1940, as amended, and is advised by J.P. Morgan Investment Management Inc. |
| The rate shown is the current yield as of October 31, 2024. |
| Amount is included on the Statements of Operations as Income from securities lending (net) (after payments of rebates and Citibank’s fee). |
|
For the year ended October 31, 2024 |
| | | | | Change in
Unrealized
Appreciation/
(Depreciation) | | | | Capital Gain
Distributions |
JPMorgan Securities Lending Money Market Fund Agency SL Class Shares, 4.85% (a) (b) | | | | | | | | | |
JPMorgan U.S. Government Money Market Fund Class IM Shares, 4.80% (a) (b) | | | | | | | | | |
JPMorgan U.S. Government Money Market Fund Class IM Shares, 4.80% (a) (b) | | | | | | | | | |
| | | | | | | | | |
|
| Investment in an affiliated fund, which is registered under the Investment Company Act of 1940, as amended, and is advised by J.P. Morgan Investment Management Inc. |
| The rate shown is the current yield as of October 31, 2024. |
| Amount is included on the Statements of Operations as Income from securities lending (net) (after payments of rebates and Citibank’s fee). |
U.S. Small Cap Equity ETF |
For the year ended October 31, 2024 |
| | | | | Change in
Unrealized
Appreciation/
(Depreciation) | | | | Capital Gain
Distributions |
JPMorgan Securities Lending Money Market Fund Agency SL Class Shares, 4.85% (a) (b) | | | | | | | | | |
| J.P. Morgan Exchange-Traded Funds | |
NOTES TO FINANCIAL STATEMENTSAS OF October 31, 2024 (continued)
U.S. Small Cap Equity ETF (continued) |
For the year ended October 31, 2024 |
| | | | | Change in Unrealized Appreciation/ (Depreciation) | | | | Capital Gain Distributions |
JPMorgan U.S. Government Money Market Fund Class IM Shares, 4.80% (a) (b) | | | | | | | | | |
JPMorgan U.S. Government Money Market Fund Class IM Shares, 4.80% (a) (b) | | | | | | | | | |
| | | | | | | | | |
|
| Investment in an affiliated fund, which is registered under the Investment Company Act of 1940, as amended, and is advised by J.P. Morgan Investment Management Inc. |
| The rate shown is the current yield as of October 31, 2024. |
| Amount is included on the Statements of Operations as Income from securities lending (net) (after payments of rebates and Citibank’s fee). |
|
For the year ended October 31, 2024 |
| | | | | Change in
Unrealized
Appreciation/
(Depreciation) | | | | Capital Gain
Distributions |
JPMorgan Securities Lending Money Market Fund Agency SL Class Shares, 4.85% (a) (b) | | | | | | | | | |
JPMorgan U.S. Government Money Market Fund Class IM Shares, 4.80% (a) (b) | | | | | | | | | |
JPMorgan U.S. Government Money Market Fund Class IM Shares, 4.80% (a) (b) | | | | | | | | | |
| | | | | | | | | |
|
| Investment in an affiliated fund, which is registered under the Investment Company Act of 1940, as amended, and is advised by J.P. Morgan Investment Management Inc. |
| The rate shown is the current yield as of October 31, 2024. |
| Amount is included on the Statements of Operations as Income from securities lending (net) (after payments of rebates and Citibank’s fee). |
|
For the year ended October 31, 2024 |
| | | | | Change in
Unrealized
Appreciation/
(Depreciation) | | | | Capital Gain
Distributions |
JPMorgan Securities Lending Money Market Fund Agency SL Class Shares, 4.85% (a) (b) | | | | | | | | | |
| J.P. Morgan Exchange-Traded Funds | |
U.S. Quality Factor ETF (continued) |
For the year ended October 31, 2024 |
| | | | | Change in Unrealized Appreciation/ (Depreciation) | | | | Capital Gain Distributions |
JPMorgan U.S. Government Money Market Fund Class IM Shares, 4.80% (a) (b) | | | | | | | | | |
JPMorgan U.S. Government Money Market Fund Class IM Shares, 4.80% (a) (b) | | | | | | | | | |
| | | | | | | | | |
|
| Investment in an affiliated fund, which is registered under the Investment Company Act of 1940, as amended, and is advised by J.P. Morgan Investment Management Inc. |
| The rate shown is the current yield as of October 31, 2024. |
| Amount is included on the Statements of Operations as Income from securities lending (net) (after payments of rebates and Citibank’s fee). |
|
For the year ended October 31, 2024 |
| | | | | Change in
Unrealized
Appreciation/
(Depreciation) | | | | Capital Gain
Distributions |
JPMorgan Securities Lending Money Market Fund Agency SL Class Shares, 4.85% (a) (b) | | | | | | | | | |
JPMorgan U.S. Government Money Market Fund Class IM Shares, 4.80% (a) (b) | | | | | | | | | |
JPMorgan U.S. Government Money Market Fund Class IM Shares, 4.80% (a) (b) | | | | | | | | | |
| | | | | | | | | |
|
| Investment in an affiliated fund, which is registered under the Investment Company Act of 1940, as amended, and is advised by J.P. Morgan Investment Management Inc. |
| The rate shown is the current yield as of October 31, 2024. |
| Amount is included on the Statements of Operations as Income from securities lending (net) (after payments of rebates and Citibank’s fee). |
E. Foreign Currency Translation — The books and records of the Funds are maintained in U.S. dollars. Foreign currency amounts are translated into U.S. dollars at the prevailing exchange rates of such currencies against the U.S. dollar. The market value of investment securities and other assets and liabilities are translated at the exchange rate as of the valuation date. Purchases and sales of investment securities, income and expenses are translated at the exchange rate prevailing on the respective dates of such transactions.
The Funds do not isolate the effect of changes in foreign exchange rates from changes in market prices on securities held. Accordingly, such changes are included within Change in net unrealized appreciation/depreciation on investments in non-affiliates on the Statements of Operations.
Reported realized foreign currency gains and losses arise from the disposition of foreign currency, currency gains or losses realized between the trade and settlement dates on securities transactions, and the difference between the amounts of dividends, interest and foreign withholding taxes recorded on each Fund's books on the transaction date and the U.S. dollar equivalent of the amounts actually received or paid. These reported realized foreign currency gains and losses are included in Net realized gain (loss) on foreign currency transactions on the Statements of Operations. Unrealized foreign currency gains and losses arise from changes (due to changes in exchange rates) in the value of foreign currency and other assets and liabilities denominated in foreign currencies, which are held at year end and are included in Change in net unrealized appreciation/depreciation on foreign currency translations on the Statements of Operations.
| J.P. Morgan Exchange-Traded Funds | |
NOTES TO FINANCIAL STATEMENTSAS OF October 31, 2024 (continued)
F. Futures Contracts— The Funds used index futures contracts to obtain long exposure to gain or reduce exposure to the stock market, to gain or reduce exposure to particular countries or regions, maintain liquidity, minimize transaction costs or to manage and hedge interest rate risk associated with portfolio investments.
Futures contracts provide for the delayed delivery of the underlying instrument at a fixed price or are settled for a cash amount based on the change in the value of the underlying instrument at a specific date in the future. Upon entering into a futures contract, the Funds are required to deposit with the broker, cash or securities in an amount equal to a certain percentage of the contract amount, which is referred to as the initial margin deposit. Subsequent payments, referred to as variation margin, are made or received by the Funds periodically and are based on changes in the market value of open futures contracts. Changes in the market value of open futures contracts are recorded as Change in net unrealized appreciation/depreciation on futures contracts on the Statements of Operations. Realized gains or losses, representing the difference between the value of the contract at the time it was opened and the value at the time it was closed, are reported on the Statements of Operations at the closing or expiration of the futures contract. Securities deposited as initial margin are designated on the SOIs, while cash deposited, which is considered restricted, is recorded on the Statements of Assets and Liabilities. A receivable from and/or a payable to brokers for the daily variation margin is also recorded on the Statements of Assets and Liabilities.
The use of futures contracts exposes the Funds to equity price risks. The Funds may be subject to the risk that the change in the value of the futures contract may not correlate perfectly with the underlying instrument. Use of long futures contracts subjects the Funds to risk of loss in excess of the amounts shown on the Statements of Assets and Liabilities, up to the notional amount of the futures contracts. Use of short futures contracts subjects the Funds to unlimited risk of loss. The Funds may enter into futures contracts only on exchanges or boards of trade. The exchange or board of trade acts as the counterparty to each futures transaction; therefore, the Funds' credit risk is limited to failure of the exchange or board of trade. Under some circumstances, futures exchanges may establish daily limits on the amount that the price of a futures contract can vary from the previous day’s settlement price, which could effectively prevent liquidation of positions.
The Funds' futures contracts are not subject to master netting arrangements (the right to close out all transactions traded with a counterparty and net amounts owed or due across transactions).
G. Forward Foreign Currency Exchange Contracts— Emerging Markets Equity ETF is exposed to foreign currency risks associated with some or all of their portfolio investments and used forward foreign currency exchange contracts to hedge or manage certain of these exposures as part of an investment strategy. The Fund also bought forward foreign currency exchange contracts to gain exposure to currencies. Forward foreign currency exchange contracts represent obligations to purchase or sell foreign currency on a specified future date at a price fixed at the time the contracts are entered into. Non-deliverable forward foreign currency exchange contracts are settled with the counterparty in U.S. dollars without the delivery of the foreign currency.
The values of the forward foreign currency exchange contracts are adjusted daily based on the applicable exchange rate of the underlying currency. Changes in the value of these contracts are recorded as unrealized appreciation or depreciation until the contract settlement date. When the forward foreign currency exchange contract is closed, the Fund records a realized gain or loss equal to the difference between the value at the time the contract was opened and the value at the time it was closed. The Fund also records a realized gain or loss, upon settlement, when a forward foreign currency exchange contract offsets another forward foreign currency exchange contract with the same counterparty.
The Fund’s forward foreign currency exchange contracts are subject to master netting arrangements (the right to close out all transactions with a counterparty and net amounts owed or due across transactions). The Fund may be required to post or receive collateral for non-deliverable forward foreign currency exchange contracts. As of October 31, 2024, the Fund did not receive or post collateral for forward foreign currency exchange contracts.
H. Summary of Derivatives Information—The following tables present the value of derivatives held as of October 31, 2024, by their primary underlying risk exposure and respective location on the Statements of Assets and Liabilities:
| | BetaBuilders
Developed
Asia Pacific
ex-Japan
ETF | BetaBuilders
Emerging Markets
Equity ETF | | BetaBuilders
International
Equity ETF | |
| | | | | | |
Unrealized Appreciation on Futures Contracts * | | | | | | |
Unrealized Depreciation on Futures Contracts * | | | | | | |
Net Fair Value of Derivative Contracts: | | | | | | |
Unrealized Appreciation (Depreciation) on Futures Contracts * | | | | | | |
| J.P. Morgan Exchange-Traded Funds | |
| BetaBuilders
U.S. Equity ETF | BetaBuilders U.S.
Mid Cap Equity
ETF | BetaBuilders U.S.
Small Cap
Equity ETF | Emerging
Markets
Equity ETF | |
| | | | | |
Unrealized Appreciation on Futures Contracts * | | | | | |
Unrealized Depreciation on Futures Contracts * | | | | | |
Net Fair Value of Derivative Contracts: | | | | | |
Unrealized Appreciation (Depreciation) on Futures Contracts * | | | | | |
| | | | | | |
| | | | | | |
Unrealized Appreciation on Futures Contracts * | | | | | | |
Unrealized Depreciation on Futures Contracts * | | | | | | |
Net Fair Value of Derivative Contracts: | | | | | | |
Unrealized Appreciation (Depreciation) on Futures Contracts * | | | | | | |
|
| Includes cumulative appreciation/(depreciation) on futures contracts, if any, as reported on the SOIs. Only current day’s variation margin is reported within the Statements of Assets and Liabilities. |
The following tables present the effect of derivatives on the Statements of Operations for the year ended October 31, 2024, by primary underlying risk exposure:
| | BetaBuilders
Developed
Asia Pacific
ex-Japan
ETF | BetaBuilders
Emerging Markets
Equity ETF | | BetaBuilders
International
Equity ETF | |
Realized Gain (Loss) on Derivatives Recognized as a Result From Operations: |
|
| | | | | | |
Net Change in Unrealized Appreciation (Depreciation) on Derivatives Recognized as a Result of Operations: |
|
| | | | | | |
| BetaBuilders
U.S. Equity ETF | BetaBuilders U.S.
Mid Cap Equity
ETF | BetaBuilders U.S.
Small Cap
Equity ETF | Carbon
Transition U.S.
Equity ETF | Emerging
Markets
Equity ETF | |
Realized Gain (Loss) on Derivatives Recognized as a Result From Operations: |
|
| | | | | | |
Foreign Exchange Rate Risk Exposure: |
Forward Foreign Currency Exchange Contracts | | | | | | |
Net Change in Unrealized Appreciation (Depreciation) on Derivatives Recognized as a Result of Operations: |
|
| | | | | | |
| J.P. Morgan Exchange-Traded Funds | |
NOTES TO FINANCIAL STATEMENTSAS OF October 31, 2024 (continued)
| | | | | | |
Realized Gain (Loss) on Derivatives Recognized as a Result From Operations: |
|
| | | | | | |
Net Change in Unrealized Appreciation (Depreciation) on Derivatives Recognized as a Result of Operations: |
|
| | | | | | |
The table below discloses the volume of the Funds' futures contracts and forward foreign currency exchange contracts activity during the year ended October 31, 2024. Please refer to the tables in the Summary of Derivatives Information for derivative-related gains and losses associated with volume activity:
| | BetaBuilders
Developed
Asia Pacific
ex-Japan
ETF | BetaBuilders
Emerging Markets
Equity ETF | |
| | | | |
Average Notional Balance Long | | | | |
Ending Notional Balance Long | | | | |
| BetaBuilders
International
Equity ETF | | BetaBuilders
U.S. Equity ETF | BetaBuilders U.S.
Mid Cap Equity
ETF |
| | | | |
Average Notional Balance Long | | | | |
Ending Notional Balance Long | | | | |
| BetaBuilders U.S.
Small Cap
Equity ETF | Carbon
Transition U.S.
Equity ETF | Emerging
Markets
Equity ETF | |
| | | | |
Average Notional Balance Long | | | | |
Ending Notional Balance Long | | | | |
Forward Foreign Currency Exchange Contracts: | | | | |
Average Settlement Value Purchased | | | | |
| | | | |
| | | | |
Average Notional Balance Long | | | | |
Ending Notional Balance Long | | | | |
| | |
| | |
Average Notional Balance Long | | |
Ending Notional Balance Long | | |
I. Security Transactions and Investment Income— Investment transactions are accounted for on the trade date (the date the order to buy or sell is executed). Securities gains and losses are calculated on a specifically identified cost basis.
Dividend income, net of foreign taxes withheld, if any, is recorded on the ex-dividend date or when a Fund first learns of the dividend.
| J.P. Morgan Exchange-Traded Funds | |
To the extent such information is publicly available, the Funds record distributions received in excess of income earned from underlying investments as a reduction of cost of investments and/or realized gain. Such amounts are based on estimates if actual amounts are not available and actual amounts of income, realized gain and return of capital may differ from the estimated amounts. The Funds adjust the estimated amounts of the components of distributions (and consequently their net investment income) as necessary, once the issuers provide information about the actual composition of the distributions.
J. Federal Income Taxes— Each Fund is treated as a separate taxable entity for Federal income tax purposes. Each Fund's policy is to comply with the provisions of the Internal Revenue Code (the “Code”) applicable to regulated investment companies and to distribute to shareholders all of its distributable net investment income and net realized capital gains on investments. Accordingly, no provision for Federal income tax is necessary. Management has reviewed the Funds' tax positions for all open tax years and has determined that as of October 31, 2024, no liability for Federal income tax is required in the Funds' financial statements for net unrecognized tax benefits. However, management’s conclusions may be subject to future review based on changes in, or the interpretation of, the accounting standards or tax laws and regulations. Each Fund's Federal tax returns for the prior three fiscal years, or since inception if shorter, remain subject to examination by the Internal Revenue Service.
K. Foreign Taxes—The Funds may be subject to foreign taxes on income, gains on investments or currency purchases/repatriation, a portion of which may be recoverable. The Funds will accrue such taxes and recoveries as applicable, based upon their current interpretation of tax rules and regulations that exist in the markets in which they invest. When a capital gains tax is determined to apply, the Funds record an estimated deferred tax liability in an amount that would be payable if the securities were disposed of on the valuation date.
L. Distributions to Shareholders— Distributions from net investment income, if any, are generally declared and paid at least quarterly, except for BetaBuilders Japan ETF, for which distributions are generally declared and paid at least annually. Net realized capital gains, if any, are distributed by each Fund at least annually. The amount of distributions from net investment income and net realized capital gains is determined in accordance with Federal income tax regulations, which may differ from GAAP. To the extent these “book/tax” differences are permanent in nature (i.e., that they result from other than timing of recognition — “temporary differences”), such amounts are reclassified within the capital accounts based on their Federal tax basis treatment.
The following amounts were reclassified within the capital accounts:
| | Accumulated
undistributed
(distributions in
excess of)
net investment
income | Accumulated
net realized
gains (losses) |
| | | |
BetaBuilders Developed Asia Pacific ex-Japan ETF | | | |
BetaBuilders Emerging Markets Equity ETF | | | |
| | | |
BetaBuilders International Equity ETF | | | |
| | | |
BetaBuilders U.S. Equity ETF | | | |
BetaBuilders U.S. Mid Cap Equity ETF | | | |
BetaBuilders U.S. Small Cap Equity ETF | | | |
Carbon Transition U.S. Equity ETF | | | |
Emerging Markets Equity ETF | | | |
| | | |
| | | |
| | | |
U.S. Small Cap Equity ETF | | | |
| | | |
| | | |
| | | |
The reclassifications for the Funds relate primarily to tax adjustments on certain investments, foreign currency gains or losses, foreign taxes and redemptions in-kind.
| J.P. Morgan Exchange-Traded Funds | |
NOTES TO FINANCIAL STATEMENTSAS OF October 31, 2024 (continued)
3. Fees and Other Transactions with Affiliates
A. Management Fee—JPMIM manages the investments of each Fund pursuant to a Management Agreement. For such services, JPMIM is paid a fee which is accrued daily and paid no more frequently than monthly based on each Fund's respective average daily net assets at the following rate:
| |
| |
BetaBuilders Developed Asia Pacific ex-Japan ETF | |
BetaBuilders Emerging Markets Equity ETF | |
| |
BetaBuilders International Equity ETF | |
| |
BetaBuilders U.S. Equity ETF | |
BetaBuilders U.S. Mid Cap Equity ETF | |
BetaBuilders U.S. Small Cap Equity ETF | |
Carbon Transition U.S. Equity ETF | |
Emerging Markets Equity ETF | |
| |
| |
| |
U.S. Small Cap Equity ETF | |
| |
| |
| |
Under each Management Agreement, JPMIM is responsible for substantially all expenses of each Fund, (including expenses of the Trust relating to each Fund), except for the management fees, payments under the Funds' 12b-1 plan (if any), interest expenses, dividend and interest expenses related to short sales, taxes, acquired fund fees and expenses (other than fees for funds advised by the Adviser and/or its affiliates), costs of holding shareholder meetings, and litigation and potential litigation and other extraordinary expenses not incurred in the ordinary course of each Fund’s business. Additionally, each Fund is responsible for its non-operating expenses, including brokerage commissions and fees and expenses associated with each Fund’s securities lending program, if applicable. For the avoidance of doubt, the Adviser’s payment of such expenses may be accomplished through a Fund’s payment of such expenses and a corresponding reduction in the fee payable to the Adviser, provided, however, that if the amount of expenses paid by a Fund exceeds the fee payable to the Adviser, the Adviser will reimburse that Fund for such amount.
B. Administration Fee— JPMIM provides administration services to the Funds. Pursuant to each Management Agreement, JPMIM is compensated as described in Note 3.A.
JPMorgan Chase Bank, N.A. (“JPMCB”), a wholly-owned subsidiary of JPMorgan, serves as the Funds' sub-administrator (the “Sub-administrator”). For its services as Sub-administrator, JPMCB receives a portion of the management fees payable to JPMIM.
C. Custodian, Accounting and Transfer Agent Fees— JPMCB provides custody, accounting and transfer agency services to the Funds. For performing these services, JPMIM pays JPMCB transaction and asset-based fees that vary according to the number of transactions and positions, plus out-of-pocket expenses.
Additionally, Authorized Participants generally pay transaction fees associated with the creation and redemption of Fund shares. These fees are paid to JPMIM to offset certain custodian charges that are covered by each Management Agreement.
Interest income earned on cash balances at the custodian, if any, is included in Interest income from affiliates on the Statements of Operations.
Interest expense paid to the custodian related to cash overdrafts, if any, is included in Interest expense to affiliates on the Statements of Operations.
| J.P. Morgan Exchange-Traded Funds | |
D. Distribution Services— The Distributor or its agent distributes Creation Units for each Fund on an agency basis. The Distributor does not maintain a secondary market in shares of each Fund. JPMDS receives no fees for their distribution services under the distribution agreement with the Trust (the “Distribution Agreement”). Although the Trust does not pay any fees under the Distribution Agreement, JPMIM pays JPMDS for certain distribution related services.
E. Waivers and Reimbursements— The Funds may invest in one or more money market funds advised by the Adviser (affiliated money market funds). The fees for the affiliated money market funds, except for investments of securities lending cash collateral, are covered under each Management Agreement as described in Note 3.A.
F. Other— Certain officers of the Trust are affiliated with the Adviser, the Administrator and JPMDS. Such officers receive no compensation from the Funds for serving in their respective roles.
The Board designated and appointed a Chief Compliance Officer to the Funds pursuant to Rule 38a-1 under the 1940 Act. The fees associated with the office of the Chief Compliance Officer are paid for by JPMIM as described in Note 3.A.
The SEC has granted an exemptive order permitting the Funds to engage in principal transactions with J.P. Morgan Securities LLC, an affiliated broker, involving taxable money market instruments, subject to certain conditions.
4. Investment Transactions
During the year ended October 31, 2024, purchases and sales of investments (excluding short-term investments) were as follows:
| Purchases
(excluding
U.S. Government) | Sales
(excluding
U.S. Government) |
| | |
BetaBuilders Developed Asia Pacific ex-Japan ETF | | |
BetaBuilders Emerging Markets Equity ETF | | |
| | |
BetaBuilders International Equity ETF | | |
| | |
BetaBuilders U.S. Equity ETF | | |
BetaBuilders U.S. Mid Cap Equity ETF | | |
BetaBuilders U.S. Small Cap Equity ETF | | |
Carbon Transition U.S. Equity ETF | | |
Emerging Markets Equity ETF | | |
| | |
| | |
| | |
U.S. Small Cap Equity ETF | | |
| | |
| | |
| | |
During the year ended October 31, 2024, there were no purchases or sales of U.S. Government securities.
For the year ended October 31, 2024, in-kind transactions associated with creations and redemptions were as follows:
| | |
| | |
BetaBuilders Developed Asia Pacific ex-Japan ETF | | |
BetaBuilders Emerging Markets Equity ETF | | |
| | |
BetaBuilders International Equity ETF | | |
| | |
BetaBuilders U.S. Equity ETF | | |
BetaBuilders U.S. Mid Cap Equity ETF | | |
BetaBuilders U.S. Small Cap Equity ETF | | |
| J.P. Morgan Exchange-Traded Funds | |
NOTES TO FINANCIAL STATEMENTSAS OF October 31, 2024 (continued)
| | |
Carbon Transition U.S. Equity ETF | | |
Emerging Markets Equity ETF | | |
| | |
| | |
| | |
U.S. Small Cap Equity ETF | | |
| | |
| | |
| | |
During the year ended October 31, 2024, the Funds delivered portfolio securities for the redemption of Fund shares (in-kind redemptions). Cash and portfolio securities were transferred for redemptions at fair value. For financial reporting purposes, the Funds recorded net realized gains and losses in connection with each in-kind redemption transaction.
5. Federal Income Tax Matters
For Federal income tax purposes, the estimated cost and unrealized appreciation (depreciation) in value of investments held at October 31, 2024 were as follows:
| | Gross
Unrealized
Appreciation | Gross
Unrealized
Depreciation | Net Unrealized
Appreciation
(Depreciation) |
| | | | |
BetaBuilders Developed Asia Pacific ex-Japan ETF | | | | |
BetaBuilders Emerging Markets Equity ETF | | | | |
| | | | |
BetaBuilders International Equity ETF | | | | |
| | | | |
BetaBuilders U.S. Equity ETF | | | | |
BetaBuilders U.S. Mid Cap Equity ETF | | | | |
BetaBuilders U.S. Small Cap Equity ETF | | | | |
Carbon Transition U.S. Equity ETF | | | | |
Emerging Markets Equity ETF | | | | |
| | | | |
| | | | |
| | | | |
U.S. Small Cap Equity ETF | | | | |
| | | | |
| | | | |
| | | | |
The difference between book and tax basis appreciation (depreciation) on investments is primarily attributed to tax adjustments on certain investments, certain derivatives and wash sale loss deferrals.
| J.P. Morgan Exchange-Traded Funds | |
The tax character of distributions paid during the year ended October 31, 2024 was as follows:
| | |
| | |
BetaBuilders Developed Asia Pacific ex-Japan ETF | | |
BetaBuilders Emerging Markets Equity ETF | | |
| | |
BetaBuilders International Equity ETF | | |
| | |
BetaBuilders U.S. Equity ETF | | |
BetaBuilders U.S. Mid Cap Equity ETF | | |
BetaBuilders U.S. Small Cap Equity ETF | | |
Carbon Transition U.S. Equity ETF | | |
Emerging Markets Equity ETF | | |
| | |
| | |
| | |
U.S. Small Cap Equity ETF | | |
| | |
| | |
| | |
|
| Short-term gain distributions are treated as ordinary income for income tax purposes. |
The tax character of distributions paid during the year ended October 31, 2023 was as follows:
| | |
| | |
BetaBuilders Developed Asia Pacific ex-Japan ETF | | |
BetaBuilders Emerging Markets Equity ETF | | |
| | |
BetaBuilders International Equity ETF | | |
| | |
BetaBuilders U.S. Equity ETF | | |
BetaBuilders U.S. Mid Cap Equity ETF | | |
BetaBuilders U.S. Small Cap Equity ETF | | |
Carbon Transition U.S. Equity ETF | | |
Emerging Markets Equity ETF | | |
| | |
| | |
| | |
U.S. Small Cap Equity ETF | | |
| | |
| | |
| | |
|
| Short-term gain distributions are treated as ordinary income for income tax purposes. |
| J.P. Morgan Exchange-Traded Funds | |
NOTES TO FINANCIAL STATEMENTSAS OF October 31, 2024 (continued)
As of October 31, 2024, the estimated components of net assets (excluding paid-in-capital) on a tax basis were as follows:
| Current
Distributable
Ordinary
Income | Current
Distributable
Long-Term
Capital Gain
(Tax Basis Capital
Loss Carryover) | Unrealized
Appreciation
(Depreciation) |
| | | |
BetaBuilders Developed Asia Pacific ex-Japan ETF | | | |
BetaBuilders Emerging Markets Equity ETF | | | |
| | | |
BetaBuilders International Equity ETF | | | |
| | | |
BetaBuilders U.S. Equity ETF | | | |
BetaBuilders U.S. Mid Cap Equity ETF | | | |
BetaBuilders U.S. Small Cap Equity ETF | | | |
Carbon Transition U.S. Equity ETF | | | |
Emerging Markets Equity ETF | | | |
| | | |
| | | |
| | | |
U.S. Small Cap Equity ETF | | | |
| | | |
| | | |
| | | |
| | | |
The cumulative timing differences primarily consist of tax adjustments on certain investments, trustee deferred compensation and wash sale loss deferrals.
| J.P. Morgan Exchange-Traded Funds | |
As of October 31, 2024, the following Funds had net capital loss carryforwards, which are available to offset future realized gains:
| Capital Loss Carryforward Character |
| | |
| | |
BetaBuilders Developed Asia Pacific ex-Japan ETF | | |
BetaBuilders Emerging Markets Equity ETF | | |
| | |
BetaBuilders International Equity ETF | | |
| | |
BetaBuilders U.S. Equity ETF | | |
BetaBuilders U.S. Mid Cap Equity ETF | | |
BetaBuilders U.S. Small Cap Equity ETF | | |
Carbon Transition U.S. Equity ETF | | |
Emerging Markets Equity ETF | | |
| | |
| | |
| | |
U.S. Small Cap Equity ETF | | |
| | |
| | |
| | |
|
| Amount includes capital loss carryforwards which are limited in future years under Internal Revenue Code sections 381-384. |
As of October 31, 2024, the following Funds utilized net capital loss carryforwards as follows:
| |
| | |
| | |
BetaBuilders Developed Asia Pacific ex-Japan ETF | | |
BetaBuilders Emerging Markets Equity ETF | | |
BetaBuilders U.S. Equity ETF | | |
| | |
| | |
U.S. Small Cap Equity ETF | | |
| | |
6. Capital Share Transactions
The Trust issues and redeems shares of the Funds only in Creation Units through the Distributor at NAV. Capital shares transactions detail can be found in the Statements of Changes in Net Assets.
Shares of the Funds may only be purchased or redeemed by Authorized Participants. Such Authorized Participants may from time to time hold, of record or beneficially, a substantial percentage of the Funds' shares outstanding and act as executing or clearing broker for investment transactions on behalf of the Funds. An Authorized Participant is either (1) a “Participating Party” or other participant in the clearing process through the Continuous Net Settlement System of the National Securities Clearing Corporation (“NSCC”); or (2) a DTC Participant; which, in either case, must have executed an agreement with the Distributor.
Creation Units of a Fund may be created in advance of receipt by the Trust of all or a portion of the applicable basket of equity securities and other instruments (“Deposit Instruments”) and cash as described in the Funds’ registration statement. In these instances, the initial Deposit Instruments and cash must be deposited in an amount equal to the sum of the cash amount, plus at least 105% for BetaBuilders Canada ETF, BetaBuilders Developed Asia Pacific ex-Japan ETF, BetaBuilders Europe ETF, BetaBuilders International Equity ETF, BetaBuilders Japan ETF, BetaBuilders U.S. Small Cap Equity ETF, Carbon Transition U.S. Equity ETF and International Equity ETF, and plus at least 110% for Emerging Markets Equity ETF of the market
| J.P. Morgan Exchange-Traded Funds | |
NOTES TO FINANCIAL STATEMENTSAS OF October 31, 2024 (continued)
value of undelivered Deposit Instruments. A transaction fee may be imposed to offset transfer and other transaction costs associated with the purchase or redemption of Creation Units.
Effective November 1, 2022, the Funds rely upon an exemptive order granted by the SEC (the “Order”) permitting the establishment and operation of an Interfund Lending Facility (the “Facility”). The Facility allows the Funds to directly lend and borrow money to or from any other fund relying upon the Order at rates beneficial to both the borrowing and lending funds. Advances under the Facility are taken primarily for temporary or emergency purposes, including the meeting of redemption requests that otherwise might require the untimely disposition of securities, and are subject to each Fund's borrowing restrictions. The interfund loan rate is determined, as specified in the Order, by averaging the current repurchase agreement rate and the current bank loan rate. The Order was granted to JPMorgan Trust II and may be relied upon by the Funds because the Funds and the series of JPMorgan Trust II are all investment companies in the same “group of investment companies” (as defined in Section 12(d)(1)(G) of the 1940 Act).
The Funds had no borrowings outstanding from another fund, or loans outstanding to another fund at October 31, 2024. Average borrowings from the Facility during the year ended October 31, 2024 were as follows:
| | | | |
BetaBuilders Developed Asia Pacific ex-Japan ETF | | | | |
| | | | |
The Trust and JPMCB have entered into a financing arrangement. Under this arrangement, JPMCB provides an unsecured, uncommitted credit facility in the aggregate amount of $100 million to certain of the J.P. Morgan Funds, including the Funds. Advances under the arrangement are taken primarily for temporary or emergency purposes, including the meeting of redemption requests that otherwise might require the untimely disposition of securities, and are subject to each Fund's borrowing restrictions. Interest on borrowings is payable at a rate determined by JPMCB at the time of borrowing. This agreement has been extended until October 28, 2025.
The Funds had no borrowings outstanding from the unsecured, uncommitted credit facility during the year ended October 31, 2024.
Effective August 8, 2023, the Trust, along with certain other trusts for J.P. Morgan Funds (“Borrowers”), has entered into an existing joint syndicated senior unsecured revolving credit facility totaling $1.5 billion (“Credit Facility”) with various lenders and The Bank of New York Mellon, as administrative agent for the lenders. Although the Trust is effectively part of the Credit Facility as of August 8, 2023, it was not eligible to draw on the Credit Facility, and did not incur costs associated with being a part of the Credit Facility up through May 30, 2024.
This Credit Facility provides a source of funds to the Borrowers for temporary and emergency purposes, including the meeting of redemption requests that otherwise might require the untimely disposition of securities. Under the terms of the Credit Facility, a borrowing fund must have a minimum of $25 million in adjusted net asset value and not exceed certain adjusted net asset coverage ratios prior to and during the time in which any borrowings are outstanding. If a fund does not comply with the aforementioned requirements, the fund must remediate within three business days with respect to the $25 million minimum adjusted net asset value or within one business day with respect to certain asset coverage ratios or the administrative agent at the request of, or with the consent of, the lenders may terminate the Credit Facility and declare any outstanding borrowings to be due and payable immediately.
Interest associated with any borrowing under the Credit Facility is charged to the borrowing fund at a rate of interest equal to 1.00%, plus the greater of the federal funds effective rate or the one-month Adjusted Secured Overnight Financing Rate (SOFR).
The Funds did not utilize the Credit Facility during the period November 1, 2023 through May 30, 2024.
Effective May 31, 2024, the Funds are no longer part of the Credit Facility.
8. Risks, Concentrations and Indemnifications
In the normal course of business, the Funds enter into contracts that contain a variety of representations which provide general indemnifications. Each Fund's maximum exposure under these arrangements is unknown. The amount of exposure would depend on future claims that may be brought against each Fund. However, based on experience, the Funds expect the risk of loss to be remote.
| J.P. Morgan Exchange-Traded Funds | |
As of October 31, 2024, JPMorgan SmartRetirement Funds and JPMorgan SmartRetirement Blend Funds, which are affiliated fund of funds, each owned in the aggregate, shares representing more than 10% of the net assets of the Funds as follows:
| JPMorgan
SmartRetirement
Funds | JPMorgan
SmartRetirement
Blend Funds |
BetaBuilders Emerging Markets Equity ETF | | |
BetaBuilders International Equity ETF | | |
BetaBuilders U.S. Mid Cap Equity ETF | | |
BetaBuilders U.S. Small Cap Equity ETF | | |
Significant shareholder transactions by these shareholders may impact the Funds' performance and liquidity.
Significant shareholder transactions by the Adviser may impact the Funds' performance and liquidity.
BetaBuilders Canada ETF, BetaBuilders Developed Asia Pacific ex-Japan ETF, BetaBuilders Emerging Markets Equity ETF, BetaBuilders Europe ETF, BetaBuilders International Equity ETF, BetaBuilders Japan ETF, Emerging Markets Equity ETF and International Equity ETF may have elements of risk not typically associated with investments in the United States of America due to concentrated investments in a limited number of foreign countries or regions, which may vary throughout the period. Such concentrations may subject each of these Funds to additional risks resulting from political or economic conditions in such countries or regions and the possible imposition of adverse governmental laws or currency exchange restrictions could cause the securities and their markets to be less liquid and their prices to be more volatile than those of comparable U.S. securities.
Investing in securities of foreign countries may include certain risks and considerations not typically associated with investing in U.S. securities. These risks include revaluation of currencies, high rates of inflation, repatriation restrictions on income and currencies, and future and adverse political, social and economic developments.
As of October 31, 2024, the following Funds had non-U.S. country allocations representing greater than 10% of total investments (excluding investment of cash collateral from securities loaned) as follows:
| | BetaBuilders
Developed
Asia Pacific
ex-Japan
ETF | BetaBuilders
Emerging Markets
Equity ETF | | BetaBuilders
International
Equity ETF | | Emerging
Markets
Equity ETF | |
| | | | | | | | |
| | | | | | | | |
| | | | | | | | |
| | | | | | | | |
| | | | | | | | |
| | | | | | | | |
| | | | | | | | |
| | | | | | | | |
| | | | | | | | |
| | | | | | | | |
| | | | | | | | |
As of October 31, 2024, a significant portion of the investments of the BetaBuilders Canada ETF, BetaBuilders Developed Asia Pacific ex-Japan ETF, BetaBuilders Europe ETF, BetaBuilders International Equity ETF, BetaBuilders Japan ETF, Emerging Markets Equity ETF and International Equity ETF consisted of securities that were denominated in foreign currencies. Changes in currency exchange rates will affect the value of, and investment income from, such securities.
Derivatives may be riskier than other types of investments because they may be more sensitive to changes in economic and market conditions and could result in losses that significantly exceed the Funds’ original investment. Many derivatives create leverage thereby causing the Funds to be more volatile than they would have been if they had not used derivatives. Derivatives also expose the Funds to counterparty risk (the risk that the derivative counterparty will not fulfill its contractual obligations), including credit risk of the derivative counterparty. The possible lack of a liquid secondary market for derivatives and the resulting inability of the Funds to sell or otherwise close a derivatives position could expose the Funds to losses and could make derivatives more difficult for the Funds to value accurately.
| J.P. Morgan Exchange-Traded Funds | |
NOTES TO FINANCIAL STATEMENTSAS OF October 31, 2024 (continued)
Disruptions to creations and redemptions, the existence of significant market volatility or potential lack of an active trading market for the shares (including through a trading halt), as well as other factors, may result in shares trading significantly above (at a premium) or below (at a discount) to the NAV or to the intraday value of the Funds’ holdings. During such periods, investors may incur significant losses if shares are sold.
The Funds may not track the return of their underlying index for a number of reasons and therefore may not achieve their investment objective. For example, the Funds incur a number of operating expenses not applicable to their underlying index, and incur costs in buying and selling securities, especially when rebalancing the Funds’ securities holdings to reflect changes in the composition of the underlying index. In addition, each Fund’s return may differ from the return of its underlying index as a result of, among other things, pricing differences and the inability to purchase certain securities included in the underlying index due to regulatory or other restrictions. To the extent of the previously outlined items, each Fund’s return may differ from the return of the underlying index.
BetaBuilders Canada ETF, BetaBuilders Developed Asia Pacific ex-Japan ETF, BetaBuilders Emerging Markets Equity ETF, BetaBuilders Europe ETF, BetaBuilders International Equity ETF, BetaBuilders Japan ETF, Emerging Markets Equity ETF and International Equity ETF invest in foreign issuers and foreign securities (including depositary receipts) that are subject to additional risks, including political and economic risks, unstable governments, civil conflicts and war, greater volatility, decreased market liquidity, expropriation and nationalization risks, sanctions or other measures by the United States or other governments, currency fluctuations, higher transaction costs, delayed settlement, possible foreign controls on investment and less stringent investor protection and disclosure standards of foreign markets. In certain markets where securities and other instruments are not traded “delivery versus payment,” a Fund may not receive timely payment for securities or other instruments it has delivered or receive delivery of securities paid for and may be subject to increased risk that the counterparty will fail to make payments or delivery when due or default completely. Foreign market trading hours, clearance and settlement procedures, and holiday schedules may limit the Funds' ability to buy and sell securities.
Events and evolving conditions in certain economies or markets may alter the risks associated with investments tied to countries or regions that historically were perceived as comparatively stable becoming riskier and more volatile. Diversified Return Emerging Markets Equity ETF invests a substantial portion of its assets in emerging market countries. These risks are magnified in countries in emerging markets. Emerging market countries typically have less-established market economies than developed countries and may face greater social, economic, regulatory and political uncertainties. In addition, emerging markets typically present greater illiquidity and price volatility concerns due to smaller or limited local capital markets and greater difficulty in determining market valuations of securities due to limited public information on issuers. Certain emerging market countries may be subject to less stringent requirements regarding accounting, auditing, financial reporting and record keeping and therefore, material information related to an investment may not be available or reliable.
Additionally, the Funds may have substantial difficulties exercising their legal rights or enforcing a counterparty’s legal obligations in certain jurisdictions outside of the United States, in particular in emerging market countries, which can increase the risks of loss.
The Funds are subject to infectious disease epidemics/pandemics risk. The effects of any future pandemic or other global event to public health and business and market conditions, may have a significant negative impact on the performance of a Fund's investments, increase a Fund's volatility, negatively impact a Fund’s arbitrage and pricing mechanisms, exacerbate pre-existing political, social and economic risks to the Funds, and negatively impact broad segments of businesses and populations. In addition, governments, their regulatory agencies, or self-regulatory organizations have taken or may take actions in response to a pandemic or other global event that affect the instruments in which the Funds invest, or the issuers of such instruments, in ways that could have a significant negative impact on a Fund’s investment performance. The ultimate impact of any pandemic or other global event and the extent to which the associated conditions and governmental responses impact a Fund will also depend on future developments, which are highly uncertain, difficult to accurately predict and subject to frequent changes.
Subsequent to October 31, 2024, BetaBuilders Europe ETF had net redemptions of $2,717,559,916, which represented 41% of the Fund’s net assets as of October 31, 2024.
| J.P. Morgan Exchange-Traded Funds | |
REPORT OF INDEPENDENT REGISTERED PUBLIC ACCOUNTING FIRM
To the Board of Trustees of J.P. Morgan Exchange-Traded Fund Trust and Shareholders of each of the eighteen funds listed in the table below
Opinions on the Financial Statements
We have audited the accompanying statements of assets and liabilities, including the schedules of portfolio investments, of each of the funds listed in the table below (eighteen of the funds constituting J.P. Morgan Exchange-Traded Fund Trust, hereafter collectively referred to as the "Funds") as of October 31, 2024, the related statements of operations and of changes in net assets for each of the periods indicated in the table below, including the related notes, and the financial highlights for each of the periods indicated therein (collectively referred to as the “financial statements”). In our opinion, the financial statements present fairly, in all material respects, the financial position of each of the Funds listed in the table below as of October 31, 2024, the results of each of their operations and the changes in each of their net assets for the periods indicated in the table below, and each of the financial highlights for each of the periods indicated therein, in conformity with accounting principles generally accepted in the United States of America.
JPMorgan BetaBuilders Canada ETF (1) |
JPMorgan BetaBuilders Developed Asia Pacific ex-Japan ETF (1) |
JPMorgan BetaBuilders Emerging Markets Equity ETF (2) |
JPMorgan BetaBuilders Europe ETF (1) |
JPMorgan BetaBuilders International Equity ETF (1) |
JPMorgan BetaBuilders Japan ETF (1) |
JPMorgan BetaBuilders U.S. Equity ETF (1) |
JPMorgan BetaBuilders U.S. Mid Cap Equity ETF (1) |
JPMorgan BetaBuilders U.S. Small Cap Equity ETF (1) |
JPMorgan Carbon Transition U.S. Equity ETF (1) |
JPMorgan Diversified Return Emerging Markets Equity ETF (1) |
JPMorgan Diversified Return International Equity ETF (1) |
JPMorgan Diversified Return U.S. Equity ETF (1) |
JPMorgan Diversified Return U.S. Mid Cap Equity ETF (1) |
JPMorgan Diversified Return U.S. Small Cap Equity ETF (1) |
JPMorgan U.S. Momentum Factor ETF (1) |
JPMorgan U.S. Quality Factor ETF (1) |
JPMorgan U.S. Value Factor ETF (1) |
| Statement of operations for the year ended October 31, 2024 and statement of changes in net assets for the years ended October 31, 2024 and 2023. |
| Statement of operations for the year ended October 31, 2024 and statement of changes in net assets for the year ended October 31, 2024 and the period May 10, 2023 (commencement of operations) through October 31, 2023. |
These financial statements are the responsibility of the Funds’ management. Our responsibility is to express an opinion on the Funds’ financial statements based on our audits. We are a public accounting firm registered with the Public Company Accounting Oversight Board (United States) (PCAOB) and are required to be independent with respect to the Funds in accordance with the U.S. federal securities laws and the applicable rules and regulations of the Securities and Exchange Commission and the PCAOB.
We conducted our audits of these financial statements in accordance with the standards of the PCAOB. Those standards require that we plan and perform the audit to obtain reasonable assurance about whether the financial statements are free of material misstatement, whether due to error or fraud.
Our audits included performing procedures to assess the risks of material misstatement of the financial statements, whether due to error or fraud, and performing procedures that respond to those risks. Such procedures included examining, on a test basis, evidence regarding the amounts and disclosures in the financial statements. Our audits also included evaluating the accounting principles used and significant estimates made by management, as well as evaluating the overall presentation of the financial statements. Our procedures included confirmation of securities owned as of October 31, 2024 by correspondence with the custodian, transfer agents
| J.P. Morgan Exchange-Traded Funds | |
REPORT OF INDEPENDENT REGISTERED PUBLIC ACCOUNTING FIRM
and brokers; when replies were not received from brokers, we performed other auditing procedures. We believe that our audits provide a reasonable basis for our opinions.
/s/ PricewaterhouseCoopers LLP
New York, New York
December 23, 2024
We have served as the auditor of one or more investment companies in the JPMorgan Funds complex since 1993.
| J.P. Morgan Exchange-Traded Funds | |
Certain tax information for the J.P. Morgan Funds is required to be provided to shareholders based upon the Funds' income and distributions for the taxable year ended October 31, 2024. The information and distributions reported in this letter may differ from the information and taxable distributions reported to the shareholders for the calendar year ending December 31, 2024. The information necessary to complete your income tax returns for the calendar year ending December 31, 2024 will be provided under separate cover.
Dividends Received Deduction (DRD)
Each Fund listed below had the following percentage, or maximum allowable percentage, of ordinary income distributions eligible for the dividends received deduction for corporate shareholders for the fiscal year ended October 31, 2024:
| Dividends
Received
Deduction |
JPMorgan BetaBuilders U.S. Equity ETF | |
JPMorgan BetaBuilders U.S. Mid Cap Equity ETF | |
JPMorgan BetaBuilders U.S. Small Cap Equity ETF | |
JPMorgan Carbon Transition U.S. Equity ETF | |
JPMorgan Diversified Return U.S. Equity ETF | |
JPMorgan Diversified Return U.S. Mid Cap Equity ETF | |
JPMorgan Diversified Return U.S. Small Cap Equity ETF | |
JPMorgan U.S. Momentum Factor ETF | |
JPMorgan U.S. Quality Factor ETF | |
JPMorgan U.S. Value Factor ETF | |
Qualified Dividend Income (QDI)
Each Fund listed below had the following amount, or maximum allowable amount, of ordinary income distributions and foreign tax credits (if applicable) treated as qualified dividends for the fiscal year ended October 31, 2024:
| |
JPMorgan BetaBuilders Canada ETF | |
JPMorgan BetaBuilders Developed Asia Pacific ex-Japan ETF | |
JPMorgan BetaBuilders Emerging Markets Equity ETF | |
JPMorgan BetaBuilders Europe ETF | |
JPMorgan BetaBuilders International Equity ETF | |
JPMorgan BetaBuilders Japan ETF | |
JPMorgan BetaBuilders U.S. Equity ETF | |
JPMorgan BetaBuilders U.S. Mid Cap Equity ETF | |
JPMorgan BetaBuilders U.S. Small Cap Equity ETF | |
JPMorgan Carbon Transition U.S. Equity ETF | |
JPMorgan Diversified Return Emerging Markets Equity ETF | |
JPMorgan Diversified Return International Equity ETF | |
| |
JPMorgan Diversified Return U.S. Equity ETF | |
JPMorgan Diversified Return U.S. Mid Cap Equity ETF | |
JPMorgan Diversified Return U.S. Small Cap Equity ETF | |
JPMorgan U.S. Momentum Factor ETF | |
JPMorgan U.S. Quality Factor ETF | |
JPMorgan U.S. Value Factor ETF | |
The following Funds had the following amount, or maximum allowable amount, of ordinary income distributions treated as 199A dividends for the fiscal year ended October 31, 2024:
| |
JPMorgan BetaBuilders U.S. Mid Cap Equity ETF | |
JPMorgan BetaBuilders U.S. Small Cap Equity ETF | |
JPMorgan Diversified Return U.S. Equity ETF | |
JPMorgan Diversified Return U.S. Mid Cap Equity ETF | |
JPMorgan Diversified Return U.S. Small Cap Equity ETF | |
Foreign Source Income and Foreign Tax Credit Pass Through
For the fiscal year ended October 31, 2024, the following Funds intend to elect to pass through to shareholders taxes paid to foreign countries. Gross income and foreign tax expenses are as follows or amounts as finally determined:
| Total Foreign
Source Income | |
JPMorgan BetaBuilders Canada ETF | | |
JPMorgan BetaBuilders Developed Asia Pacific ex-Japan ETF | | |
JPMorgan BetaBuilders Emerging Markets Equity ETF | | |
JPMorgan BetaBuilders Europe ETF | | |
JPMorgan BetaBuilders International Equity ETF | | |
JPMorgan BetaBuilders Japan ETF | | |
JPMorgan Diversified Return Emerging Markets Equity ETF | | |
JPMorgan Diversified Return International Equity ETF | | |
| J.P. Morgan Exchange-Traded Funds | |
THIS PAGE IS INTENTIONALLY LEFT BLANK
J.P. Morgan Exchange-Traded Funds are distributed by JPMorgan Distribution Services, Inc., an indirect, wholly-owned subsidiary of JPMorgan Chase & Co. Affiliates of JPMorgan Chase & Co. receive fees for providing various services to the Funds.
Contact J.P. Morgan Exchange-Traded Funds at 1-844-457-6383 (844-4JPM ETF) for a fund prospectus. You can also visit us at www.jpmorganfunds.com. Investors should carefully consider the investment objectives and risks as well as charges and expenses of the fund before investing. The prospectus contains this and other information about the fund. Read the prospectus carefully before investing.
Investors may obtain information about the Securities Investor Protection Corporation (SIPC), including the SIPC brochure, by visiting www.sipc.org or by calling SIPC at 202-371-8300.
Each Fund files a complete schedule of its fund holdings for the first and third quarters of its fiscal year with the SEC as an exhibit to its report on Form N-PORT. The Funds' Form N-PORT reports are available on the SEC’s website at http://www.sec.gov. Each Fund's quarterly holdings can be found by visiting the J.P. Morgan Funds’ website at www.jpmorganfunds.com.
A description of each Fund's policies and procedures with respect to the disclosure of each Fund's holdings is available in the prospectus and Statement of Additional Information.
A copy of proxy policies and procedures is available without charge upon request by calling 1-844-457-6383 and on the Funds' website at www.jpmorganfunds.com. A description of such policies and procedures is on the SEC’s website at www.sec.gov. The Trustees have delegated the authority to vote proxies for securities owned by the Funds to the Adviser. A copy of the Funds' voting record for the most recent 12-month period ended June 30 is available on the SEC’s website at www.sec.gov or at the Funds' website at www.jpmorganfunds.com no later than August 31 of each year. The Funds' proxy voting record will include, among other things, a brief description of the matter voted on for each fund security, and will state how each vote was cast, for example, for or against the proposal.
J.P. Morgan Asset Management is the brand name for the asset management business of JPMorgan Chase & Co. and its affiliates worldwide.
© JPMorgan Chase & Co., 2024. All rights reserved. October 2024.
AN-ETF-1024
Changes in and Disagreements with Accountants for Open-End Management Investment Companies
Proxy Disclosures for Open-End Management Investment Companies
Remuneration Paid to Directors, Officers, and Others of Open-End Management Investment Companies
Included in the Statements of Operations within the Funds' Financial Statements.
Statement Regarding Basis for Approval of Management Agreements
The Board of Trustees (the “Board” or the “Trustees”) has established various standing committees composed of Trustees with diverse backgrounds, to which the Board has assigned specific subject matter responsibilities to further enhance the effectiveness of the Board’s oversight and decision making. The Board and its investment committees (Money Market and Alternative Products Committee, Equity Committee, and Fixed Income Committee) met regularly throughout the year and, at each meeting, considered factors that are relevant to their annual consideration of the continuation of the management agreements. The Board also met for the specific purpose of considering management agreement annual renewals. The Board held meetings June 25-26, 2024 and August 20-22, 2024, at which the Trustees considered the continuation of the management agreements for each Fund whose annual report is contained herein (each a “Management Agreement” and collectively, the “Management Agreements”). At the June meeting, the Board’s investment committees met to review and consider performance, expense and related information for the J.P. Morgan Funds. Each investment committee reported to the full Board, which then considered each investment committee’s preliminary findings. At the August meeting, the Trustees continued their review and consideration. The Trustees, including a majority of the Trustees who are not parties to a Management Agreement or “interested persons” (as defined in the Investment Company Act of 1940) of any party to a Management Agreement or any of their affiliates, approved the continuation of each Management Agreement on August 22, 2024.
As part of their review of the Management Agreements, the Trustees considered and reviewed performance and other information about the Funds received from J.P. Morgan Investment Management Inc. (the “Adviser”). This information included the Funds’ performance as compared to the performance of their peers and benchmarks, and analyses by the Adviser of the Funds’ performance. In addition, at each of their regular meetings throughout the year, the Trustees considered reports on the performance of certain J.P. Morgan Funds provided by an independent investment consulting firm (the “independent consultant”). In addition, in preparation for the June and August meetings, the Trustees requested, received and evaluated extensive materials from the Adviser, including performance and expense information compiled by Broadridge, using data from Lipper Inc. and/or Morningstar Inc., independent providers of investment company data (together, “Broadridge”). The Trustees’ independent consultant also provided additional quantitative and statistical analyses of certain Funds, including risk and performance return assessments as compared to the Funds’ objectives, benchmarks, and peers. Before voting on the Management Agreements, the Trustees reviewed the Management Agreements with representatives of the Adviser, counsel to the Funds, and independent legal counsel to the Trustees, and received a memorandum from independent legal counsel to the Trustees discussing the legal standards for their consideration of the Management Agreements. The Trustees also discussed the Management Agreements with independent legal counsel in executive sessions at which no representatives of the Adviser were present.
A summary of the material factors evaluated by the Trustees in determining whether to approve each Management Agreement is provided below. Each Trustee attributed different weights to the various factors and no factor alone was considered determinative. The Trustees considered information provided with respect to the Funds throughout the year, as well as materials furnished specifically in connection with the annual review process. From year to year, the Trustees consider and place emphasis on relevant information in light of changing circumstances in market and economic conditions.
After considering and weighting the factors and information they had received, the Trustees found that the compensation to be received by the Adviser from each Fund under the applicable Management Agreement was fair and reasonable under the circumstances, and determined that the continuance of each Management Agreement was in the best interests of each Fund and its shareholders.
Nature, Extent and Quality of Services Provided by the Adviser
The Trustees received and considered information regarding the nature, extent and quality of services provided to each Fund under the applicable Management Agreement. The Trustees took into account information furnished throughout the year at Trustee meetings, as well as the materials furnished specifically in connection with this annual review process. Among other things, the Trustees considered:
•
The background and experience of the Adviser’s senior management and investment personnel, including personnel changes, if any;
•
The qualifications, backgrounds and responsibilities of the portfolio management team primarily responsible for the day-to-day management of each Fund, including personnel changes, if any;
•
The investment strategy for each Fund, and the infrastructure supporting the portfolio management teams;
•
Information about the structure and distribution strategy for each Fund and how it fits within the Adviser’s other fund offerings
within the J.P. Morgan Funds complex;
•
The administration services provided by the Adviser in its role as Administrator;
•
Their knowledge of the nature and quality of the services provided by the Adviser and its affiliates gained from their experience as Trustees of the Funds and in the financial industry generally;
•
The overall reputation and capabilities of the Adviser and its affiliates;
•
The commitment of the Adviser to provide high quality service to the Funds;
•
Their overall confidence in the Adviser’s integrity; and
•
The Adviser’s responsiveness to requests for additional information, questions or concerns raised by them, including the Adviser’s willingness to consider and implement organizational and operational changes designed to improve investment results and the services provided to each Fund.
Based upon these considerations and other factors, the Trustees concluded that they were satisfied with the nature, extent and quality of the services provided to the Funds by the Adviser.
Costs of Services Provided and Profitability to the Adviser and its Affiliates
The Trustees received and considered information regarding the profitability to the Adviser and its affiliates from providing services to each Fund. The Trustees reviewed and discussed this information. The Trustees recognized that this information is not audited and represents the Adviser’s determination of its and its affiliates’ revenues from the contractual services provided to the Funds, less expenses of providing such services. Expenses include direct and indirect costs and are calculated using an allocation methodology developed by the Adviser and reviewed with the Board. The Trustees also recognized that it is difficult to make comparisons of profitability from fund management contracts because comparative information is not generally publicly available and is affected by numerous factors, including the structure of the particular adviser, the types of funds it manages, its business mix, numerous assumptions regarding allocations and the fact that publicly-traded fund managers’ operating profits and net income are net of distribution and marketing expenses. Based upon their review, and taking into consideration the factors noted above, the Trustees concluded that the profitability to the Adviser under each Management Agreement was not unreasonable in light of the services and benefits provided to each Fund.
The Trustees also considered the fees earned by JPMorgan Chase Bank, N.A. (“JPMCB”), an affiliate of the Adviser, for custody, fund accounting and other related services for each Fund, and the profitability of the arrangements to JPMCB.
The Trustees reviewed information regarding potential “fall-out” or ancillary benefits received by the Adviser and its affiliates as a result of their relationship with the Funds. The Trustees considered that the J.P. Morgan Funds' operating accounts are held at JPMCB, which, as a result, will receive float benefits for certain J.P. Morgan Funds, as applicable. The Trustees also noted that the Adviser supports a diverse set of products and services, which benefits the Adviser by allowing it to leverage its infrastructure to serve additional clients, including benefits that may be received by the Adviser and its affiliates in connection with the Funds’ potential investments in other funds advised by the Adviser. The Trustees also reviewed the Adviser’s allocation of fund brokerage for the J.P. Morgan Funds complex, including allocations to brokers who provide research to the Adviser, as well as the Adviser’s use of affiliates to provide other services and the benefits to such affiliates of doing so. The Trustees also considered the benefit to the Adviser and its affiliates from allocating client assets to the Funds.
The Trustees considered the extent to which the Funds may benefit from potential economies of scale. The Trustees considered that under the Management Agreements, the Adviser provides advisory and administrative services and is responsible for substantially all expenses of each Fund except for certain enumerated contractual exclusions under a “unitary fee” structure. The Trustees noted that the unitary management fee for each Fund does not contain breakpoints. The Trustees considered that shareholders would benefit because expenses would be limited even when a Fund is new and not achieving economies of scale. The Trustees considered the fact that increases in assets would not lead to management fee decreases even if economies of scale are achieved, but also that the Trustees would have the opportunity to further review the appropriateness of the fee payable to the Adviser under the Management Agreement in the future. The Trustees also concluded that all Funds benefited from the Adviser’s reinvestment in its operations to
serve the Funds and their shareholders. The Trustees noted that the Adviser’s reinvestment ensures sufficient resources in terms of personnel and infrastructure to support the Funds. After considering the factors identified above, the Trustees concluded that the Fund’s shareholders will receive the benefits of potential economies of scale.
Fees Relative to Adviser’s Other Clients
The Trustees received and considered information about the nature and extent of management services and fee rates offered to other clients of the Adviser, including, to the extent applicable, institutional separate accounts, collective investment trusts, other registered investment companies and/or private funds sub-advised by the Adviser, for investment management styles substantially similar to that of each Fund. The Trustees considered the complexity of investment management for registered investment companies relative to the Adviser’s other clients and noted differences, as applicable, in the fee structure and the regulatory, legal and other risks and responsibilities of providing services to the different clients. The Trustees considered that serving as an adviser to a registered investment company involves greater responsibilities and risks than acting as a sub-adviser and observed that sub-advisory fees may be lower than those charged by the Adviser to each Fund. The Trustees also noted that the adviser, not the applicable registered investment company, typically bears the sub-advisory fee and that many responsibilities related to the advisory function are typically retained by the primary adviser. The Trustees concluded that the fee rates charged to each Fund in comparison to those charged to the Adviser’s other clients were reasonable.
The Trustees considered that each Fund is a “passive” ETF whose objective is to closely correspond, before fees and expenses, to the performance of its benchmark index. The Trustees receive and consider information about each Fund’s performance throughout the year. The Trustees considered each Fund’s investment strategy and processes, portfolio management teams and competitive positioning against peer funds, as identified by Broadridge and/or management. As part of this review, the Trustees also reviewed each Fund’s performance against its benchmark index. The Trustees also discussed the performance and the investment strategy of each Fund with the Adviser. Based on these discussions and various other factors, the Trustee concluded each Fund’s performance was satisfactory.
Management Fees and Expense Ratios
The Trustees considered the contractual and net management fee rates paid by each Fund to the Adviser and compared the rates to the information prepared by Broadridge concerning management fee rates paid by other funds in the same Broadridge category as each Fund. This review included ranking of each Fund within an expense universe comprised of funds with the same Morningstar investment classification and objective (the “Universe”), as well as a subset of funds within the Universe (the “Peer Group”). The Trustees reviewed a description of Broadridge’s methodology for selecting funds in the Peer Group and Universe, as applicable, and noted that the Peer Group and/or Universe quintile rankings were not calculated if the number of funds in the Peer Group and/or Universe did not meet a predetermined minimum. The Trustees also reviewed information about other expenses and the total expense ratio for each Fund. The Trustees recognized that it can be difficult to make comparisons of management fees because there are variations in the services that are included in the fees paid by other funds. The Trustees’ determinations as a result of the review of each Fund’s management fees and expense ratios are summarized below:
The Trustees noted that the JPMorgan BetaBuilders Canada ETF’s net management fee and actual total expenses were in the first quintile of the Universe. Broadridge did not calculate quintile rankings for the Peer Group for this Fund due to the limited number of funds in the Peer Group. After considering the factors identified above, in light of this information, the Trustees concluded that the management fee was fair and reasonable in light of the services provided to the Fund.
The Trustees noted that the JPMorgan BetaBuilders Developed Asia Pacific ex-Japan ETF’s net management fee and actual total expenses were in the first quintile of the Universe. Broadridge did not calculate quintile rankings for the Peer Group for this Fund due to the limited number of funds in the Peer Group. After considering the factors identified above, in light of this information, the Trustees concluded that the management fee was fair and reasonable in light of the services provided to the Fund.
The Trustees noted that the JPMorgan BetaBuilders Emerging Markets Equity ETF’s net management fee and actual total expenses were in the second and first quintiles of the Peer Group and Universe, respectively. After considering the factors identified above, in light of this information, the Trustees concluded that the management fee was fair and reasonable in light of the services provided to the Fund.
The Trustees noted that the JPMorgan BetaBuilders Europe ETF’s net management fee was in the second and first quintiles of the Peer Group and Universe, respectively, and that the actual total expenses were in the first quintile of both the Peer Group and Universe. After considering the factors identified above, in light of this information, the Trustees concluded that the management fee was fair and reasonable in light of the services provided to the Fund.
The Trustees noted that the JPMorgan BetaBuilders International Equity ETF’s net management fee and actual total expenses were in the second and first quintiles of the Peer Group and Universe, respectively. After considering the factors identified above, in light of this information, the Trustees concluded that the management fee was fair and reasonable in light of the services provided to the Fund.
The Trustees noted that the JPMorgan BetaBuilders Japan ETF’s net management fee was in the second quintile of both the Peer Group and Universe, and that the actual total expenses were in the first and second quintiles of the Peer Group and Universe, respectively. After considering the factors identified above, in light of this information, the Trustees concluded that the management fee was fair and reasonable in light of the services provided to the Fund.
The Trustees noted that the JPMorgan BetaBuilders U.S. Equity ETF’s net management fee and actual total expenses were in the first quintile of both the Peer Group and Universe. After considering the factors identified above, in light of this information, the Trustees concluded that the management fee was fair and reasonable in light of the services provided to the Fund.
The Trustees noted that the JPMorgan BetaBuilders U.S. Mid Cap Equity ETF’s net management fee and actual total expenses were in the third and first quintiles of the Peer Group and Universe, respectively. After considering the factors identified above, in light of this information, the Trustees concluded that the management fee was fair and reasonable in light of the services provided to the Fund.
The Trustees noted that the JPMorgan BetaBuilders U.S. Small Cap Equity ETF’s net management fee was in the fourth and second quintiles of the Peer Group and Universe, respectively, and that the actual total expenses were in the third and first quintiles of the Peer Group and Universe, respectively. After considering the factors identified above, in light of this information, the Trustees concluded that the management fee was fair and reasonable in light of the services provided to the Fund.
The Trustees noted that the JPMorgan Carbon Transition U.S. Equity ETF’s net management fee was in the third quintile of both the Peer Group and Universe, and that the actual total expenses were in the third and second quintiles of the Peer Group and Universe, respectively. After considering the factors identified above, in light of this information, the Trustees concluded that the management fee was fair and reasonable in light of the services provided to the Fund.
The Trustees noted that the JPMorgan Diversified Return Emerging Markets Equity ETF’s net management fee was in the third quintile of both the Peer Group and Universe, and that the actual total expenses were in the first and third quintiles of the Peer Group and Universe, respectively. After considering the factors identified above, in light of this information, the Trustees concluded that the management fee was fair and reasonable in light of the services provided to the Fund.
The Trustees noted that the JPMorgan Diversified Return International Equity ETF’s net management fee and actual total expenses were in the third and fourth quintiles of the Peer Group and Universe, respectively. After considering the factors identified above, in light of this information, the Trustees concluded that the management fee was fair and reasonable in light of the services provided to the Fund.
The Trustees noted that the JPMorgan Diversified Return U.S. Equity ETF’s net management fee and actual total expenses were in the first and second quintiles of the Peer Group and Universe, respectively. After considering the factors identified above, in light of this information, the Trustees concluded that the management fee was fair and reasonable in light of the services provided to the Fund.
The Trustees noted that the JPMorgan Diversified Return U.S. Mid Cap Equity ETF’s net management fee and actual total expenses were in the first and third quintiles of the Peer Group and Universe, respectively. After considering the factors identified above, in light of this information, the Trustees concluded that the management fee was fair and reasonable in light of the services provided to the Fund.
The Trustees noted that the JPMorgan Diversified Return U.S. Small Cap Equity ETF’s net management fee and actual total expenses were in the second and third quintiles of the Peer Group and Universe, respectively. After considering the factors identified above, in light of this information, the Trustees concluded that the management fee was fair and reasonable in light of the services provided to the Fund.
The Trustees noted that the JPMorgan U.S. Momentum Factor ETF’s net management fee and actual total expenses were in the second quintile of the Universe. Broadridge did not calculate quintile rankings for the Peer Group for this Fund due to the limited number of funds in the Peer Group. After considering the factors identified above, in light of this information, the Trustees concluded that the management fee was fair and reasonable in light of the services provided to the Fund.
The Trustees noted that the JPMorgan U.S. Quality Factor ETF’s net management fee and actual total expenses were in the first and second quintiles of the Peer Group and Universe, respectively. After considering the factors identified above, in light of this information, the Trustees concluded that the management fee was fair and reasonable in light of the services provided to the Fund.
The Trustees noted that the JPMorgan U.S. Value Factor ETF’s net management fee and actual total expenses were in the third and second quintiles of the Peer Group and Universe, respectively. After considering the factors identified above, in light of this information, the Trustees concluded that the management fee was fair and reasonable in light of the services provided to the Fund.
Annual Financial Statements
J.P. Morgan Exchange-Traded Funds
October 31, 2024
| | |
JPMorgan Active China ETF | | |
JPMorgan Active Developing Markets Equity ETF | | |
JPMorgan ActiveBuilders Emerging Markets Equity ETF | | |
JPMorgan Dividend Leaders ETF | | |
JPMorgan Global Select Equity ETF | | The NASDAQ Stock Market® LLC |
JPMorgan Healthcare Leaders ETF | | The NASDAQ Stock Market® LLC |
JPMorgan Hedged Equity Laddered Overlay ETF | | |
JPMorgan International Growth ETF | | |
JPMorgan International Value ETF | | The NASDAQ Stock Market® LLC |
CONTENTS
Investments in a Fund are not deposits or obligations of, or guaranteed or endorsed by, any bank and are not insured or guaranteed by the FDIC, the Federal Reserve Board or any other government agency. You could lose money if you sell when a Fund’s share price is lower than when you invested.
Past performance is no guarantee of future performance. The general market views expressed in this report are opinions based on market and other conditions through the end of the reporting period and are subject to change without notice. These views are not intended to predict the future performance of a Fund or the securities markets.
Prospective investors should refer to the Funds’ prospectuses for a discussion of the Funds’ investment objectives, strategies and risks. Call J.P. Morgan Exchange-Traded Funds at (844) 457-6383 for a prospectus containing more complete information about a Fund, including management fees and other expenses. Please read it carefully before investing.
Shares are bought and sold throughout the day on an exchange at market price (not at net asset value) through a brokerage account, and are not individually subscribed and redeemed from a Fund. Shares may only be subscribed and redeemed directly from a Fund by Authorized Participants, in very large creation/redemption units. Brokerage commissions will reduce returns.
JPMorgan Active China ETF
SCHEDULE OF PORTFOLIO INVESTMENTSAS OF October 31, 2024
| | |
|
Automobile Components — 2.3% |
Fuyao Glass Industry Group Co. Ltd., Class A | | |
|
China Construction Bank Corp., Class H | | |
China Merchants Bank Co. Ltd., Class A | | |
Postal Savings Bank of China Co. Ltd., Class H (a) | | |
| | |
|
Kweichow Moutai Co. Ltd., Class A | | |
|
Alibaba Group Holding Ltd. | | |
PDD Holdings, Inc., ADR * | | |
| | |
Electrical Equipment — 1.2% |
Hongfa Technology Co. Ltd., Class A | | |
Electronic Equipment, Instruments & Components — 9.3% |
BOE Technology Group Co. Ltd., Class A | | |
Foxconn Industrial Internet Co. Ltd., Class A | | |
Luxshare Precision Industry Co. Ltd., Class A | | |
Sunny Optical Technology Group Co. Ltd. | | |
Xiamen Faratronic Co. Ltd., Class A | | |
| | |
|
| | |
| | |
| | |
|
Angel Yeast Co. Ltd., Class A | | |
Anjoy Foods Group Co. Ltd., Class A | | |
Inner Mongolia Yili Industrial Group Co. Ltd., Class A | | |
| | |
|
China Resources Gas Group Ltd. | | |
| | |
| | |
Health Care Equipment & Supplies — 1.0% |
Shenzhen Mindray Bio-Medical Electronics Co. Ltd., Class A | | |
Health Care Providers & Services — 0.9% |
Sinopharm Group Co. Ltd., Class H | | |
| | |
|
Hotels, Restaurants & Leisure — 6.1% |
| | |
| | |
| | |
Household Durables — 4.7% |
Haier Smart Home Co. Ltd., Class H | | |
Jason Furniture Hangzhou Co. Ltd., Class A | | |
Midea Group Co. Ltd., Class A | | |
| | |
Independent Power and Renewable Electricity Producers — 2.1% |
China Yangtze Power Co. Ltd., Class A | | |
|
China Pacific Insurance Group Co. Ltd., Class H | | |
PICC Property & Casualty Co. Ltd., Class H | | |
Ping An Insurance Group Co. of China Ltd., Class A | | |
| | |
Interactive Media & Services — 14.1% |
| | |
| | |
| | |
|
Jiangsu Hengli Hydraulic Co. Ltd., Class A | | |
Weichai Power Co. Ltd., Class H | | |
Zhuzhou CRRC Times Electric Co. Ltd., Class A | | |
Zhuzhou CRRC Times Electric Co. Ltd., Class H | | |
| | |
|
Focus Media Information Technology Co. Ltd., Class A | | |
|
Zijin Mining Group Co. Ltd., Class H | | |
Oil, Gas & Consumable Fuels — 3.0% |
China Petroleum & Chemical Corp., Class H | | |
PetroChina Co. Ltd., Class H | | |
| | |
|
China Resources Sanjiu Medical & Pharmaceutical Co. Ltd., Class A | | |
Real Estate Management & Development — 1.9% |
| | |
SEE NOTES TO FINANCIAL STATEMENTS.
| J.P. Morgan Exchange-Traded Funds | |
JPMorgan Active China ETF
SCHEDULE OF PORTFOLIO INVESTMENTSAS OF October 31, 2024 (continued)
| | |
Common Stocks — continued |
Semiconductors & Semiconductor Equipment — 3.0% |
Flat Glass Group Co. Ltd., Class H | | |
Montage Technology Co. Ltd., Class A | | |
| | |
|
Kingdee International Software Group Co. Ltd. * | | |
Technology Hardware, Storage & Peripherals — 1.9% |
| | |
Textiles, Apparel & Luxury Goods — 1.0% |
Shenzhou International Group Holdings Ltd. | | |
Total Common Stocks
(Cost $11,400,680) | | |
Short-Term Investments — 0.1% |
Investment Companies — 0.1% |
JPMorgan Prime Money Market Fund Class IM, 4.90% (b) (c)(Cost $8,860) | | |
Total Investments — 100.0%
(Cost $11,409,540) | | |
Liabilities in Excess of Other Assets — (0.0)% ^ | | |
| | |
Percentages indicated are based on net assets. |
| |
| American Depositary Receipt |
| Amount rounds to less than 0.1% of net assets. |
| Non-income producing security. | |
| Security exempt from registration pursuant to Regulation S under the Securities Act of 1933, as amended. Regulation S applies to securities offerings that are made outside of the United States and do not involve direct selling efforts in the United States and as such may have restrictions on resale. | |
| Investment in an affiliated fund, which is registered under the Investment Company Act of 1940, as amended, and is advised by J.P. Morgan Investment Management Inc. | |
| The rate shown is the current yield as of October 31, 2024. | |
SEE NOTES TO FINANCIAL STATEMENTS.
| J.P. Morgan Exchange-Traded Funds | |
JPMorgan Active Developing Markets Equity ETF
SCHEDULE OF PORTFOLIO INVESTMENTSAS OF October 31, 2024
| | |
|
|
B3 SA - Brasil Bolsa Balcao | | |
| | |
| | |
BB Seguridade Participacoes SA | | |
Itau Unibanco Holding SA, ADR | | |
Itau Unibanco Holding SA (Preference) | | |
| | |
NU Holdings Ltd., Class A * | | |
Petroleo Brasileiro SA, ADR | | |
| | |
| | |
| | |
| | |
| | |
|
Alibaba Group Holding Ltd. | | |
China Construction Bank Corp., Class H | | |
China Mengniu Dairy Co. Ltd. | | |
China Merchants Bank Co. Ltd., Class H | | |
China Pacific Insurance Group Co. Ltd., Class H | | |
China Petroleum & Chemical Corp., Class H | | |
China Resources Mixc Lifestyle Services Ltd. (a) | | |
China Yangtze Power Co. Ltd., Class A | | |
Contemporary Amperex Technology Co. Ltd., Class A | | |
Full Truck Alliance Co. Ltd., ADR | | |
Fuyao Glass Industry Group Co. Ltd., Class H (a) | | |
| | |
Haier Smart Home Co. Ltd., Class A | | |
Haier Smart Home Co. Ltd., Class H | | |
Huayu Automotive Systems Co. Ltd., Class A | | |
Industrial & Commercial Bank of China Ltd., Class H | | |
Inner Mongolia Yili Industrial Group Co. Ltd., Class A | | |
| | |
Jiangsu Hengli Hydraulic Co. Ltd., Class A | | |
| | |
| | |
Kweichow Moutai Co. Ltd., Class A | | |
Midea Group Co. Ltd., Class A | | |
Montage Technology Co. Ltd., Class A | | |
| | |
PDD Holdings, Inc., ADR * | | |
Ping An Insurance Group Co. of China Ltd., Class H | | |
Shenzhen Mindray Bio-Medical Electronics Co. Ltd., Class A | | |
| | |
|
|
Shenzhou International Group Holdings Ltd. | | |
| | |
Trip.com Group Ltd., ADR * | | |
Wuliangye Yibin Co. Ltd., Class A | | |
| | |
| | |
|
National Bank of Greece SA | | |
|
| | |
Hong Kong Exchanges & Clearing Ltd. | | |
Techtronic Industries Co. Ltd. | | |
| | |
|
| | |
|
Apollo Hospitals Enterprise Ltd. | | |
| | |
| | |
| | |
| | |
| | |
| | |
| | |
Hindustan Aeronautics Ltd. (a) | | |
| | |
| | |
| | |
| | |
| | |
| | |
Power Grid Corp. of India Ltd. | | |
| | |
Tata Consultancy Services Ltd. | | |
| | |
| | |
| | |
|
Bank Central Asia Tbk. PT | | |
Bank Mandiri Persero Tbk. PT | | |
SEE NOTES TO FINANCIAL STATEMENTS.
| J.P. Morgan Exchange-Traded Funds | |
JPMorgan Active Developing Markets Equity ETF
SCHEDULE OF PORTFOLIO INVESTMENTSAS OF October 31, 2024 (continued)
| | |
Common Stocks — continued |
|
Bank Rakyat Indonesia Persero Tbk. PT | | |
Telkom Indonesia Persero Tbk. PT | | |
| | |
|
| | |
|
BBB Foods, Inc., Class A * | | |
Grupo Aeroportuario del Pacifico SAB de CV, Class B | | |
Grupo Financiero Banorte SAB de CV, Class O | | |
| | |
| | |
Vista Energy SAB de CV, ADR * | | |
Wal-Mart de Mexico SAB de CV | | |
| | |
|
Copa Holdings SA, Class A | | |
|
| | |
|
| | |
|
| | |
|
| | |
Saudi Arabian Oil Co. (a) | | |
Saudi National Bank (The) | | |
| | |
|
| | |
| | |
Capitec Bank Holdings Ltd. | | |
| | |
| | |
| | |
| | |
|
Hana Financial Group, Inc. | | |
Hanwha Aerospace Co. Ltd. | | |
Hanwha Industrial Solutions Co. Ltd. * | | |
| | |
| | |
| | |
|
|
| | |
Samsung Electronics Co. Ltd. | | |
Samsung Electronics Co. Ltd. (Preference) | | |
Samsung Fire & Marine Insurance Co. Ltd. | | |
Shinhan Financial Group Co. Ltd. | | |
| | |
| | |
| | |
|
Banco Bilbao Vizcaya Argentaria SA | | |
|
| | |
ASE Technology Holding Co. Ltd. | | |
Chailease Holding Co. Ltd. | | |
| | |
| | |
Novatek Microelectronics Corp. | | |
| | |
Realtek Semiconductor Corp. | | |
Taiwan Semiconductor Manufacturing Co. Ltd. | | |
United Microelectronics Corp. | | |
| | |
| | |
| | |
|
| | |
|
Aselsan Elektronik Sanayi ve Ticaret A/S | | |
BIM Birlesik Magazalar A/S | | |
| | |
| | |
Turkiye Garanti Bankasi A/S | | |
Yapi ve Kredi Bankasi A/S | | |
| | |
|
| | |
Total Common Stocks
(Cost $14,336,916) | | |
SEE NOTES TO FINANCIAL STATEMENTS.
| J.P. Morgan Exchange-Traded Funds | |
| | |
Total Investments — 99.5%
(Cost $14,336,916) | | |
Other Assets in Excess of Liabilities — 0.5% | | |
| | |
Percentages indicated are based on net assets. |
| |
| American Depositary Receipt |
| Non-Voting Depositary Receipt |
| A special type of equity investment that shares in the earnings of the company, has limited voting rights, and may have a dividend preference. Preference shares may also have liquidation preference. |
| Limited liability company |
| |
| Non-income producing security. |
| Security exempt from registration pursuant to Regulation S under the Securities Act of 1933, as amended. Regulation S applies to securities offerings that are made outside of the United States and do not involve direct selling efforts in the United States and as such may have restrictions on resale. |
Summary of Investments by Industry, October 31, 2024
The following table represents the portfolio investments of the Fund by industry classifications as a percentage of total investments:
| PERCENT OF
TOTAL
INVESTMENTS |
| |
Semiconductors & Semiconductor Equipment | |
Technology Hardware, Storage & Peripherals | |
Interactive Media & Services | |
Consumer Staples Distribution & Retail | |
| |
| |
| |
| |
| |
Hotels, Restaurants & Leisure | |
Oil, Gas & Consumable Fuels | |
| |
| |
| |
| |
| |
Independent Power and Renewable Electricity Producers | |
| |
| |
Others (each less than 1.0%) | |
SEE NOTES TO FINANCIAL STATEMENTS.
| J.P. Morgan Exchange-Traded Funds | |
JPMorgan ActiveBuilders Emerging Markets Equity ETF
SCHEDULE OF PORTFOLIO INVESTMENTSAS OF October 31, 2024
| | |
|
|
| | |
|
| | |
Raiffeisen Bank International AG | | |
| | |
|
Arcos Dorados Holdings, Inc., Class A | | |
| | |
B3 SA - Brasil Bolsa Balcao | | |
| | |
| | |
BB Seguridade Participacoes SA | | |
Cia de Saneamento Basico do Estado de Sao Paulo SABESP | | |
Cia Energetica de Minas Gerais (Preference) | | |
Cury Construtora e Incorporadora SA | | |
| | |
| | |
Itau Unibanco Holding SA (Preference) | | |
| | |
| | |
| | |
| | |
NU Holdings Ltd., Class A * | | |
Petroleo Brasileiro SA, ADR | | |
| | |
| | |
| | |
| | |
| | |
| | |
| | |
| | |
| | |
| | |
|
| | |
| | |
| | |
|
Airtac International Group | | |
Alibaba Group Holding Ltd. | | |
Angel Yeast Co. Ltd., Class A | | |
| | |
|
|
Anjoy Foods Group Co. Ltd., Class A | | |
ANTA Sports Products Ltd. | | |
| | |
Bank of Hangzhou Co. Ltd., Class A | | |
Beijing Kingsoft Office Software, Inc., Class A | | |
Beijing Yanjing Brewery Co. Ltd., Class A | | |
BOE Technology Group Co. Ltd., Class A | | |
Budweiser Brewing Co. APAC Ltd. (a) | | |
| | |
BYD Electronic International Co. Ltd. | | |
China Construction Bank Corp., Class H | | |
| | |
China Life Insurance Co. Ltd., Class H | | |
China Mengniu Dairy Co. Ltd. | | |
China Merchants Bank Co. Ltd., Class H | | |
China Overseas Land & Investment Ltd. | | |
China Pacific Insurance Group Co. Ltd., Class H | | |
China Petroleum & Chemical Corp., Class H | | |
China Resources Gas Group Ltd. | | |
China Resources Mixc Lifestyle Services Ltd. (a) | | |
China Resources Power Holdings Co. Ltd. | | |
China Resources Sanjiu Medical & Pharmaceutical Co. Ltd., Class A | | |
China Shenhua Energy Co. Ltd., Class H | | |
China Suntien Green Energy Corp. Ltd., Class H | | |
China Yangtze Power Co. Ltd., Class A | | |
Chongqing Brewery Co. Ltd., Class A | | |
| | |
CITIC Securities Co. Ltd., Class H | | |
| | |
Contemporary Amperex Technology Co. Ltd., Class A | | |
| | |
Flat Glass Group Co. Ltd., Class H | | |
Focus Media Information Technology Co. Ltd., Class A | | |
Foxconn Industrial Internet Co. Ltd., Class A | | |
Full Truck Alliance Co. Ltd., ADR | | |
Fuyao Glass Industry Group Co. Ltd., Class H (a) | | |
Ganfeng Lithium Group Co. Ltd. (a) | | |
Geely Automobile Holdings Ltd. | | |
Great Wall Motor Co. Ltd., Class H | | |
SEE NOTES TO FINANCIAL STATEMENTS.
| J.P. Morgan Exchange-Traded Funds | |
| | |
Common Stocks — continued |
|
Gree Electric Appliances, Inc. of Zhuhai, Class A | | |
| | |
Haier Smart Home Co. Ltd., Class H | | |
Haitian International Holdings Ltd. | | |
Hefei Meiya Optoelectronic Technology, Inc., Class A | | |
Hongfa Technology Co. Ltd., Class A | | |
Huatai Securities Co. Ltd., Class H (a) | | |
Industrial & Commercial Bank of China Ltd., Class H | | |
Inner Mongolia Yili Industrial Group Co. Ltd., Class A | | |
JD Health International, Inc. * (a) | | |
| | |
Jiangsu Hengli Hydraulic Co. Ltd., Class A | | |
Jiayou International Logistics Co. Ltd., Class A | | |
| | |
KE Holdings, Inc., Class A | | |
Kingdee International Software Group Co. Ltd. * | | |
Kweichow Moutai Co. Ltd., Class A | | |
| | |
Luxshare Precision Industry Co. Ltd., Class A | | |
Luzhou Laojiao Co. Ltd., Class A | | |
| | |
Midea Group Co. Ltd., Class A | | |
| | |
Montage Technology Co. Ltd., Class A | | |
NARI Technology Co. Ltd., Class A | | |
| | |
Ningbo Tuopu Group Co. Ltd., Class A | | |
PDD Holdings, Inc., ADR * | | |
PetroChina Co. Ltd., Class H | | |
PICC Property & Casualty Co. Ltd., Class H | | |
Ping An Insurance Group Co. of China Ltd., Class H | | |
Postal Savings Bank of China Co. Ltd., Class H (a) | | |
Qingdao Haier Biomedical Co. Ltd., Class A | | |
Sailun Group Co. Ltd., Class A | | |
SF Holding Co. Ltd., Class A | | |
Shanghai Baosight Software Co. Ltd., Class A | | |
Shanghai Pudong Development Bank Co. Ltd., Class A | | |
| | |
|
|
Shenzhen Inovance Technology Co. Ltd., Class A | | |
Shenzhen Mindray Bio-Medical Electronics Co. Ltd., Class A | | |
Shenzhou International Group Holdings Ltd. | | |
| | |
Sinoma International Engineering Co., Class A | | |
Sinopharm Group Co. Ltd., Class H | | |
| | |
SITC International Holdings Co. Ltd. | | |
Sunny Optical Technology Group Co. Ltd. | | |
Sunresin New Materials Co. Ltd., Class A | | |
SUPCON Technology Co. Ltd., Class A | | |
| | |
Tingyi Cayman Islands Holding Corp. | | |
Tongwei Co. Ltd., Class A | | |
| | |
Weichai Power Co. Ltd., Class H | | |
Wuliangye Yibin Co. Ltd., Class A | | |
Xiamen Faratronic Co. Ltd., Class A | | |
Xiaomi Corp., Class B * (a) | | |
| | |
Zhejiang NHU Co. Ltd., Class A | | |
Zhejiang Supor Co. Ltd., Class A | | |
Zhongji Innolight Co. Ltd., Class A | | |
Zhuzhou CRRC Times Electric Co. Ltd., Class H | | |
Zijin Mining Group Co. Ltd., Class H | | |
Zoomlion Heavy Industry Science and Technology Co. Ltd., Class H | | |
| | |
| | |
|
| | |
|
Bank of Georgia Group plc | | |
| | |
| | |
|
Alpha Services and Holdings SA | | |
Eurobank Ergasias Services and Holdings SA | | |
Hellenic Telecommunications Organization SA | | |
| | |
Metlen Energy & Metals SA | | |
Motor Oil Hellas Corinth Refineries SA | | |
SEE NOTES TO FINANCIAL STATEMENTS.
| J.P. Morgan Exchange-Traded Funds | |
JPMorgan ActiveBuilders Emerging Markets Equity ETF
SCHEDULE OF PORTFOLIO INVESTMENTSAS OF October 31, 2024 (continued)
| | |
Common Stocks — continued |
|
National Bank of Greece SA | | |
| | |
Piraeus Financial Holdings SA | | |
| | |
|
| | |
| | |
Hong Kong Exchanges & Clearing Ltd. | | |
Techtronic Industries Co. Ltd. | | |
| | |
|
MOL Hungarian Oil & Gas plc | | |
| | |
| | |
| | |
|
| | |
Apollo Hospitals Enterprise Ltd. | | |
| | |
| | |
| | |
| | |
| | |
| | |
Bharat Petroleum Corp. Ltd. | | |
| | |
| | |
| | |
Britannia Industries Ltd. | | |
| | |
CG Power & Industrial Solutions Ltd. | | |
Cholamandalam Investment and Finance Co. Ltd. | | |
| | |
| | |
Colgate-Palmolive India Ltd. | | |
Computer Age Management Services Ltd. | | |
Crompton Greaves Consumer Electricals Ltd. | | |
| | |
| | |
| | |
Dr Reddy's Laboratories Ltd. | | |
| | |
| | |
|
|
Embassy Office Parks, REIT | | |
Endurance Technologies Ltd. (a) | | |
| | |
| | |
| | |
HDFC Asset Management Co. Ltd. (a) | | |
| | |
| | |
HDFC Life Insurance Co. Ltd. (a) | | |
| | |
| | |
Hindustan Aeronautics Ltd. (a) | | |
| | |
| | |
ICICI Lombard General Insurance Co. Ltd. (a) | | |
| | |
| | |
InterGlobe Aviation Ltd. * (a) | | |
| | |
| | |
| | |
| | |
| | |
| | |
| | |
| | |
Metropolis Healthcare Ltd. (a) | | |
Multi Commodity Exchange of India Ltd. | | |
| | |
| | |
Oil & Natural Gas Corp. Ltd. | | |
| | |
| | |
| | |
| | |
SBI Life Insurance Co. Ltd. (a) | | |
| | |
| | |
| | |
| | |
Syngene International Ltd. (a) | | |
Tata Consultancy Services Ltd. | | |
| | |
| | |
SEE NOTES TO FINANCIAL STATEMENTS.
| J.P. Morgan Exchange-Traded Funds | |
| | |
Common Stocks — continued |
|
| | |
| | |
Tube Investments of India Ltd. | | |
| | |
| | |
| | |
| | |
| | |
|
Aspirasi Hidup Indonesia Tbk. PT | | |
Bank Central Asia Tbk. PT | | |
Bank Mandiri Persero Tbk. PT | | |
Bank Negara Indonesia Persero Tbk. PT | | |
Bank Rakyat Indonesia Persero Tbk. PT | | |
Indofood CBP Sukses Makmur Tbk. PT | | |
| | |
Telkom Indonesia Persero Tbk. PT | | |
| | |
| | |
|
| | |
NAC Kazatomprom JSC, GDR (a) | | |
| | |
|
| | |
|
99 Speed Mart Retail Holdings Bhd. * | | |
| | |
| | |
| | |
| | |
| | |
Press Metal Aluminium Holdings Bhd. | | |
| | |
| | |
| | |
| | |
|
| | |
| | |
Arca Continental SAB de CV | | |
BBB Foods, Inc., Class A * | | |
| | |
|
|
Bolsa Mexicana de Valores SAB de CV | | |
| | |
Coca-Cola Femsa SAB de CV | | |
Corp. Inmobiliaria Vesta SAB de CV | | |
Fomento Economico Mexicano SAB de CV | | |
| | |
| | |
Grupo Aeroportuario del Pacifico SAB de CV, Class B | | |
Grupo Aeroportuario del Sureste SAB de CV, Class B (b) | | |
Grupo Comercial Chedraui SA de CV | | |
Grupo Financiero Banorte SAB de CV, Class O | | |
| | |
Kimberly-Clark de Mexico SAB de CV, Class A | | |
| | |
| | |
Wal-Mart de Mexico SAB de CV | | |
| | |
|
Copa Holdings SA, Class A | | |
|
| | |
|
| | |
| | |
International Container Terminal Services, Inc. | | |
Metropolitan Bank & Trust Co. | | |
| | |
| | |
|
Bank Polska Kasa Opieki SA | | |
| | |
| | |
| | |
| | |
Powszechna Kasa Oszczednosci Bank Polski SA | | |
Powszechny Zaklad Ubezpieczen SA | | |
| | |
|
| | |
SEE NOTES TO FINANCIAL STATEMENTS.
| J.P. Morgan Exchange-Traded Funds | |
JPMorgan ActiveBuilders Emerging Markets Equity ETF
SCHEDULE OF PORTFOLIO INVESTMENTSAS OF October 31, 2024 (continued)
| | |
Common Stocks — continued |
|
| | |
Qatar Gas Transport Co. Ltd. | | |
| | |
| | |
|
| | |
| | |
GMK Norilskiy Nickel PAO, ADR ‡ * | | |
GMK Norilskiy Nickel PAO ‡ | | |
Magnitogorsk Iron & Steel Works PJSC, GDR ‡ * (a) | | |
Moscow Exchange MICEX-RTS PJSC ‡ | | |
| | |
Sberbank of Russia PJSC ‡ | | |
Severstal PAO, GDR ‡ * (a) | | |
| | |
X5 Retail Group NV, GDR ‡ * (a) | | |
| | |
|
| | |
| | |
Aldrees Petroleum and Transport Services Co. | | |
| | |
AlKhorayef Water & Power Technologies Co. * | | |
| | |
| | |
Bupa Arabia for Cooperative Insurance Co. | | |
Catrion Catering Holding Co. | | |
Co. for Cooperative Insurance (The) | | |
| | |
| | |
| | |
| | |
| | |
Saudi Arabian Oil Co. (a) | | |
Saudi Aramco Base Oil Co. | | |
| | |
Saudi National Bank (The) | | |
| | |
United International Transportation Co. | | |
| | |
|
| | |
| | |
|
|
| | |
| | |
| | |
Capitec Bank Holdings Ltd. | | |
| | |
| | |
| | |
Foschini Group Ltd. (The) | | |
| | |
Harmony Gold Mining Co. Ltd. | | |
| | |
| | |
| | |
| | |
| | |
Truworths International Ltd. | | |
| | |
| | |
|
| | |
| | |
| | |
BNK Financial Group, Inc. | | |
| | |
| | |
| | |
Daeduck Electronics Co. Ltd. | | |
| | |
Doosan Enerbility Co. Ltd. * | | |
Eugene Technology Co. Ltd. | | |
Hana Financial Group, Inc. | | |
Hankook Tire & Technology Co. Ltd. | | |
| | |
| | |
Hanwha Aerospace Co. Ltd. | | |
| | |
HD Korea Shipbuilding & Offshore Engineering Co. Ltd. * | | |
| | |
| | |
| | |
| | |
| | |
| | |
SEE NOTES TO FINANCIAL STATEMENTS.
| J.P. Morgan Exchange-Traded Funds | |
| | |
Common Stocks — continued |
|
| | |
| | |
| | |
KEPCO Plant Service & Engineering Co. Ltd. | | |
| | |
KIWOOM Securities Co. Ltd. | | |
Korea Aerospace Industries Ltd. | | |
Korea Investment Holdings Co. Ltd. | | |
Korean Air Lines Co. Ltd. | | |
| | |
Kumho Petrochemical Co. Ltd. | | |
| | |
LG Energy Solution Ltd. * | | |
LigaChem Biosciences, Inc. * | | |
| | |
| | |
Nextbiomedical Co. Ltd. * | | |
Samsung Biologics Co. Ltd. * (a) | | |
| | |
Samsung Electro-Mechanics Co. Ltd. | | |
Samsung Electronics Co. Ltd. | | |
Samsung Fire & Marine Insurance Co. Ltd. | | |
Samsung Heavy Industries Co. Ltd. * | | |
Samsung Life Insurance Co. Ltd. | | |
| | |
| | |
Samsung Securities Co. Ltd. | | |
| | |
Shinhan Financial Group Co. Ltd. | | |
| | |
| | |
| | |
SM Entertainment Co. Ltd. | | |
| | |
| | |
| | |
| | |
Tokai Carbon Korea Co. Ltd. | | |
| | |
| | |
|
Banco Bilbao Vizcaya Argentaria SA | | |
|
| | |
| | |
|
|
| | |
| | |
| | |
ASE Technology Holding Co. Ltd. | | |
Asia Vital Components Co. Ltd. | | |
| | |
| | |
| | |
Cathay Financial Holding Co. Ltd. | | |
Chailease Holding Co. Ltd. | | |
| | |
| | |
CTBC Financial Holding Co. Ltd. | | |
| | |
E.Sun Financial Holding Co. Ltd. | | |
Elan Microelectronics Corp. | | |
| | |
| | |
Evergreen Marine Corp. Taiwan Ltd. | | |
| | |
Formosa Petrochemical Corp. | | |
Fubon Financial Holding Co. Ltd. | | |
Gudeng Precision Industrial Co. Ltd. | | |
Hon Hai Precision Industry Co. Ltd. | | |
| | |
Jentech Precision Industrial Co. Ltd. | | |
KGI Financial Holding Co. Ltd. | | |
Largan Precision Co. Ltd. | | |
| | |
Makalot Industrial Co. Ltd. | | |
Materials Analysis Technology, Inc. | | |
| | |
Mega Financial Holding Co. Ltd. | | |
Nien Made Enterprise Co. Ltd. | | |
Novatek Microelectronics Corp. | | |
| | |
| | |
Powertech Technology, Inc. | | |
Poya International Co. Ltd. | | |
President Chain Store Corp. | | |
| | |
Realtek Semiconductor Corp. | | |
Shiny Chemical Industrial Co. Ltd. | | |
| | |
SEE NOTES TO FINANCIAL STATEMENTS.
| J.P. Morgan Exchange-Traded Funds | |
JPMorgan ActiveBuilders Emerging Markets Equity ETF
SCHEDULE OF PORTFOLIO INVESTMENTSAS OF October 31, 2024 (continued)
| | |
Common Stocks — continued |
|
Taiwan Semiconductor Manufacturing Co. Ltd. | | |
Tong Yang Industry Co. Ltd. | | |
Uni-President Enterprises Corp. | | |
United Microelectronics Corp. | | |
Vanguard International Semiconductor Corp. | | |
| | |
| | |
| | |
Yuanta Financial Holding Co. Ltd. | | |
| | |
|
| | |
Bangkok Dusit Medical Services PCL, Class F | | |
Bumrungrad Hospital PCL, NVDR | | |
| | |
Intouch Holdings PCL, NVDR | | |
| | |
Krung Thai Bank PCL, NVDR | | |
PTT Exploration & Production PCL | | |
| | |
Siam Cement PCL (The) (Registered) | | |
| | |
| | |
| | |
|
| | |
Aselsan Elektronik Sanayi ve Ticaret A/S | | |
BIM Birlesik Magazalar A/S | | |
| | |
| | |
| | |
Turkcell Iletisim Hizmetleri A/S | | |
Turkiye Garanti Bankasi A/S | | |
Turkiye Is Bankasi A/S, Class C | | |
Turkiye Petrol Rafinerileri A/S | | |
| | |
Yapi ve Kredi Bankasi A/S | | |
| | |
United Arab Emirates — 0.9% |
Abu Dhabi Commercial Bank PJSC | | |
Abu Dhabi Islamic Bank PJSC | | |
| | |
| | |
| | |
|
United Arab Emirates — continued |
ADNOC Logistics & Services | | |
| | |
Dubai Electricity & Water Authority PJSC | | |
| | |
| | |
| | |
| | |
| | |
|
| | |
| | |
| | |
|
| | |
ExlService Holdings, Inc. * | | |
| | |
| | |
| | |
|
| | |
Total Common Stocks
(Cost $956,439,885) | | |
Short-Term Investments — 0.8% |
Investment Companies — 0.7% |
JPMorgan Prime Money Market Fund Class IM Shares, 4.90% (c) (d)
(Cost $7,607,812) | | |
Investment of Cash Collateral from Securities Loaned — 0.1% |
JPMorgan Securities Lending Money Market Fund Agency SL Class Shares, 4.85% (c) (d)(Cost $1,234,130) | | |
Total Short-Term Investments
(Cost $8,841,942) | | |
Total Investments — 100.4%
(Cost $965,281,827) | | |
Liabilities in Excess of Other Assets — (0.4)% | | |
| | |
Percentages indicated are based on net assets. |
SEE NOTES TO FINANCIAL STATEMENTS.
| J.P. Morgan Exchange-Traded Funds | |
| |
| American Depositary Receipt |
| |
| Global Depositary Receipt |
| |
| Non-Voting Depositary Receipt |
| Public Joint Stock Company |
| A special type of equity investment that shares in the earnings of the company, has limited voting rights, and may have a dividend preference. Preference shares may also have liquidation preference. |
| Limited liability company |
| Real Estate Investment Trust |
| |
| |
| Amount rounds to less than 0.1% of net assets. |
| Value determined using significant unobservable inputs. | |
| Non-income producing security. | |
| Security exempt from registration pursuant to Regulation S under the Securities Act of 1933, as amended. Regulation S applies to securities offerings that are made outside of the United States and do not involve direct selling efforts in the United States and as such may have restrictions on resale. | |
| The security or a portion of this security is on loan at October 31, 2024. The total value of securities on loan at October 31, 2024 is $911,320. | |
| Investment in an affiliated fund, which is registered under the Investment Company Act of 1940, as amended, and is advised by J.P. Morgan Investment Management Inc. | |
| The rate shown is the current yield as of October 31, 2024. | |
Summary of Investments by Industry, October 31, 2024
The following table represents the portfolio investments of the Fund by industry classifications as a percentage of total investments:
| PERCENT OF
TOTAL
INVESTMENTS |
| |
Semiconductors & Semiconductor Equipment | |
Interactive Media & Services | |
Technology Hardware, Storage & Peripherals | |
| |
| |
| |
Oil, Gas & Consumable Fuels | |
| |
Consumer Staples Distribution & Retail | |
Electronic Equipment, Instruments & Components | |
Hotels, Restaurants & Leisure | |
| |
| |
| |
| |
| |
| |
| |
| |
| |
| |
| |
Others (each less than 1.0%) | |
| |
SEE NOTES TO FINANCIAL STATEMENTS.
| J.P. Morgan Exchange-Traded Funds | |
JPMorgan Dividend Leaders ETF
SCHEDULE OF PORTFOLIO INVESTMENTSAS OF October 31, 2024
| | |
|
|
| | |
|
| | |
|
Novo Nordisk A/S, Class B | | |
|
| | |
|
Cie Generale des Etablissements Michelin SCA | | |
| | |
LVMH Moet Hennessy Louis Vuitton SE | | |
| | |
| | |
| | |
| | |
|
| | |
| | |
| | |
|
| | |
Hong Kong Exchanges & Clearing Ltd. | | |
| | |
|
Bank Central Asia Tbk. PT | | |
|
| | |
|
| | |
|
| | |
| | |
Japan Exchange Group, Inc. | | |
Shin-Etsu Chemical Co. Ltd. | | |
Tokio Marine Holdings, Inc. | | |
| | |
|
Wal-Mart de Mexico SAB de CV | | |
|
| | |
| | |
|
|
| | |
| | |
| | |
|
| | |
| | |
| | |
|
| | |
|
| | |
|
| | |
|
Taiwan Semiconductor Manufacturing Co. Ltd., ADR | | |
Taiwan Semiconductor Manufacturing Co. Ltd. | | |
| | |
|
| | |
| | |
| | |
| | |
| | |
|
| | |
| | |
| | |
| | |
| | |
| | |
| | |
| | |
| | |
| | |
| | |
| | |
| | |
| | |
Fidelity National Information Services, Inc. | | |
Honeywell International, Inc. | | |
| | |
SEE NOTES TO FINANCIAL STATEMENTS.
| J.P. Morgan Exchange-Traded Funds | |
| | |
Common Stocks — continued |
United States — continued |
| | |
| | |
Mastercard, Inc., Class A | | |
| | |
| | |
Meta Platforms, Inc., Class A | | |
Microchip Technology, Inc. | | |
| | |
| | |
| | |
| | |
| | |
| | |
| | |
| | |
Seagate Technology Holdings plc | | |
| | |
| | |
| | |
| | |
| | |
| | |
| | |
| | |
Total Common Stocks
(Cost $5,963,389) | | |
Total Investments — 99.2%
(Cost $5,963,389) | | |
Other Assets in Excess of Liabilities — 0.8% | | |
| | |
Percentages indicated are based on net assets. |
| |
| American Depositary Receipt |
| Limited liability company |
| Real Estate Investment Trust |
| Limited partnership with share capital |
Summary of Investments by Industry, October 31, 2024
The following table represents the portfolio investments of the Fund by industry classifications as a percentage of total investments:
| PERCENT OF
TOTAL
INVESTMENTS |
Semiconductors & Semiconductor Equipment | |
| |
| |
| |
| |
| |
Hotels, Restaurants & Leisure | |
| |
Oil, Gas & Consumable Fuels | |
| |
| |
Interactive Media & Services | |
| |
| |
| |
Health Care Providers & Services | |
Textiles, Apparel & Luxury Goods | |
| |
| |
Health Care Equipment & Supplies | |
| |
| |
Construction & Engineering | |
| |
| |
| |
| |
| |
| |
Technology Hardware, Storage & Peripherals | |
Others (each less than 1.0%) | |
SEE NOTES TO FINANCIAL STATEMENTS.
| J.P. Morgan Exchange-Traded Funds | |
JPMorgan Global Select Equity ETF
SCHEDULE OF PORTFOLIO INVESTMENTSAS OF October 31, 2024
| | |
|
|
Novo Nordisk A/S, Class B | | |
|
| | |
| | |
LVMH Moet Hennessy Louis Vuitton SE | | |
| | |
| | |
| | |
| | |
|
| | |
| | |
Muenchener Rueckversicherungs-Gesellschaft AG (Registered) | | |
| | |
|
| | |
Hong Kong Exchanges & Clearing Ltd. | | |
| | |
|
| | |
|
| | |
Japan Exchange Group, Inc. | | |
Shin-Etsu Chemical Co. Ltd. | | |
Tokio Marine Holdings, Inc. | | |
| | |
|
| | |
| | |
| | |
| | |
|
| | |
|
| | |
|
UBS Group AG (Registered) | | |
| | |
|
|
Taiwan Semiconductor Manufacturing Co. Ltd., ADR | | |
Taiwan Semiconductor Manufacturing Co. Ltd. | | |
| | |
|
| | |
| | |
| | |
| | |
| | |
|
| | |
| | |
Advanced Micro Devices, Inc. * | | |
| | |
| | |
| | |
| | |
| | |
| | |
| | |
Charles Schwab Corp. (The) | | |
| | |
| | |
| | |
Digital Realty Trust, Inc., REIT | | |
| | |
| | |
| | |
Fidelity National Information Services, Inc. | | |
| | |
Honeywell International, Inc. | | |
| | |
Mastercard, Inc., Class A | | |
| | |
Meta Platforms, Inc., Class A | | |
Microchip Technology, Inc. | | |
| | |
| | |
Mondelez International, Inc., Class A | | |
| | |
| | |
| | |
| | |
SEE NOTES TO FINANCIAL STATEMENTS.
| J.P. Morgan Exchange-Traded Funds | |
| | |
Common Stocks — continued |
United States — continued |
| | |
| | |
| | |
Regeneron Pharmaceuticals, Inc. * | | |
| | |
| | |
| | |
| | |
| | |
Uber Technologies, Inc. * | | |
| | |
| | |
| | |
| | |
| | |
| | |
| | |
Total Common Stocks
(Cost $4,460,703,518) | | |
Short-Term Investments — 1.2% |
Investment Companies — 1.2% |
JPMorgan Prime Money Market Fund Class IM Shares, 4.90% (a) (b)
(Cost $58,734,188) | | |
Total Investments — 100.2%
(Cost $4,519,437,706) | | |
Liabilities in Excess of Other Assets — (0.2)% | | |
| | |
Percentages indicated are based on net assets. |
| |
| American Depositary Receipt |
| Real Estate Investment Trust |
| Non-income producing security. |
| Investment in an affiliated fund, which is registered under the Investment Company Act of 1940, as amended, and is advised by J.P. Morgan Investment Management Inc. |
| The rate shown is the current yield as of October 31, 2024. |
Summary of Investments by Industry, October 31, 2024
The following table represents the portfolio investments of the Fund by industry classifications as a percentage of total investments:
| PERCENT OF
TOTAL
INVESTMENTS |
Semiconductors & Semiconductor Equipment | |
| |
| |
| |
| |
| |
| |
Technology Hardware, Storage & Peripherals | |
| |
| |
Oil, Gas & Consumable Fuels | |
Interactive Media & Services | |
Health Care Providers & Services | |
Hotels, Restaurants & Leisure | |
| |
Textiles, Apparel & Luxury Goods | |
| |
| |
| |
| |
| |
| |
| |
| |
| |
Energy Equipment & Services | |
Health Care Equipment & Supplies | |
| |
| |
Others (each less than 1.0%) | |
| |
SEE NOTES TO FINANCIAL STATEMENTS.
| J.P. Morgan Exchange-Traded Funds | |
JPMorgan Healthcare Leaders ETF
SCHEDULE OF PORTFOLIO INVESTMENTSAS OF October 31, 2024
| | |
|
|
Novo Nordisk A/S, Class B | | |
| | |
| | |
|
Sartorius AG (Preference) | | |
|
| | |
| | |
| | |
|
| | |
|
Lonza Group AG (Registered) | | |
| | |
Sonova Holding AG (Registered) | | |
| | |
|
| | |
|
| | |
Acadia Healthcare Co., Inc. * | | |
Agios Pharmaceuticals, Inc. * | | |
Alnylam Pharmaceuticals, Inc. * | | |
| | |
Apellis Pharmaceuticals, Inc. * | | |
| | |
| | |
| | |
BioMarin Pharmaceutical, Inc. * | | |
Blueprint Medicines Corp. * | | |
Boston Scientific Corp. * | | |
| | |
| | |
| | |
Cooper Cos., Inc. (The) * | | |
| | |
| | |
| | |
Evolent Health, Inc., Class A * | | |
| | |
Halozyme Therapeutics, Inc. * | | |
| | |
| | |
|
United States — continued |
| | |
IDEXX Laboratories, Inc. * | | |
Inspire Medical Systems, Inc. * | | |
Intra-Cellular Therapies, Inc. * | | |
Intuitive Surgical, Inc. * | | |
| | |
iRhythm Technologies, Inc. * | | |
| | |
| | |
| | |
| | |
| | |
Neurocrine Biosciences, Inc. * | | |
Regeneron Pharmaceuticals, Inc. * | | |
REVOLUTION Medicines, Inc. * | | |
| | |
| | |
Sarepta Therapeutics, Inc. * | | |
| | |
Thermo Fisher Scientific, Inc. | | |
| | |
| | |
Vertex Pharmaceuticals, Inc. * | | |
West Pharmaceutical Services, Inc. | | |
| | |
Total Common Stocks
(Cost $6,359,771) | | |
Total Investments — 99.1%
(Cost $6,359,771) | | |
Other Assets in Excess of Liabilities — 0.9% | | |
| | |
Percentages indicated are based on net assets. |
| |
| A special type of equity investment that shares in the earnings of the company, has limited voting rights, and may have a dividend preference. Preference shares may also have liquidation preference. |
| Non-income producing security. |
SEE NOTES TO FINANCIAL STATEMENTS.
| J.P. Morgan Exchange-Traded Funds | |
Summary of Investments by Industry, October 31, 2024
The following table represents the portfolio investments of the Fund by industry classifications as a percentage of total investments:
| PERCENT OF
TOTAL
INVESTMENTS |
| |
| |
Health Care Providers & Services | |
Health Care Equipment & Supplies | |
Life Sciences Tools & Services | |
| |
SEE NOTES TO FINANCIAL STATEMENTS.
| J.P. Morgan Exchange-Traded Funds | |
JPMorgan Hedged Equity Laddered Overlay ETF
SCHEDULE OF PORTFOLIO INVESTMENTSAS OF October 31, 2024
| | |
|
Aerospace & Defense — 1.5% |
| | |
| | |
| | |
| | |
| | |
Air Freight & Logistics — 0.9% |
| | |
United Parcel Service, Inc., Class B | | |
| | |
Automobile Components — 0.1% |
| | |
|
| | |
|
| | |
| | |
| | |
| | |
| | |
| | |
| | |
|
| | |
| | |
| | |
| | |
|
| | |
| | |
BioMarin Pharmaceutical, Inc. * | | |
Neurocrine Biosciences, Inc. * | | |
Regeneron Pharmaceuticals, Inc. * | | |
Sarepta Therapeutics, Inc. * | | |
Vertex Pharmaceuticals, Inc. * | | |
| | |
|
| | |
|
| | |
| | |
|
Building Products — continued |
| | |
| | |
| | |
|
Ameriprise Financial, Inc. | | |
Charles Schwab Corp. (The) | | |
| | |
Goldman Sachs Group, Inc. (The) (a) | | |
| | |
| | |
|
| | |
| | |
LyondellBasell Industries NV, Class A | | |
| | |
| | |
Communications Equipment — 0.3% |
| | |
| | |
| | |
Construction Materials — 0.2% |
Martin Marietta Materials, Inc. | | |
|
| | |
Consumer Staples Distribution & Retail — 0.8% |
Costco Wholesale Corp. (a) | | |
| | |
| | |
|
| | |
Diversified Telecommunication Services — 0.2% |
| | |
Electric Utilities — 2.2% |
| | |
| | |
| | |
| | |
| | |
| | |
SEE NOTES TO FINANCIAL STATEMENTS.
| J.P. Morgan Exchange-Traded Funds | |
| | |
Common Stocks — continued |
Electrical Equipment — 0.4% |
| | |
| | |
| | |
Electronic Equipment, Instruments & Components — 0.1% |
TE Connectivity plc (Switzerland) | | |
Energy Equipment & Services — 0.2% |
| | |
|
| | |
Warner Music Group Corp., Class A | | |
| | |
Financial Services — 5.7% |
Berkshire Hathaway, Inc., Class B * (a) | | |
| | |
| | |
Fidelity National Information Services, Inc. | | |
Mastercard, Inc., Class A (a) | | |
| | |
| | |
|
Mondelez International, Inc., Class A (a) | | |
Ground Transportation — 1.2% |
| | |
Uber Technologies, Inc. * | | |
| | |
| | |
Health Care Equipment & Supplies — 2.0% |
| | |
Baxter International, Inc. | | |
Boston Scientific Corp. * (a) | | |
| | |
| | |
| | |
Health Care Providers & Services — 2.3% |
| | |
| | |
| | |
| | |
UnitedHealth Group, Inc. (a) | | |
| | |
| | |
|
|
| | |
| | |
| | |
Hotels, Restaurants & Leisure — 3.3% |
| | |
Chipotle Mexican Grill, Inc. * | | |
DoorDash, Inc., Class A * | | |
| | |
Hilton Worldwide Holdings, Inc. | | |
| | |
Royal Caribbean Cruises Ltd. | | |
| | |
| | |
Household Durables — 0.1% |
| | |
Household Products — 0.5% |
Church & Dwight Co., Inc. | | |
Procter & Gamble Co. (The) | | |
| | |
Independent Power and Renewable Electricity Producers — 0.1% |
| | |
Industrial Conglomerates — 0.9% |
Honeywell International, Inc. (a) | | |
|
| | |
|
| | |
Marsh & McLennan Cos., Inc. | | |
| | |
Principal Financial Group, Inc. | | |
| | |
Travelers Cos., Inc. (The) | | |
| | |
Interactive Media & Services — 6.5% |
Alphabet, Inc., Class A (a) | | |
Alphabet, Inc., Class C (a) | | |
Meta Platforms, Inc., Class A (a) | | |
| | |
SEE NOTES TO FINANCIAL STATEMENTS.
| J.P. Morgan Exchange-Traded Funds | |
JPMorgan Hedged Equity Laddered Overlay ETF
SCHEDULE OF PORTFOLIO INVESTMENTSAS OF October 31, 2024 (continued)
| | |
Common Stocks — continued |
|
Accenture plc, Class A (Ireland) | | |
Cognizant Technology Solutions Corp., Class A | | |
| | |
Life Sciences Tools & Services — 1.4% |
| | |
Thermo Fisher Scientific, Inc. | | |
| | |
|
| | |
| | |
| | |
| | |
| | |
|
Charter Communications, Inc., Class A * | | |
Comcast Corp., Class A (a) | | |
| | |
| | |
|
| | |
|
| | |
| | |
| | |
Oil, Gas & Consumable Fuels — 3.2% |
| | |
| | |
| | |
| | |
| | |
| | |
| | |
Passenger Airlines — 0.2% |
| | |
Personal Care Products — 0.3% |
Estee Lauder Cos., Inc. (The), Class A | | |
| | |
| | |
|
| | |
| | |
|
Pharmaceuticals — continued |
| | |
| | |
| | |
| | |
Professional Services — 0.4% |
| | |
|
Equity LifeStyle Properties, Inc. | | |
Semiconductors & Semiconductor Equipment — 12.3% |
Advanced Micro Devices, Inc. * (a) | | |
| | |
| | |
| | |
| | |
| | |
| | |
NXP Semiconductors NV (China) (a) | | |
Texas Instruments, Inc. (a) | | |
| | |
|
| | |
Cadence Design Systems, Inc. * | | |
| | |
| | |
| | |
| | |
| | |
| | |
|
Digital Realty Trust, Inc. | | |
| | |
| | |
| | |
|
| | |
| | |
Burlington Stores, Inc. * | | |
| | |
O'Reilly Automotive, Inc. * | | |
| | |
| | |
SEE NOTES TO FINANCIAL STATEMENTS.
| J.P. Morgan Exchange-Traded Funds | |
| | |
Common Stocks — continued |
Technology Hardware, Storage & Peripherals — 7.8% |
| | |
Hewlett Packard Enterprise Co. | | |
Seagate Technology Holdings plc | | |
| | |
| | |
Textiles, Apparel & Luxury Goods — 0.1% |
Lululemon Athletica, Inc. * | | |
|
| | |
Philip Morris International, Inc. | | |
| | |
Trading Companies & Distributors — 0.1% |
| | |
Wireless Telecommunication Services — 0.2% |
| | |
Total Common Stocks
(Cost $1,696,613,403) | | |
| | |
|
Put Options Purchased — 1.2% |
| | |
11/29/2024 at USD 533.00, American Style | | |
Notional Amount: USD 607,534,976 | | |
Counterparty: Exchange-Traded * | | |
12/31/2024 at USD 543.00, American Style | | |
Notional Amount: USD 607,534,976 | | |
Counterparty: Exchange-Traded * | | |
1/31/2025 at USD 538.00, American Style | | |
Notional Amount: USD 619,817,600 | | |
Counterparty: Exchange-Traded * | | |
Total Put Options Purchased
(Cost $24,357,375) | | |
| | |
Short-Term Investments — 0.1% |
Investment Companies — 0.1% |
JPMorgan U.S. Government Money Market Fund Class IM Shares, 4.80% (b) (c)
(Cost $3,197,539) | | |
Total Investments — 101.0%
(Cost $1,724,168,317) | | |
Liabilities in Excess of Other Assets — (1.0)% | | |
| | |
Percentages indicated are based on net assets. |
| |
| |
| Real Estate Investment Trust |
| Standard & Poor's Depositary Receipt |
| |
| Amount rounds to less than 0.1% of net assets. |
| Non-income producing security. | |
| All or a portion of the security is segregated for options written. | |
| Investment in an affiliated fund, which is registered under the Investment Company Act of 1940, as amended, and is advised by J.P. Morgan Investment Management Inc. | |
| The rate shown is the current yield as of October 31, 2024. | |
SEE NOTES TO FINANCIAL STATEMENTS.
| J.P. Morgan Exchange-Traded Funds | |
JPMorgan Hedged Equity Laddered Overlay ETF
SCHEDULE OF PORTFOLIO INVESTMENTSAS OF October 31, 2024 (continued)
Written Call Options Contracts as of October 31, 2024
|
| | | | | | |
| | | | | | |
| | | | | | |
| | | | | | |
| |
Written Put Options Contracts as of October 31, 2024
|
| | | | | | |
| | | | | | |
| | | | | | |
| | | | | | |
| | | | | | |
Total Written Options Contracts (Premiums Received $24,178,782) | |
| |
| |
| Standard & Poor's Depositary Receipt |
| |
SEE NOTES TO FINANCIAL STATEMENTS.
| J.P. Morgan Exchange-Traded Funds | |
JPMorgan International Growth ETF
SCHEDULE OF PORTFOLIO INVESTMENTSAS OF October 31, 2024
| | |
|
|
| | |
|
| | |
NU Holdings Ltd., Class A * | | |
| | |
|
Alimentation Couche-Tard, Inc. | | |
Canadian Pacific Kansas City Ltd. | | |
| | |
| | |
|
Fuyao Glass Industry Group Co. Ltd., Class H (a) | | |
PDD Holdings, Inc., ADR * | | |
Shenzhen Mindray Bio-Medical Electronics Co. Ltd., Class A | | |
| | |
| | |
| | |
|
| | |
Novo Nordisk A/S, Class B | | |
| | |
|
| | |
| | |
| | |
LVMH Moet Hennessy Louis Vuitton SE | | |
| | |
| | |
|
Muenchener Rueckversicherungs-Gesellschaft AG (Registered) | | |
| | |
| | |
|
Hong Kong Exchanges & Clearing Ltd. | | |
|
| | |
Computer Age Management Services Ltd. | | |
| | |
| | |
|
|
Bank Central Asia Tbk. PT | | |
Bank Rakyat Indonesia Persero Tbk. PT | | |
| | |
|
Ryanair Holdings plc, ADR | | |
|
| | |
| | |
| | |
| | |
| | |
| | |
| | |
| | |
| | |
Recruit Holdings Co. Ltd. | | |
Shin-Etsu Chemical Co. Ltd. | | |
| | |
| | |
Tokio Marine Holdings, Inc. | | |
| | |
|
| | |
Wal-Mart de Mexico SAB de CV | | |
| | |
|
| | |
| | |
| | |
| | |
| | |
| | |
|
| | |
|
| | |
| | |
| | |
| | |
SEE NOTES TO FINANCIAL STATEMENTS.
| J.P. Morgan Exchange-Traded Funds | |
JPMorgan International Growth ETF
SCHEDULE OF PORTFOLIO INVESTMENTSAS OF October 31, 2024 (continued)
| | |
Common Stocks — continued |
|
| | |
Industria de Diseno Textil SA | | |
| | |
|
| | |
| | |
| | |
|
Cie Financiere Richemont SA (Registered) | | |
|
| | |
Taiwan Semiconductor Manufacturing Co. Ltd., ADR | | |
Taiwan Semiconductor Manufacturing Co. Ltd. | | |
| | |
|
| | |
| | |
InterContinental Hotels Group plc | | |
London Stock Exchange Group plc | | |
| | |
| | |
| | |
| | |
| | |
|
| | |
| | |
| | |
| | |
| | |
| | |
Total Common Stocks
(Cost $87,721,168) | | |
Short-Term Investments — 4.0% |
Investment Companies — 4.0% |
JPMorgan Prime Money Market Fund Class IM Shares, 4.90% (b) (c)
(Cost $4,280,612) | | |
| | |
Total Investments — 99.6%
(Cost $92,001,780) | | |
Other Assets in Excess of Liabilities — 0.4% | | |
| | |
Percentages indicated are based on net assets. |
| |
| American Depositary Receipt |
| Limited liability company |
| Real Estate Investment Trust |
| Non-income producing security. |
| Security exempt from registration pursuant to Regulation S under the Securities Act of 1933, as amended. Regulation S applies to securities offerings that are made outside of the United States and do not involve direct selling efforts in the United States and as such may have restrictions on resale. |
| Investment in an affiliated fund, which is registered under the Investment Company Act of 1940, as amended, and is advised by J.P. Morgan Investment Management Inc. |
| The rate shown is the current yield as of October 31, 2024. |
SEE NOTES TO FINANCIAL STATEMENTS.
| J.P. Morgan Exchange-Traded Funds | |
Summary of Investments by Industry, October 31, 2024
The following table represents the portfolio investments of the Fund by industry classifications as a percentage of total investments:
| PERCENT OF
TOTAL
INVESTMENTS |
Semiconductors & Semiconductor Equipment | |
Hotels, Restaurants & Leisure | |
| |
| |
| |
| |
Interactive Media & Services | |
| |
Health Care Equipment & Supplies | |
| |
| |
| |
Electronic Equipment, Instruments & Components | |
| |
Textiles, Apparel & Luxury Goods | |
Consumer Staples Distribution & Retail | |
| |
| |
| |
| |
| |
| |
| |
| |
| |
Construction & Engineering | |
| |
Others (each less than 1.0%) | |
| |
Futures contracts outstanding as of October 31, 2024:
| | | | | VALUE AND
UNREALIZED
APPRECIATION
(DEPRECIATION) ($) |
| | | | | |
| | | | | |
SEE NOTES TO FINANCIAL STATEMENTS.
| J.P. Morgan Exchange-Traded Funds | |
JPMorgan International Growth ETF
SCHEDULE OF PORTFOLIO INVESTMENTSAS OF October 31, 2024 (continued)
| |
| International Financial Service Centre |
| |
SEE NOTES TO FINANCIAL STATEMENTS.
| J.P. Morgan Exchange-Traded Funds | |
JPMorgan International Value ETF
SCHEDULE OF PORTFOLIO INVESTMENTSAS OF October 31, 2024
| | |
|
|
| | |
| | |
| | |
| | |
Ventia Services Group Pty. Ltd. | | |
| | |
| | |
| | |
|
| | |
| | |
| | |
Vienna Insurance Group AG Wiener Versicherung Gruppe | | |
| | |
|
| | |
| | |
| | |
| | |
| | |
|
| | |
Cia de Saneamento de Minas Gerais Copasa MG | | |
Cia Energetica de Minas Gerais (Preference) | | |
| | |
| | |
Petroleo Brasileiro SA (Preference) | | |
| | |
| | |
| | |
|
Bank of Nova Scotia (The) | | |
Canadian Natural Resources Ltd. | | |
| | |
Dundee Precious Metals, Inc. | | |
| | |
Fairfax Financial Holdings Ltd. | | |
| | |
| | |
| | |
Precision Drilling Corp. * | | |
| | |
| | |
|
|
| | |
Toronto-Dominion Bank (The) | | |
| | |
| | |
|
Agricultural Bank of China Ltd., Class H | | |
Alibaba Group Holding Ltd. | | |
BOC Hong Kong Holdings Ltd. | | |
China CITIC Bank Corp. Ltd., Class H | | |
China Coal Energy Co. Ltd., Class H | | |
China Construction Bank Corp., Class H | | |
| | |
China Merchants Bank Co. Ltd., Class H | | |
China Pacific Insurance Group Co. Ltd., Class H | | |
China Resources Pharmaceutical Group Ltd. (a) | | |
CSPC Pharmaceutical Group Ltd. | | |
Geely Automobile Holdings Ltd. | | |
Gree Electric Appliances, Inc. of Zhuhai, Class A | | |
Industrial & Commercial Bank of China Ltd., Class H | | |
| | |
Jiangxi Copper Co. Ltd., Class H | | |
| | |
| | |
Livzon Pharmaceutical Group, Inc., Class H | | |
People's Insurance Co. Group of China Ltd. (The), Class H | | |
PetroChina Co. Ltd., Class H | | |
PICC Property & Casualty Co. Ltd., Class H | | |
Ping An Insurance Group Co. of China Ltd., Class H | | |
Sinopharm Group Co. Ltd., Class H | | |
| | |
Vipshop Holdings Ltd., ADR | | |
Weichai Power Co. Ltd., Class H | | |
Yangzijiang Shipbuilding Holdings Ltd. | | |
| | |
|
| | |
| | |
| | |
| | |
SEE NOTES TO FINANCIAL STATEMENTS.
| J.P. Morgan Exchange-Traded Funds | |
JPMorgan International Value ETF
SCHEDULE OF PORTFOLIO INVESTMENTSAS OF October 31, 2024 (continued)
| | |
Common Stocks — continued |
|
| | |
| | |
| | |
| | |
|
| | |
| | |
| | |
| | |
Cie Generale des Etablissements Michelin SCA | | |
| | |
| | |
| | |
| | |
| | |
| | |
Unibail-Rodamco-Westfield, REIT | | |
| | |
| | |
| | |
| | |
|
Bank of Georgia Group plc | | |
|
| | |
| | |
| | |
Deutsche Bank AG (Registered) | | |
Deutsche Telekom AG (Registered) | | |
| | |
| | |
| | |
Fresenius SE & Co. KGaA * | | |
| | |
Henkel AG & Co. KGaA (Preference) | | |
Hornbach Holding AG & Co. KGaA | | |
| | |
Muenchener Rueckversicherungs-Gesellschaft AG (Registered) | | |
| | |
| | |
| | |
| | |
|
|
| | |
| | |
| | |
|
Eurobank Ergasias Services and Holdings SA | | |
Hellenic Telecommunications Organization SA | | |
National Bank of Greece SA | | |
| | |
|
Bank of East Asia Ltd. (The) | | |
Cathay Pacific Airways Ltd. | | |
| | |
Pacific Basin Shipping Ltd. | | |
| | |
United Laboratories International Holdings Ltd. (The) | | |
| | |
|
| | |
|
| | |
Bharat Petroleum Corp. Ltd. | | |
| | |
| | |
| | |
| | |
| | |
Oil & Natural Gas Corp. Ltd. | | |
State Bank of India, GDR (a) | | |
| | |
| | |
| | |
|
Adaro Energy Indonesia Tbk. PT | | |
Astra International Tbk. PT | | |
| | |
| | |
|
| | |
| | |
Bank of Ireland Group plc | | |
| | |
SEE NOTES TO FINANCIAL STATEMENTS.
| J.P. Morgan Exchange-Traded Funds | |
| | |
Common Stocks — continued |
|
Glenveagh Properties plc * (a) | | |
| | |
| | |
|
Banca Monte dei Paschi di Siena SpA | | |
| | |
| | |
| | |
| | |
Danieli & C Officine Meccaniche SpA | | |
| | |
| | |
| | |
Mediobanca Banca di Credito Finanziario SpA | | |
MFE-MediaForEurope NV, Class B | | |
| | |
| | |
| | |
| | |
| | |
|
Asahi Group Holdings Ltd. | | |
Cosmo Energy Holdings Co. Ltd. | | |
| | |
Dai-ichi Life Holdings, Inc. | | |
| | |
Furukawa Electric Co. Ltd. | | |
| | |
Hokkaido Electric Power Co., Inc. | | |
| | |
| | |
| | |
| | |
Japan Petroleum Exploration Co. Ltd. | | |
| | |
Kansai Electric Power Co., Inc. (The) | | |
| | |
| | |
| | |
| | |
Mitsubishi UFJ Financial Group, Inc. | | |
Mizuho Financial Group, Inc. | | |
| | |
| | |
|
|
MS&AD Insurance Group Holdings, Inc. | | |
| | |
Nomura Real Estate Holdings, Inc. | | |
| | |
| | |
| | |
| | |
Sega Sammy Holdings, Inc. | | |
| | |
| | |
SKY Perfect JSAT Holdings, Inc. | | |
| | |
| | |
| | |
Sumitomo Electric Industries Ltd. | | |
Sumitomo Mitsui Financial Group, Inc. | | |
Sumitomo Realty & Development Co. Ltd. | | |
Sumitomo Rubber Industries Ltd. | | |
| | |
| | |
Tokyo Steel Manufacturing Co. Ltd. | | |
| | |
Tokyu Fudosan Holdings Corp. | | |
| | |
| | |
| | |
Yokohama Rubber Co. Ltd. (The) | | |
| | |
|
| | |
|
ABN AMRO Bank NV, CVA (a) | | |
| | |
| | |
Eurocommercial Properties NV, REIT | | |
| | |
| | |
Koninklijke Heijmans N.V., CVA | | |
| | |
| | |
| | |
| | |
SEE NOTES TO FINANCIAL STATEMENTS.
| J.P. Morgan Exchange-Traded Funds | |
JPMorgan International Value ETF
SCHEDULE OF PORTFOLIO INVESTMENTSAS OF October 31, 2024 (continued)
| | |
Common Stocks — continued |
|
| | |
| | |
| | |
| | |
| | |
| | |
| | |
|
| | |
|
| | |
|
Banco Comercial Portugues SA, Class R | | |
|
| | |
| | |
Oversea-Chinese Banking Corp. Ltd. | | |
United Overseas Bank Ltd. | | |
| | |
|
| | |
| | |
| | |
| | |
|
| | |
| | |
| | |
| | |
Hana Financial Group, Inc. | | |
Hankook Tire & Technology Co. Ltd. | | |
| | |
| | |
| | |
Hyundai Marine & Fire Insurance Co. Ltd. | | |
| | |
| | |
| | |
| | |
| | |
Korean Air Lines Co. Ltd. | | |
| | |
| | |
|
|
| | |
Kumho Petrochemical Co. Ltd. | | |
Samsung Electronics Co. Ltd. | | |
Samsung Fire & Marine Insurance Co. Ltd. | | |
Samsung Life Insurance Co. Ltd. | | |
| | |
| | |
|
Banco Bilbao Vizcaya Argentaria SA | | |
| | |
| | |
| | |
| | |
Grupo Catalana Occidente SA | | |
| | |
| | |
| | |
|
| | |
| | |
| | |
Skandinaviska Enskilda Banken AB, Class A | | |
Storskogen Group AB, Class B | | |
Svenska Handelsbanken AB, Class A | | |
| | |
| | |
| | |
| | |
|
| | |
| | |
Zurich Insurance Group AG | | |
| | |
|
Compeq Manufacturing Co. Ltd. | | |
| | |
Hon Hai Precision Industry Co. Ltd. | | |
| | |
United Microelectronics Corp. | | |
| | |
|
| | |
SEE NOTES TO FINANCIAL STATEMENTS.
| J.P. Morgan Exchange-Traded Funds | |
| | |
Common Stocks — continued |
|
Krung Thai Bank PCL, NVDR | | |
PTT Exploration & Production PCL, NVDR | | |
| | |
|
| | |
Tofas Turk Otomobil Fabrikasi A/S | | |
Turkcell Iletisim Hizmetleri A/S | | |
Turkiye Garanti Bankasi A/S | | |
| | |
United Arab Emirates — 0.7% |
| | |
| | |
| | |
| | |
|
| | |
| | |
| | |
| | |
| | |
British American Tobacco plc | | |
British Land Co. plc (The), REIT | | |
| | |
| | |
| | |
| | |
| | |
| | |
| | |
| | |
| | |
International Consolidated Airlines Group SA | | |
| | |
| | |
| | |
| | |
| | |
| | |
Land Securities Group plc, REIT | | |
| | |
Marks & Spencer Group plc | | |
| | |
| | |
| | |
|
United Kingdom — continued |
Paragon Banking Group plc | | |
| | |
Shaftesbury Capital plc, REIT | | |
| | |
| | |
| | |
| | |
Watches of Switzerland Group plc * (b) | | |
| | |
|
| | |
| | |
| | |
| | |
| | |
| | |
| | |
| | |
Total Common Stocks
(Cost $95,980,142) | | |
Short-Term Investments — 1.8% |
Investment Companies — 1.8% |
JPMorgan Prime Money Market Fund Class IM Shares, 4.90% (c) (d)
(Cost $1,798,141) | | |
Total Investments — 99.5%
(Cost $97,778,283) | | |
Other Assets in Excess of Liabilities — 0.5% | | |
| | |
Percentages indicated are based on net assets. |
| |
| American Depositary Receipt |
| Certificaten Van Aandelen (Dutch Certificate) |
| Global Depositary Receipt |
| Non-Voting Depositary Receipt |
| |
| Public Joint Stock Company |
| A special type of equity investment that shares in the earnings of the company, has limited voting rights, and may have a dividend preference. Preference shares may also have liquidation preference. |
| Limited liability company |
SEE NOTES TO FINANCIAL STATEMENTS.
| J.P. Morgan Exchange-Traded Funds | |
JPMorgan International Value ETF
SCHEDULE OF PORTFOLIO INVESTMENTSAS OF October 31, 2024 (continued)
| Real Estate Investment Trust |
| Limited partnership with share capital |
| Non-income producing security. |
| Security exempt from registration pursuant to Regulation S under the Securities Act of 1933, as amended. Regulation S applies to securities offerings that are made outside of the United States and do not involve direct selling efforts in the United States and as such may have restrictions on resale. |
| Securities exempt from registration under Rule 144A or section 4(a)(2), of the Securities Act of 1933, as amended. |
| Investment in an affiliated fund, which is registered under the Investment Company Act of 1940, as amended, and is advised by J.P. Morgan Investment Management Inc. |
| The rate shown is the current yield as of October 31, 2024. |
Summary of Investments by Industry, October 31, 2024
The following table represents the portfolio investments of the Fund by industry classifications as a percentage of total investments:
| PERCENT OF
TOTAL
INVESTMENTS |
| |
| |
Oil, Gas & Consumable Fuels | |
| |
| |
Diversified Telecommunication Services | |
Construction & Engineering | |
| |
| |
Trading Companies & Distributors | |
| |
| |
| |
Real Estate Management & Development | |
| |
Wireless Telecommunication Services | |
| |
| |
Energy Equipment & Services | |
Technology Hardware, Storage & Peripherals | |
| |
| |
| |
Electronic Equipment, Instruments & Components | |
| |
| |
Others (each less than 1.0%) | |
| |
SEE NOTES TO FINANCIAL STATEMENTS.
| J.P. Morgan Exchange-Traded Funds | |
STATEMENTS OF ASSETS AND LIABILITIESAS OF October 31, 2024
| | JPMorgan
Active Developing
Markets
Equity ETF | JPMorgan
ActiveBuilders
Emerging Markets
Equity ETF |
| | | |
Investments in non-affiliates, at value | | | |
Investments in affiliates, at value | | | |
Investments of cash collateral received from securities loaned, at value (See Note 2.C.) | | | |
| | | |
Foreign currency, at value | | | |
| | | |
Investment securities sold | | | |
Dividends from non-affiliates | | | |
Dividends from affiliates | | | |
| | | |
Securities lending income (See Note 2.C.) | | | |
| | | |
| | | |
| | | |
Investment securities purchased | | | |
Collateral received on securities loaned (See Note 2.C.) | | | |
| | | |
Management fees (See Note 3.A.) | | | |
Deferred foreign capital gains tax | | | |
| | | |
| | | |
| | | |
| | | |
Total distributable earnings (loss) | | | |
| | | |
Outstanding number of shares
(unlimited number of shares authorized - par value $0.0001) | | | |
Net asset value, per share | | | |
Cost of investments in non-affiliates | | | |
Cost of investments in affiliates | | | |
| | | |
Investment securities on loan, at value (See Note 2.C.) | | | |
Cost of investment of cash collateral (See Note 2.C.) | | | |
SEE NOTES TO FINANCIAL STATEMENTS.
| J.P. Morgan Exchange-Traded Funds | |
STATEMENTS OF ASSETS AND LIABILITIESAS OF October 31, 2024 (continued)
| JPMorgan
Dividend
Leaders ETF | JPMorgan
Global Select
Equity ETF | JPMorgan
Healthcare
Leaders ETF |
| | | |
Investments in non-affiliates, at value | | | |
Investments in affiliates, at value | | | |
| | | |
Foreign currency, at value | | | |
Segregated cash balance with Authorized Participant for deposit securities | | | |
| | | |
Investment securities sold | | | |
| | | |
Dividends from non-affiliates | | | |
Dividends from affiliates | | | |
| | | |
| | | |
| | | |
| | | |
Foreign currency due to custodian, at value | | | |
Investment securities purchased | | | |
| | | |
Collateral upon return of deposit securities | | | |
| | | |
Management fees (See Note 3.A.) | | | |
| | | |
| | | |
| | | |
| | | |
Total distributable earnings (loss) | | | |
| | | |
Outstanding number of shares
(unlimited number of shares authorized - par value $0.0001) | | | |
Net asset value, per share | | | |
Cost of investments in non-affiliates | | | |
Cost of investments in affiliates | | | |
| | | |
SEE NOTES TO FINANCIAL STATEMENTS.
| J.P. Morgan Exchange-Traded Funds | |
| JPMorgan
Hedged Equity
Laddered Overlay ETF | JPMorgan
International
Growth ETF | JPMorgan
International
Value ETF |
| | | |
Investments in non-affiliates, at value | | | |
Investments in affiliates, at value | | | |
Options purchased, at value | | | |
Restricted cash for exchange-traded options | | | |
| | | |
Foreign currency, at value | | | |
Deposits at broker for futures contracts | | | |
Segregated cash balance with Authorized Participant for deposit securities | | | |
| | | |
Investment securities sold | | | |
| | | |
Dividends from non-affiliates | | | |
Dividends from affiliates | | | |
| | | |
Securities lending income (See Note 2.C.) | | | |
| | | |
| | | |
| | | |
Investment securities purchased | | | |
Variation margin on futures contracts | | | |
Collateral upon return of deposit securities | | | |
Outstanding options written, at fair value | | | |
| | | |
Management fees (See Note 3.A.) | | | |
Deferred foreign capital gains tax | | | |
| | | |
| | | |
| | | |
| | | |
Total distributable earnings (loss) | | | |
| | | |
Outstanding number of shares
(unlimited number of shares authorized - par value $0.0001) | | | |
Net asset value, per share | | | |
Cost of investments in non-affiliates | | | |
Cost of investments in affiliates | | | |
Cost of options purchased | | | |
| | | |
Premiums received from options written | | | |
SEE NOTES TO FINANCIAL STATEMENTS.
| J.P. Morgan Exchange-Traded Funds | |
STATEMENTS OF OPERATIONSFOR THE YEAR ENDED October 31, 2024
| | JPMorgan
Active Developing
Markets
Equity ETF (a) | JPMorgan
ActiveBuilders
Emerging Markets
|
| | | |
Interest income from non-affiliates | | | |
Interest income from affiliates | | | |
Dividend income from non-affiliates | | | |
Dividend income from affiliates | | | |
Income from securities lending (net) (See Note 2.C.) | | | |
Foreign taxes withheld (net) | | | |
| | | |
| | | |
Management fees (See Note 3.A.) | | | |
Interest expense to non-affiliates | | | |
Interest expense to affiliates | | | |
| | | |
Net investment income (loss) | | | |
REALIZED/UNREALIZED GAINS (LOSSES): | | | |
Net realized gain (loss) on transactions from: | | | |
Investments in non-affiliates | | | |
Investments in affiliates | | | |
In-kind redemptions of investments in non-affiliates (See Note 4) | | | |
| | | |
Foreign currency transactions | | | |
| | | |
Change in net unrealized appreciation/depreciation on: | | | |
Investments in non-affiliates | | | |
Investments in affiliates | | | |
Foreign currency translations | | | |
Change in net unrealized appreciation/depreciation | | | |
Net realized/unrealized gains (losses) | | | |
Change in net assets resulting from operations | | | |
(a)
Commencement of operations was May 16, 2024.
(b)
Net of foreign capital gains tax of $(1,507).
(c)
Net of foreign capital gains tax of $(2,048,084).
(d)
Net of change in foreign capital gains tax of $(13,381).
(e)
Net of change in foreign capital gains tax of $(3,803,425).
SEE NOTES TO FINANCIAL STATEMENTS.
| J.P. Morgan Exchange-Traded Funds | |
| JPMorgan
Dividend
Leaders ETF (a) | JPMorgan
Global Select
Equity ETF | |
| | | |
Interest income from non-affiliates | | | |
Interest income from affiliates | | | |
Dividend income from non-affiliates | | | |
Dividend income from affiliates | | | |
Foreign taxes withheld (net) | | | |
| | | |
| | | |
Management fees (See Note 3.A.) | | | |
Interest expense to non-affiliates | | | |
Interest expense to affiliates | | | |
| | | |
Net investment income (loss) | | | |
REALIZED/UNREALIZED GAINS (LOSSES): | | | |
Net realized gain (loss) on transactions from: | | | |
Investments in non-affiliates | | | |
Investments in affiliates | | | |
In-kind redemptions of investments in non-affiliates (See Note 4) | | | |
Foreign currency transactions | | | |
| | | |
Change in net unrealized appreciation/depreciation on: | | | |
Investments in non-affiliates | | | |
Investments in affiliates | | | |
Foreign currency translations | | | |
Change in net unrealized appreciation/depreciation | | | |
Net realized/unrealized gains (losses) | | | |
Change in net assets resulting from operations | | | |
(a)
Commencement of operations was September 25, 2024.
(b)
Commencement of operations was November 1, 2023.
SEE NOTES TO FINANCIAL STATEMENTS.
| J.P. Morgan Exchange-Traded Funds | |
STATEMENTS OF OPERATIONSFOR THE YEAR ENDED October 31, 2024 (continued)
| JPMorgan
Hedged Equity
Laddered Overlay ETF | JPMorgan
International
Growth ETF | |
| | | |
Interest income from non-affiliates | | | |
Interest income from affiliates | | | |
Dividend income from non-affiliates | | | |
Dividend income from affiliates | | | |
Income from securities lending (net) (See Note 2.C.) | | | |
Foreign taxes withheld (net) | | | |
| | | |
| | | |
Management fees (See Note 3.A.) | | | |
Interest expense to non-affiliates | | | |
Interest expense to affiliates | | | |
| | | |
Net investment income (loss) | | | |
REALIZED/UNREALIZED GAINS (LOSSES): | | | |
Net realized gain (loss) on transactions from: | | | |
Investments in non-affiliates | | | |
Investments in affiliates | | | |
In-kind redemptions of investments in non-affiliates (See Note 4) | | | |
In-kind redemptions of options purchased (See Note 4) | | | |
| | | |
| | | |
Foreign currency transactions | | | |
| | | |
| | | |
Change in net unrealized appreciation/depreciation on: | | | |
Investments in non-affiliates | | | |
Investments in affiliates | | | |
| | | |
| | | |
Foreign currency translations | | | |
| | | |
Change in net unrealized appreciation/depreciation | | | |
Net realized/unrealized gains (losses) | | | |
Change in net assets resulting from operations | | | |
(a)
Net of foreign capital gains tax of $(6,785).
(b)
Net of change in foreign capital gains tax of $(10,714).
SEE NOTES TO FINANCIAL STATEMENTS.
| J.P. Morgan Exchange-Traded Funds | |
STATEMENTS OF CHANGES IN NET ASSETSFOR THE PERIODS INDICATED
| | JPMorgan
Active Developing
Markets
Equity ETF |
| Year Ended
October 31, 2024 | Period Ended
October 31, 2023 (a) | |
CHANGE IN NET ASSETS RESULTING FROM OPERATIONS: | | | |
Net investment income (loss) | | | |
| | | |
Change in net unrealized appreciation/depreciation | | | |
Change in net assets resulting from operations | | | |
DISTRIBUTIONS TO SHAREHOLDERS: | | | |
Total distributions to shareholders | | | |
| | | |
Change in net assets resulting from capital transactions | | | |
| | | |
| | | |
| | | |
| | | |
| | | |
Proceeds from shares issued | | | |
| | | |
Total change in net assets resulting from capital transactions | | | |
| | | |
| | | |
Net increase in shares from share transactions | | | |
(a)
Commencement of operations was March 15, 2023.
(b)
Commencement of operations was May 16, 2024.
SEE NOTES TO FINANCIAL STATEMENTS.
| J.P. Morgan Exchange-Traded Funds | |
STATEMENTS OF CHANGES IN NET ASSETSFOR THE PERIODS INDICATED (continued)
| JPMorgan ActiveBuilders
Emerging Markets Equity
ETF | JPMorgan
Dividend
Leaders ETF |
| Year Ended
October 31, 2024 | Year Ended
October 31, 2023 | |
CHANGE IN NET ASSETS RESULTING FROM OPERATIONS: | | | |
Net investment income (loss) | | | |
| | | |
Change in net unrealized appreciation/depreciation | | | |
Change in net assets resulting from operations | | | |
DISTRIBUTIONS TO SHAREHOLDERS: | | | |
Total distributions to shareholders | | | |
| | | |
Change in net assets resulting from capital transactions | | | |
| | | |
| | | |
| | | |
| | | |
| | | |
Proceeds from shares issued | | | |
| | | |
Total change in net assets resulting from capital transactions | | | |
| | | |
| | | |
| | | |
Net increase (decrease) in shares from share transactions | | | |
(a)
Commencement of operations was September 25, 2024.
SEE NOTES TO FINANCIAL STATEMENTS.
| J.P. Morgan Exchange-Traded Funds | |
| JPMorgan
Global Select
Equity ETF | JPMorgan
Healthcare Leaders ETF |
| Year Ended
October 31, 2024 | Period Ended
October 31, 2023 (a) | |
CHANGE IN NET ASSETS RESULTING FROM OPERATIONS: | | | |
Net investment income (loss) | | | |
| | | |
Change in net unrealized appreciation/depreciation | | | |
Change in net assets resulting from operations | | | |
DISTRIBUTIONS TO SHAREHOLDERS: | | | |
Total distributions to shareholders | | | |
| | | |
Change in net assets resulting from capital transactions | | | |
| | | |
| | | |
| | | |
| | | |
| | | |
Proceeds from shares issued | | | |
| | | |
Total change in net assets resulting from capital transactions | | | |
| | | |
| | | |
| | | |
Net increase in shares from share transactions | | | |
(a)
Commencement of operations was September 13, 2023.
(b)
Commencement of operations was November 1, 2023.
SEE NOTES TO FINANCIAL STATEMENTS.
| J.P. Morgan Exchange-Traded Funds | |
STATEMENTS OF CHANGES IN NET ASSETSFOR THE PERIODS INDICATED (continued)
| JPMorgan Hedged Equity
Laddered Overlay ETF | JPMorgan
International Growth ETF |
| Year Ended
October 31, 2024 | Period Ended
October 31, 2023 (a) | Year Ended
October 31, 2024 | |
CHANGE IN NET ASSETS RESULTING FROM OPERATIONS: | | | | |
Net investment income (loss) | | | | |
| | | | |
Change in net unrealized appreciation/depreciation | | | | |
Change in net assets resulting from operations | | | | |
DISTRIBUTIONS TO SHAREHOLDERS: | | | | |
Total distributions to shareholders | | | | |
| | | | |
Change in net assets resulting from capital transactions | | | | |
| | | | |
| | | | |
| | | | |
| | | | |
| | | | |
Proceeds from shares issued | | | | |
| | | | |
Total change in net assets resulting from capital transactions | | | | |
| | | | |
| | | | |
| | | | |
Net increase in shares from share transactions | | | | |
(a)
Commencement of operations was September 28, 2023.
SEE NOTES TO FINANCIAL STATEMENTS.
| J.P. Morgan Exchange-Traded Funds | |
| JPMorgan
International
Value ETF |
| Year Ended
October 31, 2024 | |
CHANGE IN NET ASSETS RESULTING FROM OPERATIONS: | | |
Net investment income (loss) | | |
| | |
Change in net unrealized appreciation/depreciation | | |
Change in net assets resulting from operations | | |
DISTRIBUTIONS TO SHAREHOLDERS: | | |
Total distributions to shareholders | | |
| | |
Change in net assets resulting from capital transactions | | |
| | |
| | |
| | |
| | |
| | |
Proceeds from shares issued | | |
| | |
Total change in net assets resulting from capital transactions | | |
| | |
| | |
Net increase in shares from share transactions | | |
(a)
Commencement of operations was September 13, 2023.
SEE NOTES TO FINANCIAL STATEMENTS.
| J.P. Morgan Exchange-Traded Funds | |
FINANCIAL HIGHLIGHTSFOR THE PERIODS INDICATED
| Per share operating performance |
| | | |
| Net asset
value,
beginning
of period | Net investment
income
(loss) (b) | Net realized
and unrealized
gains
(losses)
on investments | Total from
investment
operations | | | |
JPMorgan Active China ETF | | | | | | | |
Year Ended October 31, 2024 | | | | | | | |
March 15, 2023 (g) through October 31, 2023 | | | | | | | |
JPMorgan Active Developing Markets Equity ETF | | | | | | | |
May 16, 2024 (g) through October 31, 2024 | | | | | | | |
JPMorgan ActiveBuilders Emerging Markets Equity ETF | | | | | | | |
Year Ended October 31, 2024 | | | | | | | |
Year Ended October 31, 2023 | | | | | | | |
Year Ended October 31, 2022 | | | | | | | |
March 10, 2021 (g) through October 31, 2021 | | | | | | | |
JPMorgan Dividend Leaders ETF | | | | | | | |
September 25, 2024 (g) through October 31, 2024 | | | | | | | |
JPMorgan Global Select Equity ETF | | | | | | | |
Year Ended October 31, 2024 | | | | | | | |
September 13, 2023 (g) through October 31, 2023 | | | | | | | |
JPMorgan Healthcare Leaders ETF | | | | | | | |
November 1, 2023 (g) through October 31, 2024 | | | | | | | |
JPMorgan Hedged Equity Laddered Overlay ETF | | | | | | | |
Year Ended October 31, 2024 | | | | | | | |
September 28, 2023 (g) through October 31, 2023 | | | | | | | |
JPMorgan International Growth ETF | | | | | | | |
Year Ended October 31, 2024 | | | | | | | |
Year Ended October 31, 2023 | | | | | | | |
Year Ended October 31, 2022 | | | | | | | |
Year Ended October 31, 2021 | | | | | | | |
May 20, 2020 (g) through October 31, 2020 | | | | | | | |
JPMorgan International Value ETF | | | | | | | |
Year Ended October 31, 2024 | | | | | | | |
September 13, 2023 (g) through October 31, 2023 | | | | | | | |
|
| Annualized for periods less than one year, unless otherwise noted. |
| Calculated based upon average shares outstanding. |
| Not annualized for periods less than one year. |
| Includes adjustments in accordance with accounting principles generally accepted in the United States of America and as such, the net asset values for financial reporting purposes and the returns based upon those net asset values may differ from the net asset values and returns for shareholder transactions. |
| Market price return was calculated assuming an initial investment made at the market price at the beginning of the reporting period, reinvestment of all dividends and distributions at the market price during the period, and sale at the market price on the last day of the period. The price used to calculate the market price return was the closing price on the listing exchange of the Fund. |
| Includes interest expense, if applicable, which is less than 0.005% unless otherwise noted. |
| Commencement of operations. |
| Since the shares of the Fund did not trade in the secondary market until the day after the Fund’s inception, for the period from the inception to the first day of secondary market trading, the net asset value is used as a proxy for the secondary market trading price to calculate the market returns. |
| Includes interest expense, which is less than 0.01% unless otherwise noted. |
| Does not include expenses of unaffiliated Underlying Funds. |
| Amount rounds to less than $0.005. |
SEE NOTES TO FINANCIAL STATEMENTS.
| J.P. Morgan Exchange-Traded Funds | |
| |
| | | | | Ratios to average net assets (a) | |
Net asset
value,
end of
period | | | Market
price
total
return (c)(e) | | | Net
investment
income
(loss) | Expenses
without waivers
and reimbursements(f) | Portfolio
turnover
rate (c) |
| | | | | | | | |
| | | | | | | | |
| | | | | | | | |
| | | | | | | | |
| | | | | | | | |
| | | | | | | | |
| | | | | | | | |
| | | | | | | | |
| | | | | | | | |
| | | | | | | | |
| | | | | | | | |
| | | | | | | | |
| | | | | | | | |
| | | | | | | | |
| | | | | | | | |
| | | | | | | | |
| | | | | | | | |
| | | | | | | | |
| | | | | | | | |
| | | | | | | | |
| | | | | | | | |
| | | | | | | | |
| | | | | | | | |
| | | | | | | | |
| | | | | | | | |
| | | | | | | | |
| | | | | | | | |
| | | | | | | | |
| | | | | | | | |
SEE NOTES TO FINANCIAL STATEMENTS.
| J.P. Morgan Exchange-Traded Funds | |
NOTES TO FINANCIAL STATEMENTSAS OF October 31, 2024
1. Organization
J.P. Morgan Exchange-Traded Fund Trust (the “Trust”) was formed on February 25, 2010, and is governed by a Declaration of Trust as amended and restated February 19, 2014, and is registered under the Investment Company Act of 1940, as amended (the “1940 Act”), as an open-end management investment company.
The following are 9 separate funds of the Trust (each, a "Fund" and collectively, the "Funds") covered by this report:
| Diversification Classification |
JPMorgan Active China ETF | |
JPMorgan Active Developing Markets Equity ETF(1) | |
JPMorgan ActiveBuilders Emerging Markets Equity ETF | |
JPMorgan Dividend Leaders ETF(2) | |
JPMorgan Global Select Equity ETF | |
JPMorgan Healthcare Leaders ETF(3) | |
JPMorgan Hedged Equity Laddered Overlay ETF | |
JPMorgan International Growth ETF | |
JPMorgan International Value ETF | |
|
| Commencement of operations was May 16, 2024. |
| Commencement of operations was September 25, 2024. |
| Commencement of operations was November 1, 2023. |
The investment objective of JPMorgan Active China ETF (“Active China ETF”), JPMorgan Active Developing Markets Equity ETF (“Active Developing Markets Equity ETF”), JPMorgan ActiveBuilders Emerging Markets Equity ETF (“ActiveBuilders Emerging Markets Equity ETF”), JPMorgan Global Select Equity ETF ("Global Select Equity ETF"), JPMorgan Healthcare Leaders ETF ("Healthcare Leaders ETF"), JPMorgan International Growth ETF (“International Growth ETF”) and JPMorgan International Value ETF ("International Value ETF") is to seek to provide long-term capital appreciation.
The investment objective of JPMorgan Dividend Leaders ETF ("Dividend Leaders ETF") is to seek to provide long-term capital growth and current income.
The investment objective of JPMorgan Hedged Equity Laddered Overlay ETF (“Hedged Equity Laddered Overlay ETF”) is to seek to provide capital appreciation.
J.P. Morgan Investment Management Inc. (“JPMIM”), an indirect, wholly-owned subsidiary of JPMorgan Chase & Co. (“JPMorgan”), acts as adviser (the “Adviser”) and administrator (the “Administrator”) to the Funds.
Shares of each Fund are listed and traded at market price on an exchange as follows:
| |
| |
Active Developing Markets Equity ETF | |
ActiveBuilders Emerging Markets Equity ETF | |
| |
| The NASDAQ Stock Market® LLC |
| The NASDAQ Stock Market® LLC |
Hedged Equity Laddered Overlay ETF | |
| |
| The NASDAQ Stock Market® LLC |
Market prices for the Funds’ shares may be different from their net asset value (“NAV”).
The Funds issue and redeem their shares on a continuous basis, through JPMorgan Distribution Services, Inc. (the “Distributor” or “JPMDS”), an indirect, wholly-owned subsidiary of JPMorgan, at NAV in large blocks of shares, referred to as “Creation Units”. Creation Units are issued and redeemed in exchange for a basket of securities and/or cash. Shares are generally traded in the secondary market in amounts less than a Creation Unit at market prices that change throughout the day. Only individuals or institutions that have entered into an authorized participant agreement with the Distributor may do business directly with the Funds (each, an “Authorized Participant”).
| J.P. Morgan Exchange-Traded Funds | |
2. Significant Accounting Policies
The following is a summary of significant accounting policies followed by the Funds in the preparation of their financial statements. The Funds are investment companies and, accordingly, follow the investment company accounting and reporting guidance of the Financial Accounting Standards Board (“FASB”) Accounting Standards Codification Topic 946 — Investment Companies, which is part of U.S. generally accepted accounting principles (“GAAP”). The preparation of financial statements in conformity with GAAP requires management to make estimates and assumptions that affect (i) the reported amounts of assets and liabilities, (ii) disclosure of contingent assets and liabilities at the date of the financial statements, and (iii) the reported amounts of increases and decreases in net assets from operations during the reporting period. Actual results could differ from those estimates.
A. Valuation of Investments— Investments are valued in accordance with GAAP and the Funds' valuation policies set forth by, and under the supervision and responsibility of, the Board of Trustees of the Trust (the "Board"), which established the following approach to valuation, as described more fully below: (i) investments for which market quotations are readily available shall be valued at their market value and (ii) all other investments for which market quotations are not readily available shall be valued at their fair value as determined in good faith by the Board.
Under Section 2(a)(41) of the 1940 Act, the Board is required to determine fair value for securities that do not have readily available market quotations. Under Securities and Exchange Commission ("SEC") Rule 2a-5 (Good Faith Determinations of Fair Value), the Board may designate the performance of these fair valuation determinations to a valuation designee. The Board has designated the Adviser as the “Valuation Designee” to perform fair valuation determinations for the Funds on behalf of the Board subject to appropriate oversight by the Board. The Adviser, as Valuation Designee, leverages the J.P. Morgan Asset Management Americas Valuation Committee (“AVC”) to help oversee and carry out the policies for the valuation of investments held in the Funds. The Adviser, as Valuation Designee, remains responsible for the valuation determinations.
This oversight by the AVC includes monitoring the appropriateness of fair values based on results of ongoing valuation oversight including, but not limited to, consideration of macro or security specific events, market events, and pricing vendor and broker due diligence. The Administrator is responsible for discussing and assessing the potential impacts to the fair values on an ongoing basis, and, at least on a quarterly basis, with the AVC and the Board.
A market-based approach is primarily used to value the Funds' investments. Investments for which market quotations are not readily available are fair valued using prices supplied by approved affiliated and/or unaffiliated pricing vendors or third party broker-dealers (collectively referred to as “Pricing Services”) or may be internally fair valued using methods set forth by the valuation policies approved by the Board. This may include the use of related or comparable assets or liabilities, recent transactions, market multiples, book values and other relevant information for the investment. An income-based valuation approach may be used in which the anticipated future cash flows of the investment are discounted to calculate the fair value. Discounts may also be applied due to the nature or duration of any restrictions on the disposition of the investments. Valuations may be based upon current market prices of securities that are comparable in coupon, rating, maturity and industry. It is possible that the estimated values may differ significantly from the values that would have been used had a ready market for the investments existed, and such differences could be material.
Equities and other exchange-traded instruments are valued at the last sale price or official market closing price on the primary exchange on which the instrument is traded before the NAVs of the Funds are calculated on a valuation date. Certain foreign equity instruments are valued by applying international fair value factors provided by approved Pricing Services. The factors seek to adjust the local closing price for movements of local markets post-closing, but prior to the time the NAVs are calculated.
Investments in open-end investment companies (“Underlying Funds”) are valued at each Underlying Fund’s NAV per share as of the report date.
Futures contracts and options are generally valued on the basis of available market quotations.
Valuations reflected in this report are as of the report date. As a result, changes in valuation due to market events and/or issuer-related events after the report date and prior to issuance of the report are not reflected herein.
The various inputs that are used in determining the valuation of the Funds' investments are summarized into the three broad levels listed below.
•
Level 1 — Unadjusted inputs using quoted prices in active markets for identical investments.
•
Level 2 — Other significant observable inputs including, but not limited to, quoted prices for similar investments, inputs other than quoted prices that are observable for investments (such as interest rates, prepayment speeds, credit risk, etc.) or other market corroborated inputs.
•
Level 3 — Significant inputs based on the best information available in the circumstances, to the extent observable inputs are not available (including the Funds' assumptions in determining the fair value of investments).
A financial instrument’s level within the fair value hierarchy is based on the lowest level of any input, both individually and in the aggregate, that is significant to the fair value measurement. The inputs or methodology used for valuing instruments are not necessarily an indication of the risk associated with investing in those instruments.
| J.P. Morgan Exchange-Traded Funds | |
NOTES TO FINANCIAL STATEMENTSAS OF October 31, 2024 (continued)
The following tables represent each valuation input as presented on the Schedules of Portfolio Investments ("SOIs"):
| | | | |
| | Level 2
Other significant
observable inputs | Level 3
Significant
unobservable inputs | |
Investments in Securities | | | | |
| | | | |
| | | | |
| | | | |
| | | | |
| | | | |
| | | | |
Electronic Equipment, Instruments & Components | | | | |
| | | | |
| | | | |
| | | | |
Health Care Equipment & Supplies | | | | |
Health Care Providers & Services | | | | |
Hotels, Restaurants & Leisure | | | | |
| | | | |
Independent Power and Renewable Electricity Producers | | | | |
| | | | |
Interactive Media & Services | | | | |
| | | | |
| | | | |
| | | | |
Oil, Gas & Consumable Fuels | | | | |
| | | | |
Real Estate Management & Development | | | | |
Semiconductors & Semiconductor Equipment | | | | |
| | | | |
Technology Hardware, Storage & Peripherals | | | | |
Textiles, Apparel & Luxury Goods | | | | |
| | | | |
| | | | |
| | | | |
Total Investments in Securities | | | | |
Active Developing Markets Equity ETF | | |
| | Level 2
Other significant
observable inputs | Level 3
Significant
unobservable inputs | |
Investments in Securities | | | | |
| | | | |
| | | | |
| | | | |
| | | | |
| | | | |
| | | | |
| | | | |
| | | | |
| | | | |
| J.P. Morgan Exchange-Traded Funds | |
Active Developing Markets Equity ETF (continued) | | |
| | Level 2 Other significant observable inputs | Level 3 Significant unobservable inputs | |
| | | | |
| | | | |
| | | | |
| | | | |
| | | | |
| | | | |
| | | | |
| | | | |
| | | | |
| | | | |
| | | | |
| | | | |
| | | | |
| | | | |
Total Investments in Securities | | | | |
ActiveBuilders Emerging Markets Equity ETF | | |
| | Level 2
Other significant
observable inputs | Level 3
Significant
unobservable inputs | |
Investments in Securities | | | | |
| | | | |
| | | | |
| | | | |
| | | | |
| | | | |
| | | | |
| | | | |
| | | | |
| | | | |
| | | | |
| | | | |
| | | | |
| | | | |
| | | | |
| | | | |
| | | | |
| | | | |
| | | | |
| | | | |
| | | | |
| | | | |
| | | | |
| | | | |
| | | | |
| | | | |
| | | | |
| | | | |
| J.P. Morgan Exchange-Traded Funds | |
NOTES TO FINANCIAL STATEMENTSAS OF October 31, 2024 (continued)
ActiveBuilders Emerging Markets Equity ETF (continued) | | |
| | Level 2 Other significant observable inputs | Level 3 Significant unobservable inputs | |
| | | | |
| | | | |
| | | | |
| | | | |
| | | | |
| | | | |
| | | | |
| | | | |
| | | | |
| | | | |
| | | | |
Investment of Cash Collateral from Securities Loaned | | | | |
Total Short-Term Investments | | | | |
Total Investments in Securities | | | | |
| | |
| | Level 2
Other significant
observable inputs | Level 3
Significant
unobservable inputs | |
Investments in Securities | | | | |
| | | | |
| | | | |
| | | | |
| | | | |
| | | | |
| | | | |
| | | | |
| | | | |
| | | | |
| | | | |
| | | | |
| | | | |
| | | | |
| | | | |
| | | | |
| | | | |
| | | | |
| | | | |
| | | | |
| | | | |
| | | | |
| | | | |
Total Investments in Securities | | | | |
| J.P. Morgan Exchange-Traded Funds | |
| | |
| | Level 2
Other significant
observable inputs | Level 3
Significant
unobservable inputs | |
Investments in Securities | | | | |
| | | | |
| | | | |
| | | | |
| | | | |
| | | | |
| | | | |
| | | | |
| | | | |
| | | | |
| | | | |
| | | | |
| | | | |
| | | | |
| | | | |
| | | | |
| | | | |
| | | | |
Total Investments in Securities | | | | |
| | |
| | Level 2
Other significant
observable inputs | Level 3
Significant
unobservable inputs | |
Investments in Securities | | | | |
| | | | |
| | | | |
| | | | |
| | | | |
| | | | |
| | | | |
| | | | |
| | | | |
| | | | |
Total Investments in Securities | | | | |
Hedged Equity Laddered Overlay ETF | | | | |
| | Level 2
Other significant
observable inputs | Level 3
Significant
unobservable inputs | |
Total Investments in Securities (a) | | | | |
Depreciation in Other Financial Instruments | | | | |
| | | | |
| | | | |
| J.P. Morgan Exchange-Traded Funds | |
NOTES TO FINANCIAL STATEMENTSAS OF October 31, 2024 (continued)
Hedged Equity Laddered Overlay ETF (continued) | | | | |
| | Level 2 Other significant observable inputs | Level 3 Significant unobservable inputs | |
| | | | |
Total Depreciation in Other Financial Instruments | | | | |
|
| Please refer to the SOI for specifics of portfolio holdings. |
| | |
| | Level 2
Other significant
observable inputs | Level 3
Significant
unobservable inputs | |
Investments in Securities | | | | |
| | | | |
| | | | |
| | | | |
| | | | |
| | | | |
| | | | |
| | | | |
| | | | |
| | | | |
| | | | |
| | | | |
| | | | |
| | | | |
| | | | |
| | | | |
| | | | |
| | | | |
| | | | |
| | | | |
| | | | |
| | | | |
| | | | |
| | | | |
| | | | |
| | | | |
| | | | |
Total Investments in Securities | | | | |
Depreciation in Other Financial Instruments | | | | |
| | | | |
| | |
| | Level 2
Other significant
observable inputs | Level 3
Significant
unobservable inputs | |
Investments in Securities | | | | |
| | | | |
| | | | |
| J.P. Morgan Exchange-Traded Funds | |
International Value ETF (continued) | | |
| | Level 2 Other significant observable inputs | Level 3 Significant unobservable inputs | |
| | | | |
| | | | |
| | | | |
| | | | |
| | | | |
| | | | |
| | | | |
| | | | |
| | | | |
| | | | |
| | | | |
| | | | |
| | | | |
| | | | |
| | | | |
| | | | |
| | | | |
| | | | |
| | | | |
| | | | |
| | | | |
| | | | |
| | | | |
| | | | |
| | | | |
| | | | |
| | | | |
| | | | |
| | | | |
| | | | |
| | | | |
| | | | |
| | | | |
| | | | |
| | | | |
| | | | |
| | | | |
| | | | |
| | | | |
Total Investments in Securities | | | | |
B. Restricted Securities— Certain securities held by the Funds may be subject to legal or contractual restrictions on resale. Restricted securities generally are resold in transactions exempt from registration under the Securities Act of 1933, as amended (the “Securities Act”). Disposal of these securities may involve time-consuming negotiations and expense. Prompt sale at the current valuation may be difficult and could adversely affect the NAVs of the Funds.
As of October 31, 2024, the Funds had no investments in restricted securities other than securities sold to the Funds under Rule 144A and/or Regulation S under the Securities Act.
| J.P. Morgan Exchange-Traded Funds | |
NOTES TO FINANCIAL STATEMENTSAS OF October 31, 2024 (continued)
C. Securities Lending — The Funds are authorized to engage in securities lending in order to generate additional income. The Funds are able to lend to approved borrowers. Citibank N.A. (“Citibank”) serves as lending agent for the Funds, pursuant to a Securities Lending Agency Agreement (the “Securities Lending Agency Agreement”). Securities loaned are collateralized by cash equal to at least 100% of the market value plus accrued interest on the securities lent, which is invested in the Class IM Shares of the JPMorgan U.S. Government Money Market Fund and the Agency SL Class Shares of the JPMorgan Securities Lending Money Market Fund. The Funds retain the interest earned on cash collateral investments but are required to pay the borrower a rebate for the use of the cash collateral. In cases where the lent security is of high value to borrowers, there may be a negative rebate (i.e., a net payment from the borrower to the Funds). Upon termination of a loan, the Funds are required to return to the borrower an amount equal to the cash collateral, plus any rebate owed to the borrowers. The remaining maturities of the securities lending transactions are considered overnight and continuous. Loans are subject to termination by the Funds or the borrower at any time.
The net income earned on the securities lending (after payment of rebates and Citibank’s fee) is included on the Statements of Operations as Income from securities lending (net). The Funds also receive payments from the borrower during the period of the loan, equivalent to dividends and interest earned on the securities loaned, which are recorded as Dividend or Interest income, respectively, on the Statements of Operations.
Under the Securities Lending Agency Agreement, Citibank marks to market the loaned securities on a daily basis. In the event the cash received from the borrower is less than 102% of the value of the loaned securities (105% for loans of non-U.S. securities), Citibank requests additional cash from the borrower so as to maintain a collateralization level of at least 102% of the value of the loaned securities plus accrued interest (105% for loans of non-U.S. securities), subject to certain de minimis amounts.
The value of securities out on loan is recorded as an asset on the Statements of Assets and Liabilities. The value of the cash collateral received is recorded as a liability on the Statements of Assets and Liabilities and details of collateral investments are disclosed on the SOIs.
The Funds bear the risk of loss associated with the collateral investments and are not entitled to additional collateral from the borrower to cover any such losses. To the extent that the value of the collateral investments declines below the amount owed to a borrower, the Funds may incur losses that exceed the amount they earned on lending the security. Upon termination of a loan, the Funds may use leverage (borrow money) to repay the borrower for cash collateral posted if the Adviser does not believe that it is prudent to sell the collateral investments to fund the payment of this liability. Securities lending activity is subject to master netting arrangements.
The following table presents for each lending Fund, the value of the securities on loan with Citibank, net of amounts available for offset under the master netting arrangements and any related collateral received or posted by the Funds as of October 31, 2024.
| Investment Securities
on Loan, at value,
Presented on the
Statements of Assets
and Liabilities | Cash Collateral
Posted by Borrower* | Net Amount Due
to Counterparty
(not less than zero) |
ActiveBuilders Emerging Markets Equity ETF | | | |
|
| Collateral posted reflects the value of securities on loan and does not include any additional amounts received from the borrower. |
Securities lending also involves counterparty risks, including the risk that the loaned securities may not be returned in a timely manner or at all. Subject to certain conditions, Citibank has agreed to indemnify the Funds from losses resulting from a borrower’s failure to return a loaned security.
JPMIM voluntarily waived management fees charged to the Funds to reduce the impact of the cash collateral investment in the JPMorgan U.S. Government Money Market Fund from 0.13% to 0.06%. For the year ended October 31, 2024, JPMIM waived fees associated with the Funds' investment in the JPMorgan U.S. Government Money Market Fund as follows:
Active Developing Markets Equity ETF | |
ActiveBuilders Emerging Markets Equity ETF | |
| |
| |
The above waiver is included in the determination of earnings on cash collateral investment and in the calculation of Citibank’s compensation and is included on the Statements of Operations as Income from securities lending (net).
Active Developing Markets Equity ETF, International Growth ETF and International Value ETF did not have any securities out on loan at October 31, 2024. Active China ETF, Dividend Leaders ETF, Global Select Equity ETF, Healthcare Leaders ETF and Hedged Equity Laddered Overlay ETF did not lend out any securities during the year ended October 31, 2024.
| J.P. Morgan Exchange-Traded Funds | |
D. Investment Transactions with Affiliates— The Funds invested in Underlying Funds advised by the Adviser. An issuer which is under common control with a Fund may be considered an affiliate. For the purposes of the financial statements, the Funds assume the issuers listed in the tables below to be affiliated issuers. The Underlying Funds’ distributions may be reinvested into such Underlying Funds. Reinvestment amounts are included in the purchases at cost amounts in the tables below.
|
For the year ended October 31, 2024 |
| | | | | Change in
Unrealized
Appreciation/
(Depreciation) | | | | Capital Gain
Distributions |
JPMorgan Prime Money Market Fund Class IM Shares, 4.90% (a) (b) | | | | | | | | | |
|
| Investment in an affiliated fund, which is registered under the Investment Company Act of 1940, as amended, and is advised by J.P. Morgan Investment Management Inc. |
| The rate shown is the current yield as of October 31, 2024. |
Active Developing Markets Equity ETF |
For the period ended October 31, 2024 |
| | | | | Change in
Unrealized
Appreciation/
(Depreciation) | | | | Capital Gain
Distributions |
JPMorgan Prime Money Market Fund Class IM Shares, 4.90% (b) (c) | | | | | | | | | |
JPMorgan U.S. Government Money Market Fund Class IM Shares, 4.80% (b) (c) | | | | | | | | | |
| | | | | | | | | |
|
| Commencement of operations was May 16, 2024. |
| Investment in an affiliated fund, which is registered under the Investment Company Act of 1940, as amended, and is advised by J.P. Morgan Investment Management Inc. |
| The rate shown is the current yield as of October 31, 2024. |
| Amount is included on the Statements of Operations as Income from securities lending (net) (after payments of rebates and Citibank’s fee). |
ActiveBuilders Emerging Markets Equity ETF |
For the year ended October 31, 2024 |
| | | | | Change in
Unrealized
Appreciation/
(Depreciation) | | | | Capital Gain
Distributions |
JPMorgan Prime Money Market Fund Class IM Shares, 4.90% (a) (b) | | | | | | | | | |
JPMorgan Securities Lending Money Market Fund Agency SL Class Shares, 4.85% (a) (b) | | | | | | | | | |
JPMorgan U.S. Government Money Market Fund Class IM Shares, 4.80% (a) (b) | | | | | | | | | |
| | | | | | | | | |
|
| Investment in an affiliated fund, which is registered under the Investment Company Act of 1940, as amended, and is advised by J.P. Morgan Investment Management Inc. |
| The rate shown is the current yield as of October 31, 2024. |
| Amount is included on the Statements of Operations as Income from securities lending (net) (after payments of rebates and Citibank’s fee). |
| J.P. Morgan Exchange-Traded Funds | |
NOTES TO FINANCIAL STATEMENTSAS OF October 31, 2024 (continued)
|
For the period ended October 31, 2024 |
| Value at
September 25,
2024(a) | | | | Change in
Unrealized
Appreciation/
(Depreciation) | | | | Capital Gain
Distributions |
JPMorgan Prime Money Market Fund Class IM Shares, 4.90% (b) (c) | | | | | | | | | |
|
| Commencement of operations was September 25, 2024. |
| Investment in an affiliated fund, which is registered under the Investment Company Act of 1940, as amended, and is advised by J.P. Morgan Investment Management Inc. |
| The rate shown is the current yield as of October 31, 2024. |
|
For the year ended October 31, 2024 |
| | | | | Change in
Unrealized
Appreciation/
(Depreciation) | | | | Capital Gain
Distributions |
JPMorgan Prime Money Market Fund Class IM Shares, 4.90% (a) (b) | | | | | | | | | |
|
| Investment in an affiliated fund, which is registered under the Investment Company Act of 1940, as amended, and is advised by J.P. Morgan Investment Management Inc. |
| The rate shown is the current yield as of October 31, 2024. |
|
For the period ended October 31, 2024 |
| Value at
November 1,
2023(a) | | | | Change in
Unrealized
Appreciation/
(Depreciation) | | | | Capital Gain
Distributions |
JPMorgan U.S. Government Money Market Fund Class IM Shares, 4.80% (b) (c) | | | | | | | | | |
|
| Commencement of operations was November 1, 2023. |
| Investment in an affiliated fund, which is registered under the Investment Company Act of 1940, as amended, and is advised by J.P. Morgan Investment Management Inc. |
| The rate shown is the current yield as of October 31, 2024. |
Hedged Equity Laddered Overlay ETF |
For the year ended October 31, 2024 |
| | | | | Change in
Unrealized
Appreciation/
(Depreciation) | | | | Capital Gain
Distributions |
JPMorgan U.S. Government Money Market Fund Class IM Shares, 4.80% (a) (b) | | | | | | | | | |
|
| Investment in an affiliated fund, which is registered under the Investment Company Act of 1940, as amended, and is advised by J.P. Morgan Investment Management Inc. |
| The rate shown is the current yield as of October 31, 2024. |
| J.P. Morgan Exchange-Traded Funds | |
|
For the year ended October 31, 2024 |
| | | | | Change in
Unrealized
Appreciation/
(Depreciation) | | | | Capital Gain
Distributions |
JPMorgan Prime Money Market Fund Class IM Shares, 4.90% (a) (b) | | | | | | | | | |
JPMorgan Securities Lending Money Market Fund Agency SL Class Shares, 4.85% (a) (b) | | | | | | | | | |
JPMorgan U.S. Government Money Market Fund Class IM Shares, 4.80% (a) (b) | | | | | | | | | |
JPMorgan U.S. Government Money Market Fund Class IM Shares, 4.80% (a) (b) | | | | | | | | | |
| | | | | | | | | |
|
| Investment in an affiliated fund, which is registered under the Investment Company Act of 1940, as amended, and is advised by J.P. Morgan Investment Management Inc. |
| The rate shown is the current yield as of October 31, 2024. |
| Amount is included on the Statements of Operations as Income from securities lending (net) (after payments of rebates and Citibank’s fee). |
|
For the year ended October 31, 2024 |
| | | | | Change in
Unrealized
Appreciation/
(Depreciation) | | | | Capital Gain
Distributions |
JPMorgan Prime Money Market Fund Class IM Shares, 4.90% (a) (b) | | | | | | | | | |
JPMorgan Securities Lending Money Market Fund Agency SL Class Shares, 4.85% (a) (b) | | | | | | | | | |
JPMorgan U.S. Government Money Market Fund Class IM Shares, 4.80% (a) (b) | | | | | | | | | |
JPMorgan U.S. Government Money Market Fund Class IM Shares, 4.80% (a) (b) | | | | | | | | | |
| | | | | | | | | |
|
| Investment in an affiliated fund, which is registered under the Investment Company Act of 1940, as amended, and is advised by J.P. Morgan Investment Management Inc. |
| The rate shown is the current yield as of October 31, 2024. |
| Amount is included on the Statements of Operations as Income from securities lending (net) (after payments of rebates and Citibank’s fee). |
E. Foreign Currency Translation — The books and records of the Funds are maintained in U.S. dollars. Foreign currency amounts are translated into U.S. dollars at the prevailing exchange rates of such currencies against the U.S. dollar. The market value of investment securities and other assets and liabilities are translated at the exchange rate as of the valuation date. Purchases and sales of investment securities, income and expenses are translated at the exchange rate prevailing on the respective dates of such transactions.
The Funds do not isolate the effect of changes in foreign exchange rates from changes in market prices on securities held. Accordingly, such changes are included within Change in net unrealized appreciation/depreciation on investments in non-affiliates on the Statements of Operations.
Reported realized foreign currency gains and losses arise from the disposition of foreign currency, currency gains or losses realized between the trade and settlement dates on securities transactions, and the difference between the amounts of dividends, interest and foreign withholding taxes recorded on each Fund's books on the transaction date and the U.S. dollar equivalent of the amounts actually received or paid. These reported realized foreign currency gains and losses are included in Net realized gain (loss) on foreign currency transactions on the Statements of Operations.
| J.P. Morgan Exchange-Traded Funds | |
NOTES TO FINANCIAL STATEMENTSAS OF October 31, 2024 (continued)
Unrealized foreign currency gains and losses arise from changes (due to changes in exchange rates) in the value of foreign currency and other assets and liabilities denominated in foreign currencies, which are held at year end and are included in Change in net unrealized appreciation/depreciation on foreign currency translations on the Statements of Operations.
F. Options— Hedged Equity Laddered Overlay ETF purchased and sold (“wrote”) put and call options on various instruments including options on indices to manage and hedge interest rate risks within its portfolio and also to gain long or short exposure to the underlying instrument, index, currency or rate. A purchaser of a put option has the right, but not the obligation, to sell the underlying instrument at an agreed upon price (“strike price”) to the option seller. A purchaser of a call option has the right, but not the obligation, to purchase the underlying instrument at the strike price from the option seller.
Options Purchased— Premiums paid by the Fund for options purchased are included on the Statements of Assets and Liabilities as Options purchased. The option is adjusted daily to reflect the current market value of the option and the change is recorded as Change in net unrealized appreciation/depreciation on options purchased on the Statements of Operations. If the option is allowed to expire, the Funds will lose the entire premium it paid and record a realized loss for the premium amount. Premiums paid for options purchased which are exercised or closed are added to the amounts paid or will offset against the proceeds on the underlying investment transaction to determine the realized gain (loss) or cost basis of the underlying investment.
Options Written— Premiums received by the Fund for options written are included on the Statements of Assets and Liabilities as a liability. The amount of the liability is adjusted daily to reflect the current market value of the option written and the change in market value is recorded as Change in net unrealized appreciation/depreciation on options written on the Statements of Operations. Premiums received from options written that expire are treated as realized gains. If a written option is closed, the Fund records a realized gain or loss on options written based on whether the cost of the closing transaction exceeds the premium received. If a call option is exercised by the option buyer, the premium received by the Fund is added to the proceeds from the sale of the underlying security to the option buyer and compared to the cost of the closing transaction to determine whether there has been a realized gain or loss. If a put option is exercised by an option buyer, the premium received by the option seller reduces the cost basis of the purchased security.
The Fund pledges collateral to the counterparty in the form of securities for options written. Securities designated as collateral are denoted on the SOI.
Written uncovered call options subject the Fund to unlimited risk of loss. Written covered call options limit the upside potential of a security above the strike price. Written put options subject the Fund to risk of loss if the value of the security declines below the exercise price minus the put premium.
The Fund is not subject to credit risk on options written as the counterparty has already performed its obligation by paying the premium at the inception of the contract.
The Fund’s exchange-traded option contracts are not subject to master netting arrangements (the right to close out all transactions traded with a counterparty and net amounts owed or due across transactions).
G. Futures Contracts— Active Developing Markets Equity ETF, Hedged Equity Laddered Overlay ETF, International Growth ETF and International Value ETF used index futures contracts to manage and hedge equity price risk associated with portfolio investments. The Funds also purchased futures contracts to invest incoming cash in the market or sold futures in response to cash outflows, thereby simulating an invested position in the underlying index while maintaining a cash balance for liquidity.
Futures contracts provide for the delayed delivery of the underlying instrument at a fixed price or are settled for a cash amount based on the change in the value of the underlying instrument at a specific date in the future. Upon entering into a futures contract, the Funds are required to deposit with the broker, cash or securities in an amount equal to a certain percentage of the contract amount, which is referred to as the initial margin deposit. Subsequent payments, referred to as variation margin, are made or received by the Funds periodically and are based on changes in the market value of open futures contracts. Changes in the market value of open futures contracts are recorded as Change in net unrealized appreciation/depreciation on futures contracts on the Statements of Operations. Realized gains or losses, representing the difference between the value of the contract at the time it was opened and the value at the time it was closed, are reported on the Statements of Operations at the closing or expiration of the futures contract. Securities deposited as initial margin are designated on the SOIs, while cash deposited, which is considered restricted, is recorded on the Statements of Assets and Liabilities. A receivable from and/or a payable to brokers for the daily variation margin is also recorded on the Statements of Assets and Liabilities.
The use of futures contracts exposes the Funds to equity price risk. The Funds may be subject to the risk that the change in the value of the futures contract may not correlate perfectly with the underlying instrument. Use of long futures contracts subjects the Funds to risk of loss in excess of the amounts shown on the Statements of Assets and Liabilities, up to the notional amount of the futures contracts. Use of short futures contracts subjects the Funds to unlimited risk of loss. The Funds may enter into futures contracts only on exchanges or boards of trade. The exchange or board of trade acts as the counterparty to each futures transaction; therefore, the Funds' credit risk is limited to failure of the exchange or board of trade. Under some circumstances, futures exchanges may establish daily limits on the amount that the price of a futures contract can vary from the previous day’s settlement price, which could effectively prevent liquidation of positions.
| J.P. Morgan Exchange-Traded Funds | |
The Funds' futures contracts are not subject to master netting arrangements (the right to close out all transactions traded with a counterparty and net amounts owed or due across transactions).
The table below discloses the volume of the Funds' options and futures contracts activity during the year ended October 31, 2024:
| Active Developing
Markets
Equity ETF | Hedged Equity
Laddered Overlay ETF | | |
| | | | |
Average Notional Balance Long | | | | |
Ending Notional Balance Long | | | | |
| | | | |
Average Number of Contracts Purchased | | | | |
Average Number of Contracts Written | | | | |
Ending Number of Contracts Purchased | | | | |
Ending Number of Contracts Written | | | | |
|
| For the period May 16, 2024 through October 31, 2024. |
The Funds' derivatives contracts held at October 31, 2024 are not accounted for as hedging instruments under GAAP.
H. Security Transactions and Investment Income— Investment transactions are accounted for on the trade date (the date the order to buy or sell is executed). Securities gains and losses are calculated on a specifically identified cost basis.
Dividend income, net of foreign taxes withheld, if any, is recorded on the ex-dividend date or when a Fund first learns of the dividend.
To the extent such information is publicly available, the Funds record distributions received in excess of income earned from underlying investments as a reduction of cost of investments and/or realized gain. Such amounts are based on estimates if actual amounts are not available and actual amounts of income, realized gain and return of capital may differ from the estimated amounts. The Funds adjust the estimated amounts of the components of distributions (and consequently their net investment income) as necessary, once the issuers provide information about the actual composition of the distributions.
| J.P. Morgan Exchange-Traded Funds | |
NOTES TO FINANCIAL STATEMENTSAS OF October 31, 2024 (continued)
I. Federal Income Taxes— Each Fund is treated as a separate taxable entity for Federal income tax purposes. Each Fund's policy is to comply with the provisions of the Internal Revenue Code (the “Code”) applicable to regulated investment companies and to distribute to shareholders all of its distributable net investment income and net realized capital gains on investments. Accordingly, no provision for Federal income tax is necessary. Management has reviewed the Funds' tax positions for all open tax years and has determined that as of October 31, 2024, no liability for Federal income tax is required in the Funds' financial statements for net unrecognized tax benefits. However, management’s conclusions may be subject to future review based on changes in, or the interpretation of, the accounting standards or tax laws and regulations. Each Fund's Federal tax returns for the prior three fiscal years, or since inception if shorter, remain subject to examination by the Internal Revenue Service.
J. Foreign Taxes—The Funds may be subject to foreign taxes on income, gains on investments or currency purchases/repatriation, a portion of which may be recoverable. The Funds will accrue such taxes and recoveries as applicable, based upon their current interpretation of tax rules and regulations that exist in the markets in which they invest. When a capital gains tax is determined to apply, the Funds record an estimated deferred tax liability in an amount that would be payable if the securities were disposed of on the valuation date.
K. Distributions to Shareholders— Distributions from net investment income, if any, are generally declared and paid at least annually for Active China ETF, Active Developing Markets Equity ETF, ActiveBuilders Emerging Markets Equity ETF, Global Select Equity ETF, Healthcare Leaders ETF, International Growth ETF and International Value ETF, and at least quarterly for Dividend Leaders ETF and Hedged Equity Laddered Overlay ETF. Net realized capital gains, if any, are distributed by each Fund at least annually. The amount of distributions from net investment income and net realized capital gains is determined in accordance with Federal income tax regulations, which may differ from GAAP. To the extent these “book/tax” differences are permanent in nature (i.e., that they result from other than timing of recognition — “temporary differences”), such amounts are reclassified within the capital accounts based on their Federal tax basis treatment.
The following amounts were reclassified within the capital accounts:
| | Accumulated
undistributed
(distributions in
excess of)
net investment
income | Accumulated
net realized
gains (losses) |
| | | |
Active Developing Markets Equity ETF | | | |
ActiveBuilders Emerging Markets Equity ETF | | | |
| | | |
| | | |
| | | |
Hedged Equity Laddered Overlay ETF | | | |
| | | |
| | | |
The reclassifications for the Funds relate primarily to tax adjustments on certain investments, foreign currency gains or losses, foreign taxes, tax equalization and redemptions in-kind.
3. Fees and Other Transactions with Affiliates
A. Management Fee— Pursuant to each Fund’s Management Agreement, the Adviser is paid a management fee which is accrued daily and paid no more frequently than monthly based on each Fund's respective average daily net assets at the following rate:
| |
| |
Active Developing Markets Equity ETF | |
ActiveBuilders Emerging Markets Equity ETF | |
| |
| |
| |
Hedged Equity Laddered Overlay ETF | |
| |
| |
| J.P. Morgan Exchange-Traded Funds | |
The Adviser, with respect to Active China ETF, has entered into an investment sub-advisory agreement with JPMorgan Asset Management (Asia Pacific) Limited (“JPMAM ((AP)”)), an indirect, wholly-owned subsidiary of JPMorgan Asset Management Holdings Inc. (“Sub-Advisory Agreement”). For its services as sub-adviser, JPMAM (AP) receives a portion of the fees payable to the Adviser.
Pursuant to the Sub-Advisory Agreement, JPMAM (AP) is responsible for the day-to-day investment decisions of Active China ETF. JPMIM has obtained a “managers of managers” exemptive order from the SEC, as expanded by subsequent SEC staff no-action relief (the “Exemptive Order”), upon which Active China ETF may rely, which grants exemptions from certain provisions of the 1940 Act. Pursuant to the Exemptive Order, JPMIM is permitted, subject to supervision and approval of the Board, to enter into and materially amend sub-advisory agreements with affiliated and unaffiliated sub-advisers without such agreements being approved by the shareholders of Active China ETF. Accordingly, Active China ETF and JPMIM may hire, terminate, or replace affiliated and unaffiliated sub-advisers without shareholder approval, including, without limitation, the replacement or reinstatement of any sub-advisers with respect to which a sub-advisory agreement has automatically terminated as a result of an assignment. JPMIM will continue to have ultimate responsibility, subject to oversight of the Board, to oversee the sub-advisers and recommend their hiring, termination and replacement.
Active China ETF has selected JPMAM (AP) to manage all of Active China ETF’s assets. Shareholders will be notified of any changes in sub-advisers. Shareholders of Active China ETF have the right to terminate a sub-advisory agreement for Active China ETF at any time by a vote of the majority of the outstanding voting securities of Active China ETF. The Exemptive Order also permits Active China ETF to disclose to shareholders the management fees only in the aggregate.
Under each Management Agreement, JPMIM is responsible for substantially all expenses of each Fund, (including expenses of the Trust relating to each Fund), except for the management fees, payments under the Funds' 12b-1 plan (if any), interest expenses, dividend and interest expenses related to short sales, taxes, acquired fund fees and expenses (other than fees for funds advised by the Adviser and/or its affiliates), costs of holding shareholder meetings, and litigation and potential litigation and other extraordinary expenses not incurred in the ordinary course of each Fund’s business. Additionally, each Fund is responsible for its non-operating expenses, including brokerage commissions and fees and expenses associated with each Fund’s securities lending program, if applicable. For the avoidance of doubt, the Adviser’s payment of such expenses may be accomplished through a Fund’s payment of such expenses and a corresponding reduction in the fee payable to the Adviser, provided, however, that if the amount of expenses paid by a Fund exceeds the fee payable to the Adviser, the Adviser will reimburse that Fund for such amount.
B. Administration Fee— JPMIM provides administration services to the Funds. Pursuant to each Management Agreement, JPMIM is compensated as described in Note 3.A.
JPMorgan Chase Bank, N.A. (“JPMCB”), a wholly-owned subsidiary of JPMorgan, serves as the Funds' sub-administrator (the “Sub-administrator”). For its services as Sub-administrator, JPMCB receives a portion of the management fees payable to JPMIM.
C. Custodian, Accounting and Transfer Agent Fees— JPMCB provides custody, accounting and transfer agency services to the Funds. For performing these services, JPMIM pays JPMCB transaction and asset-based fees that vary according to the number of transactions and positions, plus out-of-pocket expenses.
Additionally, Authorized Participants generally pay transaction fees associated with the creation and redemption of Fund shares. These fees are paid to JPMIM to offset certain custodian charges that are covered by each Management Agreement.
Interest income earned on cash balances at the custodian, if any, is included in Interest income from affiliates on the Statements of Operations.
Interest expense paid to the custodian related to cash overdrafts, if any, is included in Interest expense to affiliates on the Statements of Operations.
D. Distribution Services— The Distributor or its agent distributes Creation Units for each Fund on an agency basis. The Distributor does not maintain a secondary market in shares of each Fund. JPMDS receives no fees for their distribution services under the distribution agreement with the Trust (the “Distribution Agreement”). Although the Trust does not pay any fees under the Distribution Agreement, JPMIM pays JPMDS for certain distribution related services.
E. Waivers and Reimbursements— The Funds may invest in one or more money market funds advised by the Adviser (affiliated money market funds). The fees for the affiliated money market funds, except for investments of securities lending cash collateral, are covered under each Management Agreement as described in Note 3.A.
F. Other— Certain officers of the Trust are affiliated with the Adviser, the Administrator and JPMDS. Such officers receive no compensation from the Funds for serving in their respective roles.
The Board designated and appointed a Chief Compliance Officer to the Funds pursuant to Rule 38a-1 under the 1940 Act. The fees associated with the office of the Chief Compliance Officer are paid for by JPMIM as described in Note 3.A.
The SEC has granted an exemptive order permitting the Funds to engage in principal transactions with J.P. Morgan Securities LLC, an affiliated broker, involving taxable money market instruments, subject to certain conditions.
| J.P. Morgan Exchange-Traded Funds | |
NOTES TO FINANCIAL STATEMENTSAS OF October 31, 2024 (continued)
4. Investment Transactions
During the year ended October 31, 2024, purchases and sales of investments (excluding short-term investments) were as follows:
| Purchases
(excluding
U.S. Government) | Sales
(excluding
U.S. Government) |
| | |
Active Developing Markets Equity ETF | | |
ActiveBuilders Emerging Markets Equity ETF | | |
| | |
| | |
| | |
Hedged Equity Laddered Overlay ETF | | |
| | |
| | |
During the year ended October 31, 2024, there were no purchases or sales of U.S. Government securities.
For the year ended October 31, 2024, in-kind transactions associated with creations and redemptions were as follows:
| | |
Active Developing Markets Equity ETF | | |
ActiveBuilders Emerging Markets Equity ETF | | |
| | |
| | |
| | |
Hedged Equity Laddered Overlay ETF | | |
| | |
| | |
During the year ended October 31, 2024, the Funds delivered portfolio securities for the redemption of Fund shares (in-kind redemptions). Cash, portfolio securities and options transacted via in-kind (if any), were transferred for redemptions at fair value. For financial reporting purposes, the Funds recorded net realized gains and losses in connection with each in-kind redemption transaction.
5. Federal Income Tax Matters
For Federal income tax purposes, the estimated cost and unrealized appreciation (depreciation) in value of investments held at October 31, 2024 were as follows:
| | Gross
Unrealized
Appreciation | Gross
Unrealized
Depreciation | Net Unrealized
Appreciation
(Depreciation) |
| | | | |
Active Developing Markets Equity ETF | | | | |
ActiveBuilders Emerging Markets Equity ETF | | | | |
| | | | |
| | | | |
| | | | |
Hedged Equity Laddered Overlay ETF | | | | |
| | | | |
| | | | |
The difference between book and tax basis appreciation (depreciation) on investments is primarily attributed to tax adjustments on certain investments and wash sale loss deferrals.
| J.P. Morgan Exchange-Traded Funds | |
The tax character of distributions paid during the year ended October 31, 2024 was as follows:
| | |
| | |
ActiveBuilders Emerging Markets Equity ETF | | |
| | |
| | |
Hedged Equity Laddered Overlay ETF | | |
| | |
| | |
|
| Short-term gain distributions are treated as ordinary income for income tax purposes. |
The tax character of distributions paid during the year ended October 31, 2023 was as follows:
| | |
ActiveBuilders Emerging Markets Equity ETF | | |
| | |
|
| Short-term gain distributions are treated as ordinary income for income tax purposes. |
As of October 31, 2024, the estimated components of net assets (excluding paid-in-capital) on a tax basis were as follows:
| Current
Distributable
Ordinary
Income | Current
Distributable
Long-Term
Capital Gain
(Tax Basis Capital
Loss Carryover) | Unrealized
Appreciation
(Depreciation) |
| | | |
Active Developing Markets Equity ETF | | | |
ActiveBuilders Emerging Markets Equity ETF | | | |
| | | |
| | | |
| | | |
Hedged Equity Laddered Overlay ETF | | | |
| | | |
| | | |
| | | |
The cumulative timing differences primarily consist of tax adjustments on certain investments, trustee deferred compensation and wash sale loss deferrals.
| J.P. Morgan Exchange-Traded Funds | |
NOTES TO FINANCIAL STATEMENTSAS OF October 31, 2024 (continued)
As of October 31, 2024, the following Funds had net capital loss carryforwards, which are available to offset future realized gains:
| Capital Loss Carryforward Character |
| | |
| | |
Active Developing Markets Equity ETF | | |
ActiveBuilders Emerging Markets Equity ETF | | |
| | |
Hedged Equity Laddered Overlay ETF | | |
| | |
During the year ended October 31, 2024, the following Funds utilized capital loss carryforwards as follows:
6. Capital Share Transactions
The Trust issues and redeems shares of the Funds only in Creation Units through the Distributor at NAV. Capital shares transactions detail can be found in the Statements of Changes in Net Assets.
Shares of the Funds may only be purchased or redeemed by Authorized Participants. Such Authorized Participants may from time to time hold, of record or beneficially, a substantial percentage of the Funds' shares outstanding and act as executing or clearing broker for investment transactions on behalf of the Funds. An Authorized Participant is either (1) a “Participating Party” or other participant in the clearing process through the Continuous Net Settlement System of the National Securities Clearing Corporation (“NSCC”); or (2) a DTC Participant; which, in either case, must have executed an agreement with the Distributor.
Creation Units of a Fund may be created in advance of receipt by the Trust of all or a portion of the applicable basket of equity securities and other instruments (“Deposit Instruments”) and cash as described in the Funds’ registration statement. In these instances, the initial Deposit Instruments and cash must be deposited in an amount equal to the sum of the cash amount, plus at least 105% for Active China ETF, Active Developing Markets Equity ETF, Global Select Equity ETF, Healthcare Leaders ETF, Hedged Equity Laddered Overlay ETF (for negotiated redemptions only), International Growth ETF and International Value ETF, and plus at least 110% for ActiveBuilders Emerging Markets Equity ETF and Dividend Leaders ETF of the market value of undelivered Deposit Instruments. A transaction fee may be imposed to offset transfer and other transaction costs associated with the purchase or redemption of Creation Units.
Effective November 1, 2022, the Funds rely upon an exemptive order granted by the SEC (the “Order”) permitting the establishment and operation of an Interfund Lending Facility (the “Facility”). The Facility allows the Funds to directly lend and borrow money to or from any other fund relying upon the Order at rates beneficial to both the borrowing and lending funds. Advances under the Facility are taken primarily for temporary or emergency purposes, including the meeting of redemption requests that otherwise might require the untimely disposition of securities, and are subject to each Fund's borrowing restrictions. The interfund loan rate is determined, as specified in the Order, by averaging the current repurchase agreement rate and the current bank loan rate. The Order was granted to JPMorgan Trust II and may be relied upon by the Funds because the Funds and the series of JPMorgan Trust II are all investment companies in the same “group of investment companies” (as defined in Section 12(d)(1)(G) of the 1940 Act).
As of October 31, 2024, the Funds had no borrowings outstanding from another fund, or loans outstanding to another fund. Average borrowings from the Facility during the year ended October 31, 2024 were as follows:
| | | | |
ActiveBuilders Emerging Markets Equity ETF | | | | |
The Trust and JPMCB have entered into a financing arrangement. Under this arrangement, JPMCB provides an unsecured, uncommitted credit facility in the aggregate amount of $100 million to certain of the J.P. Morgan Funds, including the Funds. Advances under the arrangement are taken
| J.P. Morgan Exchange-Traded Funds | |
primarily for temporary or emergency purposes, including the meeting of redemption requests that otherwise might require the untimely disposition of securities, and are subject to each Fund's borrowing restrictions. Interest on borrowings is payable at a rate determined by JPMCB at the time of borrowing. This agreement has been extended until October 28, 2025.
The Funds had no borrowings outstanding from the unsecured, uncommitted credit facility during the year ended October 31, 2024.
Effective August 8, 2023, the Trust, along with certain other trusts for J.P. Morgan Funds, excluding Active Developing Markets Equity ETF, Global Select Equity ETF, Hedged Equity Laddered Overlay ETF, Healthcare Leaders ETF and International Value ETF, (“Borrowers”), has entered into an existing joint syndicated senior unsecured revolving credit facility totaling $1.5 billion (“Credit Facility”) with various lenders and The Bank of New York Mellon, as administrative agent for the lenders. Although the Trust is effectively part of the Credit Facility as of August 8, 2023, it was not eligible to draw on the Credit Facility, and did not incur costs associated with being a part of the Credit Facility up through May 30, 2024.
This Credit Facility provides a source of funds to the Borrowers for temporary and emergency purposes, including the meeting of redemption requests that otherwise might require the untimely disposition of securities. Under the terms of the Credit Facility, a borrowing fund must have a minimum of $25 million in adjusted net asset value and not exceed certain adjusted net asset coverage ratios prior to and during the time in which any borrowings are outstanding. If a fund does not comply with the aforementioned requirements, the fund must remediate within three business days with respect to the $25 million minimum adjusted net asset value or within one business day with respect to certain asset coverage ratios or the administrative agent at the request of, or with the consent of, the lenders may terminate the Credit Facility and declare any outstanding borrowings to be due and payable immediately.
Interest associated with any borrowing under the Credit Facility is charged to the borrowing fund at a rate of interest equal to 1.00%, plus the greater of the federal funds effective rate or the one-month Adjusted Secured Overnight Financing Rate (SOFR).
The Funds did not utilize the Credit Facility during the period November 1, 2023 through May 30, 2024.
Effective May 31, 2024, the Funds are no longer part of the Credit Facility.
8. Risks, Concentrations and Indemnifications
In the normal course of business, the Funds enter into contracts that contain a variety of representations which provide general indemnifications. Each Fund's maximum exposure under these arrangements is unknown. The amount of exposure would depend on future claims that may be brought against each Fund. However, based on experience, the Funds expect the risk of loss to be remote.
As of October 31, 2024, JPMorgan SmartRetirement Funds, which are affiliated fund of funds, each owned in the aggregate, shares representing more than 10% of the net assets of the Funds as follows:
| JPMorgan
SmartRetirement
Funds |
ActiveBuilders Emerging Markets Equity ETF | |
| |
Significant shareholder transactions by these shareholders may impact the Funds' performance and liquidity.
As of October 31, 2024, the Adviser owned shares representing more than 10% of net assets of the following Funds:
| |
| |
Active Developing Markets Equity ETF | |
| |
| |
Significant shareholder transactions by the Adviser may impact the Funds' performance.
The Funds may have elements of risk not typically associated with investments in the United States of America due to concentrated investments in a limited number of foreign countries or regions, which may vary throughout the period. Such concentrations may subject each of these Funds to additional risks resulting from political or economic conditions in such countries or regions and the possible imposition of adverse governmental laws or currency exchange restrictions could cause the securities and their markets to be less liquid and their prices to be more volatile than those of comparable U.S. securities.
Investing in securities of foreign countries may include certain risks and considerations not typically associated with investing in U.S. securities. These risks include revaluation of currencies, high rates of inflation, repatriation restrictions on income and currencies, and future and adverse political, social and economic developments.
| J.P. Morgan Exchange-Traded Funds | |
NOTES TO FINANCIAL STATEMENTSAS OF October 31, 2024 (continued)
Investments in Mainland China, Hong Kong, Taiwan and Macau are subject to significant legal, regulatory, monetary and economic risks, as well as the potential for regional and global conflicts, including actions that are contrary to the interests of the U.S.
Chinese operating companies sometimes rely on Variable Interest Entity (VIE) structures to raise capital from non-Chinese investors, even though such arrangements are not formally recognized under Chinese law. VIE structures are used due to Mainland Chinese government prohibitions on foreign ownership of companies in certain industries and it is not clear that the contracts are enforceable or that the structures will otherwise work as intended. There may also be conflicts of interest between the legal owners of the Mainland Chinese company and non-Chinese investors (such as Active China ETF). It is unclear whether the Mainland China government will withdraw its implicit acceptance of the VIE structure, or whether any new laws, rules or regulations relating to VIE structures will be adopted or, if adopted, what impact they would have on the interests of non-Chinese investors. The market value of Active China ETF’s associated portfolio holdings would likely fall, causing substantial investment losses.
As of October 31, 2024, the following Funds had non-U.S. country allocations representing greater than 10% of total investments (excluding investment of cash collateral from securities loaned) as follows:
| | Active Developing
Markets
Equity ETF | ActiveBuilders
Emerging
Markets
Equity ETF | | |
| | | | | |
| | | | | |
| | | | | |
| | | | | |
| | | | | |
| | | | | |
As of October 31, 2024, a significant portion of the investments of the Funds consisted of securities that were denominated in foreign currencies. Changes in currency exchange rates will affect the value of, and investment income from, such securities.
Derivatives may be riskier than other types of investments because they may be more sensitive to changes in economic and market conditions and could result in losses that significantly exceed the Funds’ original investment. Many derivatives create leverage thereby causing the Funds to be more volatile than they would have been if they had not used derivatives. Derivatives also expose the Funds to counterparty risk (the risk that the derivative counterparty will not fulfill its contractual obligations), including credit risk of the derivative counterparty. The possible lack of a liquid secondary market for derivatives and the resulting inability of the Funds to sell or otherwise close a derivatives position could expose the Funds to losses.
Disruptions to creations and redemptions, the existence of significant market volatility or potential lack of an active trading market for the shares (including through a trading halt), as well as other factors, may result in shares trading significantly above (at a premium) or below (at a discount) to the NAV or to the intraday value of the Funds’ holdings. During such periods, investors may incur significant losses if shares are sold.
The Funds invest in foreign issuers and foreign securities (including depositary receipts) that are subject to additional risks, including political and economic risks, unstable governments, civil conflicts and war, greater volatility, decreased market liquidity, expropriation and nationalization risks, sanctions or other measures by the United States or other governments, currency fluctuations, higher transaction costs, delayed settlement, possible foreign controls on investment, liquidity risks and less stringent investor protection and disclosure standards of foreign markets. In certain markets where securities and other instruments are not traded “delivery versus payment,” a Fund may not receive timely payment for securities or other instruments it has delivered or receive delivery of securities paid for and may be subject to increased risk that the counterparty will fail to make payments or delivery when due or default completely. Foreign market trading hours, clearance and settlement procedures, and holiday schedules may limit the Funds' ability to buy and sell securities.
Events and evolving conditions in certain economies or markets may alter the risks associated with investments tied to countries or regions that historically were perceived as comparatively stable becoming riskier and more volatile. ActiveBuilders Emerging Markets Equity ETF invests a substantial portion of its assets in emerging market countries. These risks are magnified in countries in emerging markets. Emerging market
countries typically have less established market economies than developed countries and may face greater social, economic, regulatory and political uncertainties. In addition, emerging markets typically present greater illiquidity and price volatility concerns due to smaller or limited local capital markets and greater difficulty in determining market valuations of securities due to limited public information on issuers. Certain emerging market countries may be subject to less stringent requirements regarding accounting, auditing, financial reporting and record keeping and therefore, material information related to an investment may not be available or reliable.
Additionally, the Funds may have substantial difficulties exercising their legal rights or enforcing a counterparty’s legal obligations in certain jurisdictions outside of the United States, in particular in emerging market countries, which can increase the risks of loss.
The Funds are subject to infectious disease epidemics/pandemics risk. The effects of any future pandemic or other global event to public health and business and market conditions, may have a significant negative impact on the performance of a Fund's investments, increase a Fund's volatility,
| J.P. Morgan Exchange-Traded Funds | |
negatively impact a Fund’s arbitrage and pricing mechanisms, exacerbate pre-existing political, social and economic risks to the Funds, and negatively impact broad segments of businesses and populations. In addition, governments, their regulatory agencies, or self-regulatory organizations have taken or may take actions in response to a pandemic or other global event that affect the instruments in which the Funds invest, or the issuers of such instruments, in ways that could have a significant negative impact on a Fund’s investment performance. The ultimate impact of any pandemic or other global event and the extent to which the associated conditions and governmental responses impact a Fund will also depend on future developments, which are highly uncertain, difficult to accurately predict and subject to frequent changes.
| J.P. Morgan Exchange-Traded Funds | |
REPORT OF INDEPENDENT REGISTERED PUBLIC ACCOUNTING FIRM
To the Board of Trustees of J.P. Morgan Exchange-Traded Fund Trust and Shareholders of each of the nine funds listed in the table below
Opinions on the Financial Statements
We have audited the accompanying statements of assets and liabilities, including the schedules of portfolio investments, of each of the funds listed in the table below (nine of the funds constituting J.P. Morgan Exchange-Traded Fund Trust, hereafter collectively referred to as the "Funds") as of October 31, 2024, the related statements of operations and of changes in net assets for each of the periods indicated in the table below, including the related notes, and the financial highlights for each of the periods indicated therein (collectively referred to as the “financial statements”). In our opinion, the financial statements present fairly, in all material respects, the financial position of each of the Funds listed in the table below as of October 31, 2024, the results of each of their operations and the changes in each of their net assets for the periods indicated in the table below, and each of the financial highlights for each of the periods indicated therein, in conformity with accounting principles generally accepted in the United States of America.
JPMorgan Active China ETF (1) |
JPMorgan Active Developing Markets Equity ETF (2) |
JPMorgan ActiveBuilders Emerging Markets Equity ETF (3) |
JPMorgan Dividend Leaders ETF (4) |
JPMorgan Global Select Equity ETF (5) |
JPMorgan Healthcare Leaders ETF (6) |
JPMorgan Hedged Equity Laddered Overlay ETF (7) |
JPMorgan International Growth ETF (3) |
JPMorgan International Value ETF (5) |
| Statement of operations for the year ended October 31, 2024, and statement of changes in net assets for the year ended October 31, 2024 and the period March 15, 2023 (commencement of operations) through October 31, 2023 |
| Statement of operations and statement of changes in net assets for the period May 16, 2024 (commencement of operations) through October 31, 2024 |
| Statement of operations for the year ended October 31, 2024 and statement of changes in net assets for the years ended October 31, 2024 and 2023 |
| Statement of operations and statement of changes in net assets for the period September 25, 2024 (commencement of operations) through October 31, 2024 |
| Statement of operations for the year ended October 31, 2024, and statement of changes in net assets for the year ended October 31, 2024 and the period September 13, 2023 (commencement of operations) through October 31, 2023 |
| Statement of operations and statement of changes in net assets for the period November 1, 2023 (commencement of operations) through October 31, 2024 |
| Statement of operations for the year ended October 31, 2024, and statement of changes in net assets for the year ended October 31, 2024 and the period September 28, 2023 (commencement of operations) through October 31, 2023 |
These financial statements are the responsibility of the Funds’ management. Our responsibility is to express an opinion on the Funds’ financial statements based on our audits. We are a public accounting firm registered with the Public Company Accounting Oversight Board (United States) (PCAOB) and are required to be independent with respect to the Funds in accordance with the U.S. federal securities laws and the applicable rules and regulations of the Securities and Exchange Commission and the PCAOB.
We conducted our audits of these financial statements in accordance with the standards of the PCAOB. Those standards require that we plan and perform the audit to obtain reasonable assurance about whether the financial statements are free of material misstatement, whether due to error or fraud.
Our audits included performing procedures to assess the risks of material misstatement of the financial statements, whether due to error or fraud, and performing procedures that respond to those risks. Such procedures included examining, on a test basis, evidence regarding the amounts and disclosures in the financial statements. Our audits also included evaluating the accounting principles used and significant estimates made by management, as well as evaluating the overall presentation of the financial statements. Our procedures included confirmation of securities owned as of October 31, 2024 by correspondence with the custodian, transfer agent
| J.P. Morgan Exchange-Traded Funds | |
and brokers; when replies were not received from brokers, we performed other auditing procedures. We believe that our audits provide a reasonable basis for our opinions.
/s/ PricewaterhouseCoopers LLP
New York, New York
December 23, 2024
We have served as the auditor of one or more investment companies in the JPMorgan Funds complex since 1993.
| J.P. Morgan Exchange-Traded Funds | |
Certain tax information for the J.P. Morgan Funds is required to be provided to shareholders based upon the Funds' income and distributions for the taxable year ended October 31, 2024. The information and distributions reported in this letter may differ from the information and taxable distributions reported to the shareholders for the calendar year ending December 31, 2024. The information necessary to complete your income tax returns for the calendar year ending December 31, 2024 will be provided under separate cover.
Dividends Received Deduction (DRD)
Each Fund listed below had the following percentage, or maximum allowable percentage, of ordinary income distributions eligible for the dividends received deduction for corporate shareholders for the fiscal year ended October 31, 2024:
| Dividends
Received
Deduction |
JPMorgan Global Select Equity ETF | |
JPMorgan Healthcare Leaders ETF | |
JPMorgan Hedged Equity Laddered Overlay ETF | |
Qualified Dividend Income (QDI)
Each Fund listed below had the following amount, or maximum allowable amount, of ordinary income distributions and foreign tax credits (if applicable) treated as qualified dividends for the fiscal year ended October 31, 2024:
| |
JPMorgan Active China ETF | |
JPMorgan Active Developing Markets Equity ETF | |
JPMorgan ActiveBuilders Emerging Markets Equity ETF | |
JPMorgan Global Select Equity ETF | |
JPMorgan Healthcare Leaders ETF | |
JPMorgan Hedged Equity Laddered Overlay ETF | |
JPMorgan International Growth ETF | |
JPMorgan International Value ETF | |
Foreign Source Income and Foreign Tax Credit Pass Through
For the fiscal year ended October 31, 2024, the following Funds intend to elect to pass through to shareholders taxes paid to foreign countries. Gross income and foreign tax expenses are as follows or amounts as finally determined:
| Total Foreign
Source Income | |
JPMorgan Active China ETF | | |
JPMorgan Active Developing Markets Equity ETF | | |
JPMorgan ActiveBuilders Emerging Markets Equity ETF | | |
JPMorgan International Growth ETF | | |
JPMorgan International Value ETF | | |
| J.P. Morgan Exchange-Traded Funds | |
THIS PAGE IS INTENTIONALLY LEFT BLANK
THIS PAGE IS INTENTIONALLY LEFT BLANK
J.P. Morgan Exchange-Traded Funds are distributed by JPMorgan Distribution Services, Inc., an indirect, wholly-owned subsidiary of JPMorgan Chase & Co. Affiliates of JPMorgan Chase & Co. receive fees for providing various services to the Funds.
Contact J.P. Morgan Exchange-Traded Funds at 1-844-457-6383 (844-4JPM ETF) for a fund prospectus. You can also visit us at www.jpmorganfunds.com. Investors should carefully consider the investment objectives and risks as well as charges and expenses of the fund before investing. The prospectus contains this and other information about the fund. Read the prospectus carefully before investing.
Investors may obtain information about the Securities Investor Protection Corporation (SIPC), including the SIPC brochure, by visiting www.sipc.org or by calling SIPC at 202-371-8300.
Each Fund files a complete schedule of its fund holdings for the first and third quarters of its fiscal year with the SEC as an exhibit to its report on Form N-PORT. The Funds' Form N-PORT reports are available on the SEC’s website at http://www.sec.gov. Each Fund's quarterly holdings can be found by visiting the J.P. Morgan Funds’ website at www.jpmorganfunds.com.
A description of each Fund's policies and procedures with respect to the disclosure of each Fund's holdings is available in the prospectuses and Statement of Additional Information.
A copy of proxy policies and procedures is available without charge upon request by calling 1-844-457-6383 and on the Funds' website at www.jpmorganfunds.com. A description of such policies and procedures is on the SEC’s website at www.sec.gov. The Trustees have delegated the authority to vote proxies for securities owned by the Funds to the Adviser. A copy of the Funds' voting record for the most recent 12-month period ended June 30 is available on the SEC’s website at www.sec.gov or at the Funds' website at www.jpmorganfunds.com no later than August 31 of each year. The Funds' proxy voting record will include, among other things, a brief description of the matter voted on for each fund security, and will state how each vote was cast, for example, for or against the proposal.
J.P. Morgan Asset Management is the brand name for the asset management business of JPMorgan Chase & Co. and its affiliates worldwide.
© JPMorgan Chase & Co., 2024. All rights reserved. October 2024.
AN-ACT-ETF-1024
Changes in and Disagreements with Accountants for Open-End Management Investment Companies
Proxy Disclosures for Open-End Management Investment Companies
Remuneration Paid to Directors, Officers, and Others of Open-End Management Investment Companies
Included in the Statements of Operations within the Funds' Financial Statements.
Statement Regarding Basis for Approval of Management Agreement and Sub-Advisory Agreement, Initial Management Agreements, and Management Agreements
BOARD APPROVAL OF MANAGEMENT AGREEMENT AND SUB-ADVISORY AGREEMENT
JPMorgan Active China ETF
The Board of Trustees (the “Board” or the “Trustees”) has established various standing committees composed of Trustees with diverse backgrounds, to which the Board has assigned specific subject matter responsibilities to further enhance the effectiveness of the Board’s oversight and decision making. The Board and its investment committees (Money Market and Alternative Products Committee, Equity Committee, and Fixed Income Committee) met regularly throughout the year and, at each meeting, considered factors that are relevant to their annual consideration of the continuation of the management agreements. The Board also met for the specific purpose of considering management agreement annual renewals. The Board held meetings June 25-26, 2024 and August 20-22, 2024, at which the Trustees considered the continuation of the management agreement (the “Management Agreement”) and sub-advisory agreement (the “Sub-Advisory Agreement”) (each an “Agreement” and together the “Agreements”) for the JPMorgan Active China ETF (the “Fund”) whose annual report is contained herein. At the June meeting, the Board’s investment committees met to review and consider performance, expense and related information for the J.P. Morgan Funds. Each investment committee reported to the full Board, which then considered each investment committee’s preliminary findings. At the August meeting, the Trustees continued their review and consideration. The Trustees, including a majority of the Trustees who are not parties to an Agreement or “interested persons” (as defined in the Investment Company Act of 1940) of any party to an Agreement or any of their affiliates, approved the continuation of each Agreement on August 22, 2024.
As part of their review of the Agreements, the Trustees considered and reviewed performance and other information about the Fund received from J.P. Morgan Investment Management Inc. (the “Adviser”). This information included the Fund’s performance as compared to the performance of its peers and benchmarks, and analyses by the Adviser of the Fund’s performance. In addition, at each of their regular meetings throughout the year, the Trustees considered reports on the performance of certain J.P. Morgan Funds provided by an independent investment consulting firm (the “independent consultant”). In addition, in preparation for the June and August meetings, the Trustees requested, received and evaluated extensive materials from the Adviser, including performance and expense information compiled by Broadridge, using data from Lipper Inc. and/or Morningstar Inc., independent providers of investment company data (together, “Broadridge”). Such materials also included information relating to JPMorgan Asset Management (Asia Pacific) Limited, an affiliate of the Adviser and the sub-adviser for the Fund (the “Sub-Adviser”). Broadridge did not include performance information for the Fund because it had less than one year of performance. The Trustees’ independent consultant also provided additional quantitative and statistical analyses of certain Funds, including risk and performance return assessments as compared to the Funds’ objectives, benchmarks, and peers. Before voting on the Agreements, the Trustees reviewed the Agreements with representatives of the Adviser, counsel to the Fund, and independent legal counsel to the Trustees, and received a memorandum from independent legal counsel to the Trustees discussing the legal standards for their consideration of the Agreements. The Trustees also discussed the Agreements with independent legal counsel in executive sessions at which no representatives of the Adviser or Sub-Adviser were present.
A summary of the material factors evaluated by the Trustees in determining whether to approve each Agreement is provided below. Each Trustee attributed different weights to the various factors and no factor alone was considered determinative. The Trustees considered information provided with respect to the Fund throughout the year, as well as materials furnished specifically in connection with the annual review process. From year to year, the Trustees consider and place emphasis on relevant information in light of changing circumstances in market and economic conditions.
After considering and weighing the factors and information they had received, the Trustees found that the compensation to be received by the Adviser from the Fund under its Management Agreement and by the Sub-Adviser from the Adviser under the Sub-Advisory Agreement, was fair and reasonable under the circumstances, and determined that the continuance of each Agreement was in the best interests of the Fund and its shareholders.
Nature, Extent and Quality of Services Provided by the Adviser and Sub-Adviser
The Trustees received and considered information regarding the nature, extent and quality of services provided to the Fund under the applicable Agreement. The Trustees took into account information furnished throughout the year at Trustee meetings, as well as the materials furnished specifically in connection with this annual review process. Among other things, the Trustees considered:
•
The background and experience of the Adviser’s and Sub-Adviser’s senior management and investment personnel, including personnel changes, if any;
•
The qualifications, backgrounds and responsibilities of the portfolio management team primarily responsible for the day-to-day management of the Fund, including personnel changes, if any;
•
The investment strategy for the Fund, and the infrastructure supporting the portfolio management team;
•
Information about the structure and distribution strategy for the Fund and how it fits within the Adviser’s other fund offerings within the J.P. Morgan Funds complex;
•
The administration services provided by the Adviser in its role as Administrator;
•
Their knowledge of the nature and quality of the services provided by the Adviser, Sub-Adviser and their affiliates gained from their experience as Trustees of the Fund and in the financial industry generally;
•
The overall reputation and capabilities of the Adviser, Sub-Adviser and their affiliates;
•
The commitment of the Adviser and Sub-Adviser to provide high quality service to the Fund;
•
Their overall confidence in the Adviser’s and Sub-Adviser’s integrity; and
•
The Adviser’s and Sub-Adviser’s responsiveness to requests for additional information, questions or concerns raised by them, including the Adviser’s willingness to consider and implement organizational and operational changes designed to improve investment results and the services provided to the Fund.
Based upon these considerations and other factors, the Trustees concluded that they were satisfied with the nature, extent and quality of the services provided to the Fund by the Adviser and Sub-Adviser.
Costs of Services Provided and Profitability to the Adviser and its Affiliates
The Trustees received and considered information regarding the profitability to the Adviser and its affiliates from providing services to the Fund. The Trustees reviewed and discussed this information. The Trustees recognized that this information is not audited and represents the Adviser’s determination of its and its affiliates’ revenues from the contractual services provided to the Fund, less expenses of providing such services. Expenses include direct and indirect costs and are calculated using an allocation methodology developed by the Adviser and reviewed with the Board. The Trustees also recognized that it is difficult to make comparisons of profitability from fund management contracts because comparative information is not generally publicly available and is affected by numerous factors, including the structure of the particular adviser, the types of funds it manages, its business mix, numerous assumptions regarding allocations and the fact that publicly-traded fund managers’ operating profits and net income are net of distribution and marketing expenses. Based upon their review, and taking into consideration the factors noted above, the Trustees concluded that the profitability to the Adviser under the Management Agreement was not unreasonable in light of the services and benefits provided to the Fund.
The Trustees also considered the fees earned by JPMorgan Chase Bank, N.A. (“JPMCB”), an affiliate of the Adviser and Sub-Adviser, for custody, fund accounting and other related services for the Fund, and the profitability of the arrangements to JPMCB.
The Trustees reviewed information regarding potential “fall-out” or ancillary benefits received by the Adviser, Sub-Adviser and their affiliates as a result of their relationship with the Fund. The Trustees considered that the J.P. Morgan Funds' operating accounts are held at JPMCB, which, as a result, will receive float benefits for certain J.P. Morgan Funds, as applicable. The Trustees also noted that the Adviser supports a diverse set of products and services, which benefits the Adviser by allowing it to leverage its infrastructure to serve additional clients, including benefits that may be received by the Adviser and its affiliates in connection with the Fund’s potential investments in other funds advised by the Adviser. The Trustees also reviewed the Adviser’s allocation of fund brokerage for the J.P. Morgan Funds complex, including allocations to brokers who provide research to the Adviser, as well as the Adviser’s use of affiliates to provide other services and the benefits to such affiliates of doing so. The Trustees also considered the benefit to the Adviser, Sub-Adviser and their affiliates from allocating client assets to the Fund.
The Trustees considered the extent to which the Fund may benefit from potential economies of scale. The Trustees considered that under the Management Agreement, the Adviser provides advisory and administrative services and is responsible for substantially all expenses of the Fund except for certain enumerated contractual exclusions under a “unitary fee” structure. The Trustees noted that the unitary management fee for the Fund does not contain breakpoints. The Trustees considered that shareholders would benefit because expenses would be limited even when the Fund is new and not achieving economies of scale. The Trustees considered the
fact that increases in assets would not lead to management fee decreases even if economies of scale are achieved, but also that the Trustees would have the opportunity to further review the appropriateness of the fee payable to the Adviser under the Management Agreement in the future. The Trustees also concluded that the Fund benefited from the Adviser’s reinvestment in its operations to serve the Fund and its shareholders. The Trustees noted that the Adviser’s reinvestment ensures sufficient resources in terms of personnel and infrastructure to support the Fund. After considering the factors identified above, the Trustees concluded that the Fund’s shareholders will receive the benefits of potential economies of scale.
Fees Relative to Adviser’s Other Clients
The Trustees received and considered information about the nature and extent of management services and fee rates offered to other clients of the Adviser, including, to the extent applicable, institutional separate accounts, collective investment trusts, other registered investment companies and/or private funds sub-advised by the Adviser, for investment management styles substantially similar to that of the Fund. The Trustees considered the complexity of investment management for registered investment companies relative to the Adviser’s other clients and noted differences, as applicable, in the fee structure and the regulatory, legal and other risks and responsibilities of providing services to the different clients. The Trustees considered that serving as an adviser to a registered investment company involves greater responsibilities and risks than acting as a sub-adviser and observed that sub-advisory fees may be lower than those charged by the Adviser to the Fund. The Trustees also noted that the adviser, not the applicable registered investment company, typically bears the sub-advisory fee and that many responsibilities related to the advisory function are typically retained by the primary adviser. The Trustees concluded that the fee rates charged to the Fund in comparison to those charged to the Adviser’s other clients were reasonable.
The Trustees receive and consider information about the Fund’s performance throughout the year. The Trustees considered the brief operating history of the Fund which launched in 2023 and therefore was not included in the Broadridge’s performance information. The Trustees discussed the Fund’s performance (on both a relative and absolute basis). The Trustees also considered the Fund’s investment strategy and processes, portfolio management teams and competitive positioning against peer funds. The Trustees also discussed the performance and the investment strategy of the Fund with the Adviser. Based on these discussions and various other factors, the Trustees concluded the Fund’s performance was satisfactory.
Management Fees and Expense Ratios
The Trustees considered the contractual and net management fee rates paid by the Fund to the Adviser and compared the rates to the information prepared by Broadridge concerning management fee rates paid by other funds in the Universe, as well as a subset of funds within the Universe (the “Peer Group”). The Trustees reviewed a description of Broadridge’s methodology for selecting funds in the Peer Group and Universe, as applicable, and noted that Universe and Peer Group quintile rankings were not calculated if the number of funds in the Universe and/or Peer Group did not meet a predetermined minimum. The Trustees also reviewed information about other expenses and the total expense ratio for the Fund. The Trustees considered the fees paid by the Adviser to the Sub-Adviser out of the management fee. The Trustees recognized that it can be difficult to make comparisons of management fees because there are variations in the services that are included in the fees paid by other funds. The Trustees’ determinations as a result of the review of the Fund’s management fees and expense ratios are summarized below:
The Trustees noted that while Broadridge provided data for funds in the Peer Group and Universe for the Fund, Broadridge did not calculate quintile rankings due to the limited number of funds in both the Peer Group and Universe. After considering the factors identified above, in light of this information, the Trustees concluded that the management fee paid by the Fund to the Adviser and by the Adviser to the Sub-Adviser were fair and reasonable in light of the services provided to the Fund.
BOARD APPROVAL OF INITIAL MANAGEMENT AGREEMENTS
JPMorgan Active Developing Markets Equity ETF and JPMorgan Dividend Leaders ETF
The Board of Trustees (the “Board” or the “Trustees”) held meetings and approved the initial management agreements (each a “Management Agreement” and collectively, the “Management Agreements”) for the JPMorgan Active Developing Markets Equity ETF (the “Active Developing Markets Equity ETF”) on November 14-16, 2023 and for JPMorgan Dividend Leaders ETF (the “Dividend Leaders ETF ”) on May 7-9, 2024. Each of the funds is referred to herein as a “Fund” and collectively, as the “Funds”. The Management Agreements were approved by a majority of the Trustees who are not “Interested Persons” (as defined in the Investment Company Act of 1940) of any party to each Management Agreement or any of their affiliates. In connection with the approval of each Management Agreement, the Trustees reviewed written materials prepared by J.P. Morgan Investment Management Inc. (the “Adviser”) and received oral presentations from Adviser personnel. Before voting on the proposed Management Agreements, the Trustees reviewed each Management Agreement with representatives of the Adviser and with counsel to the Funds and independent legal counsel to the Trustees and received a memorandum from independent legal counsel discussing the legal standards for their consideration of the proposed Management Agreements. They also considered information they received from the Adviser over the course of the year in connection with their oversight of other funds managed by the Adviser. The Trustees also discussed each proposed Management Agreement with independent legal counsel in executive session at which no representatives of the Adviser were present.
A summary of the material factors evaluated by the Trustees in determining whether to approve each Management Agreement is provided below. The Trustees considered information provided with respect to the Funds and the approval of the Management Agreements. Each Trustee attributed his or her own evaluation of the significance of the various factors, and no factor alone was considered determinative. The Trustees determined that the proposed compensation to be received by the Adviser from each Fund under its Management Agreement was fair and reasonable and that initial approval of the Management Agreements was in the best interests of each Fund and its potential shareholders.
Summarized below are the material factors considered and discussed by the Trustees in reaching their conclusions:
Nature, Extent and Quality of Services Provided by the Adviser
In connection with the approval of each Fund’s initial Management Agreement, the Trustees considered the materials furnished specifically in connection with the approval of the applicable Management Agreement, as well as other relevant information furnished for the Trustees, regarding the nature, extent, and quality of services provided by the adviser. Among other things, the Trustees considered:
•
The background and experience of the Adviser’s senior management and investment personnel;
•
The qualifications, backgrounds and responsibilities of the portfolio management team to be primarily responsible for the day-to-day management of each Fund;
•
The investment strategy for each Fund, and the infrastructure supporting the portfolio management teams;
•
Information about the structure and distribution strategy of each Fund and how it fits within the Adviser’s other fund offerings within the J.P. Morgan Funds complex;
•
The administration services to be provided by the Adviser under the Management Agreements;
•
Their knowledge of the nature and quality of the services provided by the Adviser and its affiliates gained from their experience as Trustees of the Funds and in the financial industry generally;
•
The overall reputation and capabilities of the Adviser and its affiliates;
•
The commitment of the Adviser to provide high quality service to the Funds;
•
Their overall confidence in the Adviser’s integrity; and
•
The Adviser’s responsiveness to requests for additional information, questions or concerns raised by them.
Based upon these considerations and other factors, the Trustees concluded that they were satisfied with the nature, extent and quality of services to be provided to the Funds by the Adviser.
Fall-Out Benefits
The Trustees reviewed information regarding potential “fall-out” or ancillary benefits expected to be received by the Adviser and its affiliates as a result of their relationship with the Funds. Additionally, the Trustees considered that any fall-out or ancillary benefits would be comparable to those related to the other funds in the complex.
The Trustees also considered the benefits the Adviser is expected to receive as the result of the roles JPMorgan Chase Bank, N.A. (“JPMCB”), an affiliate of the Adviser, plays as custodian, fund accountant and transfer agent for the Funds, including the profitability of those arrangements to JPMCB.
The Trustees considered the extent to which the Funds may benefit from potential economies of scale. The Trustees considered that under the Management Agreements, the Adviser will provide advisory and administrative services and will be responsible for substantially all expenses of each Fund except for certain enumerated contractual exclusions under a “unitary fee structure.” The Trustees noted that the proposed unitary management fee for each Fund does not contain breakpoints. The Trustees considered that shareholders would benefit because expenses would be limited even when a Fund is new and not achieving economies of scale. The Trustees considered the fact that increases in assets would not lead to management fee decreases even if economies of scale are achieved, but also that the Trustees would have the opportunity to further review the appropriateness of the fee payable to the Adviser under its Management Agreement in the future. After considering the factors identified above, the Trustees concluded that each Fund’s shareholders will receive the benefits of potential economies of scale.
Fees Relative to Adviser’s Other Clients
The Trustees received and considered information about the nature and extent of management services and fee rates offered to clients of the Adviser, including, to the extent applicable, institutional separate accounts, collective investment trusts, other registered investment companies and/or private funds sub-advised by the Adviser, for management styles substantially similar to that of each Fund. For the Dividend Leaders ETF, the Trustees considered that the Adviser or its affiliates offer other accounts with a substantially similar investment strategy as that of the Fund. The Trustees concluded that the fees to be charged to the Fund in comparison to those charged to such other clients were reasonable. For the Active Developing Markets Equity ETF , the Trustees considered the Adviser’s view that it does not manage other accounts with a substantially similar investment strategy as that of the Fund.
The Trustees considered each Fund’s investment strategy and processes, the portfolio management team and competitive positioning against identified peer funds and concluded that the prospects for competitive future performance were acceptable.
The Trustees considered the contractual management fee rate that will be paid by each Fund to the Adviser and compared that rate to information prepared by Broadridge Investor Communications Solutions Inc. (“Broadridge”), an independent provider of investment company data, providing management fee rates paid by other funds in the same Morningstar category as each Fund. The Trustees also considered the fees paid to JPMCB, for custody, fund accounting, transfer agency and other related services for each Fund and the profitability of these arrangements to JPMCB.
The Trustees considered how each Fund will be positioned against peer funds, as identified by management and/or Broadridge, as well as how the peer funds included in the Broadridge data differed from the Funds. The Trustees also noted that because the Funds were not yet operational, no profitability information was available. After considering the factors identified above and other factors, in light of the information, the Trustees concluded that each Fund’s proposed management fee was fair and reasonable.
BOARD APPROVAL OF MANAGEMENT AGREEMENTS
JPMorgan ActiveBuilders Emerging Markets Equity ETF, JPMorgan Global Select Equity ETF, JPMorgan Hedged Equity Laddered Overlay ETF, JPMorgan International Growth ETF and JPMorgan International Value ETF
The Board of Trustees (the “Board” or the “Trustees”) has established various standing committees composed of Trustees with diverse backgrounds, to which the Board has assigned specific subject matter responsibilities to further enhance the effectiveness of the Board’s oversight and decision making. The Board and its investment committees (Money Market and Alternative Products Committee, Equity Committee, and Fixed Income Committee) met regularly throughout the year and, at each meeting, considered factors that are relevant to their annual consideration of the continuation of the management agreements. The Board also met for the specific purpose of considering management agreement annual renewals. The Board held meetings June 25-26, 2024 and August 20-22, 2024, at which the Trustees considered the continuation of the management agreements for the JPMorgan ActiveBuilders Emerging Markets Equity ETF, JPMorgan Global Select Equity ETF, JPMorgan Hedged Equity Laddered Overlay ETF, JPMorgan International Growth ETF and JPMorgan International Value ETF (each a “Fund,” and collectively, the “Funds”) whose annual report is contained herein (each a “Management Agreement” and collectively, the “Management Agreements”). At the June meeting, the Board’s investment committees met to review and consider performance, expense and related information for the J.P. Morgan Funds. Each investment committee reported to the full Board, which then considered each investment committee’s preliminary findings. At the August meeting, the Trustees continued their review and consideration. The Trustees, including a majority of the Trustees who are not parties to a Management Agreement or “interested persons” (as defined in the Investment Company Act of 1940) of any party to a Management Agreement or any of their affiliates, approved the continuation of each Management Agreement on August 22, 2024.
As part of their review of the Management Agreements, the Trustees considered and reviewed performance and other information about the Funds received from J.P. Morgan Investment Management Inc. (the “Adviser”). This information included the Funds’ performance as compared to the performance of their peers and benchmarks, and analyses by the Adviser of the Funds’ performance. In addition, at each of their regular meetings throughout the year, the Trustees considered reports on the performance of certain J.P. Morgan Funds provided by an independent investment consulting firm (the “independent consultant”). In addition, in preparation for the June and August meetings, the Trustees requested, received and evaluated extensive materials from the Adviser, including performance and expense information compiled by Broadridge, using data from Lipper Inc. and/or Morningstar Inc., independent providers of investment company data (together, “Broadridge”). The Trustees’ independent consultant also provided additional quantitative and statistical analyses of certain Funds, including risk and performance return assessments as compared to the Funds’ objectives, benchmarks, and peers. Before voting on the Management Agreements, the Trustees reviewed the Management Agreements with representatives of the Adviser, counsel to the Funds, and independent legal counsel to the Trustees, and received a memorandum from independent legal counsel to the Trustees discussing the legal standards for their consideration of the Management Agreements. The Trustees also discussed the Management Agreements with independent legal counsel in executive sessions at which no representatives of the Adviser were present.
A summary of the material factors evaluated by the Trustees in determining whether to approve each Management Agreement is provided below. Each Trustee attributed different weights to the various factors and no factor alone was considered determinative. The Trustees considered information provided with respect to the Funds throughout the year, as well as materials furnished specifically in connection with the annual review process. From year to year, the Trustees consider and place emphasis on relevant information in light of changing circumstances in market and economic conditions.
After considering and weighing the factors and information they had received, the Trustees found that the compensation to be received by the Adviser from each Fund under the applicable Management Agreement was fair and reasonable under the circumstances, and determined that the continuance of each Management Agreement was in the best interests of each Fund and its shareholders.
Nature, Extent and Quality of Services Provided by the Adviser
The Trustees received and considered information regarding the nature, extent and quality of services provided to each Fund under the applicable Management Agreement. The Trustees took into account information furnished throughout the year at Trustee meetings, as well as the materials furnished specifically in connection with this annual review process. Among other things, the Trustees considered:
•
The background and experience of the Adviser’s senior management and investment personnel, including personnel changes, if any;
•
The qualifications, backgrounds and responsibilities of the portfolio management team primarily responsible for the day-to-day
management of each Fund, including personnel changes, if any;
•
The investment strategy for each Fund, and the infrastructure supporting the portfolio management teams;
•
Information about the structure and distribution strategy for each Fund and how it fits within the Adviser’s other fund offerings within the J.P. Morgan Funds complex;
•
The administration services provided by the Adviser in its role as Administrator;
•
Their knowledge of the nature and quality of the services provided by the Adviser and its affiliates gained from their experience as Trustees of the Funds and in the financial industry generally;
•
The overall reputation and capabilities of the Adviser and its affiliates;
•
The commitment of the Adviser to provide high quality service to the Funds;
•
Their overall confidence in the Adviser’s integrity; and
•
The Adviser’s responsiveness to requests for additional information, questions or concerns raised by them, including the Adviser’s willingness to consider and implement organizational and operational changes designed to improve investment results and the services provided to each Fund.
Based upon these considerations and other factors, the Trustees concluded that they were satisfied with the nature, extent and quality of the services provided to the Funds by the Adviser.
Costs of Services Provided and Profitability to the Adviser and its Affiliates
The Trustees received and considered information regarding the profitability to the Adviser and its affiliates from providing services to each Fund. The Trustees reviewed and discussed this information. The Trustees recognized that this information is not audited and represents the Adviser’s determination of its and its affiliates’ revenues from the contractual services provided to the Funds, less expenses of providing such services. Expenses include direct and indirect costs and are calculated using an allocation methodology developed by the Adviser and reviewed with the Board. The Trustees also recognized that it is difficult to make comparisons of profitability from fund management contracts because comparative information is not generally publicly available and is affected by numerous factors, including the structure of the particular adviser, the types of funds it manages, its business mix, numerous assumptions regarding allocations and the fact that publicly-traded fund managers’ operating profits and net income are net of distribution and marketing expenses. Based upon their review, and taking into consideration the factors noted above, the Trustees concluded that the profitability to the Adviser under each Management Agreement was not unreasonable in light of the services and benefits provided to each Fund.
The Trustees also considered the fees earned by JPMorgan Chase Bank, N.A. (“JPMCB”), an affiliate of the Adviser, for custody, fund accounting and other related services for each Fund, and the profitability of the arrangements to JPMCB.
The Trustees reviewed information regarding potential “fall-out” or ancillary benefits received by the Adviser and its affiliates as a result of their relationship with the Funds. The Trustees considered that the J.P. Morgan Funds' operating accounts are held at JPMCB, which, as a result, will receive float benefits for certain J.P. Morgan Funds, as applicable. The Trustees also noted that the Adviser supports a diverse set of products and services, which benefits the Adviser by allowing it to leverage its infrastructure to serve additional clients, including benefits that may be received by the Adviser and its affiliates in connection with the Funds’ potential investments in other funds advised by the Adviser. The Trustees also reviewed the Adviser’s allocation of fund brokerage for the J.P. Morgan Funds complex, including allocations to brokers who provide research to the Adviser, as well as the Adviser’s use of affiliates to provide other services and the benefits to such affiliates of doing so. The Trustees also considered the benefit to the Adviser and its affiliates from allocating client assets to the Funds.
The Trustees considered the extent to which the Funds may benefit from potential economies of scale. The Trustees considered that under the Management Agreements, the Adviser provides advisory and administrative services and is responsible for substantially all expenses of each Fund except for certain enumerated contractual exclusions under a “unitary fee” structure. The Trustees noted that the unitary management fee for each Fund does not contain breakpoints. The Trustees considered that shareholders would benefit because expenses would be limited even when a Fund is new and not achieving economies of scale. The Trustees considered the fact that increases in assets would not lead to management fee decreases even if economies of scale are achieved, but also that the
Trustees would have the opportunity to further review the appropriateness of the fee payable to the Adviser under the Management Agreement in the future. The Trustees also concluded that all Funds benefited from the Adviser’s reinvestment in its operations to serve the Funds and their shareholders. The Trustees noted that the Adviser’s reinvestment ensures sufficient resources in terms of personnel and infrastructure to support the Funds. After considering the factors identified above, the Trustees concluded that the Fund’s shareholders will receive the benefits of potential economies of scale.
Fees Relative to Adviser’s Other Clients
The Trustees received and considered information about the nature and extent of management services and fee rates offered to other clients of the Adviser, including, to the extent applicable, institutional separate accounts, collective investment trusts, other registered investment companies and/or private funds sub-advised by the Adviser, for investment management styles substantially similar to that of each Fund. The Trustees considered the complexity of investment management for registered investment companies relative to the Adviser’s other clients and noted differences, as applicable, in the fee structure and the regulatory, legal and other risks and responsibilities of providing services to the different clients. The Trustees considered that serving as an adviser to a registered investment company involves greater responsibilities and risks than acting as a sub-adviser and observed that sub-advisory fees may be lower than those charged by the Adviser to each Fund. The Trustees also noted that the adviser, not the applicable registered investment company, typically bears the sub-advisory fee and that many responsibilities related to the advisory function are typically retained by the primary adviser. The Trustees concluded that the fee rates charged to each Fund in comparison to those charged to the Adviser’s other clients were reasonable.
The Trustees receive and consider information about each Fund’s performance throughout the year. For the JPMorgan Global Select Equity ETF, JPMorgan Hedged Equity Laddered Overlay ETF and JPMorgan International Value ETF, each of which launched in 2023 and therefore were not included in the Broadridge comparison discussed below, the Trustees discussed each Fund’s performance (on both a relative and absolute basis). The Trustees also considered each Fund’s investment strategy and processes, portfolio management teams and competitive positioning against peer funds. The Trustees also discussed the performance and the investment strategy of each of these Funds with the Adviser. Based on these discussions and various other factors, the Trustees concluded each Fund’s performance was satisfactory.
For the JPMorgan ActiveBuilders Emerging Markets Equity ETF and JPMorgan International Growth ETF, the Trustees received and considered absolute and/or relative performance information for the Funds with at least one-year of performance history in a report prepared by Broadridge. The Trustees considered the total return performance information, which included the ranking of the Funds within a performance universe comprised of funds with the same Broadridge investment classification and objective (the “Universe”), by total return for the applicable one- and three-year periods. The Trustees reviewed a description of Broadridge’s methodology for selecting exchange-traded funds in each Fund’s Universe, and noted that Universe quintile rankings were not calculated if the number of funds in the Universe did not meet a predetermined minimum. As part of this review, the Trustees also reviewed each Fund’s performance against its benchmark and considered the performance information provided for the Funds at regular Board meetings by the Adviser and the Trustees’ independent consultant and also considered the special analysis prepared for certain Funds by the Trustees’ independent consultant. The Trustees also engaged with the Adviser to consider what steps might be taken to improve performance, as applicable. The Broadridge performance data noted by the Trustees as part of their review and the determinations made by the Trustees with respect to each Fund’s performance are summarized below:
The Trustees noted that the JPMorgan ActiveBuilders Emerging Markets Equity ETF’s performance was in the fourth quintile of the Universe for the one-year period ended December 31, 2023. The Trustees discussed the performance and investment strategy of the Fund with the Adviser and reviewed the performance analysis and evaluation prepared by the independent consultant. The Trustees also considered that the Fund is relatively new, with its three-year anniversary in March of 2024. Based upon these discussions and various other factors, the Trustees concluded that the Fund’s performance was satisfactory under the circumstances. The Trustees requested, however, that the Fund’s Adviser provide additional Fund performance information to be reviewed with members of the Equity Committee at each of their regular meetings over the course of the next year.
The Trustees noted that the JPMorgan International Growth ETF’s performance was in the fourth and fifth quintiles of the Universe for the one- and three-year periods ended December 31, 2023, respectively. The Trustees discussed the performance and investment strategy of the Fund with the Adviser and reviewed the performance analysis and evaluation prepared by the independent consultant. The Trustees noted that although the Fund had underperformed in the medium term, its more recent performance had shown improvement. Based upon these discussions and various other factors, the Trustees concluded that the Fund’s performance was satisfactory under the circumstances.
Management Fees and Expense Ratios
The Trustees considered the contractual and net management fee rates paid by each Fund to the Adviser and compared the rates to the information prepared by Broadridge concerning management fee rates paid by other funds in the Universe, as well as a subset of funds within the Universe (the “Peer Group”). The Trustees reviewed a description of Broadridge’s methodology for selecting funds in the Peer Group and Universe, as applicable, and noted that Universe and Peer Group quintile rankings were not calculated if the number of funds in the Universe and/or Peer Group did not meet a predetermined minimum. The Trustees also reviewed information about other expenses and the total expense ratio for each Fund. The Trustees recognized that it can be difficult to make comparisons of management fees because there are variations in the services that are included in the fees paid by other funds. The Trustees’ determinations as a result of the review of each Fund’s management fees and expense ratios are summarized below:
The Trustees noted that the JPMorgan ActiveBuilders Emerging Markets Equity ETF’s net management fee was in the second quintile of both the Peer Group and Universe, and that the actual total expenses were in the first quintile of both the Peer Group and Universe. After considering the factors identified above, in light of this information, the Trustees concluded that the management fee was fair and reasonable in light of the services provided to the Fund.
The Trustees noted that the JPMorgan Global Select Equity ETF’s net management fee was in the first and second quintiles of the Peer Group and Universe, respectively, and that the actual total expenses were in the first quintile of both the Peer Group and Universe. After considering the factors identified above, in light of this information, the Trustees concluded that the management fee was fair and reasonable in light of the services provided to the Fund.
The Trustees noted that the JPMorgan Hedged Equity Laddered Overlay ETF’s net management fee and actual total expenses were in the first quintile of both the Peer Group and Universe. After considering the factors identified above, in light of this information, the Trustees concluded that the management fee was fair and reasonable in light of the services provided to the Fund.
The Trustees noted that the JPMorgan International Growth ETF’s net management fee was in the third and second quintiles of the Peer Group and Universe, respectively, and that the actual total expenses were in the second quintile of both the Peer Group and Universe. After considering the factors identified above, in light of this information, the Trustees concluded that the management fee was fair and reasonable in light of the services provided to the Fund.
The Trustees noted that the JPMorgan International Value ETF’s net management fee and actual total expenses were in the fourth quintile of the Universe. Broadridge did not calculate quintile rankings for the Peer Group for this Fund due to the limited number of funds in the Peer Group. After considering the factors identified above, in light of this information, the Trustees concluded that the management fee was fair and reasonable in light of the services provided to the Fund.
Annual Financial Statements
J.P. Morgan Exchange-Traded Funds
October 31, 2024
| | |
JPMorgan Climate Change Solutions ETF | | |
JPMorgan Sustainable Infrastructure ETF | | The NASDAQ Stock Market® LLC |
CONTENTS
Investments in a Fund are not deposits or obligations of, or guaranteed or endorsed by, any bank and are not insured or guaranteed by the FDIC, the Federal Reserve Board or any other government agency. You could lose money if you sell when a Fund’s share price is lower than when you invested.
Past performance is no guarantee of future performance. The general market views expressed in this report are opinions based on market and other conditions through the end of the reporting period and are subject to change without notice. These views are not intended to predict the future performance of a Fund or the securities markets.
Prospective investors should refer to the Funds’ prospectus for a discussion of the Funds’ investment objectives, strategies and risks. Call J.P. Morgan Exchange-Traded Funds at (844) 457-6383 for a prospectus containing more complete information about a Fund, including management fees and other expenses. Please read it carefully before investing.
Shares are bought and sold throughout the day on an exchange at market price (not at net asset value) through a brokerage account, and are not individually subscribed and redeemed from a Fund. Shares may only be subscribed and redeemed directly from a Fund by Authorized Participants, in very large creation/redemption units. Brokerage commissions will reduce returns.
JPMorgan Climate Change Solutions ETF
SCHEDULE OF PORTFOLIO INVESTMENTSAS OF October 31, 2024
| | |
|
|
| | |
|
| | |
|
West Fraser Timber Co. Ltd. | | |
|
Contemporary Amperex Technology Co. Ltd., Class A | | |
NARI Technology Co. Ltd., Class A | | |
| | |
|
| | |
| | |
| | |
| | |
|
| | |
|
| | |
| | |
| | |
Voltalia SA (Registered) * | | |
| | |
|
| | |
| | |
| | |
| | |
| | |
|
| | |
|
| | |
| | |
| | |
|
| | |
| | |
Kurita Water Industries Ltd. | | |
| | |
| | |
|
|
| | |
| | |
| | |
|
| | |
|
| | |
| | |
| | |
|
| | |
| | |
| | |
|
| | |
| | |
| | |
| | |
| | |
|
Taiwan Semiconductor Manufacturing Co. Ltd., ADR | | |
|
| | |
|
| | |
| | |
| | |
| | |
| | |
| | |
| | |
| | |
| | |
| | |
| | |
| | |
| | |
| | |
| | |
| | |
| | |
SEE NOTES TO FINANCIAL STATEMENTS.
| J.P. Morgan Exchange-Traded Funds | |
JPMorgan Climate Change Solutions ETF
SCHEDULE OF PORTFOLIO INVESTMENTSAS OF October 31, 2024 (continued)
| | |
Common Stocks — continued |
United States — continued |
| | |
| | |
| | |
| | |
| | |
| | |
| | |
Watts Water Technologies, Inc., Class A | | |
| | |
| | |
| | |
Total Common Stocks
(Cost $12,862,580) | | |
Total Investments — 98.9%
(Cost $12,862,580) | | |
Other Assets in Excess of Liabilities — 1.1% | | |
| | |
Percentages indicated are based on net assets. |
| |
| American Depositary Receipt |
| |
| Real Estate Investment Trust |
| Non-income producing security. |
| Security exempt from registration pursuant to Regulation S under the Securities Act of 1933, as amended. Regulation S applies to securities offerings that are made outside of the United States and do not involve direct selling efforts in the United States and as such may have restrictions on resale. |
Summary of Investments by Industry, October 31, 2024
The following table represents the portfolio investments of the Fund by industry classifications as a percentage of total investments:
| PERCENT OF
TOTAL
INVESTMENTS |
| |
| |
| |
Commercial Services & Supplies | |
| |
| |
Semiconductors & Semiconductor Equipment | |
Construction & Engineering | |
Independent Power and Renewable Electricity Producers | |
Electronic Equipment, Instruments & Components | |
| |
| |
| |
| |
Others (each less than 1.0%) | |
SEE NOTES TO FINANCIAL STATEMENTS.
| J.P. Morgan Exchange-Traded Funds | |
JPMorgan Sustainable Infrastructure ETF
SCHEDULE OF PORTFOLIO INVESTMENTSAS OF October 31, 2024
| | |
|
|
| | |
| | |
| | |
| | |
|
| | |
Warehouses De Pauw CVA, REIT | | |
| | |
|
Cia de Saneamento Basico do Estado de Sao Paulo SABESP | | |
Transmissora Alianca de Energia Eletrica S/A | | |
| | |
|
Canadian National Railway Co. | | |
|
China Longyuan Power Group Corp. Ltd., Class H | | |
Contemporary Amperex Technology Co. Ltd., Class A | | |
NARI Technology Co. Ltd., Class A | | |
| | |
|
| | |
|
| | |
| | |
| | |
| | |
|
| | |
| | |
| | |
|
| | |
Infrastrutture Wireless Italiane SpA (a) | | |
Terna - Rete Elettrica Nazionale | | |
| | |
|
Kurita Water Industries Ltd. | | |
| | |
| | |
| | |
|
|
| | |
|
| | |
|
| | |
Corp. ACCIONA Energias Renovables SA | | |
| | |
| | |
Solaria Energia y Medio Ambiente SA * | | |
| | |
|
| | |
| | |
LondonMetric Property plc, REIT | | |
| | |
| | |
| | |
UNITE Group plc (The), REIT | | |
United Utilities Group plc | | |
| | |
|
Alexandria Real Estate Equities, Inc., REIT | | |
American Tower Corp., REIT | | |
Americold Realty Trust, Inc., REIT | | |
| | |
| | |
Digital Realty Trust, Inc., REIT | | |
| | |
| | |
HA Sustainable Infrastructure Capital, Inc., REIT | | |
| | |
Healthpeak Properties, Inc., REIT | | |
| | |
| | |
| | |
| | |
Public Service Enterprise Group, Inc. | | |
Rexford Industrial Realty, Inc., REIT | | |
Sabra Health Care REIT, Inc., REIT | | |
SBA Communications Corp., REIT | | |
| | |
| | |
| | |
SEE NOTES TO FINANCIAL STATEMENTS.
| J.P. Morgan Exchange-Traded Funds | |
JPMorgan Sustainable Infrastructure ETF
SCHEDULE OF PORTFOLIO INVESTMENTSAS OF October 31, 2024 (continued)
| | |
Common Stocks — continued |
United States — continued |
| | |
| | |
| | |
Total Common Stocks
(Cost $19,710,144) | | |
Short-Term Investments — 0.7% |
Investment Companies — 0.7% |
JPMorgan Prime Money Market Fund Class IM Shares, 4.90% (b) (c)
(Cost $146,601) | | |
Total Investments — 99.6%
(Cost $19,856,745) | | |
Other Assets in Excess of Liabilities — 0.4% | | |
| | |
Percentages indicated are based on net assets. |
| |
| Certificaten Van Aandelen (Dutch Certificate) |
| Real Estate Investment Trust |
| Non-income producing security. |
| Security exempt from registration pursuant to Regulation S under the Securities Act of 1933, as amended. Regulation S applies to securities offerings that are made outside of the United States and do not involve direct selling efforts in the United States and as such may have restrictions on resale. |
| Investment in an affiliated fund, which is registered under the Investment Company Act of 1940, as amended, and is advised by J.P. Morgan Investment Management Inc. |
| The rate shown is the current yield as of October 31, 2024. |
Summary of Investments by Industry, October 31, 2024
The following table represents the portfolio investments of the Fund by industry classifications as a percentage of total investments:
| PERCENT OF
TOTAL
INVESTMENTS |
| |
| |
| |
| |
| |
| |
| |
Independent Power and Renewable Electricity Producers | |
| |
Construction & Engineering | |
Diversified Telecommunication Services | |
| |
| |
Real Estate Management & Development | |
Electronic Equipment, Instruments & Components | |
Health Care Providers & Services | |
Transportation Infrastructure | |
Others (each less than 1.0%) | |
| |
SEE NOTES TO FINANCIAL STATEMENTS.
| J.P. Morgan Exchange-Traded Funds | |
STATEMENTS OF ASSETS AND LIABILITIESAS OF October 31, 2024
| JPMorgan
Climate Change
Solutions ETF | JPMorgan Sustainable
Infrastructure ETF |
| | |
Investments in non-affiliates, at value | | |
Investments in affiliates, at value | | |
| | |
Foreign currency, at value | | |
| | |
Dividends from non-affiliates | | |
Dividends from affiliates | | |
| | |
| | |
| | |
| | |
Management fees (See Note 3.A.) | | |
| | |
| | |
| | |
| | |
| | |
Total distributable earnings (loss) | | |
| | |
Outstanding number of shares
(unlimited number of shares authorized - par value $0.0001) | | |
Net asset value, per share | | |
Cost of investments in non-affiliates | | |
Cost of investments in affiliates | | |
| | |
SEE NOTES TO FINANCIAL STATEMENTS.
| J.P. Morgan Exchange-Traded Funds | |
STATEMENTS OF OPERATIONSFOR THE YEAR ENDED October 31, 2024
| JPMorgan
Climate Change
Solutions ETF | JPMorgan Sustainable
Infrastructure ETF |
| | |
Interest income from non-affiliates | | |
Interest income from affiliates | | |
Dividend income from non-affiliates | | |
Dividend income from affiliates | | |
Non-cash dividend income from non-affiliates | | |
Foreign taxes withheld (net) | | |
| | |
| | |
Management fees (See Note 3.A.) | | |
| | |
Net investment income (loss) | | |
REALIZED/UNREALIZED GAINS (LOSSES): | | |
Net realized gain (loss) on transactions from: | | |
Investments in non-affiliates | | |
Investments in affiliates | | |
In-kind redemptions of investments in non-affiliates (See Note 4) | | |
Foreign currency transactions | | |
| | |
Change in net unrealized appreciation/depreciation on: | | |
Investments in non-affiliates | | |
Investments in affiliates | | |
Foreign currency translations | | |
Change in net unrealized appreciation/depreciation | | |
Net realized/unrealized gains (losses) | | |
Change in net assets resulting from operations | | |
SEE NOTES TO FINANCIAL STATEMENTS.
| J.P. Morgan Exchange-Traded Funds | |
STATEMENTS OF CHANGES IN NET ASSETSFOR THE PERIODS INDICATED
| JPMorgan
Climate Change Solutions ETF | JPMorgan Sustainable
Infrastructure ETF |
| Year Ended
October 31, 2024 | Year Ended
October 31, 2023 | Year Ended
October 31, 2024 | Year Ended
October 31, 2023 |
CHANGE IN NET ASSETS RESULTING FROM OPERATIONS: | | | | |
Net investment income (loss) | | | | |
| | | | |
Change in net unrealized appreciation/depreciation | | | | |
Change in net assets resulting from operations | | | | |
DISTRIBUTIONS TO SHAREHOLDERS: | | | | |
Total distributions to shareholders | | | | |
| | | | |
Change in net assets resulting from capital transactions | | | | |
| | | | |
| | | | |
| | | | |
| | | | |
| | | | |
Proceeds from shares issued | | | | |
| | | | |
Total change in net assets resulting from capital transactions | | | | |
| | | | |
| | | | |
| | | | |
Net increase (decrease) in shares from share transactions | | | | |
SEE NOTES TO FINANCIAL STATEMENTS.
| J.P. Morgan Exchange-Traded Funds | |
FINANCIAL HIGHLIGHTSFOR THE PERIODS INDICATED
| Per share operating performance |
| | | |
| Net asset
value,
beginning
of period | Net investment
income
(loss) (b) | Net realized
and unrealized
gains
(losses)
on investments | Total from
investment
operations | |
JPMorgan Climate Change Solutions ETF | | | | | |
Year Ended October 31, 2024 | | | | | |
Year Ended October 31, 2023 | | | | | |
December 13, 2021 (f) through October 31, 2022 | | | | | |
JPMorgan Sustainable Infrastructure ETF | | | | | |
Year Ended October 31, 2024 | | | | | |
Year Ended October 31, 2023 | | | | | |
September 7, 2022 (f) through October 31, 2022 | | | | | |
|
| Annualized for periods less than one year, unless otherwise noted. |
| Calculated based upon average shares outstanding. |
| Not annualized for periods less than one year. |
| Includes adjustments in accordance with accounting principles generally accepted in the United States of America and as such, the net asset values for financial reporting purposes and the returns based upon those net asset values may differ from the net asset values and returns for shareholder transactions. |
| Market price return was calculated assuming an initial investment made at the market price at the beginning of the reporting period, reinvestment of all dividends and distributions at the market price during the period, and sale at the market price on the last day of the period. The closing price was used to calculate the market price return. |
| Commencement of operations. |
| Since the shares of the Fund did not trade in the secondary market until the day after the Fund’s inception, for the period from the inception to the first day of secondary market trading, the net asset value is used as a proxy for the secondary market trading price to calculate the market returns. |
SEE NOTES TO FINANCIAL STATEMENTS.
| J.P. Morgan Exchange-Traded Funds | |
| |
| | | | | Ratios to average net assets (a) | |
Net asset
value,
end of
period | | | Market
price
total
return (c)(e) | | | Net
investment
income
(loss) | Portfolio
turnover
rate (c) |
| | | | | | | |
| | | | | | | |
| | | | | | | |
| | | | | | | |
| | | | | | | |
| | | | | | | |
| | | | | | | |
| | | | | | | |
SEE NOTES TO FINANCIAL STATEMENTS.
| J.P. Morgan Exchange-Traded Funds | |
NOTES TO FINANCIAL STATEMENTSAS OF October 31, 2024
1. Organization
J.P. Morgan Exchange-Traded Fund Trust (the “Trust”) was formed on February 25, 2010, and is governed by a Declaration of Trust as amended and restated February 19, 2014, and is registered under the Investment Company Act of 1940, as amended (the “1940 Act”), as an open-end management investment company.
The following are 2 separate funds of the Trust (each, a "Fund" and collectively, the "Funds") covered by this report:
| Diversification Classification |
JPMorgan Climate Change Solutions ETF | |
JPMorgan Sustainable Infrastructure ETF | |
The investment objective of JPMorgan Climate Change Solutions ETF (“Climate Change Solutions ETF”) is to seek to achieve long-term capital appreciation by investing in companies that the adviser believes are developing solutions to address climate change.
The investment objective of JPMorgan Sustainable Infrastructure ETF ("Sustainable Infrastructure ETF") is to seek to achieve long-term capital appreciation by investing in companies that the adviser believes are well-positioned to develop the infrastructure required to facilitate a sustainable and inclusive economy.
J.P. Morgan Investment Management Inc. (“JPMIM”), an indirect, wholly-owned subsidiary of JPMorgan Chase & Co. (“JPMorgan”), acts as adviser (the “Adviser”) and administrator (the “Administrator”) to the Funds.
Shares of each Fund are listed and traded at market price on an exchange as follows:
| |
Climate Change Solutions ETF | |
Sustainable Infrastructure ETF | The NASDAQ Stock Market® LLC |
Market prices for the Funds’ shares may be different from their net asset value (“NAV”).
The Funds issue and redeem their shares on a continuous basis, through JPMorgan Distribution Services, Inc. (the “Distributor” or “JPMDS”), an indirect, wholly-owned subsidiary of JPMorgan, at NAV in large blocks of shares, referred to as “Creation Units”. Creation Units are issued and redeemed in exchange for a basket of securities and/or cash. A cash amount may be substituted if a Fund has sizable exposure to market or sponsor restricted securities. Shares are generally traded in the secondary market in amounts less than a Creation Unit at market prices that change throughout the day. Only individuals or institutions that have entered into an authorized participant agreement with the Distributor may do business directly with the Funds (each, an “Authorized Participant”).
2. Significant Accounting Policies
The following is a summary of significant accounting policies followed by the Funds in the preparation of their financial statements. The Funds are investment companies and, accordingly, follow the investment company accounting and reporting guidance of the Financial Accounting Standards Board (“FASB”) Accounting Standards Codification Topic 946 — Investment Companies, which is part of U.S. generally accepted accounting principles (“GAAP”). The preparation of financial statements in conformity with GAAP requires management to make estimates and assumptions that affect (i) the reported amounts of assets and liabilities, (ii) disclosure of contingent assets and liabilities at the date of the financial statements, and (iii) the reported amounts of increases and decreases in net assets from operations during the reporting period. Actual results could differ from those estimates.
A. Valuation of Investments— Investments are valued in accordance with GAAP and the Funds' valuation policies set forth by, and under the supervision and responsibility of, the Board of Trustees of the Trust (the "Board"), which established the following approach to valuation, as described more fully below: (i) investments for which market quotations are readily available shall be valued at their market value and (ii) all other investments for which market quotations are not readily available shall be valued at their fair value as determined in good faith by the Board.
Under Section 2(a)(41) of the 1940 Act, the Board is required to determine fair value for securities that do not have readily available market quotations. Under Securities and Exchange Commission ("SEC") Rule 2a-5 (Good Faith Determinations of Fair Value), the Board may designate the performance of these fair valuation determinations to a valuation designee. The Board has designated the Adviser as the “Valuation Designee” to perform fair valuation determinations for the Funds on behalf of the Board subject to appropriate oversight by the Board. The Adviser, as Valuation Designee, leverages the J.P. Morgan Asset Management Americas Valuation Committee (“AVC”) to help oversee and carry out the policies for the valuation of investments held in the Funds. The Adviser, as Valuation Designee, remains responsible for the valuation determinations.
| J.P. Morgan Exchange-Traded Funds | |
This oversight by the AVC includes monitoring the appropriateness of fair values based on results of ongoing valuation oversight including, but not limited to, consideration of macro or security specific events, market events, and pricing vendor and broker due diligence. The Administrator is responsible for discussing and assessing the potential impacts to the fair values on an ongoing basis, and, at least on a quarterly basis, with the AVC and the Board.
Equities and other exchange-traded instruments are valued at the last sale price or official market closing price on the primary exchange on which the instrument is traded before the NAVs of the Funds are calculated on a valuation date. Certain foreign equity instruments are valued by applying international fair value factors provided by approved Pricing Services. The factors seek to adjust the local closing price for movements of local markets post closing, but prior to the time the NAVs are calculated.
Investments in open-end investment companies (“Underlying Funds”) are valued at each Underlying Fund’s NAV per share as of the report date.
Valuations reflected in this report are as of the report date. As a result, changes in valuation due to market events and/or issuer-related events after the report date and prior to issuance of the report are not reflected herein.
The various inputs that are used in determining the valuation of the Funds' investments are summarized into the three broad levels listed below.
•
Level 1 — Unadjusted inputs using quoted prices in active markets for identical investments.
•
Level 2 — Other significant observable inputs including, but not limited to, quoted prices for similar investments, inputs other than quoted prices that are observable for investments (such as interest rates, prepayment speeds, credit risk, etc.) or other market corroborated inputs.
•
Level 3 — Significant inputs based on the best information available in the circumstances, to the extent observable inputs are not available (including the Funds' assumptions in determining the fair value of investments).
A financial instrument’s level within the fair value hierarchy is based on the lowest level of any input, both individually and in the aggregate, that is significant to the fair value measurement. The inputs or methodology used for valuing instruments are not necessarily an indication of the risk associated with investing in those instruments.
The following tables represent each valuation input as presented on the Schedules of Portfolio Investments ("SOIs"):
Climate Change Solutions ETF | | |
| | Level 2
Other significant
observable inputs | Level 3
Significant
unobservable inputs | |
Investments in Securities | | | | |
| | | | |
| | | | |
| | | | |
| | | | |
| | | | |
| | | | |
| | | | |
| | | | |
| | | | |
| | | | |
| | | | |
| | | | |
| | | | |
| | | | |
| | | | |
| | | | |
| | | | |
| | | | |
| | | | |
| | | | |
| | | | |
Total Investments in Securities | | | | |
| J.P. Morgan Exchange-Traded Funds | |
NOTES TO FINANCIAL STATEMENTSAS OF October 31, 2024 (continued)
Sustainable Infrastructure ETF | | |
| | Level 2
Other significant
observable inputs | Level 3
Significant
unobservable inputs | |
Investments in Securities | | | | |
| | | | |
| | | | |
| | | | |
| | | | |
| | | | |
| | | | |
| | | | |
| | | | |
| | | | |
| | | | |
| | | | |
| | | | |
| | | | |
| | | | |
| | | | |
| | | | |
| | | | |
| | | | |
| | | | |
Total Investments in Securities | | | | |
B. Restricted Securities— Certain securities held by the Funds may be subject to legal or contractual restrictions on resale. Restricted securities generally are resold in transactions exempt from registration under the Securities Act of 1933, as amended (the “Securities Act”). Disposal of these securities may involve time-consuming negotiations and expense. Prompt sale at the current valuation may be difficult and could adversely affect the NAVs of the Funds.
As of October 31, 2024, the Funds had no investments in restricted securities other than securities sold to the Funds under Rule 144A and/or Regulation S under the Securities Act.
C. Securities Lending — The Funds are authorized to engage in securities lending in order to generate additional income. The Funds are able to lend to approved borrowers. Citibank N.A. (“Citibank”) serves as lending agent for the Funds, pursuant to a Securities Lending Agency Agreement (the “Securities Lending Agency Agreement”). Securities loaned are collateralized by cash equal to at least 100% of the market value plus accrued interest on the securities lent, which is invested in the Class IM Shares of the JPMorgan U.S. Government Money Market Fund and the Agency SL Class Shares of the JPMorgan Securities Lending Money Market Fund. The Funds retain the interest earned on cash collateral investments but are required to pay the borrower a rebate for the use of the cash collateral. In cases where the lent security is of high value to borrowers, there may be a negative rebate (i.e., a net payment from the borrower to the Funds). Upon termination of a loan, the Funds are required to return to the borrower an amount equal to the cash collateral, plus any rebate owed to the borrowers. The remaining maturities of the securities lending transactions are considered overnight and continuous. Loans are subject to termination by the Funds or the borrower at any time.
The net income earned on the securities lending (after payment of rebates and Citibank’s fee) is included on the Statements of Operations as Income from securities lending (net). The Funds also receive payments from the borrower during the period of the loan, equivalent to dividends and interest earned on the securities loaned, which are recorded as Dividend or Interest income, respectively, on the Statements of Operations.
Under the Securities Lending Agency Agreement, Citibank marks to market the loaned securities on a daily basis. In the event the cash received from the borrower is less than 102% of the value of the loaned securities (105% for loans of non-U.S. securities), Citibank requests additional cash from the borrower so as to maintain a collateralization level of at least 102% of the value of the loaned securities plus accrued interest (105% for loans of non-U.S. securities), subject to certain de minimis amounts.
The value of securities out on loan is recorded as an asset on the Statements of Assets and Liabilities. The value of the cash collateral received is recorded as a liability on the Statements of Assets and Liabilities and details of collateral investments are disclosed on the SOIs.
| J.P. Morgan Exchange-Traded Funds | |
The Funds bear the risk of loss associated with the collateral investments and are not entitled to additional collateral from the borrower to cover any such losses. To the extent that the value of the collateral investments declines below the amount owed to a borrower, the Funds may incur losses that exceed the amount they earned on lending the security. Upon termination of a loan, the Funds may use leverage (borrow money) to repay the borrower for cash collateral posted if the Adviser does not believe that it is prudent to sell the collateral investments to fund the payment of this liability. Securities lending activity is subject to master netting arrangements.
Securities lending also involves counterparty risks, including the risk that the loaned securities may not be returned in a timely manner or at all. Subject to certain conditions, Citibank has agreed to indemnify the Funds from losses resulting from a borrower’s failure to return a loaned security.
The Funds did not lend out any securities during the year ended October 31, 2024.
D. Investment Transactions with Affiliates— The Funds invested in Underlying Funds advised by the Adviser. An issuer which is under common control with a Fund may be considered an affiliate. For the purposes of the financial statements, the Funds assume the issuers listed in the tables below to be affiliated issuers. The Underlying Funds’ distributions may be reinvested into such Underlying Funds. Reinvestment amounts are included in the purchases at cost amounts in the tables below.
Climate Change Solutions ETF |
For the year ended October 31, 2024 |
| | | | | Change in
Unrealized
Appreciation/
(Depreciation) | | | | Capital Gain
Distributions |
JPMorgan Prime Money Market Fund Class IM Shares, 4.90% (a) (b) | | | | | | | | | |
|
| Investment in an affiliated fund, which is registered under the Investment Company Act of 1940, as amended, and is advised by J.P. Morgan Investment Management Inc. |
| The rate shown is the current yield as of October 31, 2024. |
Sustainable Infrastructure ETF |
For the year ended October 31, 2024 |
| | | | | Change in
Unrealized
Appreciation/
(Depreciation) | | | | Capital Gain
Distributions |
JPMorgan Prime Money Market Fund Class IM Shares, 4.90% (a) (b) | | | | | | | | | |
|
| Investment in an affiliated fund, which is registered under the Investment Company Act of 1940, as amended, and is advised by J.P. Morgan Investment Management Inc. |
| The rate shown is the current yield as of October 31, 2024. |
E. Foreign Currency Translation — The books and records of the Funds are maintained in U.S. dollars. Foreign currency amounts are translated into U.S. dollars at the prevailing exchange rates of such currencies against the U.S. dollar. The market value of investment securities and other assets and liabilities are translated at the exchange rate as of the valuation date. Purchases and sales of investment securities, income and expenses are translated at the exchange rate prevailing on the respective dates of such transactions.
The Funds do not isolate the effect of changes in foreign exchange rates from changes in market prices on securities held. Accordingly, such changes are included within Change in net unrealized appreciation/depreciation on investments in non-affiliates on the Statements of Operations.
Reported realized foreign currency gains and losses arise from the disposition of foreign currency, currency gains or losses realized between the trade and settlement dates on securities transactions, and the difference between the amounts of dividends, interest and foreign withholding taxes recorded on each Fund's books on the transaction date and the U.S. dollar equivalent of the amounts actually received or paid. These reported realized foreign currency gains and losses are included in Net realized gain (loss) on foreign currency transactions on the Statements of Operations. Unrealized foreign currency gains and losses arise from changes (due to changes in exchange rates) in the value of foreign currency and other assets and liabilities denominated in foreign currencies, which are held at year end and are included in Change in net unrealized appreciation/depreciation on foreign currency translations on the Statements of Operations.
| J.P. Morgan Exchange-Traded Funds | |
NOTES TO FINANCIAL STATEMENTSAS OF October 31, 2024 (continued)
F. Security Transactions and Investment Income— Investment transactions are accounted for on the trade date (the date the order to buy or sell is executed). Securities gains and losses are calculated on a specifically identified cost basis.
Dividend income, net of foreign taxes withheld, if any, is recorded on the ex-dividend date or when a Fund first learns of the dividend.
To the extent such information is publicly available, the Funds record distributions received in excess of income earned from underlying investments as a reduction of cost of investments and/or realized gain. Such amounts are based on estimates if actual amounts are not available and actual amounts of income, realized gain and return of capital may differ from the estimated amounts. The Funds adjust the estimated amounts of the components of distributions (and consequently their net investment income) as necessary, once the issuers provide information about the actual composition of the distributions.
G. Federal Income Taxes— Each Fund is treated as a separate taxable entity for Federal income tax purposes. Each Fund's policy is to comply with the provisions of the Internal Revenue Code (the “Code”) applicable to regulated investment companies and to distribute to shareholders all of its distributable net investment income and net realized capital gains on investments. Accordingly, no provision for Federal income tax is necessary. Management has reviewed the Funds' tax positions for all open tax years and has determined that as of October 31, 2024, no liability for Federal income tax is required in the Funds' financial statements for net unrecognized tax benefits. However, management’s conclusions may be subject to future review based on changes in, or the interpretation of, the accounting standards or tax laws and regulations. Each Fund's Federal tax returns for the prior three fiscal years, or since inception if shorter, remain subject to examination by the Internal Revenue Service.
H. Foreign Taxes—The Funds may be subject to foreign taxes on income, gains on investments or currency purchases/repatriation, a portion of which may be recoverable. The Funds will accrue such taxes and recoveries as applicable, based upon their current interpretation of tax rules and regulations that exist in the markets in which they invest. When a capital gains tax is determined to apply, the Funds record an estimated deferred tax liability in an amount that would be payable if the securities were disposed of on the valuation date.
I. Distributions to Shareholders— Distributions from net investment income, if any, are generally declared and paid at least annually. Net realized capital gains, if any, are distributed by each Fund at least annually. The amount of distributions from net investment income and net realized capital gains is determined in accordance with Federal income tax regulations, which may differ from GAAP. To the extent these “book/tax” differences are permanent in nature (i.e., that they result from other than timing of recognition — “temporary differences”), such amounts are reclassified within the capital accounts based on their Federal tax basis treatment.
The following amounts were reclassified within the capital accounts:
| | Accumulated
undistributed
(distributions in
excess of)
net investment
income | Accumulated
net realized
gains (losses) |
Climate Change Solutions ETF | | | |
Sustainable Infrastructure ETF | | | |
The reclassifications for the Funds relate primarily to redemptions in-kind and tax adjustments on certain investments.
3. Fees and Other Transactions with Affiliates
A. Management Fee—JPMIM manages the investments of each Fund pursuant to a Management Agreement. For such services, JPMIM is paid a fee which is accrued daily and paid no more frequently than monthly based on each Fund's respective average daily net assets at the following rate:
| |
Climate Change Solutions ETF | |
Sustainable Infrastructure ETF | |
Under each Management Agreement, JPMIM is responsible for substantially all expenses of each Fund, (including expenses of the Trust relating to each Fund), except for the management fees, payments under the Funds' 12b-1 plan (if any), interest expenses, dividend and interest expenses related to short sales, taxes, acquired fund fees and expenses (other than fees for funds advised by the Adviser and/or its affiliates), costs of holding shareholder meetings, and litigation and potential litigation and other extraordinary expenses not incurred in the ordinary course of each Fund’s business. Additionally, each Fund is responsible for its non-operating expenses, including brokerage commissions and fees and expenses associated with each Fund’s securities lending program, if applicable. For the avoidance of doubt, the Adviser’s payment of such expenses may be accomplished through a Fund’s payment of such expenses and a corresponding reduction in the fee payable to the Adviser, provided, however, that if the amount of expenses paid by a Fund exceeds the fee payable to the Adviser, the Adviser will reimburse that Fund for such amount.
| J.P. Morgan Exchange-Traded Funds | |
B. Administration Fee— JPMIM provides administration services to the Funds. Pursuant to each Management Agreement, JPMIM is compensated as described in Note 3.A.
JPMorgan Chase Bank, N.A. (“JPMCB”), a wholly-owned subsidiary of JPMorgan, serves as the Funds' sub-administrator (the “Sub-administrator”). For its services as Sub-administrator, JPMCB receives a portion of the management fees payable to JPMIM.
C. Custodian, Accounting and Transfer Agent Fees— JPMCB provides custody, accounting and transfer agency services to the Funds. For performing these services, JPMIM pays JPMCB transaction and asset-based fees that vary according to the number of transactions and positions, plus out-of-pocket expenses.
Additionally, Authorized Participants generally pay transaction fees associated with the creation and redemption of Fund shares. These fees are paid to JPMIM to offset certain custodian charges that are covered by each Management Agreement.
Interest income earned on cash balances at the custodian, if any, is included in Interest income from affiliates on the Statements of Operations.
Interest expense paid to the custodian related to cash overdrafts, if any, is included in Interest expense to affiliates on the Statements of Operations.
D. Distribution Services— The Distributor or its agent distributes Creation Units for each Fund on an agency basis. The Distributor does not maintain a secondary market in shares of each Fund. JPMDS receives no fees for their distribution services under the distribution agreement with the Trust (the “Distribution Agreement”). Although the Trust does not pay any fees under the Distribution Agreement, JPMIM pays JPMDS for certain distribution related services.
E. Waivers and Reimbursements— The Funds may invest in one or more money market funds advised by the Adviser (affiliated money market funds). The fees for the affiliated money market funds, except for investments of securities lending cash collateral, are covered under each Management Agreement as described in Note 3.A.
F. Other— Certain officers of the Trust are affiliated with the Adviser, the Administrator and JPMDS. Such officers receive no compensation from the Funds for serving in their respective roles.
The Board designated and appointed a Chief Compliance Officer to the Funds pursuant to Rule 38a-1 under the 1940 Act. The fees associated with the office of the Chief Compliance Officer are paid for by JPMIM as described in Note 3.A.
The SEC has granted an exemptive order permitting the Funds to engage in principal transactions with J.P. Morgan Securities LLC, an affiliated broker, involving taxable money market instruments, subject to certain conditions.
4. Investment Transactions
During the year ended October 31, 2024, purchases and sales of investments (excluding short-term investments) were as follows:
| Purchases
(excluding
U.S. Government) | Sales
(excluding
U.S. Government) |
Climate Change Solutions ETF | | |
Sustainable Infrastructure ETF | | |
During the year ended October 31, 2024, there were no purchases or sales of U.S. Government securities.
For the year ended October 31, 2024, in-kind transactions associated with creations and redemptions were as follows:
| | |
Climate Change Solutions ETF | | |
Sustainable Infrastructure ETF | | |
During the year ended October 31, 2024, the Funds delivered portfolio securities for the redemption of Fund shares (in-kind redemptions). Cash and portfolio securities were transferred for redemptions at fair value. For financial reporting purposes, the Funds recorded net realized gains and losses in connection with each in-kind redemption transaction.
| J.P. Morgan Exchange-Traded Funds | |
NOTES TO FINANCIAL STATEMENTSAS OF October 31, 2024 (continued)
5. Federal Income Tax Matters
For Federal income tax purposes, the estimated cost and unrealized appreciation (depreciation) in value of investments held at October 31, 2024 were as follows:
| | Gross
Unrealized
Appreciation | Gross
Unrealized
Depreciation | Net Unrealized
Appreciation
(Depreciation) |
Climate Change Solutions ETF | | | | |
Sustainable Infrastructure ETF | | | | |
The difference between book and tax basis appreciation (depreciation) on investments is primarily attributed to tax adjustments on certain investments and wash sale loss deferrals.
The tax character of distributions paid during the year ended October 31, 2024 was as follows:
| | |
Climate Change Solutions ETF | | |
Sustainable Infrastructure ETF | | |
|
| Short-term gain distributions are treated as ordinary income for income tax purposes. |
The tax character of distributions paid during the year ended October 31, 2023 was as follows:
| | Net
Long-Term
Capital Gains | |
Climate Change Solutions ETF | | | |
Sustainable Infrastructure ETF | | | |
|
| Short-term gain distributions are treated as ordinary income for income tax purposes. |
As of October 31, 2024, the estimated components of net assets (excluding paid-in-capital) on a tax basis were as follows:
| Current
Distributable
Ordinary
Income | Current
Distributable
Long-Term
Capital Gain
(Tax Basis Capital
Loss Carryover) | Unrealized
Appreciation
(Depreciation) |
Climate Change Solutions ETF | | | |
Sustainable Infrastructure ETF | | | |
| | | |
The cumulative timing differences primarily consist of trustee deferred compensation, tax adjustments on certain investments and wash sale loss deferrals.
As of October 31, 2024, the following Funds had net capital loss carryforwards, which are available to offset future realized gains:
| Capital Loss Carryforward Character |
| | |
Climate Change Solutions ETF | | |
Sustainable Infrastructure ETF | | |
| J.P. Morgan Exchange-Traded Funds | |
As of October 31, 2024, the Funds utilized net capital loss carryforwards as follows:
| |
| |
Climate Change Solutions ETF | |
Sustainable Infrastructure ETF | |
6. Capital Share Transactions
The Trust issues and redeems shares of the Funds only in Creation Units through the Distributor at NAV. Capital shares transactions detail can be found in the Statements of Changes in Net Assets.
Shares of the Funds may only be purchased or redeemed by Authorized Participants. Such Authorized Participants may from time to time hold, of record or beneficially, a substantial percentage of the Funds' shares outstanding and act as executing or clearing broker for investment transactions on behalf of the Funds. An Authorized Participant is either (1) a “Participating Party” or other participant in the clearing process through the Continuous Net Settlement System of the National Securities Clearing Corporation; or (2) a DTC Participant; which, in either case, must have executed an agreement with the Distributor.
Creation Units of a Fund may be created in advance of receipt by the Trust of all or a portion of the applicable basket of equity securities and other instruments (“Deposit Instruments”) and cash as described in the Funds’ registration statement. In these instances, the initial Deposit Instruments and cash must be deposited in an amount equal to the sum of the cash amount plus at least 105% for the Funds of the market value of undelivered Deposit Instruments. A transaction fee may be imposed to offset transfer and other transaction costs associated with the purchase or redemption of Creation Units.
Effective November 1, 2022, the Funds rely upon an exemptive order granted by the SEC (the “Order”) permitting the establishment and operation of an Interfund Lending Facility (the “Facility”). The Facility allows the Funds to directly lend and borrow money to or from any other fund relying upon the Order at rates beneficial to both the borrowing and lending funds. Advances under the Facility are taken primarily for temporary or emergency purposes, including the meeting of redemption requests that otherwise might require the untimely disposition of securities, and are subject to each Fund's borrowing restrictions. The interfund loan rate is determined, as specified in the Order, by averaging the current repurchase agreement rate and the current bank loan rate. The Order was granted to JPMorgan Trust II and may be relied upon by the Funds because the Funds and the series of JPMorgan Trust II are all investment companies in the same “group of investment companies” (as defined in Section 12(d)(1)(G) of the 1940 Act).
The Funds had no borrowings outstanding from another fund, or loans outstanding to another fund, during the year ended October 31, 2024.
The Trust and JPMCB have entered into a financing arrangement. Under this arrangement, JPMCB provides an unsecured, uncommitted credit facility in the aggregate amount of $100 million to certain of the J.P. Morgan Funds, including the Funds. Advances under the arrangement are taken primarily for temporary or emergency purposes, including the meeting of redemption requests that otherwise might require the untimely disposition of securities, and are subject to each Fund's borrowing restrictions. Interest on borrowings is payable at a rate determined by JPMCB at the time of borrowing. This agreement has been extended until October 28, 2025.
The Funds had no borrowings outstanding from the unsecured, uncommitted credit facility during the year ended October 31, 2024.
Effective August 8, 2023, the Trust, along with certain other trusts for J.P. Morgan Funds (“Borrowers”), has entered into an existing joint syndicated senior unsecured revolving credit facility totaling $1.5 billion (“Credit Facility”) with various lenders and The Bank of New York Mellon, as administrative agent for the lenders. Although the Trust is effectively part of the Credit Facility as of August 8, 2023, it was not eligible to draw on the Credit Facility, and did not incur costs associated with being a part of the Credit Facility up through May 30, 2024.
This Credit Facility provides a source of funds to the Borrowers for temporary and emergency purposes, including the meeting of redemption requests that otherwise might require the untimely disposition of securities. Under the terms of the Credit Facility, a borrowing fund must have a minimum of $25 million in adjusted net asset value and not exceed certain adjusted net asset coverage ratios prior to and during the time in which any borrowings are outstanding. If a fund does not comply with the aforementioned requirements, the fund must remediate within three business days with respect to the $25 million minimum adjusted net asset value or within one business day with respect to certain asset coverage ratios or the administrative agent at the request of, or with the consent of, the lenders may terminate the Credit Facility and declare any outstanding borrowings to be due and payable immediately.
Interest associated with any borrowing under the Credit Facility is charged to the borrowing fund at a rate of interest equal to 1.00%, plus the greater of the federal funds effective rate or the one-month Adjusted Secured Overnight Financing Rate (SOFR).
The Funds did not utilize the Credit Facility during the period November 1, 2023 through May 30, 2024.
Effective May 31, 2024, the Funds are no longer part of the Credit Facility.
| J.P. Morgan Exchange-Traded Funds | |
NOTES TO FINANCIAL STATEMENTSAS OF October 31, 2024 (continued)
8. Risks, Concentrations and Indemnifications
In the normal course of business, the Funds enter into contracts that contain a variety of representations which provide general indemnifications. Each Fund's maximum exposure under these arrangements is unknown. The amount of exposure would depend on future claims that may be brought against each Fund. However, based on experience, the Funds expect the risk of loss to be remote.
As of October 31, 2024, the Adviser owned shares representing more than 10% of net assets of the following Funds:
| |
Climate Change Solutions ETF | |
Sustainable Infrastructure ETF | |
Significant shareholder transactions by the Adviser may impact the Funds' performance.
Climate Change Solutions ETF’s investment strategy may result in the Climate Change Solutions ETF investing in securities or industry sectors that underperform the market. The Climate Change Solutions ETF’s focus on securities of issuers that, in the Adviser’s opinion, are developing solutions to address climate change and benefit from growing demand for such solutions will result in exposure to certain market segments including transportation, construction, food and water, renewable energy and electrification and recycling and reuse. Climate Change Solutions ETF will be more susceptible to events or factors affecting such market segments, and the market prices of its portfolio securities may be more volatile than those of funds that are more diversified. Climate Change Solutions ETF is particularly exposed to, and may be negatively impacted by changes in global and regional climates, environmental protection regulatory actions, changes in government standards and subsidy levels, changes in taxation and other domestic and international political, regulatory and economic developments. Companies involved in renewable energy and electrification also may be adversely affected by the increased use of, or decreases in prices for, oil or other fossil fuels. In addition, scientific developments, such as breakthroughs in the remediation of climate change, and changes in governmental policies relating to the effects of pollution may affect investments in pollution control, which could in turn affect these companies. Such companies also may be significantly affected by technological changes in industries focusing on energy, pollution control and mitigation of climate change. Because society’s focus on climate change issues is relatively new, the emphasis and direction of governmental policies is subject to significant change, and rapid technological change could render even new approaches and products obsolete. The Adviser may consider certain factors related to climate change that may cause it to perform differently compared to funds that do not have such considerations. The consideration of these factors may result in the Climate Change Solutions ETF forgoing opportunities to buy certain securities when it might otherwise be advantageous to do so, or selling securities for climate change reasons when it might otherwise be disadvantageous for it to do so. In addition, there is a risk that the companies identified by the Adviser do not operate as expected when addressing climate changes issues. There are significant differences in interpretations of what it means for a company to have solutions that address climate change.
Sustainable Infrastructure ETF’s investment strategy and the Adviser’s determinations of what is considered sustainable infrastructure may result in Sustainable Infrastructure ETF investing in securities or industry sectors that underperform the market and other funds that do not have the same considerations. Sustainable Infrastructure ETF’s focus on securities of issuers that, in the Adviser’s opinion, are developing solutions to address sustainable infrastructure and benefit from growing demand for such solutions will result in exposure to certain market segments, including certain types of utilities, electricity, renewables, transportation, water, digital, sustainable logistics, and medical. Such focus may result in Sustainable Infrastructure ETF’s forgoing opportunities to buy certain securities when it might otherwise be advantageous to do so, or selling securities for sustainability reasons when it might otherwise be disadvantageous for it to do so. In addition, there is a risk that the companies selected for their relation to the sub-themes do not operate as expected when addressing sustainability issues. Sustainable Infrastructure ETF will be more susceptible to events or factors affecting such market segments, and the market prices of its portfolio securities may be more volatile than those of funds that are more diversified. The factors that the Adviser considers in evaluating sustainable infrastructure may change over time. There may also be differences in interpretations of what it means for a company to “facilitate a sustainable and inclusive economy.” The portfolio decisions that the Adviser makes may differ with other investors’ or investment managers’ views. Sustainable Infrastructure ETF is particularly exposed to, and may be negatively impacted by changes in global and regional standards, environmental protection regulatory actions, government regulation of medical facilities, changes in government standards and subsidy levels, changes in taxation and other domestic and international political, regulatory and economic developments. In addition, scientific developments, such as breakthroughs in electrical and water engineering and advancements in technology, including digital technology and changes in governmental policies relating to infrastructure, may affect investments in infrastructure which could in turn affect these companies. Such companies also may be significantly affected by technological changes in industries focusing on energy, transportation, and digital infrastructure.
The Funds may have elements of risk not typically associated with investments in the United States of America due to concentrated investments in a limited number of foreign countries or regions, which may vary throughout the period. Such concentrations may subject each of these Funds to additional risks resulting from political or economic conditions in such countries or regions and the possible imposition of adverse governmental laws or currency exchange restrictions could cause the securities and their markets to be less liquid and their prices to be more volatile than those of comparable U.S. securities.
| J.P. Morgan Exchange-Traded Funds | |
As of October 31, 2024, the following Fund had non-U.S. country allocations representing greater than 10% of total investments as follows:
| Sustainable
Infrastructure ETF |
| |
Investing in securities of foreign countries may include certain risks and considerations not typically associated with investing in U.S. securities. These risks include revaluation of currencies, high rates of inflation, repatriation restrictions on income and currencies, and future and adverse political, social and economic developments.
The Funds invest in foreign issuers and foreign securities (including depositary receipts) that are subject to additional risks, including political and economic risks, unstable governments, civil conflicts and war, greater volatility, decreased market liquidity, expropriation and nationalization risks, sanctions or other measures by the United States or other governments, currency fluctuations, higher transaction costs, delayed settlement, possible foreign controls on investment, and less stringent investor protection and disclosure standards of foreign markets. In certain markets where securities and other instruments are not traded “delivery versus payment,” a Fund may not receive timely payment for securities or other instruments it has delivered or receive delivery of securities paid for and may be subject to increased risk that the counterparty will fail to make payments or delivery when due or default completely. Foreign market trading hours, clearance and settlement procedures, and holiday schedules may limit the Funds' ability to buy and sell securities.
Events and evolving conditions in certain economies or markets may alter the risks associated with investments tied to countries or regions that historically were perceived as comparatively stable becoming riskier and more volatile. The Funds each invest a substantial portion of their assets in emerging market countries. These risks are magnified in countries in emerging markets. Emerging market countries typically have less-established market economies than developed countries and may face greater social, economic, regulatory and political uncertainties. In addition, emerging markets typically present greater illiquidity and price volatility concerns due to smaller or limited local capital markets and greater difficulty in determining market valuations of securities due to limited public information on issuers. Certain emerging market countries may be subject to less stringent requirements regarding accounting, auditing, financial reporting and record keeping and therefore, material information related to an investment may not be available or reliable. Additionally, the Funds may have substantial difficulties exercising their legal rights or enforcing a counterparty’s legal obligations in certain jurisdictions outside of the United States, in particular in emerging market countries, which can increase the risks of loss.
The Funds are subject to infectious disease epidemics/pandemics risk. The effects of any future pandemic or other global event to public health and business and market conditions, may have a significant negative impact on the performance of a Fund's investments, increase a Fund's volatility, negatively impact a Fund’s arbitrage and pricing mechanisms, exacerbate pre-existing political, social and economic risks to the Funds, and negatively impact broad segments of businesses and populations. In addition, governments, their regulatory agencies, or self-regulatory organizations have taken or may take actions in response to a pandemic or other global event that affect the instruments in which the Funds invest, or the issuers of such instruments, in ways that could have a significant negative impact on a Fund’s investment performance. The ultimate impact of any pandemic or other global event and the extent to which the associated conditions and governmental responses impact a Fund will also depend on future developments, which are highly uncertain, difficult to accurately predict and subject to frequent changes.
Effective December 13, 2024, Climate Change Solutions ETF was classified as a diversified investment company rather than a non-diversified investment company.
| J.P. Morgan Exchange-Traded Funds | |
REPORT OF INDEPENDENT REGISTERED PUBLIC ACCOUNTING FIRM
To the Board of Trustees of J.P. Morgan Exchange-Traded Fund Trust and Shareholders of JPMorgan Climate Change Solutions ETF and JPMorgan Sustainable Infrastructure ETF
Opinions on the Financial Statements
We have audited the accompanying statements of assets and liabilities, including the schedules of portfolio investments, of JPMorgan Climate Change Solutions ETF and JPMorgan Sustainable Infrastructure ETF (two of the funds constituting J.P. Morgan Exchange-Traded Fund Trust, hereafter collectively referred to as the "Funds") as of October 31, 2024, the related statements of operations for the year ended October 31, 2024, the statements of changes in net assets for each of the two years in the period ended October 31, 2024, including the related notes, and the financial highlights for each of the periods indicated therein (collectively referred to as the “financial statements”). In our opinion, the financial statements present fairly, in all material respects, the financial position of each of the Funds as of October 31, 2024, the results of each of their operations for the year then ended, the changes in each of their net assets for each of the two years in the period ended October 31, 2024 and each of the financial highlights for each of the periods indicated therein, in conformity with accounting principles generally accepted in the United States of America.
These financial statements are the responsibility of the Funds’ management. Our responsibility is to express an opinion on the Funds’ financial statements based on our audits. We are a public accounting firm registered with the Public Company Accounting Oversight Board (United States) (PCAOB) and are required to be independent with respect to the Funds in accordance with the U.S. federal securities laws and the applicable rules and regulations of the Securities and Exchange Commission and the PCAOB.
We conducted our audits of these financial statements in accordance with the standards of the PCAOB. Those standards require that we plan and perform the audit to obtain reasonable assurance about whether the financial statements are free of material misstatement, whether due to error or fraud.
Our audits included performing procedures to assess the risks of material misstatement of the financial statements, whether due to error or fraud, and performing procedures that respond to those risks. Such procedures included examining, on a test basis, evidence regarding the amounts and disclosures in the financial statements. Our audits also included evaluating the accounting principles used and significant estimates made by management, as well as evaluating the overall presentation of the financial statements. Our procedures included confirmation of securities owned as of October 31, 2024 by correspondence with the custodian and transfer agent. We believe that our audits provide a reasonable basis for our opinions.
/s/ PricewaterhouseCoopers LLP
New York, New York
December 23, 2024
We have served as the auditor of one or more investment companies in the JPMorgan Funds complex since 1993.
| J.P. Morgan Exchange-Traded Funds | |
Certain tax information for the J.P. Morgan Funds is required to be provided to shareholders based upon the Funds' income and distributions for the taxable year ended October 31, 2024. The information and distributions reported in this letter may differ from the information and taxable distributions reported to the shareholders for the calendar year ending December 31, 2024. The information necessary to complete your income tax returns for the calendar year ending December 31, 2024 will be provided under separate cover.
Dividends Received Deduction (DRD)
Each Fund listed below had the following percentage, or maximum allowable percentage, of ordinary income distributions eligible for the dividends received deduction for corporate shareholders for the fiscal year ended October 31, 2024:
| Dividends
Received
Deduction |
JPMorgan Climate Change Solutions ETF | |
JPMorgan Sustainable Infrastructure ETF | |
Qualified Dividend Income (QDI)
Each Fund listed below had the following amount, or maximum allowable amount, of ordinary income distributions and foreign tax credits (if applicable) treated as qualified dividends for the fiscal year ended October 31, 2024:
| |
JPMorgan Climate Change Solutions ETF | |
JPMorgan Sustainable Infrastructure ETF | |
Foreign Source Income and Foreign Tax Credit Pass Through
For the fiscal year ended October 31, 2024, the following Funds intend to elect to pass through to shareholders taxes paid to foreign countries. Gross income and foreign tax expenses are as follows or amounts as finally determined:
| Total Foreign
Source Income | |
JPMorgan Climate Change Solutions ETF | | |
JPMorgan Sustainable Infrastructure ETF | | |
| J.P. Morgan Exchange-Traded Funds | |
THIS PAGE IS INTENTIONALLY LEFT BLANK
THIS PAGE IS INTENTIONALLY LEFT BLANK
THIS PAGE IS INTENTIONALLY LEFT BLANK
J.P. Morgan Exchange-Traded Funds are distributed by JPMorgan Distribution Services, Inc., an indirect, wholly-owned subsidiary of JPMorgan Chase & Co. Affiliates of JPMorgan Chase & Co. receive fees for providing various services to the Funds.
Contact J.P. Morgan Exchange-Traded Funds at 1-844-457-6383 (844-4JPM ETF) for a fund prospectus. You can also visit us at www.jpmorganfunds.com. Investors should carefully consider the investment objectives and risks as well as charges and expenses of the fund before investing. The prospectus contains this and other information about the fund. Read the prospectus carefully before investing.
Investors may obtain information about the Securities Investor Protection Corporation (SIPC), including the SIPC brochure, by visiting www.sipc.org or by calling SIPC at 202-371-8300.
Each Fund files a complete schedule of its fund holdings for the first and third quarters of its fiscal year with the SEC as an exhibit to its report on Form N-PORT. The Funds' Form N-PORT reports are available on the SEC’s website at http://www.sec.gov. Each Fund's quarterly holdings can be found by visiting the J.P. Morgan Funds’ website at www.jpmorganfunds.com.
A description of each Fund's policies and procedures with respect to the disclosure of each Fund's holdings is available in the prospectus and Statement of Additional Information.
A copy of proxy policies and procedures is available without charge upon request by calling 1-844-457-6383 and on the Funds' website at www.jpmorganfunds.com. A description of such policies and procedures is on the SEC’s website at www.sec.gov. The Trustees have delegated the authority to vote proxies for securities owned by the Funds to the Adviser. A copy of the Funds' voting record for the most recent 12-month period ended June 30 is available on the SEC’s website at www.sec.gov or at the Funds' website at www.jpmorganfunds.com no later than August 31 of each year. The Funds' proxy voting record will include, among other things, a brief description of the matter voted on for each fund security, and will state how each vote was cast, for example, for or against the proposal.
J.P. Morgan Asset Management is the brand name for the asset management business of JPMorgan Chase & Co. and its affiliates worldwide.
© JPMorgan Chase & Co., 2024. All rights reserved. October 2024.
AN-SUS-ETF-1024
Changes in and Disagreements with Accountants for Open-End Management Investment Companies
Proxy Disclosures for Open-End Management Investment Companies
Remuneration Paid to Directors, Officers, and Others of Open-End Management Investment Companies
Included in the Statements of Operations within the Funds' Financial Statements.
Statement Regarding Basis for Approval of Management Agreements
The Board of Trustees (the “Board” or the “Trustees”) has established various standing committees composed of Trustees with diverse backgrounds, to which the Board has assigned specific subject matter responsibilities to further enhance the effectiveness of the Board’s oversight and decision making. The Board and its investment committees (Money Market and Alternative Products Committee, Equity Committee, and Fixed Income Committee) met regularly throughout the year and, at each meeting, considered factors that are relevant to their annual consideration of the continuation of the management agreements. The Board also met for the specific purpose of considering management agreement annual renewals. The Board held meetings June 25-26, 2024 and August 20-22, 2024, at which the Trustees considered the continuation of the management agreements for each Fund whose annual report is contained herein (each a “Management Agreement” and collectively, the “Management Agreements”). At the June meeting, the Board’s investment committees met to review and consider performance, expense and related information for the J.P. Morgan Funds. Each investment committee reported to the full Board, which then considered each investment committee’s preliminary findings. At the August meeting, the Trustees continued their review and consideration. The Trustees, including a majority of the Trustees who are not parties to a Management Agreement or “interested persons” (as defined in the Investment Company Act of 1940) of any party to a Management Agreement or any of their affiliates, approved the continuation of each Management Agreement on August 22, 2024.
As part of their review of the Management Agreements, the Trustees considered and reviewed performance and other information about the Funds received from J.P. Morgan Investment Management Inc. (the “Adviser”). This information included the Funds’ performance as compared to the performance of their peers and benchmarks, and analyses by the Adviser of the Funds’ performance. In addition, at each of their regular meetings throughout the year, the Trustees considered reports on the performance of certain J.P. Morgan Funds provided by an independent investment consulting firm (the “independent consultant”). In addition, in preparation for the June and August meetings, the Trustees requested, received and evaluated extensive materials from the Adviser, including performance and expense information compiled by Broadridge, using data from Lipper Inc. and/or Morningstar Inc., independent providers of investment company data (together, “Broadridge”). The Trustees’ independent consultant also provided additional quantitative and statistical analyses of certain Funds, including risk and performance return assessments as compared to the Funds’ objectives, benchmarks, and peers. Before voting on the Management Agreements, the Trustees reviewed the Management Agreements with represen
tatives of the Adviser, counsel to the Funds, and independent legal counsel to the Trustees, and received a memorandum from independent legal counsel to the Trustees discussing the legal standards for their consideration of the Management Agreements. The Trustees also discussed the Management Agreements with independent legal counsel in executive sessions at which no representatives of the Adviser were present.
A summary of the material factors evaluated by the Trustees in determining whether to approve each Management Agreement is provided below. Each Trustee attributed different weights to the various factors and no factor alone was considered determinative. The Trustees considered information provided with respect to the Funds throughout the year, as well as materials furnished specifically in connection with the annual review process. From year to year, the Trustees consider and place emphasis on relevant information in light of changing circumstances in market and economic conditions.
After considering and weighing the factors and information they had received, the Trustees found that the compensation to be received by the Adviser from each Fund under the applicable Management Agreement was fair and reasonable under the circumstances, and determined that the continuance of each Management Agreement was in the best interests of each Fund and its shareholders.
Nature, Extent and Quality of Services Provided by the Adviser
The Trustees received and considered information regarding the nature, extent and quality of services provided to each Fund under the applicable Management Agreement. The Trustees took into account information furnished throughout the year at Trustee meetings, as well as the materials furnished specifically in connection with this annual review process. Among other things, the Trustees considered:
•
The background and experience of the Adviser’s senior management and investment personnel, including personnel changes, if any;
•
The qualifications, backgrounds and responsibilities of the portfolio management team primarily responsible for the day-to-day management of each Fund, including personnel changes, if any;
•
The investment strategy for each Fund, and the infrastructure supporting the portfolio management teams;
•
Information about the structure and distribution strategy for each Fund and how it fits within the Adviser’s other fund offerings within the J.P. Morgan Funds complex;
•
The administration services provided by the Adviser in its
role as Administrator;
•
Their knowledge of the nature and quality of the services provided by the Adviser and its affiliates gained from their experience as Trustees of the Funds and in the financial industry generally;
•
The overall reputation and capabilities of the Adviser and its affiliates;
•
The commitment of the Adviser to provide high quality service to the Funds;
•
Their overall confidence in the Adviser’s integrity; and
•
The Adviser’s responsiveness to requests for additional information, questions or concerns raised by them, including the Adviser’s willingness to consider and implement organizational and operational changes designed to improve investment results and the services provided to each Fund.
Based upon these considerations and other factors, the Trustees concluded that they were satisfied with the nature, extent and quality of the services provided to the Funds by the Adviser.
Costs of Services Provided and Profitability to the Adviser and its Affiliates
The Trustees received and considered information regarding the profitability to the Adviser and its affiliates from providing services to each Fund. The Trustees reviewed and discussed this information. The Trustees recognized that this information is not audited and represents the Adviser’s determination of its and its affiliates’ revenues from the contractual services provided to the Funds, less expenses of providing such services. Expenses include direct and indirect costs and are calculated using an allocation methodology developed by the Adviser and reviewed with the Board. The Trustees also recognized that it is difficult to make comparisons of profitability from fund management contracts because comparative information is not generally publicly available and is affected by numerous factors, including the structure of the particular adviser, the types of funds it manages, its business mix, numerous assumptions regarding allocations and the fact that publicly-traded fund managers’ operating profits and net income are net of distribution and marketing expenses. Based upon their review, and taking into consideration the factors noted above, the Trustees concluded that the profitability to the Adviser under each Management Agreement was not unreasonable in light of the services and benefits provided to each Fund.
The Trustees also considered the fees earned by JPMorgan Chase Bank, N.A. (“JPMCB”), an affiliate of the Adviser, for custody, fund accounting and other related services for each Fund, and the profitability of the arrangements to JPMCB.
Fall-Out Benefits
The Trustees reviewed information regarding potential “fall-out” or ancillary benefits received by the Adviser and its affiliates as a result of their relationship with the Funds. The Trustees considered that the J.P. Morgan Funds' operating accounts are held at JPMCB, which, as a result, will receive float benefits for certain J.P. Morgan Funds, as applicable. The Trustees also noted that the Adviser supports a diverse set of products and services, which benefits the Adviser by allowing it to leverage its infrastructure to serve additional clients, including benefits that may be received by the Adviser and its affiliates in connection with the Funds’ potential investments in other funds advised by the Adviser. The Trustees also reviewed the Adviser’s allocation of fund brokerage for the J.P. Morgan Funds complex, including allocations to brokers who provide research to the Adviser, as well as the Adviser’s use of affiliates to provide other services and the benefits to such affiliates of doing so. The Trustees also considered the benefit to the Adviser and its affiliates from allocating client assets to the Funds.
The Trustees considered the extent to which the Funds may benefit from potential economies of scale. The Trustees considered that under the Management Agreements, the Adviser provides advisory and administrative services and is responsible for substantially all expenses of each Fund except for certain enumerated contractual exclusions under a “unitary fee structure.” The Trustees noted that the unitary management fee for each Fund does not contain breakpoints. The Trustees considered that shareholders would benefit because expenses would be limited even when a Fund is new and not achieving economies of scale. The Trustees considered the fact that increases in assets would not lead to management fee decreases even if economies of scale are achieved, but also that the Trustees would have the opportunity to further review the appropriateness of the fee payable to the Adviser under the Management Agreement in the future. The Trustees also concluded that all Funds benefited from the Adviser’s reinvestment in its operations to serve the Funds and their shareholders. The Trustees noted that the Adviser’s reinvestment ensures sufficient resources in terms of personnel and infrastructure to support the Funds. After considering the factors identified above, the Trustees concluded that the Funds' shareholders will receive the benefits of potential economies of scale.
Fees Relative to Adviser’s Other Clients
The Trustees received and considered information about the nature and extent of management services and fee rates offered to other clients of the Adviser, including, to the extent applicable, institutional separate accounts, collective investment trusts, other registered investment companies and/or private funds sub-advised by the Adviser, for investment
management styles substantially similar to that of each Fund. The Trustees considered the complexity of investment management for registered investment companies relative to the Adviser’s other clients and noted differences, as applicable, in the fee structure and the regulatory, legal and other risks and responsibilities of providing services to the different clients. The Trustees considered that serving as an adviser to a registered investment company involves greater responsibilities and risks than acting as a sub-adviser and observed that sub-advisory fees may be lower than those charged by the Adviser to each Fund. The Trustees also noted that the adviser, not the applicable registered investment company, typically bears the sub-advisory fee and that many responsibilities related to the advisory function are typically retained by the primary adviser. The Trustees concluded that the fee rates charged to each Fund in comparison to those charged to the Adviser’s other clients were reasonable.
The Trustees receive and consider information about each Fund’s performance throughout the year. In addition, the Trustees received and considered absolute and relative performance information for the Funds with at least one-year of performance history in a report prepared by Broadridge. The Trustees considered the total return performance information, which included the ranking of the Funds within a performance universe comprised of funds with the same Broadridge investment classification and objective (the “Universe”), by total return for the applicable one-year periods. The Trustees reviewed a description of Broadridge’s methodology for selecting exchange-traded funds in each Fund’s Universe, and noted that Universe quintile rankings were not calculated if the number of funds in the Universe did not meet a predetermined minimum. As part of this review, the Trustees also reviewed each Fund’s performance against its benchmark and considered the performance information provided for the Funds at regular Board meetings by the Adviser and the Trustees’ independent consultant and also considered the special analysis prepared for certain Funds by the Trustees’ independent consultant. The Trustees also engaged with the Adviser to consider what steps might be taken to improve performance, as applicable. The Broadridge performance data noted by the Trustees as part of their review and the determinations made by the Trustees with respect to each Fund’s performance are summarized below:
The Trustees noted that the JPMorgan Climate Change Solutions ETF’s performance was in the fourth quintile of the Universe for the one-year period ended December 31, 2023. The Trustees discussed the performance and investment strategy of the Fund
with the Adviser and reviewed the performance analysis and evaluation prepared by the independent consultant. Based upon these discussions and various other factors, the Trustees concluded that the Fund’s performance was satisfactory under the circumstances.
The Trustees noted that the JPMorgan Sustainable Infrastructure ETF’s performance was in the second quintile of the Universe for the one-year period ended December 31, 2023. The Trustees discussed the performance and investment strategy of the Fund with the Adviser and reviewed the performance analysis and evaluation prepared by the independent consultant. Based upon these discussions and various other factors, the Trustees concluded that the Fund’s performance was satisfactory.
Management Fees and Expense Ratios
The Trustees considered the contractual management fee rate paid by each Fund to the Adviser and compared the rate to the information prepared by Broadridge concerning management fee rates paid by other funds in the Universe, as well as a subset of funds within the Universe (the “Peer Group”). The Trustees also reviewed information about other expenses and the total expenses ratio for each Fund and noted that the Universe and Peer Group quintile rankings were not calculated if the number of funds in the Universe and/or Peer Group did not meet a predetermined minimum. The Trustees recognized that it can be difficult to make comparisons of management fees because there are variations in the services that are included in the fees paid by other funds. The Trustees’ determinations as a result of the review of each Fund’s management fees and expense ratios are summarized below:
The Trustees noted that the JPMorgan Climate Change Solutions ETF’s net management fee and actual total expenses were in the first quintile of both the Peer Group and Universe. After considering the factors identified above, in light of this information, the Trustees concluded that the management fee was fair and reasonable in light of the services provided to the Fund.
The Trustees noted that while Broadridge provided data for funds in the Peer Group and Universe for the JPMorgan Sustainable Infrastructure ETF, Broadridge did not calculate quintile rankings due to the limited number of funds in both the Peer Group and Universe. After considering the fees relative to the funds in the Peer Group, the Trustees concluded that the management fee was fair and reasonable in light of the services provided to the Fund.
Annual Financial Statements
J.P. Morgan Exchange-Traded Funds
October 31, 2024
| | |
JPMorgan International Research Enhanced Equity ETF | | |
CONTENTS
Investments in the Fund are not deposits or obligations of, or guaranteed or endorsed by, any bank and are not insured or guaranteed by the FDIC, the Federal Reserve Board or any other government agency. You could lose money if you sell when the Fund’s share price is lower than when you invested.
Past performance is no guarantee of future performance. The general market views expressed in this report are opinions based on market and other conditions through the end of the reporting period and are subject to change without notice. These views are not intended to predict the future performance of the Fund or the securities markets.
Prospective investors should refer to the Fund's prospectus for a discussion of the Fund's investment objectives, strategies and risks. Call J.P. Morgan Exchange-Traded Funds at (844) 457-6383 for a prospectus containing more complete information about the Fund, including management fees and other expenses. Please read it carefully before investing.
Shares are bought and sold throughout the day on an exchange at market price (not at net asset value) through a brokerage account, and are not individually subscribed and redeemed from the Fund. Shares may only be subscribed and redeemed directly from the Fund by Authorized Participants, in large creation/redemption units. Brokerage commissions will reduce returns.
JPMorgan International Research Enhanced Equity ETF
SCHEDULE OF PORTFOLIO INVESTMENTSAS OF October 31, 2024
| | |
|
|
| | |
| | |
| | |
Commonwealth Bank of Australia | | |
| | |
| | |
| | |
| | |
Insurance Australia Group Ltd. | | |
| | |
| | |
| | |
National Australia Bank Ltd. | | |
| | |
| | |
| | |
| | |
| | |
| | |
| | |
Woodside Energy Group Ltd. | | |
| | |
| | |
|
| | |
| | |
| | |
|
| | |
|
| | |
Novo Nordisk A/S, Class B | | |
| | |
|
| | |
| | |
| | |
|
| | |
| | |
| | |
| | |
| | |
|
|
| | |
Cie Generale des Etablissements Michelin SCA | | |
| | |
| | |
| | |
| | |
| | |
| | |
LVMH Moet Hennessy Louis Vuitton SE | | |
| | |
| | |
| | |
| | |
| | |
| | |
| | |
|
| | |
| | |
| | |
| | |
| | |
Deutsche Telekom AG (Registered) | | |
| | |
| | |
| | |
| | |
| | |
Muenchener Rueckversicherungs-Gesellschaft AG (Registered) | | |
| | |
| | |
| | |
| | |
| | |
| | |
|
| | |
| | |
| | |
Hong Kong Exchanges & Clearing Ltd. | | |
| | |
| | |
SEE NOTES TO FINANCIAL STATEMENTS.
| J.P. Morgan Exchange-Traded Funds | |
JPMorgan International Research Enhanced Equity ETF
SCHEDULE OF PORTFOLIO INVESTMENTSAS OF October 31, 2024 (continued)
| | |
Common Stocks — continued |
|
Sun Hung Kai Properties Ltd. | | |
Techtronic Industries Co. Ltd. | | |
| | |
|
| | |
|
| | |
FinecoBank Banca Fineco SpA | | |
| | |
| | |
|
| | |
| | |
Asahi Group Holdings Ltd. | | |
| | |
| | |
Chugai Pharmaceutical Co. Ltd. | | |
| | |
| | |
| | |
| | |
| | |
| | |
| | |
| | |
| | |
| | |
| | |
| | |
| | |
| | |
| | |
| | |
Mitsubishi UFJ Financial Group, Inc. | | |
| | |
| | |
Murata Manufacturing Co. Ltd. | | |
| | |
Nippon Paint Holdings Co. Ltd. | | |
| | |
Nippon Telegraph & Telephone Corp. | | |
Nomura Research Institute Ltd. | | |
| | |
| | |
|
|
| | |
| | |
Pan Pacific International Holdings Corp. | | |
Recruit Holdings Co. Ltd. | | |
Renesas Electronics Corp. | | |
| | |
| | |
Seven & i Holdings Co. Ltd. | | |
| | |
Shin-Etsu Chemical Co. Ltd. | | |
| | |
| | |
| | |
| | |
Sumitomo Electric Industries Ltd. | | |
Sumitomo Metal Mining Co. Ltd. | | |
Sumitomo Mitsui Financial Group, Inc. | | |
| | |
| | |
| | |
Takeda Pharmaceutical Co. Ltd. | | |
| | |
Tokio Marine Holdings, Inc. | | |
| | |
| | |
| | |
|
| | |
|
| | |
| | |
| | |
Koninklijke Ahold Delhaize NV | | |
| | |
| | |
| | |
| | |
|
| | |
Oversea-Chinese Banking Corp. Ltd. | | |
| | |
United Overseas Bank Ltd. | | |
| | |
SEE NOTES TO FINANCIAL STATEMENTS.
| J.P. Morgan Exchange-Traded Funds | |
| | |
Common Stocks — continued |
|
Banco Bilbao Vizcaya Argentaria SA | | |
| | |
| | |
Industria de Diseno Textil SA | | |
| | |
|
| | |
| | |
| | |
| | |
|
Cie Financiere Richemont SA (Registered) | | |
| | |
| | |
Lonza Group AG (Registered) | | |
| | |
| | |
| | |
| | |
UBS Group AG (Registered) | | |
Zurich Insurance Group AG | | |
| | |
|
| | |
| | |
| | |
Berkeley Group Holdings plc | | |
British American Tobacco plc | | |
| | |
| | |
| | |
| | |
InterContinental Hotels Group plc | | |
| | |
| | |
London Stock Exchange Group plc | | |
| | |
| | |
Reckitt Benckiser Group plc | | |
| | |
Rolls-Royce Holdings plc * | | |
| | |
| | |
| | |
|
United Kingdom — continued |
| | |
| | |
| | |
| | |
| | |
|
| | |
| | |
| | |
| | |
| | |
| | |
| | |
| | |
| | |
| | |
| | |
Total Common Stocks
(Cost $5,584,741,842) | | |
Short-Term Investments — 0.4% |
Investment Companies — 0.4% |
JPMorgan Prime Money Market Fund Class IM Shares, 4.90% (b) (c)
(Cost $29,211,915) | | |
Total Investments — 99.4%
(Cost $5,613,953,757) | | |
Other Assets in Excess of Liabilities — 0.6% | | |
| | |
Percentages indicated are based on net assets. |
| |
| American Depositary Receipt |
| |
| Real Estate Investment Trust |
| Limited partnership with share capital |
| Non-income producing security. |
| Security exempt from registration pursuant to Regulation S under the Securities Act of 1933, as amended. Regulation S applies to securities offerings that are made outside of the United States and do not involve direct selling efforts in the United States and as such may have restrictions on resale. |
SEE NOTES TO FINANCIAL STATEMENTS.
| J.P. Morgan Exchange-Traded Funds | |
JPMorgan International Research Enhanced Equity ETF
SCHEDULE OF PORTFOLIO INVESTMENTSAS OF October 31, 2024 (continued)
| Investment in an affiliated fund, which is registered under the Investment Company Act of 1940, as amended, and is advised by J.P. Morgan Investment Management Inc. |
| The rate shown is the current yield as of October 31, 2024. |
Summary of Investments by Industry, October 31, 2024
The following table represents the portfolio investments of the Fund by industry classifications as a percentage of total investments:
| PERCENT OF
TOTAL
INVESTMENTS |
| |
| |
| |
Oil, Gas & Consumable Fuels | |
Semiconductors & Semiconductor Equipment | |
Textiles, Apparel & Luxury Goods | |
| |
| |
| |
| |
Diversified Telecommunication Services | |
| |
| |
| |
| |
| |
| |
| |
| |
| |
| |
Consumer Staples Distribution & Retail | |
| |
Trading Companies & Distributors | |
Construction & Engineering | |
| |
| |
Electronic Equipment, Instruments & Components | |
| |
Health Care Equipment & Supplies | |
| |
Others (each less than 1.0%) | |
| |
SEE NOTES TO FINANCIAL STATEMENTS.
| J.P. Morgan Exchange-Traded Funds | |
STATEMENT OF ASSETS AND LIABILITIESAS OF October 31, 2024
| JPMorgan
International
Research
Enhanced
Equity ETF |
| |
Investments in non-affiliates, at value | |
Investments in affiliates, at value | |
| |
Foreign currency, at value | |
| |
Investment securities sold | |
| |
Dividends from non-affiliates | |
Dividends from affiliates | |
| |
Securities lending income (See Note 2.C.) | |
| |
| |
| |
| |
| |
Printing and mailing costs | |
Custodian and accounting fees | |
Trustees’ and Chief Compliance Officer’s fees | |
| |
| |
| |
| |
| |
Total distributable earnings (loss) | |
| |
Outstanding number of shares
(unlimited number of shares authorized - par value $0.0001) | |
Net asset value, per share | |
Cost of investments in non-affiliates | |
Cost of investments in affiliates | |
| |
SEE NOTES TO FINANCIAL STATEMENTS.
| J.P. Morgan Exchange-Traded Funds | |
STATEMENT OF OPERATIONSFOR THE YEAR ENDED October 31, 2024
| JPMorgan
International
Research
Enhanced
Equity ETF |
| |
Interest income from non-affiliates | |
Interest income from affiliates | |
Dividend income from non-affiliates | |
Dividend income from affiliates | |
Income from securities lending (net) (See Note 2.C.) | |
Foreign taxes withheld (net) | |
| |
| |
| |
| |
Custodian and accounting fees | |
Interest expense to non-affiliates | |
Interest expense to affiliates | |
| |
Trustees’ and Chief Compliance Officer’s fees | |
Printing and mailing costs | |
Registration and filing fees | |
| |
| |
| |
Less expense reimbursements | |
| |
Net investment income (loss) | |
REALIZED/UNREALIZED GAINS (LOSSES): | |
Net realized gain (loss) on transactions from: | |
Investments in non-affiliates | |
Investments in affiliates | |
In-kind redemptions of investments in non-affiliates (See Note 4) | |
| |
Foreign currency transactions | |
| |
Change in net unrealized appreciation/depreciation on: | |
Investments in non-affiliates | |
Investments in affiliates | |
| |
Foreign currency translations | |
Change in net unrealized appreciation/depreciation | |
Net realized/unrealized gains (losses) | |
Change in net assets resulting from operations | |
SEE NOTES TO FINANCIAL STATEMENTS.
| J.P. Morgan Exchange-Traded Funds | |
STATEMENTS OF CHANGES IN NET ASSETSFOR THE PERIODS INDICATED
| JPMorgan International Research
Enhanced Equity ETF |
| Year Ended
October 31, 2024 | Year Ended
October 31, 2023 |
CHANGE IN NET ASSETS RESULTING FROM OPERATIONS: | | |
Net investment income (loss) | | |
| | |
Change in net unrealized appreciation/depreciation | | |
Change in net assets resulting from operations | | |
DISTRIBUTIONS TO SHAREHOLDERS: | | |
Total distributions to shareholders | | |
| | |
Change in net assets resulting from capital transactions | | |
| | |
| | |
| | |
| | |
| | |
Proceeds from shares issued | | |
| | |
Total change in net assets resulting from capital transactions | | |
| | |
| | |
| | |
Net increase (decrease) in shares from share transactions | | |
SEE NOTES TO FINANCIAL STATEMENTS.
| J.P. Morgan Exchange-Traded Funds | |
FINANCIAL HIGHLIGHTSFOR THE PERIODS INDICATED
| Per share operating performance (a) |
| | | |
| Net asset
value,
beginning
of period | Net investment
income
(loss) (b) | Net realized
and unrealized
gains
(losses)
on investments | Total from
investment
operations | |
JPMorgan International Research Enhanced Equity ETF (e) | | | | | |
Year Ended October 31, 2024 | | | | | |
Year Ended October 31, 2023 | | | | | |
Year Ended October 31, 2022 | | | | | |
Year Ended October 31, 2021 | | | | | |
Year Ended October 31, 2020 | | | | | |
|
| Per share amounts reflect the conversion of the Predecessor Fund into the Fund as of the close of business on June 10, 2022. |
| Calculated based upon average shares outstanding. |
| Includes adjustments in accordance with accounting principles generally accepted in the United States of America and as such, the net asset values for financial reporting purposes and the returns based upon those net asset values may differ from the net asset values and returns for shareholder transactions. |
| JPMorgan International Research Enhanced Equity ETF acquired all of the assets and liabilities of the JPMorgan International Research Enhanced Equity Fund (“Predecessor Fund”) in a reorganization that occurred as of the close of business on June 10, 2022. Market price returns are calculated using the official closing price of the JPMorgan International Research Enhanced Equity ETF on the listing exchange as of the time that the JPMorgan International Research Enhanced Equity ETF's NAV is calculated. Prior to the JPMorgan International Research Enhanced Equity ETF's listing on June 13, 2022, the NAV performance of the Class R6 Shares of the Predecessor Fund are used as proxy market price returns. |
| JPMorgan International Research Enhanced Equity ETF (the “Fund”) acquired all of the assets and liabilities of the JPMorgan International Research Enhanced Equity Fund (“Predecessor Fund”) in a reorganization that occurred as of the close of business on June 10, 2022. Performance and financial history of the Predecessor Fund’s Class R6 Shares have been adopted by the Fund and will be used going forward. As a result, the financial highlight information reflects that of the Predecessor Fund’s Class R6 Shares for the period November 1, 2018 up through the reorganization. |
| Reflects income from foreign withholding tax claims, including related interest income. Had the Fund not received these proceeds, the net investment income (loss) per share would have remained the same and the net investment income (loss) ratio would have been 2.44%. |
SEE NOTES TO FINANCIAL STATEMENTS.
| J.P. Morgan Exchange-Traded Funds | |
| |
| | | | | Ratios to average net assets | |
Net asset
value,
end of
period | | | Market
price
total
return (d) | | | Net
investment
income
(loss) | Expenses
without waivers
and reimbursements | |
| | | | | | | | |
| | | | | | | | |
| | | | | | | | |
| | | | | | | | |
| | | | | | | | |
| | | | | | | | |
SEE NOTES TO FINANCIAL STATEMENTS.
| J.P. Morgan Exchange-Traded Funds | |
NOTES TO FINANCIAL STATEMENTSAS OF October 31, 2024
1. Organization
J.P. Morgan Exchange-Traded Fund Trust (the “Trust”) was formed on February 25, 2010, and is governed by a Declaration of Trust as amended and restated February 19, 2014, and is registered under the Investment Company Act of 1940, as amended (the “1940 Act”), as an open-end management investment company. JPMorgan International Research Enhanced Equity ETF (the "Fund") is a separate diversified series of the Trust covered in this report.
The investment objective of the Fund is to seek to provide long-term capital appreciation.
J.P. Morgan Investment Management Inc. (“JPMIM”), an indirect, wholly-owned subsidiary of JPMorgan Chase & Co. (“JPMorgan”), acts as adviser (the “Adviser”) and administrator (the “Administrator”) to the Fund.
Shares of the Fund are listed and traded at market price on the NYSE Arca, Inc. Market prices for the Fund’s shares may be different from its net asset value (“NAV”). The Fund issues and redeems its shares on a continuous basis, through JPMorgan Distribution Services, Inc. (the “Distributor” or “JPMDS”), an indirect, wholly-owned subsidiary of JPMorgan, at NAV in large blocks of shares, referred to as “Creation Units". Creation Units are issued and redeemed in exchange for a basket of securities and/or cash. Shares are generally traded in the secondary market in amounts less than a Creation Unit at market prices that change throughout the day. Only individuals or institutions that have entered into an authorized participant agreement with the Distributor may do business directly with the Fund (each, an “Authorized Participant”).
2. Significant Accounting Policies
The following is a summary of significant accounting policies followed by the Fund in the preparation of its financial statements. The Fund is an investment company and, accordingly, follows the investment company accounting and reporting guidance of the Financial Accounting Standards Board (“FASB”) Accounting Standards Codification Topic 946 — Investment Companies, which is part of U.S. generally accepted accounting principles (“GAAP”). The preparation of financial statements in conformity with GAAP requires management to make estimates and assumptions that affect (i) the reported amounts of assets and liabilities, (ii) disclosure of contingent assets and liabilities at the date of the financial statements, and (iii) the reported amounts of increases and decreases in net assets from operations during the reporting period. Actual results could differ from those estimates.
A. Valuation of Investments— Investments are valued in accordance with GAAP and the Fund's valuation policies set forth by, and under the supervision and responsibility of, the Board of Trustees of the Trust (the "Board"), which established the following approach to valuation, as described more fully below: (i) investments for which market quotations are readily available shall be valued at their market value and (ii) all other investments for which market quotations are not readily available shall be valued at their fair value as determined in good faith by the Board.
Under Section 2(a)(41) of the 1940 Act, the Board is required to determine fair value for securities that do not have readily available market quotations. Under Securities and Exchange Commission ("SEC") Rule 2a-5 (Good Faith Determinations of Fair Value), the Board may designate the performance of these fair valuation determinations to a valuation designee. The Board has designated the Adviser as the “Valuation Designee” to perform fair valuation determinations for the Fund on behalf of the Board subject to appropriate oversight by the Board. The Adviser, as Valuation Designee, leverages the J.P. Morgan Asset Management Americas Valuation Committee (“AVC”) to help oversee and carry out the policies for the valuation of investments held in the Fund. The Adviser, as Valuation Designee, remains responsible for the valuation determinations.
This oversight by the AVC includes monitoring the appropriateness of fair values based on results of ongoing valuation oversight including, but not limited to, consideration of macro or security specific events, market events, and pricing vendor and broker due diligence. The Administrator is responsible for discussing and assessing the potential impacts to the fair values on an ongoing basis, and, at least on a quarterly basis, with the AVC and the Board.
Equities and other exchange-traded instruments are valued at the last sale price or official market closing price on the primary exchange on which the instrument is traded before the NAV of the Fund is calculated on a valuation date. Certain foreign equity instruments are valued by applying international fair value factors provided by approved Pricing Services. The factors seek to adjust the local closing price for movements of local markets post-closing, but prior to the time the NAV is calculated.
Investments in open-end investment companies (“Underlying Funds”) are valued at each Underlying Fund’s NAV per share as of the report date.
Futures contracts are generally valued on the basis of available market quotations.
Valuations reflected in this report are as of the report date. As a result, changes in valuation due to market events and/or issuer-related events after the report date and prior to issuance of the report are not reflected herein.
The various inputs that are used in determining the valuation of the Fund's investments are summarized into the three broad levels listed below.
•
Level 1 — Unadjusted inputs using quoted prices in active markets for identical investments.
•
Level 2 — Other significant observable inputs including, but not limited to, quoted prices for similar investments, inputs other than quoted prices that are observable for investments (such as interest rates, prepayment speeds, credit risk, etc.) or other market corroborated inputs.
•
Level 3 — Significant inputs based on the best information available in the circumstances, to the extent observable inputs are not available (including the Fund's assumptions in determining the fair value of investments).
| J.P. Morgan Exchange-Traded Funds | |
A financial instrument’s level within the fair value hierarchy is based on the lowest level of any input, both individually and in the aggregate, that is significant to the fair value measurement. The inputs or methodology used for valuing instruments are not necessarily an indication of the risk associated with investing in those instruments.
The following table represents each valuation input as presented on the Schedule of Portfolio Investments ("SOI"):
| | |
| | Level 2
Other significant
observable inputs | Level 3
Significant
unobservable inputs | |
Investments in Securities | | | | |
| | | | |
| | | | |
| | | | |
| | | | |
| | | | |
| | | | |
| | | | |
| | | | |
| | | | |
| | | | |
| | | | |
| | | | |
| | | | |
| | | | |
| | | | |
| | | | |
| | | | |
| | | | |
| | | | |
| | | | |
| | | | |
| | | | |
| | | | |
Total Investments in Securities | | | | |
B. Restricted Securities— Certain securities held by the Fund may be subject to legal or contractual restrictions on resale. Restricted securities generally are resold in transactions exempt from registration under the Securities Act of 1933, as amended (the “Securities Act”). Disposal of these securities may involve time-consuming negotiations and expense. Prompt sale at the current valuation may be difficult and could adversely affect the NAV of the Fund.
As of October 31, 2024, the Fund had no investments in restricted securities other than securities sold to the Fund under Rule 144A and/or Regulation S under the Securities Act.
C. Securities Lending — The Fund is authorized to engage in securities lending in order to generate additional income. The Fund is able to lend to approved borrowers. Citibank N.A. (“Citibank”) serves as lending agent for the Fund, pursuant to a Securities Lending Agency Agreement (the “Securities Lending Agency Agreement”). Securities loaned are collateralized by cash equal to at least 100% of the market value plus accrued interest on the securities lent, which is invested in the Class IM Shares of the JPMorgan U.S. Government Money Market Fund and the Agency SL Class Shares of the JPMorgan Securities Lending Money Market Fund. The Fund retains the interest earned on cash collateral investments but is required to pay the borrower a rebate for the use of the cash collateral. In cases where the lent security is of high value to borrowers, there may be a negative rebate (i.e., a net payment from the borrower to the Fund). Upon termination of a loan, the Fund is required to return to the borrower an amount equal to the cash collateral, plus any rebate owed to the borrowers. The remaining maturities of the securities lending transactions are considered overnight and continuous. Loans are subject to termination by the Fund or the borrower at any time.
The net income earned on the securities lending (after payment of rebates and Citibank’s fee) is included on the Statement of Operations as Income from securities lending (net). The Fund also receives payments from the borrower during the period of the loan, equivalent to dividends and interest earned on the securities loaned, which are recorded as Dividend or Interest income, respectively, on the Statement of Operations.
| J.P. Morgan Exchange-Traded Funds | |
NOTES TO FINANCIAL STATEMENTSAS OF October 31, 2024 (continued)
Under the Securities Lending Agency Agreement, Citibank marks to market the loaned securities on a daily basis. In the event the cash received from the borrower is less than 102% of the value of the loaned securities (105% for loans of non-U.S. securities), Citibank requests additional cash from the borrower so as to maintain a collateralization level of at least 102% of the value of the loaned securities plus accrued interest (105% for loans of non-U.S. securities), subject to certain de minimis amounts.
The value of securities out on loan is recorded as an asset on the Statement of Assets and Liabilities. The value of the cash collateral received is recorded as a liability on the Statement of Assets and Liabilities and details of collateral investments are disclosed on the SOI.
The Fund bears the risk of loss associated with the collateral investments and is not entitled to additional collateral from the borrower to cover any such losses. To the extent that the value of the collateral investments declines below the amount owed to a borrower, the Fund may incur losses that exceed the amount it earned on lending the security. Upon termination of a loan, the Fund may use leverage (borrow money) to repay the borrower for cash collateral posted if the Adviser does not believe that it is prudent to sell the collateral investments to fund the payment of this liability. Securities lending activity is subject to master netting arrangements.
Securities lending also involves counterparty risks, including the risk that the loaned securities may not be returned in a timely manner or at all. Subject to certain conditions, Citibank has agreed to indemnify the Fund from losses resulting from a borrower’s failure to return a loaned security.
JPMIM voluntarily waived management fees charged to the Fund to reduce the impact of the cash collateral investment in the JPMorgan U.S. Government Money Market Fund from 0.13% to 0.06%. For the year ended October 31, 2024, JPMIM waived fees associated with the Fund's investment in the JPMorgan U.S. Government Money Market Fund. The amount of this waiver was $3,820.
The above waiver is included in the determination of earnings on cash collateral investment and in the calculation of Citibank’s compensation and is included on the Statement of Operations as Income from securities lending (net).
D. Investment Transactions with Affiliates— The Fund invested in Underlying Funds advised by the Adviser. An issuer which is under common control with the Fund may be considered an affiliate. For the purposes of the financial statements, the Fund assumes the issuers listed in the table below to be affiliated issuers. The Underlying Funds’ distributions may be reinvested into such Underlying Funds. Reinvestment amounts are included in the purchases at cost amounts in the table below.
|
For the year ended October 31, 2024 |
| | | | | Change in
Unrealized
Appreciation/
(Depreciation) | | | | Capital Gain
Distributions |
JPMorgan Prime Money Market Fund Class IM Shares, 4.90% (a) (b) | | | | | | | | | |
JPMorgan Securities Lending Money Market Fund Agency SL Class Shares, 4.85% (a) (b) | | | | | | | | | |
JPMorgan U.S. Government Money Market Fund Class IM Shares, 4.80% (a) (b) | | | | | | | | | |
| | | | | | | | | |
|
| Investment in an affiliated fund, which is registered under the Investment Company Act of 1940, as amended, and is advised by J.P. Morgan Investment Management Inc. |
| The rate shown is the current yield as of October 31, 2024. |
| Amount is included on the Statement of Operations as Income from securities lending (net) (after payments of rebates and Citibank’s fee). |
E. Foreign Currency Translation — The books and records of the Fund are maintained in U.S. dollars. Foreign currency amounts are translated into U.S. dollars at the prevailing exchange rates of such currencies against the U.S. dollar. The market value of investment securities and other assets and liabilities are translated at the exchange rate as of the valuation date. Purchases and sales of investment securities, income and expenses are translated at the exchange rate prevailing on the respective dates of such transactions.
The Fund does not isolate the effect of changes in foreign exchange rates from changes in market prices on securities held. Accordingly, such changes are included within Change in net unrealized appreciation/depreciation on investments in non-affiliates on the Statement of Operations.
| J.P. Morgan Exchange-Traded Funds | |
Reported realized foreign currency gains and losses arise from the disposition of foreign currency, currency gains or losses realized between the trade and settlement dates on securities transactions, and the difference between the amounts of dividends, interest and foreign withholding taxes recorded on the Fund books on the transaction date and the U.S. dollar equivalent of the amounts actually received or paid. These reported realized foreign currency gains and losses are included in Net realized gain (loss) on foreign currency transactions on the Statement of Operations. Unrealized foreign currency gains and losses arise from changes (due to changes in exchange rates) in the value of foreign currency and other assets and liabilities denominated in foreign currencies, which are held at year end and are included in Change in net unrealized appreciation/depreciation on foreign currency translations on the Statement of Operations.
F. Futures Contracts—The Fund used index futures contracts to gain or reduce exposure to the stock market, or maintain liquidity or minimize transaction costs. The Fund also purchased futures contracts to invest incoming cash in the market or sold futures in response to cash outflows, thereby simulating an invested position in the underlying index while maintaining a cash balance for liquidity.
Futures contracts provide for the delayed delivery of the underlying instrument at a fixed price or are settled for a cash amount based on the change in the value of the underlying instrument at a specific date in the future. Upon entering into a futures contract, the Fund is required to deposit with the broker, cash or securities in an amount equal to a certain percentage of the contract amount, which is referred to as the initial margin deposit. Subsequent payments, referred to as variation margin, are made or received by the Fund periodically and are based on changes in the market value of open futures contracts. Changes in the market value of open futures contracts are recorded as Change in net unrealized appreciation/depreciation on futures contracts on the Statement of Operations. Realized gains or losses, representing the difference between the value of the contract at the time it was opened and the value at the time it was closed, are reported on the Statement of Operations at the closing or expiration of the futures contract. Securities deposited as initial margin are designated on the SOI, while cash deposited, which is considered restricted, is recorded on the Statement of Assets and Liabilities. A receivable from and/or a payable to brokers for the daily variation margin is also recorded on the Statement of Assets and Liabilities.
The use of futures contracts exposes the Fund to equity price and foreign exchange risk. The Fund may be subject to the risk that the change in the value of the futures contract may not correlate perfectly with the underlying instrument. Use of long futures contracts subjects the Fund to risk of loss in excess of the amounts shown on the Statement of Assets and Liabilities, up to the notional amount of the futures contracts. Use of short futures contracts subjects the Fund to unlimited risk of loss. The Fund may enter into futures contracts only on exchanges or boards of trade. The exchange or board of trade acts as the counterparty to each futures transaction; therefore, the Fund's credit risk is limited to failure of the exchange or board of trade. Under some circumstances, futures exchanges may establish daily limits on the amount that the price of a futures contract can vary from the previous day’s settlement price, which could effectively prevent liquidation of positions.
The Fund's futures contracts are not subject to master netting arrangements (the right to close out all transactions traded with a counterparty and net amounts owed or due across transactions).
The table below discloses the volume of the Fund's futures contracts activity during the year ended October 31, 2024:
| |
| |
Average Notional Balance Long | |
G. Security Transactions and Investment Income— Investment transactions are accounted for on the trade date (the date the order to buy or sell is executed). Securities gains and losses are calculated on a specifically identified cost basis.
Dividend income, net of foreign taxes withheld, if any, is recorded on the ex-dividend date or when the Fund first learns of the dividend.
To the extent such information is publicly available, the Fund records distributions received in excess of income earned from underlying investments as a reduction of cost of investments and/or realized gain. Such amounts are based on estimates if actual amounts are not available and actual amounts of income, realized gain and return of capital may differ from the estimated amounts. The Fund adjusts the estimated amounts of the components of distributions (and consequently its net investment income) as necessary, once the issuers provide information about the actual composition of the distributions.
| J.P. Morgan Exchange-Traded Funds | |
NOTES TO FINANCIAL STATEMENTSAS OF October 31, 2024 (continued)
H. Allocation of Income and Expenses— Expenses directly attributable to the Fund are charged directly to the Fund, while the expenses attributable to more than one fund of the Trust are allocated among the applicable funds.
I. Federal Income Taxes— The Fund is treated as a separate taxable entity for Federal income tax purposes. The Fund's policy is to comply with the provisions of the Internal Revenue Code (the “Code”) applicable to regulated investment companies and to distribute to shareholders all of its distributable net investment income and net realized capital gains on investments. Accordingly, no provision for Federal income tax is necessary. Management has reviewed the Fund's tax positions for all open tax years and has determined that as of October 31, 2024, no liability for Federal income tax is required in the Fund's financial statements for net unrecognized tax benefits. However, management’s conclusions may be subject to future review based on changes in, or the interpretation of, the accounting standards or tax laws and regulations. The Fund's Federal tax returns for the prior three fiscal years remain subject to examination by the Internal Revenue Service.
J. Foreign Taxes—The Fund may be subject to foreign taxes on income, gains on investments or currency purchases/repatriation, a portion of which may be recoverable. The Fund will accrue such taxes and recoveries as applicable, based upon its current interpretation of tax rules and regulations that exist in the markets in which it invests. When a capital gains tax is determined to apply, the Fund records an estimated deferred tax liability in an amount that would be payable if the securities were disposed of on the valuation date.
K. Distributions to Shareholders— Distributions from net investment income, if any, are generally declared and paid at least annually. Net realized capital gains, if any, are distributed at least annually. The amount of distributions from net investment income and net realized capital gains is determined in accordance with Federal income tax regulations, which may differ from GAAP. To the extent these “book/tax” differences are permanent in nature (i.e., that they result from other than timing of recognition — “temporary differences”), such amounts are reclassified within the capital accounts based on their Federal tax basis treatment.
The following amounts were reclassified within the capital accounts:
| | Accumulated
undistributed
(distributions in
excess of)
net investment
income | Accumulated
net realized
gains (losses) |
| | | |
The reclassifications for the Fund relate primarily to redemptions in-kind and tax adjustments on certain investments.
3. Fees and Other Transactions with Affiliates
A. Investment Advisory Fee— Pursuant to an Investment Advisory Agreement, the Adviser manages the investments of the Fund and for such services is paid a fee. The investment advisory fee is accrued daily and paid monthly at an annual rate of 0.20% of the Fund's average daily net assets.
The Adviser waived investment advisory fees and/or reimbursed expenses as outlined in Note 3.E.
B. Administration Fee— Pursuant to an Administration Agreement, the Administrator provides certain administration services to the Fund. In consideration of these services, the Administrator receives a fee accrued daily and paid monthly at an annual rate of 0.075% of the first $10 billion of the Fund's average daily net assets, plus 0.050% of the Fund's average daily net assets between $10 billion and $20 billion, plus 0.025% of the Fund's average daily net assets between $20 billion and $25 billion, plus 0.010% of the Fund's average daily net assets in excess of $25 billion. For the year ended October 31, 2024, the effective rate was 0.075% of the Fund's average daily net assets, notwithstanding any fee waivers and/or expense reimbursements.
The Administrator waived administration fees as outlined in Note 3.E.
JPMorgan Chase Bank, N.A. ("JPMCB"), a wholly-owned subsidiary of JPMorgan, serves as the Fund's sub-administrator (the “Sub-administrator”). For its services as Sub-administrator, JPMCB receives a portion of the fees paid to the Administrator.
| J.P. Morgan Exchange-Traded Funds | |
C. Distribution Fees— The Distributor or its agent distributes Creation Units for the Fund on an agency basis. The Distributor does not maintain a secondary market in shares of the Fund. JPMDS receives no fees for their distribution services under the distribution agreement with the Trust (the “Distribution Agreement”). Although the Trust does not pay any fees under the Distribution Agreement, JPMIM pays JPMDS for certain distribution related services.
D. Custodian, Accounting and Transfer Agent Fees— JPMCB provides portfolio custody, accounting and transfer agency services (effective as of the Closing Date) to the Fund. For performing these services, the Fund pays JPMCB transaction and asset-based fees that vary according to the number of transactions and positions, plus out-of-pocket expenses. The amounts paid directly to JPMCB by the Fund for custody and accounting services are included in Custodian and accounting fees on the Statement of Operations. The amounts paid directly to JPMCB by the Fund for transfer agency services are included in Transfer agency fees on the Statement of Operations.
Additionally, Authorized Participants generally pay transaction fees associated with the creation and redemption of Fund shares. These fees are used to offset certain custodian charges incurred by the Fund for these transactions.
Interest income earned on cash balances at the custodian, if any, is included in Interest income from affiliates on the Statement of Operations.
Interest expense paid to the custodian related to cash overdrafts, if any, is included in Interest expense to affiliates on the Statement of Operations.
E. Waivers and Reimbursements— The Adviser and/or its affiliates have contractually agreed to waive fees and/or reimburse the Fund to the extent that total annual operating expenses (excluding acquired fund fees and expenses other than certain money market fund fees as described below, dividend and interest expenses related to short sales, interest, taxes, expenses related to litigation and potential litigation, costs of shareholder meetings, and extraordinary expenses) exceed 0.24% of the Fund's average daily net assets.
The expense limitation agreement was in effect for the year ended October 31, 2024 and the contractual expense limitation is in place until at least June 30, 2025.
For the year ended October 31, 2024, the Fund's service providers waived fees and/or reimbursed expenses for the Fund as follows. None of these parties expect the Fund to repay any such waived fees and/or reimbursed expenses in future years.
| |
| Contractual
Reimbursements |
| |
Additionally, the Fund may invest in one or more money market funds advised by the Adviser (affiliated money market funds). The Adviser, Administrator and/or JPMDS, as shareholder servicing agent, have contractually agreed to waive fees and/or reimburse expenses in an amount sufficient to offset the respective net fees each collects from the affiliated money market fund on the Fund's investment in such affiliated money market fund, except for investments of securities lending cash collateral. None of these parties expect the Fund to repay any such waived fees and/or reimbursed expenses in future years.
The amount of these waivers resulting from investments in these money market funds for the year ended October 31, 2024 was $119,838
JPMIM voluntarily agreed to reimburse the Fund for the Trustee Fees paid to one of the interested Trustees. For the year ended October 31, 2024, the amount of this reimbursement was $380.
F. Other— Certain officers of the Trust are affiliated with the Adviser, the Administrator and JPMDS. Such officers, with the exception of the Chief Compliance Officer, receive no compensation from the Fund for serving in their respective roles.
The Board designated and appointed a Chief Compliance Officer to the Fund pursuant to Rule 38a-1 under the 1940 Act. The Fund, along with certain other affiliated funds, makes reimbursement payments, on a pro-rata basis, to the Administrator for a portion of the fees associated with the office of the Chief Compliance Officer. Such fees are included in Trustees’ and Chief Compliance Officer’s fees on the Statement of Operations.
The Trust adopted a Trustee Deferred Compensation Plan (the “Plan”) which allows the independent Trustees to defer the receipt of all or a portion of compensation related to performance of their duties as Trustees. The deferred fees are invested in various J.P. Morgan Funds until distribution in accordance with the Plan.
The SEC has granted an exemptive order permitting the Fund to engage in principal transactions with J.P. Morgan Securities LLC, an affiliated broker, involving taxable money market instruments, subject to certain conditions.
| J.P. Morgan Exchange-Traded Funds | |
NOTES TO FINANCIAL STATEMENTSAS OF October 31, 2024 (continued)
4. Investment Transactions
During the year ended October 31, 2024, purchases and sales of investments (excluding short-term investments) were as follows:
| Purchases
(excluding
U.S. Government) | Sales
(excluding
U.S. Government) |
| | |
For the year ended October 31, 2024, in-kind transactions associated with creations and redemptions were as follows:
During the year ended October 31, 2024, the Fund delivered portfolio securities for the redemption of Fund shares (in-kind redemptions). Cash and portfolio securities were transferred for redemptions at fair value. For financial reporting purposes, the Fund recorded net realized gains and losses in connection with each in-kind redemption transaction.
5. Federal Income Tax Matters
For Federal income tax purposes, the estimated cost and unrealized appreciation (depreciation) in value of investments held at October 31, 2024 were as follows:
| | Gross
Unrealized
Appreciation | Gross
Unrealized
Depreciation | Net Unrealized
Appreciation
(Depreciation) |
| | | | |
The difference between book and tax basis appreciation (depreciation) on investments is primarily attributed to tax adjustments on certain investments and wash sale loss deferrals.
The tax character of distributions paid during the year ended October 31, 2024 was as follows:
|
| Short-term gain distributions are treated as ordinary income for income tax purposes. |
The tax character of distributions paid during the year ended October 31, 2023 was as follows:
|
| Short-term gain distributions are treated as ordinary income for income tax purposes. |
| J.P. Morgan Exchange-Traded Funds | |
As of October 31, 2024, the estimated components of net assets (excluding paid-in-capital) on a tax basis were as follows:
| Current
Distributable
Ordinary
Income | Current
Distributable
Long-Term
Capital Gain
(Tax Basis Capital
Loss Carryover) | Unrealized
Appreciation
(Depreciation) |
| | | |
| | | |
The cumulative timing differences primarily consist of tax adjustments on certain investments and wash sale loss deferrals.
As of October 31, 2024, the Fund had net capital loss carryforwards, which are available to offset future realized gains:
| Capital Loss Carryforward Character |
| | |
| | |
During the year ended October 31, 2024, the Fund utilized capital loss carryforwards as follows:
6. Capital Share Transactions
The Trust issues and redeems shares of the Fund only in Creation Units through the Distributor at NAV. Capital shares transactions detail can be found in the Statement of Changes in Net Assets.
Shares of the Fund may only be purchased or redeemed by Authorized Participants. Such Authorized Participants may from time to time hold, of record or beneficially, a substantial percentage of the shares outstanding and act as executing or clearing broker for investment transactions on behalf of the Fund. An Authorized Participant is either (1) a “Participating Party” or other participant in the clearing process through the Continuous Net Settlement System of the National Securities Clearing Corporation (“NSCC”); or (2) a DTC Participant; which, in either case, must have executed an agreement with the Distributor.
Creation Units of the Fund may be created in advance of receipt by the Trust of all or a portion of the applicable basket of equity securities and other instruments (“Deposit Instruments”) and cash as described in the Fund's registration statement. In these instances, the initial Deposit Instruments and cash must be deposited in an amount equal to the sum of the cash amount, plus at least 105% for the Fund of the market value of undelivered Deposit Instruments. A transaction fee may be imposed to offset transfer and other transaction costs associated with the purchase or redemption of Creation Units.
Effective November 1, 2022, the Fund relies upon an exemptive order granted by the SEC (the “Order”) permitting the establishment and operation of an Interfund Lending Facility (the “Facility”). The Facility allows the Fund to directly lend and borrow money to or from any other fund relying upon the Order at rates beneficial to both the borrowing and lending funds. Advances under the Facility are taken primarily for temporary or emergency purposes, including the meeting of redemption requests that otherwise might require the untimely disposition of securities, and are subject to the Fund's borrowing restrictions. The interfund loan rate is determined, as specified in the Order, by averaging the current repurchase agreement rate and the current bank loan rate. The Order was granted to JPMorgan Trust II and may be relied upon by the Fund because the Fund and the series of JPMorgan Trust II are all investment companies in the same “group of investment companies” (as defined in Section 12(d)(1)(G) of the 1940 Act).
The Fund had no borrowings outstanding from another fund, or loans outstanding to another fund, during the year ended October 31, 2024.
The Trust and JPMCB have entered into a financing arrangement. Under this arrangement, JPMCB provides an unsecured, uncommitted credit facility in the aggregate amount of $100 million to certain of the J.P. Morgan Funds, including the Fund. Advances under the arrangement are taken primarily for temporary or emergency purposes, including the meeting of redemption requests that otherwise might require the untimely disposition of securities, and are subject to the Fund's borrowing restrictions. Interest on borrowings is payable at a rate determined by JPMCB at the time of borrowing. This agreement has been extended until October 28, 2025.
| J.P. Morgan Exchange-Traded Funds | |
NOTES TO FINANCIAL STATEMENTSAS OF October 31, 2024 (continued)
The Fund had no borrowings outstanding from the unsecured, uncommitted credit facility during the year ended October 31, 2024.
Effective August 8, 2023, the Trust, along with certain other trusts for J.P. Morgan Funds (“Borrowers”), has entered into an existing joint syndicated senior unsecured revolving credit facility totaling $1.5 billion (“Credit Facility”) with various lenders and The Bank of New York Mellon, as administrative agent for the lenders. Although the Trust is effectively part of the Credit Facility as of August 8, 2023, it was not eligible to draw on the Credit Facility, and did not incur costs associated with being a part of the Credit Facility up through May 30, 2024.
This Credit Facility provides a source of funds to the Borrowers for temporary and emergency purposes, including the meeting of redemption requests that otherwise might require the untimely disposition of securities. Under the terms of the Credit Facility, a borrowing fund must have a minimum of $25 million in adjusted net asset value and not exceed certain adjusted net asset coverage ratios prior to and during the time in which any borrowings are outstanding. If a fund does not comply with the aforementioned requirements, the fund must remediate within three business days with respect to the $25 million minimum adjusted net asset value or within one business day with respect to certain asset coverage ratios or the administrative agent at the request of, or with the consent of, the lenders may terminate the Credit Facility and declare any outstanding borrowings to be due and payable immediately.
Interest associated with any borrowing under the Credit Facility is charged to the borrowing fund at a rate of interest equal to 1.00%, plus the greater of the federal funds effective rate or the one-month Adjusted Secured Overnight Financing Rate (SOFR).
The Fund did not utilize the Credit Facility during the period November 1, 2023 through May 30, 2024.
Effective May 31, 2024, the Fund is no longer part of the Credit Facility.
8. Risks, Concentrations and Indemnifications
In the normal course of business, the Fund enters into contracts that contain a variety of representations which provide general indemnifications. The Fund's maximum exposure under these arrangements is unknown. The amount of exposure would depend on future claims that may be brought against the Fund. However, based on experience, the Fund expects the risk of loss to be remote.
As of October 31, 2024, J.P. Morgan Investor Funds and JPMorgan SmartRetirement Funds, which are affiliated funds of funds, each owned in the aggregate, shares representing more than 10% of the net assets of the Fund as follows:
| | JPMorgan
SmartRetirement
Funds |
| | |
Significant shareholder transactions by the Adviser may impact the Fund's performance and liquidity.
The Fund may have elements of risk not typically associated with investments in the United States of America due to concentrated investments in a limited number of foreign countries or regions, which may vary throughout the year. Such concentrations may subject the Fund to additional risks resulting from political or economic conditions in such countries or regions and the possible imposition of adverse governmental laws or currency exchange restrictions could cause the securities and their markets to be less liquid and their prices to be more volatile than those of comparable U.S. securities.
As of October 31, 2024, the Fund had non-U.S. country allocations representing greater than 10% of total investments (excluding investment
of cash collateral from securities loaned) as follows:
Derivatives may be riskier than other types of investments because they may be more sensitive to changes in economic and market conditions and could result in losses that significantly exceed the Fund's original investment. Many derivatives create leverage thereby causing the Fund to be more volatile than it would have been if it had not used derivatives. Derivatives also expose the Fund to counterparty risk (the risk that the derivative counterparty will not fulfill its contractual obligations), including credit risk of the derivative counterparty. The possible lack of a liquid secondary market for derivatives and the resulting inability of the Fund to sell or otherwise close a derivatives position could expose the Fund to losses and could make derivatives more difficult for the Fund to value accurately.
The Fund invests in foreign issuers and foreign securities (including depositary receipts) that are subject to additional risks, including political and economic risks, civil conflicts and war, greater volatility, expropriation and nationalization risks, sanctions or other measures by the United States or other governments, currency fluctuations, higher transaction costs, delayed settlement, possible foreign controls on investment, liquidity risks and less stringent investor protection and disclosure standards of foreign markets. In certain markets where securities and other instruments are not
| J.P. Morgan Exchange-Traded Funds | |
traded “delivery versus payment,” the Fund may not receive timely payment for securities or other instruments it has delivered or receive delivery of securities paid for and may be subject to increased risk that the counterparty will fail to make payments or delivery when due or default completely.
Events and evolving conditions in certain economies or markets may alter the risks associated with investments tied to countries or regions that historically were perceived as comparatively stable becoming riskier and more volatile.
Disruptions to creations and redemptions, the existence of significant market volatility or potential lack of an active trading market for the shares (including through a trading halt), as well as other factors, may result in shares trading significantly above (at a premium) or below (at a discount) to the NAV or to the intraday value of the Fund's holdings. During such periods, investors may incur significant losses if shares are sold.
The Fund is subject to infectious disease epidemics/pandemics risk. The effects of any future pandemic or other global event to public health and business and market conditions, may have a significant negative impact on the performance of the Fund's investments, increase the Fund's volatility, negatively impact a Fund’s arbitrage and pricing mechanisms, exacerbate pre-existing political, social and economic risks to the Fund, and negatively impact broad segments of businesses and populations. In addition, governments, their regulatory agencies, or self-regulatory organizations have taken or may take actions in response to a pandemic or other global event that affect the instruments in which the Fund invests, or the issuers of such instruments, in ways that could have a significant negative impact on the Fund's investment performance. The ultimate impact of any pandemic or other global event and the extent to which the associated conditions and governmental responses impact the Fund will also depend on future developments, which are highly uncertain, difficult to accurately predict and subject to frequent changes.
| J.P. Morgan Exchange-Traded Funds | |
REPORT OF INDEPENDENT REGISTERED PUBLIC ACCOUNTING FIRM
To the Board of Trustees of J.P. Morgan Exchange-Traded Fund Trust and Shareholders of JPMorgan International Research Enhanced Equity ETF
Opinion on the Financial Statements
We have audited the accompanying statement of assets and liabilities, including the schedule of portfolio investments, of JPMorgan International Research Enhanced Equity ETF (one of the funds constituting J.P. Morgan Exchange-Traded Fund Trust, referred to hereafter as the “Fund”) as of October 31, 2024, the related statement of operations for the year ended October 31, 2024, the statement of changes in net assets for each of the two years in the period ended October 31, 2024, including the related notes, and the financial highlights for each of the five years in the period ended October 31, 2024 (collectively referred to as the “financial statements”). In our opinion, the financial statements present fairly, in all material respects, the financial position of the Fund as of October 31, 2024, the results of its operations for the year then ended, the changes in its net assets for each of the two years in the period ended October 31, 2024 and the financial highlights for each of the five years in the period ended October 31, 2024 in conformity with accounting principles generally accepted in the United States of America.
These financial statements are the responsibility of the Fund’s management. Our responsibility is to express an opinion on the Fund’s financial statements based on our audits. We are a public accounting firm registered with the Public Company Accounting Oversight Board (United States) (PCAOB) and are required to be independent with respect to the Fund in accordance with the U.S. federal securities laws and the applicable rules and regulations of the Securities and Exchange Commission and the PCAOB.
We conducted our audits of these financial statements in accordance with the standards of the PCAOB. Those standards require that we plan and perform the audit to obtain reasonable assurance about whether the financial statements are free of material misstatement, whether due to error or fraud.
Our audits included performing procedures to assess the risks of material misstatement of the financial statements, whether due to error or fraud, and performing procedures that respond to those risks. Such procedures included examining, on a test basis, evidence regarding the amounts and disclosures in the financial statements. Our audits also included evaluating the accounting principles used and significant estimates made by management, as well as evaluating the overall presentation of the financial statements. Our procedures included confirmation of securities owned as of October 31, 2024 by correspondence with the custodian and transfer agent. We believe that our audits provide a reasonable basis for our opinion.
/s/ PricewaterhouseCoopers LLP
New York, New York
December 23, 2024
We have served as the auditor of one or more investment companies in the JPMorgan Funds complex since 1993.
| J.P. Morgan Exchange-Traded Funds | |
Certain tax information for the J.P. Morgan Funds is required to be provided to shareholders based upon the Fund's income and distributions for the taxable year ended October 31, 2024. The information and distributions reported in this letter may differ from the information and taxable distributions reported to the shareholders for the calendar year ending December 31, 2024. The information necessary to complete your income tax returns for the calendar year ending December 31, 2024 will be provided under separate cover.
Qualified Dividend Income (QDI)
The Fund had $163,603,681, of ordinary income distributions and foreign tax credits (if applicable) treated as qualified dividends for the fiscal year ended October 31, 2024.
Foreign Source Income and Foreign Tax Credit Pass Through
For the fiscal year ended October 31, 2024, the Fund intends to elect to pass through to shareholders taxes paid to foreign countries. The Fund had $191,094,421 and $14,022,689 in gross income and foreign tax expenses or amounts as finally determined.
| J.P. Morgan Exchange-Traded Funds | |
THIS PAGE IS INTENTIONALLY LEFT BLANK
THIS PAGE IS INTENTIONALLY LEFT BLANK
THIS PAGE IS INTENTIONALLY LEFT BLANK
J.P. Morgan Exchange-Traded Funds are distributed by JPMorgan Distribution Services, Inc., an indirect, wholly-owned subsidiary of JPMorgan Chase & Co. Affiliates of JPMorgan Chase & Co. receive fees for providing various services to the Funds.
Contact J.P. Morgan Exchange-Traded Funds at 1-844-457-6383 (844-4JPM ETF) for a fund prospectus. You can also visit us at www.jpmorganfunds.com. Investors should carefully consider the investment objectives and risks as well as charges and expenses of the fund before investing. The prospectus contains this and other information about the fund. Read the prospectus carefully before investing.
Investors may obtain information about the Securities Investor Protection Corporation (SIPC), including the SIPC brochure, by visiting www.sipc.org or by calling SIPC at 202-371-8300.
The Fund files a complete schedule of its fund holdings for the first and third quarters of its fiscal year with the SEC as an exhibit to its report on Form N-PORT. The Fund's Form N-PORT reports are available on the SEC’s website at http://www.sec.gov. The Fund's quarterly holdings can be found by visiting the J.P. Morgan Funds’ website at www.jpmorganfunds.com.
A description of the Fund's policies and procedures with respect to the disclosure of the Fund's holdings is available in the prospectus and Statement of Additional Information.
A copy of proxy policies and procedures is available without charge upon request by calling 1-844-457-6383 and on the Fund's website at www.jpmorganfunds.com. A description of such policies and procedures is on the SEC’s website at www.sec.gov. The Trustees have delegated the authority to vote proxies for securities owned by the Fund to the Adviser. A copy of the Fund's voting record for the most recent 12-month period ended June 30 is available on the SEC’s website at www.sec.gov or at the Fund's website at www.jpmorganfunds.com no later than August 31 of each year. The Fund's proxy voting record will include, among other things, a brief description of the matter voted on for each fund security, and will state how each vote was cast, for example, for or against the proposal.
J.P. Morgan Asset Management is the brand name for the asset management business of JPMorgan Chase & Co. and its affiliates worldwide.
© JPMorgan Chase & Co., 2024. All rights reserved. October 2024.
AN-CONV-ETF-1024
Changes in and Disagreements with Accountants for Open-End Management Investment Companies
Proxy Disclosures for Open-End Management Investment Companies
Remuneration Paid to Directors, Officers, and Others of Open-End Management Investment Companies
Included in the Statement of Operations within the Fund's Financial Statements.
Statement Regarding Basis for Approval of Management Agreement
The Board of Trustees (the “Board” or the “Trustees”) has established various standing committees composed of Trustees with diverse backgrounds, to which the Board has assigned specific subject matter responsibilities to further enhance the effectiveness of the Board’s oversight and decision making. The Board and its investment committees (Money Market and Alternative Products Committee, Equity Committee, and Fixed Income Committee) met regularly throughout the year and, at each meeting, considered factors that are relevant to their annual consideration of the continuation of the investment advisory agreements. The Board also met for the specific purpose of considering investment advisory agreement annual renewals. The Board held meetings June 25-26, 2024 and August 20-22, 2024, at which the Trustees considered the continuation of the investment advisory agreement for the Fund whose annual report is contained herein (the “Advisory Agreement” ). At the June meeting, the Board’s investment committees met to review and consider performance, expense and related information for the J.P. Morgan Funds. Each investment committee reported to the full Board, which then considered each investment committee’s preliminary findings. At the August meeting, the Trustees continued their review and consideration. The Trustees, including a majority of the Trustees who are not parties to the Advisory Agreement or “interested persons” (as defined in the Investment Company Act of 1940) of any party to the Advisory Agreement or any of their affiliates, approved the continuation of the Advisory Agreement on August 22, 2024.
As part of their review of the Advisory Agreement, the Trustees considered and reviewed performance and other information about the Fund received from J.P. Morgan Investment Management Inc. (the “Adviser”). This information included the Fund’s performance as compared to the performance of its peers and benchmark, and analyses by the Adviser of the Fund’s performance. In addition, at each of their regular meetings throughout the year, the Trustees considered reports on the performance of certain J.P. Morgan Funds provided by an independent investment consulting firm (the “independent consultant”). In addition, in preparation for the June and August meetings, the Trustees requested, received and evaluated extensive materials from the Adviser, including performance and expense information compiled by Broadridge, using data from Lipper Inc. and/or Morningstar Inc., independent providers of investment company data (together, “Broadridge”). The Trustees’ independent consultant also provided additional quantitative and statistical analyses of certain Funds, including risk and performance return assessments as compared to the Fund’s objectives, benchmarks, and peers. Before voting on the Advisory Agreement, the Trustees reviewed the Advisory Agreement with representatives of the Adviser, counsel to the Fund, and independent legal counsel to the Trustees, and received a memorandum from independent legal counsel to the Trustees discussing the legal standards for their consideration of the Advisory Agreement. The Trustees also discussed the Advisory Agreement with independent legal counsel in executive sessions at which no representatives of the Adviser were present.
A summary of the material factors evaluated by the Trustees in determining whether to approve the Advisory Agreement is provided below. Each Trustee attributed different weights to the various factors and no factor alone was considered determinative. The Trustees considered information provided with respect to the Fund throughout the year, as well as materials furnished specifically in connection with the annual review process. From year to year, the Trustees consider and place emphasis on relevant information in light of changing circumstances in market and economic conditions.
After considering and weighing the factors and information they had received, the Trustees found that the compensation to be received by the Adviser from the Fund under the Advisory Agreement was fair and reasonable under the circumstances, and determined that the continuance of the Advisory Agreement was in the best interests of the Fund and its shareholders.
Nature, Extent and Quality of Services Provided by the Adviser
The Trustees received and considered information regarding the nature, extent and quality of services provided to the Fund under the Advisory Agreement. The Trustees took into account information furnished throughout the year at Trustee meetings, as well as the materials furnished specifically in connection with this annual review process. Among other things, the Trustees considered:
•
The background and experience of the Adviser’s senior management and investment personnel, including personnel changes, if any;
•
The qualifications, backgrounds and responsibilities of the portfolio management team primarily responsible for the day-to-day management of the Fund, including personnel changes, if any;
•
The investment strategy for the Fund, and the infrastructure supporting the portfolio management teams;
•
Information about the structure and distribution strategy for the Fund and how it fits within the Adviser’s other fund offerings within the J.P. Morgan Funds complex;
•
The administration services provided by the Adviser in its role as Administrator;
•
Their knowledge of the nature and quality of the services provided by the Adviser and its affiliates gained from their experience as Trustees of the Fund and in the financial industry generally;
•
The overall reputation and capabilities of the Adviser and its affiliates;
•
The commitment of the Adviser to provide high quality service to the Fund;
•
Their overall confidence in the Adviser’s integrity; and
•
The Adviser’s responsiveness to requests for additional information, questions or concerns raised by them, including the Adviser’s willingness to consider and implement organizational and operational changes designed to improve investment results and the services provided to the Fund.
Based upon these considerations and other factors, the Trustees concluded that they were satisfied with the nature, extent and quality of the services provided to the Fund by the Adviser.
Costs of Services Provided and Profitability to the Adviser and its Affiliates
The Trustees received and considered information regarding the profitability to the Adviser and its affiliates from providing services to the Fund. The Trustees reviewed and discussed this information. The Trustees recognized that this information is not audited and represents the Adviser’s determination of its and its affiliates’ revenues from the contractual services provided to the Fund, less expenses of providing such services. Expenses include direct and indirect costs and are calculated using an allocation methodology developed by the Adviser and reviewed with the Board. The Trustees also recognized that it is difficult to make comparisons of profitability from fund investment advisory contracts because comparative information is not generally publicly available and is affected by numerous factors, including the structure of the particular adviser, the types of funds it manages, its business mix, numerous assumptions regarding allocations and the fact that publicly-traded fund managers’ operating profits and net income are net of distribution and marketing expenses. Based upon their review, and taking into consideration the factors noted above, the Trustees concluded that the profitability to the Adviser under the Advisory Agreement was not unreasonable in light of the services and benefits provided to the Fund.
The Trustees also considered that the Adviser earns fees from the Fund for providing administration services. These fees were shown separately in the profitability analysis presented to the Trustees. The Trustees also considered the fees earned by JPMorgan Chase Bank, N.A. (“JPMCB”), an affiliate of the Adviser, for custody, fund accounting and other related services for the Fund, and the profitability of the arrangements to JPMCB.
The Trustees reviewed information regarding potential “fall-out” or ancillary benefits received by the Adviser and its affiliates as a result of their relationship with the Fund. The Trustees considered that the J.P. Morgan Funds' operating accounts are held at JPMCB, which, as a result, will receive float benefits for certain J.P. Morgan Funds, as applicable. The Trustees also noted that the Adviser supports a diverse set of products and services, which benefits the Adviser by allowing it to leverage its infrastructure to serve additional clients, including benefits that may be received by the Adviser and its affiliates in connection with the Fund’s potential investments in other funds advised by the Adviser. The Trustees also reviewed the Adviser’s allocation of fund brokerage for the J.P. Morgan Funds complex, including allocations to brokers who provide research to the Adviser, as well as the Adviser’s use of affiliates to provide other services and the benefits to such affiliates of doing so. The Trustees also considered the benefit to the Adviser and its affiliates from allocating client assets to the Fund.
The Trustees considered the extent to which the Fund may benefit from potential economies of scale. The Trustees considered that there may not be a direct relationship between economies of scale realized by the Fund and those realized by the Adviser as assets increase. The Trustees considered the extent to which the Fund was priced to scale and whether it would be appropriate to add advisory fee breakpoints, but noted that the Fund has implemented a contractual expense limitation and fee waiver (“Fee Cap”) which allow the Fund’s shareholders to share potential economies of scale from the Fund’s inception, and that the fees remain fair and reasonable relative to peer funds. The Trustees considered the benefits to the Fund of the use of an affiliated distributor and custodian, including the ability to rely on existing infrastructure supporting distribution, custodial and transfer agent services and the ability to negotiate competitive fees for the Fund. The Trustees further considered the Adviser's and JPMorgan Distribution Services, Inc.’s (“JPMDS”), an affiliate of the Adviser which serves as the Fund’s principal underwriter, ongoing investments in their business in support of the Fund, including the Adviser's and/or JPMDS's investments in trading systems, technology (including improvements to the J.P. Morgan Funds’ website, and cybersecurity improvements), retention of key talent, and regulatory support enhancements. The
Trustees concluded that the current fee structure for the Fund, including the Fee Cap that the Adviser has in place that serves to limit the overall net expense ratio of the Fund at a competitive level, was reasonable. The Trustees concluded that the Fund’s shareholders received the benefits of potential economies of scale through the Fee Cap and from the Adviser’s reinvestment in its operations to serve the Fund and its shareholders. The Trustees noted that the Adviser’s reinvestment ensures sufficient resources in terms of personnel and infrastructure to support the Fund.
Fees Relative to Adviser’s Other Clients
The Trustees received and considered information about the nature and extent of investment advisory services and fee rates offered to other clients of the Adviser, including, to the extent applicable, institutional separate accounts, collective investment trusts, other registered investment companies and/or private funds sub-advised by the Adviser, for investment management styles substantially similar to that of the Fund. The Trustees considered the complexity of investment management for registered investment companies relative to the Adviser’s other clients and noted differences, as applicable, in the fee structure and the regulatory, legal and other risks and responsibilities of providing services to the different clients. The Trustees considered that serving as an adviser to a registered investment company involves greater responsibilities and risks than acting as a sub-adviser and observed that sub-advisory fees may be lower than those charged by the Adviser to the Fund. The Trustees also noted that the adviser, not the applicable registered investment company, typically bears the sub-advisory fee and that many responsibilities related to the advisory function are typically retained by the primary adviser. The Trustees concluded that the fee rates charged to the Fund in comparison to those charged to the Adviser’s other clients were reasonable.
The Trustees receive and consider information about the Fund’s performance throughout the year. In addition, the Trustees received and considered absolute and/or relative performance information for the Fund in a report prepared by Broadridge. The Trustees considered the total return performance information, which included the ranking of the Fund within a performance universe comprised of funds with the same Broadridge investment classification and objective (the “Universe”), by total return for the applicable one-, three- and five-year periods. The Trustees reviewed a description of Broadridge’s methodology for selecting exchange-traded funds in the Fund’s Universe, and noted that Universe quintile rankings were not calculated if the number of funds in the Universe did not meet a predetermined minimum. As part of this review, the Trustees also reviewed the Fund’s performance against its benchmark and considered the performance information provided for the Fund at regular Board meetings by the Adviser and the Trustees’ independent consultant and also considered the special analysis prepared for certain Funds by the Trustees’ independent consultant. The Trustees also engaged with the Adviser to consider what steps might be taken to improve performance, as applicable. The Broadridge performance data noted by the Trustees as part of their review and the determinations made by the Trustees with respect to the Fund’s performance are summarized below:
The Trustees noted that the Fund’s performance was in the first, first and second quintiles of the Universe for the one-, three- and five-year periods ended December 31, 2023, respectively. The Trustees discussed the performance and investment strategy of the Fund with the Adviser and reviewed the performance analysis and evaluation prepared by the independent consultant. Based upon these discussions and various other factors, the Trustees concluded that the Fund’s performance was satisfactory.
Advisory Fee and Expense Ratio
The Trustees considered the contractual advisory fee rate and administration fee rate paid by the Fund to the Adviser and compared the combined rate to the information prepared by Broadridge concerning management fee rates paid by other funds in the Universe, as well as a subset of funds within the Universe (the “Peer Group”). The Trustees recognized that Broadridge reported the Fund’s management fee rate as the combined contractual advisory fee and administration fee rates. The Trustees also reviewed information about other expenses and the expense ratio for the Fund, and noted that Universe and Peer Group quintile rankings were not calculated if the number of funds in the Universe and/or Peer Group did not meet a predetermined minimum. The Trustees considered the Fee Cap currently in place for the Fund, the net advisory fee rate and net expense ratio, taking into account any waivers and/or reimbursements, and, where deemed appropriate by the Trustees, additional waivers and/or reimbursements. The Trustees recognized that it can be difficult to make comparisons of advisory fees because there are variations in the services that are included in the fees paid by other funds. The Trustees’ determinations as a result of the review of the Fund’s advisory fee and expense ratio are summarized below:
The Trustees noted that the Fund’s net advisory fee was in the first and second quintiles of the Peer Group and Universe, respectively, and that the actual total expenses were in the second quintile of both the Peer Group and Universe. After considering the factors identified above, in light of this information, the Trustees concluded that the advisory fee was fair and reasonable in light of the services provided to the Fund.
ITEM 8. CHANGES IN AND DISAGREEMENTS WITH ACCOUNTANTS FOR OPEN-END MANAGEMENT INVESTMENT COMPANIES.
Refer to Item 7.
ITEM 9. PROXY DISCLOSURES FOR OPEN-END MANAGEMENT INVESTMENT COMPANIES.
Refer to Item 7.
ITEM 10. REMUNERATION PAID TO DIRECTORS, OFFICERS, AND OTHERS OF OPEN-END MANAGEMENT INVESTMENT COMPANIES.
Refer to Item 7.
ITEM 11. STATEMENT REGARDING BASIS FOR APPROVAL OF INVESTMENT ADVISORY CONTRACT.
Refer to Item 7.
ITEM 12. DISCLOSURE OF PROXY VOTING POLICIES AND PROCEDURES FOR CLOSED-END MANAGEMENT INVESTMENT COMPANIES.
Not applicable.
ITEM 13. PORTFOLIO MANAGERS OF CLOSED-END MANAGEMENT INVESTMENT COMPANIES.
Not applicable.
ITEM 14. PURCHASES OF EQUITY SECURITIES BY CLOSED-END MANAGEMENT INVESTMENT COMPANY AND AFFILIATED PURCHASERS.
Not applicable.
ITEM 15. SUBMISSION OF MATTERS TO A VOTE OF SECURITY HOLDERS.
Describe any material changes to the procedures by which shareholders may recommend nominees to the registrant’s board of directors, where those changes were implemented after the registrant last provided disclosure in response to the requirements of Item 7(d)(2)(ii)(G) of Schedule 14A (17 CFR 240.14a-101), or this Item.
No material changes to report.
ITEM 16. CONTROLS AND PROCEDURES.
(a) Disclose the conclusions of the registrant’s principal executive and principal financial officers, or persons performing similar functions, regarding the effectiveness of the registrant’s disclosure controls and procedures (as defined in Rule 30a-3(c) under the Act (17 CFR 270.30a-3(c))) as of a date within 90 days of the filing date of the report that includes the disclosure required by this paragraph, based on the evaluation of these controls and procedures required by Rule 30a-3(b) under the Act (17 CFR 270.30a-3(b)) and Rules 13a-15(b) or 15d-15(b) under the Exchange Act (17 CFR 240.13a-15(b) or 240.15d-15(b)).
The Registrant’s principal executive and principal financial officers have concluded, based on their evaluation of the Registrant’s disclosure controls and procedures as of a date within 90 days of the filing date of this report, that the Registrant’s disclosure controls and procedures are reasonably designed to ensure that information required to be disclosed by the Registrant on Form N-CSR is recorded, processed, summarized and reported within the required time periods and that information required to be disclosed by the Registrant in the reports that it files or submits on Form N-CSR is accumulated and communicated to the Registrant’s management, including its principal executive and principal financial officers, as appropriate to allow timely decisions regarding required disclosure.
(b) Disclose any change in the registrant’s internal control over financial reporting (as defined in Rule 30a-3(d) under the Act (17 CFR 270.30a-3(d)) that occurred during the period covered by this report that has materially affected, or is reasonably likely to materially affect, the registrant’s internal control over financial reporting.
There were no changes in the Registrant’s internal control over financial reporting that occurred during the period covered by this report that have materially affected, or are reasonably likely to materially affect, the Registrant’s internal control over financial reporting.
ITEM 17. DISCLOSURE OF SECURITIES LENDING ACTIVITIES FOR CLOSED-END MANAGEMENT INVESTMENT COMPANIES.
Not applicable.
ITEM 18. RECOVERY OF ERRONEOUSLY AWARDED COMPENSATION.
Not applicable.
ITEM 19. EXHIBITS.
| | (a) | File the exhibits listed below as part of this Form. Letter or number the exhibits in the sequence indicated. |
(1) Any code of ethics, or amendment thereto, that is the subject of the disclosure required by Item 2, to the extent that the registrant intends to satisfy the Item 2 requirements through filing of an exhibit.
Code of Ethics applicable to its Principal Executive and Principal Financial Officers pursuant to Section 406 of the Sarbanes-Oxley Act of 2002 attached hereto.
(2) A separate certification for each principal executive officer and principal financial officer of the registrant as required by Rule 30a-2(a) under the Act (17 CFR 270.30a-2(2) A separate certification for each principal executive officer and principal financial officer of the registrant as required by Rule 30a-2(a) under the Act (17 CFR 270.30a-2), exactly as set forth below:
Certifications pursuant to Rule 30a-2(a) under the Investment Company Act of 1940 are attached hereto.
(1) Any written solicitation to purchase securities under Rule 23c-1 under the Act (17 CFR 270.23c-1) sent or given during the period covered by the report by or on behalf of the registrant to 10 or more persons.
Not applicable.
(2) Change in the registrant’s independent public accountant. Provide the information called for by Item 4 of Form 8-K under the Exchange Act (17 CFR 249.308). Unless otherwise specified by Item 4, or related to and necessary for a complete understanding of information not previously disclosed, the information should relate to events occurring during the reporting period.
Not applicable.
Certifications pursuant to Rule 30a-2(b) under the Investment Company Act of 1940 are attached hereto.
SIGNATURES
Pursuant to the requirements of the Securities Exchange Act of 1934 and the Investment Company Act of 1940, the registrant has duly caused this report to be signed on its behalf by the undersigned, thereunto duly authorized.
| | |
| J.P. Morgan Exchange-Traded Fund Trust |
| |
| By: | | /s/ Brian S. Shlissel |
| | Brian S. Shlissel |
| | President and Principal Executive Officer |
| | January 3, 2025 |
Pursuant to the requirements of the Securities Exchange Act of 1934 and the Investment Company Act of 1940, this report has been signed below by the following persons on behalf of the registrant and in the capacities and on the dates indicated.
| | |
| By: | | /s/ Brian S. Shlissel |
| | Brian S. Shlissel |
| | President and Principal Executive Officer |
| | January 3, 2025 |
| |
| By: | | /s/ Timothy J. Clemens |
| | Timothy J. Clemens |
| | Treasurer and Principal Financial Officer |
| | January 3, 2025 |