UNITED STATES
SECURITIES AND EXCHANGE COMMISSION
Washington, D.C. 20549
FORM N-CSR
CERTIFIED SHAREHOLDER REPORT OF REGISTERED MANAGEMENT INVESTMENT COMPANIES
Investment Company Act file number
J.P. Morgan Exchange-Traded Fund Trust
(Exact name of registrant as specified in charter)
277 Park Avenue
New York, NY 10172
(Address of principal executive offices) (Zip code)
Gregory S. Samuels
J.P. Morgan Investment Management Inc.
277 Park Avenue
New York, NY 10172
(Name and Address of Agent for Service)
| With copies to: |
Elizabeth A. Davin, Esq.
JPMorgan Chase & Co.
1111 Polaris Parkway
Columbus, OH 43240 | Jon S. Rand, Esq.
Dechert LLP
1905 Avenue of the Americas
New York, NY 10036 |
Registrant's telephone number, including area code:
Date of reporting period:
Item 1. Report to Stockholders.
a.) The following is a copy of the report transmitted to shareholders pursuant to Rule 30e-1 under the Investment Company Act of 1940 (17 CFR 270.30e-1).
b.) A copy of the notice transmitted to shareholders in reliance on Rule 30e-3 under the 1940 Act that contains disclosures specified by paragraph (c)(3) of that rule is included in the Annual Report. Not Applicable. Notices do not incorporate disclosures from the shareholder reports.
SEMI-ANNUAL SHAREHOLDER REPORT | December 31, 2024 (Unaudited)
JPMorgan Active Growth ETF
Ticker: JGRO - NYSE Arca, Inc.
SEMI-ANNUAL SHAREHOLDER REPORT
This semi-annual shareholder report contains important information about the JPMorgan Active Growth ETF (the "Fund") for the period of July 1, 2024 to December 31, 2024. You can find additional information about the Fund at www.jpmorganfunds.com/funddocuments. You can also request this information by contacting us at 1-844-457-6383, by sending an e-mail request to jpm.xf@jpmorgan.com or by asking any financial intermediary that offers shares of the Fund.
What were the Fund costs for the last six months?
(based on a hypothetical $10,000 investment)
| Fund | Costs of a
$10,000 investment | Costs paid as a percentage
of a $10,000 investment* |
| JPMorgan Active Growth ETF | $23 | 0.44% |
| * | This charge is annualized. |
| Fund net assets | $4,306,872,310 | |
| Total number of portfolio holdings | 110 | |
| Portfolio turnover rate | 19 | % |
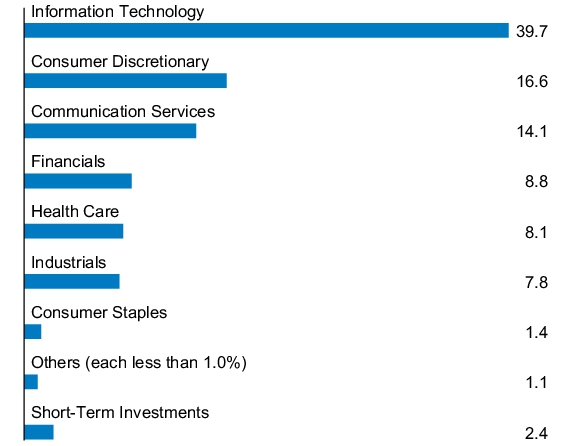
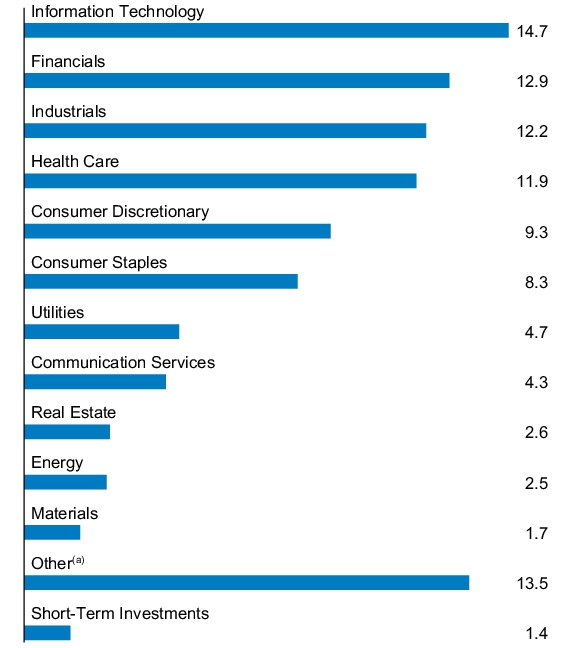
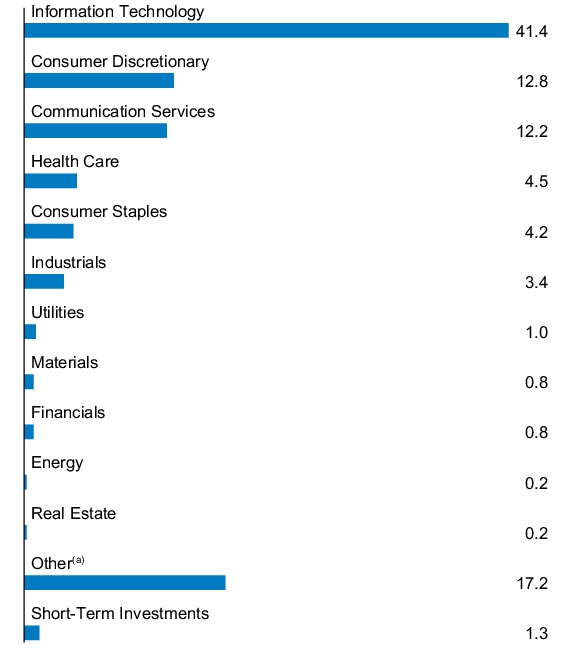
PORTFOLIO COMPOSITION - SECTOR
(% of Total Investments)
Availability of Additional Information
At www.jpmorganfunds.com/funddocuments, you can find additional information about the Fund, including the Fund’s:
Prospectus
Financial information
Fund holdings
Proxy voting information
You can also request this information by contacting us at 1-844-457-6383.
SEMI-ANNUAL SHAREHOLDER REPORT | December 31, 2024 (Unaudited)
JPMorgan Active Small Cap Value ETF
Ticker: JPSV - NYSE Arca, Inc.
SEMI-ANNUAL SHAREHOLDER REPORT
This semi-annual shareholder report contains important information about the JPMorgan Active Small Cap Value ETF (the "Fund") for the period of July 1, 2024 to December 31, 2024. You can find additional information about the Fund at www.jpmorganfunds.com/funddocuments. You can also request this information by contacting us at 1-844-457-6383, by sending an e-mail request to jpm.xf@jpmorgan.com or by asking any financial intermediary that offers shares of the Fund.
What were the Fund costs for the last six months?
(based on a hypothetical $10,000 investment)
| Fund | Costs of a
$10,000 investment | Costs paid as a percentage
of a $10,000 investment* |
| JPMorgan Active Small Cap Value ETF | $39 | 0.74% |
| * | This charge is annualized. |
| Fund net assets | $19,582,691 | |
| Total number of portfolio holdings | 115 | |
| Portfolio turnover rate | 26 | % |
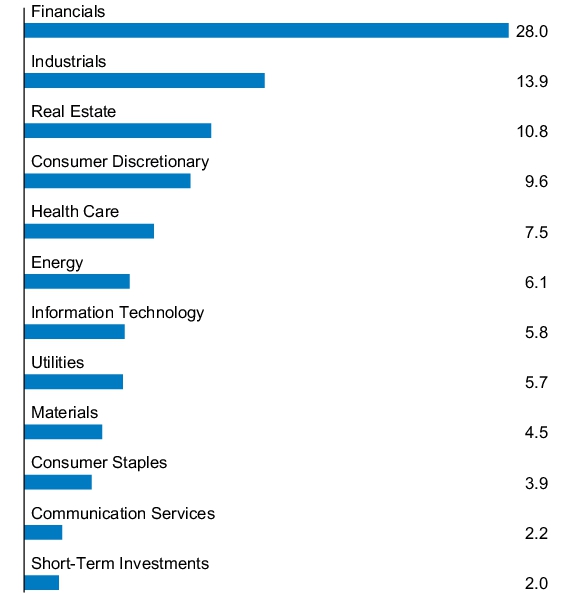
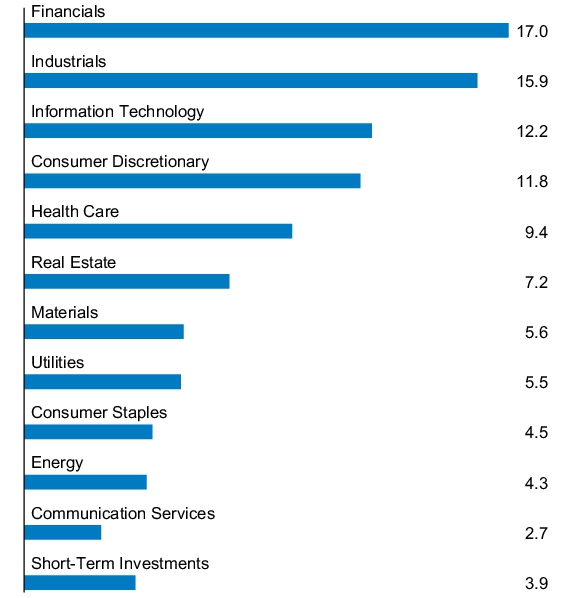
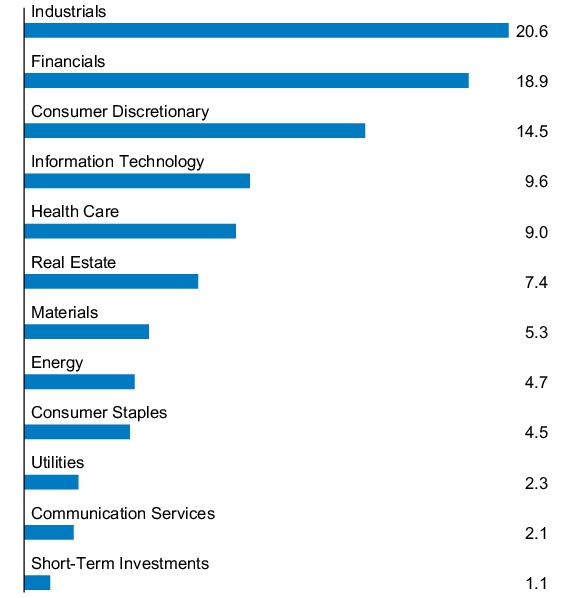
PORTFOLIO COMPOSITION - SECTOR
(% of Total Investments)
Availability of Additional Information
At www.jpmorganfunds.com/funddocuments, you can find additional information about the Fund, including the Fund’s:
Prospectus
Financial information
Fund holdings
Proxy voting information
You can also request this information by contacting us at 1-844-457-6383.
SEMI-ANNUAL SHAREHOLDER REPORT | December 31, 2024 (Unaudited)
JPMorgan Active Value ETF
Ticker: JAVA - NYSE Arca, Inc.
SEMI-ANNUAL SHAREHOLDER REPORT
This semi-annual shareholder report contains important information about the JPMorgan Active Value ETF (the "Fund") for the period of July 1, 2024 to December 31, 2024. You can find additional information about the Fund at www.jpmorganfunds.com/funddocuments. You can also request this information by contacting us at 1-844-457-6383, by sending an e-mail request to jpm.xf@jpmorgan.com or by asking any financial intermediary that offers shares of the Fund.
What were the Fund costs for the last six months?
(based on a hypothetical $10,000 investment)
| Fund | Costs of a
$10,000 investment | Costs paid as a percentage
of a $10,000 investment* |
| JPMorgan Active Value ETF | $23 | 0.43% |
| * | This charge is annualized. |
| Fund net assets | $2,422,428,811 | |
| Total number of portfolio holdings | 181 | |
| Portfolio turnover rate | 40 | % |
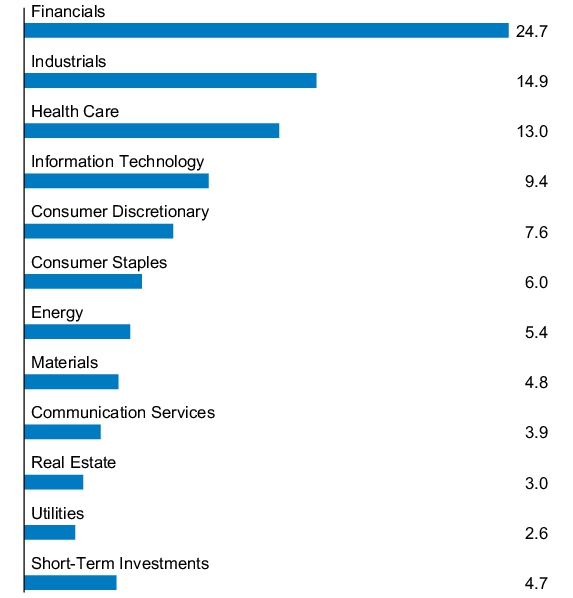
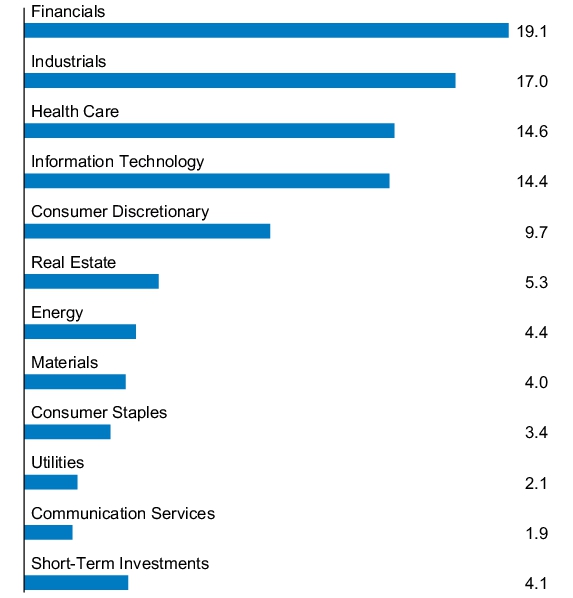
PORTFOLIO COMPOSITION - SECTOR
(% of Total Investments)
Availability of Additional Information
At www.jpmorganfunds.com/funddocuments, you can find additional information about the Fund, including the Fund’s:
Prospectus
Financial information
Fund holdings
Proxy voting information
You can also request this information by contacting us at 1-844-457-6383.
SEMI-ANNUAL SHAREHOLDER REPORT | December 31, 2024 (Unaudited)
JPMorgan Equity Focus ETF
Ticker: JPEF - The NASDAQ Stock Market® LLC
SEMI-ANNUAL SHAREHOLDER REPORT
This semi-annual shareholder report contains important information about the JPMorgan Equity Focus ETF (the "Fund") for the period of July 1, 2024 to December 31, 2024. You can find additional information about the Fund at www.jpmorganfunds.com/funddocuments. You can also request this information by contacting us at 1-844-457-6383, by sending an e-mail request to jpm.xf@jpmorgan.com or by asking any financial intermediary that offers shares of the Fund.
What were the Fund costs for the last six months?
(based on a hypothetical $10,000 investment)
| Fund | Costs of a
$10,000 investment | Costs paid as a percentage
of a $10,000 investment* |
| JPMorgan Equity Focus ETF | $26 | 0.50% |
| * | This charge is annualized. |
| Fund net assets | $1,084,854,864 | |
| Total number of portfolio holdings | 41 | |
| Portfolio turnover rate | 10 | % |
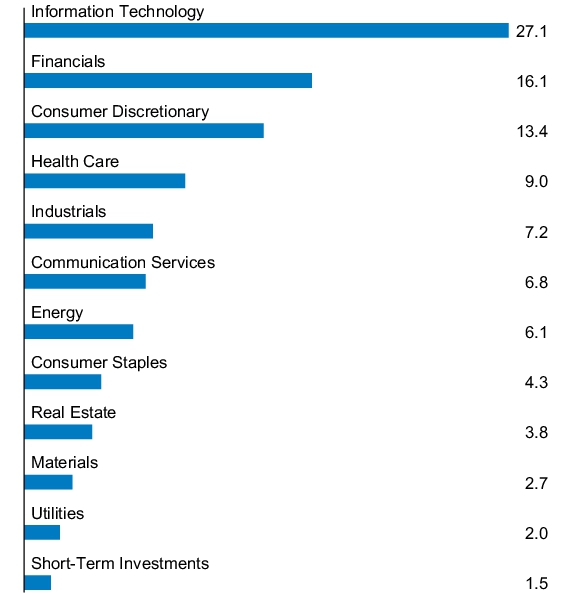
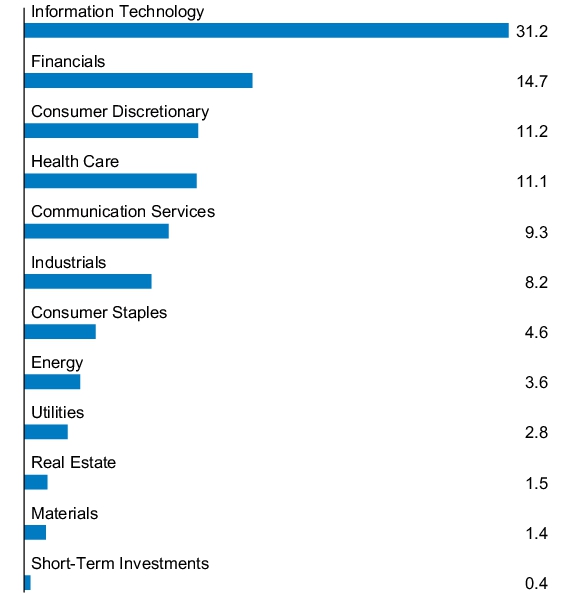
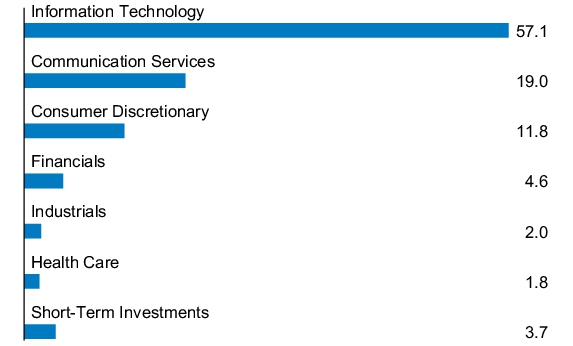
PORTFOLIO COMPOSITION - SECTOR
(% of Total Investments)
Availability of Additional Information
At www.jpmorganfunds.com/funddocuments, you can find additional information about the Fund, including the Fund’s:
Prospectus
Financial information
Fund holdings
Proxy voting information
You can also request this information by contacting us at 1-844-457-6383.
SEMI-ANNUAL SHAREHOLDER REPORT | December 31, 2024 (Unaudited)
JPMorgan Equity Premium Income ETF
Ticker: JEPI - NYSE Arca, Inc.
SEMI-ANNUAL SHAREHOLDER REPORT
This semi-annual shareholder report contains important information about the JPMorgan Equity Premium Income ETF (the "Fund") for the period of July 1, 2024 to December 31, 2024. You can find additional information about the Fund at www.jpmorganfunds.com/funddocuments. You can also request this information by contacting us at 1-844-457-6383, by sending an e-mail request to jpm.xf@jpmorgan.com or by asking any financial intermediary that offers shares of the Fund.
What were the Fund costs for the last six months?
(based on a hypothetical $10,000 investment)
| Fund | Costs of a
$10,000 investment | Costs paid as a percentage
of a $10,000 investment* |
| JPMorgan Equity Premium Income ETF | $18 | 0.35% |
| * | This charge is annualized. |
| Fund net assets | $36,990,006,438 | |
| Total number of portfolio holdings | 130 | |
| Portfolio turnover rate | 85 | % |
PORTFOLIO COMPOSITION - SECTOR
(% of Total Investments)
| (a) | Equity-Linked Notes that are linked to the S&P 500 Index. |
Availability of Additional Information
At www.jpmorganfunds.com/funddocuments, you can find additional information about the Fund, including the Fund’s:
Prospectus
Financial information
Fund holdings
Proxy voting information
You can also request this information by contacting us at 1-844-457-6383.
SEMI-ANNUAL SHAREHOLDER REPORT | December 31, 2024 (Unaudited)
JPMorgan Fundamental Data Science Large Core ETF
Ticker: LCDS - The NASDAQ Stock Market® LLC
SEMI-ANNUAL SHAREHOLDER REPORT
This semi-annual shareholder report contains important information about the JPMorgan Fundamental Data Science Large Core ETF (the "Fund") for the period of August 7, 2024 (fund inception) to December 31, 2024. You can find additional information about the Fund at www.jpmorganfunds.com/funddocuments. You can also request this information by contacting us at 1-844-457-6383, by sending an e-mail request to jpm.xf@jpmorgan.com or by asking any financial intermediary that offers shares of the Fund.
What were the Fund costs for the last six months?
(based on a hypothetical $10,000 investment)
| Fund | Costs of a
$10,000 investment | Costs paid as a percentage
of a $10,000 investment* |
| JPMorgan Fundamental Data Science Large Core ETF | $13 | 0.30% |
| * | This charge is annualized. |
| Fund net assets | $12,623,883 | |
| Total number of portfolio holdings | 89 | |
| Portfolio turnover rate | 5 | % |
PORTFOLIO COMPOSITION - SECTOR
(% of Total Investments)
Availability of Additional Information
At www.jpmorganfunds.com/funddocuments, you can find additional information about the Fund, including the Fund’s:
Prospectus
Financial information
Fund holdings
Proxy voting information
You can also request this information by contacting us at 1-844-457-6383.
SEMI-ANNUAL SHAREHOLDER REPORT | December 31, 2024 (Unaudited)
JPMorgan Fundamental Data Science Mid Core ETF
Ticker: MCDS - The NASDAQ Stock Market® LLC
SEMI-ANNUAL SHAREHOLDER REPORT
This semi-annual shareholder report contains important information about the JPMorgan Fundamental Data Science Mid Core ETF (the "Fund") for the period of August 7, 2024 (fund inception) to December 31, 2024. You can find additional information about the Fund at www.jpmorganfunds.com/funddocuments. You can also request this information by contacting us at 1-844-457-6383, by sending an e-mail request to jpm.xf@jpmorgan.com or by asking any financial intermediary that offers shares of the Fund.
What were the Fund costs for the last six months?
(based on a hypothetical $10,000 investment)
| Fund | Costs of a
$10,000 investment | Costs paid as a percentage
of a $10,000 investment* |
| JPMorgan Fundamental Data Science Mid Core ETF | $15 | 0.35% |
| * | This charge is annualized. |
| Fund net assets | $6,682,594 | |
| Total number of portfolio holdings | 141 | |
| Portfolio turnover rate | 5 | % |
PORTFOLIO COMPOSITION - SECTOR
(% of Total Investments)
Availability of Additional Information
At www.jpmorganfunds.com/funddocuments, you can find additional information about the Fund, including the Fund’s:
Prospectus
Financial information
Fund holdings
Proxy voting information
You can also request this information by contacting us at 1-844-457-6383.
SEMI-ANNUAL SHAREHOLDER REPORT | December 31, 2024 (Unaudited)
JPMorgan Fundamental Data Science Small Core ETF
Ticker: SCDS - The NASDAQ Stock Market® LLC
SEMI-ANNUAL SHAREHOLDER REPORT
This semi-annual shareholder report contains important information about the JPMorgan Fundamental Data Science Small Core ETF (the "Fund") for the period of August 7, 2024 (fund inception) to December 31, 2024. You can find additional information about the Fund at www.jpmorganfunds.com/funddocuments. You can also request this information by contacting us at 1-844-457-6383, by sending an e-mail request to jpm.xf@jpmorgan.com or by asking any financial intermediary that offers shares of the Fund.
What were the Fund costs for the last six months?
(based on a hypothetical $10,000 investment)
| Fund | Costs of a
$10,000 investment | Costs paid as a percentage
of a $10,000 investment* |
| JPMorgan Fundamental Data Science Small Core ETF | $17 | 0.40% |
| * | This charge is annualized. |
| Fund net assets | $6,562,753 | |
| Total number of portfolio holdings | 210 | |
| Portfolio turnover rate | 10 | % |
PORTFOLIO COMPOSITION - SECTOR
(% of Total Investments)
Availability of Additional Information
At www.jpmorganfunds.com/funddocuments, you can find additional information about the Fund, including the Fund’s:
Prospectus
Financial information
Fund holdings
Proxy voting information
You can also request this information by contacting us at 1-844-457-6383.
SEMI-ANNUAL SHAREHOLDER REPORT | December 31, 2024 (Unaudited)
JPMorgan Nasdaq Equity Premium Income ETF
Ticker: JEPQ - The NASDAQ Stock Market® LLC
SEMI-ANNUAL SHAREHOLDER REPORT
This semi-annual shareholder report contains important information about the JPMorgan Nasdaq Equity Premium Income ETF (the "Fund") for the period of July 1, 2024 to December 31, 2024. You can find additional information about the Fund at www.jpmorganfunds.com/funddocuments. You can also request this information by contacting us at 1-844-457-6383, by sending an e-mail request to jpm.xf@jpmorgan.com or by asking any financial intermediary that offers shares of the Fund.
What were the Fund costs for the last six months?
(based on a hypothetical $10,000 investment)
| Fund | Costs of a
$10,000 investment | Costs paid as a percentage
of a $10,000 investment* |
| JPMorgan Nasdaq Equity Premium Income ETF | $18 | 0.35% |
| * | This charge is annualized. |
| Fund net assets | $20,800,336,259 | |
| Total number of portfolio holdings | 103 | |
| Portfolio turnover rate | 87 | % |
PORTFOLIO COMPOSITION - SECTOR
(% of Total Investments)
| (a) | Equity-Linked Notes that are linked to the Nasdaq-100 Index. |
Availability of Additional Information
At www.jpmorganfunds.com/funddocuments, you can find additional information about the Fund, including the Fund’s:
Prospectus
Financial information
Fund holdings
Proxy voting information
You can also request this information by contacting us at 1-844-457-6383.
SEMI-ANNUAL SHAREHOLDER REPORT | December 31, 2024 (Unaudited)
JPMorgan Small & Mid Cap Enhanced Equity ETF (formerly known as JPMorgan Market Expansion Enhanced Equity ETF)
Ticker: JMEE - NYSE Arca, Inc.
SEMI-ANNUAL SHAREHOLDER REPORT
This semi-annual shareholder report contains important information about the JPMorgan Small & Mid Cap Enhanced Equity ETF (formerly known as JPMorgan Market Expansion Enhanced Equity ETF) (the "Fund") for the period of July 1, 2024 to December 31, 2024. You can find additional information about the Fund at www.jpmorganfunds.com/funddocuments. You can also request this information by contacting us at 1-844-457-6383, by sending an e-mail request to jpm.xf@jpmorgan.com or by asking any financial intermediary that offers shares of the Fund.
What were the Fund costs for the last six months?
(based on a hypothetical $10,000 investment)
| Fund | Costs of a
$10,000 investment | Costs paid as a percentage
of a $10,000 investment* |
| JPMorgan Small & Mid Cap Enhanced Equity ETF | $13 | 0.24% |
| * | This charge is annualized. |
| Fund net assets | $1,603,042,618 | |
| Total number of portfolio holdings | 606 | |
| Portfolio turnover rate | 10 | % |
PORTFOLIO COMPOSITION - SECTOR
(% of Total Investments)
Availability of Additional Information
At www.jpmorganfunds.com/funddocuments, you can find additional information about the Fund, including the Fund’s:
Prospectus
Financial information
Fund holdings
Proxy voting information
You can also request this information by contacting us at 1-844-457-6383.
SEMI-ANNUAL SHAREHOLDER REPORT | December 31, 2024 (Unaudited)
JPMorgan U.S. Tech Leaders ETF
Ticker: JTEK - The NASDAQ Stock Market® LLC
SEMI-ANNUAL SHAREHOLDER REPORT
This semi-annual shareholder report contains important information about the JPMorgan U.S. Tech Leaders ETF (the "Fund") for the period of July 1, 2024 to December 31, 2024. You can find additional information about the Fund at www.jpmorganfunds.com/funddocuments. You can also request this information by contacting us at 1-844-457-6383, by sending an e-mail request to jpm.xf@jpmorgan.com or by asking any financial intermediary that offers shares of the Fund.
What were the Fund costs for the last six months?
(based on a hypothetical $10,000 investment)
| Fund | Costs of a
$10,000 investment | Costs paid as a percentage
of a $10,000 investment* |
| JPMorgan U.S. Tech Leaders ETF | $34 | 0.65% |
| * | This charge is annualized. |
| Fund net assets | $935,796,542 | |
| Total number of portfolio holdings | 61 | |
| Portfolio turnover rate | 29 | % |
PORTFOLIO COMPOSITION - SECTOR
(% of Total Investments)
Availability of Additional Information
At www.jpmorganfunds.com/funddocuments, you can find additional information about the Fund, including the Fund’s:
Prospectus
Financial information
Fund holdings
Proxy voting information
You can also request this information by contacting us at 1-844-457-6383.
ITEM 2. CODE OF ETHICS.
Not applicable to a semi-annual report.
ITEM 3. AUDIT COMMITTEE FINANCIAL EXPERT.
Not applicable to a semi-annual report.
ITEM 4. PRINCIPAL ACCOUNTANT FEES AND SERVICES.
Not applicable to a semi-annual report.
ITEM 5. AUDIT COMMITTEE OF LISTED REGISTRANTS.
Not applicable to a semi-annual report.
ITEM 6. INVESTMENTS.
File Schedule I – Investments in securities of unaffiliated issuers as of the close of the reporting period as set forth in Section 210.12-12 of Regulation S-X, unless the schedule is included as part of the report to shareholders filed under Item 1 of this Form.
Included in Item 1.
ITEM 7. FINANCIAL STATEMENTS AND FINANCIAL HIGHLIGHTS FOR OPEN-END MANAGEMENT INVESTMENT
COMPANIES.
Semi-Annual Financial Statements
J.P. Morgan Exchange-Traded Funds
December 31, 2024 (Unaudited)
| | |
JPMorgan Equity Focus ETF | | The NASDAQ Stock Market® LLC |
CONTENTS
Investments in the Fund are not deposits or obligations of, or guaranteed or endorsed by, any bank and are not insured or guaranteed by the FDIC, the Federal Reserve Board or any other government agency. You could lose money if you sell when the Fund’s share price is lower than when you invested.
Past performance is no guarantee of future performance. The general market views expressed in this report are opinions based on market and other conditions through the end of the reporting period and are subject to change without notice. These views are not intended to predict the future performance of the Fund or the securities markets.
Prospective investors should refer to the Fund's prospectus for a discussion of the Fund's investment objectives, strategies and risks. Call J.P. Morgan Exchange-Traded Funds at (844) 457-6383 for a prospectus containing more complete information about the Fund, including management fees and other expenses. Please read it carefully before investing.
Shares are bought and sold throughout the day on an exchange at market price (not at net asset value) through a brokerage account, and are not individually subscribed and redeemed from the Fund. Shares may only be subscribed and redeemed directly from the Fund by Authorized Participants, in large creation/redemption units. Brokerage commissions will reduce returns.
JPMorgan Equity Focus ETF
SCHEDULE OF PORTFOLIO INVESTMENTSAS OF December 31, 2024 (Unaudited)
| | |
|
|
| | |
|
Regeneron Pharmaceuticals, Inc. * | | |
|
| | |
|
| | |
|
| | |
Construction & Engineering — 1.8% |
| | |
Construction Materials — 1.2% |
Martin Marietta Materials, Inc. | | |
|
Capital One Financial Corp. | | |
Containers & Packaging — 1.5% |
Packaging Corp. of America | | |
Electric Utilities — 2.0% |
| | |
Financial Services — 5.4% |
Berkshire Hathaway, Inc., Class B * | | |
Mastercard, Inc., Class A | | |
| | |
Ground Transportation — 0.8% |
JB Hunt Transport Services, Inc. | | |
Health Care Equipment & Supplies — 1.5% |
Intuitive Surgical, Inc. * | | |
Health Care Providers & Services — 3.3% |
| | |
| | |
| | |
Hotels, Restaurants & Leisure — 3.9% |
| | |
| | |
| | |
Household Products — 2.5% |
Procter & Gamble Co. (The) | | |
Industrial Conglomerates — 2.2% |
Honeywell International, Inc. | | |
| | |
|
|
| | |
Interactive Media & Services — 6.8% |
| | |
Meta Platforms, Inc., Class A | | |
| | |
Life Sciences Tools & Services — 1.2% |
Thermo Fisher Scientific, Inc. | | |
Oil, Gas & Consumable Fuels — 6.1% |
| | |
| | |
| | |
Personal Care Products — 1.9% |
Estee Lauder Cos., Inc. (The), Class A | | |
|
| | |
|
| | |
Semiconductors & Semiconductor Equipment — 11.7% |
| | |
| | |
| | |
| | |
|
| | |
| | |
| | |
Palo Alto Networks, Inc. * | | |
| | |
|
| | |
|
| | |
| | |
| | |
Technology Hardware, Storage & Peripherals — 3.9% |
| | |
Total Common Stocks
(Cost $873,084,975) | | |
SEE NOTES TO FINANCIAL STATEMENTS.
| J.P. Morgan Exchange-Traded Funds | |
JPMorgan Equity Focus ETF
SCHEDULE OF PORTFOLIO INVESTMENTSAS OF December 31, 2024 (Unaudited) (continued)
| | |
Short-Term Investments — 1.5% |
Investment Companies — 1.5% |
JPMorgan Prime Money Market Fund Class IM Shares, 4.54% (a) (b)
(Cost $16,155,256) | | |
Total Investments — 100.0%
(Cost $889,240,231) | | |
Liabilities in Excess of Other Assets — (0.0)% ^ | | |
| | |
Percentages indicated are based on net assets. |
| |
| Real Estate Investment Trust |
| Amount rounds to less than 0.1% of net assets. |
| Non-income producing security. | |
| Investment in an affiliated fund, which is registered under the Investment Company Act of 1940, as amended, and is advised by J.P. Morgan Investment Management Inc. | |
| The rate shown is the current yield as of December 31, 2024. | |
SEE NOTES TO FINANCIAL STATEMENTS.
| J.P. Morgan Exchange-Traded Funds | |
STATEMENT OF ASSETS AND LIABILITIESAS OF December 31, 2024 (Unaudited)
| |
| |
Investments in non-affiliates, at value | |
Investments in affiliates, at value | |
| |
| |
| |
Dividends from non-affiliates | |
Dividends from affiliates | |
| |
| |
| |
| |
Investment securities purchased | |
| |
| |
| |
Custodian and accounting fees | |
| |
| |
| |
| |
| |
Total distributable earnings (loss) | |
| |
Outstanding number of shares
(unlimited number of shares authorized - par value $0.0001) | |
Net asset value, per share | |
Cost of investments in non-affiliates | |
Cost of investments in affiliates | |
SEE NOTES TO FINANCIAL STATEMENTS.
| J.P. Morgan Exchange-Traded Funds | |
STATEMENT OF OPERATIONSFOR THE SIX MONTHS ENDED December 31, 2024 (Unaudited)
| |
| |
Dividend income from non-affiliates | |
Dividend income from affiliates | |
| |
| |
| |
| |
Custodian and accounting fees | |
| |
Trustees’ and Chief Compliance Officer’s fees | |
Printing and mailing costs | |
Registration and filing fees | |
| |
| |
| |
Less expense reimbursements | |
| |
Net investment income (loss) | |
REALIZED/UNREALIZED GAINS (LOSSES): | |
Net realized gain (loss) on transactions from: | |
Investments in non-affiliates | |
Investments in affiliates | |
In-kind redemptions of investments in non-affiliates (See Note 4) | |
| |
Change in net unrealized appreciation/depreciation on: | |
Investments in non-affiliates | |
Investments in affiliates | |
Change in net unrealized appreciation/depreciation | |
Net realized/unrealized gains (losses) | |
Change in net assets resulting from operations | |
SEE NOTES TO FINANCIAL STATEMENTS.
| J.P. Morgan Exchange-Traded Funds | |
STATEMENTS OF CHANGES IN NET ASSETSFOR THE PERIODS INDICATED
| JPMorgan Equity Focus ETF |
| Six Months Ended
December 31, 2024
(Unaudited) | |
CHANGE IN NET ASSETS RESULTING FROM OPERATIONS: | | |
Net investment income (loss) | | |
| | |
Change in net unrealized appreciation/depreciation | | |
Change in net assets resulting from operations | | |
DISTRIBUTIONS TO SHAREHOLDERS: | | |
Total distributions to shareholders | | |
| | |
Change in net assets resulting from capital transactions | | |
| | |
| | |
| | |
| | |
(a)
JPMorgan Equity Focus ETF acquired all of the assets and liabilities of the JPMorgan Equity Focus Fund ("Acquired Fund") in a reorganization that occurred as of the close of business on July 28, 2023. Performance and financial history of the Acquired Fund’s Class R6 Shares have been adopted by JPMorgan Equity Focus ETF and will be used going forward. As a result, the information prior to close of business on July 28, 2023, reflects that of the Acquired Fund's Class R6 Shares. The Acquired Fund ceased operations as of the date of the reorganization. See Note 1.
SEE NOTES TO FINANCIAL STATEMENTS.
| J.P. Morgan Exchange-Traded Funds | |
STATEMENTS OF CHANGES IN NET ASSETSFOR THE PERIODS INDICATED (continued)
| JPMorgan Equity Focus ETF |
| Six Months Ended December 31, 2024
(Unaudited) | |
CAPITAL TRANSACTIONS: (b) | | |
Proceeds from shares issued | | |
| | |
Change in net assets resulting from capital transactions | | |
| | |
Proceeds from shares issued | | |
| | |
Change in net assets resulting from Class A capital transactions | | |
| | |
Proceeds from shares issued | | |
| | |
Change in net assets resulting from Class C capital transactions | | |
| | |
Proceeds from shares issued | | |
| | |
Change in net assets resulting from Class I capital transactions | | |
Total change in net assets resulting from capital transactions | | |
(a)
JPMorgan Equity Focus ETF acquired all of the assets and liabilities of the JPMorgan Equity Focus Fund ("Acquired Fund") in a reorganization that occurred as of the close of business on July 28, 2023. Performance and financial history of the Acquired Fund’s Class R6 Shares have been adopted by JPMorgan Equity Focus ETF and will be used going forward. As a result, the information prior to close of business on July 28, 2023, reflects that of the Acquired Fund's Class R6 Shares. The Acquired Fund ceased operations as of the date of the reorganization. See Note 1.
(b)
Reflects reorganization from the Acquired Fund on July 28, 2023. See Note 1.
SEE NOTES TO FINANCIAL STATEMENTS.
| J.P. Morgan Exchange-Traded Funds | |
| JPMorgan Equity Focus ETF |
| Six Months Ended December 31, 2024 (Unaudited) | |
| | |
| | |
| | |
| | |
| | |
| | |
| | |
| | |
| | |
| | |
| | |
| | |
| | |
| | |
| | |
| | |
(a)
JPMorgan Equity Focus ETF acquired all of the assets and liabilities of the JPMorgan Equity Focus Fund ("Acquired Fund") in a reorganization that occurred as of the close of business on July 28, 2023. Performance and financial history of the Acquired Fund’s Class R6 Shares have been adopted by JPMorgan Equity Focus ETF and will be used going forward. As a result, the information prior to close of business on July 28, 2023, reflects that of the Acquired Fund's Class R6 Shares. The Acquired Fund ceased operations as of the date of the reorganization. See Note 1.
(b)
Reflects reorganization from the Acquired Fund on July 28, 2023. See Note 1.
SEE NOTES TO FINANCIAL STATEMENTS.
| J.P. Morgan Exchange-Traded Funds | |
FINANCIAL HIGHLIGHTSFOR THE PERIODS INDICATED
| Per share operating performance (a) |
| | | |
| Net asset
value,
beginning
of period | Net
investment
income
(loss) (c) | Net realized
and unrealized
gains
(losses)
on investments | Total from
investment
operations | | | |
JPMorgan Equity Focus ETF (h) | | | | | | | |
Six Months Ended December 31, 2024 (Unaudited) | | | | | | | |
| | | | | | | |
| | | | | | | |
| | | | | | | |
| | | | | | | |
| | | | | | | |
|
| Per share amounts reflect the conversion of the Predecessor Fund into the Fund as of the close of business on July 28, 2023. See Note 1. |
| Annualized for periods less than one year, unless otherwise noted. |
| Calculated based upon average shares outstanding. |
| Not annualized for periods less than one year. |
| Includes adjustments in accordance with accounting principles generally accepted in the United States of America and as such, the net asset values for financial reporting purposes and the returns based upon those net asset values may differ from the net asset values and returns for shareholder transactions. |
| JPMorgan Equity Focus ETF acquired all of the assets and liabilities of the JPMorgan Equity Focus Fund (“Predecessor Fund”) in a reorganization that occurred as of the close of business on July 28, 2023. Market price returns are calculated using the official closing price of the JPMorgan Equity Focus ETF on the listing exchange as of the time that the JPMorgan Equity Focus ETF's NAV is calculated. Prior to the JPMorgan Equity Focus ETF's listing on July 31, 2023, the NAV performance of the Class R6 Shares of the Predecessor Fund are used as proxy market price returns. |
| Includes interest expense, if applicable, which is less than 0.005% unless otherwise noted. |
| JPMorgan Equity Focus ETF (the “Fund”) acquired all of the assets and liabilities of the JPMorgan Equity Focus Fund (“Predecessor Fund”) in a reorganization that occurred as of the close of business on July 28, 2023. Performance and financial history of the Predecessor Fund’s Class R6 Shares have been adopted by the Fund and will be used going forward. As a result, the financial highlight information reflects that of the Predecessor Fund’s Class R6 Shares for the period July 1, 2019 up through the reorganization. |
SEE NOTES TO FINANCIAL STATEMENTS.
| J.P. Morgan Exchange-Traded Funds | |
| |
| | | | | Ratios to average net assets (b) | |
Net asset
value,
end of
period | | | Market
price
total
return (d)(f) | | | Net
investment
income
(loss) | Expenses
without waivers
and reimbursements | Portfolio
turnover
rate (d) |
| | | | | | | | |
| | | | | | | | |
| | | | | | | | |
| | | | | | | | |
| | | | | | | | |
| | | | | | | | |
| | | | | | | | |
SEE NOTES TO FINANCIAL STATEMENTS.
| J.P. Morgan Exchange-Traded Funds | |
NOTES TO FINANCIAL STATEMENTSAS OF December 31, 2024 (Unaudited)
1. Organization
J.P. Morgan Exchange-Traded Fund Trust (the “Trust”) was formed on February 25, 2010, and is governed by a Declaration of Trust as amended and restated February 19, 2014, and is registered under the Investment Company Act of 1940, as amended (the “1940 Act”), as an open-end management investment company. JPMorgan Equity Focus ETF (the “Fund”) is a separate diversified series of the Trust covered in this report.
As of the close of business on July 28, 2023 (the "Closing Date"), pursuant to an Agreement and Plan of Reorganization and Liquidation previously approved by the Board of Trustees of the Trust (the “Board”), JPMorgan Equity Focus Fund (a mutual fund) (the “Acquired Fund” or “Equity Focus Fund”), a series of JPMorgan Trust I, was reorganized (the "Reorganization") into the Fund, a newly created exchange-traded fund. Following the Reorganization, the Acquired Fund’s performance (Class R6 Shares) and financial history were adopted by the Fund. In connection with the Reorganization, each shareholder of the Acquired Fund (except as noted below) received shares of the Fund equal in value to the number of shares of the Acquired Fund they owned on the Closing Date, including a cash payment in lieu of fractional shares of the Fund, which cash payment might have been taxable. Shareholders of the Acquired Fund who did not hold their shares through a brokerage account that could accept shares of the Fund on the Closing Date had their Acquired Fund shares liquidated, and such shareholders received cash equal in value to their Acquired Fund shares, which cash payment might have been taxable. Shareholders of the Acquired Fund who held their shares through a fund direct individual retirement account and did not take action prior to the Reorganization had their Acquired Fund shares exchanged for Morgan Shares of JPMorgan U.S. Government Money Market Fund equal in value to their Acquired Fund shares. The Fund has the same investment adviser, investment objective and fundamental investment policies and substantially similar investment strategies as the Acquired Fund. Effective as of the close of business on the Closing Date, the Acquired Fund ceased operations in connection with the consummation of the Reorganization.
J.P. Morgan Investment Management Inc. (“JPMIM”), an indirect, wholly-owned subsidiary of JPMorgan Chase & Co. (“JPMorgan”), acts as adviser (the “Adviser”) and administrator (the “Administrator”) to the Fund.
Costs incurred by the Fund and the Acquired Fund associated with the Reorganization (including the legal costs associated with the Reorganization) were borne by the Adviser by waiving fees or reimbursing expenses to offset the costs incurred by the Fund and Acquired Fund associated with the Reorganization, including any brokerage fees and expenses incurred by the Fund and Acquired Fund related to the disposition and acquisition of assets as part of a Reorganization. Brokerage fees and expenses related to the disposition and acquisition of assets (including any disposition to raise cash to pay redemption proceeds) that were incurred in the ordinary course of business were borne by the Fund and the Acquired Fund. The management fee of the Fund is the same as the management fee of the Acquired Fund. The total annual fund operating expenses of the Fund are expected to be lower than the net expenses of each share class of the Acquired Fund after taking into consideration the expense limitation agreement the Adviser has entered into with the Fund for a term ending on July 31, 2026. The Reorganization did not result in the material change to the Acquired Fund's portfolio holdings. There are no material differences in accounting policies of the Acquired Fund as compared to those of the Fund.
The Fund did not purchase or sell securities following the Reorganization for purposes of realigning its investment portfolio. Accordingly, the Reorganization of the Acquired Fund did not affect the Fund’s portfolio turnover ratio for the year ended June 30, 2024.
The investment objective of the Fund is to seek long term capital appreciation.
Shares of the Fund are listed and traded at market price on The NASDAQ Stock Market® LLC. Market prices for the Fund’s shares may be different from its net asset value (“NAV”). The Fund issues and redeems its shares on a continuous basis, through JPMorgan Distribution Services, Inc. (the “Distributor” or “JPMDS”), an indirect, wholly-owned subsidiary of JPMorgan, at NAV in large blocks of shares, referred to as “Creation Units". Creation Units are issued and redeemed in exchange for a basket of securities and/or cash. Shares are generally traded in the secondary market in amounts less than a Creation Unit at market prices that change throughout the day. Only individuals or institutions that have entered into an authorized participant agreement with the Distributor may do business directly with the Fund (each, an “Authorized Participant”).
2. Significant Accounting Policies
The following is a summary of significant accounting policies followed by the Fund in the preparation of its financial statements. The Fund is an investment company and, accordingly, follows the investment company accounting and reporting guidance of the Financial Accounting Standards Board (“FASB”) Accounting Standards Codification Topic 946 — Investment Companies, which is part of U.S. generally accepted accounting principles (“GAAP”). The preparation of financial statements in conformity with GAAP requires management to make estimates and assumptions that affect (i) the reported amounts of assets and liabilities, (ii) disclosure of contingent assets and liabilities at the date of the financial statements, and (iii) the reported amounts of increases and decreases in net assets from operations during the reporting period. Actual results could differ from those estimates.
A. Valuation of Investments— Investments are valued in accordance with GAAP and the Fund's valuation policies set forth by, and under the supervision and responsibility of, the Board, which established the following approach to valuation, as described more fully below: (i) investments for which market quotations are readily available shall be valued at their market value and (ii) all other investments for which market quotations are not readily available shall be valued at their fair value as determined in good faith by the Board.
Under Section 2(a)(41) of the 1940 Act, the Board is required to determine fair value for securities that do not have readily available market quotations. Under Securities and Exchange Commission (“SEC”) Rule 2a-5 (Good Faith Determinations of Fair Value), the Board may designate the performance of these fair valuation determinations to a valuation designee. The Board has designated the Adviser as the “Valuation Designee” to
| J.P. Morgan Exchange-Traded Funds | |
perform fair valuation determinations for the Fund on behalf of the Board subject to appropriate oversight by the Board. The Adviser, as Valuation Designee, leverages the J.P. Morgan Asset Management Americas Valuation Committee (“AVC”) to help oversee and carry out the policies for the valuation of investments held in the Fund. The Adviser, as Valuation Designee, remains responsible for the valuation determinations.
This oversight by the AVC includes monitoring the appropriateness of fair values based on results of ongoing valuation oversight including, but not limited to, consideration of macro or security specific events, market events, and pricing vendor and broker due diligence. The Administrator is responsible for discussing and assessing the potential impacts to the fair values on an ongoing basis, and, at least on a quarterly basis, with the AVC and the Board.
Equities and other exchange-traded instruments are valued at the last sale price or official market closing price on the primary exchange on which the instrument is traded before the NAV of the Fund is calculated on a valuation date.
Investments in open-end investment companies (“Underlying Funds”) are valued at each Underlying Fund’s NAV per share as of the report date.
Valuations reflected in this report are as of the report date. As a result, changes in valuation due to market events and/or issuer-related events after the report date and prior to issuance of the report are not reflected herein.
The various inputs that are used in determining the valuation of the Fund's investments are summarized into the three broad levels listed below.
•
Level 1 — Unadjusted inputs using quoted prices in active markets for identical investments.
•
Level 2 — Other significant observable inputs including, but not limited to, quoted prices for similar investments, inputs other than quoted prices that are observable for investments (such as interest rates, prepayment speeds, credit risk, etc.) or other market corroborated inputs.
•
Level 3 — Significant inputs based on the best information available in the circumstances, to the extent observable inputs are not available (including the Fund's assumptions in determining the fair value of investments).
A financial instrument’s level within the fair value hierarchy is based on the lowest level of any input, both individually and in the aggregate, that is significant to the fair value measurement. The inputs or methodology used for valuing instruments are not necessarily an indication of the risk associated with investing in those instruments.
The following table represents each valuation input as presented on the Schedule of Portfolio Investments ("SOI"):
| | | | |
| | Level 2
Other significant
observable inputs | Level 3
Significant
unobservable inputs | |
Total Investments in Securities (a) | | | | |
|
| Please refer to the SOI for specifics of portfolio holdings. |
B. Restricted Securities— Certain securities held by the Fund may be subject to legal or contractual restrictions on resale. Restricted securities generally are resold in transactions exempt from registration under the Securities Act of 1933, as amended (the “Securities Act”). Disposal of these securities may involve time-consuming negotiations and expense. Prompt sale at the current valuation may be difficult and could adversely affect the NAV of the Fund.
As of December 31, 2024, the Fund had no investments in restricted securities including securities sold to the Fund under Rule 144A and/or Regulation S under the Securities Act.
C. Securities Lending — The Fund is authorized to engage in securities lending in order to generate additional income. The Fund is able to lend to approved borrowers. Citibank N.A. (“Citibank”) serves as lending agent for the Fund, pursuant to a Securities Lending Agency Agreement (the “Securities Lending Agency Agreement”). Securities loaned are collateralized by cash equal to at least 100% of the market value plus accrued interest on the securities lent, which is invested in the Class IM Shares of the JPMorgan U.S. Government Money Market Fund and the Agency SL Class Shares of the JPMorgan Securities Lending Money Market Fund. The Fund retains the interest earned on cash collateral investments but is required to pay the borrower a rebate for the use of the cash collateral. In cases where the lent security is of high value to borrowers, there may be a negative rebate (i.e., a net payment from the borrower to the Fund). Upon termination of a loan, the Fund is required to return to the borrower an amount equal to the cash collateral, plus any rebate owed to the borrowers. The remaining maturities of the securities lending transactions are considered overnight and continuous. Loans are subject to termination by the Fund or the borrower at any time.
The net income earned on the securities lending (after payment of rebates and Citibank’s fee) is included on the Statement of Operations as Income from securities lending (net). The Fund also receives payments from the borrower during the period of the loan, equivalent to dividends and interest earned on the securities loaned, which are recorded as Dividend or Interest income, respectively, on the Statement of Operations.
Under the Securities Lending Agency Agreement, Citibank marks to market the loaned securities on a daily basis. In the event the cash received from the borrower is less than 102% of the value of the loaned securities (105% for loans of non-U.S. securities), Citibank requests additional cash from
| J.P. Morgan Exchange-Traded Funds | |
NOTES TO FINANCIAL STATEMENTSAS OF December 31, 2024 (Unaudited) (continued)
the borrower so as to maintain a collateralization level of at least 102% of the value of the loaned securities plus accrued interest (105% for loans of non-U.S. securities), subject to certain de minimis amounts.
The value of securities out on loan is recorded as an asset on the Statement of Assets and Liabilities. The value of the cash collateral received is recorded as a liability on the Statement of Assets and Liabilities and details of collateral investments are disclosed on the SOI.
The Fund bears the risk of loss associated with the collateral investments and is not entitled to additional collateral from the borrower to cover any such losses. To the extent that the value of the collateral investments declines below the amount owed to a borrower, the Fund may incur losses that exceed the amount it earned on lending the security. Upon termination of a loan, the Fund may use leverage (borrow money) to repay the borrower for cash collateral posted if the Adviser does not believe that it is prudent to sell the collateral investments to fund the payment of this liability. Securities lending activity is subject to master netting arrangements.
Securities lending also involves counterparty risks, including the risk that the loaned securities may not be returned in a timely manner or at all. Subject to certain conditions, Citibank has agreed to indemnify the Fund from losses resulting from a borrower’s failure to return a loaned security.
The Fund did not lend out any securities during the six months ended December 31, 2024.
D. Investment Transactions with Affiliates— The Fund invested in an Underlying Fund advised by the Adviser. An issuer which is under common control with the Fund may be considered an affiliate. For the purposes of the financial statements, the Fund assumes the issuer listed in the table below to be an affiliated issuer. The Underlying Fund's distributions may be reinvested into the Underlying Fund. Reinvestment amounts are included in the purchases at cost amounts in the table below.
|
For the six months ended December 31, 2024 |
| | | | | Change in
Unrealized
Appreciation/
(Depreciation) | | Shares at
December 31,
2024 | | Capital Gain
Distributions |
JPMorgan Prime Money Market Fund Class IM Shares, 4.54% (a) (b) | | | | | | | | | |
|
| Investment in an affiliated fund, which is registered under the Investment Company Act of 1940, as amended, and is advised by J.P. Morgan Investment Management Inc. |
| The rate shown is the current yield as of December 31, 2024. |
E. Security Transactions and Investment Income— Investment transactions are accounted for on the trade date (the date the order to buy or sell is executed). Securities gains and losses are calculated on a specifically identified cost basis.
Dividend income, net of foreign taxes withheld, if any, is recorded on the ex-dividend date or when the Fund first learns of the dividend.
To the extent such information is publicly available, the Fund records distributions received in excess of income earned from underlying investments as a reduction of cost of investments and/or realized gain. Such amounts are based on estimates if actual amounts are not available and actual amounts of income, realized gain and return of capital may differ from the estimated amounts. The Fund adjusts the estimated amounts of the components of distributions (and consequently its net investment income) as necessary, once the issuers provide information about the actual composition of the distributions.
| J.P. Morgan Exchange-Traded Funds | |
F. Allocation of Income and Expenses— Expenses directly attributable to the Fund are charged directly to the Fund, while the expenses attributable to more than one fund of the Trust are allocated among the applicable funds.
G. Federal Income Taxes— The Fund is treated as a separate taxable entity for Federal income tax purposes. The Fund's policy is to comply with the provisions of the Internal Revenue Code (the “Code”) applicable to regulated investment companies and to distribute to shareholders all of its distributable net investment income and net realized capital gains on investments. Accordingly, no provision for Federal income tax is necessary. Management has reviewed the Fund's tax positions for all open tax years and has determined that as of December 31, 2024, no liability for Federal income tax is required in the Fund's financial statements for net unrecognized tax benefits. However, management’s conclusions may be subject to future review based on changes in, or the interpretation of, the accounting standards or tax laws and regulations. The Fund's Federal tax returns for the prior three fiscal years remain subject to examination by the Internal Revenue Service.
H. Distributions to Shareholders— Distributions from net investment income, if any, are generally declared and paid at least annually. Net realized capital gains, if any, are distributed at least annually. The amount of distributions from net investment income and net realized capital gains is determined in accordance with Federal income tax regulations, which may differ from GAAP. To the extent these “book/tax” differences are permanent in nature (i.e., that they result from other than timing of recognition — “temporary differences”), such amounts are reclassified within the capital accounts based on their Federal tax basis treatment.
3. Fees and Other Transactions with Affiliates
A. Investment Advisory Fee— Pursuant to an Investment Advisory Agreement, the Adviser manages the investments of the Fund and for such services is paid a fee. The investment advisory fee is accrued daily and paid monthly at an annual rate of 0.50% of the Fund's average daily net assets.
B. Administration Fee— Pursuant to an Administration Agreement, the Administrator provides certain administration services to the Fund. In consideration of these services, the Administrator receives a fee accrued daily and paid monthly at an annual rate of 0.075% of the first $10 billion of the Fund's average daily net assets, plus 0.050% of the Fund's average daily net assets between $10 billion and $20 billion, plus 0.025% of the Fund's average daily net assets between $20 billion and $25 billion, plus 0.010% of the Fund's average daily net assets in excess of $25 billion. For the six months ended December 31, 2024, the effective annualized rate was 0.075% of the Fund's average daily net assets, notwithstanding any fee waivers and/or expense reimbursements.
The Administrator waived administration fees as outlined in Note 3.E.
JPMorgan Chase Bank, N.A. (“JPMCB”), a wholly-owned subsidiary of JPMorgan, serves as the Fund's sub-administrator (the “Sub-administrator”). For its services as Sub-administrator, JPMCB receives a portion of the administration fees payable to JPMIM.
C. Custodian, Accounting and Transfer Agent Fees— JPMCB provides portfolio custody, accounting and transfer agency services (effective as of the Closing Date) to the Fund. For performing these services, the Fund pays JPMCB transaction and asset-based fees that vary according to the number of transactions and positions, plus out-of-pocket expenses. The amounts paid directly to JPMCB by the Fund for custody and accounting services are included in Custodian and accounting fees on the Statement of Operations. The amounts paid directly to JPMCB by the Fund for transfer agency services are included in Transfer agency fees on the Statement of Operations.
Additionally, Authorized Participants generally pay transaction fees associated with the creation and redemption of Fund shares. These fees are used to offset certain custodian charges incurred by the Fund for these transactions.
Interest income earned on cash balances at the custodian, if any, is included in Interest income from affiliates on the Statement of Operations.
Interest expense paid to the custodian related to cash overdrafts, if any, is included in Interest expense to affiliates on the Statement of Operations.
D. Distribution Services— The Distributor or its agent distributes Creation Units for the Fund on an agency basis. The Distributor does not maintain a secondary market in shares of the Fund. JPMDS receives no fees for their distribution services under the distribution agreement with the Trust (the “Distribution Agreement”). Although the Trust does not pay any fees under the Distribution Agreement, JPMIM pays JPMDS for certain distribution related services.
E. Waivers and Reimbursements—The Adviser, Administrator and/or JPMDS had contractually agreed to waive fees and/or reimburse the Fund to the extent that total annual operating expenses (excluding acquired fund fees and expenses other than certain money market fund fees as described below, dividend and interest expenses related to short sales, interest, taxes, expenses related to litigation and potential litigation, expenses related to trustee elections and extraordinary expenses) exceed 0.50% of the Fund's average daily net assets.
The expense limitation agreement was in effect for the six months ended December 31, 2024, and the contractual expense limitation is in place until at least July 31, 2026.
| J.P. Morgan Exchange-Traded Funds | |
NOTES TO FINANCIAL STATEMENTSAS OF December 31, 2024 (Unaudited) (continued)
For the six months ended December 31, 2024, the Fund's service providers waived fees and/or reimbursed expenses for the Fund as follows. None of these parties expect the Fund to repay any such waived fees and/or reimbursed expenses in future years.
| |
| Contractual
Reimbursements |
| |
Additionally, the Fund may invest in one or more money market funds advised by the Adviser (affiliated money market funds). The Adviser, Administrator and/or JPMDS, as shareholder servicing agent, have contractually agreed to waive fees and/or reimburse expenses in an amount sufficient to offset the respective net fees each collects from the affiliated money market fund on the Fund’s investment in such affiliated money market fund, except for investments of securities lending cash collateral. None of these parties expect the Fund to repay any such waived fees and/ or reimbursed expenses in future years.
The amount of these waivers resulting from investments in these money market funds for the six months ended December 31, 2024 was $8,266.
F. Other— Certain officers of the Trust are affiliated with the Adviser, the Administrator and JPMDS. Such officers, with the exception of the Chief Compliance Officer, receive no compensation from the Fund for serving in their respective roles.
The Board designated and appointed a Chief Compliance Officer to the Fund pursuant to Rule 38a-1 under the 1940 Act. The Fund, along with certain other affiliated funds, makes reimbursement payments, on a pro-rata basis, to the Administrator for a portion of the fees associated with the office of the Chief Compliance Officer. Such fees are included in Trustees’ and Chief Compliance Officer’s fees on the Statement of Operations.
The Trust adopted a Trustee Deferred Compensation Plan (the “Plan”) which allows the independent Trustees to defer the receipt of all or a portion of compensation related to performance of their duties as Trustees. The deferred fees are invested in various J.P. Morgan Funds until distribution in accordance with the Plan.
The SEC has granted an exemptive order permitting the Fund to engage in principal transactions with J.P. Morgan Securities LLC, an affiliated broker, involving taxable money market instruments, subject to certain conditions.
4. Investment Transactions
During the six months ended December 31, 2024, purchases and sales of investments (excluding short-term investments) were as follows:
| Purchases
(excluding
U.S. Government) | Sales
(excluding
U.S. Government) |
| | |
During the six months ended December 31, 2024, there were no purchases or sales of U.S. Government securities.
For the six months ended December 31, 2024, in-kind transactions associated with creations and redemptions were as follows:
During the six months ended December 31, 2024, the Fund delivered portfolio securities for the redemption of Fund shares (in-kind redemptions). Cash and portfolio securities were transferred for redemptions at fair value. For financial reporting purposes, the Fund recorded net realized gains and losses in connection with each in-kind redemption transaction.
5. Federal Income Tax Matters
For Federal income tax purposes, the estimated cost and unrealized appreciation (depreciation) in value of investments held at December 31, 2024 were as follows:
| | Gross
Unrealized
Appreciation | Gross
Unrealized
Depreciation | Net Unrealized
Appreciation
(Depreciation) |
| | | | |
| J.P. Morgan Exchange-Traded Funds | |
At June 30, 2024, the Fund had net capital loss carryforwards, which are available to offset future realized gains:
| Capital Loss Carryforward Character |
| |
| |
During the year ended June 30, 2024, the Fund utilized capital loss carryforwards as follows:
6. Capital Share Transactions
The Trust issues and redeems shares of the Fund only in Creation Units through the Distributor at NAV. Capital shares transactions detail can be found in the Statements of Changes in Net Assets.
Shares of the Fund may only be purchased or redeemed by Authorized Participants. Such Authorized Participants may from time to time hold, of record or beneficially, a substantial percentage of the Fund's shares outstanding and act as executing or clearing broker for investment transactions on behalf of the Fund. An Authorized Participant is either (1) a “Participating Party” or other participant in the clearing process through the Continuous Net Settlement System of the National Securities Clearing Corporation (“NSCC”); or (2) a DTC Participant; which, in either case, must have executed an agreement with the Distributor.
Creation Units of the Fund may be created in advance of receipt by the Trust of all or a portion of the applicable basket of equity securities and other instruments (“Deposit Instruments”) and cash as described in the Fund's registration statement. In these instances, the initial Deposit Instruments and cash must be deposited in an amount equal to the sum of the cash amount, plus at least 105% for the Fund of the market value of undelivered Deposit Instruments. A transaction fee may be imposed to offset transfer and other transaction costs associated with the purchase or redemption of Creation Units.
Effective November 1, 2022, the Fund relies upon an exemptive order granted by the SEC (the “Order”) permitting the establishment and operation of an Interfund Lending Facility (the “Facility”). The Facility allows the Fund to directly lend and borrow money to or from any other fund relying upon the Order at rates beneficial to both the borrowing and lending funds. Advances under the Facility are taken primarily for temporary or emergency purposes, including the meeting of redemption requests that otherwise might require the untimely disposition of securities, and are subject to the Fund's borrowing restrictions. The interfund loan rate is determined, as specified in the Order, by averaging the current repurchase agreement rate and the current bank loan rate. The Order was granted to JPMorgan Trust II and may be relied upon by the Fund because the Fund and the series of JPMorgan Trust II are all investment companies in the same “group of investment companies” (as defined in Section 12(d)(1)(G) of the 1940 Act).
The Fund had no borrowings outstanding from another fund, or loans outstanding to another fund, during the six months ended December 31, 2024.
The Trust and JPMCB have entered into a financing arrangement. Under this arrangement, JPMCB provides an unsecured, uncommitted credit facility in the aggregate amount of $100 million to certain of the J.P. Morgan Funds, including the Fund. Advances under the arrangement are taken primarily for temporary or emergency purposes, including the meeting of redemption requests that otherwise might require the untimely disposition of securities, and are subject to the Fund's borrowing restrictions. Interest on borrowings is payable at a rate determined by JPMCB at the time of borrowing. This agreement has been extended until October 28, 2025.
The Fund had no borrowings outstanding from the unsecured, uncommitted credit facility during the six months ended December 31, 2024.
8. Risks, Concentrations and Indemnifications
In the normal course of business, the Fund enters into contracts that contain a variety of representations which provide general indemnifications. The Fund's maximum exposure under these arrangements is unknown. The amount of exposure would depend on future claims that may be brought against the Fund. However, based on experience, the Fund expects the risk of loss to be remote.
Disruptions to creations and redemptions, the existence of significant market volatility or potential lack of an active trading market for the shares (including through a trading halt), as well as other factors, may result in shares trading significantly above (at a premium) or below (at a discount) to the NAV or to the intraday value of the Fund's holdings. During such periods, investors may incur significant losses if shares are sold.
The Fund is subject to infectious disease epidemics/pandemics risk. The effects of any future pandemic or other global event to public health and business and market conditions may have a significant negative impact on the performance of the Fund's investments, increase the Fund's volatility,
| J.P. Morgan Exchange-Traded Funds | |
NOTES TO FINANCIAL STATEMENTSAS OF December 31, 2024 (Unaudited) (continued)
exacerbate pre-existing political, social and economic risks to the Fund, and negatively impact broad segments of businesses and populations. In addition, governments, their regulatory agencies, or self-regulatory organizations have taken or may take actions in response to a pandemic or other global event that affect the instruments in which the Fund invests, or the issuers of such instruments, in ways that could have a significant negative impact on the Fund's investment performance. The ultimate impact of any pandemic or other global event and the extent to which the associated conditions and governmental responses impact the Fund will also depend on future developments, which are highly uncertain, difficult to accurately predict and subject to frequent changes.
| J.P. Morgan Exchange-Traded Funds | |
J.P. Morgan Exchange-Traded Funds are distributed by JPMorgan Distribution Services, Inc., an indirect, wholly-owned subsidiary of JPMorgan Chase & Co. Affiliates of JPMorgan Chase & Co. receive fees for providing various services to the Funds.
Contact J.P. Morgan Exchange-Traded Funds at 1-844-457-6383 (844-4JPM ETF) for a fund prospectus. You can also visit us at www.jpmorganfunds.com. Investors should carefully consider the investment objectives and risks as well as charges and expenses of the fund before investing. The prospectus contains this and other information about the fund. Read the prospectus carefully before investing.
Investors may obtain information about the Securities Investor Protection Corporation (SIPC), including the SIPC brochure, by visiting www.sipc.org or by calling SIPC at 202-371-8300.
J.P. Morgan Asset Management is the brand name for the asset management business of JPMorgan Chase & Co. and its affiliates worldwide.
© JPMorgan Chase & Co., 2024. All rights reserved. December 2024.
SAN-CONV-ETF-1224
Changes in and Disagreements with Accountants for Open-End Management Investment Companies
Proxy Disclosures for Open-End Management Investment Companies
Remuneration Paid to Directors, Officers, and Others of Open-End Management Investment Companies
Included in the Statement of Operations within the Fund's Financial Statements.
Statement Regarding Basis for Approval of Investment Advisory Agreement
The Board of Trustees (the “Board” or the “Trustees”) has established various standing committees composed of Trustees with diverse backgrounds, to which the Board has assigned specific subject matter responsibilities to further enhance the effectiveness of the Board’s oversight and decision making. The Board and its investment committees (Money Market and Alternative Products Committee, Equity Committee, and Fixed Income Committee) met regularly throughout the year and, at each meeting, considered factors that are relevant to their annual consideration of the continuation of the investment advisory agreements. The Board also met for the specific purpose of considering investment advisory agreement annual renewals. The Board held meetings June 25-26, 2024 and August 20-22, 2024, at which the Trustees considered the continuation of the investment advisory agreement for the Fund whose annual report is contained herein (the “Advisory Agreement” ). At the June meeting, the Board’s investment committees met to review and consider performance, expense and related information for the J.P. Morgan Funds. Each investment committee reported to the full Board, which then considered each investment committee’s preliminary findings. At the August meeting, the Trustees continued their review and consideration. The Trustees, including a majority of the Trustees who are not parties to the Advisory Agreement or “interested persons” (as defined in the Investment Company Act of 1940) of any party to the Advisory Agreement or any of their affiliates, approved the continuation of the Advisory Agreement on August 22, 2024.
As part of their review of the Advisory Agreement, the Trustees considered and reviewed performance and other information about the Fund received from J.P. Morgan Investment Management Inc. (the “Adviser”). This information included the Fund’s performance as compared to the performance of its peers and benchmark, and analyses by the Adviser of the Fund’s performance. In addition, at each of their regular meetings throughout the year, the Trustees considered reports on the performance of certain J.P. Morgan Funds provided by an independent investment consulting firm (the “independent consultant”). In addition, in preparation for the June and August meetings, the Trustees requested, received and evaluated extensive materials from the Adviser, including performance and expense information compiled by Broadridge, using data from Lipper Inc. and/or Morningstar, Inc., independent providers of investment company data (together, “Broadridge”). The Trustees’ independent consultant also provided additional quantitative and statistical analyses of certain Funds, including risk and performance return assessments as compared to the Fund’s objectives, benchmarks, and peers. Before voting on the Advisory Agreement, the Trustees reviewed the Advisory Agreement with representatives of the Adviser, counsel to the Fund, and independent legal counsel to the Trustees, and
received a memorandum from independent legal counsel to the Trustees discussing the legal standards for their consideration of the Advisory Agreement. The Trustees also discussed the Advisory Agreement with independent legal counsel in executive sessions at which no representatives of the Adviser were present.
A summary of the material factors evaluated by the Trustees in determining whether to approve the Advisory Agreement is provided below. Each Trustee attributed different weights to the various factors and no factor alone was considered determinative. The Trustees considered information provided with respect to the Fund throughout the year, as well as materials furnished specifically in connection with the annual review process. From year to year, the Trustees consider and place emphasis on relevant information in light of changing circumstances in market and economic conditions.
After considering and weighing the factors and information they had received, the Trustees found that the compensation to be received by the Adviser from the Fund under the Advisory Agreement was fair and reasonable under the circumstances, and determined that the continuance of the Advisory Agreement was in the best interests of the Fund and its shareholders.
Nature, Extent and Quality of Services Provided by the Adviser
The Trustees received and considered information regarding the nature, extent and quality of services provided to the Fund under its Advisory Agreement. The Trustees took into account information furnished throughout the year at Trustee meetings, as well as the materials furnished specifically in connection with this annual review process. Among other things, the Trustees considered:
•
The background and experience of the Adviser’s senior management and investment personnel, including personnel changes, if any;
•
The qualifications, backgrounds and responsibilities of the portfolio management team primarily responsible for the day-to-day management of the Fund, including personnel changes, if any;
•
The investment strategy for the Fund, and the infrastructure supporting the portfolio management team;
•
Information about the structure and distribution strategy for the Fund and how it fits within the Adviser’s other fund offerings within the J.P. Morgan Funds complex;
•
The administration services provided by the Adviser in its role as Administrator;
•
Their knowledge of the nature and quality of the services
provided by the Adviser and its affiliates gained from their experience as Trustees of the Fund and in the financial industry generally;
•
The overall reputation and capabilities of the Adviser and its affiliates;
•
The commitment of the Adviser to provide high quality service to the Fund;
•
Their overall confidence in the Adviser’s integrity; and
•
The Adviser’s responsiveness to requests for additional information, questions or concerns raised by them, including the Adviser’s willingness to consider and implement organizational and operational changes designed to improve investment results and the services provided to the Fund.
•
Based upon these considerations and other factors, the Trustees concluded that they were satisfied with the nature, extent and quality of the services provided to the Fund by the Adviser.
Costs of Services Provided and Profitability to the Adviser and its Affiliates
The Trustees received and considered information regarding the profitability to the Adviser and its affiliates from providing services to the Fund. The Trustees reviewed and discussed this information. The Trustees recognized that this information is not audited and represents the Adviser’s determination of its and its affiliates’ revenues from the contractual services provided to the Fund, less expenses of providing such services. Expenses include direct and indirect costs and are calculated using an allocation methodology developed by the Adviser and reviewed with the Board. The Trustees also recognized that it is difficult to make comparisons of profitability from fund investment advisory contracts because comparative information is not generally publicly available and is affected by numerous factors, including the structure of the particular adviser, the types of funds it manages, its business mix, numerous assumptions regarding allocations and the fact that publicly-traded fund managers’ operating profits and net income are net of distribution and marketing expenses. Based upon their review, and taking into consideration the factors noted above, the Trustees concluded that the profitability to the Adviser under the Advisory Agreement was not unreasonable in light of the services and benefits provided to the Fund.
The Trustees also considered that the Adviser earns fees from the Fund for providing administration services. These fees were shown separately in the profitability analysis presented to the Trustees. The Trustees also considered the fees earned by JPMorgan Chase Bank, N.A. (“JPMCB”), an affiliate of the Adviser, for custody, fund accounting and other related services for the Fund, and the profitability of the arrangements to JPMCB.
Fall-Out Benefits
The Trustees reviewed information regarding potential “fall-out” or ancillary benefits received by the Adviser and its affiliates as a result of their relationship with the Fund. The Trustees considered that the J.P. Morgan Funds' operating accounts are held at JPMCB, which, as a result, will receive float benefits for certain J.P. Morgan Funds, as applicable. The Trustees also noted that the Adviser supports a diverse set of products and services, which benefits the Adviser by allowing it to leverage its infrastructure to serve additional clients, including benefits that may be received by the Adviser and its affiliates in connection with the Fund’s potential investments in other funds advised by the Adviser. The Trustees also reviewed the Adviser’s allocation of fund brokerage for the J.P. Morgan Funds complex, including allocations to brokers who provide research to the Adviser, as well as the Adviser’s use of affiliates to provide other services and the benefits to such affiliates of doing so. The Trustees also considered the benefit to the Adviser and its affiliates from allocating client assets to the Fund.
The Trustees considered the extent to which the Fund may benefit from potential economies of scale. The Trustees considered that there may not be a direct relationship between economies of scale realized by the Fund and those realized by the Adviser as assets increase. The Trustees considered the extent to which the Fund was priced to scale and whether it would be appropriate to add advisory fee breakpoints, but noted that the Fund has implemented a contractual expense limitation and fee waiver (“Fee Cap”) which allow the Fund’s shareholders to share potential economies of scale from the Fund’s inception, prior to reaching scale. The Trustees noted that the fees remain fair and reasonable relative to peer funds. The Trustees considered the benefits to the Fund of the use of an affiliated distributor and custodian, including the ability to rely on existing infrastructure supporting distribution, custodial and transfer agent services and the ability to negotiate competitive fees for the Fund. The Trustees further considered the Adviser's and JPMorgan Distribution Services, Inc.’s (“JPMDS”), an affiliate of the Adviser which serves as the Fund’s distributor and principal underwriter, ongoing investments in their business in support of the Fund, including the Adviser's and/or JPMDS's investments in trading systems, technology (including improvements to the J.P. Morgan Funds’ website, and cybersecurity improvements), retention of key talent, and regulatory support enhancements. The Trustees concluded that the current fee structure for the Fund, including the Fee Cap that the Adviser has in place that serves to limit the overall net expense ratio of the Fund at a competitive level, was reasonable. The Trustees concluded that the Fund’s shareholders received the benefits of potential economies of scale through the Fee Cap and from the Adviser’s reinvestment in its
operations to serve the Fund and its shareholders. The Trustees noted that the Adviser’s reinvestment ensures sufficient resources in terms of personnel and infrastructure to support the Fund.
Fees Relative to Adviser’s Other Clients
The Trustees received and considered information about the nature and extent of investment advisory services and fee rates offered to other clients of the Adviser, including, to the extent applicable, institutional separate accounts, collective investment trusts, other registered investment companies and/or private funds sub-advised by the Adviser, and for investment management styles substantially similar to that of the Fund. The Trustees considered the complexity of investment management for registered investment companies relative to the Adviser’s other clients and noted differences, as applicable, in the fee structure and the regulatory, legal and other risks and responsibilities of providing services to the different clients. The Trustees considered that serving as an adviser to a registered investment company involves greater responsibilities and risks than acting as a sub-adviser and observed that sub-advisory fees may be lower than those charged by the Adviser to the Fund. The Trustees also noted that the adviser, not the applicable registered investment company, typically bears the sub-advisory fee and that many responsibilities related to the advisory function are typically retained by the primary adviser. The Trustees concluded that the fee rates charged to the Fund in comparison to those charged to the Adviser’s other clients were reasonable.
The Trustees receive and consider information about the Fund’s performance throughout the year. In addition, the Trustees received and considered absolute and/or relative performance information for the Fund in a report prepared by Broadridge. The Trustees considered the total return performance information, which included the ranking of the Fund within a performance universe comprised of funds with the same Broadridge investment classification and objective (the “Universe”), by total return for the applicable one-, three- and five-year periods. The Trustees reviewed a description of Broadridge’s methodology for selecting exchange-traded funds in the Fund’s Universe, and noted that Universe quintile rankings were not calculated if the number of funds in the Universe did not meet a predetermined minimum. As part of this review, the Trustees also reviewed the Fund’s performance against its benchmark and considered the performance information provided for the Fund at regular Board meetings by the Adviser and the Trustees’ independent consultant and also considered the special analysis prepared
for certain Funds by the Trustees’ independent consultant. The Trustees also engaged with the Adviser to consider what steps might be taken to improve performance, as applicable. The Broadridge performance data noted by the Trustees as part of their review and the determinations made by the Trustees with respect to the Fund’s performance are summarized below:
The Trustees noted that the Fund’s performance was in the first quintile of the Universe for each of the one-, three- and five-year periods ended December 31, 2023. The Trustees discussed the performance and investment strategy of the Fund with the Adviser and reviewed the performance analysis and evaluation prepared by the independent consultant. Based upon these discussions and various other factors, the Trustees concluded that the Fund’s performance was satisfactory.
Advisory Fee and Expense Ratio
The Trustees considered the contractual advisory fee rate and administration fee rate paid by the Fund to the Adviser and compared the combined rate to the information prepared by Broadridge concerning management fee rates paid by other funds in the Universe, as well as a subset of funds within the Universe (the “Peer Group”). The Trustees recognized that Broadridge reported the Fund’s management fee rate as the combined contractual advisory fee and administration fee rates. The Trustees also reviewed information about other expenses and the expense ratio for the Fund, and noted that Universe and Peer Group quintile rankings were not calculated if the number of funds in the Universe and/or Peer Group did not meet a predetermined minimum. The Trustees considered the Fee Cap currently in place for the Fund, the net advisory fee rate and net expense ratio, taking into account any waivers and/or reimbursements, and, where deemed appropriate by the Trustees, additional waivers and/or reimbursements. The Trustees recognized that it can be difficult to make comparisons of advisory fees because there are variations in the services that are included in the fees paid by other funds. The Trustees’ determinations as a result of the review of the Fund’s advisory fee and expense ratio are summarized below:
The Trustees noted that the Fund’s net advisory fee was in the first and second quintiles of the Peer Group and Universe, respectively, and that the actual total expenses were in the first and third quintiles of the Peer Group and Universe, respectively. After considering the factors identified above, in light of this information, the Trustees concluded that the advisory fee was fair and reasonable in light of the services provided to the Fund.
Semi-Annual Financial Statements
J.P. Morgan Exchange-Traded Funds
December 31, 2024 (Unaudited)
| | |
JPMorgan Active Growth ETF | | |
JPMorgan Active Small Cap Value ETF | | |
JPMorgan Active Value ETF | | |
JPMorgan Equity Premium Income ETF | | |
JPMorgan Fundamental Data Science Large Core ETF | | The NASDAQ Stock Market® LLC |
JPMorgan Fundamental Data Science Mid Core ETF | | The NASDAQ Stock Market® LLC |
JPMorgan Fundamental Data Science Small Core ETF | | The NASDAQ Stock Market® LLC |
JPMorgan Nasdaq Equity Premium Income ETF | | The NASDAQ Stock Market® LLC |
JPMorgan Small & Mid Cap Enhanced Equity ETF (formerly known as JPMorgan Market Expansion Enhanced Equity ETF) | | |
JPMorgan U.S. Tech Leaders ETF | | The NASDAQ Stock Market® LLC |
CONTENTS
Investments in a Fund are not deposits or obligations of, or guaranteed or endorsed by, any bank and are not insured or guaranteed by the FDIC, the Federal Reserve Board or any other government agency. You could lose money if you sell when a Fund’s share price is lower than when you invested.
Past performance is no guarantee of future performance. The general market views expressed in this report are opinions based on market and other conditions through the end of the reporting period and are subject to change without notice. These views are not intended to predict the future performance of a Fund or the securities markets.
Prospective investors should refer to the Funds’ prospectuses for a discussion of the Funds’ investment objectives, strategies and risks. Call J.P. Morgan Exchange-Traded Funds at (844) 457-6383 for a prospectus containing more complete information about a Fund, including management fees and other expenses. Please read it carefully before investing.
Shares are bought and sold throughout the day on an exchange at market price (not at net asset value) through a brokerage account, and are not individually subscribed and redeemed from a Fund. Shares may only be subscribed and redeemed directly from a Fund by Authorized Participants, in very large creation/redemption units. Brokerage commissions will reduce returns.
JPMorgan Active Growth ETF
SCHEDULE OF PORTFOLIO INVESTMENTSAS OF December 31, 2024 (Unaudited)
| | |
|
Aerospace & Defense — 0.5% |
| | |
|
| | |
|
| | |
| | |
Constellation Brands, Inc., Class A | | |
| | |
| | |
|
Alnylam Pharmaceuticals, Inc. * | | |
| | |
| | |
Regeneron Pharmaceuticals, Inc. * | | |
| | |
|
Alibaba Group Holding Ltd., ADR (China) | | |
| | |
MercadoLibre, Inc. (Brazil) * | | |
| | |
|
| | |
|
| | |
Goldman Sachs Group, Inc. (The) | | |
Interactive Brokers Group, Inc., Class A | | |
| | |
| | |
Robinhood Markets, Inc., Class A * | | |
| | |
Commercial Services & Supplies — 0.4% |
| | |
Communications Equipment — 0.9% |
| | |
Construction & Engineering — 1.0% |
| | |
Construction Materials — 0.2% |
| | |
Consumer Staples Distribution & Retail — 0.3% |
| | |
| | |
|
|
| | |
Electrical Equipment — 1.7% |
| | |
| | |
| | |
| | |
Vertiv Holdings Co., Class A | | |
| | |
Electronic Equipment, Instruments & Components — 0.3% |
| | |
Energy Equipment & Services — 0.4% |
TechnipFMC plc (United Kingdom) | | |
|
| | |
| | |
Take-Two Interactive Software, Inc. * | | |
| | |
Financial Services — 3.8% |
Berkshire Hathaway, Inc., Class B * | | |
| | |
Mastercard, Inc., Class A | | |
| | |
| | |
Ground Transportation — 1.3% |
JB Hunt Transport Services, Inc. | | |
| | |
Uber Technologies, Inc. * | | |
| | |
| | |
Health Care Equipment & Supplies — 2.4% |
| | |
Cooper Cos., Inc. (The) * | | |
Edwards Lifesciences Corp. * | | |
Intuitive Surgical, Inc. * | | |
| | |
Health Care Providers & Services — 0.6% |
| | |
Hotels, Restaurants & Leisure — 3.4% |
| | |
| | |
Chipotle Mexican Grill, Inc. * | | |
SEE NOTES TO FINANCIAL STATEMENTS.
| J.P. Morgan Exchange-Traded Funds | |
JPMorgan Active Growth ETF
SCHEDULE OF PORTFOLIO INVESTMENTSAS OF December 31, 2024 (Unaudited) (continued)
| | |
Common Stocks — continued |
Hotels, Restaurants & Leisure — continued |
DoorDash, Inc., Class A * | | |
Flutter Entertainment plc (United Kingdom) * | | |
Hilton Worldwide Holdings, Inc. | | |
| | |
| | |
| | |
Household Durables — 1.1% |
| | |
| | |
| | |
Industrial Conglomerates — 0.7% |
| | |
|
| | |
Interactive Media & Services — 10.2% |
| | |
Meta Platforms, Inc., Class A | | |
| | |
|
International Business Machines Corp. | | |
| | |
Shopify, Inc., Class A (Canada) * | | |
Snowflake, Inc., Class A * | | |
| | |
Life Sciences Tools & Services — 0.8% |
| | |
Mettler-Toledo International, Inc. * | | |
Thermo Fisher Scientific, Inc. | | |
| | |
|
| | |
| | |
| | |
|
Trade Desk, Inc. (The), Class A * | | |
|
| | |
Oil, Gas & Consumable Fuels — 0.5% |
| | |
| | |
|
Oil, Gas & Consumable Fuels — continued |
| | |
| | |
| | |
Personal Care Products — 0.2% |
| | |
|
| | |
Intra-Cellular Therapies, Inc. * | | |
| | |
| | |
Professional Services — 0.3% |
Booz Allen Hamilton Holding Corp. | | |
Semiconductors & Semiconductor Equipment — 14.5% |
ASML Holding NV (Registered), NYRS (Netherlands) | | |
| | |
| | |
| | |
| | |
| | |
Taiwan Semiconductor Manufacturing Co. Ltd., ADR (Taiwan) | | |
| | |
| | |
|
| | |
AppLovin Corp., Class A * | | |
Atlassian Corp., Class A * | | |
Crowdstrike Holdings, Inc., Class A * | | |
| | |
| | |
| | |
| | |
| | |
Palo Alto Networks, Inc. * | | |
| | |
| | |
| | |
| | |
|
| | |
SEE NOTES TO FINANCIAL STATEMENTS.
| J.P. Morgan Exchange-Traded Funds | |
| | |
Common Stocks — continued |
Specialty Retail — continued |
| | |
| | |
| | |
Technology Hardware, Storage & Peripherals — 8.1% |
| | |
Trading Companies & Distributors — 0.3% |
| | |
| | |
| | |
Total Common Stocks
(Cost $3,699,595,061) | | |
Short-Term Investments — 2.4% |
Investment Companies — 2.4% |
JPMorgan U.S. Government Money Market Fund Class IM Shares, 4.44% (a) (b)
(Cost $103,972,952) | | |
Total Investments — 100.0%
(Cost $3,803,568,013) | | |
Liabilities in Excess of Other Assets — (0.0)% ^ | | |
| | |
Percentages indicated are based on net assets. |
| |
| American Depositary Receipt |
| |
| Amount rounds to less than 0.1% of net assets. |
| Non-income producing security. | |
| Investment in an affiliated fund, which is registered under the Investment Company Act of 1940, as amended, and is advised by J.P. Morgan Investment Management Inc. | |
| The rate shown is the current yield as of December 31, 2024. | |
SEE NOTES TO FINANCIAL STATEMENTS.
| J.P. Morgan Exchange-Traded Funds | |
JPMorgan Active Small Cap Value ETF
SCHEDULE OF PORTFOLIO INVESTMENTSAS OF December 31, 2024 (Unaudited)
| | |
|
Aerospace & Defense — 1.6% |
| | |
| | |
| | |
Automobile Components — 1.1% |
| | |
| | |
| | |
|
| | |
| | |
| | |
Columbia Banking System, Inc. | | |
| | |
First Commonwealth Financial Corp. | | |
| | |
| | |
| | |
| | |
| | |
| | |
Provident Financial Services, Inc. | | |
| | |
Simmons First National Corp., Class A | | |
| | |
| | |
| | |
| | |
|
| | |
|
| | |
| | |
| | |
| | |
|
Donnelley Financial Solutions, Inc. * | | |
Hamilton Lane, Inc., Class A | | |
Virtus Investment Partners, Inc. | | |
| | |
|
| | |
| | |
| | |
|
|
| | |
| | |
| | |
| | |
Commercial Services & Supplies — 0.7% |
Aris Water Solutions, Inc., Class A | | |
Containers & Packaging — 0.9% |
| | |
Diversified Consumer Services — 0.8% |
Graham Holdings Co., Class B | | |
|
Essential Properties Realty Trust, Inc. | | |
Diversified Telecommunication Services — 0.6% |
Iridium Communications, Inc. | | |
Electric Utilities — 1.4% |
| | |
Portland General Electric Co. | | |
| | |
Electronic Equipment, Instruments & Components — 4.3% |
| | |
Napco Security Technologies, Inc. | | |
| | |
| | |
| | |
Vishay Intertechnology, Inc. | | |
| | |
Energy Equipment & Services — 2.1% |
| | |
| | |
| | |
Weatherford International plc | | |
| | |
Financial Services — 2.3% |
PennyMac Financial Services, Inc. | | |
| | |
| | |
|
| | |
| | |
| | |
SEE NOTES TO FINANCIAL STATEMENTS.
| J.P. Morgan Exchange-Traded Funds | |
| | |
Common Stocks — continued |
|
Chesapeake Utilities Corp. | | |
| | |
Southwest Gas Holdings, Inc. | | |
| | |
Ground Transportation — 0.9% |
| | |
Health Care Equipment & Supplies — 1.6% |
| | |
| | |
Utah Medical Products, Inc. | | |
| | |
Health Care Providers & Services — 4.8% |
Concentra Group Holdings Parent, Inc. | | |
| | |
| | |
| | |
| | |
|
| | |
Sabra Health Care REIT, Inc. | | |
| | |
Hotel & Resort REITs — 1.1% |
| | |
Sunstone Hotel Investors, Inc. | | |
| | |
Hotels, Restaurants & Leisure — 0.2% |
| | |
Household Durables — 2.0% |
| | |
| | |
| | |
| | |
|
Plymouth Industrial REIT, Inc. | | |
| | |
| | |
|
Safety Insurance Group, Inc. | | |
Selective Insurance Group, Inc. | | |
| | |
| | |
|
Interactive Media & Services — 1.1% |
| | |
|
| | |
Life Sciences Tools & Services — 0.3% |
| | |
|
Atmus Filtration Technologies, Inc. | | |
| | |
| | |
| | |
| | |
| | |
| | |
|
John Wiley & Sons, Inc., Class A | | |
|
| | |
|
| | |
Highwoods Properties, Inc. | | |
| | |
Oil, Gas & Consumable Fuels — 4.0% |
| | |
| | |
Magnolia Oil & Gas Corp., Class A | | |
| | |
| | |
Personal Care Products — 1.6% |
Edgewell Personal Care Co. | | |
| | |
| | |
|
Prestige Consumer Healthcare, Inc. * | | |
|
| | |
Independence Realty Trust, Inc. | | |
| | |
SEE NOTES TO FINANCIAL STATEMENTS.
| J.P. Morgan Exchange-Traded Funds | |
JPMorgan Active Small Cap Value ETF
SCHEDULE OF PORTFOLIO INVESTMENTSAS OF December 31, 2024 (Unaudited) (continued)
| | |
Common Stocks — continued |
|
| | |
| | |
| | |
Semiconductors & Semiconductor Equipment — 1.5% |
| | |
| | |
| | |
|
| | |
|
| | |
| | |
| | |
Textiles, Apparel & Luxury Goods — 2.7% |
| | |
| | |
| | |
| | |
Trading Companies & Distributors — 3.1% |
Applied Industrial Technologies, Inc. | | |
Beacon Roofing Supply, Inc. * | | |
| | |
| | |
| | |
|
|
American States Water Co. | | |
Total Common Stocks
(Cost $17,623,992) | | |
Short-Term Investments — 2.0% |
Investment Companies — 2.0% |
JPMorgan U.S. Government Money Market Fund Class IM Shares, 4.44% (a) (b)
(Cost $397,909) | | |
Total Investments — 99.9%
(Cost $18,021,901) | | |
Other Assets in Excess of Liabilities — 0.1% | | |
| | |
Percentages indicated are based on net assets. |
| |
| Real Estate Investment Trust |
| Non-income producing security. |
| Investment in an affiliated fund, which is registered under the Investment Company Act of 1940, as amended, and is advised by J.P. Morgan Investment Management Inc. |
| The rate shown is the current yield as of December 31, 2024. |
SEE NOTES TO FINANCIAL STATEMENTS.
| J.P. Morgan Exchange-Traded Funds | |
JPMorgan Active Value ETF
SCHEDULE OF PORTFOLIO INVESTMENTSAS OF December 31, 2024 (Unaudited)
| | |
|
Aerospace & Defense — 2.2% |
| | |
| | |
| | |
| | |
Spirit AeroSystems Holdings, Inc., Class A * | | |
| | |
| | |
Air Freight & Logistics — 1.1% |
| | |
United Parcel Service, Inc., Class B | | |
| | |
Automobile Components — 0.3% |
| | |
|
| | |
| | |
| | |
| | |
First Citizens BancShares, Inc., Class A | | |
| | |
| | |
PNC Financial Services Group, Inc. (The) | | |
| | |
| | |
| | |
|
| | |
|
| | |
| | |
BioMarin Pharmaceutical, Inc. * | | |
Neurocrine Biosciences, Inc. * | | |
Regeneron Pharmaceuticals, Inc. * | | |
Vertex Pharmaceuticals, Inc. * | | |
| | |
|
| | |
|
| | |
| | |
|
Building Products — continued |
| | |
| | |
| | |
|
| | |
| | |
| | |
Charles Schwab Corp. (The) | | |
Goldman Sachs Group, Inc. (The) | | |
Jefferies Financial Group, Inc. | | |
| | |
Raymond James Financial, Inc. | | |
| | |
|
Air Products and Chemicals, Inc. | | |
Axalta Coating Systems Ltd. * | | |
| | |
| | |
Commercial Services & Supplies — 0.2% |
| | |
Construction Materials — 0.6% |
| | |
|
| | |
Capital One Financial Corp. | | |
Discover Financial Services | | |
| | |
Consumer Staples Distribution & Retail — 2.8% |
BJ's Wholesale Club Holdings, Inc. * | | |
Performance Food Group Co. * | | |
| | |
| | |
Containers & Packaging — 1.4% |
| | |
Graphic Packaging Holding Co. | | |
| | |
| | |
| | |
| | |
Diversified Telecommunication Services — 0.8% |
Verizon Communications, Inc. | | |
SEE NOTES TO FINANCIAL STATEMENTS.
| J.P. Morgan Exchange-Traded Funds | |
JPMorgan Active Value ETF
SCHEDULE OF PORTFOLIO INVESTMENTSAS OF December 31, 2024 (Unaudited) (continued)
| | |
Common Stocks — continued |
Electric Utilities — 1.1% |
| | |
| | |
| | |
| | |
Electrical Equipment — 1.9% |
| | |
| | |
| | |
| | |
| | |
Electronic Equipment, Instruments & Components — 0.2% |
| | |
| | |
| | |
|
Live Nation Entertainment, Inc. * | | |
| | |
| | |
Financial Services — 5.6% |
| | |
Berkshire Hathaway, Inc., Class B * | | |
| | |
| | |
Fidelity National Information Services, Inc. | | |
| | |
| | |
|
Lamb Weston Holdings, Inc. | | |
Mondelez International, Inc., Class A | | |
| | |
Ground Transportation — 2.5% |
| | |
Knight-Swift Transportation Holdings, Inc. | | |
Uber Technologies, Inc. * | | |
| | |
| | |
Health Care Equipment & Supplies — 1.1% |
| | |
Boston Scientific Corp. * | | |
| | |
| | |
| | |
|
Health Care Providers & Services — 4.9% |
| | |
| | |
| | |
| | |
| | |
| | |
| | |
| | |
Universal Health Services, Inc., Class B | | |
| | |
|
| | |
Hotel & Resort REITs — 0.3% |
Host Hotels & Resorts, Inc. | | |
Hotels, Restaurants & Leisure — 2.3% |
| | |
| | |
| | |
| | |
Household Durables — 0.5% |
Mohawk Industries, Inc. * | | |
Household Products — 0.6% |
Procter & Gamble Co. (The) | | |
Industrial Conglomerates — 0.4% |
Honeywell International, Inc. | | |
|
Americold Realty Trust, Inc. | | |
| | |
| | |
| | |
|
| | |
| | |
Hartford Financial Services Group, Inc. (The) | | |
Marsh & McLennan Cos., Inc. | | |
| | |
Oscar Health, Inc., Class A * | | |
| | |
Interactive Media & Services — 1.3% |
| | |
SEE NOTES TO FINANCIAL STATEMENTS.
| J.P. Morgan Exchange-Traded Funds | |
| | |
Common Stocks — continued |
Interactive Media & Services — continued |
Meta Platforms, Inc., Class A | | |
Pinterest, Inc., Class A * | | |
| | |
|
Cognizant Technology Solutions Corp., Class A | | |
International Business Machines Corp. | | |
| | |
|
| | |
Life Sciences Tools & Services — 0.3% |
Thermo Fisher Scientific, Inc. | | |
|
| | |
| | |
| | |
Gates Industrial Corp. plc * | | |
| | |
| | |
| | |
|
| | |
|
| | |
| | |
| | |
United States Steel Corp. | | |
| | |
|
| | |
| | |
| | |
Public Service Enterprise Group, Inc. | | |
| | |
Oil, Gas & Consumable Fuels — 5.4% |
| | |
| | |
| | |
| | |
| | |
| | |
|
Oil, Gas & Consumable Fuels — continued |
| | |
| | |
| | |
Passenger Airlines — 1.2% |
American Airlines Group, Inc. * | | |
Copa Holdings SA, Class A (Panama) | | |
| | |
| | |
| | |
|
AstraZeneca plc, ADR (United Kingdom) | | |
| | |
| | |
| | |
| | |
| | |
Professional Services — 0.3% |
| | |
Real Estate Management & Development — 0.5% |
Zillow Group, Inc., Class C * | | |
|
AvalonBay Communities, Inc. | | |
Equity LifeStyle Properties, Inc. | | |
| | |
Semiconductors & Semiconductor Equipment — 3.6% |
Advanced Micro Devices, Inc. * | | |
| | |
ASML Holding NV (Registered), NYRS (Netherlands) | | |
Microchip Technology, Inc. | | |
| | |
NXP Semiconductors NV (China) | | |
| | |
| | |
|
| | |
| | |
| | |
| | |
| | |
| | |
SEE NOTES TO FINANCIAL STATEMENTS.
| J.P. Morgan Exchange-Traded Funds | |
JPMorgan Active Value ETF
SCHEDULE OF PORTFOLIO INVESTMENTSAS OF December 31, 2024 (Unaudited) (continued)
| | |
Common Stocks — continued |
|
Digital Realty Trust, Inc. | | |
| | |
| | |
| | |
| | |
|
| | |
| | |
| | |
O'Reilly Automotive, Inc. * | | |
| | |
| | |
| | |
Technology Hardware, Storage & Peripherals — 2.9% |
Dell Technologies, Inc., Class C | | |
Hewlett Packard Enterprise Co. | | |
Seagate Technology Holdings plc | | |
| | |
| | |
Textiles, Apparel & Luxury Goods — 0.2% |
| | |
|
Philip Morris International, Inc. | | |
Trading Companies & Distributors — 0.6% |
AerCap Holdings NV (Ireland) | | |
WESCO International, Inc. | | |
| | |
| | |
|
Wireless Telecommunication Services — 0.2% |
| | |
Total Common Stocks
(Cost $2,223,981,629) | | |
Short-Term Investments — 4.7% |
Investment Companies — 4.7% |
JPMorgan U.S. Government Money Market Fund Class IM Shares, 4.44% (a) (b)
(Cost $114,584,992) | | |
Total Investments — 99.9%
(Cost $2,338,566,621) | | |
Other Assets in Excess of Liabilities — 0.1% | | |
| | |
Percentages indicated are based on net assets. |
| |
| American Depositary Receipt |
| |
| Real Estate Investment Trust |
| Non-income producing security. |
| Investment in an affiliated fund, which is registered under the Investment Company Act of 1940, as amended, and is advised by J.P. Morgan Investment Management Inc. |
| The rate shown is the current yield as of December 31, 2024. |
SEE NOTES TO FINANCIAL STATEMENTS.
| J.P. Morgan Exchange-Traded Funds | |
JPMorgan Equity Premium Income ETF
SCHEDULE OF PORTFOLIO INVESTMENTSAS OF December 31, 2024 (Unaudited)
| | |
|
Aerospace & Defense — 2.0% |
| | |
| | |
| | |
| | |
| | |
| | |
Air Freight & Logistics — 1.2% |
| | |
United Parcel Service, Inc., Class B | | |
| | |
|
| | |
| | |
| | |
|
| | |
| | |
| | |
| | |
|
| | |
Regeneron Pharmaceuticals, Inc. * | | |
Vertex Pharmaceuticals, Inc. * | | |
| | |
|
| | |
|
| | |
| | |
| | |
|
Ameriprise Financial, Inc. | | |
| | |
| | |
|
| | |
| | |
| | |
Communications Equipment — 0.3% |
| | |
| | |
|
|
| | |
Consumer Staples Distribution & Retail — 1.5% |
| | |
| | |
| | |
Electric Utilities — 3.2% |
| | |
| | |
| | |
| | |
| | |
Electrical Equipment — 2.0% |
| | |
| | |
| | |
| | |
Electronic Equipment, Instruments & Components — 0.1% |
Keysight Technologies, Inc. * | | |
Financial Services — 5.7% |
Berkshire Hathaway, Inc., Class B * | | |
| | |
| | |
Jack Henry & Associates, Inc. | | |
Mastercard, Inc., Class A | | |
| | |
| | |
|
Mondelez International, Inc., Class A | | |
Ground Transportation — 1.0% |
| | |
| | |
| | |
Health Care Equipment & Supplies — 3.0% |
| | |
Boston Scientific Corp. * | | |
| | |
| | |
| | |
SEE NOTES TO FINANCIAL STATEMENTS.
| J.P. Morgan Exchange-Traded Funds | |
JPMorgan Equity Premium Income ETF
SCHEDULE OF PORTFOLIO INVESTMENTSAS OF December 31, 2024 (Unaudited) (continued)
| | |
Common Stocks — continued |
Health Care Providers & Services — 1.4% |
| | |
| | |
| | |
|
| | |
Hotels, Restaurants & Leisure — 4.0% |
| | |
Chipotle Mexican Grill, Inc. * | | |
| | |
| | |
| | |
Household Products — 1.7% |
Church & Dwight Co., Inc. | | |
Procter & Gamble Co. (The) | | |
| | |
Industrial Conglomerates — 1.4% |
Honeywell International, Inc. | | |
|
| | |
|
| | |
| | |
| | |
Marsh & McLennan Cos., Inc. | | |
| | |
| | |
Travelers Cos., Inc. (The) | | |
| | |
Interactive Media & Services — 3.1% |
| | |
Meta Platforms, Inc., Class A | | |
| | |
|
Accenture plc, Class A (Ireland) | | |
Cognizant Technology Solutions Corp., Class A | | |
| | |
| | |
|
Life Sciences Tools & Services — 1.6% |
| | |
Thermo Fisher Scientific, Inc. | | |
| | |
|
| | |
| | |
| | |
| | |
| | |
|
| | |
|
| | |
| | |
Public Service Enterprise Group, Inc. | | |
| | |
Oil, Gas & Consumable Fuels — 2.5% |
| | |
| | |
| | |
| | |
Personal Care Products — 0.2% |
| | |
|
| | |
| | |
| | |
| | |
| | |
Professional Services — 0.3% |
| | |
Residential REITs — 0.0% ^ |
Equity LifeStyle Properties, Inc. | | |
Semiconductors & Semiconductor Equipment — 6.5% |
| | |
ASML Holding NV (Registered), NYRS (Netherlands) | | |
| | |
| | |
| | |
SEE NOTES TO FINANCIAL STATEMENTS.
| J.P. Morgan Exchange-Traded Funds | |
| | |
Common Stocks — continued |
Semiconductors & Semiconductor Equipment — continued |
NXP Semiconductors NV (China) | | |
| | |
| | |
|
Cadence Design Systems, Inc. * | | |
| | |
| | |
| | |
| | |
| | |
| | |
|
| | |
| | |
| | |
| | |
|
| | |
Burlington Stores, Inc. * | | |
| | |
| | |
| | |
Technology Hardware, Storage & Peripherals — 1.0% |
| | |
Seagate Technology Holdings plc | | |
| | |
|
| | |
Philip Morris International, Inc. | | |
| | |
Trading Companies & Distributors — 0.3% |
| | |
Total Common Stocks
(Cost $26,220,071,106) | | |
| | |
Equity-Linked Notes — 13.6% |
Barclays Bank plc, ELN, 41.20%, 2/4/2025, (linked to S&P 500 Index) (United Kingdom) (a) | | |
| | |
|
Barclays Bank plc, ELN, 47.30%, 2/7/2025, (linked to S&P 500 Index) (United Kingdom) (a) | | |
BNP Paribas Issuance BV, ELN, 40.48%, 1/21/2025, (linked to S&P 500 Index) (a) | | |
BNP Paribas, ELN, 42.20%, 1/8/2025, (linked to S&P 500 Index) (a) | | |
BNP Paribas, ELN, 53.51%, 1/31/2025, (linked to S&P 500 Index) (a) | | |
BofA Finance LLC, ELN, 40.45%, 1/17/2025, (linked to S&P 500 Index) (a) | | |
BofA Finance LLC, ELN, 42.48%, 1/7/2025, (linked to S&P 500 Index) (a) | | |
BofA Finance LLC, ELN, 43.08%, 1/24/2025, (linked to S&P 500 Index) (a) | | |
Royal Bank of Canada, ELN, 38.06%, 1/14/2025, (linked to S&P 500 Index) (Canada) (a) | | |
Royal Bank of Canada, ELN, 41.46%, 1/22/2025, (linked to S&P 500 Index) (Canada) (a) | | |
Societe Generale SA, ELN, 55.55%, 1/28/2025, (linked to S&P 500 Index) (a) | | |
UBS AG, ELN, 38.49%, 1/10/2025, (linked to S&P 500 Index) (Switzerland) (a) | | |
UBS AG, ELN, 38.92%, 1/13/2025, (linked to S&P 500 Index) (Switzerland) (a) | | |
UBS AG, ELN, 44.39%, 2/3/2025, (linked to S&P 500 Index) (Switzerland) (a) | | |
Wells Fargo Bank, ELN, 61.94%, 1/27/2025, (linked to S&P 500 Index) | | |
Total Equity-Linked Notes
(Cost $5,028,019,551) | | |
SEE NOTES TO FINANCIAL STATEMENTS.
| J.P. Morgan Exchange-Traded Funds | |
JPMorgan Equity Premium Income ETF
SCHEDULE OF PORTFOLIO INVESTMENTSAS OF December 31, 2024 (Unaudited) (continued)
| | |
Short-Term Investments — 1.4% |
Investment Companies — 1.4% |
JPMorgan U.S. Government Money Market Fund Class IM Shares, 4.44% (b) (c)
(Cost $523,661,539) | | |
Total Investments — 100.1%
(Cost $31,771,752,196) | | |
Liabilities in Excess of Other Assets — (0.1)% | | |
| | |
Percentages indicated are based on net assets. |
| |
| Real Estate Investment Trust |
| Amount rounds to less than 0.1% of net assets. |
| Non-income producing security. | |
| Securities exempt from registration under Rule 144A or section 4(a)(2), of the Securities Act of 1933, as amended. | |
| Investment in an affiliated fund, which is registered under the Investment Company Act of 1940, as amended, and is advised by J.P. Morgan Investment Management Inc. | |
| The rate shown is the current yield as of December 31, 2024. | |
SEE NOTES TO FINANCIAL STATEMENTS.
| J.P. Morgan Exchange-Traded Funds | |
JPMorgan Fundamental Data Science Large Core ETF
SCHEDULE OF PORTFOLIO INVESTMENTSAS OF December 31, 2024 (Unaudited)
| | |
|
Aerospace & Defense — 2.0% |
| | |
| | |
| | |
Air Freight & Logistics — 1.1% |
United Parcel Service, Inc., Class B | | |
Automobile Components — 0.1% |
| | |
|
| | |
|
| | |
First Citizens BancShares, Inc., Class A | | |
| | |
| | |
| | |
|
| | |
|
| | |
Regeneron Pharmaceuticals, Inc. * | | |
Vertex Pharmaceuticals, Inc. * | | |
| | |
|
| | |
|
| | |
|
Ameriprise Financial, Inc. | | |
| | |
| | |
| | |
|
Axalta Coating Systems Ltd. * | | |
| | |
| | |
| | |
Communications Equipment — 0.2% |
| | |
|
| | |
| | |
|
Consumer Staples Distribution & Retail — 1.2% |
BJ's Wholesale Club Holdings, Inc. * | | |
| | |
Performance Food Group Co. * | | |
| | |
Electric Utilities — 2.2% |
| | |
| | |
| | |
| | |
Electronic Equipment, Instruments & Components — 0.7% |
| | |
|
| | |
Financial Services — 4.2% |
Berkshire Hathaway, Inc., Class B * | | |
| | |
Mastercard, Inc., Class A | | |
| | |
| | |
| | |
|
Mondelez International, Inc., Class A | | |
Ground Transportation — 1.0% |
| | |
Health Care Equipment & Supplies — 2.0% |
| | |
| | |
| | |
Health Care Providers & Services — 2.4% |
| | |
| | |
| | |
Hotels, Restaurants & Leisure — 2.2% |
Chipotle Mexican Grill, Inc. * | | |
Hilton Worldwide Holdings, Inc. | | |
| | |
| | |
| | |
Household Products — 0.3% |
Church & Dwight Co., Inc. | | |
SEE NOTES TO FINANCIAL STATEMENTS.
| J.P. Morgan Exchange-Traded Funds | |
JPMorgan Fundamental Data Science Large Core ETF
SCHEDULE OF PORTFOLIO INVESTMENTSAS OF December 31, 2024 (Unaudited) (continued)
| | |
Common Stocks — continued |
Industrial Conglomerates — 1.1% |
Honeywell International, Inc. | | |
|
| | |
|
| | |
| | |
| | |
Interactive Media & Services — 7.0% |
| | |
Meta Platforms, Inc., Class A | | |
| | |
|
Cognizant Technology Solutions Corp., Class A | | |
Life Sciences Tools & Services — 0.8% |
| | |
|
| | |
| | |
| | |
|
| | |
|
| | |
Oil, Gas & Consumable Fuels — 3.6% |
| | |
| | |
| | |
| | |
Personal Care Products — 0.1% |
Estee Lauder Cos., Inc. (The), Class A | | |
|
| | |
Elanco Animal Health, Inc. * | | |
| | |
| | |
Professional Services — 0.5% |
| | |
Semiconductors & Semiconductor Equipment — 11.3% |
| | |
| | |
| | |
|
Semiconductors & Semiconductor Equipment — continued |
| | |
| | |
| | |
NXP Semiconductors NV (China) | | |
| | |
|
| | |
| | |
| | |
| | |
| | |
| | |
|
Digital Realty Trust, Inc. | | |
| | |
| | |
|
| | |
| | |
| | |
| | |
Technology Hardware, Storage & Peripherals — 7.8% |
| | |
Hewlett Packard Enterprise Co. | | |
Seagate Technology Holdings plc | | |
| | |
|
Philip Morris International, Inc. | | |
Wireless Telecommunication Services — 0.7% |
| | |
Total Common Stocks
(Cost $11,367,008) | | |
SEE NOTES TO FINANCIAL STATEMENTS.
| J.P. Morgan Exchange-Traded Funds | |
| | |
Short-Term Investments — 0.4% |
Investment Companies — 0.4% |
JPMorgan U.S. Government Money Market Fund Class IM Shares, 4.44% (a) (b)
(Cost $48,571) | | |
Total Investments — 99.9%
(Cost $11,415,579) | | |
Other Assets in Excess of Liabilities — 0.1% | | |
| | |
Percentages indicated are based on net assets. |
| |
| Real Estate Investment Trust |
| Non-income producing security. |
| Investment in an affiliated fund, which is registered under the Investment Company Act of 1940, as amended, and is advised by J.P. Morgan Investment Management Inc. |
| The rate shown is the current yield as of December 31, 2024. |
SEE NOTES TO FINANCIAL STATEMENTS.
| J.P. Morgan Exchange-Traded Funds | |
JPMorgan Fundamental Data Science Mid Core ETF
SCHEDULE OF PORTFOLIO INVESTMENTSAS OF December 31, 2024 (Unaudited)
| | |
|
Aerospace & Defense — 2.6% |
| | |
| | |
| | |
|
| | |
First Citizens BancShares, Inc., Class A | | |
| | |
| | |
| | |
| | |
|
Alnylam Pharmaceuticals, Inc. * | | |
| | |
Sarepta Therapeutics, Inc. * | | |
Viking Therapeutics, Inc. * | | |
| | |
|
| | |
| | |
Fortune Brands Innovations, Inc. | | |
| | |
| | |
|
| | |
LPL Financial Holdings, Inc. | | |
| | |
| | |
Raymond James Financial, Inc. | | |
| | |
Tradeweb Markets, Inc., Class A | | |
| | |
|
Axalta Coating Systems Ltd. * | | |
| | |
| | |
| | |
LyondellBasell Industries NV, Class A | | |
| | |
Construction & Engineering — 1.3% |
| | |
| | |
|
Construction Materials — 1.3% |
| | |
Martin Marietta Materials, Inc. | | |
| | |
|
Discover Financial Services | | |
Consumer Staples Distribution & Retail — 2.4% |
BJ's Wholesale Club Holdings, Inc. * | | |
Performance Food Group Co. * | | |
| | |
| | |
Containers & Packaging — 2.0% |
| | |
| | |
Packaging Corp. of America | | |
| | |
|
| | |
| | |
| | |
| | |
Electric Utilities — 2.6% |
| | |
| | |
| | |
| | |
Electrical Equipment — 0.7% |
| | |
| | |
| | |
Electronic Equipment, Instruments & Components — 1.9% |
| | |
Teledyne Technologies, Inc. * | | |
Zebra Technologies Corp., Class A * | | |
| | |
Energy Equipment & Services — 0.8% |
TechnipFMC plc (United Kingdom) | | |
|
Take-Two Interactive Software, Inc. * | | |
SEE NOTES TO FINANCIAL STATEMENTS.
| J.P. Morgan Exchange-Traded Funds | |
| | |
Common Stocks — continued |
Financial Services — 2.8% |
| | |
Fidelity National Information Services, Inc. | | |
| | |
|
Archer-Daniels-Midland Co. | | |
| | |
| | |
| | |
Ground Transportation — 1.6% |
JB Hunt Transport Services, Inc. | | |
| | |
| | |
Health Care Equipment & Supplies — 1.6% |
| | |
| | |
Zimmer Biomet Holdings, Inc. | | |
| | |
Health Care Providers & Services — 2.9% |
| | |
| | |
| | |
| | |
| | |
Hotels, Restaurants & Leisure — 4.4% |
| | |
| | |
Hilton Worldwide Holdings, Inc. | | |
| | |
Royal Caribbean Cruises Ltd. | | |
| | |
Household Durables — 1.9% |
| | |
| | |
| | |
Household Products — 0.7% |
Church & Dwight Co., Inc. | | |
Reynolds Consumer Products, Inc. | | |
| | |
Independent Power and Renewable Electricity Producers — 0.2% |
| | |
| | |
|
|
EastGroup Properties, Inc. | | |
Rexford Industrial Realty, Inc. | | |
| | |
|
| | |
| | |
Hartford Financial Services Group, Inc. (The) | | |
| | |
Prudential Financial, Inc. | | |
| | |
| | |
|
Cognizant Technology Solutions Corp., Class A | | |
| | |
| | |
| | |
Life Sciences Tools & Services — 2.1% |
| | |
Mettler-Toledo International, Inc. * | | |
West Pharmaceutical Services, Inc. | | |
| | |
|
| | |
| | |
| | |
Westinghouse Air Brake Technologies Corp. | | |
| | |
|
Charter Communications, Inc., Class A * | | |
Trade Desk, Inc. (The), Class A * | | |
| | |
|
| | |
Public Service Enterprise Group, Inc. | | |
| | |
| | |
Oil, Gas & Consumable Fuels — 3.4% |
| | |
| | |
SEE NOTES TO FINANCIAL STATEMENTS.
| J.P. Morgan Exchange-Traded Funds | |
JPMorgan Fundamental Data Science Mid Core ETF
SCHEDULE OF PORTFOLIO INVESTMENTSAS OF December 31, 2024 (Unaudited) (continued)
| | |
Common Stocks — continued |
Oil, Gas & Consumable Fuels — continued |
| | |
Williams Cos., Inc. (The) | | |
| | |
Passenger Airlines — 0.8% |
| | |
|
Jazz Pharmaceuticals plc * | | |
Professional Services — 2.2% |
Booz Allen Hamilton Holding Corp. | | |
| | |
Paylocity Holding Corp. * | | |
SS&C Technologies Holdings, Inc. | | |
| | |
Real Estate Management & Development — 0.8% |
CBRE Group, Inc., Class A * | | |
|
AvalonBay Communities, Inc. | | |
Equity LifeStyle Properties, Inc. | | |
Mid-America Apartment Communities, Inc. | | |
| | |
|
| | |
Semiconductors & Semiconductor Equipment — 2.4% |
| | |
Microchip Technology, Inc. | | |
| | |
| | |
| | |
|
AppLovin Corp., Class A * | | |
Confluent, Inc., Class A * | | |
| | |
| | |
| | |
Manhattan Associates, Inc. * | | |
| | |
| | |
Palantir Technologies, Inc., Class A * | | |
Tyler Technologies, Inc. * | | |
| | |
| | |
|
|
| | |
| | |
| | |
| | |
|
| | |
| | |
Burlington Stores, Inc. * | | |
| | |
| | |
| | |
Technology Hardware, Storage & Peripherals — 0.9% |
Hewlett Packard Enterprise Co. | | |
Super Micro Computer, Inc. * | | |
| | |
Textiles, Apparel & Luxury Goods — 1.3% |
| | |
| | |
| | |
Trading Companies & Distributors — 0.8% |
Core & Main, Inc., Class A * | | |
Total Common Stocks
(Cost $5,844,953) | | |
Short-Term Investments — 3.8% |
Investment Companies — 3.8% |
JPMorgan U.S. Government Money Market Fund Class IM Shares, 4.44% (a) (b)
(Cost $257,853) | | |
Total Investments — 99.5%
(Cost $6,102,806) | | |
Other Assets in Excess of Liabilities — 0.5% | | |
| | |
Percentages indicated are based on net assets. |
| |
| Real Estate Investment Trust |
| Non-income producing security. |
| Investment in an affiliated fund, which is registered under the Investment Company Act of 1940, as amended, and is advised by J.P. Morgan Investment Management Inc. |
| The rate shown is the current yield as of December 31, 2024. |
SEE NOTES TO FINANCIAL STATEMENTS.
| J.P. Morgan Exchange-Traded Funds | |
Futures contracts outstanding as of December 31, 2024:
| | | | | VALUE AND
UNREALIZED
APPRECIATION
(DEPRECIATION) ($) |
| | | | | |
S&P Midcap 400 Micro E-Mini Index | | | | | |
SEE NOTES TO FINANCIAL STATEMENTS.
| J.P. Morgan Exchange-Traded Funds | |
JPMorgan Fundamental Data Science Small Core ETF
SCHEDULE OF PORTFOLIO INVESTMENTSAS OF December 31, 2024 (Unaudited)
| | |
|
Aerospace & Defense — 0.4% |
| | |
Automobile Components — 1.3% |
| | |
| | |
| | |
|
Winnebago Industries, Inc. | | |
|
Amalgamated Financial Corp. | | |
| | |
Bank of NT Butterfield & Son Ltd. (The) (Bermuda) | | |
| | |
Business First Bancshares, Inc. | | |
| | |
| | |
Enterprise Financial Services Corp. | | |
| | |
| | |
First Interstate BancSystem, Inc., Class A | | |
| | |
| | |
OceanFirst Financial Corp. | | |
OFG Bancorp (Puerto Rico) | | |
| | |
| | |
| | |
Simmons First National Corp., Class A | | |
| | |
| | |
| | |
|
Agios Pharmaceuticals, Inc. * | | |
Akero Therapeutics, Inc. * | | |
Allogene Therapeutics, Inc. * | | |
Amicus Therapeutics, Inc. * | | |
Arrowhead Pharmaceuticals, Inc. * | | |
| | |
Blueprint Medicines Corp. * | | |
Halozyme Therapeutics, Inc. * | | |
| | |
iTeos Therapeutics, Inc. * | | |
| | |
Protagonist Therapeutics, Inc. * | | |
| | |
|
Biotechnology — continued |
| | |
Relay Therapeutics, Inc. * | | |
| | |
REVOLUTION Medicines, Inc. * | | |
| | |
| | |
| | |
| | |
Verve Therapeutics, Inc. * | | |
| | |
|
Savers Value Village, Inc. * | | |
|
| | |
| | |
Janus International Group, Inc. * | | |
| | |
|
Brightsphere Investment Group, Inc. | | |
Donnelley Financial Solutions, Inc. * | | |
Hamilton Lane, Inc., Class A | | |
| | |
| | |
Virtus Investment Partners, Inc. | | |
| | |
|
| | |
| | |
| | |
| | |
Perimeter Solutions, Inc. * | | |
| | |
| | |
Commercial Services & Supplies — 1.9% |
| | |
Aris Water Solutions, Inc., Class A | | |
Driven Brands Holdings, Inc. * | | |
| | |
Communications Equipment — 0.1% |
| | |
SEE NOTES TO FINANCIAL STATEMENTS.
| J.P. Morgan Exchange-Traded Funds | |
| | |
Common Stocks — continued |
Construction & Engineering — 1.0% |
| | |
| | |
| | |
|
Bread Financial Holdings, Inc. | | |
Enova International, Inc. * | | |
| | |
| | |
Consumer Staples Distribution & Retail — 1.8% |
Chefs' Warehouse, Inc. (The) * | | |
Sprouts Farmers Market, Inc. * | | |
| | |
Containers & Packaging — 0.7% |
| | |
Diversified Consumer Services — 0.2% |
OneSpaWorld Holdings Ltd. (Bahamas) | | |
|
Essential Properties Realty Trust, Inc. | | |
Diversified Telecommunication Services — 0.5% |
Bandwidth, Inc., Class A * | | |
Liberty Latin America Ltd., Class C (Puerto Rico) * | | |
| | |
Electric Utilities — 0.6% |
Portland General Electric Co. | | |
Electrical Equipment — 1.3% |
Bloom Energy Corp., Class A * | | |
Shoals Technologies Group, Inc., Class A * | | |
Thermon Group Holdings, Inc. * | | |
| | |
Electronic Equipment, Instruments & Components — 4.4% |
| | |
| | |
| | |
| | |
| | |
| | |
Vishay Intertechnology, Inc. | | |
| | |
Energy Equipment & Services — 2.5% |
| | |
| | |
|
Energy Equipment & Services — continued |
| | |
| | |
| | |
Select Water Solutions, Inc. | | |
| | |
|
Lions Gate Entertainment Corp., Class A * | | |
Financial Services — 2.8% |
AvidXchange Holdings, Inc. * | | |
| | |
| | |
Jackson Financial, Inc., Class A | | |
| | |
| | |
| | |
| | |
|
| | |
| | |
| | |
|
Chesapeake Utilities Corp. | | |
| | |
| | |
Ground Transportation — 0.4% |
| | |
Health Care Equipment & Supplies — 4.2% |
Alphatec Holdings, Inc. * | | |
| | |
| | |
| | |
| | |
iRhythm Technologies, Inc. * | | |
| | |
PROCEPT BioRobotics Corp. * | | |
| | |
TransMedics Group, Inc. * | | |
Utah Medical Products, Inc. | | |
| | |
Health Care Providers & Services — 1.2% |
Concentra Group Holdings Parent, Inc. | | |
SEE NOTES TO FINANCIAL STATEMENTS.
| J.P. Morgan Exchange-Traded Funds | |
JPMorgan Fundamental Data Science Small Core ETF
SCHEDULE OF PORTFOLIO INVESTMENTSAS OF December 31, 2024 (Unaudited) (continued)
| | |
Common Stocks — continued |
Health Care Providers & Services — continued |
| | |
Hims & Hers Health, Inc. * | | |
| | |
| | |
|
| | |
Health Care Technology — 0.5% |
Evolent Health, Inc., Class A * | | |
| | |
| | |
Hotel & Resort REITs — 2.0% |
| | |
Ryman Hospitality Properties, Inc. | | |
Sunstone Hotel Investors, Inc. | | |
Xenia Hotels & Resorts, Inc. | | |
| | |
Hotels, Restaurants & Leisure — 2.7% |
Accel Entertainment, Inc. * | | |
| | |
| | |
Hilton Grand Vacations, Inc. * | | |
Life Time Group Holdings, Inc. * | | |
Monarch Casino & Resort, Inc. | | |
| | |
Household Durables — 1.4% |
| | |
| | |
| | |
|
Plymouth Industrial REIT, Inc. | | |
|
| | |
Genworth Financial, Inc., Class A * | | |
Oscar Health, Inc., Class A * | | |
| | |
Safety Insurance Group, Inc. | | |
| | |
Interactive Media & Services — 0.4% |
| | |
| | |
|
|
| | |
DigitalOcean Holdings, Inc. * | | |
| | |
| | |
Life Sciences Tools & Services — 0.3% |
| | |
Maravai LifeSciences Holdings, Inc., Class A * | | |
| | |
|
Atmus Filtration Technologies, Inc. | | |
| | |
| | |
Hillman Solutions Corp. * | | |
| | |
| | |
Watts Water Technologies, Inc., Class A | | |
| | |
|
John Wiley & Sons, Inc., Class A | | |
| | |
| | |
| | |
|
| | |
| | |
| | |
Mortgage Real Estate Investment Trusts (REITs) — 0.3% |
| | |
|
| | |
|
| | |
Oil, Gas & Consumable Fuels — 1.9% |
| | |
International Seaways, Inc. | | |
| | |
| | |
Teekay Tankers Ltd., Class A (Canada) | | |
| | |
SEE NOTES TO FINANCIAL STATEMENTS.
| J.P. Morgan Exchange-Traded Funds | |
| | |
Common Stocks — continued |
Passenger Airlines — 0.4% |
| | |
Personal Care Products — 0.6% |
Edgewell Personal Care Co. | | |
|
| | |
Professional Services — 2.5% |
Barrett Business Services, Inc. | | |
ExlService Holdings, Inc. * | | |
| | |
Huron Consulting Group, Inc. * | | |
| | |
| | |
Real Estate Management & Development — 0.2% |
Cushman & Wakefield plc * | | |
|
| | |
|
| | |
Retail Opportunity Investments Corp. | | |
| | |
Semiconductors & Semiconductor Equipment — 3.7% |
| | |
Credo Technology Group Holding Ltd. * | | |
Penguin Solutions, Inc. * | | |
| | |
| | |
| | |
| | |
| | |
|
| | |
| | |
Clear Secure, Inc., Class A | | |
Clearwater Analytics Holdings, Inc., Class A * | | |
Freshworks, Inc., Class A * | | |
LiveRamp Holdings, Inc. * | | |
| | |
| | |
| | |
| | |
|
|
| | |
Zeta Global Holdings Corp., Class A * | | |
| | |
|
Abercrombie & Fitch Co., Class A * | | |
| | |
| | |
| | |
Textiles, Apparel & Luxury Goods — 1.6% |
| | |
| | |
| | |
Trading Companies & Distributors — 3.1% |
Applied Industrial Technologies, Inc. | | |
Beacon Roofing Supply, Inc. * | | |
| | |
Rush Enterprises, Inc., Class A | | |
| | |
Total Common Stocks
(Cost $5,887,779) | | |
Short-Term Investments — 4.1% |
Investment Companies — 4.1% |
JPMorgan U.S. Government Money Market Fund Class IM Shares, 4.44% (a) (b)
(Cost $265,596) | | |
Total Investments — 99.6%
(Cost $6,153,375) | | |
Other Assets in Excess of Liabilities — 0.4% | | |
| | |
Percentages indicated are based on net assets. |
| |
| Real Estate Investment Trust |
| Non-income producing security. |
| Investment in an affiliated fund, which is registered under the Investment Company Act of 1940, as amended, and is advised by J.P. Morgan Investment Management Inc. |
| The rate shown is the current yield as of December 31, 2024. |
SEE NOTES TO FINANCIAL STATEMENTS.
| J.P. Morgan Exchange-Traded Funds | |
JPMorgan Fundamental Data Science Small Core ETF
SCHEDULE OF PORTFOLIO INVESTMENTSAS OF December 31, 2024 (Unaudited) (continued)
Futures contracts outstanding as of December 31, 2024:
| | | | | VALUE AND
UNREALIZED
APPRECIATION
(DEPRECIATION) ($) |
| | | | | |
Russell 2000 Micro E-Mini Index | | | | | |
SEE NOTES TO FINANCIAL STATEMENTS.
| J.P. Morgan Exchange-Traded Funds | |
JPMorgan Nasdaq Equity Premium Income ETF
SCHEDULE OF PORTFOLIO INVESTMENTSAS OF December 31, 2024 (Unaudited)
| | |
|
Air Freight & Logistics — 0.1% |
United Parcel Service, Inc., Class B | | |
|
| | |
|
| | |
Constellation Brands, Inc., Class A | | |
| | |
| | |
| | |
|
| | |
| | |
| | |
Regeneron Pharmaceuticals, Inc. * | | |
Vertex Pharmaceuticals, Inc. * | | |
| | |
|
| | |
MercadoLibre, Inc. (Brazil) * | | |
PDD Holdings, Inc., ADR (China) * | | |
| | |
|
| | |
Commercial Services & Supplies — 0.5% |
| | |
Communications Equipment — 1.0% |
| | |
Consumer Staples Distribution & Retail — 1.5% |
| | |
Electric Utilities — 1.0% |
| | |
| | |
| | |
| | |
Electrical Equipment — 0.4% |
| | |
|
| | |
Take-Two Interactive Software, Inc. * | | |
| | |
Financial Services — 0.8% |
| | |
| | |
|
Financial Services — continued |
Mastercard, Inc., Class A | | |
| | |
| | |
|
| | |
Mondelez International, Inc., Class A | | |
| | |
Ground Transportation — 0.8% |
| | |
Uber Technologies, Inc. * | | |
| | |
Health Care Equipment & Supplies — 1.5% |
| | |
Intuitive Surgical, Inc. * | | |
| | |
Health Care Providers & Services — 0.3% |
| | |
Hotels, Restaurants & Leisure — 2.9% |
| | |
| | |
Chipotle Mexican Grill, Inc. * | | |
DoorDash, Inc., Class A * | | |
Marriott International, Inc., Class A | | |
| | |
| | |
Industrial Conglomerates — 0.9% |
Honeywell International, Inc. | | |
|
| | |
Interactive Media & Services — 7.4% |
| | |
Meta Platforms, Inc., Class A | | |
| | |
|
Cognizant Technology Solutions Corp., Class A | | |
| | |
| | |
Life Sciences Tools & Services — 0.2% |
Thermo Fisher Scientific, Inc. | | |
|
| | |
SEE NOTES TO FINANCIAL STATEMENTS.
| J.P. Morgan Exchange-Traded Funds | |
JPMorgan Nasdaq Equity Premium Income ETF
SCHEDULE OF PORTFOLIO INVESTMENTSAS OF December 31, 2024 (Unaudited) (continued)
| | |
Common Stocks — continued |
|
Charter Communications, Inc., Class A * | | |
| | |
Trade Desk, Inc. (The), Class A * | | |
| | |
Oil, Gas & Consumable Fuels — 0.2% |
| | |
|
| | |
Professional Services — 0.4% |
| | |
Semiconductors & Semiconductor Equipment — 18.3% |
Advanced Micro Devices, Inc. * | | |
| | |
| | |
ASML Holding NV (Registered), NYRS (Netherlands) | | |
| | |
| | |
| | |
| | |
| | |
| | |
NXP Semiconductors NV (China) | | |
| | |
| | |
| | |
| | |
|
| | |
| | |
AppLovin Corp., Class A * | | |
Atlassian Corp., Class A * | | |
Crowdstrike Holdings, Inc., Class A * | | |
| | |
| | |
| | |
| | |
MicroStrategy, Inc., Class A * (a) | | |
| | |
Palantir Technologies, Inc., Class A * | | |
Palo Alto Networks, Inc. * | | |
| | |
| | |
| | |
| | |
| | |
|
|
| | |
O'Reilly Automotive, Inc. * | | |
| | |
| | |
Technology Hardware, Storage & Peripherals — 8.4% |
| | |
Seagate Technology Holdings plc | | |
| | |
Textiles, Apparel & Luxury Goods — 0.1% |
Lululemon Athletica, Inc. * | | |
Wireless Telecommunication Services — 1.0% |
| | |
Total Common Stocks
(Cost $13,933,343,050) | | |
| | |
Equity-Linked Notes — 17.2% |
Barclays Bank plc, ELN, 66.00%, 1/27/2025, (linked to Nasdaq-100 Index) (United Kingdom) (b) | | |
BNP Paribas, ELN, 51.80%, 1/10/2025, (linked to Nasdaq-100 Index) (France) (b) | | |
BNP Paribas, ELN, 53.42%, 1/17/2025, (linked to Nasdaq-100 Index) (b) | | |
Mizuho Markets Cayman LP, ELN, 57.35%, 2/3/2025, (linked to Nasdaq-100 Index) (b) | | |
Mizuho Markets Cayman LP, ELN, 62.85%, 1/31/2025, (linked to Nasdaq-100 Index) (Japan) (b) | | |
National Bank of Canada, ELN, 52.50%, 1/7/2025, (linked to Nasdaq-100 Index) (b) | | |
National Bank of Canada, ELN, 63.10%, 2/7/2025, (linked to Nasdaq-100 Index) (b) | | |
Royal Bank of Canada, ELN, 51.21%, 1/21/2025, (linked to Nasdaq-100 Index) (Canada) (b) | | |
Societe Generale SA, ELN, 58.57%, 1/24/2025, (linked to Nasdaq-100 Index) (b) | | |
UBS AG, ELN, 50.87%, 1/13/2025, (linked to Nasdaq-100 Index) (Switzerland) (b) | | |
Total Equity-Linked Notes
(Cost $3,559,913,378) | | |
SEE NOTES TO FINANCIAL STATEMENTS.
| J.P. Morgan Exchange-Traded Funds | |
| | |
Short-Term Investments — 1.3% |
Investment Companies — 1.2% |
JPMorgan U.S. Government Money Market Fund Class IM Shares, 4.44% (c) (d)
(Cost $243,052,364) | | |
Investment of Cash Collateral from Securities Loaned — 0.1% |
JPMorgan Securities Lending Money Market Fund Agency SL Class Shares, 4.47% (c) (d)
(Cost $27,864,990) | | |
Total Short-Term Investments
(Cost $270,917,354) | | |
Total Investments — 100.0%
(Cost $17,764,173,782) | | |
Liabilities in Excess of Other Assets — (0.0)% ^ | | |
| | |
Percentages indicated are based on net assets. |
| |
| American Depositary Receipt |
| |
| |
| Real Estate Investment Trust |
| Amount rounds to less than 0.1% of net assets. |
| Non-income producing security. | |
| The security or a portion of this security is on loan at December 31, 2024. The total value of securities on loan at December 31, 2024 is $26,034,521. | |
| Securities exempt from registration under Rule 144A or section 4(a)(2), of the Securities Act of 1933, as amended. | |
| Investment in an affiliated fund, which is registered under the Investment Company Act of 1940, as amended, and is advised by J.P. Morgan Investment Management Inc. | |
| The rate shown is the current yield as of December 31, 2024. | |
SEE NOTES TO FINANCIAL STATEMENTS.
| J.P. Morgan Exchange-Traded Funds | |
JPMorgan Small & Mid Cap Enhanced Equity ETF (formerly known as JPMorgan Market Expansion Enhanced Equity ETF)
SCHEDULE OF PORTFOLIO INVESTMENTSAS OF December 31, 2024 (Unaudited)
| | |
|
Aerospace & Defense — 0.6% |
| | |
| | |
| | |
| | |
| | |
| | |
| | |
Air Freight & Logistics — 0.2% |
| | |
| | |
| | |
Automobile Components — 0.7% |
| | |
American Axle & Manufacturing Holdings, Inc. * | | |
| | |
| | |
| | |
| | |
Goodyear Tire & Rubber Co. (The) * | | |
| | |
| | |
| | |
|
| | |
| | |
Winnebago Industries, Inc. | | |
| | |
|
| | |
| | |
| | |
| | |
| | |
| | |
Berkshire Hills Bancorp, Inc. | | |
| | |
| | |
Capitol Federal Financial, Inc. | | |
Central Pacific Financial Corp. | | |
| | |
Commerce Bancshares, Inc. | | |
Community Financial System, Inc. | | |
| | |
|
|
Cullen/Frost Bankers, Inc. | | |
Customers Bancorp, Inc. * | | |
| | |
Dime Community Bancshares, Inc. | | |
| | |
| | |
First BanCorp (Puerto Rico) | | |
| | |
| | |
| | |
| | |
| | |
| | |
| | |
| | |
National Bank Holdings Corp., Class A | | |
OFG Bancorp (Puerto Rico) | | |
| | |
| | |
Pinnacle Financial Partners, Inc. | | |
| | |
Prosperity Bancshares, Inc. | | |
| | |
Seacoast Banking Corp. of Florida | | |
Southside Bancshares, Inc. | | |
| | |
Texas Capital Bancshares, Inc. * | | |
| | |
| | |
United Community Banks, Inc. | | |
| | |
| | |
| | |
| | |
| | |
| | |
| | |
|
| | |
Coca-Cola Consolidated, Inc. | | |
| | |
|
Arrowhead Pharmaceuticals, Inc. * | | |
SEE NOTES TO FINANCIAL STATEMENTS.
| J.P. Morgan Exchange-Traded Funds | |
| | |
Common Stocks — continued |
Biotechnology — continued |
| | |
Halozyme Therapeutics, Inc. * | | |
Neurocrine Biosciences, Inc. * | | |
Protagonist Therapeutics, Inc. * | | |
Sarepta Therapeutics, Inc. * | | |
United Therapeutics Corp. * | | |
Vir Biotechnology, Inc. * | | |
| | |
|
| | |
| | |
Ollie's Bargain Outlet Holdings, Inc. * | | |
| | |
|
| | |
Advanced Drainage Systems, Inc. | | |
| | |
| | |
| | |
Fortune Brands Innovations, Inc. | | |
Gibraltar Industries, Inc. * | | |
| | |
Lennox International, Inc. | | |
| | |
Quanex Building Products Corp. | | |
Resideo Technologies, Inc. * | | |
Simpson Manufacturing Co., Inc. | | |
| | |
| | |
| | |
|
Affiliated Managers Group, Inc. | | |
| | |
Brightsphere Investment Group, Inc. | | |
Carlyle Group, Inc. (The) | | |
Donnelley Financial Solutions, Inc. * | | |
| | |
| | |
Interactive Brokers Group, Inc., Class A | | |
Janus Henderson Group plc | | |
Jefferies Financial Group, Inc. | | |
| | |
| | |
| | |
|
Capital Markets — continued |
| | |
| | |
| | |
Virtu Financial, Inc., Class A | | |
Virtus Investment Partners, Inc. | | |
| | |
| | |
|
| | |
Arcadium Lithium plc (Argentina) * | | |
| | |
| | |
Axalta Coating Systems Ltd. * | | |
| | |
| | |
| | |
| | |
| | |
| | |
| | |
| | |
Minerals Technologies, Inc. | | |
| | |
Sensient Technologies Corp. | | |
| | |
Commercial Services & Supplies — 1.8% |
| | |
| | |
| | |
| | |
| | |
| | |
| | |
| | |
| | |
| | |
| | |
| | |
| | |
Communications Equipment — 0.6% |
| | |
SEE NOTES TO FINANCIAL STATEMENTS.
| J.P. Morgan Exchange-Traded Funds | |
JPMorgan Small & Mid Cap Enhanced Equity ETF (formerly known as JPMorgan Market Expansion Enhanced Equity ETF)
SCHEDULE OF PORTFOLIO INVESTMENTSAS OF December 31, 2024 (Unaudited) (continued)
| | |
Common Stocks — continued |
Communications Equipment — continued |
Digi International, Inc. * | | |
Lumentum Holdings, Inc. * | | |
| | |
Construction & Engineering — 3.0% |
| | |
| | |
Comfort Systems USA, Inc. | | |
| | |
| | |
Everus Construction Group, Inc. * | | |
| | |
Granite Construction, Inc. (a) | | |
| | |
| | |
| | |
| | |
Construction Materials — 0.2% |
| | |
| | |
| | |
|
| | |
Encore Capital Group, Inc. * | | |
Enova International, Inc. * | | |
| | |
| | |
| | |
| | |
Consumer Staples Distribution & Retail — 2.4% |
| | |
BJ's Wholesale Club Holdings, Inc. * | | |
Casey's General Stores, Inc. | | |
Chefs' Warehouse, Inc. (The) * | | |
Performance Food Group Co. * | | |
| | |
Sprouts Farmers Market, Inc. * | | |
United Natural Foods, Inc. * | | |
| | |
| | |
Containers & Packaging — 1.3% |
| | |
| | |
| | |
|
Containers & Packaging — continued |
| | |
| | |
| | |
| | |
| | |
Diversified Consumer Services — 1.5% |
Adtalem Global Education, Inc. * | | |
| | |
| | |
Graham Holdings Co., Class B | | |
Grand Canyon Education, Inc. * | | |
| | |
| | |
Service Corp. International | | |
Strategic Education, Inc. | | |
| | |
| | |
|
Alexander & Baldwin, Inc. | | |
American Assets Trust, Inc. | | |
Armada Hoffler Properties, Inc. | | |
Essential Properties Realty Trust, Inc. | | |
| | |
| | |
Diversified Telecommunication Services — 0.6% |
Frontier Communications Parent, Inc. * | | |
Iridium Communications, Inc. | | |
Lumen Technologies, Inc. * | | |
| | |
Electric Utilities — 0.8% |
| | |
| | |
| | |
Electrical Equipment — 1.1% |
| | |
| | |
NEXTracker, Inc., Class A * | | |
| | |
| | |
| | |
| | |
SEE NOTES TO FINANCIAL STATEMENTS.
| J.P. Morgan Exchange-Traded Funds | |
| | |
Common Stocks — continued |
Electronic Equipment, Instruments & Components — 2.7% |
Advanced Energy Industries, Inc. | | |
Arrow Electronics, Inc. * | | |
| | |
| | |
Benchmark Electronics, Inc. | | |
| | |
| | |
| | |
| | |
| | |
| | |
Energy Equipment & Services — 1.1% |
| | |
| | |
| | |
| | |
| | |
| | |
Oceaneering International, Inc. * | | |
Patterson-UTI Energy, Inc. | | |
| | |
| | |
Weatherford International plc | | |
| | |
|
Cinemark Holdings, Inc. * | | |
TKO Group Holdings, Inc. * | | |
| | |
Financial Services — 2.7% |
| | |
| | |
Euronet Worldwide, Inc. * | | |
EVERTEC, Inc. (Puerto Rico) | | |
Jackson Financial, Inc., Class A | | |
| | |
| | |
| | |
NMI Holdings, Inc., Class A * | | |
| | |
| | |
| | |
| | |
|
Financial Services — continued |
| | |
| | |
| | |
|
| | |
Darling Ingredients, Inc. * | | |
| | |
Fresh Del Monte Produce, Inc. | | |
| | |
John B Sanfilippo & Son, Inc. | | |
| | |
| | |
Simply Good Foods Co. (The) * | | |
| | |
| | |
|
Chesapeake Utilities Corp. | | |
MDU Resources Group, Inc. | | |
| | |
Southwest Gas Holdings, Inc. | | |
| | |
| | |
| | |
Ground Transportation — 1.1% |
| | |
Avis Budget Group, Inc. * | | |
Knight-Swift Transportation Holdings, Inc. | | |
| | |
| | |
| | |
| | |
| | |
Health Care Equipment & Supplies — 2.7% |
| | |
| | |
| | |
Globus Medical, Inc., Class A * | | |
| | |
| | |
Integra LifeSciences Holdings Corp. * | | |
Lantheus Holdings, Inc. * | | |
| | |
SEE NOTES TO FINANCIAL STATEMENTS.
| J.P. Morgan Exchange-Traded Funds | |
JPMorgan Small & Mid Cap Enhanced Equity ETF (formerly known as JPMorgan Market Expansion Enhanced Equity ETF)
SCHEDULE OF PORTFOLIO INVESTMENTSAS OF December 31, 2024 (Unaudited) (continued)
| | |
Common Stocks — continued |
Health Care Equipment & Supplies — continued |
Merit Medical Systems, Inc. * | | |
| | |
| | |
Tandem Diabetes Care, Inc. * | | |
| | |
Health Care Providers & Services — 2.0% |
Acadia Healthcare Co., Inc. * | | |
| | |
| | |
AMN Healthcare Services, Inc. * | | |
| | |
| | |
| | |
| | |
| | |
| | |
Option Care Health, Inc. * | | |
| | |
| | |
| | |
|
| | |
Healthcare Realty Trust, Inc. | | |
Omega Healthcare Investors, Inc. | | |
Sabra Health Care REIT, Inc. | | |
| | |
Health Care Technology — 0.1% |
| | |
| | |
| | |
Hotel & Resort REITs — 0.3% |
Apple Hospitality REIT, Inc. | | |
DiamondRock Hospitality Co. | | |
Park Hotels & Resorts, Inc. | | |
Sunstone Hotel Investors, Inc. | | |
Xenia Hotels & Resorts, Inc. | | |
| | |
Hotels, Restaurants & Leisure — 3.2% |
| | |
| | |
| | |
| | |
| | |
|
Hotels, Restaurants & Leisure — continued |
Brinker International, Inc. * | | |
| | |
Dave & Buster's Entertainment, Inc. * | | |
Golden Entertainment, Inc. | | |
Hilton Grand Vacations, Inc. * | | |
Hyatt Hotels Corp., Class A | | |
| | |
Marriott Vacations Worldwide Corp. | | |
Monarch Casino & Resort, Inc. | | |
Penn Entertainment, Inc. * | | |
Planet Fitness, Inc., Class A * | | |
Shake Shack, Inc., Class A * | | |
Six Flags Entertainment Corp. | | |
| | |
| | |
| | |
| | |
| | |
Household Durables — 2.0% |
| | |
Century Communities, Inc. | | |
Green Brick Partners, Inc. * | | |
Installed Building Products, Inc. | | |
| | |
| | |
| | |
| | |
| | |
Taylor Morrison Home Corp. * | | |
Tempur Sealy International, Inc. | | |
| | |
| | |
| | |
| | |
Household Products — 0.1% |
Central Garden & Pet Co., Class A * | | |
Independent Power and Renewable Electricity Producers — 0.1% |
Clearway Energy, Inc., Class C | | |
|
EastGroup Properties, Inc. | | |
First Industrial Realty Trust, Inc. | | |
SEE NOTES TO FINANCIAL STATEMENTS.
| J.P. Morgan Exchange-Traded Funds | |
| | |
Common Stocks — continued |
Industrial REITs — continued |
| | |
| | |
| | |
|
American Financial Group, Inc. | | |
| | |
Brighthouse Financial, Inc. * | | |
CNO Financial Group, Inc. | | |
Fidelity National Financial, Inc. | | |
First American Financial Corp. | | |
Genworth Financial, Inc., Class A * | | |
Horace Mann Educators Corp. | | |
| | |
Kinsale Capital Group, Inc. | | |
Old Republic International Corp. | | |
| | |
Reinsurance Group of America, Inc. | | |
RenaissanceRe Holdings Ltd. (Bermuda) | | |
| | |
| | |
| | |
Interactive Media & Services — 0.7% |
| | |
| | |
| | |
| | |
| | |
| | |
ZoomInfo Technologies, Inc. * | | |
| | |
|
| | |
|
| | |
| | |
| | |
| | |
Life Sciences Tools & Services — 0.9% |
| | |
| | |
| | |
| | |
|
Life Sciences Tools & Services — continued |
| | |
| | |
| | |
|
| | |
| | |
| | |
| | |
| | |
| | |
| | |
| | |
Franklin Electric Co., Inc. | | |
| | |
Greenbrier Cos., Inc. (The) | | |
| | |
Lincoln Electric Holdings, Inc. | | |
| | |
| | |
| | |
| | |
Standex International Corp. | | |
| | |
| | |
| | |
| | |
Watts Water Technologies, Inc., Class A | | |
| | |
Marine Transportation — 0.4% |
| | |
| | |
| | |
|
John Wiley & Sons, Inc., Class A | | |
New York Times Co. (The), Class A | | |
| | |
| | |
|
| | |
Alpha Metallurgical Resources, Inc. * | | |
| | |
| | |
SEE NOTES TO FINANCIAL STATEMENTS.
| J.P. Morgan Exchange-Traded Funds | |
JPMorgan Small & Mid Cap Enhanced Equity ETF (formerly known as JPMorgan Market Expansion Enhanced Equity ETF)
SCHEDULE OF PORTFOLIO INVESTMENTSAS OF December 31, 2024 (Unaudited) (continued)
| | |
Common Stocks — continued |
Metals & Mining — continued |
Carpenter Technology Corp. | | |
| | |
| | |
| | |
| | |
| | |
| | |
United States Steel Corp. | | |
| | |
| | |
Mortgage Real Estate Investment Trusts (REITs) — 0.4% |
Annaly Capital Management, Inc. | | |
Ellington Financial, Inc. (a) | | |
KKR Real Estate Finance Trust, Inc. | | |
PennyMac Mortgage Investment Trust | | |
Starwood Property Trust, Inc. | | |
| | |
|
Northwestern Energy Group, Inc. | | |
| | |
| | |
|
| | |
| | |
| | |
Highwoods Properties, Inc. | | |
| | |
| | |
| | |
Oil, Gas & Consumable Fuels — 3.6% |
| | |
| | |
California Resources Corp. | | |
| | |
| | |
| | |
| | |
| | |
| | |
| | |
| | |
| | |
| | |
|
Oil, Gas & Consumable Fuels — continued |
Magnolia Oil & Gas Corp., Class A | | |
| | |
| | |
| | |
PBF Energy, Inc., Class A | | |
| | |
| | |
REX American Resources Corp. * | | |
| | |
| | |
| | |
| | |
Paper & Forest Products — 0.2% |
| | |
Passenger Airlines — 0.7% |
| | |
| | |
American Airlines Group, Inc. * | | |
| | |
| | |
Sun Country Airlines Holdings, Inc. * | | |
| | |
Personal Care Products — 0.6% |
| | |
Edgewell Personal Care Co. | | |
| | |
| | |
|
Corcept Therapeutics, Inc. * | | |
Jazz Pharmaceuticals plc * | | |
Prestige Consumer Healthcare, Inc. * | | |
Supernus Pharmaceuticals, Inc. * | | |
| | |
Professional Services — 2.3% |
CACI International, Inc., Class A * | | |
| | |
ExlService Holdings, Inc. * | | |
| | |
| | |
| | |
Heidrick & Struggles International, Inc. | | |
| | |
SEE NOTES TO FINANCIAL STATEMENTS.
| J.P. Morgan Exchange-Traded Funds | |
| | |
Common Stocks — continued |
Professional Services — continued |
| | |
| | |
| | |
| | |
Paylocity Holding Corp. * | | |
Science Applications International Corp. | | |
| | |
Real Estate Management & Development — 0.5% |
Cushman & Wakefield plc * | | |
eXp World Holdings, Inc. (a) | | |
Jones Lang LaSalle, Inc. * | | |
| | |
|
American Homes 4 Rent, Class A | | |
| | |
Equity LifeStyle Properties, Inc. | | |
Independence Realty Trust, Inc. | | |
| | |
| | |
|
| | |
Brixmor Property Group, Inc. | | |
Curbline Properties Corp. | | |
| | |
| | |
| | |
| | |
Phillips Edison & Co., Inc. | | |
Retail Opportunity Investments Corp. | | |
| | |
| | |
| | |
Semiconductors & Semiconductor Equipment — 2.6% |
Axcelis Technologies, Inc. * | | |
| | |
| | |
| | |
| | |
Kulicke & Soffa Industries, Inc. (Singapore) | | |
Lattice Semiconductor Corp. * | | |
| | |
| | |
| | |
|
Semiconductors & Semiconductor Equipment — continued |
| | |
Penguin Solutions, Inc. * | | |
| | |
| | |
| | |
| | |
| | |
Ultra Clean Holdings, Inc. * | | |
| | |
Veeco Instruments, Inc. * | | |
| | |
| | |
|
| | |
| | |
Appfolio, Inc., Class A * | | |
DoubleVerify Holdings, Inc. * | | |
| | |
| | |
| | |
LiveRamp Holdings, Inc. * | | |
Manhattan Associates, Inc. * | | |
MARA Holdings, Inc. * (a) | | |
| | |
| | |
| | |
| | |
| | |
| | |
|
| | |
| | |
Four Corners Property Trust, Inc. | | |
Gaming and Leisure Properties, Inc. | | |
Lamar Advertising Co., Class A | | |
| | |
| | |
| | |
|
Abercrombie & Fitch Co., Class A * | | |
Academy Sports & Outdoors, Inc. | | |
American Eagle Outfitters, Inc. | | |
Asbury Automotive Group, Inc. * | | |
SEE NOTES TO FINANCIAL STATEMENTS.
| J.P. Morgan Exchange-Traded Funds | |
JPMorgan Small & Mid Cap Enhanced Equity ETF (formerly known as JPMorgan Market Expansion Enhanced Equity ETF)
SCHEDULE OF PORTFOLIO INVESTMENTSAS OF December 31, 2024 (Unaudited) (continued)
| | |
Common Stocks — continued |
Specialty Retail — continued |
| | |
| | |
Boot Barn Holdings, Inc. * | | |
| | |
Burlington Stores, Inc. * | | |
| | |
| | |
Dick's Sporting Goods, Inc. | | |
| | |
Floor & Decor Holdings, Inc., Class A * | | |
| | |
GameStop Corp., Class A * (a) | | |
| | |
| | |
| | |
Lithia Motors, Inc., Class A | | |
| | |
| | |
Penske Automotive Group, Inc. | | |
| | |
| | |
| | |
Sonic Automotive, Inc., Class A | | |
| | |
| | |
Victoria's Secret & Co. * | | |
| | |
| | |
Technology Hardware, Storage & Peripherals — 0.7% |
Pure Storage, Inc., Class A * | | |
Textiles, Apparel & Luxury Goods — 1.5% |
| | |
| | |
| | |
G-III Apparel Group Ltd. * | | |
| | |
| | |
| | |
Skechers U.S.A., Inc., Class A * | | |
| | |
Under Armour, Inc., Class A * | | |
| | |
|
Textiles, Apparel & Luxury Goods — continued |
| | |
Wolverine World Wide, Inc. | | |
| | |
Trading Companies & Distributors — 1.7% |
Applied Industrial Technologies, Inc. | | |
| | |
Core & Main, Inc., Class A * | | |
| | |
| | |
| | |
MSC Industrial Direct Co., Inc., Class A | | |
Rush Enterprises, Inc., Class A | | |
| | |
WESCO International, Inc. | | |
| | |
|
American States Water Co. | | |
California Water Service Group | | |
Essential Utilities, Inc. | | |
| | |
Wireless Telecommunication Services — 0.1% |
| | |
Telephone and Data Systems, Inc. | | |
| | |
Total Common Stocks
(Cost $1,304,932,329) | | |
Short-Term Investments — 1.1% |
Investment Companies — 0.3% |
JPMorgan U.S. Government Money Market Fund Class IM Shares, 4.44% (b) (c)
(Cost $3,753,998) | | |
SEE NOTES TO FINANCIAL STATEMENTS.
| J.P. Morgan Exchange-Traded Funds | |
| | |
Short-Term Investments — continued |
Investment of Cash Collateral from Securities Loaned — 0.8% |
JPMorgan Securities Lending Money Market Fund Agency SL Class Shares, 4.47% (b) (c)
(Cost $13,191,090) | | |
Total Short-Term Investments
(Cost $16,945,088) | | |
Total Investments — 100.0%
(Cost $1,321,877,417) | | |
Other Assets in Excess of Liabilities — 0.0% ^ | | |
| | |
Percentages indicated are based on net assets. |
| |
| Real Estate Investment Trust |
| Amount rounds to less than 0.1% of net assets. |
| Non-income producing security. | |
| The security or a portion of this security is on loan at December 31, 2024. The total value of securities on loan at December 31, 2024 is $12,707,832. | |
| Investment in an affiliated fund, which is registered under the Investment Company Act of 1940, as amended, and is advised by J.P. Morgan Investment Management Inc. | |
| The rate shown is the current yield as of December 31, 2024. | |
Futures contracts outstanding as of December 31, 2024:
| | | | | VALUE AND
UNREALIZED
APPRECIATION
(DEPRECIATION) ($) |
| | | | | |
Russell 2000 E-Mini Index | | | | | |
S&P Midcap 400 E-Mini Index | | | | | |
| | | | | |
SEE NOTES TO FINANCIAL STATEMENTS.
| J.P. Morgan Exchange-Traded Funds | |
JPMorgan U.S. Tech Leaders ETF
SCHEDULE OF PORTFOLIO INVESTMENTSAS OF December 31, 2024 (Unaudited)
| | |
|
|
| | |
|
NU Holdings Ltd., Class A (Brazil) * | | |
|
Alibaba Group Holding Ltd., ADR (China) | | |
| | |
MercadoLibre, Inc. (Brazil) * | | |
| | |
|
Robinhood Markets, Inc., Class A * | | |
Communications Equipment — 3.3% |
| | |
| | |
| | |
Electrical Equipment — 0.8% |
| | |
|
| | |
Sea Ltd., ADR (Singapore) * | | |
| | |
Take-Two Interactive Software, Inc. * | | |
| | |
Ground Transportation — 1.2% |
Uber Technologies, Inc. * | | |
Health Care Technology — 1.6% |
Veeva Systems, Inc., Class A * | | |
Hotels, Restaurants & Leisure — 1.7% |
| | |
|
| | |
Interactive Media & Services — 8.6% |
| | |
Meta Platforms, Inc., Class A | | |
| | |
| | |
| | |
|
| | |
Shopify, Inc., Class A (Canada) * | | |
| | |
|
|
Snowflake, Inc., Class A * | | |
| | |
| | |
Life Sciences Tools & Services — 0.3% |
| | |
|
Trade Desk, Inc. (The), Class A * | | |
Semiconductors & Semiconductor Equipment — 19.3% |
Allegro MicroSystems, Inc. (Japan) * | | |
ASML Holding NV (Registered), NYRS (Netherlands) | | |
| | |
| | |
Credo Technology Group Holding Ltd. * | | |
| | |
| | |
Monolithic Power Systems, Inc. | | |
| | |
| | |
| | |
Taiwan Semiconductor Manufacturing Co. Ltd., ADR (Taiwan) | | |
| | |
|
AppLovin Corp., Class A * | | |
Atlassian Corp., Class A * | | |
Confluent, Inc., Class A * | | |
Crowdstrike Holdings, Inc., Class A * | | |
| | |
| | |
| | |
Guidewire Software, Inc. * | | |
| | |
| | |
Manhattan Associates, Inc. * | | |
| | |
| | |
Palantir Technologies, Inc., Class A * | | |
Palo Alto Networks, Inc. * | | |
Procore Technologies, Inc. * | | |
| | |
SEE NOTES TO FINANCIAL STATEMENTS.
| J.P. Morgan Exchange-Traded Funds | |
| | |
Common Stocks — continued |
|
| | |
Zoom Communications, Inc. * | | |
| | |
Technology Hardware, Storage & Peripherals — 1.1% |
| | |
Total Common Stocks
(Cost $770,161,057) | | |
Short-Term Investments — 3.8% |
Investment Companies — 3.3% |
JPMorgan U.S. Government Money Market Fund Class IM Shares, 4.44% (b) (c)
(Cost $30,918,464) | | |
Investment of Cash Collateral from Securities Loaned — 0.5% |
JPMorgan Securities Lending Money Market Fund Agency SL Class Shares, 4.47% (b) (c)
(Cost $4,241,878) | | |
Total Short-Term Investments
(Cost $35,160,342) | | |
Total Investments — 100.5%
(Cost $805,321,399) | | |
Liabilities in Excess of Other Assets — (0.5)% | | |
| | |
Percentages indicated are based on net assets. |
| |
| American Depositary Receipt |
| |
| Non-income producing security. |
| The security or a portion of this security is on loan at December 31, 2024. The total value of securities on loan at December 31, 2024 is $4,053,657. |
| Investment in an affiliated fund, which is registered under the Investment Company Act of 1940, as amended, and is advised by J.P. Morgan Investment Management Inc. |
| The rate shown is the current yield as of December 31, 2024. |
SEE NOTES TO FINANCIAL STATEMENTS.
| J.P. Morgan Exchange-Traded Funds | |
STATEMENTS OF ASSETS AND LIABILITIESAS OF December 31, 2024 (Unaudited)
| | JPMorgan
Active Small Cap
Value ETF | | JPMorgan
Equity Premium
Income ETF |
| | | | |
Investments in non-affiliates, at value | | | | |
Investments in affiliates, at value | | | | |
| | | | |
| | | | |
| | | | |
Investment securities sold | | | | |
| | | | |
Interest from non-affiliates | | | | |
Dividends from non-affiliates | | | | |
Dividends from affiliates | | | | |
| | | | |
| | | | |
| | | | |
| | | | |
Investment securities purchased | | | | |
| | | | |
Management fees (See Note 3.A.) | | | | |
| | | | |
| | | | |
| | | | |
| | | | |
Total distributable earnings (loss) | | | | |
| | | | |
Outstanding number of shares
(unlimited number of shares authorized - par value $0.0001) | | | | |
Net asset value, per share | | | | |
Cost of investments in non-affiliates | | | | |
Cost of investments in affiliates | | | | |
SEE NOTES TO FINANCIAL STATEMENTS.
| J.P. Morgan Exchange-Traded Funds | |
| JPMorgan
Fundamental Data
Science Large
Core ETF | JPMorgan
Fundamental Data
Science Mid
Core ETF | JPMorgan
Fundamental Data
Science Small
Core ETF | JPMorgan
Nasdaq Equity
Premium Income ETF |
| | | | |
Investments in non-affiliates, at value | | | | |
Investments in affiliates, at value | | | | |
Investments of cash collateral received from securities loaned, at value (See Note 2.C.) | | | | |
| | | | |
Deposits at broker for futures contracts | | | | |
| | | | |
Investment securities sold | | | | |
| | | | |
Interest from non-affiliates | | | | |
Dividends from non-affiliates | | | | |
Dividends from affiliates | | | | |
Securities lending income (See Note 2.C.) | | | | |
Variation margin on futures contracts | | | | |
| | | | |
| | | | |
| | | | |
| | | | |
Investment securities purchased | | | | |
Collateral received on securities loaned (See Note 2.C.) | | | | |
| | | | |
Management fees (See Note 3.A.) | | | | |
| | | | |
| | | | |
| | | | |
| | | | |
Total distributable earnings (loss) | | | | |
| | | | |
Outstanding number of shares
(unlimited number of shares authorized - par value $0.0001) | | | | |
Net asset value, per share | | | | |
Cost of investments in non-affiliates | | | | |
Cost of investments in affiliates | | | | |
Investment securities on loan, at value (See Note 2.C.) | | | | |
Cost of investment of cash collateral (See Note 2.C.) | | | | |
SEE NOTES TO FINANCIAL STATEMENTS.
| J.P. Morgan Exchange-Traded Funds | |
STATEMENTS OF ASSETS AND LIABILITIESAS OF December 31, 2024 (Unaudited) (continued)
| JPMorgan
Small & Mid Cap
Enhanced Equity ETF
(formerly known as
JPMorgan Market
Expansion Enhanced
Equity ETF) | JPMorgan
U.S. Tech
Leaders ETF |
| | |
Investments in non-affiliates, at value | | |
Investments in affiliates, at value | | |
Investments of cash collateral received from securities loaned, at value (See Note 2.C.) | | |
| | |
Deposits at broker for futures contracts | | |
| | |
| | |
Dividends from non-affiliates | | |
Dividends from affiliates | | |
Securities lending income (See Note 2.C.) | | |
Variation margin on futures contracts | | |
| | |
| | |
| | |
| | |
| | |
Collateral received on securities loaned (See Note 2.C.) | | |
| | |
| | |
| | |
Management fees (See Note 3.A.) | | |
Custodian and accounting fees | | |
Trustees’ and Chief Compliance Officer’s fees | | |
| | |
| | |
| | |
| | |
| | |
Total distributable earnings (loss) | | |
| | |
Outstanding number of shares
(unlimited number of shares authorized - par value $0.0001) | | |
Net asset value, per share | | |
Cost of investments in non-affiliates | | |
Cost of investments in affiliates | | |
Investment securities on loan, at value (See Note 2.C.) | | |
Cost of investment of cash collateral (See Note 2.C.) | | |
SEE NOTES TO FINANCIAL STATEMENTS.
| J.P. Morgan Exchange-Traded Funds | |
STATEMENTS OF OPERATIONSFOR THE SIX MONTHS ENDED December 31, 2024 (Unaudited)
| | JPMorgan
Active Small Cap
Value ETF | | JPMorgan
Equity Premium
Income ETF |
| | | | |
Interest income from non-affiliates | | | | |
Interest income from affiliates | | | | |
Dividend income from non-affiliates | | | | |
Dividend income from affiliates | | | | |
Income from securities lending (net) (See Note 2.C.) | | | | |
| | | | |
| | | | |
Management fees (See Note 3.A.) | | | | |
Interest expense to non-affiliates | | | | |
Interest expense to affiliates | | | | |
| | | | |
Net investment income (loss) | | | | |
REALIZED/UNREALIZED GAINS (LOSSES): | | | | |
Net realized gain (loss) on transactions from: | | | | |
Investments in non-affiliates | | | | |
In-kind redemptions of investments in non-affiliates (See Note 4) | | | | |
| | | | |
| | | | |
Change in net unrealized appreciation/depreciation on: | | | | |
Investments in non-affiliates | | | | |
| | | | |
Change in net unrealized appreciation/depreciation | | | | |
Net realized/unrealized gains (losses) | | | | |
Change in net assets resulting from operations | | | | |
SEE NOTES TO FINANCIAL STATEMENTS.
| J.P. Morgan Exchange-Traded Funds | |
STATEMENTS OF OPERATIONSFOR THE SIX MONTHS ENDED December 31, 2024 (Unaudited) (continued)
| JPMorgan
Fundamental Data
Science Large
Core ETF (a) | JPMorgan
Fundamental Data
Science Mid
Core ETF (a) | JPMorgan
Fundamental Data
Science Small
Core ETF (a) | |
| | | | |
Interest income from non-affiliates | | | | |
Interest income from affiliates | | | | |
Dividend income from non-affiliates | | | | |
Dividend income from affiliates | | | | |
Income from securities lending (net) (See Note 2.C.) | | | | |
| | | | |
| | | | |
Management fees (See Note 3.A.) | | | | |
Interest expense to non-affiliates | | | | |
Interest expense to affiliates | | | | |
| | | | |
Net investment income (loss) | | | | |
REALIZED/UNREALIZED GAINS (LOSSES): | | | | |
Net realized gain (loss) on transactions from: | | | | |
Investments in non-affiliates | | | | |
In-kind redemptions of investments in non-affiliates (See Note 4) | | | | |
| | | | |
| | | | |
Change in net unrealized appreciation/depreciation on: | | | | |
Investments in non-affiliates | | | | |
| | | | |
Change in net unrealized appreciation/depreciation | | | | |
Net realized/unrealized gains (losses) | | | | |
Change in net assets resulting from operations | | | | |
(a)
Commencement of operations was August 7, 2024.
SEE NOTES TO FINANCIAL STATEMENTS.
| J.P. Morgan Exchange-Traded Funds | |
| JPMorgan
Small & Mid Cap
Enhanced Equity ETF
(formerly known as
JPMorgan Market
Expansion Enhanced
Equity ETF) | JPMorgan
U.S. Tech
Leaders ETF |
| | |
Interest income from non-affiliates | | |
Interest income from affiliates | | |
Dividend income from non-affiliates | | |
Dividend income from affiliates | | |
Non-cash dividend income from non-affiliates | | |
Income from securities lending (net) (See Note 2.C.) | | |
| | |
| | |
Management fees (See Note 3.A.) | | |
| | |
| | |
Custodian and accounting fees | | |
Interest expense to non-affiliates | | |
Interest expense to affiliates | | |
| | |
Trustees’ and Chief Compliance Officer’s fees | | |
Printing and mailing costs | | |
Registration and filing fees | | |
| | |
| | |
| | |
Less expense reimbursements | | |
| | |
Net investment income (loss) | | |
REALIZED/UNREALIZED GAINS (LOSSES): | | |
Net realized gain (loss) on transactions from: | | |
Investments in non-affiliates | | |
In-kind redemptions of investments in non-affiliates (See Note 4) | | |
| | |
| | |
Change in net unrealized appreciation/depreciation on: | | |
Investments in non-affiliates | | |
Investments in affiliates | | |
| | |
Change in net unrealized appreciation/depreciation | | |
Net realized/unrealized gains (losses) | | |
Change in net assets resulting from operations | | |
SEE NOTES TO FINANCIAL STATEMENTS.
| J.P. Morgan Exchange-Traded Funds | |
STATEMENTS OF CHANGES IN NET ASSETSFOR THE PERIODS INDICATED
| | JPMorgan
Active Small Cap
Value ETF |
| Six Months Ended
December 31, 2024
(Unaudited) | | Six Months Ended
December 31, 2024
(Unaudited) | |
CHANGE IN NET ASSETS RESULTING FROM OPERATIONS: | | | | |
Net investment income (loss) | | | | |
| | | | |
Change in net unrealized appreciation/depreciation | | | | |
Change in net assets resulting from operations | | | | |
DISTRIBUTIONS TO SHAREHOLDERS: | | | | |
Total distributions to shareholders | | | | |
| | | | |
Change in net assets resulting from capital transactions | | | | |
| | | | |
| | | | |
| | | | |
| | | | |
| | | | |
Proceeds from shares issued | | | | |
| | | | |
Total change in net assets resulting from capital transactions | | | | |
| | | | |
| | | | |
| | | | |
Net increase in shares from share transactions | | | | |
SEE NOTES TO FINANCIAL STATEMENTS.
| J.P. Morgan Exchange-Traded Funds | |
| | JPMorgan Equity
Premium Income ETF |
| Six Months Ended
December 31, 2024
(Unaudited) | | Six Months Ended
December 31, 2024
(Unaudited) | |
CHANGE IN NET ASSETS RESULTING FROM OPERATIONS: | | | | |
Net investment income (loss) | | | | |
| | | | |
Change in net unrealized appreciation/depreciation | | | | |
Change in net assets resulting from operations | | | | |
DISTRIBUTIONS TO SHAREHOLDERS: | | | | |
Total distributions to shareholders | | | | |
| | | | |
Change in net assets resulting from capital transactions | | | | |
| | | | |
| | | | |
| | | | |
| | | | |
| | | | |
Proceeds from shares issued | | | | |
| | | | |
Total change in net assets resulting from capital transactions | | | | |
| | | | |
| | | | |
| | | | |
Net increase in shares from share transactions | | | | |
SEE NOTES TO FINANCIAL STATEMENTS.
| J.P. Morgan Exchange-Traded Funds | |
STATEMENTS OF CHANGES IN NET ASSETSFOR THE PERIODS INDICATED (continued)
| JPMorgan
Fundamental Data
Science Large
Core ETF (a) | JPMorgan
Fundamental Data
Science Mid
Core ETF (a) |
| Period Ended
December 31, 2024
(Unaudited) | Period Ended
December 31, 2024
|
CHANGE IN NET ASSETS RESULTING FROM OPERATIONS: | | |
Net investment income (loss) | | |
| | |
Change in net unrealized appreciation/depreciation | | |
Change in net assets resulting from operations | | |
DISTRIBUTIONS TO SHAREHOLDERS: | | |
Total distributions to shareholders | | |
| | |
Change in net assets resulting from capital transactions | | |
| | |
| | |
| | |
| | |
| | |
Proceeds from shares issued | | |
| | |
Total change in net assets resulting from capital transactions | | |
| | |
| | |
| | |
Net increase in shares from share transactions | | |
(a)
Commencement of operations was August 7, 2024.
SEE NOTES TO FINANCIAL STATEMENTS.
| J.P. Morgan Exchange-Traded Funds | |
| JPMorgan
Fundamental Data
Science Small
Core ETF (a) | JPMorgan Nasdaq Equity Premium Income ETF |
| Period Ended
December 31, 2024
(Unaudited) | Six Months Ended
December 31, 2024
(Unaudited) | |
CHANGE IN NET ASSETS RESULTING FROM OPERATIONS: | | | |
Net investment income (loss) | | | |
| | | |
Change in net unrealized appreciation/depreciation | | | |
Change in net assets resulting from operations | | | |
DISTRIBUTIONS TO SHAREHOLDERS: | | | |
Total distributions to shareholders | | | |
| | | |
Change in net assets resulting from capital transactions | | | |
| | | |
| | | |
| | | |
| | | |
| | | |
Proceeds from shares issued | | | |
| | | |
Total change in net assets resulting from capital transactions | | | |
| | | |
| | | |
| | | |
Net increase in shares from share transactions | | | |
(a)
Commencement of operations was August 7, 2024.
SEE NOTES TO FINANCIAL STATEMENTS.
| J.P. Morgan Exchange-Traded Funds | |
STATEMENTS OF CHANGES IN NET ASSETSFOR THE PERIODS INDICATED (continued)
| JPMorgan
Small & Mid Cap
Enhanced Equity ETF
(formerly known as
JPMorgan Market
Expansion Enhanced
Equity ETF) | JPMorgan
U.S. Tech
Leaders ETF |
| Six Months Ended
December 31, 2024
(Unaudited) | | Six Months Ended
December 31, 2024
(Unaudited) | |
CHANGE IN NET ASSETS RESULTING FROM OPERATIONS: | | | | |
Net investment income (loss) | | | | |
| | | | |
Change in net unrealized appreciation/depreciation | | | | |
Change in net assets resulting from operations | | | | |
DISTRIBUTIONS TO SHAREHOLDERS: | | | | |
Total distributions to shareholders | | | | |
| | | | |
Change in net assets resulting from capital transactions | | | | |
| | | | |
| | | | |
| | | | |
| | | | |
| | | | |
Proceeds from shares issued | | | | |
| | | | |
Total change in net assets resulting from capital transactions | | | | |
| | | | |
| | | | |
| | | | |
Net increase in shares from share transactions | | | | |
(a)
Commencement of operations was October 4, 2023.
SEE NOTES TO FINANCIAL STATEMENTS.
| J.P. Morgan Exchange-Traded Funds | |
THIS PAGE IS INTENTIONALLY LEFT BLANK
FINANCIAL HIGHLIGHTSFOR THE PERIODS INDICATED
| Per share operating performance |
| | | |
| Net asset
value,
beginning
of period | Net
investment
income
(loss) (b) | Net realized
and unrealized
gains
(losses)
on investments | Total from
investment
operations | | | |
JPMorgan Active Growth ETF | | | | | | | |
Six Months Ended December 31, 2024 (Unaudited) | | | | | | | |
| | | | | | | |
August 8, 2022 (f) through June 30, 2023 | | | | | | | |
JPMorgan Active Small Cap Value ETF | | | | | | | |
Six Months Ended December 31, 2024 (Unaudited) | | | | | | | |
| | | | | | | |
March 7, 2023 (f) through June 30, 2023 | | | | | | | |
JPMorgan Active Value ETF | | | | | | | |
Six Months Ended December 31, 2024 (Unaudited) | | | | | | | |
| | | | | | | |
| | | | | | | |
October 4, 2021 (f) through June 30, 2022 | | | | | | | |
JPMorgan Equity Premium Income ETF | | | | | | | |
Six Months Ended December 31, 2024 (Unaudited) | | | | | | | |
| | | | | | | |
| | | | | | | |
| | | | | | | |
| | | | | | | |
May 20, 2020 (f) through June 30, 2020 | | | | | | | |
JPMorgan Fundamental Data Science Large Core ETF | | | | | | | |
August 7, 2024 (f) through December 31, 2024 (Unaudited) | | | | | | | |
|
| Annualized for periods less than one year, unless otherwise noted. |
| Calculated based upon average shares outstanding. |
| Not annualized for periods less than one year. |
| Includes adjustments in accordance with accounting principles generally accepted in the United States of America and as such, the net asset values for financial reporting purposes and the returns based upon those net asset values may differ from the net asset values and returns for shareholder transactions. |
| Market price return was calculated assuming an initial investment made at the market price at the beginning of the reporting period, reinvestment of all dividends and distributions at the market price during the period, and sale at the market price on the last day of the period. The closing price was used to calculate the market price return. |
| Commencement of operations. |
| Since the shares of the Fund did not trade in the secondary market until the day after the Fund’s inception, for the period from the inception to the first day of secondary market trading, the net asset value is used as a proxy for the secondary market trading price to calculate the market returns. |
| Calculation of the net realized and unrealized gains (losses) per share does not correlate with the Fund’s net realized and unrealized gains (losses) presented in the Statements of Operations due to the timing of capital transactions in relation to the fluctuating market values of the Fund’s investments. |
| J.P. Morgan Exchange-Traded Funds | |
| |
| | | | | Ratios to average net assets (a) | |
Net asset
value,
end of
period | | | Market
price
total
return (c)(e) | | | Net
investment
income
(loss) | Portfolio
turnover
rate (c) |
| | | | | | | |
| | | | | | | |
| | | | | | | |
| | | | | | | |
| | | | | | | |
| | | | | | | |
| | | | | | | |
| | | | | | | |
| | | | | | | |
| | | | | | | |
| | | | | | | |
| | | | | | | |
| | | | | | | |
| | | | | | | |
| | | | | | | |
| | | | | | | |
| | | | | | | |
| | | | | | | |
| | | | | | | |
| | | | | | | |
| | | | | | | |
| | | | | | | |
| J.P. Morgan Exchange-Traded Funds | |
FINANCIAL HIGHLIGHTSFOR THE PERIODS INDICATED (continued)
| Per share operating performance |
| | | |
| Net asset
value,
beginning
of period | Net
investment
income
(loss) (b) | Net realized
and unrealized
gains
(losses)
on investments | Total from
investment
operations | | | |
JPMorgan Fundamental Data Science Mid Core ETF | | | | | | | |
August 7, 2024 (f) through December 31, 2024 (Unaudited) | | | | | | | |
JPMorgan Fundamental Data Science Small Core ETF | | | | | | | |
August 7, 2024 (f) through December 31, 2024 (Unaudited) | | | | | | | |
JPMorgan Nasdaq Equity Premium Income ETF | | | | | | | |
Six Months Ended December 31, 2024 (Unaudited) | | | | | | | |
| | | | | | | |
| | | | | | | |
May 3, 2022 (f) through June 30, 2022 | | | | | | | |
JPMorgan Small & Mid Cap Enhanced Equity ETF (formerly known as JPMorgan Market Expansion Enhanced Equity ETF) (h) (i) | | | | | | | |
Six Months Ended December 31, 2024 (Unaudited) | | | | | | | |
| | | | | | | |
| | | | | | | |
| | | | | | | |
| | | | | | | |
| | | | | | | |
JPMorgan U.S. Tech Leaders ETF | | | | | | | |
Six Months Ended December 31, 2024 (Unaudited) | | | | | | | |
October 4, 2023 (f) through June 30, 2024 | | | | | | | |
|
| Annualized for periods less than one year, unless otherwise noted. |
| Calculated based upon average shares outstanding. |
| Not annualized for periods less than one year. |
| Includes adjustments in accordance with accounting principles generally accepted in the United States of America and as such, the net asset values for financial reporting purposes and the returns based upon those net asset values may differ from the net asset values and returns for shareholder transactions. |
| Market price return was calculated assuming an initial investment made at the market price at the beginning of the reporting period, reinvestment of all dividends and distributions at the market price during the period, and sale at the market price on the last day of the period. The closing price was used to calculate the market price return. |
| Commencement of operations. |
| Since the shares of the Fund did not trade in the secondary market until the day after the Fund’s inception, for the period from the inception to the first day of secondary market trading, the net asset value is used as a proxy for the secondary market trading price to calculate the market returns. |
| JPMorgan Small & Mid Cap Enhanced Equity ETF (formerly known as JPMorgan Market Expansion Enhanced Equity ETF) acquired all of the assets and liabilities of the Predecessor Fund in a reorganization that occurred as of the close of business on May 6, 2022. Performance and financial history of the Predecessor Fund’s Class R6 Shares have been adopted by the Fund and will be used going forward. As a result, the financial highlight information reflects that of the Predecessor Fund’s Class R6 Shares for the period July 1, 2019 up through the reorganization. |
| Per Share amounts reflect the conversion of the JPMorgan Small & Mid Cap Enhanced Equity ETF (formerly known as JPMorgan Market Expansion Enhanced Equity ETF) as of the close of business on May 6, 2022. See Note 1. |
| JPMorgan Small & Mid Cap Enhanced Equity ETF (formerly known as JPMorgan Market Expansion Enhanced Equity ETF) acquired all of the assets and liabilities of the Predecessor Fund in a reorganization that occurred as of the close of business on May 6, 2022. Market price returns are calculated using the official closing price of the JPMorgan Small & Mid Cap Enhanced Equity ETF (formerly known as JPMorgan Market Expansion Enhanced Equity ETF) on the listing exchange as of the time that the JPMorgan Small & Mid Cap Enhanced Equity ETF's (formerly known as JPMorgan Market Expansion Enhanced Equity ETF) net asset value ("NAV") is calculated. Prior to the JPMorgan Small & Mid Cap Enhanced Equity ETF's (formerly known as JPMorgan Market Expansion Enhanced Equity ETF) listing on May 9, 2022, the NAV performance of the Class R6 and the Class I Shares of the Predecessor Fund are used as proxy market price returns. |
| J.P. Morgan Exchange-Traded Funds | |
| |
| | | | | Ratios to average net assets (a) | |
Net asset
value,
end of
period | | | Market
price
total
return (c)(e) | | | Net
investment
income
(loss) | Expenses
without waivers
and reimbursements | Portfolio
turnover
rate (c) |
| | | | | | | | |
| | | | | | | | |
| | | | | | | | |
| | | | | | | | |
| | | | | | | | |
| | | | | | | | |
| | | | | | | | |
| | | | | | | | |
| | | | | | | | |
| | | | | | | | |
| | | | | | | | |
| | | | | | | | |
| | | | | | | | |
| | | | | | | | |
| | | | | | | | |
| | | | | | | | |
| | | | | | | | |
| | | | | | | | |
| | | | | | | | |
| J.P. Morgan Exchange-Traded Funds | |
NOTES TO FINANCIAL STATEMENTSAS OF December 31, 2024 (Unaudited)
1. Organization
J.P. Morgan Exchange-Traded Fund Trust (the “Trust”) was formed on February 25, 2010, and is governed by a Declaration of Trust as amended and restated February 19, 2014, and is registered under the Investment Company Act of 1940, as amended (the “1940 Act”), as an open-end management investment company.
The following are 10 separate funds of the Trust (each, a "Fund" and collectively, the "Funds") covered by this report:
| Diversification Classification |
JPMorgan Active Growth ETF | |
JPMorgan Active Small Cap Value ETF | |
JPMorgan Active Value ETF | |
JPMorgan Equity Premium Income ETF | |
JPMorgan Fundamental Data Science Large Core ETF(1) | |
JPMorgan Fundamental Data Science Mid Core ETF(1) | |
JPMorgan Fundamental Data Science Small Core ETF(1) | |
JPMorgan Nasdaq Equity Premium Income ETF | |
JPMorgan Small & Mid Cap Enhanced Equity ETF (formerly known as JPMorgan Market Expansion Enhanced Equity | |
JPMorgan U.S. Tech Leaders ETF | |
|
| Commencement of operations was August 7, 2024. |
| Effective September 30, 2024, JPMorgan Market Expansion Enhanced Equity ETF changed its name to JPMorgan Small & Mid Cap Enhanced Equity ETF. |
The investment objective of JPMorgan Active Growth ETF (“Active Growth ETF”), JPMorgan Active Small Cap Value ETF (“Active Small Cap Value ETF”), JPMorgan Active Value ETF (“Active Value ETF”), JPMorgan Fundamental Data Science Large Core ETF (“Fundamental Data Science Large Core ETF”), JPMorgan Fundamental Data Science Mid Core ETF (“Fundamental Data Science Mid Core ETF”), JPMorgan Fundamental Data Science Small Core ETF (“Fundamental Data Science Small Core ETF”), and JPMorgan U.S. Tech Leaders ETF ("U.S. Tech Leaders ETF") is to seek to provide long-term capital appreciation.
The investment objective of JPMorgan Equity Premium Income ETF (“Equity Premium Income ETF”) and JPMorgan Nasdaq Equity Premium Income ETF (“Nasdaq Equity Premium Income ETF”) is to seek current income while maintaining prospects for capital appreciation.
The investment objective of JPMorgan Small & Mid Cap Enhanced Equity ETF (“Small & Mid Cap Enhanced Equity ETF”) is to seek to provide investment results that correspond to or incrementally exceed the total return performance of an index that tracks the performance of the small- and mid- capitalization equity markets.
J.P. Morgan Investment Management Inc. (“JPMIM”), an indirect, wholly-owned subsidiary of JPMorgan Chase & Co. (“JPMorgan”), acts as adviser (the “Adviser”) and administrator (the “Administrator”) to the Funds.
Shares of each Fund are listed and traded at market price on an exchange as follows:
| |
| |
Active Small Cap Value ETF | |
| |
Equity Premium Income ETF | |
Fundamental Data Science Large Core ETF | The NASDAQ Stock Market® LLC |
Fundamental Data Science Mid Core ETF | The NASDAQ Stock Market® LLC |
Fundamental Data Science Small Core ETF | The NASDAQ Stock Market® LLC |
Nasdaq Equity Premium Income ETF | The NASDAQ Stock Market® LLC |
Small & Mid Cap Enhanced Equity ETF | |
| The NASDAQ Stock Market® LLC |
Market prices for the Funds’ shares may be different from their net asset value (“NAV”).
The Funds issue and redeem their shares on a continuous basis, through JPMorgan Distribution Services, Inc. (the “Distributor” or “JPMDS”), an indirect, wholly-owned subsidiary of JPMorgan, at NAV in large blocks of shares, referred to as “Creation Units”. Creation Units are issued and redeemed in exchange for a basket of securities and/or cash. A cash amount may be substituted if a Fund has sizable exposure to market or sponsor
| J.P. Morgan Exchange-Traded Funds | |
restricted securities. Shares are generally traded in the secondary market in amounts less than a Creation Unit at market prices that change throughout the day. Only individuals or institutions that have entered into an authorized participant agreement with the Distributor may do business directly with the Funds (each, an “Authorized Participant”).
2. Significant Accounting Policies
The following is a summary of significant accounting policies followed by the Funds in the preparation of their financial statements. The Funds are investment companies and, accordingly, follow the investment company accounting and reporting guidance of the Financial Accounting Standards Board (“FASB”) Accounting Standards Codification Topic 946 — Investment Companies, which is part of U.S. generally accepted accounting principles (“GAAP”). The preparation of financial statements in conformity with GAAP requires management to make estimates and assumptions that affect (i) the reported amounts of assets and liabilities, (ii) disclosure of contingent assets and liabilities at the date of the financial statements, and (iii) the reported amounts of increases and decreases in net assets from operations during the reporting period. Actual results could differ from those estimates.
A. Valuation of Investments— Investments are valued in accordance with GAAP and the Funds' valuation policies set forth by, and under the supervision and responsibility of, the Board of Trustees of the Trust (the "Board"), which established the following approach to valuation, as described more fully below: (i) investments for which market quotations are readily available shall be valued at their market value and (ii) all other investments for which market quotations are not readily available shall be valued at their fair value as determined in good faith by the Board.
Under Section 2(a)(41) of the 1940 Act, the Board is required to determine fair value for securities that do not have readily available market quotations. Under Securities and Exchange Commission (“SEC”) Rule 2a-5 (Good Faith Determinations of Fair Value), the Board may designate the performance of these fair valuation determinations to a valuation designee. The Board has designated the Adviser as the “Valuation Designee” to perform fair valuation determinations for the Funds on behalf of the Board subject to appropriate oversight by the Board. The Adviser, as Valuation Designee, leverages the J.P. Morgan Asset Management Americas Valuation Committee (“AVC”) to help oversee and carry out the policies for the valuation of investments held in the Funds. The Adviser, as Valuation Designee, remains responsible for the valuation determinations.
This oversight by the AVC includes monitoring the appropriateness of fair values based on results of ongoing valuation oversight including, but not limited to, consideration of macro or security specific events, market events, and pricing vendor and broker due diligence. The Administrator is responsible for discussing and assessing the potential impacts to the fair values on an ongoing basis, and, at least on a quarterly basis, with the AVC and the Board.
Fixed income instruments are valued based on prices received from approved affiliated and unaffiliated pricing vendors or third party broker-dealers (collectively referred to as “Pricing Services”). The Pricing Services use multiple valuation techniques to determine the valuation of fixed income instruments. In instances where sufficient market activity exists, the Pricing Services may utilize a market-based approach through which trades or quotes from market makers are used to determine the valuation of these instruments. In instances where sufficient market activity may not exist, the Pricing Services also utilize proprietary valuation models which may consider market transactions in comparable securities and the various relationships between securities in determining fair value and/or market characteristics in order to estimate the relevant cash flows, which are then discounted to calculate the fair values.
Equities and other exchange-traded instruments are valued at the last sale price or official market closing price on the primary exchange on which the instrument is traded before the NAV of the Funds are calculated on a valuation date.
Investments in open-end investment companies (“Underlying Funds”) are valued at each Underlying Fund’s NAV per share as of the report date.
Futures contracts are generally valued on the basis of available market quotations.
Valuations reflected in this report are as of the report date. As a result, changes in valuation due to market events and/or issuer-related events after the report date and prior to issuance of the report are not reflected herein.
The various inputs that are used in determining the valuation of the Funds’ investments are summarized into the three broad levels listed below.
•
Level 1 — Unadjusted inputs using quoted prices in active markets for identical investments.
•
Level 2 — Other significant observable inputs (including, but not limited to, quoted prices for similar securities, interest rates, prepayment speeds, credit risk, etc.).
•
Level 3 — Significant unobservable inputs (including the Funds’ own assumptions in determining the fair value of investments).
A financial instrument’s level within the fair value hierarchy is based on the lowest level of any input, both individually and in the aggregate, that is significant to the fair value measurement. The inputs or methodology used for valuing securities are not necessarily an indication of the risk associated with investing in those securities. For example, certain money market securities are valued using amortized cost, in accordance with rules under the 1940 Act. Generally, amortized cost approximates the current fair value of a security, but since the value is not obtained from a quoted price in an active market, such securities are reflected as level 2.
| J.P. Morgan Exchange-Traded Funds | |
NOTES TO FINANCIAL STATEMENTSAS OF December 31, 2024 (Unaudited) (continued)
The following tables represent each valuation input as presented on the Schedules of Portfolio Investments (“SOIs”):
| | | | |
| | Level 2
Other significant
observable inputs | Level 3
Significant
unobservable inputs | |
Total Investments in Securities (a) | | | | |
|
| Please refer to the SOI for specifics of portfolio holdings. |
Active Small Cap Value ETF | | | | |
| | Level 2
Other significant
observable inputs | Level 3
Significant
unobservable inputs | |
Total Investments in Securities (a) | | | | |
|
| Please refer to the SOI for specifics of portfolio holdings. |
| | | | |
| | Level 2
Other significant
observable inputs | Level 3
Significant
unobservable inputs | |
Total Investments in Securities (a) | | | | |
|
| Please refer to the SOI for specifics of portfolio holdings. |
Equity Premium Income ETF | | | | |
| | Level 2
Other significant
observable inputs | Level 3
Significant
unobservable inputs | |
Investments in Securities | | | | |
| | | | |
| | | | |
| | | | |
| | | | |
Total Investments in Securities | | | | |
Fundamental Data Science Large Core ETF | | | | |
| | Level 2
Other significant
observable inputs | Level 3
Significant
unobservable inputs | |
Total Investments in Securities (a) | | | | |
|
| Please refer to the SOI for specifics of portfolio holdings. |
Fundamental Data Science Mid Core ETF | | | | |
| | Level 2
Other significant
observable inputs | Level 3
Significant
unobservable inputs | |
Total Investments in Securities (a) | | | | |
| J.P. Morgan Exchange-Traded Funds | |
Fundamental Data Science Mid Core ETF (continued) | | | | |
| | Level 2 Other significant observable inputs | Level 3 Significant unobservable inputs | |
Depreciation in Other Financial Instruments | | | | |
| | | | |
|
| Please refer to the SOI for specifics of portfolio holdings. |
Fundamental Data Science Small Core ETF | | | | |
| | Level 2
Other significant
observable inputs | Level 3
Significant
unobservable inputs | |
Total Investments in Securities (a) | | | | |
Depreciation in Other Financial Instruments | | | | |
| | | | |
|
| Please refer to the SOI for specifics of portfolio holdings. |
Nasdaq Equity Premium Income ETF | | | | |
| | Level 2
Other significant
observable inputs | Level 3
Significant
unobservable inputs | |
Investments in Securities | | | | |
| | | | |
| | | | |
| | | | |
| | | | |
Investment of Cash Collateral from Securities Loaned | | | | |
Total Short-Term Investments | | | | |
Total Investments in Securities | | | | |
Small & Mid Cap Enhanced Equity ETF | | | | |
| | Level 2
Other significant
observable inputs | Level 3
Significant
unobservable inputs | |
Total Investments in Securities (a) | | | | |
Appreciation in Other Financial Instruments | | | | |
| | | | |
Depreciation in Other Financial Instruments | | | | |
| | | | |
Total Net Appreciation/ Depreciation in Other
Financial Instruments | | | | |
|
| Please refer to the SOI for specifics of portfolio holdings. |
| J.P. Morgan Exchange-Traded Funds | |
NOTES TO FINANCIAL STATEMENTSAS OF December 31, 2024 (Unaudited) (continued)
| | | | |
| | Level 2
Other significant
observable inputs | Level 3
Significant
unobservable inputs | |
Total Investments in Securities (a) | | | | |
|
| Please refer to the SOI for specifics of portfolio holdings. |
B. Restricted Securities— Certain securities held by the Funds may be subject to legal or contractual restrictions on resale. Restricted securities generally are resold in transactions exempt from registration under the Securities Act of 1933, as amended (the “Securities Act”). Disposal of these securities may involve time-consuming negotiations and expense. Prompt sale at the current valuation may be difficult and could adversely affect the NAVs of the Funds.
As of December 31, 2024, the Funds had no investments in restricted securities other than securities sold to the Funds under Rule 144A and/or Regulation S under the Securities Act.
C. Securities Lending — The Funds are authorized to engage in securities lending in order to generate additional income. The Funds are able to lend to approved borrowers. Citibank N.A. (“Citibank”) serves as lending agent for the Funds, pursuant to a Securities Lending Agency Agreement (the “Securities Lending Agency Agreement”). Securities loaned are collateralized by cash equal to at least 100% of the market value plus accrued interest on the securities lent, which is invested in the Class IM Shares of the JPMorgan U.S. Government Money Market Fund and the Agency SL Class Shares of the JPMorgan Securities Lending Money Market Fund. The Funds retain the interest earned on cash collateral investments but are required to pay the borrower a rebate for the use of the cash collateral. In cases where the lent security is of high value to borrowers, there may be a negative rebate (i.e., a net payment from the borrower to the Funds). Upon termination of a loan, the Funds are required to return to the borrower an amount equal to the cash collateral, plus any rebate owed to the borrowers. The remaining maturities of the securities lending transactions are considered overnight and continuous. Loans are subject to termination by the Funds or the borrower at any time.
The net income earned on the securities lending (after payment of rebates and Citibank’s fee) is included on the Statements of Operations as Income from securities lending (net). The Funds also receive payments from the borrower during the period of the loan, equivalent to dividends and interest earned on the securities loaned, which are recorded as Dividend or Interest income, respectively, on the Statements of Operations.
Under the Securities Lending Agency Agreement, Citibank marks to market the loaned securities on a daily basis. In the event the cash received from the borrower is less than 102% of the value of the loaned securities (105% for loans of non-U.S. securities), Citibank requests additional cash from the borrower so as to maintain a collateralization level of at least 102% of the value of the loaned securities plus accrued interest (105% for loans of non-U.S. securities), subject to certain de minimis amounts.
The value of securities out on loan is recorded as an asset on the Statements of Assets and Liabilities. The value of the cash collateral received is recorded as a liability on the Statements of Assets and Liabilities and details of collateral investments are disclosed on the SOIs.
The Funds bear the risk of loss associated with the collateral investments and are not entitled to additional collateral from the borrower to cover any such losses. To the extent that the value of the collateral investments declines below the amount owed to a borrower, the Funds may incur losses that exceed the amount they earned on lending the security. Upon termination of a loan, the Funds may use leverage (borrow money) to repay the borrower for cash collateral posted if the Adviser does not believe that it is prudent to sell the collateral investments to fund the payment of this liability. Securities lending activity is subject to master netting arrangements.
The following table presents for each lending Fund, the value of the securities on loan with Citibank, net of amounts available for offset under the master netting arrangements and any related collateral received or posted by the Funds as of December 31, 2024.
| Investment Securities
on Loan, at value,
Presented on the
Statements of Assets
and Liabilities | Cash Collateral
Posted by Borrower* | Net Amount Due
to Counterparty
(not less than zero) |
Nasdaq Equity Premium Income ETF | | | |
Small & Mid Cap Enhanced Equity ETF | | | |
| | | |
|
| Collateral posted reflects the value of securities on loan and does not include any additional amounts received from the borrower. |
Securities lending also involves counterparty risks, including the risk that the loaned securities may not be returned in a timely manner or at all. Subject to certain conditions, Citibank has agreed to indemnify the Funds from losses resulting from a borrower’s failure to return a loaned security.
| J.P. Morgan Exchange-Traded Funds | |
JPMIM voluntarily waived management fees charged to the Funds to reduce the impact of the cash collateral investment in the JPMorgan U.S. Government Money Market Fund from 0.13% to 0.06%. For the six months ended December 31, 2024, JPMIM waived fees associated with the Funds' investment in the JPMorgan U.S. Government Money Market Fund as follows:
| |
Fundamental Data Science Small Core ETF | |
Small & Mid Cap Enhanced Equity ETF | |
| |
The above waiver is included in the determination of earnings on cash collateral investment and in the calculation of Citibank’s compensation and is included on the Statements of Operations as Income from securities lending (net).
Active Value ETF, Active Small Cap Value ETF, Equity Premium Income ETF and Fundamental Data Science Small Core ETF did not have any securities on loan at December 31, 2024.
Active Growth ETF, Fundamental Data Science Large Core ETF and Fundamental Data Science Mid Core ETF did not lend out any securities during the six months ended December 31, 2024.
D. Investment Transactions with Affiliates— The Funds invested in Underlying Funds advised by the Adviser. An issuer which is under common control with a Fund may be considered an affiliate. For the purposes of the financial statements, the Funds assume the issuers listed in the tables below to be affiliated issuers. The Underlying Funds’ distributions may be reinvested into such Underlying Funds. Reinvestment amounts are included in the purchases at cost amounts in the tables below.
|
For the six months ended December 31, 2024 |
| | | | | Change in
Unrealized
Appreciation/
(Depreciation) | | Shares at
December 31,
2024 | | Capital Gain
Distributions |
JPMorgan U.S. Government Money Market Fund Class IM Shares, 4.44% (a) (b) | | | | | | | | | |
|
| Investment in an affiliated fund, which is registered under the Investment Company Act of 1940, as amended, and is advised by J.P. Morgan Investment Management Inc. |
| The rate shown is the current yield as of December 31, 2024. |
Active Small Cap Value ETF |
For the six months ended December 31, 2024 |
| | | | | Change in
Unrealized
Appreciation/
(Depreciation) | | Shares at
December 31,
2024 | | Capital Gain
Distributions |
JPMorgan U.S. Government Money Market Fund Class IM Shares, 4.44% (a) (b) | | | | | | | | | |
JPMorgan U.S. Government Money Market Fund Class IM Shares, 4.44% (a) (b) | | | | | | | | | |
| | | | | | | | | |
|
| Investment in an affiliated fund, which is registered under the Investment Company Act of 1940, as amended, and is advised by J.P. Morgan Investment Management Inc. |
| The rate shown is the current yield as of December 31, 2024. |
| Amount is included on the Statements of Operations as Income from securities lending (net) (after payments of rebates and Citibank’s fee). |
| J.P. Morgan Exchange-Traded Funds | |
NOTES TO FINANCIAL STATEMENTSAS OF December 31, 2024 (Unaudited) (continued)
|
For the six months ended December 31, 2024 |
| | | | | Change in
Unrealized
Appreciation/
(Depreciation) | | Shares at
December 31,
2024 | | Capital Gain
Distributions |
JPMorgan Securities Lending Money Market Fund Agency SL Class Shares, 4.47% (a) (b) | | | | | | | | | |
JPMorgan U.S. Government Money Market Fund Class IM Shares, 4.44% (a) (b) | | | | | | | | | |
JPMorgan U.S. Government Money Market Fund Class IM Shares, 4.44% (a) (b) | | | | | | | | | |
| | | | | | | | | |
|
| Investment in an affiliated fund, which is registered under the Investment Company Act of 1940, as amended, and is advised by J.P. Morgan Investment Management Inc. |
| The rate shown is the current yield as of December 31, 2024. |
| Amount is included on the Statements of Operations as Income from securities lending (net) (after payments of rebates and Citibank’s fee). |
Equity Premium Income ETF |
For the six months ended December 31, 2024 |
| | | | | Change in
Unrealized
Appreciation/
(Depreciation) | | Shares at
December 31,
2024 | | Capital Gain
Distributions |
JPMorgan Securities Lending Money Market Fund Agency SL Class Shares, 4.47% (a) (b) | | | | | | | | | |
JPMorgan U.S. Government Money Market Fund Class IM Shares, 4.44% (a) (b) | | | | | | | | | |
| | | | | | | | | |
|
| Investment in an affiliated fund, which is registered under the Investment Company Act of 1940, as amended, and is advised by J.P. Morgan Investment Management Inc. |
| The rate shown is the current yield as of December 31, 2024. |
| Amount is included on the Statements of Operations as Income from securities lending (net) (after payments of rebates and Citibank’s fee). |
| J.P. Morgan Exchange-Traded Funds | |
Fundamental Data Science Large Core ETF |
For the period ended December 31, 2024 |
| | | | | Change in
Unrealized
Appreciation/
(Depreciation) | | Shares at
December 31,
2024 | | Capital Gain
Distributions |
JPMorgan U.S. Government Money Market Fund Class IM Shares, 4.44% (b) (c) | | | | | | | | | |
|
| Commencement of operations was August 7, 2024. |
| Investment in an affiliated fund, which is registered under the Investment Company Act of 1940, as amended, and is advised by J.P. Morgan Investment Management Inc. |
| The rate shown is the current yield as of December 31, 2024. |
Fundamental Data Science Mid Core ETF |
For the period ended December 31, 2024 |
| | | | | Change in
Unrealized
Appreciation/
(Depreciation) | | Shares at
December 31,
2024 | | Capital Gain
Distributions |
JPMorgan Securities Lending Money Market Fund Agency SL Class Shares, 4.47% (b) (c) | | | | | | | | | |
JPMorgan U.S. Government Money Market Fund Class IM Shares, 4.44% (b) (c) | | | | | | | | | |
| | | | | | | | | |
|
| Commencement of operations was August 7, 2024. |
| Investment in an affiliated fund, which is registered under the Investment Company Act of 1940, as amended, and is advised by J.P. Morgan Investment Management Inc. |
| The rate shown is the current yield as of December 31, 2024. |
| Amount is included on the Statements of Operations as Income from securities lending (net) (after payments of rebates and Citibank’s fee). |
Fundamental Data Science Small Core ETF |
For the period ended December 31, 2024 |
| | | | | Change in
Unrealized
Appreciation/
(Depreciation) | | Shares at
December 31,
2024 | | Capital Gain
Distributions |
JPMorgan Securities Lending Money Market Fund Agency SL Class Shares, 4.47% (b) (c) | | | | | | | | | |
JPMorgan U.S. Government Money Market Fund Class IM Shares, 4.44% (b) (c) | | | | | | | | | |
JPMorgan U.S. Government Money Market Fund Class IM Shares, 4.44% (b) (c) | | | | | | | | | |
| | | | | | | | | |
|
| Commencement of operations was August 7, 2024. |
| Investment in an affiliated fund, which is registered under the Investment Company Act of 1940, as amended, and is advised by J.P. Morgan Investment Management Inc. |
| The rate shown is the current yield as of December 31, 2024. |
| Amount is included on the Statements of Operations as Income from securities lending (net) (after payments of rebates and Citibank’s fee). |
| J.P. Morgan Exchange-Traded Funds | |
NOTES TO FINANCIAL STATEMENTSAS OF December 31, 2024 (Unaudited) (continued)
Nasdaq Equity Premium Income ETF |
For the six months ended December 31, 2024 |
| | | | | Change in
Unrealized
Appreciation/
(Depreciation) | | Shares at
December 31,
2024 | | Capital Gain
Distributions |
JPMorgan Securities Lending Money Market Fund Agency SL Class Shares, 4.47% (a) (b) | | | | | | | | | |
JPMorgan U.S. Government Money Market Fund Class IM Shares, 4.44% (a) (b) | | | | | | | | | |
| | | | | | | | | |
|
| Investment in an affiliated fund, which is registered under the Investment Company Act of 1940, as amended, and is advised by J.P. Morgan Investment Management Inc. |
| The rate shown is the current yield as of December 31, 2024. |
| Amount is included on the Statements of Operations as Income from securities lending (net) (after payments of rebates and Citibank’s fee). |
Small & Mid Cap Enhanced Equity ETF |
For the six months ended December 31, 2024 |
| | | | | Change in
Unrealized
Appreciation/
(Depreciation) | | Shares at
December 31,
2024 | | Capital Gain
Distributions |
JPMorgan Securities Lending Money Market Fund Agency SL Class Shares, 4.47% (a) (b) | | | | | | | | | |
JPMorgan U.S. Government Money Market Fund Class IM Shares, 4.44% (a) (b) | | | | | | | | | |
JPMorgan U.S. Government Money Market Fund Class IM Shares, 4.44% (a) (b) | | | | | | | | | |
| | | | | | | | | |
|
| Investment in an affiliated fund, which is registered under the Investment Company Act of 1940, as amended, and is advised by J.P. Morgan Investment Management Inc. |
| The rate shown is the current yield as of December 31, 2024. |
| Amount is included on the Statements of Operations as Income from securities lending (net) (after payments of rebates and Citibank’s fee). |
|
For the six months ended December 31, 2024 |
| | | | | Change in
Unrealized
Appreciation/
(Depreciation) | | Shares at
December 31,
2024 | | Capital Gain
Distributions |
JPMorgan Securities Lending Money Market Fund Agency SL Class Shares, 4.47% (a) (b) | | | | | | | | | |
| J.P. Morgan Exchange-Traded Funds | |
U.S. Tech Leaders ETF (continued) |
For the six months ended December 31, 2024 |
| | | | | Change in Unrealized Appreciation/ (Depreciation) | | Shares at December 31, 2024 | | Capital Gain Distributions |
JPMorgan U.S. Government Money Market Fund Class IM Shares, 4.44% (a) (b) | | | | | | | | | |
JPMorgan U.S. Government Money Market Fund Class IM Shares, 4.44% (a) (b) | | | | | | | | | |
| | | | | | | | | |
|
| Investment in an affiliated fund, which is registered under the Investment Company Act of 1940, as amended, and is advised by J.P. Morgan Investment Management Inc. |
| The rate shown is the current yield as of December 31, 2024. |
| Amount is included on the Statements of Operations as Income from securities lending (net) (after payments of rebates and Citibank’s fee). |
E. Futures Contracts— Equity Premium Income ETF, Fundamental Data Science Large Core ETF, Fundamental Data Science Mid Core ETF, Fundamental Data Science Small Core ETF and Small & Mid Cap Enhanced Equity ETF used index futures contracts to manage and hedge equity price risk associated with portfolio investments. The Funds also purchased futures contracts to invest incoming cash in the market or sold futures in response to cash outflows, thereby simulating an invested position in the underlying index while maintaining a cash balance for liquidity.
Futures contracts provide for the delayed delivery of the underlying instrument at a fixed price or are settled for a cash amount based on the change in the value of the underlying instrument at a specific date in the future. Upon entering into a futures contract, the Funds are required to deposit with the broker, cash or securities in an amount equal to a certain percentage of the contract amount, which is referred to as the initial margin deposit. Subsequent payments, referred to as variation margin, are made or received by the Funds periodically and are based on changes in the market value of open futures contracts. Changes in the market value of open futures contracts are recorded as Change in net unrealized appreciation/depreciation on futures contracts on the Statements of Operations. Realized gains or losses, representing the difference between the value of the contract at the time it was opened and the value at the time it was closed, are reported on the Statements of Operations at the closing or expiration of the futures contract. Securities deposited as initial margin are designated on the SOIs, while cash deposited, which is considered restricted, is recorded on the Statements of Assets and Liabilities. A receivable from and/or a payable to brokers for the daily variation margin is also recorded on the Statements of Assets and Liabilities.
The use of futures contracts exposes the Funds to equity price risk. The Funds may be subject to the risk that the change in the value of the futures contract may not correlate perfectly with the underlying instrument. Use of long futures contracts subjects the Funds to risk of loss in excess of the amounts shown on the Statements of Assets and Liabilities, up to the notional amount of the futures contracts. Use of short futures contracts subjects the Funds to unlimited risk of loss. The Funds may enter into futures contracts only on exchanges or boards of trade. The exchange or board of trade acts as the counterparty to each futures transaction; therefore, the Funds' credit risk is limited to failure of the exchange or board of trade. Under some circumstances, futures exchanges may establish daily limits on the amount that the price of a futures contract can vary from the previous day’s settlement price, which could effectively prevent liquidation of positions.
The Funds' futures contracts are not subject to master netting arrangements (the right to close out all transactions traded with a counterparty and net amounts owed or due across transactions).
The table below discloses the volume of the Funds' futures contracts activity during the six months ended December 31, 2024:
| | Fundamental Data
Science Large
Core ETF | Fundamental Data
Science Mid
Core ETF | Fundamental Data
Science Small
Core ETF | Small & Mid Cap
Enhanced
Equity ETF |
| | | | | |
Average Notional Balance Long | | | | | |
Average Notional Balance Short | | | | | |
Ending Notional Balance Long | | | | | |
| J.P. Morgan Exchange-Traded Funds | |
NOTES TO FINANCIAL STATEMENTSAS OF December 31, 2024 (Unaudited) (continued)
F. Equity-Linked Notes— Equity Premium Income ETF and Nasdaq Equity Premium Income ETF invested in Equity-Linked Notes (“ELNs”). These are hybrid instruments which combine both debt and equity characteristics into a single note form. ELNs' values are linked to the performance of an underlying index. ELNs are unsecured debt obligations of an issuer and may not be publicly listed or traded on an exchange. ELNs are valued daily, under procedures adopted by the Board, based on values provided by an approved pricing source. These notes have a coupon which is accrued and recorded as Interest income from non-affiliates on the Statements of Operations. Changes in the market value of ELNs are recorded as Change in net unrealized appreciation or depreciation on the Statements of Operations. A Fund realizes a gain or loss when an ELN is sold or matures, which is recorded as Net realized gain (loss) on transactions from investments in non-affiliates on the Statements of Operations.
As of December 31, 2024, Equity Premium Income ETF and Nasdaq Equity Premium Income ETF had outstanding ELNs as listed on the SOIs.
G. Security Transactions and Investment Income— Investment transactions are accounted for on the trade date (the date the order to buy or sell is executed). Securities gains and losses are calculated on a specifically identified cost basis. Interest income is determined on the basis of coupon interest accrued using the effective interest method, which adjusts for amortization of premiums and accretion of discounts. Distributions of net investment income and realized capital gains from the Underlying Funds are recorded on the ex-dividend date.
To the extent such information is publicly available, the Funds record distributions received in excess of income earned from underlying investments as a reduction of cost of investments and/or realized gain. Such amounts are based on estimates if actual amounts are not available and actual amounts of income, realized gain and return of capital may differ from the estimated amounts. The Funds adjust the estimated amounts of the components of distributions (and consequently their net investment income) as necessary, once the issuers provide information about the actual composition of the distributions.
H. Federal Income Taxes— Each Fund is treated as a separate taxable entity for Federal income tax purposes. Each Fund's policy is to comply with the provisions of the Internal Revenue Code (the “Code”) applicable to regulated investment companies and to distribute to shareholders all of its distributable net investment income and net realized capital gains on investments. Accordingly, no provision for Federal income tax is necessary. Management has reviewed the Funds' tax positions for all open tax years and has determined that as of December 31, 2024, no liability for Federal income tax is required in the Funds' financial statements for net unrecognized tax benefits. However, management’s conclusions may be subject to future review based on changes in, or the interpretation of, the accounting standards or tax laws and regulations. Each Fund's Federal tax returns for the prior three fiscal years, or since inception if shorter, remain subject to examination by the Internal Revenue Service.
I. Distributions to Shareholders— Distributions from net investment income, if any, are generally declared and paid at least monthly for Equity Premium Income ETF and Nasdaq Equity Premium Income ETF, at least annually for Active Growth ETF, Active Small Cap Value ETF, Small & Mid Cap Enhanced Equity ETF and U.S. Tech Leaders ETF, and at least quarterly for Active Value ETF, Fundamental Data Science Large Core ETF, Fundamental Data Science Mid Core ETF and Fundamental Data Science Small Core ETF. Net realized capital gains, if any, are distributed at least annually. The amount of distributions from net investment income and net realized capital gains is determined in accordance with Federal income tax regulations, which may differ from GAAP. To the extent these “book/tax” differences are permanent in nature (i.e., that they result from other than timing of recognition — “temporary differences”), such amounts are reclassified within the capital accounts based on their Federal tax basis treatment.
3. Fees and Other Transactions with Affiliates
A. Management Fee—JPMIM manages the investments of each Fund. For each Fund other than Small & Mid Cap Enhanced Equity ETF, the investments are managed pursuant to a Management Agreement, under which JPMIM is responsible for substantially all of each Fund’s expenses as described below. JPMIM also manages the investments of Small & Mid Cap Enhanced Equity ETF pursuant to an Investment Advisory Agreement. For such services, JPMIM is paid a fee which is accrued daily and paid no more frequently than monthly based on each Fund's respective average daily net assets at the following rate:
| |
| |
Active Small Cap Value ETF | |
| |
Equity Premium Income ETF | |
Fundamental Data Science Large Core ETF | |
Fundamental Data Science Mid Core ETF | |
Fundamental Data Science Small Core ETF | |
Nasdaq Equity Premium Income ETF | |
Small & Mid Cap Enhanced Equity ETF | |
| |
Under Management Agreement applicable to each Fund except Small & Mid Cap Enhanced Equity ETF, JPMIM is responsible for substantially all expenses of each Fund, (including expenses of the Trust relating to each Fund), except for the management fees, payments under the Funds' 12b-1 plan (if any), interest expenses, dividend and interest expenses related to short sales, taxes, acquired fund fees and expenses (other than fees for
| J.P. Morgan Exchange-Traded Funds | |
funds advised by the Adviser and/or its affiliates), costs of holding shareholder meetings, and litigation and potential litigation and other extraordinary expenses not incurred in the ordinary course of each Fund’s business. Additionally, each Fund is responsible for its non-operating expenses, including brokerage commissions and fees and expenses associated with each Fund’s securities lending program, if applicable. For the avoidance of doubt, the Adviser’s payment of such expenses may be accomplished through a Fund’s payment of such expenses and a corresponding reduction in the fee payable to the Adviser, provided, however, that if the amount of expenses paid by a Fund exceeds the fee payable to the Adviser, the Adviser will reimburse that Fund for such amount.
B. Administration Fee— JPMIM provides administration services to the Funds. Pursuant to each Management Agreement, JPMIM is compensated as described in Note 3.A.
Pursuant to a separate Administration Agreement, the Administrator provides certain administration services to Small & Mid Cap Enhanced Equity ETF. In consideration of these services, the Administrator receives a fee accrued daily and paid monthly at an annual rate of 0.075% of the first $10 billion of Small & Mid Cap Enhanced Equity ETF's average daily net assets, plus 0.050% of the Fund’s average daily net assets between $10 billion and $20 billion, plus 0.025% of the Fund’s average daily net assets between $20 billion and $25 billion, plus 0.010% of the Fund’s average daily net assets in excess of $25 billion. For the six months ended December 31, 2024, the effective annualized rate was 0.075% of Small & Mid Cap Enhanced Equity ETF's average daily net assets, notwithstanding any fee waivers and/or expense reimbursements.
The Administrator waived administration fees for Small & Mid Cap Enhanced Equity ETF as outlined in Note 3.E.
JPMorgan Chase Bank, N.A. (“JPMCB”), a wholly-owned subsidiary of JPMorgan, serves as the Funds' sub-administrator (the “Sub-administrator”). For its services as Sub-administrator, JPMCB receives a portion of the management fees and administration fees payable to JPMIM.
C. Custodian, Accounting and Transfer Agent Fees— JPMCB provides custody, accounting and transfer agency services to the Funds. For performing these services, JPMIM, for the Funds except Small & Mid Cap Enhanced Equity ETF, pays JPMCB transaction and asset-based fees that vary according to the number of transactions and positions, plus out-of-pocket expenses.
For Small & Mid Cap Enhanced Equity ETF, the Fund pays JPMCB directly. The amounts for custody and accounting services are included in Custodian and accounting fees on the Statements of Operations. The amounts paid for transfer agency services are included in Transfer agency fees on the Statements of Operations.
Additionally, Authorized Participants generally pay transaction fees associated with the creation and redemption of Fund shares. These fees are paid to JPMIM to offset certain custodian charges that are covered by each Management Agreement.
Interest income earned on cash balances at the custodian, if any, is included in Interest income from affiliates on the Statements of Operations.
Interest expense paid to the custodian related to cash overdrafts, if any, is included in Interest expense to affiliates on the Statements of Operations.
D. Distribution Services— The Distributor or its agent distributes Creation Units for each Fund on an agency basis. The Distributor does not maintain a secondary market in shares of each Fund. JPMDS receives no fees for their distribution services under the distribution agreement with the Trust (the “Distribution Agreement”). Although the Trust does not pay any fees under the Distribution Agreement, JPMIM pays JPMDS for certain distribution related services.
E. Waivers and Reimbursements— The Adviser and/or its affiliates have contractually agreed to waive fees and/or reimburse Small & Mid Cap Enhanced Equity ETF to the extent that total annual operating expenses (excluding acquired fund fees and expenses other than certain money market fund fees as described below, dividend and interest expenses related to short sales, interest, taxes, expenses related to litigation and potential litigation, costs of shareholder meetings, and extraordinary expenses) exceed 0.24% of Small & Mid Cap Enhanced Equity ETF's average daily net assets. The expense limitation agreement was in effect for the six months ended December 31, 2024 and the contractual expense limitation is in place until at least October 31, 2025.
For the six months ended December 31, 2024, Small & Mid Cap Enhanced Equity ETF’s service providers waived fees and/or reimbursed expenses for Small & Mid Cap Enhanced Equity ETF as follows. None of these parties expect Small & Mid Cap Enhanced Equity ETF to repay any such waived fees and/or reimbursed expenses in future years.
| |
| Contractual
Reimbursements |
Small & Mid Cap Enhanced Equity ETF | |
Additionally, the Funds may invest in one or more money market funds advised by the Adviser (affiliated money market funds). The Adviser, Administrator and/or JPMDS, as shareholder servicing agent, have contractually agreed to waive fees and/or reimburse expenses in an amount sufficient to offset the respective net fees each collects from the affiliated money market fund on the applicable Fund’s investment in such affiliated money market fund, except for investments of securities lending cash collateral. None of these parties expect the Funds to repay any such waived fees and/ or reimbursed expenses in future years.
| J.P. Morgan Exchange-Traded Funds | |
NOTES TO FINANCIAL STATEMENTSAS OF December 31, 2024 (Unaudited) (continued)
The amounts of these waivers resulting from investments in these money market funds for the six months ended December 31, 2024 were as follows:
| |
Small & Mid Cap Enhanced Equity ETF | |
F. Other— Certain officers of the Trust are affiliated with the Adviser, the Administrator and JPMDS. Such officers receive no compensation from the Funds for serving in their respective roles.
The Board designated and appointed a Chief Compliance Officer to the Funds pursuant to Rule 38a-1 under the 1940 Act. The fees associated with the office of the Chief Compliance Officer are paid for by JPMIM as described in Note 3.A. for the Funds except Small & Mid Cap Enhanced Equity ETF. Small & Mid Cap Enhanced Equity ETF, along with certain other affiliated funds, makes reimbursement payments, on a pro-rata basis, to the Administrator for a portion of the fees associated with the office of the Chief Compliance Officer. Such fees are included in Trustees’ and Chief Compliance Officer’s fees on the Statements of Operations.
The Trust adopted a Trustee Deferred Compensation Plan (the “Plan”) which allows the independent Trustees to defer the receipt of all or a portion of compensation related to performance of their duties as Trustees. The deferred fees are invested in various J.P. Morgan Funds until distribution in accordance with the Plan.
The below Funds used related party broker-dealers during the six months ended December 31, 2024, and incurred brokerage commissions with broker-dealers affiliated with the Adviser as follows:
| |
| |
| |
Equity Premium Income ETF | |
Nasdaq Equity Premium Income ETF | |
Small & Mid Cap Enhanced Equity ETF | |
The SEC has granted an exemptive order permitting the Funds to engage in principal transactions with J.P. Morgan Securities LLC, an affiliated broker, involving taxable money market instruments, subject to certain conditions.
4. Investment Transactions
During the six months ended December 31, 2024, purchases and sales of investments (excluding short-term investments) were as follows:
| Purchases
(excluding
U.S. Government) | Sales
(excluding
U.S. Government) |
| | |
Active Small Cap Value ETF | | |
| | |
Equity Premium Income ETF | | |
Fundamental Data Science Large Core ETF | | |
Fundamental Data Science Mid Core ETF | | |
Fundamental Data Science Small Core ETF | | |
Nasdaq Equity Premium Income ETF | | |
Small & Mid Cap Enhanced Equity ETF | | |
| | |
During the six months ended December 31, 2024, there were no purchases or sales of U.S. Government securities.
For the six months ended December 31, 2024, in-kind transactions associated with creations and redemptions were as follows:
| | |
| | |
Active Small Cap Value ETF | | |
| | |
Equity Premium Income ETF | | |
Fundamental Data Science Large Core ETF | | |
| J.P. Morgan Exchange-Traded Funds | |
| | |
Fundamental Data Science Mid Core ETF | | |
Fundamental Data Science Small Core ETF | | |
Nasdaq Equity Premium Income ETF | | |
Small & Mid Cap Enhanced Equity ETF | | |
| | |
During the six months ended December 31, 2024, the Funds delivered portfolio securities for the redemption of Fund shares (in-kind redemptions). Cash and portfolio securities were transferred for redemptions at fair value. For financial reporting purposes, the Funds recorded net realized gains and losses in connection with each in-kind redemption transaction.
5. Federal Income Tax Matters
For Federal income tax purposes, the estimated cost and unrealized appreciation (depreciation) in value of investments held at December 31, 2024 were as follows:
| | Gross
Unrealized
Appreciation | Gross
Unrealized
Depreciation | Net Unrealized
Appreciation
(Depreciation) |
| | | | |
Active Small Cap Value ETF | | | | |
| | | | |
Equity Premium Income ETF | | | | |
Fundamental Data Science Large Core ETF | | | | |
Fundamental Data Science Mid Core ETF | | | | |
Fundamental Data Science Small Core ETF | | | | |
Nasdaq Equity Premium Income ETF | | | | |
Small & Mid Cap Enhanced Equity ETF | | | | |
| | | | |
At June 30, 2024, the following Funds had net capital loss carryforwards, which are available to offset future realized gains:
| Capital Loss Carryforward Character |
| | |
| | |
Active Small Cap Value ETF | | |
| | |
Equity Premium Income ETF | | |
Nasdaq Equity Premium Income ETF | | |
Small & Mid Cap Enhanced Equity ETF | | |
| | |
| J.P. Morgan Exchange-Traded Funds | |
NOTES TO FINANCIAL STATEMENTSAS OF December 31, 2024 (Unaudited) (continued)
Net capital losses (gains) and specified ordinary losses incurred after October 31 and late year ordinary losses incurred after December 31 and within the taxable year are deemed to arise on the first business day of the Funds' next taxable year. For the year ended June 30, 2024, the following Funds deferred to July 1, 2024 the following net capital losses (gains), specified ordinary losses and late year ordinary losses of:
| Net Capital Losses (Gains) | | Late Year
Ordinary Loss Deferral |
| | |
| | | | |
| | | | |
Equity Premium Income ETF | | | | |
Nasdaq Equity Premium Income ETF | | | | |
Small & Mid Cap Enhanced Equity ETF | | | | |
| | | | |
During the year ended June 30, 2024, the following Fund utilized capital loss carryforwards as follows:
| |
| |
Active Small Cap Value ETF | |
6. Capital Share Transactions
The Trust issues and redeems shares of the Funds only in Creation Units through the Distributor at NAV. Capital shares transactions detail can be found in the Statements of Changes in Net Assets.
Shares of the Funds may only be purchased or redeemed by Authorized Participants. Such Authorized Participants may from time to time hold, of record or beneficially, a substantial percentage of the Funds' shares outstanding and act as executing or clearing broker for investment transactions on behalf of the Funds. An Authorized Participant is either (1) a “Participating Party” or other participant in the clearing process through the Continuous Net Settlement System of the National Securities Clearing Corporation (“NSCC”); or (2) a DTC Participant; which, in either case, must have executed an agreement with the Distributor.
Creation Units of a Fund may be created in advance of receipt by the Trust of all or a portion of the applicable basket of equity securities and other instruments (“Deposit Instruments”) and cash as described in the Funds’ registration statement. In these instances, the initial Deposit Instruments and cash must be deposited in an amount equal to the sum of the cash amount plus at least 105% for the Funds of the market value of undelivered Deposit Instruments. A transaction fee may be imposed to offset transfer and other transaction costs associated with the purchase or redemption of Creation Units.
Authorized Participants transacting in Creation Units for cash may also pay a variable fee to compensate the relevant fund for market impact expenses relating to investing in portfolio securities. Such variable fees, if any, are included in “Proceeds from shares issued” in the Statements of Changes in Net Assets.
Effective November 1, 2022, the Funds rely upon an exemptive order granted by the SEC (the “Order”) permitting the establishment and operation of an Interfund Lending Facility (the “Facility”). The Facility allows the Funds to directly lend and borrow money to or from any other fund relying upon the Order at rates beneficial to both the borrowing and lending funds. Advances under the Facility are taken primarily for temporary or emergency purposes, including the meeting of redemption requests that otherwise might require the untimely disposition of securities, and are subject to each Fund's borrowing restrictions. The interfund loan rate is determined, as specified in the Order, by averaging the current repurchase agreement rate and the current bank loan rate. The Order was granted to JPMorgan Trust II and may be relied upon by the Funds because the Funds and the series of JPMorgan Trust II are all investment companies in the same “group of investment companies” (as defined in Section 12(d)(1)(G) of the 1940 Act).
The Funds had no borrowings outstanding from another fund, or loans outstanding to another fund, during the six months ended December 31, 2024.
The Trust and JPMCB have entered into a financing arrangement. Under this arrangement, JPMCB provides an unsecured, uncommitted credit facility in the aggregate amount of $100 million to certain of the J.P. Morgan Funds, including the Funds. Advances under the arrangement are taken primarily for temporary or emergency purposes, including the meeting of redemption requests that otherwise might require the untimely disposition of securities, and are subject to each Fund's borrowing restrictions. Interest on borrowings is payable at a rate determined by JPMCB at the time of borrowing. This agreement has been extended until October 28, 2025.
The Funds had no borrowings outstanding from the unsecured, uncommitted credit facility during the six months ended December 31, 2024.
| J.P. Morgan Exchange-Traded Funds | |
8. Risks, Concentrations and Indemnifications
In the normal course of business, the Funds enter into contracts that contain a variety of representations which provide general indemnifications. Each Fund's maximum exposure under these arrangements is unknown. The amount of exposure would depend on future claims that may be brought against each Fund. However, based on experience, the Funds expect the risk of loss to be remote.
As of December 31, 2024, J.P. Morgan Investor Funds, which are affiliated fund of funds, each owned in the aggregate, shares representing more than 10% of the net assets of the Funds as follows:
| |
Small & Mid Cap Enhanced Equity ETF | |
Significant shareholder transactions by these shareholders may impact the Funds' performance and liquidity.
As of December 31, 2024, the Adviser owned shares representing more than 10% of net assets of the following Funds:
| |
Active Small Cap Value ETF | |
Fundamental Data Science Large Core ETF | |
Fundamental Data Science Mid Core ETF | |
Fundamental Data Science Small Core ETF | |
Significant shareholder transactions by the Adviser may impact the Funds' performance.
Disruptions to creations and redemptions, the existence of significant market volatility or potential lack of an active trading market for the shares (including through a trading halt), as well as other factors, may result in shares trading significantly above (at a premium) or below (at a discount) to the NAV or to the intraday value of the Funds’ holdings. During such periods, investors may incur significant losses if shares are sold.
Equity Premium Income ETF's and Nasdaq Equity Premium Income ETF's investments in ELNs entail varying degrees of risks. The Funds are subject to loss of their full principal amount. In addition, the ELNs are subject to a stated maximum return which may limit the payment at maturity. The Funds may also be exposed to additional risks associated with structured notes including: counterparty credit risk related to the issuer’s ability to make payment at maturity; liquidity risk related to a lack of liquid market for these notes, preventing the Funds from trading or selling the notes easily; and a greater degree of market risk than other types of debt securities because the investor bears the risk associated with the underlying financial instruments.
Derivatives may be riskier than other types of investments because they may be more sensitive to changes in economic and market conditions and could result in losses that significantly exceed the Funds' original investment. Many derivatives create leverage thereby causing the Funds to be more volatile than they would have been if they had not used derivatives. Derivatives also expose the Funds to counterparty risk (the risk that the derivative counterparty will not fulfill its contractual obligations), including credit risk of the derivative counterparty. The possible lack of a liquid secondary market for derivatives and the resulting inability of the Funds to sell or otherwise close a derivatives position could expose the Funds to losses and could make derivatives more difficult for the Funds to value accurately.
The Funds are subject to infectious disease epidemics/pandemics risk. The effects of any future pandemic or other global event to public health and business and market conditions may have a significant negative impact on the performance of a Fund's investments, increase a Fund's volatility, exacerbate pre-existing political, social and economic risks to the Funds, and negatively impact broad segments of businesses and populations. In addition, governments, their regulatory agencies, or self-regulatory organizations have taken or may take actions in response to a pandemic or other global event that affect the instruments in which the Funds invest, or the issuers of such instruments, in ways that could have a significant negative impact on a Fund’s investment performance. The ultimate impact of any pandemic or other global event and the extent to which the associated conditions and governmental responses impact a Fund will also depend on future developments, which are highly uncertain, difficult to accurately predict and subject to frequent changes.
| J.P. Morgan Exchange-Traded Funds | |
THIS PAGE IS INTENTIONALLY LEFT BLANK
J.P. Morgan Exchange-Traded Funds are distributed by JPMorgan Distribution Services, Inc., an indirect, wholly-owned subsidiary of JPMorgan Chase & Co. Affiliates of JPMorgan Chase & Co. receive fees for providing various services to the Funds.
Contact J.P. Morgan Exchange-Traded Funds at 1-844-457-6383 (844-4JPM ETF) for a fund prospectus. You can also visit us at www.jpmorganfunds.com. Investors should carefully consider the investment objectives and risks as well as charges and expenses of the fund before investing. The prospectus contains this and other information about the fund. Read the prospectus carefully before investing.
Investors may obtain information about the Securities Investor Protection Corporation (SIPC), including the SIPC brochure, by visiting www.sipc.org or by calling SIPC at 202-371-8300.
J.P. Morgan Asset Management is the brand name for the asset management business of JPMorgan Chase & Co. and its affiliates worldwide.
© JPMorgan Chase & Co., 2024. All rights reserved. December 2024.
SAN-ETF-1224
Changes in and Disagreements with Accountants for Open-End Management Investment Companies
Proxy Disclosures for Open-End Management Investment Companies
Remuneration Paid to Directors, Officers, and Others of Open-End Management Investment Companies
Included in the Statements of Operations within the Funds' Financial Statements.
Statement Regarding Basis for Approval of Management Agreements, Initial Management Agreements and Investment Advisory Agreement
BOARD APPROVAL OF MANAGEMENT AGREEMENTS
JPMorgan Active Growth ETF, JPMorgan Active Small Cap Value ETF, JPMorgan Active Value ETF, JPMorgan Equity Premium Income ETF, JPMorgan Nasdaq Equity Premium Income ETF and JPMorgan U.S. Tech Leaders ETF
The Board of Trustees (the “Board” or the “Trustees”) has established various standing committees composed of Trustees with diverse backgrounds, to which the Board has assigned specific subject matter responsibilities to further enhance the effectiveness of the Board’s oversight and decision making. The Board and its investment committees (Money Market and Alternative Products Committee, Equity Committee, and Fixed Income Committee) met regularly throughout the year and, at each meeting, considered factors that are relevant to their annual consideration of the continuation of the management agreements. The Board also met for the specific purpose of considering management agreement annual renewals. The Board held meetings June 25-26, 2024 and August 20-22, 2024, at which the Trustees considered the continuation of the management agreements for JPMorgan Active Growth ETF, JPMorgan Active Small Cap Value ETF, JPMorgan Active Value ETF, JPMorgan Equity Premium Income ETF, JPMorgan Nasdaq Equity Premium Income ETF and JPMorgan U.S. Tech Leaders ETF (each a “Fund,” and collectively, the “Funds”) whose semi-annual report is contained herein (each a “Management Agreement” and collectively, the “Management Agreements”). At the June meeting, the Board’s investment committees met to review and consider performance, expense and related information for the J.P. Morgan Funds. Each investment committee reported to the full Board, which then considered each investment committee’s preliminary findings. At the August meeting, the Trustees continued their review and consideration. The Trustees, including a majority of the Trustees who are not parties to a Management Agreement or “interested persons” (as defined in the Investment Company Act of 1940) of any party to a Management Agreement or any of their affiliates, approved the continuation of each Management Agreement on August 22, 2024.
As part of their review of the Management Agreements, the Trustees considered and reviewed performance and other information about the Funds received from J.P. Morgan Investment Management Inc. (the “Adviser”). This information included the Funds’ performance as compared to the performance of their peers and benchmarks, and analyses by the Adviser of the Funds’ performance. In addition, at each of their regular meetings throughout the year, the Trustees considered reports on the performance of certain J.P. Morgan Funds provided by an independent investment consulting firm (the “independent consultant”). In addition, in preparation for the
June and August meetings, the Trustees requested, received and evaluated extensive materials from the Adviser, including performance and expense information compiled by Broadridge, using data from Lipper Inc. and/or Morningstar, Inc., independent providers of investment company data (together, “Broadridge”). The Trustees’ independent consultant also provided additional quantitative and statistical analyses of certain Funds, including risk and performance return assessments as compared to the Funds’ objectives, benchmarks, and peers. Before voting on the Management Agreements, the Trustees reviewed the Management Agreements with representatives of the Adviser, counsel to the Funds, and independent legal counsel to the Trustees, and received a memorandum from independent legal counsel to the Trustees discussing the legal standards for their consideration of the Management Agreements. The Trustees also discussed the Management Agreements with independent legal counsel in executive sessions at which no representatives of the Adviser were present.
A summary of the material factors evaluated by the Trustees in determining whether to approve each Management Agreement is provided below. Each Trustee attributed different weights to the various factors and no factor alone was considered determinative. The Trustees considered information provided with respect to the Funds throughout the year, as well as materials furnished specifically in connection with the annual review process. From year to year, the Trustees consider and place emphasis on relevant information in light of changing circumstances in market and economic conditions.
After considering and weighing the factors and information they had received, the Trustees found that the compensation to be received by the Adviser from each Fund under the applicable Management Agreement was fair and reasonable under the circumstances, and determined that the continuance of each Management Agreement was in the best interests of each Fund and its shareholders.
Nature, Extent and Quality of Services Provided by the Adviser
The Trustees received and considered information regarding the nature, extent and quality of services provided to each Fund under the applicable Management Agreement. The Trustees took into account information furnished throughout the year at Trustee meetings, as well as the materials furnished specifically in connection with this annual review process. Among other things, the Trustees considered:
•
The background and experience of the Adviser’s senior management and investment personnel, including personnel changes, if any;
•
The qualifications, backgrounds and responsibilities of the portfolio management team primarily responsible for the day-to-day management of each Fund, including personnel changes, if any;
•
The investment strategy for each Fund, and the infrastructure supporting the portfolio management teams;
•
Information about the structure and distribution strategy for each Fund and how it fits within the Adviser’s other fund offerings within the J.P. Morgan Funds complex;
•
The administration services provided by the Adviser in its role as Administrator;
•
Their knowledge of the nature and quality of the services provided by the Adviser and its affiliates gained from their experience as Trustees of the Funds and in the financial industry generally;
•
The overall reputation and capabilities of the Adviser and its affiliates;
•
The commitment of the Adviser to provide high quality service to the Funds;
•
Their overall confidence in the Adviser’s integrity; and
•
The Adviser’s responsiveness to requests for additional information, questions or concerns raised by them, including the Adviser’s willingness to consider and implement organizational and operational changes designed to improve investment results and the services provided to each Fund.
Based upon these considerations and other factors, the Trustees concluded that they were satisfied with the nature, extent and quality of the services provided to the Funds by the Adviser.
Costs of Services Provided and Profitability to the Adviser and its Affiliates
The Trustees received and considered information regarding the profitability to the Adviser and its affiliates from providing services to each Fund. The Trustees reviewed and discussed this information. The Trustees recognized that this information is not audited and represents the Adviser’s determination of its and its affiliates’ revenues from the contractual services provided to the Funds, less expenses of providing such services. Expenses include direct and indirect costs and are calculated using an allocation methodology developed by the Adviser and reviewed with the Board. The Trustees also recognized that it is difficult to make comparisons of profitability from fund management contracts because comparative information is not generally publicly available and is affected by numerous factors, including the structure of the particular adviser, the types of funds it manages, its business mix, numerous assumptions regarding allocations and the fact that publicly-traded fund managers’ operating profits and net income are
net of distribution and marketing expenses. Based upon their review, and taking into consideration the factors noted above, the Trustees concluded that the profitability to the Adviser under each Management Agreement was not unreasonable in light of the services and benefits provided to each Fund.
The Trustees also considered the fees earned by JPMorgan Chase Bank, N.A. (“JPMCB”), an affiliate of the Adviser, for custody, fund accounting and other related services for each Fund, and the profitability of the arrangements to JPMCB.
The Trustees reviewed information regarding potential “fall-out” or ancillary benefits received by the Adviser and its affiliates as a result of their relationship with the Funds. The Trustees considered that the J.P. Morgan Funds' operating accounts are held at JPMCB, which, as a result, will receive float benefits for certain J.P. Morgan Funds, as applicable. The Trustees also noted that the Adviser supports a diverse set of products and services, which benefits the Adviser by allowing it to leverage its infrastructure to serve additional clients, including benefits that may be received by the Adviser and its affiliates in connection with the Funds’ potential investments in other funds advised by the Adviser. The Trustees also reviewed the Adviser’s allocation of fund brokerage for the J.P. Morgan Funds complex, including allocations to brokers who provide research to the Adviser, as well as the Adviser’s use of affiliates to provide other services and the benefits to such affiliates of doing so. The Trustees also considered the benefit to the Adviser and its affiliates from allocating client assets to the Funds.
The Trustees considered the extent to which the Funds may benefit from potential economies of scale. The Trustees considered that under the Management Agreements, the Adviser provides advisory and administrative services and is responsible for substantially all expenses of each Fund except for certain enumerated contractual exclusions under a “unitary fee” structure. The Trustees noted that the unitary management fee for each Fund does not contain breakpoints. The Trustees considered that shareholders would benefit because expenses would be limited even when a Fund is new and not achieving economies of scale. The Trustees considered the fact that increases in assets would not lead to management fee decreases even if economies of scale are achieved, but also that the Trustees would have the opportunity to further review the appropriateness of the fee payable to the Adviser under the Management Agreement in the future. The Trustees further considered the Adviser's and JPMorgan Distribution Services, Inc.’s (“JPMDS”), an affiliate of the Adviser which serves as the Fund’s distributor and principal underwriter, ongoing investments in their business in support of the Fund, including the Adviser's and/or JPMDS's investments in trading systems,
technology (including improvements to the J.P. Morgan Funds’ website, and cybersecurity improvements), retention of key talent, and regulatory support enhancements. The Trustees also concluded that all Funds benefited from the Adviser’s reinvestment in its operations to serve the Funds and their shareholders. The Trustees noted that the Adviser’s reinvestment ensures sufficient resources in terms of personnel and infrastructure to support the Funds. After considering the factors identified above, the Trustees concluded that the Fund’s shareholders will receive the benefits of potential economies of scale.
Fees Relative to Adviser’s Other Clients
The Trustees received and considered information about the nature and extent of management services and fee rates offered to other clients of the Adviser, including, to the extent applicable, institutional separate accounts, collective investment trusts, other registered investment companies and/or private funds sub-advised by the Adviser, and for investment management styles substantially similar to that of each Fund. The Trustees considered the complexity of investment management for registered investment companies relative to the Adviser’s other clients and noted differences, as applicable, in the fee structure and the regulatory, legal and other risks and responsibilities of providing services to the different clients. The Trustees considered that serving as an adviser to a registered investment company involves greater responsibilities and risks than acting as a sub-adviser and observed that sub-advisory fees may be lower than those charged by the Adviser to each Fund. The Trustees also noted that the adviser, not the applicable registered investment company, typically bears the sub-advisory fee and that many responsibilities related to the advisory function are typically retained by the primary adviser. The Trustees concluded that the fee rates charged to each Fund in comparison to those charged to the Adviser’s other clients were reasonable.
The Trustees receive and consider information about each Fund’s performance throughout the year.
For JPMorgan Active Small Cap Value ETF and JPMorgan U.S. Tech Leaders ETF, each of which launched in 2023 and therefore were not included in the Broadridge comparison discussed below, the Trustees discussed each Fund’s performance (on both a relative and absolute basis). The Trustees also considered each Fund’s investment strategy and processes, portfolio management teams and competitive positioning against peer funds. The Trustees also discussed the performance and the investment strategy of each of these Funds with the Adviser. Based on these discussions and various other factors, the Trustees concluded each Fund’s performance was satisfactory.
For the JPMorgan Active Growth ETF, JPMorgan Active Value ETF, JPMorgan Equity Premium Income ETF and JPMorgan Nasdaq Equity Premium Income ETF, the Trustees received and considered absolute and/or relative performance information for the Funds with at least one-year of performance history in a report prepared by Broadridge. The Trustees considered the total return performance information, which included the ranking of the Funds within a performance universe comprised of funds with the same Broadridge investment classification and objective (the “Universe”), by total return for the applicable one- and three-year periods. The Trustees reviewed a description of Broadridge’s methodology for selecting exchange-traded funds in each Fund’s Universe, and noted that Universe quintile rankings were not calculated if the number of funds in the Universe did not meet a predetermined minimum. As part of this review, the Trustees also reviewed each Fund’s performance against its benchmark and considered the performance information provided for the Funds at regular Board meetings by the Adviser and the Trustees’ independent consultant and also considered the special analysis prepared for certain Funds by the Trustees’ independent consultant. The Trustees also engaged with the Adviser to consider what steps might be taken to improve performance, as applicable. The Broadridge performance data noted by the Trustees as part of their review and the determinations made by the Trustees with respect to each Fund’s performance are summarized below:
The Trustees noted that the JPMorgan Active Growth ETF’s performance was in the third quintile of the Universe for the one-year period ended December 31, 2023. The Trustees discussed the performance and investment strategy of the Fund with the Adviser and, based upon this discussion and various other factors, concluded that the Fund’s performance was satisfactory.
The Trustees noted that the JPMorgan Active Value ETF’s performance was in the third quintile of the Universe for the one-year period ended December 31, 2023. The Trustees discussed the performance and investment strategy of the Fund with the Adviser and reviewed the performance analysis and evaluation prepared by the independent consultant. Based upon these discussions and various other factors, the Trustees concluded that the Fund’s performance was satisfactory.
The Trustees noted that the JPMorgan Equity Premium Income ETF’s performance was in the fourth and second quintiles of the Universe for the one-and three-year periods ended December 31, 2023, respectively. The Trustees discussed the performance and investment strategy of the Fund with the Adviser and reviewed the performance analysis and evaluation prepared by the independent consultant. Based upon these discussions and various other factors, the Trustees concluded that the Fund’s performance was satisfactory under the circumstances.
The Trustees noted that the JPMorgan Nasdaq Equity Premium Income ETF’s performance was in the first quintile of the Universe for the one-year period ended December 31, 2023. The Trustees discussed the performance and investment strategy of the Fund with the Adviser and, based upon this discussion and various other factors, concluded that the Fund’s performance was satisfactory.
Management Fees and Expense Ratios
The Trustees considered the contractual and net management fee rates paid by each Fund to the Adviser and compared the rates to the information prepared by Broadridge concerning management fee rates paid by other funds in the Universe, as well as a subset of funds within the Universe (the “Peer Group”). The Trustees reviewed a description of Broadridge’s methodology for selecting funds in the Peer Group and Universe, as applicable, and noted that Universe and Peer Group quintile rankings were not calculated if the number of funds in the Universe and/or Peer Group did not meet a predetermined minimum. The Trustees also reviewed information about other expenses and the total expense ratio for each Fund. The Trustees recognized that it can be difficult to make comparisons of management fees because there are variations in the services that are included in the fees paid by other funds. The Trustees’ determinations as a result of the review of each Fund’s management fees and expense ratios are summarized below:
The Trustees noted that the JPMorgan Active Growth ETF’s net management fee and actual total expenses were both in the first quintile of both the Peer Group and Universe. After considering the factors identified above, in light of this information, the Trustees concluded that the management fee was fair and reasonable in light of the services provided to the Fund.
The Trustees noted that the JPMorgan Active Small Cap Value ETF’s net management fee and actual total expenses were both in the fifth quintile of both the Peer Group and Universe. After considering the factors identified above, in light of this information, the Trustees concluded that the management fee was fair and reasonable in light of the services provided to the Fund.
The Trustees noted that the JPMorgan Active Value ETF’s net management fee was in the third quintile of both the Peer Group and Universe, and that the actual total expenses were in the second quintile of both the Peer Group and Universe. After considering the factors identified above, in light of this information, the Trustees concluded that the management fee was fair and reasonable in light of the services provided to the Fund.
The Trustees noted that the JPMorgan Equity Premium Income ETF’s net management fee and actual total expenses were both in the first quintile of both the Peer Group and Universe. After
considering the factors identified above, in light of this information, the Trustees concluded that the management fee was fair and reasonable in light of the services provided to the Fund.
The Trustees noted that the JPMorgan Nasdaq Equity Premium Income ETF’s net management fee and actual total expenses were both in the first quintile of both the Peer Group and Universe. After considering the factors identified above, in light of this information, the Trustees concluded that the management fee was fair and reasonable in light of the services provided to the Fund.
The Trustees noted that the JPMorgan U.S. Tech Leaders ETF’s net management fee and actual total expenses were both in the second quintile of both the Peer Group and Universe. After considering the factors identified above, in light of this information, the Trustees concluded that the management fee was fair and reasonable in light of the services provided to the Fund.
BOARD APPROVAL OF INITIAL MANAGEMENT AGREEMENTS
JPMorgan Fundamental Data Science Large Core ETF, JPMorgan Fundamental Data Science Mid Core ETF and JPMorgan Fundamental Data Science Small Core ETF
On May 7-9, 2024, the Board of Trustees (the “Board” or the “Trustees”) held meetings and approved the initial management agreements (each a “Management Agreement” and collectively, the “Management Agreements”) for the JPMorgan Fundamental Data Science Large Core ETF, JPMorgan Fundamental Data Science Mid Core ETF and JPMorgan Fundamental Data Science Small Core ETF. Each of the funds is referred to herein as a “Fund” and collectively, as the “Funds”. The Management Agreements were approved by a majority of the Trustees who are not “Interested Persons” (as defined in the Investment Company Act of 1940) of any party to each Management Agreement or any of their affiliates. In connection with the approval of each Management Agreement, the Trustees reviewed written materials prepared by J.P. Morgan Investment Management Inc. (the “Adviser”) and received oral presentations from Adviser personnel. Before voting on the proposed Management Agreements, the Trustees reviewed each Management Agreement with representatives of the Adviser and with counsel to the Funds and independent legal counsel to the Trustees and received a memorandum from independent legal counsel discussing the legal standards for their consideration of the proposed Management Agreements. They also considered information they received from the Adviser over the course of the year in connection with their oversight of other funds managed by the Adviser. The Trustees also discussed each proposed Management Agreement with independent legal counsel in executive session at which no representatives of the Adviser were present.
A summary of the material factors evaluated by the Trustees in determining whether to approve each Management Agreement is provided below. The Trustees considered information provided with respect to the Funds and the approval of the Management Agreements. Each Trustee attributed his or her own evaluation of the significance of the various factors, and no factor alone was considered determinative. The Trustees determined that the proposed compensation to be received by the Adviser from each Fund under its Management Agreement was fair and reasonable and that initial approval of the Management Agreements was in the best interests of each Fund and its potential shareholders.
Summarized below are the material factors considered and discussed by the Trustees in reaching their conclusions:
Nature, Extent and Quality of Services Provided by the Adviser
In connection with the approval of each Fund’s initial Management Agreement, the Trustees considered the materials furnished specifically in connection with the approval of the
applicable Management Agreement, as well as other relevant information furnished for the Trustees, regarding the nature, extent, and quality of services provided by the adviser. Among other things, the Trustees considered:
•
The background and experience of the Adviser’s senior management and investment personnel;
•
The qualifications, backgrounds and responsibilities of the portfolio management team to be primarily responsible for the day-to-day management of each Fund;
•
The investment strategy for each Fund, and the infrastructure supporting the portfolio management teams;
•
Information about the structure and distribution strategy of each Fund and how it fits within the Adviser’s other fund offerings within the J.P. Morgan Funds complex;
•
The administration services to be provided by the Adviser under the Management Agreements;
•
Their knowledge of the nature and quality of the services provided by the Adviser and its affiliates gained from their experience as Trustees of the Funds and in the financial industry generally;
•
The overall reputation and capabilities of the Adviser and its affiliates;
•
The commitment of the Adviser to provide high quality service to the Funds;
•
Their overall confidence in the Adviser’s integrity; and
•
The Adviser’s responsiveness to requests for additional information, questions or concerns raised by them.
Based upon these considerations and other factors, the Trustees concluded that they were satisfied with the nature, extent and quality of services to be provided to the Funds by the Adviser.
The Trustees reviewed information regarding potential “fall-out” or ancillary benefits expected to be received by the Adviser and its affiliates as a result of their relationship with the Funds. Additionally, the Trustees considered that any fall-out or ancillary benefits would be comparable to those related to the other funds in the complex.
The Trustees also considered the benefits the Adviser is expected to receive as the result of the roles JPMorgan Chase Bank, N.A. (“JPMCB”), an affiliate of the Adviser, plays as custodian, fund accountant and transfer agent for the Funds, including the profitability of those arrangements to JPMCB.
Economies of Scale
The Trustees considered the extent to which the Funds may benefit from potential economies of scale. The Trustees considered that under the Management Agreements, the Adviser will provide advisory and administrative services and will be responsible for substantially all expenses of each Fund except for certain enumerated contractual exclusions under a “unitary fee” structure. The Trustees noted that the proposed unitary management fee for each Fund does not contain breakpoints. The Trustees considered that shareholders would benefit because expenses would be limited even when a Fund is new and not achieving economies of scale. The Trustees considered the fact that increases in assets would not lead to management fee decreases even if economies of scale are achieved, but also that the Trustees would have the opportunity to further review the appropriateness of the fee payable to the Adviser under its Management Agreement in the future. After considering the factors identified above, the Trustees concluded that each Fund’s shareholders will receive the benefits of potential economies of scale.
Fees Relative to Adviser’s Other Clients
The Trustees received and considered information about the nature and extent of management services and fee rates offered to clients of the Adviser, including, to the extent applicable, institutional separate accounts, collective investment trusts, other registered investment companies and/or private funds sub-advised by the Adviser, and for management styles substantially similar to that of each Fund. The Trustees considered the Adviser’s view that it does not manage other accounts with a substantially similar investment strategy as that of each of the Funds.
The Trustees considered each Fund’s investment strategy and processes, the portfolio management team and competitive positioning against identified peer funds and concluded that the prospects for competitive future performance were acceptable.
The Trustees considered the contractual management fee rate that will be paid by each Fund to the Adviser and compared that rate to information prepared by Broadridge Investor Communications Solutions Inc. (“Broadridge”), an independent provider of investment company data, providing management fee rates paid by other funds in the same Morningstar category as each Fund. The Trustees also considered the fees paid to JPMCB, for custody, fund accounting, transfer agency and other related services for each Fund and the profitability of these arrangements to JPMCB.
The Trustees considered how each Fund will be positioned against peer funds, as identified by management and/or Broadridge, as well as how the peer funds included in the Broadridge data differed from the Funds. The Trustees also
noted that because the Funds were not yet operational, no profitability information was available. After considering the factors identified above and other factors, in light of the information, the Trustees concluded that each Fund’s proposed management fee was fair and reasonable.
BOARD APPROVAL OF INVESTMENT ADVISORY AGREEMENT
JPMorgan Small & Mid Cap Enhanced Equity ETF
The Board of Trustees (the “Board” or the “Trustees”) has established various standing committees composed of Trustees with diverse backgrounds, to which the Board has assigned specific subject matter responsibilities to further enhance the effectiveness of the Board’s oversight and decision making. The Board and its investment committees (Money Market and Alternative Products Committee, Equity Committee, and Fixed Income Committee) met regularly throughout the year and, at each meeting, considered factors that are relevant to their annual consideration of the continuation of the investment advisory agreements. The Board also met for the specific purpose of considering investment advisory agreement annual renewals. The Board held meetings June 25-26, 2024 and August 22-22, 2024, at which the Trustees considered the continuation of the investment advisory agreement for the JPMorgan Small & Mid Cap Enhanced Equity ETF (the “Fund”) whose semi-annual report is contained herein (the “Advisory Agreement” ). At the June meeting, the Board’s investment committees met to review and consider performance, expense and related information for the J.P. Morgan Funds. Each investment committee reported to the full Board, which then considered each investment committee’s preliminary findings. At the August meeting, the Trustees continued their review and consideration. The Trustees, including a majority of the Trustees who are not parties to the Advisory Agreement or “interested persons” (as defined in the Investment Company Act of 1940) of any party to the Advisory Agreement or any of their affiliates, approved the continuation of the Advisory Agreement on August 22, 2024.
As part of their review of the Advisory Agreement, the Trustees considered and reviewed performance and other information about the Fund received from J.P. Morgan Investment Management Inc. (the “Adviser”). This information included the Fund’s performance as compared to the performance of its peers and benchmark, and analyses by the Adviser of the Fund’s performance. In addition, at each of their regular meetings throughout the year, the Trustees considered reports on the performance of certain J.P. Morgan Funds provided by an independent investment consulting firm (the “independent consultant”). In addition, in preparation for the June and August meetings, the Trustees requested, received and evaluated extensive materials from the Adviser, including performance and expense information compiled by Broadridge, using data from Lipper Inc. and/or Morningstar, Inc., independent providers of investment company data (together, “Broadridge”). The Trustees’ independent consultant also provided additional quantitative and statistical analyses of certain Funds, including risk and performance return assessments as compared to the Fund’s objectives, benchmarks, and peers. Before voting on the Advisory Agreement, the Trustees reviewed the Advisory
Agreement with representatives of the Adviser, counsel to the Fund, and independent legal counsel to the Trustees, and received a memorandum from independent legal counsel to the Trustees discussing the legal standards for their consideration of the Advisory Agreement. The Trustees also discussed the Advisory Agreement with independent legal counsel in executive sessions at which no representatives of the Adviser were present.
A summary of the material factors evaluated by the Trustees in determining whether to approve the Advisory Agreement is provided below. Each Trustee attributed different weights to the various factors and no factor alone was considered determinative. The Trustees considered information provided with respect to the Fund throughout the year, as well as materials furnished specifically in connection with the annual review process. From year to year, the Trustees consider and place emphasis on relevant information in light of changing circumstances in market and economic conditions.
After considering and weighing the factors and information they had received, the Trustees found that the compensation to be received by the Adviser from the Fund under the Advisory Agreement was fair and reasonable under the circumstances, and determined that the continuance of the Advisory Agreement was in the best interests of the Fund and its shareholders.
Nature, Extent and Quality of Services Provided by the Adviser
The Trustees received and considered information regarding the nature, extent and quality of services provided to the Fund under its Advisory Agreement. The Trustees took into account information furnished throughout the year at Trustee meetings, as well as the materials furnished specifically in connection with this annual review process. Among other things, the Trustees considered:
•
The background and experience of the Adviser’s senior management and investment personnel, including personnel changes, if any;
•
The qualifications, backgrounds and responsibilities of the portfolio management team primarily responsible for the day-to-day management of the Fund, including personnel changes, if any;
•
The investment strategy for the Fund, and the infrastructure supporting the portfolio management team;
•
Information about the structure and distribution strategy for the Fund and how it fits within the Adviser’s other fund offerings within the J.P. Morgan Funds complex;
•
The administration services provided by the Adviser in its role as Administrator;
•
Their knowledge of the nature and quality of the services
provided by the Adviser and its affiliates gained from their experience as Trustees of the Fund and in the financial industry generally;
•
The overall reputation and capabilities of the Adviser and its affiliates;
•
The commitment of the Adviser to provide high quality service to the Fund;
•
Their overall confidence in the Adviser’s integrity; and
•
The Adviser’s responsiveness to requests for additional information, questions or concerns raised by them, including the Adviser’s willingness to consider and implement organizational and operational changes designed to improve investment results and the services provided to the Fund.
Based upon these considerations and other factors, the Trustees concluded that they were satisfied with the nature, extent and quality of the services provided to the Fund by the Adviser.
Costs of Services Provided and Profitability to the Adviser and its Affiliates
The Trustees received and considered information regarding the profitability to the Adviser and its affiliates from providing services to the Fund. The Trustees reviewed and discussed this information. The Trustees recognized that this information is not audited and represents the Adviser’s determination of its and its affiliates’ revenues from the contractual services provided to the Fund, less expenses of providing such services. Expenses include direct and indirect costs and are calculated using an allocation methodology developed by the Adviser and reviewed with the Board. The Trustees also recognized that it is difficult to make comparisons of profitability from fund investment advisory contracts because comparative information is not generally publicly available and is affected by numerous factors, including the structure of the particular adviser, the types of funds it manages, its business mix, numerous assumptions regarding allocations and the fact that publicly-traded fund managers’ operating profits and net income are net of distribution and marketing expenses. Based upon their review, and taking into consideration the factors noted above, the Trustees concluded that the profitability to the Adviser under the Advisory Agreement was not unreasonable in light of the services and benefits provided to the Fund.
The Trustees also considered that the Adviser earns fees from the Fund for providing administration services. These fees were shown separately in the profitability analysis presented to the Trustees. The Trustees also considered the fees earned by JPMorgan Chase Bank, N.A. (“JPMCB”), an affiliate of the Adviser, for custody, fund accounting and other related services for the Fund, and the profitability of the arrangements to JPMCB.
Fall-Out Benefits
The Trustees reviewed information regarding potential “fall-out” or ancillary benefits received by the Adviser and its affiliates as a result of their relationship with the Fund. The Trustees considered that the J.P. Morgan Funds' operating accounts are held at JPMCB, which, as a result, will receive float benefits for certain J.P. Morgan Funds, as applicable. The Trustees also noted that the Adviser supports a diverse set of products and services, which benefits the Adviser by allowing it to leverage its infrastructure to serve additional clients, including benefits that may be received by the Adviser and its affiliates in connection with the Fund’s potential investments in other funds advised by the Adviser. The Trustees also reviewed the Adviser’s allocation of fund brokerage for the J.P. Morgan Funds complex, including allocations to brokers who provide research to the Adviser, as well as the Adviser’s use of affiliates to provide other services and the benefits to such affiliates of doing so. The Trustees also considered the benefit to the Adviser and its affiliates from allocating client assets to the Fund.
The Trustees considered the extent to which the Fund may benefit from potential economies of scale. The Trustees considered that there may not be a direct relationship between economies of scale realized by the Fund and those realized by the Adviser as assets increase. The Trustees considered the extent to which the Fund was priced to scale and whether it would be appropriate to add advisory fee breakpoints, but noted that the Fund has implemented a contractual expense limitation and fee waiver (“Fee Cap”) which allow the Fund’s shareholders to share potential economies of scale from the Fund’s inception, prior to reaching scale. The Trustees noted that the fees remain fair and reasonable relative to peer funds. The Trustees considered the benefits to the Fund of the use of an affiliated distributor and custodian, including the ability to rely on existing infrastructure supporting distribution, custodial and transfer agent services and the ability to negotiate competitive fees for the Fund. The Trustees further considered the Adviser's and JPMorgan Distribution Services, Inc.’s (“JPMDS”), an affiliate of the Adviser which serves as the Fund’s distributor and principal underwriter, ongoing investments in their business in support of the Fund, including the Adviser's and/or JPMDS's investments in trading systems, technology (including improvements to the J.P. Morgan Funds’ website, and cybersecurity improvements), retention of key talent, and regulatory support enhancements. The Trustees concluded that the current fee structure for the Fund, including the Fee Cap that the Adviser has in place that serves to limit the overall net expense ratio of the Fund at a competitive level, was reasonable. The Trustees concluded that the Fund’s shareholders received the benefits of potential economies of scale through the Fee Cap and from the Adviser’s reinvestment in its
operations to serve the Fund and its shareholders. The Trustees noted that the Adviser’s reinvestment ensures sufficient resources in terms of personnel and infrastructure to support the Fund.
Fees Relative to Adviser’s Other Clients
The Trustees received and considered information about the nature and extent of investment advisory services and fee rates offered to other clients of the Adviser, including, to the extent applicable, institutional separate accounts, collective investment trusts, other registered investment companies and/or private funds sub-advised by the Adviser, and for investment management styles substantially similar to that of the Fund. The Trustees considered the complexity of investment management for registered investment companies relative to the Adviser’s other clients and noted differences, as applicable, in the fee structure and the regulatory, legal and other risks and responsibilities of providing services to the different clients. The Trustees considered that serving as an adviser to a registered investment company involves greater responsibilities and risks than acting as a sub-adviser and observed that sub-advisory fees may be lower than those charged by the Adviser to the Fund. The Trustees also noted that the adviser, not the applicable registered investment company, typically bears the sub-advisory fee and that many responsibilities related to the advisory function are typically retained by the primary adviser. The Trustees concluded that the fee rates charged to the Fund in comparison to those charged to the Adviser’s other clients were reasonable.
The Trustees receive and consider information about the Fund’s performance throughout the year. In addition, the Trustees received and considered absolute and/or relative performance information for the Fund in a report prepared by Broadridge. The Trustees considered the total return performance information, which included the ranking of the Fund within a performance universe comprised of funds with the same Broadridge investment classification and objective (the “Universe”), by total return for the applicable one-, three- and five-year periods. The Trustees reviewed a description of Broadridge’s methodology for selecting exchange-traded funds in the Fund’s Universe, and noted that Universe quintile rankings were not calculated if the number of funds in the Universe did not meet a predetermined minimum. As part of this review, the Trustees also reviewed the Fund’s performance against its benchmark and considered the performance information provided for the Fund at regular Board meetings by the Adviser and the Trustees’ independent
consultant and also considered the special analysis prepared for certain Funds by the Trustees’ independent consultant. The Trustees also engaged with the Adviser to consider what steps might be taken to improve performance, as applicable. The Broadridge performance data noted by the Trustees as part of their review and the determinations made by the Trustees with respect to the Fund’s performance are summarized below:
The Trustees noted that the Fund’s performance was in the second, first and first quintiles of the Universe for the one-, three- and five-year periods ended December 31, 2023, respectively. The Trustees discussed the performance and investment strategy of the Fund with the Adviser and reviewed the performance analysis and evaluation prepared by the independent consultant. Based upon these discussions and various other factors, the Trustees concluded that the Fund’s performance was satisfactory.
Advisory Fee and Expense Ratio
The Trustees considered the contractual advisory fee rate and administration fee rate paid by the Fund to the Adviser and compared the combined rate to the information prepared by Broadridge concerning management fee rates paid by other funds in the Universe, as well as a subset of funds within the Universe (the “Peer Group”). The Trustees recognized that Broadridge reported the Fund’s management fee rate as the combined contractual advisory fee and administration fee rates. The Trustees also reviewed information about other expenses and the expense ratio for the Fund, and noted that Universe and Peer Group quintile rankings were not calculated if the number of funds in the Universe and/or Peer Group did not meet a predetermined minimum. The Trustees considered the Fee Cap currently in place for the Fund, the net advisory fee rate and net expense ratio, taking into account any waivers and/or reimbursements, and, where deemed appropriate by the Trustees, additional waivers and/or reimbursements. The Trustees recognized that it can be difficult to make comparisons of advisory fees because there are variations in the services that are included in the fees paid by other funds. The Trustees’ determinations as a result of the review of the Fund’s advisory fee and expense ratio are summarized below:
The Trustees noted that the Fund’s net advisory fee and actual total expenses were in the first quintile of both the Peer Group and Universe. After considering the factors identified above, in light of this information, the Trustees concluded that the advisory fee was fair and reasonable in light of the services provided to the Fund.
ITEM 8. CHANGES IN AND DISAGREEMENTS WITH ACCOUNTANTS FOR OPEN-END MANAGEMENT INVESTMENT COMPANIES.
Refer to Item 7.
ITEM 9. PROXY DISCLOSURES FOR OPEN-END MANAGEMENT INVESTMENT COMPANIES.
Refer to Item 7.
ITEM 10. REMUNERATION PAID TO DIRECTORS, OFFICERS, AND OTHERS OF OPEN-END MANAGEMENT INVESTMENT COMPANIES.
Refer to Item 7.
ITEM 11. STATEMENT REGARDING BASIS FOR APPROVAL OF INVESTMENT ADVISORY CONTRACT.
Refer to Item 7.
ITEM 12. DISCLOSURE OF PROXY VOTING POLICIES AND PROCEDURES FOR CLOSED-END MANAGEMENT INVESTMENT COMPANIES.
Not applicable.
ITEM 13. PORTFOLIO MANAGERS OF CLOSED-END MANAGEMENT INVESTMENT COMPANIES.
Not applicable.
ITEM 14. PURCHASES OF EQUITY SECURITIES BY CLOSED-END MANAGEMENT INVESTMENT COMPANY AND AFFILIATED PURCHASERS.
Not applicable.
ITEM 15. SUBMISSION OF MATTERS TO A VOTE OF SECURITY HOLDERS.
Describe any material changes to the procedures by which shareholders may recommend nominees to the registrant’s board of directors, where those changes were implemented after the registrant last provided disclosure in response to the requirements of Item 7(d)(2)(ii)(G) of Schedule 14A (17 CFR 240.14a-101), or this Item.
No material changes to report.
ITEM 16. CONTROLS AND PROCEDURES.
(a) Disclose the conclusions of the registrant’s principal executive and principal financial officers, or persons performing similar functions, regarding the effectiveness of the registrant’s disclosure controls and procedures (as defined in Rule 30a-3(c) under the Act (17 CFR 270.30a-3(c))) as of a date within 90 days of the filing date of the report that includes the disclosure required by this paragraph, based on the evaluation of these controls and procedures required by Rule 30a-3(b) under the Act (17 CFR 270.30a-3(b)) and Rules 13a-15(b) or 15d-15(b) under the Exchange Act (17 CFR 240.13a-15(b) or 240.15d-15(b)).
The Registrant’s principal executive and principal financial officers have concluded, based on their evaluation of the Registrant’s disclosure controls and procedures as of a date within 90 days of the filing date of this report, that the Registrant’s disclosure controls and procedures are reasonably designed to ensure that information required to be disclosed by the Registrant on Form N-CSR is recorded, processed, summarized and reported within the required time periods and that information required to be disclosed by the Registrant in the reports that it files or submits on Form N-CSR is accumulated and communicated to the Registrant’s management, including its principal executive and principal financial officers, as appropriate to allow timely decisions regarding required disclosure.
(b) Disclose any change in the registrant’s internal control over financial reporting (as defined in Rule 30a-3(d) under the Act (17 CFR 270.30a-3(d)) that occurred during the period covered by this report that has materially affected, or is reasonably likely to materially affect, the registrant’s internal control over financial reporting.
There were no changes in the Registrant’s internal control over financial reporting that occurred during the period covered by this report that have materially affected, or are reasonably likely to materially affect, the Registrant’s internal control over financial reporting.
ITEM 17. DISCLOSURE OF SECURITIES LENDING ACTIVITIES FOR CLOSED-END MANAGEMENT INVESTMENT COMPANIES.
Not applicable.
ITEM 18. RECOVERY OF ERRONEOUSLY AWARDED COMPENSATION.
Not applicable.
ITEM 19. EXHIBITS
| | (a) | File the exhibits listed below as part of this Form. Letter or number the exhibits in the sequence indicated. |
(1) Any code of ethics, or amendment thereto, that is the subject of the disclosure required by Item 2, to the extent that the registrant intends to satisfy the Item 2 requirements through filing of an exhibit.
Not applicable.
(2) A separate certification for each principal executive officer and principal financial officer of the registrant as required by Rule 30a-2(a) under the Act (17 CFR 270.30a-2), exactly as set forth below:
Certifications pursuant to Rule 30a-2(a) under the Investment Company Act of 1940 are attached hereto.
(1) Any written solicitation to purchase securities under Rule 23c-1 under the Act (17 CFR 270.23c-1) sent or given during the period covered by the report by or on behalf of the registrant to 10 or more persons.
Not applicable.
(2) Change in the registrant’s independent public accountant. Provide the information called for by Item 4 of Form 8-K under the Exchange Act (17 CFR 249.308). Unless otherwise specified by Item 4, or related to and necessary for a complete understanding of information not previously disclosed, the information should relate to events occurring during the reporting period.
Not applicable.
Certifications pursuant to Rule 30a-2(b) under the Investment Company Act of 1940 are attached hereto.
SIGNATURES
Pursuant to the requirements of the Securities Exchange Act of 1934 and the Investment Company Act of 1940, the registrant has duly caused this report to be signed on its behalf by the undersigned, thereunto duly authorized.
| | |
| J.P. Morgan Exchange-Traded Fund Trust |
| |
| By: | | /s/ Brian S. Shlissel |
| | Brian S. Shlissel |
| | President and Principal Executive Officer |
| |
| | March 5, 2025 |
Pursuant to the requirements of the Securities Exchange Act of 1934 and the Investment Company Act of 1940, this report has been signed below by the following persons on behalf of the registrant and in the capacities and on the dates indicated.
| | |
| By: | | /s/ Brian S. Shlissel |
| | Brian S. Shlissel |
| | President and Principal Executive Officer |
| |
| | March 5, 2025 |
| |
| By: | | /s/ Timothy J. Clemens |
| | Timothy J. Clemens |
| | Treasurer and Principal Financial Officer |
| |
| | March 5, 2025 |