UNITED STATES
SECURITIES AND EXCHANGE COMMISSION
Washington, D.C. 20549
FORM N-CSR
CERTIFIED SHAREHOLDER REPORT OF REGISTERED
MANAGEMENT INVESTMENT COMPANIES
Investment Company Act File Number: 811-22410
| T. Rowe Price Real Assets Fund, Inc. |
|
| (Exact name of registrant as specified in charter) |
| |
| 100 East Pratt Street, Baltimore, MD 21202 |
|
| (Address of principal executive offices) |
| |
| David Oestreicher |
| 100 East Pratt Street, Baltimore, MD 21202 |
|
| (Name and address of agent for service) |
Registrant’s telephone number, including area code: (410) 345-2000
Date of fiscal year end: December 31
Date of reporting period: December 31, 2014
Item 1. Report to Shareholders
| Real Assets Fund | December 31, 2014 |
The views and opinions in this report were current as of December 31, 2014. They are not guarantees of performance or investment results and should not be taken as investment advice. Investment decisions reflect a variety of factors, and the managers reserve the right to change their views about individual stocks, sectors, and the markets at any time. As a result, the views expressed should not be relied upon as a forecast of the fund’s future investment intent. The report is certified under the Sarbanes-Oxley Act, which requires mutual funds and other public companies to affirm that, to the best of their knowledge, the information in their financial reports is fairly and accurately stated in all material respects.
REPORTS ON THE WEB
Sign up for our E-mail Program, and you can begin to receive updated fund reports and prospectuses online rather than through the mail. Log in to your account at troweprice.com for more information.
Manager’s Letter
Fellow Shareholders
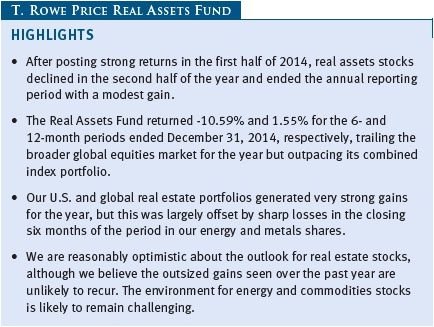
After posting strong returns in the first half of 2014, real assets stocks declined in the second half of the year and ended the annual reporting period with a modest gain. U.S. and global real estate stocks performed well for the year as yield-hungry investors searched for income-producing securities. However, energy and commodities stocks plummeted in the second half of 2014 amid concerns about oversupply, slack demand growth, and a stronger U.S. dollar.
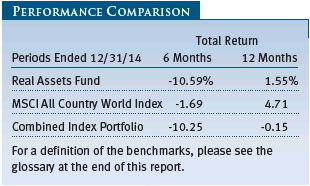
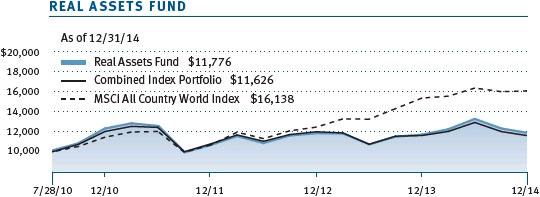
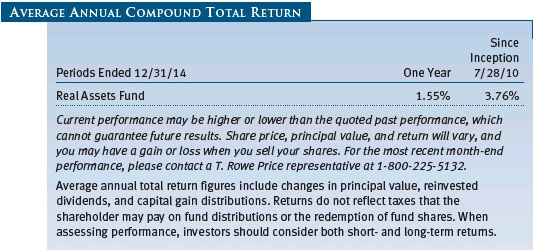
As shown in the Performance Comparison table, the Real Assets Fund returned -10.59% and 1.55% for the 6- and 12-month periods ended December 31, 2014, respectively. The fund trailed the broader global equities market as represented by the MSCI All Country World Index for the full year but outpaced its combined index portfolio, a custom blended benchmark that we believe provides a more appropriate performance comparison.
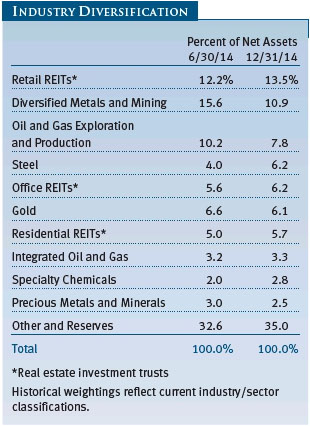
This past year has tested many of the principles underlying the design of our real assets strategy. Global inflation remains muted, especially in non-U.S. developed markets, and global economic growth is tepid. When we designed our investment strategy, we recognized that the Real Assets Fund would likely struggle against the broader global equities market in a low-inflation, slow-growth environment such as we are now experiencing. Our approach is to diversify the portfolio across a range of assets that tend to perform differently under a given inflation scenario, with the goal to smooth returns over time under a full range of inflation regimes. That said, our U.S. and global real estate portfolios generated very strong gains for the year. However, this was largely offset by sharp losses in the closing six months of the period in our energy and metals shares, which sold off along with global commodities prices. Security selection in the fund’s underlying portfolios boosted annual results versus our combined index portfolio, while decisions to overweight and underweight various asset classes had little net impact.
MARKET ENVIRONMENT
U.S. stocks produced strong overall gains in 2014, with the large-cap S&P 500 Index capping a sixth consecutive year of positive returns. The market found support in signs of a resilient U.S. recovery and steady economic improvement throughout the year. U.S. gross domestic product (GDP) grew at an annualized rate of 4.6% in the second quarter and an unexpectedly robust 5.0% in the third quarter, with the combined periods marking the strongest consecutive quarters of economic growth since 2003. A firming labor market reflected the improving economy as employers added 252,000 new jobs in December and the unemployment rate declined to 5.6%. Inflation expectations stayed tame, aided by falling oil prices and signs of slowing economic growth in Europe, Japan, and China. Long-term interest rates declined despite the cessation of the Federal Reserve’s asset purchase program in October. With the end of the Fed’s quantitative easing program, investors shifted their attention to the timing and pace of the Fed’s interest rate normalization, now expected to begin in mid- to late 2015.
Outside the U.S., stocks in Japan declined as its economy slowed into recession in the wake of an April 1 sales tax increase that depressed consumer and business spending. In response, the Bank of Japan expanded its stimulus measures, and the government postponed another consumption tax increase that had been scheduled for late 2015. European markets generally lagged Asian shares. Third-quarter GDP growth in the eurozone was just 0.2% as the region struggled with low inflation, high unemployment, and a loss of consumer and business confidence. Emerging markets equities declined but fared better than shares in non-U.S. developed markets. Commodity-exporting markets tended to lag commodity importers. Significantly, the U.S. dollar strengthened against most other currencies due to a combination of slowing growth and more accommodative monetary policy overseas and expectations of tighter policies in the U.S.
After strong performance in the first half of 2014, natural resources stocks tumbled in the period’s closing six months. The decline in oil prices was particularly sharp as a number of factors weighed heavily on the sector. Increased North American shale oil production and OPEC’s decision in November to maintain current output are two key reasons for the decline in oil prices. Meanwhile, slower economies in Europe, Japan, and China contributed to reduced demand expectations for oil. While energy prices grabbed the lion’s share of headlines, other commodities were not immune to the weakness: copper prices fell more than 25% for the year, and iron ore prices fell from over $130 per ton to less than $70 per ton. Since most global commodities are priced in U.S. dollars, the greenback’s rising value was another factor that weighed heavily on the natural resources space. In contrast to the challenges faced by energy and commodities stocks, real estate investment trusts (REITs) scored solid gains for the year as yield-hungry investors continued to seek income-producing assets in a low-rate environment, with U.S. REITs generating exceptionally strong returns.
PORTFOLIO REVIEW AND POSITIONING
It was a rewarding year for real estate investors as solid fundamentals and low interest rates fueled strong returns across the sector. Although most investors expected bond yields to increase in the past year, interest rates defied expectations and actually declined, fueling demand from yield-hungry investors for real estate stocks and other dividend-paying securities. Going into 2014, we anticipated that the ongoing U.S. economic recovery would support fundamentals in the real estate market and drive earnings and dividends for our companies. However, we did not foresee the dramatic decline in interest rates that fostered the strong expansion in multiples that bolstered our sector’s returns. U.S. real estate holdings significantly outpaced global real estate holdings, although our global equity performance was relatively strong as well.
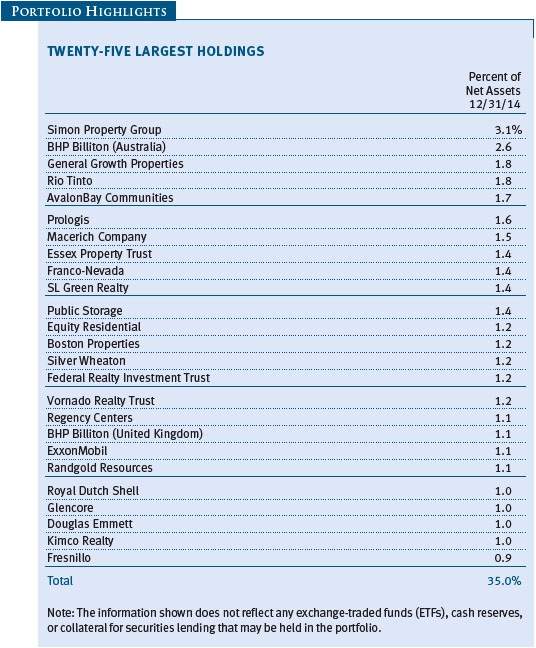
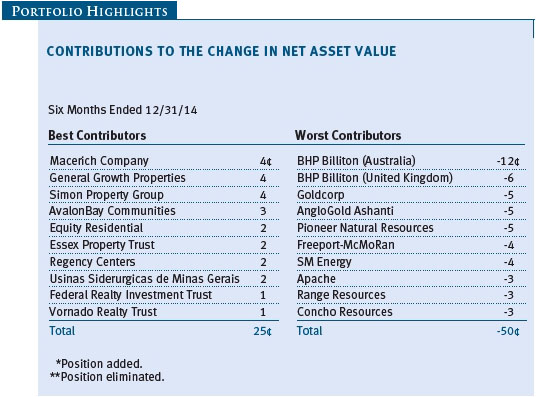
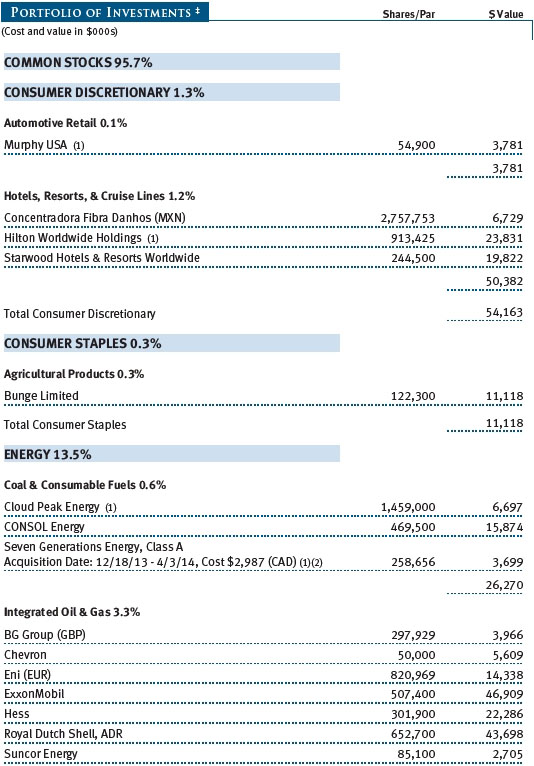
Apartment REITs performed very well in 2014. Since apartment demand has historically been correlated with job growth, a steadily improving labor market throughout the past year supported robust demand for rental housing. Among our apartment REITs, Essex Property Trust performed exceptionally well as the company has been highly successful in integrating and implementing best practices resulting from the merger with BRE Properties. AvalonBay Communities continued to enhance growth and value through the company’s development activities. Equity Residential teamed with AvalonBay to acquire the Archstone portfolio, and we believe that both companies have greatly benefited from the transaction. (Please refer to the fund’s portfolio of investments for a complete list of holdings and the amount each represents in the portfolio.)
As online shopping has increased in popularity, traditional brick-and-mortar retail stores have come under pressure. However, to paraphrase Mark Twain, rumors of the demise of physical locations have proven greatly exaggerated as prime retail shopping destinations continue to attract shoppers. Our property holdings generally performed very well, reflecting the strength of and demand for our specific companies. Class A malls were exceptionally strong during the year. General Growth Properties owns many such popular malls and was a standout contributor this year. Additionally, investors are excited by the many ongoing redevelopment projects at General Growth Properties, such as the extensive renovation at the Ala Moana mall in Honolulu, Hawaii. Simon Property Group joined a growing list of mall companies that decided to improve their overall portfolio quality via subtraction, spinning off some of its lower-productivity malls in an entity named Washington Prime Group, a stock that we subsequently eliminated. Not only did the fund receive a nice performance boost from Simon Property’s own share price appreciation, it also benefited from the gains of Macerich Company after it was revealed that Simon Property had taken a stake in the company.
Our energy and other commodities-related investments struggled as commodity prices declined significantly over the second half of 2014 owing to concerns about excess supply and tepid demand. Oil-related stocks across a broad swath of industries echoed the steep drop in oil prices and fell sharply in the last six months of the reporting period. Overall, we adopted a more defensive posture in oil stocks, looking for companies with low cost structures and healthy balance sheets that are more likely to withstand the current environment and emerge in a stronger competitive position when the oil price cycle turns. Athlon Energy was a rare bright spot among U.S. energy exploration and production (E&P) companies after an announced acquisition by Canada’s Encana Corporation. A number of other U.S. E&P companies, including SM Energy, Pioneer Natural Resources, Apache, and Range Resources, hurt performance.
Diversified metals and mining stocks declined in absolute terms along with the global commodities market, although stock selection helped our portfolio outperform its benchmark. Given the weakness in metals prices, the largest detractors to fund performance over the year were concentrated in the mining space. Anglo-Australian miner BHP Billiton weighed heavily on results, particularly in the fourth quarter due to its energy exposure. Other miners, including Rio Tinto, Vale, and Freeport-McMoRan also fell as prices softened.
On a relative basis, our precious metals holdings outperformed other commodity-related investments. Franco-Nevada benefited from a bounce in gold prices and a low-cost business model based on royalties from mining operations. However, AngloGold Ashanti weighed on results due to concerns about high costs and elevated debt.
There were some bright spots in the natural resources space that helped the fund’s relative performance. Like the real estate sector, utilities stocks surged higher as a declining yield on the 10-year Treasury note drove income-seeking investors to dividend-paying equities. Concerns about a slowing global economy also caused many investors to seek the safety of more defensive sectors, such as utilities. Multi-utilities NiSource and PG&E were among our better performers, as was electric utility American Electric Power.
We also enjoyed solid double-digit absolute gains in specialty chemicals. Profit margins in the sector benefited from lower input costs as a result of declining commodity prices and rising revenues from the ongoing U.S. economic recovery. Coatings company RPM, which owns the Rust-Oleum and DAP brands, and paint manufacturer Sherwin-Williams were among the industry’s strongest performers.
OUTLOOK
We expect modest global economic growth over the next several quarters. Diminishing fiscal headwinds, increased state and local government spending, improving private sector demand, and moderate job growth should support gradual improvements in U.S. economic activity. U.S. Federal Reserve policy remains accommodative, with interest rate hikes not expected until mid- to late 2015. Healthy corporate balance sheets and cash flows offer flexibility to increase hiring and capital expenditures, enhance merger and acquisition activity, and return capital to shareholders through dividends and share repurchases. A stronger U.S. dollar and lower energy prices are beneficial for U.S. consumers but represent a headwind to corporate earnings in manufacturing and export-oriented sectors.
Overseas, Europe’s economy has softened due to concerns about deflation, burdensome debt loads, and high unemployment, and Japan’s economy slipped back into recession. We are encouraged that policymakers in Europe and Japan have started to implement more aggressive stimulus, but we expect these measures will take some time to bear fruit. Overall growth is slowing in emerging markets, but there is a wide divergence between industries, countries, and regions.
We continue to believe that we are in the early stages of a secular down cycle in commodities. U.S. oil prices declined more than 45% over the course of 2014, and U.S. natural gas prices have fallen by almost 80% since 2008. Although cheaper energy benefits U.S. consumers’ budgets and energy-intensive manufacturers, it challenges the stocks of energy producers, particularly energy service companies. Falling oil prices have also punished energy-exporting economies in the developing world, as well as the high yield bond market, 20% of which is composed of energy companies. Lackluster economic growth outside the U.S. coupled with a stronger U.S. dollar spell continued trouble for a wide range of commodities, including industrial metals and oil.
We are reasonably optimistic about the outlook for real estate stocks, although we believe the outsized gains seen over the past year are unlikely to recur. While impossible to predict, it does appear that the markets expect a longer period for low interest rates. We have seen that a low-rate environment heightens demand for income-producing properties, although the total returns may depend on the multiple that investors are willing to pay for earnings. We remain confident in the caliber and quality of our REITs and their abilities to adapt and perform in a healthy growth environment.
Key risks to global markets include the effectiveness of global monetary policy to stimulate growth and rising geopolitical tensions in some regions of the world. However, we believe that highly diversified portfolios and a careful focus on fundamental research can enhance our ability to identify investment opportunities on behalf of our shareholders.
Respectfully submitted,

Wyatt A. Lee
Portfolio manager and chairman of the fund’s Investment
Advisory Committee
January 26, 2015
The committee chairman has day-to-day responsibility for managing the portfolio and works with committee members in developing and executing its investment program.
RISKS OF STOCK INVESTING
The fund’s share price can fall because of weakness in the stock markets, a particular industry, or specific holdings. Stock markets can decline for many reasons, including adverse political or economic developments, changes in investor psychology, or heavy institutional selling. The prospects for an industry or company may deteriorate because of a variety of factors, including disappointing earnings or changes in the competitive environment. In addition, the investment manager’s assessment of companies held in a fund may prove incorrect, resulting in losses or poor performance even in rising markets. Funds that invest only in specific industries will experience greater volatility than funds investing in a broad range of industries. The rate of earnings growth of natural resources companies may be irregular since these companies are strongly affected by natural forces, global economic cycles, and international politics. For example, stock prices of energy companies can fall sharply when oil prices decrease.
GLOSSARY
Combined index portfolio: An unmanaged stock portfolio consisting of 30% global natural resources (65% MSCI All Country World Index Energy and 35% MSCI All Country World Index Materials), 20% U.S. real estate (Wilshire U.S. Real Estate Securities Index), 20% global real estate (FTSE EPRA/NAREIT Developed Index), 25% global metals and mining (MSCI All Country World Index Metals & Mining), and 5% precious metals (80% MSCI All Country World Index IMI Gold, 20% MSCI All Country World Index IMI Precious Metals & Minerals).
| ● | FTSE EPRA/NAREIT Developed Index: An index that tracks the performance of developed market real estate securities. |
| |
| ● | MSCI All Country World Index Energy: An index that tracks the performance of companies engaged in the exploration and production of energy commodities. |
| |
| ● | MSCI All Country World Index IMI Gold: An index that tracks the performance of companies engaged in the exploration and production of gold. |
| |
| ● | MSCI All Country World Index IMI Precious Metals & Minerals: An index that tracks the performance of companies engaged in the exploration and production of precious metals and minerals. |
| |
| ● | MSCI All Country World Index Materials: An index that tracks the performance of companies engaged in the exploration and production of basic materials. |
| |
| ● | MSCI All Country World Index Metals & Mining: An index that tracks the performance of metals and mining companies. |
| |
| ● | Wilshire U.S. Real Estate Securities Index: An index that tracks the performance of publicly traded U.S. real estate securities. |
Gross domestic product (GDP): The total market value of all goods and services produced in a country in a given year.
MSCI All Country World Index: A capitalization-weighted index of stocks from developed and emerging markets worldwide.
Real estate investment trusts (REITs): Publicly traded companies that own, develop, and operate apartment complexes, hotels, office buildings, and other commercial properties.
Note: MSCI makes no express or implied warranties or representations and shall have no liability whatsoever with respect to any MSCI data contained herein. The MSCI data may not be further redistributed or used as a basis for other indices or any securities or financial products. This report is not approved, reviewed, or produced by MSCI.
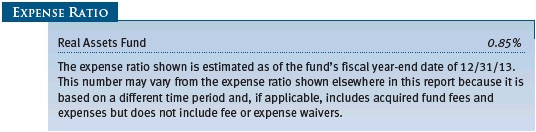
Performance and Expenses
This chart shows the value of a hypothetical $10,000 investment in the fund over the past 10 fiscal year periods or since inception (for funds lacking 10-year records). The result is compared with benchmarks, which may include a broad-based market index and a peer group average or index. Market indexes do not include expenses, which are deducted from fund returns as well as mutual fund averages and indexes.
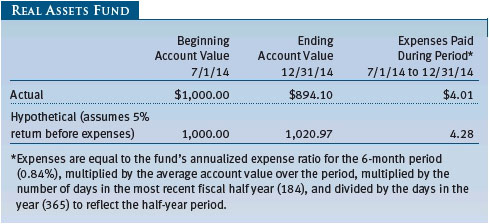
As a mutual fund shareholder, you may incur two types of costs: (1) transaction costs, such as redemption fees or sales loads, and (2) ongoing costs, including management fees, distribution and service (12b-1) fees, and other fund expenses. The following example is intended to help you understand your ongoing costs (in dollars) of investing in the fund and to compare these costs with the ongoing costs of investing in other mutual funds. The example is based on an investment of $1,000 invested at the beginning of the most recent six-month period and held for the entire period.
Actual Expenses
The first line of the following table (Actual) provides information about actual account values and expenses based on the fund’s actual returns. You may use the information on this line, together with your account balance, to estimate the expenses that you paid over the period. Simply divide your account value by $1,000 (for example, an $8,600 account value divided by $1,000 = 8.6), then multiply the result by the number on the first line under the heading “Expenses Paid During Period” to estimate the expenses you paid on your account during this period.
Hypothetical Example for Comparison Purposes
The information on the second line of the table (Hypothetical) is based on hypothetical account values and expenses derived from the fund’s actual expense ratio and an assumed 5% per year rate of return before expenses (not the fund’s actual return). You may compare the ongoing costs of investing in the fund with other funds by contrasting this 5% hypothetical example and the 5% hypothetical examples that appear in the shareholder reports of the other funds. The hypothetical account values and expenses may not be used to estimate the actual ending account balance or expenses you paid for the period.
Note: T. Rowe Price charges an annual account service fee of $20, generally for accounts with less than $10,000. The fee is waived for any investor whose T. Rowe Price mutual fund accounts total $50,000 or more; accounts electing to receive electronic delivery of account statements, transaction confirmations, prospectuses, and shareholder reports; or accounts of an investor who is a T. Rowe Price Preferred Services, Personal Services, or Enhanced Personal Services client (enrollment in these programs generally requires T. Rowe Price assets of at least $100,000). This fee is not included in the accompanying table. If you are subject to the fee, keep it in mind when you are estimating the ongoing expenses of investing in the fund and when comparing the expenses of this fund with other funds.
You should also be aware that the expenses shown in the table highlight only your ongoing costs and do not reflect any transaction costs, such as redemption fees or sales loads. Therefore, the second line of the table is useful in comparing ongoing costs only and will not help you determine the relative total costs of owning different funds. To the extent a fund charges transaction costs, however, the total cost of owning that fund is higher.
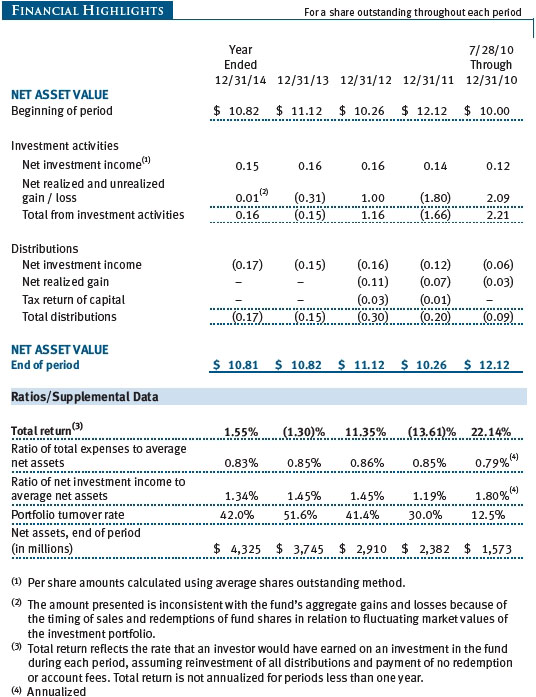
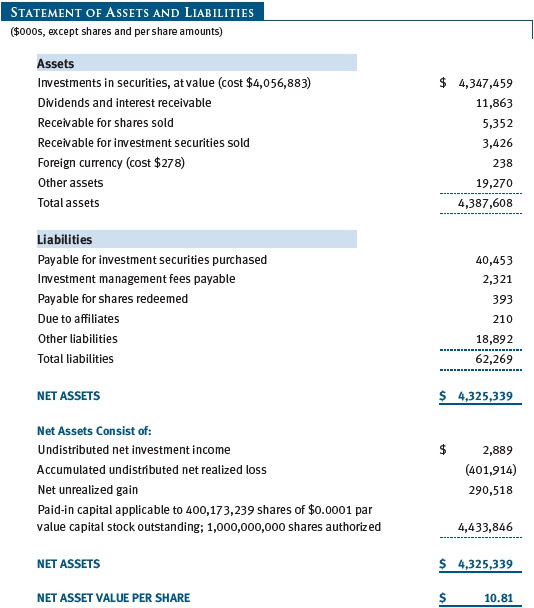
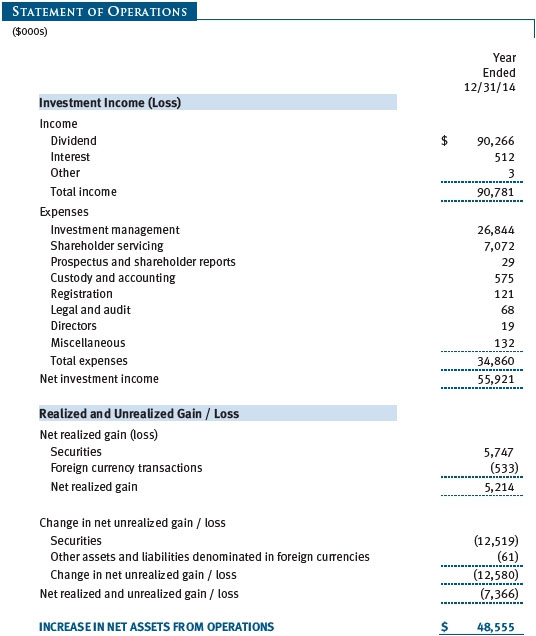
The accompanying notes are an integral part of these financial statements.


The accompanying notes are an integral part of these financial statements.
The accompanying notes are an integral part of these financial statements.
The accompanying notes are an integral part of these financial statements.
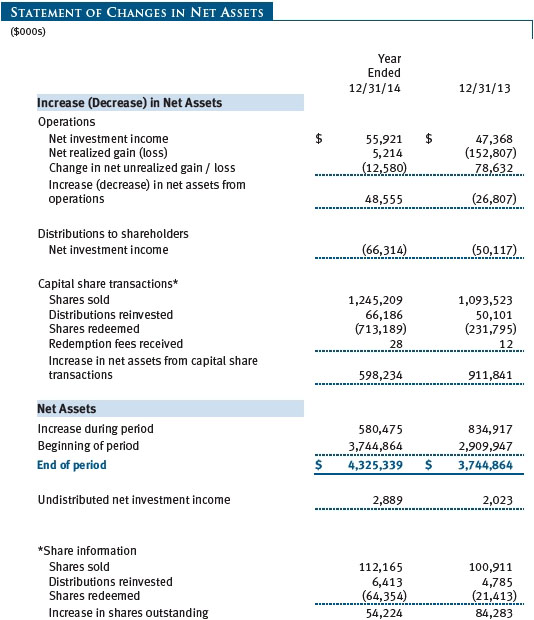
The accompanying notes are an integral part of these financial statements.
| Notes to Financial Statements |
T. Rowe Price Real Assets Fund (the fund), is registered under the Investment Company Act of 1940 (the 1940 Act) as a diversified, open-end management investment company. The fund commenced operations on July 28, 2010. The fund seeks to provide long-term growth of capital.
NOTE 1 - SIGNIFICANT ACCOUNTING POLICIES
Basis of Preparation The fund is an investment company and follows accounting and reporting guidance in the Financial Accounting Standards Board (FASB) Accounting Standards Codification Topic 946 (ASC 946). The accompanying financial statements were prepared in accordance with accounting principles generally accepted in the United States of America (GAAP), including but not limited to ASC 946. GAAP requires the use of estimates made by management. Management believes that estimates and valuations are appropriate; however, actual results may differ from those estimates, and the valuations reflected in the accompanying financial statements may differ from the value ultimately realized upon sale or maturity.
Investment Transactions, Investment Income, and Distributions Income and expenses are recorded on the accrual basis. Premiums and discounts on debt securities are amortized for financial reporting purposes. Dividends received from mutual fund investments are reflected as dividend income; capital gain distributions are reflected as realized gain/loss. Dividend income and capital gain distributions are recorded on the ex-dividend date. Income tax-related interest and penalties, if incurred, would be recorded as income tax expense. Investment transactions are accounted for on the trade date. Realized gains and losses are reported on the identified cost basis. Distributions to shareholders are recorded on the ex-dividend date. Distributions from REITs are initially recorded as dividend income and, to the extent such represent a return of capital or capital gain for tax purposes, are reclassified when such information becomes available. Income distributions are declared and paid annually. Capital gain distributions, if any, are generally declared and paid by the fund annually.
Currency Translation Assets, including investments, and liabilities denominated in foreign currencies are translated into U.S. dollar values each day at the prevailing exchange rate, using the mean of the bid and asked prices of such currencies against U.S. dollars as quoted by a major bank. Purchases and sales of securities, income, and expenses are translated into U.S. dollars at the prevailing exchange rate on the date of the transaction. The effect of changes in foreign currency exchange rates on realized and unrealized security gains and losses is reflected as a component of security gains and losses.
Rebates Subject to best execution, the fund may direct certain security trades to brokers who have agreed to rebate a portion of the related brokerage commission to the fund in cash. Commission rebates are reflected as realized gain on securities in the accompanying financial statements and totaled $151,000 for the year ended December 31, 2014.
Redemption Fees A 2% fee is assessed on redemptions of fund shares held for 90 days or less to deter short-term trading and to protect the interests of long-term shareholders. Redemption fees are withheld from proceeds that shareholders receive from the sale or exchange of fund shares. The fees are paid to the fund and are recorded as an increase to paid-in capital. The fees may cause the redemption price per share to differ from the net asset value per share.
New Accounting Guidance In June 2014, FASB issued Accounting Standards Update (ASU) No. 2014-11, Transfers and Servicing (Topic 860), Repurchase-to-Maturity Transactions, Repurchase Financings, and Disclosures. The ASU changes the accounting for certain repurchase agreements and expands disclosure requirements related to repurchase agreements, securities lending, repurchase-to-maturity and similar transactions. The ASU is effective for interim and annual reporting periods beginning after December 15, 2014. Adoption will have no effect on the fund’s net assets or results of operations.
NOTE 2 - VALUATION
The fund’s financial instruments are valued and its net asset value (NAV) per share is computed at the close of the New York Stock Exchange (NYSE), normally 4 p.m. ET, each day the NYSE is open for business.
Fair Value The fund’s financial instruments are reported at fair value, which GAAP defines as the price that would be received to sell an asset or paid to transfer a liability in an orderly transaction between market participants at the measurement date. The T. Rowe Price Valuation Committee (the Valuation Committee) has been established by the fund’s Board of Directors (the Board) to ensure that financial instruments are appropriately priced at fair value in accordance with GAAP and the 1940 Act. Subject to oversight by the Board, the Valuation Committee develops and oversees pricing-related policies and procedures and approves all fair value determinations. Specifically, the Valuation Committee establishes procedures to value securities; determines pricing techniques, sources, and persons eligible to effect fair value pricing actions; oversees the selection, services, and performance of pricing vendors; oversees valuation-related business continuity practices; and provides guidance on internal controls and valuation-related matters. The Valuation Committee reports to the Board; is chaired by the fund’s treasurer; and has representation from legal, portfolio management and trading, operations, and risk management.
Various valuation techniques and inputs are used to determine the fair value of financial instruments. GAAP establishes the following fair value hierarchy that categorizes the inputs used to measure fair value:
Level 1 – quoted prices (unadjusted) in active markets for identical financial instruments that the fund can access at the reporting date
Level 2 – inputs other than Level 1 quoted prices that are observable, either directly or indirectly (including, but not limited to, quoted prices for similar financial instruments in active markets, quoted prices for identical or similar financial instruments in inactive markets, interest rates and yield curves, implied volatilities, and credit spreads)
Level 3 – unobservable inputs
Observable inputs are developed using market data, such as publicly available information about actual events or transactions, and reflect the assumptions that market participants would use to price the financial instrument. Unobservable inputs are those for which market data are not available and are developed using the best information available about the assumptions that market participants would use to price the financial instrument. GAAP requires valuation techniques to maximize the use of relevant observable inputs and minimize the use of unobservable inputs. When multiple inputs are used to derive fair value, the financial instrument is assigned to the level within the fair value hierarchy based on the lowest-level input that is significant to the fair value of the financial instrument. Input levels are not necessarily an indication of the risk or liquidity associated with financial instruments at that level but rather the degree of judgment used in determining those values.
Valuation Techniques Equity securities listed or regularly traded on a securities exchange or in the over-the-counter (OTC) market are valued at the last quoted sale price or, for certain markets, the official closing price at the time the valuations are made. OTC Bulletin Board securities are valued at the mean of the closing bid and asked prices. A security that is listed or traded on more than one exchange is valued at the quotation on the exchange determined to be the primary market for such security. Listed securities not traded on a particular day are valued at the mean of the closing bid and asked prices for domestic securities and the last quoted sale or closing price for international securities.
For valuation purposes, the last quoted prices of non-U.S. equity securities may be adjusted to reflect the fair value of such securities at the close of the NYSE. If the fund determines that developments between the close of a foreign market and the close of the NYSE will, in its judgment, materially affect the value of some or all of its portfolio securities, the fund will adjust the previous quoted prices to reflect what it believes to be the fair value of the securities as of the close of the NYSE. In deciding whether it is necessary to adjust quoted prices to reflect fair value, the fund reviews a variety of factors, including developments in foreign markets, the performance of U.S. securities markets, and the performance of instruments trading in U.S. markets that represent foreign securities and baskets of foreign securities. The fund may also fair value securities in other situations, such as when a particular foreign market is closed but the fund is open. The fund uses outside pricing services to provide it with quoted prices and information to evaluate or adjust those prices. The fund cannot predict how often it will use quoted prices and how often it will determine it necessary to adjust those prices to reflect fair value. As a means of evaluating its security valuation process, the fund routinely compares quoted prices, the next day’s opening prices in the same markets, and adjusted prices.
Actively traded domestic equity securities generally are categorized in Level 1 of the fair value hierarchy. Non-U.S. equity securities generally are categorized in Level 2 of the fair value hierarchy despite the availability of quoted prices because, as described above, the fund evaluates and determines whether those quoted prices reflect fair value at the close of the NYSE or require adjustment. OTC Bulletin Board securities, certain preferred securities, and equity securities traded in inactive markets generally are categorized in Level 2 of the fair value hierarchy.
Debt securities generally are traded in the OTC market. Securities with remaining maturities of one year or more at the time of acquisition are valued at prices furnished by dealers who make markets in such securities or by an independent pricing service, which considers the yield or price of bonds of comparable quality, coupon, maturity, and type, as well as prices quoted by dealers who make markets in such securities. Generally, debt securities are categorized in Level 2 of the fair value hierarchy; however, to the extent the valuations include significant unobservable inputs, the securities would be categorized in Level 3.
Investments in mutual funds are valued at the mutual fund’s closing NAV per share on the day of valuation and are categorized in Level 1 of the fair value hierarchy. Assets and liabilities other than financial instruments, including short-term receivables and payables, are carried at cost, or estimated realizable value, if less, which approximates fair value.
Thinly traded financial instruments and those for which the above valuation procedures are inappropriate or are deemed not to reflect fair value are stated at fair value as determined in good faith by the Valuation Committee. The objective of any fair value pricing determination is to arrive at a price that could reasonably be expected from a current sale. Financial instruments fair valued by the Valuation Committee are primarily private placements, restricted securities, warrants, rights, and other securities that are not publicly traded.
Subject to oversight by the Board, the Valuation Committee regularly makes good faith judgments to establish and adjust the fair valuations of certain securities as events occur and circumstances warrant. For instance, in determining the fair value of an equity investment with limited market activity, such as a private placement or a thinly traded public company stock, the Valuation Committee considers a variety of factors, which may include, but are not limited to, the issuer’s business prospects, its financial standing and performance, recent investment transactions in the issuer, new rounds of financing, negotiated transactions of significant size between other investors in the company, relevant market valuations of peer companies, strategic events affecting the company, market liquidity for the issuer, and general economic conditions and events. In consultation with the investment and pricing teams, the Valuation Committee will determine an appropriate valuation technique based on available information, which may include both observable and unobservable inputs. The Valuation Committee typically will afford greatest weight to actual prices in arm’s length transactions, to the extent they represent orderly transactions between market participants; transaction information can be reliably obtained; and prices are deemed representative of fair value. However, the Valuation Committee may also consider other valuation methods such as market-based valuation multiples; a discount or premium from market value of a similar, freely traded security of the same issuer; or some combination. Fair value determinations are reviewed on a regular basis and updated as information becomes available, including actual purchase and sale transactions of the issue. Because any fair value determination involves a significant amount of judgment, there is a degree of subjectivity inherent in such pricing decisions, and fair value prices determined by the Valuation Committee could differ from those of other market participants. Depending on the relative significance of unobservable inputs, including the valuation technique(s) used, fair valued securities may be categorized in Level 2 or 3 of the fair value hierarchy.
Valuation Inputs The following table summarizes the fund’s financial instruments, based on the inputs used to determine their fair values on December 31, 2014:
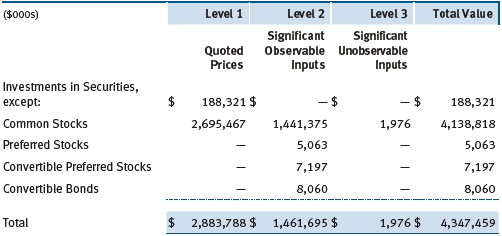
There were no material transfers between Levels 1 and 2 during the year ended December 31, 2014.
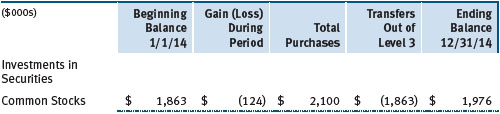
Following is a reconciliation of the fund’s Level 3 holdings for the year ended December 31, 2014. Gain (loss) reflects both realized and change in unrealized gain/loss on Level 3 holdings during the period, if any, and is included on the accompanying Statement of Operations. The change in unrealized gain/loss on Level 3 instruments held at December 31, 2014, totaled $(124,000) for the year ended December 31, 2014. Transfers into and out of Level 3 are reflected at the value of the financial instrument at the beginning of the period. During the year, transfers out of Level 3 were because observable market data became available for the security.
NOTE 3 - OTHER INVESTMENT TRANSACTIONS
Consistent with its investment objective, the fund engages in the following practices to manage exposure to certain risks and/or to enhance performance. The investment objective, policies, program, and risk factors of the fund are described more fully in the fund’s prospectus and Statement of Additional Information.
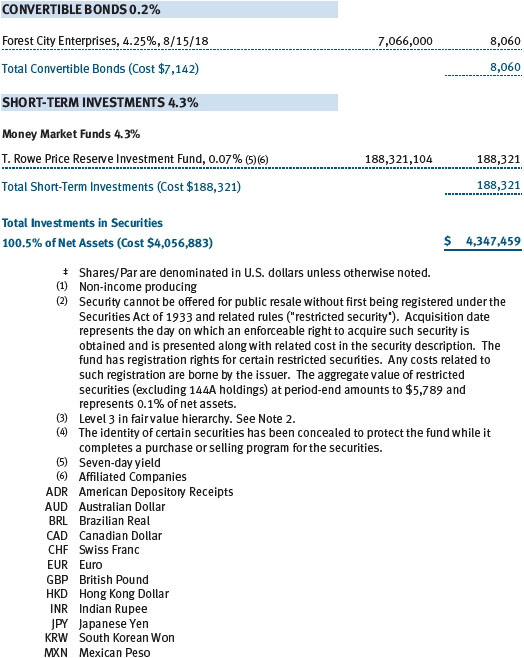
Restricted Securities The fund may invest in securities that are subject to legal or contractual restrictions on resale. Prompt sale of such securities at an acceptable price may be difficult and may involve substantial delays and additional costs.
Other Purchases and sales of portfolio securities other than short-term securities aggregated $2,197,977,000 and $1,701,343,000, respectively, for the year ended December 31, 2014.
NOTE 4 - FEDERAL INCOME TAXES
No provision for federal income taxes is required since the fund intends to continue to qualify as a regulated investment company under Subchapter M of the Internal Revenue Code and distribute to shareholders all of its taxable income and gains. Distributions determined in accordance with federal income tax regulations may differ in amount or character from net investment income and realized gains for financial reporting purposes. Financial reporting records are adjusted for permanent book/tax differences to reflect tax character but are not adjusted for temporary differences.
The fund files U.S. federal, state, and local tax returns as required. The fund’s tax returns are subject to examination by the relevant tax authorities until expiration of the applicable statute of limitations, which is generally three years after the filing of the tax return but which can be extended to six years in certain circumstances. Tax returns for open years have incorporated no uncertain tax positions that require a provision for income taxes.
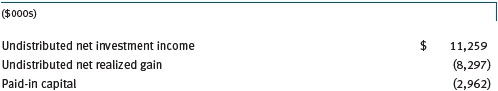
Reclassifications to paid-in capital relate primarily to an over distribution of taxable income not deemed a return of capital for tax purposes. Reclassifications between income and gain relate primarily to the character of dividends received from real estate investment trusts (REITs). For the year ended December 31, 2014, the following reclassifications were recorded to reflect tax character (there was no impact on results of operations or net assets):
Distributions during the years ended December 31, 2014 and December 31, 2013, totaled $66,314,000 and $50,117,000, respectively, and were characterized as ordinary income for tax purposes. At December 31, 2014, the tax-basis cost of investments and components of net assets were as follows:
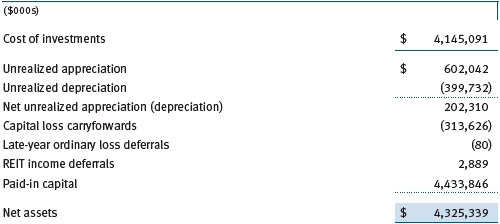
The difference between book-basis and tax-basis net unrealized appreciation (depreciation) is attributable to the deferral of losses from wash sales and the realization of gains/losses on passive foreign investment companies for tax purposes. The fund intends to retain realized gains to the extent of available capital loss carryforwards. Net realized capital losses may be carried forward indefinitely to offset future realized capital gains. During the year ended December 31, 2014, the fund utilized $1,486,000 of capital loss carryforwards. In accordance with federal tax laws applicable to investment companies, specified net losses realized between November 1 and December 31 are not recognized for tax purposes until the subsequent year (late-year ordinary loss deferrals); however, such losses are recognized for financial reporting purposes in the year realized. Similarly, certain dividends declared by REITs in December and paid the following January are recognized for tax purposes in the subsequent year (REIT income deferrals) but, for financial reporting purposes, are included in the fund’s dividend income on ex-date.
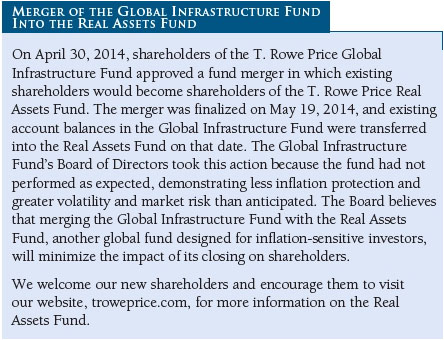
NOTE 5 - ACQUISITION
On May 19, 2014, the fund acquired substantially all of the assets of the T. Rowe Price Global Infrastructure Fund (the acquired fund), pursuant to the Agreement and Plan of Reorganization dated January 31, 2014, and approved by shareholders of the acquired fund on April 30, 2014. The acquisition provides the acquired fund’s shareholders global investments along with a broader diversification across sectors and a stronger focus on inflation projections, as well as a potentially lower expense ratio. The acquisition was accomplished by a tax-free exchange of 3,118,056 shares of the fund with a value of $36,731,000 for all 3,795,094 shares of the acquired fund then outstanding, with the same value. The exchange was based on values at the close of the NYSE on the immediately preceding business day, May 16, 2014. The net assets of the acquired fund at that date included $20,000 of unrealized depreciation. Assets of the acquired fund, including securities of $35,650,000, cash of $842,000, and receivables and other assets of $239,000, were combined with those of the fund, resulting in aggregate net assets of $4,181,367,000 immediately after the acquisition.
Pro forma results of operations of the combined entity for the entire year ended December 31, 2014, as though the acquisition had occurred as of the beginning of the year (rather than on the actual acquisition date), are as follows:
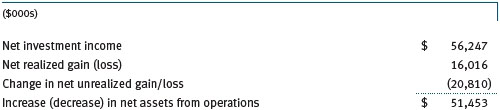
Because the combined investment portfolios have been managed as a single portfolio since the acquisition was completed, it is not practicable to separate the amounts of revenue and earnings of the acquired fund that have been included in the fund’s accompanying Statement of Operations since May 19, 2014.
NOTE 6 - RELATED PARTY TRANSACTIONS
The fund is managed by T. Rowe Price Associates, Inc. (Price Associates), a wholly owned subsidiary of T. Rowe Price Group, Inc. (Price Group). The investment management agreement between the fund and Price Associates provides for an annual investment management fee, which is computed daily and paid monthly. The fee consists of an individual fund fee, equal to 0.35% of the fund’s average daily net assets, and a group fee. The group fee rate is calculated based on the combined net assets of certain mutual funds sponsored by Price Associates (the group) applied to a graduated fee schedule, with rates ranging from 0.48% for the first $1 billion of assets to 0.275% for assets in excess of $400 billion. The fund’s group fee is determined by applying the group fee rate to the fund’s average daily net assets. At December 31, 2014, the effective annual group fee rate was 0.29%.
In addition, the fund has entered into service agreements with Price Associates and two wholly owned subsidiaries of Price Associates (collectively, Price). Price Associates computes the daily share price and provides certain other administrative services to the fund. T. Rowe Price Services, Inc., provides shareholder and administrative services in its capacity as the fund’s transfer and dividend-disbursing agent. T. Rowe Price Retirement Plan Services, Inc., provides subaccounting and recordkeeping services for certain retirement accounts invested in the fund. For the year ended December 31, 2014, expenses incurred pursuant to these service agreements were $185,000 for Price Associates; $77,000 for T. Rowe Price Services, Inc.; and $2,000 for T. Rowe Price Retirement Plan Services, Inc. The total amount payable at period-end pursuant to these service agreements is reflected as Due to Affiliates in the accompanying financial statements.
Additionally, the fund is one of several mutual funds in which certain college savings plans managed by Price Associates may invest. As approved by the fund’s Board of Directors, shareholder servicing costs associated with each college savings plan are borne by the fund in proportion to the average daily value of its shares owned by the college savings plan. For the year ended December 31, 2014, the fund was charged $360,000 for shareholder servicing costs related to the college savings plans, of which $273,000 was for services provided by Price. The amount payable at period-end pursuant to this agreement is reflected as Due to Affiliates in the accompanying financial statements. At December 31, 2014, approximately 5% of the outstanding shares of the fund were held by college savings plans.
The fund is also one of several mutual funds sponsored by Price Associates (underlying Price funds) in which the T. Rowe Price Spectrum Funds (Spectrum Funds), as well as the T. Rowe Price Retirement Funds and T. Rowe Price Target Retirement Funds (Retirement Funds) may invest. Neither the Spectrum Funds nor the Retirement Funds invest in the underlying Price funds for the purpose of exercising management or control. Pursuant to separate special servicing agreements, expenses associated with the operation of the Spectrum Funds and Retirement Funds are borne by each underlying Price fund to the extent of estimated savings to it and in proportion to the average daily value of its shares owned by the Spectrum Funds and Retirement Funds, respectively. Expenses allocated under these agreements are reflected as shareholder servicing expenses in the accompanying financial statements. For the year ended December 31, 2014, the fund was allocated $180,000 of Spectrum Funds’ expenses and $6,412,000 of Retirement Funds’ expenses. Of these amounts, $2,945,000 related to services provided by Price. At period-end, the amount payable to Price pursuant to this agreement is reflected as Due to Affiliates in the accompanying financial statements. At December 31, 2014, approximately 4% of the outstanding shares of the fund were held by the Spectrum Funds and 84% were held by the Retirement Funds.
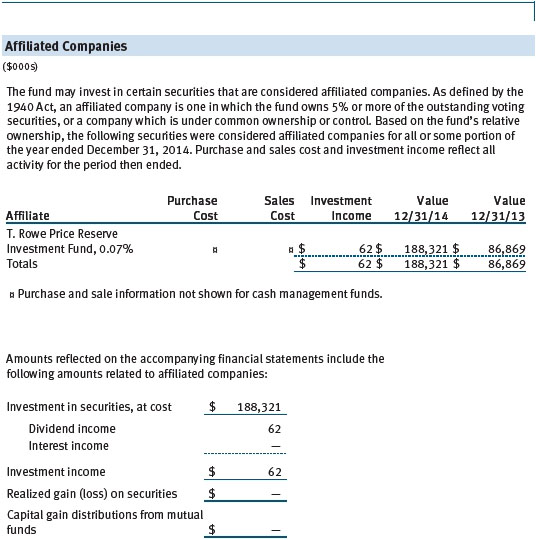
The fund may invest in the T. Rowe Price Reserve Investment Fund, the T. Rowe Price Government Reserve Investment Fund, or the T. Rowe Price Short-Term Reserve Fund (collectively, the Price Reserve Investment Funds), open-end management investment companies managed by Price Associates and considered affiliates of the fund. The Price Reserve Investment Funds are offered as short-term investment options to mutual funds, trusts, and other accounts managed by Price Associates or its affiliates and are not available for direct purchase by members of the public. The Price Reserve Investment Funds pay no investment management fees.
Mutual funds and other accounts managed by T. Rowe Price and its affiliates (collectively, T. Rowe Price funds) may invest in the fund; however, no T. Rowe Price fund may invest for the purpose of exercising management or control over the fund. At December 31, 2014, approximately 5% of the fund’s outstanding shares were held by T. Rowe Price funds.
As of December 31, 2014, T. Rowe Price Group, Inc., or its wholly owned subsidiaries owned 472,301 shares of the fund, representing less than 1% of the fund’s net assets.
| Report of Independent Registered Public Accounting Firm |
To the Board of Directors and Shareholders of
T. Rowe Price Real Assets Fund, Inc.
In our opinion, the accompanying statement of assets and liabilities, including the portfolio of investments, and the related statements of operations and of changes in net assets and the financial highlights present fairly, in all material respects, the financial position of T. Rowe Price Real Assets Fund, Inc. (the “Fund”) at December 31, 2014, the results of its operations, the changes in its net assets and the financial highlights for each of the periods indicated therein, in conformity with accounting principles generally accepted in the United States of America. These financial statements and financial highlights (hereafter referred to as “financial statements”) are the responsibility of the Fund’s management. Our responsibility is to express an opinion on these financial statements based on our audits. We conducted our audits of these financial statements in accordance with the standards of the Public Company Accounting Oversight Board (United States). Those standards require that we plan and perform the audit to obtain reasonable assurance about whether the financial statements are free of material misstatement. An audit includes examining, on a test basis, evidence supporting the amounts and disclosures in the financial statements, assessing the accounting principles used and significant estimates made by management, and evaluating the overall financial statement presentation. We believe that our audits, which included confirmation of securities at December 31, 2014 by correspondence with the custodian and brokers, and confirmation of the underlying fund by correspondence with the transfer agent, provide a reasonable basis for our opinion.
PricewaterhouseCoopers LLP
Baltimore, Maryland
February 19, 2015
| Tax Information (Unaudited) for the Tax Year Ended 12/31/14 |
We are providing this information as required by the Internal Revenue Code and Section 19 of the Investment Company Act of 1940. The amounts shown reflect the tax character of those distributions that are required to be disclosed, and may differ from those elsewhere in this report because of differences between tax and financial reporting requirements.
The fund’s distributions to shareholders included:
| ● | $8,305,000 from short-term capital gains, |
| |
| ● | $2,962,000 in excess of fund taxable income that is not a return of capital for tax purposes. |
For taxable non-corporate shareholders, $50,126,000 of the fund’s income represents qualified dividend income subject to a long-term capital gains tax rate of not greater than 20%.
For corporate shareholders, $16,288,000 of the fund’s income qualifies for the dividends-received deduction.
| Information on Proxy Voting Policies, Procedures, and Records |
A description of the policies and procedures used by T. Rowe Price funds and portfolios to determine how to vote proxies relating to portfolio securities is available in each fund’s Statement of Additional Information. You may request this document by calling 1-800-225-5132 or by accessing the SEC’s website, sec.gov.
The description of our proxy voting policies and procedures is also available on our website, troweprice.com. To access it, click on the words “Social Responsibility” at the top of our corporate homepage. Next, click on the words “Conducting Business Responsibly” on the left side of the page that appears. Finally, click on the words “Proxy Voting Policies” on the left side of the page that appears.
Each fund’s most recent annual proxy voting record is available on our website and through the SEC’s website. To access it through our website, follow the above directions to reach the “Conducting Business Responsibly” page. Click on the words “Proxy Voting Records” on the left side of that page, and then click on the “View Proxy Voting Records” link at the bottom of the page that appears.
| How to Obtain Quarterly Portfolio Holdings |
The fund files a complete schedule of portfolio holdings with the Securities and Exchange Commission for the first and third quarters of each fiscal year on Form N-Q. The fund’s Form N-Q is available electronically on the SEC’s website (sec.gov); hard copies may be reviewed and copied at the SEC’s Public Reference Room, 100 F St. N.E., Washington, DC 20549. For more information on the Public Reference Room, call 1-800-SEC-0330.
| About the Fund’s Directors and Officers |
Your fund is overseen by a Board of Directors (Board) that meets regularly to review a wide variety of matters affecting or potentially affecting the fund, including performance, investment programs, compliance matters, advisory fees and expenses, service providers, and business and regulatory affairs. The Board elects the fund’s officers, who are listed in the final table. At least 75% of the Board’s members are independent of T. Rowe Price Associates, Inc. (T. Rowe Price), and its affiliates; “inside” or “interested” directors are employees or officers of T. Rowe Price. The business address of each director and officer is 100 East Pratt Street, Baltimore, Maryland 21202. The Statement of Additional Information includes additional information about the fund directors and is available without charge by calling a T. Rowe Price representative at 1-800-638-5660.
| Independent Directors |
| |
| Name | | |
| (Year of Birth) | | |
| Year Elected* | | |
| [Number of T. Rowe Price | | Principal Occupation(s) and Directorships of Public Companies and |
| Portfolios Overseen] | | Other Investment Companies During the Past Five Years |
| | | |
| William R. Brody, M.D., Ph.D. | | President and Trustee, Salk Institute for Biological Studies (2009 to |
| (1944) | | present); Director, BioMed Realty Trust (2013 to present); Director, |
| 2010 | | Novartis, Inc. (2009 to present); Director, IBM (2007 to present) |
| [165] | | |
| | | |
| Anthony W. Deering | | Chairman, Exeter Capital, LLC, a private investment firm (2004 to |
| (1945) | | present); Director, Brixmor Real Estate Investment Trust (2012 to |
| 2010 | | present); Director and Member of the Advisory Board, Deutsche |
| [165] | | Bank North America (2004 to present); Director, Under Armour |
| | | (2008 to present); Director, Vornado Real Estate Investment Trust |
| | (2004 to 2012) |
| | | |
| Donald W. Dick, Jr. | | Principal, EuroCapital Partners, LLC, an acquisition and management |
| (1943) | | advisory firm (1995 to present) |
| 2010 | | |
| [165] | | |
| | | |
| Bruce W. Duncan | | President, Chief Executive Officer, and Director, First Industrial |
| (1951) | | Realty Trust, an owner and operator of industrial properties (2009 |
| 2013 | | to present); Chairman of the Board (2005 to present), Interim Chief |
| [165] | | Executive Officer (2007), and Director, Starwood Hotels & Resorts, a |
| | hotel and leisure company (1999 to present) |
| | | |
| Robert J. Gerrard, Jr. | | Advisory Board Member, Pipeline Crisis/Winning Strategies, a |
| (1952) | | collaborative working to improve opportunities for young African |
| 2012 | | Americans (1997 to present); Chairman of Compensation Committee |
| [165] | | and Director, Syniverse Holdings, Inc., a provider of wireless voice |
| | and data services for telecommunications companies (2008 to 2011) |
| | | |
| Karen N. Horn | | Limited Partner and Senior Managing Director, Brock Capital Group, |
| (1943) | | an advisory and investment banking firm (2004 to present); Director, |
| 2010 | | Eli Lilly and Company (1987 to present); Director, Simon Property |
| [165] | | Group (2004 to present); Director, Norfolk Southern (2008 to present) |
| | | |
| Paul F. McBride | | Former Company Officer and Senior Vice President, Human |
| (1956) | | Resources and Corporate Initiatives, Black & Decker Corporation |
| 2013 | | (2004 to 2010) |
| [165] | | |
| | | |
| Cecilia E. Rouse, Ph.D. | | Dean, Woodrow Wilson School (2012 to present); Professor and |
| (1963) | | Researcher, Princeton University (1992 to present); Director, MDRC, |
| 2012 | | a nonprofit education and social policy research organization |
| [165] | | (2011 to present); Member, National Academy of Education (2010 |
| | to present); Research Associate, National Bureau of Economic |
| | Research’s Labor Studies Program (2011 to present); Member, |
| | President’s Council of Economic Advisors (2009 to 2011); Chair |
| | of Committee on the Status of Minority Groups in the Economic |
| | Profession, American Economic Association (2012 to present) |
| | | |
| John G. Schreiber | | Owner/President, Centaur Capital Partners, Inc., a real estate |
| (1946) | | investment company (1991 to present); Cofounder and Partner, |
| 2010 | | Blackstone Real Estate Advisors, L.P. (1992 to present); Director, |
| [165] | | General Growth Properties, Inc. (2010 to 2013); Director, BXMT |
| | (formerly Capital Trust, Inc.), a real estate investment company |
| | (2012 to present); Director and Chairman of the Board, Brixmor |
| | Property Group, Inc. (2013 to present); Director, Hilton Worldwide |
| | (2013 to present) |
| | | |
| Mark R. Tercek | | President and Chief Executive Officer, The Nature Conservancy (2008 |
| (1957) | | to present); Managing Director, The Goldman Sachs Group, Inc. |
| 2010 | | (1984 to 2008) |
| [165] | | |
| |
| *Each independent director serves until retirement, resignation, or election of a successor. |
| Inside Directors | | |
| |
| Name | | |
| (Year of Birth) | | |
| Year Elected* | | |
| [Number of T. Rowe Price | | Principal Occupation(s) and Directorships of Public Companies and |
| Portfolios Overseen] | | Other Investment Companies During the Past Five Years |
| | | |
| Edward C. Bernard | | Director and Vice President, T. Rowe Price; Vice Chairman of the |
| (1956) | | Board, Director, and Vice President, T. Rowe Price Group, Inc.; |
| 2010 | | Chairman of the Board, Director, and President, T. Rowe Price |
| [165] | | Investment Services, Inc.; Chairman of the Board and Director, |
| | T. Rowe Price Retirement Plan Services, Inc., and T. Rowe Price |
| | Services, Inc.; Chairman of the Board, Chief Executive Officer, |
| | and Director, T. Rowe Price International; Chairman of the Board, |
| | Chief Executive Officer, Director, and President, T. Rowe Price Trust |
| | Company; Chairman of the Board, all funds |
| | | |
| Brian C. Rogers, CFA, CIC | | Chief Investment Officer, Director, and Vice President, T. Rowe Price; |
| (1955) | | Chairman of the Board, Chief Investment Officer, Director, and Vice |
| 2010 | | President, T. Rowe Price Group, Inc.; Vice President, T. Rowe Price |
| [111] | | Trust Company |
| |
| *Each inside director serves until retirement, resignation, or election of a successor. |
| Officers |
| |
| Name (Year of Birth) | | |
| Position Held With Real Assets Fund | | Principal Occupation(s)
|
| E. Frederick Bair, CFA, CPA (1969) | | Vice President, T. Rowe Price, T. Rowe Price |
Vice President
| | Group, Inc., and T. Rowe Price Trust Company |
| Darrell N. Braman (1963) | | Vice President, Price Hong Kong, Price |
| Vice President | | Singapore, T. Rowe Price, T. Rowe Price Group, |
| | Inc., T. Rowe Price International, T. Rowe Price |
| | Investment Services, Inc., and T. Rowe Price |
| | Services, Inc.
|
| Richard de los Reyes (1975) | | Vice President, T. Rowe Price, T. Rowe Price |
| Vice President | | Group, Inc., and T. Rowe Price Trust Company
|
| Shawn T. Driscoll (1975) | | Vice President, T. Rowe Price, T. Rowe Price |
| Vice President | | Group, Inc., and T. Rowe Price Trust Company
|
| Roger L. Fiery III, CPA (1959) | | Vice President, Price Hong Kong, Price |
| Vice President | | Singapore, T. Rowe Price, T. Rowe Price Group, |
| | Inc., T. Rowe Price International, and T. Rowe |
| | Price Trust Company
|
| John R. Gilner (1961) | | Chief Compliance Officer and Vice President, |
| Chief Compliance Officer | | T. Rowe Price; Vice President, T. Rowe Price |
| | Group, Inc., and T. Rowe Price Investment |
| | Services, Inc.
|
| Gregory S. Golczewski (1966) | | Vice President, T. Rowe Price and T. Rowe Price |
| Vice President | | Trust Company
|
| Gregory K. Hinkle, CPA (1958) | | Vice President, T. Rowe Price, T. Rowe Price |
| Treasurer | | Group, Inc., and T. Rowe Price Trust Company
|
| Stefan Hubrich, Ph.D., CFA (1974) | | Vice President, T. Rowe Price and T. Rowe Price |
| Vice President | | Group, Inc.
|
| David M. Lee, CFA (1962) | | Vice President, T. Rowe Price, T. Rowe Price |
| Vice President | | Group, Inc., and T. Rowe Price Trust Company
|
| Wyatt A. Lee, CFA (1971) | | Vice President, T. Rowe Price, T. Rowe Price |
| President | | Group, Inc., and T. Rowe Price Trust Company
|
| Patricia B. Lippert (1953) | | Assistant Vice President, T. Rowe Price and |
| Secretary | | T. Rowe Price Investment Services, Inc.
|
| David Oestreicher (1967) | | Director, Vice President, and Secretary, T. Rowe |
| Vice President | | Price Investment Services, Inc., T. Rowe Price |
| | Retirement Plan Services, Inc., T. Rowe Price |
| | Services, Inc., and T. Rowe Price Trust Company; |
| | Chief Legal Officer, Vice President, and |
| | Secretary, T. Rowe Price Group, Inc.; Vice |
| | President and Secretary, T. Rowe Price and |
| | T. Rowe Price International; Vice President, |
| | Price Hong Kong and Price Singapore
|
| Timothy E. Parker, CFA (1974) | | Vice President, T. Rowe Price and T. Rowe Price |
| Vice President | | Group, Inc.
|
| Deborah D. Seidel (1962) | | Vice President, T. Rowe Price, T. Rowe Price |
| Vice President | | Group, Inc., T. Rowe Price Investment Services, |
| | Inc., and T. Rowe Price Services, Inc.
|
| Daniel O. Shackelford, CFA (1958) | | Vice President, T. Rowe Price, T. Rowe Price |
| Vice President | | Group, Inc., and T. Rowe Price Trust Company
|
| Charles M. Shriver, CFA (1967) | | Vice President, T. Rowe Price, T. Rowe Price |
| Vice President | | Group, Inc., and T. Rowe Price Trust Company
|
| Julie L. Waples (1970) | | Vice President, T. Rowe Price |
Vice President
| | |
| Richard T. Whitney, CFA (1958) | | Vice President, T. Rowe Price, T. Rowe Price |
| Vice President | | Group, Inc., T. Rowe Price International, and |
| | T. Rowe Price Trust Company |
| |
| Unless otherwise noted, officers have been employees of T. Rowe Price or T. Rowe Price International for at least 5 years. |
Item 2. Code of Ethics.
The registrant has adopted a code of ethics, as defined in Item 2 of Form N-CSR, applicable to its principal executive officer, principal financial officer, principal accounting officer or controller, or persons performing similar functions. A copy of this code of ethics is filed as an exhibit to this Form N-CSR. No substantive amendments were approved or waivers were granted to this code of ethics during the period covered by this report.
Item 3. Audit Committee Financial Expert.
The registrant’s Board of Directors/Trustees has determined that Mr. Anthony W. Deering qualifies as an audit committee financial expert, as defined in Item 3 of Form N-CSR. Mr. Deering is considered independent for purposes of Item 3 of Form N-CSR.
Item 4. Principal Accountant Fees and Services.
(a) – (d) Aggregate fees billed for the last two fiscal years for professional services rendered to, or on behalf of, the registrant by the registrant’s principal accountant were as follows:
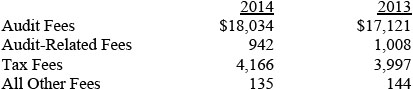
Audit fees include amounts related to the audit of the registrant’s annual financial statements and services normally provided by the accountant in connection with statutory and regulatory filings. Audit-related fees include amounts reasonably related to the performance of the audit of the registrant’s financial statements and specifically include the issuance of a report on internal controls and, if applicable, agreed-upon procedures related to fund acquisitions. Tax fees include amounts related to services for tax compliance, tax planning, and tax advice. The nature of these services specifically includes the review of distribution calculations and the preparation of Federal, state, and excise tax returns. All other fees include the registrant’s pro-rata share of amounts for agreed-upon procedures in conjunction with service contract approvals by the registrant’s Board of Directors/Trustees.
(e)(1) The registrant’s audit committee has adopted a policy whereby audit and non-audit services performed by the registrant’s principal accountant for the registrant, its investment adviser, and any entity controlling, controlled by, or under common control with the investment adviser that provides ongoing services to the registrant require pre-approval in advance at regularly scheduled audit committee meetings. If such a service is required between regularly scheduled audit committee meetings, pre-approval may be authorized by one audit committee member with ratification at the next scheduled audit committee meeting. Waiver of pre-approval for audit or non-audit services requiring fees of a de minimis amount is not permitted.
(2) No services included in (b) – (d) above were approved pursuant to paragraph (c)(7)(i)(C) of Rule 2-01 of Regulation S-X.
(f) Less than 50 percent of the hours expended on the principal accountant’s engagement to audit the registrant’s financial statements for the most recent fiscal year were attributed to work performed by persons other than the principal accountant’s full-time, permanent employees.
(g) The aggregate fees billed for the most recent fiscal year and the preceding fiscal year by the registrant’s principal accountant for non-audit services rendered to the registrant, its investment adviser, and any entity controlling, controlled by, or under common control with the investment adviser that provides ongoing services to the registrant were $2,283,000 and $1,691,000, respectively.
(h) All non-audit services rendered in (g) above were pre-approved by the registrant’s audit committee. Accordingly, these services were considered by the registrant’s audit committee in maintaining the principal accountant’s independence.
Item 5. Audit Committee of Listed Registrants.
Not applicable.
Item 6. Investments.
(a) Not applicable. The complete schedule of investments is included in Item 1 of this Form N-CSR.
(b) Not applicable.
Item 7. Disclosure of Proxy Voting Policies and Procedures for Closed-End Management Investment Companies.
Not applicable.
Item 8. Portfolio Managers of Closed-End Management Investment Companies.
Not applicable.
Item 9. Purchases of Equity Securities by Closed-End Management Investment Company and Affiliated Purchasers.
Not applicable.
Item 10. Submission of Matters to a Vote of Security Holders.
Not applicable.
Item 11. Controls and Procedures.
(a) The registrant’s principal executive officer and principal financial officer have evaluated the registrant’s disclosure controls and procedures within 90 days of this filing and have concluded that the registrant’s disclosure controls and procedures were effective, as of that date, in ensuring that information required to be disclosed by the registrant in this Form N-CSR was recorded, processed, summarized, and reported timely.
(b) The registrant’s principal executive officer and principal financial officer are aware of no change in the registrant’s internal control over financial reporting that occurred during the registrant’s second fiscal quarter covered by this report that has materially affected, or is reasonably likely to materially affect, the registrant’s internal control over financial reporting.
Item 12. Exhibits.
(a)(1) The registrant’s code of ethics pursuant to Item 2 of Form N-CSR is attached.
(2) Separate certifications by the registrant's principal executive officer and principal financial officer, pursuant to Section 302 of the Sarbanes-Oxley Act of 2002 and required by Rule 30a-2(a) under the Investment Company Act of 1940, are attached.
(3) Written solicitation to repurchase securities issued by closed-end companies: not applicable.
(b) A certification by the registrant's principal executive officer and principal financial officer, pursuant to Section 906 of the Sarbanes-Oxley Act of 2002 and required by Rule 30a-2(b) under the Investment Company Act of 1940, is attached.
SIGNATURES
Pursuant to the requirements of the Securities Exchange Act of 1934 and the Investment Company Act of 1940, the registrant has duly caused this report to be signed on its behalf by the undersigned, thereunto duly authorized.
T. Rowe Price Real Assets Fund, Inc.
| By | /s/ Edward C. Bernard |
| | Edward C. Bernard |
| | Principal Executive Officer |
| | |
| Date February 19, 2015 | |
Pursuant to the requirements of the Securities Exchange Act of 1934 and the Investment Company Act of 1940, this report has been signed below by the following persons on behalf of the registrant and in the capacities and on the dates indicated.
| By | /s/ Edward C. Bernard |
| | Edward C. Bernard |
| | Principal Executive Officer |
| | |
| Date February 19, 2015 | | |
| |
| |
| By | /s/ Gregory K. Hinkle |
| | Gregory K. Hinkle |
| | Principal Financial Officer |
| | |
| Date February 19, 2015 | | |