UNITED STATES
SECURITIES AND EXCHANGE COMMISSION
Washington, D.C. 20549
FORM N-CSR
CERTIFIED SHAREHOLDER REPORT OF REGISTERED
MANAGEMENT INVESTMENT COMPANIES
Investment Company Act File Number: 811-22410
| T. Rowe Price Real Assets Fund, Inc. |
|
| (Exact name of registrant as specified in charter) |
| |
| 100 East Pratt Street, Baltimore, MD 21202 |
|
| (Address of principal executive offices) |
| |
| David Oestreicher |
| 100 East Pratt Street, Baltimore, MD 21202 |
|
| (Name and address of agent for service) |
Registrant’s telephone number, including area code: (410) 345-2000
Date of fiscal year end: December 31
Date of reporting period: December 31, 2018
Item 1. Report to Shareholders
| Real Assets Fund | December 31, 2018 |
Beginning on January 1, 2021, as permitted by SEC regulations, paper copies of the T. Rowe Price funds’ annual and semiannual shareholder reports will no longer be mailed, unless you specifically request them. Instead, shareholder reports will be made available on the funds’ website (troweprice.com/prospectus), and you will be notified by mail with a website link to access the reports each time a report is posted to the site.
If you already elected to receive reports electronically, you will not be affected by this change and need not take any action. At any time, shareholders who invest directly in T. Rowe Price funds may generally elect to receive reports or other communications electronically by enrolling attroweprice.com/paperlessor, if you are a retirement plan sponsor or invest in the funds through a financial intermediary (such as an investment advisor, broker-dealer, insurance company, or bank), by contacting your representative or your financial intermediary.
You may elect to continue receiving paper copies of future shareholder reports free of charge. To do so, if you invest directly with T. Rowe Price, please call T. Rowe Price as follows: IRA, nonretirement account holders, and institutional investors,1-800-225-5132; small business retirement accounts,1-800-492-7670. If you are a retirement plan sponsor or invest in the T. Rowe Price funds through a financial intermediary, please contact your representative or financial intermediary or follow additional instructions if included with this document. Your election to receive paper copies of reports will apply to all funds held in your account with your financial intermediary or, if you invest directly in the T. Rowe Price funds, with T. Rowe Price. Your election can be changed at any time in the future.
| T. ROWE PRICE REAL ASSETS FUND |
|
HIGHLIGHTS
| ■ | The Real Assets Fund declined in the 12-month period ended December 31, 2018, and trailed its benchmarks for the period. |
| ■ | Security selection within U.S. and global real estate securities, as well as metals and mining stocks, detracted for the period. However, stock selection among natural resources and precious metals companies added value. Tactical overweight and underweight decisions relative to the benchmark also contributed to performance. |
| ■ | We are moving to a neutral allocation between the underlying components as opportunities appear more balanced. Going forward, we will continue to adjust allocations tactically to reflect a top-down view of the real assets sector, with a focus on how inflation affects the various securities in the portfolio. |
| ■ | In our view, the current state of the U.S. economy is unlikely to spur significant inflation, and several other countries face moderating growth. We are beginning to see glimmers of possible support for a more durable move higher in inflation over the long term, but equities in the Real Assets Fund face near-term headwinds from structural challenges and weak global demand. |

Log in to your account attroweprice.comfor more information.
*Certain mutual fund accounts that are assessed an annual account service fee can also save money by switching to e-delivery.
CIO Market Commentary
Dear Shareholder
The year 2018 was not one that investors will remember fondly. The major stock indexes recorded their worst declines in a decade, with most falling over 20% from recent peaks and bringing a technical end to the bull market that began in 2009. In direct contrast to 2017, financial assets performed poorly across asset classes and geographies. The broadest measure of domestic bond returns, the Bloomberg Barclays U.S. Aggregate Bond Index, returned exactly nothing (0.0%) for the year, and nearly all overseas bond and equity markets also performed poorly. “Cash was king,” in Wall Street parlance, which never makes for a happy reign.
Many issues were behind the market weakness, but we can point to four primary factors that weighed on sentiment:
Rising interest rates.Wage pressures appeared to be accelerating early in the year, sending longer-term bond yields to multiyear highs and sparking a sell-off in equities in early February. Wage gains soon moderated, but a continued decline in the unemployment rate—which reached a five-decade low of 3.7% in September—kept investors on the lookout for higher inflation ahead. In October, yields returned to their peaks on the back of good economic data and suggestions from Federal Reserve officials that they might keep hiking interest rates more quickly than expected. This was subsequently followed by a decline in long-term rates as investors sought safety late in the year and questioned the pace of future interest rate hikes.
Trade tensions.On March 1, President Donald Trump took markets by surprise in announcing a new series of metal tariffs. His administration quickly adopted a decidedly protectionist stance, with pro-trade advocates leaving and the announcement of plans for a range of new trade restrictions. Many threats never materialized, and the White House announced a renegotiated trade deal with Canada and Mexico. Trade tensions with China only appeared to deepen as the year progressed, however.
Slowing global growth. A global slowdown became apparent in the second half of 2018. Environmental and financial reforms put the brakes on the Chinese economy, as planned, but trade frictions caused growth to slow below official targets. Other emerging markets suffered from a stronger U.S. dollar and higher U.S. interest rates. In Europe, trade worries also hampered business spending, while unresolved Brexit fears and further threats to the eurozone from Italy and elsewhere also took a toll. Plummeting oil prices late in the year seemed to confirm a general weakening in global economic conditions.
Peaking fundamentals.The U.S. economy stood apart by accelerating in 2018, but a moderation in 2019 appears all but inevitable as the effects of fiscal stimulus moderate. Of specific concern to investors is the almost certain slowdown in corporate profits in the coming year. Overall profits for the S&P 500 grew by 25% versus the year before in the first three quarters of 2018—a pace sure to slow as the year-over-year impact of the tax cut fades, wage gains pressure margins, and the global economy cools.
The market’s dramatic pullback in the final weeks of 2018—stocks suffered their worst December since the Great Depression—seemed to reflect fears that a recession might even be imminent. I think such concerns are overblown. The Fed has already completed most of its planned rate hikes, promising less of a headwind for the economy and markets. China and Europe are likely to respond to slowing growth with stimulus, and both will benefit from lower oil prices. As I write, some encouraging signs have also emerged on the trade front, although whether the U.S. and China can resolve their differences remains perhaps the largest uncertainty facing markets.
In terms of stock performance, the painful end to 2018 served to improve valuations, making gains in the coming year less of a hurdle. I would also note that a further stock market “bust” in 2019 seems unlikely given that we never experienced the concentrated “boom” that has preceded past bad bear markets. In the final stages of the dot-com boom of the late 1990s, for example, investors flooded in to telecom shares, and huge amounts of capital and risk flowed in to housing in the mid-2000s. Currently, I simply do not see those sorts of distortions in the financial system.
Of course, opinions about what 2019 holds vary among our investment professionals at T. Rowe Price, and we sharpen each other’s thinking by constantly sharing opinions and insights. Please rest assured that your fund’s manager is drawing on the insights and perspectives across our global organization as he or she charts the course ahead.
Thank you for your continued confidence in T. Rowe Price.
Sincerely,

Robert Sharps
Group Chief Investment Officer
Management’s Discussion of Fund Performance
INVESTMENT OBJECTIVE
The fund seeks to provide long-term growth of capital.
FUND COMMENTARY
How did the fund perform in the past 12 months?
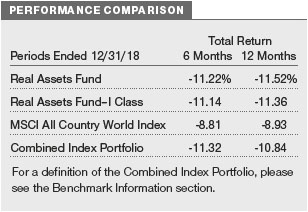
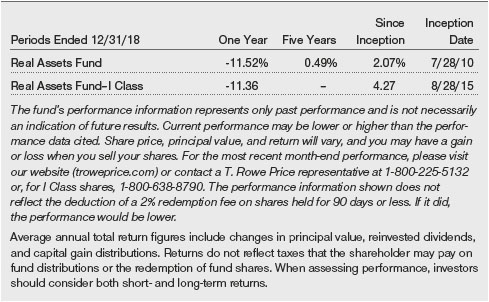
The Real Assets Fund returned -11.52% for the 12-month period ended December 31, 2018. The fund trailed the broader global equities market, represented by the MSCI All Country World Index, and its combined index portfolio, which is a custom benchmark composed of multiple indexes that represent the asset classes in which the fund invests. (Returns for I Class sharesvaried slightly, reflecting their different fee structure.Past performance cannot guarantee future results.)
What factors influenced the fund’s performance?
Global equity markets declined and were volatile throughout 2018, as trade tensions, slowing growth, and political uncertainty weighed on various markets.The underlying sub-asset classes in the Real Assets Fund all generated negative returns for the year, with natural resources, metals and mining, and precious metals stocks posting double-digit losses.
Security selection in U.S. and global real estate stocks detracted the most from relative performance. Real estate stocks initially posted modest gains in the first half of 2018, but the gains were largely offset by losses in the second half of the year. An underweight allocation to health care real estate investment trusts (REITs) hurt relative results. Health care REITs performed well in a down market, as investors gravitated to their perceived defensive attributes during a bout of volatility late in the year; consequently, our underweight position proved unfavorable.
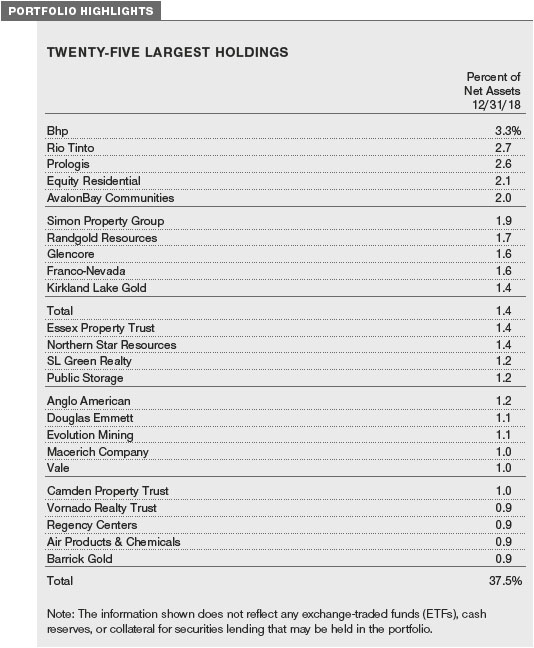
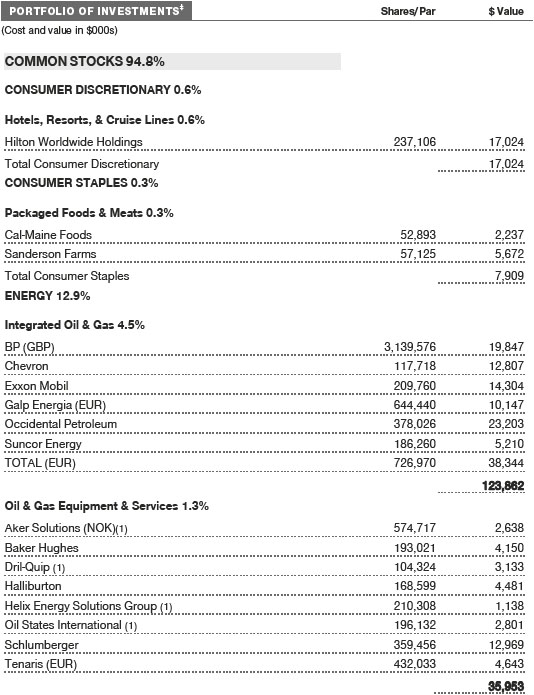
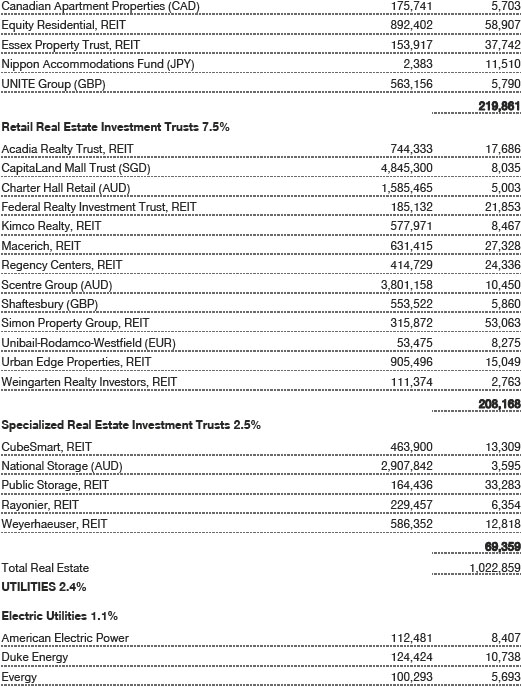
Our mall and shopping center landlords underperformed the broader real estate market as a growing threat from e-commerce and store closures weighed on the retail segment. Despite owning highly productive regional malls andposting solid quarterly results,Macerich CompanyandGeneral Growth Properties(GGP) declined during the period. The market did not react well to the disappointing news that mall operator GGP agreed to a merger at a price below our long-term estimation of its value. Additionally, our shares in Macerich lagged, in part because it, too, has been viewed as a mall acquisition candidate, so expectationswere lowered after the GGP deal. While real estate stocks declined overall for the reporting period, they outpaced broader global equities, and our tactical overweight allocation to the asset class for most of the year contributed to the fund’s performance. (Please refer to the portfolio of investments for a complete list of holdings and the amount each represents in the portfolio.)
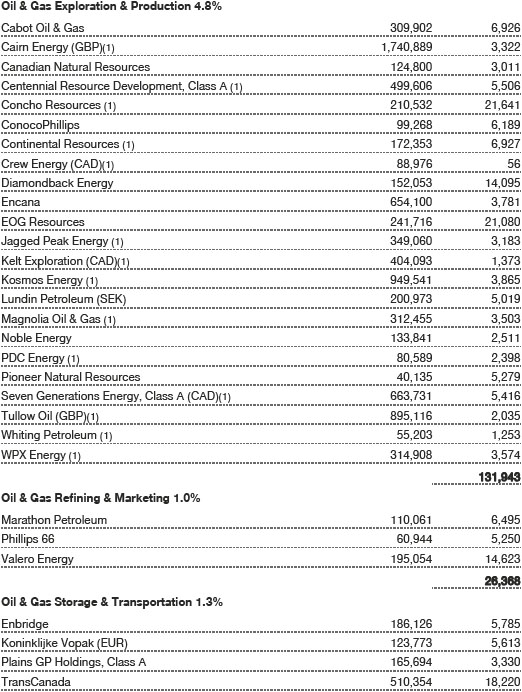
Security selection within our natural resources stocks added value. During the year, slowing Chinese economic growth weighed on commodity prices, and crude oil prices rose to four-year highs in October before plunging into bear marketterritory amid global oversupply fears. In this environment, we benefited from an underweight to the U.S. oil exploration and production industry. We are being extremely selective and are focused on owning high-quality companies, which helped us to avoid several names that lost nearly half of their value in 2018.
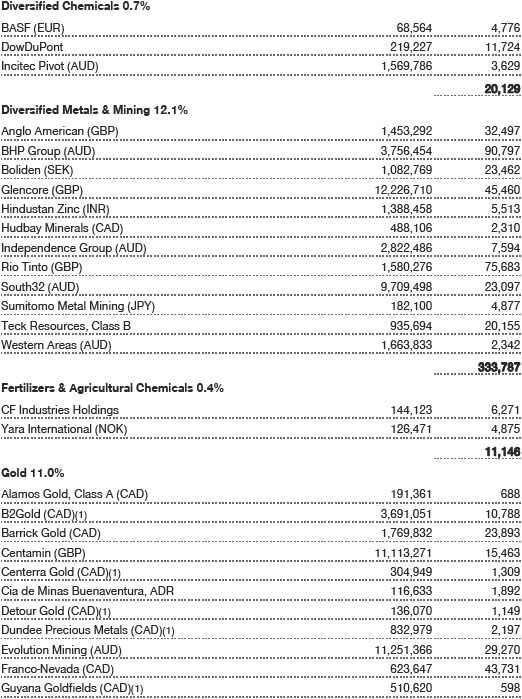
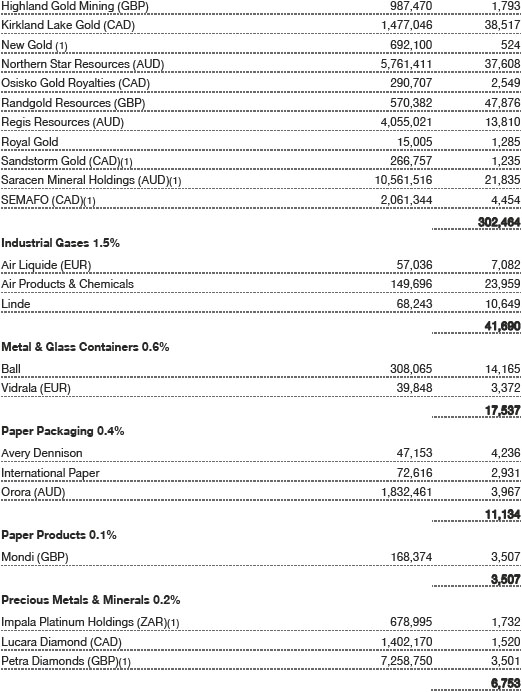
Positive stock selection within precious metals also helped results. Holding high-quality gold miners drove relative performance within the industry, with our top positions meaningfully outperforming the broader space led byKirkland Lake Gold,Saracen Mineral Holdings, andNorthern Star Resources. We focus on smaller miners that should be able to generate stable returns on invested capital while expanding production and replenishing their resource base.
How is the fund positioned?
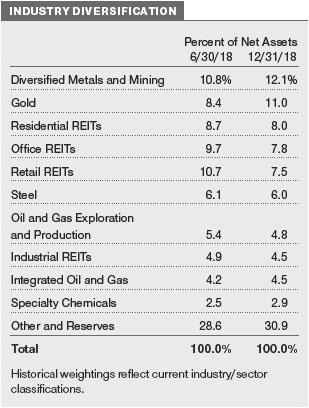
Equities in the Real Assets Fund face headwinds, given weak global demand and structural challenges. For most of the year, we maintained an underweight allocation to natural resources equities—including metals and mining stocks—and were overweight U.S. and global real estate stocks. In December, we started to reallocate the fund, targeting a neutral allocation between the underlying components as opportunities appear more balanced.
Real estate assets are caught in a late-cycle bind: If the economy continues to improve, the Federal Reserve (Fed) will likely raise interest rates further, pressuring this interest rate-sensitive asset class. However, if monetary policy goes on an extended pause, it would likely be because growth is weak, which could hurt the underlying rental yields. As a result, most near-term outcomes are not favorable for the asset class.
Meanwhile, global commodities remain in the midst of a secular downcycle, driven by a long-term global supply/demand imbalance. Growth is fading structurally in China, pressuring industrial metals; at the same time, the torrid pace of productivity improvements—thanks to the U.S. shale revolution—has driven down energy extraction costs and boosted supply, hurting pricing power in the industry.
In this challenging environment, the fund’s underlying components focus on owning high-quality companies that operate at the lower end of the cost curve and are capable of generating cash flow growth and profits when prices are under pressure. Going forward, our fund positioning will include a top-down view of the real assets sector, with a focus on how inflation affects the various securities in the portfolio.
What is portfolio management’s outlook?
In our view, the current state of the U.S. economy is unlikely to spur significant inflation. The U.S. labor force is recovering, after taking a substantial hit during the Great Recession of 2008–2009, but it appears to have achieved full employment without real pressure on wages. Economic activity continues to be modest, and normal business cycle dynamics are proving elusive, as witnessed by a dormant housing market and below-normal wage growth. At the same time, the full impact of Fed tightening has yet to be felt, as monetary policy operates with long and variable lags; meanwhile, the fiscal stimulus from the late-2017 tax cuts is waning, and threats loom as the federal government shutdown and policy uncertainty over tariffs weigh on business and consumer sentiment.
Globally, many countries also face headwinds to growth. Chinese economic growth has decelerated sharply, thanks in part to a deleveraging campaign; the eurozone economies are facing a difficult export environment (especially to China) and ongoing uncertainties from Italian and British politics; and the Japanese economy remains stuck in a low inflation environment.
As we outlined in the positioning section, most near-term outcomes are not favorable for the real assets sector. Over the longer-term, however, we are beginning to see glimmers of possible support for a more durable move higher in inflation. First, most investors have become structurally bearish on inflation, limiting the scope of downside surprises. Second, thanks to years of low investment rates, global capacity is both aging and facing supply constraints—particularly as firms unwind supply chains exposed to political risks and tariffs on Chinese exports. Third, the global labor force is aging rapidly, and unemployment rates are falling to very low levels. This suggests that forces are in play for a rebound in pricing power during the recovery from the next recession. We believe that should the rate of inflation move higher, the Real Assets Fund’s diversification benefits may help to provide a buffer, especially since a higher inflation rate has historically been a headwind for more traditional stock and bond portfolios.
The views expressed reflect the opinions of T. Rowe Price as of the date of this report and are subject to change based on changes in market, economic, or other conditions. These views are not intended to be a forecast of future events and are no guarantee of future results.
RISKS OF STOCK INVESTING
The fund’s share price can fall because of weakness in the stock markets, a particular industry, or specific holdings. Stock markets can decline for many reasons, including adverse political or economic developments, changes in investor psychology, or heavy institutional selling. The prospects for an industry or company may deteriorate because of a variety of factors, including disappointing earnings or changes in the competitive environment. In addition, the investment manager’s assessment of companies held in a fund may prove incorrect, resulting in losses or poor performance even in rising markets. Funds that invest only in specific industries will experience greater volatility than funds investing in a broad range of industries. The rate of earnings growth of natural resources companies may be irregular since these companies are strongly affected by natural forces, global economic cycles, and international politics. For example, stock prices of energy companies can fall sharply when oil prices decrease.
BENCHMARK INFORMATION
Combined index portfolio:As of January 1, 2018, the Real Assets combined index portfolio is composed of 30% MSCI World Select Natural Resources, 25% MSCI All Country World Index Metals and Mining, 20% Wilshire RESI, 20% EPRA/NAREIT Developed Real Estate Index, 4% MSCI All Country World Index IMI Gold, and 1% MSCI All Country World Index IMI Precious Metals and Minerals. Prior to this date, the Real Assets combined index portfolio was composed of 30% global natural resources (65% MSCI All Country World Index Energy and 35% MSCI All Country World Index Materials), 20% U.S. real estate (Wilshire U.S. Real Estate Securities Index), 20% global real estate (FTSE EPRA/NAREIT Developed Index), 25% global metals and mining (MSCI All Country World Index Metals and Mining), and 5% precious metals (80% MSCI All Country World Index IMI Gold and 20% MSCI All Country World Index IMI Precious Metals and Minerals).
Note:MSCI makes no express or implied warranties or representations and shall have no liability whatsoever with respect to any MSCI data contained herein. The MSCI data may not be further redistributed or used as a basis for other indices or any securities or financial products. This report is not approved, reviewed, or produced by MSCI.
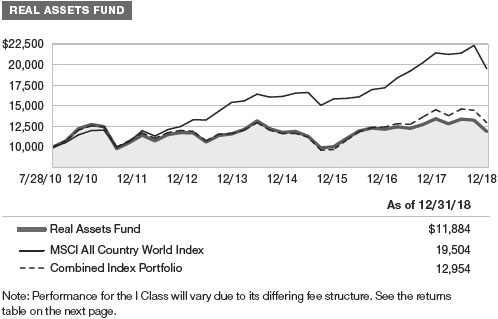
GROWTH OF $10,000
This chart shows the value of a hypothetical $10,000 investment in the fund over the past 10 fiscal year periods or since inception (for funds lacking 10-year records). The result is compared with benchmarks, which include a broad-based market index and may also include a peer group average or index. Market indexes do not include expenses, which are deducted from fund returns as well as mutual fund averages and indexes.
AVERAGE ANNUAL COMPOUND TOTAL RETURN
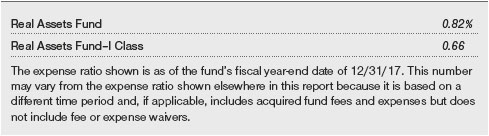
EXPENSE RATIO
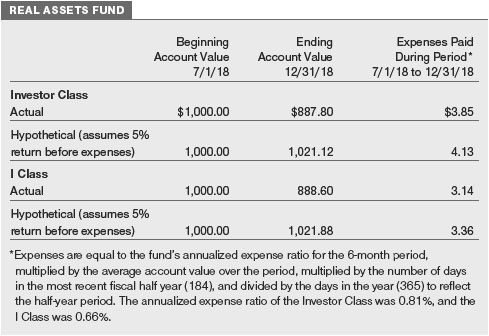
FUND EXPENSE EXAMPLE
As a mutual fund shareholder, you may incur two types of costs: (1) transaction costs, such as redemption fees or sales loads, and (2) ongoing costs, including management fees, distribution and service (12b-1) fees, and other fund expenses. The following example is intended to help you understand your ongoing costs (in dollars) of investing in the fund and to compare these costs with the ongoing costs of investing in other mutual funds. The example is based on an investment of $1,000 invested at the beginning of the most recent six-month period and held for the entire period.
Please note that the fund has two share classes: The original share class (Investor Class) charges no distribution and service (12b-1) fee, and the I Class shares are also available to institutionally oriented clients and impose no 12b-1 or administrative fee payment. Each share class is presented separately in the table.
Actual Expenses
The first line of the following table (Actual) provides information about actual account values and expenses based on the fund’s actual returns. You may use the information on this line, together with your account balance, to estimate the expenses that you paid over the period. Simply divide your account value by $1,000 (for example, an $8,600 account value divided by $1,000 = 8.6), then multiply the result by the number on the first line under the heading “Expenses Paid During Period” to estimate the expenses you paid on your account during this period.
Hypothetical Example for Comparison Purposes
The information on the second line of the table (Hypothetical) is based on hypothetical account values and expenses derived from the fund’s actual expense ratio and an assumed 5% per year rate of return before expenses (not the fund’s actual return). You may compare the ongoing costs of investing in the fund with other funds by contrasting this 5% hypothetical example and the 5% hypothetical examples that appear in the shareholder reports of the other funds. The hypothetical account values and expenses may not be used to estimate the actual ending account balance or expenses you paid for the period.
Note:T. Rowe Price charges an annual account service fee of $20, generally for accounts with less than $10,000. The fee is waived for any investor whose T. Rowe Price mutual fund accounts total $50,000 or more; accounts electing to receive electronic delivery of account statements, transaction confirmations, prospectuses, and shareholder reports; or accounts of an investor who is a T. Rowe Price Personal Services or Enhanced Personal Services client (enrollment in these programs generally requires T. Rowe Price assets of at least $250,000). This fee is not included in the accompanying table. If you are subject to the fee, keep it in mind when you are estimating the ongoing expenses of investing in the fund and when comparing the expenses of this fund with other funds.
You should also be aware that the expenses shown in the table highlight only your ongoing costs and do not reflect any transaction costs, such as redemption fees or sales loads. Therefore, the second line of the table is useful in comparing ongoing costs only and will not help you determine the relative total costs of owning different funds. To the extent a fund charges transaction costs, however, the total cost of owning that fund is higher.
The accompanying notes are an integral part of these financial statements.
The accompanying notes are an integral part of these financial statements.
The accompanying notes are an integral part of these financial statements.
The accompanying notes are an integral part of these financial statements.
The accompanying notes are an integral part of these financial statements.
The accompanying notes are an integral part of these financial statements.
| NOTES TO FINANCIAL STATEMENTS |
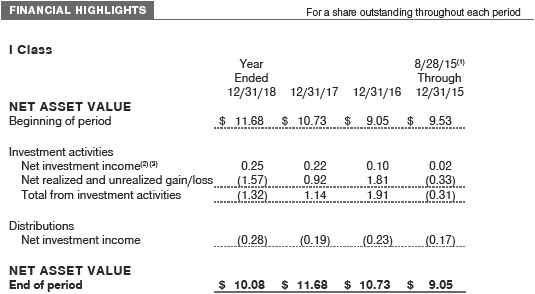
T. Rowe Price Real Assets Fund, Inc. (the fund) is registered under the Investment Company Act of 1940 (the 1940 Act) as a diversified, open-end management investment company. The fund seeks to provide long-term growth of capital. The fund has two classes of shares: the Real Assets Fund (Investor Class) and the Real Assets Fund–I Class (I Class). I Class shares generally are available only to investors meeting a $1,000,000 minimum investment, although the minimum is generally waived for certain client accounts. Each class has exclusive voting rights on matters related solely to that class; separate voting rights on matters that relate to both classes; and, in all other respects, the same rights and obligations as the other class.
NOTE 1 - SIGNIFICANT ACCOUNTING POLICIES
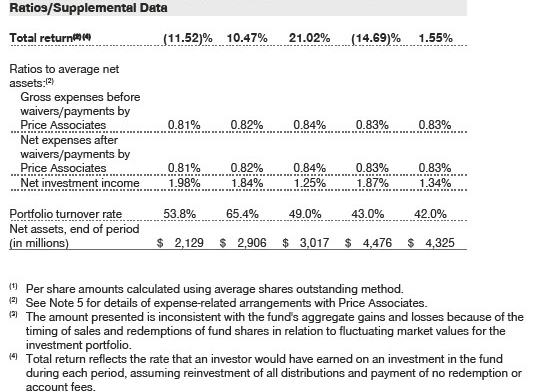
Basis of PreparationThe fund is an investment company and follows accounting and reporting guidance in the Financial Accounting Standards Board (FASB)Accounting Standards CodificationTopic 946 (ASC 946). The accompanying financial statements were prepared in accordance with accounting principles generally accepted in the United States of America (GAAP), including, but not limited to, ASC 946. GAAP requires the use of estimates made by management. Management believes that estimates and valuations are appropriate; however, actual results may differ from those estimates, and the valuations reflected in the accompanying financial statements may differ from the value ultimately realized upon sale or maturity. Certain ratios in the accompanying Financial Highlights have been included to conform to the current year presentation.
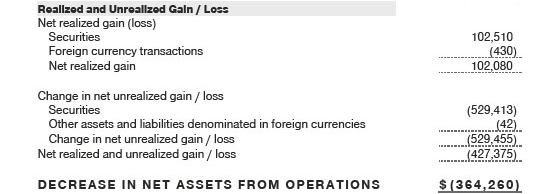
Investment Transactions, Investment Income, and DistributionsInvestment transactions are accounted for on the trade date basis. Income and expenses are recorded on the accrual basis. Realized gains and losses are reported on the identified cost basis. Premiums and discounts on debt securities are amortized for financial reporting purposes. Income tax-related interest and penalties, if incurred, are recorded as income tax expense. Dividends received from mutual fund investments are reflected as dividend income; capital gain distributions are reflected as realized gain/loss. Dividend income and capital gain distributions are recorded on the ex-dividend date. Distributions from REITs are initially recorded as dividend income and, to the extent such represent a return of capital or capital gain for tax purposes, are reclassified when such information becomes available. Distributions to shareholders are recorded on the ex-dividend date. Income distributions, if any, are declared and paid by each class annually. A capital gain distribution may also be declared and paid by the fund annually.
Currency TranslationAssets, including investments, and liabilities denominated in foreign currencies are translated into U.S. dollar values each day at the prevailing exchange rate, using the mean of the bid and asked prices of such currencies against U.S. dollars as quoted by a major bank. Purchases and sales of securities, income, and expenses are translated into U.S. dollars at the prevailing exchange rate on the respective date of such transaction. The effect of changes in foreign currency exchange rates on realized and unrealized security gains and losses is not bifurcated from the portion attributable to changes in market prices.
Class AccountingShareholder servicing, prospectus, and shareholder report expenses incurred by each class are charged directly to the class to which they relate. Expenses common to both classes, investment income, and realized and unrealized gains and losses are allocated to the classes based upon the relative daily net assets of each class.
RebatesSubject to best execution, the fund may direct certain security trades to brokers who have agreed to rebate a portion of the related brokerage commission to the fund in cash. Commission rebates are reflected as realized gain on securities in the accompanying financial statements and totaled $9,000 for the year ended December 31, 2018.
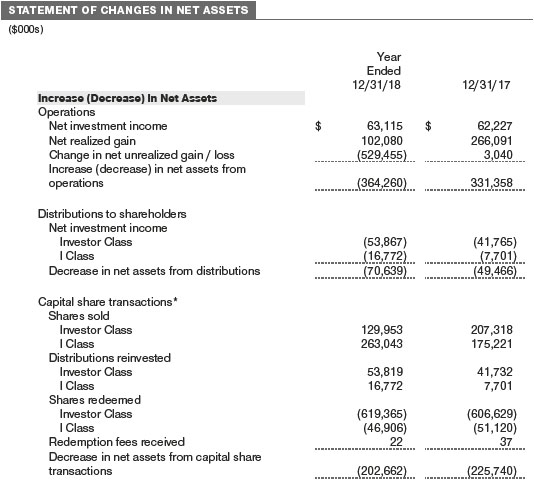
Redemption FeesA 2% fee is assessed on redemptions of fund shares held for 90 days or less to deter short-term trading and to protect the interests of long-term shareholders. Redemption fees are withheld from proceeds that shareholders receive from the sale or exchange of fund shares. The fees are paid to the fund and are recorded as an increase to paid-in capital. The fees may cause the redemption price per share to differ from the net asset value per share.
In-Kind RedemptionsIn accordance with guidelines described in the fund’s prospectus, and when considered to be in the best interest of all shareholders, the fund may distribute portfolio securities rather than cash as payment for a redemption of fund shares (in-kind redemption). Gains and losses realized on in-kind redemptions are not recognized for tax purposes and are reclassified from undistributed realized gain (loss) to paid-in capital. During the year ended December 31, 2018, the fund realized $59,468,000 of net gain on $174,789,000 of in-kind redemptions.
New Accounting GuidanceIn March 2017, the FASB issued amended guidance to shorten the amortization period for certain callable debt securities held at a premium. The guidance is effective for fiscal years and interim periods beginning after December 15, 2018. Adoption will have no effect on the fund’s net assets or results of operations.
IndemnificationIn the normal course of business, the fund may provide indemnification in connection with its officers and directors, service providers, and/or private company investments. The fund’s maximum exposure under these arrangements is unknown; however, the risk of material loss is currently considered to be remote.
NOTE 2 - VALUATION
The fund’s financial instruments are valued and each class’s net asset value (NAV) per share is computed at the close of the New York Stock Exchange (NYSE), normally 4 p.m. ET, each day the NYSE is open for business. However, the NAV per share may be calculated at a time other than the normal close of the NYSE if trading on the NYSE is restricted, if the NYSE closes earlier, or as may be permitted by the SEC.
Fair ValueThe fund’s financial instruments are reported at fair value, which GAAP defines as the price that would be received to sell an asset or paid to transfer a liability in an orderly transaction between market participants at the measurement date. The T. Rowe Price Valuation Committee (the Valuation Committee) is an internal committee that has been delegated certain responsibilities by the fund’s Board of Directors (the Board) to ensure that financial instruments are appropriately priced at fair value in accordance with GAAP and the 1940 Act. Subject to oversight by the Board, the Valuation Committee develops and oversees pricing-related policies and procedures and approves all fair value determinations. Specifically, the Valuation Committee establishes procedures to value securities; determines pricing techniques, sources, and persons eligible to effect fair value pricing actions; oversees the selection, services, and performance of pricing vendors; oversees valuation-related business continuity practices; and provides guidance on internal controls and valuation-related matters. The Valuation Committee reports to the Board and has representation from legal, portfolio management and trading, operations, risk management, and the fund’s treasurer.
Various valuation techniques and inputs are used to determine the fair value of financial instruments. GAAP establishes the following fair value hierarchy that categorizes the inputs used to measure fair value:
Level 1 – quoted prices (unadjusted) in active markets for identical financial instruments that the fund can access at the reporting date
Level 2 – inputs other thanLevel 1 quoted prices that are observable, either directly or indirectly (including, but not limited to, quoted prices for similar financial instruments in active markets, quoted prices for identical or similar financial instruments in inactive markets, interest rates and yield curves, implied volatilities, and credit spreads)
Level 3 – unobservable inputs
Observable inputs are developed using market data, such as publicly available information about actual events or transactions, and reflect the assumptions that market participants would use to price the financial instrument. Unobservable inputs are those for which market data are not available and are developed using the best information available about the assumptions that market participants would use to price the financial instrument. GAAP requires valuation techniques to maximize the use of relevant observable inputs and minimize the use of unobservable inputs. When multiple inputs are used to derive fair value, the financial instrument is assigned to the level within the fair value hierarchy based on the lowest-level input that is significant to the fair value of the financial instrument. Input levels are not necessarily an indication of the risk or liquidity associated with financial instruments at that level but rather the degree of judgment used in determining those values.
Valuation TechniquesEquity securities listed or regularly traded on a securities exchange or in the over-the-counter (OTC) market are valued at the last quoted sale price or, for certain markets, the official closing price at the time the valuations are made. OTC Bulletin Board securities are valued at the mean of the closing bid and asked prices. A security that is listed or traded on more than one exchange is valued at the quotation on the exchange determined to be the primary market for such security. Listed securities not traded on a particular day are valued at the mean of the closing bid and asked prices for domestic securities and the last quoted sale or closing price for international securities.
For valuation purposes, the last quoted prices of non-U.S. equity securities may be adjusted to reflect the fair value of such securities at the close of the NYSE. If the fund determines that developments between the close of a foreign market and the close of the NYSE will affect the value of some or all of its portfolio securities, the fund will adjust the previous quoted prices to reflect what it believes to be the fair value of the securities as of the close of the NYSE. In deciding whether it is necessary to adjust quoted prices to reflect fair value, the fund reviews a variety of factors, including developments in foreign markets, the performance of U.S. securities markets, and the performance of instruments trading in U.S. markets that represent foreign securities and baskets of foreign securities. The fund may also fair value securities in other situations, such as when a particular foreign market is closed but the fund is open. The fund uses outside pricing services to provide it with quoted prices and information to evaluate or adjust those prices. The fund cannot predict how often it will use quoted prices and how often it will determine it necessary to adjust those prices to reflect fair value. As a means of evaluating its security valuation process, the fund routinely compares quoted prices, the next day’s opening prices in the same markets, and adjusted prices.
Actively traded equity securities listed on a domestic exchange generally are categorized in Level 1 of the fair value hierarchy. Non-U.S. equity securities generally are categorized in Level 2 of the fair value hierarchy despite the availability of quoted prices because, as described above, the fund evaluates and determines whether those quoted prices reflect fair value at the close of the NYSE or require adjustment. OTC Bulletin Board securities, certain preferred securities, and equity securities traded in inactive markets generally are categorized in Level 2 of the fair value hierarchy.
Debt securities generally are traded in the OTC market and are valued at prices furnished by dealers who make markets in such securities or by an independent pricing service, which considers the yield or price of bonds of comparable quality, coupon, maturity, and type, as well as prices quoted by dealers who make markets in such securities. Generally, debt securities are categorized in Level 2 of the fair value hierarchy; however, to the extent the valuations include significant unobservable inputs, the securities would be categorized in Level 3.
Investments in mutual funds are valued at the mutual fund’s closing NAV per share on the day of valuation and are categorized in Level 1 of the fair value hierarchy. Assets and liabilities other than financial instruments, including short-term receivables and payables, are carried at cost, or estimated realizable value, if less, which approximates fair value.
Thinly traded financial instruments and those for which the above valuation procedures are inappropriate or are deemed not to reflect fair value are stated at fair value as determined in good faith by the Valuation Committee. The objective of any fair value pricing determination is to arrive at a price that could reasonably be expected from a current sale. Financial instruments fair valued by the Valuation Committee are primarily private placements, restricted securities, warrants, rights, and other securities that are not publicly traded.
Subject to oversight by the Board, the Valuation Committee regularly makes good faith judgments to establish and adjust the fair valuations of certain securities as events occur and circumstances warrant. For instance, in determining the fair value of an equity investment with limited market activity, such as a private placement or a thinly traded public company stock, the Valuation Committee considers a variety of factors, which may include, but are not limited to, the issuer’s business prospects, its financial standing and performance, recent investment transactions in the issuer, new rounds of financing, negotiated transactions of significant size between other investors in the company, relevant market valuations of peer companies, strategic events affecting thecompany, market liquidity for the issuer, and general economic conditions and events. In consultation with the investment and pricing teams, the Valuation Committee will determine an appropriate valuation technique based on available information, which may include both observable and unobservable inputs. The Valuation Committee typically will afford greatest weight to actual prices in arm’s length transactions, to the extent they represent orderly transactions between market participants; transaction information can be reliably obtained, and prices are deemed representative of fair value. However, the Valuation Committee may also consider other valuation methods such as market-based valuation multiples; a discount or premium from market value of a similar, freely traded security of the same issuer; or some combination. Fair value determinations are reviewed on a regular basis and updated as information becomes available, including actual purchase and sale transactions of the issue. Because any fair value determination involves a significant amount of judgment, there is a degree of subjectivity inherent in such pricing decisions, and fair value prices determined by the Valuation Committee could differ from those of other market participants. Depending on the relative significance of unobservable inputs, including the valuation technique(s) used, fair valued securities may be categorized in Level 2 or 3 of the fair value hierarchy.
Valuation InputsThe following table summarizes the fund’s financial instruments, based on the inputs used to determine their fair values on December 31, 2018 (for further detail by category, please refer to the accompanying Portfolio of Investments):
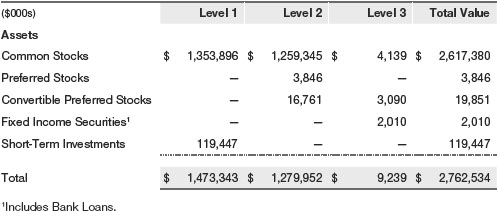
There were no material transfers between Levels 1 and 2 during the year ended December 31, 2018.
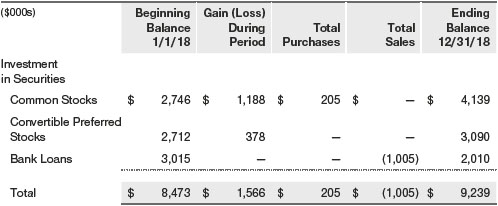
Following is a reconciliation of the fund’s Level 3 holdings for the year ended December 31, 2018. Gain (loss) reflects both realized and change in unrealized gain/loss on Level 3 holdings during the period, if any, and is included on the accompanying Statement of Operations. The change in unrealized gain/loss on Level 3 instruments held at December 31, 2018, totaled $1,566,000 for the year ended December 31, 2018.
NOTE 3 - OTHER INVESTMENT TRANSACTIONS
Consistent with its investment objective, the fund engages in the following practices to manage exposure to certain risks and/or to enhance performance. The investment objective, policies, program, and risk factors of the fund are described more fully in the fund’s prospectus and Statement of Additional Information.
Restricted SecuritiesThe fund may invest in securities that are subject to legal or contractual restrictions on resale. Prompt sale of such securities at an acceptable price may be difficult and may involve substantial delays and additional costs.
Bank LoansThe fund may invest in bank loans, which represent an interest in amounts owed by a borrower to a syndicate of lenders. Bank loans are generally noninvestment grade and often involve borrowers whose financial condition is highly leveraged. Bank loans may be in the form of either assignments or participations. A loan assignment transfers all legal, beneficial, and economic rights to the buyer, and transfer typically requires consent of both the borrower and agent. In contrast, a loan participation generally entitles the buyer to receive the cash flows from principal, interest, and any fee payments on a portion of a loan; however, the seller continues to hold legal title to that portion of the loan. As a result, the buyer of a loan participation generally has no direct recourse against the borrower and is exposed to credit risk of both the borrower and seller of the participation. Bank loans often have extended settlement periods, generally may be repaid at any time at the option of the borrower, and may require additional principal to be funded at the borrowers’ discretion at a later date (e.g. unfunded commitments and revolving debt instruments). Until settlement, the fund maintains liquid assets sufficient to settle its unfunded loan commitments. The fund reflects both the funded portion of a bank loan as well as its unfunded commitment in the Portfolio of Investments. However, if a credit agreement provides no initial funding of a tranche and funding of the full commitment at a future date(s) is at the borrower’s discretion and considered uncertain, a loan is reflected in the Portfolio of Investments only if, and only to the extent that, the fund has actually settled a funding commitment.
OtherPurchases and sales of portfolio securities other than short-term securities aggregated $1,650,587,000 and $1,894,385,000, respectively, for the year ended December 31, 2018.
NOTE 4 - FEDERAL INCOME TAXES
No provision for federal income taxes is required since the fund intends to continue to qualify as a regulated investment company under Subchapter M of the Internal Revenue Code and distribute to shareholders all of its taxable income and gains. Distributions determined in accordance with federal income tax regulations may differ in amount or character from net investment income and realized gains for financial reporting purposes. Financial reporting records are adjusted for permanent book/tax differences to reflect tax character but are not adjusted for temporary differences.
The fund files U.S. federal, state, and local tax returns as required. The fund’s tax returns are subject to examination by the relevant tax authorities until expiration of the applicable statute of limitations, which is generally three years after the filing of the tax return but which can be extended to six years in certain circumstances. Tax returns for open years have incorporated no uncertain tax positions that require a provision for income taxes.
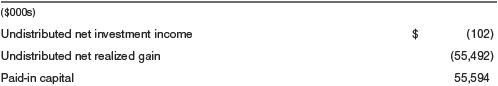
Reclassifications to paid-in capital relate primarily to redemptions in kind. Reclassifications between income and gain relate primarily to the character of foreign capital gains taxes. For the year ended December 31, 2018, the following reclassifications were recorded to reflect tax character (there was no impact on results of operations or net assets):
Distributions during the years ended December 31, 2018 and December 31, 2017, totaled $70,639,000 and $49,466,000, respectively, and were characterized as ordinary income for tax purposes. At December 31, 2018, the tax-basis cost of investments and components of net assets were as follows:
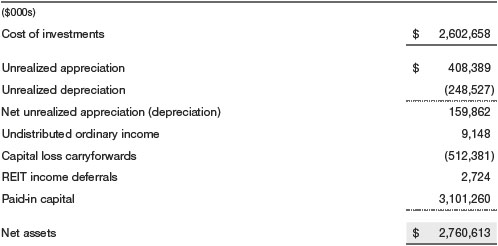
The difference between book-basis and tax-basis net unrealized appreciation (depreciation) is attributable to the deferral of losses from wash sales, and the realization of gains/losses on passive foreign investment companies for tax purposes. The fund intends to retain realized gains to the extent of available capital loss carryforwards. Net realized capital losses may be carried forward indefinitely to offset future realized capital gains. During the year ended December 31, 2018, the fund utilized $56,428,000 of capital loss carryforwards. Certain dividends declared by real estate investment trusts (REITs) in December and paid the following January are recognized for tax purposes in the subsequent year (REIT income deferrals) but, for financial reporting purposes, are included in the fund’s dividend income on ex-date.
NOTE 5 - RELATED PARTY TRANSACTIONS
The fund is managed by T. Rowe Price Associates, Inc. (Price Associates), a wholly owned subsidiary of T. Rowe Price Group, Inc. (Price Group). The investment management agreement between the fund and Price Associates provides for an annual investment management fee, which is computed daily and paid monthly. The fee consists of an individual fund fee, equal to 0.35% of the fund’s average daily net assets, and a group fee. The group fee rate is calculated based on the combined net assets of certain mutualfunds sponsored by Price Associates (the group) applied to a graduated fee schedule, with rates ranging from 0.48% for the first $1 billion of assets to 0.265% for assets in excess of $650 billion. The fund’s group fee is determined by applying the group fee rate to the fund’s average daily net assets. At December 31, 2018, the effective annual group fee rate was 0.29%.
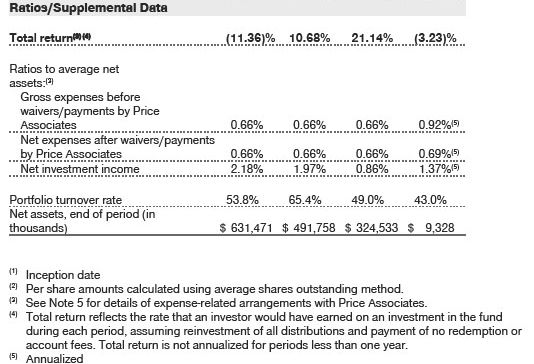
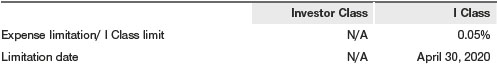
The I Class is subject to an operating expense limitation (I Class limit) pursuant to which Price Associates is contractually required to pay all operating expenses of the I Class, excluding management fees, interest, expenses related to borrowings, taxes, brokerage, and other non-recurring expenses permitted by the investment management agreement, to the extent such operating expenses, on an annualized basis, exceed the I Class limit. This agreement will continue through the limitation date indicated in the table below, and may be renewed, revised, or revoked only with approval of the fund’s Board. The I Class is required to repay Price Associates for expenses previously paid to the extent the class’s net assets grow or expenses decline sufficiently to allow repayment without causing the class’s operating expenses (after the repayment is taken into account) to exceed both: (1) the I Class limit in place at the time such amounts were paid; and (2) the current I Class limit. However, no repayment will be made more than three years after the date of a payment or waiver.
In addition, the fund has entered into service agreements with Price Associates and two wholly owned subsidiaries of Price Associates, each an affiliate of the fund (collectively, Price). Price Associates provides certain accounting and administrative services to the fund. T. Rowe Price Services, Inc. provides shareholder and administrative services in its capacity as the fund’s transfer and dividend-disbursing agent. T. Rowe Price Retirement Plan Services, Inc. provides subaccounting and recordkeeping services for certain retirement accounts invested in the Investor Class. For the year ended December 31, 2018, expenses incurred pursuant to these service agreements were $79,000 for Price Associates; $98,000 for T. Rowe Price Services, Inc.; and $1,000 for T. Rowe Price Retirement Plan Services, Inc. All amounts due to and due from Price, exclusive of investment management fees payable, are presented net on the accompanying Statement of Assets and Liabilities.
Additionally, the fund is one of several mutual funds in which certain college savings plans managed by Price Associates may invest. As approved by the fund’s Board of Directors, shareholder servicing costs associated with each college savings plan are borneby the fund in proportion to the average daily value of its shares owned by the college savings plan. For the year ended December 31, 2018, the fund was charged $313,000 for shareholder servicing costs related to the college savings plans, of which $229,000 was for services provided by Price. All amounts due to and due from Price, exclusive of investment management fees payable, are presented net on the Statement of Assets and Liabilities. At December 31, 2018, approximately 8% of the outstanding shares of the Investor Class were held by college savings plans.
The fund is also one of several mutual funds sponsored by Price Associates (underlying Price Funds) in which the T. Rowe Price Spectrum Funds (Spectrum Funds) and T. Rowe Price Retirement Funds (Retirement Funds) may invest. None of the Spectrum Funds or Retirement Funds invest in the underlying Price Funds for the purpose of exercising management or control. Pursuant to special servicing agreements, expenses associated with the operation of the Spectrum Funds and Retirement Funds are borne by each underlying Price Fund to the extent of estimated savings to it and in proportion to the average daily value of its shares owned by the Spectrum Funds and Retirement Funds. Expenses allocated under these special servicing agreements are reflected as shareholder servicing expense in the accompanying financial statements. For the year ended December 31, 2018, the fund was allocated $75,000 of Spectrum Funds’ expenses and $3,303,000 of Retirement Funds’ expenses. Of these amounts, $1,084,000 related to services provided by Price. All amounts due to and due from Price, exclusive of investment management fees payable, are presented net on the accompanying Statement of Assets and Liabilities. At December 31, 2018, approximately 88% of the outstanding shares of the Investor Class were held by the Spectrum Funds and Retirement Funds.
In addition, other mutual funds, trusts, and other accounts managed by Price Associates or its affiliates (collectively, Price Funds and accounts) may invest in the fund and are not subject to the special servicing agreements disclosed above. No Price fund or account may invest for the purpose of exercising management or control over the fund. At December 31, 2018, approximately 95% of the I Class’s outstanding shares were held by Price Funds and accounts.
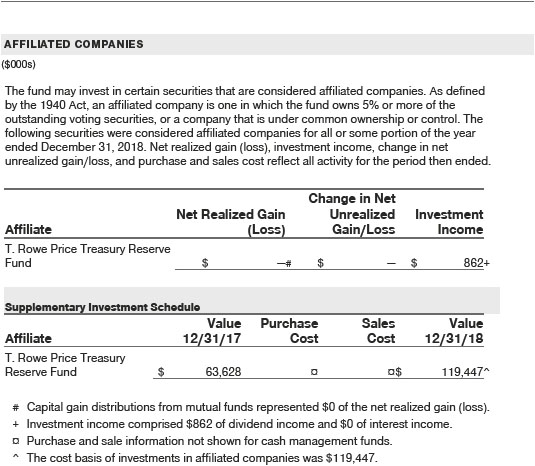
The fund may invest its cash reserves in certain open-end management investment companies managed by Price Associates and considered affiliates of the fund: the T. Rowe Price Government Reserve Fund or the T. Rowe Price Treasury Reserve Fund, organized as money market funds, or the T. Rowe Price Short-Term Fund, a short-term bond fund (collectively, the Price Reserve Funds). The Price Reserve Funds are offered as short-term investment options to mutual funds, trusts, and other accounts managed by Price Associates or its affiliates and are not available for direct purchase by members of the public. Cash collateral from securities lending is invested in the T. Rowe Price Short-Term Fund. The Price Reserve Funds pay no investment management fees.
The fund may participate in securities purchase and sale transactions with other funds or accounts advised by Price Associates (cross trades), in accordance with procedures adopted by the fund’s Board and Securities and Exchange Commission rules, which require, among other things, that such purchase and sale cross trades be effected at the independent current market price of the security. During the year ended December 31, 2018, the aggregate value of purchases and sales cross trades with other funds or accounts advised by Price Associates was less than 1% of the fund’s net assets as of December 31, 2018.
REPORT OF INDEPENDENT REGISTERED PUBLIC ACCOUNTING FIRM
To the Board of Directors and Shareholders of
T. Rowe Price Real Assets Fund, Inc.
Opinion on the Financial Statements
We have audited the accompanying statement of assets and liabilities, including the portfolio of investments, of T. Rowe Price Real Assets Fund, Inc. (the “Fund”) as of December 31, 2018, the related statement of operations for the year ended December 31, 2018, the statement of changes in net assets for each of the two years in the period ended December 31, 2018, including the related notes, and the financial highlights for each of the periods indicated therein (collectively referred to as the “financial statements”). In our opinion, the financial statements present fairly, in all material respects, the financial position of the Fund as of December 31, 2018, the results of its operations for the year then ended, the changes in its net assets for each of the two years in the period ended December 31, 2018 and the financial highlights for each of the periods indicated therein, in conformity with accounting principles generally accepted in the United States of America.
Basis for Opinion
These financial statements are the responsibility of the Fund’s management. Our responsibility is to express an opinion on the Fund’s financial statements based on our audits. We are a public accounting firm registered with the Public Company Accounting Oversight Board (United States) (PCAOB) and are required to be independent with respect to the Fund in accordance with the U.S. federal securities laws and the applicable rules and regulations of the Securities and Exchange Commission and the PCAOB.
We conducted our audits of these financial statements in accordance with the standards of the PCAOB. Those standards require that we plan and perform the audit to obtain reasonable assurance about whether the financial statements are free of material misstatement, whether due to error or fraud.
Our audits included performing procedures to assess the risks of material misstatement of the financial statements, whether due to error or fraud, and performing procedures that respond to those risks. Such procedures included examining, on a test basis, evidence regarding the amounts and disclosures in the financial statements. Our audits also included evaluating the accounting principles used and significant estimates made by management, as well as evaluating the overall presentation of the financial statements. Our procedures included confirmation of securities owned as of December 31, 2018 by correspondence with the custodians, transfer agent and brokers; when replies were not received from brokers, we performed other auditing procedures. We believe that our audits provide a reasonable basis for our opinion.
PricewaterhouseCoopers LLP
Baltimore, Maryland
February 20, 2019
We have served as the auditor of one or more investment companies in the T. Rowe Price group of investment companies since 1973.
TAX INFORMATION (UNAUDITED) FOR THE TAX YEAR ENDED 12/31/18
We are providing this information as required by the Internal Revenue Code. The amounts shown may differ from those elsewhere in this report because of differences between tax and financial reporting requirements.
For taxable non-corporate shareholders, $48,495,000 of the fund’s income represents qualified dividend income subject to a long-term capital gains tax rate of not greater than 20%.
For corporate shareholders, $11,566,000 of the fund’s income qualifies for the dividends-received deduction.
For individuals and certain trusts and estates which are entitled to claim a deduction of up to 20 percent of their combined qualified real estate investment trust (REIT) dividends, $19,139,000 of the fund’s income qualifies as qualified real estate investment trust (REIT) dividends.
INFORMATION ON PROXY VOTING POLICIES, PROCEDURES, AND RECORDS
A description of the policies and procedures used by T. Rowe Price funds and portfolios to determine how to vote proxies relating to portfolio securities is available in each fund’s Statement of Additional Information. You may request this document by calling 1-800-225-5132 or by accessing the SEC’s website, sec.gov.
The description of our proxy voting policies and procedures is also available on our corporate website. To access it, please visit the following Web page:
https://www3.troweprice.com/usis/corporate/en/utility/policies.html
Scroll down to the section near the bottom of the page that says, “Proxy Voting Policies.” Click on the Proxy Voting Policies link in the shaded box.
Each fund’s most recent annual proxy voting record is available on our website and through the SEC’s website. To access it through T. Rowe Price, visit the website location shown above, and scroll down to the section near the bottom of the page that says, “Proxy Voting Records.” Click on the Proxy Voting Records link in the shaded box.
HOW TO OBTAIN QUARTERLY PORTFOLIO HOLDINGS
Effective for reporting periods on or after March 1, 2019, the fund files a complete schedule of portfolio holdings with the Securities and Exchange Commission (SEC) for the first and third quarters of each fiscal year as an exhibit to its reports on Form N-PORT. Prior to March 1, 2019, the fund filed a complete schedule of portfolio holdings with the SEC for the first and third quarters of each fiscal year on Form N-Q. The fund’s Forms N-PORT and N-Q are available electronically on the SEC’s website (sec.gov).
ABOUT THE FUND’S DIRECTORS AND OFFICERS
Your fund is overseen by a Board of Directors (Board) that meets regularly to review a wide variety of matters affecting or potentially affecting the fund, including performance, investment programs, compliance matters, advisory fees and expenses, service providers, and business and regulatory affairs. The Board elects the fund’s officers, who are listed in the final table. At least 75% of the Board’s members are independent of the Boards of T. Rowe Price Associates, Inc. (T. Rowe Price), and its affiliates; “inside” or “interested” directors are employees or officers of T. Rowe Price. The business address of each director and officer is 100 East Pratt Street, Baltimore, Maryland 21202. The Statement of Additional Information includes additional information about the fund directors and is available without charge by calling a T. Rowe Price representative at 1-800-638-5660.
| INDEPENDENT DIRECTORS(a) |
| |
Name
(Year of Birth)
Year Elected
[Number of T. Rowe Price
Portfolios Overseen] | | Principal Occupation(s) and Directorships of Public Companies and Other Investment Companies During the Past Five Years |
| | | |
Teresa Bryce Bazemore(b)
(1959)
2018
[189] | | President, Radian Guaranty (2008 to 2017); Member, Bazemore Consulting LLC (2018 to present); Member, Chimera Investment Corporation (2017 to present); Member, Federal Home Loan Bank of Pittsburgh (2017 to present) |
| | | |
Ronald J. Daniels(b)
(1959)
2018
[189] | | President, The Johns Hopkins University(c)and Professor, Political Science Department, The Johns Hopkins University (2009 to present); Director, Lyndhurst Holdings (2015 to present) |
| | | |
Bruce W. Duncan
(1951)
2013
[189] | | Chief Executive Officer and Director (January 2009 to December 2016), Chairman of the Board (January 2016 to present), and President (January 2009 to September 2016), First Industrial Realty Trust, an owner and operator of industrial properties; Chairman of the Board (2005 to September 2016) and Director (1999 to September 2016), Starwood Hotels & Resorts, a hotel and leisure company; Director, Boston Properties (May 2016 to present); Director, Marriott International, Inc. (September 2016 to present) |
| | | |
Robert J. Gerrard, Jr.
(1952)
2012
[189] | | Advisory Board Member, Pipeline Crisis/Winning Strategies, a collaborative working to improve opportunities for young African Americans (1997 to present); Chairman of the Board, all funds (since July 2018) |
| | | |
Paul F. McBride
(1956)
2013
[189] | | Advisory Board Member, Vizzia Technologies (2015 to present); Board Member, Dunbar Armored (2012 to present) |
| | | |
Cecilia E. Rouse, Ph.D.
(1963)
2012
[189] | | Dean, Woodrow Wilson School (2012 to present); Professor andResearcher, Princeton University (1992 to present); Member of NationalAcademy of Education (2010 to present); Director, MDRC, a nonprofiteducation and social policy research organization (2011 to present);Research Associate of Labor Studies Program at the National Bureauof Economic Research (2011 to 2015); Board Member of the NationalBureau of Economic Research (2011 to present); Chair of Committeeon the Status of Minority Groups in the Economic Profession of theAmerican Economic Association (2012 to 2017); Vice President (2015to 2016), American Economic Association |
| | | |
John G. Schreiber
(1946)
2010
[189] | | Owner/President, Centaur Capital Partners, Inc., a real estate investment company (1991 to present); Cofounder, Partner, and Cochairman of the Investment Committee, Blackstone Real Estate Advisors, L.P. (1992 to 2015); Director, General Growth Properties, Inc. (2010 to 2013); Director, Blackstone Mortgage Trust, a real estate finance company (2012 to 2016); Director and Chairman of the Board, Brixmor Property Group, Inc. (2013 to present); Director, Hilton Worldwide (2013 to present); Director, Hudson Pacific Properties (2014 to 2016) ); Director, Invitation Homes (2014 to present) |
| | | |
Mark R. Tercek
(1957)
2010
[189] | | President and Chief Executive Officer, The Nature Conservancy (2008 to present) |
| | | |
| (a)All information about the independent directors was current as of December 31, 2017, except for the information provided for Ms. Bazemore and Mr. Daniels, which is current as of January 1, 2018. |
| (b)Effective January 1, 2018, Ms. Bazemore and Mr. Daniels were elected as independent directors of the Price Funds. |
| (c)William J. Stromberg, president and chief executive officer of T. Rowe Price Group, Inc., the parent company of the Price Funds’ investment advisor, has served on the Board of Trustees of Johns Hopkins University since 2014 and is a member of the Johns Hopkins University Board’s Compensation Committee. |
| | | |
| INSIDE DIRECTORS | | |
| |
Name
(Year of Birth)
Year Elected*
[Number of T. Rowe Price
Portfolios Overseen] | | Principal Occupation(s) and Directorships of Public Companies and Other Investment Companies During the Past Five Years |
| | | |
Edward C. Bernard**
(1956)
2010
[0] | | Director and Vice President, T. Rowe Price; Vice Chairman of the Board, Director, and Vice President, T. Rowe Price Group, Inc.; Chairman of the Board, Director, and Vice President, T. Rowe Price Investment Services, Inc., and T. Rowe Price Services, Inc.; Chairman of the Board and Director, T. Rowe Price Retirement Plan Services, Inc.; Chairman of the Board, Chief Executive Officer, Director, and President, T. Rowe Price International and T. Rowe Price Trust Company; Chairman of the Board, all funds (2006 to July 2018) |
| | | |
David Oestreicher
(1967)
2018
[189] | | Chief Legal Officer, Vice President, and Secretary, T. Rowe Price Group, Inc.; Director, Vice President, and Secretary, T. Rowe Price Investment Services, Inc., T. Rowe Price Retirement Plan Services, Inc., T. Rowe Price Services, Inc., and T. Rowe Price Trust Company; Vice President and Secretary, T. Rowe Price, T. Rowe Price Hong Kong, and T. Rowe Price International; Vice President, T. Rowe Price Japan and T. Rowe Price Singapore; Principal Executive Officer and Executive Vice President, all funds |
| | | |
Robert W. Sharps, CFA,
CPA
(1971)
2017
[135] | | Vice President, T. Rowe Price, T. Rowe Price Group, Inc., and T. Rowe Price Trust Company |
| |
| *Each inside director serves until retirement, resignation, or election of a successor. |
| **Effective at the conclusion of a meeting of the Boards of the Price Funds held on July 25, 2018, Mr. Bernard resigned from his role as a director and chairman of the Boards of all the Price Funds. |
| OFFICERS | | |
| |
Name (Year of Birth)
Position Held With Real Assets Fund | | Principal Occupation(s) |
| | | |
Boyko Atanassov, CFA (1969)
Vice President | | Vice President, T. Rowe Price and T. Rowe Price Group, Inc. |
| | | |
E. Frederick Bair, CFA, CPA (1969)
Vice President | | Vice President, T. Rowe Price, T. Rowe Price Group, Inc., and T. Rowe Price Trust Company |
| | | |
Stephen L. Bartolini, CFA (1977)
Vice President | | Vice President, T. Rowe Price, T. Rowe Price Group, Inc., and T. Rowe Price Trust Company |
| | | |
Darrell N. Braman (1963)
Vice President and Secretary | | Vice President, Price Hong Kong, Price Singapore, T. Rowe Price, T. Rowe Price Group, Inc., T. Rowe Price International, T. Rowe Price Investment Services, Inc., and T. Rowe Price Services, Inc. |
| | | |
Richard Coghlan, Ph.D. (1961)
Co-President | | Vice President, T. Rowe Price and T. Rowe Price Group, Inc. |
| | | |
Richard de los Reyes (1975)
Vice President | | Vice President, T. Rowe Price, T. Rowe Price Group, Inc., and T. Rowe Price Trust Company |
| | | |
Shawn T. Driscoll (1975)
Vice President | | Vice President, T. Rowe Price, T. Rowe Price Group, Inc., and T. Rowe Price Trust Company |
| | | |
Christopher Faulkner-MacDonagh, Ph.D. (1969)
Co-President | | Vice President, T. Rowe Price and T. Rowe Price Group, Inc. |
| | | |
John R. Gilner (1961)
Chief Compliance Officer | | Chief Compliance Officer and Vice President, T. Rowe Price; Vice President, T. Rowe Price Group, Inc., and T. Rowe Price Investment Services, Inc. |
| | | |
Gary J. Greb (1961)
Vice President | | Vice President, T. Rowe Price, T. Rowe Price International, and T. Rowe Price Trust Company |
| | | |
Stefan Hubrich, Ph.D., CFA (1974)
Vice President | | Vice President, T. Rowe Price and T. Rowe Price Group, Inc. |
| | | |
Nina P. Jones, CPA (1980)
Vice President | | Vice President, T. Rowe Price and T. Rowe Price Group, Inc. |
| | | |
Paul J. Krug, CPA (1964)
Vice President | | Vice President, T. Rowe Price, T. Rowe Price Group, Inc., and T. Rowe Price Trust Company |
| | | |
Catherine D. Mathews (1963)
Treasurer and Vice President | | Vice President, T. Rowe Price, T. Rowe Price Group, Inc., and T. Rowe Price Trust Company |
| | | |
Sebastien Page (1977)
Vice President | | Vice President, T. Rowe Price and T. Rowe Price Group, Inc. |
| | | |
John W. Ratzesberger (1975)
Vice President | | Vice President, T. Rowe Price, T. Rowe Price Group, Inc., and T. Rowe Price Trust Company; formerly, North American Head of Listed Derivatives Operation, Morgan Stanley (to 2013) |
| | | |
Shannon H. Rauser (1987)
Assistant Secretary | | Employee, T. Rowe Price |
| | | |
Daniel O. Shackelford, CFA (1958)
Vice President | | Vice President, T. Rowe Price, T. Rowe Price Group, Inc., and T. Rowe Price Trust Company |
| | | |
Charles M. Shriver, CFA (1967)
Vice President | | Vice President, T. Rowe Price, T. Rowe Price Group, Inc., T. Rowe Price International, and T. Rowe Price Trust Company |
| | | |
Megan Warren (1968)
Vice President | | Vice President, T. Rowe Price, T. Rowe Price Group, Inc., T. Rowe Price Retirement Plan Services, Inc., T. Rowe Price Services, Inc., and T. Rowe Price Trust Company; formerly, Executive Director, JP Morgan Chase (to 2017) |
| |
| Unless otherwise noted, officers have been employees of T. Rowe Price or T. Rowe Price International for at least 5 years. |
Item 2. Code of Ethics.
The registrant has adopted a code of ethics, as defined in Item 2 of Form N-CSR, applicable to its principal executive officer, principal financial officer, principal accounting officer or controller, or persons performing similar functions. A copy of this code of ethics is filed as an exhibit to this Form N-CSR. No substantive amendments were approved or waivers were granted to this code of ethics during the period covered by this report.
Item 3. Audit Committee Financial Expert.
The registrant’s Board of Directors/Trustees has determined that Mr. Bruce W. Duncan qualifies as an audit committee financial expert, as defined in Item 3 of Form N-CSR. Mr. Duncan is considered independent for purposes of Item 3 of Form N-CSR.
Item 4. Principal Accountant Fees and Services.
(a) – (d) Aggregate fees billed for the last two fiscal years for professional services rendered to, or on behalf of, the registrant by the registrant’s principal accountant were as follows:
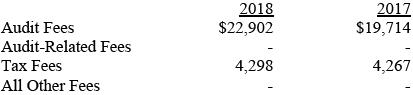
Audit fees include amounts related to the audit of the registrant’s annual financial statements and services normally provided by the accountant in connection with statutory and regulatory filings. Audit-related fees include amounts reasonably related to the performance of the audit of the registrant’s financial statements and specifically include the issuance of a report on internal controls and, if applicable, agreed-upon procedures related to fund acquisitions. Tax fees include amounts related to services for tax compliance, tax planning, and tax advice. The nature of these services specifically includes the review of distribution calculations and the preparation of Federal, state, and excise tax returns. All other fees include the registrant’s pro-rata share of amounts for agreed-upon procedures in conjunction with service contract approvals by the registrant’s Board of Directors/Trustees.
(e)(1) The registrant’s audit committee has adopted a policy whereby audit and non-audit services performed by the registrant’s principal accountant for the registrant, its investment adviser, and any entity controlling, controlled by, or under common control with the investment adviser that provides ongoing services to the registrant require pre-approval in advance at regularly scheduled audit committee meetings. If such a service is required between regularly scheduled audit committee meetings, pre-approval may be authorized by one audit committee member with ratification at the next scheduled audit committee meeting. Waiver of pre-approval for audit or non-audit services requiring fees of a de minimis amount is not permitted.
(2) No services included in (b) – (d) above were approved pursuant to paragraph (c)(7)(i)(C) of Rule 2-01 of Regulation S-X.
(f) Less than 50 percent of the hours expended on the principal accountant’s engagement to audit the registrant’s financial statements for the most recent fiscal year were attributed to work performed by persons other than the principal accountant’s full-time, permanent employees.
(g) The aggregate fees billed for the most recent fiscal year and the preceding fiscal year by the registrant’s principal accountant for non-audit services rendered to the registrant, its investment adviser, and any entity controlling, controlled by, or under common control with the investment adviser that provides ongoing services to the registrant were $2,544,000 and $2,169,000, respectively.
(h) All non-audit services rendered in (g) above were pre-approved by the registrant’s audit committee. Accordingly, these services were considered by the registrant’s audit committee in maintaining the principal accountant’s independence.
Item 5. Audit Committee of Listed Registrants.
Not applicable.
Item 6. Investments.
(a) Not applicable. The complete schedule of investments is included in Item 1 of this Form N-CSR.
(b) Not applicable.
Item 7. Disclosure of Proxy Voting Policies and Procedures for Closed-End Management Investment Companies.
Not applicable.
Item 8. Portfolio Managers of Closed-End Management Investment Companies.
Not applicable.
Item 9. Purchases of Equity Securities by Closed-End Management Investment Company and Affiliated Purchasers.
Not applicable.
Item 10. Submission of Matters to a Vote of Security Holders.
Not applicable.
Item 11. Controls and Procedures.
(a) The registrant’s principal executive officer and principal financial officer have evaluated the registrant’s disclosure controls and procedures within 90 days of this filing and have concluded that the registrant’s disclosure controls and procedures were effective, as of that date, in ensuring that information required to be disclosed by the registrant in this Form N-CSR was recorded, processed, summarized, and reported timely.
(b) During the period, the Price Funds’ accounting agent, The Bank of New York Mellon (BNYM), converted the fund’s books and records from a legacy fund accounting system / operating model to a BNYM fund accounting system / operating model.
Item 12. Exhibits.
(a)(1) The registrant’s code of ethics pursuant to Item 2 of Form N-CSR is attached.
(2) Separate certifications by the registrant's principal executive officer and principal financial officer, pursuant to Section 302 of the Sarbanes-Oxley Act of 2002 and required by Rule 30a-2(a) under the Investment Company Act of 1940, are attached.
(3) Written solicitation to repurchase securities issued by closed-end companies: not applicable.
(b) A certification by the registrant’s principal executive officer and principal financial officer, pursuant to Section 906 of the Sarbanes-Oxley Act of 2002 and required by Rule 30a-2(b) under the Investment Company Act of 1940, is attached.
SIGNATURES
Pursuant to the requirements of the Securities Exchange Act of 1934 and the Investment Company Act of 1940, the registrant has duly caused this report to be signed on its behalf by the undersigned, thereunto duly authorized.
T. Rowe Price Real Assets Fund, Inc.
| By | | /s/ David Oestreicher |
| | | David Oestreicher |
| | | Principal Executive Officer |
| |
| Date | | February 20, 2019 | | | | |
Pursuant to the requirements of the Securities Exchange Act of 1934 and the Investment Company Act of 1940, this report has been signed below by the following persons on behalf of the registrant and in the capacities and on the dates indicated.
| By | | /s/ David Oestreicher |
| | | David Oestreicher |
| | | Principal Executive Officer |
| |
| Date | | February 20, 2019 | | | | |
| |
| |
| By | | /s/ Catherine D. Mathews |
| | | Catherine D. Mathews |
| | | Principal Financial Officer |
| |
| Date | | February 20, 2019 | | | | |