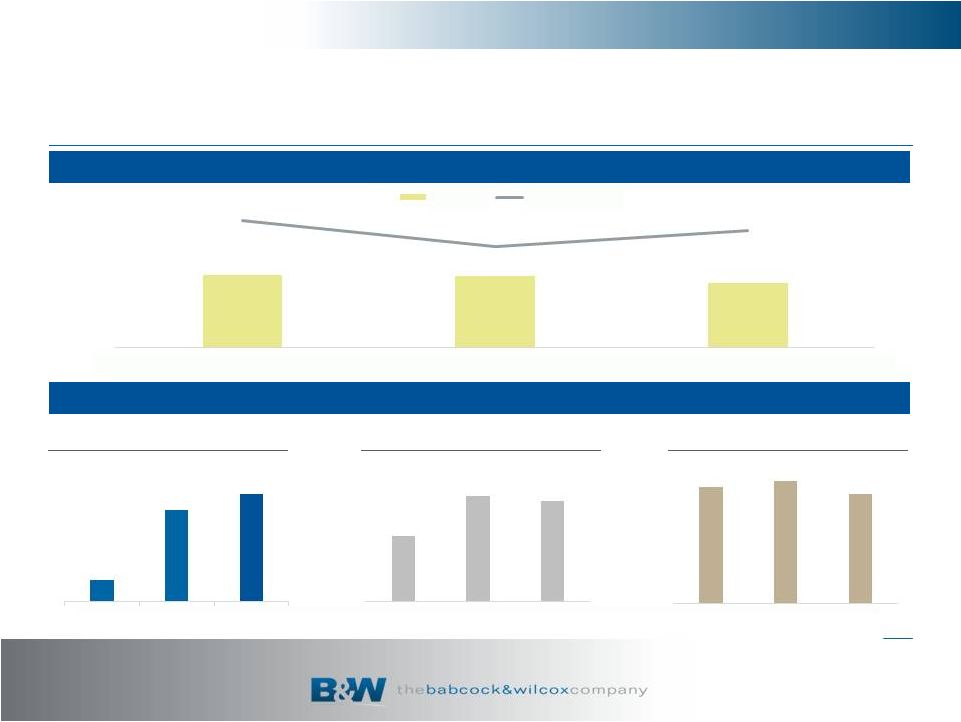
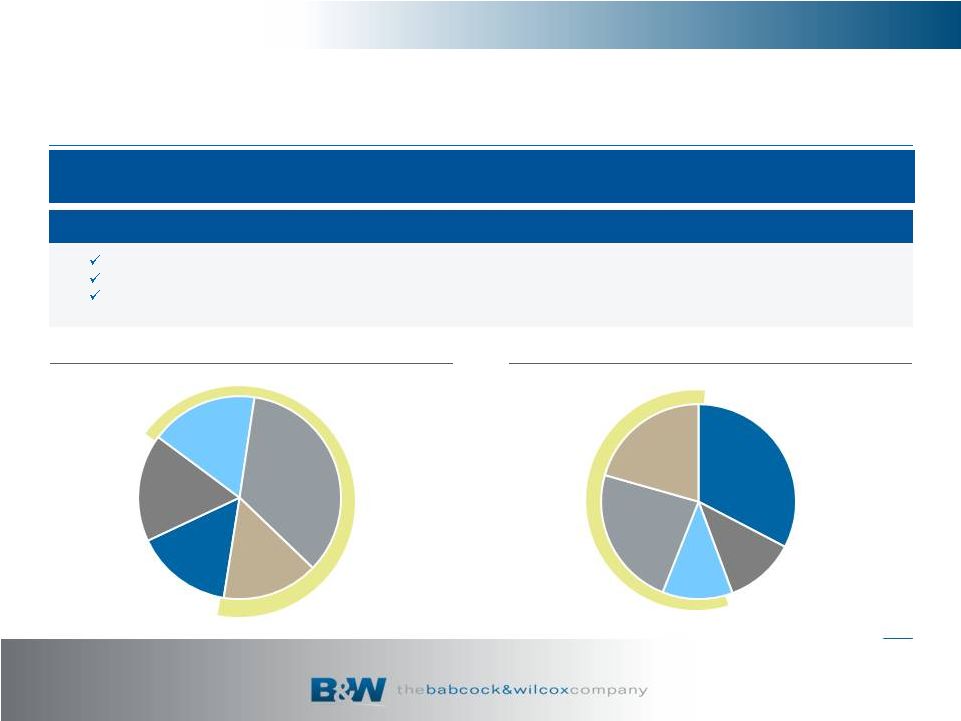
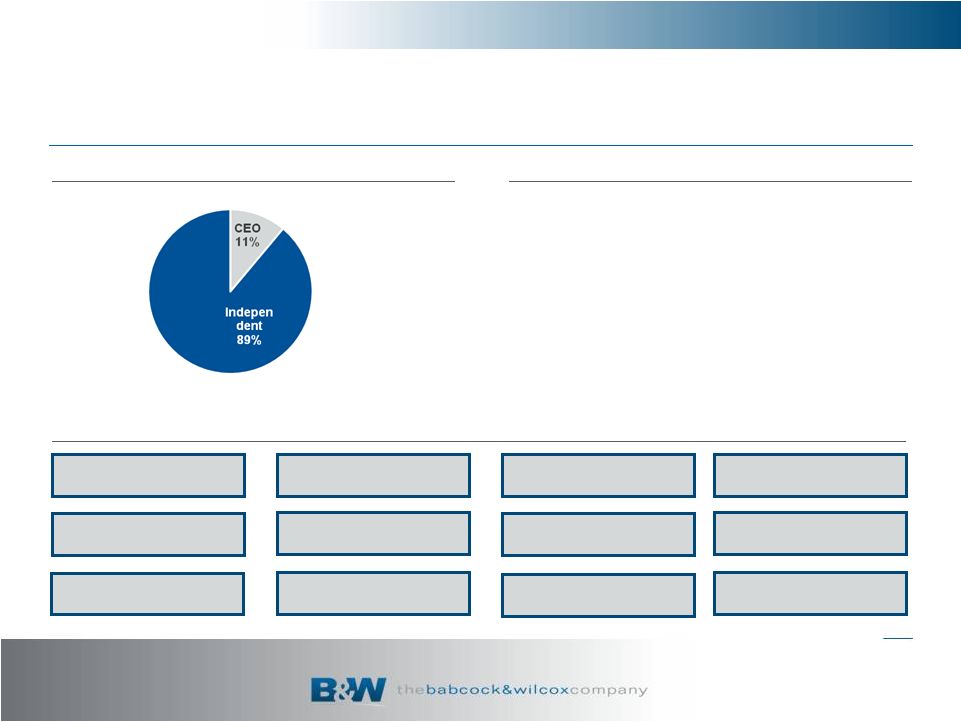
© 2015 Babcock & Wilcox Company. All Rights Reserved. © 2015 Babcock & Wilcox Company. All Rights Reserved. 13 © 2015 Babcock & Wilcox Company. All Rights Reserved. Thorough Process for Setting Compensation that Reflects Challenging Metrics and Rapidly Changing Market Approach to Setting Executive Compensation • Compensation Value – Broad Peer Group of 300 industrial companies • Compensation Structure – Custom Peer Group of 16 Companies Why We Choose Financial Metrics Compensation Levels are Benchmarked to Reasonably Sized Peers in Relevant Industries; Significantly Larger Peers Are Used for Benchmarking Pay Practices, And Not For Setting Pay Levels Total direct compensation for NEOs targeted at median of a broad survey of over 300 general industrial companies Data is adjusted using regression analysis based on revenues to account for company size Supports decisions around pay design and metrics Includes companies where we compete for talent in the engineering and construction, aerospace and defense, heavy electrical equipment and industrial machinery industries Reviewed peer group for 2014; two companies were removed due to higher revenue and/or market cap Operating Income Overall profitability of enterprise Aligned with share price movement Maximum utilization of company assets Commonly used performance metric Correlation to stock price Return on Invested Capital Cumulative Earnings per Share Total Shareholder Return Prevalent performance measure Increases alignment with shareholders Responsive to shareholder input on metric selection Metrics and process for setting goals are benchmarked against peer group practices Metrics Benchmarked to Industry Peers |