UNITED STATES
SECURITIES AND EXCHANGE COMMISSION
Washington, D.C. 20549
FORM 10-K
(Mark One)
|
| | |
| R | | ANNUAL REPORT PURSUANT TO SECTION 13 OR 15(d) OF THE SECURITIES EXCHANGE ACT OF 1934 |
For the fiscal year ended December 31, 2012
OR
|
| | |
| £ | | TRANSITION REPORT PURSUANT TO SECTION 13 OR 15(d) OF THE SECURITIES EXCHANGE ACT OF 1934 |
For the transition period from to
Commission file number 001-34737
VIEWPOINT FINANCIAL GROUP, INC.
(Exact name of registrant as specified in its charter)
|
| | |
| Maryland | | 27-2176993 |
| (State or other jurisdiction of incorporation or organization) | | (I.R.S. Employer Identification No.) |
| | | |
1309 W. 15th Street, Plano, Texas | | 75075 |
| (Address of Principal Executive Offices) | | (Zip Code) |
Registrant’s telephone number, including area code: (972) 578-5000
Securities registered pursuant to Section 12(b) of the Act:
|
| | |
| | | Name of Each Exchange on Which |
| Title of Each Class | | Registered |
| Common Stock, par value $0.01 per share | | Nasdaq Global Select Market |
Securities registered pursuant to Section 12(g) of the Act: None
Indicate by check mark if the registrant is a well-known seasoned issuer, as defined in Rule 405 of the Securities Act. Yes o No þ
Indicate by check mark if the registrant is not required to file reports pursuant to Section 13 or Section 15(d) of the Act. Yes o No þ
Indicate by check mark whether the registrant (1) has filed all reports required to be filed by Section 13 or 15(d) of the Securities Exchange Act of 1934 during the preceding 12 months (or for such shorter period that the registrant was required to file such reports) and (2) has been subject to such filing requirements for the past 90 days. Yes R No £
Indicate by check mark whether the registrant has submitted electronically and posted on its corporate Web site, if any, every Interactive Data File required to be submitted and posted pursuant to Rule 405 of Regulation S-T during the preceding 12 months (or for such shorter period that the registrant was required to submit and post such files). Yes R No £
Indicate by check mark if disclosure of delinquent filers pursuant to Item 405 of Regulation S-K is not contained herein, and will not be contained, to the best of registrant’s knowledge, in definitive proxy or information statement incorporated by reference in Part III of this Form 10-K or any amendment to this Form 10-K. R
Indicate by check mark whether the registrant is a large accelerated filer, an accelerated filer, a non-accelerated filer, or a smaller reporting company. See the definitions of “large accelerated filer,” “accelerated filer” and “smaller reporting company” in Rule 12b-2 of the Exchange Act. (Check one):
|
| | | | | | |
Large accelerated filer £ | | Accelerated filer R | | Non-accelerated filer £ | | Smaller reporting company £ |
| | | | | (Do not check if a smaller reporting company) | | |
Indicate by check mark whether the registrant is a shell company (as defined in Rule 12b-2 of the Act). Yes £ No R
The aggregate market value of the voting and non-voting common equity held by nonaffiliates of the Registrant was $602.0 million as of June 30, 2012, the last business day of the Registrant’s most recently completed second fiscal quarter. Solely for the purpose of this computation, it has been assumed that executive officers and directors of the Registrant are “affiliates”.
There were issued and outstanding 39,612,911 shares of the Registrant’s common stock as of February 19, 2013.
DOCUMENTS INCORPORATED BY REFERENCE:
|
| | |
| Document | | Part of Form 10-K |
| Portions of the definitive Proxy Statement to be used in conjunction with the Registrant’s Annual Meeting of Shareholders. | | Part III |
| | | |
| | | |
VIEWPOINT FINANCIAL GROUP, INC.
FORM 10-K
December 31, 2012
INDEX
|
| |
| | Page |
| | |
| |
| | |
| |
| | |
| |
| | |
| |
| | |
| |
| | |
| |
| | |
Item 4 Mine Safety Disclosures | |
| | |
| |
| | |
| |
| | |
| |
| | |
| |
| | |
| |
| | |
| |
| | |
| |
| | |
| |
| | |
| |
| | |
| |
| | |
| |
| | |
| |
| | |
| |
| | |
| |
| | |
| |
| | |
| |
| | |
| |
| | |
| |
| | |
PART I
Special Note Regarding Forward-Looking Statements
When used in filings by ViewPoint Financial Group, Inc. (the “Company,” “we,” or “our” in these financial statements) with the Securities and Exchange Commission (the “SEC”) in the Company's press releases or other public or shareholder communications, and in oral statements made with the approval of an authorized executive officer, the words or phrases “will likely result,” “are expected to,” “will continue,” “is anticipated,” “estimate,” “project,” “intends” or similar expressions are intended to identify “forward-looking statements” within the meaning of the Private Securities Litigation Reform Act of 1995. Such statements are subject to certain risks and uncertainties, including, among other things: changes in economic conditions; legislative changes; changes in policies by regulatory agencies; fluctuations in interest rates; the risks of lending and investing activities, including changes in the level and direction of loan delinquencies and write-offs and changes in estimates of the adequacy of the allowance for loan losses; the Company's ability to access cost-effective funding; fluctuations in real estate values and both residential and commercial real estate market conditions; demand for loans and deposits in the Company's market area; the industry-wide decline in mortgage production; competition; changes in management's business strategies; our ability to successfully integrate any assets, liabilities, customers, systems and management personnel we have acquired or may acquire into our operations and our ability to realize related revenue synergies and cost savings within expected time frames and any goodwill charges related thereto; and other factors set forth under Risk Factors in the Company's Form 10-K that could cause actual results to differ materially from historical earnings and those presently anticipated or projected. The factors listed above could materially affect the Company's financial performance and could cause the Company's actual results for future periods to differ materially from any opinions or statements expressed with respect to future periods in any current statements.
The Company does not undertake - and specifically declines any obligation - to publicly release the result of any revisions that may be made to any forward-looking statements to reflect events or circumstances occurring after the date of such statements.
General
The Company, a Maryland corporation, is a full stock holding company for its wholly owned subsidiary, ViewPoint Bank, National Association (the “Bank”).
On April 2, 2012, the Company completed its acquisition of Highlands Bancshares, Inc. (“Highlands”), parent company of The First National Bank of Jacksboro, which operated in Dallas under the name Highlands Bank (the "Highlands acquisition"). This was a strategic, in-market acquisition to provide growth opportunities in North Texas. As part of the acquisition, Highlands President and CEO Kevin Hanigan joined the Company and the Bank as president and chief executive officer. He also was appointed to the Company's and the Bank's Board of Directors, along with Highlands board member Bruce Hunt. In this stock-for-stock transaction, Highlands' shareholders received 0.6636 shares of the Company's common stock in exchange for each share of Highlands' common stock. As a result, the Company issued 5,513,061 common shares with an acquisition date fair value of total consideration paid of $86.1 million, based on the Company's closing stock price of $15.62 on April 2, 2012 including an insignificant amount of cash paid in lieu of fractional shares.
On June 5, 2012, the Bank and ViewPoint Bankers Mortgage, Inc. (doing business as ViewPoint Mortgage) ("VPM"), our wholly owned mortgage banking subsidiary, entered into a definitive agreement (the “Agreement”) with Highlands Residential Mortgage, Ltd. (no relation to Highlands) (“HRM”) to sell substantially all of the assets of VPM to HRM, subject to certain closing conditions the "VPM sale"). The terms of the Agreement provided for HRM to, subject to certain conditions contained in the Agreement, (i) purchase VPM's loan pipeline and all of VPM's existing construction loan portfolio, together with certain furniture, fixtures and equipment, (ii) assume substantially all of VPM's loan production office leases and its equipment leases, (iii) hire no less than 95% of the current VPM employees and satisfactorily release VPM from certain employment contracts, and (iv) make additional earn out payments to VPM. Following completion of the sale, the Agreement provided an opportunity for the Bank to partner with HRM to continue providing the Bank's customers with residential mortgage services. The transaction closed in the third quarter of 2012.
Unless the context otherwise requires, references in this document to the “Company” refer to ViewPoint Financial Group, Inc. and its predecessor, ViewPoint Financial Group, a United States corporation, and references to the “Bank” refer to ViewPoint Bank, N.A. References to “we,” “us,” and “our” means ViewPoint Financial Group, Inc. or ViewPoint Bank, N.A. , unless the context otherwise requires.
The Company and the Bank were examined and regulated by the Office of Thrift Supervision (“OTS”), its primary federal regulator until July 2011, when regulatory oversight of the Company transferred to the Board of Governors of the Federal Reserve System ("FRB"), and regulatory oversight of the Bank transferred to the thrift division of the Office of the Comptroller of the Currency (“OCC”). On December 19, 2011, the Bank converted its charter from a federal thrift charter to a national banking charter, with regulatory oversight by the OCC and certain back-up oversight by the Federal Deposit Insurance Corporation (“FDIC”). The Bank is required to have certain reserves and stock set by the FRB and is a member of the Federal Home Loan Bank of Dallas, which is one of the 12 regional banks in the Federal Home Loan Bank (“FHLB”) System.
Business Strategies
Our principal business consists of attracting retail deposits from the general public and the business community and investing those funds, along with borrowed funds, in commercial real estate loans, secured and unsecured commercial and industrial loans, as well as permanent loans secured by first and second mortgages on owner-occupied, one- to four-family residences and consumer loans. Additionally, the Warehouse Purchase Program allows mortgage banking company customers to close one- to four-family real estate loans in their own name and manage its cash flow needs until the loans are sold to investors. We also offer brokerage services for the purchase and sale of non-deposit investment and insurance products through a third party brokerage arrangement. Our operating revenues are derived principally from interest earned on interest-earning assets including loans and investment securities and service charges and fees on deposits and other account services. Our primary sources of funds are deposits, FHLB advances and other borrowings, and payments received on loans and securities. We offer a variety of deposit accounts that provide a wide range of interest rates and terms, generally including savings, money market, term certificate and demand accounts.
Our principal objective is to remain an independent, community-oriented financial institution, providing outstanding service and innovative products to customers in our primary market area. Our Board of Directors adopted a strategy designed to maintain growth and profitability, a strong capital position and high asset quality. This strategy primarily involves:
| |
| • | Continuing the growth and diversification of our loan portfolio |
Over the past year, we have continued to successfully transition our lending activities from a predominantly consumer driven model to become a more diversified organization by emphasizing four key business line initiatives: 1.) Warehouse Purchase Program, through which we provide funding for unaffiliated mortgage originators through our purchase of participation interests in mortgage loans held for sale in the secondary market, 2.) commercial real estate lending, 3.) consumer banking and 4.) commercial and industrial lending. During 2012, a renewed focus was initiated in the growth of the commercial and industrial lending portfolio, as experienced lenders from our market area were added to the organization resulting from the Highlands acquisition, and additional new lenders were hired in an effort to drive the business forward. This effort resulted in the improved diversification of the overall loan portfolio, and improved the sensitivity of our interest-earning assets with shorter term commercial loans that are often priced against some variable interest rate index. Our added Treasury Management emphasis provides depository products and services to our commercial customers and serves as a catalyst for deposit growth.
| |
| • | Maintaining our historically high asset quality |
We believe that strong asset quality is a key to long-term financial success. We seek to maintain high asset quality and moderate credit risk by strictly adhering to our strong lending policies, and to maintain low charge-off ratios and low levels of non-performing assets. We intend to continue our efforts to grow and diversify our loan portfolio and to adhere to sound credit management principles.
| |
| • | Focusing on the total customer relationship |
We offer customers a wide range of products and services that provide us with diversification of revenue sources and solidify customer relationships. We focus on providing our customers with excellent customer service and creative financial solutions. It is our objective to know our customers and their businesses better than our competition, provide effective ideas and solutions for their financial needs, and execute the delivery of these products and services in an efficient and professional manner.
| |
| • | Continuing community banking emphasis |
We will continue to operate as a community banking organization focused on meeting the needs of consumers and small-to-mid sized businesses in our market areas. We will do so by providing a high degree of service and responsiveness combined with a variety of products and services. In addition to developing deep relationships with our existing customers, we intend to expand our business with potential new customers by leveraging our well-established involvement in the communities that we serve. We are very focused on supporting the communities in which we do business, and in exhibiting exceptional corporate citizenship.
Market Areas
We are headquartered in Plano, Texas, and have 31 full-service branches, 29 located in our primary market area, the Dallas/Fort Worth Metroplex, and two First National Bank of Jacksboro locations in Jack and Wise Counties in Texas. We also have one commercial loan production office located in Houston. Based on the most recent branch deposit data provided by the FDIC (as of June 2012), we ranked fourth in deposit share in Collin County, with 8.46% of total deposits, and ninth in the Dallas/Fort Worth Metropolitan Statistical Area, with 1.24% of total deposits.
Our market area includes a diverse population of management, professional and sales personnel, office employees, manufacturing and transportation workers, service industry workers, government employees and self-employed individuals. The population includes a skilled work force with a wide range of education levels and ethnic backgrounds. Major employment sectors include financial services, manufacturing, education, health and social services, retail trades, transportation and professional services. There were 18 companies headquartered in the Dallas/Fort Worth Metroplex included on the Fortune 500 list for 2012, giving our market area the sixth-highest concentration of such companies among U.S. metropolitan areas. Large employers headquartered in our market area include Exxon Mobil, AT&T, Kimberly-Clark, Dr. Pepper/Snapple, American Airlines, Texas Instruments, J.C. Penney, Dean Foods and Southwest Airlines.
For December 2012, the Dallas/Fort Worth Metroplex reported an unemployment rate (not seasonally adjusted) of 5.9%, compared to the national average of 7.6% (source is Bureau of Labor Statistics Local Area Unemployment Statistics Unemployment Rates for Metropolitan Areas, using the Dallas-Fort Worth-Arlington, Texas Metropolitan Statistical Area.)
Lending Activities
The following table presents information concerning the composition of our loan portfolio in dollar amounts and in percentages (before deductions for deferred fees and discounts and allowances for losses) as of the dates indicated.
|
| | | | | | | | | | | | | | | | | | | | | | | | | | | | | | | | | | |
| | December 31, |
| | 2012 | | 2011 | | 2010 | | 2009 | | 2008 |
| | Amount | | Percent | | Amount | | Percent | | Amount | | Percent | | Amount | | Percent | | Amount | | Percent |
| | (Dollars in thousands) |
| Commercial real estate | $ | 839,908 |
| | 49.68 | % | | $ | 585,328 |
| | 47.66 | % | | $ | 479,640 |
| | 43.33 | % | | $ | 454,483 |
| | 40.52 | % | | $ | 436,483 |
| | 34.92 | % |
| | | | | | | | | | | | | | | | | | | | |
| Commercial and industrial: | | | | | | | | | | | | | | | | | | | |
| Commercial | 245,799 |
| | 14.54 |
| | 54,479 |
| | 4.44 |
| | 39,279 |
| | 3.54 |
| | 27,983 |
| | 2.49 |
| | 18,574 |
| | 1.49 |
|
| Warehouse lines of credit | 32,726 |
| | 1.94 |
| | 16,141 |
| | 1.31 |
| | — |
| | — |
| | — |
| | — |
| | 53,271 |
| | 4.26 |
|
| Total commercial and industrial | 278,525 |
| | 16.48 |
| | 70,620 |
| | 5.75 |
| | 39,279 |
| | 3.54 |
| | 27,983 |
| | 2.49 |
| | 71,845 |
| | 5.75 |
|
| | | | | | | | | | | | | | | | | | | | |
| Consumer: | |
| | | | | | | | | | | | | | | | | | |
| One- to four- family real estate | 378,255 |
| | 22.37 |
| | 379,944 |
| | 30.94 |
| | 381,584 |
| | 34.47 |
| | 406,268 |
| | 36.22 |
| | 476,412 |
| | 38.11 |
|
| Home equity/home improvement | 135,001 |
| | 7.98 |
| | 140,966 |
| | 11.48 |
| | 139,165 |
| | 12.57 |
| | 138,000 |
| | 12.30 |
| | 124,073 |
| | 9.93 |
|
| Other consumer | 59,080 |
| | 3.49 |
| | 51,170 |
| | 4.17 |
| | 67,366 |
| | 6.09 |
| | 94,895 |
| | 8.47 |
| | 141,169 |
| | 11.29 |
|
| Total consumer | 572,336 |
| | 33.84 |
| | 572,080 |
| | 46.59 |
| | 588,115 |
| | 53.13 |
| | 639,163 |
| | 56.99 |
| | 741,654 |
| | 59.33 |
|
| | | | | | | | | | | | | | | | | | | | |
| Total loans held for investment, gross | 1,690,769 |
| | 100.00 | % | | 1,228,028 |
| | 100.00 | % | | 1,107,034 |
| | 100.00 | % | | 1,121,629 |
| | 100.00 | % | | 1,249,982 |
| | 100.00 | % |
| | | | | | | | | | | | | | | | | | | | |
| Net of: | | | | | | | | | | | | | | | | | | | |
| Deferred fees and discounts, net | 486 |
| | | | 516 |
| | | | (73 | ) | | | | (1,160 | ) | | | | (1,206 | ) | | |
| Allowance for loan losses | (18,051 | ) | | | | (17,487 | ) | | | | (14,847 | ) | | | | (12,310 | ) | | | | (9,068 | ) | | |
| Total loans held for investment, net | $ | 1,673,204 |
| | | | $ | 1,211,057 |
| | | | $ | 1,092,114 |
| | | | $ | 1,108,159 |
| | | | $ | 1,239,708 |
| | |
| | | | | | | | | | | | | | | | | | | | |
| Loans held for sale | $ | 1,060,720 |
| | | | $ | 834,352 |
| | | | $ | 491,985 |
| | | | $ | 341,431 |
| | | | $ | 159,884 |
| | |
The following table shows the composition of our loan portfolio by fixed and adjustable rate as of the dates indicated.
|
| | | | | | | | | | | | | | | | | | | | | | | | | | | | | | | | | | |
| | December 31, |
| | 2012 | | 2011 | | 2010 | | 2009 | | 2008 |
| | Amount | | Percent | | Amount | | Percent | | Amount | | Percent | | Amount | | Percent | | Amount | | Percent |
| | (Dollars in thousands) |
| Fixed rate loans: | | | | | | | | | | | | | | | | | | | |
| Commercial real estate | $ | 448,735 |
| | 26.54 | % | | $ | 309,064 |
| | 25.17 | % | | $ | 299,849 |
| | 27.09 | % | | $ | 284,741 |
| | 25.39 | % | | $ | 271,830 |
| | 21.75 | % |
| Commercial and industrial | 46,805 |
| | 2.77 |
| | 25,408 |
| | 2.07 |
| | 26,744 |
| | 2.42 |
| | 10,901 |
| | 0.97 |
| | 10,213 |
| | 0.82 |
|
| Consumer: | | | | | | | | | | | | | | | | | | | |
| One- to four- family real estate | 281,727 |
| | 16.66 |
| | 283,200 |
| | 23.06 |
| | 276,260 |
| | 24.96 |
| | 282,948 |
| | 25.23 |
| | 352,369 |
| | 28.19 |
|
| Home equity/home improvement | 103,964 |
| | 6.15 |
| | 107,586 |
| | 8.76 |
| | 103,760 |
| | 9.37 |
| | 105,230 |
| | 9.38 |
| | 107,176 |
| | 8.57 |
|
| Other consumer | 49,035 |
| | 2.90 |
| | 40,549 |
| | 3.30 |
| | 50,229 |
| | 4.53 |
| | 76,102 |
| | 6.78 |
| | 120,564 |
| | 9.65 |
|
| Total consumer | 434,726 |
| | 25.71 |
| | 431,335 |
| | 35.12 |
| | 430,249 |
| | 38.86 |
| | 464,280 |
| | 41.39 |
| | 580,109 |
| | 46.41 |
|
| Total fixed rate loans | 930,266 |
| | 55.02 |
| | 765,807 |
| | 62.36 |
| | 756,842 |
| | 68.37 |
| | 759,922 |
| | 67.75 |
| | 862,152 |
| | 68.98 |
|
| Adjustable rate loans: | | | | | | | | | | | | | | | | | | | |
| Commercial real estate | 391,173 |
| | 23.14 |
| | 276,264 |
| | 22.50 |
| | 179,791 |
| | 16.24 |
| | 169,742 |
| | 15.14 |
| | 164,653 |
| | 13.17 |
|
Commercial and industrial 1 | 231,720 |
| | 13.71 |
| | 45,212 |
| | 3.68 |
| | 12,535 |
| | 1.13 |
| | 17,082 |
| | 1.52 |
| | 61,632 |
| | 4.93 |
|
| Consumer: | | | | | | | | | | | | | | | | | | | |
| One- to four- family real estate | 96,528 |
| | 5.71 |
| | 96,744 |
| | 7.87 |
| | 105,324 |
| | 9.51 |
| | 123,320 |
| | 10.99 |
| | 124,043 |
| | 9.92 |
|
| Home equity/home improvement | 31,037 |
| | 1.84 |
| | 33,380 |
| | 2.72 |
| | 35,405 |
| | 3.20 |
| | 32,770 |
| | 2.92 |
| | 16,897 |
| | 1.35 |
|
| Other consumer | 10,045 |
| | 0.58 |
| | 10,621 |
| | 0.87 |
| | 17,137 |
| | 1.55 |
| | 18,793 |
| | 1.68 |
| | 20,605 |
| | 1.65 |
|
| Total consumer | 137,610 |
| | 8.13 |
| | 140,745 |
| | 11.46 |
| | 157,866 |
| | 14.26 |
| | 174,883 |
| | 15.59 |
| | 161,545 |
| | 12.92 |
|
| Total adjustable rate loans | 760,503 |
| | 44.98 |
| | 462,221 |
| | 37.64 |
| | 350,192 |
| | 31.63 |
| | 361,707 |
| | 32.25 |
| | 387,830 |
| | 31.02 |
|
| Total loans held for investment, gross | 1,690,769 |
| | 100.00 | % | | 1,228,028 |
| | 100.00 | % | | 1,107,034 |
| | 100.00 | % | | 1,121,629 |
| | 100.00 | % | | 1,249,982 |
| | 100.00 | % |
| Net of: | | | | | | | | | | | | | | | | | | | |
| Deferred fees and discounts, net | 486 |
| | | | 516 |
| | | | (73 | ) | | | | (1,160 | ) | | | | (1,206 | ) | | |
| Allowance for loan losses | (18,051 | ) | | | | (17,487 | ) | | | | (14,847 | ) | | | | (12,310 | ) | | | | (9,068 | ) | | |
| Total loans held for investment, net | $1,673,204 | | | | $ | 1,211,057 |
| | | | $ | 1,092,114 |
| | | | $ | 1,108,159 |
| | | | $ | 1,239,708 |
| | |
| | | | | | | | | | | | | | | | | | | | |
| Loans held for sale | $ | 1,060,720 |
| | | | $ | 834,352 |
| | | | $ | 491,985 |
| | | | $ | 341,431 |
| | | | $ | 159,884 |
| | |
1 Includes warehouse lines of credit, which are classified as secured commercial lines of credit.
The following schedule illustrates the contractual maturity of our loan portfolio (not including loans held for sale) at December 31, 2012. Loans which have adjustable or renegotiable interest rates are shown as maturing in the period during which the contract is due. Purchased credit impaired loans are reported at their contractual interest rate. The schedule does not reflect the effects of possible prepayments or enforcement of due-on-sale clauses.
|
| | | | | | | | | | | | | | | | | | | | | | | | | | | | | | | | | | | |
| | | Commercial Real Estate | | Commercial and Industrial | | Consumer - Real Estate | | Consumer - Other | | Total Loans Held For Investment |
| Due During Years Ending December 31, | | Amount | | Weighted Average Rate | | Amount | | Weighted Average Rate | | Amount | | Weighted Average Rate | | Amount | | Weighted Average Rate | | Amount | | Weighted Average Rate |
| | | (Dollars in thousands) |
2013 1 | | $ | 48,325 |
| | 6.54 | % | | $ | 157,434 |
| | 4.27 | % | | $ | 9,002 |
| | 6.15 | % | | $ | 13,636 |
| | 8.41 | % | | $ | 228,397 |
| | 5.07 | % |
| 2014 | | 38,762 |
| | 5.82 |
| | 53,044 |
| | 4.33 |
| | 8,037 |
| | 6.06 |
| | 7,751 |
| | 6.82 |
| | 107,594 |
| | 5.17 |
|
| 2015 | | 193,209 |
| | 5.26 |
| | 21,558 |
| | 5.17 |
| | 4,916 |
| | 6.41 |
| | 10,649 |
| | 6.39 |
| | 230,332 |
| | 5.33 |
|
| 2016-2017 | | 242,221 |
| | 5.75 |
| | 40,767 |
| | 4.94 |
| | 10,324 |
| | 6.31 |
| | 23,384 |
| | 4.96 |
| | 316,696 |
| | 5.61 |
|
| 2018-2022 | | 296,609 |
| | 5.82 |
| | 5,086 |
| | 5.84 |
| | 45,709 |
| | 5.62 |
| | 2,882 |
| | 6.77 |
| | 350,286 |
| | 5.80 |
|
| 2023-2027 | | 16,376 |
| | 4.92 |
| | 636 |
| | 5.03 |
| | 135,534 |
| | 4.99 |
| | 778 |
| | 8.23 |
| | 153,324 |
| | 5.00 |
|
| 2028 and following | | 4,406 |
| | 5.72 |
| | — |
| | - | | 299,734 |
| | 5.36 |
| | — |
| | - | | 304,140 |
| | 5.37 |
|
| Total | | $ | 839,908 |
| | | | $ | 278,525 |
| | | | $ | 513,256 |
| | | | $ | 59,080 |
| | | | $ | 1,690,769 |
| | |
1 Includes demand loans, loans having no stated maturity and overdraft loans.
The total amount of loans due after December 31, 2013 which have fixed interest rates is $858.6 million, or 58.7%. The total amount of loans due after December 31, 2013 which have floating or adjustable interest rates is $603.8 million, or 41.3%.
Lending Authority. The Company's Chief Credit Officer can approve secured loans up to $2 million and unsecured loans up to $500,000, while the Company's Chief Executive Officer can approve loans up to $3 million, either secured or unsecured. The Management Loan Committee has authority to approve Warehouse Purchase Program maximum aggregate outstanding balances up to $20 million, commercial real estate loans up to $12.5 million, and commercial & industrial loans up to $5 million. Loans over these amounts must be approved the Bank's Board Loan Committee.
At December 31, 2012, under federal regulation, the maximum amount we could lend to any one borrower and borrower's related entities was approximately $60.7 million. Our five largest relationships, excluding Warehouse Purchase Program customers, consisted of 18 loans that totaled $152.2 million, or 9.0% of total loans held for investment, at December 31, 2012. The 18 loans making up this total were all secured commercial real estate projects, with property types primarily being retail and office in nature. The majority of project locations are in Texas, with primary and secondary market exposure. The largest relationship contains three loans totaling $55.3 million with both retail and office collateral. Of the $152.2 million to these five borrowers, none of the 18 loans are rated Criticized or Classified.
Commercial Real Estate Lending. The commercial real estate lending initiative began in 2003 with the Company purchasing participations from financial institutions on a variety of investor owned commercial projects. This business model evolved into what is ongoing today: direct relationships with primarily regional owners of commercial retail and office projects occupied by local, regional, and national tenants. Although the Company has financed other project types (multifamily, industrial, mixed use, etc.) these other project types do not constitute a significant concentration of the commercial real estate portfolio. 93% of these projects are located in Texas, with primary, secondary, and some tertiary markets represented.
The Company's commercial real estate lending business model is relatively unique and its success has been tested over many years. The primary focus of the analysis and repayment reliance of the loan is almost exclusively the commercial project itself, as opposed to a combination of project and sponsorship reliance. By choosing this project reliance focus, the Company makes sure the project has ample equity at loan inception rather than relying on it developing in the future when sponsorship liquidity might not equal project liquidity needs. Although most guaranty structures do not include guaranty of payment, the additional equity investment required at loan inception generally ensures that the project ownership is engaged and attentive to the project's ongoing success. Most guaranty structures include guarantees regarding fraud and misrepresentation. The Company also has a Chief Appraiser in house to help order, review, and approve appraisals, both commercial and residential.
The Company's reliance on loan structures that emphasize upfront equity rather than back-end guaranty of payment provides multiple benefits to the Company, most driven by the lower initial loan balance. For example,the lower loan balance typically drives the initial loan to value ratio of each project well below regulatory requirements for commercial projects. This lower ratio also provides a cushion in case appraised values drop as a result of reduced occupancy, reduced cash flow, or increased capitalization rates. The low loan balance also aids in achieving a higher debt yield ratio (net operating income to loan amount), and a higher debt service coverage ratio (net operating income to debt service requirement), both important metrics for the Company. Escrows for taxes and insurance are typically maintained for loans in this portfolio, as well as funds for tenant improvement or leasing commissions as anticipated. Regular financial information is gathered to stay apprised of the financial status of the project. Although a guaranty of payment is not utilized on these transactions, the Company does require annual statements on the sponsors in order to identify other projects likely to cause financial hardship to our borrower.
This portfolio also includes a smaller portion of commercial real estate loans to owner occupied businesses. These loans are typically characterized by higher loan to value ratios than our other commercial real estate loans but generally come with an unlimited guaranty of payment from the company owner(s). At December 31, 2012, the commercial real estate lending portfolio totaled $839.9 million.
Commercial and Industrial Lending. The establishment of the commercial and industrial lending group is the most recent Company lending initiative. With origins beginning in 2007, we initially offered secured term loan facilities to small business owners for equipment and rolling stock needs, with annual monitoring performed. As this business segment grew, the Company began making larger loans to larger borrowers and revolving lines of credit were added to the product offering. The portfolio in this business group increased with the acquisition of Highlands in April 2012, which resulted in the addition of a staff of experienced loan officers and a sizable commercial and industrial loan portfolio.
Our commercial and industrial borrowers are typically located within Texas, but often provide their products and services regionally or nationally. Loans are generally secured by a pledge on business assets such as accounts receivable, inventory, equipment, vehicles, etc., with the objective of reducing loan balances more quickly than the decline in useful life or value of the asset. The likelihood of loans being paid depends on the success of the business itself, and economic conditions can play a large role in the long term viability of a company. We generally obtain personal guarantees for privately held companies.
Financial information on these borrowers is required at regular intervals, with company information required on monthly or quarterly terms and annual personal financial statements required on owner/guarantors. Covenants are included in loan structure with the most common being leverage, liquidity and debt service covenants. Leverage covenants generally include debt to tangible net worth or minimum tangible net worth, while liquidity covenants generally include minimum liquidity, minimum Earnings Before Interest, Taxes, Depreciation, and Amortizations (EBITDA), and minimum current ratio.
During 2012, the Company established lending relationships with two banks in an effort to obtain energy loans by way of participations purchased. The Company was successful in purchasing energy loans and accumulated commitments in excess of $70 million during the year. The Company obtains any required reserve valuations from an established third party engineering firm.
At December 31, 2012, the commercial and industrial lending portfolio totaled $245.8 million, including the energy loans referenced above.
Warehouse Purchase Program. The Warehouse Purchase Program, which the Company initiated in July 2008, allows unaffiliated mortgage originators to close one- to four-family real estate loans in their own name and manage its cash flow needs until the loans are sold to investors (the “Warehouse Purchase Program”). The Company purchases a 100% participation interest in the mortgage loans originated by our mortgage banking company customers, which are then held as one- to four- family mortgage loans held for sale on a short-term basis. The mortgage banking company has no obligation to offer and we have no obligation to purchase these participation interests. The mortgage banking company closes mortgage loans consistent with underwriting standards established by approved investors and once the loan closes, our participation interest is delivered by us to the investor selected by the originator and approved by the Company.
The mortgage banking company customers are located across the U.S. and originate loans primarily through traditional retail and/ or wholesale business models. These customers are strategically targeted for their experienced management teams and thoroughly analyzed to ensure long term and profitable business models. By using this approach the Company believes that this type of lending carries a lower risk profile than one- to four- family loans held for investment based on the short term nature of the held for sale exposure, combined with the additional strength of the mortgage originator sponsorship.
Warehouse Purchase Program maximum aggregate outstanding balances range in size from $10 million to $45 million, with the "house limit" set at $35 million. The maximum aggregate outstanding balances are priced using a combined base rate and a risk premium set for both product type (Prime, Jumbo, etc.) and age of the loan. The typical maximum aggregate outstanding balance includes the payment guaranty of company owners holding significant ownership positions, along with non-interest bearing pledged deposits in line with the maximum aggregate outstanding balance purchase limit. Typical covenants include minimum tangible net worth, maximum leverage and minimum liquidity. As loans age, the Company requires loan paydowns to reduce the Company's risk involving loans that are not purchased by investors on a timely basis.
At December 31, 2012, the Company had 43 mortgage banking company customers with maximum aggregate outstanding balances of $1.3 billion and an aggregate outstanding balance of $1.1 billion. The aggregate average outstanding balance during 2012 ($772 million) increased dramatically over the aggregate average outstanding balance during 2011($415 million) as the low interest rate environment kept volume levels high for both originators and investors. The average mortgage loan being purchased by the Company reflects a blend of both Conforming and Government loan characteristics, and confirms the Company's contention regarding a lower risk profile; average metrics include a loan to value (LTV) of 85%, an average credit score of 734, and an average loan size of $205,000.
One- to Four-Family Real Estate Lending. For the first seven months of 2012 prior to the VPM sale, we originated $201.3 million of one- to four- family mortgage loans through VPM. Of the $201.3 million in loans closed, $145.9 million were sold to outside investors, while the remaining $55.4 million were retained in the Company's portfolio. After the VPM sale in July 2012, the Company partnered with HRM to provide residential mortgage services to its customers through a referral program. The Company periodically purchases one- to four- family loans from HRM and other correspondents on both a servicing retained and servicing released basis. At December 31, 2012, our one- to four-family loan portfolio totaled $378.3 million.
Home Equity/Home Improvement Lending. Our consumer home equity/home improvement loans totaled $135.0 million at December 31, 2012. All of our home equity loans are secured by Texas real estate. Under Texas law, home equity borrowers are allowed to borrow a maximum of 80% (combined loan-to-value of the first lien, if any, plus the home equity loan) of the fair market value of their primary residence. The same 80% combined loan-to-value maximum applies to home equity lines of credit, with the home equity line further limited to 50% of the fair market value of the home. As a result, our home equity loans and home equity lines of credit have low loan-to-value ratios compared to similar loans in most other states. Home equity lines of credit are originated with an adjustable rate of interest based on the Wall Street Journal Prime (“Prime”) rate of interest plus a margin. Home equity lines of credit have up to a ten year draw period and amounts may be re-borrowed after payment at any time during the draw period. While the rate of interest continues to float, once the draw period has lapsed, the payment is amortized over a ten year period based on the loan balance at that time.
Other Consumer Lending. We offer a variety of secured and unsecured consumer loans, including new and used automobile loans, recreational vehicle loans and loans secured by savings deposits. We originate our consumer loans primarily in our market areas. At December 31, 2012, our other consumer loan portfolio totaled $59.1 million.
Loan Originations, Purchases, Sales, Repayments and Servicing
The Company attempts to meet the needs of the markets it serves by originating thoroughly analyzed and documented loans to both businesses and consumers. These loans typically involve a direct relationship with the borrower, owner(s), and management of the borrowing entity in an attempt to better identify borrower needs and better identify risks to the Company that must be mitigated in the loan structure. It is not unusual for a loan request to be so large as to exceed the Company's house limit for transaction size, or for the Company to have a concentration to a particular borrower or industry, such that a smaller loan size is preferred.
In these instances the Company will solicit one or more financial partners to take a portion of a transaction by way of purchasing a participation in the loan. The participation agreement outlines the relationship between the Company and the participant with regard to borrower access, loan servicing, loan documents, etc. The participant ends up having an indirect relationship with the borrower through the Company; essentially becoming a “silent partner” in the transaction. The participant's transactional involvement is typically limited to only that provided by the Company as “agent” in the transaction, and the participation interest is sold without recourse.
When a participation arrangement is unacceptable to the financial partner and a direct relationship with the borrower is the only structure acceptable, a syndication arrangement is often formed. In a syndication arrangement the financial partner has a direct relationship with the borrower and has its own documents, with terms that mirror those of the agent bank. Just like in a participation, the financial partner shares pro-rata in collateral, but because syndication partners are essentially equal in rights and responsibilities there is usually a designated partner responsible for administering the flow of funds and information between the parties. The Company has entered into the sale of both participations and syndications from warehouse, commercial real estate, and commercial and industrial borrowers in an attempt to meet our borrower's needs and stay within our own risk tolerances.
The Company has also entered into the purchase of both participation and syndication transactions as a means of assisting our financial partners who may have encountered excess loan exposure to their own borrowers. The rights and remedies of these purchases are essentially the same as outlined under the sale of a participation or syndication. A participation purchased would give the Company little to no access to our financial partner's borrower and we would have to accept the terms outlined and documents used for that borrower.
In 2012, the Company sold $19.5 million in participations and syndications and purchased $84.4 million in participations and syndications.
The following table shows the loan origination, purchase, sales and repayment activities (including loans held for sale) of the Company for the periods indicated.
|
| | | | | | | | | | | |
| | Year Ended December 31, |
| | 2012 | | 2011 | | 2010 |
| Originations by type: | (Dollars in thousands) |
| Commercial real estate | $ | 337,203 |
| | $ | 241,978 |
| | $ | 95,457 |
|
| Commercial and industrial | 148,685 |
| | 34,444 |
| | 25,379 |
|
| Consumer: | | | | | |
| One- to four- family real estate | 201,301 |
| | 367,184 |
| | 487,746 |
|
| Home equity/home improvement | 30,132 |
| | 34,614 |
| | 34,371 |
|
| Other consumer | 28,289 |
| | 22,459 |
| | 23,124 |
|
| Total consumer | 259,722 |
| | 424,257 |
| | 545,241 |
|
| Total loans originated | 745,610 |
| | 700,679 |
| | 666,077 |
|
| Purchases: | | | | | |
| Loans acquired through acquisition | 283,381 |
| | — |
| | — |
|
| Commercial and industrial | 84,383 |
| | — |
| | — |
|
| One- to four- family real estate¹ | 12,815,419 |
| | 8,062,531 |
| | 7,785,854 |
|
| Total loans purchased | 13,183,183 |
| | 8,062,531 |
| | 7,785,854 |
|
| Sales and Repayments: | | | | | |
| Commercial real estate | 3,000 |
| | 21,761 |
| | 7,452 |
|
| Commercial and industrial | 16,500 |
| | — |
| | — |
|
| One- to four- family real estate¹ | 12,529,385 |
| | 7,530,360 |
| | 7,726,951 |
|
| Other consumer | — |
| | 4,494 |
| | 1,344 |
|
| Total loans sold | 12,548,885 |
| | 7,556,615 |
| | 7,735,747 |
|
| Principal repayments | 690,799 |
| | 743,234 |
| | 580,225 |
|
| Total reductions | 13,239,684 |
| | 8,299,849 |
| | 8,315,972 |
|
| Decrease in other items, net | (594 | ) | | (2,051 | ) | | (1,450 | ) |
| Net increase | $ | 688,515 |
| | $ | 461,310 |
| | $ | 134,509 |
|
1 Includes Warehouse Purchase Program loans
Asset Quality
An accurate assessment of asset quality is essential to the long term health of the Company. Failure to identify deterioration in the Company's largest asset category, loans, could result in a shortfall of loan loss reserves needed for loans requiring charge off, and a charge against capital would be required. Credit analysts, loan officers, and lending managers are charged with not only proper risk analysis before loans are made, but also after they are booked and performing as expected. The goal is to identify the proper risk status and take actions appropriate to that risk. The Company has a risk rating system and a loss reserve methodology for each category of loan that includes Pass, Special Mention, Substandard, Doubtful, and Loss. The Company also regularly engages the services of third party firms to perform an independent assessment of individual loan risk grades and the processes for risk identification.
The Company has a variety of monitoring tools that serve as indicators of potential borrower weakness and early warning signs of possible risk grade deterioration. For example, a borrower's inability to provide ongoing loan documentation, maintain positive balances in deposit accounts, and make loan payments as scheduled are all signs of potential deterioration in a borrower's financial condition and the need for a review of the asset risk grade. Borrowers who are unable to meet original loan terms and require concessions on structure that the Company would not ordinarily grant are automatically downgraded and examined for the need of additional reserves to cover specific impairment. Loans are reviewed regularly to ensure that they are properly graded, structured to meet the borrower's cash flow capability, and considered in the Company's calculation of the allowance for loan losses.
Delinquent Loans. The following table sets forth our loan delinquencies by type, by amount and by percentage of type at December 31, 2012.
|
| | | | | | | | | | | | | | | | | | | | | | | | | | |
| | Loans Delinquent For: | | | | | | |
| | 30-89 Days | | 90 Days and Over | | Total Loans Delinquent 30 Days or More |
| | Number | | Amount | | Percent of Loan Category | | Number | | Amount | | Percent of Loan Category | | Number | | Amount | | Percent of Loan Category |
| | (Dollars in thousands) |
| Commercial real estate | 9 | | $ | 3,425 |
| | 0.41 | % | | 7 | | $ | 1,128 |
| | 0.13 | % | | 16 | | $ | 4,553 |
| | 0.54 | % |
Commercial and industrial 1 | 20 | | 2,596 |
| | 0.93 |
| | 18 | | 2,867 |
| | 1.03 |
| | 38 | | 5,463 |
| | 1.96 |
|
| | | | | | | | | | | | | | | | | | |
| Consumer: | | | | | | | | | |
| | | | | | | | |
| One- to four- family real estate | 79 | | 8,966 |
| | 2.37 |
| | 28 | | 3,845 |
| | 1.02 |
| | 107 | | 12,811 |
| | 3.39 |
|
| Home equity/home improvement | 32 | | 1,153 |
| | 0.85 |
| | 6 | | 624 |
| | 0.46 |
| | 38 | | 1,777 |
| | 1.32 |
|
| Other consumer | 77 | | 714 |
| | 1.21 |
| | 4 | | 49 |
| | 0.08 |
| | 81 | | 763 |
| | 1.29 |
|
| Total consumer | 188 | | 10,833 |
| | 1.89 |
| | 38 | | 4,518 |
| | 0.79 |
| | 226 | | 15,351 |
| | 2.68 |
|
| | | | | | | | | | | | | | | | | | |
| Total loans | 217 | | $ | 16,854 |
| | 1.00 | % | | 63 | | $ | 8,513 |
| | 0.50 | % | | 280 | | $ | 25,367 |
| | 1.50 | % |
1 There were no past due warehouse lines of credit for the period presented
Non-performing Assets. The table below sets forth the amounts and categories of non-performing assets in our loan portfolio. Loans are placed on nonaccrual status when the collection of principal and/or interest becomes doubtful or other factors involving the loan warrant placing the loan on nonaccrual status. Loans that are past due 30 days or greater are considered delinquent. Interest income on loans is discontinued at the time the loan is 90 days delinquent unless the loan is a purchased credit impaired loan that is performing according to its expected cash flows. Consumer loans are typically charged off no later than 120 days past due. Past due status is based on the contractual terms of the loan. In all cases, loans are placed on nonaccrual or charged-off at an earlier date if collection of principal or interest is considered doubtful. Nonaccrual loans include both smaller balance homogeneous loans that are collectively evaluated for impairment and individually classified impaired loans.
All interest accrued but not received for loans placed on nonaccrual is reversed against interest income. Interest received on such loans is accounted for on the cash-basis or cost-recovery method, until qualifying for return to accrual. Loans are returned to accrual status when all the principal and interest amounts contractually due are brought current and future payments are reasonably assured.
Troubled debt restructurings, which are accounted for under ASC 310-40, are loans which have renegotiated loan terms to assist borrowers who are unable to meet the original terms of their loans. Such modifications to loan terms may include a below market interest rate, a reduction in principal, or a longer term to maturity. All troubled debt restructurings are initially classified as nonaccruing loans, regardless of whether the loan was performing at the time it was restructured. Once a troubled debt restructuring has performed according to its modified terms for six months and the collection of future principal and interest under the revised terms is deemed probable, the Company places the loan back on accruing status. At December 31, 2012, the Company had $18.0 million in troubled debt restructurings, $13.8 million of which were classified as nonaccrual, including $11.2 million of commercial real estate loans. Of the $13.8 million in nonaccrual troubled debt restructurings, $11.5 million were not delinquent at December 31, 2012.
|
| | | | | | | | | | | | | | | | | | | |
| | Year Ended December 31, |
| | 2012 | | 2011 | | 2010 | | 2009 | | 2008 |
| | (Dollars in thousands) |
| Nonaccruing loans: | | | | | | | | | |
| Commercial real estate | $ | 13,609 |
| | $ | 16,076 |
| | $ | 9,812 |
| | $ | 4,682 |
| | $ | — |
|
Commercial and industrial 1 | 5,401 |
| | 430 |
| | 272 |
| | 44 |
| | 174 |
|
| Consumer: | |
| | | | | | | | |
| One- to four- family real estate | 6,854 |
| | 5,340 |
| | 5,938 |
| | 6,007 |
| | 1,290 |
|
| Home equity/home improvement | 1,077 |
| | 1,226 |
| | 1,306 |
| | 562 |
| | 306 |
|
| Other consumer | 262 |
| | 26 |
| | 300 |
| | 380 |
| | 447 |
|
| Total consumer | 8,193 |
| | 6,592 |
| | 7,544 |
| | 6,949 |
| | 2,043 |
|
| Total non-performing loans | 27,203 |
| | 23,098 |
| | 17,628 |
| | 11,675 |
| | 2,217 |
|
| | | | | | | | | | |
| Foreclosed assets: | | | | | | | | | |
| Commercial real estate | 662 |
| | 1,553 |
| | 2,219 |
| | 3,455 |
| | 843 |
|
| Consumer: | | | | | | | | | |
| One- to four- family real estate | 1,224 |
| | 733 |
| | 449 |
| | 462 |
| | 718 |
|
| Other consumer | 15 |
| | 7 |
| | 11 |
| | — |
| | 83 |
|
| Total consumer | 1,239 |
| | 740 |
| | 460 |
| | 462 |
| | 801 |
|
| Total foreclosed assets | 1,901 |
| | 2,293 |
| | 2,679 |
| | 3,917 |
| | 1,644 |
|
| Total non-performing assets | $ | 29,104 |
| | $ | 25,391 |
| | $ | 20,307 |
| | $ | 15,592 |
| | $ | 3,861 |
|
| | | | | | | | | | |
Total non-performing assets as a percentage of total assets 2 | 0.79 | % | | 0.80 | % | | 0.69 | % | | 0.66 | % | | 0.17 | % |
Total non-performing loans as a percentage of total loans 2 | 1.61 | % | | 1.88 | % | | 1.59 | % | | 1.04 | % | | 0.18 | % |
| | | | | | | | | | |
| Performing troubled debt restructurings: | | | | | | | | | |
| Commercial real estate | $ | 3,384 |
| | $ | 2,860 |
| | $ | 1,119 |
| | $ | — |
| | $ | 1,796 |
|
| Commercial and industrial | 207 |
| | 26 |
| | — |
| | 79 |
| | — |
|
| One- to four- family real estate | 509 |
| | 136 |
| | 143 |
| | 343 |
| | 93 |
|
| Home equity/home improvement | 49 |
| | 107 |
| | — |
| | 113 |
| | 67 |
|
| Other consumer | 67 |
| | 142 |
| | 26 |
| | 443 |
| | 572 |
|
| Total | $ | 4,216 |
| | $ | 3,271 |
| | $ | 1,288 |
| | $ | 978 |
| | $ | 2,528 |
|
1 There were no non-performing or troubled debt restructured warehouse lines of credit for the periods presented.
2 Purchased credit impaired (PCI) loans are not considered nonperforming loans, and accordingly, are not included in the non-performing loans to total loans ratio as a numerator, but are included in total loans reflected in the denominator. The result is a downward trend in the ratio when compared to prior periods, assuming all other factors stay the same. Similarly, other asset quality ratios, such as the allowance for loan losses to total loans ratio will reflect a downward trend, assuming all other factors stay the same, due to the impact of PCI loans on the denominator with no corresponding impact in the numerator. At December 31, 2012, loans past due over 90 days that were still accruing interest totaled $593,000 and consisted entirely of PCI loans.
For the year ended December 31, 2012, gross interest income which would have been recorded had the non-accruing loans been current in accordance with their original terms throughout the entire year amounted to $1.4 million. The amount that was included in interest income on these loans for the year ended December 31, 2012 was $11,000.
At December 31, 2012, $31.4 million in loans were individually impaired; $4.5 million of the allowance for loan losses was allocated to impaired loans at period-end. A loan is impaired when it is probable, based on current information and events, that the Company will be unable to collect all contractual principal and interest payments due in accordance with the terms of the loan agreements. Troubled debt restructurings are also considered impaired. Impaired loans are measured on an individual basis for individually significant loans based on the present value of expected future cash flows discounted at the loan’s effective interest rate or, as a practical expedient, at the loan’s observable market price or the fair value of the collateral if the loan is collateral dependent. The amount of impairment, if any, and any subsequent changes are included in the allowance for loan losses as a specific loss reserve. Please see “Comparison of Financial Condition at December 31, 2012, and December 31, 2011 — Loans” contained in Item 7 of this report for more information.
Other Loans of Concern. The Company has other loans that are currently performing and do not meet the criteria for impairment, but where some concern exists. Deterioration on these loans may result in the future inclusion of these loans in the non-performing asset categories. These loans consist of residential and commercial real estate and commercial and industrial loans that are rated as “special mention,” meaning that these loans have potential weaknesses that deserve management’s close attention. These loans are not adversely classified according to regulatory classifications and do not expose the Company to sufficient risk to warrant adverse classification. These loans have been considered in management’s determination of our allowance for loan losses. Excluding the non-performing assets set forth in the table above, as of December 31, 2012, there was an aggregate of $20.8 million of these potential problem loans. Of the $20.8 million, three commercial real estate loans totaling $14.7 million were not delinquent at December 31, 2012, but are being monitored due to circumstances such as low occupancy rate, low debt service coverage or prior payment history problems.
Classified Assets. Loans and other assets, such as debt and equity securities, considered by management to be of lesser quality, are classified as “substandard,” “doubtful” or “loss.” An asset is considered “substandard” if it is inadequately protected by the current net worth and paying capacity of the obliger or of the collateral pledged, if any. “Substandard” assets include those characterized by the “distinct possibility” that the insured institution will sustain “some loss” if the deficiencies are not corrected. Assets classified as “doubtful” have all of the weaknesses of those classified “substandard,” with the added characteristic that the weaknesses present make “collection or liquidation in full,” on the basis of currently existing facts, conditions and values, “highly questionable and improbable.” Assets classified as “loss” are those considered “uncollectible” and of such little value that their continuance as assets without the establishment of a specific loss reserve is not warranted.
We regularly review the problem assets in our portfolio to determine the appropriate classification. The aggregate amount of classified assets at the dates indicated was as follows:
|
| | | | | | | |
| | At December 31, |
| | 2012 | | 2011 |
| | (Dollars in thousands) |
| Loss | $ | — |
| | $ | — |
|
| Doubtful | 5,334 |
| | 5,159 |
|
| Substandard | 50,351 |
| | 25,730 |
|
| Total classified loans | 55,685 |
| | 30,889 |
|
| Foreclosed assets | 1,901 |
| | 2,293 |
|
| Total classified assets | $ | 57,586 |
| | $ | 33,182 |
|
| | | | |
| Classified assets as a percentage of equity | 11.06 | % | | 8.17 | % |
| Classified assets as a percentage of assets | 1.57 |
| | 1.04 |
|
Classified loans increased by $24.8 million, to $55.7 million at December 31, 2012, from $30.9 million at December 31, 2011. This increase was primarily due to $23.5 million in classified loans acquired from Highlands.
Allowance for Loan Losses. We establish provisions for loan losses, which are charged to earnings, at a level required to reflect estimated credit losses in the loan portfolio. In evaluating the level of the allowance for loan losses, management considers historical loss experience, the types and amount of loans in the loan portfolio, adverse situations that may affect borrowers’ ability to repay, estimated value of any underlying collateral, prevailing economic conditions, and current factors.
For the general component of the allowance for loan losses, we stratify the loan portfolio into homogeneous groups of loans that possess similar loss potential characteristics and apply a loss ratio to these groups of loans to estimate the credit losses in the loan portfolio. We use both historical loss ratios and qualitative loss factors assigned to major loan collateral types to establish loss allocations. The historical loss ratio is generally defined as an average percentage of net annual loan losses to loans outstanding. Qualitative loss factors are based on management’s judgment of company-specific data and external economic indicators and how this information could impact the Company’s specific loan portfolios. The Allowance for Loan Loss Committee sets and adjusts qualitative loss factors by reviewing changes in loan composition and the seasonality of specific portfolios. The Committee also considers credit quality and trends relating to delinquency, non-performing and/or classified loans and bankruptcy within the Company’s loan portfolio when evaluating qualitative loss factors. Additionally, the Committee adjusts qualitative factors to account for the potential impact of external economic factors, including the unemployment rate, housing prices, vacancy rates and inventory levels specific to our primary market area.
For the specific component of the allowance for loan losses, commercial and industrial, one- to four-family and commercial real estate loans are individually analyzed for impairment when management has concerns about the borrower’s ability to repay. Loss estimates include the negative difference, if any, between the current fair value of the collateral or the estimated discounted cash flows and the loan amount due.
At December 31, 2012, our allowance for loan losses was $18.1 million, or 1.07% of the total loan portfolio. Assessing the allowance for loan losses is inherently subjective as it requires making material estimates, including the amount and timing of future cash flows expected to be received on impaired loans that may be susceptible to significant change. In the opinion of management, the allowance, when taken as a whole, reflects estimated credit losses in our loan portfolio. See Notes 1 and 6 of the Notes to Consolidated Financial Statements under Item 8 of this report.
The following table sets forth an analysis of our allowance for loan losses.
|
| | | | | | | | | | | | | | | | | | | |
| | Year Ended December 31, |
| | 2012 | | 2011 | | 2010 | | 2009 | | 2008 |
| | (Dollars in thousands) |
| Balance at beginning of period | $ | 17,487 |
| | $ | 14,847 |
| | $ | 12,310 |
| | $ | 9,068 |
| | $ | 6,165 |
|
| Charge-offs: | | | | | | | | | |
| Commercial real estate | 187 |
| | 15 |
| | 624 |
| | 835 |
| | 180 |
|
Commercial and industrial 1 | 1,178 |
| | 470 |
| | 638 |
| | 720 |
| | 453 |
|
| Consumer: | | | | | | | | | |
| One- to four- family | 515 |
| | 238 |
| | 279 |
| | 455 |
| | 145 |
|
| Home equity/home improvement | 283 |
| | 249 |
| | 123 |
| | 59 |
| | 60 |
|
| Other consumer | 1,039 |
| | 850 |
| | 1,330 |
| | 2,926 |
| | 3,188 |
|
| Total consumer | 1,837 |
| | 1,337 |
| | 1,732 |
| | 3,440 |
| | 3,393 |
|
| Total charge-offs | 3,202 |
| | 1,822 |
| | 2,994 |
| | 4,995 |
| | 4,026 |
|
| Recoveries: | | | | | | | | | |
| Commercial real estate | — |
| | 29 |
| | — |
| | — |
| | — |
|
Commercial and industrial 1 | 114 |
| | 38 |
| | 67 |
| | 37 |
| | 22 |
|
| Consumer: | | | | | | | | | |
| One- to four- family | 42 |
| | 30 |
| | 15 |
| | 13 |
| | 13 |
|
| Home equity/home improvement | 28 |
| | 30 |
| | 4 |
| | 19 |
| | 4 |
|
| Other consumer | 443 |
| | 365 |
| | 326 |
| | 516 |
| | 719 |
|
| Total consumer | 513 |
| | 425 |
| | 345 |
| | 548 |
| | 736 |
|
| Total recoveries | 627 |
| | 492 |
| | 412 |
| | 585 |
| | 758 |
|
| Net charge-offs | 2,575 |
| | 1,330 |
| | 2,582 |
| | 4,410 |
| | 3,268 |
|
| Provision for loan losses | 3,139 |
| | 3,970 |
| | 5,119 |
| | 7,652 |
| | 6,171 |
|
| Balance at end of period | $ | 18,051 |
| | $ | 17,487 |
| | $ | 14,847 |
| | $ | 12,310 |
| | $ | 9,068 |
|
| Ratio of net charge-offs during the period to | | | | | | | | | |
| average loans outstanding during the period | 0.11 | % | | 0.09 | % | | 0.17 | % | | 0.31 | % | | 0.30 | % |
| Ratio of net charge-offs during the period to | | | | | | | | | |
| average non-performing assets | 9.45 | % | | 5.82 | % | | 14.38 | % | | 45.34 | % | | 96.08 | % |
Allowance as a percentage of non-performing loans2 | 66.36 | % | | 75.71 | % | | 84.22 | % | | 105.44 | % | | 409.02 | % |
Allowance as a percentage of total loans 2 | | | | | | | | | |
| (end of period) | 1.07 | % | | 1.42 | % | | 1.34 | % | | 1.10 | % | | 0.73 | % |
1 There was no net charge-off activity on warehouse lines of credit for the periods presented.
2 Purchased credit impaired (PCI) loans are not considered nonperforming loans, and accordingly, are not included in the non-performing loans to total loans ratio as a numerator, but are included in total loans reflected in the denominator. The result is a downward trend in the ratio when compared to prior periods, assuming all other factors stay the same. Similarly, other asset quality ratios, such as the allowance for loan losses to total loans ratio will reflect a downward trend, assuming all other factors stay the same, due to the impact of PCI loans on the denominator with no corresponding impact in the numerator. At December 31, 2012, loans past due over 90 days that were still accruing interest totaled $593,000 and consisted entirely of PCI loans.
The distribution of our allowance for losses on loans at the dates indicated is summarized below. In 2012, the balances in our commercial real estate and commercial and industrial portfolios increased, leading to growth in their respective allowance for loan loss categories. Conversely, as the one- to four-family real estate portfolio has declined, its respective loan loss reserve has decreased.
|
| | | | | | | | | | | | | | | | | | | | | | | | | | | | | | | | | | |
| | December 31, |
| | 2012 | | 2011 | | 2010 | | 2009 | | 2008 |
| | Allocated Allowance | | % (a) | | Allocated Allowance | | % (a) | | Allocated Allowance | | % (a) | | Allocated Allowance | | % (a) | | Allocated Allowance | | % (a) |
| | (Dollars in thousands) |
| Commercial real estate | $ | 11,304 |
| | 49.68 | % | | $ | 10,621 |
| | 47.66 | % | | $ | 7,949 |
| | 43.33 | % | | $ | 6,457 |
| | 40.52 | % | | $ | 4,175 |
| | 34.92 | % |
| Commercial | 2,541 |
| | 14.54 |
| | 2,074 |
| | 4.44 |
| | 1,652 |
| | 3.54 |
| | 1,382 |
| | 2.49 |
| | 862 |
| | 1.49 |
|
| Warehouse lines of credit | 33 |
| | 1.94 |
| | 16 |
| | 1.31 |
| | — |
| | — |
| | — |
| | — |
| | 477 |
| | 4.26 |
|
| Consumer: | | | | | | | | | | | | | | | | | | | |
| One- to four- family real estate | 2,356 |
| | 22.37 |
| | 3,027 |
| | 30.94 |
| | 3,307 |
| | 34.47 |
| | 2,379 |
| | 36.22 |
| | 1,675 |
| | 38.11 |
|
| Home equity/home improvement | 1,199 |
| | 7.98 |
| | 1,043 |
| | 11.48 |
| | 936 |
| | 12.57 |
| | 730 |
| | 12.30 |
| | 460 |
| | 9.93 |
|
| Other consumer | 618 |
| | 3.49 |
| | 706 |
| | 4.17 |
| | 1,003 |
| | 6.09 |
| | 1,362 |
| | 8.47 |
| | 1,419 |
| | 11.29 |
|
| Total | $ | 18,051 |
| | 100.00 | % | | $ | 17,487 |
| | 100.00 | % | | $ | 14,847 |
| | 100.00 | % | | $ | 12,310 |
| | 100.00 | % | | $ | 9,068 |
| | 100.00 | % |
(a) Loans outstanding as a percentage of total loans held for investment
Investment Activities
National banks have broad investment authority, except for corporate equity securities, which are generally limited to stock in subsidiaries, certain housing projects and bank service companies. Debt securities are categorized by law and OCC regulation into various types, with each type subject to different permitted investment levels calculated as percentages of capital, except for government and government-related obligations, which may be invested in without limit.
The Executive Vice President/Chief Financial Officer delegates the basic responsibility for the management of our investment portfolio to the Senior Vice President/Director of Treasury and Finance, subject to the direction and guidance of the Asset/Liability Management Committee. The Senior Vice President/Director of Treasury and Finance considers various factors when making decisions, including the marketability, duration, maturity and tax consequences of the proposed investment. The amount, mix, and maturity structure of investments will be affected by various market conditions, including the current and anticipated slope of the yield curve, the level of interest rates, the trend of new deposit inflows, and the anticipated demand for funds via deposit withdrawals and loan originations and purchases.
The general objectives of our investment portfolio are to provide liquidity when loan demand is high, to assist in maintaining earnings when loan demand is low and to optimize earnings while satisfactorily managing risk, including credit risk, reinvestment risk, liquidity risk and interest rate risk. Our investment securities currently consist primarily of agency collateralized mortgage obligations, agency mortgage-backed securities, Small Business Administration securitized loan pools consisting of only the U.S. government guaranteed portion, and Texas entity municipal bonds. These securities are of industry investment grade, possess acceptable credit risk and have an aggregate market value in excess of total amortized cost as of December 31, 2012. For more information, please see Note 5 of the Notes to Consolidated Financial Statements under Item 8 of this report and “Asset/Liability Management” under Item 7A of this report. The table below reflects the regulatory stock holdings at December 31, 2012 and associated dividends earned for the year then ended.
|
| | | |
| | December 31, 2012 |
| | (dollars in thousands) |
| Federal Reserve stock | $ | 7,005 |
|
| Federal Home Loan Bank stock | 38,020 |
|
| Total | $ | 45,025 |
|
| | |
| | Year ended |
| | December 31, 2012 |
| Federal Reserve cash dividends | $ | 441 |
|
| Federal Home Loan Bank stock dividends | 121 |
|
The following table sets forth the composition of our securities portfolio and other investments at the dates indicated. At December 31, 2012, our securities portfolio did not contain securities of any issuer with an aggregate book value in excess of 10% of our equity capital, excluding those issued by the United States Government or its agencies or United States GSEs.
|
| | | | | | | | | | | | | | | | | | | | | | | | |
| | | December 31, |
| | | 2012 | | 2011 | | 2010 |
| | | Amortized Cost | | Fair Value | | Amortized Cost | | Fair Value | | Amortized Cost | | Fair Value |
| | | (Dollars in thousands) |
| Available for sale: | | | | | | | | | | | | |
| SBA pools | | $ | 3,342 |
| | $ | 3,448 |
| | $ | 4,161 |
| | $ | 4,222 |
| | $ | 5,084 |
| | $ | 5,108 |
|
| Agency collateralized mortgage obligations | | 116,723 |
| | 117,486 |
| | 293,584 |
| | 294,670 |
| | 357,340 |
| | 357,892 |
|
| Agency mortgage-backed securities | | 164,023 |
| | 166,100 |
| | 133,907 |
| | 134,853 |
| | 351,385 |
| | 354,497 |
|
| Total available for sale | | 284,088 |
| | 287,034 |
| | 431,652 |
| | 433,745 |
| | 713,809 |
| | 717,497 |
|
| | | | | | | | | | | | | |
| Held to maturity: | | | | | | | | | | | | |
| US Government and agency bonds | | — |
| | — |
| | — |
| | — |
| | 9,997 |
| | 10,165 |
|
| Municipal bonds | | 50,456 |
| | 55,472 |
| | 50,473 |
| | 55,413 |
| | 50,488 |
| | 50,085 |
|
| Agency collateralized mortgage obligations | | 186,467 |
| | 189,423 |
| | 269,516 |
| | 274,010 |
| | 209,193 |
| | 206,280 |
|
| Agency mortgage-backed securities | | 123,631 |
| | 131,258 |
| | 180,499 |
| | 188,719 |
| | 162,841 |
| | 167,766 |
|
| Total held to maturity | | 360,554 |
| | 376,153 |
| | 500,488 |
| | 518,142 |
| | 432,519 |
| | 434,296 |
|
| | | | | | | | | | | | | |
| Total investment securities | | 644,642 |
| | 663,187 |
| | 932,140 |
| | 951,887 |
| | 1,146,328 |
| | 1,151,793 |
|
| | | | | | | | | | | | | |
| FHLB and Federal Reserve Bank stock | | 45,025 |
| | 45,025 |
| | 37,590 |
| | 37,590 |
| | 20,569 |
| | 20,569 |
|
| | | | | | | | | | | | | |
| Total securities | | $ | 689,667 |
| | $ | 708,212 |
| | $ | 969,730 |
| | $ | 989,477 |
| | $ | 1,166,897 |
| | $ | 1,172,362 |
|
The composition and contractual maturities of the investment securities portfolio as of December 31, 2012, excluding FRB stock and FHLB stock, are indicated in the following table. However, it is expected that investment securities with a prepayment option will generally repay their principal in full prior to contractual maturity. Prepayment options exist for the SBA pools, agency collateralized mortgage obligations and agency mortgage-backed securities. In addition, the municipal bonds in the “over 10 years” category are callable between 2017 and 2020. The weighted average yield is based on amortized cost.
|
| | | | | | | | | | | | | | | | | | | | | | | | | | | | | | | | | | | | | | |
| | | | | | | | | | | | | | | | | | | | | | |
| | 1 year or less | | 1 to 5 years | | 5 to 10 years | | After 10 years | | Total Securities |
| | Amortized Cost | | Weighted Average Yield | | Amortized Cost | | Weighted Average Yield | | Amortized Cost | | Weighted Average Yield | | Amortized Cost | | Weighted Average Yield | | Amortized Cost | | Weighted Average Yield | | Fair Value |
| | (Dollars in thousands) |
| Available for sale: | | | | | | | | | | | | | | | | | | | | | |
| SBA pools | $ | — |
| | — | % | | $ | 477 |
| | 2.71 | % | | $ | 2,865 |
| | 2.63 | % | | $ | — |
| | — | % | | $ | 3,342 |
| | 2.64 | % | | $ | 3,448 |
|
| Agency collateralized mortgage obligations | — |
| | — |
| | — |
| | — |
| | — |
| | — |
| | 116,723 |
| | 1.09 |
| | 116,723 |
| | 1.09 |
| | 117,486 |
|
| Agency mortgage-backed securities | — |
| | — |
| | — |
| | — |
| | 16,426 |
| | 1.04 |
| | 147,597 |
| | 1.58 |
| | 164,023 |
| | 1.53 |
| | 166,100 |
|
| Total available for sale | — |
| | — |
| | 477 |
| | 2.71 |
| | 19,291 |
| | 1.28 |
| | 264,320 |
| | 1.36 |
| | 284,088 |
| | 1.36 |
| | 287,034 |
|
| | | | | | | | | | | | | | | | | | | | | | |
| Held to maturity: | | | | | | | | | | | | | | | | | | | | | |
| Municipal bonds | 1,468 |
| | 3.47 |
| | 4,646 |
| | 3.57 |
| | 14,032 |
| | 3.80 |
| | 30,310 |
| | 3.76 |
| | 50,456 |
| | 3.75 |
| | 55,472 |
|
| Agency collateralized mortgage obligations | — |
| | — |
| | — |
| | — |
| | 19,976 |
| | 4.14 |
| | 166,491 |
| | 1.14 |
| | 186,467 |
| | 1.46 |
| | 189,423 |
|
| Agency mortgage-backed securities | — |
| | — |
| | — |
| | — |
| | 66,849 |
| | 3.55 |
| | 56,782 |
| | 2.93 |
| | 123,631 |
| | 3.26 |
| | 131,258 |
|
| Total held to maturity | 1,468 |
| | 3.47 |
| | 4,646 |
| | 3.57 |
| | 100,857 |
| | 3.70 |
| | 253,583 |
| | 1.86 |
| | 360,554 |
| | 2.40 |
| | 376,153 |
|
| | | | | | | | | | | | | | | | | | | | | | |
| Total investment securities | $ | 1,468 |
| | 3.47 | % | | $ | 5,123 |
| | 3.49 | % | | $ | 120,148 |
| | 3.31 | % | | $ | 517,903 |
| | 1.60 | % | | $ | 644,642 |
| | 1.94 | % | | $ | 663,187 |
|
Sources of Funds
General. Our sources of funds are deposits, borrowings, payments of principal and interest on loans and investments, sales of loans and funds provided from operations.
Deposits. The Company's deposit base is our primary source of funding and consists of core deposits from the communities served by our branch and office locations. We offer a variety of deposit accounts with a competitive range of interest rates and terms to both consumers and businesses. Deposits include interest-bearing and non-interest-bearing demand accounts, savings, money market, certificates of deposit and individual retirement accounts. These accounts earn interest at rates established by management based on competitive market factors, management's desire to increase certain product types or maturities, and in keeping with our asset/liability, liquidity and profitability objectives. Competitive products, competitive pricing and high touch customer service are important to attracting and retaining these deposits.
The Company has historically been an active bidder for public fund deposits within the state of Texas. This strategy has been refined to one which will seek to attract future public funds primarily in the direct markets that we serve and only at rates that are consistent with our strategy of providing a low cost source of core funding for the Company. At December 31, 2012 and 2011, the Company's public fund deposits totaled $186.5 million and $251.4 million, respectively.
The Company has opted to provide an avenue for large depositors to maintain full FDIC insurance coverage for all deposits up to $50 million. Under an agreement with Promontory Interfinancial Network, we participate in the Certificate of Deposit Account Registry Service (CDARS) and the Insured Cash Sweep (ICS) money market product. These are deposit-matching programs which distribute excess balances on deposit with the Company across other participating banks. In return, those participating financial institutions place their excess customer deposits with the Company in a reciprocal amount. These products are designed to enhance our ability to attract and retain customers and increase deposits by providing additional FDIC insurance for large deposits. Due to the nature of the placement of the funds, CDARS and ICS deposits are classified as “brokered deposits” by regulatory agencies. At December 31, 2012 and 2011, we had $88.5 million and $92.3 million, respectively, in aggregate reciprocal CDARS and ICS deposits.
The following table sets forth our deposit flows during the periods indicated.
|
| | | | | | | | | | | |
| | Year Ended December 31, |
| | 2012 | | 2011 | | 2010 |
| | (Dollars in thousands) |
| Opening balance | $ | 1,963,491 |
| | $ | 2,017,550 |
| | $ | 1,796,665 |
|
| Net deposits and withdrawals | 202,862 |
| | (76,533 | ) | | 189,870 |
|
| Interest | 11,453 |
| | 22,474 |
| | 31,015 |
|
| | | | | | |
| Ending balance | $ | 2,177,806 |
| | $ | 1,963,491 |
| | $ | 2,017,550 |
|
| Net increase (decrease) | $ | 214,315 |
| | $ | (54,059 | ) | | $ | 220,885 |
|
| Percent increase (decrease) | 10.91 | % | | (2.68 | )% | | 12.29 | % |
The following table sets forth the dollar amount of deposits in the various types of deposit programs offered at the dates indicated.
|
| | | | | | | | | | | | | | | | | | | | |
| | December 31, |
| | 2012 | | 2011 | | 2010 |
| | Amount | | Percent of Total | | Amount | | Percent of Total | | Amount | | Percent of Total |
| | (Dollars in thousands) |
| Transaction and Savings Deposits: | | | | | | | | | | | |
| Non-interest-bearing demand | $ | 357,800 |
| | 16.43 | % | | $ | 211,670 |
| | 10.78 | % | | $ | 201,998 |
| | 10.01 | % |
| Interest-bearing demand | 488,748 |
| | 22.44 |
| | 498,253 |
| | 25.37 |
| | 438,719 |
| | 21.74 |
|
| Savings and money market | 880,924 |
| | 40.45 |
| | 759,576 |
| | 38.69 |
| | 711,911 |
| | 35.29 |
|
| Total non-certificates | 1,727,472 |
| | 79.32 |
| | 1,469,499 |
| | 74.84 |
| | 1,352,628 |
| | 67.04 |
|
| Certificates: | | | | | | | | | | | |
| 0.00-1.99% | 365,704 |
| | 16.79 |
| | 372,902 |
| | 18.99 |
| | 407,564 |
| | 20.20 |
|
| 2.00-3.99% | 38,991 |
| | 1.79 |
| | 70,875 |
| | 3.61 |
| | 201,291 |
| | 9.98 |
|
| 4.00-5.99% | 45,636 |
| | 2.10 |
| | 50,213 |
| | 2.56 |
| | 56,067 |
| | 2.78 |
|
| 6.00% and over | 3 |
| | — |
| | 2 |
| | — |
| | — |
| | — |
|
| Total certificates | 450,334 |
| | 20.68 |
| | 493,992 |
| | 25.16 |
| | 664,922 |
| | 32.96 |
|
| | | | | | | | | | | | |
| Total deposits | $ | 2,177,806 |
| | 100.00 | % | | $ | 1,963,491 |
| | 100.00 | % | | $ | 2,017,550 |
| | 100.00 | % |
The following table shows rate and maturity information for our certificates of deposit at December 31, 2012.
|
| | | | | | | | | | | | | | | | | | | | | | | |
| | | 0.00-1.99% | | 2.00-3.99% | | 4.00-5.99% | | 6.00% and over | | Total | | Percent of Total |
| | | (Dollars in thousands) |
| Certificates maturing in quarter ending: | | | | | | | | | | | | |
| March 31, 2013 | | $ | 104,036 |
| | $ | 2,933 |
| | $ | 968 |
| | $ | — |
| | $ | 107,937 |
| | 23.96 | % |
| June 30, 2013 | | 68,749 |
| | 4,083 |
| | 1,519 |
| | — |
| | 74,351 |
| | 16.51 |
|
| September 30, 2013 | | 75,364 |
| | 5,957 |
| | 1,051 |
| | — |
| | 82,372 |
| | 18.29 |
|
| December 31, 2013 | | 51,082 |
| | 3,224 |
| | 33,951 |
| | — |
| | 88,257 |
| | 19.60 |
|
| March 31, 2014 | | 14,871 |
| | 3,671 |
| | — |
| | — |
| | 18,542 |
| | 4.12 |
|
| June 30, 2014 | | 13,188 |
| | 922 |
| | 7,580 |
| | — |
| | 21,690 |
| | 4.82 |
|
| September 30, 2014 | | 4,518 |
| | 1,546 |
| | 197 |
| | — |
| | 6,261 |
| | 1.39 |
|
| December 31, 2014 | | 12,732 |
| | 2,324 |
| | 352 |
| | — |
| | 15,408 |
| | 3.42 |
|
| Thereafter | | 21,164 |
| | 14,331 |
| | 18 |
| | 3 |
| | 35,516 |
| | 7.89 |
|
| Total | | $ | 365,704 |
| | $ | 38,991 |
| | $ | 45,636 |
| | $ | 3 |
| | $ | 450,334 |
| | 100.00 | % |
| | | | | | | | | | | | | |
| Percent of Total | | 81.21 | % | | 8.66 | % | | 10.13 | % | | — | % | | 100.00 | % | | |
| | | | | | | | | | | | | |
The following table indicates the amount of our certificates of deposit by time remaining until maturity as of December 31, 2012.
|
| | | | | | | | | | | | | | | | | | | |
| | Maturity | | |
| | 3 Months or less | | Over 3 to 6 Months | | Over 6 to 12 Months | | Over 12 Months | | Total |
| | (Dollars in thousands) |
| Certificates less than $100,000 | $ | 20,796 |
| | $ | 21,183 |
| | $ | 39,485 |
| | $ | 30,759 |
| | $ | 112,223 |
|
| Certificates of $100,000 or more | 29,080 |
| | 26,876 |
| | 68,957 |
| | 46,662 |
| | 171,575 |
|
| Public funds¹ | 58,061 |
| | 26,292 |
| | 62,187 |
| | 19,996 |
| | 166,536 |
|
| Total certificates | $ | 107,937 |
| | $ | 74,351 |
| | $ | 170,629 |
| | $ | 97,417 |
| | $ | 450,334 |
|
¹Deposits from governmental and other public entities
Borrowings. Although deposits are our primary source of funds, we may utilize borrowings to manage interest rate risk or as a cost-effective source of funds when they can be invested at a positive interest rate spread for additional capacity to fund loan demand according to our asset/liability management goals. We also fund a portion of our Warehouse Purchase Program fundings with short-term FHLB advances. Our borrowings consist primarily of advances from the FHLB of Dallas and a $25.0 million repurchase agreement with Credit Suisse.
We may obtain advances from the FHLB of Dallas upon the security of certain loans and securities. These advances may be made pursuant to several different credit programs, each of which has its own interest rate, range of maturities and call features. At December 31, 2012, we had $895.4 million in FHLB advances outstanding and the ability to borrow an additional $683.0 million. In addition to FHLB advances, the Company may also use the discount window at the Federal Reserve Bank or fed funds purchased from correspondent banks as a source of short-term funding. These funding sources were utilized during 2012 but had no balances outstanding at December 31, 2012. See Notes 13 and 14 of the Notes to Consolidated Financial Statements contained in Item 8 of this report for more information about our borrowings.
The following table sets forth the maximum month-end balance and daily average balance of FHLB advances, the repurchase agreement and other borrowings for the periods indicated.
|
| | | | | | | | | | | |
| | Year Ended December 31, |
| | 2012 | | 2011 | | 2010 |
| | (Dollars in thousands) |
| Maximum balance: | | | | | |
| FHLB advances | $ | 938,396 |
| | $ | 805,187 |
| | $ | 513,231 |
|
| Repurchase agreement | 84,817 |
| | 25,000 |
| | 25,000 |
|
| Other borrowings | 23,200 |
| | 10,000 |
| | 10,323 |
|
| Average balance outstanding: | | | | | |
| FHLB advances | $ | 680,674 |
| | $ | 453,434 |
| | $ | 364,853 |
|
| Repurchase agreement | 36,398 |
| | 25,000 |
| | 25,000 |
|
| Other borrowings | 1,193 |
| | 8,085 |
| | 10,027 |
|
During 2012, the Company acquired $50.0 million in repurchase agreements in the Highlands acquisition. These agreements unwound or matured prior to December 31, 2012.
The following table sets forth certain information as to FHLB advances, the repurchase agreement and other borrowings at the dates indicated.
|
| | | | | | | | | | | |
| | At December 31, |
| | 2012 | | 2011 | | 2010 |
| | (Dollars in thousands) |
| FHLB advances at end of period | $ | 892,208 |
| | $ | 746,398 |
| | $ | 461,219 |
|
| Repurchase agreement at end of period | 25,000 |
| | 25,000 |
| | 25,000 |
|
| Other borrowings at end of period | — |
| | — |
| | 10,000 |
|
| Weighted average rate of FHLB advances during the period | 1.44 | % | | 2.18 | % | | 3.21 | % |
| Weighted average rate of FHLB advances at end of period | 0.95 | % | | 1.21 | % | | 1.95 | % |
| Weighted average rate of repurchase agreement during the period | 2.41 | % | | 3.22 | % | | 3.22 | % |
| Weighted average rate of repurchase agreement at end of period | 3.22 | % | | 3.22 | % | | 3.22 | % |
| Weighted average rate of other borrowings during the period | 2.78 | % | | 5.87 | % | | 5.99 | % |
| Weighted average rate of other borrowings at end of period | N/A |
| | N/A |
| | 6.00 | % |
How We Are Regulated
The Company was a savings and loan holding company regulated by the OTS through July 20, 2011, and thereafter, as a result of the Dodd-Frank Act, by the FRB through December 18, 2011. The Bank was a federal savings bank regulated by the OTS through July 20, 2011, and thereafter, as a result of the Dodd-Frank Act, by the thrift division of the OCC through December 18, 2011. On December 19, 2011, the Bank converted to a national bank and is subject to regulation by the OCC, with certain back-up oversight by the FDIC. Due to that charter change, the Company became regulated by the FRB as a bank holding company. As a public company, the Company is subject to the regulation and reporting requirements of the SEC. Also, the Dodd-Frank Act created the Consumer Financial Protection Bureau (“CFPB”), which has broad authority to promulgate regulations intended to protect consumers with respect to financial products and services, including those provided by the Bank, and to restrict unfair, deceptive or abusive conduct by providers of consumer financial products and services.
Set forth below is a brief description of certain laws and regulations that are applicable to the Company and the Bank. This description, as well as other descriptions of laws and regulations contained in this Form 10-K, is not complete and is qualified in its entirety by reference to the applicable laws and regulations.
Legislation is introduced from time to time in the United States Congress that may affect our operations. In addition, the regulations governing the Company and the Bank may be amended from time to time by the OCC, the FRB, the FDIC, the CFPB or the SEC, as appropriate. Any legislative or regulatory changes, including those resulting from the Dodd-Frank Act, in the future could adversely affect our operations and financial condition.
ViewPoint Financial Group, Inc. The Company is a bank holding company subject to regulatory oversight by the FRB. The Company is required to register and file reports with the FRB and is subject to regulation and examination by the FRB, including requirements that the Company serve as a source of financial and managerial strength for the Bank, particularly when the Bank is in financial distress. In addition, the FRB has enforcement authority over the Company and any of its non-bank subsidiaries. The Company’s direct activities and those of its non-bank subsidiaries are subject to FRB regulation and must be closely related to banking, as determined by the FRB. The Company must obtain FRB approval to acquire substantially all the assets of another bank or bank holding company or to merge with another bank holding company. In addition, the Company must obtain FRB authorization to control more than 5% of the shares of any other bank or bank holding company and may not own more than 5% of any other entity engaged in activities not permitted for the Company. The FRB imposes capital requirements on the Company. See “- Regulatory Capital Requirements.”
ViewPoint Bank, N.A. As a national bank, the Bank is subject to regulation, examination and supervision by the OCC. The OCC oversees the Bank’s operations under federal law, regulations and policies, including consumer compliance laws, and ensures that the Bank operates in a safe and sound manner. The OCC extensively regulates many aspects of the Bank’s operations including branching, dividends, interest and fees collected, anti-money laundering activities, confidentiality of customer information, credit card operations, corporate governance, mergers and purchase and assumption transactions, insurance activities, securities investments, real estate investments, trust operations, lending activities, subsidiary operations and required capital levels. It also regulates the Bank’s transactions with affiliates (including the Company) and loans to insiders. This regulation and supervision primarily is intended for the protection of depositors and not for the purpose of protecting shareholders. When the Bank was a federal savings bank, it was required to maintain a certain level of thrift-related
assets consisting of housing related loans and investments and was subject to percentage-of-assets limits on consumer and commercial investments and loans. No such requirements or limits apply to the Bank as a national bank.
As a result of examinations, the OCC may require the Bank to establish additional reserves for loan losses, which decreases the Company’s net income. The OCC, as well as the other federal banking agencies, has adopted guidelines establishing safety and soundness standards on such matters as loan underwriting and documentation, asset quality, earnings standards, internal controls and audit systems, interest rate risk exposure and compensation and other employee benefits. Any institution which fails to comply with these standards must submit a compliance plan. The OCC also has extensive enforcement authority over all national banks and their management, employees and affiliates. This enforcement authority includes, among other things, the ability to assess civil money penalties, to issue cease-and-desist or removal orders and to initiate injunctive actions. In general, these enforcement actions may be initiated for violations of laws and regulations and unsafe or unsound practices. Other actions or inactions may provide the basis for enforcement action, including misleading or untimely reports filed with the OCC. Except under certain circumstances, public disclosure of final enforcement actions by the OCC is required.
To fund its operations, the OCC has established a schedule for the assessment of “supervisory fees” for all national banks. These supervisory fees are computed based on the Bank’s total assets and increase if the Bank experiences financial distress. The rate of these fees is similar to the rate for fees the Bank paid to the OTS. Such fees totaled $611,000 in 2012.
FDIC Regulation and Insurance of Accounts. The Bank’s deposits are insured up to the applicable limits by the FDIC, and such insurance is backed by the full faith and credit of the United States Government. The basic deposit insurance level is generally $250,000, as specified in FDIC regulations. As insurer, the FDIC imposes deposit insurance premiums. Our deposit insurance premiums for the year ended December 31, 2012 were $1.9 million. Those premiums may increase due to strains on the FDIC deposit insurance fund due to the cost of large bank failures and the increase in the number of troubled banks. Also, if the Bank experiences financial distress or operates in an unsafe or unsound manner, these deposit premiums may increase.
In accordance with the Dodd-Frank Act, the FDIC has issued regulations setting insurance premium assessments based on an institution’s total assets minus its Tier 1 capital, instead of based on its deposits. The intent of the new assessment calculations is not to substantially change the level of premiums paid, notwithstanding the use of assets as the calculation base instead of deposits. The Bank’s premiums continue to be based on its assignment to one of four risk categories based on capital, supervisory ratings and other factors.
As a result of a decline in the reserve ratio (the ratio of the net worth of the deposit insurance fund to estimated insured deposits) and concerns about expected failure costs and available liquid assets in the deposit insurance fund, the FDIC required each insured institution to prepay on December 30, 2009, the estimated amount of its quarterly assessments for the fourth quarter of 2009 and all quarters through the end of 2012 (in addition to the regular quarterly assessment for the third quarter which was due on December 30, 2009). The prepaid amount was recorded as an asset with a zero risk weight and each institution continues to record quarterly expenses for deposit insurance. For purposes of calculating the prepaid amount, assessments were measured at each institution’s assessment rate as of September 30, 2009, with a uniform increase of 3 basis points effective January 1, 2011, and were based on each institution’s assessment base for the third quarter of 2009, with growth assumed quarterly at an annual rate of 5%. If events cause actual assessments during the prepayment period to vary from the prepaid amount, institutions will pay excess assessments in cash, or receive a rebate of prepaid amounts not exhausted after collection of assessments due on June 30, 2013, as applicable. Collection of the prepayment does not preclude the FDIC from changing assessment rates or revising the risk-based assessment system.
As insurer, the FDIC may conduct examinations and some supervision of, require reporting by and exercise back-up enforcement authority against FDIC-insured institutions. It also may prohibit the Bank from engaging in any activity that it determines by regulation or order to pose a serious risk to the deposit insurance fund and may terminate our deposit insurance if it determines that the Bank has engaged in unsafe or unsound practices or is in an unsafe or unsound condition.
Regulatory Capital Requirements. Both the Company and the Bank are required to maintain a minimum level of regulatory capital. The OCC has established capital standards for the Bank, including a leverage ratio and a risk-based capital requirement, as well as capital standards for purposes of establishing the threshold for prompt corrective action and also may impose capital requirements in excess of these standards on a case-by-case basis. The FRB has established similar leverage and risk-based capital requirements that the Company must meet as a bank holding company. See “Item 7 — Management’s Discussion and Analysis of Financial Condition and Results of Operation — Capital Resources” for information on the Company’s and the Bank’s compliance with these capital requirements.
Under the OCC capital regulations, the Bank must maintain a minimum leverage capital ratio of 4% Tier 1 capital to adjusted total assets. The OCC can require a higher leverage capital ratio on an individualized basis if it determines the Bank is exposed to undue or excessive risk. The Bank also must meet a minimum risk- based capital ratio of at least 8% qualifying total
capital (at least 50% Tier 1 capital plus Tier 2 capital, which includes the loan loss allowance, up to 1.25% of risk-weighted assets) to risk-weighted assets (most balance sheet and certain off-balance sheet assets weighted 0% to 100% based on relevant risks of types of assets).
Under the law and regulations on prompt corrective action, the OCC is authorized and, under certain circumstances, required to take actions against banks that fail to meet their capital requirements. The OCC is generally required to restrict the activities of an “undercapitalized institution,” which is a bank with less than a 4% leverage capital ratio, a 4% Tier 1 risked-based capital ratio or an 8.0% total risk-based capital ratio. Any such institution must submit a capital restoration plan and, until such plan is approved by the OCC, may not increase its assets, acquire another institution, establish a branch or engage in any new activities, and generally may not make capital distributions.
Any bank that fails to comply with its capital plan or has Tier 1 risk-based or leverage capital ratio of less than 3.0% or a risk-based capital ratio of less than 6.0% and is considered “significantly undercapitalized” must be made subject to one or more additional specified actions and operating restrictions which may cover all aspects of its operations and may include a forced merger or acquisition of the institution. A bank that becomes “critically undercapitalized” because it has a tangible capital ratio of 2.0% or less is subject to further restrictions on its activities. In addition, a receiver or conservator must be appointed, with certain limited exceptions, within 90 days after a bank becomes critically undercapitalized.
To be considered well capitalized under the prompt corrective action standards, a bank must have at least a 5% leverage capital ratio, a 6% Tier 1 risk-based capital ratio and a 10% total risk-based capital ratio and no enforceable individualized capital requirement. Banks that are not well capitalized are adequately capitalized under these standards until capital ratios fall to the under capitalized level. Once a bank is not well capitalized it generally may not accept brokered deposits and is subject to limits on the rates it offers on deposits.
The FRB has established similar capital ratio requirements that apply to bank holding companies, including the Company, on a consolidated basis. To be considered well capitalized, a bank holding company must have, on a consolidated basis, at least a Tier 1 risk-based capital ratio of 6% and a total risk-based capital ratio of 10% and no enforceable individualized capital requirement.
As a result of the Dodd-Frank Act and potential capital requirements being considered by the Basel Committee on Banking Supervision, these capital requirements imposed on the Bank and the Company could increase. The federal banking agencies have proposed rules that would substantially amend the current capital rules applicable to the Company and the Bank. The proposed rules would implement the “Basel III” regulatory capital reforms and changes required by the Dodd-Frank Act. “Basel III” refers to various documents released by the Basel Committee on Banking Supervision. As published, the proposed rules contemplated a general effective date of January 1, 2013, and, for certain provisions, various phase-in periods and later effective dates. However, the federal banking agencies have announced that the proposed rules will not be effective on January 1, 2013. The agencies have not adopted final rules or published any modifications to the proposed rules. The proposed rules as published are summarized below. It is not possible to predict when or in what form final regulations may be adopted. When adopted, final regulations could increase our capital requirements.
The proposed rules include new minimum capital ratios, to be phased in until fully effective on January 1, 2015, and would refine the definitions of what constitutes “capital” for purposes of calculating those ratios. The proposed new minimum capital ratios would be: (i) a new common equity Tier 1 capital ratio of 4.5%; (ii) a Tier 1 capital ratio of 6% (increased from 4%); (iii) a total capital ratio of 8% (unchanged from current rules); and (iv) a Tier 1 leverage ratio of 4%. The proposed rules would also establish a “capital conservation buffer” requirement of 2.5% above each of the new regulatory minimum capital ratios to be phased in starting on January 1, 2016 and fully effective on January 1, 2019. An institution would be subject to limitations on paying dividends, engaging in share repurchases, and paying discretionary bonuses if any of its capital levels fell below the buffer amount.
The proposed rules also implement other revisions to the current capital rules, such as recognition of all unrealized gains and losses on available for sale debt and equity securities, and provide that instruments that will no longer qualify as capital would be phased out over time.
The federal banking agencies also proposed revisions, effective January 1, 2015, to the prompt corrective action framework, which is designed to place restrictions on insured depository institutions if their capital levels show signs of weakness. Under the proposed prompt corrective action standards, insured depository institutions would be required to meet the following in order to qualify as “well capitalized:” (i) a common equity Tier 1 risk-based capital ratio of 6.5%; (ii) a Tier 1 risk-based capital ratio of 8% (increased from 6%); (iii) a total risk-based capital ratio of 10% (unchanged from current rules); and (iv) a Tier 1 leverage ratio of 5% (unchanged from the current rules).
The proposed rules set forth certain changes for the calculation of risk-weighted assets, effective January 1, 2015. In particular, the proposed rules would establish risk-weighting categories generally ranging from 0% for U.S. government and agency securities to 600% for certain equity exposures. Specifics include, among others:
| |
| • | For residential mortgage exposures, changing the current 50% risk weight for high-quality seasoned mortgages and 100% risk-weight for all other mortgages to risk weights between 35% and 200% depending upon the LTV ratio and other factors (but VA and FHA guaranteed loans would have 0% risk weight). |
| |
| • | Applying a 150% risk weight instead of a 100% risk weight for certain high volatility commercial real estate acquisition, development and construction loans. |
| |
| • | Assigning a 150% risk weight to exposures (other than residential mortgage exposures) that are 90 days past due. |
| |
| • | Providing for a 20% credit conversion factor for the unused portion of a commitment with an original maturity of one year or less that is not unconditionally cancellable (currently set at 0%). |
Limitations on Dividends and Other Capital Distributions. The Company’s major source of funds consists of the net proceeds retained by the Company from our initial public offering in 2006 and our second-step public offering in 2010. We also have the ability to receive dividends or capital distributions from the Bank, our wholly owned subsidiary. The ability of the Bank to pay dividends depends on its earnings and capital levels and may be limited by the OCC directives or orders. The Bank generally must obtain OCC approval of a dividend if the total dividends declared during the current year, including the proposed dividend, exceed net income for the current year and retained net income for the prior two years. It is the Bank’s policy to maintain a strong capital position; so, in times of financial or economic distress, the Bank will be less likely to pay dividends to the Company.
The ability of the Company to pay dividends to its stockholders is dependent on the receipt of dividends from the Bank. Under Maryland law, the Company cannot pay cash dividends if it would render the Company unable to pay its debts (unless they are paid from recent earnings) or become insolvent.
The FRB has issued a policy statement on the payment of cash dividends by bank holding companies, which expresses the FRB’s view that a bank holding company should pay cash dividends only to the extent that its net income for the past year is sufficient to cover both the cash dividends and a rate of earnings retention that is consistent with the holding company’s capital needs, asset quality and overall financial condition. The FRB also indicated that it would be inappropriate for a company experiencing serious financial problems to borrow funds to pay dividends. Furthermore, a bank holding company may be prohibited from paying any dividends if the holding company’s bank subsidiary is not adequately capitalized.
A bank holding company is required to give the FRB prior written notice of any purchase or redemption of its outstanding equity securities if the gross consideration for the purchase or redemption, when combined with the net consideration paid for all such purchases or redemptions during the preceding 12 months, is equal to 10% or more of the company’s consolidated net worth. The FRB may disapprove such a purchase or redemption if it determines that the proposal would constitute an unsafe or unsound practice or would violate any law, regulation, FRB order, or any condition imposed by, or written agreement with, the FRB. This notification requirement does not apply to any company that meets the well-capitalized standard for bank holding companies, is well-managed, and is not subject to any unresolved supervisory issues.
Federal Securities Laws. The common stock of the Company is registered with the SEC under the Securities Exchange Act of 1934, as amended (the “Exchange Act”). Therefore, the Company is subject to the reporting, information disclosure, proxy solicitation, insider trading limits and other requirements imposed on public companies by the SEC under the Exchange Act. This includes limits on sales of stock by certain insiders and the filing of insider ownership reports with the SEC. The SEC and Nasdaq have adopted regulations under the Sarbanes-Oxley Act of 2002 that apply to the Company as a Nasdaq-traded, public company, which seek to improve corporate governance, provide enhanced penalties for financial reporting improprieties and improve the reliability of disclosures in SEC filings.
Subsidiary and Other Activities
National banks are authorized to invest in various types of subsidiaries, including bank service corporations, operating subsidiaries and financial subsidiaries. There are investment and activity limits on each of these types of subsidiaries.
In July 2012, the Company sold its only operating subsidiary, VPM (please see Item 1 - General under Part 1 of this Annual Report on Form 10-K for more information). Also in 2012, the Bank dissolved its subsidiary housing the Bank’s equity investments in two community development-oriented venture capital funds, which are now housed directly in the Bank. At December 31, 2012, the Bank did not have any subsidiaries.
Competition
The Texas market for banking services is highly competitive. Texas’ largest banking organizations are headquartered outside of Texas and are controlled by out-of-state organizations. We also compete with other providers of financial services, such as savings and loan associations, credit unions, consumer finance companies, insurance companies and commercial finance and leasing companies. We believe that many middle market companies and successful professionals and entrepreneurs are interested in banking with a company headquartered in, and with decision-making authority based in, Texas and with established Texas bankers who have the expertise to act as trusted advisors to the customer with regard to its banking needs. We believe our bank can offer customers more responsive and personalized service. We believe that, if we service these customers properly, we will be able to establish long-term relationships and provide multiple products to our customers, thereby enhancing our profitability.
Executive Officers of ViewPoint Financial Group, Inc. and ViewPoint Bank, N.A.
Officers are elected annually to serve for a one year term. There are no arrangements or understandings between the officers and any other person pursuant to which he or she was or is to be selected as an officer. As of the date of this report, our executive officers were as follows.
Kevin J. Hanigan. Mr. Hanigan, age 56, is a director and the President and Chief Executive Officer of the Company and the Bank, positions he has held since the completion of the Highlands acquisition with and into the Company in April 2012. Mr. Hanigan is a member of the Lending Committee. Prior to joining the Company, Mr. Hanigan was the chairman and chief executive officer of Highlands, serving in those roles since 2010. His experience in Texas banking spans three decades and includes numerous leadership and management roles. Prior to joining Highlands, Mr. Hanigan served as chairman and chief executive officer of Guaranty Bank. After joining Guaranty in 1996, Mr. Hanigan held several senior-level executive positions that culminated in his appointment as chairman and chief executive officer in 2009. Previous positions with Guaranty included senior executive vice president from 2000 to 2007 with oversight of all corporate banking operations and responsibilities for middle market, oil and gas, syndications, treasury management and asset-based lending. In April 2007, Mr. Hanigan was appointed senior executive vice president with responsibilities for retail banking operations, provided through 163 offices in Texas and California, as well as an insurance subsidiary. From March to November 2008, he served as senior executive vice president and chief banking officer until his appointment as president and chief operating officer in November 2008. Mr. Hanigan began his career with Bank of the Southwest in Houston in June 1980. Mr. Hanigan earned his undergraduate degree and Master of Business Administration from Arizona State University. With more than 30 years of experience working in the banking industry in Texas and serving as chief executive officer of several institutions, Mr. Hanigan brings outstanding leadership skills and a deep understanding of the local banking market and issues facing the banking industry.
Scott A. Almy. Mr. Almy, age 46, has served as Executive Vice President, Chief Risk Officer and General Counsel of the Company and the Bank since July 2012. Mr. Almy oversees the credit, risk, compliance, information technology, internal audit and legal functions of the Company and has nearly 20 years of bank regulatory expertise. Prior to joining the Company, Mr. Almy was the managing member of a private law firm in Dallas, where he focused on regulatory and transactional matters affecting banks, bank holding companies and other financial firms. Prior to that, he spent 15 years at Guaranty Financial Group, serving as general counsel and secretary for the company and its subsidiary, Guaranty Bank. Mr. Almy has a J.D. from Texas Tech University School of Law and a B.B.A from Texas A&M. He also completed the Executive Education Program in Advanced Risk Management at the Wharton School, University of Pennsylvania.
Charles D. Eikenberg. Mr. Eikenberg, age 58, has served as Executive Vice President of Community Banking for the Company and the Bank since April 2012. Mr. Eikenberg oversees the community banking, administrative operations, marketing and retail investment functions of the Company. He has over 30 years of experience as a Texas banker, primarily focused on consumer and retail banking. Mr. Eikenberg joined the Company as head of Community Banking in 2012 when the Company merged with Highlands, where he served as Chief Retail Officer. Prior to joining Highlands, Mr. Eikenberg served as Senior Executive Vice President, Retail Banking at Guaranty Bank and also held positions at Inter First Bank in Houston and Bank One, where he remained throughout the JP Morgan Chase acquisition, serving in numerous senior positions for retail credit, investments and branch distribution. Mr. Eikenberg holds an M.B.A. from the University of Houston and a Bachelors Degree from Baylor University.
Thomas S. Swiley. Mr. Swiley, age 63, has served as Executive Vice President and Chief Lending Officer of the Company and the Bank since July 2012. Mr. Swiley oversees the Corporate Banking, Business Banking, Entrepreneurial Banking, and Commercial Real Estate and Warehouse Lending Divisions of the Company, along with the Treasury Management Sales function. Mr. Swiley's extensive Texas banking career spans over thirty-five years, and includes six years as President, and President and Chief Operating Officer of Bank of Texas, N.A. He has also held various executive positions with other commercial banks, primarily with Bank of America and its predecessors. Mr. Swiley holds both a M.B.A. and B.B.A. from Southern Methodist University and is also a graduate of the Southwestern Graduate School of Banking.
Pathie (Patti) E. McKee. Ms. McKee, age 47, has served as Executive Vice President, Chief Financial Officer and Treasurer of the Company since 2006 and the Bank (including its predecessor entity) since 1997. Ms. McKee oversees the Company's finance, investment and corporate accounting operations. Ms. McKee has over 30 years of banking experience and has held numerous positions including Director of Internal Audit, Controller and accountant. Ms. McKee is a certified public accountant and holds a M.B.A. from the University of Texas at Dallas.
Mark L. Williamson. Mr. Williamson, age 58, has served as Executive Vice President and Chief Credit Officer of the Company and the Bank since 2010. Mr. Williamson’s responsibilities include business and consumer underwriting, loan operations, portfolio analysis, default management, credit approval and all credit policy matters. Mr. Williamson has over 35 years of credit, lending and risk management experience in markets throughout Texas, including Dallas, Houston, Midland and Lubbock. Most recently he served as EVP and Chief Credit Officer for the Dallas and Lubbock markets of PlainsCapital Bank. Prior to that, he served in both lending and risk management capacities at Guaranty Bank and Chase Bank of Texas. Mr. Williamson holds a M.B.A. from the University of Texas Permian Basin, a B.B.A. from Texas Tech University and is a graduate of the Southwestern Graduate School of Banking.
Employees
At December 31, 2012, we had a total of 543 full-time employees and 29 part-time employees. Our employees are not represented by any collective bargaining group. Management considers its employee relations to be good.
Internet Website
We maintain three websites with the addresses viewpointbank.com, viewpointfinancialgroup.com and fnbjacksboro.com. The information contained on our websites is not included as a part of, or incorporated by reference into, this Annual Report on Form 10-K. Other than an investor’s own Internet access charges, we make available free of charge through our website our Annual Reports on Form 10-K, Quarterly Reports on Form 10-Q and Current Reports on Form 8-K, and amendments to these reports, as soon as reasonably practicable after we have electronically filed such material with, or furnished such material to, the SEC.
An investment in our common stock is not an insured deposit and is subject to risks inherent in our business. Before making an investment decision, you should carefully consider the risks and uncertainties described below together with all of the other information included and incorporated by reference in this report. In addition to the risks and uncertainties described below, other risks and uncertainties not currently known to us or that we currently deem to be immaterial also may materially and adversely affect our business, financial condition, capital levels, cash flows, liquidity, results of operations and prospects. The market price of our common stock could decline significantly due to any of these identified or other risks, and you could lose some or all of your investment. This report is qualified in its entirety by these risk factors.
Risks Related To The Industry
A return of recessionary conditions could result in increases in our level of non-performing loans and/or reduce demand for our products and services, which could have an adverse effect on our results of operations.
The ongoing debate in Congress regarding the national debt ceiling and federal budget deficit, and concerns over the United States' credit rating (which was downgraded by Standard & Poor's), the European sovereign debt crisis, the overall weakness in the economy and continued high unemployment in the United States, among other economic indicators, have contributed to increased volatility in the capital markets and diminished expectations for the economy.
A return of recessionary conditions and/or continued negative developments in the domestic and international credit markets may significantly affect the markets in which we do business, the value of our loans and investments, and our ongoing operations, costs and profitability. Further declines in real estate values and sales volumes and continued high unemployment
levels may result in higher than expected loan delinquencies and a decline in demand for our products and services. These negative events may cause us to incur losses and may adversely affect our capital, liquidity, and financial condition.
Furthermore, the Board of Governors of the Federal Reserve System, in an attempt to help the overall economy, has, among other things, kept interest rates low through its targeted federal funds rate and the purchase of mortgage-backed securities. If the Federal Reserve increases the federal funds rate, overall interest rates will likely rise, which may negatively impact the housing markets and the U.S. economic recovery. In addition, deflationary pressures, while possibly lowering our operating costs, could have a significant negative effect on our borrowers, especially our business borrowers, and the values of underlying collateral securing loans, which could negatively affect our financial performance.
If economic conditions deteriorate in the state of Texas, the value of our collateral and borrowers' ability to repay loans may decline.
Substantially all of our loans are located in the state of Texas. Our financial results may be adversely affected by changes in prevailing economic conditions, including decreases in real estate values, changes in interest rates which may cause a decrease in interest rate spreads, adverse employment conditions, the monetary and fiscal policies of the federal government and other significant external events. Decreases in real estate values in the state of Texas could adversely affect the value of property used as collateral for some of our loans. As a result, the market value of the real estate underlying the loans may not, at any given time, be sufficient to satisfy the outstanding principal amount of the loans. In the event that we are required to foreclose on a property securing a loan, we may not recover funds in an amount equal to the remaining loan balance. Consequently, we would sustain loan losses and potentially incur a higher provision for loan loss expense, which would have an adverse impact on earnings. In addition, adverse changes in the Texas economy may have a negative effect on the ability of borrowers to make timely repayments of their loans, which would also have an adverse impact on earnings.
Passage of the Dodd-Frank Wall Street Reform and Consumer Protection Act will increase our operational and compliance costs.
The Dodd-Frank Act has significantly changed, and will continue to significantly change, the bank regulatory structure and affect the lending, deposit, investment, trading and operating activities of financial institutions and their holding companies. The Dodd-Frank Act requires various federal agencies to adopt a broad range of new rules and regulations and to prepare numerous studies and reports for Congress. The federal agencies are given significant discretion in drafting the rules and regulations, and consequently, many of the details and much of the impact of the Dodd-Frank Act remain unknown. Provided below is an overview of what management considers key provisions of the Dodd-Frank Act relevant to us and is based on the limited information currently available since many of the implementing rules and regulations have not yet been finalized:
| |
| • | Consumer Financial Protection Bureau (“CFPB”): The CFPB has broad rule-making authority for a wide range of consumer protection laws that apply to all banks and savings institutions, including the authority to prohibit “unfair, deceptive or abusive” acts and practices. The CFPB has direct examination and enforcement authority over all banks with more than $10 billion in assets while banks with $10 billion or less in assets will continue to be examined for compliance with consumer laws by their primary bank regulators. We do not currently have assets in excess of $10 billion, but may at some point in the future. |
| |
| • | Deposit Insurance: The assessment base for FDIC deposit insurance has changed from domestic deposits to average total assets less average tangible equity. The maximum amount of deposit insurance coverage permanently increased to $250 thousand per depositor, and the DIF's minimum reserve ratio was increased. |
| |
| • | Holding Company Capital Requirements: Tier 1 Capital and risk-based capital requirements for bank holding companies are now at least as stringent as those applicable to banks, which will limit our ability to borrow at the holding company level and invest the proceeds from such borrowings as capital in the Bank. Certain instruments are now excluded from Tier 1 capital including trust preferred securities. |
| |
| • | Commercial Demand Deposit Accounts: Interest can now be paid on these accounts. |
| |
| • | Interchange Fees: Card issuers are now limited in the amount they can charge to merchants for processing debit card transactions. |
| |
| • | Federal Preemption: A historically strong preemption rule for national banks has been weakened and state attorneys general now have the ability to enforce federal consumer protection laws. |
| |
| • | Transaction Account Guarantees (“TAG”): In an effort to help stabilize the banking system, the FDIC created the TAG program in 2008, which was extended twice, and in 2010 the Dodd-Frank Act required that all banks participate in the TAG program. TAG permitted unlimited deposit insurance for certain business and government bank accounts. The TAG program expired on December 31, 2012 and, if we are unable to retain those relationships, we may see significant deposit account balances moved from the Bank to other institutions as account holders affected by the expiration of the TAG program seek higher returns for their deposits. |
It is difficult to predict at this time what specific impact the Dodd-Frank Act and the yet to be written implementing rules and regulations will have on community banks. However, it is expected that at a minimum they will increase our operating and compliance costs, which could adversely affect key operating efficiency ratios, and could increase our interest expense.
Changes in laws and regulations and the cost of regulatory compliance with new laws and regulations may adversely affect our operations and our income and may decrease our efficiency.
We, directly and indirectly through the Bank, are subject to extensive regulation, supervision and examination by the OCC, the FRB, the SEC and the FDIC, and other regulatory bodies. These regulatory authorities have extensive discretion in connection with their supervisory and enforcement activities, including the ability to impose restrictions on a bank's operations, reclassify assets, determine the adequacy of a bank's allowance for loan losses and its risk weighting of its assets and determine the level of deposit insurance premiums assessed. Our business is highly regulated; therefore, the laws and applicable regulations are subject to frequent change. Any new regulations or legislation, change in existing regulations or oversight, whether a change in regulatory policy or a change in a regulator's interpretation of a law or regulation, could have a material impact on our operations.
The potential exists for additional federal or state laws and regulations, or changes in policy or interpretation, affecting lending and funding practices, interest rate risk management and liquidity standards. Moreover, bank regulatory agencies have been active in responding to concerns and trends identified in examinations, and have issued many formal enforcement orders requiring capital ratios in excess of regulatory requirements. Bank regulatory agencies, such as the OCC and the FDIC, govern the activities in which we may engage, primarily for the protection of depositors and not for the protection or benefit of potential investors. In addition, new laws and regulations may increase our costs of regulatory compliance and of doing business, and otherwise affect our operations. New laws and regulations may significantly affect the markets in which we do business, the markets for and value of our loans and investments, the fees we can charge and our ongoing operations, costs and profitability.
Legal and regulatory proceedings and related matters could adversely affect us or the financial services industry in general.
We, and other participants in the financial services industry upon whom we rely to operate, have been and may in the future become involved in legal and regulatory proceedings. Most of the proceedings we consider to be in the normal course of our business or typical for the industry, however it is inherently difficult to assess the outcome of these matters and there can be no assurance that anyone in particular, including us, will prevail in any proceeding or litigation. There could be substantial cost and management diversion in such litigation and proceedings, and any adverse determination could have a materially adversely affect on our business, brand or image, or our financial condition and results of our operations.
The short-term and long-term impact of the changing regulatory capital requirements and anticipated new capital rules is uncertain.
In June 2012, the FRB, FDIC and the OCC proposed rules that would substantially amend the regulatory risk-based capital rules applicable to us. The proposed rules were subject to a public comment period that has expired and there is no date set for the adoption of final rules.
Various provisions of the Dodd-Frank Act increase the capital requirements of bank holding companies, such as the Company. The leverage and risk-based capital ratios of these entities may not be lower than the leverage and risk-based capital ratios for insured depository institutions. The proposed rules include new minimum risk-based capital and leverage ratios, which would be phased in during 2013 and 2014, and would refine the definition of what constitutes “capital” for purposes of calculating those ratios. The proposed new minimum capital level requirements applicable to the Company and the Bank under the proposals would be: (i) a new common equity Tier 1 capital ratio of 4.5%; (ii) a Tier 1 capital ratio of 6% (increased from 4%); (iii) a total capital ratio of 8% (unchanged from current rules); and (iv) a Tier 1 leverage ratio of 4% for all institutions. The proposed rules would also establish a “capital conservation buffer” of 2.5% above the new regulatory minimum capital ratios, and would result in the following minimum ratios: (i) a common equity Tier 1 capital ratio of 7.0%, (ii) a Tier 1 capital ratio of 8.5%, and (iii) a total capital ratio of 10.5%. The new capital conservation buffer requirement would be phased in beginning in January 2016 at 0.625% of risk-weighted assets and would increase each year until fully implemented in January 2019. An institution would be subject to limitations on paying dividends, engaging in share repurchases, and paying discretionary bonuses if its capital level falls below the buffer amount. These limitations would establish a maximum percentage of eligible retained income that could be utilized for such actions. While the proposed Basel III changes and other regulatory capital requirements will likely result in generally higher regulatory capital standards, it is difficult at this time to predict when or how any new standards will ultimately be applied to the Company and the Bank.
In addition, in the current economic and regulatory environment, regulators of banks and bank holding companies have become more likely to impose capital requirements on bank holding companies and banks that are more stringent than those required by applicable existing regulations. The application of more stringent capital requirements for us could, among other things, result in lower returns on invested capital, require the raising of additional capital, and result in regulatory actions if we were to be unable to comply with such requirements.
Furthermore, the imposition of liquidity requirements in connection with the implementation of Basel III could result in our having to lengthen the term of our funding, restructure our business models, and/or increase our holdings of liquid assets. Implementation of changes to asset risk weightings for risk based capital calculations, items included or deducted in calculating regulatory capital and/or additional capital conservation buffers could result in management modifying its business strategy and could limit our ability to make distributions, including paying out dividends or buying back shares.
Our business is susceptible to fraud and our customers could be the subject of fraud.
As a financial institution, we experience fraud risk with our borrowers, depositors or employees, directly or indirectly. We rely on information provided by, or on behalf of our customers, which could turn out to be fraudulent. We believe we have
controls in place to detect and prevent such fraud but in some cases multi-party collusion or other sophisticated methods of hiding fraud, may not be readily detected or detectable, and could result in losses that affect our financial condition and results of our operations.
Fraud is not limited to the financial services industry. Our customers could experience fraud in their businesses, which could materially impact their ability to repay their loans, and deposit customers in all financial institutions are constantly and unwittingly solicited by others in fraud schemes that vary from easily detectable and obvious attempts to high-level and very complex international schemes that could drain an account of millions of dollars and require detailed financial forensics to unravel. While we have controls in place, contractual agreements with our customers partitioning liability, and insurance to help mitigate the risk, none of these are guarantees that we will not experience a fraud loss, potentially a loss that could have a material adverse affect on our financial condition, reputation and results of our operations.
Our business is reliant on outside vendors.
Our business is highly dependent on the use of certain outside vendors for our day-to-day operations, including such high level vendors as our data processing vendor, our card processing vendor and our on-line banking vendors. Our operations are exposed to risk that a vendor may not perform in accordance with established performance standards required in our agreements for any number of reasons including a change in their senior management, their financial condition, their product line or mix and how they support existing customers, or a simple change in their strategic focus. While we have comprehensive polices and procedures in place to mitigate risk at all phases of vendor management from selection, to performance monitoring and renewals, the failure of a vendor to perform in accordance with contractual agreements could be disruptive to our business, which could have a material adverse affect on our financial conditions and results of our operations.
Changes in interest rates could adversely affect our results of operations and financial condition.
As with most financial institutions, our results of operations depend substantially on our net interest income, which is the difference between the interest income we earn on our interest-earning assets, such as loans and securities, and the interest expense we pay on our interest-bearing liabilities, such as deposits and borrowings. Interest rates, which remain at historically low levels, are highly sensitive to many factors that are beyond our control such as general economic conditions and policies of the federal government, in particular the Federal Open Market Committee. Changes in monetary policy, including changes in interest rates, could influence (i) the amount of interest we receive on loans and securities, (ii) the amount of interest we pay on deposits and borrowings, (iii) our ability to originate loans and obtain deposits, (iv) the fair value of our assets and liabilities, and (v) the reinvestment risk associated with a reduced duration of our mortgage-backed securities portfolio as borrowers refinance to reduce borrowing costs. When interest-bearing liabilities reprice or mature more quickly than interest-earning assets, an increase in interest rates generally would tend to result in a decrease in net interest income.
Although management believes it has implemented an effective asset and liability management strategy to manage the potential effects of changes in interest rates, including the use of adjustable rate and/or short-term assets, and Federal Home Loan Bank advances or longer term repurchase agreements, any substantial, unexpected, prolonged change in market interest rates could have a material adverse effect on our financial condition and results of our operation and/or our strategies may not always be successful in managing the risk associated with changes in interest rates.
Liquidity risk could impair our ability to fund operations and jeopardize our financial condition.
Liquidity is essential to our business. We rely on a number of different sources in order to meet our potential liquidity demands. Our primary sources of liquidity are increases in deposit accounts, cash flows from loan payments and our securities portfolio. Borrowings also provide us with a source of funds to meet liquidity demands. An inability to raise funds through deposits, borrowings, the sale of loans and other sources could have a substantial negative effect on our liquidity. Our access to funding sources in amounts adequate to finance our activities or on terms which are acceptable to us could be impaired by factors that affect us specifically, or the financial services industry or economy in general. Factors that could detrimentally impact our access to liquidity sources include adverse regulatory action against us or a decrease in the level of our business activity as a result of a downturn in the markets in which our loans are concentrated. Our ability to borrow could also be impaired by factors that are not specific to us, such as a disruption in the financial markets or negative views and expectations about the prospects for the financial services industry in light of the recent turmoil faced by banking organizations or deterioration in credit markets.
Additionally, collateralized public funds are bank deposits of state and local municipalities. These deposits are required to be secured by certain investment grade securities to ensure repayment, which on the one hand tends to reduce our contingent liquidity risk by making these funds somewhat less credit sensitive, but on the other hand reduces standby liquidity by restricting the potential liquidity of the pledged collateral. Although these funds historically have been a relatively stable source of funds for us, availability depends on the individual municipality's fiscal policies and cash flow needs and may be
affected by the expiration of the TAG program discussed above.
Higher FDIC insurance premiums and special assessments will affect our earnings.
In accordance with the Dodd-Frank Act, the FDIC adopted a new deposit insurance premium assessment system which was effective April 1, 2011. To the extent our non-deposit liabilities are determined to bear certain additional risk to the deposit insurance fund, future increases in our assessment rate or levels or any special assessments would decrease our earnings. Furthermore, market conditions affecting financial institutions led to the failure (or merger into healthier organizations) of many national, regional and community-based financial institutions. These failures, and projected future failures, have a significant negative impact on the legally-required capitalization levels of the FDIC's insurance fund which has led to higher insurance premiums paid by financial institutions, and could lead to significantly higher premiums in the future.
Our ability to attract and retain key employees may change.
Our success depends, in large part, on our ability to attract and retain key employees, competition for which can be intense. We may not be able to hire or retain these employees. The unexpected loss of a key employee could have a material adverse impact on our business as the skills, knowledge of our market and institution, and the years of experience of a departing key employee which are all difficult to quickly replace with qualified personnel.
Furthermore, in 2011 federal regulators imposed limitations on incentive-based compensation for covered financial institutions which the regulators believe encourage inappropriate risk-taking, are deemed by a regulator to be excessive or may lead to material losses. We may be at a disadvantage offering compensation packages in competition with other banks and non-banks that are not subject to the rules.
The soundness of other financial institutions could adversely affect us.
The financial services industry is interrelated. As with all institutions, including commercial and savings banks, credit unions, broker-dealers, investment banks, and other such institutional clients, we routinely engage in financial transactions with other financial institutions including loan syndications and participations, trading and clearing transactions, deposit accounts, and many other routine transactions. We rely on other institutions ability to remain commercially viable, that they are being operated in safe and sound manner, and in accordance with all applicable laws and regulations applicable to the transactions in which we engage as well as the operation of their business as a whole. If our reliance is misplaced, or a default, failure or even rumors of such by one of more of those institutions occurs, it may lead to transaction-specific loss, default or credit risk for us, and could lead to further industry-wide liquidity problems, all of which can have a material adverse affect on our financial condition and results of operations.
System failure or breaches of our network security could subject us to increased operating costs as well as litigation and other liabilities.
The computer systems and network infrastructure we use could be vulnerable to unforeseen problems. Our operations are dependent upon our ability to protect our computer equipment against damage from physical theft, fire, power loss, telecommunications failure or a similar catastrophic event, as well as from security breaches, denial of service attacks, viruses, worms and other disruptive problems caused by hackers. Any damage or failure that causes an interruption in our operations could have a material adverse effect on our financial condition and results of operations. Computer break-ins, phishing and other disruptions could also jeopardize the security of information stored in and transmitted through our computer systems and network infrastructure, which may result in significant liability to us and may cause existing and potential customers to refrain from doing business with us. Although we, with the help of third-party service providers, intend to continue to implement security technology and establish operational procedures to prevent such damage, there can be no assurance that these security measures will be successful. In addition, advances in computer capabilities, new discoveries in the field of cryptography or other developments could result in a compromise or breach of the algorithms we and our third-party service providers use to encrypt and protect customer transaction data. A failure of such security measures could have a material adverse effect on our financial condition and results of operations.
Natural disasters, severe weather events, worldwide hostilities, including terrorist attacks, and other external events may adversely affect the general economy, the financial services industry, the industries of our customers, and us in particular.
Natural disasters, severe weather events, including those prominent in our geographic footprint and those prominent in the geographic areas of our vendors and business partners, together with worldwide hostilities, including terrorist attacks, and other external events could have a significant impact on our ability to conduct our business. They could also affect the stability of our deposit base, our borrowers' ability to repay loans, impair collateral, result in a loss of revenue or an increase in
expenses. Although management has established disaster recovery and business continuity procedures and plans, the occurrence of any such event may adversely affect our business, which in turn could have a material adverse affect on our financial condition and results of our operations.
Changes in accounting standards, or our own accounting practices or policies, could materially impact our financial statements.
From time to time entities that set accounting standards change the financial accounting and reporting standards that govern the preparation of our financial statements. These changes can be both difficult to predict and involve judgment and discretion in their interpretation by us, and our independent accounting firms. The changes implemented by the entities in setting standards themselves could materially impact, potentially even retroactively, how we report our financial condition and results of our operations as could our interpretation of those changes.
Risks Related To The Company's Business
Our business initiatives and strategies, product lines, revenue enhancement or efficiency improvements may be less successful than anticipated or not realized at all.
We make certain projections and assumptions when we adopt or modify existing business initiatives and strategies, product lines, enter or expand our market presence, attempt to re-balance our loan portfolio, execute our customer retention plan or seek revenue enhancement or efficiency improvements. Our projections and assumptions may not be accurate and may be affected by numerous conditions outside of our control and therefore we may not be able to achieve desired or projected results on the timeline we anticipate, some benefits may not be fully realized or we may not realize any benefit at all.
Our customers may have difficulty weathering a downturn in the economy, which may impair their ability to repay their loans.
Historically we have, and will continue to, target our marketing and business development strategies primarily to local or regional, small-to-medium sized businesses, some of whom are in volatile industries such as energy and real estate. These firms are generally more vulnerable to economic downturns, whether large and sudden downturns or moderate downturns that are more prolonged, and may not have the capital needed to compete against their larger, more capitalized competitors or a particular business sector may be affected significantly more than other sectors or the economy as a whole, and these firms may therefore experience volatile operating results, which may affect their ability to repay their loans. Additionally, the continued success of these firms is frequently contingent on a small group of owners or senior management, and the death, disability or resignation of one or more of such individuals could also have a material adverse affect on the business and its ability to repay its loan obligations. Economic downturns and other events that affect the economy as a whole, or our customers business in particular, could cause us to incur credit losses that would have a material adverse affect on our financial condition and results of our operation.
Our loan portfolio possesses increased risk due to our percentage of commercial real estate and commercial and industrial loans.
Over the last several years, we have been re-balancing our loan portfolio by increasing our commercial lending to diversify our loan mix and improve the yield on our assets, and we anticipate that trend to continue. The credit risk related to these types of loans is considered to be greater than the risk related to our previous target asset of one‑ to four‑family residential loans because the repayment of commercial real estate loans and commercial and industrial loans typically is dependent on the successful operation and income stream of the borrowers' business and the real estate securing the loans as collateral, both of which can be significantly affected by economic conditions. Additionally, commercial loans typically involve larger loan balances to single borrowers or groups of related borrowers compared to residential real estate loans. If loans that are collateralized by real estate become troubled and the value of the real estate has been significantly impaired, then we may not be able to recover the full contractual amount of principal and interest that we anticipated at the time we originated the loan, which could require us to increase our provision for loan losses and adversely affect our financial condition and results of our operation.
Several of our borrowers have more than one commercial real estate loan outstanding with us. Consequently, an adverse development with respect to one loan or one credit relationship can expose us to significantly greater risk of loss compared to an adverse development with respect to a one‑ to four‑family residential mortgage loan. Finally, if we foreclose on a commercial real estate loan, our holding period for the collateral, if any, typically is longer than for one‑ to four‑family residential property because there are fewer potential purchasers of the collateral. Since we plan to continue to increase our originations of these loans, it may be necessary to increase the level of our allowance for loan losses due to the increased risk characteristics associated with these types of loans. Any increase to our allowance for loan losses would adversely affect our
earnings. Any delinquent payments or the failure to repay these loans would hurt our earnings.
Our Warehouse Purchase Program balances can fluctuate widely.
We have a high lending concentration in the Warehouse Purchase Program. Because Warehouse Purchase Program balances are contingent upon residential mortgage lending activity, changes in the residential real estate market nationwide can lead to wide fluctuations of balances in this product, materially impacting both interest and non-interest income. Additionally, Warehouse Purchase Program period-end balances are generally higher than the average balance during the period due to increased mortgage activity that occurs at the end of a month.
The credit quality of our loans could decline.
Although we regularly review credit exposure related to particular customers, industry sectors and product lines, default risk may arise from circumstances that are difficult to predict or detect. In such circumstances, we could experience an increase in our provision for loan loss, reserve for credit loss, nonperforming assets, and net charge-offs any of which could have a material adverse affect on our financial condition and results of our operation.
Specifically, residential mortgage lending, including home equity loans and lines of credit, is generally sensitive to regional and local economic conditions that may significantly affect the ability of borrowers to meet their loan payment obligations, making loss levels difficult to predict. The decline in residential real estate values resulting from the downturn in local housing markets has reduced the value of the real estate collateral securing many of our loans and has increased the risk that we would incur losses if borrowers default on their loans. Continued declines in both the volume of real estate sales and sales prices, coupled with high levels and increases in unemployment, may result in higher loan delinquencies or problem assets.
Our loan portfolio also contains adjustable rate loans. Borrowers with adjustable rate loans are exposed to increased monthly payments when the related interest rate adjusts upward under the terms of the loan from the initial fixed to the rate computed in accordance with the applicable index and margin. Any rise in prevailing market interest rates may result in increased payments for borrowers who have adjustable rate loans, increasing the possibility of default. Borrowers seeking to avoid these increased monthly payments by refinancing their loans may no longer be able to find available replacement loans at comparably lower interest rates. In addition, a decline in housing prices may leave borrowers with insufficient equity in the collateral to permit them to refinance or the inability to sell the collateral for an amount equal to or greater than the unpaid principal balance of their loans.
These potential negative events, which may have a greater impact on our earnings and capital than on the earnings and capital of other financial institutions due to our product mix, may cause us to incur losses, which would adversely affect our capital and liquidity and damage our financial condition and business operations.
Our allowance for loan losses may not be sufficient to cover actual loan losses and/or our non-performing assets may increase.
In determining the amount of the allowance for loan losses, we review our loans and our loss and delinquency experience, evaluate economic conditions and make various assumptions and judgments about the loan portfolio. Management recognizes that significant new growth in loan portfolios such as the increased focus on commercial and industrial loans, new loan products and the refinancing of existing loans can result in portfolios not performing in a historical or projected manner. If our assumptions are incorrect, our allowance for loan losses may not be sufficient to cover actual losses, resulting in additions to our allowance, which decreases our net income.
Our banking regulators and external auditor periodically review our allowance for loan losses. These entities may require us to recognize additions to the allowance for loan losses based on their judgments about information available to them at the time of their review. Any increase in our allowance for loan losses or loan charge‑offs as required by these authorities may have a material adverse effect on our financial condition and results of operations.
Our non-performing assets adversely affect our net income in various ways including interest accrual, reserves for credit losses, write-downs and additional costs including carrying costs of other real estate owned assets. Further, the resolution of non-performing assets requires the active involvement of management, which can distract them from the overall supervision of our operations and other income-producing activities, all of which can have a material adverse affect on our financial condition and results of operations.
Our Enterprise Risk Management program may not be able to adequately monitor or control perceived risks
Our enterprise risk management (“ERM”) program is designed to formalize the practice of understanding and
controlling the nature and amount of risk we take pursuing our business initiatives and strategies and to establish management accountability for the risks accepted and includes an institution-wide coordination of credit risk, operational risk, market risk, capital management and liquidity management.
In 2012, the Board of Governors of the Federal Reserve System issued proposed rules (“Enhanced Prudential Standards”) for the management of enterprise wide risk applicable to complex or larger financial institutions over $10 billion in assets or are otherwise covered by the Dodd-Frank Act. Some of the requirements of the Enhanced Prudential Standards include a formal board-level risk committee and the establishment of a Chief Risk Officer with oversight of the ERM program. While the Enhanced Prudential Standards may not currently be a requirement for us, management believes that much of the Enhanced Prudential Standards represent industry best-practices and we have already implemented, or are in the process of implementing, many of its requirements.
While we have an ERM program with Board-level involvement, we may not be able to monitor or control all risks, which could have a materially adverse affect on our financial condition and results of our operations.
Our acquisition of Highlands or future strategic transactions may adversely affect us.
We regularly evaluate potential merger and acquisition opportunities. As a result, some negotiations may occur and future transactions involving cash or securities may occur, which may include payment of a premium over book value and therefore could result in a dilution of our tangible net book value and net income per common share in connection with such future transaction. Although we seek merger and acquisition targets that are culturally similar, have experienced management together with either a geographic footprint that compliments ours, or offers the potential for improved profitability through management, economies of scale of expanded services, mergers and acquisitions have many inherent risks, some of which are unknown to us at the time of the consummation and all of which could have a material adverse affect on our financial condition or the results of our operations including the possibility that at any time following the consummation of a transaction, the accretable yield attributable to the assets of the target may decrease, thereby decreasing our net interest margin, perhaps materially.
We completed our acquisition of Highlands on April 2, 2012 and completed systems integration on July 31, 2012. Difficulties in capitalizing on the perceived opportunities presented by the acquisition may delay or prevent us from fully achieving the expected benefits of the transaction, including higher than anticipated deposit attrition, loss of key employees, disruption of our business and such difficulties could extend for an unknown amount of time. We will be subject to similar risks and difficulties in connection with any future potential transactions.
Our securities portfolio may be negatively impacted by fluctuations in market value and interest rates.
Our securities portfolio may be impacted by fluctuations in market value, potentially reducing accumulated other comprehensive income and/or earnings. Fluctuations in market value may be caused by changes in market interest rates, lower market prices for securities and limited investor demand. Our securities portfolio is evaluated for other-than-temporary impairment. If this evaluation shows impairment to the actual or projected cash flows associated with one or more securities, a potential loss to earnings may occur. Changes in interest rates can also have an adverse effect on our financial condition, as our available-for-sale securities are reported at their estimated fair value, and therefore are impacted by fluctuations in interest rates. We increase or decrease our shareholders' equity by the amount of change in the estimated fair value of the available-for-sale securities, net of taxes.
The value of our goodwill and other intangible assets may decline.
Goodwill and other intangible assets are subject to a decline, perhaps even significantly, for several reasons including if there is a significant decline in our expected future cash flows, change in the business environment, or a material and sustained decline in the market value of our stock, which may require us to take future charges related to the impairment of that goodwill and other intangible assets in the future, which could have a material adverse affect on our financial condition and results of our operations.
Strong competition within our market area may limit our growth and profitability.
Competition in the banking and financial services industry is intense. We compete with numerous commercial banks, savings institutions, mortgage brokerage firms, credit unions, finance companies, mutual funds, insurance companies, and brokerage and investment banking firms operating locally and elsewhere. Many of our competitors have substantially greater resources and lending limits than we have, have greater name recognition and market presence that benefit them in attracting business, and offer certain services that we do not or cannot provide. In addition, larger competitors may be able to price loans and deposits more aggressively than we do. Our profitability depends upon our continued ability to successfully compete in
our market area. The greater resources and deposit and loan products offered by some of our competitors may limit our ability to increase our interest earning assets.
A reduction in our credit rating could adversely affect us.
Rating agencies regularly evaluate us, which are based on a number of factors, some of which we control, some of which we do not including economic conditions generally affecting the economy and the financial services industry in particular. There is no assurance that we will maintain our current ratings and a credit rating downgrade could affect our ability to access capital markets, increase costs and adversely affect profitability.
Risks Related To The Company's Common Stock
Regulatory and corporate governance anti-takeover provisions may make it difficult for you to receive a change-in-control premium.
Provisions of federal banking laws, including regulatory approval requirements, could make it more difficult for a third party to acquire the Company, even if doing so would be perceived to be beneficial to the Company's shareholders. These provisions effectively inhibit a non-negotiated merger or other business combination, which, in turn, could adversely affect the market price of the Company's common stock. With certain limited exceptions, federal regulations make it difficult for any one person or company or a group of persons from, directly or indirectly, acquiring more than 10% (5% if the acquirer is a bank holding company) of any class of our voting stock or obtaining the ability to control in any manner the election of a majority of our directors or otherwise direct the management or policies of our company without prior notice or application to and the approval of the appropriate federal regulator(s). Certain provisions of our corporate documents are also designed to make merger, tender offer or proxy contest more difficult, even if such events were perceived by many of our stockholders to be beneficial to their interests.
Our stock price can be volatile and its trading volume is generally less than other institutions.
Stock price volatility may make it more difficult for you to resell your common stock when you want and at prices you find attractive. Our stock price can fluctuate significantly in response to a variety of factors including the risk factors discussed elsewhere in this report that our outside of our control and which may occur regardless of our operating results. Also, although our common stock is currently listed for trading on the NASDAQ, the trading volume of our stock is less than that of other, larger financial services companies. Given the lower trading volume of our stock, significant sales of the stock, or the expectation of these sales, could cause the stock price to fall.
We may not continue to pay dividends on our stock.
Our shareholders are only entitled to receive Board declared dividends out of funds legally available for such payments. Although we have historically declared cash dividends, we are not required to do so and may reduce or eliminate future dividends. This could adversely affect the market price of our stock. Also, we are a bank holding company, and our ability to declare and pay dividends is dependent on certain federal regulatory considerations, including the guidelines of the FRB regarding capital adequacy and dividends.
An investment in the Company's common stock is not an insured deposit.
The Company's common stock is not a bank deposit and, therefore, is not insured against loss by the Federal Deposit Insurance Corporation (FDIC), any other deposit insurance fund or by any other public or private entity. Investment in the Company's common stock is inherently risky for the reasons described in this “Risk Factors” section and elsewhere in this report and is subject to the same market forces that affect the price of common stock in any company. As a result, if you acquire the Company's common stock, you could lose some or all of your investment.
|
| |
| Item 1B. | Unresolved Staff Comments |
None.
The executive offices of the Company and the Bank are located at 1309 West 15th Street, Plano, Texas. In addition to our executive offices, we have five administrative offices, 31 full-service branches and one commercial loan production office. We own the space in which our executive offices are located and majority of the space in which our administrative offices are located. At December 31, 2012, we owned 20 of our branches, and leased the remaining facilities. The majority of our
branches are located in the Dallas/ Fort Worth Metroplex in Texas, and include the cities of Addison, Allen, Carrollton, Coppell, Dallas, Plano, Euless, Flower Mound, Frisco, Garland, Grand Prairie, Grapevine, McKinney, Richardson and Wylie. We also own two First National Bank of Jacksboro locations in Jack and Wise Counties in Texas. We have one commercial loan production office located in Houston, Texas. We lease our Warehouse Purchase Program office located in Littleton, Colorado. The net book value of our investment in premises, equipment and leaseholds, excluding computer equipment, was approximately $49.4 million at December 31, 2012. We believe that our current administrative and executive facilities are adequate to meet the present and immediately foreseeable needs of the Bank and the Company. In July 2012, due to the VPM sale, the seven remaining VPM loan production offices were transitioned to HRM and are no longer operated by the Company.
We currently utilize IBM and FiServ Signature in-house data processing systems. The net book value of all of our data processing and computer equipment at December 31, 2012, was $3.8 million.
For more information about the Company's premises and equipment, please see Note 11 of the Notes to Consolidated Financial Statements contained in Item 8 of this report.
We are involved from time to time as plaintiff or defendant in various legal actions arising in the normal course of our businesses. While the ultimate outcome of pending proceedings cannot be predicted with certainty, it is the opinion of management, after consultation with counsel representing us in such proceedings, that the resolution of these proceedings should not have a material adverse effect on our consolidated financial position or results of operations.
|
| |
| Item 4. | Mine Safety Disclosures. |
Not applicable.
PART II
|
| |
| Item 5. | Market for Registrant’s Common Equity, Related Shareholder Matters and Issuer Purchases of Equity Securities |
Our common stock is listed on the NASDAQ Global Select Market under the symbol “VPFG”. There were 2,011 holders of record of our common stock as of February 19, 2013.
The following table presents quarterly market high and low closing sales price information and cash dividends per share declared for our common stock for the two years ended December 31, 2012.
|
| | | | | | | | | | | | |
| | Market Price Range | | Dividends | |
| | High | | Low | | Declared | |
| 2012 | | | | | | |
| Quarter ended March 31, 2012 | $ | 15.65 |
| | $ | 13.19 |
| | $ | 0.06 |
| |
| Quarter ended June 30, 2012 | 16.72 |
| | 14.79 |
| | 0.06 |
| |
| Quarter ended September 30, 2012 | 19.50 |
| | 15.88 |
| | 0.08 |
| |
| Quarter ended December 31, 2012 | 21.80 |
| | 19.30 |
| | 0.20 |
| 1 |
| | | | | | | |
| 2011 | | | | | | |
| Quarter ended March 31, 2011 | $ | 13.70 |
| | $ | 11.57 |
| | $ | 0.05 |
| |
| Quarter ended June 30, 2011 | 13.94 |
| | 12.05 |
| | 0.05 |
| |
| Quarter ended September 30, 2011 | 14.00 |
| | 10.81 |
| | 0.05 |
| |
| Quarter ended December 31, 2011 | 13.29 |
| | 11.16 |
| | 0.05 |
| |
1 Includes the $0.10 per share prepayment of the dividend for the first quarter of 2013
The timing and amount of cash dividends paid depends on our earnings, capital requirements, financial condition and other relevant factors. The primary source for dividends paid to shareholders is the net proceeds retained by the Company from our initial public offering in 2006 and our second-step public offering in 2010. We also have the ability to receive dividends or capital distributions from the Bank, our wholly owned subsidiary. There are regulatory restrictions on the ability of the Bank to pay dividends. See “How We Are Regulated — Limitations on Dividends and Other Capital Distributions” under Item 1 of this report and Note 20 of Notes to Consolidated Financial Statements contained in Item 8 of this report.
Stock Repurchases
On August 22, 2012, the Company announced its intention to repurchase up to 5% of its total common shares outstanding, or approximately 1,978,871 shares. The stock repurchase program, which is open-ended, commenced on August 27, 2012, and allows the Company to repurchase its shares from time to time in the open market and in negotiated transactions, depending upon market conditions. The Board of Directors of the Company also authorized management to enter into a trading plan with Sandler O'Neill & Partners, LP in accordance with Rule 10b5-1 of the Securities Exchange Act of 1934, as amended, to facilitate repurchases of its common stock pursuant to the above- mentioned stock repurchase program. There were no repurchases of common stock in 2012.
Equity Compensation Plans
Set forth below is information, at December 31, 2012, regarding the Company's equity compensation plans, both of which were approved by the Company's shareholders.
|
| | | | | | | | | |
| | Number of Securities to be Issued upon Exercise of Outstanding Options | | Weighted Average Exercise Price | | Number of Securities Remaining Available for Issuance under Plans1 |
| 2007 Equity Incentive Plan | 500,049 |
|
| $ | 13.70 |
|
| 1,011,416 |
|
| 2012 Equity Incentive Plan | — |
|
| — |
|
| 2,269,153 |
|
| Total | 500,049 |
| | $ | 13.70 |
| | 3,280,569 |
|
| | | | | | |
1 Includes 63,890 shares under the 2007 Equity Incentive Plan and 523,803 shares under the 2012 Equity Incentive Plan that may be awarded as restricted stock |
Shareholder Return Performance Graph Presentation
The line graph below compares the cumulative total shareholder return on the Company’s common stock to the cumulative total return of a broad index of the NASDAQ Stock Market and a savings and loan industry index (Morningstar Savings and Cooperative Banks Index) for the period December 31, 2007 through December 31, 2012. The information presented below assumes $100 was invested on December 31, 2007, in the Company’s common stock and in each of the indices and assumes the reinvestment of all dividends. Historical stock price performance is not necessarily indicative of future stock price performance.
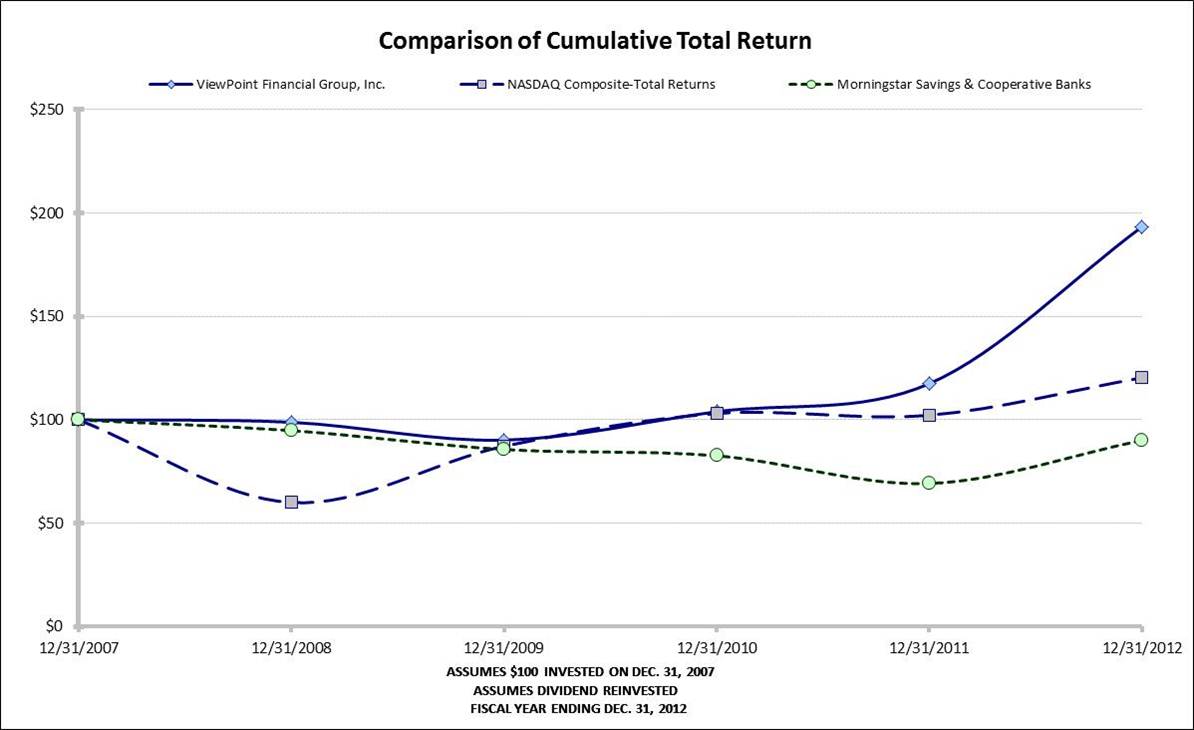
|
| | | | | | | | | | | | | | | | | | | |
| | | | 12/31/2007 | | 12/31/2008 | | 12/31/2009 | | 12/31/2010 | | 12/31/2011 | | 12/31/2012 |
| ViewPoint Financial Group, Inc. | Return % | | | | (1.17 | ) | | (8.73 | ) | | 15.28 |
| | 13.06 |
| | 64.56 |
|
| | Cum $ | | 100.00 |
| | 98.83 |
| | 90.21 |
| | 103.99 |
| | 117.57 |
| | 193.47 |
|
| NASDAQ Composite-Total Returns | Return % | | | | (39.98 | ) | | 45.36 |
| | 18.16 |
| | (0.79 | ) | | 17.75 |
|
| | Cum $ | | 100.00 |
| | 60.02 |
| | 87.25 |
| | 103.09 |
| | 102.28 |
| | 120.43 |
|
| Morningstar Savings & Cooperative Banks | Return % | | | | (5.16 | ) | | (9.64 | ) | | (3.55 | ) | | (16.20 | ) | | 30.10 |
|
| | Cum $ | | 100.00 |
| | 94.84 |
| | 85.70 |
| | 82.66 |
| | 69.27 |
| | 90.11 |
|
|
| |
| Item 6. | Selected Financial Data |
The summary information presented below under “Selected Financial Condition Data” and “Selected Operations Data” for each of the years ended December 31 is derived from our audited consolidated financial statements. The following information is only a summary and you should read it in conjunction with “Management’s Discussion and Analysis of Financial Condition and Results of Operations” under Item 7 of this report and “Financial Statements and Supplementary Data” under Item 8 of this report below.
|
| | | | | | | | | | | | | | | | | | | |
| | At and For the Year Ended December 31, |
| | 2012 | | 2011 | | 2010 | | 2009 | | 2008 |
| | (Dollars in thousands) |
| Selected Financial Condition Data: | | | | | | | | | |
| Total assets | $ | 3,663,058 |
| | $ | 3,180,578 |
| | $ | 2,941,995 |
| | $ | 2,379,504 |
| | $ | 2,213,415 |
|
| Loans held for sale | 1,060,720 |
| | 834,352 |
| | 491,985 |
| | 341,431 |
| | 159,884 |
|
| Loans receivable, net | 1,673,204 |
| | 1,211,057 |
| | 1,092,114 |
| | 1,108,159 |
| | 1,239,708 |
|
| Securities available for sale, at fair value | 287,034 |
| | 433,745 |
| | 717,497 |
| | 484,058 |
| | 483,016 |
|
| Securities held to maturity, at amortized cost | 360,554 |
| | 500,488 |
| | 432,519 |
| | 254,724 |
| | 172,343 |
|
| FHLB and Federal Reserve Bank stock | 45,025 |
| | 37,590 |
| | 20,569 |
| | 14,147 |
| | 18,069 |
|
| Bank-owned life insurance | 34,916 |
| | 29,007 |
| | 28,501 |
| | 28,117 |
| | 27,578 |
|
| Deposits | 2,177,806 |
| | 1,963,491 |
| | 2,017,550 |
| | 1,796,665 |
| | 1,548,090 |
|
| Borrowings | 917,208 |
| | 771,398 |
| | 496,219 |
| | 347,504 |
| | 435,841 |
|
| Shareholders' equity | 520,871 |
| | 406,309 |
| | 396,589 |
| | 205,682 |
| | 194,139 |
|
| | | | | | | | | | |
| Selected Operations Data: | | | | | | | | | |
| Total interest income | $ | 137,992 |
| | $ | 116,224 |
| | $ | 115,385 |
| | $ | 107,906 |
| | $ | 96,795 |
|
| Total interest expense | 22,169 |
| | 33,646 |
| | 44,153 |
| | 49,286 |
| | 46,169 |
|
| Net interest income | 115,823 |
| | 82,578 |
| | 71,232 |
| | 58,620 |
| | 50,626 |
|
| Provision for loan losses | 3,139 |
| | 3,970 |
| | 5,119 |
| | 7,652 |
| | 6,171 |
|
| Net interest income after provision for loan losses | 112,684 |
| | 78,608 |
|
| 66,113 |
|
| 50,968 |
|
| 44,455 |
|
| Service charges and fees | 19,512 |
| | 18,556 |
| | 18,505 |
| | 18,954 |
| | 19,779 |
|
| Net gain on sale of loans | 5,436 |
| | 7,639 |
| | 13,041 |
| | 16,591 |
| | 9,390 |
|
| Impairment of collateralized debt obligations | — |
| | — |
| | — |
| | (12,246 | ) | | (13,809 | ) |
| Gain on sale of available for sale securities | 1,014 |
| | 6,268 |
| | — |
| | 2,377 |
| | — |
|
| Other non-interest income | 3,594 |
| | 2,085 |
| | 1,918 |
| | 1,523 |
| | 3,504 |
|
| Total non-interest income | 29,556 |
| | 34,548 |
|
| 33,464 |
|
| 27,199 |
|
| 18,864 |
|
| Total non-interest expense | 87,690 |
| | 75,240 |
| | 73,146 |
| | 74,537 |
| | 68,911 |
|
| Income (loss) before income tax expense (benefit) | 54,550 |
| | 37,916 |
|
| 26,431 |
|
| 3,630 |
|
| (5,592 | ) |
| Income tax expense (benefit) | 19,309 |
| | 11,588 |
| | 8,632 |
| | 960 |
| | (2,277 | ) |
| Net income (loss) | $ | 35,241 |
| | $ | 26,328 |
|
| $ | 17,799 |
|
| $ | 2,670 |
|
| $ | (3,315 | ) |
|
| | | | | | | | | | | | | | |
| | At and For the Year Ended December 31, |
| | 2012 | | 2011 | | 2010 | | 2009 | | 2008 |
| Selected Financial Ratios and Other Data (Unaudited): | | | | | | | | | |
| Performance Ratios: | | | | | | | | | |
| Return on assets (ratio of net income (loss) to average total assets) | 1.04 | % | | 0.89 | % | | 0.66 | % | | 0.12 | % | | (0.17 | )% |
| Return on equity (ratio of net income (loss) to average equity) | 7.23 |
| | 6.45 |
| | 5.69 |
| | 1.34 |
| | (1.65 | ) |
| Interest rate spread: | | | | | | | | | |
| Average during period | 3.43 |
| | 2.65 |
| | 2.49 |
| | 2.37 |
| | 2.28 |
|
| End of period | 3.18 |
| | 2.48 |
| | 2.20 |
| | 2.29 |
| | 2.09 |
|
| Net interest margin | 3.61 |
| | 2.91 |
| | 2.80 |
| | 2.72 |
| | 2.85 |
|
| Non-interest income to operating revenue | 17.64 |
| | 22.91 |
| | 22.48 |
| | 20.13 |
| | 16.31 |
|
| Operating expense to average total assets | 2.59 |
| | 2.54 |
| | 2.71 |
| | 3.26 |
| | 3.63 |
|
Efficiency ratio 1 | 61.32 |
| | 67.81 |
| | 69.58 |
| | 78.38 |
| | 82.77 |
|
| Average interest earning assets to average interest bearing liabilities | 126.13 |
| | 121.99 |
| | 118.11 |
| | 115.14 |
| | 121.73 |
|
Dividend payout ratio 3 | 43.84 |
| | 26.28 |
| | 21.70 |
| | 92.58 |
| | N/M* |
|
| Asset Quality Ratios: | | | | | | | | | |
| Non-performing assets to total assets at end of period | 0.79 |
| | 0.80 |
| | 0.69 |
| | 0.66 |
| | 0.17 |
|
| Non-performing loans to total loans | 1.61 |
| | 1.88 |
| | 1.59 |
| | 1.04 |
| | 0.18 |
|
| Allowance for loan losses to non-performing loans | 66.36 |
| | 75.71 |
| | 84.22 |
| | 105.44 |
| | 409.02 |
|
| Allowance for loan losses to total loans | 1.07 |
| | 1.42 |
| | 1.34 |
| | 1.10 |
| | 0.73 |
|
| Capital Ratios: | | | | | | | | | |
| Equity to total assets at end of period | 14.22 |
| | 12.77 |
| | 13.48 |
| | 8.64 |
| | 8.77 |
|
| Average equity to average assets | 14.40 |
| | 13.76 |
| | 11.59 |
| | 8.73 |
| | 10.59 |
|
| Other Data: | | | | | | | | | |
Number of branches 2 | 31 |
| | 25 |
| | 23 |
| | 23 |
| | 30 |
|
| Number of loan production offices | 1 |
| | 8 |
| | 14 |
| | 15 |
| | 15 |
|
*Number is not meaningful.
1 Calculated by dividing total non-interest expense by net interest income plus non-interest income, excluding gain (loss) on sale of foreclosed assets, impairment of goodwill, gains from securities transactions and other nonrecurring items.
2 In 2009, we opened three new full-service community bank offices in Grapevine, Frisco and Wylie. On January 2, 2009, we announced plans to expand our community banking network by opening more free-standing, full-service community bank offices and transition away from limited-service grocery store banking centers. As a result, we closed ten in-store banking centers located in Carrollton, Dallas, Garland, Plano, McKinney, Frisco and Wylie in 2009.
3In 2012, the Company prepaid the quarterly dividend for the first quarter of 2013 in December 2012, distributing an additional $0.10 per common share.
|
| |
| Item 7. | Management’s Discussion and Analysis of Financial Condition and Results of Operations |
General
Our principal business consists of attracting retail deposits from the general public and the business community and investing those funds, along with borrowed funds, in commercial real estate, secured and unsecured commercial and industrial loans, as well as permanent loans secured by first and second mortgages on owner-occupied, one- to four-family residences and consumer loans. Additionally, we have an active program with mortgage banking companies that allows them to close one- to four-family real estate loans in their own name and manage its cash flow needs until the loans are sold to investors (the “Warehouse Purchase Program”). The Company purchases a 100% participation interest in the loans originated by our mortgage banking company customers, which are then held as one- to four- family mortgage loans held for sale on a short-term basis. The mortgage banking company has no obligation to offer and we have no obligation to purchase these participation interests. The mortgage banking company closes mortgage loans consistent with underwriting standards established by approved investors and once the loan closes, the mortgage banking company delivers the loan to a third party investor.
We also offer brokerage services for the purchase and sale of non-deposit investment and insurance products through a third party brokerage arrangement.
Our operating revenues are derived principally from interest earned on interest-earning assets including loans and investment securities and service charges and fees on deposits and other account services. Our primary sources of funds are deposits, FHLB advances and other borrowings, and payments received on loans and securities. We offer a variety of deposit accounts that provide a wide range of interest rates and terms, generally including savings, money market, term certificate and demand accounts.
Critical Accounting Estimates
Certain of our accounting estimates are important to the portrayal of our financial condition, since they require management to make difficult, complex or subjective judgments, some of which may relate to matters that are inherently uncertain. Estimates are susceptible to material changes as a result of changes in facts and circumstances. Facts and circumstances which could affect these judgments include, but are not limited to, changes in interest rates, changes in the performance of the economy and changes in the financial condition of borrowers. Management believes that its critical accounting estimates include determining the allowance for loan losses and other-than-temporary impairments in our securities portfolio. Our accounting policies are discussed in detail in Note 1 of the Notes to Consolidated Financial Statements contained in Item 8 of this report.
Allowance for Loan Loss. The allowance for loan losses and related provision expense are susceptible to change if the credit quality of our loan portfolio changes, which is evidenced by many factors, including but not limited to charge-offs and non-performing loan trends. Generally, one- to four-family residential mortgage lending has a lower credit risk profile compared to consumer lending (such as automobile or personal line of credit loans). Commercial real estate and commercial and industrial lending, however, have higher credit risk profiles than consumer and one- to four- family residential mortgage loans due to these loans being larger in amount and non-homogenous in structure and term. While management uses available information to recognize losses on loans, changes, in economic conditions, the mix and size of the loan portfolio and individual borrower conditions can dramatically impact our level of allowance for loan losses in relatively short periods of time. Management believes that the allowance for loan losses is maintained at a level that represents our best estimate of inherent credit losses in the loan portfolio as of December 31, 2012.
Management evaluates current information and events regarding a borrower's ability to repay its obligations and considers a loan to be impaired when the ultimate collectability of amounts due, according to the contractual terms of the loan agreement, is in doubt. If an impaired loan is collateral-dependent, the fair value of the collateral, less the estimated cost to sell, is used to determine the amount of impairment. If an impaired loan is not collateral-dependent, the impairment amount is determined using the negative difference, if any, between the estimated discounted cash flows and the loan amount due. For impaired loans, the amount of the impairment can be adjusted, based on current data, until such time as the actual basis is established by acquisition of the collateral or until the basis is collected. Impairment losses are reflected in the allowance for loan losses through a charge to the provision for loan losses. Subsequent recoveries are credited to the allowance for loan losses. Cash receipts for accruing loans are applied to principal and interest under the contractual terms of the loan agreement. Cash receipts on impaired loans for which the accrual of interest has been discontinued are applied first to principal.
Other-than-Temporary Impairments. The Company evaluates securities for other-than-temporary impairment on at least a quarterly basis and more frequently when economic, market, or security specific concerns warrant such evaluation.
Consideration is given to the length of time and the extent to which the fair value has been less than amortized cost, the financial condition and near-term prospects of the issuer, and the intent and ability of the Company to retain its investment in the issuer for a period of time sufficient to allow for any anticipated recovery in fair value. In analyzing an issuer’s financial condition, the Company may consider whether the securities are issued by the federal government or its agencies, whether downgrades by bond rating agencies have occurred, and the results of reviews of the issuer’s financial condition. The Company conducts regular reviews of the bond agency ratings of securities and considers whether the securities were issued by or have principal and interest payments guaranteed by the federal government or its agencies. These reviews focus on the underlying rating of the issuer and also include the insurance rating of securities that have an insurance component. The ratings and financial condition of the issuers are monitored, as well as the financial condition and ratings of the insurers.
Business Strategy
Our principal objective is to remain an independent, community-oriented financial institution, providing outstanding service and innovative products to customers in our primary market area. Our Board of Directors has sought to accomplish this objective through the adoption of a strategy designed to maintain efficient, growing profitability, strong capital adequacy and high asset quality. Please see Part I, Item 1 - "Business Strategies" for more information.
Comparison of Financial Condition at December 31, 2012 and December 31, 2011
General. Total assets increased by $482.5 million, or 15.2%, to $3.66 billion at December 31, 2012, from $3.18 billion at December 31, 2011, primarily due to a $462.1 million, or 38.2%, increase in net loans held for investment and a $226.4 million, or 27.1%, increase in loans held for sale. The increase in loans included loans acquired in the Highlands acquisition, which totaled $222.9 million at December 31, 2012. The increase in loans was partially offset by a $286.6 million, or 30.7%, decline in our securities portfolio resulting primarily from maturities, paydowns and sales of securities.
Loans. Gross loans (including $1.06 billion in mortgage loans held for sale at December 31, 2012) increased by $689.1 million, or 33.4%, from $2.06 billion at December 31, 2011, to $2.75 billion at December 31, 2012. $466.2 million of the increase was due to organic growth, while $222.9 million of the increase was due to loans acquired in the Highlands acquisition.
|
| | | | | | | | | | | | | | |
| | December 31, 2012 | | December 31, 2011 | | Dollar Change |
| | Percent Change |
|
| | (Dollars in thousands) |
| | | | | | | | |
| Commercial real estate | $ | 839,908 |
| | $ | 585,328 |
| | $ | 254,580 |
| | 43.49 | % |
| | | | | | | | |
| Commercial and industrial loans: | | | | | | | |
| Commercial | 245,799 |
| | 54,479 |
| | 191,320 |
| | 351.18 |
|
| Warehouse lines of credit | 32,726 |
| | 16,141 |
| | 16,585 |
| | 102.75 |
|
| Total commercial and industrial loans | 278,525 |
| | 70,620 |
| | 207,905 |
| | 294.40 |
|
| | | | | | | | |
| Consumer: | | | | | | | |
| One- to four-family real estate | 378,255 |
| | 379,944 |
| | (1,689 | ) | | (0.44 | ) |
| Home equity/home improvement | 135,001 |
| | 140,966 |
| | (5,965 | ) | | (4.23 | ) |
| Other consumer | 59,080 |
| | 51,170 |
| | 7,910 |
| | 15.46 |
|
| Total consumer loans | 572,336 |
| | 572,080 |
| | 256 |
| | 0.04 |
|
| | | | | | | | |
| Gross loans held for investment | 1,690,769 |
| | 1,228,028 |
| | 462,741 |
| | 37.68 |
|
| | | | | | | | |
| Loans held for sale | 1,060,720 |
| | 834,352 |
| | 226,368 |
| | 27.13 |
|
| | | | | | | | |
| Gross loans | $ | 2,751,489 |
| | $ | 2,062,380 |
| | $ | 689,109 |
| | 33.41 | % |
The commercial real estate portfolio increased by $254.6 million, or 43.5%, to $839.9 million at December 31, 2012, from $585.3 million at December 31, 2011, with $181.9 million of this increase attributable to organic growth. $72.7 million of the increase was due to the acquisition of Highlands. Our commercial real estate portfolio consists almost exclusively of
loans secured by existing, multi-tenanted commercial real estate. 93% of our commercial real estate loan balances are secured by properties located in Texas.
Commercial and industrial (“C&I”) loans increased by $207.9 million, or 294.4%, to $278.5 million at December 31, 2012, from $70.6 million at December 31, 2011, with $112.0 million of this increase due to organic growth. $95.9 million of the increase was due to the Highlands acquisition. In 2012, the Company emphasized growth in the C&I line of business, and added experienced lenders both from the Highlands acquisition and new hires. During 2012, the Company established lending relationships with two banks in an effort to obtain energy loans by way of participations purchased. The Company was successful in purchasing energy loans and accumulated commitments in excess of $70 million during the year. The Company obtains required reserve valuations from an established third party engineering firm. At December 31, 2012, the Company had $48.1 million in energy (oil and gas) loans outstanding. Warehouse lines of credit increased by $16.6 million, or 102.8%, from $16.1 million at December 31, 2011, to $32.7 million at December 31, 2012.
Loans held for sale increased by $226.4 million, or 27.1%, to $1.06 billion at December 31, 2012, from $834.4 million at December 31, 2011, and at December 31, 2012, consisted of Warehouse Purchase Program loans purchased for sale under our standard loan participation agreement. The Company purchases a 100% participation interest in the loans originated by our mortgage banking company customers, which are then held as one- to four- family mortgage loans held for sale on a short-term basis. The mortgage banking company has no obligation to offer and we have no obligation to purchase these participation interests. The mortgage banking company closes mortgage loans consistent with underwriting standards established by approved investors and once the loan closes, the participation interest is delivered by the Company to the investor selected by the originator and approved by the Company. Loans funded by the Warehouse Purchase Program during 2012 consisted of 57% conforming and 43% government, with properties located in 49 states (all states except New York).
Pertinent information regarding the Warehouse Purchase Program is reflected below:
|
| | | | | | | |
| | At and For the Year Ended December 31, |
| | 2012 | | 2011 |
| | (Dollars in thousands) |
| Fee income generated for the year | $ | 4,453 |
| | $ | 2,920 |
|
| Interest income generated for the year | 31,521 |
| | 18,243 |
|
| Average outstanding balance per client | 28,500 |
| | 13,900 |
|
| Number of clients | 43 |
| | 36 |
|
| Range of approved maximum borrowing amounts | $10 million to $45 million |
| | $10 million to $35 million |
|
| Average utilization | 65 | % | | 77 | % |
One- to four-family loans decreased by $1.6 million, or 0.4%, to $378.3 million at December 31, 2012, from $379.9 million at December 31, 2011. $47.9 million in one- to four- family loans were acquired in the Highlands acquisition; net of the acquisition, one- to four- family loans decreased by $49.5 million. For the first seven months of 2012, prior to the VPM sale, VPM originated $201.3 million in one- to four-family mortgage loans, compared to $367.2 million during 2011.
Allowance for Loan Losses. The allowance for loan losses is maintained to cover losses that are estimated in accordance with U.S. generally accepted accounting principles. It is our estimate of credit losses in our loan portfolio at each balance sheet date. Our methodology for analyzing the allowance for loan losses consists of general and specific components.
For the general component, we stratify the loan portfolio into homogeneous groups of loans that possess similar loss potential characteristics and apply a loss ratio to these groups of loans to estimate the credit losses in the loan portfolio. We use both historical loss ratios and qualitative loss factors assigned to major loan collateral types to establish loss allocations. The historical loss ratio is generally defined as an average percentage of net annual loan losses to loans outstanding. Qualitative loss factors are based on management's judgment of company-specific data and external economic indicators which may not yet be reflective in the historical loss ratios and how this information could impact the Company's specific loan portfolios. The Allowance for Loan Loss Committee sets and adjusts qualitative loss factors by reviewing changes in loan composition and the seasonality of specific portfolios. The Allowance for Loan Loss Committee also considers credit quality and trends relating to delinquency, non-performing and/or classified loans and bankruptcy within the Company's loan portfolio when evaluating qualitative loss factors. Additionally, the Allowance for Loan Loss Committee adjusts qualitative factors periodically to account for the potential impact of external economic factors, including the unemployment rate, housing price, vacancy rates and inventory levels specific to our primary market area.
For the specific component, the allowance for loan losses on individually analyzed impaired loans includes commercial and industrial and one- to four-family and commercial real estate loans where management has concerns about the borrower's ability to repay. Loss estimates include the negative difference, if any, between the current fair value of the collateral or the estimated discounted cash flows and the loan amount due.
Loans acquired from Highlands were initially recorded at fair value, which included an estimate of credit losses expected to be realized over the remaining lives of the loans, and therefore no corresponding allowance for loan losses was recorded for these loans at acquisition. Methods utilized to estimate the required allowance for loan losses for acquired loans not deemed credit−impaired at acquisition are similar to originated loans; however, the estimate of loss is based on the unpaid principal balance less the remaining purchase discount.
Purchased credit impaired (PCI) loans are not considered nonperforming loans, and accordingly, are not included in the non-performing loans to total loans ratio as a numerator, but are included in total loans reflected in the denominator. The result is a downward trend in the ratio when compared to prior periods, assuming all other factors stay the same. Similarly, other asset quality ratios, such as the allowance for loan losses to total loans ratio will reflect a downward trend, assuming all other factors stay the same, due to the impact of PCI loans on the denominator with no corresponding impact in the numerator.
Our non-performing loans, which consist of nonaccrual loans, include both smaller balance homogeneous loans that are collectively evaluated for impairment and individually classified impaired loans. Loans are placed on nonaccrual status when the collection of principal and/or interest becomes doubtful or other factors involving the loan warrant placing the loan on nonaccrual status.
A modified loan is considered a troubled debt restructuring (“TDR”) when two conditions are met: 1) the borrower is experiencing financial difficulty and 2) concessions are made by the Company that would not otherwise be considered for a borrower or collateral with similar credit risk characteristics. Modifications to loan terms may include a modification of the contractual interest rate to a below-market rate (even if the modified rate is higher than the original rate), forgiveness of accrued interest, forgiveness of a portion of principal, an extended repayment period or a deed in lieu of foreclosure or other transfer of assets other than cash to fully or partially satisfy a debt. The Company's policy is to place all TDRs on nonaccrual for a minimum period of six months. Loans qualify for a return to accrual status once they have demonstrated performance with the restructured terms of the loan agreement for a minimum of six months and the collection of principal and interest under the revised terms is deemed probable. At December 31, 2012, of our $18.0 million in TDRs, $4.2 million were accruing interest and $13.8 million were classified as nonaccrual. Nonaccrual TDRs included $11.2 million attributable to six commercial real estate loans, five of which were performing in accordance with their restructured terms at December 31, 2012.
Our non-performing loans to total loans ratio at December 31, 2012, was 1.61%, compared to 1.88% at December 31, 2011. Non-performing loans increased by $4.1 million to $27.2 million at December 31, 2012, from $23.1 million at December 31, 2011. This increase was primarily due to three commercial lines of credit acquired in the Highlands acquisition totaling $2.8 million.
Securities. Our securities portfolio decreased by $286.6 million, or 30.7%, to $647.6 million at December 31, 2012, from $934.2 million at December 31, 2011. The decrease in our securities portfolio primarily resulted from paydowns and maturities totaling $751.0 million and sales of $133.6 million, which were partially offset by purchases totaling $516.1 million. The majority of these purchases were done for tax strategy purposes. The security sales were part of a change in interest earning asset mix strategy designed, in part, to replace lower yielding securities with higher yielding loans, provide funding for loan growth, and manage liquidity policy ratios. In addition, $86.3 million in securities were acquired in the Highlands transaction.
Deposits. Total deposits increased by $214.3 million, or 10.9%, to $2.18 billion at December 31, 2012, from $1.96 billion at December 31, 2011.
|
| | | | | | | | | | | | | | |
| | December 31, 2012 | | December 31, 2011 | | Dollar Change | | Percent Change |
| | (Dollars in thousands) |
| Non-interest-bearing demand | $ | 357,800 |
| | $ | 211,670 |
| | $ | 146,130 |
| | 69.0 | % |
| Interest-bearing demand | 488,748 |
| | 498,253 |
| | (9,505 | ) | | (1.9 | ) |
| Savings and money market | 880,924 |
| | 759,576 |
| | 121,348 |
| | 16.0 |
|
| Time | 450,334 |
| | 493,992 |
| | (43,658 | ) | | (8.8 | ) |
| Total deposits | $ | 2,177,806 |
| | $ | 1,963,491 |
| | $ | 214,315 |
| | 10.9 | % |
The increase in deposits was primarily due to $378.4 million in deposits acquired in the Highlands acquisition, which included $140.0 million in savings and money market, $121.2 million in time, $78.7 million in non-interest-bearing demand and $38.5 million in interest-bearing demand. Excluding the impact of the Highlands acquisition, deposits decreased by $164.1 million from December 31, 2011, to December 31, 2012. This decrease net of the Highlands acquisition was primarily due to a $164.9 million decline in time deposits, which resulted from a pricing strategy designed to reduce our time deposit rates and improve our net interest margin. Non-interest-bearing demand deposits, excluding the impact of Highlands' deposits, increased by $67.4 million, primarily due to growth in Warehouse Purchase Program checking deposits and commercial checking. The decline in interest-bearing demand deposits included a $46.9 million decline in Absolute Checking deposits.
Borrowings. FHLB advances, net of a $3.2 million restructuring prepayment penalty, increased by $145.8 million, or 19.5%, to $892.2 million at December 31, 2012, from $746.4 million at December 31, 2011. The outstanding balance of FHLB advances increased due to a higher Warehouse Purchase Program balance at December 31, 2012, of which a portion was strategically funded with short term advances. At December 31, 2012, the Company was eligible to borrow an additional $683.0 million from the FHLB. Additionally, the Company was eligible to borrow $105.8 million from the Federal Reserve Bank discount window and has five available federal funds lines of credit with other financial institutions totaling $140.0 million. In addition to FHLB advances, at December 31, 2012, the Company had a $25.0 million outstanding repurchase agreement with Credit Suisse.
The below table shows FHLB advances by maturity and weighted average rate at the end of the period:
|
| | | | | | |
| | Balance | | Weighted Average Rate |
| | (Dollars in thousands) |
| Less than 90 days | $ | 558,243 |
| | 0.17 | % |
| 90 days to less than one year | 142,891 |
| | 0.78 |
|
| One to three years | 98,258 |
| | 3.37 |
|
| After three to five years | 77,846 |
| | 2.91 |
|
| After five years | 18,163 |
| | 4.82 |
|
| | 895,401 |
| | 0.95 | % |
| Restructuring prepayment penalty | (3,193 | ) | | |
| Total | $ | 892,208 |
| | |
Shareholders’ Equity. Total shareholders' equity increased by $114.6 million, or 28.2% , to $520.9 million at December 31, 2012, from $406.3 million at December 31, 2011.
|
| | | | | | | | | | | | | | |
| | December 31, 2012 | | December 31, 2011 | | Dollar Change | | Percent Change |
| | (Dollars in thousands) |
| Common stock | $ | 396 |
| | $ | 337 |
| | $ | 59 |
| | 17.5 | % |
| Additional paid-in capital | 372,168 |
| | 279,473 |
| | 92,695 |
| | 33.2 |
|
| Retained earnings | 164,328 |
| | 144,535 |
| | 19,793 |
| | 13.7 |
|
| Accumulated other comprehensive income | 1,895 |
| | 1,347 |
| | 548 |
| | 40.7 |
|
| Unearned ESOP shares | (17,916 | ) | | (19,383 | ) | | 1,467 |
| | (7.6 | ) |
| Total shareholders’ equity | $ | 520,871 |
| | $ | 406,309 |
| | $ | 114,562 |
| | 28.2 | % |
The increase in shareholders' equity was primarily due to the Highlands acquisition, which was an all-stock transaction. Each outstanding share of Highlands' common stock, which totaled 8,307,911 shares at the time of the transaction, was exchanged for 0.6636 shares of Company stock, resulting in an increase of 5,513,061 shares of Company common stock. The transaction increased common stock by $55,000 and increased additional paid-in capital by $86.1 million. Additionally, retained earnings was increased by net income of $35.2 million recognized during 2012, partially offset by the payment of five quarterly dividends totaling $0.40 per common share. The December 2012 dividend of $0.10 per common share represented a dividend prepayment, as the Company does not expect to declare or pay a quarterly dividend in the first quarter of 2013. The dividends reduced retained earnings by $15.4 million during 2012.
Comparison of Results of Operation for the Years Ended December 31, 2012 and 2011
General. Net income for the year ended December 31, 2012 was $35.2 million, an increase of $8.9 million, or 33.9%, from net income of $26.3 million for the year ended December 31, 2011. The increase in net income was driven by an increase in net interest income of $33.2 million, partially offset by a $12.5 million increase in non-interest expense and a $4.9 million decrease in non-interest income. The increased non-interest expenses included acquisition costs of $4.1 million related to the Highlands acquisition, $129,000 in costs related to the sale of VPM, $755,000 in severance costs, and $308,000 in stock awarded to the Company's newly appointed CEO. Basic and diluted earnings per share for the year ended December 31, 2012, were $0.98, a $0.17 increase from $0.81 for the year ended December 31, 2011.
Interest Income. Interest income increased by $21.8 million, or 18.7%, to $138.0 million for the year ended December 31, 2012 from $116.2 million for the year ended December 31, 2011.
|
| | | | | | | | | | | | | | |
| | Year Ended December 31, | | Dollar | | Percent |
| | 2012 | | 2011 | | Change | | Change¹ |
| | (Dollars in thousands) |
| Interest and dividend income | | | | | | | |
| Loans, including fees | $ | 120,596 |
| | $ | 88,238 |
| | $ | 32,358 |
| | 36.7 | % |
| Securities | 16,741 |
| | 27,722 |
| | (10,981 | ) | | (39.6 | ) |
| Interest-bearing deposits in other financial institutions | 117 |
| | 170 |
| | (53 | ) | | (31.2 | ) |
| FHLB and Federal Reserve Bank stock | 538 |
| | 94 |
| | 444 |
| | 472.3 |
| | $ | 137,992 |
| | $ | 116,224 |
| | $ | 21,768 |
| | 18.7 | % |
The increase in interest income for the year ended December 31, 2012, compared to the year ended December 31, 2011, was primarily due to a $32.4 million, or 36.7% , increase in interest income on loans. Accretion associated with the Highlands acquisition contributed $3.8 million to the increase for the comparable periods. Interest income on loans held for sale (consisting primarily of Warehouse Purchase Program loans) increased $12.8 million, as the average balance increased by $345.6 million for the comparable years ended December 31, 2012 and 2011. Additionally, the average balance of commercial real estate loans increased by $201.6 million during the year ended December 31, 2012, compared to the year ended December 31, 2011, contributing an $11.1 million increase in interest income. The average balance of C&I loans for the year ended December 31, 2012, increased by $141.6 million from the same period in 2011, contributing a $7.4 million increase in interest income.
These increases were partially offset by an $11.0 million, or 39.6%, decline in interest on securities, which resulted primarily from the sale of securities and normal paydowns as well as a reduction in the yield on securities. Overall, the yield on interest-earning assets increased by 20 basis points, to 4.30% for the year ended December 31, 2012, from 4.10% for the year ended December 31, 2011, as a result of the shift of funds from lower yielding securities to higher yielding loans.
Interest Expense. Interest expense decreased by $11.4 million, or 34.1%, to $22.2 million for the year ended December 31, 2012, from $33.6 million for the year ended December 31, 2011.
|
| | | | | | | | | | | | | | |
| | Year Ended December 31, | | Dollar | | Percent |
| | 2012 | | 2011 | | Change | | Change |
| | (Dollars in thousands) |
| Interest expense | | | | | | | |
| Deposits | $ | 11,453 |
| | $ | 22,474 |
| | $ | (11,021 | ) | | (49.0 | )% |
| FHLB advances | 9,807 |
| | 9,882 |
| | (75 | ) | | (0.8 | ) |
| Repurchase agreement | 876 |
| | 816 |
| | 60 |
| | 7.4 |
|
| Other borrowings | 33 |
| | 474 |
| | (441 | ) | | (93.0 | ) |
| | $ | 22,169 |
| | $ | 33,646 |
| | $ | (11,477 | ) | | (34.1 | )% |
The decrease was primarily caused by an $11.0 million, or 49.0%, decrease in the interest expense paid on deposits. The decrease in interest expense on deposits was partially due to a $5.0 million decrease in interest expense on time accounts, as a result of a $140.7 million decline in the average balance during the year ended December 31, 2012, compared to the year ended December 31, 2011, and a 53 basis point decline in the average rate for the same periods. Additionally, interest expense
on interest-bearing demand deposits declined by $4.9 million, due to a 106 basis point decline in the average rate, from 1.77% for the year ended December 31, 2011, to 0.71% for the year ended December 31, 2012. Deposit costs have continued to decline due to rate reductions in Absolute Checking and other interest-bearing accounts. Interest expense on other borrowings decreased by $441,000, or 93.0%, due to the prepayment in October 2011 of four promissory notes totaling $10.0 million. Each of the four promissory notes had an interest rate of 6% per annum.
Net Interest Income. Net interest income increased by $33.2 million, or 40.3%, to $115.8 million for the year ended December 31, 2012, from $82.6 million for the year ended December 31, 2011. The net interest margin increased 70 basis points to 3.61% for the year ended December 31, 2012, from 2.91% for the same period last year. The net interest rate spread increased 78 basis points to 3.43% for the year ended December 31, 2012, from 2.65% for the same period last year. The increase in the net interest rate margin and spread was primarily attributable to changes in the earning asset mix, lower deposit and borrowing rates, and the impact of the Highlands acquisition. Net of the impact of the Highlands acquisition, the net interest margin for the year ended December 31, 2012 was 3.50%.
Provision for Loan Losses. The provision for loan losses was $3.1 million for the year ended December 31, 2012, a decrease of $831,000, or 20.9%, from $4.0 million for the year ended December 31, 2011. We feel our credit quality has improved due to continued improvement in economic conditions, enhancements in loan underwriting and oversight, as well as the addition of highly experienced commercial lending staff over the past year, both through the Highlands acquisition and new hires. Net charge-offs increased by $1.2 million during the year ended December 31, 2012, compared to the same period in 2011, primarily related to legacy Highlands loans (initially recorded at fair value), which had additional credit deterioration after acquisition.
Non-interest Income. Non-interest income decreased by $4.9 million, or 14.4%, to $29.6 million for the year ended December 31, 2012, from $34.5 million for the year ended December 31, 2011.
|
| | | | | | | | | | | | | | |
| | Year Ended December 31, | | Dollar | | Percent |
| | 2012 | | 2011 | | Change | | Change |
| | (Dollars in thousands) |
| Non-interest income | | | | | | | |
| Service charges and fees | $ | 19,512 |
| | $ | 18,556 |
| | $ | 956 |
| | 5.2 | % |
| Other charges and fees | 579 |
| | 723 |
| | (144 | ) | | (19.9 | ) |
| Net gain on sale of mortgage loans | 5,436 |
| | 7,639 |
| | (2,203 | ) | | (28.8 | ) |
| Bank-owned life insurance income | 699 |
| | 506 |
| | 193 |
| | 38.1 |
|
| Gain on sale of available for sale securities | 1,014 |
| | 6,268 |
| | (5,254 | ) | | (83.8 | ) |
| Loss on sale and disposition of assets | (191 | ) | | (798 | ) | | 607 |
| | (76.1 | ) |
| Impairment of goodwill | (818 | ) | | (271 | ) | | (547 | ) | | 201.8 |
| Other | 3,325 |
| | 1,925 |
| | 1,400 |
| | 72.7 |
|
| | $ | 29,556 |
| | $ | 34,548 |
| | $ | (4,992 | ) | | (14.4 | )% |
The decrease in non-interest income for the year ended December 31, 2012, compared to the year ended December 31, 2011, was primarily attributable to a $6.3 million gain on the sale of available for sale securities in 2011, compared to a gain of $1.0 million during the comparable period in 2012. This decrease was partially offset by a $1.4 million increase in other non-interest income, related to a $2.2 million increase in the value of an equity investment in a community development-oriented private equity fund used for Community Reinvestment Act purposes in 2012, compared to a value increase of $941,000 during the comparable period in 2011.
Net gain on the sale of mortgage loans decreased by $2.2 million, or 28.8%, as we closed out the pipeline from the sale of VPM, selling $179.2 million in loans during the year ended December 31 2012, compared to $268.8 million during the year ended December 31, 2011. Loss on sale and disposition of assets improved $607,000, primarily due to a decline in the value of a foreclosed commercial property in 2011 that was not repeated in 2012. The decrease in non-interest income was also a result of $1.1 million in losses associated with the sale of VPM, including the full impairment of VPM's remaining goodwill of $818,000 and $223,000 from fixed asset disposals.
Service charges and fees increased by $956,000, primarily due to a $1.5 million increase in Warehouse Purchase Program fee income and a $299,000 increase in commercial loan prepayment fees. These fee income increases were partially offset by a $681,000 decrease in non-sufficient funds fees, as less items were returned in 2012 compared to 2011, as well as a $444,000 decrease in debit card interchange income. On October 1, 2012, the Company began refunding all ATM fees charged
to customers with an Absolute Checking account, which will decrease future fee income. In the fourth quarter of 2012, $87,000 in ATM fees were refunded.
Non-interest Expense. Non-interest expense increased by $12.5 million, or 16.5%, to $87.7 million for the year ended December 31, 2012, from $75.2 million for the year ended December 31, 2011.
|
| | | | | | | | | | | | | | |
| | Year Ended December 31, | | Dollar | | Percent |
| | 2012 | | 2011 | | Change | | Change |
| | (Dollars in thousands) |
| Non-interest expense | | | | | | | |
| Salaries and employee benefits | $ | 51,719 |
| | $ | 47,360 |
| | $ | 4,359 |
| | 9.2 | % |
| Acquisition costs | 4,127 |
| | — |
| | 4,127 |
| | N/M |
| Advertising | 1,753 |
| | 1,519 |
| | 234 |
| | 15.4 |
|
| Occupancy and equipment | 7,365 |
| | 5,966 |
| | 1,399 |
| | 23.4 |
|
| Outside professional services | 2,320 |
| | 2,644 |
| | (324 | ) | | (12.3 | ) |
| Regulatory assessments | 2,534 |
| | 2,401 |
| | 133 |
| | 5.5 |
|
| Data processing | 6,109 |
| | 4,648 |
| | 1,461 |
| | 31.4 |
|
| Office operations | 7,144 |
| | 5,972 |
| | 1,172 |
| | 19.6 |
|
| Other | 4,619 |
| | 4,730 |
| | (111 | ) | | (2.3 | ) |
| | $ | 87,690 |
| | $ | 75,240 |
| | $ | 12,450 |
| | 16.5 | % |
¹ N/M - not meaningful
The increased non-interest expenses included Highlands-related acquisition costs of $4.1 million and $226,000 in severance costs (reported in salaries and employee benefits expense) related to the Highlands acquisition and the sale of VPM, as well as $529,000 in severance and benefit costs paid for the departures of our General Counsel and our Chief Operating Officer. Salaries and employee benefits expense increased by $4.4 million, or 9.2%, primarily due to the addition of employees from the Highlands acquisition, as well as adding three new ViewPoint Bank locations in mid to late 2011. This increase was partially offset by salary and benefit savings from the sale of VPM.
Occupancy and equipment expense increased $1.4 million, of which $1.0 million was due to the addition of the rent for buildings acquired in the Highlands acquisition. Data processing expenses increased $1.5 million, of which $433,000 was related to the Highlands acquisition, as well as increased software renewal costs. $475,000 of the increase in office operations expense was related to the Highlands acquisition and $598,000 was attributable to an ATM servicing project. Although VPM was sold in July 2012, $6.7 million in operating expenses were incurred during the year ended December 31, 2012, as the Company worked all loans in the pipeline until the loans were purchased by an investor or the Bank.
Income Tax Expense. During the year ended December 31 2012, we recognized income tax expense of $19.3 million on our pre-tax income, which was an effective tax rate of 35.4%, compared to income tax expense of $11.6 million, which was an effective tax rate of 30.6%, for the year ended December 31, 2011. The increase in the effective tax rate was primarily due to various individually immaterial adjustments to income tax expense recorded during the period.
Comparison of Results of Operation for the Years Ended December 31, 2011 and 2010
General. Net income for the year ended December 31, 2011, was $26.3 million, an increase of $8.5 million, or 47.9%, from net income of $17.8 million for the year ended December 31, 2010. Net income for the year ended December 31, 2011, included a $4.1 million net of tax gain on the sale of available for sale securities. The increase in net income was driven by higher net interest income, the gain on sale of securities and a lower provision for loan losses, and was partially offset by a $5.4 million decline in the net gain on sales of loans and a $2.1 million increase in non-interest expense. Our basic and diluted earnings per share for the year ended December 31, 2011, were $0.81, a $0.22 increase from $0.59 for the year ended December 31, 2010.
Interest Income. Interest income increased by $839,000, or 0.7%, from $115.4 million for the year ended December 31, 2010, to $116.2 million for the year ended December 31, 2011.
|
| | | | | | | | | | | | | | |
| | Year Ended December 31, | | Dollar | | Percent |
| | 2011 | | 2010 | | Change | | Change |
| | (Dollars in thousands) |
| Interest and dividend income | | | | | | | |
| Loans, including fees | $ | 88,238 |
| | $ | 88,550 |
| | $ | (312 | ) | | (0.4 | )% |
| Securities | 27,722 |
| | 26,365 |
| | 1,357 |
| | 5.1 |
|
| Interest bearing deposits in other financial institutions | 170 |
| | 402 |
| | (232 | ) | | (57.7 | ) |
| FHLB stock | 94 |
| | 68 |
| | 26 |
| | 38.2 |
|
| | $ | 116,224 |
| | $ | 115,385 |
| | $ | 839 |
| | 0.7 | % |
The increase in interest income was driven by a $1.4 million, or 5.1%, increase in the interest income earned on securities, which was attributable to a $3.9 million increase in the interest earned on agency collateralized mortgage obligations. Although the average yield on collateralized mortgage obligations declined by 56 basis points from the year ended December 31, 2010, compared to the same period in 2011, the average balance increased by $305.4 million. This increase in interest income from securities was partially offset by a $312,000 decline in interest income earned from loans. A $2.3 million increase in interest income on commercial real estate loans due to a $44.2 million increase in the average balance was offset by a $1.4 million decline in interest income on consumer loans due to lower volume and a $1.4 million decline in one- to four- family real estate interest income due to decreases in both loan volume and yield. Interest income on Warehouse Purchase Program balances increased by $270,000, as a $47.0 million increase in the average balance offset a 49 basis point decline in the average yield. Additionally, an $8.2 million increase in the average balance of commercial and industrial loans led to a $482,000 increase in interest earned in that loan category. Overall, the yield on interest-earning assets for the year ended December 31, 2011, decreased by 44 basis points, from 4.54% for the year ended December 31, 2010, to 4.10% for the same period in 2011.
Interest Expense. Interest expense decreased by $10.6 million, or 23.8%, from $44.2 million for the year ended December 31, 2010, to $33.6 million for the year ended December 31, 2011.
|
| | | | | | | | | | | | | | |
| | Year Ended December 31, | | Dollar | | Percent |
| | 2011 | | 2010 | | Change | | Change |
| | (Dollars in thousands) |
| Interest expense | | | | | | | |
| Deposits | $ | 22,474 |
| | $ | 31,015 |
| | $ | (8,541 | ) | | (27.5 | )% |
| FHLB advances | 9,882 |
| | 11,723 |
| | (1,841 | ) | | (15.7 | ) |
| Repurchase agreement | 816 |
| | 816 |
| | — |
| | — |
|
| Other borrowings | 474 |
| | 599 |
| | (125 | ) | | (20.9 | ) |
| | $ | 33,646 |
| | $ | 44,153 |
| | $ | (10,507 | ) | | (23.8 | )% |
The decrease was primarily caused by an $8.5 million, or 27.5%, decrease in the interest expense paid on deposits. Although the average balance of savings and money market accounts increased by $20.3 million, an 80 basis point decrease in the average rate led to a $5.6 million decline in interest expense on this deposit category. Additionally, a $31.3 million decrease in the average balance of time deposits, coupled with a 26 basis point rate decline, caused a $2.2 million decrease in interest expense on time deposits. The average balance of interest-bearing demand deposits increased by $95.6 million; however, the average rate declined by 63 basis points, leading to a $667,000 reduction in interest expense. Deposit cost has continued to decline due to gradual rate reductions in Absolute Checking and other interest-bearing deposit accounts.
Interest expense on borrowings decreased by $2.0 million, or 15.0%, as an $86.6 million increase in the average balance of borrowings was offset by a 99 basis point reduction in the average rate. The decrease in the average rate paid on borrowings was caused by the strategic decision to fund a portion of the increase in Warehouse Purchase Program balances with short-term advances. Additionally, in November 2010, $91.6 million in fixed-rate FHLB advances were modified. These advances, which had a weighted average rate of 4.15%, were prepaid and restructured with $91.6 million of new, lower-cost
FHLB advances with a weighted average rate of 1.79%, which contributed to the reduction in interest expense paid on FHLB advances. Also, in October 2011, the Company prepaid four promissory notes for unsecured loans totaling $10 million obtained from four local, private investors in October 2009. The notes could not be prepaid by the Company during the first two years of the loan term, but thereafter could be prepaid in whole or in part at any time without fee or penalty. Each of the four promissory notes had an interest rate of 6% per annum. Overall, the cost of interest-bearing liabilities decreased 60 basis points, from 2.05% for the year ended December 31, 2010, to 1.45% for the year ended December 31, 2011.
Net Interest Income. Net interest income increased by $11.4 million, or 15.9%, to $82.6 million for the year ended December 31, 2011, from $71.2 million for the year ended December 31, 2010. The net interest rate spread increased 16 basis points to 2.65% for the year ended December 31, 2011, from 2.49% for the same period last year. The net interest margin increased 11 basis points to 2.91% for the year ended December 31, 2011, from 2.80% for the same period last year. The increase in the net interest rate spread and margin was primarily attributable to lower deposit and borrowing rates.
Provision for Loan Losses. The provision for loan losses was $4.0 million for the year ended December 31, 2011, a decrease of $1.1 million, or 22.4%, from the year ended December 31, 2010. The balance of the allowance for loan losses increased by $2.6 million from December 31, 2010, to December 31, 2011, as management increased qualitative factors considered in determining the appropriateness of the allowance, due to the continued weak economic conditions and an increase in non-performing loans. Despite these trends, the Company has not seen an increase in charge-offs, as net charge-offs declined by $1.3 million from 2010 to 2011.
Non-interest Income. Non-interest income increased by $1.0 million, or 3.2%, from $33.5 million for the year ended December 31, 2010, to $34.5 million for the year ended December 31, 2011.
|
| | | | | | | | | | | | | | |
| | Year Ended December 31, | | Dollar | | Percent |
| | 2011 | | 2010 | | Change | | Change¹ |
| | (Dollars in thousands) |
| Non-interest income | | | | | | | |
| Service charges and fees | $ | 18,556 |
| | $ | 18,505 |
| | $ | 51 |
| | 0.3 | % |
| Other charges and fees | 723 |
| | 711 |
| | 12 |
| | 1.7 |
|
| Net gain on sale of mortgage loans | 7,639 |
| | 13,041 |
| | (5,402 | ) | | (41.4 | ) |
| Bank-owned life insurance income | 506 |
| | 384 |
| | 122 |
| | 31.8 |
|
| Gain on sale of available for sale securities | 6,268 |
| | — |
| | 6,268 |
| | N/M |
| Loss on sale and disposition of assets | (798 | ) | | (365 | ) | | (433 | ) | | 118.6 |
|
| Impairment of goodwill | (271 | ) | | — |
| | (271 | ) | | N/M |
| Other | 1,925 |
| | 1,188 |
| | 737 |
| | 62.0 |
|
| | $ | 34,548 |
| | $ | 33,464 |
| | $ | 1,084 |
| | 3.2 | % |
¹ N/M - not meaningful
The increase in non-interest income was primarily attributable to the sale of available for sale securities in 2011, which generated a pre-tax gain of $6.3 million. Proceeds from the sale totaled $279.4 million. This increase was partially offset by a $5.4 million, or 41.4%, decline in the net gain on sale of mortgage loans, as VPM sold $268.8 million in loans to outside investors in 2011, compared to $402.0 million in 2010. The decrease in sales can be attributed to the lower volume of one- to four-family loan originations in 2011 compared to the volume experienced during the prior year. Loss on sale and disposition of assets increased by $433,000 primarily due to value declines related to a commercial real estate foreclosed asset.
In June 2011, the Company impaired its goodwill by $271,000, reducing the goodwill balance from $1.1 million at December 31, 2010, to $818,000 at December 31, 2011. The goodwill resulted from the Bank's 2007 purchase of the assets of Bankers Financial Mortgage Group, Ltd (now VPM). Due to the downturn in mortgage market conditions, reduced earnings and loan production personnel changes, the Company performed an evaluation of its goodwill outside of the normal annual review cycle. This evaluation showed a $271,000 excess of carrying value of the goodwill over its fair value.
Service charges and fees increased by $51,000, as lower volume led non-sufficient funds fees to decline by $1.6 million, which was offset by a $1.2 million increase in debit card income due to increased debit card activity and a renegotiated debit card contract. Also, commercial fee income increased by $471,000, which resulted from pre-payment penalties on commercial real estate loans. Other non-interest income increased by $737,000 primarily due to the increase in the value of equity investments in two community development-oriented venture capital funds used for Community Reinvestment Act purposes.
Non-interest Expense. Non-interest expense increased by $2.1 million, or 2.9%, from $73.1 million for the year ended December 31, 2010, to $75.2 million for the year ended December 31, 2011.
|
| | | | | | | | | | | | | | |
| | Year Ended December 31, | | Dollar | | Percent |
| | 2011 | | 2010 | | Change | | Change |
| | (Dollars in thousands) |
| Non-interest expense | | | | | | | |
| Salaries and employee benefits | $ | 47,360 |
| | $ | 46,203 |
| | $ | 1,157 |
| | 2.5 | % |
| Advertising | 1,519 |
| | 1,285 |
| | 234 |
| | 18.2 |
|
| Occupancy and equipment | 5,966 |
| | 5,907 |
| | 59 |
| | 1.0 |
|
| Outside professional services | 2,644 |
| | 2,369 |
| | 275 |
| | 11.6 |
|
| Regulatory assessments | 2,401 |
| | 3,235 |
| | (834 | ) | | (25.8 | ) |
| Data processing | 4,648 |
| | 4,232 |
| | 416 |
| | 9.8 |
|
| Office operations | 5,972 |
| | 5,790 |
| | 182 |
| | 3.1 |
|
| Other | 4,730 |
| | 4,125 |
| | 605 |
| | 14.7 |
|
| | $ | 75,240 |
| | $ | 73,146 |
| | $ | 2,094 |
| | 2.9 | % |
The increase in non-interest expense was primarily due to a $1.2 million, or 2.5%, increase in salaries and employee benefits expense during the year ended December 31, 2011, compared to the same period in 2010, which increased primarily due to merit increases and staffing increases, as well as new community bank offices opened in Carrollton, Flower Mound and Lake Highlands. A staff reduction and lower commissions at VPM due to the decline in loan production offset salary increases by $2.2 million. Over the past year, we continued to hire new community bank presidents with experience in commercial and industrial lending, as well as additional compliance and back-office staff to assist in meeting our business strategies and to comply with increased regulatory requirements. Additionally, ESOP expense increased by $716,000 due to the shares purchased by the ESOP in the Conversion on July 6, 2010.
Outside professional services expense increased by $275,000, or 11.6%, in 2011 compared to 2010, primarily due to settlement and estimated legal expenses related to litigation. The majority of these expenses is attributable to a class action lawsuit alleging that the Company, the Bank and VPM improperly classified VPM's mortgage loan officers as exempt employees under the FLSA, and thereby failed to properly compensate them for overtime. At a mediation in September 2011 and without admitting liability, the parties agreed to settle the matter for $350,000. Data processing expense increased by $416,000, or 9.8%, primarily due to increased software renewal costs, while other non-interest expense increased by $605,000, or 14.7%, primarily due to costs relating to our pending acquisition of Highlands Bancshares, Inc. These increases were partially offset by an $834,000, or 25.8%, reduction in regulatory assessments due to the new FDIC fee structure, which uses assets less Tier One capital as an assessment base and resulted in a lower rate.
Income Tax Expense. During the year ended December 31, 2011, we recognized income tax expense of $11.6 million on our pre-tax income, which was an effective tax rate of 30.6%, compared to income tax expense of $8.6 million, which was an effective tax rate of 32.7%, for the year ended December 31, 2010. The decline in the effective tax rate was primarily due to various immaterial adjustments to income tax expense recorded during the period.
Average Balances, Net Interest Income, Yields Earned and Rates Paid
The following table presents, for the periods indicated, the total dollar amount of interest income from average interest earning assets and the resultant yields, as well as the interest expense on average interest bearing liabilities, expressed both in dollars and rates. Also presented are the weighted average yields on interest earning assets, rates paid on interest bearing liabilities and the resultant spread. All average balances are daily average balances. Non-accruing loans have been included in the table as loans carrying a zero yield.
|
| | | | | | | | | | | | | | | | | | | | | | | | | | | | | | | | |
| | Year Ended December 31, |
| | 2012 | | 2011 | | 2010 |
| | Average Outstanding Balance | | Interest Earned/Paid | | Yield/ Rate | | Average Outstanding Balance | | Interest Earned/Paid | | Yield/ Rate | | Average Outstanding Balance | | Interest Earned/Paid | | Yield/ Rate |
| | (Dollars in thousands) |
| Interest-earning assets: | | | | | | | | | | | | | | | | | |
| Commercial real estate | $ | 719,181 |
| | $ | 45,429 |
| | 6.32 | % | | $ | 517,592 |
| | $ | 34,320 |
| | 6.63 | % | | $ | 473,400 |
| | $ | 32,006 |
| | 6.76 | % |
| Commercial and industrial | 185,101 |
| | 10,112 |
| | 5.46 |
| | 43,512 |
| | 2,760 |
| | 6.34 |
| | 35,283 |
| | 2,278 |
| | 6.46 |
|
| One- to four- family real estate | 398,885 |
| | 21,392 |
| | 5.36 |
| | 378,578 |
| | 20,058 |
| | 5.30 |
| | 389,002 |
| | 21,422 |
| | 5.51 |
|
| Home equity/home improvement | 141,692 |
| | 7,851 |
| | 5.54 |
| | 140,713 |
| | 8,072 |
| | 5.74 |
| | 133,328 |
| | 8,025 |
| | 6.02 |
|
| Other consumer | 59,120 |
| | 3,610 |
| | 6.11 |
| | 54,756 |
| | 3,622 |
| | 6.61 |
| | 80,298 |
| | 5,038 |
| | 6.27 |
|
| Loans held for sale | 785,150 |
| | 32,202 |
| | 4.10 |
| | 439,533 |
| | 19,406 |
| | 4.42 |
| | 407,287 |
| | 19,781 |
| | 4.86 |
|
| Less: deferred fees and allowance for loan loss | (18,269 | ) | | — |
| | — |
| | (15,697 | ) | | — |
| | — |
| | (14,352 | ) | | — |
| | — |
|
Loans receivable 1 | 2,270,860 |
| | 120,596 |
| | 5.31 |
| | 1,558,987 |
| | 88,238 |
| | 5.66 |
| | 1,504,246 |
| | 88,550 |
| | 5.89 |
|
| Agency mortgage-backed securities | 331,308 |
| | 7,833 |
| | 2.36 |
| | 455,552 |
| | 12,583 |
| | 2.76 |
| | 466,536 |
| | 13,959 |
| | 2.99 |
|
| Agency collateralized mortgage obligations | 466,394 |
| | 6,909 |
| | 1.48 |
| | 666,861 |
| | 12,940 |
| | 1.94 |
| | 361,453 |
| | 9,025 |
| | 2.50 |
|
| Investment securities | 56,603 |
| | 1,999 |
| | 3.53 |
| | 62,410 |
| | 2,199 |
| | 3.52 |
| | 100,879 |
| | 3,381 |
| | 3.35 |
|
| FHLB and FRB stock | 39,548 |
| | 538 |
| | 1.36 |
| | 21,468 |
| | 94 |
| | 0.44 |
| | 16,939 |
| | 68 |
| | 0.40 |
|
| Interest earning deposit accounts | 43,669 |
| | 117 |
| | 0.27 |
| | 68,007 |
| | 170 |
| | 0.25 |
| | 90,614 |
| | 402 |
| | 0.44 |
|
| Total interest-earning assets | 3,208,382 |
| | 137,992 |
| | 4.30 |
| | 2,833,285 |
| | 116,224 |
| | 4.10 |
| | 2,540,667 |
| | 115,385 |
| | 4.54 |
|
| Non-interest-earning assets | 177,717 |
| | | | | | 134,562 |
| | | | | | 157,703 |
| | | | |
| Total assets | $ | 3,386,099 |
| | | | | | $ | 2,967,847 |
| | | | | | $ | 2,698,370 |
| | | | |
| Interest-bearing liabilities: | | | | | | | | | | | | | | | | | |
| Interest-bearing demand | $ | 479,209 |
| | 3,391 |
| | 0.71 |
| | $ | 469,715 |
| | 8,309 |
| | 1.77 |
| | $ | 374,083 |
| | 8,976 |
| | 2.40 |
|
| Savings and money market | 859,119 |
| | 2,340 |
| | 0.27 |
| | 738,503 |
| | 3,466 |
| | 0.47 |
| | 718,224 |
| | 9,102 |
| | 1.27 |
|
| Time | 487,040 |
| | 5,722 |
| | 1.17 |
| | 627,736 |
| | 10,699 |
| | 1.70 |
| | 658,988 |
| | 12,937 |
| | 1.96 |
|
| Borrowings | 718,265 |
| | 10,716 |
| | 1.49 |
| | 486,519 |
| | 11,172 |
| | 2.30 |
| | 399,880 |
| | 13,138 |
| | 3.29 |
|
| Total interest-bearing liabilities | 2,543,633 |
| | 22,169 |
| | 0.87 |
| | 2,322,473 |
| | 33,646 |
| | 1.45 |
| | 2,151,175 |
| | 44,153 |
| | 2.05 |
|
| Non-interest-bearing demand | 306,788 |
| | | | | | 195,278 |
| | | | | | 183,720 |
| | | | |
| Non-interest-bearing liabilities | 48,076 |
| | | | | | 41,832 |
| | | | | | 50,853 |
| | | | |
| Total liabilities | 2,898,497 |
| | | | | | 2,559,583 |
| | | | | | 2,385,748 |
| | | | |
| Total shareholders’ equity | 487,602 |
| | | | | | 408,264 |
| | | | | | 312,622 |
| | | | |
| Total liabilities and shareholders’ equity | $ | 3,386,099 |
| | | | | | $ | 2,967,847 |
| | | | | | $ | 2,698,370 |
| | | | |
| Net interest income and margin | | | $ | 115,823 |
| | 3.61 | % | | | | $ | 82,578 |
| | 2.91 | % | | | | $ | 71,232 |
| | 2.80 | % |
Net interest income and margin (tax-equivalent basis) 2 | | | $ | 116,510 |
| | 3.63 | % | | | | $ | 83,273 |
| | 2.94 | % | | | | $ | 72,096 |
| | 2.84 | % |
| Net interest rate spread | | | | | 3.43 | % | | | | | | 2.65 | % | | | | | | 2.49 | % |
| Net earning assets | $ | 664,749 |
| | | | | | $ | 510,812 |
| | | | | | $ | 389,492 |
| | | | |
| Average interest-earning assets to average interest-bearing liabilities | 126.13 | % | | | | | | 121.99 | % | | | | | | 118.11 | % | | | | |
|
| |
1 | Calculated net of deferred fees, loan discounts, loans in process and allowance for loan losses. Includes loans held for sale. |
| | |
2 | In order to make pretax income and resultant yields on tax-exempt investments and loans comparable to those on taxable investments and loans, a tax-equivalent adjustment has been computed using a federal income tax rate of 35% for 2012, 2011 and 2010. Tax-exempt investments and loans had an average balance of $52.3 million, $52.6 million and $41.7 million for the years ended December 31, 2012, 2011 and 2010, respectively.
|
Rate/Volume Analysis
The following schedule presents the dollar amount of changes in interest income and interest expense for major components of interest earning assets and interest bearing liabilities. It distinguishes between the changes related to outstanding balances and those due to changes in interest rates. The change in interest attributable to rate has been determined by applying the change in rate between periods to average balances outstanding in the earlier period. The change in interest due to volume has been determined by applying the rate from the earlier period to the change in average balances outstanding between periods. Changes attributable to both rate and volume which cannot be segregated have been allocated proportionately based on the changes due to rate and the changes due to volume.
|
| | | | | | | | | | | | | | | | | | | | | | | |
| | Year Ended December 31, |
| | 2012 versus 2011 | | 2011 versus 2010 |
| | Increase (Decrease) Due to | | Total Increase | | Increase (Decrease) Due to | | Total Increase |
| | Volume | | Rate | | (Decrease) | | Volume | | Rate | | (Decrease) |
| | (Dollars in thousands) |
| Interest-earning assets: | | | | | | | | | | | |
| Commercial real estate | $ | 12,803 |
| | $ | (1,694 | ) | | $ | 11,109 |
| | $ | 2,940 |
| | $ | (626 | ) | | $ | 2,314 |
|
| Commercial and industrial | 7,786 |
| | (434 | ) | | 7,352 |
| | 523 |
| | (41 | ) | | 482 |
|
| One- to four- family real estate | 1,087 |
| | 247 |
| | 1,334 |
| | (565 | ) | | (799 | ) | | (1,364 | ) |
| Home equity/home improvement | 56 |
| | (277 | ) | | (221 | ) | | 433 |
| | (386 | ) | | 47 |
|
| Other consumer | 277 |
| | (289 | ) | | (12 | ) | | (1,677 | ) | | 261 |
| | (1,416 | ) |
| Loans held for sale | 14,265 |
| | (1,469 | ) | | 12,796 |
| | 1,458 |
| | (1,833 | ) | | (375 | ) |
| Loans receivable | 36,274 |
| | (3,916 | ) | | 32,358 |
| | 3,112 |
| | (3,424 | ) | | (312 | ) |
| Agency mortgage-backed securities | (3,108 | ) | | (1,642 | ) | | (4,750 | ) | | (323 | ) | | (1,053 | ) | | (1,376 | ) |
| Agency collateralized mortgage obligations | (3,375 | ) | | (2,656 | ) | | (6,031 | ) | | 6,281 |
| | (2,366 | ) | | 3,915 |
|
| Investment securities | (205 | ) | | 5 |
| | (200 | ) | | (1,348 | ) | | 166 |
| | (1,182 | ) |
| FHLB and FRB stock | 127 |
| | 317 |
| | 444 |
| | 19 |
| | 7 |
| | 26 |
|
| Interest earning deposit accounts | (64 | ) | | 11 |
| | (53 | ) | | (84 | ) | | (148 | ) | | (232 | ) |
| Total interest-earning assets | 29,649 |
| | (7,881 | ) | | 21,768 |
| | 7,657 |
| | (6,818 | ) | | 839 |
|
| Interest-bearing liabilities: | | | | | | | | | | | |
| Interest-bearing demand | 165 |
| | (5,083 | ) | | (4,918 | ) | | 1,997 |
| | (2,664 | ) | | (667 | ) |
| Savings and money market | 500 |
| | (1,626 | ) | | (1,126 | ) | | 250 |
| | (5,886 | ) | | (5,636 | ) |
| Time | (2,086 | ) | | (2,891 | ) | | (4,977 | ) | | (592 | ) | | (1,646 | ) | | (2,238 | ) |
| Borrowings | 4,247 |
| | (4,703 | ) | | (456 | ) | | 2,488 |
| | (4,454 | ) | | (1,966 | ) |
| Total interest bearing liabilities | 2,826 |
| | (14,303 | ) | | (11,477 | ) | | 4,143 |
| | (14,650 | ) | | (10,507 | ) |
| Net interest income | $ | 26,823 |
| | $ | 6,422 |
| | $ | 33,245 |
| | $ | 3,514 |
| | $ | 7,832 |
| | $ | 11,346 |
|
Liquidity
Management maintains a liquidity position that it believes will adequately provide funding for loan demand and deposit run-off that may occur in the normal course of business. The Company relies on a number of different sources in order to meet its potential liquidity demands. The primary sources are increases in deposit accounts and cash flows from loan payments and the securities portfolio.
Planning for the Company's normal business liquidity needs, both expected and unexpected, is done on a daily and short-term basis through the cash management function. On a longer-term basis it is accomplished through the budget and strategic planning functions, with support from internal asset/liability management software model projections.
The Liquidity Committee monitors liquidity positions and projections, and adds liquidity contingency planning to the process by focusing on possible scenarios that would stress liquidity beyond the Bank's normal business liquidity needs. These scenarios may include macro economics and bank specific situations focusing on high probability-high impact, high
probability-low impact, low probability-high impact, and low probability-low impact stressors.
Management recognizes that the events and their severity of liquidity stress leading up to and occurring during a liquidity stress event cannot be precisely defined or listed. Nevertheless, management believes that liquidity stress events can be categorized into sources and uses of liquidity, and levels of severity, with responses that apply to various situations.
In addition to the primary sources of funds, management has several secondary sources available to meet potential funding requirements. As of December 31, 2012, the Company had an additional borrowing capacity of $683.0 million with the FHLB. Also, at December 31, 2012, the Company had $140.0 million in federal funds lines of credit available with other financial institutions. The Company may also use the discount window at the Federal Reserve Bank as a source of short-term funding. Federal Reserve Bank borrowing capacity varies based upon securities pledged to the discount window line. As of December 31, 2012, securities pledged had a collateral value of $105.8 million.
As of December 31, 2012, the Company had classified 44.3% of its securities portfolio as available for sale (including pledged securities), providing an additional source of liquidity. Management believes that because active markets exist and our securities portfolio is of high quality, our available for sale securities are marketable. Participations in loans we originate, including portions of commercial real estate loans, are sold to create another source of liquidity and to manage borrower concentration risk as well as interest rate risk.
Liquidity management is both a daily and long-term function of business management. Short term excess liquidity is generally placed in short-term investments, such as overnight deposits and federal funds sold. On a longer term basis, we maintain a strategy of investing in various lending products and investment securities, including mortgage-backed securities.
The Company is a separate legal entity from the Bank and must provide for its own liquidity. In addition to its operating expenses, the Company is responsible for paying any dividends declared to its shareholders. The Company's primary source of funds consists of the net proceeds retained by the Company from our initial public offering in 2006 and our “second-step” offering in July 2010. We also have the ability to receive dividends or capital distributions from the Bank, although there are regulatory restrictions on the ability of the Bank to pay dividends. At December 31, 2012, the Company (on an unconsolidated basis) had liquid assets of $47.6 million.
The Company uses its sources of funds primarily to meet its ongoing commitments, pay maturing deposits and fund withdrawals, and to fund loan commitments. Total approved loan commitments (including Warehouse Purchase Program commitments, unused lines of credit and letters of credit) amounted to $500.2 million and $437.4 million at December 31, 2012, and December 31, 2011, respectively. It is management's policy to offer deposit rates that are competitive with other local financial institutions. Based on this management strategy, we believe that a majority of maturing deposits will remain with the Company. Certificates of deposit scheduled to mature in one year or less at December 31, 2012 totaled $352.9 million with a weighted average rate of 1.15%.
During the year ended December 31, 2012, cash and cash equivalents increased by $22.3 million, or 48.2%, to $68.7 million as of December 31, 2012, from $46.3 million as of December 31, 2011. Cash provided by investing activities of $283.9 million offset cash used by financing activities of $93.8 million and cash used in operating activities of $167.7 million. Primary sources of cash for the year ended December 31, 2012 included proceeds from the sale of loans held for sale of $12.53 billion (primarily related to our Warehouse Purchase Program), maturities, prepayments and calls of available-for-sale securities of $614.4 million and proceeds from FHLB advances of $634.0 million. Primary uses of cash for the year ended December 31, 2012, included loans originated or purchased for sale of $12.76 billion (primarily related to our Warehouse Purchase Program), purchases of available-for-sale securities of $516.1 million and repayments on FHLB advances of $488.2 million.
During 2011, cash and cash equivalents decreased by $22.4 million, or 32.5%, from $68.7 million as of December 31, 2010, to $46.3 million as of December 31, 2011. Cash used in operating activities of $294.2 million offset cash provided by investing activities of $70.6 million and cash provided by financing activities of $201.2 million. Primary sources of cash for the year ended December 31, 2011 included proceeds from the sale of loans held for sale of $7.54 billion (primarily related to our Warehouse Purchase Program), maturities, prepayments and calls of available-for-sale securities of $551.2 million and proceeds from FHLB advances of $502.5 million. Primary uses of cash for the year ended December 31, 2011, included loans originated or purchased for sale of $7.87 billion (primarily related to our Warehouse Purchase Program), purchases of available-for-sale securities of $544.2 million, repayments on FHLB advances of $217.3 million and purchases of held-to-maturity securities of $184.1 million.
Please see Item 1A (Risk Factors) under Part 1 of this Form 10-K for information regarding liquidity risk.
Off-Balance Sheet Arrangements, Contractual Obligations and Commitments
The following table presents our longer term, non-deposit related, contractual obligations and commitments to extend credit to our borrowers, in aggregate and by payment due dates (not including any interest amounts). In addition to the commitments below, the Company had overdraft protection available to its depositors in the amount of $79.4 million at December 31, 2012.
|
| | | | | | | | | | | | | | | | | | | |
| | December 31, 2012 |
| | Less than One Year | | One through Three Years | | Four through Five Years | | After Five Years | | Total |
| | (Dollars in thousands) |
| Contractual obligations: | | | | | | | | | |
| Deposits without a stated maturity | $ | 1,727,472 |
| | $ | — |
| | $ | — |
| | $ | — |
| | $ | 1,727,472 |
|
| Certificates of deposit | 352,917 |
| | 76,232 |
| | 19,344 |
| | 1,841 |
| | 450,334 |
|
| FHLB advances (gross of restructuring prepayment penalty of $3,193) | 701,134 |
| | 98,258 |
| | 77,846 |
| | 18,163 |
| | 895,401 |
|
| Repurchase agreement | — |
| | — |
| | — |
| | 25,000 |
| | 25,000 |
|
| Private equity fund for Community Reinvestment Act purposes | 2,000 |
| | — |
| | — |
| | — |
| | 2,000 |
|
| Operating leases (premises) | 2,374 |
| | 4,559 |
| | 3,343 |
| | 5,921 |
| | 16,197 |
|
| Total contractual obligations | $ | 2,785,897 |
| | $ | 179,049 |
| | $ | 100,533 |
| | $ | 50,925 |
| | 3,116,404 |
|
Off-balance sheet loan commitments: 1 | | | | | | | | | |
| Unused commitments to extend credit | $ | 219,284 |
| | $ | — |
| | $ | — |
| | $ | — |
| | 219,284 |
|
| Unused commitment on Warehouse Purchase Program loans | 278,780 |
| | — |
| | — |
| | — |
| | 278,780 |
|
| Standby letters of credit | 2,155 |
| | — |
| | — |
| | — |
| | 2,155 |
|
| Total loan commitments | $ | 500,219 |
| | $ | — |
| | $ | — |
| | $ | — |
| | 500,219 |
|
| Total contractual obligations and loan commitments | | | | | | | | | $ | 3,616,623 |
|
|
| | |
| | | |
1 | | Loans having no stated maturity are reported in the “Less than One Year” category. |
Capital Resources
The Bank and the Company are subject to minimum capital requirements imposed by the OCC and the FRB. Consistent with our goal to operate a sound and profitable organization, our policy is for the Bank and the Company to maintain “well-capitalized” status under the capital categories of the OCC and the FRB. Based on capital levels at December 31, 2012, and 2011, the Bank and the Company were considered to be well-capitalized. See “How We Are Regulated - Regulatory Capital Requirements.”
At December 31, 2012, the Bank's equity totaled $419.9 million. The Company's consolidated equity totaled $520.9 million, or 14.2% of total assets, at December 31, 2012.
|
| | | | | | | | | | | | | | | | | | | | |
| | Actual | | Required for Capital Adequacy Purposes | | To Be Well-Capitalized Under Prompt Corrective Action Regulations |
| | Amount | | Ratio | | Amount | | Ratio | | Amount | | Ratio |
| December 31, 2012 | (Dollars in Thousands) |
| Total risk-based capital | | | | | | | | | | | |
| the Company | $ | 505,566 |
| | 22.47 | % | | $ | 179,957 |
| | 8.00 | % | | 224,947 |
| | 10.00 | % |
| the Bank | 404,562 |
| | 18.00 |
| | 179,847 |
| | 8.00 |
| | 224,809 |
| | 10.00 |
|
| Tier 1 risk-based capital | | | | | | | | | | | |
| the Company | 487,515 |
| | 21.67 |
| | 89,979 |
| | 4.00 |
| | 134,968 |
| | 6.00 |
|
| the Bank | 386,511 |
| | 17.19 |
| | 89,923 |
| | 4.00 |
| | 134,885 |
| | 6.00 |
|
| Tier 1 leverage | | | | | | | | | | | |
| the Company | 487,515 |
| | 13.97 |
| | 139,620 |
| | 4.00 |
| | 174,525 |
| | 5.00 |
|
| the Bank | 386,511 |
| | 11.08 |
| | 139,595 |
| | 4.00 |
| | 174,493 |
| | 5.00 |
|
| | | | | | | | | | | | |
| December 31, 2011 | | | | | | | | | | | |
| Total risk-based capital | | | | | | | | | | | |
| the Company | $ | 421,185 |
| | 25.46 | % | | $ | 132,336 |
| | 8.00 | % | | $ | 165,421 |
| | 10.00 | % |
| the Bank | 336,694 |
| | 20.36 |
| | 132,279 |
| | 8.00 |
| | 165,349 |
| | 10.00 |
|
| Tier 1 risk-based capital | | | | | | | | | | | |
| the Company | 403,698 |
| | 24.40 |
| | 66,168 |
| | 4.00 |
| | 99,252 |
| | 6.00 |
|
| the Bank | 319,207 |
| | 19.31 |
| | 66,140 |
| | 4.00 |
| | 99,209 |
| | 6.00 |
|
| Tier 1 leverage | | | | | | | | | | | |
| the Company | 403,698 |
| | 12.58 |
| | 128,398 |
| | 4.00 |
| | 160,498 |
| | 5.00 |
|
| the Bank | 319,207 |
| | 9.94 |
| | 128,517 |
| | 4.00 |
| | 160,647 |
| | 5.00 |
|
Impact of Inflation
The effects of price changes and inflation can vary substantially for most financial institutions. While management believes that inflation affects the economic value of total assets, it believes that it is difficult to assess the overall impact. Management believes this to be the case due to the fact that generally neither the timing nor the magnitude of changes in the consumer price index (“CPI”) coincides with changes in interest rates or asset values. For example, the price of one or more of the components of the CPI may fluctuate considerably, influencing composite CPI, without having a corresponding effect on interest rates, asset values, or the cost of those goods and services normally purchased by the Bank. In years of high inflation, intermediate and long-term interest rates tend to increase, adversely impacting the market values of investment securities, mortgage loans and other long-term fixed rate loans. In addition, high inflation may lead to higher short-term interest rates, which tend to increase the cost of funds. In years of low inflation, the opposite may occur.
Recent Accounting Pronouncements
For discussion of Recent Accounting Pronouncements, please see Note 1 — Adoption of New Accounting Standards and Note 1 — Effect of Newly Issued But Not Yet Effective Accounting Standards of the Notes to Consolidated Financial Statements under Item 8 of this report
|
| |
| Item 7A. | Quantitative and Qualitative Disclosures about Market Risk |
Asset/Liability Management
Our Risk When Interest Rates Change. The rates of interest we earn on assets and pay on liabilities generally are established contractually for a period of time. However, market rates change over time. Like other financial institutions, our results of operations are impacted by changes in market interest rates and the interest rate sensitivity of our assets and liabilities. The risk associated with changes in market interest rates and our ability to adapt to these changes is known as interest rate risk and is our most significant market risk.
How We Measure Our Risk of Interest Rate Changes. As part of our attempt to manage our exposure to changes in market interest rates and comply with applicable regulations, we calculate and monitor our interest rate risk. In doing so, we analyze and manage assets and liabilities based on their interest rates and contractual cash flows, timing of maturities, prepayment potential, repricing opportunities, and sensitivity to actual or potential changes in market interest rates.
The Company is subject to interest rate risk to the extent that its interest bearing liabilities, primarily deposits, FHLB advances and other borrowings, reprice more rapidly or slowly, or at different rates (basis risk) than its interest earning assets, primarily loans and investment securities.
The Bank calculates interest rate risk by entering relevant contractual and projected information into the asset/liability management software simulation model. Data required by the model includes balance, rate, pay down schedule, and maturity. For items that contractually reprice, the repricing index, spread, and frequency are entered, including any initial, periodic, and lifetime interest rate caps and floors.
The Bank has adopted an asset and liability management policy. This policy sets the foundation for monitoring and managing the potential for adverse effects of material prolonged increases or decreases in interest rates on our results of operations. The Board of Directors sets the asset and liability policy for the Bank, which is implemented by the Asset/Liability Management Committee.
The purpose of the Asset/Liability Management Committee is to monitor, communicate, coordinate, and direct asset/liability management consistent with our business plan and board-approved policies. The committee directs and monitors the volume and mix of assets and funding sources, taking into account relative costs and spreads, interest rate sensitivity and liquidity needs. The objectives are to manage assets and funding sources to produce results that are consistent with liquidity, capital adequacy, interest rate risk, growth, and profitability goals.
The Committee meets on a bimonthly basis to, among other things, protect capital through earnings stability over the interest rate cycle; maintain our well-capitalized status; and provide a reasonable return on investment. The Committee recommends appropriate strategy changes based on this review. The Committee is responsible for reviewing and reporting the effects of policy implementation and strategies to the Board of Directors at least quarterly. In addition, two outside members of the Board of Directors are on the Asset/Liability Management Committee. Senior managers oversee the process on a daily basis.
A key element of the Bank’s asset/liability management strategy is to protect earnings by managing the inherent maturity and repricing mismatches between its interest earning assets and interest bearing liabilities. The Bank generally manages such earnings exposure through the addition of loans, investment securities and deposits with risk mitigating characteristics and by entering into appropriate term FHLB advance agreements.
As part of its efforts to monitor and manage interest rate risk, the Bank uses the economic value of equity (“EVE”) methodology adopted by the OCC as part of its capital regulations. In essence, the EVE approach calculates the difference between the present value of expected cash flows from assets and liabilities. In addition to monitoring selected measures of EVE, management also calculates and monitors potential effects on net interest income resulting from increases or decreases in market interest rates. This approach uses the earnings at risk (“EAR”) methodology adopted by the OCC as part of its capital regulations. EAR calculates estimated net interest income using a flat balance sheet approach over a twelve month time horizon. The EAR process is used in conjunction with EVE measures to identify interest rate risk on both a global and account level basis. Management and the Board of Directors review EVE and EAR measurements at least quarterly to determine whether the Bank's interest rate exposure is within the limits established by the Board of Directors.
The Bank's asset/liability management strategy sets acceptable limits for the percentage change in EVE and EAR given changes in interest rates. For an instantaneous, parallel, and sustained interest rate increase or decrease of 100 basis points, the Bank's policy indicates that the EVE ratio should not fall below 7.00%, and for increases of 200, 300 and 400 basis points, the EVE ratio should not fall below 6.00%, 5.25% and 5.00%, respectively. For an instantaneous, parallel, and sustained interest rate increase or decrease of 100 basis points, the Bank's policy indicates that EAR should not decrease by more than 7%, and for increases of 200, 300, and 400 basis points, EAR should not decrease by more than 10%, 13%, and 15%, respectively.
As illustrated in the tables below, the Bank was within policy limits for all scenarios tested. The tables presented below, as of December 31, 2012, and December 31, 2011, are internal analyses of our interest rate risk as measured by changes in EVE and EAR for instantaneous, parallel, and sustained shifts for all market rates and yield curves, in 100 basis point increments, up 400 basis points and down 100 basis points.
As illustrated in the tables below, our EVE would be positively impacted by a parallel, instantaneous, and sustained increase in market rates. Such an increase in rates would positively impact EVE as a result of the duration of assets, including loans and investments, being shorter than the duration of liabilities, primarily deposit accounts and FHLB borrowings. As interest rates rise, the market value of fixed rate advances and retail deposits declines due to longer maturities and contractual rates lower than market rates. As illustrated in the table below at December 31, 2012, our EAR would be positively impacted by a parallel, instantaneous, and sustained increase in market rates of 300 or 400 basis points. As market interest rates rise and variable loan rates move above their floors, the interest rate repricing of variable rate and maturing loans and securities increases net interest income.
|
| | | | | | | | | | | | | | | | | | | | | |
| December 31, 2012 |
| Change in Interest Rates in Basis Points | | Economic Value of Equity | | Earnings at Risk (12 months) |
| | Estimated EVE | | Estimated Increase / (Decrease) in EVE | | EVE Ratio % | | Estimated Net Interest Income | | Increase / (Decrease) in Estimated Net Interest Income |
| | | $ Amount | | $ Change | | % Change | | | | $ Amount | | $ Change | | % Change |
| | | (Dollars in thousands) |
| 400 |
| | 534,416 |
| | 18,473 |
| | 3.58 |
| | 15.40 | | 140,514 |
| | 11,608 |
| | 9.01 |
|
| 300 |
| | 541,071 |
| | 25,128 |
| | 4.87 |
| | 15.31 | | 134,215 |
| | 5,309 |
| | 4.12 |
|
| 200 |
| | 541,636 |
| | 25,693 |
| | 4.98 |
| | 15.07 | | 127,916 |
| | (990 | ) | | (0.77 | ) |
| 100 |
| | 534,009 |
| | 18,066 |
| | 3.50 |
| | 14.62 | | 125,333 |
| | (3,573 | ) | | (2.77 | ) |
| — |
| | 515,943 |
| | — |
| | — |
| | 13.94 | | 128,906 |
| | — |
| | — |
|
| (100 | ) | | 493,055 |
| | (22,888 | ) | | (4.44 | ) | | 13.15 | | 127,524 |
| | (1,382 | ) | | (1.07 | ) |
|
| | | | | | | | | | | | | | | | | | | | | |
| December 31, 2011 |
| Change in Interest Rates in Basis Points | | Economic Value of Equity | | Earnings at Risk (12 months) |
| | Estimated EVE | | Estimated Increase / (Decrease) in EVE | | EVE Ratio % | | Estimated Net Interest Income | | Increase / (Decrease) in Estimated Net Interest Income |
| | | $ Amount | | $ Change | | % Change | | | | $ Amount | | $ Change | | % Change |
| | | (Dollars in thousands) |
| 400 |
| | 392,825 |
| | (17,571 | ) | | (4.28 | ) | | 13.22 | | 93,440 |
| | 10,734 |
| | 12.98 |
|
| 300 |
| | 410,840 |
| | 444 |
| | 0.11 |
| | 13.51 | | 89,242 |
| | 6,536 |
| | 7.90 |
|
| 200 |
| | 420,598 |
| | 10,202 |
| | 2.49 |
| | 13.54 | | 84,896 |
| | 2,190 |
| | 2.65 |
|
| 100 |
| | 421,130 |
| | 10,734 |
| | 2.62 |
| | 13.30 | | 80,798 |
| | (1,908 | ) | | (2.31 | ) |
| — |
| | 410,396 |
| | — |
| | — |
| | 12.75 | | 82,706 |
| | — |
| | — |
|
| (100 | ) | | 383,397 |
| | (26,999 | ) | | (6.58 | ) | | 11.76 | | 85,652 |
| | 2,946 |
| | 3.56 |
|
The Bank's EVE was $515.9 million, or 13.94%, of the market value of portfolio assets as of December 31, 2012, a $105.5 million increase from $410.4 million, or 12.75%, of the market value of portfolio assets as of December 31, 2011. Based upon the assumptions utilized, an immediate 200 basis point increase in market interest rates would result in a $25.7 million increase in our EVE at December 31, 2012, compared to a $10.2 million increase at December 31, 2011, and would result in a 113 basis point increase in our EVE ratio to 15.07% at December 31, 2012, as compared to a 79 basis point increase to 13.54% at December 31, 2011. An immediate 100 basis point decrease in market interest rates would result in a $22.9 million decrease in our EVE at December 31, 2012, compared to $27.0 million increase at December 31, 2011, and would result in a 79 basis point decrease in our EVE ratio to 13.15% at December 31, 2012, as compared to a 99 basis point decrease in our EVE ratio to 11.76% at December 31, 2011.
A research study of the bank’s non-maturity deposit accounts has been completed. In this study, decay rates, repricing betas, and customer behavior were analyzed over time on an individual account level basis. The results were aggregated by product, with recommendations which were subsequently implemented. The updated account assumptions resulted in an increase to the overall projected duration of the non-maturity deposit account portfolio.
The Bank's EAR for the twelve months ending December 31, 2013 is measured at $128.9 million, compared to $82.7 million for the twelve months ending December 31, 2012. Based on the assumptions utilized, an immediate 200 basis point increase in market rates would result in a $990 thousand, or 0.77%, decrease in net interest income for the twelve months ending December 31, 2013, compared to a $2.2 million, or 2.65%, increase for the twelve months ending December 31, 2012. An immediate 100 basis point decrease in market rates would result in a $1.4 million decrease in net interest income for the twelve months ending December 31, 2013, compared to a $2.9 million increase for the twelve months ending December 31, 2012.
We have implemented a strategic plan to mitigate interest rate risk. This plan includes the ongoing review of our mix of fixed rate versus variable rate loans, investments, deposits, and borrowings. When available and appropriate, high quality adjustable rate assets are purchased or originated. These assets generally may reduce our sensitivity to upward interest rate shocks. On the liability side of the balance sheet, borrowings are added as appropriate. These borrowings will be of a size and term so as to mitigate the impact of duration mismatches, reducing our sensitivity to upward interest rate shocks. These strategies are implemented as needed and as opportunities arise to mitigate interest rate risk without materially sacrificing earnings.
In managing our mix of assets and liabilities, while considering the relationship between long and short term interest rates, market conditions, and consumer preferences, we may place somewhat greater emphasis on maintaining or increasing the Bank’s net interest margin than on strictly matching the interest rate sensitivity of its assets and liabilities.
Management also believes that at times the increased net income which may result from a mismatch in the actual maturity, repricing, or duration of its asset and liability portfolios can provide sufficient returns to justify the increased exposure to sudden and unexpected increases or decreases in interest rates which may result from such a mismatch. Management believes that the Bank’s level of interest rate risk is acceptable under this approach.
In evaluating the Bank’s exposure to market interest rate movements, certain shortcomings inherent in the method of analysis presented in the foregoing table must be considered. For example, although certain assets and liabilities may have similar maturities or repricing characteristics, their interest rate drivers may react in different degrees to changes in market interest rates (basis risk). Also, the interest rates on certain types of assets and liabilities may fluctuate in advance of changes in market interest rates, while interest rates on other types may lag behind changes in market interest rates. Additionally, certain assets, such as adjustable rate mortgages, have features which restrict changes in interest rates over the life of the asset (time to initial interest rate reset; interest rate reset frequency; initial, periodic, and lifetime caps and floors). Further, in the event of a significant change in market interest rates, loan and securities prepayment and time deposit early withdrawal levels may deviate significantly from those assumed in the table above. Assets with prepayment options and liabilities with early withdrawal options are being monitored. Current market rates and customer behavior are being considered in the management of interest rate risk. Finally, the ability of many borrowers to service their debt may decrease in the event of an interest rate increase. The Bank considers all of these factors in monitoring its exposure to interest rate risk. Of note, the current historically low interest rate environment has resulted in asymmetrical interest rate risk. The interest rates on certain repricing assets and liabilities cannot be fully shocked downward.
The Board of Directors and management believe that the Bank’s ability to successfully manage and mitigate its exposure to interest rate risk is strengthened by several key factors. For example, the Bank manages its balance sheet duration and overall interest rate risk by placing a preference on originating and retaining adjustable rate loans. In addition, the Bank borrows at various maturities from the FHLB to mitigate mismatches between the asset and liability portfolios. Furthermore,
the investment securities portfolio is used as a primary interest rate risk management tool through the duration and repricing targeting of purchases and sales.
|
| |
| Item 8. | Financial Statements and Supplementary Data |
VIEWPOINT FINANCIAL GROUP, INC.
FINANCIAL STATEMENTS
December 31, 2012, 2011, and 2010
INDEX
|
| |
| | Page |
| | |
| |
| | |
| CONSOLIDATED FINANCIAL STATEMENTS | |
| | |
| |
| | |
| |
| | |
| |
| | |
| |
| | |
| |
| | |
| |
Report of Independent Registered Public Accounting Firm
The Board of Directors and Shareholders of
ViewPoint Financial Group, Inc.
We have audited the accompanying consolidated balance sheets of ViewPoint Financial Group, Inc. as of December 31, 2012 and 2011 and the related consolidated statements of income and comprehensive income, changes in shareholders' equity, and cash flows for each of the three years in the period ended December 31, 2012. These financial statements are the responsibility of the Company's management. Our responsibility is to express an opinion on these financial statements based on our audits.
We conducted our audits in accordance with the standards of the Public Company Accounting Oversight Board (United States). Those standards require that we plan and perform the audit to obtain reasonable assurance about whether the financial statements are free of material misstatement. An audit includes examining, on a test basis, evidence supporting the amounts and disclosures in the financial statements. An audit also includes assessing the accounting principles used and significant estimates made by management, as well as evaluating the overall financial statement presentation. We believe that our audit provides a reasonable basis for our opinion.
In our opinion, the financial statements referred to above present fairly, in all material respects, the consolidated financial position of ViewPoint Financial Group, Inc. at December 31, 2012 and 2011, and the consolidated results of their operations and their cash flows for each of the three years in the period ended December 31, 2012, in conformity with U.S. generally accepted accounting principles.
We also have audited, in accordance with the standards of the Public Company Accounting Oversight Board (United States), ViewPoint Financial Group, Inc.'s internal control over financial reporting as of December 31, 2012, based on criteria established in Internal Control-Integrated Framework issued by the Committee of Sponsoring Organizations of the Treadway Commission and our report dated February 20, 2013 expressed an unqualified opinion thereon.
/s/ Ernst & Young LLP
Dallas, Texas
February 20, 2013
CONSOLIDATED BALANCE SHEETS
Years ended December 31,
(Dollar amounts in thousands, except per share data)
|
| | | | | | | |
| | 2012 | | 2011 |
| ASSETS | | | |
| Cash and due from financial institutions | $ | 34,227 |
| | $ | 16,661 |
|
| Short-term interest-bearing deposits in other financial institutions | 34,469 |
| | 29,687 |
|
| Total cash and cash equivalents | 68,696 |
| | 46,348 |
|
| Securities available for sale, at fair value | 287,034 |
| | 433,745 |
|
| Securities held to maturity (fair value: December 31, 2012 — $376,153, December 31, 2011— $518,142) | 360,554 |
| | 500,488 |
|
| Loans held for sale (includes $0 and $16,607 carried at fair value at December 31, 2012 and 2011) | 1,060,720 |
| | 834,352 |
|
| Loans held for investment (net of allowance for loan losses of $18,051 at December 31, 2012 and $17,487 at December 31, 2011) | 1,673,204 |
| | 1,211,057 |
|
| FHLB and Federal Reserve Bank stock, at cost | 45,025 |
| | 37,590 |
|
| Bank-owned life insurance | 34,916 |
| | 29,007 |
|
| Foreclosed assets, net | 1,901 |
| | 2,293 |
|
| Premises and equipment, net | 53,160 |
| | 50,261 |
|
| Goodwill | 29,650 |
| | 818 |
|
| Accrued interest receivable | 9,900 |
| | 8,982 |
|
| Prepaid FDIC assessment | 4,809 |
| | 4,967 |
|
| Other assets | 33,489 |
| | 20,670 |
|
| Total assets | $ | 3,663,058 |
| | $ | 3,180,578 |
|
| LIABILITIES AND SHAREHOLDERS’ EQUITY | | | |
| Deposits | | | |
| Non-interest-bearing demand | $ | 357,800 |
| | $ | 211,670 |
|
| Interest-bearing demand | 488,748 |
| | 498,253 |
|
| Savings and money market | 880,924 |
| | 759,576 |
|
| Time | 450,334 |
| | 493,992 |
|
| Total deposits | 2,177,806 |
| | 1,963,491 |
|
| FHLB advances (net of prepayment penalty of $3,193 at December 31, 2012 and $4,222 at December 31, 2011 | 892,208 |
| | 746,398 |
|
| Repurchase agreement | 25,000 |
| | 25,000 |
|
| Accrued interest payable | 1,216 |
| | 1,220 |
|
| Other liabilities | 45,957 |
| | 38,160 |
|
| Total liabilities | 3,142,187 |
| | 2,774,269 |
|
| Commitments and contingent liabilities | — |
| | — |
|
| Shareholders’ equity | | | |
| Preferred stock, $.01 par value; 10,000,000 shares authorized; 0 shares issued — December 31, 2012 and December 31, 2011 | — |
| | — |
|
| Common stock, $.01 par value; 90,000,000 shares authorized; 39,612,911 shares issued — December 31, 2012 and 33,700,399 shares issued — December 31, 2011 | 396 |
| | 337 |
|
| Additional paid-in capital | 372,168 |
| | 279,473 |
|
| Retained earnings | 164,328 |
| | 144,535 |
|
| Accumulated other comprehensive income, net | 1,895 |
| | 1,347 |
|
| Unearned Employee Stock Ownership Plan (ESOP) shares; 1,918,039 shares at December 31, 2012 and 2,102,234 shares at December 31, 2011 | (17,916 | ) | | (19,383 | ) |
| Total shareholders’ equity | 520,871 |
| | 406,309 |
|
| Total liabilities and shareholders’ equity | $ | 3,663,058 |
| | $ | 3,180,578 |
|
| | | | |
| See accompanying notes to consolidated financial statements. |
CONSOLIDATED STATEMENTS OF INCOME
Years ended December 31,
(Dollar amounts in thousands, except per share data)
|
| | | | | | | | | | | |
| | 2012 | | 2011 | | 2010 |
| Interest and dividend income | | | | | |
| Loans, including fees | $ | 120,596 |
| | $ | 88,238 |
| | $ | 88,550 |
|
| Taxable securities | 14,850 |
| | 25,830 |
| | 24,837 |
|
| Nontaxable securities | 1,891 |
| | 1,892 |
| | 1,528 |
|
| Interest-bearing deposits in other financial institutions | 117 |
| | 170 |
| | 402 |
|
| FHLB and Federal Reserve Bank stock | 538 |
| | 94 |
| | 68 |
|
| | 137,992 |
| | 116,224 |
| | 115,385 |
|
| Interest expense | | | | | |
| Deposits | 11,453 |
| | 22,474 |
| | 31,015 |
|
| FHLB advances | 9,807 |
| | 9,882 |
| | 11,723 |
|
| Repurchase agreement | 876 |
| | 816 |
| | 816 |
|
| Other borrowings | 33 |
| | 474 |
| | 599 |
|
| | 22,169 |
| | 33,646 |
| | 44,153 |
|
| Net interest income | 115,823 |
| | 82,578 |
| | 71,232 |
|
| Provision for loan losses | 3,139 |
| | 3,970 |
| | 5,119 |
|
| Net interest income after provision for loan losses | 112,684 |
| | 78,608 |
| | 66,113 |
|
| Non-interest income | | | | | |
| Service charges and fees | 19,512 |
| | 18,556 |
| | 18,505 |
|
| Other charges and fees | 579 |
| | 723 |
| | 711 |
|
| Net gain on sale of mortgage loans | 5,436 |
| | 7,639 |
| | 13,041 |
|
| Bank-owned life insurance income | 699 |
| | 506 |
| | 384 |
|
| Gain on sale of available for sale securities | 1,014 |
| | 6,268 |
| | — |
|
| Loss on sale and disposition of assets | (191 | ) | | (798 | ) | | (365 | ) |
| Impairment of goodwill | (818 | ) | | (271 | ) | | — |
|
| Other | 3,325 |
| | 1,925 |
| | 1,188 |
|
| | 29,556 |
| | 34,548 |
| | 33,464 |
|
| Non-interest expense | | | | | |
| Salaries and employee benefits | 51,719 |
| | 47,360 |
| | 46,203 |
|
| Acquisition costs | 4,127 |
| | — |
| | — |
|
| Advertising | 1,753 |
| | 1,519 |
| | 1,285 |
|
| Occupancy and equipment | 7,365 |
| | 5,966 |
| | 5,907 |
|
| Outside professional services | 2,320 |
| | 2,644 |
| | 2,369 |
|
| Regulatory assessments | 2,534 |
| | 2,401 |
| | 3,235 |
|
| Data processing | 6,109 |
| | 4,648 |
| | 4,232 |
|
| Office operations | 7,144 |
| | 5,972 |
| | 5,790 |
|
| Other | 4,619 |
| | 4,730 |
| | 4,125 |
|
| | 87,690 |
| | 75,240 |
| | 73,146 |
|
| Income before income tax expense | 54,550 |
| | 37,916 |
| | 26,431 |
|
| Income tax expense | 19,309 |
| | 11,588 |
| | 8,632 |
|
| Net income | $ | 35,241 |
| | $ | 26,328 |
| | $ | 17,799 |
|
| Earnings per share: | | | | | |
| Basic | $ | 0.98 |
| | $ | 0.81 |
| | $ | 0.59 |
|
| Diluted | $ | 0.98 |
| | $ | 0.81 |
| | $ | 0.59 |
|
| | | | | | |
| See accompanying notes to consolidated financial statements. |
CONSOLIDATED STATEMENTS OF COMPREHENSIVE INCOME
Years ended December 31,
(Dollar amounts in thousands)
|
| | | | | | | | | | | |
| | 2012 | | 2011 | | 2010 |
| Net income | $ | 35,241 |
| | $ | 26,328 |
| | $ | 17,799 |
|
| Change in unrealized gains (losses) on securities available for sale | 1,867 |
| | 4,673 |
| | (2,132 | ) |
| Reclassification of amount realized through sale of securities | (1,014 | ) | | (6,268 | ) | | — |
|
| Tax effect | (305 | ) | | 569 |
| | 703 |
|
| Other comprehensive income (loss), net of tax | 548 |
| | (1,026 | ) | | (1,429 | ) |
| Comprehensive income | $ | 35,789 |
| | $ | 25,302 |
| | $ | 16,370 |
|
| | | | | | |
| See accompanying notes to consolidated financial statements. |
CONSOLIDATED STATEMENTS OF CHANGES IN SHAREHOLDERS’ EQUITY
Years ended December 31,
(Dollar amounts in thousands, except per share and share data)
|
| | | | | | | | | | | | | | | | | | | | | | | | | | | |
| | Common Stock | | Additional Paid-In Capital | | Unearned ESOP Shares | | Retained Earnings | | Accumulated Other Comprehensive Income, Net | | Treasury Stock | | Total Shareholders’ Equity |
| Balance at January 1, 2010 | $ | 305 |
| | $ | 118,254 |
| | $ | (6,159 | ) | | $ | 111,188 |
| | $ | 3,802 |
| | $ | (21,708 | ) | | $ | 205,682 |
|
| ESOP shares earned, 157,065 shares | — |
| | 686 |
| | 1,196 |
| | — |
| | — |
| | — |
| | 1,882 |
|
| Share-based compensation expense | — |
| | 1,802 |
| | — |
| | — |
| | — |
| | — |
| | 1,802 |
|
| Restricted stock forfeiture | — |
| | 334 |
| | — |
| | — |
| | — |
| | (334 | ) | | — |
|
| Treasury stock purchased at cost, 25,634 shares | — |
| | — |
| | — |
| | — |
| | — |
| | (407 | ) | | (407 | ) |
| Treasury stock retired, 25,309 shares | — |
| | (334 | ) | | — |
| | — |
| | — |
| | 334 |
| | — |
|
| Dividends declared ($0.16 per share) | — |
| | — |
| | — |
| | (3,862 | ) | | — |
| | — |
| | (3,862 | ) |
| Items relating to Conversion and stock offering: | | | | | | | | | | | | | |
| Merger of ViewPoint MHC pursuant to reorganization | — |
| | 207 |
| | — |
| | — |
| | — |
| | — |
| | 207 |
|
| Treasury stock retired pursuant to reorganization (1,305,435 shares) | (13 | ) | | (22,102 | ) | | — |
| | — |
| | — |
| | 22,115 |
| | — |
|
| Cancellation of ViewPoint MHC shares (14,183,812 shares) | (142 | ) | | 142 |
| | — |
| | — |
| | — |
| | — |
| | — |
|
| Proceeds from stock offering (19,857,337 shares), net expense of $7,773 | 199 |
| | 190,602 |
| | — |
| | — |
| | — |
| | — |
| | 190,801 |
|
| Purchase of shares by ESOP pursuant to reorganization (1,588,587 shares) | — |
| | — |
| | (15,886 | ) | | — |
| | — |
| | — |
| | (15,886 | ) |
| Comprehensive income | — |
| | — |
| | — |
| | 17,799 |
| | (1,429 | ) | | — |
| | 16,370 |
|
| Balance at December 31, 2010 | 349 |
| | 289,591 |
| | (20,849 | ) | | 125,125 |
| | 2,373 |
| | — |
| | 396,589 |
|
| ESOP shares earned, 184,194 shares | — |
| | 1,331 |
| | 1,466 |
| | — |
| | — |
| | — |
| | 2,797 |
|
| Share-based compensation expense | — |
| | 1,551 |
| | — |
| | — |
| | — |
| | — |
| | 1,551 |
|
| Dividends declared ($0.20 per share) | — |
| | — |
| | — |
| | (6,918 | ) | | — |
| | — |
| | (6,918 | ) |
| Share repurchase, 1,100,100 shares | (12 | ) | | (13,000 | ) | | — |
| | — |
| | — |
| | — |
| | (13,012 | ) |
| Comprehensive income | — |
| | — |
| | — |
| | 26,328 |
| | (1,026 | ) | | — |
| | 25,302 |
|
| Balance at December 31, 2011 | 337 |
| | 279,473 |
| | (19,383 | ) | | 144,535 |
| | 1,347 |
| | — |
| | 406,309 |
|
| ESOP shares earned, 184,195 shares | — |
| | 2,526 |
| | 1,467 |
| | — |
| | — |
| | — |
| | 3,993 |
|
| Share-based compensation expense | — |
| | 1,878 |
| | — |
| | — |
| | — |
| | — |
| | 1,878 |
|
| Net issuance of common stock under employee stock plans (399,451 shares) | 4 |
| | 2,232 |
| | — |
| | — |
| | — |
| | — |
| | 2,236 |
|
| Dividends declared ($0.40 per share) | — |
| | — |
| | — |
| | (15,448 | ) | | — |
| | — |
| | (15,448 | ) |
| Acquisition of Highlands Bancshares, Inc. | 55 |
| | 86,059 |
| | — |
| | — |
| | — |
| | — |
| | 86,114 |
|
| Comprehensive income | — |
| | — |
| | — |
| | 35,241 |
| | 548 |
| | — |
| | 35,789 |
|
| Balance at December 31, 2012 | $ | 396 |
| | $ | 372,168 |
| | $ | (17,916 | ) | | $ | 164,328 |
| | $ | 1,895 |
| | $ | — |
| | $ | 520,871 |
|
| See accompanying notes to consolidated financial statements. |
CONSOLIDATED STATEMENTS OF CASH FLOWS
Years ended December 31,
(Dollar amounts in thousands)
|
| | | | | | | | | | | |
| | 2012 | | 2011 | | 2010 |
| Cash flows from operating activities | | | | | |
| Net income | $ | 35,241 |
| | $ | 26,328 |
| | $ | 17,799 |
|
| Adjustments to reconcile net income to net cash used in operating activities: | | | | | |
| Provision for loan losses | 3,139 |
| | 3,970 |
| | 5,119 |
|
| Depreciation and amortization | 3,971 |
| | 3,515 |
| | 3,571 |
|
| Deferred tax expense (benefit) | 5,262 |
| | 204 |
| | (794 | ) |
| Premium amortization and accretion of securities, net | 6,424 |
| | 4,515 |
| | 3,832 |
|
| Accretion related to acquired loans | (3,784 | ) | | — |
| | — |
|
| Gain on sale of available for sale securities | (1,014 | ) | | (6,268 | ) | | — |
|
| ESOP compensation expense | 3,993 |
| | 2,797 |
| | 1,882 |
|
| Share-based compensation expense | 1,878 |
| | 1,551 |
| | 1,802 |
|
| Net gain on loans held for sale | (5,436 | ) | | (7,639 | ) | | (13,041 | ) |
| Loans originated or purchased for sale | (12,755,753 | ) | | (7,872,727 | ) | | (7,877,505 | ) |
| Proceeds from sale of loans held for sale | 12,534,821 |
| | 7,537,999 |
| | 7,739,992 |
|
| FHLB stock dividends | (121 | ) | | (84 | ) | | (68 | ) |
| Bank-owned life insurance (BOLI) income | (699 | ) | | (506 | ) | | (384 | ) |
| Loss on sale and disposition of assets | 191 |
| | 652 |
| | 546 |
|
| Impairment of goodwill | 818 |
| | 271 |
| | — |
|
| Net change in deferred loan fees | 30 |
| | (589 | ) | | (1,087 | ) |
| Net change in accrued interest receivable | 793 |
| | 266 |
| | (1,149 | ) |
| Net change in other assets | (1,871 | ) | | 3,277 |
| | 2,515 |
|
| Net change in other liabilities | 4,371 |
| | 8,311 |
| | 2,687 |
|
| Net cash used in operating activities | (167,746 | ) | | (294,157 | ) | | (114,283 | ) |
| Cash flows from investing activities | | | | | |
| Available-for-sale securities: | | | | | |
| Maturities, prepayments and calls | 614,361 |
| | 551,204 |
| | 562,924 |
|
| Purchases | (516,139 | ) | | (544,232 | ) | | (801,282 | ) |
| Proceeds from sale of AFS securities | 133,595 |
| | 279,420 |
| | — |
|
| Held-to-maturity securities: | | | | | |
| Maturities, prepayments and calls | 136,606 |
| | 113,687 |
| | 69,788 |
|
| Purchases | — |
| | (184,137 | ) | | (248,628 | ) |
| Distribution from new markets equity fund | — |
| | — |
| | 458 |
|
| Net change in loans held for investment | (182,658 | ) | | (123,995 | ) | | 8,259 |
|
| Purchase of FHLB and Federal Reserve Bank stock | (4,845 | ) | | (16,937 | ) | | (6,354 | ) |
| Cash and cash equivalents from acquisition | 98,469 |
| | — |
| | — |
|
| Purchases of premises and equipment | (2,272 | ) | | (5,213 | ) | | (2,114 | ) |
| Proceeds from sale of assets | 6,740 |
| | 868 |
| | 3,959 |
|
| Net cash provided by (used in) investing activities | 283,857 |
| | 70,665 |
| | (412,990 | ) |
CONSOLIDATED STATEMENTS OF CASH FLOWS (Continued)
Years ended December 31,
(Dollar amounts in thousands)
|
| | | | | | | | | | | |
| Cash flows from financing activities | | | | | |
| Net change in deposits | (164,149 | ) | | (54,059 | ) | | 220,885 |
|
| Proceeds from FHLB advances | 634,000 |
| | 502,500 |
| | 291,645 |
|
| Repayments on FHLB advances | (488,190 | ) | | (217,321 | ) | | (142,930 | ) |
| Share repurchase | — |
| | (13,012 | ) | | — |
|
| Net proceeds from stock offering | — |
| | — |
| | 190,801 |
|
| Purchase of shares by ESOP pursuant to reorganization | — |
| | — |
| | (15,886 | ) |
| Merger of ViewPoint MHC pursuant to reorganization | — |
| | — |
| | 207 |
|
| Repayments of other borrowings | (62,212 | ) | | (10,000 | ) | | — |
|
| Treasury stock purchased | — |
| | — |
| | (407 | ) |
| Payment of dividends | (15,448 | ) | | (6,918 | ) | | (3,862 | ) |
| Proceeds from stock option exercises | 2,236 |
| | — |
| | — |
|
| Net cash provided by (used in) financing activities | (93,763 | ) | | 201,190 |
| | 540,453 |
|
| Net change in cash and cash equivalents | 22,348 |
| | (22,302 | ) | | 13,180 |
|
| Beginning cash and cash equivalents | 46,348 |
| | 68,650 |
| | 55,470 |
|
| Ending cash and cash equivalents | $ | 68,696 |
| | $ | 46,348 |
| | $ | 68,650 |
|
| Supplemental cash flow information: | | | | | |
| Interest paid | $ | 22,173 |
| | $ | 33,967 |
| | $ | 44,496 |
|
| Income taxes paid | 17,490 |
| | 12,780 |
| | 5,948 |
|
| Supplemental noncash disclosures: | | | | | |
| Transfers from loans to other real estate owned | 4,507 |
| | 1,671 |
| | 3,754 |
|
| Net noncash liabilities assumed in stock acquisition of Highlands Bancshares, Inc. | 12,355 |
| | — |
| | — |
|
| | | | | | |
| See accompanying notes to consolidated financial statements. |
VIEWPOINT FINANCIAL GROUP, INC.
NOTES TO CONSOLIDATED FINANCIAL STATEMENTS
(Dollar amounts in thousands, except per share and share data)
NOTE 1 — SUMMARY OF SIGNIFICANT ACCOUNTING POLICIES
Nature of Operations and Principles of Consolidation: The consolidated financial statements include ViewPoint Financial Group, Inc. (the “Company”), whose business currently consists of the operations of its wholly-owned subsidiary, ViewPoint Bank, N.A. (the “Bank”). Prior to its sale in the third quarter of 2012, the Bank's operations included its wholly-owned subsidiary, ViewPoint Bankers Mortgage, Inc. (doing business as ViewPoint Mortgage) ("VPM"). Intercompany transactions and balances are eliminated in consolidation.
The Company provides financial services through 31 full-service branches and one commercial loan production office. Its primary deposit products are demand, savings and term certificate accounts, and its primary lending products are commercial real estate, commercial and industrial and consumer lending, including one- to four-family real estate loans. Most loans are secured by specific items of collateral, including business assets, commercial and residential real estate and consumer assets. Commercial loans are expected to be repaid from cash flow from operations of businesses.
Use of Estimates: To prepare financial statements in conformity with U.S. generally accepted accounting principles, management makes estimates and assumptions based on available information. These estimates and assumptions affect the amounts reported in the financial statements and the disclosures provided, and actual results could differ. The allowance for loan losses, valuation of other real estate owned, other-than-temporary impairment of securities, realization of deferred tax assets, and fair values of financial instruments are particularly subject to change.
Cash Flows: Cash and cash equivalents include cash, deposits with other financial institutions with maturities less than 90 days, and federal funds sold. Net cash flows are reported for customer loan and deposit transactions, interest-bearing deposits in other financial institutions, federal funds purchased, and repurchase agreements.
Restrictions on Cash: Cash on hand or on deposit with the Federal Reserve Bank of $0 and $1,000 was required to meet regulatory reserve and clearing requirements at December 31, 2012 and 2011, respectively. The Federal Reserve Bank pays interest on required reserve balances and on excess balances. The Company maintains deposits with other financial institutions in amounts that exceed federal deposit insurance coverage. Management regularly evaluates the credit risk associated with the counterparties to these transactions and believes that the Company is not exposed to any significant credit risks on cash and cash equivalents.
Securities: Securities that the Company has both the positive intent and ability to hold to maturity are classified as held to maturity and are carried at amortized cost. Securities that the Company intends to hold for an indefinite period of time, but not necessarily to maturity, are classified as available for sale and are carried at fair value. Unrealized gains and losses on securities classified as available for sale have been accounted for as accumulated other comprehensive income (loss), net of taxes.
Gains and losses on the sale of securities classified as available for sale are recorded on the settlement date using the specific-identification method. Amortization of premiums and discounts are recognized in interest income over the period to maturity. Premiums and discounts on securities are amortized using the level-yield method without anticipating prepayment, except for mortgage-backed securities where prepayments are anticipated. Premiums and discounts on callable securities are amortized to the initial call date.
The Company evaluates securities for other-than-temporary impairment on at least a quarterly basis and more frequently when economic, market, or security specific concerns warrant such evaluation. Consideration is given to the length of time and the extent to which the fair value has been less than amortized cost, the financial condition and near-term prospects of the issuer, and the intent and ability of the Company to retain its investment for a period of time sufficient to allow for any anticipated recovery in fair value. In analyzing an issuer’s financial condition, the Company may consider whether the securities are issued by the federal government or its agencies, whether downgrades by bond rating agencies have occurred, and the results of reviews of the issuers’ financial condition. The Company conducts regular reviews of the bond agency ratings of securities and considers whether the securities were issued by or have principal and interest payments guaranteed by the federal government or its agencies. These reviews focus on the underlying rating of the issuer and also include the insurance rating of securities that have an insurance component or guarantee. The ratings and financial condition of the issuers are monitored, as well as the financial condition and ratings of the insurers and guarantors.
VIEWPOINT FINANCIAL GROUP, INC.
NOTES TO CONSOLIDATED FINANCIAL STATEMENTS
(Dollar amounts in thousands, except per share and share data)
NOTE 1 — SUMMARY OF SIGNIFICANT ACCOUNTING POLICIES (Continued)
For periods in which other-than-temporary impairment of a debt security is recognized, the credit portion of the amount is determined by subtracting the present value of the stream of estimated cash flows as calculated in a discounted cash flow model and discounted at book yield from the prior period’s ending carrying value. The non-credit portion of the amount is determined by subtracting the credit portion of the impairment from the difference between the book value and fair value of the security. The credit related portion of the impairment is charged against income and the non-credit related portion is charged to equity as a component of other comprehensive income.
Repurchase/Resell Agreements: The Company sells certain securities under agreements to repurchase. The securities sold under these agreements are treated as collateralized borrowings and are recorded at amounts equal to the cash received. The contractual terms of the agreements to repurchase may require the Company to provide additional collateral if the fair value of the securities underlying the borrowings declines during the term of the agreement.
Loans Held for Sale: Mortgage loans held for sale consist of Warehouse Purchase Program loans purchased for sale under our standard loan participation agreement and are carried at the lower of aggregate cost or market, as determined by outstanding commitments from investors. The Company purchases a 100% participation interest in the loans originated by our mortgage banking company customers, which are then held as one- to four- family mortgage loans held for sale on a short-term basis. The mortgage banking company has no obligation to offer and we have no obligation to purchase these participation interests. The mortgage banking company closes mortgage loans consistent with underwriting standards established by approved investors and once the loan closes, the participation interest is delivered by the Company to the investor selected by the originator and approved by the Company. The Company does not recognize gains or losses on the purchase or sale of the participation interests.
The Company elected the fair value option for certain residential mortgage loans held for sale at VPM in accordance with Accounting Standards Codification ("ASC") Topic 820. This election allowed for a more effective offset of the changes in fair values of the loans and the derivative instruments used to economically hedge them without the burden of complying with the requirements for hedge accounting under ASC Topic 815, “Derivatives and Hedging.” The Company did not elect the fair value option for other loans held for sale primarily because they are not economically hedged using derivative instruments.
Prior to the Company's sale of VPM in the third quarter of 2012, mortgage loans held for sale for which the fair value option was elected were typically pooled together and sold into the mortgage market, depending upon underlying attributes of the loan, such as agency eligibility, product type, interest rate, and credit quality. These mortgage loans held for sale were valued predominantly using quoted market prices for similar instruments.
Loans: Loans that management has the intent and ability to hold for the foreseeable future or until maturity or payoff are reported at the principal balance outstanding, net of unearned interest, purchase premiums and discounts, deferred loan fees and costs, and an allowance for loan losses. Interest income is accrued on the unpaid principal balance. Loan origination fees, net of certain direct origination costs, are deferred and recognized in interest income using the level-yield method without anticipating prepayments.
Loans that are past due 30 days or greater are considered delinquent. Interest income on loans is discontinued at the time the loan is 90 days delinquent unless the loan is a purchased credit impaired loan that is performing according to its expected cash flows. Consumer loans are typically charged off no later than 120 days past due. Past due status is based on the contractual terms of the loan. In all cases, loans are placed on nonaccrual or charged-off at an earlier date if collection of principal or interest is considered doubtful. Nonaccrual loans include both smaller balance homogeneous loans that are collectively evaluated for impairment and individually classified impaired loans.
All interest accrued but not received for loans placed on nonaccrual is reversed against interest income. Interest received on such loans is accounted for on the cash-basis or cost-recovery method, until qualifying for return to accrual. Loans are returned to accrual status when all the principal and interest amounts contractually due are brought current and future payments are reasonably assured.
VIEWPOINT FINANCIAL GROUP, INC.
NOTES TO CONSOLIDATED FINANCIAL STATEMENTS
(Dollar amounts in thousands, except per share and share data)
NOTE 1 — SUMMARY OF SIGNIFICANT ACCOUNTING POLICIES (Continued)
For loans collateralized by real property and commercial and industrial loans, credit exposure is monitored by internally assigned grades used for classification of loans and other assets. A loan is considered “special mention” if it is a potential problem loan that is currently performing and does not meet the criteria for impairment, but where some concern exists. A loan is considered “substandard” if it is inadequately protected by the current net worth and paying capacity of the obligor or the collateral pledged, if any. “Substandard” loans include those characterized by the distinct possibility that the insured institution will sustain some loss if the deficiencies are not corrected. Loans classified as “doubtful” have all of the weaknesses of those classified as “substandard”, with the added characteristic that the weaknesses present make collection or liquidation in full, on the basis of currently existing facts, conditions and values, highly questionable and improbable. All other loans that do not fall into the above mentioned categories are considered “pass” loans. Updates to internally assigned grades are made monthly and/or upon significant developments.
For other consumer loans, credit exposure is monitored by payment history of the loans. Non-performing consumer loans are placed on nonaccrual and are generally greater than 90 days past due.
Acquired Loans: Loans acquired through the completion of a transfer, including loans acquired in a business combination, that have evidence of deterioration of credit quality since origination and for which it is probable, at acquisition, that the Company will be unable to collect all contractually required payment receivable are initially recorded at fair value (as determined by the present value of expected future cash flows) with no valuation allowance. The difference between the undiscounted cash flows expected at acquisition and the investment in the loan, or the “accretable yield,” is recognized as interest income on a level-yield method over the life of the loan. Contractually required payments for interest and principal that exceed the undiscounted cash flows expected at acquisition, or the “nonaccretable difference,” are not recognized as a yield adjustment or as a loss accrual or a valuation allowance. Increases in expected cash flows subsequent to the initial investment are recognized prospectively through adjustment of the yield on the loan over its remaining life. Decreases in expected cash flows are recognized as impairment. Valuation allowances on these impaired loans reflect only losses incurred after the acquisition (meaning the present value of all cash flows expected at acquisition that ultimately are not to be received). Revolving loans, including lines of credit, are excluded from acquired impaired loan accounting.
For acquired loans not deemed credit-impaired at acquisition, the differences between the initial fair value and the unpaid principal balance are recognized as interest income on a level-yield basis over the lives of the related loans. Subsequent to the acquisition date, methods utilized to estimate the required allowance for loan losses for these loans is similar to originated loans; however, a provision for loan losses will be recorded only to the extent the required allowance exceeds any remaining credit discounts.
Concentration of Credit Risk: Most of the Company’s business activity is with customers located within the North Texas region. Therefore, the Company’s exposure to credit risk is significantly affected by changes in the economy of the North Texas area.
Allowance for Loan Losses: The allowance for loan losses is a valuation allowance for estimated credit losses, increased by the provision for loan losses and decreased by charge-offs less recoveries. Management estimates the allowance balance required using past loan loss experience, the nature and volume of the portfolio, information about specific borrower situations and estimated collateral values, economic conditions and other factors. Allocations of the allowance may be made for specific loans, but the entire allowance is available for any loans that, in management’s judgment, should be charged off. Loan losses are charged against the allowance when management believes the uncollectability of a loan balance is confirmed. The allowance consists of specific and general components. The specific component relates to loans that are individually classified as impaired. The general component covers non-impaired loans and is based on historical loss experience adjusted for current factors.
VIEWPOINT FINANCIAL GROUP, INC.
NOTES TO CONSOLIDATED FINANCIAL STATEMENTS
(Dollar amounts in thousands, except per share and share data)
NOTE 1 — SUMMARY OF SIGNIFICANT ACCOUNTING POLICIES (Continued)
Management evaluates current information and events regarding a borrower’s ability to repay its obligations and considers a loan to be impaired when the ultimate collectability of amounts due, according to the contractual terms of the loan agreement, is in doubt. Impaired loans are measured on an individual basis for real estate secured and commercial and industrial loans, as well as all troubled debt restructured loans, based on the present value of expected future cash flows discounted at the loan’s effective interest rate or, as a practical expedient, at the loan’s observable market price or the fair value of the collateral if the loan is collateral dependent. The amount of the impairment can be adjusted, based on current data, until such time as the actual basis is established by acquisition of the collateral. If the loan is not collateral dependent, it is then evaluated at the present value of estimated future cash flows using the loan’s effective interest rate at inception. Impairment losses are reflected in the allowance for loan losses through a charge to the provision for loan losses. Subsequent recoveries are credited to the allowance for loan losses.
A modified loan is considered a troubled debt restructuring (“TDR”) when two conditions are met: 1) the borrower is experiencing financial difficulty and 2) concessions are made by the Company that would not otherwise be considered for a borrower or collateral with similar credit risk characteristics. Modifications to loan terms may include a modification of the contractual interest rate to a below-market rate (even if the modified rate is higher than the original rate), forgiveness of accrued interest, forgiveness of a portion of principal, an extended repayment period or a deed in lieu of foreclosure or other transfer of assets other than cash to fully or partially satisfy a debt. The Company’s policy is to place all TDRs on nonaccrual for a minimum period of six months. Loans qualify for return to accrual status once they have demonstrated performance with the restructured terms of the loan agreement for a minimum of six months and the collection of principal and interest under the revised terms is deemed probable. All TDRs are individually analyzed for impairment. Loss estimates include the negative difference, if any, between the current fair value of the collateral or the estimated discounted cash flows and the loan amount due. Loans reported as troubled debt restructurings are evaluated in accordance with ASC Topic 310-40, "Troubled Debt Restructurings by Creditors".
Large groups of smaller-balance homogeneous loans are collectively evaluated for impairment. Accordingly, the Company does not separately identify individual consumer loans for impairment disclosures.
The allowance for loan losses and related provision expense are susceptible to change if the credit quality of our loan portfolio changes, which is evidenced by many factors including charge-offs and non-performing loan trends. Generally, one- to four-family residential real estate lending has a lower credit risk profile compared to consumer lending (such as automobile or personal line of credit loans). Commercial real estate and commercial and industrial lending, however, have higher credit risk profiles than consumer and one- to four- family residential real estate loans due to these loans being larger in amount and non-homogenous in structure and term. Changes in economic conditions, the mix and size of the loan portfolio and individual borrower conditions can dramatically impact our level of allowance for loan losses in relatively short periods of time. Management believes that the allowance for loan losses is maintained at a level that represents our best estimate of credit losses in the loan portfolio. While management uses available information to recognize losses on loans, future additions to the allowance for loan losses may be necessary based on changes in economic conditions.
Transfers of Financial Assets: Transfers of financial assets are accounted for as sales, when control over the assets has been surrendered. Control over transferred assets is deemed to be surrendered when the assets have been isolated from the Company, the transferee obtains the right (free of conditions that constrain it from taking advantage of that right) to pledge or exchange the transferred assets, and the Company does not maintain effective control over the transferred assets through an agreement to repurchase them before their maturity.
Foreclosed Assets, net: Assets acquired through loan foreclosure are initially recorded at the lower of the recorded investment in the loan at the time of foreclosure or the fair value less costs to sell, establishing a new cost basis. Any write-down in the carrying value of a property at the time of acquisition is charged-off to the allowance for loan losses. If fair value declines subsequent to foreclosure, a valuation allowance is recorded through expense. Operating costs after acquisition are expensed.
Premises and Equipment: Land is carried at cost. Premises and equipment are stated at cost less accumulated depreciation. Buildings and related components are generally depreciated using the straight-line method with useful lives ranging from 10 to 30 years. Furniture, fixtures and equipment are generally depreciated using the straight-line method with useful lives ranging from 3 to 7 years. The cost of leasehold improvements is amortized over the shorter of the lease term or useful life using the straight-line method.
VIEWPOINT FINANCIAL GROUP, INC.
NOTES TO CONSOLIDATED FINANCIAL STATEMENTS
(Dollar amounts in thousands, except per share and share data)
NOTE 1 — SUMMARY OF SIGNIFICANT ACCOUNTING POLICIES (Continued)
Federal Home Loan Bank (FHLB) and Federal Reserve Bank stock: FHLB and Federal Reserve Bank stock is carried at cost, classified as restricted securities and periodically evaluated for impairment based on the ultimate recoverability of the par value. Both cash and stock dividends are reported as interest income.
Bank-Owned Life Insurance: The Company has purchased life insurance policies on certain key employees. The purchase of these life insurance policies allows the Company to use tax-advantaged rates of return. Bank-owned life insurance is recorded at the amount that can be realized under the insurance contract at the balance sheet date, which is the cash surrender value adjusted for other charges or other amounts due that are probable at settlement.
Goodwill: Goodwill represents the excess of the cost of businesses acquired over the fair value of the net assets acquired. Goodwill is evaluated for impairment on an annual basis at December 31. According to ASC 350-20, "Intangibles- Goodwill and Other", goodwill shall be tested for impairment between annual tests if an event occurs or circumstances change that would more likely than not reduce the fair value below its carrying amount. Deterioration in economic market conditions, changes in key personnel, increased estimates of the effects of recent regulatory or legislative changes, or additional regulatory or legislative changes may result in declines in projected business performance beyond management's current expectations. Such declines in business performance could cause the estimated fair value of goodwill to decline, which could result in an impairment charge to earnings in a future period related to goodwill.
The Company first assesses qualitative factors to determine whether it is more likely than not that the fair value of a reporting unit is less than its carrying amount as a basis for determining the need to perform the two-step test for goodwill impairment (the qualitative method.)
If the qualitative method cannot be used, the Company uses the two-step test. Under the two-step test, the Company compares the estimated fair value of a reporting unit with its carrying amount, including goodwill. If the estimated fair value of a reporting unit exceeds its carrying amount, goodwill of the reporting unit is considered not impaired. If the carrying amount of a reporting unit exceeds its estimated fair value, the second step of the goodwill impairment test is performed to measure the amount of impairment loss, if any. Step Two of the goodwill impairment test compares the implied estimated fair value of reporting unit goodwill with the carrying amount of that goodwill. If the carrying amount of goodwill for that reporting unit exceeds the implied fair value of that unit's goodwill, an impairment loss is recognized in an amount equal to that excess. Additional information regarding goodwill and impairment testing can be found in Note 8.
Identifiable Intangibles: Intangible assets are acquired assets that lack physical substance but can be distinguished from goodwill because of contractual or other legal rights or because the asset is capable of being sold or exchanged either on it own or in combination with a related contract, asset, or liability. The Company's intangible assets relate to core deposits and customer relationships. Intangible assets with definite useful lives are amortized on an accelerated basis over their estimated life. Intangible assets, premises and equipment and other long-lived assets are tested for impairment whenever events or changes in circumstances indicate the carrying amount of the assets may not be recoverable from future undiscounted cash flows. If impaired, the assets are recorded at fair value.
Brokerage Fee Income: Acting as an agent, the Company earns brokerage income by buying and selling securities on behalf of its customers through an independent third party and earning fees on the transactions. These fees are recorded on the trade date.
Advertising Expense: The Company expenses all advertising costs as they are incurred.
Income Taxes: Income tax expense is the total of the current year income tax due or refundable and the change in deferred tax assets and liabilities. Deferred tax assets and liabilities are the expected future tax amounts for the temporary differences between carrying amounts and tax bases of assets and liabilities, computed using enacted tax rates. A valuation allowance, if needed, reduces deferred tax assets to the amount expected to be realized.
A tax position is recognized as a benefit only if it is “more likely than not” that the tax position would be sustained in a tax examination, with a tax examination being presumed to occur. The amount recognized is the largest amount of tax benefit that is greater than 50% likely of being realized on examination. For tax positions not meeting the “more likely than not” test, no tax benefit is recorded. The Company did not have any amount accrued with respect to uncertainty in income taxes at December 31, 2012 and 2011.
VIEWPOINT FINANCIAL GROUP, INC.
NOTES TO CONSOLIDATED FINANCIAL STATEMENTS
(Dollar amounts in thousands, except per share and share data)
NOTE 1 — SUMMARY OF SIGNIFICANT ACCOUNTING POLICIES (Continued)
The Company recognizes interest and/or penalties related to income tax matters in income tax expense and did not have any amounts accrued for interest and penalties for the years ended December 31, 2012 and 2011. The Company files a consolidated income tax return with its subsidiaries. Federal income tax expense or benefit has been allocated to subsidiaries on a separate return basis.
Share-Based Compensation: Compensation cost is recognized for stock options and restricted stock awards issued to employees and directors, based on the fair value of these awards at the date of grant. A Black-Scholes model is utilized to estimate the fair value of stock options, while the market price of the Company’s common stock at the date of grant is used for restricted stock awards. Compensation cost is recognized over the required service period, generally defined as the vesting period. For awards with graded vesting, compensation cost is recognized on a straight-line basis over the requisite service period for the entire award. For awards with performance-based vesting conditions, compensation cost is recognized when the achievement of the performance condition is considered probable of achievement. If a performance condition is subsequently determined to be improbable of achievement, compensation cost is reversed.
Retirement Plans: Employee 401(k) and profit sharing plan expense is the amount of matching contributions as determined by formula. Deferred compensation and supplemental retirement plan expense allocates the benefits over years of service.
Comprehensive Income (Loss): Comprehensive income (loss) consists of net income and other comprehensive income (loss). Other comprehensive income (loss) includes unrealized gains and losses on securities available for sale, net of taxes, which are also recognized as a separate component of equity.
Loss Contingencies: Loss contingencies, including claims and legal actions arising in the ordinary course of business, are recorded as liabilities when the likelihood of loss is probable and an amount or range of loss can be reasonably estimated. Management does not believe there now are such matters that will have a material effect on the financial statements.
Earnings (loss) per common share: The Company calculated earnings (loss) per common share in accordance with ASC Topic 260, “Earnings Per Share,” which provides that unvested share-based payment awards that contain nonforfeitable rights to dividends or dividend equivalents (whether paid or unpaid) are participating securities and shall be included in the computation of earnings per share pursuant to the two-class method. The Company has determined that its outstanding non-vested stock awards/stock units and deferred stock units are participating securities. Accordingly, earnings per common share is computed using the two-class method prescribed under ASC Topic 260.
Under the two-class method, basic earnings per common share is computed by dividing net earnings allocated to common stock by the weighted-average number of common shares outstanding during the applicable period, excluding outstanding participating securities. Diluted earnings per common share is computed using the weighted-average number of shares determined for the basic earnings per common share computation plus the dilutive effect of stock compensation using the treasury stock method. A reconciliation of the weighted-average shares used in calculating basic earnings per common share and the weighted average common shares used in calculating diluted earnings per common share for the reported periods is provided in Note 3 - Earnings Per Common Share.
Employee stock ownership plan (ESOP): The Company accounts for its ESOP in accordance with ASC 718-40, "Employee Stock Ownership Plans". Accordingly, since the Company sponsors the ESOP with an employer loan, neither the ESOP’s loan payable nor the Company’s loan receivable are reported in the Company’s consolidated balance sheet. Likewise, the Company does not recognize interest income or interest cost on the loan.
Unallocated shares held by the ESOP are recorded as unearned ESOP shares in the consolidated statement of changes in shareholders’ equity. As shares are committed to be released for allocation, the Company recognizes compensation expense equal to the average market price of the shares for the period. Dividends on allocated ESOP shares reduce retained earnings; dividends on unearned ESOP shares reduce debt and accrued interest.
Dividend Restriction: Banking regulations require maintaining certain capital levels and may limit the dividends paid by the Bank to the Company or by the Company to shareholders.
VIEWPOINT FINANCIAL GROUP, INC.
NOTES TO CONSOLIDATED FINANCIAL STATEMENTS
(Dollar amounts in thousands, except per share and share data)
NOTE 1 — SUMMARY OF SIGNIFICANT ACCOUNTING POLICIES (Continued)
Fair Value of Financial Instruments: In general, fair values of financial instruments are based upon quoted market prices, where available. If such quoted market prices are not available, fair value is based upon internally developed models that primarily use, as inputs, observable market-based parameters. Valuation adjustments may be made to ensure that financial instruments are recorded at fair value. These adjustments may include amounts to reflect counterparty credit quality and the Company’s creditworthiness, among other things, as well as unobservable parameters. Any such valuation adjustments are applied consistently over time.
Operating Segments: The reportable segments are determined by the products and services offered, primarily distinguished between banking and mortgage banking. Loans, investments and deposits generate the revenues in the banking segment; secondary marketing sales generate the revenue in the mortgage banking segment. Segment performance is evaluated using segment profit (loss). As explained in Note 23 - Segment Information, the Company sold substantially all the assets of VPM, the Company's mortgage banking subsidiary in the third quarter of 2012.
Loan Commitments and Related Financial Instruments: Financial instruments include off-balance sheet credit instruments, such as commitments to make loans and commercial letters of credit, issued to meet customer financing needs. The face amount for these items represents the exposure to loss, before considering customer collateral or ability to repay. Such financial instruments are recorded when they are funded.
Reclassifications: Some items in the prior year financial statements were reclassified to conform to the current presentation.
Adoption of New Accounting Standards:
In June 2011, the FASB issued ASU 2011-05, Comprehensive Income (Topic 220): Presentation of Comprehensive Income. This ASU eliminated the option to present the components of other comprehensive income as part of the statement of changes in stockholders’ equity. An entity has the option to present the total of comprehensive income, the components of net income, and the components of other comprehensive income either in a single continuous statement of comprehensive income or in two separate but consecutive statements. In both choices, an entity is required to present each component of net income along with total net income, each component of other comprehensive income along with a total for other comprehensive income, and a total amount for comprehensive income. The amendments in this ASU did not change the items that must be reported in other comprehensive income or when an item of other comprehensive income must be reclassified to net income. This ASU was effective for fiscal years, and interim periods within those years, beginning after December 15, 2011. The Company is currently complying with these disclosure requirements.
In September 2011, the FASB issued ASU 2011-08, Intangibles—Goodwill and Other (Topic 350): Testing Goodwill for Impairment. This ASU simplified how entities test goodwill for impairment by permitting an entity to first assess qualitative factors to determine whether it is more likely than not that the fair value of a reporting unit is less than its carrying amount as a basis for determining whether it is necessary to perform the two-step goodwill impairment test described in Topic 350. The more-likely-than-not threshold is defined as having a likelihood of more than 50 percent. Previous guidance under Topic 350 required an entity to test goodwill for impairment on at least an annual basis, by comparing the fair value of a reporting unit with its carrying amount, including goodwill (step one). If the fair value of a reporting unit is less than its carrying amount, then the second step of the test must be performed to measure the amount of the impairment loss, if any. Under the amendments in this ASU, an entity is not required to calculate the fair value of a reporting unit unless the entity determines that it is more likely than not that its fair value is less than its carrying amount. This ASU was effective for annual and interim goodwill impairment tests performed for fiscal years beginning after December 15, 2011.
In December 2011, the FASB issued ASU 2011-12, Comprehensive Income (Topic 220): Deferral of the Effective Date for Amendments to the Presentation of Reclassifications of Items Out of Accumulated Other Comprehensive Income in ASU 2011-05. Under the amendments in ASU 2011-05, entities are required to present reclassification adjustments and the effect of those reclassification adjustments on the face of the financial statements where net income is presented, by component of net income, and on the face of the financial statements where other comprehensive income is presented, by component of other comprehensive income. In addition, the amendments in Update 2011-05 required that reclassification adjustments be presented in interim financial periods. The amendments in this Update superseded changes to those paragraphs in Update 2011-05 that pertain to how, when, and where reclassification adjustments are presented. This ASU was effective for public entities for fiscal years, and interim periods within those years, beginning after December 15, 2011. The adoption of this ASU did not have a significant impact to the Company’s financial statements.
VIEWPOINT FINANCIAL GROUP, INC.
NOTES TO CONSOLIDATED FINANCIAL STATEMENTS
(Dollar amounts in thousands, except per share and share data)
NOTE 1 — SUMMARY OF SIGNIFICANT ACCOUNTING POLICIES (Continued)
Effect of Newly Issued But Not Yet Effective Accounting Standards
In July 2012, the FASB issued ASU 2012-02, Intangibles--Goodwill and Other (Topic 350): Testing Indefinite-Lived Intangible Assets for Impairment. Under the guidance in this ASU, an entity has the option to bypass the qualitative assessment outlined in ASU 2011-08, Intangibles-Goodwill and Other (Topic 350): Testing Goodwill for Impairment, for any indefinite-lived intangible asset in any period and proceed directly to performing the quantitative impairment test. An entity will be able to resume performing the qualitative assessment in any subsequent period. The amendments in this ASU are effective for annual and interim impairment tests performed for fiscal years beginning after September 15, 2012. Early adoption is permitted, including for annual and interim impairment tests performed as of a date before July 27, 2012, if a public entity's financial statements for the most recent annual or interim period have not yet been issued or, for nonpublic entities, have not yet been made available for issuance. The adoption of this ASU is not expected to have a significant impact to the Company's financial statements.
NOTE 2 - SHARE TRANSACTIONS
The Company, a Maryland corporation, was organized by ViewPoint MHC (“the MHC”), ViewPoint Financial Group and ViewPoint Bank to facilitate the second-step conversion of the Bank from the mutual holding company structure to the stock holding company structure (the “Conversion”). Upon consummation of the Conversion, which occurred on July 6, 2010, the Company became the holding company for the Bank and now owns all of the issued and outstanding shares of the Bank’s common stock. As part of the Conversion, shares of the Company’s common stock were issued and sold in an offering to certain depositors of the Bank and others. Concurrent with the offering, each share of ViewPoint Financial Group’s common stock owned by public shareholders was exchanged for 1.4 shares of the Company’s common stock, with cash being paid in lieu of issuing any fractional shares.
The Company holds a liquidation account for the benefit of certain depositors of the Bank who remain depositors of the Bank at the time of liquidation. The liquidation account is designed to provide payments to these depositors of their liquidation interests in the event of a liquidation of the Company and the Bank, or the Bank alone. In the unlikely event that the Company and the Bank were to liquidate, all claims of creditors, including those of depositors, would be paid first, followed by distribution of the liquidation account maintained by the Company, with any assets remaining thereafter distributed to the Company as the holder of the Bank’s common stock.
In a liquidation of both entities, or of the Bank, when the Company has insufficient assets to fund the distribution due to Eligible Account Holders and Supplemental Eligible Account Holders and the Bank has positive net worth, the Bank shall pay amounts necessary to fund the Company’s remaining obligations under the liquidation account.
The Company sold a total of 19,857,337 shares of common stock in the Conversion offering at $10.00 per share. Proceeds from the offering, net of $7,773 in expenses, totaled $190,801. The Company used $15,886 of the proceeds to fund the ESOP. All share and per share information in this report for periods prior to the Conversion has been revised to reflect the 1.4:1 conversion ratio on publicly traded shares, which resulted in a 4,287,752 increase in outstanding shares.
On August 26, 2011, the Company announced its intention to repurchase up to 5% of its total common shares outstanding, or approximately 1,741,975 shares of its common stock, in the open market at prevailing market prices over a period beginning on August 30, 2011, and continuing until the earlier of the completion of the repurchase or the next twelve months, depending upon market conditions. Prior to termination on December 19, 2011, 1,100,100 shares were repurchased at an average price of $11.83. The share repurchases under the plan were halted as a result of the Company’s announced acquisition of Highlands Bancshares, Inc., which automatically triggered termination of the Company’s trading plan with Sandler O’Neill & Partners, LP.
On August 22, 2012, the Company announced its intention to repurchase up to 5% of its total common shares outstanding, or approximately 1,978,871 shares. The stock repurchase program, which is open-ended, commenced on August 27, 2012, and allows the Company to repurchase its shares from time to time in the open market and in negotiated transactions, depending upon market conditions. The Board of Directors of the Company also authorized management to enter into a trading plan with Sandler O'Neill & Partners, LP in accordance with Rule 10b5-1 of the Securities Exchange Act of 1934, as amended, to facilitate repurchases of its common stock pursuant to the above- mentioned stock repurchase program. There were no repurchases of common stock in 2012.
VIEWPOINT FINANCIAL GROUP, INC.
NOTES TO CONSOLIDATED FINANCIAL STATEMENTS
(Dollar amounts in thousands, except per share and share data)
NOTE 3 — EARNINGS PER COMMON SHARE
Basic earnings per common share is computed by dividing net income by the weighted-average number of common shares outstanding for the period, reduced for average unallocated ESOP shares and average unvested restricted stock awards. Diluted earnings per common share reflects the potential dilution that could occur if securities or other contracts to issue common stock (such as stock awards and options) were exercised or converted to common stock, or resulted in the issuance of common stock that then shared in the Company’s earnings. Diluted earnings per common share is computed by dividing net income by the weighted-average number of common shares outstanding for the period increased for the dilutive effect of unexercised stock options and unvested restricted stock awards. The dilutive effect of the unexercised stock options and unvested restricted stock awards is calculated under the treasury stock method utilizing the average market value of the Company’s stock for the period. Unvested share-based awards that contain nonforfeitable rights to dividends or dividend equivalents (whether paid or unpaid) are participating securities and shall be included in the computation of earnings per share pursuant to the two-class method described in ASC 260-10-45-60B. A reconciliation of the numerator and denominator of the basic and diluted earnings per common share computation for 2012, 2011, and 2010 was as follows:
|
| | | | | | | | | | | |
| | Years Ended December 31, |
| | 2012 | | 2011 | | 2010 |
| Basic earnings per share: | | | | | |
| Numerator: | | | | | |
| Net income | $ | 35,241 |
| | $ | 26,328 |
| | $ | 17,799 |
|
| Distributed and undistributed earnings to participating securities | (106 | ) | | (123 | ) | | (164 | ) |
| Income available to common shareholders | $ | 35,135 |
| | $ | 26,205 |
| | $ | 17,635 |
|
| Denominator: | | | | | |
| Weighted average common shares outstanding | 38,004,897 |
| | 34,571,991 |
| | 31,977,020 |
|
| Less: Average unallocated ESOP shares | (2,017,098 | ) | | (2,201,101 | ) | | (1,567,687 | ) |
| Average unvested restricted stock awards | (108,095 | ) | | (151,049 | ) | | (280,348 | ) |
| Average shares for basic earnings per share | 35,879,704 |
| | 32,219,841 |
| | 30,128,985 |
|
| Basic earnings per common share | $ | 0.98 |
| | $ | 0.81 |
| | $ | 0.59 |
|
| Diluted earnings per share: | | | | | |
| Numerator: | | | | | |
| Income available to common shareholders | $ | 35,135 |
| | $ | 26,205 |
| | $ | 17,635 |
|
| Denominator: | | | | | |
| Average shares for basic earnings per share | 35,879,704 |
| | 32,219,841 |
| | 30,128,985 |
|
| Dilutive effect of share-based compensation plan | 118,641 |
| | 63,266 |
| | 2,975 |
|
| Average shares for diluted earnings per share | 35,998,345 |
| | 32,283,107 |
| | 30,131,960 |
|
| Diluted earnings per common share | $ | 0.98 |
| | 0.81 |
| | 0.59 |
|
All of the options outstanding at December 31, 2010 were excluded in the computation of diluted earnings per share because the options’ exercise prices were greater than the average market price of the common stock and were, therefore, antidilutive.
VIEWPOINT FINANCIAL GROUP, INC.
NOTES TO CONSOLIDATED FINANCIAL STATEMENTS
(Dollar amounts in thousands, except per share and share data)
NOTE 4 - ACQUISITION
On April 2, 2012, the Company completed its acquisition of Highlands Bancshares, Inc. (“Highlands”), parent company of The First National Bank of Jacksboro, which operated in Dallas under the name Highlands Bank. This was a strategic, in-market acquisition to provide growth opportunities in North Texas. As part of the acquisition, Highlands President and CEO Kevin Hanigan joined the Company and the Bank as president and chief executive officer. He also was appointed to the Company's and the Bank's Board of Directors, along with Highlands board member Bruce Hunt.
In this stock-for-stock transaction, Highlands' shareholders received 0.6636 shares of the Company's common stock in exchange for each share of Highlands' common stock. As a result, the Company issued 5,513,061 common shares with an acquisition date fair value of total consideration paid of $86,114, based on the Company's closing stock price of $15.62 on April 2, 2012 including an insignificant amount of cash paid in lieu of fractional shares.
The assets acquired and liabilities assumed were recorded on the consolidated balance sheet at estimated fair value on the acquisition date. The acquisition was not considered to be a significant business combination. The following table presents the amounts recorded on the consolidated balance sheet on the acquisition date, showing the estimated fair value as reported initially and the revised estimate.
|
| | | | | | | | | | | |
| | Initial Estimate | | Adjustments (1) | | Revised Estimate |
| Fair value of total consideration paid: | | | | | |
| Common stock issued (5,513,061 shares) | $ | 86,114 |
| | $ | — |
| | $ | 86,114 |
|
| Fair value of identifiable assets acquired: | | | | | |
| Cash and cash equivalents | 98,469 |
| | — |
| | 98,469 |
|
| Securities | 86,335 |
| | — |
| | 86,335 |
|
| Loans | 284,068 |
| | (687 | ) | | 283,381 |
|
| Premises and equipment | 4,916 |
| | — |
| | 4,916 |
|
| Core deposit intangible | 1,745 |
| | — |
| | 1,745 |
|
| Other assets | 25,591 |
| | 240 |
| | 25,831 |
|
| Total identifiable assets acquired | 501,124 |
| | (447 | ) | | 500,677 |
|
| Fair value of liabilities assumed: | | | | | |
| Deposits | 378,464 |
| | — |
| | 378,464 |
|
| Borrowings | 62,632 |
| | — |
| | 62,632 |
|
| Other liabilities | 3,117 |
| | — |
| | 3,117 |
|
| Total liabilities assumed | 444,213 |
| | — |
| | 444,213 |
|
| Fair value of net identifiable assets acquired | 56,911 |
| | (447 | ) | | 56,464 |
|
| Goodwill resulting from acquisition | $ | 29,203 |
| | $ | 447 |
| | $ | 29,650 |
|
(1) Adjustments represent revisions to the fair value of four loans that were not deemed credit-impaired at acquisition date due to additional information obtained in the third quarter of 2012
Initial goodwill of $29,650 was recorded after adjusting for the fair value of net identifiable assets acquired. The goodwill resulting from the acquisition represents the inherent long-term value expected from the business opportunities created from acquiring Highlands. None of the goodwill recognized will be deductible for income tax purposes. The core deposit intangible is being amortized on an accelerated basis over the estimated life, currently expected to be 7 years.
In connection with the acquisition of Highlands, the Company acquired loans both with and without evidence of credit deterioration since origination. The acquired loans were initially recorded at fair value with no carryover of any allowance for loan losses. Loans acquired with evidence of credit quality deterioration at acquisition for which it was probable the Company would not be able to collect all contractual amounts due were accounted for as purchased credit-impaired (“PCI”). The Company individually reviewed the acquired PCI loans and the portfolio was accounted for at estimated fair value on the acquisition date as follows:
VIEWPOINT FINANCIAL GROUP, INC.
NOTES TO CONSOLIDATED FINANCIAL STATEMENTS
(Dollar amounts in thousands, except per share and share data)
NOTE 4 — ACQUISITION (Continued)
|
| | | |
| | Acquired PCI loans |
Contractually required principal and interest (1) | $ | 29,408 |
|
| Contractual cash flows not expected to be collected (nonaccretable difference) | 5,366 |
|
| Expected cash flows | 24,042 |
|
| Less: Interest component of expected cash flows (accretable yield) | 9,322 |
|
| Fair value at acquisition | $ | 14,720 |
|
(1) Excludes loans fully charged off prior to acquisition date with no expectation of future cash flows.
The Company estimated the total cash flows expected to be collected from the acquired PCI loans, which included undiscounted expected principal and interest, using credit risk, interest rate and prepayment risk models that incorporated management's best estimate of current key assumptions such as default rates, loss severity and payment speeds.
The carrying amount of acquired PCI loans included in the consolidated balance sheet and the related outstanding balance at December 31, 2012 was as follows:
|
| | | |
| | December 31, 2012 |
|
| Acquired PCI loans: | |
| Carrying amount, net of allowance of $148 | $ | 12,660 |
|
| Outstanding contractual balance | 16,296 |
|
The outstanding contractual balance represents the total amount owed as of December 31, 2012 including accrued but unpaid interest and any amounts previously charged-off.
Changes in the accretable yield for acquired PCI loans for the year ended December 31, 2012 were as follows:
|
| | | |
| | Year ended |
| | December 31, 2012 |
| Balance at beginning of period | $ | — |
|
| Additions | 9,322 |
|
| Reclassifications to/from nonaccretable | 556 |
|
| Disposals | (2,006 | ) |
| Accretion | (1,441 | ) |
| Balance at December 31, 2012 | $ | 6,431 |
|
Information regarding acquired loans not deemed credit-impaired at acquisition date was as follows:
|
| | | |
| | Nonimpaired loans |
| Contractually required principal and interest | $ | 306,941 |
|
| Contractual cash flows not expected to be collected | 7,216 |
|
| Fair value at acquisition | 268,661 |
|
VIEWPOINT FINANCIAL GROUP, INC.
NOTES TO CONSOLIDATED FINANCIAL STATEMENTS
(Dollar amounts in thousands, except per share and share data)
NOTE 5 - SECURITIES
The fair value of available-for-sale securities and the related gross unrealized gains and losses recognized in accumulated other comprehensive income (loss), net of tax, were as follows:
|
| | | | | | | | | | | | | | | |
| | Amortized | | Gross Unrealized | | Gross Unrealized | | |
| December 31, 2012 | Cost | | Gains | | Losses | | Fair Value |
| Agency residential mortgage-backed securities | $ | 164,023 |
| | $ | 2,195 |
| | $ | 118 |
| | $ | 166,100 |
|
| Agency residential collateralized mortgage obligations | 116,723 |
| | 996 |
| | 233 |
| | 117,486 |
|
| SBA pools | 3,342 |
| | 106 |
| | — |
| | 3,448 |
|
| Total securities | $ | 284,088 |
| | $ | 3,297 |
| | $ | 351 |
| | $ | 287,034 |
|
|
| | | | | | | | | | | | | | | |
| | Amortized | | Gross Unrealized | | Gross Unrealized | | |
| December 31, 2011 | Cost | | Gains | | Losses | | Fair Value |
| Agency residential mortgage-backed securities | $ | 133,907 |
| | $ | 1,125 |
| | $ | 179 |
| | $ | 134,853 |
|
| Agency residential collateralized mortgage obligations | 293,584 |
| | 1,676 |
| | 590 |
| | 294,670 |
|
| SBA pools | 4,161 |
| | 61 |
| | — |
| | 4,222 |
|
| Total securities | $ | 431,652 |
| | $ | 2,862 |
| | $ | 769 |
| | $ | 433,745 |
|
The carrying amount, unrecognized gains and losses, and fair value of securities held to maturity were as follows:
|
| | | | | | | | | | | | | | | |
| | Amortized | | Gross Unrealized | | Gross Unrealized | | |
| December 31, 2012 | Cost | | Gains | | Losses | | Fair Value |
| Agency residential mortgage-backed securities | $ | 114,388 |
| | $ | 6,324 |
| | $ | — |
| | $ | 120,712 |
|
| Agency commercial mortgage-backed securities | 9,243 |
| | 1,303 |
| | — |
| | 10,546 |
|
| Agency residential collateralized mortgage obligations | 186,467 |
| | 3,129 |
| | 173 |
| | 189,423 |
|
| Municipal bonds | 50,456 |
| | 5,018 |
| | 2 |
| | 55,472 |
|
| Total securities | $ | 360,554 |
| | $ | 15,774 |
| | $ | 175 |
| | $ | 376,153 |
|
|
| | | | | | | | | | | | | | | |
| | Amortized | | Gross Unrealized | | Gross Unrealized | | |
| December 31, 2011 | Cost | | Gains | | Losses | | Fair Value |
| Agency residential mortgage-backed securities | $ | 171,103 |
| | $ | 7,501 |
| | $ | 23 |
| | $ | 178,581 |
|
| Agency commercial mortgage-backed securities | 9,396 |
| | 742 |
| | — |
| | 10,138 |
|
| Agency residential collateralized mortgage obligations | 269,516 |
| | 4,712 |
| | 218 |
| | 274,010 |
|
| Municipal bonds | 50,473 |
| | 4,940 |
| | — |
| | 55,413 |
|
| Total securities | $ | 500,488 |
| | $ | 17,895 |
| | $ | 241 |
| | $ | 518,142 |
|
VIEWPOINT FINANCIAL GROUP, INC.
NOTES TO CONSOLIDATED FINANCIAL STATEMENTS
(Dollar amounts in thousands, except per share and share data)
NOTE 5 - SECURITIES (Continued)
The carrying amount and fair value of held to maturity debt securities and the fair value of available for sale debt securities at year end 2012 by contractual maturity were as follows. Securities with contractual payments not due at a single maturity date, including mortgage backed securities and collateralized mortgage obligations, are shown separately.
|
| | | | | | | | | | | |
| | | | Available |
| | Held to maturity | | for sale |
| | Carrying Amount | | Fair Value | | Fair Value |
| Due in one year or less | $ | 1,468 |
| | $ | 1,494 |
| | $ | — |
|
| Due after one to five years | 4,646 |
| | 5,066 |
| | 490 |
|
| Due after five to ten years | 14,032 |
| | 15,520 |
| | 2,958 |
|
| Due after ten years | 30,310 |
| | 33,392 |
| | — |
|
| Agency residential mortgage-backed securities | 114,388 |
| | 120,712 |
| | 166,100 |
|
| Agency commercial mortgage-backed securities | 9,243 |
| | 10,546 |
| | — |
|
| Agency residential collateralized mortgage obligations | 186,467 |
| | 189,423 |
| | 117,486 |
|
| Total | $ | 360,554 |
| | $ | 376,153 |
| | $ | 287,034 |
|
Information regarding pledged securities is summarized below:
|
| | | | | | | |
| | December 31, 2012 | | December 31, 2011 |
| Public fund certificates of deposit | $ | 134,846 |
| | $ | 236,933 |
|
| Repurchase agreements | 25,000 |
| | 25,000 |
|
| Carrying value of securities pledged on above funds | 176,508 |
| | 300,820 |
|
At year end 2012 and 2011, there were no holdings of securities of any one issuer, other than the U.S. Government and its agencies or U.S. Government Sponsored Enterprises, in an amount greater than 10% of shareholders’ equity.
Sales activity of securities for the years ended December 31, 2012 and 2011 was as follows:
|
| | | | | | | |
| | December 31, |
| | 2012 | | 2011 |
| Proceeds | $ | 133,595 |
| | $ | 279,420 |
|
| Gross gains | 1,142 |
| | 6,338 |
|
| Gross losses | 128 |
| | 70 |
|
The tax provision related to the net realized gains was $355 for the year ended December 31, 2012 and was $2,194 for the year ended December 31, 2011. There was no sale activity during 2010.
Securities with unrealized losses at year‑end 2012 and 2011, aggregated by investment category and length of time that individual securities have been in a continuous unrealized loss position, were as follows:
|
| | | | | | | | | | | | | | | | | | | | | | | | | | | | | | | | |
| AFS | Less than 12 Months | | 12 Months or More | | Total |
| December 31, 2012 | Fair Value | | Unrealized Loss | | Number | | Fair Value | | Unrealized Loss | | Number | | Fair Value | | Unrealized Loss | | Number |
| Agency residential mortgage-backed securities | $ | 24,462 |
| | $ | 118 |
| | 4 |
| | $ | — |
| | $ | — |
| | — |
| | $ | 24,462 |
| | $ | 118 |
| | 4 |
|
| Agency residential collateralized mortgage obligations | 2 |
| | — |
| | 1 |
| | 16,912 |
| | 233 |
| | 6 |
| | 16,914 |
| | 233 |
| | 7 |
|
| Total temporarily impaired | $ | 24,464 |
| | $ | 118 |
| | 5 |
| | $ | 16,912 |
| | $ | 233 |
| | 6 |
| | $ | 41,376 |
| | $ | 351 |
| | 11 |
|
VIEWPOINT FINANCIAL GROUP, INC.
NOTES TO CONSOLIDATED FINANCIAL STATEMENTS
(Dollar amounts in thousands, except per share and share data)
NOTE 5 - SECURITIES (Continued)
|
| | | | | | | | | | | | | | | | | | | | | | | | | | | | | | | | |
| HTM | Less than 12 Months | | 12 Months or More | | Total |
| December 31, 2012 | Fair Value | | Unrealized Loss | | Number | | Fair Value | | Unrealized Loss | | Number | | Fair Value | | Unrealized Loss | | Number |
| Agency residential collateralized mortgage obligations | $ | 19,311 |
| | $ | 62 |
| | 5 |
| | $ | 4,972 |
| | $ | 111 |
| | 4 |
| | $ | 24,283 |
| | $ | 173 |
| | 9 |
|
| Municipal bonds | 281 |
| | 2 |
| | 1 |
| | — |
| | — |
| | — |
| | 281 |
| | 2 |
| | 1 |
|
| Total temporarily impaired | $ | 19,592 |
|
| $ | 64 |
|
| 6 |
| | $ | 4,972 |
| | $ | 111 |
| | 4 |
| | $ | 24,564 |
|
| $ | 175 |
| | 10 |
|
|
| | | | | | | | | | | | | | | | | | | | | | | | | | | | | | | | |
| AFS | Less than 12 Months | | 12 Months or More | | Total |
| December 31, 2011 | Fair Value | | Unrealized Loss | | Number | | Fair Value | | Unrealized Loss | | Number | | Fair Value | | Unrealized Loss | | Number |
| Agency residential mortgage-backed securities | $ | 11,745 |
| | $ | 24 |
| | 4 |
| | $ | 30,248 |
| | $ | 155 |
| | 5 |
| | $ | 41,993 |
| | $ | 179 |
| | 9 |
|
| Agency residential collateralized mortgage obligations | 49,318 |
| | 393 |
| | 9 |
| | 29,635 |
| | 197 |
| | 12 |
| | 78,953 |
| | 590 |
| | 21 |
|
| Total temporarily impaired | $ | 61,063 |
| | $ | 417 |
| | 13 |
| | $ | 59,883 |
| | $ | 352 |
| | 17 |
| | $ | 120,946 |
| | $ | 769 |
| | 30 |
|
|
| | | | | | | | | | | | | | | | | | | | | | | | | | | | | | | | |
| HTM | Less than 12 Months | | 12 Months or More | | Total |
| December 31, 2011 | Fair Value | | Unrealized Loss | | Number | | Fair Value | | Unrealized Loss | | Number | | Fair Value | | Unrealized Loss | | Number |
| Agency residential mortgage-backed securities | $ | 5,897 |
| | $ | 23 |
| | 1 |
| | $ | — |
| | $ | — |
| | — |
| | $ | 5,897 |
| | $ | 23 |
| | 1 |
|
| Agency residential collateralized mortgage obligations | 27,390 |
| | 66 |
| | 6 |
| | 3,788 |
| | 152 |
| | 1 |
| | 31,178 |
| | 218 |
| | 7 |
|
| Total temporarily impaired | $ | 33,287 |
| | $ | 89 |
| | 7 |
| | $ | 3,788 |
| | $ | 152 |
| | 1 |
| | $ | 37,075 |
| | $ | 241 |
| | 8 |
|
Other-than-Temporary Impairment
In determining other-than-temporary impairment for debt securities, management considers many factors, including: (1) the length of time and the extent to which the fair value has been less than cost, (2) the financial condition and near-term prospects of the issuer, (3) whether the market decline was affected by macroeconomic conditions, and (4) whether the Company has the intent to sell the debt security or more likely than not will be required to sell the debt security before its anticipated recovery. The Company does not believe these unrealized losses to be other-than-temporary.
VIEWPOINT FINANCIAL GROUP, INC.
NOTES TO CONSOLIDATED FINANCIAL STATEMENTS
(Dollar amounts in thousands, except per share and share data)
NOTE 6 - LOANS
Loans consist of the following:
|
| | | | | | | |
| | December 31, 2012 | | December 31, 2011 |
| Commercial real estate | $ | 839,908 |
| | $ | 585,328 |
|
| | | | |
| Commercial and industrial loans: | | | |
| Commercial | 245,799 |
| | 54,479 |
|
| Warehouse lines of credit | 32,726 |
| | 16,141 |
|
| Total commercial and industrial loans | 278,525 |
| | 70,620 |
|
| | | | |
| Consumer: | | | |
| One- to four-family real estate | 378,255 |
| | 379,944 |
|
| Home equity/home improvement | 135,001 |
| | 140,966 |
|
| Other consumer loans | 59,080 |
| | 51,170 |
|
| Total consumer | 572,336 |
| | 572,080 |
|
| | | | |
| Gross loans held for investment | 1,690,769 |
| | 1,228,028 |
|
| | | | |
| Net of: | | | |
| Deferred fees and discounts, net | 486 |
| | 516 |
|
| Allowance for loan losses | (18,051 | ) | | (17,487 | ) |
| Net loans held for investment | $ | 1,673,204 |
| | $ | 1,211,057 |
|
| | | | |
| Loans held for sale | $ | 1,060,720 |
| | $ | 834,352 |
|
VIEWPOINT FINANCIAL GROUP, INC.
NOTES TO CONSOLIDATED FINANCIAL STATEMENTS
(Dollar amounts in thousands, except per share and share data)
NOTE 6 - LOANS (Continued)
Activity in the allowance for loan losses for the years ended December 31, 2012, 2011 and 2010, segregated by portfolio segment and evaluation for impairment, was as follows. At December 31, 2012, 2011 and 2010, there was no portion of the allowance for loan losses individually evaluated for impairment that was allocated to purchased credit impaired ("PCI") loans.
|
| | | | | | | | | | | | | | | | | | | | | | | |
| | Commercial Real Estate | | Commercial and Industrial | | One- to Four-Family Real Estate | | Home Equity/Home Improvement | | Other Consumer | | |
| December 31, 2012 | | | | | Total |
| Allowance for loan losses: | | | | | | | | | | | |
| Beginning balance - January 1, 2012 | $ | 10,621 |
| | $ | 2,090 |
| | $ | 3,027 |
| | $ | 1,043 |
| | $ | 706 |
| | $ | 17,487 |
|
| Charge-offs | (187 | ) | | (1,178 | ) | | (515 | ) | | (283 | ) | | (1,039 | ) | | (3,202 | ) |
| Recoveries | — |
| | 114 |
| | 42 |
| | 28 |
| | 443 |
| | 627 |
|
| Provision expense (benefit) | 870 |
| | 1,548 |
| | (198 | ) | | 411 |
| | 508 |
| | 3,139 |
|
| Ending balance - December 31, 2012 | $ | 11,304 |
| | $ | 2,574 |
| | $ | 2,356 |
| | $ | 1,199 |
| | $ | 618 |
| | $ | 18,051 |
|
| Allowance ending balance: | | | | | | | | | | | |
| Individually evaluated for impairment | $ | 2,880 |
| | $ | 647 |
| | $ | 729 |
| | $ | 238 |
| | $ | 23 |
| | $ | 4,517 |
|
| Collectively evaluated for impairment | 8,424 |
| | 1,927 |
| | 1,627 |
| | 961 |
| | 595 |
| | 13,534 |
|
| Loans: | | | | | | | | | | | |
| Individually evaluated for impairment | 16,992 |
| | 5,609 |
| | 7,363 |
| | 1,126 |
| | 329 |
| | 31,419 |
|
| Collectively evaluated for impairment | 813,538 |
| | 270,843 |
| | 369,944 |
| | 133,663 |
| | 58,554 |
| | 1,646,542 |
|
| PCI Loans | 9,378 |
| | 2,073 |
| | 948 |
| | 212 |
| | 197 |
| | 12,808 |
|
| Ending balance | $ | 839,908 |
| | $ | 278,525 |
| | $ | 378,255 |
| | $ | 135,001 |
| | $ | 59,080 |
| | $ | 1,690,769 |
|
VIEWPOINT FINANCIAL GROUP, INC.
NOTES TO CONSOLIDATED FINANCIAL STATEMENTS
(Dollar amounts in thousands, except per share and share data)
NOTE 6 - LOANS (Continued)
|
| | | | | | | | | | | | | | | | | | | | | | | |
| | Commercial Real Estate | | Commercial and Industrial | | One- to Four-Family Real Estate | | Home Equity/Home Improvement | | Other Consumer | | |
| December 31, 2011 | | | | | Total |
| Allowance for loan losses: | | | | | | | | | | | |
| Beginning balance - January 1, 2011 | $ | 7,949 |
| | $ | 1,652 |
| | $ | 3,307 |
| | $ | 936 |
| | $ | 1,003 |
| | $ | 14,847 |
|
| Charge-offs | (15 | ) | | (470 | ) | | (238 | ) | | (249 | ) | | (850 | ) | | (1,822 | ) |
| Recoveries | 29 |
| | 38 |
| | 30 |
| | 30 |
| | 365 |
| | 492 |
|
| Provision expense (benefit) | 2,658 |
| | 870 |
| | (72 | ) | | 326 |
| | 188 |
| | 3,970 |
|
| Ending balance - December 31, 2011 | $ | 10,621 |
| | $ | 2,090 |
| | $ | 3,027 |
| | $ | 1,043 |
| | $ | 706 |
| | $ | 17,487 |
|
| Allowance ending balance: | | | | | | | | | | | |
| Individually evaluated for impairment | $ | 2,358 |
| | $ | 87 |
| | $ | 750 |
| | $ | 290 |
| | $ | 13 |
| | $ | 3,498 |
|
| Collectively evaluated for impairment | 8,263 |
| | 2,003 |
| | 2,277 |
| | 753 |
| | 693 |
| | 13,989 |
|
| Loans: | | | | | | | | | | | |
| Individually evaluated for impairment | 18,936 |
| | 456 |
| | 5,476 |
| | 1,333 |
| | 168 |
| | 26,369 |
|
| Collectively evaluated for impairment | 566,392 |
| | 70,164 |
| | 374,468 |
| | 139,633 |
| | 51,002 |
| | 1,201,659 |
|
| Ending balance | $ | 585,328 |
| | $ | 70,620 |
| | $ | 379,944 |
| | $ | 140,966 |
| | $ | 51,170 |
| | $ | 1,228,028 |
|
|
| | | | | | | | | | | | | | | | | | | | | | | |
| | Commercial Real Estate | | Commercial and Industrial | | One- to Four-Family Real Estate | | Home
Equity/Home Improvement | | Other Consumer | | |
| December 31, 2010 | | | | | Total |
| Allowance for loan losses: | | | | | | | | | | | |
| Beginning balance - January 1, 2010 | $ | 6,457 |
| | $ | 1,382 |
| | $ | 2,379 |
| | $ | 730 |
| | $ | 1,362 |
| | $ | 12,310 |
|
| Charge-offs | (624 | ) | | (638 | ) | | (279 | ) | | (123 | ) | | (1,330 | ) | | (2,994 | ) |
| Recoveries | — |
| | 67 |
| | 15 |
| | 4 |
| | 326 |
| | 412 |
|
| Provision expense (benefit) | 2,116 |
| | 841 |
| | 1,192 |
| | 325 |
| | 645 |
| | 5,119 |
|
| Ending balance - December 31, 2010 | $ | 7,949 |
| | $ | 1,652 |
| | $ | 3,307 |
| | $ | 936 |
| | $ | 1,003 |
| | $ | 14,847 |
|
| Allowance ending balance: | | | | | | | | | | | |
| Individually evaluated for impairment | $ | 1,002 |
| | $ | 8 |
| | $ | 474 |
| | $ | 95 |
| | $ | 22 |
| | $ | 1,601 |
|
| Collectively evaluated for impairment | 6,947 |
| | 1,644 |
| | 2,833 |
| | 841 |
| | 981 |
| | 13,246 |
|
| Loans: | | | | | | | | | | | |
| Individually evaluated for impairment | 10,930 |
| | 272 |
| | 6,081 |
| | 1,306 |
| | 326 |
| | 18,915 |
|
| Collectively evaluated for impairment | 468,710 |
| | 39,007 |
| | 375,503 |
| | 137,859 |
| | 67,040 |
| | 1,088,119 |
|
| Ending balance | $ | 479,640 |
| | $ | 39,279 |
| | $ | 381,584 |
| | $ | 139,165 |
| | $ | 67,366 |
| | $ | 1,107,034 |
|
VIEWPOINT FINANCIAL GROUP, INC.
NOTES TO CONSOLIDATED FINANCIAL STATEMENTS
(Dollar amounts in thousands, except per share and share data)
NOTE 6 - LOANS (Continued)
Impaired loans at December 31, 2012, and December 31, 2011, were as follows 1:
|
| | | | | | | | | | | | | | | | | | | | | | | |
| | December 31, 2012 | | December 31, 2011 |
| | Recorded Investment | | Unpaid Principal Balance | | Related Allowance | | Recorded
Investment | | Unpaid
Principal
Balance | | Related
Allowance |
| With no related allowance recorded: | | | | | | | | | | | |
| Commercial real estate | $ | 4,383 |
| | $ | 4,586 |
| | $ | — |
| | $ | 2,860 |
| | $ | 2,860 |
| | $ | — |
|
| | | | | | | | | | | | |
| Commercial and industrial | 3,284 |
| | 4,501 |
| | — |
| | 55 |
| | 55 |
| | — |
|
| | | | | | | | | | | | |
| Consumer: | | | | | | | | | | | |
| One- to four- family real estate | 4,472 |
| | 4,535 |
| | — |
| | 1,664 |
| | 1,664 |
| | — |
|
| Home equity/home improvement | 819 |
| | 833 |
| | — |
| | 844 |
| | 844 |
| | — |
|
| Other consumer | 28 |
| | 29 |
| | — |
| | — |
| | — |
| | — |
|
| Total consumer | 5,319 |
| | 5,397 |
| | — |
| | 2,508 |
| | 2,508 |
| | — |
|
| | | | | | | | | | | | |
| Impaired loans with no related allowance recorded | 12,986 |
| | 14,484 |
| | — |
| | 5,423 |
| | 5,423 |
| | — |
|
| | | | | | | | | | | | |
| With an allowance recorded: | | | | | | | | | | | |
| Commercial real estate | 12,609 |
| | 13,182 |
| | 2,756 |
| | 16,076 |
| | 16,076 |
| | 2,358 |
|
| | | | | | | | | | | | |
| Commercial and industrial | 2,325 |
| | 3,131 |
| | 630 |
| | 401 |
| | 401 |
| | 87 |
|
| | | | | | | | | | | | |
| Consumer: | | | | | | | | | | | |
| One- to four- family real estate | 2,891 |
| | 2,980 |
| | 722 |
| | 3,812 |
| | 3,812 |
| | 750 |
|
| Home equity/home improvement | 307 |
| | 324 |
| | 238 |
| | 489 |
| | 489 |
| | 290 |
|
| Other consumer | 301 |
| | 309 |
| | 23 |
| | 168 |
| | 168 |
| | 13 |
|
| Total consumer | 3,499 |
| | 3,613 |
| | 983 |
| | 4,469 |
| | 4,469 |
| | 1,053 |
|
| | | | | | | | | | | | |
| Impaired loans with allowance recorded | 18,433 |
| | 19,926 |
| | 4,369 |
| | 20,946 |
| | 20,946 |
| | 3,498 |
|
| Total: | | | | | | | | | | | |
| Commercial real estate | 16,992 |
| | 17,768 |
| | 2,756 |
| | 18,936 |
| | 18,936 |
| | 2,358 |
|
| Commercial and industrial | 5,609 |
| | 7,632 |
| | 630 |
| | 456 |
| | 456 |
| | 87 |
|
| Consumer | 8,818 |
| | 9,010 |
| | 983 |
| | 6,977 |
| | 6,977 |
| | 1,053 |
|
| | $ | 31,419 |
| | $ | 34,410 |
| | $ | 4,369 |
| | $ | 26,369 |
| | $ | 26,369 |
| | $ | 3,498 |
|
VIEWPOINT FINANCIAL GROUP, INC.
NOTES TO CONSOLIDATED FINANCIAL STATEMENTS
(Dollar amounts in thousands, except per share and share data)
NOTE 6 - LOANS (Continued)
|
| | | | | | | | | | | | | | | | | | | | | | | |
| | December 31, 2012 | | December 31, 2011 | | December 31, 2010 |
| | Average Recorded Investment | | Interest Income Recognized | | Average Recorded Investment | | Interest Income Recognized | | Average Recorded Investment | | Interest Income Recognized |
| With no related allowance recorded: | | | | | | | | | | | |
| Commercial real estate | $ | 3,722 |
| | $ | 332 |
| | $ | 1,364 |
| | $ | 85 |
| | $ | 2,710 |
| | $ | 203 |
|
| | | | | | | | | | | | |
| Commercial and industrial | 1,410 |
| | 9 |
| | 10 |
| | 1 |
| | 54 |
| | 8 |
|
| | | | | | | | | | | | |
| Consumer: | | | | | | | | | | | |
| One- to four- family real estate | 2,493 |
| | 36 |
| | 1,757 |
| | 54 |
| | 3,651 |
| | 107 |
|
| Home equity/home improvement | 630 |
| | 7 |
| | 942 |
| | 22 |
| | 366 |
| | 16 |
|
| Other consumer | 65 |
| | — |
| | — |
| | — |
| | — |
| | — |
|
| Total consumer | 3,188 |
| | 43 |
| | 2,699 |
| | 76 |
| | 4,017 |
| | 123 |
|
| | | | | | | | | | | | |
| Impaired loans with no related allowance recorded | 8,320 |
| | 384 |
| | 4,073 |
| | 162 |
| | 6,781 |
| | 334 |
|
| With an allowance recorded: | | | | | | | | | | | |
| Commercial real estate | 15,194 |
| | — |
| | 10,935 |
| | 540 |
| | 6,432 |
| | 134 |
|
| | | | | | | | | | | | |
| Commercial and industrial | 887 |
| | — |
| | 374 |
| | 13 |
| | 299 |
| | 6 |
|
| | | | | | | | | | | | |
| Consumer: | | | | | | | | | | | |
| One- to four- family real estate | 3,051 |
| | 5 |
| | 3,248 |
| | 55 |
| | 1,631 |
| | 59 |
|
| Home equity/home improvement | 678 |
| | — |
| | 338 |
| | 8 |
| | 381 |
| | 2 |
|
| Other consumer | 170 |
| | 2 |
| | 191 |
| | — |
| | 414 |
| | — |
|
| Total consumer | 3,899 |
| | 7 |
| | 3,777 |
| | 63 |
| | 2,426 |
| | 61 |
|
| | | | | | | | | | | | |
| Impaired loans with allowance recorded | 19,980 |
| | 7 |
| | 15,086 |
| | 616 |
| | 9,157 |
| | 201 |
|
| Total: | | | | | | | | | | | |
| Commercial real estate | 18,916 |
| | 332 |
| | 12,299 |
| | 625 |
| | 9,142 |
| | 337 |
|
| Commercial and industrial | 2,297 |
| | 9 |
| | 384 |
| | 14 |
| | 353 |
| | 14 |
|
| Consumer | 7,087 |
| | 50 |
| | 6,476 |
| | 139 |
| | 6,443 |
| | 184 |
|
| | | | | | | | | | | | |
| | $ | 28,300 |
| | $ | 391 |
| | $ | 19,159 |
| | $ | 778 |
| | $ | 15,938 |
| | $ | 535 |
|
1 Loans reported do not include PCI loans
VIEWPOINT FINANCIAL GROUP, INC.
NOTES TO CONSOLIDATED FINANCIAL STATEMENTS
(Dollar amounts in thousands, except per share and share data)
NOTE 6 - LOANS (Continued)
Loans past due over 90 days that were still accruing interest totaled $593 at December 31, 2012, which consisted entirely of PCI loans. There were no loans past due over 90 days that were still accruing interest at December 31, 2011. At December 31, 2012, there were no PCI loans that were considered non-performing loans, while $5,364 of purchased performing loans were considered non-performing at December 31, 2012, including $3,159 of commercial lines of credit that did not qualify for PCI accounting due to their revolving nature. Non-performing (nonaccrual) loans were as follows.
|
| | | | | | | |
| | Years Ended December 31, |
| | 2012 | | 2011 |
| Commercial real estate | $ | 13,609 |
| | $ | 16,076 |
|
| | | | |
| Commercial and industrial | 5,401 |
| | 430 |
|
| | | | |
| Consumer: | | | |
| One- to four- family real estate | 6,854 |
| | 5,340 |
|
| Home equity/home improvement | 1,077 |
| | 1,226 |
|
| Other consumer | 262 |
| | 26 |
|
| Total consumer | 8,193 |
| | 6,592 |
|
| | | | |
| Total | $ | 27,203 |
| | $ | 23,098 |
|
For the years ended December 31, 2012, 2011and 2010, gross interest income which would have been recorded had the non-accruing loans been current in accordance with their original terms amounted to $1,421, $1,531and $1,265 respectively. The amount that was included in interest income on these loans for the years ended December 31, 2012, 2011 and 2010 was $11, $473 and $150, respectively.
The outstanding balances of troubled debt restrucutrings ("TDRs") are shown below:
|
| | | | | | | |
| | December 31, |
| TDRs | 2012 | | 2011 |
| Nonaccrual TDRs | $ | 13,760 |
| | $ | 10,420 |
|
Performing TDRs (1) | 4,216 |
| | 3,271 |
|
| Total | $ | 17,976 |
| | $ | 13,691 |
|
| | | | |
| Specific reserves on TDRs | $ | 2,643 |
| | $ | 2,115 |
|
| Outstanding commitments to lend additional funds to borrowers with TDR loans | — |
| | — |
|
1 Performing TDR loans are loans that have been performing under the restructured terms for at least six months and the Company is accruing interest on these loans.
VIEWPOINT FINANCIAL GROUP, INC.
NOTES TO CONSOLIDATED FINANCIAL STATEMENTS
(Dollar amounts in thousands, except per share and share data)
NOTE 6 - LOANS (Continued)
The following table provides the recorded balances of loans modified as a TDR during the years ended December 31, 2012 and 2011.
|
| | | | | | | | | | | | | | | | | | | |
| Year Ended December 31, 2012 | Loan Bifurcation | | Principal Deferrals (a) | | Combination of Rate Reduction and Principal Deferral | | Other | | Total |
| Commercial real estate | $ | 5,876 |
| | $ | — |
| | $ | — |
| | $ | — |
| | $ | 5,876 |
|
| Commercial and industrial | — |
| | 26 |
| | — |
| | 76 |
| | 102 |
|
| Consumer: | | | | | | | | | |
| One- to four- family real estate | — |
| | 782 |
| | 689 |
| | 249 |
| | 1,720 |
|
| Home equity/home improvement | — |
| | 177 |
| | 28 |
| | 42 |
| | 247 |
|
| Other consumer | — |
| | 99 |
| | 37 |
| | 17 |
| | 153 |
|
| Total consumer | — |
| | 1,058 |
| | 754 |
| | 308 |
| | 2,120 |
|
| Total | $ | 5,876 |
| | $ | 1,084 |
| | $ | 754 |
| | $ | 384 |
| | $ | 8,098 |
|
| | | | | | | | | | |
| Year Ended December 31, 2011 | | | | | | | | | |
| Consumer: | | | | | | | | | |
| One- to four- family real estate | $ | — |
| | $ | — |
| | $ | 149 |
| | $ | 186 |
| | $ | 335 |
|
| Home equity/home improvement | — |
| | 6 |
| | — |
| | 75 |
| | 81 |
|
| Other consumer | — |
| | 19 |
| | — |
| | — |
| | 19 |
|
| Total | $ | — |
| | $ | 25 |
| | $ | 149 |
| | $ | 261 |
| | $ | 435 |
|
| (a) Beginning in September 2012, principal deferrals include Chapter 7 bankruptcy loans for which the court has discharged the borrower's obligation and the borrower has not reaffirmed the debt. Such loans are placed on non accrual status. |
TDRs modified during the twelve-month periods ending December 31, 2012 and 2011, which experienced a subsequent default during the periods are shown below. A payment default is defined as a loan that was 90 days or more past due.
|
| | | | | | | |
| | Years Ended December 31, |
| | 2012 | | 2011 |
| Consumer: | | | |
| One- to four- family real estate | $ | 229 |
| | $ | 91 |
|
| Home equity/home improvement | 59 |
| | — |
|
| Total | $ | 288 |
| | $ | 91 |
|
VIEWPOINT FINANCIAL GROUP, INC.
NOTES TO CONSOLIDATED FINANCIAL STATEMENTS
(Dollar amounts in thousands, except per share and share data)
NOTE 6 - LOANS (Continued)
Below is an analysis of the age of recorded investment in loans that were past due for the years ended December 31, 2012 and 2011.
|
| | | | | | | | | | | | | | | | | |
| December 31, 2012 | 30-59 Days Past Due | | 60-89 Days Past Due | | 90 Days and Greater Past Due | | Total Loans Past Due | | Current Loans (a) | | Total Loans |
| Commercial real estate | 2,243 |
| | 1,182 |
| | 1,128 |
| | 4,553 |
| | 835,355 |
| | 839,908 |
|
| | | | | | | | | | | | |
| Commercial and industrial | 2,066 |
| | 530 |
| | 2,867 |
| | 5,463 |
| | 273,062 |
| | 278,525 |
|
| | | | | | | | | | | | |
| Consumer loans: | | | | | | | | | | | |
| One- to four- family real estate | 7,099 |
| | 1,867 |
| | 3,845 |
| | 12,811 |
| | 365,444 |
| | 378,255 |
|
| Home equity/home improvement | 1,046 |
| | 107 |
| | 624 |
| | 1,777 |
| | 133,224 |
| | 135,001 |
|
| Other consumer | 563 |
| | 151 |
| | 49 |
| | 763 |
| | 58,317 |
| | 59,080 |
|
| Total consumer loans | 8,708 |
| | 2,125 |
| | 4,518 |
| | 15,351 |
| | 556,985 |
| | 572,336 |
|
| | | | | | | | | | | | |
| Total | 13,017 |
| | 3,837 |
| | 8,513 |
| | 25,367 |
| | 1,665,402 |
| | 1,690,769 |
|
|
| | | | | | | | | | | | | | | | | |
| December 31, 2011 | 30-59 Days Past Due | | 60-89 Days Past Due | | 90 Days and Greater Past Due | | Total Loans Past Due | | Current Loans | | Total Loans |
| Commercial real estate | 13,038 |
| | 852 |
| | 899 |
| | 14,789 |
| | 570,539 |
| | 585,328 |
|
| | | | | | | | | | | | |
| Commercial and industrial | 236 |
| | 25 |
| | 143 |
| | 404 |
| | 70,216 |
| | 70,620 |
|
| | | | | | | | | | | | |
| Consumer loans: | | | | | | | | | | | |
| One- to four- family real estate | 4,325 |
| | 1,676 |
| | 3,663 |
| | 9,664 |
| | 370,280 |
| | 379,944 |
|
| Home equity/home improvement | 654 |
| | 123 |
| | 983 |
| | 1,760 |
| | 139,206 |
| | 140,966 |
|
| Other consumer | 156 |
| | 125 |
| | 13 |
| | 294 |
| | 50,876 |
| | 51,170 |
|
| Total consumer loans | 5,135 |
| | 1,924 |
| | 4,659 |
| | 11,718 |
| | 560,362 |
| | 572,080 |
|
| | | | | | | | | | | | |
| Total | 18,409 |
| | 2,801 |
| | 5,701 |
| | 26,911 |
| | 1,201,117 |
| | 1,228,028 |
|
(a) Includes acquired PCI loans with a total carrying value of $11.2 million at December 31, 2012
VIEWPOINT FINANCIAL GROUP, INC.
NOTES TO CONSOLIDATED FINANCIAL STATEMENTS
(Dollar amounts in thousands, except per share and share data)
NOTE 6 - LOANS (Continued)
The recorded investment in loans by credit quality indicators at December 31, 2012 and 2011, was as follows.
Real Estate and Commercial and Industrial Credit Exposure
Credit Risk Profile by Internally Assigned Grade
|
| | | | | | | | | | | | | | | |
| | Commercial Real | | Commercial and | | One- to Four- | | Home Equity/Home |
| December 31, 2012 | Estate | | Industrial | | Family Real Estate | | Improvement |
| Grade: (a) | | | | | | | |
| Pass | $ | 793,507 |
| | $ | 264,528 |
| | $ | 365,858 |
| | $ | 131,889 |
|
| Special Mention | 17,504 |
| | 645 |
| | 2,219 |
| | 398 |
|
| Substandard | 27,669 |
| | 13,227 |
| | 7,092 |
| | 1,850 |
|
| Doubtful | 1,228 |
| | 125 |
| | 3,086 |
| | 864 |
|
| Total | $ | 839,908 |
| | $ | 278,525 |
| | $ | 378,255 |
| | $ | 135,001 |
|
|
| | | | | | | | | | | | | | | |
| | Commercial Real | | Commercial and | | One- to Four- | | Home Equity/Home |
| December 31, 2011 | Estate | | Industrial | | Family | | Improvement |
| Grade: | | | | | | | |
| Pass | $ | 535,536 |
| | $ | 70,140 |
| | $ | 370,935 |
| | $ | 138,080 |
|
| Special Mention | 29,934 |
| | 50 |
| | 1,349 |
| | 147 |
|
| Substandard | 18,959 |
| | 315 |
| | 4,528 |
| | 1,726 |
|
| Doubtful | 899 |
| | 115 |
| | 3,132 |
| | 1,013 |
|
| Total | $ | 585,328 |
| | $ | 70,620 |
| | $ | 379,944 |
| | $ | 140,966 |
|
(a) PCI loans are included in the substandard or doubtful categories. These categories are generally consistent with "substandard" categories as defined by regulatory authorities.
Consumer Credit Exposure
Credit Risk Profile Based on Payment Activity
|
| | | | | | | | |
| | December 31, 2012 | | December 31, 2011 | |
| Performing | $ | 58,818 |
| | $ | 51,144 |
| |
| Non-performing | 262 |
| | 26 |
| |
| Total | $ | 59,080 |
| | $ | 51,170 |
| |
NOTE 7 - FAIR VALUE
ASC 820, “Fair Value Measurements and Disclosures”, establishes a fair value hierarchy which requires an entity to maximize the use of observable inputs and minimize the use of unobservable inputs when measuring fair value. The standard describes three levels of inputs that may be used to measure fair value:
Level 1: Quoted prices (unadjusted) for identical assets or liabilities in active markets that the entity has the ability to access as of the measurement date.
Level 2: Significant other observable inputs other than Level 1 prices such as quoted prices for similar assets or liabilities; quoted prices in markets that are not active; or other inputs that are observable or can be corroborated by observable market data.
VIEWPOINT FINANCIAL GROUP, INC.
NOTES TO CONSOLIDATED FINANCIAL STATEMENTS
(Dollar amounts in thousands, except per share and share data)
NOTE 7 - FAIR VALUE (Continued)
Level 3: Prices or valuation techniques that require inputs that are both significant and unobservable in the market. These instruments are valued using the best information available, some of which is internally developed, and reflects a reporting entity’s own assumptions about the risk premiums that market participants would generally require and the assumptions they would use.
The fair values of securities available for sale are determined by obtaining quoted prices on nationally recognized securities exchanges (Level 1 inputs) or matrix pricing, which is a mathematical technique widely used in the industry to value debt securities without relying exclusively on quoted prices for the specific securities but rather by relying on the securities' relationship to other benchmark quoted securities (Level 2 inputs.)
The Company elected the fair value option for certain residential mortgage loans held for sale at VPM in accordance with ASC 820. This election allowed for a more effective offset of the changes in fair values of the loans and the derivative instruments used to economically hedge them without the burden of complying with the requirements for hedge accounting under ASC 815, “Derivatives and Hedging.” The Company did not elect the fair value option for other loans held for sale primarily because they are not economically hedged using derivative instruments.
Prior to the Company's sale of VPM in the third quarter of 2012, mortgage loans held for sale for which the fair value option was elected were typically pooled together and sold into the mortgage market, depending upon underlying attributes of the loan, such as agency eligibility, product type, interest rate, and credit quality. These mortgage loans held for sale were valued predominantly using quoted market prices for similar instruments. Therefore, the Company classified these valuations as Level 2 in the fair value disclosures. The aggregate fair values and aggregate outstanding principal balances of certain loans held for sale for which the fair value option was elected are listed below.
|
| | | | | | | |
| | December 31, |
| | 2012 | | 2011 |
| Aggregate fair value | $ | — |
| | $ | 16,607 |
|
| Aggregate outstanding principal balance | — |
| | 16,379 |
|
Interest income on mortgage loans held for sale was recognized based on contractual rates and reflected in interest income on mortgage loans held for sale in the consolidated income statement.
The Company entered into a variety of derivative financial instruments as part of its hedging strategy. The majority of these derivatives were exchange-traded or traded within highly active dealer markets. In order to determine the fair value of these instruments, the Company utilized the exchange price or dealer market price for the particular derivative contract; therefore, these contracts were classified as Level 2. The net gain arising from changes in the fair value of certain mortgage loans held for sale, netted with the related economic hedges, is reflected below.
|
| | | | | | | |
| | Year ended December 31, |
| | 2012 | | 2011 |
| Net gain from changes in loan fair values | $ | — |
| | $ | 1,403 |
|
| Economic hedging losses | — |
| | 1,248 |
|
| Net gain included in mortgage income | $ | — |
| | $ | 155 |
|
VIEWPOINT FINANCIAL GROUP, INC.
NOTES TO CONSOLIDATED FINANCIAL STATEMENTS
(Dollar amounts in thousands, except per share and share data)
NOTE 7 - FAIR VALUE (Continued)
Assets and Liabilities Measured on a Recurring Basis
Assets measured at fair value on a recurring basis are summarized below. There were no liabilities measured at fair value on a recurring basis as of December 31, 2012 or 2011.
|
| | | |
| December 31, 2012 | Fair Value Measurements Using Significant Other Observable Inputs (Level 2) |
| Assets: | |
| Agency residential mortgage-backed securities | $ | 166,100 |
|
| Agency residential collateralized mortgage obligations | 117,486 |
|
| SBA pools | 3,448 |
|
| Total securities available for sale | $ | 287,034 |
|
| Loans held for sale | — |
|
| Derivative instruments | — |
|
|
| | | |
| December 31, 2011 | Fair Value Measurements Using Significant Other Observable Inputs (Level 2) |
| Assets: | |
| Agency residential mortgage-backed securities | $ | 134,853 |
|
| Agency residential collateralized mortgage obligations | 294,670 |
|
| SBA pools | 4,222 |
|
| Total securities available for sale | $ | 433,745 |
|
| Loans held for sale | 16,607 |
|
| Derivative instruments | 16 |
|
Assets and Liabilities Measured on a Non-Recurring Basis
Assets and liabilities measured at fair value on a non-recurring basis are summarized below. There were no liabilities measured at fair value on a non-recurring basis as of December 31, 2012 or 2011.
|
| | | | | | | | | | | |
| | | Fair Value Measurements Using |
| | December 31, 2012 | | Significant Other Observable Inputs (Level 2) | | Significant Unobservable Inputs (Level 3) |
| Assets: | | | | | |
| Impaired loans | $ | 14,064 |
| | $ | — |
| | $ | 14,064 |
|
| Other real estate owned | 1,886 |
| | 416 |
| | 1,470 |
|
|
| | | | | | | | | | | |
| | | | Fair Value Measurements Using |
| | December 31, 2011 | | Significant Other Observable Inputs (Level 2) | | Significant Unobservable Inputs (Level 3) |
| Assets: | | | | | |
| Impaired loans | $ | 17,448 |
| | $ | — |
| | $ | 17,448 |
|
| Other real estate owned | 2,286 |
| | 549 |
| | 1,737 |
|
VIEWPOINT FINANCIAL GROUP, INC.
NOTES TO CONSOLIDATED FINANCIAL STATEMENTS
(Dollar amounts in thousands, except per share and share data)
NOTE 7 - FAIR VALUE (Continued)
Unobservable inputs used in nonrecurring Level 3 fair value measurements at December 31, 2012, are summarized below:
|
| | | | | | |
| Quantitative Information about Level 3 Fair Value Measurements |
| December 31, 2012 | Fair Value | Valuation Technique | Unobservable Input | Range (Average) |
| Impaired loans | $ | 10,986 |
| Third Party Appraisal | Discount of market value | 0%-20% (8%) |
| | | | Estimated marketing costs | 0%-7% (6%) |
| | | | Estimated legal expenses | $0-$7 ($2) |
| | | | Estimated property maintenance | 0%-1% (1%) |
| | 3,078 |
| Discounted Cash Flow Analysis | Interest rate | 2.4%-5.4% (3.8%) |
| | | | Loan term (in months) | 10-251 (107) |
| Other real estate owned | 1,470 |
| Third Party Appraisal | Discount of market value | 8%-70% (18%) |
| | | | Estimated marketing costs | 0%-7% (6%) |
| | | | Estimated property maintenance | 0%-1% (1%) |
Impaired loans that are collateral dependent are measured for impairment using the fair value of the collateral as determined by third party appraisals using recent comparative sales data. The fair value of the collateral is then adjusted for the Level 3 inputs described above. Impaired loans that are not collateral dependent are measured for impairment by a discounted cash flow analysis using a net present value calculation utilizing data from the loan file before and after the modification.
Other real estate owned is measured at the lower of book or fair value less costs to sell. Other real estate owned that was valued using third party appraisals, listing agreements or sales contracts less actual costs to sell is classified as Level 2, while other real estate owned that was valued using third party appraisals, listing agreements or sales contracts less costs to sell and other Level 3 valuation inputs described in the above table is classified as Level 3.
The Credit Administration department evaluates the valuations on impaired loans and other real estate owned at least monthly. These valuations are reviewed at least monthly by the Allowance for Loan Loss Committee and are considered in the calculation of the allowance for loan losses. Unobservable inputs are monitored and adjusted if market conditions change.
Activity for other real estate owned for the years ended December 31, 2012 and 2011, and the related valuation allowances was as follows:
|
| | | | | | | |
| | 2012 | | 2011 |
| Balance at January 1 | $ | 2,286 |
| | $ | 2,668 |
|
Transfers in at fair value (a) | 4,507 |
| | 1,671 |
|
| Change in valuation allowance | 1,019 |
| | (624 | ) |
| Sale of property (gross) | (5,926 | ) | | (1,429 | ) |
| Balance at December 31 | $ | 1,886 |
| | $ | 2,286 |
|
| Valuation allowance: | | | |
| Balance at January 1 | $ | 1,076 |
| | $ | 452 |
|
| Sale of property | (1,344 | ) | | (76 | ) |
| Valuation adjustment | 325 |
| | 700 |
|
| Balance at December 31 | $ | 57 |
| | $ | 1,076 |
|
(a) The year ended December 31, 2012, includes other real estate owned acquired in the Highlands acquisition of $1,986 as of the date of acquisition.
VIEWPOINT FINANCIAL GROUP, INC.
NOTES TO CONSOLIDATED FINANCIAL STATEMENTS
(Dollar amounts in thousands, except per share and share data)
NOTE 7 - FAIR VALUE (Continued)
Carrying amount and fair value information of financial instruments at December 31, 2012, were as follows:
|
| | | | | | | | | | | | | | | |
| | December 31, 2012 |
| | | | Fair Value |
| | Carrying Amount | | Quoted Prices in Active Markets for Identical Assets (Level 1) | | Significant Other Observable Inputs (Level 2) | | Significant Unobservable Inputs (Level 3) |
| Financial assets | | | | | | | |
| Cash and cash equivalents | $ | 68,696 |
| | $ | 68,696 |
| | $ | — |
| | $ | — |
|
| Securities available for sale | 287,034 |
| | — |
| | 287,034 |
| | — |
|
| Securities held to maturity | 360,554 |
| | — |
| | 376,153 |
| | — |
|
| Loans held for sale | 1,060,720 |
| | — |
| | — |
| | 1,061,334 |
|
| Loans held for investment, net | 1,673,204 |
| | — |
| | — |
| | 1,696,060 |
|
| FHLB and Federal Reserve Bank stock | 45,025 |
| | N/A | | N/A | | N/A |
| Bank-owned life insurance | 34,916 |
| | 34,916 |
| | — |
| | — |
|
| Accrued interest receivable | 9,900 |
| | 9,900 |
| | — |
| | — |
|
| Financial liabilities | | | | | | | |
| Deposits | $ | 2,177,806 |
| | $ | — |
| | $ | — |
| | $ | 2,097,063 |
|
| FHLB advances | 892,208 |
| | — |
| | — |
| | 912,817 |
|
| Repurchase agreement | 25,000 |
| | — |
| | — |
| | 28,501 |
|
| Accrued interest payable | 1,216 |
| | 1,216 |
| | — |
| | — |
|
Carrying amounts and estimated fair values of financial instruments at December 31, 2011, were as follows:
|
| | | | | | | |
| | Carrying Amount | | Fair Value |
| Financial assets | | | |
| Cash and cash equivalents | $ | 46,348 |
| | $ | 46,348 |
|
| Securities available for sale | 433,745 |
| | 433,745 |
|
| Securities held to maturity | 500,488 |
| | 518,142 |
|
| Loans held for sale | 834,352 |
| | 834,878 |
|
| Loans, net | 1,211,057 |
| | 1,235,248 |
|
| FHLB and Federal Reserve Bank stock | 37,590 |
| | N/A |
|
| Bank-owned life insurance | 29,007 |
| | 29,007 |
|
| Accrued interest receivable | 8,982 |
| | 8,982 |
|
| Derivative instruments | 16 |
| | 16 |
|
| Financial liabilities | | | |
| Deposits | $ | 1,963,491 |
| | $ | 1,891,661 |
|
| FHLB advances | 746,398 |
| | 764,772 |
|
| Repurchase agreement | 25,000 |
| | 28,267 |
|
| Accrued interest payable | 1,220 |
| | 1,220 |
|
VIEWPOINT FINANCIAL GROUP, INC.
NOTES TO CONSOLIDATED FINANCIAL STATEMENTS
(Dollar amounts in thousands, except per share and share data)
NOTE 7 - FAIR VALUE (Continued)
The methods and assumptions used to estimate fair value are described as follows:
Estimated fair value is the carrying amount for cash and cash equivalents, bank-owned life insurance and accrued interest receivable and payable. For loans, fair value is based on discounted cash flows using current market offering rates, estimated life, and applicable credit risk. For deposits and borrowings, fair value is calculated using the FHLB advance curve to discount cash flows for the estimated life for deposits and according to the contractual repayment schedule for borrowings. Fair value of debt is based on discounting the estimated cash flows using the current rate at which similar borrowings would be made with similar terms and remaining maturities. It was not practicable to determine the fair value of FHLB and Federal Reserve Bank stock due to restrictions on its transferability. The fair value of off-balance sheet items is based on the current fees or costs that would be charged to enter into or terminate such arrangements and are not considered significant to this presentation.
NOTE 8 - GOODWILL AND CORE DEPOSIT INTANGIBLES
Goodwill and other intangible assets are presented in the table below. The increases in goodwill and core deposit intangible assets were related to the Highlands acquisition on April 2, 2012. Changes in the carrying amount of the Company's goodwill and core deposit intangibles (“CDI”) for year ended December 31, 2012 and 2011, were as follows:
|
| | | | | | | | | | | |
| | Goodwill | Core Deposit |
| | Bank | | VPM | | Intangible - Bank |
| Balance as of December 31, 2010 | $ | — |
| | $ | 1,089 |
| | $ | — |
|
| Impairment | — |
| | (271 | ) | | — |
|
| Balance as of December 31, 2011 | — |
| | 818 |
| | — |
|
| Impairment | — |
| | (818 | ) | | — |
|
| Highlands acquisition | 29,650 |
| | — |
| | 1,745 |
|
| Amortization | — |
| | — |
| | (360 | ) |
| Balance as of December 31, 2012 | $ | 29,650 |
| | $ | — |
| | $ | 1,385 |
|
Management performs an evaluation annually, and more frequently if a triggering event occurs, of whether any impairment of the goodwill or other intangibles has occurred. If any such impairment is determined, a write-down is recorded. Due to the downturn in mortgage market conditions and the loss of key production personnel, an evaluation of goodwill was performed outside of the normal annual cycle in 2011. For purposes of performing Step One of the goodwill impairment test, the fair value was determined using the income approach by discounting the next five years projected cash flows. The assumptions in the model considered market economic and industry forecasts and management's judgment. Based on the estimated results in the Step Two analysis, a goodwill impairment of $271 was recognized during year ended December 31, 2011. As a result of the execution of an agreement to sell substantially all of the assets of VPM in the second quarter of 2012, VPM recognized an impairment charge of $818 that brought its goodwill balance to $0.
Goodwill is recorded on the acquisition date of each entity (Refer to Note 4 - Acquisition for more information regarding goodwill and intangibles generated from the Highlands acquisition). CDI are amortized on an accelerated basis over their estimated lives, which the Company believes is seven years. The estimated aggregate future amortization expense for intangible assets remaining as of December 31, 2012 is as follows:
|
| | | |
| 2013 | $ | 423 |
|
| 2014 | 346 |
|
| 2015 | 270 |
|
| 2016 | 193 |
|
| 2017 | 116 |
|
| Thereafter | 37 |
|
VIEWPOINT FINANCIAL GROUP, INC.
NOTES TO CONSOLIDATED FINANCIAL STATEMENTS
(Dollar amounts in thousands, except per share and share data)
NOTE 9 — DERIVATIVE FINANCIAL INSTRUMENTS
Prior to the sale of VPM in the third quarter of 2012, the Company entered into interest rate lock commitments (“IRLCs”) with prospective residential mortgage borrowers whereby the interest rate on the loan was determined prior to funding and the borrowers had locked into that interest rate. These commitments were carried at fair value in accordance with ASC 815, Derivatives and Hedging. The estimated fair values of IRLCs were based on quoted market values and were recorded in other assets in the consolidated balance sheets. The initial and subsequent changes in the fair value of IRLCs were a component of net gain on sale of loans.
The Company managed the risk profiles of its IRLCs and mortgage loans held for sale on a daily basis. To manage the price risk associated with IRLCs, the Company entered into forward sales of mortgage-backed securities in an amount similar to the portion of the IRLC expected to close, assuming no change in mortgage interest rates. In addition, to manage the interest rate risk associated with mortgage loans held for sale, the Company entered into forward sales of mortgage-backed securities to deliver mortgage loan inventory to investors. The estimated fair values of forward sales of mortgage-backed securities and forward sale commitments were based on quoted market values and were recorded as another asset or an accrued liability in the consolidated balance sheets.
The initial and subsequent changes in value on forward sales of mortgage-backed securities were a component of net gain on sale of loans.
There were no IRLC's outstanding at December 31, 2012. The following tables provide the outstanding notional balances and fair values of outstanding positions for the dates indicated during the twelve months ended December 31, 2011, and recorded gains (losses) during the twelve months ended December 31, 2012 and 2011.
|
| | | | |
| | Recorded | |
| December 31, 2012 | Gains (Losses) | |
| Other Assets | | |
| IRLCs | $ | (90 | ) | |
| Loan sale commitments | 1,077 |
| |
| Forward mortgage-backed securities trades | (795 | ) | |
|
| | | | | | | | | | | | | |
| | Expiration | | Outstanding Notional | | | | Recorded |
| December 31, 2011 | Dates | | Balance | | Fair Value | | Gains/(Losses) |
| Other Assets | | | �� | | | | |
| IRLCs | 2012 | | $ | 11,432 |
| | $ | 90 |
| | $ | 79 |
|
| Loan sale commitments | 2012 | | 1,590 |
| | 20 |
| | 1,503 |
|
| Forward mortgage-backed securities trades | 2012 | | 9,750 |
| | (74 | ) | | (1,428 | ) |
VIEWPOINT FINANCIAL GROUP, INC.
NOTES TO CONSOLIDATED FINANCIAL STATEMENTS
(Dollar amounts in thousands, except per share and share data)
NOTE 10 - LOAN SALES AND SERVICING
Loans held for sale activity was as follows:
|
| | | | | | | |
| | Years Ended December 31, |
| | 2012 | | 2011 |
| Balance at January 1 | $ | 834,352 |
| | $ | 491,985 |
|
| Loans originated for sale | 12,755,753 |
| | 7,872,727 |
|
| Proceeds from sale of loans held for sale | (12,534,821 | ) | | (7,537,999 | ) |
| Net gain on sale of loans held for sale | 5,436 |
| | 7,639 |
|
| Loans held for sale, net at December 31 | $ | 1,060,720 |
| | $ | 834,352 |
|
Mortgage loans serviced for others are not included in the Company's balance sheet, although there is a servicing asset associated with loans serviced for a third party. The principal balances of these loans at year-end are as follows:
|
| | | | | | | | | | | |
| | December 31, |
| | 2012 | | 2011 | | 2010 |
| Serviced loans | $ | 67,936 |
| | $ | 89,248 |
| | $ | 110,691 |
|
| Subserviced loans | 93,932 |
| | 127,004 |
| | 164,648 |
|
| Total mortgage loans serviced for others | $ | 161,868 |
| | $ | 216,252 |
| | $ | 275,339 |
|
Escrows on real estate loans totaled $27,235 and $23,596 at December 31, 2012 and 2011, respectively, and are reported in "Other Liabilities" on the consolidated balance sheets.
VIEWPOINT FINANCIAL GROUP, INC.
NOTES TO CONSOLIDATED FINANCIAL STATEMENTS
(Dollar amounts in thousands, except per share and share data)
NOTE 11 — PREMISES AND EQUIPMENT
Premises and equipment were as follows:
|
| | | | | | | |
| | December 31, |
| | 2012 | | 2011 |
| Land | $ | 17,076 |
| | $ | 17,076 |
|
| Buildings | 48,475 |
| | 45,359 |
|
| Furniture, fixtures and equipment | 26,557 |
| | 36,657 |
|
| Leasehold improvements | 4,634 |
| | 2,846 |
|
| | 96,742 |
| | 101,938 |
|
| Less: accumulated depreciation | (43,582 | ) | | (51,677 | ) |
| Total | $ | 53,160 |
| | $ | 50,261 |
|
Depreciation expense was $3,936, $3,515, and $3,571 for 2012, 2011, and 2010, respectively.
Operating Leases: The Company leases certain bank or loan production office properties and equipment under operating leases. Certain leases contain renewal options that may be exercised. Rent expense was $2,157, $1,468 and $1,531 for 2012, 2011 and 2010, respectively.
Rent commitments, before considering applicable renewal options, as of December 31, 2012, were as follows:
|
| | | |
| 2013 | $ | 2,374 |
|
| 2014 | 2,292 |
|
| 2015 | 2,267 |
|
| 2016 | 2,250 |
|
| 2017 | 1,093 |
|
| Thereafter | 5,921 |
|
| Total | $ | 16,197 |
|
At December 31, 2012, the Company had no commitments for future locations and held two parcels of land for future development.
VIEWPOINT FINANCIAL GROUP, INC.
NOTES TO CONSOLIDATED FINANCIAL STATEMENTS
(Dollar amounts in thousands, except per share and share data)
NOTE 12 - DEPOSITS
Time deposits of $100 or more were $337,242 and $400,578 at year‑end 2012 and 2011, respectively. On July 21, 2010, the Dodd-Frank Wall Street Reform and Consumer Protection Act permanently raised the standard maximum deposit insurance amount (SMDIA) to $250. The FDIC insurance coverage limit applies per depositor, per insured depository institution, for each account ownership category.
At December 31, 2012 and 2011, we had $88,513 and $92,268 in reciprocal deposits, respectively. This consisted entirely of certificates of deposit made under our participation in the Certificate of Deposit Account Registry Service® (CDARS®) and our Insured Cash Sweep (ICS) money market product. Through CDARS®, the Company can provide a depositor the ability to place up to $50,000 on deposit with the Company while receiving FDIC insurance on the entire deposit by placing customer funds in excess of the FDIC deposit limits with other financial institutions in the CDARS® network. In return, these financial institutions place customer funds with the Company on a reciprocal basis. Similarly, customer funds in our ICS money market product are swept from a transaction account at the Company into money market accounts at multiple banks to allow access to FDIC insurance coverage through multiple accounts. Regulators consider reciprocal deposits to be brokered deposits.
At December 31, 2012, scheduled maturities of time deposits for the next five years with the weighted average rate at the end of the period were as follows:
|
| | | | | | |
| | Balance | | Weighted Average Rate |
| 2013 | $ | 352,917 |
| | 1.15 | % |
| 2014 | 61,901 |
| | 1.60 |
|
| 2015 | 14,331 |
| | 1.43 |
|
| 2016 | 11,234 |
| | 2.09 |
|
| 2017 and thereafter | 9,951 |
| | 1.70 |
|
| Total | $ | 450,334 |
| | 1.25 | % |
At December 31, 2012 and 2011, the Company's deposits included public funds totaling $186,508 and $251,417 respectively. At December 31, 2012 and 2011, overdrawn deposits of $552 and $274 were reclassified as unsecured consumer loans.
Interest expense on deposits is summarized as follows:
|
| | | | | | | | | | | |
| | Years Ended December 31, |
| | 2012 | | 2011 | | 2010 |
| Interest bearing demand | $ | 3,391 |
| | $ | 8,309 |
| | $ | 8,976 |
|
| Savings and money market | 2,340 |
| | 3,466 |
| | 9,102 |
|
| Time | 5,722 |
| | 10,699 |
| | 12,937 |
|
| Total | $ | 11,453 |
| | $ | 22,474 |
| | $ | 31,015 |
|
VIEWPOINT FINANCIAL GROUP, INC.
NOTES TO CONSOLIDATED FINANCIAL STATEMENTS
(Dollar amounts in thousands, except per share and share data)
NOTE 13 - REPURCHASE AGREEMENT
In April 2008, the Company entered into a 10-year term structured repurchase callable agreement with Credit Suisse Securities (U.S.A.) LLC for $25,000 to leverage the balance sheet and increase liquidity. The interest rate was fixed at 1.62% for the first year of the agreement. The interest rate now adjusts quarterly to 6.25% less the 90 day LIBOR, subject to a lifetime cap of 3.22%. The rate was 3.22% at December 31, 2012. At maturity, the securities underlying the agreement are returned to the Company. The fair value of these securities sold under agreements to repurchase was $32,522 at December 31, 2012 and $33,836 at December 31, 2011. The Company retains the right to substitute securities under the terms of the agreements.
As part of the Highlands acquisition, the Company acquired $40,000 in repurchase agreements with JP Morgan Chase Bank, N.A. and a $10,000 repurchase agreement with CitiGroup Global Markets, Inc. The Company recognized a $95 gain on the unwinding of the JP Morgan Chase Bank, N.A. repurchase agreements in May 2012. The CitiGroup Global Markets, Inc. repurchase agreement matured in August 2012 and was not renewed.
Information concerning the securities sold under agreements to repurchase is summarized as follows:
|
| | | | | | | | | | | |
| | Years Ended December 31, |
| | 2012 | | 2011 | | 2010 |
| Average balance during the year | $ | 31,462 |
| | $ | 32,286 |
| | $ | 32,328 |
|
| Average interest rate during the year | 2.05 | % | | 1.69 | % | | 1.87 | % |
| Maximum month-end balance during the year | $ | 32,338 |
| | $ | 34,350 |
| | $ | 34,053 |
|
| Weighted average interest rate at year-end | 3.16 | % | | 1.50 | % | | 2.17 | % |
NOTE 14 — BORROWINGS
Federal Home Loan Bank ("FHLB") Advances
At December 31, 2012, advances from the FHLB totaled $892,208, net of a restructuring prepayment penalty of $3,193, and had interest rates ranging from 0.04% to 5.99% with a weighted average rate of 0.95%. At December 31, 2011, advances from the FHLB totaled $746,398, net of a restructuring penalty of $4,222, and had interest rates ranging from 0.04% to 5.99% with a weighted average rate of 1.21%. At December 31, 2012 and 2011, the Company had $0 and $20,000, respectively, in variable rate FHLB advances; the remainder of FHLB advances at those dates had fixed rates.
In November 2010, $91,644 in fixed-rate FHLB advances were modified. The 22 advances that were modified had a weighted average rate of 4.15% and an average term to maturity of approximately 2.6 years. These advances were prepaid and restructured with $91,644 of new, lower-cost FHLB advances with a weighted average rate of 1.79% and an average term to maturity of approximately 4.9 years. The early repayment of the debt resulted in a prepayment penalty of $5,421, which is being amortized to interest expense as an adjustment to the cost of the new FHLB advances. The effective rate of the new advances after accounting for the prepayment penalty is 2.98%. The prepayment penalty balance, net of accumulated amortization, was $3,193 at December 31, 2012.
Each advance is payable at its maturity date and is subject to prepayment penalties. The advances were collateralized by mortgage and commercial loans with FHLB collateral values of $1,272,330 and $721,135 under a blanket lien arrangement at December 31, 2012 and 2011, respectively. In addition, securities safekept at FHLB are used as collateral for advances. Based on this collateral, the Company was eligible to borrow an additional $682,984 and $515,948 at year-end 2012 and 2011, respectively.
FHLB stock also secures debts to the FHLB. The current agreement provided for a maximum borrowing amount of approximately $1,578,509 and $1,266,694 at December 31, 2012 and 2011, respectively.
VIEWPOINT FINANCIAL GROUP, INC.
NOTES TO CONSOLIDATED FINANCIAL STATEMENTS
(Dollar amounts in thousands, except per share and share data)
NOTE 14 - BORROWINGS (Continued)
At December 31, 2012 the advances were structured to contractually pay down as follows:
|
| | | | | |
| | Balance | | Weighted Average Rate |
| 2013 | $ | 701,134 |
| | 0.30% |
| 2014 | 36,516 |
| | 2.86 |
| 2015 | 61,742 |
| | 3.66 |
| 2016 | 62,300 |
| | 2.55 |
| 2017 | 15,546 |
| | 4.33 |
| Thereafter | 18,163 |
| | 4.82 |
| | 895,401 |
| | 0.95% |
| Restructuring prepayment penalty | (3,193 | ) | | |
| Total | $ | 892,208 |
| | |
Other Borrowings
At December 31, 2012 and December 31, 2011, the Company had borrowing availability representing the collateral value assigned to the securities pledged to the discount window through the Federal Reserve Bank of $105,807 and $33,681, respectively. Additionally, uncommitted, unsecured Fed Fund lines of credit totaling $140,000 and $76,000 were available at December 31, 2012 and December 31, 2011, respectively, from multiple correspondent banks.
In October 2009, the Company entered into four promissory notes for unsecured loans totaling $10,000 obtained from local private investors to increase funds available at the Company level. The lenders were all members of the same family and long-time customers of the Bank. One of the notes had an original principal amount of $7,000 and the other three notes had principal amounts of $1,000 each. Each of the four promissory notes initially bore interest at 6.00% per annum, thereafter adjusting quarterly to a rate equal to the national average 2-year jumbo CD rate plus 2.00%, with a floor of 6.00% and a ceiling of 9.00%. Interest-only payments under the notes were due quarterly. The unpaid principal balance and all accrued but unpaid interest under each of the notes were due and payable on October 15, 2014. These notes were repaid in full in October 2011.
NOTE 15 — BENEFITS
401(k) Plan: The Company offers a KSOP plan with a 401(k) match. Employees are eligible for the match if they have one year of service with 1000 hours worked and become eligible each quarter once they meet the eligibility requirements. Employees may participate on their own without meeting the service requirements; however, in this case, employees do not qualify for the match. Employees may contribute between 2% and 75% of their compensation subject to certain limitations. A matching contribution will be paid to eligible employees' accounts, which is equal to 100% of first 5% of the employee's contribution up to a maximum of 5% of the employee's qualifying compensation. Matching expense for 2012, 2011 and 2010 was $1,105, $846 and $860, respectively.
Deferred Compensation Plan: The Company has entered into certain non-qualified deferred compensation agreements with members of the executive management team, directors and certain employees. These agreements, which are subject to the rules of section 409(a) of the Internal Revenue Code, relate to the voluntary deferral of compensation received and do not have an employer contribution. The accrued liability as of December 31, 2012 and 2011 was $1,414 and $1,464, respectively.
The Company had an existing deferred compensation agreement with the former President and Chief Executive Officer of the Company that provides benefits payable based on specified terms of the agreement. The accrued liability as of December 31, 2012 and 2011 was approximately $451 and $1,301, respectively. $892 was paid in 2012 per the terms of the agreement, with the final payment due in 2013. The expense for this deferred compensation agreement was $41, $139 and $142 for the years ended December 31, 2012, 2011 and 2010, respectively. The deferred compensation per the agreement was based upon the performance of specified assets.
VIEWPOINT FINANCIAL GROUP, INC.
NOTES TO CONSOLIDATED FINANCIAL STATEMENTS
(Dollar amounts in thousands, except per share and share data)
NOTE 15 - BENEFITS (Continued)
Included in other assets is a universal life insurance policy as well as variable and fixed annuity contracts totaling $2,039 and $2,934 at December 31, 2012 and 2011, respectively. The Company is the owner and beneficiary of the policy. The policy pays interest on the funds invested. The life insurance is recorded at the net cash surrender value, or the amount that can be realized. Interest income on the investment is included in the statements of income.
Bank-Owned Life Insurance: In 2007, the Company purchased and provided those who agreed to be insured under a separate account bank-owned life insurance plan with a share of the death benefit while they remain actively employed with the Company. The benefit will equal 200% of each participating employee's base salary at the time of plan implementation and 200% of each participating director's annual base fees. Imputed taxable income will be based on the death benefit. In the event of death while actively employed with the Company, the deceased employee's or director's designated beneficiary will receive an income tax free death benefit paid directly from the insurance carrier.
In conjunction with the acquisition of Highlands in April 2012, the Company acquired an existing hybrid account bank-owned life insurance policy that provides certain executive officers who agreed to be insured under the plan with a share of the death benefit while they remain employed with the Company. The benefit is dependent upon the executive's most recent officer title and ranges from $75 to $150. No benefit will be paid if the executive reaches normal retirement age or, while disabled, obtains gainful employment with an entity other than the Company.
The total balance of the bank-owned life insurance policies, reported as an asset, at December 31, 2012 and 2011 totaled $34,916 and $29,007, and income for 2012, 2011 and 2010 totaled $699, $506 and $384, respectively.
Retirement Agreement: On December 31, 2011, President and Chief Executive Officer Garold Base retired from his positions as an officer and director of the Company. Mr. Base also entered into a Resignation, Consulting, Non-competition, Non-solicitation and Confidentiality Agreement (the “Agreement”) with the Company, effective December 31, 2011. Pursuant to the terms of the Agreement, Mr. Base resigned as a director of the Company and the Bank, provided 4 months of consulting services to the Company and the Bank, and forfeited his rights to 38,992 unvested shares of restricted stock previously granted to him. In exchange, Mr. Base received $7 per month for his consulting services and was paid a lump sum cash payment of $488 for the forfeiture of his restricted stock.
NOTE 16 — ESOP PLAN
In connection with the 2006 minority stock offering, the Company established an Employee Stock Ownership Plan (“ESOP”) for the benefit of its employees with an effective date of October 1, 2006. The ESOP purchased 928,395 shares of common stock with proceeds from a 10 year note in the amount of $9,284 from the Company. After the 2010 Conversion and stock offering, the unearned shares held by the ESOP were adjusted to reflect the 1.4:1 exchange ratio on publicly traded shares. Additionally, in connection with the 2010 Conversion and stock offering, the ESOP purchased 1,588,587 shares of common stock with proceeds from a 30 year note in the amount of $15,886 from the Company. The Company's Board of Directors determines the amount of contribution to the ESOP annually but is required to make contributions sufficient to service the ESOP's debt. Shares are released for allocation to employees as the ESOP debt is repaid. Eligible employees receive an allocation of released shares at the end of the calendar year on a relative compensation basis. Employees are eligible if they had one year of service with 1,000 hours worked and become eligible each quarter once they meet the eligibility requirements. The dividends paid on allocated shares are paid to employee accounts. Dividends on unallocated shares held by the ESOP are applied to the ESOP note payable. Contributions to the ESOP during 2012, 2011 and 2010 were $2,060, $2,060 and $1,629, respectively, and expense was $3,152, $2,340 and $1,624 for December 31, 2012, 2011 and 2010, respectively.
Shares held by the ESOP were as follows:
|
| | | | | | | |
| | 2012 | | 2011 |
| Allocated to participants | 970,301 |
| | 786,106 |
|
| Unearned | 1,918,039 |
| | 2,102,234 |
|
| Total ESOP shares | 2,888,340 |
| | 2,888,340 |
|
| Fair value of unearned shares at December 31 | $ | 40,164 |
| | $ | 27,350 |
|
VIEWPOINT FINANCIAL GROUP, INC.
NOTES TO CONSOLIDATED FINANCIAL STATEMENTS
(Dollar amounts in thousands, except per share and share data)
NOTE 17 - SHARE-BASED COMPENSATION
The Company has shareholder approved share-based compensation plans that are accounted for under ASC 718, Compensation - Stock Compensation, which requires companies to record compensation cost for share-based payment transactions with employees in return for employment service. Under the plans, 3,370,040 options to purchase shares of common stock and 1,348,016 restricted shares of common stock were made available. All share and per share information for periods prior to the Conversion has been adjusted to reflect the 1.4:1 exchange ratio on publicly traded shares. Shares issued in connection with stock compensation awards are issued from available authorized shares. Compensation cost charged to income for share-based compensation is presented below:
|
| | | | | | | | | | | |
| | Years ended December 31, |
| | 2012 | | 2011 | | 2010 |
| Restricted stock | $ | 1,512 |
| | $ | 1,102 |
| | $ | 1,483 |
|
| Stock options | 365 |
| | 449 |
| | 319 |
|
| | | | | | |
| Income tax benefit | 657 |
| | 543 |
| | 631 |
|
The restricted stock portion of the plans allows the Company to grant restricted stock to directors, advisory directors, officers and other employees. Compensation expense is recognized over the vesting period of the awards based on the fair value of the stock at issue date, which is determined using the last sale price as quoted on the NASDAQ Stock Market. Total restricted shares available for future issuance under the plans totaled 587,693 at year-end 2012 and 824,624 shares have been issued under the plans through December 31, 2012.
A combined summary of changes in the nonvested shares for the Company's stock plans for 2012, 2011 and 2010 follows:
|
| | | | | | | | | | | | | | | | | | | | |
| | 2012 | | 2011 | | 2010 |
| | Shares | | Weighted- Average Grant Date Fair Value | | Shares | | Weighted- Average Grant Date Fair Value | | Shares | | Weighted- Average Grant Date Fair Value |
| Non-vested at January 1 | 71,603 |
| | $ | 13.08 |
| | 218,393 |
| | $ | 13.14 |
| | 364,161 |
| | $ | 13.15 |
|
| Granted | 222,336 |
| | 17.56 |
| | — |
| | — |
| | — |
| | — |
|
| Vested | (108,643 | ) | | 14.54 |
| | (107,798 | ) | | 13.15 |
| | (120,459 | ) | | 13.16 |
|
| Forfeited | — |
| | — |
| | (38,992 | ) | | 13.19 |
| | (25,309 | ) | | 13.19 |
|
| Non-vested at December 31 | 185,296 |
| | $ | 17.60 |
| | 71,603 |
| | $ | 13.08 |
| | 218,393 |
| | $ | 13.14 |
|
As of December 31, 2012, there was $2,766 of total unrecognized compensation expense related to non-vested shares awarded under the restricted stock plans. That expense is expected to be recognized over a weighted-average period of 2.93 years. The total fair value of shares vested during the year ended December 31, 2012, was $1,580.
The stock option portion of the plans permits the grant of stock options to its directors, advisory directors, officers and other employees. Under the terms of the stock option plans, stock options may not be granted with an exercise price less than the fair market value of the Company’s common stock on the date the option is granted and may not be exercised later than ten years after the grant date. The fair market value is the last sale price as quoted on the NASDAQ Stock Market on the date of grant.
VIEWPOINT FINANCIAL GROUP, INC.
NOTES TO CONSOLIDATED FINANCIAL STATEMENTS
(Dollar amounts in thousands, except per share and share data)
NOTE 17 - SHARE-BASED COMPENSATION (Continued)
The fair value of each option award is estimated on the date of grant using a closed form option valuation (Black-Scholes) model that uses the assumptions noted in the table below. The risk-free interest rate is the implied yield available on U.S. Treasury zero-coupon issues with a remaining term equal to the expected term of the stock option in effect at the time of the grant. Although the contractual term of the stock options granted is ten years, the expected term of the stock is less because option restrictions do not permit recipients to sell or hedge their options, and therefore, we believe, encourage exercise of the option before the end of the contractual term. The expected term of stock options is based on employees' actual vesting behavior and expected volatilities are based on historical volatilities of the Company’s common stock. Expected dividends are the estimated dividend rate over the expected term of the stock options. For awards with performance-based vesting conditions, compensation cost is recognized when the achievement of the performance condition is considered probable of achievement. If a performance condition is subsequently determined to be improbable of achievement, compensation cost is reversed.
The weighted average fair value of stock options granted during 2012, 2011 and 2010 was $5.11, $4.30 and $4.09, respectively. The fair value of options granted was determined using the following weighted-average assumptions as of grant date:
|
| | | | | | | | |
| | 2012 | | 2011 | | 2010 |
| Risk-free interest rate | 1.25 | % | | 2.45 | % | | 2.60 | % |
| Expected term of stock options (years) | 6.6 |
| | 7.5 |
| | 7.5 |
|
| Expected stock price volatility | 34.43 | % | | 33.20 | % | | 35.80 | % |
| Expected dividends | 1.39 | % | | 1.42 | % | | 1.29 | % |
A summary of activity in the stock option portion of the plans for 2012, 2011 and 2010 was as follows:
|
| | | | | | | | | | | | |
| | | | Weighted- Average Exercise Price | | Weighted- Average Remaining Contractual Term | | Aggregate Intrinsic Value |
| Options | Shares | | | |
| Outstanding at January 1, 2010 | 366,376 |
| | $ | 12.25 |
| | 8.1 | | $ | 114 |
|
| Granted | 117,072 |
| | 11.08 |
| | 10 | | 71 |
|
| Exercised | — |
| | — |
| | 0 | | — |
|
| Forfeited | (25,893 | ) | | 11.30 |
| | 0 | | 15 |
|
| Outstanding at December 31, 2010 | 457,555 |
| | 12.01 |
| | 7.6 | | 170 |
|
| Granted | 108,500 |
| | 12.72 |
| | 10.0 | | 31 |
|
| Exercised | — |
| | — |
| | 0 | | — |
|
| Forfeited | (30,671 | ) | | 11.61 |
| | 0 | | 44 |
|
| Outstanding at December 31, 2011 | 535,384 |
| | 12.17 |
| | 7.1 | | 483 |
|
| Granted | 185,700 |
| | 16.61 |
| | 10.0 | | — |
|
| Exercised | (177,115 | ) | | 12.62 |
| | 0 | | 858 |
|
| Forfeited | (43,920 | ) | | 11.68 |
| | 0 | | — |
|
| Outstanding at December 31, 2012 | 500,049 |
| | $ | 13.70 |
| | 7.6 | | $ | 3,619 |
|
| Fully vested and expected to vest | 491,086 |
| | $ | 13.68 |
| | 7.6 | | $ | 3,568 |
|
| Exercisable at December 31, 2012 | 153,689 |
| | $ | 12.30 |
| | 5.6 | | $ | 1,328 |
|
VIEWPOINT FINANCIAL GROUP, INC.
NOTES TO CONSOLIDATED FINANCIAL STATEMENTS
(Dollar amounts in thousands, except per share and share data)
NOTE 17 - SHARE-BASED COMPENSATION (Continued)
No stock options were exercised in 2011 or 2010. As of December 31, 2012, there was $1,086 of total unrecognized compensation expense related to non-vested stock options. That expense is expected to be recognized over a weighted-average period of 3.07 years. At December 31, 2012, the Company applied an estimated forfeiture rate of 5% based on historical activity. The intrinsic value for stock options is calculated based on the difference between the exercise price of the underlying awards and the market price of our common stock as of the reporting date.
The Compensation Committee may grant stock appreciation rights, which give the recipient of the award the right to receive the excess of the market value of the shares represented by the stock appreciation rights on the date exercised over the exercise price. As of December 31, 2012, the Company has not granted any stock appreciation rights.
NOTE 18 — INCOME TAXES
The Company's pre-tax income is subject to federal income tax and state margin tax at a combined rate of 36% for 2012 , 2011 and 2010. Income tax expense for 2012, 2011 and 2010, was as follows:
|
| | | | | | | | | | | |
| | 2012 | | 2011 | | 2010 |
| Current expense (benefit) | $ | 14,047 |
| | $ | 11,384 |
| | $ | 9,426 |
|
| Deferred expense (benefit) | 5,262 |
| | 204 |
| | (794 | ) |
| Total income tax expense (benefit) | $ | 19,309 |
| | $ | 11,588 |
| | $ | 8,632 |
|
VIEWPOINT FINANCIAL GROUP, INC.
NOTES TO CONSOLIDATED FINANCIAL STATEMENTS
(Dollar amounts in thousands, except per share and share data)
NOTE 18 - INCOME TAXES (Continued)
At December 31, 2012 and 2011, deferred tax assets and liabilities were due to the following:
|
| | | | | | | |
| | December 31, |
| | 2012 | | 2011 |
| Deferred tax assets: | | | |
| Allowance for loan losses | $ | 6,330 |
| | $ | 6,134 |
|
| Other real estate owned | 20 |
| | 378 |
|
| Depreciation | 192 |
| | 14 |
|
| Deferred compensation arrangements | 705 |
| | 739 |
|
| Self-funded health insurance | 93 |
| | 70 |
|
| Non-accrual interest | 303 |
| | 237 |
|
| Restricted stock and stock options | 623 |
| | 614 |
|
| NOL carryforward from acquisition | 3,023 |
| | — |
|
| Intangible assets | 733 |
| | — |
|
| Fair value mark on purchased loans | 2,962 |
| | — |
|
| Other | 1,073 |
| | 505 |
|
| | 16,057 |
| | 8,691 |
|
| Deferred tax liabilities: | | | |
| Mortgage servicing assets | (94 | ) | | (147 | ) |
| Net unrealized gain on securities available for sale | (1,050 | ) | | (735 | ) |
| Partnership — Lone Star New Markets Fund | (809 | ) | | (744 | ) |
| Other | (78 | ) | | (109 | ) |
| | (2,031 | ) | | (1,735 | ) |
| Net deferred tax asset | $ | 14,026 |
| | $ | 6,956 |
|
The net deferred tax asset is recorded on the consolidated balance sheets under “other assets.” Management performed an analysis related to the Company's deferred tax asset for each of the years ended December 31, 2012 and 2011 and, based upon these analyses, no valuation allowance was deemed necessary as of December 31, 2012 or 2011.
Effective tax rates differ from the federal statutory rate of 35% in 2012, 2011 and 2010, applied to income before income taxes due to the following:
|
| | | | | | | | | | | |
| | At and for the Year Ended December 31, |
| | 2012 | | 2011 | | 2010 |
| Federal statutory rate times financial statement income | $ | 19,093 |
| | $ | 13,271 |
| | $ | 9,251 |
|
| Effect of: | | | | | |
| State taxes, net of federal benefit | 87 |
| | 56 |
| | 29 |
|
| New market tax credit | (192 | ) | | (192 | ) | | (119 | ) |
| Bank-owned life insurance income | (245 | ) | | (151 | ) | | (134 | ) |
| Municipal interest income | (662 | ) | | (740 | ) | | (535 | ) |
| Other | 1,228 |
| | (656 | ) | | 140 |
|
| Total income tax expense (benefit) | $ | 19,309 |
| | $ | 11,588 |
| | $ | 8,632 |
|
| Effective Tax Rate | 35.40 | % | | 30.56 | % | | 32.66 | % |
VIEWPOINT FINANCIAL GROUP, INC.
NOTES TO CONSOLIDATED FINANCIAL STATEMENTS
(Dollar amounts in thousands, except per share and share data)
NOTE 18 - INCOME TAXES (Continued)
The Company files income tax returns in the U.S. federal jurisdiction and several U.S. state jurisdictions. The Company is generally no longer subject to U.S. federal income tax examinations for tax years prior to 2010, with the exception of certain Highlands tax returns for older years in which tax losses were generated.
NOTE 19 — RELATED PARTY TRANSACTIONS
Loans to executive officers, directors, and their affiliates during 2012 were as follows:
|
| | | |
| Beginning balance | $ | 1,365 |
|
| New loans | — |
|
| Effect of changes in composition of related parties | (100 | ) |
| Repayments | (198 | ) |
| Ending balance | $ | 1,067 |
|
None of the above loans were considered non-performing or potential problem loans. These loans are made in the ordinary course of business and on substantially the same terms, including interest rates and collateral, as those prevailing at the time for comparable transactions with other unaffiliated persons and do not involve more than normal risk of collectability. Deposits from executive officers, directors, and their affiliates at year‑end 2012 and 2011 were $2,960 and $3,495, respectively.
VIEWPOINT FINANCIAL GROUP, INC.
NOTES TO CONSOLIDATED FINANCIAL STATEMENTS
(Dollar amounts in thousands, except per share and share data)
NOTE 20 — REGULATORY CAPITAL MATTERS
Banks and bank holding companies are subject to regulatory capital requirements administered by federal banking agencies. Capital adequacy guidelines and, additionally for banks, prompt corrective action regulations, involve quantitative measures of assets, liabilities, and certain off‑balance sheet items calculated under regulatory accounting practices. Capital amounts and classifications are also subject to qualitative judgments by regulators. Failure to meet capital requirements can initiate regulatory action.
Prompt corrective action regulations provide five classifications: well-capitalized, adequately capitalized, undercapitalized, significantly undercapitalized, and critically undercapitalized, although these terms are not used to represent overall financial condition. If an institution is adequately capitalized, regulatory approval is required to accept brokered deposits. If an institution is undercapitalized, capital distributions are limited, as is asset growth and expansion, and capital restoration plans are required. At year‑end 2012, the most recent regulatory notification categorized the Bank and the Company as well-capitalized under the regulatory framework for prompt corrective action. There are no conditions or events since that notification that management believes have changed the institution's category. Management believes that, at December 31, 2012, the Bank and the Company met all capital adequacy requirements to which it is subject.
Effective December 19, 2011, the Bank converted its charter from a federal thrift charter to a national banking association charter under 12 C.F.R. Part 5.24. Also effective December 19, 2011, the Company converted from a thrift holding company to a national bank holding company. Accordingly, regulatory capital levels and ratios are calculated according to Form FFIEC 041 instructions.
|
| | | | | | | | | | | | | | | | | | | | |
| | | | | | | | | | To Be Well-Capitalized |
| | | | | | Required for Capital | | Under Prompt Corrective |
| | Actual | | Adequacy Purposes | | Action Regulations |
| | Amount | | Ratio | | Amount | | Ratio | | Amount | | Ratio |
| As of December 31, 2012 | | | | | | | | | | | |
| Total risk-based capital | | | | | | | | | | | |
| the Company | $ | 505,566 |
| | 22.47 | % | | $ | 179,957 |
| | 8.00 | % | | $ | 224,947 |
| | 10.00 | % |
| the Bank | 404,562 |
| | 18.00 |
| | 179,847 |
| | 8.00 |
| | 224,809 |
| | 10.00 |
|
| Tier 1 risk-based capital | | | | | | | | | | | |
| the Company | 487,515 |
| | 21.67 |
| | 89,979 |
| | 4.00 |
| | 134,968 |
| | 6.00 |
|
| the Bank | 386,511 |
| | 17.19 |
| | 89,923 |
| | 4.00 |
| | 134,885 |
| | 6.00 |
|
| Tier 1 leverage | | | | | | | | | | | |
| the Company | 487,515 |
| | 13.97 |
| | 139,620 |
| | 4.00 |
| | 174,525 |
| | 5.00 |
|
| the Bank | 386,511 |
| | 11.08 |
| | 139,595 |
| | 4.00 |
| | 174,493 |
| | 5.00 |
|
| As of December 31, 2011 | | | | | | | | | | | |
| Total risk-based capital | | | | | | | | | | | |
| the Company | $ | 421,185 |
| | 25.46 | % | | $ | 132,336 |
| | 8.00 | % | | $ | 165,421 |
| | 10.00 | % |
| the Bank | 336,694 |
| | 20.36 |
| | 132,279 |
| | 8.00 |
| | 165,349 |
| | 10.00 |
|
| Tier 1 risk-based capital | | | | | | | | | | | |
| the Company | 403,698 |
| | 24.40 |
| | 66,168 |
| | 4.00 |
| | 99,252 |
| | 6.00 |
|
| the Bank | 319,207 |
| | 19.31 |
| | 66,140 |
| | 4.00 |
| | 99,209 |
| | 6.00 |
|
| Tier 1 leverage | | | | | | | | | | | |
| the Company | 403,698 |
| | 12.58 |
| | 128,398 |
| | 4.00 |
| | 160,498 |
| | 5.00 |
|
| the Bank | 319,207 |
| | 9.94 |
| | 128,517 |
| | 4.00 |
| | 160,647 |
| | 5.00 |
|
VIEWPOINT FINANCIAL GROUP, INC.
NOTES TO CONSOLIDATED FINANCIAL STATEMENTS
(Dollar amounts in thousands, except per share and share data)
NOTE 20 — REGULATORY CAPITAL MATTERS (Continued)
The following is a reconciliation of the Company and Bank’s equity under accounting principles generally accepted in the United States to regulatory capital (as defined by the OCC and FRB):
|
| | | | | | | | | | | | | | | |
| | December 31, 2012 | | December 31, 2011 |
| | Company | | Bank | | Company | | Bank |
| GAAP equity | $ | 520,871 |
| | $ | 419,867 |
| | $ | 406,189 |
| | $ | 321,698 |
|
| Deduction for nonfinancial equity investments | (516 | ) | | (516 | ) | | (328 | ) | | (328 | ) |
| Disallowed goodwill and intangible assets | (30,945 | ) | | (30,945 | ) | | (816 | ) | | (816 | ) |
| Unrealized loss (gain) on securities available for sale | (1,895 | ) | | (1,895 | ) | | (1,347 | ) | | (1,347 | ) |
| Tier 1 capital | 487,515 |
| | 386,511 |
| �� | 403,698 |
| | 319,207 |
|
| Allowance for loan losses | 18,051 |
| | 18,051 |
| | 17,487 |
| | 17,487 |
|
| Total capital | $ | 505,566 |
| | $ | 404,562 |
| | $ | 421,185 |
| | $ | 336,694 |
|
Dividend Restrictions and Information—Banking regulations limit the amount of dividends that may be paid by the Bank to the Company without prior approval of regulatory agencies. Historically, the Company has maintained adequate liquidity to pay dividends to its shareholders and anticipates the continued ability to do so for the foreseeable future without the need for receiving dividends from the Bank. The Bank may pay dividends to the Company within the limitations of the regulations. Under OCC regulations, limitations have been imposed upon all “capital distributions” by national banks, including cash dividend payments by an institution to its holding company for any purpose, payments to shareholders of another institution in a cash-out merger and other distributions charged against capital. As a subsidiary of a national holding company, the Bank may make a capital distribution with 30-days prior notice to the OCC, provided that the following criteria are met:
| |
| • | The Bank has a regulatory rating in the top two categories. |
| |
| • | The Bank is not of supervisory concern, and would remain well-capitalized or adequately-capitalized, as defined in the OCC prompt corrective action regulations, following the proposed distribution. |
| |
| • | The proposed distribution, combined with dividends already paid for the year, does not exceed its net income for the calendar year-to-date plus retained net income for the previous two years. |
Should the Bank not meet the above stated requirements, it must file an application with the OCC before making the distribution.
VIEWPOINT FINANCIAL GROUP, INC.
NOTES TO CONSOLIDATED FINANCIAL STATEMENTS
(Dollar amounts in thousands, except per share and share data)
NOTE 21 - LOAN COMMITTMENTS, CONTINGENT LIABILITIES AND OTHER RELATED ACTIVITIES
In the normal course of business, the Company enters into various transactions, which, in accordance with generally accepted accounting principles are not included in its consolidated balance sheets. The Company enters into these transactions to meet the financing needs of its customers. These transactions include commitments to extend credit and standby letters of credit, which involve, to varying degrees, elements of credit risk and interest rate risk. Credit losses up to the face amount of these instruments could result, although material losses are not anticipated. The same credit policies are used to make such commitments as are used for loans, including obtaining collateral at exercise of the commitment.
The Company enters into contractual commitments to extend credit, normally with fixed expiration dates or termination clauses, at specified rates and for specific purposes. Since many commitments expire without being drawn upon, the total contractual amount of commitments does not necessarily represent future cash requirements of the Company. Substantially all of the Company's commitments to extend credit are contingent upon customers maintaining specific credit standards at the time of loan funding. Standby letters of credit are written conditional commitments issued by the Company to guarantee the performance of a customer to a third party. In the event the customer does not perform in accordance with the terms of the agreement with the third party, the Company would be required to fund the commitment. The maximum potential amount of future payments the Company could be required to make is represented by the contractual amount of the commitment. If the commitment were funded, the Company would be entitled to seek recovery from the customer. The Company's policies generally require that standby letter of credit arrangements contain security and debt covenants similar to those contained in loan agreements.
The Company considers the fees collected in connection with the issuance of standby letters of credit to be representative of the fair value of its obligation undertaken in issuing the guarantee. In accordance with applicable accounting standards related to guarantees, the Company defers fees collected in connection with the issuance of standby letters of credit. The fees are then recognized in income proportionately over the life of the standby letter of credit agreement.
The contractual amounts of financial instruments with off‑balance sheet risk at year-end were as follows:
|
| | | | | | | |
| | At December 31, |
| | 2012 | | 2011 |
| Unused commitments to extend credit | $ | 219,284 |
| | $ | 202,558 |
|
| Unused commitment on Warehouse Purchase Program loans | 278,780 |
| | 234,066 |
|
| Standby letters of credit | 2,155 |
| | 811 |
|
| Total commitments to extend credit | $ | 500,219 |
| | $ | 437,435 |
|
In addition to the commitments above, the Company had overdraft protection available in the amounts of $79,416 and $71,509 for December 31, 2012 and 2011, respectively. As of December 31, 2012, the Company had sold $178,436 of loans into the secondary market that contain certain credit recourse provisions that range from four to ten months. The amount subject to recourse was approximately $16,111 as of year-end 2012. The risk of loss exists up to the total value of the outstanding loan balance although material losses are not anticipated.
In regards to unused commitments on Warehouse Purchase Program loans, the Company reserves the right, at any time, to refuse to buy any mortgage loans offered for sale by its mortgage banking company customers for any reason in the Company's sole and absolute discretion.
In December 2012, the Board of Directors of the Bank voted to approve a $2,000 investment in a community development-oriented private equity fund used for Community Reinvestment Act purposes. The investment is structured as a limited partnership.
VIEWPOINT FINANCIAL GROUP, INC.
NOTES TO CONSOLIDATED FINANCIAL STATEMENTS
(Dollar amounts in thousands, except per share and share data)
NOTE 21 - LOAN COMMITTMENTS, CONTINGENT LIABILITIES AND OTHER RELATED ACTIVITIES (Continued)
Liability for Mortgage Loan Repurchase Losses
Prior to VPM's sale in July 2012, the Company sold whole residential real estate loans to private investors, such as other banks and mortgage companies. The agreements under which the Company sold mortgage loans contained provisions that included various representations and warranties regarding the origination and characteristics of the mortgage loans. Although the specific representations and warranties varied among investor agreements, they typically covered ownership of the loan, compliance with loan criteria set forth in the applicable agreement, validity of the lien securing the loan, absence of delinquent taxes or liens against the property securing the loan, compliance with applicable origination laws, and other matters. The Company may be required to repurchase mortgage loans, indemnify the investor or insurer, or reimburse the investor or insurer for credit losses incurred on loans in the event of a breach of such contractual representations or warranties that is not remedied within the time period specified in the applicable agreement after we receive notice of the breach. Typically, it is a condition to repurchase or indemnify a loan that the breach must have had a material and adverse effect on the value of the mortgage loan or to the interests of the security holders in the mortgage loan. Agreements under which the Company sold mortgage loans required the delivery of various documents to the investor, and the Company may be obligated to repurchase or indemnify any mortgage loan as to which the required documents were not delivered or were defective. Upon receipt of a repurchase or indemnification request, the Company works with investors to arrive at a mutually agreeable resolution. These demands are typically reviewed on a loan by loan basis to validate the claims made by the investor and determine if a contractual event occurred. The Company managed the risk associated with potential repurchases or other forms of settlement through underwriting and quality assurance practices.
In the fourth quarter of 2010, the Company established a mortgage repurchase liability that reflects management's estimate of losses for loans for which the Company could have repurchase obligations based on historical investor repurchase and indemnification demands and historical loss ratios. Although investors may demand repurchase at any time, the Company's historical demands have occurred within 12 months of the investor purchase. The Company had no repurchases and two indemnifications in 2012. In 2011, there was one repurchase and five indemnifications. Actual losses were $22 and $118 during the years ended December 31, 2012 and 2011, respectively.
The liability, included in “Other Liabilities” in the consolidated balance sheet, was $114 at December 31, 2012. Additions to the liability reduced net gains on mortgage loan origination/sales. The mortgage repurchase liability of $114 at December 31, 2012, represents the Company's best estimate of the loss that may be incurred for various representations and warranties in the contractual provisions of sales of mortgage loans. There may be a range of reasonably possible losses in excess of the estimated liability that cannot be estimated with confidence. Because the level of mortgage loan repurchase losses are dependent on economic factors, investor demand strategies and other external conditions that may change over the life of the underlying loans, the level of the liability for mortgage loan repurchase losses is difficult to estimate and requires considerable management judgment.
VIEWPOINT FINANCIAL GROUP, INC.
NOTES TO CONSOLIDATED FINANCIAL STATEMENTS
(Dollar amounts in thousands, except per share and share data)
NOTE 22- SEGMENT INFORMATION
On June 5, 2012, the Bank and VPM, our former mortgage banking subsidiary, entered into a definitive agreement (the “Agreement”) with Highlands Residential Mortgage, Ltd. (“HRM”) to sell substantially all of the assets of VPM to HRM, subject to certain closing conditions. The terms of the Agreement provided for HRM to, subject to certain conditions contained in the Agreement, (i) purchase VPM's loan pipeline and all of VPM's existing construction loan portfolio, together with certain furniture, fixtures and equipment, (ii) assume substantially all of VPM's loan production office leases and its equipment leases, (iii) hire no less than 95% of the current VPM employees and satisfactorily release VPM from certain employment contracts, and (iv) make additional earn out payments to VPM. Following completion of the sale, the Agreement provided an opportunity for the Bank to partner with HRM to continue providing the Bank's customers with residential mortgage services.
The transaction closed in the third quarter of 2012. As a result of the execution of the Agreement, in the second quarter of 2012, VPM recognized $1,190 in one-time write-offs and expenses relating to the sale, including $818 of goodwill that was impaired to $0 and $250 in fixed asset losses.
The reportable segments are determined by the products and services offered, primarily distinguished between banking and VPM, our former mortgage banking subsidiary. Loans, investments and deposits generate the revenues in the banking segment; secondary marketing sales generated the revenue in the VPM segment. Segment performance is evaluated using segment profit (loss). Information reported internally for performance assessment for years ended December 31, 2012, 2011 and 2010 was as follows:
|
| | | | | | | | | | | | | | | |
| | Year Ended December 31, 2012 |
| | Banking | | VPM | | Eliminations and Adjustments1 | | Total Segments (Consolidated Total) |
| Results of Operations: | | | | | | | |
| Total interest income | $ | 137,974 |
| | $ | 994 |
| | $ | (976 | ) | | $ | 137,992 |
|
| Total interest expense | 22,906 |
| | 975 |
| | (1,712 | ) | | 22,169 |
|
| Provision for loan losses | 3,212 |
| | (73 | ) | | — |
| | 3,139 |
|
| Net interest income after provision for loan losses | 111,856 |
| | 92 |
| | 736 |
| | 112,684 |
|
| Other revenue | 24,769 |
| | (1,040 | ) | | 391 |
| | 24,120 |
|
| Net gain (loss) on sale of loans | (1,578 | ) | | 7,014 |
| | — |
| | 5,436 |
|
| Total non-interest expense | 78,673 |
| | 6,687 |
| | 2,330 |
| | 87,690 |
|
| Income before income tax expense (benefit) | 56,374 |
| | (621 | ) | | (1,203 | ) | | 54,550 |
|
| Income tax expense (benefit) | 19,973 |
| | (204 | ) | | (460 | ) | | 19,309 |
|
| Net income (loss) | $ | 36,401 |
| | $ | (417 | ) | | $ | (743 | ) | | $ | 35,241 |
|
| Segment assets | $ | 3,661,677 |
| | $ | — |
| | $ | 1,381 |
| | $ | 3,663,058 |
|
| Noncash items: | | | | | | | |
| Net gain (loss) on sale of loans | (1,578 | ) | | 7,014 |
| | — |
| | 5,436 |
|
| Depreciation | 3,783 |
| | 153 |
| | — |
| | 3,936 |
|
| Provision for loan losses | 3,212 |
| | (73 | ) | | — |
| | 3,139 |
|
VIEWPOINT FINANCIAL GROUP, INC.
NOTES TO CONSOLIDATED FINANCIAL STATEMENTS
(Dollar amounts in thousands, except per share and share data)
NOTE 22- SEGMENT INFORMATION (Continued)
|
| | | | | | | | | | | | | | | |
| | Year Ended December 31, 2011 |
| | Banking | | VPM | | Eliminations and Adjustments1 | | Total Segments (Consolidated Total) |
| Results of Operations: | | | | | | | |
| Total interest income | $ | 116,032 |
| | $ | 1,698 |
| | $ | (1,506 | ) | | $ | 116,224 |
|
| Total interest expense | 33,992 |
| | 1,506 |
| | (1,852 | ) | | 33,646 |
|
| Provision for loan losses | 3,962 |
| | 8 |
| | — |
| | 3,970 |
|
| Net interest income after provision for loan losses | 78,078 |
| | 184 |
| | 346 |
| | 78,608 |
|
| Other revenue | 25,394 |
| | (306 | ) | | 1,821 |
| | 26,909 |
|
| Net gain (loss) on sale of loans | (2,158 | ) | | 9,797 |
| | — |
| | 7,639 |
|
| Total non-interest expense | 61,231 |
| | 12,464 |
| | 1,545 |
| | 75,240 |
|
| Income before income tax expense (benefit) | 40,083 |
| | (2,789 | ) | | 622 |
| | 37,916 |
|
| Income tax expense (benefit) | 12,905 |
| | (916 | ) | | (401 | ) | | 11,588 |
|
| Net income (loss) | $ | 27,178 |
| | $ | (1,873 | ) | | $ | 1,023 |
| | $ | 26,328 |
|
| Segment assets | $ | 3,180,291 |
| | $ | 52,568 |
| | $ | (52,281 | ) | | $ | 3,180,578 |
|
| Noncash items: | | | | | | | |
| Net gain (loss) on sale of loans | (2,158 | ) | | 9,797 |
| | — |
| | 7,639 |
|
| Depreciation | 3,223 |
| | 292 |
| | — |
| | 3,515 |
|
| Provision for loan losses | 3,962 |
| | 8 |
| | — |
| | 3,970 |
|
|
| | | | | | | | | | | | | | | |
| | Year Ended December 31, 2010 |
| | Banking | | VPM | | Eliminations and Adjustments1 | | Total Segments (Consolidated Total) |
| Results of Operations: | | | | | | | |
| Total interest income | $ | 115,069 |
| | $ | 2,277 |
| | $ | (1,961 | ) | | $ | 115,385 |
|
| Total interest expense | 44,156 |
| | 1,961 |
| | (1,964 | ) | | 44,153 |
|
| Provision for loan losses | 5,054 |
| | 65 |
| | — |
| | 5,119 |
|
| Net interest income after provision for loan losses | 65,859 |
| | 251 |
| | 3 |
| | 66,113 |
|
| Other revenue | 20,796 |
| | (38 | ) | | (335 | ) | | 20,423 |
|
| Net gain (loss) on sale of loans | (2,061 | ) | | 15,102 |
| | — |
| | 13,041 |
|
| Total non-interest expense | 57,430 |
| | 14,990 |
| | 726 |
| | 73,146 |
|
| Income before income tax expense (benefit) | 27,164 |
| | 325 |
| | (1,058 | ) | | 26,431 |
|
| Income tax expense (benefit) | 8,752 |
| | 70 |
| | (190 | ) | | 8,632 |
|
| Net income | $ | 18,412 |
| | $ | 255 |
| | $ | (868 | ) | | $ | 17,799 |
|
| Segment assets | $ | 2,943,794 |
| | $ | 51,382 |
| | $ | (53,181 | ) | | $ | 2,941,995 |
|
| Noncash items: | | | | | | | |
| Net gain (loss) on sale of loans | (2,061 | ) | | 15,102 |
| | — |
| | 13,041 |
|
| Depreciation | 3,272 |
| | 299 |
| | — |
| | 3,571 |
|
| Provision for loan losses | 5,054 |
| | 65 |
| | — |
| | 5,119 |
|
1 Includes eliminating entries for intercompany transactions and stand-alone expenses of the Company.
VIEWPOINT FINANCIAL GROUP, INC.
NOTES TO CONSOLIDATED FINANCIAL STATEMENTS
(Dollar amounts in thousands, except per share and share data)
NOTE 23 - PARENT COMPANY ONLY CONDENSED FINANCIAL INFORMATION
Condensed financial information of ViewPoint Financial Group, Inc. follows:
CONDENSED BALANCE SHEETS
December 31,
|
| | | | | | | |
| | 2012 | | 2011 |
| ASSETS | | | |
| Cash on deposit at subsidiary | $ | 47,559 |
| | $ | 62,158 |
|
| Investment in banking subsidiary | 419,867 |
| | 321,818 |
|
| Receivable from banking subsidiary | 33,174 |
| | 1,754 |
|
| ESOP note receivable and other assets | 20,271 |
| | 20,904 |
|
| Total assets | $ | 520,871 |
| | $ | 406,634 |
|
| LIABILITIES AND SHAREHOLDERS’ EQUITY | | | |
| Other liabilities | $ | — |
| | $ | 325 |
|
| Shareholders’ equity | 520,871 |
| | 406,309 |
|
| Total liabilities and shareholders’ equity | $ | 520,871 |
| | $ | 406,634 |
|
CONDENSED STATEMENTS OF INCOME
December 31, |
| | | | | | | | | | | |
| | 2012 | | 2011 | | 2010 |
| Interest income on ESOP loan | $ | 762 |
| | $ | 819 |
| | $ | 602 |
|
| Interest expense | 27 |
| | 473 |
| | 600 |
|
| Operating expenses | 2,355 |
| | 1,595 |
| | 806 |
|
| Loss before income tax benefit and equity in undistributed earnings of subsidiary | (1,620 | ) | | (1,249 | ) | | (804 | ) |
| Income tax benefit | (460 | ) | | (401 | ) | | (190 | ) |
| Equity in undistributed earnings of subsidiary | 36,401 |
| | 27,176 |
| | 18,413 |
|
| Net income | $ | 35,241 |
| | $ | 26,328 |
| | $ | 17,799 |
|
VIEWPOINT FINANCIAL GROUP, INC.
NOTES TO CONSOLIDATED FINANCIAL STATEMENTS
(Dollar amounts in thousands, except per share and share data)
NOTE 23 - PARENT COMPANY ONLY CONDENSED FINANCIAL INFORMATION (Continued)
CONDENSED STATEMENTS OF CASH FLOWS
December 31,
|
| | | | | | | | | | | |
| | 2012 | | 2011 | | 2010 |
| Cash flows from operating activities | | | | | |
| Net income | $ | 35,241 |
| | $ | 26,328 |
| | $ | 17,799 |
|
| Adjustments to reconcile net income to net cash from operating activities: | | | | | |
| Equity in undistributed earnings of subsidiary | (36,401 | ) | | (27,176 | ) | | (18,413 | ) |
| Vesting of restricted stock | 1,805 |
| | 1,327 |
| | 1,455 |
|
| Net change in intercompany receivable | (31,946 | ) | | — |
| | 5,000 |
|
| Net change in other assets | (665 | ) | | (402 | ) | | (79 | ) |
| Net change in other liabilities | (325 | ) | | 200 |
| | (2 | ) |
| Net cash from operating activities | (32,291 | ) | | 277 |
| | 5,760 |
|
| Cash flows from investing activities | | | | | |
| Contribution of 50% of proceeds of stock offering to subsidiary | — |
| | — |
| | (95,400 | ) |
| Fund ESOP note receivable from Conversion and stock offering | — |
| | — |
| | (15,886 | ) |
| Capital contribution to subsidiary | 29,007 |
| | — |
| | — |
|
| Cash and cash equivalents acquired from acquisition | 599 |
| | — |
| | — |
|
| Payments received on ESOP notes receivable | 1,298 |
| | 1,241 |
| | 1,026 |
|
| Net cash from investing activities | 30,904 |
| | 1,241 |
| | (110,260 | ) |
| Cash flows from financing activities | | | | | |
| Share repurchase | — |
| | (13,012 | ) | | — |
|
| Proceeds (repayments) from borrowing | — |
| | (10,000 | ) | | — |
|
| Net proceeds from stock offering | — |
| | — |
| | 190,801 |
|
| Merger of ViewPoint MHC pursuant to reorganization | — |
| | — |
| | 207 |
|
| Treasury stock purchased | — |
| | — |
| | (407 | ) |
| Net issuance of common stock under employee stock plans | 2,236 |
| | — |
| | — |
|
| Payment of dividends | (15,448 | ) | | (6,918 | ) | | (3,862 | ) |
| Net cash from financing activities | (13,212 | ) | | (29,930 | ) | | 186,739 |
|
| Net change in cash and cash equivalents | (14,599 | ) | | (28,412 | ) | | 82,239 |
|
| Beginning cash and cash equivalents | 62,158 |
| | 90,570 |
| | 8,331 |
|
| Ending cash and cash equivalents | $ | 47,559 |
| | $ | 62,158 |
| | $ | 90,570 |
|
VIEWPOINT FINANCIAL GROUP, INC.
NOTES TO CONSOLIDATED FINANCIAL STATEMENTS
(Dollar amounts in thousands, except per share and share data)
NOTE 24 — QUARTERLY FINANCIAL DATA (Unaudited)
|
| | | | | | | | | | | | | | | | | | | | | | | | | |
| | | | | | Net Interest Income | | Provision (Credit)
for Loan Losses | | | | Earnings per Share |
| | Interest Income | | Interest Expense | | | | Net Income¹ | | Basic | | Diluted |
| 2012 | | | | | | | | | | | | | |
| First quarter | $ | 29,376 |
| | $ | 5,886 |
| | $ | 23,490 |
| | $ | 895 |
| | $ | 7,072 |
| | 0.22 |
| | 0.22 |
|
| Second quarter | 35,127 |
| | 5,941 |
| | 29,186 |
| | 1,447 |
| | 6,492 |
| | 0.17 |
| | 0.17 |
|
| Third quarter | 37,008 |
| | 5,389 |
| | 31,619 |
| | 814 |
| | 11,316 |
| | 0.30 |
| | 0.30 |
|
| Fourth quarter | 36,481 |
| | 4,953 |
| | 31,528 |
| | (17 | ) | | 10,361 |
| | 0.28 |
| | 0.27 |
|
| 2011 | | | | | | | | | | | | | |
| First quarter | $ | 27,895 |
| | $ | 8,918 |
| | $ | 18,977 |
| | $ | 1,095 |
| | $ | 6,554 |
| | 0.20 |
| | 0.20 |
|
| Second quarter | 27,986 |
| | 9,021 |
| | 18,965 |
| | 1,065 |
| | 4,857 |
| | 0.15 |
| | 0.15 |
|
| Third quarter | 29,006 |
| | 8,527 |
| | 20,479 |
| | 581 |
| | 5,143 |
| | 0.16 |
| | 0.16 |
|
| Fourth quarter | 31,337 |
| | 7,180 |
| | 24,157 |
| | 1,229 |
| | 9,774 |
| | 0.31 |
| | 0.31 |
|
¹Net income includes net gains on securities available for sale of $898 and $116 during the third and second quarters of 2012, respectively, and $818 of impairment of goodwill during the second quarter of 2012. Net income includes net gains on securities available for sale of $2,853 and $3,415 during the fourth and first quarters of 2011, respectively, and $271 of impairment of goodwill during the second quarter of 2011.
NOTE 25 — SUBSEQUENT EVENTS
The Company evaluated events from the date of the consolidated financial statements on December 31, 2012 through the issuance of those consolidated financial statements included in this Annual Report on Form 10-K dated February 20, 2013. No additional events were identified requiring recognition in and/or disclosures in the consolidated financial statements.
|
| |
| Item 9. | Changes in and Disagreements with Accountants on Accounting and Financial Disclosure |
None.
|
| |
| Item 9A. | Controls and Procedures |
| |
| (a) | Evaluation of Disclosure Controls and Procedures: An evaluation of our disclosure controls and procedures (as defined in Rule 13a-15(e) under the Securities Exchange Act of 1934 (the “Act”)) as of December 31, 2012, was carried out under the supervision and with the participation of our Chief Executive Officer, Chief Financial Officer and several other members of our senior management. Our Chief Executive Officer and Chief Financial Officer concluded that, as of December 31, 2012, our disclosure controls and procedures were effective in ensuring that the information we are required to disclose in the reports we file or submit under the Act is (i) accumulated and communicated to our management (including the Chief Executive Officer and Chief Financial Officer) in a timely manner, and (ii) recorded, processed, summarized and reported within the time periods specified in the SEC’s rules and forms. |
| |
| (b) | Management’s Report on Internal Control Over Financial Reporting: Management of the Company is responsible for establishing and maintaining an effective system of internal control over financial reporting. The Company’s system of internal control over financial reporting is designed to provide reasonable assurance regarding the reliability of financial reporting and the preparation of financial statements for external purposes in accordance with generally accepted accounting principles. There are inherent limitations in the effectiveness of any system of internal control over financial reporting, including the possibility of human error and circumvention or overriding of controls. Accordingly, even an effective system of internal control over financial reporting can provide only reasonable assurance with respect to financial statement preparation. Projections of any evaluation of effectiveness to future periods are subject to the risks that controls may become inadequate because of changes in conditions or that the degree of compliance with the policies or procedures may deteriorate. |
Management assessed the Company’s systems of internal control over financial reporting as of December 31, 2012. This assessment was based on criteria for effective internal control over financial reporting described in Internal Control — Integrated Framework issued by the Committee of Sponsoring Organizations of the Treadway Commission. Based on this assessment, management believes that, as of December 31, 2012, the Company maintained effective internal control over financial reporting based on those criteria. The Company’s independent registered public accounting firm that audited the financial statements included in this annual report on Form 10-K has issued an attestation report on the Company’s internal control over financial reporting. The attestation report of Ernst & Young LLP appears below.
Report of Independent Registered Public Accounting Firm
The Board of Directors and Shareholders of
ViewPoint Financial Group, Inc.
We have audited ViewPoint Financial Group, Inc.'s internal control over financial reporting as of December 31, 2012, based on criteria established in Internal Control-Integrated Framework issued by the Committee of Sponsoring Organizations of the Treadway Commission (the COSO criteria). ViewPoint Financial Group, Inc.'s management is responsible for maintaining effective internal control over financial reporting, and for its assessment of the effectiveness of internal control over financial reporting included in the accompanying Management's Report on Internal Control Over Financial Reporting. Our responsibility is to express an opinion on the company's internal control over financial reporting based on our audit.
We conducted our audit in accordance with the standards of the Public Company Accounting Oversight Board (United States). Those standards require that we plan and perform the audit to obtain reasonable assurance about whether effective internal control over financial reporting was maintained in all material respects. Our audit included obtaining an understanding of internal control over financial reporting, assessing the risk that a material weakness exists, testing and evaluating the design and operating effectiveness of internal control based on the assessed risk, and performing such other procedures as we considered necessary in the circumstances. We believe that our audit provides a reasonable basis for our opinion.
A company's internal control over financial reporting is a process designed to provide reasonable assurance regarding the reliability of financial reporting and the preparation of financial statements for external purposes in accordance with generally accepted accounting principles. A company's internal control over financial reporting includes those policies and procedures that (1) pertain to the maintenance of records that, in reasonable detail, accurately and fairly reflect the transactions and dispositions of the assets of the company; (2) provide reasonable assurance that transactions are recorded as necessary to permit preparation of financial statements in accordance with generally accepted accounting principles, and that receipts and expenditures of the company are being made only in accordance with authorizations of management and directors of the company; and (3) provide reasonable
assurance regarding prevention or timely detection of unauthorized acquisition, use, or disposition of the company's assets that could have a material effect on the financial statements.
Because of its inherent limitations, internal control over financial reporting may not prevent or detect misstatements. Also, projections of any evaluation of effectiveness to future periods are subject to the risk that controls may become inadequate because of changes in conditions, or that the degree of compliance with the policies or procedures may deteriorate.
In our opinion, ViewPoint Financial Group, Inc. maintained, in all material respects, effective internal control over financial reporting as of December 31, 2012, based on the COSO criteria.
We also have audited, in accordance with the standards of the Public Company Accounting Oversight Board (United States), the consolidated balance sheets as of December 31, 2012 and 2011, and the related consolidated statements of income and comprehensive income, changes in shareholders' equity, and cash flows for each of the three years in the period ended December 31, 2012 of ViewPoint Financial Group, Inc. and our report dated February 20, 2013 expressed an unqualified opinion thereon.
/s/ Ernst & Young
Dallas, Texas
February 20, 2013
| |
| (c) | Changes in Internal Control Over Financial Reporting: During the quarter ended December 31, 2012, no change occurred in our internal control over financial reporting that has materially affected, or is reasonably likely to materially affect, our internal control over financial reporting. |
|
| | |
| | | |
| Item 9B. | | Other Information |
Not applicable.
PART III
|
| |
| Item 10. | Directors, Executive Officers and Corporate Governance |
Directors and Executive Officers. The information concerning our directors required by this item is incorporated herein by reference from our definitive proxy statement for our Annual Meeting of Shareholders being held on May 16, 2013, a copy of which will be filed with the Securities and Exchange Commission not later than 120 days after the end of our fiscal year. Information required by this item regarding the audit committee of the Company’s Board of Directors, including information regarding the audit committee financial expert serving on the audit committee, is incorporated herein by reference from our definitive proxy statement for our Annual Meeting of Shareholders being held on May 16, 2013, a copy of which will be filed with the Securities and Exchange Commission not later than 120 days after the end of our fiscal year. Information about our executive officers is contained under the caption “Executive Officers” in Part I of this Form 10-K, and is incorporated herein by this reference.
Section 16(a) Beneficial Ownership Reporting Compliance. The information concerning compliance with the reporting requirements of Section 16(a) of the Securities Exchange Act of 1934 by our directors, officers and ten percent shareholders required by this item is incorporated herein by reference from our definitive proxy statement for our Annual Meeting of Shareholders being held on May 16, 2013, a copy of which will be filed with the Securities and Exchange Commission not later than 120 days after the end of our fiscal year.
Code of Ethics. We have adopted a code of ethics that applies to our principal executive officer, principal financial officer, principal accounting officer, and persons performing similar functions, and to all of our other employees and our directors. A copy of our code of ethics is available on our Internet website address, www.viewpointfinancialgroup.com.
Nominating Committee Procedures. There have been no material changes to the procedures by which shareholders may recommend nominees to our Board of Directors since last described to shareholders.
|
| |
| Item 11. | Executive Compensation |
The information concerning compensation required by this item is incorporated herein by reference from our definitive proxy statement for our Annual Meeting of Shareholders being held on May 16, 2013, a copy of which will be filed with the Securities and Exchange Commission not later than 120 days after the end of our fiscal year.
|
| |
| Item 12. | Security Ownership of Certain Beneficial Owners and Management and Related Shareholder Matters |
The information concerning security ownership of certain beneficial owners and management and our equity incentive plan required by this item is incorporated herein by reference from our definitive proxy statement for our Annual Meeting of Shareholders being held on May 16, 2013, a copy of which will be filed with the Securities and Exchange Commission not later than 120 days after the end of our fiscal year. Information regarding our equity compensation plans is included in Item 5 of this Form 10-K.
|
| |
| Item 13. | Certain Relationships and Related Transactions, and Director Independence |
The information concerning certain relationships and related transactions and director independence required by this item is incorporated herein by reference from our definitive proxy statement for our Annual Meeting of Shareholders being held on May 16, 2013, a copy of which will be filed with the Securities and Exchange Commission not later than 120 days after the end of our fiscal year.
|
| |
| Item 14. | Principal Accountant Fees and Services |
The information concerning principal accountant fees and services is incorporated herein by reference from our definitive proxy statement for our Annual Meeting of Shareholders being held in May 16, 2013, a copy of which will be filed not later than 120 days after the end of our fiscal year.
PART IV
|
| |
| Item 15. | Exhibits, Financial Statement Schedules |
|
| |
| (a)(1) | Financial Statements: See Part II—Item 8. Financial Statements and Supplementary Data. |
| | |
| (a)(2) | Financial Statement Schedules: All financial statement schedules have been omitted as the information is included in the notes to the consolidated financial statements or is not required under the related instructions or is not applicable. |
| | |
| (a)(3) | Exhibits: See below. |
| | |
| (b) | Exhibits: |
|
| | | |
| Exhibit | | |
| Number | | Description |
| |
| | |
| 2.1 |
| | Agreement and Plan of Merger by and between the Registrant and Highlands Bancshares, Inc. (incorporated herein by reference to Exhibit 2.1 of the Registrant’s Current Report on Form 8-K filed with the SEC on December 9, 2011 (File No. 001-34737)) |
| |
| | |
| 3.1 |
| | Charter of the Registrant (incorporated herein by reference to Exhibit 3.1 to the Registrant’s Registration Statement on Form S-1, as amended (File No. 333-165509)) |
| |
| | |
| 3.2 |
| | Bylaws of the Registrant (incorporated herein by reference to Exhibit 3.2 to the Registrant’s Registration Statement on Form S-1 (File No. 333-165509)) |
| |
| | |
| 4.0 |
| | Certificate of Registrant’s Common Stock (incorporated herein by reference to Exhibit 4.0 to the Registrant’s Registration Statement on Form S-1, as amended (File No. 333-165509)) |
| |
| | |
| 10.1 |
| | Form of Severance Agreement between ViewPoint Bank and the following executive officers: Pathie E. McKee and Mark L. Williamson (incorporated herein by reference to Exhibit 10.1 to the Registrant’s Current Report on Form 8-K filed with the SEC on February 17, 2011 (File No. 001-34737)) |
| |
| | |
| 10.2 |
| | Summary of Director Board Fee Arrangements (incorporated herein by reference to Exhibit 3.2 to the Registrant’s Quarterly Report on Form 10-Q filed with the SEC on August 9, 2007 (File No. 001-32992)) |
| |
| | |
| 10.3 |
| | ViewPoint Bank Deferred Compensation Plan (incorporated herein by reference to Exhibit 10.7 to the Registrant’s Registration Statement on Form S-1, as amended (File No. 0-24566-01)) |
| |
| | |
| 10.4 |
| | Amended and Restated ViewPoint Bank Supplemental Executive Retirement Plan (incorporated herein by reference to Exhibit 10.8 to the Registrant’s Registration Statement on Form S-1, as amended (File No. 0-24566-01)) |
| |
| | |
| 10.5 |
| | Executive Officer Incentive Plan (incorporated herein by reference to Exhibit 10.1 to the Registrant’s Current Report on Form 8-K filed with the SEC on January 26, 2011 (File No. 001-34737)) |
| |
| | |
| 10.6 |
| | Resignation, Consulting, Noncompetition, Non-solicitation and Confidentiality Agreement and Release between the Registrant and Garold R. Base (incorporated herein by reference to Exhibit 10.11 to the Registrant's Annual Report on Form 10-K filed with the SEC on February 28, 2012 (File No. 001-34737) |
|
| | | |
| Exhibit | | |
| Number | | Description |
| |
| | |
| 10.7 |
| | Employment Agreement between the Registrant and ViewPoint Bank, N.A. and Kevin Hanigan (incorporated herein by reference to Exhibit 10.1 to the Registrant’s Registration Statement on Form S-4 filed with the SEC on January 17, 2012 (File No. 333-179037)) |
| |
| | |
| 10.8 |
| | Form of General Release between the Registrant and Mark E. Hord (incorporated herein by reference to Exhibit 10.1 to the Registrant's Current Report on Form 8-K filed with the SEC on July 5, 2012 (File No. 001-34737) |
| |
| | |
| 10.9 |
| | Form of General Release between the Registrant and James C. Parks (incorporated herein by reference to Exhibit 10.1 to the Registrant's Current Report on Form 8-K filed with the SEC on August 10, 2012 (File No. 001-34737) |
| |
| | |
| 10.10 |
| | Form of Severance Agreement between ViewPoint Bank and the following executive officers: Scott A. Almy, Charles D. Eikenberg and Thomas S. Swiley (incorporated herein by reference to Exhibit 10.1 to the Registrant’s Current Report on Form 8-K filed with the SEC on November 1, 2012 (File No. 001-34737)) |
| |
| | |
| 10.11 |
| | Form of Director's Agreement |
| | | |
| 11 |
| | Statement regarding computation of per share earnings (See Note 3 of the Notes to Consolidated Financial Statements included in this Form 10-K). |
| |
| | |
| 21 |
| | Subsidiaries of the Registrant |
| |
| | |
| 23 |
| | Consent of Independent Registered Public Accounting Firm |
| |
| | |
| 24 |
| | Power of Attorney (on signature page) |
| |
| | |
| 31.1 |
| | Rule 13a — 14(a)/15d — 14(a) Certification (Chief Executive Officer) |
| |
| | |
| 31.2 |
| | Rule 13a — 14(a)/15d — 14(a) Certification (Chief Financial Officer) |
| |
| | |
| 32 |
| | Section 1350 Certifications |
| |
| | |
| 101+++ |
| | The following materials from the ViewPoint Financial Group, Inc. Annual Report on Form 10-K for the year ended December 31, 2012, formatted in eXtensible Business Reporting Language (XBRL): (i) the Consolidated Balance Sheets, (ii) the Consolidated Statements of Income, (iii) the Consolidated Statements of Comprehensive Income, (iv) the Consolidated Statements of Changes in Shareholders’ Equity, (vi) the Consolidated Statements of Cash Flows and (vii) related notes. |
|
| | |
+ | | This exhibit shall not be deemed “filed” for purposes of Section 18 of the Securities Exchange Act of 1934, or otherwise subject to the liability of that section, and shall not be deemed to be incorporated by reference into any filing under the Securities Act of 1933 or the Securities Exchange Act of 1934. |
| | | |
++ | | As provided in Rule 406T of Regulation S-T, this information is furnished and not filed for purposes of Sections 11 and 12 of the Securities Act of 1933 and Section 18 of the Securities Exchange Act of 1934. |
EXHIBIT INDEX
|
| | |
| Exhibits: | |
| |
| |
| 10.11 |
| Form of Director's Agreement |
| | |
| 21 |
| Subsidiaries of the Registrant |
| |
| |
| 23 |
| Consent of Independent Registered Public Accounting Firm |
| |
| |
| 31.1 |
| Certification of the Chief Executive Officer |
| |
| |
| 31.2 |
| Certification of the Chief Financial Officer |
| |
| |
| 32 |
| Section 1350 Certifications |
SIGNATURES
Pursuant to the requirements of Section 13 or 15 (d) of the Securities Exchange Act of 1934, the registrant has duly caused this report to be signed on its behalf by the undersigned hereunto duly authorized.
|
| | | |
| | VIEWPOINT FINANCIAL GROUP, INC. (Registrant) |
| Date: February 19, 2013 | By: | /s/ Kevin J. Hanigan |
| | | Kevin J. Hanigan |
| | | President and Chief Executive Officer (Principal Executive Officer) |
KNOW ALL MEN BY THESE PRESENTS, that each person whose signature appears below constitutes and appoints each of Kevin J. Hanigan and Pathie E. McKee his or her true and lawful attorney-in-fact and agent, with full power of substitution and re-substitution, for him/her and in his/her name, place and stead, in any and all capacities, to sign any amendment to ViewPoint Financial Group Inc.’s Annual Report on Form 10-K for the year ended December 31, 2012, and to file the same, with all exhibits thereto, and all other documents in connection therewith, with the Securities and Exchange Commission, granting unto each said attorney-in-fact and agent full power and authority to do and perform each and every act and thing requisite and necessary to be done, as fully to all intents and purposes as he or she might or could do in person, hereby ratifying and confirming said attorney-in-fact and agent or his or her substitute or substitutes may lawfully do or cause to be done by virtue hereof.
Pursuant to the requirements of the Securities Exchange Act of 1934, this report has been signed below by the following persons on behalf of the Registrant and in the capacities and on the dates indicated.
|
| | |
| /s/ James B. McCarley | | Date: February 19, 2013 |
| James B. McCarley, Chairman of the Board and Director | | |
| | | |
| /s/ Anthony J. LeVecchio | | Date: February 19, 2013 |
| Anthony J. LeVecchio, Vice Chairman of the Board and Director | | |
| | | |
| /s/ Jack D. Ersman | | Date: February 19, 2013 |
| Jack D. Ersman, Director | | |
| | | |
| /s/ Brian McCall | | Date: February 19, 2013 |
| Brian McCall, Director | | |
| | | |
| /s/ V. Keith Sockwell | | Date: February 19, 2013 |
| V. Keith Sockwell, Director | | |
| | | |
| /s/ Karen H. O'Shea | | Date: February 19, 2013 |
| Karen H. O'Shea, Director | | |
| | | |
| /s/ Bruce Hunt | | Date: February 19, 2013 |
| Bruce Hunt, Director | | |
| | | |
| /s/ Pathie E. McKee | | Date: February 19, 2013 |
Pathie E. McKee, Executive Vice President, Chief Financial Officer and Treasurer (Principal Financial and Accounting Officer) | | |