UNITED STATES
SECURITIES AND EXCHANGE COMMISSION
Washington, D.C. 20549
FORM 6-K
REPORT OF FOREIGN PRIVATE ISSUER PURSUANT TO RULE 13a-16 OR 15d-16 UNDER THE
SECURITIES EXCHANGE ACT OF 1934
December 3, 2012
Commission File No.: 001-34830
D. MEDICAL INDUSTRIES LTD.
(Translation of registrant’s name into English)
Granot mobile post Hefer
Israel
(Address of principal executive offices)
Indicate by check mark whether the registrant files or will file annual reports under cover of Form 20-F or Form 40-F.
Form 20-F x Form 40-F o
Indicate by check mark if the registrant is submitting the Form 6-K in paper as permitted by Regulation S-T Rule 101(b)(1): _____.
Indicate by check mark if the registrant is submitting the Form 6-K in paper as permitted by Regulation S-T Rule 101(b)(7): _____.
Indicate by check mark whether by furnishing the information contained in this Form, the registrant is also thereby furnishing the information to the Commission pursuant to Rule 12g3-2(b) under the Securities Act of 1934.
Yes o No x

D. MEDICAL INDUSTRIES LTD.
Quarterly Report for the
Period Ended on September 30th, 2012
Date of the Balance Sheet: September 30th, 2012 Date of the Report: November 28th, 2012 |
Table of Contents
| · | Significant Transformations and Innovations that had Occurred in the Corporation’s Businesses; |
| · | The Board of Directors' Report regarding the Corporation's State of Affairs; |
| · | Condensed Consolidated Financial Statements; |
| · | Interim Separate Financial Data; |
| · | Goodwill impairment assessment. |
[Translated From Hebrew]
D. Medical Industries Ltd.
Significant Transformations and Innovations that had Occurred in the
Corporation’s Businesses in the Nine Months that had ended on September 30th,
20121
| 1. | The Company’s Activity and a Description of its Businesses’ Development |
| 1.1. | General |
D. Medical Industries Ltd. (hereinafter: the “Company”) has incorporated in Israel on September 22nd, 1992, as a limited liability private company according to the Companies Ordinance, 5743-1983. On August 29th, 1994, the Company became a public company, having its shares registered for trade in Tel Aviv’s Stock Exchange Ltd. (hereinafter: the “Stock Exchange”).
The Company was founded under the name Peer Maaliyot VeTaasiyot (92) Ltd. On January 1994, the Company changed its name to Ram Tzur Taasiyot Ltd. On January 2001, the Company changed its name to Arit Maarachot Ltd., and on January 2005, the Company changed its name to its current name.
On September 12th, 2011, the Company published a shelf prospectus. As of the date of this report, the Company has published four shelf offering reports according to the aforementioned prospectus.
Since August 2010, after an IPO in the USA, the Company's shares were also traded in the NASDAQ Stock Market. On July 26th, 2012, the trading of Company's shares in the NASDAQ Stock Market was suspended, since the Company did not meet the requirement according to which a Company should have a minimal equity capital of $2,500,000 or a market value of listed shares in a total of $35,000,000 or net income from current operation during the previous full fiscal year or during two out of the three previous full fiscal years in a total of $500,000. Afterwards, the Company turned to the American SEC in a request to remove its shares from listing and registration on the NASDAQ Stock Market. As of the date of this report, the Company's shares are traded in the Stock Exchange and in the OTC Bulletin Board (“Over the Counter”) or in the Pink Sheets.
| 1 | The update is in accordance with the provisions of regulation 39a to the Securities Regulations (Periodic and Immediate Statements), 5730-1970 and includes significant changes and innovations that had occurred in the corporation’s businesses during the nine months period that has ended on September 30th, 2012, and until the date on which this report is published. This report should be read in relation with the Company’s annual statement as of December 31st, 2011 (Form 20-F), that was published on April 30th, 2012. |
| 1.2. | The Company's Holdings |
As of the date of this report, the Company holds the entire outstanding capital of Spring Health Solutions LTD. (hereinafter: “Spring Health”), a private company incorporated in Israel, that holds the entire outstanding capital of Spring Health Solutions INC (hereinafter: “Spring INC”), a private company incorporated in Delaware, USA; In addition, the Company holds the entire outstanding capital of G-Sense Ltd. (hereinafter: “G-Sense”)2, a private company incorporated in Israel; and the entire outstanding capital of Spring-Set Health Solutions Ltd. (hereinafter: “Spring-Set”), a private company incorporated in Israel (the Company, Spring Health, Spring INC, G-Sense and Spring-Set shall jointly be referred to hereinafter: the “Group”).
Below is a diagram of the Company’s holdings structure as of the date of this report:
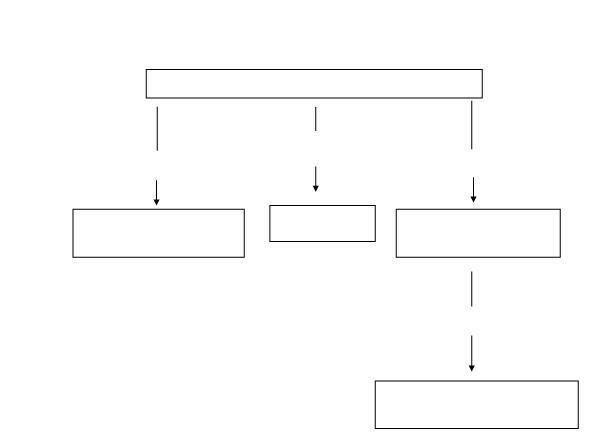
D. Medical Industries Ltd.
G-Sense Ltd.
Spring-Set Health Solutions
Ltd.
Ltd.
Spring Health Solutions
Ltd.
Ltd.
100%
100%
100%
100%
Spring Health Solutions INC
2 | It should be noted that Mr. Avraham Shkalim (hereinafter: “Mr. Shkalim”), who was the CEO of G-Sense, holds stock warrants that may be exercised at any time to ordinary shares of G-Sense in a rate of 8% of G-Sense’s capital stock (in the event that G-Sense or its operation will be sold, Mr. Shkalim shall be entitled to exercise its stock warrants to ordinary shares of G-Sense in a rate of 15% of G-Sense's stock capital) (See Subsection 1.4.9 below). |
2
| 1.3. | Fields of Operation |
As of the date of this report, the Company, through its subsidiaries, holds intellectual property and know-how in the fields of treatment in diabetes and Drug Delivery. In addition, the Company has a little commercial operation in the field of sales of infusion sets to be used with insulin pumps that are manufactured by a sub-contractor in China.
The Company has commenced its operation in relation to medical equipment at the end of 2004. The Company mainly operates through its subsidiary Spring Health, that has developed the Group’s core tehcnology – the spring-based delivery mechanism. Spring Health operates in conjunction with Spring-Set and Spring INC on manufacturing and marketing of the infusion set known by the commercial name SpringTM Universal Infusion Set. G-Sense holds intellectual property and know-how in the field of continuos measurement of the concentration of glucose in the blood.
| 1.4. | Significant Acquisitions and Sales of Assets which are not in the Ordinary Course of Business |
| 1.4.1. | On December 21st, 2004 and February 2nd, 2005, the Company has entered into agreements with Spring Health, in accordance to which the Company acquired (by way of allocation) 72.99% of Spring Health’s outstanding capital stock on the same date (approximately 70% in full dilution, on the same date), in consideration for an investment of US$1,500 in Spring Health. The aforementioned consideration was paid in full. |
In the aforementioned agreement dated February 2nd, 2005, the shareholders of Spring Health who had held Spring Health's shares prior to signing the aforementioned agreement (hereinafter: the “First Shareholders of Spring Health”), were granted, according to their holdings' rate, the option to convert Spring Health’s shares, which were held by them, to the Company's shares, such that in exchange for each single share of Spring Health, the First Shareholders of Spring Health are entitled to receive 80 shares of the Company (2.5 shares after the Company’s capital consolidation). The aforementioned option was exersiced and the shares were converted as specified above.
In addition, it was set that the Company shall pay to the First Shareholders of Spring Health payments in a rate of 2% of the sales of the products of Spring Health and up to a total payment of US$3,000. It should be noted, that all of Spring Health's First Shareholders have exercised their right to convert Spring Health's shares to the Company’s shares, and by doing so, they have lost, in accordance with the aforementioned agreement, their right to receive for the aforementioned payment.
3
| 1.4.2. | On February 13th, 2007, the Company has engaged in an investment agreement with Spring Health, according to which on March 2007, the Company has invested in Spring Health a total sum of US$1,600, and in consideration, the Company’s holdings have been increased to 80.7% of Spring Health’s outstanding capital, in full dilution. |
| 1.4.3. | On Nobember 28th, 2007, the Company’s board of directors has decided to invest $US4,000 in Spring Health such that the Company’s holdings' rate in Spring Health will increase to 86.54% in full dilution. The aforementioned sum was transferred to Spring Health. |
| 1.4.4. | On October 24th, 2007, the Company offered the minority shareholders in Spring Health, who held on that time approximately 13% (not in full dilution) of Spring Health’s outstanding capital, to convert their shares to the Company’s shares in a rate of 60 shares (1.875 shares after the Company’s capital consolidation) for each share of Spring Health. Five of the said minority shareholders have accepted the Company's offer, and on July 2008, the Company has signed an agreement with the aforementioned shareholders, in accordance to which the Company has purchased 49,432 shares of Spring Health from the aforementioned shareholders in considertaion for an allocation of 2,965,920 shares of the Company (92,685 shares after the Company’s capital conslidation). The conversion was performed in its entirety. After performing the aforesaid conversion, the Company held approximately 92.2% of Spring Health’s share capital, in full dilution. |
| 1.4.5. | In accordance with the agreement dated February 6th, 2005, until December 31st, 2011, the remaining shares of Spring Health’s minority shareholders were converted and the options that had been granted to Spring Health's employees to convert their shares to the Company’s shares in a ratio of one Spring Health's share to 2.5 shares of the Company, were exercised. Following the performance of the aforesaid conversions, the Company held the entire share capital of Spring Health. |
4
| 1.4.6. | Loans to Spring Health |
On September 2009, a loan agreement was signed between the Company and Spring Health, in which the Company has granted Spring Health a loan in a sum of approximately 2,630 thousand NIS for five years. The loan is index linked and bears an interest in a rate of 4%.
On Feburary 2010, a loan agreement was signed between the Company and Spring Health, in which the Company has granted Spring Health a loan in a sum of approximately 5,500 thousand NIS for a year. The loan is index linked and bears an interest in a rate of 4%. The aforementioned loan had been repaid in full according to its terms.
On June 2010, a loan agreement was signed between the Company and Spring Health, in which the Company has granted Spring Health a loan in a sum of 500 thousand NIS for five years. The loan is index linked and bears an interest in a rate of 4%.
On October 2010, a loan agreement was signed between the Company and Spring Health, in which the Company has granted Spring Health a loan in a sum of approximately 16,000 thousand NIS for five years. The loan is index linked and bears an interest in a rate of 4%.
On Feburary 2011, a loan agreement was signed between The Company and Spring Health, in which the Company has granted Spring Health a loan in a sum of approximately 6,000 thosuand NIS for four years and eight months. The loan is index linked and bears an interest in a rate of 4%.
On May 2011, a loan agreement was signed between the Company and Spring Health, in which the Company has granted Spring Health a loan in a sum of approximately 10,000 thousand NIS for five years. The loan is index linked and bears an interest in a rate of 4%.
On December 2011, a loan agreement was signed between the Company and Spring Health, in which the Company exchanged all the loans to Spring Health, the balance of which in the day of the exchange was 44,224 thousand NIS, for a loan in a sum of approximately 44,224 thousand NIS for five years. The loan is index linked and bears an interest in a rate of 4%. In the aforementioned date, Spring Health was granted an additional loan in a sum of 1,276 thousand NIS under the same terms.
On May 2012, a loan agreement was signed between the Company and Spring Health, in which the Company has granted Spring Health a loan in a sum of approximately 3,000 thousand NIS for five years. The loan is index linked and bears an interest in a rate of 4%.
5
In July 2012, a loan agreement was signed between the Company and Spring Health, in which the Company granted Spring Health a loan in a sum of approximately 3,000 thousand NIS for five years. The loan is index linked and bears an interest in a rate of 4%.
As of the date of this report, none of the loans which were granted on December 2011, May 2012 and July 2012, or any part hereof, has been repaid.
| 1.4.7. | In accordance with the resolution of the Company’s board of directors dated November 28th, 2007, the Company has engaged with Spring Health and Spring-Set (as a company in establishment) in an agreement regarding the establishment of Spring-Set. Upon the establishment of Spring-Set, the Company has held 90.1% of its outstanding capital. |
| It was agreed, that the Company shall grant Spring-Set a total of $700,000 as a loan to finance its operation. As of the date of this report, the loan (and any part hereof) was not yet repaid. |
| In addidtion, it was set that Spring Health will transfer to Spring-Set the intellectual property which relates to developing a perishable equipment for insulin pumps. It was also agreed, that Spring-Set will sell to Spring Health the products that Spring Health will order from it, in cost prices. In addition, Spring-Set shall pay to Spring Health royalties in a rate of 7% of Spring-Set’s total sales to third parties. |
According to an appended agreement to the aforementioned agreement, Mr. Shkalim, who was the CEO of Spring Health on that time, shall be entitled to an accumulative bonus of up to 1 million U.S. dollars, according to Spring-Set’s sales' rate as specified in the aforementioned appended agreement3. |
| On October 2011, it was agreed with Mr. Shkalim, in an agreement that was validated by the court, that in consideration for 9.9% of his holdings in Spring-Set, Mr. Shkalim shall receive 73,148 shares of the Company. As of the date of this report, the Company holds the entire share capital of Spring-Set. |
| 3 | It should be noted, that the Company is of the opinion that since the employer-employee relations between Spring Health and Mr. Shkalim have concluded, his entitlement to the aforesaid bonus has expired. |
6
| 1.4.8. | Loans to Spring-Set |
On Feburary 2008, the loan mentioned in Section 1.4.7 above was granted, in a sum of approximately 2,514 thousand NIS (which were equal to US$700 thousand) for five years. The loan is index linked and bears an interest in a rate of 4%.
On October 2008, a loan agreement was signed between the Company and Spring-Set, in which the Company has granted to Spring-Set a in a sum of approximately 1,874 thousand NIS for five years. The loan is index linked and bears an interest in a rate of 4%.
On March 2010, a loan agreement was signed between the Company and Spring-set, in which the Company has granted a loan to Spring-Set in a sum of approximately 2,500 thousand NIS for a year. The loan is index linked and bears an interest in a rate of 4%. On March 2011, the aforementioned loan was repaid.
On June 2010, a loan agreement was signed between the Company and Spring-Set, in which the Company has granted to Spring-Set a loan in a sum of approximately 3,000 thousand NIS for five years. The loan is index linked and bears an interest in a rate of 4%.
On October 2010, a loan agreement was signed between the Company and Spring-Set, in which the Company has granted to Spring-Set a loan in a sum of approximately 7,500 thousand NIS for five years. The loan is index linked and bears an interest in a rate of 4%.
On May 2011, a loan agreement was signed between the Company and Spring-set, in which the Company has granted to Spring-Set a loan in a sum of approximately 6,500 thousand NIS for five years. The loan is index linked and bears an interest in a rate of 4%.
On December 2011, a loan agreement was signed between the Company and Spring-Set, in which the Company has exchanged all of the loans, the balance of which on the date of the exchange was 23,752 thousand NIS, in a loan in a sum of approximately 23,752 thousand NIS for five years. The loan is index linked and bears an interest in a rate of 4%. On the aforementioned date, Spring-Set was granted another loan in a sum of 1,748 thousand NIS under the same terms. As of the date of this report, the loans specified in this paragraph (and any part hereof) ware not yet repaid.
7
| 1.4.9. | On April 2005, an agreement was signed between the Company and G-Sense (as a company in establishment) and Spring Health, according to which Spring Health assigned and transferred to G-Sense all of its rights in relation to the development of a sensor for a continuous measurment of the glucose level in the blood and in relation to an application for a patent registration that was submitted by Spring Health in relation to the sensor. |
| It was agreed, that in consideration for assigning the rights in the sensor, Spring Health shall be entitled to receive royalties in a rate of 4% of any income that G-Sense will have in relation with the sensor, unlimitedly. |
| The Company has obligated to invest in G-Sense the sum of 2,500 thousand U.S. dollars in accordance with the milestones specified in the aforementioned agreement. As of the the date of this report, the Company has transferred to G-Sense 300 thousand dollars out of the aforementioned sum. |
| According to an appended agreement to the aforementioned agreement, Mr. Shkalim, who was the CEO of Spring Health on that time, shall be entitled, in consideration for his services to G-Sense, to options which may be immediately exercised to G-Sense's shares in an exercise price of 0 NIS per share and in a rate of 8% of the share capital, and in the event that the Company or its operation shall be sold, he shall be entitled to an exercise in a rate of 15% of the share capital. It was further set, that in the event that agreements with strategic partners shall be signed, the aforementioned employee will receive the sums of $100,000 or $200,000, in accordance with the rules set in the aforementioned agreement, or according to G-Sense’s resolution, options which may be exercised to 250,000 or 500,000 shares of the Company, respectively. |
8
| 1.4.10. | Loans to G-Sense |
On October 2006, a loan agreement was signed between the Company and G-Sense, in which the Company has granted to G-Sense a loan in a sum of approximately 330 thousand NIS for five years. The loan is index linked and bears an interest in a rate of 4%.
On Feburary 2007, a loan agreement was signed between the Company and G-Sense, in which the Company has granted to G-Sense a loan in a sum of approximately 2,982 thousand NIS for five years. The loan is index linked and an interest in a rate of 4%. On December 2007, a loan agreement was signed between the Company and G-Sense, in which the Company has granted to G-Sense a loan in a sum of approximately 2,000 thousand NIS for five years. The loan is index linked and bears an interest in a rate of 4%.
On September 2009, a loan agreement was signed between the Company and G-Sense, in which the Company has granted to G-Sense a loan in a sum of approximately 1,324 thousand NIS for five years. The loan is index linked and bears an interest in a rate of 4%.
On June 2010, a loan agreement was signed between the Company and G-Sense, in which the Company has granted to G-Sense a loan in a sum of approximately 1,750 thousand NIS for five years. The loan is index linked and bears an interest in a rate of 4%.
On September 2011, a loan agreement was signed between the Company and G-Sense, in which the Company has granted to G-Sense a loan in a sum of approximately 700 thousand NIS for five years. The loan is index linked and bears an interest in a rate of 4%.
On December 2011, a loan agreement was signed between the Company and G-Sense, in which the Company exchanged all of the loans, the balance of which on the day of the exchange was approximately 11,541 thousand NIS, to a loan in a sum of approximately 11,541 thousand NIS for five years. The loan is index linked and bears an interest in a rate of 4%. On the aforementioned date, G-Sense was granted an additional loan in a sum of 9 thousand NIS under the same terms.
On July 2012, a loan agreement was signed between the Company and G-Sense was signed, in which the Company granted G-Sense a loan in a sum of approximately 300 thousand NIS for five years. The loan is index linked and bears an interest in a rate of 4%.
As of the date of this report, none of the loans which were granted on December 2011 and July 2012 (or any part hereof), have been repaid.
9
| 1.4.11. | On April 29th, 2012, the Company’s board of directors has resolved that a merger between Spring Health and Spring-Set will be performed, by way of operation sale, effective as of July 1st, 2012. |
| 1.4.12. | On June 19th, 2012, the Company has announced that it is negotiating with an unrelated third party that is engaged in the field of medical equipment in relation to diabetes (hereinafter: the “Target Company”), regarding an execution of an acquisition transaction in which the Company or one of its subsidiaries shall purchase the entire outstanding capital of the Target Company, in considertion for cash and the Company’s and/or the Company’s subsidiary's shares. The aforementioned negotiation has not perfected into a transaction. |
| 1.4.13. | On November 8th, 2012, the Company has announced that it is negotiating with a foreign international company that is engaged in the development and manufacture of devices used for treatment of diabetes, for the purpose of selling the intellectual property which covers various aspects of Spring™ Universal Infusion Set, which is owned by Spring Health and Spring-Set. As of the date of this report, the entire of the aforesaid transaction's terms have not yet been agreed upon, and the said negotiation has not yet been perfected into a binding agreement. |
It is hereby clarified, that Spring™ Universal Infusion Set can be connected to all of the pumps that uses a universal luer lock. In addition, as aforementioned, the Company has additional products that are currently in different commercialization stages, among them a spring-based insulin pump, and that the intellectual property which relates to the aforesaid products shall remain the Company's property.
| 1.5. | Structural changes |
On March 2012, the Company has initiated a strategic reorganization in the Company, designed to significantly reduce the Company's ongoing operating expenses, including by means of a staff reduction and a voluntary reduction in the compensation of, among others, the chairman of the board, the chief executive officer, chief financial officer and the chief operating officer4. Following the resolution regarding the reorganization, the Company has dismissed most of its employees. As of the date of this report, the Company turns its efforts to continuing to support of its existing customer base and to receiving orders for SpringTM Universal Infusion Set, while the Company's efforts in relation to research and development, and some of its efforts in relation to regulatory and commercialization are currently on hold, until an addtional capital shall be raised for the purpose of these goals.
| 4 | It should be noted, that the chief executive officer, chief financial officer and the chief operating officer have cancelled the voluntary reduction about two months following their agreement to it. |
10
The Company has hired the services of Healthios Capital Markets, LLC (herein: “Healthios”), a Chicago-based leading consulting firm that focuses on providing services for companies engaged in health care products, as a financial advisor in relation to the aforementioned reorganization and in a purpose to support the Company in attaining strategic partnership (e.g. OEM, sale of the Company’s technology, in all or in part, or attaining licensing agreements to use the Company’s technology). As of November 28th, 2012, the Company has paid Healthios approximately 52 thousand U.S. dollars in consideration for the services which were provided to the Company by Healthios.
| 2. | Fields of Operation |
| See Section 1.3 above. |
| 3. | Investments in the Company’s Capital and Transactions in the Company's Shares |
Transactions in the Company’s shares
To the Company's best knowledge, during the period that has commenced on January 1st, 2011 and ended on the date of this report, the Company's stakeholder have not performed transactions outside of the stock market.
| 4. | Dividends distribution |
The Company has never declared and, as of the date of the report, the Company does not anticipate paying cash dividends on the Company's ordinary shares in the foreseeable future.
The Company's board of directors has the discretion to declare and pay dividends on the Company's ordinary shares, and it will make a determination to do so on a number of factors, including, among others, our earnings, financial condition and other business and economic factors that the Company's board of directors may deem relevant. The Company may pay dividends in any fiscal year only out of its “profits” (as defined by the Companies Law, 5759-1999), provided that the distribution is not reasonably expected to impair the Company's ability to fulfill its outstanding and expected obligations. In the event that the Company shall not pay dividends, the Company's ordinary shares may be less valuable because a return on the shareholders' investment will only occur if the trading price of the Company's ordinary shares appreciates.
11
| 5. | Financial Information regarding the Group’s Fields of Operation |
The following is a consolidated financial data regarding the Group’s fields of operation (in thousands NIS):
| The Nine Months that had ended on September 30th | |||
| 2011 | 2012 | ||
| Incomes from the operation field | From external | 1,145 | 609 |
| From other operation fields | - | - | |
| Total | 1,145 | 609 | |
| Costs attributed to the operation field | Costs which constitute incomes of another operation field | 8,402 | 2,761 |
| Other costs | - | - | |
| Total | 8,402 | 2,761 | |
| Costs attributed to the operation field | Fixed costs | 4,384 | 1,153 |
| Variable costs | 4,018 | 1,608 | |
| Total | 8,402 | 2,706 | |
| Profit (loss) from routine activities | From routine activities attributed to the owners | (28,884) | (12,584) |
| From routine activities attributed to rights which do not grant control | (3,504) | - | |
| Total | (32,388) | (12,584) | |
| Total assets | 29,454 | 8,743 | |
| Total liabilities | 10,977 | 7,724 | |
| 6. | General Environment and the Influence of external factors on the Group’s Operation |
The following is a description of the fundamental factors which, to the Group’s best knowledge, have or are expected to have a significant influence on the business results or developments of the Group, and their consequences:
| a. | Influence of the Global Crisis |
The year 2011 was characterized with an uneven financial development rate throughout the year, in both the international and local arenas: on the commencement of the year, there were forecasts for the continuation of the recovery of the global economy and the continuation of growth of the Israeli economy, a trend that was realized, among others, by increases of the prices of shares in the capital markets. However, toward the midyear of 2011, the European debt crisis worsened, where fears were growing stronger toward an insolvent Greece. The European crisis has worsened, when the concerns from Greece's lack of capability to perform repayments have become stronger. The European crisis has continued to become stronger and has additionally expanded to central countries in the continent such as Spain and Italy.
12
In the forth quarter of 2011, the European crisis has worsened, and as a result, the leaders of the European countries have decided to take several measures in order to deal with the debts. The transfer of large quantities of funds to the European bank system by the central bank has led, by the end of 2011 and on the commencement of 2012, to a reduction of the uncertainty, to stabilization and even to increases in the prices of the shares in the stocks and corporate bonds markets in the global financial markets. Nonetheless, the uncertainty in relation to all of the aforesaid regarding Spain’s debts and Greece’s political stability kept shaking the markets in 2012 as well.
The global changes influence the Company, especially in relation to the management of the balances of the liquid resources and the exposures to changes in the foreign currency rates. As of the date of this report, to the best knowledge of the Company’s board of directors, the aforesaid crisis has no direct influences on the Company’s operation and its current financial situation, except for the influence of the changes in the foreign currency rates.
The Company’s cash balances are deposited in short-term deposits in the Israeli currency and foreign currency in banks in Israel and the United States. The Company does not have positions in any derivatives.
Nonetheless, even though at this stage, the aforementioned global crisis does not have a direct influence on the Company, it may indirectly influence the Company in the future, such as an influence on the Company’s ability to raise additional funds in the capital market as well as from private investors for the purpose of continuation of its current operation, what might negatively influence its business results and marketing plans and its ability to expand to additional markets. Additionally, the financial crisis might influence the Company’s existing and potential clients, what might, under certain circumstances, indirectly influence on the Company’s operation and incomes. The crisis might bring about a decline in the extent of the financial activity in the markets in which the Company operates.
13
| b. | The State of the Israeli Hi-Tech Market and the Venture Capital Market |
According to an IVC5 survey for the year 2011, Israeli hi-tech companies raised $2.14 billion from local and foreign venture investors, the highest amount in the past 11 years, which constitutes nearly 70% above the amount raised in 2010 and 91% above the amount raised in 2009. |
| However, in the first half of 2012, the venture capital investments amount reached $936 million, an 11% less than the amount which was invested during the first half of 2011, but 62% more than the amount which was invested during the first half of 2010. |
| During the second quarter of 2012, Israeli hi-tech companies raised $453 million from local and foreign investors, which constitutes 6% less than the amount which was raised during the first quarter of 2012 and 20% less than the amount which was raised during the second quarter of 2011. |
| c. | Israel’s Security-Political State |
In times of tranquility in the security situation in Israel, an improvement occurs in the business environment of technological firms including the Company. The aforementioned is realized by the presence of foreign investors in Israel and by an improvement in the investments' atmosphere, which are performed by issuing of Israeli firms in markets in Israel and abroad as well as by mergers and acquisitions.
Deterioration in the security situation might cause a worsening in the market’s financial state, including in the business environment of technological firms, a concern of investors from Israel and abroad to conducting investment transactions in Israeli companies and a difficulty to perform “exits”.
| d. | Product Approval Policy of the Supervising Authorities |
The Group’s operation, mainly in the field of medical equipment, is influenced by the policies of the supervising authorities in the various countries for approving its products.
5 | Israel Venture Capital Research Center – A research center specializing in analyzing the Hi-Tech industry, and that observes the Israeli venture capital market, tendencies, statistics, transactions, etc. The organization is supported by Giza Venture Capital Fund and the IVA, which is Israel Venture Association. The IVC's survey is published on IVC's website www.ivc-online.com. The survey data is brought as is and were not examined by the Company or anyone on its behalf. |
14
The marketing of the Group’s products is conditional upon the receipt of an approval by the health authorities in each country in which the products will be marketed, including an FDA approval and a CE Mark since the Group's products are medical products, as detailed below:
| 1. | CE Mark |
To the Group's best knowledge, based on public publications, the CE Mark is a European standard for products, that constitutes a statement by a manufacturer according to which the product meets the standards of the European Union for health, safety and the environment. The standard ensures free trade between the countries of the European Union and the EFTA countries (Iceland, Liechtenstein and Norway), and permits the customs and enforcement authorities in the European countries to disapprove similar products which do not bear the CE Mark.
In accordance with the European Medical Device Directive regarding medical equipment (93/42/EEC), starting from June 14th, 1998, manufacturers of medical equipment must act according to the instructions of the European Medical Device Directive. Medical equipment is defined as any instrument, apparatus, appliance or material, which is used for medical treatment of human beings or required for the purpose of operation of a medical instrument or apparatus, whether used alone or in combination with additional instruments, including the software necessary for the medical device or which constitutes the product itself, and which is designated for diagnosis and treatment of disease, an injury or handicap, and which is not a medicine.
During the inspection of the medical equipment, the safety and technical features of the product as well as the quality management system of the manufacturer are tested by the European Notified Body, such that by the end of the process, the manufacturer receives the CE Mark as well as ISO13485 standard for the quality management process.
To obtain a CE Mark for the types of medical devices that are manufactured by the Group, the Group must implement a quality management system, or QMS, and create a Technical File demonstrating compliance with the requirements of the European Medical Devices Directive, as well as proving a contractual relationship with The European Authorized Representative. The QMS and the Technical File must be audited by a third-party assessing body, or a notified body, who, if the audit is successful, will issue an EC Certificate. The corporation must then draw up a Declaration of Conformity stating that its products conform to the type described in the EC Certificate and with the provisions of the European Medical Devices Directive, and must affix the CE Mark to all of its products marketed in the EEA.
The European Medical Devices Directive has been recently amended by Directive 2007/47/EC which has strengthened the EEA’s conformity assessment and post-marketing surveillance procedures. The European Commission is also currently reviewing the medical devices legislative framework with the aim of simplifying it and ensuring a more uniform application of the provisions contained in the Directives across the EEA.
15
As of the date of this report, Spring Health received a CE Mark for the first and second generation of the ADI pump and the Insulin delivery system SpringTM Zone, that replaces the second generation of the ADI pump. On September 1st, 2009, Spring Health received a CE Mark for the first version of Spring Hybrid Patch Pump.
On March 24th, 2009, the Company has announced that Spring-Set received a CE Mark for the advanced infusion kit “Lighty” (known by its new name - SpringTM Universal Infusion Set).
It should be noted, that in order to preserve the standards, a qualification exam of the European Qualification Body must be passed every year.
| 2. | U.S. Food and Drug Administration (“FDA”) |
To the Group's best knowledge, based on public publications, the FDA is a federal organization, that belongs to the American Department of Health and Human Services, whose aim is to protect the health of the American public by founding and enforcing a high product standard and by various regulatory demands, that will allow the safety and efficiency of products such as drugs meant to be used by human beings and veterinarian usage, as well as biological products and medical devices.
Foreign companies, that manufacture medical devices and are interested in exporting the devices to the USA, are committed to meeting the regulatory requirements of the FDA prior to exporting the medical devices and also afterwards, since the FDA does not recognize regulatory approvals given by the institutions of other countries. The FDA demands include, among others, manufacture of the medical devices according to a regulation of quality control, receipt of scientific reports regarding the medical devices, and providing an option to the FDA's representatives to oversee the manufacture procedures in the factory.
16
The FDA classifies medical devices into one of three classes. Devices deemed to pose lower risk are placed in either class I or II, which requires the manufacturer to submit to the FDA a premarket notification requesting permission for commercial distribution. This process is known as 510(k) clearance and is usually the shorter process. To obtain 510(k) clearance, the manufacturer must demonstrate that the proposed device is safe and efficient, and is substantially equivalent to other products which are legally marketed in the USA. Some low risk devices are exempt from this requirement. Devices deemed by the FDA to pose the greatest risk, such as life-sustaining, life-supporting or implantable devices, a device deemed to be not substantially equivalent to a previously cleared 510(k) device or a “pre amendment” class III device (in commercial distribution before May 28, 1976) for which premarket applications have not been called, are placed in class III. In general, a class III device cannot be marketed in the United States unless the FDA approves the device after submission of a premarket approval, or a PMA application. The FDA can also impose restrictions on the sale, distribution or use of devices at the time of their clearance or approval, or subsequent to marketing.
After a device receives a clearance or approval and is placed on the market, numerous regulatory requirements apply, including: establishment registration and device listing with the FDA; meeting the strict QSR requirements, which require manufacturers to follow quality assurance procedures during all aspects of the manufacturing process; labeling regulations; regulations regarding operations of marketing of the product; reporting regulations, which require that manufacturers report to the FDA if their device may have caused or contributed to a death or a serious injury or malfunctioned in a way that would likely cause or contribute to a death or a serious injury if the malfunction were to recur; regulations which require manufacturers to report to the FDA field corrections and product recalls or removals if undertaken to reduce a risk to health posed by the device; and post-market surveillance regulations.
Failure to comply with applicable regulatory requirements might result in enforcement actions by the FDA, which may include any of the following sanctions: civil or criminal penalties, recall or seizure of products, operating restrictions, partial suspension or total shutdown of production, refusing requests for 510(k) clearance or PMA approval of new products, and rescinding previously granted 510(k) clearances or withdrawing previously granted PMA approvals.
After obtaining the 510(K) clearance, the manufacturer is required to perform an establishment registration and listing procedure in the FDA’s database. Without performing the said procedure, products cannot be transferred through the customs for sale in the USA. The manufacturer is required for a yearly update of its registration and listing.
17
The ADI Insulin pump of the first generation and the SpringTM Universal Infusion Set were granted the FDA approval for marketing in the USA under the 510(K) procedure.
The Group estimates, based on consultation it has received, that its other products in the field of insulin dripping might require a 510(k) clearance procedure. Regarding the system for monitoring the glucose level, it is still unclear whether the aforesaid process will be sufficient. In the event that the Group shall be required to go through a procedure for obtaining a PMA approval, it will entail longer and more expensive procedures, costs and time.
It should be noted, that the Group’s estimation regarding the types of approvals required for its products as detailed above, the time tables and costs required in relation to obtaining of the above approvals, are anticipatory information, as defined in the Securities law, 5728-1968, that is based on the Company’s estimations of its development potential and preliminary documents that the Company received from relevant professional figures to the development plans detailed above. These estimations might not realize, in whole or in part, or realize in a different manner than as expected. The factors that might influence on the non-realization of the aforesaid estimations, in whole or in part, or on their realization in a different manner than expected, are compliance with the products' feasibility tests, the Group’s success in meeting the goals and dates detailed above, the costs involved in issuing the aforementioned approvals, the Group’s success in developing its products and/or realization of the risk factors that might bear a significant influence on the Group’s operation and business results.
| 3. | The Ministry of Health |
The Group’s operation in Israel will be subject to obtaining permits from the Ministry of Health, which relate to two levels: on the level of importing parts for the production and marketing of the Group’s products, the group is subject to the approval of the Medical Devices and Accessories Unit (“AMR”) in the Ministry of Health’s pharmaceutics department. On the R&D level, human testing will be performed by the group, which is subject to AMR’s and the Ethics Committee (“Helsinki Committee”) approval, as detailed below.
18
| 4. | Medical Devices and Accessories (“AMR”) |
AMR is defined as a device, an accessory, software, chemical material, biological or biotechnological product, that is used in a medical treatment, or is required for the operation of a device or accessory that is used for treatment and that is not designated principally to operate on the human body as medicine. The AMR unit in the Ministry of Health is the body in charge on AMR registration in the State of Israel, the issuance of documents that assist with the exportation of AMR, the grant of various importation permits to the AMR, monitoring the marketing of AMR in Israel and approving clinical experiments with the AMR.
As of the date of this report, the ADI pump of the first generation and the SpringTM Universal Infusion Set have received AMR approval and Free Sale Certificate approval.
| 5. | Public Health Regulations (Medical Experiments on Humans) 5741-1980 (hereinafter: the “Regulations”) and Procedure no. 14 of the Ministry of Health’s Pharmaceutics Department – Medical Experiments on Human Beings (hereinafter: the “procedure”) |
The regulations and procedure set the regularizations for approval of performance of a medical experiment and an experiment with medical equipment, that is defined as a special medical experiment on human beings. According to the procedure, every medical experiment is subject to the Regulations, to the Genetic Information law, 5761-2000, to the procedures’ directives, to the Harmonized Tripartite Guideline for Good Clinical Practice ICH-GCP (E6) and to the directives of ISO 14155-1, 14155-2 (2003): Clinical Investigation of Medical Devices for Human Subjects, as well as circulars and procedures of the Ministry of Health that are published from time to time.
19
The Regulations set that a medical experiment on a human being shall not be approved, unless the Ethics Committee “Helsinki Committee” (see herein) of the hospital intending to perform the experiment has approved its performance and notified the aforesaid in writing to the medical manager of the hospital in which the experiment is taking place and the hospital’s manager was convinced that the experiment does not contradict the “Helsinki Declaration” and is not contradictory to the regulations. In specific cases detailed in the Regulations, an expert opinion is additionally required from the supreme “Helsinki Committee” for medical experiments on human beings, in order to approve the performance of the experiment.
The Ethics Committee was established by virtue of the international convention (The Helsinki Convention) and the duty of which is to approve experiments on human beings aiming to prove the efficiency of instruments, only following their safety was proven on animals and the following conditions, among others, were tested: the latent advantages in the experiment for the participant and society as a whole, which justify the latent risk of the experiment and the inconvenience involved in its performance, and the existing medical and scientific information which justifies the performance of the experiment.
20
| 6. | The Encouragement of Industrial Research and Development Law 5744-1984 (hereinafter: the “R&D Law”) |
The R&D Law sets a series of demands, which must be met by the applicant for benefits for financing a research and development. Whoever was granted the benefits specified under the by the R&D Law should pay to the state’s treasury, royalties from any income derived from the product developed as part of or as a result of the program, including services that are additional or bound in the product. In addition, the R&D law requires that a product that shall be developed as a result of the research and development will be manufactured in Israel only, unless the research committee of the Industry, Trade and Labor Ministry has approved the assignment of manufacture rights of the product outside of Israel. Spring Health was granted grants by the Chief Scientist by virtue of the R&D Law.
On April 7th, 2005, amendment no. 3 to the R&D Law was published. The aforementioned amendment allows, among others, the extraction or sale of knowledge which its development was supported by the grants of the Chief Scientist to third parties outside of Israel, in consideration for a certain part (according to a defined formula) of the consideration that was received in connection with the transaction of the extraction or sale of the knowledge, or in consideration for receiving knowledge from third parties or cooperation in the operation of research and development. The amendment became affective on June 7th, 2005, two months after its publication, and it additionally applies to plans that were approved prior to the day in which the amendment became affective.
21
On January 6th, 2011, amendment no. 5 to the R&D Law was published. The aforesaid amendment sets that a transfer of manufacture abroad of products which were developed as part of one of the support plans of the Chief Scientist is conditional on the Chief Scientist's approval and, in addition, obligates the payment of increased royalties. In addition, the amendment narrows the existing incentive for extracting knowledge from Israel by selling the entire company and ceasing from operating in Israel, as opposed to extracting knowledge when the operation in Israel continues to be carried out, by changing the formula for calculating the sum of the payment to the Chief Scientist as compensation for the loss of knowledge (“The basic amount”). In addition, there were set amendments in the rules of reduction of the basic amount. The amendment came into effect on January 1st, 2011, except with regard to the change of the formula in relation to the calculation of the basic amount and the reduction rules of the basic amount (section 19b of the R&D Law), which shall become effective on the date in which regulations related to the aforesaid section will come into effect.
In this context, it should be noted that on May 14th, 2012, The Encouragement of Research and Development in the Industry Regulations (the Maximal Amount to be Paid in Consideration for Transfer of knowledge according to Sections 19B(b)(1) and (2) of the R&D Law), 5772-2012, were brought to the approval of the Knesset’s finance committee. The said regulations deal with the amount of the maximal payment to be paid by the grantee of the approval in consideration for selling knowledge of a company abroad, which company has been granted a grant from the Chief Scientist. The regulations set that the sale of knowledge only, shall entail a payment of up to 6 times of the total sum of the grants received by the seller according to the R&D Law, and in accordance with other support plans regarding that same knowledge. On the other hand, in the event that the sale of knowledge is performed as part of a transaction in which the seller of knowledge ceases from being a corporation incorporated in Israel, the payment shall not exceed a sum equal to 6 times the total sum of all the grants received according to the R&D Law and in accordance with other support plans regarding any knowledge whatsoever. In an event that the seller of the knowledge has obligated to keeping the research and development operation in Israel, the payment will not exceed 3 times the total of the grants received in relation to the same knowledge or the entire knowledge, according to the circumstances of the matter. According to the above regulations, keeping the research and development operation in Israel, means manning of not less than 75% of the R&D positions (directly or indirectly), based on a monthly average of the six months preceding the submission of the application, for a period of three years since the date of payment in consideration for selling the knowledge. The above regulations have not yet come into effect.
22
| 7. | Canadian Legislation |
The medical equipment field is regulated in Canada by the Federal Canadian Health Department. The Federal Canadian Health Department classifies medical equipment in accordance with the risk that is derived from medical equipment in accordance with the medical equipment classification rules detailed in appendix no. 1 of the Medical Devices Regulations to the Food and Drugs Act. There are four levels of classification in accordance with the level of invasiveness.
The Company is of the opinion, that in light of a review of The Health Canada guidance document Keyword Index to Assist Manufactures in Verifying Class of Medical Devices, that insulin pumps belong to the third classification category (the fourth classification category is the highest invasiveness category).
The Group received a license for the SpringTM Universal Infusion Set from the Canadian Health Department. Based on the aforementioned license, the said infusion set belongs to the second rating category.
In order to import and sell medical equipment in Canada, requirements regarding the equipment’s licensing and the “establishment licensing” must be followed. The significance of the aforesaid is that the equipment imported to Canada or sold within Canada must have a license, and that an entity importing or selling equipment as aforesaid must hold an establishment license (except in the event it is a retailer, a health treatment facility or a manufacturer).
The principal regulatory requirement is the demand for licensing the equipment. Thus, for instance, in order to receive a license for medical equipment that belongs in the third rating category, the manufacturer must submit the following documents to the Canadian Health Department: description of the equipment and the materials used for manufacture and packing the equipment; a description of the equipment characteristics that allow it to be used in medical situations, and the purposes and usages for which it is manufactured; a list of the countries in which the equipment is sold, the amount sold and a summary of problems reported and product returns; a list of standards according to which the equipment was designed and manufactured; in the event that the equipment needs to be sold in a sterile form, a description of the sterilization method; a summary of all the researches on which the manufacturer has based on in order to ensure that the equipment meets the demands for safety and effectiveness, and the conclusions derived from these researches by the manufacturer; a copy of the equipment’s label; in the event of a near patient in vitro diagnostic device, a summary of investigational testing conducted on the device using human subjects under conditions similar to the conditions of use; references of all the reports published that regard the usage, safety and effectiveness of the equipment; and a copy of the quality management system certificate that testifies that the quality management system according to the rules of which the equipment is designed and manufactured, fulfills Canada’s national standards – CAN/CSA-ISO 13485:03, Medical devices – Quality management systems – Requirements for regulatory purposes.
23
The Canadian regulation imposes many obligations on manufacturers, including obligations to follow the Canadian distribution records, treatment of complaints and requirements for reporting on problems.
Failure to conform with the Canadian regulatory regime might result in: (i) notice from Health Canada requiring conformity; (ii) suspension of the device license; (iii) an order for seizure and destruction of non-conforming products; and/or (iii) prosecution for an offence, with penalties including fines of up to $5,000.
The company is performing regulatory registration processes in China and in Mexico – files were submitted to the Mexican authorities and to the consultation company responsible for registering the product in China.
| 7. | A Description of the Corporate's Business according to Fields of Operation |
| a. | The Structure of Competition in the Field of Operation of the Company and the Changes that Occur in it |
Below is a description of several companies engaged in the business:
| 1. | Insulet Corporation (hereinafter: "Insulet") – Insulet is a medical device supplier that develops, manufactures and markets insulin infusion systems for insulin dependent diabetics. Insulet's insulin management system, OmniPod (OmniPod system), includes the OmniPod disposable infusion device as well as personal mobile diabetes manager that operates wirelessly. The FDA approved the sale of the OmniPod system in the USA. |
| 2. | Medtronic Inc. (hereinafter: "Medtronic") – Medtronic is a global company operating in the medical technology arena. It operates through seven divisions that manufacture and sell medical treatments based on devices: heart rhythm management, spine, cardiovascular, neuro-modulation, surgical technologies and Physio-control. Medtronic develops, manufactures and markets its medical devices in over 120 countries. Its major products include solutions for cardiac arrhythmia, cardiovascular diseases, neurological problems, spinal problems, skeletal and muscular system traumas, urological problems and gastric problems, diabetes as well as nose, ear and throat disorders. The Medtronic diabetes division produces external insulin pumps, continuous glucose monitoring devices, Carelink treatment management software and blood glucose meters. |
24
| 3. | Animas Corporation (hereinafter: "Animas") – Animas develops pager-sized automated insulin pumps, "worn" by diabetic patients, providing the body with continuous fast acting insulin. The infusion pumps, connected to a pipe with a needle inserted under the skin, replace the use of periodic insulin injections. Additionally, Animas sells diabetes management software and various pump accessories. It markets its products around the world through a combination of direct sales representatives and distributors. Animas is a Johnson & Johnson subsidiary, subordinated to its LifeScan division. |
| 4. | I-Flow Corporation (hereinafter: "I-Flow") – I-Flow designs, develops and markets drug delivery systems and surgical products for alleviating post surgical pains and treatment of the operated area. I-Flow products are used in hospitals, independent surgical centers, homes etc. The group deals mainly in design, development, production and marketing of advanced, cost-effective ambulatory infusion systems. It operates through a single operation channel; I-Flow has identified two product lines: local anesthetics and intravenous infusion treatment. It produces compact, mobile infusion pumps, catheters and pain kits that enable delivery of local anesthetics, chemotherapy, nutritious additives and other medications. Group customers include hospitals and alternative sites. It markets its products through distributors in the United States, Canada, Europe, Asia, Mexico, Brazil, Australia, New Zealand and the Middle East. |
The leading supplier is Medtronic, which held in 2009 58% of the market. Medtronic's MiniMed Paradigm product sells well: it is the first insulin pump integrated with the company's continuous glucose monitoring system (CGM), providing closer monitoring of glucose levels along with higher quality of living.
Roche, with a 12% market share, is the following leading supplier. Its Accucheck insulin pump is characterized by steady growth due to properties such as three operating menus, four bolus options, five basal profiles and smaller dimensions.
MiniMed (Medtronics) and Disetronic Medical Systems (Roche) were the market leaders in this segment until 2000. Following that year, a market fragmentation began due to the entrance of companies such as Animas Corporation with the R1000 insulin pump, and Eltec with the Cozmo insulin pump. The acquisition of MiniMed, which was considered the leading insulin pump manufacturer in the USA, by Medtronic, and acquisition of Disetronic, one of Europe's leading insulin pump manufacturers by Roche, helped these companies to regain the market share and to obtain control in the global market of the insulin pumps.
25
Currently, Animas holds a global market share of 11% and preserves close competition with Insulet, which has a market share of 10%. Because, as of the date of this report, Insulet is the only company that supplies disposable insulin pumps, it has managed to increase its market share rapidly since entering the arena in 2005.
Hereinafter is a chart detailing the shares of the competitors at the global market of insulin pumps (based on the revenue):

26
| b. | Developments in the Markets of the Segment of Operations, or Changes in Its Clients' Characteristics |
The diabetes treatments market includes drug treatments and treatments through medical devices. The pharmaceutical aspect includes insulin and orally administered anti-diabetes drugs. The devices segment comprises of diagnosis and monitoring devices and a variety of devices for the delivery of insulin. Some of these devices contain pre-loaded insulin doses, and they can be treated both as medical devices and pharmaceutical products. The leading segments of the diabetes products market are as follows:
Insulin, blood glucose meters and related biodegradable materials (e.g. needles, test strips), insulin pumps, insulin delivery devices (e.g. syringes, pens) and anti-diabetes drugs.
In 2010, the global diabetes management market totaled $40 billion and is expected to reach a total of around $114 billion, following an annual growth rate (CAGR) of 13.5%. Insulin, test strips and anti-diabetes drugs are the products that generate the highest revenue in this market.
The anti-diabetic drug market, which is one of the major segments of the global diabetes market, was estimated in 2010 at around $28 billion, with oral drugs being 38% of the segment and injected drugs being over 55% of the segment. The additional major segment of the global diabetes market – the devices sector – was estimated at $16 billion in 2010.
27
The value of the global insulin pump market was estimated at $724.3 million in 2010 and is expected to grow in an annual growth rate (CAGR) of 7.9% and reach $1.2 billion in 2017. According to the market reports and studies, the market is expected to be driven by a fast increase in diabetes prevalence, availability of the monetary refund, positive clinical results in studies related to the insulin pumps usage and the advantages that the insulin pumps provide to the groups of "niche" patients. USA continues to be the largest insulin pump market, driven by a high penetration rate of pumps to the market and the availability of the monetary refunds.
In 2010, the value of the American insulin pump market was estimated at $518.5 million and is expected to be characterized by 8.5% CAGR and reach the value of $915.4 million by 2017. Market growth is expected to be driven by several factors, such as an increase in prevalence of diabetes among people of all ages, higher penetration of insulin pumps to the market and the availability of the monetary refunds.
The global diabetes product market in 2010 (in $ millions) is described below:

Often, coping with diabetes is frustrating and difficult for the patients, since the blood glucose levels are influenced by hydrocarbon content of the meals, physical activity, pressure, existing or developing diseases, hormonal fluctuations, insulin absorption fluctuations and changes in the known influence of insulin on the body. Diabetics with insulin dependent diabetes, and particularly those with type 1 diabetes, require the following treatments:
| 1. | Constant monitoring and daily intake of insulin, as well as increased carbohydrate intake during the day to retain normal blood glucose levels; |
| 2. | Constant insulin supply, known as basal insulin, to address the background metabolic needs. |
28
In addition to the basal insulin, insulin-dependent diabetics require an additional insulin dosage known as "bolus", to compensate for the carbohydrates consumed during meals or as snacks or in order to offset the high doses of glucose in the blood. Diabetics who try to closely control blood glucose levels for preventing long-term complications related to the fluctuations in such levels are at high risk of "over correction" that sometimes causes hypoglycemia. Therefore, the time dedicated to the diabetes management, blood glucose level fluctuations and apprehension of hypoglycemia all contribute to the huge burden carried by patients and their family members.
| c. | Critical Success Factors in the Group’s Operation |
There are several critical success factors relating to the Group’s field of operation, which influence on the Group’s functioning and position in the market:
| 1. | A successful final development of the Group’s products. |
| 2. | Obtaining regulatory approvals in Israel, United States (FDA) and Europe (CE Mark) for all of the Group’s products, for usage and marketing in the aforementioned markets. |
| 3. | The Group’s success in marketing and selling its products in the future on a commercial basis in significant volumes whether directly or through strategic partnerships. |
| d. | The Main Entrance and Exit Barriers of the Field of Operation and the Changes that Occur to Them |
The entrance barriers of the field of operation are mainly the obtaining of regulatory approvals as detailed in Section 6(d) above, intellectual property protections and the ability to set up appropriate distribution channels in the target markets. To the Company's best knowledge, there are no exit barriers from the field of operation.
| e. | Segmentation of Income and Profitability from Products |
As of the date of this report, the Company sells only one product – SpringTM Universal Infusion Set. This sales of the aforementioned infusion set during the third quarter of 2012 constitute the entire sales for the said quarter.
| f. | New products |
As aforementioned, after the performance of the reorganization in the Company, as described in section 1.5 above, the Company has suspended its operation in the fields of research and development until additional funds will be raised for this purpose. The Company may engage in research and development in the future, but there is no assurance that it will do so.
29
| g. | Customers |
The Company does not depend on a single customer or in a small number of customers, the loss of which will significantly influence the Company’s field of operation.
The Company’s main activity is performed in Europe, USA and Canada. The volume of sales does not justify a distribution of the customers according to geographical and socio-economic characteristics.
| h. | Marketing and Distribution |
As specified above, Spring Health, Spring-Set and Spring INC operate in the fields of manufacture and marketing of SpringTM Universal Infusion Set. The said infusion set can be connected to all of the insulin pumps that use a luer lock connector, and fulfilling beyond the minimum requirements of subcutaneous drug delivery, the set includes features such as a hidden auto-retractable needle, a 360 degrees connector and a small and compact needle inserter. The core of the set is based on a mechanism of detecting detachment from the user’s body, that upon the aforesaid detachment activates a mechanism that creates a block of the infusion tube, which causes an alert. The aforementioned infusion set was recommended by a consumer guide of the American Diabetes Association.
On May 24th, 2011, the Company has announced that it has entered into an agreement with a Polish distributer in relation to the distribution of the Company's Spring™ Universal Infusion Sets in Poland. On September 28th, 2012, the Company has announced that a dispute has erupted between the Company and the Polish distributer, who has announced the Company that due to malfunctions that have been revealed, as claimed by distributer, in the infusion set, it is not willing to pay in consideration for the products that have been supplied to it, and has requested to return the products to the Company. The sum of the debt owed by the distributer for the products that have been supplied to it is approximately ˆ38,000. The Company is inspecting its rights in relation to the aforesaid difference of opinion with the assistance of its legal counsels. At this stage, the Company is not proceeding with supplying products to the said distributer.
30
On January 17th, 2012 and January 25th, 2012, the Company has announced that Spring INC has entered into non-exclusive agreements with Better Living Now Inc. and Solora Medical Supplies Inc., respectively, for the distribution of the aforementioned infusion sets in the USA. The agreements were signed for a preliminary period of two years, which is to commence upon the first order of the above companies, and after the aforementioned preliminary period, the agreements will be renewed for periods of one year. Each party can terminate the agreements upon a delivery of a prior 3 months' notice. As of the date of this report, the agreement with Soloara has not been realized.
On February 14th, 2012, the Company has announced that Spring Health and Spring-Set have entered into an exclusive distribution agreement with Nordiclnfu Care AB, a Swedish company, for the distribution of the aforementioned infusion set in the Nordic countries. The abovementioned agreement replaced a previous distribution agreement in relation to the Swedish territory and has expanded the distribution network to the entire Nordic area. The agreement was signed for a preliminary period of three years, which is to commence upon the first order of the above company, and after the aforementioned preliminary period, the agreement will be renewed for periods of one year. Each party may terminate the agreement without a cause upon a delivery of a six months' prior notice. It was also agreed that the parties will set annual sale goals.
On February 14th, 2012, the Company has announced that a distribution agreement with EXXE s.r.l, an Italian company, was terminated by the company, effective as of August 15th, 2012.
On May 14th, 2012, the Company has announced that Spring Health and Spring-Set have entered into an original equipment manufacturer (OEM) agreement with Twobiens Ltd., a leading South Korea based supplier of diabetes treatment and drug delivery products, for the worldwide distribution of the said infusion set under Twobiens' private label. The Agreement is for a term of three years and contains annual sales targets and minimum order quantities estimated at a total of US$5 Million. It was also agreed, that Twobiens shall be responsible for all costs and expenses incurred by it in the performance of its duties and responsibilities under the agreement. In addition, the Company and Spring Health retain all of their proprietary and intellectual property rights. On day June 4th, 2012, the Company has announced that the first payment according to the aforementioned agreement has been received, which payment constitutes a third of the adjustment cost for the necessities of the aforementioned supplier, as detailed in the agreement. As of the date of the report, additional payments have not yet been received from the aforementioned supplier.
31
On June 6th, 2012, the Company announced that Spring INC has signed a non-exclusive agreement with a confidential figure, for the distribution of the aforementioned set in the USA. The agreement was signed for a preliminary period of two years, and it shall be automatically renewed for periods of one year, unless it shall be terminated by either party. Each party may terminate the agreement upon a delivery of three months' prior notice.
Further to the Company's filing dated July 5th, 2011, regarding the engagement of Spring Health with Dex Medical Inc., a Canadian distributer, in a letter of intent for the exclusive distribution of the said infusion set in Canada, the Company has announced on November 15th and November 20th, 2012, that the aforementioned distributer has announced the Company it has decided to cease from serving as the exclusive distributer of the said infusion set in Canada, due to a few reasons. The distributer has indicated, that in the event that a new version of the said infusion set will be developed, it will examine it and consider distributing it in Canada. It should be noted, that the volume of sales to the said distributer has been relatively small since its appointment as the Company's distributer.
| i. | Order Backlog |
| As of the date of the financial statements and as of the date of this report, the Company has no order backlog. |
| For the purpose of this subsection, an “order backlog” shall mean obligating orders that have not yet been realized as incomes in the financial statements. |
| j. | Competition |
| 1. | Insulet Corporation |
Insulet is a U.S. company founded in 2000, which manufactures insulin injection systems for diabetics in the U.S. The company manufactures compact systems designed to be carried and used by the diabetics and enabling control of the disease by injecting insulin and monitoring blood sugar levels. The company was founded in 2000 and its headquarters are in Bedford, Massachusetts.
| 2. | Medtronic Inc. |
Medtronic is engaged in manufacturing and supplying medical equipment, surgical devices and medical products for treatment of patients suffering from various chronic diseases. The company's operation is organized in five business divisions, one of which provided products for treating urological disorders, diabetes, gastroenterology and various neurological disorders. The company was established in 1949 and its headquarters are in Minneapolis, Minnesota. Medtronic manufactures insulin infusion systems for diabetics in the U.S.
| 3. | Vascular Solutions Inc. |
Vascular develops solutions for cardiologists and radiologists throughout the world. The company's products include anti-bleeding bandages, compound for prevention of bleeding under the skin, catheter system for removing arterial blood clots, laser kit for treating varicose veins, etc. Additionally, the company provides access products, including a wire for inter-venous access. The company was established in 1996 and is headquartered in Minneapolis, Minnesota.
32
| 4. | Retractable Technologies Inc. |
The company develops, manufactures and markets safety syringes and other medical safety products. The company's products include insulin syringes, antigen syringes, safety syringes for prevention of infection and protection from wounds, etc. The company was established in 1994 and is headquartered in Texas.
| 5. | Kensey Nash Corporation |
The company develops, manufactures and markets technologies, products, equipment, biological substances and medical solutions for the health care industry. Its flagship product is used to seal open perforations in the vascular system during surgical treatments. The company has additional products including: tissue fusion kits and other biometric products for treating orthopedic injuries etc. The company was established in 1984 and its headquarters are in Pennsylvania, USA.
The following table displays the data of the comparison companies which served for tests of the reasonability of the rate of the gross profit, the R&D and operational profit in 2010-2011 and in the first nine months of 2012 (if published):
| Company | Gross profit | R&D cost rate | Operational profit |
| Insulet | 44.2% | 14.5% | (29.1)% |
| Medtronic | 76.3% | 9.3% | 25.0% |
| Vascular | 66.6% | 11.9% | 16.7% |
| Retractable | 35.6% | 2.4% | (12.8)% |
| Kensey Nash | 67.2% | 24.0% | 22.0% |
| Average | 58.0% | 12.4% | 4.3% |
| Median | 66.6% | 11.9% | 16.7% |
The Company's revenue forecast is based on the Company's multi-annual business plan, with the review of its reasonableness according to the public information with respect to the market in which the Company operates, and the discussions of the Company's management.
The Company's forecast revenue is based on its expected sales in the following product lines:
| 1. | SpringTM Zone pump; |
| 2. | Dedicated infusion set for SpringTM Zone pump; |
| 3. | Hybrid patch pump SpringTM Zone; |
| 4. | Dedicated infusion set for the hybrid pump. |
33
Below is the detailed description of the foregoing:
SpringTM Zone pump
The multi-use insulin pump SpringTM Zone is used as the improved next generation for the Company's "Adi" pump. To the Company's best knowledge, SpringTM Zone pump is the only insulin pump that implements the insulin delivery technology known as IntellispringTM. This technology, backed by a continuous monitoring safety system Total Line ControlTM (TLC), is innovative in the areas of continuous monitoring and control of insulin delivery.
In the beginning of 2012, the Company obtained CE standard for marketing of the pump in Europe, however, due to lack of financing sources, the commercialization operations were frozen. The estimation of the Company's management is that the launch of the product to the distributors will commence during the fourth quarter of 2014.
Dedicated Infusion set for SpringTM Zone pump
Along with the SpringTM Zone pump sales, the Company intends to sell to its distributors also the dedicated disposable infusion set which was developed for the pump.
SpringTM Zone Hybrid Patch Pump
As of the date of this report, the Company is at final stages of developing the SpringTM Zone hybrid patch pump. The system is hybrid since it can be carried as patch pump directly on the body or in a traditional manner by connecting it to the body with the infusion set. The hybrid pump offers, in addition to its small dimensions, also a price tag which is cheaper in comparison to the similar products. The Company intends to use this advantage for future penetration into developing markets, such as BRIC countries, with a low rate of medical insurance and sensitivity for products prices.
The first version of the pump received the CE standard. The Company's management expects that it will finalize the development and design of the pump, including receiving regulatory permission in Europe and the U.S. towards the end of 2014. The Company's forecast does not include the sales of the pump in the BRIC countries due to the high uncertainty involved in penetrating these developing markets.
Dedicated Infusion Set for SpringTM Zone Hybrid Patch Pump
Along with the SpringTM Zone hybrid patch pump sales, the Company intends to sell to its distributors the dedicated infusion set developed for the pump.
34
| k. | Production Capacity |
| Since the date of performance of the reorganization in the Company as detailed in Section 1.5 above, the Company has no independent production capacity to any of its products. The Company depends on third parties in relation to production, and thus, it is exposed to provision problems and prices fluctuations. |
The Company has signed an agreement for manufacturing and provision with United Plastic Group, Inc (hereinafter: “UPG”), a subsidiary of Medplast Inc, for the manufacture of SpringTM Universal Infusion Sets, manufacture of the perishable components of SpringTM Zone Pump, when it is available for manufacture, and the SpringTM Zone Hybrid Patch Pump, when it is available for manufacture. |
On March 28th, 2011, UPG has commenced mass production of SpringTM Universal infusion sets. |
In the event that UPG shall not provide the Company with the products for any reason whatsoever, this might cause a reduction in the Company’s sales volume, and thus, the Company’s businesses, financial state and results of operations might be significantly negatively affected. In the event that the Company shall not be able to expand its production capacity in order to answer the market’s demand, the Company’s growth might be limited, and its business state, financial state and the results of the Company’s operations might be significantly negatively affected.
The production lines for manufacturing SpringTM Universal Infusion Set have a production capacity, if they are to be operated, of 180,000-1,365,000 units per year. As of the date of this report, there are no production lines with a proven production capacity of the remainder of the Company's products.
35
| l. | Fixed Assets, Real Estate and Facilities |
As of December 31st, 2011, the address of the registered office of the Company and its subsidiaries (except for Spring INC) was in a facility in the industrial park in Tirat HaCarmel, in which the Group has performed its operation. The aforementioned property’s lease agreement had been executed between Heset-Carmel Ltd. (hereinafter: the “Lessor”) and Spring Health. The aforementioned agreement had set that Spring Health will lease 625 sqm of the area of the aforesaid facility in consideration for a monthly rent of NIS49 per meter for the first year, and afterwards the rent will annually realistically increase in a rate of 2%. In addition, it was set that the aforementioned rent will be added with linkage differentials, and that the basic index is the general index that was published on February 15th, 2008. The aforementioned lease agreement came into force on February 18th, 2009, for a preliminary period of 5 years. On November 20th, 2012, an addendum to the aforementioned lease agreement was executed. The aforementioned addendum has set, that Spring Health will evacuate the property until November 20th, 2012, and that starting the said date and until February 17th, 2014, Spring Health will pay in consideration for the property a rent of NIS20 per meter. It was also agreed, that the Spring Health shall bear the payments for electricity, water and property tax which apply to the property for the period that has ended on November 20th, 2012, and that the Lessor shall act for transmitting the aforementioned bills effective as of the aforementioned date. It was also agreed, that the Lessor shall perform a dismantlement of a screen-wall and evacuation of a CNC machine for Spring Health in consideration for the amount of NIS28,780 with the addition of VAT. |
In addition, as of December 31st, 2011, and as of the date of this report, the Company shares offices in Ramat Gan with Bio-Cell Ltd. (hereinafter: “Bio-cell”) (a company controlled by Mr. Zeev Bronfeld6), Biomedics Incubator Ltd. (hereinafter: “Biomedics”) (Mr. Zeev Bronfeld and Mr. Meni Mor7 belong to the group of holders of the controlling interest of Biomedics) and ATI Ashkelon Technological Industries Ltd. (hereinafter: “ATI”) (a second tier subsidiary of Biomedics). The offices are used by the Company’s management. The aforementioned offices’ area is 240 sqm. The offices were originally leased by the Company, but the Company has assigned the lease agreement to Bio-cell. The offices’ lease expenses, including the maintenance expenses, were evenly divided between the Company, Bio-cell, Biomedics, and ATI, according to the agreement between the aforementioned. The initial period of the aforementioned agreement has ended on July 2009, but the agreement was automatically extended twice in accordance with the terms of the agreement, according to which three automatic extensions of the period of the agreement shall be performed for a period of one year each, unless the lessee shall submit a 120 days' prior notice in writing according to which it does not wish to extend the lease period. |
| 6 | Mr. Zeev Bronfeld was a director of the company until September 12th, 2012. In addition, until September 12th, 2012, Mr. Bronfeld was considered a stakeholder of the Company in virtue of his holdings of the Company’s outstanding capital. |
| 7 | Mr. Meni Mor was the chairman of the Company until September 12th, 2012. In addition, until September 12th, 2012, Mr. Mor was considered a stakeholder of the Company in virtue of his holdings of the Company’s outstanding capital. |
36
On September 19th, 2012, the Company has announced that it had decided to terminate the lease agreement of the offices in Ramat Gan and that it intends to remove the offices of the Company's management to an alternative asset for the purpose of attempting to reduce costs. Accordingly, the Company has announced on September 13th, 2012 on the termination of the expense-sharing agreement between the Company, Bio-cell and Biomedics, regarding to bearing the expenses related to leasing of the aforementioned offices, and in addition, with regard to additional management expenses shared by the aforementioned companies (including bearing the salary of employees that provide services to the aforesaid companies). According to the provisions of the expenses-sharing agreement, the agreement shall be terminated upon three months from the date of delivery of the aforesaid notice. During 2010, 2011 and the first three quarters of 2012, the Company has paid the accumulated amounts of 291 thousand NIS, 211 thousand NIS, and approximately 168 thousand NIS, respectively, for its share of the leasing of the aforementioned offices. |
In addition, as of December 31st, 2011, and as of the date of this report, the Company is a party to an agreement for office services in relation to an office in Fort Lee, New Jersey, which is used by Spring INC. The said agreement is effective as of July 26th, 2011, and its period is extended automatically every three months. The monthly rent for the aforementioned office is US$1,900 per month. |
On September 28th, 2012, the Company has announced that the address of its registered office has changed to mobile post Hefer, Granot, 38100. As of the date od this report, the Company’s operation is performed in Granot. The monthly rent for the aforementioned offices is NIS4,500 and the term of the agreement is one year. |
37
| m. | Research and Development |
As specified above, following the performance of the reorganization in the Company as detailed under Section 1.5 above, the Company has suspended its operation in the fields of research and development until it shall raise an additional capital for this purpose. The company might deal with research and development in the future, but there is no certainty that it shall do so.
During the first half of 2012, the Company’s current development expenses were 1.75 million NIS.
During the third quarter of 2012, the Company has invested 322 thousand NIS in standardization, regulation, and quality control of the Group's patents.
As of the date of this report, the sum of the Company’s obligation to the Chief Scientist is 4.5 million NIS. The aforementioned obligation was reduced by 3.2 million NIS due to a change of the Company’s strategy (see Section 7(z) herein).
| n. | Intangible Assets |
The following is a detailing regarding Spring Health’s submitted patents' applications and patents:
| Title | Application No. | Country | Application Date | Date of Issuance |
| Fluid Drug Deliver Device | 09/991,708 | USA | 11.26.2001 | 5.18.2004 (The patent must be renewed prior to 11.18.2015) |
| Drug Delivery Device and Method | 10/446,811 | USA | 5.29.2003 | 11.6.2007 (The patent must be renewed prior to 5.6.2015) |
| Insulin Pump | 10/792,878 | USA | 3.5.2004 | 5.27.2008 (The patent must be renewed prior to 11.27.2015) |
| Fluid Drug Delivery Device | 2,468,338 | Canada | 11.26.2002 | 1.1.2010 (The patent must be renewed prior to 11.26.2013) |
| Fluid Drug Delivery Device | 02788501.1 | European patent office | 11.26. 2002 | 5.11.2008 The patent must be renewed prior to 11.26.2013) |
38
| Fluid Drug Delivery Device | 162070 | Israel | 11.26. 2002 | 11.8. 2008 (The patent must be renewed prior to 11.26.2016) |
| Drug Delivery Device and Method | 10/558,409 | USA | 11.28. 2005 | 9.20.2011 (The patent must be renewed prior to 3.20.2015) |
| Drug Delivery Device and Method | 2,527,512 | Canada | 5.30.2004 | 8.7.2012 (The patent must be renewed prior to 5.30.2013) |
| Drug Delivery Device and Method | 04735453.5 | European patent office | 5.30. 2004 | - |
| Drug Delivery Device and Method | 172200 | Israel | 5.30. 2004 | 2.19. 2010 (The patent must be renewed prior to 5.30.2014) |
| Drug Delivery Device and Method | 11/379,791 | USA | 4.23.2006 | 12.25.2007 (The patent must be renewed prior to 6.25.2015) |
| Drug Delivery Device and Method | 2009-506040 | Japan | 4.23.2007 | 2.10.2011 (The patent must be renewed prior to 2.10.2014) |
| Drug Delivery Device and Method | 5691/2008 | India | 4.23.2007 | - |
| Drug Delivery Device and Method | 80014446.8 | China | 4.23.2007 | 6.6.2012 (The patent must be renewed prior to 4.23.2013) |
| Drug Delivery Device and Method | 2,640,881 | Canada | 4.23.2007 | 9.8.2009 (The patent must be renewed prior to 4.23.2013) |
39
| Drug Delivery Device and Method | 194417 | Israel | 4.23.2007 | 9.1.2012 (The patent must be renewed prior to 12.1.2012) |
| Drug Delivery Device and Method | 07736245.7 | European patent office | 4.23.2007 | - |
| Drug Delivery System with Wireless Monitor | 12/865,863 | USA | 8.3.2010 | - |
| Drug Delivery System with Wireless Monitor | 207366 | Israel | 2.4.2009 | - |
| Drug Delivery System with Wireless Monitor | 09707503.0 | European patent office | 2.4.2009 | - |
| Drug Delivery System with Wireless Monitor | 10190856.4 | European patent office | 2.4.2009 | - |
| Drug Delivery Device and Method | 2011-022823 | Japan | 2.4.2011 | 9.28.2012 (The patent must be renewed prior to 9.28.2015). |
| Drug Delivery Device and Method | 13/217,303 | USA | 8.25.2011 | - |
40
The following is a detailing regarding Spring Health’s trademarks:
| Title | Application No. | Country | Application Date | Date of Issuance |
| "Spring" cl. 10 | 77/958,614 | USA | 3.15..2010 | 11.22.2011 (The trademark must be renewed prior to 11.22.2021). |
| "Spring" cl. 10 | 8.955.081 | Europe | 3.15.2010 | 2.17.2012 (An official certificate has not yet been received, thus, the trademark’s renewal date is unknown. Generally, a trademark should be renewed every 10 years. |
The following is a detailing regarding Spring-Set’s patents and patents' applications:
| Title | Application No. | Country | Application Date | Date of Issuance |
| Infusion Set Self-Occlusion Mechanism | 12/118,786 | USA | 5.12..2008 | 5.31.2011 (The patent must be renewed until 11.30.2014) |
| Infusion Set Self-Occlusion Mechanism | 08738346.9 | European patent office | 5.11..2008 | - |
| Infusion Set Self-Occlusion Mechanism | 2010-507059 | Japan | 5.11..2008 | - |
| Infusion Set Self-Occlusion Mechanism | 80015175.2 | China | 5.11..2008 | - |
| Infusion Set Self-Occlusion Mechanism | 6621/2009 | India | 5.11..2008 | - |
| Infusion Set Self-Occlusion Mechanism | 200840 | Israel | 5.11..2008 | - |
| Infusion Set Self-Occlusion Mechanism | 09-7019938 | South Korea | 5.11..2008 | - |
| Infusion Set Self-Occlusion Mechanism | 13/116,033 | USA | 5.26..2011 | - |
| Inserter Mechanisms | 13/382,968 | USA | 1.9..2012 | - |
| Inserter Mechanisms | 10796801.8 | European patent office | 7.7.2010 | - |
| Inserter Mechanisms for Drug Delivery Canullas | 13/388,999 | USA | 2.6..2012 | - |
41
The following is a detailing regarding G-Sense’s patents and patents' applications:
| Title | Application No. | Country | Application Date | Date of Issuance |
| Devices for Continuous Measurement of Glucose in Body Fluids | 162761 | Israel | 6.28.2004 | - |
| Devices for Continuous Measurement of Glucose in Body Fluids | 11/569,968 | USA | 12.4.2006 | 11.1.2011 (The patent must be renewed until 5.1.2015). |
| System and Method for Pseudo-Continuous Measurement of Metabolite Concentratoins in a Mammalian Body | 198672 | Israel | 11.8..2007 | - |
| System and Method for Pseudo-Continuous Measurement of Metabolite Concentratoins in a Mammalian Body | 2009-535880 | Japan | 11.8..2007 | - |
42
| System and Method for Pseudo-Continuous Measurement of Metabolite Concentratoins in a Mammalian Body | 07827344.8 | European patent office | 11.8..2007 | - |
| System and Method for Pseudo-Continuous Measurement of Metabolite Concentratoins in a Mammalian Body | 12/513,669 | USA | 5.6..2009 | - |
| Pressurized Reservoir System for Storing and Dispensing Liquids | 13/148,316 | USA | 8.8.2011 | - |
| Metabolite Management System | 12/753,143 | USA | 4.2.2010 | - |
| System and Methods for Implementing Rapid Response Monitoring of Blood Concentrations of Glucose or Other Metabolites | 09758024.5 | European patent office | 6.7..2009 | - |
| Systems and Methods for Implementing Rapid Response Monitoring of Blood Concentrations of Glucose or Other Metabolites | 12/996,419 | USA | 12.6..2010 | - |
| Systems and Methods for Implementing Rapid Response Monitoring of Blood Concentration of a Metabolite | 8657/2010 | India | 6.7..2009 | - |
43
| Systems and Methods for Implementing Rapid Response Monitoring of Blood Concentrations of Glucose or Other Metabolites | 80121363.8 | China | 6.7..2009 | - |
| Pressurized Reservoir System for Storing and Dispensing Liquids | 10709281.9 | European patent office | 2.25..2010 | - |
| Pressurized Reservoir System for Storing and Dispensing Liquids | 80009532.1 | China | 2.25..2010 | - |
| Pressurized Reservoir System for Storing and Dispensing Liquids | 5731/2011 | India | 2.25..2010 | - |
| Pressurized Reservoir System for Storing and Dispensing Liquids | 214237 | Israel | 2.25.2010 | - |
| Pressurized Reservoir System for Storing and Dispensing Liquids | 2011-551156 | Japan | 2.25.2010 | - |
| Pressurized Reservoir System for Storing and Dispensing Liquids | 2011136576 | The Russian federation | 2.25.2010 | - |
| Metabolite Management System | 10720313.5 | European patent office | 4.26..2010 | - |
| Metabolite Management System | 12156033.8 | European patent office | 2.17..2012 | - |
| Metabolite Management System | 80015583.5 | China | 4.6..2010 | - |
| Metabolite Management System | 7954/2011 | India | 4.6..2010 | - |
| Metabolite Management System | 2012502877 | Japan | 4.6..2010 | - |
| Metabolite Management System | 2011140802 | The Russian federation | 4.6..2010 | - |
44
| o. | Human Assets |
As of December 31st, 2011, the companies of the Group had employed 24 employees (5 of them were employed by the Company, one of them was employed by G-Sense, 12 of them were employed by Spring Health, and 6 of them were employed by Spring-Set).
As specified above, on March 2012, the Company has initiated reorganization in the Company, as a part of which the Company’s manpower was reduced.
As of the date of this report, the Company employs one employee – Mr. Hezkiah Tsoory, who serves as the Company’s chief of operations, and is in charge on the Group’s production system and its development operations (it should be noted, that on October 29th, 2012, Mr. Tsoory has announced his resignation, effective as of December 28th, 2012).
The group has sub-contractors in the relation to the fields of quality control, regulation, administration, marketing communications and client support. Additional entities and consultants are operated ad hoc, in most cases as sub-contractors for specific tasks.
In addition, the Company has an active and involved board of directors that directs the Company’s strategy and serves as a partner to the principal decisions (including investments, allocation of resources and prioritizing the Group’s activities).
It should be noted, that Mr. David Dana provides the Company with CFO services and he is responsible for managing the funds of the entire Group.
It should additionally be noted, that Mr. Efraim Argaman was the Company’s CEO until November 17th, 2012, and on October 15th, 2012, the Company has announced that the Company’s board of directors has approved that a general meeting of the Company's shareholders shall be convened, which agenda shall include, among others, the appointment of Mr. David Schwartz, the Company's chairman and the CEO of the Company’s subsidiaries, to act as a substitute of the Company's CEO, effective as of date in which he was appointed as the chairman of the (September 12th, 2012). As of the date of this report, the aforementioned general meeting was not yet convened.
| p. | Raw Materials and Vendors |
The Company does not purchase raw materials for manufacture on its own, but rather finished products, as part of a manufacture agreement it has executed with a third party.
45
| q. | Working Capital |
The Company has positive working capital.
The average of the credit days of the Company’s clients is 75 days; the average of the inventory days of the company is 180 days; and the average of the credit days of the Company’s vendors is 45 days.
In the first nine months of 2012, the Company’s net working capital was 4.1 million NIS.
| r. | Investments |
During 2012, the Company did not perform any investments in the companies held by the Company (as aforesaid, all of the Company’s subsidiaries are fully owned by the Company), or in partnerships and projects which are not any of the Company’s subsidiaries, or investments in other operations.
| s. | Financing |
The sources of the Company’s financing are its equity capital, which its source is in the issuings performed in the stock exchange on January 2012 and June 2012.
As of the date of this report, the Company has no debt in relation to any loans from third parties.
The Company does not have any credit frames in the banks. The Company uses independent financing sources which their source is in fund raisings in the stock exchange.
| t. | Taxation |
The tax rates applying to the Company are the rates applying to all the Israeli companies. As of the date of this report, the Company does not receive any tax benefits.
The Company has accumulative losses for tax purposes. The Company did not create an asset of deferred tax, since the Company does not anticipate, as of the date of this report, that it will cover the aforementioned losses.
The company has closed tax assessments up to 2006.
| u. | Environmental Risks and the Manner of their Handling |
As of the date of this report, the Company does not manufacture, and therefore, is not influenced or expected to be influenced by environmental risks.
46
| v. | Material Agreements |
| 1. | Agreements with Distributors |
| See section 7(h) above. |
| 2. | Management Agreement with Mr. David Schwartz |
On October 15th, 2012, the Company has announced that on October 14th, 2012, it has been resolved by the Company's balance-sheet committee and then by the Company’s board of directors, that subject to the approval of the general meeting of the Company's shareholders for the appointment of Mr. David Schwartz to act as a substitute of the Company's CEO (as specified under Section 7(o) above) as well as the engagement with Mr. Schwartz in the following agreement, the Company will enter into a management agreement with a company owned by Mr. Schwartz, according to which Mr. Schwartz will provide the Company with management services in the course of which he will serve as a Chairman of the board of directors and as the CEO of the Company, according to the terms specified in the Company's filings which were published on October 15th, 2012 and October 29th, 2012. |
| A general meeting for approving the appointment of Mr. Schwartz to act as a substitute of the Company's CEO and for approving the aforementioned agreement has not yet been convened. |
| 3. | Agreement for the provision of CFO Services with Mr. David Dana |
On October 15th, 2012, the Company has announced, that on October 14th, 2012, the Company’s board of directors has approved, following the approval of the balance-sheet committee, that the Company shall enter into an agreement for the provision of CFO services with Mr. David Dana, according to which Mr. Dana will provide the Company with accounting and financial management services that are provided by companies’ CFOs, according to the terms specified in the Company's filing dated October 15th, 2012. |
| 4. | Agreement with Healthios |
| See Section 1.5 above. |
| 5. | Lease Agreements |
| See Section 7(l) above. |
| w. | Collaboration Agreements |
An original equipment manufacturer (OEM) agreement with Twobiens Ltd. (see section 7(h) above).
47
| x. | Insurances |
As of the date of this report, the Company has a directors and officers liability insurance. The liability limit is 20 million dollars. The insurance shall be effective until June 30th, 2013.
It should be noted, that the Company’s shareholders have approved on May 25th, 2010, a framework transaction, according to which the Company shall be entitled to purchase directors and officers liability insurance policies that will provide a coverage for a period which shall not exceed 5 years from the date on which the shareholders of the Company have resolved to approve the framework transaction, subject to an approval of the balance-sheet committee and the Company’s board of directors, and subject to each of the aforesaid insurance policy to be according to the terms set by the Company's shareholders, including, among others, that the liability limit shall not exceed 20 million US dollars with an addition of an amount that equals to 20% of the total sum of the legal expenses which shall be incurred in relation to lawsuits which are covered by the insurance policy.
48
| y. | Legal Proceedings |
As of the date of this report, none of the companies of the Group is a party to a legal proceeding which is material to it.
On May 2011, the Company has entered into an agreement with a Polish distributor for the distribution of SpringTM Universal Infusion Set in Poland (hereinafter in this Subsection: the “Distributor”). The Distributor has obligated to purchase a certain amount of sets per year, and it was agreed that in the event that it shall not purchase that certain amount, it will compensate the Company. After the Distributer has commenced marketing the set, it has applied to the Company claiming that faults were discovered in the set. The Company’s representatives have traveled to Poland and performed a sample release test of the sets, which was defined by the Company. The aforementioned test found the sets to be proper. Despite the aforesaid, the Distributor has continued to restate its claims and the Company kept conducting discussions with it in relation to this matter. The Distributer has delivered to the Company a notification in which it has asked to terminate the agreement with the Company and that the Company shall indemnify it. The Company has delivered to the Distributor a response letter, in which the Company has written that the Distributor should pay to the Company an indemnification as it has not purchased the certain annual amount that it has obligated to purchase as specified in the agreement, as well as due to the failure of Distributer to comply with the provisions of the agreement. The Distributor has not delivered its response to the Company's response letter, and after about two months, the Distributor has delivered to the Company a notice in which he raised the claims which were raised in the notification sent by the Distributor as specified above.
At that stage, the Company has decided to transmit the treatment of the matter to an attorney who is engaged in collection. The representative of the aforementioned attorney in Poland has contacted and discussed with the Distributor, and has reported that the Distributor has rejected the Company’s claim and has threatened to file a counter-lawsuit. As of the date of this report, the debt of the Distributor for the products it was provided with is approximately 38 thousand Euros. With the assistance of its legal consultants, the Company is examining its rights regarding the aforesaid disagreement. At this stage, the Company is no longer providing products to the Distributor.
49
| z. | Goals and Business Strategy |
The Company has commenced to marketing the infusion sets which were developed by it, and it hopes to complete the development of the pumps which were developed by it, which completion is conditional upon its ability to raise financial resources. As of the date of this report, the Company’s cash balance is about to run out, and thus, the Company is interested in raising funds in order to deal with development, and in the event that the Company shall succeed in raising the said funds, the Company shall continue to performing the development operation.
On March 2012, the Company has initiated the performance of reorganization in the Company, designed to significantly reduce the Company’s ongoing operating expenses, including by means of a staff reduction and a voluntary reduction in the compensation of functionaries of the Company8. The implementation of said initiative has commenced on the end of March 2012, and has continued during the second quarter of 2012. During the aforesaid period, most of the Company’s employees were dismissed. In addition, starting from September 12th, 2012, most of the Company’s directors and executive management employees were replaced.
| aa. | Development Outlook for the Coming Year |
During the coming year, the Company intends to focus on raising funds in various possible manners, such as raising in the stock market, raising from investors and selling assets of intellectual property, as much as will be possible. In the event that the Company shall raise funds as above specified, and the Company’s financial status shall allow it – the Company shall use the funds for the purpose of continuation of the completion of the development as well as the operating of commercialization efforts in relation to the products which were developed by the Company.
As reported by the Company on November 8th, 2012, the Company is negotiating regarding the option to sell a part of its intellectual property for the purpose of raising funds which will be used for the continuation of its operations.
| bb. | Information regarding an Exceptional Transformation in the Company’s Businesses |
On the period of this report, several events have occurred, which events might influence on the Company’s capability to commercialize its products:
| 1. | The managers of the Company (the CEO, CFO and chief of operations) have resigned, what might make difficult the realization of the Company's plans in relation to marketing and commercialization of the products which were developed by the Company. |
| 8 | It should be noted, that the chief executive officer, chief financial officer and the chief operating officer have cancelled the voluntary reduction about two months following their agreement to it. |
50
| 2. | The Company’s surplus balances have significantly reduced and the Company does not have enough funds to allow it to invest in commercialization and marketing of its products, and as long as the Company does not raise the said funds, it will not be able to promote such efforts. |
| 3. | Several distributors of the Company have notified to the Company that faults were discovered in the Company’s products. Moreover, they have expressed concern as the executive management of the Company has resigned, and as a result of the aforementioned as well, the Company’s efforts for marketing its products have been negatively affected. |
| cc. | Other Outlooks and Estimations regarding the Corporation’s Businesses |
The Company’s efforts to penetrate its products to the market in the planned time table have not been successful. As a result, the Company’s management estimates that there is a possibility that the sales of the Company's products in the two coming years shall not achieve the planned goal and shall be lower than the expected. On the other hand, the Company’s board of directors uses its efforts to raise funds for the Company from various sources. In the event that the Company shall succeed in raising capital as aforesaid, the Company shall act to increase its efforts to penetrating its products to the market, what may significantly increase the Company’s sales. The Company is examining every possibility to improve its marketing capability, including by collaboration with similar companies in the sector.
51
[Translated from Hebrew]
The Board of Directors' report regarding the corporation's state of affairs
For the third quarter, ended September 30, 2012
The company's board of director is proud to present the board of directors' report regarding the company's state of affairs (consolidated) for September 30, 2012 and periods of nine and three months ended on that date ("Date of the Report" and "The Interim Period") in accordance with the Securities Authority's regulations (periodical and immediate reports) 5730 – 1970 ("The Regulations") ("The Board of Directors' Report for the Interim Period")
The board of directors' report for the interim period is attached to the interim consolidated financial reports ("The Interim Consolidated Financial Reports") under the assumption that the aforesaid interim consolidated financial reports are available to the reader.
This report should be read in the context of the company's financial statements for December 31, 2011, the company's business description, its risks and the analysis of the reports as presented in the Form 20F submitted on April 30, 2012 ("The Annual Report").
| 2a. | Summary of the corporation and its environment D Medical Industries Inc. (Hereinafter: "The Company") was incorporated on 22.7.1992 as a company limited by shares. On 29.8.1994 the company became public and started trading on the Tel Aviv Stock Exchange. On 4.8.2012 the company's initial public offering was performed on the NASDAQ Capital Market in the US and the company started reporting according to Chapter 5c of the Securities Law, 5728 – 1968 (report by a corporation with dual listing). On 26.7.2012 the company was delisted from trading in the NASDAQ after its equity dropped below $2.5 million. Following this, the company's shares started trading over the counter in the US, in addition to the trade on the Tel Aviv Stock Exchange. The company is assuming reporting duties in Israel under Chapter 6 of the Securities Law, 5728 – 1968 starting with the current report, side by side with the reporting duty according to the US Security Exchange Act of 1934, applicable to a foreign issuer whose securities are held by the public (Foreign Private Issuer). |
| · | On September 12, 2012, a general assembly was held during which 4 directors and an external director were appointed and 3 directors, who up until that day were the controlling block in the company, resigned. |
| · | On September 19, 2012, the company announced the resignation of its CEO Mr. Efraim Argaman. To the best of the company's knowledge Mr. Argaman's resignation does not involve circumstances that should be brought to the attention of the company's shareholders. |
| · | On September 27, 2012, the company announced the resignation of its CFO Mr. Amir Luberman. To the best of the company's knowledge Mr. Luberman's resignation does not involve circumstances that should be brought to the attention of the company's shareholders. |
| · | On September 27, 2012, the company announced the resignation of a Director - Mr. Barry Geensberg. To the best of the company's knowledge Mr. Geensberg's resignation does not involve circumstances that should be brought to the attention of the company's shareholders. |
| · | On September 28, 2012, the company announced the resignation of a Director- Mr. Avraham Ayalon. To the best of the company's knowledge Mr. Ayalon's resignation does not involve circumstances that should be brought to the attention of the company's shareholders. |
| · | On September 28, 2012, the company announced that a conflict had arisen between the company and a distributor of the company's products in Poland. The distributor announced that following flaws he claims to have been discovered in the infusion set he refuses to pay for the products provided to him and demands that the products be reclaimed by the company. The distributor's debt is ˆ38,000. The company is reviewing its rights regarding this disagreement. At this point, the company has ceased providing products to the distributor. |
As of the date of this report, the company's activity involves investing and managing the companies:
| · | Spring Health Solutions Inc. – Spring Health is engaged, together with Spring Set and Spring Inc. in the manufacturing and marketing of the infusion set, known under the trade name SpringTM Universal Infusion Set. |
| · | G-Sense Inc – is the owner of intellectual property and knowhow in the field of continuous glucose blood level measurement. |
| · | Spring Set Health Solutions Inc – was engaged, until 30.6.12, in R&D, manufacturing and marketing of biodegradable infusion kits. |
| · | For more details, see Chapter 1 – the corporation's business description for the company's annual report for 2012 |
| 2b. | financial position The current assets as of September 30, 2012 amounted to approximately NIS 6,480 thousands compared to approximately NIS 14,979 thousands as of September 30, 2011 and approximately NIS 8,537 thousands as of December 31, 2011. |
2
The cash and cash equivalents balances as of September 30, 2012 amounted to approximately NIS 3,528 thousands compared to approximately NIS 9,690 thousands as of September 30, 2011 and approximately NIS 5,048 thousands as of December 31, 2011. A decrease in the cash and cash equivalents balances resulted mostly from the consumption of cash for the current activity over the proceeds from issuing shares and warrants during 2012. The company and the consolidated companies manage the cash surpluses solidly, in shekel and foreign currency deposits. The balance of short-term deposits as of September 30, 2012 amounted to a total of approximately NIS 301 thousands compared to approximately NIS 301 thousands as of September 30, 2011 and to approximately NIS 303 thousands as of December 31, 2011. The balance of the deposits serves as collateral for a bank guarantee for a lease in a subsidiary and for credit card line of credit. The trade receivables balance as of September 30, 2012 amounted to approximately NIS 13 thousands compared to approximately NIS 452 thousands as of September 30, 2011 and approximately NIS 251 thousands as of December 31, 2011. The other receivables balance as of September 30, 2012 amounted to approximately NIS 635 thousands compared to approximately NIS 2,905 thousands as of September 30, 2011 and approximately NIS 1,226 thousands as of December 31, 2011. The drop is due to a decrease in the amounts receivable from the Chief Scientist Office and a decrease in prepaid expenses. The fixed assets held for sale balance as of September 30, 2012 amounted to approximately NIS 218 thousands compared to NIS 0 as of September 30 and December 31, 2011. The designation of fixed assets for sale was the result of the a reduction in the company's activity and the move to the company's new premises. The inventory balance as of September 30, 2012 amounted to approximately NIS 1,785 thousands compared to approximately NIS 2,441 thousands as of September 30, 2011 and approximately NIS 1,709 thousands as of December 31, 2011. The inventory balance is comprised mostly of finished goods and work in process inventory. The balance of non-current assets as of September 30, 2012 amounted to approximately NIS 2,263 thousands compared to approximately NIS 14,475 thousands as of September 30, 2011 and approximately NIS 7,095 thousands as of December 31, 2011. The fixed assets balance net of accumulated depreciation as of September 30, 2012 amounted to approximately NIS 1,834 thousands compared to approximately NIS 3,810 thousands as of September 30, 2011 and approximately NIS 4,068 thousands as of December 31, 2011. The decrease was caused by the recognition of impairment and write down of part of the fixed assets to the realization value as a result of the reduction in the company's activity and the move to the company's new premisses. |
3
The intangible assets balance net of accumulated amortization as of September 30, 2012 amounted to approximately NIS 89 thousands compared to approximately NIS 10,098 thousands as of September 30, 2011 and approximately NIS 2,521 thousands as of December 31, 2011. The intangible assets balance is comprised of goodwill created by investing in subsidiaries, investing in knowledge and patents and the acquisition of software. As of December 31, 2011 and as of September 30, 2012, the goodwill and knowhow were written down based on the valuation performed on the subsidiary's activity. The long-term loans and receivables balance as of September 30, 2012 amounted to approximately NIS 340 thousands compared to approximately NIS 567 thousands as of September 30, 2011 and approximately NIS 506 thousands as of December 31, 2011. The balance is comprised of long-term prepaid expenses and deposits for leased vehicles. The drop is mostly due to the return of vehicles by employees who terminated their employment. The current liabilities balance as of September 30, 2012 amounted to approximately NIS 2,372 thousands compared to NIS 4,928 thousands as of September 30, 2011 and approximately NIS 3,941 thousands as of December 31, 2011. The trade payables and service providers as of September 30, 2012 amounted to approximately NIS 380 thousands compared to approximately NIS 2,332 thousands as of September 30, 2011 and approximately NIS 1,537 thousands as of December 31, 2011. The other payable and credit balance as of September 30, 2012 amounted to approximately NIS 1,992 thousands compared to approximately NIS 2,596 thousands as of September 30, 2011 and approximately NIS 2,404 thousands as of December 31, 2011. The decrease is mostly due to the reduction in amounts payable to employees and institutions due to wages. The non-current liabilities balance as of September 30, 2012 amounted to approximately NIS 5,352 thousands compared to approximately NIS 6,049 thousands as of September 30, 2011 and approximately NIS 7,347 thousands as of December 31, 2011. The provision of royalties to the chief scientist balance as of September 30, 2012 amounted to approximately NIS 4,487 thousands compared to approximately NIS 6,001 thousands as of September 30, 2011 and approximately NIS 6,691 thousands as of December 31, 2011. The decrease in the liability is due to a delay of the revenues expected from selling products developed with the government's participation in way of grants. The royalties provision to the chief scientist is linked to the dollar and bear annual interest at the LIBOR rate |
4
The leasing and rent liabilities balance as of September 30, 2012 amounted to approximately NIS 865 thousands compared to NIS 0 as of September 30, 2011 and approximately NIS 575 thousands as of December 31, 2011. The leasing liability is due to the obligation to pay for the manufacturing lines in China. The termination of employer-employee liability net balance as of September 30, 2012 amounted to approximately NIS 0 thousand compared to approximately NIS 48 thousands as of September 30, 2011 and approximately NIS 81 thousands as of December 31, 2011. The equity as of September 30, 2012 amounted to approximately NIS 1,019 thousands compared to approximately NIS 18,477 thousands as of September 30, 2011 and approximately NIS 4,344 thousands as of December 31, 2011. The decrease in equity is mostly due to losses during the period after net proceeds from issuing shares and warrants |
| 2c. | Results of operations The results of operations in 2012 were characterized by a decrease in expenses as a result of the strategic change the company performed during the second and third quarters of 2012, which was intended to cut down the group's current expenses as reported on March 22, 2012 (2012-02-075687). Revenues during the nine and three months that ended on September 30, 2012 amounted to approximately NIS 609 thousands and approximately NIS 13 thousands , respectively, compared to approximately NIS 1,145 thousands and approximately NIS 305 thousands in the corresponding periods last year, respectively, and revenues of approximately NIS 1,506 thousands in the year that ended on December 31, 2011. Gross loss in the nine and three months that ended on September 30, 2012 amounted to approximately NIS 2,152 thousands and approximately NIS 758 thousands, respectively, compared to approximately NIS 7,257 thousands and approximately NIS 2,072 thousands in the corresponding periods last year, respectively, and a gross loss of NIS 8,710 thousands in the year that ended on December 31, 2011. The loss was due to low manufacturing volumes and as a result of high overhead costs and high depreciation rates in manufacturing. Research and development net expenses in the nine and three months that ended on September 30, 2012 amounted to approximately NIS 2,074 thousands and approximately NIS 322 thousands, respectively, compared to approximately NIS 12,904 thousands and approximately NIS 4,958 thousands in the corresponding periods last year, respectively, and net research and development expenses of NIS 15,396 thousands in the year that ended on December 31, 2011. Sales and marketing expenses in the nine and three months that ended on September 30, 2012 amounted to approximately NIS 1,482 thousands and approximately NIS 209 thousands, respectively, compared to approximately NIS 2,660 thousands and approximately NIS 946 thousands in the corresponding periods last year, respectively, and sales and marketing expenses of approximately NIS 3,435 thousands in the year that ended on December 31, 2011. |
5
General and administrative expenses in the nine and three months that ended on September 30, 2012 amounted to approximately NIS 5,356 thousands and approximately NIS 1,119 thousands, respectively, compared to approximately NIS 9,154 thousands and approximately NIS 3,017 thousands in the corresponding periods last year, respectively, and management and general expenses of approximately NIS 12 thousands in the year that ended on December 31, 2011. The loss from the impairment of intangible assets in the nine and three months that ended on September 30, 2012 amounted to approximately NIS 2,213 thousands compared to NIS 0 in the corresponding periods last year and approximately NIS 7,479 thousands in the year that ended on December 31, 2011. The provision for the impairment of fixed assets in the nine and three months that ended on September 30, 2012 amounted to approximately NIS 1,393 thousands compared to NIS 0 in the corresponding periods last year and in the year that ended on December 31, 2011. The provision is due to the impairment of assets that are not in use to their value in the market. Other profits in the nine and three months that ended on September 30, 2012 amounted to approximately NIS 3,018 thousands and approximately NIS 3,324 thousands, respectively, compared to approximately NIS 255 thousands and approximately NIS 27 thousands in the corresponding periods last year, respectively, and other profits of approximately NIS 573 thousands in the end that ended on December 31, 2011. Most of the profit is due to a delay in the expected revenues from the sale of products developed with the government's participation in way of grants, and the decrease in the royalties' liability to the chief scientist, as a result. Net financing expenses in the nine and three months that ended on September 30, 2012 amounted to approximately NIS 932 thousands and approximately NIS 272 thousands, respectively, compared to approximately NIS 604 thousands and approximately NIS 576 thousands in the corresponding periods last year, respectively, and net financing expenses of approximately NIS 1,058 thousands in the year that ended on December 31, 2012. Profit (loss) from a discontinued operation in the nine and three months that ended on December 30, 2012 amounted to NIS 0 compared to a loss of approximately NIS 64 thousands and a profit of approximately NIS 3,619 thousands in the corresponding periods last year, respectively, and a loss from a discontinued operation of approximately NIS 64 thousands in the year that ended on December 31, 2011. The discontinued operation is attributed to the sale of Next-Gen Biomed Inc in 2011. |
6
Loss in the nine and three months that ended on September 30, 2012 amounted to approximately NIS 12,584 thousands and approximately NIS 2,962 thousands , respectively, compared to approximately NIS 32,388 thousands and approximately NIS 7,923 thousands in the corresponding periods last year, respectively, and a loss of approximately NIS 48,305 thousands in the year that ended on December 31, 2011. |
| 2d. | Finance resources The group's activity (the company and subsidiaries held by the company) is funded mostly by funds raised in private and public allocations. The negative cash flow from operating activities in the nine and three months that ended on September 30, 2012 amounted to approximately NIS 11,372 thousands and approximately NIS 2,919 thousands, respectively, compared to approximately NIS 30,649 thousands and approximately NIS 10,435 thousands in the corresponding periods last year, respectively, and a negative cash flow from operating activity of approximately NIS 3036,709 thousands in the year that ended on December 2011. The decrease in the negative flow from operating activity was due to the strategic change performed by the group during the second and third quarters of 2012. The cash flows from investment activities in the nine and three months that ended on September 30, 2012 amounted to approximately NIS 41 thousands and approximately NIS 18 thousands , respectively, compared to approximately NIS 5,095 thousands and a negative flow from investments of approximately NIS 1,983 thousands in the corresponding periods last year, respectively. The cash flow from investments in the year that ended on December 31, 2011 amounted to approximately NIS 5,109 thousands. The positive cash flow in 2011 was mostly due to the repayment of short-term deposits and the proceeds from the sale of Next-gen Biomed Inc. The cash flow from finance activities in the nine and three months that ended on September 30, 2012, amounted to approximately NIS 9,755 thousands and approximately NIS 1,608 thousands, respectively, compared to approximately NIS 457 thousands and NIS 0 in the corresponding periods last year, respectively, and the cash flow from finance activities in the year that ended on December 31, 2011 amounted to approximately NIS 1,326 thousands. The cash flow from finance activities is due to private and public issuing of shares and warrants, net of issuance costs. |
| 2e. | Report regarding exposure to market risks and their management Investing in the company's securities involves risks that are typical to investments in start-up companies in the field of medical equipment and therefore, the investment contains a risk of losing the company's funds within a period of time that might be short. |
7
2e.1. | The market's risks that the company is exposed to are below: Interest rates, exchange rates and capital market risks The group invests the cash surpluses at its disposal in unlinked shekel deposits and dollar deposits so that gain or drops in the interest rate and fluctuations in the capital market and in the foreign currency market can have an effect of increase or decrease the company's finance income. The company recognized finance income from the revaluation of foreign currency bank balances of NIS 56thousands in the nine months that ended on September 30, 2012 and finance expenses from to the revaluation of foreign currency bank balances of NIS 9, thousands in the three months that ended on that date. |
2e.2. | Company's policy for managing Market Risks The group invests its cash surpluses in unlinked shekel deposits and dollar deposits. The group does not use derivatives for hedging purposes or for non-hedge purposes. |
2e.3. | Corporation Control Mechanisms As of the submission of this report, Accountant David Dana serves as the company's CFO. Mr. Dana is in charge of the company's market risks and is subordinated to the company's executive committee and board of directors. |
2e.4. | Holding in Derivatives During the report period the group didn't hold any derivatives. |
| 2f. | Linkage Bases Below are details about the linkage bases balance in consolidate on September 30, 2012 and on December 31, 2011 (in thousands of NIS): |
| September 30, 2012 | ||||||||||||||||||||||||
| In euro | In dollar | Index | Non-monetary | |||||||||||||||||||||
| Or linked to it | Or linked to it | Linked | Unlinked | assets | Total | |||||||||||||||||||
| Thousands of NIS | ||||||||||||||||||||||||
| Consolidated: | ||||||||||||||||||||||||
| Assets: | ||||||||||||||||||||||||
| Cash and cash equivalent | 14 | 575 | 2,939 | 3,528 | ||||||||||||||||||||
| Short-term deposits | 301 | 301 | ||||||||||||||||||||||
| Trade receivables | 13 | 13 | ||||||||||||||||||||||
| Other receivables | 698 | 105 | 530 | 635 | ||||||||||||||||||||
| Fixed assets held for sale | 218 | 218 | ||||||||||||||||||||||
| Inventory | 1,785 | 1,785 | ||||||||||||||||||||||
| Fixed assets | 1,834 | 1,834 | ||||||||||||||||||||||
| Intangible assets | 89 | 89 | ||||||||||||||||||||||
| Long-term debt balances | 7 | 36 | 297 | 340 | ||||||||||||||||||||
| 27 | 1,280 | 3,381 | 3,381 | 4,055 | 8,743 | |||||||||||||||||||
| Liabilities: | ||||||||||||||||||||||||
| Trade payables and service providers | 17 | 212 | 151 | 380 | ||||||||||||||||||||
| Other payables | 876 | 256 | 860 | 1,992 | ||||||||||||||||||||
| Provision for Royalties to Chief Scientist | 4,487 | 4,487 | ||||||||||||||||||||||
| Liabilities for leasing and rent | 772 | 93 | 865 | |||||||||||||||||||||
| Equity | 1,019 | 1,019 | ||||||||||||||||||||||
| 17 | 6,347 | 351 | 1,011 | 1,019 | 8,743 | |||||||||||||||||||
| Total net | 10 | (5,067 | ) | (351 | ) | 2,370 | 3,036 | |||||||||||||||||
8
Below are details about the linkage bases balance in consolidate on September 30, 2012 and on December 31, 2011 (in thousands of NIS)
| December 31, 2011 | |||||||||||||||||||||||||
In euro Or linked to it | In dollar Or linked to it | In dollar Or linked to it | Index Linked | Unlinked | Non-monetary assets | Total | |||||||||||||||||||
| Thousands of NIS | |||||||||||||||||||||||||
| Consolidated: | |||||||||||||||||||||||||
| Assets: | |||||||||||||||||||||||||
| Cash and cash equivalent | 524 | 1,921 | 1,921 | 2,603 | 5,048 | ||||||||||||||||||||
| Short-term deposits | 303 | 303 | |||||||||||||||||||||||
| Trade receivables | 251 | ||||||||||||||||||||||||
| Other receivables | 251 | 246 | 246 | 565 | 415 | 1,226 | |||||||||||||||||||
| Inventory | 1,709 | 1,709 | |||||||||||||||||||||||
| Fixed assets | 4,068 | 4,068 | |||||||||||||||||||||||
| Intangible assets | 2,521 | 2,521 | |||||||||||||||||||||||
| Long-term debt balances | 127 | 379 | 506 | ||||||||||||||||||||||
| 775 | 2,167 | 2,167 | 3,598 | 9,092 | 15,632 | ||||||||||||||||||||
| Liabilities: | |||||||||||||||||||||||||
| Trade payables and service providers | 33 | 983 | 983 | 521 | 1,537 | ||||||||||||||||||||
| Other payables | 31 | 504 | 504 | 1,869 | 2,404 | ||||||||||||||||||||
| Provision for Royalties to Chief Scientist | 6,691 | 6,691 | 6,691 | ||||||||||||||||||||||
| Liabilities of leasing and rent | 575 | 575 | 575 | ||||||||||||||||||||||
Liabilities due to termination of employer-employee relations, net | 81 | 81 | |||||||||||||||||||||||
| Equity | 4,344 | 4,344 | |||||||||||||||||||||||
| 64 | 8,753 | 8,753 | 2,471 | 4,344 | 15,632 | ||||||||||||||||||||
| Total net | 711 | (6,586 | ) | (6,586 | ) | 1,127 | 4,748 | ||||||||||||||||||
9
Sensitivity analysis for Financial instruments as of September 30, 2012
The following are the company's financial instruments on September 30, 2012, which are sensitive to the market risks. Liabilities that are sensitive to various market risks were presented several times according to the sensitivity analysis of each risk.
Sensitivity to changes in euro/NIS exchange rate (in thousands of NIS)
The sensitivity analysis was based on the exchange rate on September 30, 2012; the exchange rate on this date was NIS 5.0649 for 1 euro.
| Change in fair value | Fair value | Changes in fair value | ||||||||||||||||||
| 10% | 5% | Exchange rate NIS 5.0649 = 1 euro | -5% | -10% | ||||||||||||||||
| Cash and cash equivalent | 1 | 1 | 14 | (1 | ) | (1 | ) | |||||||||||||
| Trade receivables | 1 | 1 | 13 | (1 | ) | (1 | ) | |||||||||||||
| Trade payables and service providers | (1 | ) | (1 | ) | (17 | ) | 1 | 1 | ||||||||||||
| Total | 1 | 1 | 10 | (1 | ) | (1 | ) | |||||||||||||
Sensitivity to changes in dollar/NIS exchange rate (in thousands of NIS)
The sensitivity analysis was based on the exchange rate on September 30, 2012; the exchange rate on this date was NIS 3.912 for 1 dollar.
| Change in fair value | Fair value | Changes in fair value | ||||||||||||||||||
| 10% | 5% | Exchange rate NIS 3.912 = 1 dollar | -5% | -10% | ||||||||||||||||
| Cash and cash equivalent | 58 | 29 | 575 | (29 | ) | (58 | ) | |||||||||||||
| Receivables and debt balances | 69 | 35 | 698 | (35 | ) | (69 | ) | |||||||||||||
| Long-term debt balances | 1 | 0 | 7 | 0 | (1 | ) | ||||||||||||||
| Trade payables and service providers | (21 | ) | (11 | ) | (212 | ) | 11 | 21 | ||||||||||||
| Other payables | (88 | ) | (44 | ) | (876 | ) | 44 | 88 | ||||||||||||
| Provision for royalties to chief scientist | (449 | ) | (223 | ) | (4,487 | ) | 223 | 449 | ||||||||||||
| Leasing and rent liabilities | (77 | ) | (39 | ) | (772 | ) | 39 | 77 | ||||||||||||
| Total | (507 | ) | (253 | ) | (5,067 | ) | 281 | 507 | ||||||||||||
10
Sensitivity to changes in consumer price index (in thousands of NIS)
The sensitivity analysis was performed with a rate of 2% and 4% of change to the consumer price index.
| Change in fair value | Fair value | Changes in fair value | ||||||||||||||||||
| 4% | 2% | -2% | -4% | |||||||||||||||||
| Other payables | (10 | ) | (5 | ) | (256 | ) | 5 | 10 | ||||||||||||
| Leasing and rent liabilities | (4 | ) | (2 | ) | (93 | ) | 2 | 4 | ||||||||||||
| Total | (14 | ) | (7 | ) | (351 | ) | 7 | 14 | ||||||||||||
Sensitivity to changes in LIBOR interest (in thousands of NIS)
The sensitivity analysis was based on the interest rate on September 30, 2012; the interest rate on this date was 0.973%.
| Change in fair value | Fair value | Changes in fair value | ||||||||||||||||||
50% interest rate increase | 25% interest rate increase | 25% interest rate drop | 50% interest rate drop | |||||||||||||||||
| Liability to chief scientist (in current liabilities) | (0 | ) | 0 | (29 | ) | 0 | 0 | |||||||||||||
| Provision for royalties to chief scientist | (156 | ) | (72 | ) | (4,487 | ) | 91 | 170 | ||||||||||||
| Total | (156 | ) | (72 | ) | (4,516 | ) | 91 | 170 | ||||||||||||
Sensitivity to changes in Company's Capitalization rate (in thousands of NIS)
The company's capitalization rate used in the sensitivity analysis is 15%.
| Change in fair value | Fair value | Changes in fair value | ||||||||||||||||||
50% increase in capitalization rate | 25% increase in capitalization rate | 25% drop in capitalization rate | 50% drop in capitalization rate | |||||||||||||||||
| Liabilitys to chief scientist (in current liabilities) | 1 | 0 | (29 | ) | 0 | (1 | ) | |||||||||||||
| Provision for royalties to chief scientist | 1,827 | 1,059 | (4,487 | ) | (1,486 | ) | (3,605 | ) | ||||||||||||
| Total | 1,828 | 1,059 | (4,516 | ) | (1,486 | ) | (3,606 | ) | ||||||||||||
11
| 2G. | Critical Accounting Estimates |
The preparation of the company's financial statements is based on estimates and judgments that are constantly reviewed, and are based on past experience and other factors, including expectations regarding future events, which are considered reasonable, in light of the existing circumstances. In doing so the group draws up estimates and assumptions regarding the future. By nature, it is rare for the generated accounting estimates to be identical to actual results . The estimates and assumptions, which hold a significant risk for material adjustments in the book values of assets and liabilities, during the next fiscal year, are detailed below.
| 1) | Estimate of Goodwill impairment |
The group evaluates if there has been an impairment of goodwill, in accordance with the accounting policy presented in Note 2 to the financial statements. The assessment is performed on an annual basis or if there is a fundamental change in the company's activity and/or plans. The Recoverable amounts of cash generating units were determined based on value in use e calculations. These calculations require the use of estimates. Additionally, the company provided sales and costs forecasts for Spring Health Solutions Co. for the purpose of performing its valuation on December 31, 2011 and September 30, 2012. In these forecasts the company used estimates and assumptions.
| 2) | Development Expenses |
Development costs. The capitalization of costs is based on the management's judgment that there is technological and financial feasibility, a situation that exists mostly when the product development project has reached a specific milestone, or when the group is engaged in a deal of selling the knowledge produced by the development. In order to determine the amounts to be capitalized, management makes assumptions regarding the anticipated cash flows that will be generated from the assets in the future, the discount rate that will be used in the capitalization and the expected benefits period.
According to the group's management's opinion as of September 30, 2012, the aforementioned conditions have not existed, and therefore no development costs were capitalized. If the group's management had estimated that the aforementioned conditions were met, the capitalization of development costs would have reduced the group's loss.
| 3) | Loans/grants from Chief Scientist |
On the date of initial recognition the grant is credited to the profit and loss statement. The group's management is assessing whether there is a "more likely than not" probability for the payment of royalties to the chief scientist.
In the opinion of the group's management as of September 30, 2012, the existence of a liability towards the chief scientist is likely and therefore a liability of NIS 4,516 thousands was recognized accordingly in the financial statements.
12
2H. | Disclosure with respect to Corporate Internal Auditor The review committee discussed the internal auditor's report regarding issuance costs on the NASDAQ and approved the internal auditor's plan for 2013 at a scope of 60 working hours on regulatory issues such as transactions with related parties. |
2I. | Donations Policy The group has no policy regarding donations. The group donated insignificant and unsubstantial amounts to third party institutions |
| 2J. | Directors with accounting and financial expertise In accordance with Company Regulation (terms and trials for a director with expertise in accounting and finances and a director with professional qualifications), 5766 – 2005, the company's board of directors decided according to Article 92(a)(12) of the Company Law, 5759 – 1999, that considering the company's volume of activity, the field of its activity, and the lack of any special complexity in its activity, the appropriate minimal number of directors with expertise in accounting and finances will be one director. As of the date of this report Mr. Yakov Bar Lev and Mrs. Galia Malka (external director) have expertise in accounting and finances. |
2K. | Disclosure Regarding Exclusive Signatories The company has no exclusive signatories as defined by the Securities Authority regulations of January 3, 2008. |
2L. | Approval procedure of financial statements Under the procedure of approving the company's financial reports by the board of directors, a draft of the financial statements, a draft of the board of directors' report and a draft of the updates for the periodical, quarterly and annual reports are sent a few days before the scheduled meeting for approving the reports to the members of the committee for reviewing the financial reports.. The company's CFO answers the questions and provides clarifications regarding the reports to anyone who asks. During the committee's meeting, the company's financial results, financial position and cash flows are reviewed and data regarding the company's activity is presented and compared to previous periods. A discussion is held during which the company's management responds to the directors' questions. During the discussion, in which the company's auditor is also present, he is asked about issues relating to the financial statements. After this discussion, there is a vote for the approval of the financial statements, the board of directors' report and the periodical report. After the approval, the committee recommends to the board of directors, which convenes several days after the committee for reviewing the financial reports is convened, for the approval of these reports. During the board of directors' meeting, the CFO reviews the fundamental issues on the reports and provides clarifications at the directors' request. After this discussion, a vote is held for the approval of the financial statements, the board of directors' report and the periodical report. |
13
2M. | Subsequent events |
| 2M.1. | In accordance with the changes in the company's shareholder composition, the most significant shareholding in the company relates to Mr. Shimon Cohen and Mr. Yakov Bar Lev, who have an oral agreement to vote together, and who together hold 15.71% of the company as of the date of the approval of these financial statements. |
| 2M.2. | On October 14, 2012, the audit committee decided, subject to the approval of the general assembly of the company's shareholders, to appoint Mr. David Schwartz, chairman of the company's board of directors, to serve as the company's CEO (in effect from the date of his appointment as chairman of the company's board of directors 12.9.2012), and additionally, approved the company's engagement with the company controlled by Mr. Schwartz in a management agreement according to which Mr. Schwartz will provide the company with management services under which he will serve as the company's chairman of the board and CEO. In accordance with the management agreement, Mr. Schwartz will receive NIS 47,500 a month linked to the index known on the day of the engagement, as well as a onetime sum of NIS 30,000 for the work performed and expenses spent during the three month period prior to the engagement. In addition to the aforementioned compensation, the company will provide Mr. Schwartz, for no cost, realizable options for ordinary shares of the company at a rate of 9% of the company's issued share capital. On October 28, 2012 Mr. Schwartz declared that he waives the options that the company intends to allocate to him. |
| 2M.3. | On October 15, 2012, the company announced the appointment of Mr. David Dana as the company's CFO at the scope of three days a week. In exchange for his services, which he will provide through a management company, the company will pay the management company a sum of NIS 15,000 a month, as well as refund of direct expenses that his job entails. Mr. Dana will be allowed to be absent 16 days a year without derogating the management company's right to receive the monthly payment. |
14
| 2M.4. | On October 30, 2012, the company announced the resignation of Mr. Hizkiya Tzuri, VP of Operations, in effect starting December 26, 2012. To the best of the company's knowledge, Mr. Tzuri's resignation does not involve circumstances that should be brought to the attention of the company's shareholders. |
| 2M.5. | On November 8, 2012, the company announced that it was negotiating with a foreign international company, which deals with developing and manufacturing equipment used for treating diabetes, over the sale of the intellectual property owned by Spring Health Solutions Inc and Spring-Set Health Solutions Inc, which is linked in a number of aspects to Universal Infusion Set SpringTM. The full terms of the deal have not been decided yet. For further details see the company's reports from November 15 and from November 20, reference: 2012-01-280107; reference: 2012-01-284070. |
The company's board of directors thanks the staff and management for their contribution to the group.
Date: November 28, 2012
| D Medical Industries Inc | ||
| Signatory Names | Position | Signature |
| David Schwartz | Chairman of the board | |
| David Dana | Chief Financial Officer |
15
[Translated From Hebrew]
D MEDICAL INDUSTRIES LTD.
INTERIM REPORT
(unaudited)
September 30, 2012
D MEDICAL INDUSTRIES LTD.
INTERIM REPORT
(unaudited)
September 30, 2012
TABLE OF CONTENTS
| Page | |
| 2 | |
| CONDENSED CONSOLIDATED INTERIM FINANCIAL STATEMENTS IN NEW ISRAELI SHEKELS (NIS): | |
| 3 | |
| 4-5 | |
| 6-8 | |
| 9-11 | |
| 12-16 |

Auditors' review report to the shareholders of Dee Medical Industries Ltd.
Introduction
We have reviewed the accompanying financial information of D Medical Industries Ltd and its subsidiaries ("the Group"), which comprises the condensed consolidated statement of financial position as of September 30, 2012 and the related condensed consolidated statements of comprehensive income (loss), changes in equity and cash flows for the periods of nine and three months then ended. The Company's board of directors and management are responsible for the preparation and presentation of interim financial information for this interim period in accordance with IAS 34, "Interim Financial Reporting" and are responsible for the preparation of this interim financial information in accordance with Chapter D of the Securities Regulations (Periodic and Immediate Reports), 1970. Our responsibility is to express a conclusion on this interim financial information based on our review.
Scope of review
We conducted our review in accordance with Review Standard 1 of the Institute of Certified Public Accountants in Israel, "Review of Interim Financial Information Performed by the Independent Auditor of the Entity." A review of interim financial information consists of making inquiries, primarily of persons responsible for financial and accounting matters, and applying analytical and other review procedures. A review is substantially less in scope than an audit conducted in accordance with generally accepted auditing standards in Israel and consequently does not enable us to obtain assurance that we would become aware of all significant matters that might be identified in an audit. Accordingly, we do not express an audit opinion.
Conclusion
Based on our review, nothing has come to our attention that causes us to believe that the accompanying interim financial information is not prepared, in all material respects, in accordance with IAS 34.
In addition to the abovementioned, based on our review, nothing has come to our attention that causes us to believe that the accompanying interim financial information does not comply, in all material respects, with the disclosure requirements of Chapter D of the Securities Regulations (Periodic and Immediate Reports), 1970.
Without qualifying our opinion, we draw attention to the matter discussed in Note 1B to the financial statements which indicates, inter-alia, that there are substantial doubts about the company's ability to continue to exist as going concern. The attached financial statements do not include any adjustments as a result of this uncertainty.
Haifa, 28 November 2012 | Kessleman & Kesselman Certified Public Accountants Member of Price Waterhouse Coopers International Limited |
Kesselman & Kesselman, 1 Nathanson Street, Haifa 33034, Israel, P.O Box 33984, Haifa 31339
Telephone: +972 -4- 8605000, Fax:+972 -4- 8605001, www.pwc.co.il
2
D MEDICAL INDUSTRIES LTD
.
CONDENSED CONSOLIDATED STATEMENTS OF FINANCIAL POSITION
September 30, 2012 | September 30, 2011 | December 31, 2011 | ||||||||||
(unaudited) | (audited) | |||||||||||
NIS in thousands | ||||||||||||
| Assets | ||||||||||||
| CURRENT ASSETS: | ||||||||||||
| Cash and cash equivalents | 3,528 | 9,690 | 5,048 | |||||||||
| Short term deposits | 301 | 301 | 303 | |||||||||
| Trade and other receivables: | ||||||||||||
| Trade accounts receivable | 13 | 452 | 251 | |||||||||
| Other | 635 | 2,095 | 1,226 | |||||||||
| Inventory | 1,785 | 2,441 | 1,709 | |||||||||
| Fixed Assets held for sale | 218 | - | - | |||||||||
| T o t a l current assets | 6,480 | 14,979 | 8,537 | |||||||||
| NON-CURRENT ASSETS : | ||||||||||||
| Fixed Assets | 1,834 | 3,810 | 4,068 | |||||||||
| Intangible assets | 89 | 10,098 | 2,521 | |||||||||
| Long-term receivable and loans | 340 | 567 | 506 | |||||||||
| T o t a l non-current assets | 2,263 | 14,475 | 7,095 | |||||||||
| T o t a l assets | 8,743 | 29,454 | 15,632 | |||||||||
| Liabilities and equity | ||||||||||||
| CURRENT LIABILITIES: | ||||||||||||
| Other payables and credit balances: | ||||||||||||
| Trade payable and service providers | 380 | 2,332 | 1,537 | |||||||||
| Other | 1,992 | 2,596 | 2,404 | |||||||||
| 2,372 | 4,928 | 3,941 | ||||||||||
| NON-CURRENT LIABILITIES: | ||||||||||||
| Provision for royalties to the Chief Scientist | 4,487 | 6,001 | 6,691 | |||||||||
| Liability due to capital leasing and rent fees | 865 | - | 575 | |||||||||
| Liability for severance pay - net | - | 48 | 81 | |||||||||
T o t a l non-current liabilities | 5,352 | 6,049 | 7,347 | |||||||||
T o t a l liabilities | 7,724 | 10,977 | 11,288 | |||||||||
| EQUITY: | ||||||||||||
Equity attributable to shareholders: | ||||||||||||
| Share capital | 4,041 | 2,563 | 2,673 | |||||||||
| Share premium and other reserves | 239,553 | 228,987 | 232,640 | |||||||||
| Warrants and equity portion of convertible loans | 978 | 3,048 | - | |||||||||
| Accumulated loss | (243,553 | ) | (215,052 | ) | (230,969 | ) | ||||||
| 1,019 | 19,546 | 4,344 | ||||||||||
| Equity attributable to Non-controlling interest | - | (1,069 | ) | - | ||||||||
T o t a l equity | 1,019 | 18,477 | 4,344 | |||||||||
T o t a l liabilities and equity | 8,743 | 29,454 | 15,632 | |||||||||
David Schwartz | Yaacov Bar-Lev | Dana David | ||
| Chairman of the Board | Member of the Board | Chief Financial Officer |
Date of approval of the financial statements by the Board of Directors: November 28, 2012.
The notes are an integral part of these consolidated financial statements
3
D MEDICAL INDUSTRIES LTD.
CONDENSED CONSOLIDATED STATEMENTS OF COMPREHENSIVE LOSS
(Continued) - 1
| Nine months ended | Three months ended | Year ended | ||||||||||||||||||
September 30 | September 30 | December 31, | ||||||||||||||||||
2012 | 2011 | 2012 | 2011 | 2011 | ||||||||||||||||
(Unaudited) | (Audited) | |||||||||||||||||||
NIS in thousands | ||||||||||||||||||||
| CONTINUING OPERATIONS: | ||||||||||||||||||||
| Sales-net | 609 | 1,145 | 13 | 305 | 1,506 | |||||||||||||||
| Cost of sales | 2,761 | 8,402 | 771 | 2,377 | 10,216 | |||||||||||||||
| Gross loss | (2,152 | ) | (7,257 | ) | (758 | ) | (2,072 | ) | (8,710 | ) | ||||||||||
| Research and development expenses - net | 2,074 | 12,904 | 322 | 4,958 | 15,396 | |||||||||||||||
| Selling and marketing expenses | 1,482 | 2,660 | 209 | 946 | 3,435 | |||||||||||||||
| General and administrative expenses | 5,356 | 9,154 | 1,119 | 3,017 | 12,736 | |||||||||||||||
| Loss from impairment of intangible assets | 2,213 | - | 2,213 | - | 7,479 | |||||||||||||||
| Provision of fixed assets impairment | 1,393 | - | 1,393 | - | - | |||||||||||||||
| Other income - net | (3,018 | ) | (255 | ) | (3,324 | ) | (27 | ) | (573 | ) | ||||||||||
| Operating loss | (11,652 | ) | (31,720 | ) | (2,690 | ) | (10,966 | ) | (47,183 | ) | ||||||||||
| Finance income | (125 | ) | (455 | ) | (15 | ) | (231 | ) | (484 | ) | ||||||||||
| Finance costs | 1,057 | 1,059 | 287 | 807 | 1,542 | |||||||||||||||
| Finance costs - net | (932 | ) | (604 | ) | (272 | ) | (576 | ) | (1,058 | ) | ||||||||||
| LOSS FOR THE PERIOD FROM CONTINUED OPERATIONS | (12,584 | ) | (32,324 | ) | (2,962 | ) | (11,542 | ) | (48,241 | ) | ||||||||||
| DISCONTINUED OPERATION | ||||||||||||||||||||
| Profit (Loss) for the period from discontinued operation | - | (64 | ) | - | 3,619 | (64 | ) | |||||||||||||
| LOSS AND TOTAL COMPREHENSIVE LOSS FOR THE PERIOD | (12,584 | ) | (32,388 | ) | (2,962 | ) | (7,923 | ) | (48,305 | ) | ||||||||||
The notes are an integral part of these consolidated financial statements
4
D MEDICAL INDUSTRIES LTD.
CONDENSED CONSOLIDATED STATEMENTS OF COMPREHENSIVE LOSS
(Continued) - 2
| Nine months ended | Three months ended | Year ended | ||||||||||||||||||
September 30 | September 30 | December 31, | ||||||||||||||||||
2012 | 2011 | 2012 | 2011 | 2011 | ||||||||||||||||
(Unaudited) | (Audited) | |||||||||||||||||||
NIS in thousands | ||||||||||||||||||||
| LOSS ATTRIBUTABLE TO: | ||||||||||||||||||||
| Shareholders of the parent: | ||||||||||||||||||||
| From continued operations | (12,584 | ) | (31,285 | ) | (2,962 | ) | (11,209 | ) | (47,202 | ) | ||||||||||
| From discontinued operations | - | 2,401 | - | 3,619 | 2,401 | |||||||||||||||
| (12,584 | ) | (28,884 | ) | (2,962 | ) | (7,590 | ) | (44,801 | ) | |||||||||||
| Non-controlling interest: | ||||||||||||||||||||
| From continued operations | - | (1,039 | ) | - | (333 | ) | (1,039 | ) | ||||||||||||
| From discontinued operations | - | (2,465 | ) | - | - | (2,465 | ) | |||||||||||||
| - | (3,504 | ) | - | (333 | ) | (3,504 | ) | |||||||||||||
| (12,584 | ) | (32,388 | ) | (2,962 | ) | (7,923 | ) | (48,305 | ) | |||||||||||
| LOSS PER SHARE FROM CONTINUED AND DISCONTINUED OPERATIONS ATTRIBUTABLE TO THE | ||||||||||||||||||||
| SHAREHOLDERS OF THE PARENT: | ||||||||||||||||||||
| N I S | ||||||||||||||||||||
| From continued operations | 1.13 | 4.01 | 0.24 | 1.43 | 6.03 | |||||||||||||||
| From discontinued operations | - | (0.31 | ) | - | (0.46 | ) | (0.31 | ) | ||||||||||||
| 1.13 | 3.70 | 0.24 | 0.97 | 5.72 | ||||||||||||||||
The notes are an integral part of these consolidated financial statements
5
D MEDICAL INDUSTRIES LTD.
CONDENSED CONSOLIDATED STATEMENTS OF CHANGES IN EQUITY
For period of 9 months and 3 months ended at September 30, 2012
Attributable to owners of the parent | ||||||||||||||||||||
Share capital | Share Premium and other reserves | Warrants | Accumulated loss | Total | ||||||||||||||||
NIS in thousands | ||||||||||||||||||||
BALANCE AS OF JANUARY 1, 2012 (audited) | 2,673 | 232,640 | - | (230,969 | ) | 4,344 | ||||||||||||||
CHANGES DURING THE 9 MONTH PERIOD ENDED SEPTEMBER 30, 2012: (unaudited) | ||||||||||||||||||||
| Proceeds from Issuance of shares and warrants (series 4), net | 1,366 | *7,411 | *978 | - | 9,755 | |||||||||||||||
| Proceeds from exercise of options | 2 | (2 | ) | - | - | - | ||||||||||||||
| Share based payment related to stock options granted to employees and service providers: | ||||||||||||||||||||
| of the parent | - | (285 | ) | - | - | (285 | ) | |||||||||||||
| of subsidiary | - | (211 | ) | - | - | (211 | ) | |||||||||||||
| Comprehensive loss for the period | - | - | - | (12,584 | ) | (12,584 | ) | |||||||||||||
BALANCE AS OF SEPTEMBER 30, 2012(unaudited) | 4,041 | 239,553 | 978 | (243,553 | ) | 1,019 | ||||||||||||||
BALANCE AS OF JULY 1, 2012(unaudited) | 4,039 | 240,246 | 978 | (240,591 | ) | 4,672 | ||||||||||||||
CHANGES DURING THE 3 MONTH PERIOD ENDED SEPTEMBER 30, 2012: (unaudited) | ||||||||||||||||||||
| Proceeds from exercise of options | 2 | (2 | ) | - | - | - | ||||||||||||||
| Share based payment related to stock options granted to employees and service providers: | ||||||||||||||||||||
| of the parent | - | (703 | ) | - | - | (703 | ) | |||||||||||||
| of subsidiary | - | 12 | - | - | 12 | |||||||||||||||
| Comprehensive loss for the period | - | - | - | (2,962 | ) | (2,962 | ) | |||||||||||||
BALANCE AS OF SEPTEMBER 30, 2012(unaudited) | 4,041 | 239,553 | 978 | (243,553 | ) | 1,019 | ||||||||||||||
* Net of issuance costs in the amount of NIS 1,317 thousands.
The notes are an integral part of these consolidated financial statements.
6
D MEDICAL INDUSTRIES LTD.
CONDENSED CONSOLIDATED STATEMENTS OF CHANGES IN EQUITY
For period of 9 months and 3 months ended at September 30, 2012 (Continued)
Attributable to owners of the parent | ||||||||||||||||||||||||||||
| Warrants | ||||||||||||||||||||||||||||
Share capital | Share Premium and other reserves | and equity Portion of convertible Debt to shares | Accumulated losses | Total | Non-controlling interest | Total equity | ||||||||||||||||||||||
NIS in thousands | NIS in thousands | |||||||||||||||||||||||||||
BALANCE AT JANUARY 1, 2011 (audited) | 2,549 | 227,015 | 3,048 | (186,168 | ) | 46,444 | 2,944 | 49,388 | ||||||||||||||||||||
CHANGES DURING THE 9 MONTH PERIOD ENDED SEPTEMBER 30, 2011: (unaudited) | ||||||||||||||||||||||||||||
| Proceeds from exercise of options | 2 | (2 | ) | - | - | - | - | - | ||||||||||||||||||||
| Changes in ownership interests in subsidiaries that do not result in a loss of control | - | (346 | ) | - | - | (346 | ) | 346 | - | |||||||||||||||||||
| Selling of subsidiary | - | - | - | - | - | (1,043 | ) | (1,043 | ) | |||||||||||||||||||
| Non-controlling interest share in the benefit resulting from loans granted to subsidiaries | - | (254 | ) | - | - | (254 | ) | 254 | - | |||||||||||||||||||
| Share based payment related to restricted shares granted to service providers | 12 | 445 | - | - | 457 | - | 457 | |||||||||||||||||||||
| Share based payment related to stock options granted to employees and service providers: | ||||||||||||||||||||||||||||
| of the parent | - | 1,728 | - | - | 1,728 | - | 1,728 | |||||||||||||||||||||
| of subsidiary | - | 401 | - | - | 401 | (67 | ) | 334 | ||||||||||||||||||||
| Comprehensive loss for the period | - | - | - | (28,884 | ) | (28,884 | ) | (3,504 | ) | (32,388 | ) | |||||||||||||||||
BALANCE AT SEPTEMBER 30, 2011 (unaudited) | 2,563 | 228,987 | 3,048 | (215,052 | ) | 19,546 | (1,069 | ) | 18,477 | |||||||||||||||||||
BALANCE AT JULY 1, 2011 (unaudited) | 2,563 | 228,423 | 3,048 | (207,462 | ) | 26,572 | 306 | 26,878 | ||||||||||||||||||||
CHANGES DURING THE 3 MONTH PERIOD ENDED SEPTEMBER 30, 2011: (unaudited) | ||||||||||||||||||||||||||||
| Selling of subsidiary | - | - | - | - | - | (1,043 | ) | (1,043 | ) | |||||||||||||||||||
| Share based payment related to stock options granted to employees and service providers: | ||||||||||||||||||||||||||||
| of the parent | - | 498 | - | - | 498 | - | 498 | |||||||||||||||||||||
| of subsidiary | - | 66 | - | - | 66 | 1 | 67 | |||||||||||||||||||||
| Comprehensive loss for the period | - | - | - | (7,590 | ) | (7,590 | ) | (333 | ) | (7,923 | ) | |||||||||||||||||
BALANCE AT SEPTEMBER 30, 2011 (unaudited) | 2,563 | 228,987 | 3,048 | (215,052 | ) | 19,546 | (1,069 | ) | 18,477 | |||||||||||||||||||
The notes are an integral part of these consolidated financial statements.
7
D MEDICAL INDUSTRIES LTD.
CONDENSED CONSOLIDATED STATEMENTS OF CHANGES IN EQUITY
For period of 9 months and 3 months ended at September 30, 2012 (Continued)
Attributable to owners of the parent | ||||||||||||||||||||||||||||
Share capital | Share premium and other reserves | Warrants and equity portion of convertible debt | Accumulated losses | Total | Non- controlling interest | Total equity | ||||||||||||||||||||||
NIS in thousands | NIS in thousands | |||||||||||||||||||||||||||
BALANCE AT JANUARY 1, 2011 (audited) | 2,549 | 227,015 | 3,048 | (186,168 | ) | 46,444 | 2,944 | 49,388 | ||||||||||||||||||||
| CHANGES DURING 2011: | ||||||||||||||||||||||||||||
| Proceeds from issuance of shares, Net | 87 | *1,240 | - | - | 1,327 | - | 1,327 | |||||||||||||||||||||
| Proceeds from exercise of options | 2 | (2 | ) | - | - | - | - | - | ||||||||||||||||||||
| Changes in ownership interests in subsidiaries that do not result in a loss of control | 23 | (1,516 | ) | - | - | (1,493 | ) | 1,493 | - | |||||||||||||||||||
| Selling of subsidiary | - | - | - | - | - | (1,120 | ) | (1,120 | ) | |||||||||||||||||||
| Non-controlling interest share in the benefit resulting from loans granted to subsidiaries | - | (254 | ) | - | - | (254 | ) | 254 | - | |||||||||||||||||||
| Expiration of warrants and convertible loan | - | 3,048 | (3,048 | ) | - | - | - | - | ||||||||||||||||||||
| Share based payment related to restricted shares granted to service providers | 12 | 445 | - | - | 457 | - | 457 | |||||||||||||||||||||
| Share based payment related to stock options granted to employees and service providers: | ||||||||||||||||||||||||||||
| of the parent | - | 2,073 | - | - | 2,073 | - | 2,073 | |||||||||||||||||||||
| of subsidiary | - | 591 | - | - | 591 | (67 | ) | 524 | ||||||||||||||||||||
| Comprehensive loss for the year | - | - | - | (44,801 | ) | (44,801 | ) | (3,504 | ) | (48,305 | ) | |||||||||||||||||
BALANCE AT DECEMBER 31, 2011 (audited) | 2,673 | 232,640 | - | (230,969 | ) | 4,344 | - | 4,344 | ||||||||||||||||||||
* Net of issuance costs in the amount of NIS 567 Thousands.
The notes are an integral part of these consolidated financial statements.
8
D MEDICAL INDUSTRIES LTD.
CONDENSED CONSOLIDATED STATEMENTS OF CASH FLOWS
For period of 9 months and 3 months ended at September 30, 2012
| Nine months ended | Three months ended | Year ended | ||||||||||||||||||
September 30 | September 30 | December 31, | ||||||||||||||||||
2012 | 2011 | 2012 | 2011 | 2011 | ||||||||||||||||
(Unaudited) | (Audited) | |||||||||||||||||||
NIS in thousands | ||||||||||||||||||||
| CASH FLOWS FROM OPERATING ACTIVITIES: | ||||||||||||||||||||
| Net cash used in operations (A') | (11,483 | ) | (30,777 | ) | (2,928 | ) | (10,348 | ) | (37,001 | ) | ||||||||||
| Income tax paid | 60 | (5 | ) | (2 | ) | 3 | (16 | ) | ||||||||||||
| Interest received | 51 | 133 | 11 | (90 | ) | 308 | ||||||||||||||
| Net cash used in operating activities (B') | (11,372 | ) | (30,649 | ) | (2,919 | ) | (10,435 | ) | (36,709 | ) | ||||||||||
| CASH FLOWS FROM INVESTING ACTIVITIES: | ||||||||||||||||||||
| Repayment of (investment in) short term deposits | - | 3,468 | - | (33 | ) | 3,466 | ||||||||||||||
| Proceeds from realization of investment in subsidiary (C') | - | 2,339 | - | 2,339 | 2,339 | |||||||||||||||
| Proceeds from realization of fixed assets | 41 | - | 18 | - | - | |||||||||||||||
| Purchase of fixed assets | - | (583 | ) | - | (302 | ) | (567 | ) | ||||||||||||
| Purchase of intangible assets | - | (129 | ) | - | (21 | ) | (129 | ) | ||||||||||||
| Net cash used in investing activities | 41 | 5,095 | 18 | 1,983 | 5,109 | |||||||||||||||
| CASH FLOWS FROM FINANCING ACTIVITIES: | ||||||||||||||||||||
| Proceeds from issuance of ordinary shares, net of | ||||||||||||||||||||
| issuance costs | 8,777 | - | 1,608 | - | 1,327 | |||||||||||||||
| Proceeds from issuance of warrants, net of issuance costs | 978 | - | - | - | - | |||||||||||||||
| Net cash provided by financing activities (B') | 9,755 | - | 1,608 | - | 1,327 | |||||||||||||||
| NET INCREASE (DECREASE) IN CASH AND | ||||||||||||||||||||
| CASH EQUIVALENTS | (1,576 | ) | (25,554 | ) | (1,293 | ) | (8,452 | ) | (30,273 | ) | ||||||||||
| Cash and cash equivalents at beginning of the period | 5,048 | 35,085 | 4,830 | *17,976 | 35,085 | |||||||||||||||
| Exchange gains (loss) on cash and cash equivalents | 56 | 159 | (9 | ) | 166 | 236 | ||||||||||||||
| CASH AND CASH EQUIVALENTS AT END OF PERIOD | 3,528 | 9,690 | 3,528 | 9,690 | 5,048 | |||||||||||||||
* Including cash and cash equivalent in the amount of NIS 3,050 thousands relating to discontinued operation that were classified and represented at June 30, 2011 as assets held for sale.
The notes are an integral part of these consolidated financial statements
9
D MEDICAL INDUSTRIES LTD.
CONDENSED CONSOLIDATED CASH FLOWS STATEMENTS (continued)
For period of 9 months and 3 months ended at September 30, 2012 (Continued)
APPENDIX
| Nine months ended | Three months ended | Year ended | ||||||||||||||||||
September 30 | September 30 | December 31, | ||||||||||||||||||
2012 | 2011 | 2012 | 2011 | 2011 | ||||||||||||||||
(Unaudited) | (Audited) | |||||||||||||||||||
| A. NET CASH USED IN OPERATIONS: | ||||||||||||||||||||
| Loss and comprehensive loss for the period | (12,584 | ) | (32,388 | ) | (2,962 | ) | (7,923 | ) | (48,305 | ) | ||||||||||
| Adjustments due to: | ||||||||||||||||||||
| Profit from realization of investment in subsidiary(discontinued operation) | - | (3,619 | ) | - | (3,619 | ) | (3,619 | ) | ||||||||||||
| Impairment of assets | 3,553 | 3,245 | 3,378 | - | 10,724 | |||||||||||||||
| Depreciation and amortization | 866 | 859 | 220 | 298 | 1,190 | |||||||||||||||
| Capital loss | (11 | ) | 13 | (1 | ) | 13 | - | |||||||||||||
| Interest received | (51 | ) | (133 | ) | (12 | ) | 90 | (308 | ) | |||||||||||
| Exchange (gain) loss on cash and bank credit | (56 | ) | (159 | ) | 9 | (222 | ) | (236 | ) | |||||||||||
| Liabilities for severance pay - net | (81 | ) | (30 | ) | (43 | ) | (5 | ) | 5 | |||||||||||
| Warrants granted to employees in subsidiary | - | (67 | ) | - | 1 | (67 | ) | |||||||||||||
| Warrants granted to employees, trade payables and service providers in parent company and subsidiaries | (496 | ) | 2,586 | (691 | ) | 791 | 3,121 | |||||||||||||
| (8,860 | ) | (29,693 | ) | (102 | ) | (10,576 | ) | (37,495 | ) | |||||||||||
| Changes in operating asset and liability items: | ||||||||||||||||||||
| Decrease (increase) in other receivables and debit balances: | ||||||||||||||||||||
| Trade accounts receivable | 238 | (130 | ) | 19 | (88 | ) | 71 | |||||||||||||
| Other | 531 | (249 | ) | (101 | ) | (531 | ) | 688 | ||||||||||||
| Increase in inventory | (76 | ) | 53 | 51 | (413 | ) | 785 | |||||||||||||
| Increase (decrease) in other payables and credit balances: | ||||||||||||||||||||
| Trade accounts payable and service providers | (1,157 | ) | (1,359 | ) | (279 | ) | 582 | (2,154 | ) | |||||||||||
| Other | (601 | ) | (564 | ) | (140 | ) | (49 | ) | (602 | ) | ||||||||||
| Increase (decrease) in liabilities with respect to royalties to the Israeli | ||||||||||||||||||||
| Office of Chief Scientist | (2,279 | ) | 1,039 | (2,842 | ) | 724 | 1,431 | |||||||||||||
| Increase in liability to capital leasing | 555 | - | 437 | - | 88 | |||||||||||||||
| Decrease (Increase) in non-current financial assets | 166 | 126 | 29 | 3 | 187 | |||||||||||||||
| (2,623 | ) | (1,084 | ) | (2,826 | ) | 228 | 494 | |||||||||||||
| (11,483 | ) | (30,777 | ) | (2,928 | ) | (10,348 | ) | (37,001 | ) | |||||||||||
The notes are an integral part of these consolidated financial statements
10
D MEDICAL INDUSTRIES LTD.
CONDENSED CONSOLIDATED STATEMENTS OF CASH FLOWS
For period of 9 months and 3 months ended at September 30, 2012 (Continued)
| Nine months ended | Three months ended | Year ended | ||||||||||||||||||
September 30 | September 30 | December 31, | ||||||||||||||||||
2012 | 2011 | 2012 | 2011 | 2011 | ||||||||||||||||
(Unaudited) | (Audited) | |||||||||||||||||||
B. Cash Flows from discontinued operating: | ||||||||||||||||||||
| Net cash used in operating activities | - | (4,611 | ) | - | - | (4,611 | ) | |||||||||||||
| Net cash provided by financing activities | - | 2,339 | - | - | 2,339 | |||||||||||||||
| C. Proceeds from realization of investment in subsidiary | ||||||||||||||||||||
| Operating capital (less cash and cash equivalents) | - | (168 | ) | - | (168 | ) | (168 | ) | ||||||||||||
| Fixed assets, net | - | 8 | - | 8 | 8 | |||||||||||||||
| Intangible assets, net | - | (1,120 | ) | - | (1,120 | ) | (1,120 | ) | ||||||||||||
| Assets, net | - | (1,280 | ) | - | (1,280 | ) | (1,280 | ) | ||||||||||||
| Profit from sale | - | 3,619 | - | 3,619 | 3,619 | |||||||||||||||
| Total proceeds | - | 2,339 | - | 2,339 | 2,339 | |||||||||||||||
The notes are an integral part of these consolidated financial statements
11
D MEDICAL INDUSTRIES LTD.
NOTES TO CONDENSED CONSOLIDATED FINANCIAL STATEMENTS
As of September 30, 2012 (unaudited)
Note 1 – General
| a. | D Medical Instruments Ltd. (“company” or “parent company”) and its subsidiaries (together: “the group”) hold intellectual property and knowledge in the area of diabetes treatments and drug delivery. The group owns certain proprietary technology, including among other things, IV set identification and disconnection mechanism, IntellispringTM insulin delivery technology and continuous metering of blood glucose levels registered as a patent. Until 3 August 2011, the group operated in two lines of business, insulin pumps and accessories and pain reducing products. The latter was managed by its subsidiary NextGen Biomed Ltd., the holding in which was sold on 30 June 2011 and completed on 3 August 2011. Results of the former subsidiary’s operations are presented in these financial statements as a discontinued operation. The company is a limited public company associated and registered in Israel. The registered address of company headquarters is Granot Industrial Zone, Emek Hefer, Israel. Since August 2010, after an initial public offering in the USA, company shares have been traded on NASDAQ under the symbol ”DMED” and at the same time in the Tel Aviv Stock Exchange (“TASE”). On 26 July 2012, trade in company shares on NASDAQ was suspended and the company applied to the U.S. Securities & Exchange Commission requesting its shares be removed from registration on NASDAQ (also see note 4b). Company shares and options that were issued in Israel during 2012 (see 4A below) continue to be traded on the Tel Aviv Stock Exchange. Accordingly, the company has stopped applying the alleviations in reporting according to the Israeli Securities Act provided to dual companies whose securities are registered for trade both on NASDAQ and the Tel Aviv Stock Exchange. |
| b. | On 30 September 2012, the group’s working capital totals NIS 4,108 thousand and its equity totals NIS 1,019 thousand (on 31 December 2011 – NIS 4,596 thousand and NIS 4,344 thousand, respectively) (all the above is related to the owners of the parent company). Total accumulated losses from operations amount to NIS 243,553 thousands. The loss for the 9-month period ending on 30 September 2012 totals NIS 12,584 thousand and the company also had negative cash flows from ongoing operations totaling NIS 11,372 thousand (in 2011 – NIS 48,306 thousand and NIS 36,148 thousand, respectively). In the course of 2011, the company took steps to cut costs and raise additional funds for its operations through a shelf prospectus submitted in the USA and Israel. During January and June 2012, the company raised a total of NIS 10 million by way of shares and options issued to the public, using the Israeli shelf prospectus report (also see note 4A). On 21 March 2012, due to the current and expected market conditions, company board of directors decided to initiate a strategic structure change, designed to focus its business, maximize and realize the value of the company’s technology and intellectual property by licensing or selling this technology (or part of it) to a third party, and at the same time search for opportunities to sell products (within an OEM or another framework) in high volumes. Accordingly and following this decision, the company significantly decreased its ongoing operational costs during the following months, reduced compensation by agreement, including the chairman of the board, and downsized its board of directors. Following these measures, company development activities slowed down. |
12
D MEDICAL INDUSTRIES LTD.
NOTES TO CONDENSED CONSOLIDATED FINANCIAL STATEMENTS
As of September 30, 2012 (unaudited)
Note 1 – General
Due to changes in the composition of company shareholders and its board of directors, in September 2012 the company CEO and its CFO gave notice and in October 2012 the VP of operations also handed in his notice (also see notes 5B). The company and its subsidiaries continue to support its current customer base and continue to employ the customer support staff. Regarding the changes in company management after 30 September 2012, see note 5B, C. The management believes that given the current market conditions and the company’s financial situation described above, there are significant doubts as to the company’s ability to continue its operation as a going concern. Upon formulation of a business plan, the management intends to raise additional funds from external investors in early 2013, to enable the group to continue its operation until the group is able to generate profits from the sale and development of products or from intellectual property. The company’s consolidated financial statements do not include adjustments to the amounts or classification of assets and liabilities that may be required should the company cease to exist as a going concern. |
Note 2 - Basis of preparation of the interim consolidated financial statements:
| a. | The condensed interim consolidated financial information of the group as of 30 September 2012 and the interim periods of 9 and 3 months ending on that date (hereinafter: “financial information for interim period”) have been prepared in accordance with International Accounting Standard 34 – "Interim Financial Reporting" (herein- "IAS 34"). |
| b. | The condensed interim financial statements are prepared in accordance with the disclosure requirements of Chapter D of the Israeli Securities Regulations (Periodic and Immediate Reports), 1970. The financial information for the interim period does not include all the information and disclosures required in annual financial statements. One should read the financial information for the interim period together with the annual financial statements for 2011 and the accompanying notes, that were prepared in accordance with International Financial Reporting Standards (hereinafter: “IFRS"). Financial information for the interim period has been reviewed but not audited. |
| c. | Estimates: The preparation of interim financial statements requires management to make judgments, estimates and assumptions that affect the application of accounting policies and the reported amounts of assets and liabilities, income and expense. Actual results may differ from these estimates. In preparing these condensed consolidated interim financial statements, the company applied accounting policies, presentation rules and calculation methods identical to those applied in preparing its annual financial statements for 31 December 2011 and the year then ended. |
13
D MEDICAL INDUSTRIES LTD.
NOTES TO CONDENSED CONSOLIDATED FINANCIAL STATEMENTS
As of September 30, 2012 (unaudited)
Note 3 – Accounting policy principles
The significant accounting policies and calculation methods used to prepare the financial information for the interim period are consistent with those applied in the annual financial statements for 2011. New standards and amendments to existing standards that are not yet effective and the company has chosen not to early adopt, were specified in the group’s annual financial statements for 2011. |
Note 4 – Significant events during the reporting period
| a. | Shares and warrants (series 4) issued to the Israeli public: During the reporting period, the Company made a number of public offerings, under the framework of a shelf prospectus that was published in Israel on 12 September 2011. |
Date | Ordinary shares | Warrants (series 4) | Total proceed (NIS thousands) | |||||||||
| 16/11/2012 | 1,495,000 | - | 5,397 | |||||||||
| 31/11/2012 | 1,150,000 | 1,150,000 | 3,887 | |||||||||
| 29/6/2012 | 1,625,820 | - | 1,788 | |||||||||
| Total | 4,270,820 | 1,150,000 | 11,072 | |||||||||
| Less-issuance expenses | - | - | 1,317 | |||||||||
| Net Proceed | - | - | 9,755 | |||||||||
Each warrant (series 4) may be exercised to one share of NIS 0.32 par value, at an exercise price of NIS 4, for a 4-year period from issuance date. The total proceed received in the January 31, 2012 issuance was allocated between the shares and the warrants according to the relative fair value of these capital instruments on the date of issue. The fair value of the shares was determined according to the base price per share at the time of issue and the fair value of options was determined according to the Black and Scholes pricing model. The above company’s shelf prospectus is no longer valid. On 27 September 2012 the board of directors decided to authorize company's management to carry out all actions required to prepare a new shelf prospectus and raise additional capital in Israel. |
| b. | As mentioned in Note 1, trade in company shares on NASDAQ in the USA has ceased and the company requested the shares be removed from registration on this market. Upon said removal, company shares can be traded on OTC or Pink Sheets. On 12 September 2012, the board of directors decided the company should take measures to be removed from the status of an SEC reporting company in the USA, and authorized the executives to take the proper actions. |
14
D MEDICAL INDUSTRIES LTD.
NOTES TO CONDENSED CONSOLIDATED FINANCIAL STATEMENTS
As of September 30, 2012 (unaudited)
Note 4 – Significant events during the reporting period (continuend)
| c. | Pursuant to the company's reorganization and cost cuts described in Note 1B, the following events and transactions have been given effect in the financial statements for the period: |
1) | In September 2012 the company relocated its operation and offices from Tirat Carmel to Granot Industrial Zone in Emek Hefer and terminated the joint usage agreement with a third party in its Ramat Gan offices. Due to the relocation from the Tirat Carmel offices, the company included in its accounts a provision for future rental that cannot be cancelled under the lease agreements, totaling NIS 300 thousand, which was included in the general and administrative expenses for the period. The obligation to pay NIS 235 thousand in rent during the coming year is displayed in current liabilities and the NIS 65 thousand remainder in the long-term liabilities. |
| 2) | Due to the downsizing of operations and the halting of the development activities, the company designated and classified some of its fixed assets, whose depreciated cost on 30 September 2012 totaled NIS 218 thousands, as fixed assets held for sale. In addition, the company examined the fixed assets that is not being used, and after examining the expected net realization value of these assets, the company adjusted said property to is net realization value and included a provision totaling NIS 1,393 thousand in its accounts, that is presented as a separate item in the profit and loss statement for the period. |
| 3) | Following the changes during the report period and evaluation made by the company management through an external evaluator, the company determined impairment has occurred in the value of operations of its subsidiary, Spring Health Solutions Ltd., that develops insulin pumps, as compared to the carrying book value on 30 September 2012. As a result of this valuation, the company recognized an impairment provision in its books relating to its intangible assets - knowhow - in the amount of NIS 2,213 thousands. |
The recoverable amount of the subsidiary's operations was determined by discounting future cash flows expected by the company in several possible scenarios and weighing them. The discount factor used for this calculation was 25.58%.
| 4) | At the same time, due to updated assumptions relating to the company's expected sales and cash flows, expressed in the valuation and impairment of the subsidiary, the company updated the obligations to the Chief Scientist on 30 September 2012, and accordingly decreased this obligation by NIS 3,286 thousand. This sum was included in the company's other income for the period. |
| d. | The company has an agreement with a Polish distributor, whereby the distributor undertook to buy a minimum amount of products from the company. A dispute has arisen between the company and the distributor and consequently the distributor declared he would not uphold the agreement. The distributor's debt to the company on 30 September 2012 totals Euro 38 thousand. The company included a provision for waiver of said debt totaling NIS 190 thousand in its accounts for 30 September 2012, included in its marketing expenses for the reported period. |
15
D MEDICAL INDUSTRIES LTD.
NOTES TO CONDENSED CONSOLIDATED FINANCIAL STATEMENTS
As of September 30, 2012 (unaudited)
Note 5 – Events after 30 September 2012
| a. | According to the changes in company shareholdings, the most significant holding in the company is that of shareholders Mr. Simon Cohen and Mr. Jacov Bar-Lev, who have an oral agreement on joint voting and together hold 15.17% of the company as of the date of approval of these financial statements. |
| b. | On 14 October 2012, after the reporting period, the audit committee, subject to approval of the general assembly of company shareholders, decided to authorize Mr. David Schwartz, chairman of the company board, to act as company CEO (valid from the date of his appointment as chairman of the board (12.9.2012). It also approved the company's engagement in an agreement with a company under Mr. Schwartz' control whereby Mr. Schwartz would provide the company with management services in which he would act as chairman of the board and company CEO. |
| c. | According to the management agreement, Mr. Schwartz would receive NIS 47,500 per month, linked to the index on the signature date, and a one-time sum of NIS 30,000 for the work that was carried out and expenses spent during the three months prior to the signature. In addition to said remuneration, the company will allocate to Mr. Schwartz free of charge, options that may be realized into regular company shares totaling 9% of the company's issued share capital. On 28 October 2012, Mr. Schwartz announced he was waiving the options the company intended to issue him. Each of the parties may notify of the termination of the contract giving one month's prior notice. |
| d. | On 14 October 2012, after the reporting period, the audit committee, subject to company shareholders' general assembly approval, decided to appoint Mr. David Dana to act as company CFO. Accordingly, on 15 October 2012, the company signed an agreement for services with Mr. David Dana whereby he would provide the company with accounting and financial management services provided by company CFO's. Mr. Dana may provide the services on his own or through the company he controls. In return for provision of these services, the company will pay the management company the monthly sum of NIS 15,000 in addition to legal VAT. The agreement will continue to be effective even should another CFO be appointed for the company instead of the management company, providing the management company continues to provide services to the company. Each of the parties may terminate the agreement at any time after giving 60 days prior written notice. Despite the above, the company may instruct the management company to stop providing actual services at any time during the prior notification period, or without any prior notice – should the management company commit criminal offence, breach of trust or breach of confidentiality, as specified in the agreement. |
16
[Translated From Hebrew]
D MEDICAL INDUSTRIES LTD.
INTERIM REPORT
(unaudited)
September 30, 2012
Interim separate financial data per Regulation 38d of the Israeli Securities
Regulations (periodical and immediate reports), 1970
D MEDICAL INDUSTRIES LTD.
INTERIM REPORT
(unaudited)
September 30, 2012
Interim separate financial data per Regulation 38d of the Israeli Securities
Regulations (periodical and immediate reports), 1970
TABLE OF CONTENTS
| Page | |
| 2 | |
| Financial data – in thousands of NIS: | |
| 3 | |
| 4 | |
| 5-6 | |
| 7-8 |
To the Shareholders of D Medical Industries Ltd.
| Re: | Special report of auditor on separate financial data, per Regulation 38d. of theIsraeli Securities Regulations (periodical and immediate reports), 1970 |
Introduction
We have reviewed the accompanying separate interim financial data, per Regulation 38d. of the Israeli Securities Regulations (periodical and immediate reports), 1970, of D Medical Industries Ltd. (hereafter – "The company"), as of September 30, 2012 and for the periods of nine month and three month ended on that date. The Board of Directors and management are responsible for preparation and presentation of the separate interim financial data; our responsibility is to express a conclusion of the financial data for this interim period based on our review.
Scope of review
Our review was performed in accordance with Standard No. 1 on Review Engagements of the Institute of Certified Public Accountants in Israel - "Review of Interim Financial Information Performed by the Independent Auditor of the Entity". Review of interim financial information consists of making inquiries, primarily of persons responsible for financial and accounting matters, and applying analytical and other review procedures. A review is substantially less in scope than an audit conducted in accordance with Auditing Standards generally accepted in Israel and consequently does not enable us to obtain assurance that we would become aware of all significant matters that might be identified in an audit. Accordingly, we do not express an audit opinion.
Conclusion
Based on our review, nothing came to our attention that causes us to believe that the accompanying separate interim financial data is not prepared, in all material respects, in accordance with the provisions of Regulation 38d. of the Israeli Securities (periodical and immediate reports), 1970.
Without qualifying our opinion, we draw attention to note 1b. to the condensed consolidated interim financial statements, which indicates, inter alia, that there are substantial doubts about the company's ability to continue to exist as a going concern. The accompanying financial data do not include any adjustments as a result of the abovementioned uncertainty.
| Haifa, Israel | Kesselman & Kesselman |
November 28, 2012 | Certified Public Accountants (lsr.) |
| A member firm of PricewaterhouseCoopers International Limited |
Kesselman & Kesselman, 1 Nathanson Street, Haifa 33034, Israel, P.O Box 33984, Haifa 31339
Telephone: +972 -4- 8605000, Fax:+972 -4- 8605001, www.pwc.co.il
2
D MEDICAL INDUSTRIES LTD.
Interim separate financial data per Regulation 38d of the Israeli Securities
Regulations (periodical and immediate reports), 1970
Assets and liabilities included in the condensed consolidated financial statements, that are attributable to
the company as a parent company
September 30, 2012 | September 30, 2011 | December 31, 2011 | ||||||||||
(unaudited) | (audited) | |||||||||||
NIS in thousands | ||||||||||||
| Assets | ||||||||||||
| CURRENT ASSETS: | ||||||||||||
| Cash and cash equivalents | 2,111 | 6,013 | 3,267 | |||||||||
| Receivables: | ||||||||||||
| Subsidiaries – current account | - | 578 | ||||||||||
| Other | 470 | 1,233 | 2,039 | |||||||||
| Fixed assets held for sale | 7 | - | - | |||||||||
| 2,588 | 7,824 | 5,306 | ||||||||||
| NON-CURRENT ASSETS : | ||||||||||||
| Property and equipment, net | - | 69 | 64 | |||||||||
| Long term loans to subsidiaries | 63,074 | 55,378 | 47,827 | |||||||||
| Long-term receivable and loans | 332 | 71 | 432 | |||||||||
| T o t a l non-current assets | 63,406 | 55,518 | 48,323 | |||||||||
| T o t a l assets attributable to the company as a parent company | 65,994 | 63,342 | 53,629 | |||||||||
| Liabilities and equity | ||||||||||||
| CURRENT LIABILITIES: | ||||||||||||
| Trade and other payables: | ||||||||||||
| Suppliers and service providers | 34 | 149 | 101 | |||||||||
| Subsidiaries – current account | 1,773 | - | - | |||||||||
| Other | 680 | 962 | 1,022 | |||||||||
| 2,487 | 1,111 | 1,123 | ||||||||||
| NON-CURRENT LIABILITIES - | ||||||||||||
| Liability for severance pay - net | - | 41 | 44 | |||||||||
T o t a l liabilities | 2,487 | 1,152 | 1,167 | |||||||||
| Net amount attributable to the owners of the parent company – of total liabilities, less total assets, relating to subsidiaries, that are included in the consolidated accounts | 62,488 | 42,644 | 48,118 | |||||||||
| 64,975 | 43,796 | 49,285 | ||||||||||
| EQUITY ATTRIBUTABLE TO OWNERS OF THE PARENT | 1,019 | 19,546 | 4,344 | |||||||||
| T o t a l liabilities and equity attributable to the company as a parent company | 65,994 | 63,342 | 53,629 | |||||||||
David Schwartz | Yacov Bar-Lev | David Dana | ||
| Chairman of the Board | Director | Chief Financial Officer |
Date of approval of the financial statements by the Board of Directors: 28 November 2012
The attached notes and additional information are an integral part of the financial data
3
D MEDICAL INDUSTRIES LTD.
Interim separate financial data per Regulation 38d of the Israeli Securities
Regulations (periodical and immediate reports), 1970
Income and expenses included in the condensed consolidated financial statements, that are attributable to
the company as a parent company
| Nine months ended | Three months ended | Year ended | ||||||||||||||||||
September 30 | September 30 | December 31, | ||||||||||||||||||
2012 | 2011 | 2012 | 2011 | 2011 | ||||||||||||||||
(Unaudited) | (Audited) | |||||||||||||||||||
NIS in thousands | ||||||||||||||||||||
| CONTINUING OPERATIONS: | ||||||||||||||||||||
| Management fee income | 1,200 | 1,956 | - | 600 | 2,556 | |||||||||||||||
| General and administrative expenses | 4,038 | 8,103 | 624 | 2,725 | 11,185 | |||||||||||||||
| Provision for impairment of fixed assets | 31 | - | 31 | - | - | |||||||||||||||
| Other income - net | (46 | ) | - | (46 | ) | - | - | |||||||||||||
| Operating loss | (2,823 | ) | (6,147 | ) | (609 | ) | (2,125 | ) | (8,629 | ) | ||||||||||
| Finance income from loans to subsidiaries | 7,285 | 6,148 | 2,694 | 1,899 | 8,071 | |||||||||||||||
| Other finance income | 98 | 238 | 14 | 211 | 264 | |||||||||||||||
| Finance costs | (5 | ) | (38 | ) | (2 | ) | (35 | ) | (45 | ) | ||||||||||
| Finance income - net | 7,378 | 6,348 | 2,706 | 2,075 | 8,290 | |||||||||||||||
| Income (loss) before taxes on income | 4,555 | 201 | 2,097 | (50 | ) | (339 | ) | |||||||||||||
| Taxes on income | - | - | - | - | - | |||||||||||||||
| INCOME (LOSS) FOR THE PERIOD FROM CONTINUING OPERATIONS | 4,555 | 201 | 2,097 | (50 | ) | (339 | ) | |||||||||||||
| DISCONTINUED OPERATION – amount attributable to the owners of the parent company | - | 3,619 | - | 3,619 | 3,619 | |||||||||||||||
| INCOME FOR THE PERIOD ATTRIBUTABLE TO THE COMPANY AS A PARENT COMPANY | 4,555 | 3,820 | 2,097 | 3,569 | 3,280 | |||||||||||||||
| Net amount, attributable to the owners of the parent company of total expenses less total income, presenting the results of operations of subsidiaries in the condensed consolidated accounts, including discontinued operation | (17,139 | ) | (32,704 | ) | (5,059 | ) | (11,159 | ) | (48,081 | ) | ||||||||||
| TOTAL INCOME (LOSS) FOR THE PERIOD ATTRIBUTABLE TO THE OWNERS OF THE PARENT COMPANY | (12,584 | ) | (28,884 | ) | (2,962 | ) | (7,590 | ) | (44,801 | ) | ||||||||||
The attached notes and additional information are an integral part of the financial data
4
D MEDICAL INDUSTRIES LTD.
Interim separate financial data per Regulation 38d of the Israeli Securities
Regulations (periodical and immediate reports), 1970
Cash flows included in the condensed consolidated financial statements, that are attributable to
the company as a parent company
| Nine months ended | Three months ended | Year ended | ||||||||||||||||||
September 30 | September 30 | December 31, | ||||||||||||||||||
2012 | 2011 | 2012 | 2011 | 2011 | ||||||||||||||||
(Unaudited) | (Audited) | |||||||||||||||||||
NIS in thousands | ||||||||||||||||||||
| CASH FLOWS FROM OPERATING ACTIVITIES: | ||||||||||||||||||||
| Net cash provided by (used in) operations (see appendix) | (4,783 | ) | (4,002 | ) | 1,257 | (2,315 | ) | (6,707 | ) | |||||||||||
| Income tax paid | 80 | - | - | - | (5 | ) | ||||||||||||||
| Interest received | 42 | 116 | 9 | 1 | 116 | |||||||||||||||
| Net cash provided by (used in) operating activities | (4,661 | ) | (3,886 | ) | 1,266 | (2,314 | ) | (6,596 | ) | |||||||||||
| CASH FLOWS FROM INVESTING ACTIVITIES: | ||||||||||||||||||||
| Proceeds from sale of investment in subsidiary (discontinued operation) | - | 5,389 | 5,389 | 5,389 | ||||||||||||||||
| Loans granted to subsidiaries. net | (6,300 | ) | (14,552 | ) | (3,300 | ) | (4,776 | ) | (15,923 | ) | ||||||||||
| Net cash provided by (used in) investing activities* | (6,300 | ) | (9,163 | ) | (3,300 | ) | 613 | (10,534 | ) | |||||||||||
| CASH FLOWS FROM FINANCING ACTIVITIES: | ||||||||||||||||||||
| Proceeds from issuance of ordinary shares | 8,777 | - | 1,608 | - | 1,327 | |||||||||||||||
| Proceeds from issuance of warrants | 978 | - | - | - | - | |||||||||||||||
| Net cash provided by financing activities | 9,755 | - | 1,608 | - | 1,327 | |||||||||||||||
| NET INCREASE (DECREASE) IN CASH AND CASH EQUIVALENTS | (1,206 | ) | (13,049 | ) | (426 | ) | (1,701 | ) | (15,803 | ) | ||||||||||
| Cash and cash equivalents at beginning of the period | 3,267 | 18,966 | 2,533 | 7,882 | 18,966 | |||||||||||||||
| Exchange gains (loss) on cash and cash equivalents | 50 | 96 | 4 | (168 | ) | 104 | ||||||||||||||
| CASH AND CASH EQUIVALENTS AT END OF PERIOD | 2,111 | 6,013 | 2,111 | 6,013 | 3,267 | |||||||||||||||
The attached notes and additional information are an integral part of the financial data
5
D MEDICAL INDUSTRIES LTD.
Interim separate financial data per Regulation 38d of the Israeli Securities
Regulations (periodical and immediate reports), 1970
Cash flows included in the condensed consolidated financial statements, that are attributable to
the company as a parent company
| Nine months ended | Three months ended | Year ended | ||||||||||||||||||
September 30 | September 30 | December 31, | ||||||||||||||||||
2012 | 2011 | 2012 | 2011 | 2011 | ||||||||||||||||
| APPENDIX | (Unaudited) | (Audited) | ||||||||||||||||||
NIS in thousands | ||||||||||||||||||||
| NET CASH USED IN OPERATIONS ATTRIBUTABLE TO THE COMPANY AS A PARENT COMPANY: | ||||||||||||||||||||
| Income for the period attributable to the company as a parent company (including discontinued operation) | 4,555 | 3,820 | 2,097 | 3,569 | 3,280 | |||||||||||||||
| Adjustments for: | ||||||||||||||||||||
| Gain on sale of investment in subsidiary (discontinued operation) | - | (3,619 | ) | - | (3,619 | ) | (3,619 | ) | ||||||||||||
| Finance income on loans from subsidiaries | (7,285 | ) | (6,148 | ) | (2,694 | ) | (1,899 | ) | (8,071 | ) | ||||||||||
| Share based payment related stock options granted to employee and service providers | (285 | ) | 2,185 | (703 | ) | 498 | 2,530 | |||||||||||||
| Interest received | (42 | ) | (116 | ) | (9 | ) | (1 | ) | (116 | ) | ||||||||||
| Exchange (gain) loss on cash and cash equivalents | (50 | ) | (96 | ) | (4 | ) | 168 | (104 | ) | |||||||||||
| Liabilities for severance pay - net | (44 | ) | 5 | (44 | ) | 5 | 7 | |||||||||||||
| Depreciation | 26 | 14 | 7 | 4 | 19 | |||||||||||||||
| Loss on impairment of fixed assets | 31 | - | 31 | - | - | |||||||||||||||
| (3,094 | ) | (3,955 | ) | (1,319 | ) | (1,275 | ) | (6,074 | ) | |||||||||||
| Changes in operating asset and liability items: | ||||||||||||||||||||
| Decrease (increase) in trade and other receivables | 1,669 | (248 | ) | 1,305 | (343 | ) | (846 | ) | ||||||||||||
| Increase (decrease) in trade and other payables | (67 | ) | 16 | (76 | ) | - | (32 | ) | ||||||||||||
| Other | (3,291 | ) | 185 | 1,347 | (697 | ) | 245 | |||||||||||||
Net cash provided by (used in) operations | (4,783 | ) | (4,002 | ) | 1,257 | (2,315 | ) | (6,707 | ) | |||||||||||
The attached notes and additional information are an integral part of this condensed financial data
6
D MEDICAL INDUSTRIES LTD.
NOTES TO CONDENSED CONSOLIDATED FINANCIAL STATEMENTS (continued)
The amounts are presented in NIS in thousands except share and per share data
NOTE 1 – Preparation of the separate financial data per Regulation 38d. of the Israeli Securities Regulations (periodical and immediate reports), 1970
| a. | Definitions: |
"The company" – D. Medical Industries Ltd.
"The separate interim financial information" – financial information for interim periods prepared under Regulation 38d. of the Israeli Securities Regulations (periodical and immediate reports), 1970;
Unless otherwise stated herein, the terminology used in the separate interim financial data, have the same definition used for the condensed consolidated financial statements if the company as of September 30, 2012 and for the nine month and three month periods ended on that date (hereinafter – "condensed consolidated interim statements").
"Investee company" – a subsidiary or associated company, or an entity under joint control;
"Consolidated company" – a subsidiary or a company under joint control that is proportionally consolidated;
"Intercomapny transactions" – transactions between the company and its subsidiaries of companies under joint control that are proportionally consolidated;
"Intercompany balances" , intercompany income and expenses, intercompany cash flows – balances, income or expenses and cash flows, as appropriate, that were eliminated in the consolidated financial statements;
| b. | Summary of preparation principals of the separate financial data |
The separate interim financial data was prepared in accordance with Regulation 38d. of the Israeli Securities Regulations (periodical and immediate reports), 1970.
In accordance with that Regulation, a company is required to present an interim report containing certain financial data from its consolidated financial statements, drawn up under Regulation 9c. to the above Regulations, adjusted as appropriate, and supplemented with a review report of the Company's auditors.
Accordingly, the separate interim financial data presents financial information that is attributable to the Company itself as a parent company, that is drawn from the condensed consolidated interim statements of the company as of September 30, 2012 and for the periods of nine and three month that ended on that date.
The separate interim financial data should be read in conjunction with the condensed interim consolidated statements and the annual consolidated financial statements for 2011 and the notes accompanying them. The accounting policies and computation methods used in the preparation of the separate interim financial data, were applied on a consistent basis.
The separate interim financial data is reviewed and is not audited.
The separate interim financial data does not comprise financial statements that are prepared and presented under International Financial Reporting Standards ("IFRS"), in particular - separate financial statements under International Accounting Standard ("IAS") No. 27 – "consolidated and separate financial statements"; nor does it comprise interim financial statements prepared under IAS 34 – "Interim financial reporting".
7
D MEDICAL INDUSTRIES LTD.
NOTES TO CONDENSED CONSOLIDATED FINANCIAL STATEMENTS (continued)
The amounts are presented in NIS in thousands except share and per share data
NOTE 1 – Preparation of the separate financial data per Regulation 38d. of the Israeli Securities Regulations (periodical and immediate reports), 1970 (continued)
| b. | Summary of preparation principals of the separate financial data (continued) |
With that said, the accounting policy detailed in note 3 to the interim condensed consolidated financial statements, with respect to the significant accounting policies, and the way financial figures were classified in the interim condensed consolidated financial statements, were also applied in the presentation of the separate interim financial data, with the appropriate adjustments, in order to apply the accounting policies and calculation methods required for the preparation of this financial data as above.
NOTE 2 – commitments, loans, investments and material transactions between the company and its subsidiairies:
| a. | Management fees |
The company provides management services, including inter alia financial management and business development services, to its subsidiaries, under an agreement from February 2010. The subsidiaries pay for these services monthly fees of NIS 200,000 in total, in addition to reimbursement of specific costs and expenses. Taking into account the down-sizing and the restructuring of the company activities in 2012, no management fees are charged by the company as of July 1, 2012.
| b. | Loans to subsidiaries |
During 2011 and in the period of nine month ended September 30, 2012, the company provided long term loans, and renewed existing loans to its subsidiaries. These loans are linked to the consumer price index and bear annual interest of 4%. The loans can be repaid at any time, or within 90 days from receiving a demand from the company, and in no event later than the maturity of 5 years from grant.
These loans were recognized, in the separate financial data, at their present value, based on a discount rate of 15%. Accordingly, the finance income thereon, presented in the separate financial data, reflects effective annual interest of 15%.
NOTE 3 – Going concern
See note 1b. to the condensed consolidated interim financial statements.
8
[Translated from Hebrew]
Spring Health Solutions Ltd.
Goodwill impairment assessment, 30 September 2012
| November 2012 | Third draft for discussion |

22 November 2012
To:
D Medical Industries Ltd.
Re: Operation value assessment for goodwill impairment assessment
Background
We were requested by D Medical Industries Ltd. (“D Medical” and/or “Parent company”) to assess the value of Spring Health Solutions (hereinafter: “Spring” and/or “The company”) as of 30 September2012 (hereinafter: “Valuation date”) in order to apply the requirements of International Accounting Standard no. 36 –Impairment of Assets (hereinafter: “IAS 36”).
Objective
The objective of D Medical’s engagement with Laor was to assess the value of Spring’s operation in order to assess whether there has been a decline in its value, as compared to its book value in D Medical’s accounts. All this according to relevant accounting standards, subject to the reservations specified above and below and for this purpose only. This assessment does not take into account considerations that may affect the value estimation for a specific investor.
Except for the auditors, for auditing purposes, no third party may make any use of it or rely on it for any purpose without prior written permission from us.
For our work, we used Spring’s audited and unaudited financial statements, financial and operational information, internal administrative reports and additional information received from D Medical's management, provided at its best knowledge and experience. Additionally, we used public information published by others.
We used sources of information that seem reliable, whole, precise and updated to us, however, we did not carry out any auditing procedures, as defined in law and rulings, nor did we make an independent check or examination of the information we received and we do not have any opinion of the appropriateness of the data used in our work. However, we did carry out several tests regarding the reasonability of the data and forecasts. These test included, inter alia, analysis of financial statements and historical financial information about the company.
Scope of examination
The work was carried out according to the provisions of International Accounting Regulation no. 36 – impairment of assets (hereinafter: “IAS 36”) by comparing the carrying amount of the property in the books to its recoverable amount, requiring the recognition of impairment whenever the recoverable amount is lower than its carrying amount.
Sources of information
In carrying out the work we relied on the following information, among other things:
* Financial statements for the years 2009-2011
* Financial statement draft for 30 September 30, 2012
* Other financial and operation data received from D Medical management
2
* Company's budget for 2012 , approved by the Board of Directors of the Company;
* Company budget versus performance in 2012.
* Multi-annual business plan draft (yet to be approved by company board of directors)
* Valuation of goodwill for impairment assessment as at 31 December 2011
* Conversations and clarifications with D Medical management, and
* Financial and general information from various open sources.
Procedures used by us
The procedures we used include the following, among others:
* Conversations with D Medical's management regarding data and information we received.
* Independent checks by Spring, financial and operation history, analysis of business environment and company’s competitive positioning on the market; and
* Valuation of Spring’s operations.
Please note individual calculations that were used in the work process are not presented in the paper, since calculations were made on an electronic spreadsheet, difference due to rounding up numbers may have occurred.
We hereby declare we have no personal interest in D Medical and/or Spring shares, shareholders or any related parties, as specified by law or ruling, and we have no dependency or affiliation to them or parties related to them as specified in the Companies Law.
Payment for our services had no influence whatsoever on our examination results.
We are aware our findings will be used by D Medical management for the financial reporting required by the accounting principles accepted in Israel. We agree this opinion be included and/or mentioned within D Medical’s financial statements for 30 September 2012 and its reports to the Securities Authority, if so required.
Summary
According to our Valuation, based on our calculations, subject to the reservations noted above and below, the value of Spring’s operations estimated on the date of the assessment is approximately NIS 74 thousand. This value is lower than the net carrying amount attributed to the company, of NIS 2,308 thousand on 30 September2012. Therefore, and in view of the above, we have found said goodwill value impaired. The determining date for this opinion is 22 November2012. Our opinion is specified below.
Sincerely,
Laor – Consulting and Investments Ltd.
3
| Chapter | Subject | Page |
| 1 | 5 | |
| 2 | 9 | |
| 3 | 22 | |
| 4 | 25 | |
| 5 | 35 | |
| 45 | ||
| 47 | ||
| 48 | ||
| 49 | ||
| 50 |
4
Section 1
Company Description
5
General
Springs Health Solutions Ltd. (formerly Nilimedics Ltd.) was established in 2002 as part of the Technion Enterprise Incubator Ltd., and currently operates under D Medical Industries Ltd., traded on the Tel Aviv Stock Exchange.* The company operates, together with Spring Set and Spring Inc, in the field of manufacturing and marketing infusion sets, under the trade name of Spring TM Universal Infusion Set., with products based on the Continuous Glucose Monitoring (CGM) drug delivery technology.
Company headquarters are situated in Granot, Israel.
Products and Technology
The company has developed two major product lines:
| * | Spring Zone insulin pump. IntellispringTM technology is the core of the Spring Zone insulin delivery system. The pocket pump operates on a pressure metering system that derives insulin delivery energy from the pressure generated when insulin is loaded on the unique infusion set and the spring mechanism in the pump is depressed. This sophisticated mechanism, backed by the Total Line ControlTM safety system, enables safe operation and extraordinary reliability for constant control and monitoring of insulin supply. Intellispring exploits the spring's energy as power for moving the insulin. Omitting the use of a mechanism powered by a motor and gear provides a significant advantage in performance and costs, increases the system's life expectancy and reliability and enables significant decrease and miniaturization of the pump. Additional key properties of the Spring Zone insulin pump include better identification of blockage and disconnection from the body, better adaptation and constant monitoring of the insulin supply dosage. |
The Spring Zone substance delivery system has several innovative solutions:
- Sophisticated mechanism that regulates and stops substance provision
- Control mechanism that coordinates substance provision temperature and pressure
- Substance delivery dosage control mechanism.
Intellispring exploits the spring's energy as power for moving the insulin. Omitting the use of a mechanism powered by a motor and gear provides a significant advantage in performance and costs increases the system's life expectancy and reliability and enables significant decrease and miniaturization of the pump. Additional key properties of the Spring Zone insulin pump include better identification of blockage and disconnection from the body, better adaptation and constant monitoring of the insulin supply dosage.
Key properties of the technology:
| - | Hybrid system – the innovative Intellispring technology integrated into the company's traditional Adi pump was converted and turned into the world's first pump based on a hybrid system for constant insulin delivery. |
| - | Continuous monitoring – the continuous safety and monitoring system on the pipe enables safe operation and high reliability for continuous control and monitoring over insulin delivery. |
| - | Lightweight and convenient – the pump is particularly lightweight and easy to use. |
----------------
* In 2006 D Medical bought 72.99% of Spring's shares for $1.5 million. Over the years it bought additional shares eventually reaching 100% of Spring's issued share capital
6
| - | Tiny dimensions – the pump is tiny, free of background noises when operating, retaining patients' privacy |
| - | Simplicity – the entire system is in one unit, without being cumbersome and using multiple parts (cartridge, pipes, and connections) |
| - | Durability – the system is made of magnesium and damage proof |
| - | Reliability – the system is assembled from disposable parts ensuring operation malfunctions are prevented compared to multiple use systems. |
| - | Saving – system dimensions and materials from which it is made enable low production cost compared to competing products. |
| - | Support services – instruction, service and support processed based on network of certified distributors. |
| * | Spring hybrid dressing pump. The innovative Intellispring technology integrated into the company's traditional Adi pump underwent conversion into the world's first pump that is a hybrid continuous insulin delivery system. The system is hybrid because it may be worn as a dressing pump directly on the body or traditionally by connection to the body with an IV set. The system is tiny and can give warning in any possible case of blockage and the unique device that discovers air bubbles in the system. The Spring Hybrid Dressing Pump presents a new level of environmental friendliness – the pump is made of a multiple use control system with long life expectancy combined with a disposable medication receptacle. No electric component, metal materials and batteries are disposed, the only garbage is a tiny plastic container. The motor-less energy saving system can operate for approximately 30 days on standard AAA batteries. |
Marketing and sales
The SpringTM insulin pump received CE approval and is now ready for commercial sale in Europe. However, D Medical management believes that in order to begin the commercialization process the company should raise money. D Medical management expects the company to begin selling the product in Europe in the fourth quarter of 2014.
The initial version of the Spring hybrid dressing pump, semi-disposable, received CE approval. Company management expects it to be able to complete the commercial deployment process and design of the Spring hybrid dressing pump by the third quarter of 2015, begin preparations for the product's production and marketing stages and even obtain all required regulatory permissions for the commercial design from the EU. By the third quarter of 2015 it is also expected to obtain the permit required for the American market. Moreover, D Medical management claims that when it has excess inventory it will begin selling the Spring hybrid dressing pump to BRIC countries (Brasil, Russia, India and China).
The company currently holds some10 active distributor agreements covering product distribution in the following countries: Canada, Czech Republic, Greece, Netherlands, Poland and Sweden, and five distribution agreements for the American market.
Additionally, the company has signed 3 inactive distribution agreements, covering company product distribution in the following countries: China, India and Mexico.
7
Subject to the above mentioned distribution agreements, sale of company products will be made at the company plant, except for the United States, in which sale will take place on the customer's premises. Additionally, company pumps are covered by a four-year warranty.
Business Strategy
D Medical management intends to raise financial resources from external investors to enable continued development activities until sales of its products currently under development or intangible assets. At the same time, Spring wants to obtain a significant section of the global insulin pump market and Biodegradable accessories, particularly in BRIC countries, Mexico and Europe. To achieve this goal, the company plans to apply the following strategies:
| * | Leverage the saving characterizing the company's spring-based design to enter BRIC countries and Mexican markets. |
| * | Increase its profit margin by using distributors and refraining from the costs that accompany management of a direct sales force and customer support system. |
| * | Initial launch of company products in Europe. |
| * | Streamlining and improving company production processes to decrease product cost to the end consumer. |
| * | Create presence of company products in the United States. |
| * | Leverage company proprietary technology to integrate it in additional drug administration devices. |
| * | On March 22, 2012, D Medical declared it had initiated a strategic restructuring process designed to focus its business on maximization and realization of the value of the company's innovative technology and intellectual property, by licensing and/or sale of this technology (or part of it) to third parties. Our Valuation is based on company strategy that intends to promote sale of its products through marketers. |
8
Section 2
Market Review
9
General Review
About Diabetes
Diabetes is a life-threatening chronic disease with no known cure. Diabetes is caused by the body's inability to produce the insulin hormone or use it efficiently, preventing the body from proper regulation of blood sugar levels.
Glucose is the cells' major energy source and it must remain at a certain concentration level in the blood to enable the cells to function at their best. Usually, the pancreas controls blood glucose level by secreting the insulin hormone that lowers glucose levels when they get too high.
In case of diabetics, the pancreas does not produce enough insulin, or the body does not utilize insulin efficiently, thus causing abnormal increase in glucose levels.
This state, called hyperglycemia, may cause long-range chronic complications including heart conditions, limb amputation, damage to kidney function or blindness.
To prevent high blood glucose levels, diabetics often use insulin to regulate glucose levels. Insulin injections may cause blood glucose levels to impairment dangerously, leading to hypoglycemia. In cases of severe hypoglycemia, diabetics are at risk of grave complications, including losing consciousness and even death. In view of the drastic implications of the severe complications involved in hypoglycemia, many diabetics are afraid of lowering blood glucose levels. As a result, these patients often remain in a state of hyperglycemia, exposing themselves to the long-range chronic complications specified above.
According to the American Diabetic Engagement:
| * | Diabetes was the seventh leading cause of death, apparent from death certificates issued for adults in the USA in 2006; |
| * | Adults suffering from diabetes are exposed to a much higher risk of stroke or heart disease compared to non-diabetic adults. |
| * | Diabetes is among the leading causes of new cases of blindness discovered in adults aged 20 to 74, and finally, it is the major cause of kidney failure; |
| * | Some 60-70% of diabetics suffer medium to severe malfunction of the nervous system; and |
| * | Over 60% of non-traumatic amputations of lower limbs are performed on diabetics. |
Diabetes is usually divided into two categories: type 1 diabetes (formerly called diabetes mellitus, insulin dependent, or juvenile diabetes) and type 2 diabetes (formerly called diabetes mellitus, non-insulin dependent or adult diabetes). Their rate of prevalence is 5-10% and 90-95%, respectively, of the total cases of diabetes diagnosed in the US. Patients suffering from diabetes type 1 must take insulin on a daily basis, while diabetes type 2 patients need a diet, exercise, orally administered medication and/or insulin to regulate blood glucose levels. Due to the progressive character of diabetes, a large number of patients suffering from diabetes type 2 needs to use insulin to regulate their blood glucose levels.
10
According to the National Diabetes Information Clearing House (NDICH), a unit of the National Health Institute, diabetes type 1:
* Cannot be prevented, currently
| * | Develops when the body's immune system destroys beta cells in the pancreas, the only cells in the body that produce insulin. |
| * | Usually appears in children and young adults (although diabetes may be discovered at any age). |
| * | May be caused by autoimmune, generic or environmental factors, including viruses. |
| * | According to the NDICH, diabetes type 2: |
| * | Usually begins as resistance to insulin, an ailment in which (i) the cells do not use insulin properly and require larger than usual amounts of insulin for normal function, while (ii) the pancreas gradually loses its ability to produce insulin, and |
| * | Is usually related to older age, obesity, family history of diabetes, history of gestational diabetes, defective glucose metabolism, lack of physical activity and ethnic origin. |
Over the past two decades, type 2 diabetes has turned into a significant problem that increases in severity, among children and adolescents in the US. One of the possible causes of the increased frequency of diabetes type 2 during childhood and adolescence is exposure to diabetes in the womb. The problem is related to low physical activity and obesity which we see around the world. Usually, children diagnosed with diabetes type 2 are 10-19 years of age, have a family history of diabetes and suffer from insulin resistance.
Global frequency of diabetes*
Most diabetics live in the lesser economically developed regions of the world. In regions where the disease is less frequent (Africa) assessment has is that 280,000 cases of death in 2011 are elated to diabetes. Although over 80% of the total diabetics reside in countries with low or medium income, only 20% of all global health expenses have been channeled to these regions – data that reflects huge differences.
Diabetes and prevalence of Impaired Glucose Tolerance (IGT)
The largest number of diabetics has been recorded in the western-Pacific region and includes 132 million people, while the lowest number in 2011 was 14.7 million in Africa. However, the Middle East and North Africa were characterized by the highest prevalence of adult diabetes in 2011 – 11%, with North America and the Caribbeans in second place with 10.7% prevalence. The region with the second lowest prevalence after Africa is Europe, with 6.7% diabetics.
11
The following table displays regional estimates on diabetes (ages 20-79) for the years 2011 and 2030:
| 2011 | 2030 | |||||||||||||||||||||||||||
| Region | Population | No. of diabetics (millions) | Diabetic prevalence (%) | Population | No. of diabetics (millions) | Diabetic prevalence (%) | Rate of change in diabetics (%) | |||||||||||||||||||||
| Africa | 387 | 14.7 | 4.5 | 658 | 28 | 5 | 90 | |||||||||||||||||||||
| Europe | 653 | 52.8 | 6.7 | 673 | 64 | 7 | 22 | |||||||||||||||||||||
| Middle East and North Africa | 356 | 32.6 | 11.0 | 539 | 60 | 11 | 83 | |||||||||||||||||||||
| North America and Caribbean | 322 | 37.7 | 10.7 | 386 | 51 | 11 | 36 | |||||||||||||||||||||
| Southern and central Europe | 289 | 25.1 | 9.2 | 376 | 40 | 9 | 59 | |||||||||||||||||||||
| South-East Asia | 858 | 71.4 | 9.2 | 1,188 | 121 | 10 | 69 | |||||||||||||||||||||
| Western Pacific | 1,544 | 131.9 | 8.3 | 1,766 | 188 | 9 | 42 | |||||||||||||||||||||
| Global | 4,407 | 366 | 9 | 5,586 | 552 | 9 | 51 | |||||||||||||||||||||
Source: International Diabetes Federation
Data for IGT is similar. According to estimates, the Pacific-West region has the highest number of diabetics, 85 million in 2011, although the highest comparative prevalence of IGT was recorded in the North America & Caribbean region (10.75). In total, IGT prevalence was generally lower than diabetes, except in Europe, North America & Caribbean regions where its prevalence is higher.
Mortality
The mortality rate due to diabetes is 6.1% of all deaths in people aged 20-79 in Africa, to over 15% in the Pacific-West region. In ages over 49 and in all regions, diabetes is responsible for a higher percentage of total deaths among women, compared to men, totaling over 20% in certain regions and particular age groups.
These assessments show diabetes poses a significant death threat and investment in decreasing it are justified and necessary.
Medical treatment costs
The current differences between regions are quite prominent when it comes to health expenditure related to diabetes. In 2011, North American & Caribbean region spent some $223 billion, or 48% of global medical expenses on diabetes. The European region spent half that amount, $130 billion. In 2011, both regions together recorded the highest diabetes related expenses. On the other hand, the Pacific-Western region spent $72 billion only on treating diabetes, despite the fact it has the highest number of diabetics. South and Central America as well as the Middle East and North Africa spent less than 5% of their total health budget on diabetes related items, while South-East Asia and Africa spent less than 1% in 2011.
12
Diabetes treatment market
Market data
The diabetes treatment market includes medicinal components and medical device components. The pharmaceutical aspect is divided into insulin and orally administered anti-diabetes drugs. The device sector is composed of diagnosis and monitoring devices for Biodegradable substances they accompany, and a variety of insulin providing devices. Some of these devices contain pre-loaded insulin doses, and they can be treated both as medical devices and pharmaceutical products. The leading sectors on the diabetes products market are: insulin, blood sugar meters and related Biodegradable materials (e.g. needles, test strips), insulin pumps, insulin delivery devices (e.g. syringes, pens) and anti-diabetes drugs.
The global diabetes product market in 2010* (in $ millions) is described below:
In 2010, the global diabetes management market totaled $40 billion and is expected to reach a total of $114 billion soon, following an annual growth rate (CAGR) of 13.5%. Insulin, test strips and anti-diabetes drugs are the products that generate the highest revenue in this market.
Of the two major sectors of the global diabetes market, the anti-diabetes drug market constitutes a $28 billion sector, with oral drugs covering 38% and injected drugs contributing over 55%. The additional major sector of the global diabetes market – the device sector – was responsible for $16 billion in 2010.**
The value of the global insulin pump market was an estimated $724.3 million in 2010 and is expected to have an annual growth rate (CAGR) of 7.9%, reaching $1.2 billion in 2017***. According to market statements and studies, the market is expected to be powered by high increase in diabetes prevalence, available monetary refund, positive clinical results for studies on insulin pumps and the advantages provided by insulin pumps for "niche" groups of patients. The USA continues to be the largest insulin pump market, propelled by a higher infiltration rate of pumps and available monetary refunds.
In 2010, the value of the American insulin pump market was an estimated $518.5 and is expected to have an 8.5% CAGR, reaching a value of $915.4 million by 2017. Market growth should be propelled by several factors, including increase in prevalence of diabetes among people of all ages, higher introduction of insulin pumps onto the market and available monetary refunds.****
--------------------
* Diabetes Therapies & Diagnostics: Global Markets", Bharat Book bureau, June 2010.
** Life Science Market Research Statements, "Global Diabetes Devices Market & Diabetes Drugs Market (2011-2016)", February 27, 2012.
*** Bio Spectrum, "Global insulin pumps market to reach $1.2 billion by 2017" December 30, 2011.
**** See previous footnote
13
Diabetes treatment market (continued)
Quite frequently, coping with diabetes is frustrating and difficult on patients since blood glucose levels are influenced by hydrocarbon content of meals, physical activity, pressure, existing or developing diseases, hormonal fluctuations, insulin absorption fluctuations and changes in the influence of insulin on the body. Diabetics with insulin dependent diabetes, and particularly those with diabetes type 1, require:
| * | Constant monitoring and daily intake of insulin, as well as increased carbohydrate intake during the day to retain normal blood glucose levels, and |
| * | Constant insulin supply, known as basal insulin, to provide a response for background metabolic needs. |
In addition to basal insulin, insulin-dependent diabetics require addition insulin dosage known as "bolus" to compensate for carbohydrates conamounted during meals, as snacks or in order to offset high doses of glucose in the blood. Diabetics who try to closely control blood glucose levels to prevent long-term complications related to the fluctuations in these levels are at high risk of "over correction" that sometimes causes hypoglycemia. Therefore, the time dedicated to diabetes management, blood glucose level fluctuations and fear of hypoglycemia all contribute to the huge burden carried by patients and their relatives.
Insulin treatment
There are three major types of insulin treatments:
| * | Traditional treatment that includes use of insulin injection devices to inject long-term and regular insulin, once or twice a day by the patient. |
| * | Multiple Daily Injections (MDI) treatment, includes the use of insulin self-injection systems by the patient that inject long term or regular insulin or a mixture of the two types, once or twice daily, as well as additional injection of fast-acting insulin before any meal or snack, if required. And, |
| * | Treatment using an insulin pump, composed of the use of insulin pumps by patients that inject fast acting basal insulin continuously through a subcutaneous infusion (i.e. below the skin). This includes the ability to inject fast acting "bolus" insulin before meals and snacks, if necessary. |
14
| Insulin injection kits |
Traditional treatment and MDI treatment use insulin injection systems, including multiple-use injection pens prepared in advance, insulin syringes and needle kits, as well as jet insulin syringes.
| * | Injection pens are pre-filled devices containing several insulin doses, or multiple-use devices using insulin cartridges replaced every few days. Insulin injection pens use short, thin needles and a spring to deliver the drug. |
| * | Insulin syringe and needle kits are specially designed needles connected to small hollow, barrel shaped, devices equipped with a moving crank, designed for single use. Most syringe and needle kits are packed in a ready to use form, with the needle connected to the receptacle. |
| * | Insulin jet syringes are designed for subcutaneous insulin delivery enabled by releasing a high pressure jet through a tiny hole in the bottom part of the injection device. |
15
Diabetes treatment market (continued)
Insulin pumps
There are two types of insulin pumps on the market presently, multiple-use and disposable.
Multiple use insulin pumps are small mechanical devices a bit larger than a pager. The multiple use pump is externally installed, usually on the belt or in a pocket, and provides insulin subcutaneously through a disposable infusion kit. The infusion kit contains two pipes: a tiny, flexible plastic pipe known as "canola", inserted under the skin, usually on the stomach, arms or legs, as well as a thin plastic pipe that connects the canola to the insulin pump. Usually, infusion kits are replaced every two-three days. Insulin passes through the infusion kit, using a reservoir cartridge located in the insulin pump and usually containing 200-300 insulin units. The reservoir cartridge connects to the infusion pipe through an adapter within the pump.
Disposable insulin pumps are small, lightweight, adhesive devices currently provided by Insulet alone. The pump is placed directly onto the skin under the patient's clothes, for three days maximum, and is then replaced. Insulin is injected into the reservoir cartridge within the pump, containing 200 units of insulin, and is delivered through a canola (similar to the multiple use pump canola) inserted into the skin using an automatic process. The disposable insulin pump is equipped with a manual wireless device similar in size and appearance to a PDA, used to program and control the insulin pump.
The Centre for Evidence-Based Purchasing, NHS Purchasing and Supply Agency, CEP 08004, February 2008 buying guide assesses direct costs of treatment based on insulin pumps are three times higher than MDI treatment. They include the cost of equipment (insulin pumps and disposable accessories) and the cost of insulin.
Advantages of treatment using an insulin pump
MDI treatments and insulin pump treatments are intense insulin management therapies that according to many health professionals lead to more efficient monitoring of blood glucose levels. Although traditional treatment is easier to apply and relatively inexpensive, it is not as efficient as the other forms of treatment and in the long range leads to the highest rate of complications.
It has been proven that compared to MDI treatments, insulin pump treatment provides a variety of advantages for insulin-dependent diabetics, including:
| * | Improved glycemic control. Several studies have proven the advantages of treatment using insulin pumps compared to MDI treatments, including improved glycemic control, lower glycemic fluctuations and number of hypoglycemic incidents. Additionally, insulin pump treatment provides higher consistency compared to MDI treatment with regard to basal insulin absorption, due to the use of fast acting insulin compared to long range insulin, as well as bolus treatments, added at higher frequency through the insulin infusion without need for additional injections. |
| * | Improved lifestyle flexibility. Treatment with an insulin pump provides patients with increased flexibility with regard to nutrition, ability to carry out physical activities and sleeping habits. |
16
Diabetes treatment market (continued)
| * | In case of MDI treatment, patients may have to eat whether they are hungry or not to compensate for peak insulin levels, low blood glucose levels or physical activity. When treated with an insulin pump, the insulin rise phenomenon decreases and patients can generally tolerate the decline in blood glucose levels or carry out physical activities during insulin pump treatment. The insulin peak phenomenon decreases and patients can usually tolerate decline in blood glucose levels or carry out physical activities without being required to eat, buy temporary slowing down basal insulin infusion rate. Furthermore, insulin pump treatment helps patients avoid the need for frequent, painful injections. |
Challenges characterizing insulin pump treatment
Although insulin pump treatment is considered the best clinical treatment for diabetes type 1 and diabetes type 2 patients who depend on insulin, the treatment integration process was limited by its very essence.
The company believes, limited integration of treatment with insulin pumps may be related to the high cost it involves as well as performance and design of current insulin pumps that are below optimal. Additionally, the company believes some of these factors are related to the motor and gear system delivery method that characterizes their competitors' pumps.
The motor and gear systems require sophisticated, expensive production processes. The company believes the high costs related to motor and gear based insulin pumps greatly restricted integration of these pumps, particularly in developing countries.
Due to the high production costs of motor and gear based insulin pumps, the prices of multiple use insulin pumps are between $4,000 and $6,000. These costs, come in addition to the ongoing annual expense involved in using infusion kits, batteries and the expensive insulin type required to operate the pump.
To the company's best knowledge, multiple use insulin pumps on the market are usually designed for use over a four-year period, the standard warranty period for such devices. The price of the only commercially marketed disposable insulin pump – Insulet Omnipod – may be lower at only $700. However, following initial purchase of the system, Omnipod uses are required to buy at least 10 disposable insulin pumps a month, each sold for $34. Assuming the system is used over a four year period (the Omnipod system remote control is also covered by a four-year warranty) and taking into consideration the Biodegradable materials required for disposable insulin pumps (valued at $1,500 annually, without insulin), the total price of the disposable insulin pump is actually higher than the multiple use insulin pumps. The total price of the Omnipod may reach the price of a multiple use insulin pump after two years of use only. However, the cost advantage of the disposable pump remains due to the pay-as-you-go pricing model used for it.
In the USA and other developed countries, the cost of insulin pumps are covered, at least partially, but third party factors, however joint payments and deductibles can still be quite significant. For example, in the USA, joint payments total 20% of the insulin pump cost, meaning the patient has to invest between
17
Diabetes treatment market (continued)
$800 and $1,200 in the insulin pump as well as $300 annually for infusion kits, in addition to the cost of insulin.
Usually, diabetes type 2 patients have to handle higher costs, since some of them don't receive any monetary refund.
The company believes an additional obstacle facing widespread integration of insulin pump treatment is derived from the lack of willingness of external payment factors to cover the high prior cost of multiple use insulin pumps, due to the relatively short length of time patients remain in a particular health framework and the fear they may stop using the insulin pump treatment.
18
Competitors
A description of several companies in the business:
| * | Insulet Corporation (hereinafter: "Insulet") – Insulet is a medical device supplier that develops, manufactures and markets insulin infusion systems for insulin dependent diabetics. Insulet's insulin management system, OmniPod (OmniPod system), includes the OmniPod disposable infusion device as well as mobile diabetes manager that operates on wireless. The FDA approved the sale of the OmniPod system in the USA. |
| * | Medtronic Inc. (hereinafter: "Medtronic") – Medtronic is a global company operating in the medical technology arena. It operates through seven divisions that manufacture and sell medical treatments based on devices: heart rhythm management, spine, cardiovascular, neuro-modulation, surgical technologies and physio-control. Through its seven divisions, Medtronic develops, manufactures and markets its medical devices in over 120 countries. Its major products include solutions for cardiac arrhythmia, cardiovascular diseases, neurological problems, spinal problems, skeletal and muscular system traumas, urological problems and gastric problems, diabetes as well as nose, ear and throat disorders. The Medtronic sugar division produces external insulin pumps, continuous glucose monitoring devices, Carelink treatment management software and blood sugar meters. |
| * | Animas Corporation (hereinafter: "Animas") – Animas develops pager-sized automated insulin pumps, "worn" by diabetic patients, providing the body with continuous fast acting insulin. The infusion pumps, connected to a pipe with a needle inserted under the skin, replace the use of periodic insulin injections. Additionally, Animas sells diabetes management software and various pump accessories. It markets its products around the world through a combination of direct sales representatives and distributors. Animas is a Johnson & Johnson subsidiary, subordinated to its LifeScan division. |
| * | I-Flow Corporation (hereinafter: "I-Flow") – I-Flow designs, develops and markets drug delivery systems and surgical products for alleviating post surgical pains and treatment of the operated area. I-Flow products are used in hospitals, independent surgical centers, homes etc. The group deals mainly in design, development, production and marketing of advanced, cost-effective ambulatory infusion systems. It operates through a single operation channel. I-Flow has identified two product lines: local anesthetics and intravenous infusion treatment. It produces compact, mobile infusion pumps, catheters and pain kits that enable delivery of local anesthetics, cheparentapy, nutritious additives and other medications. Group customers include hospitals and alternative sites. It markets its products through distributors in the United States, Canada, Europe, Asia, Mexico, Brazil, Australia, New Zealand and the Middle East. |
19
Competition (continued)
The competitors' share of the global insulin pump market (based on revenue):
Medtronic is the leading supplier, hodling 58% of the market in 2009. Medtronic's MiniMed Paradigm product sells well: it is the first insulin pump integrated with the company's continuous sugar monitoring system (CGM), providing closer monitoring of glucose levels along with higher quality of living.
Roche, with a 12% market share, is the second leading supplier. The company's Accucheck insulin pump is characterized by steady growth due to properties including three operating menus, four bolus options, five basal profiles and smaller dimensions.
MiniMed (Medtronics) and Disetronic Medical Systems (Roche) were market leaders in this sector until 2000, when the market began to split flowing the entrance of companies such as Animas Corporation with is R1000 insulin pump, and Eltec with its Cozmo insulin pump. The acquisition of MiniMed, considered the leading insulin pump manufacturer in the USA, by Medtronic and acquisition of Disetronic, one of Europe's leading insulin pump manufacturers, by Roche helped these companies regain market shares and obtain control of the insulin pump global market.
Currently, Animas holds a 11% global market share and is in constant Competitors with Insulet, who has a 10% market share. Since at the moment, Insulet is the only company that supplies disposable insulin pumps, it has managed to increase its market share quickly since entering the arena in 2005.
20
Major Risk and Uncertainty Factors
An economic valuation should reasonably and fairly reflect a given situation for a particular time, based on known facts and defined risk factors, relating to the basic assumptions and forecasts based on this information. The starting point of our forecasts is the unaudited financial statements on 30 September 2011. According to company data presented to us, the major risk and uncertainty factors related and stemming from its line of business are:
| * | Financing problems. Company operation was stopped several months ago due to lack of financing. Delay and/or difficulty in raising the finance needed to renew its product development operation may cause the company to terminate its operation altogether. Furthermore, any delay in the company work schedule, for any reason, due to the extensive costs involved, may cause the company to incur additional expenses that could prevent completion of product development due to lack of the required financing sources. |
| * | Market recession. The recession in the Israeli and global financial markets and crisis such as the latest economic crisis that hit the global markets, may make it difficult for the company to raise the required financing sources and may make the financing terms obtained by the company, if any, more expensive. |
| * | Technological changes. Company operation results depend on its ability to finish developing its products and market them commercially. There are no assurances that R&D activity that begins in over a year's time will bear fruit, enabling successful Competitors with competing products. |
| * | Advanced medical instruments developed and manufactured by Competitors. Development of advanced medical devices by the company's competitors providing apt and/or more advanced alternatives to its products, may make future introduction to its destination markets more difficult. |
| * | Commercial production and marketing of company products. The company has not yet experienced production for commercial marketing. When the company transitions to production for commercial purposes, difficulties may arise that delay or even prevent expected sale of products and company development and growth. Successful marketing of company products is based on the company's ability to establish an efficient marketing and sales mechanism in cooperation with external parties. Inability to establish the required marketing and sales system may damage or even prevent commercial marketing of the products. |
| * | Completion of development of company products. The company is taking measures to complete development of its products. There is no certainty that development activities will conclude successfully, and the products are found efficient and safe for use. The company's development schedule may change, subject to existence of various factors. Failure to uphold the planned schedule may cause the company addition expense related to product development or even prevent completion of their development. Furthermore, costs related to the product development process may change and the company may incur additional product development expenses that may even prevent completion of the development without the required financing sources. |
21
Section 3
Financial Analysis
22
Profit and Loss Statement
The following table displays the reviewed profit and loss statement for Spring in the first nine months of 2012 and audited statements for the years 2010-2011 (in NIS thousands):
| NIS in thousands | December 31, 2009 | December 31, 2010 | December 31, 2011 | September 30, 2011 | September 30, 2012 | |||||||||||||||
| Income | 368 | 1,264 | 1,506 | 1,224 | 609 | |||||||||||||||
| Cost of sales | 437 | 4,778 | 4,580 | 5,130 | 1,006 | |||||||||||||||
| Gross profit | (69 | ) | (3,514 | ) | (3,074 | ) | (3,906 | ) | (397 | ) | ||||||||||
| R&D expenses | 6,314 | 9,336 | 11,773 | 10,223 | 1,375 | |||||||||||||||
| Sales and marketing expenses | 611 | 2,274 | 2,099 | 1,627 | 1,208 | |||||||||||||||
| General and Administrative expenses | 1,221 | 2,733 | 2,629 | 1,945 | 1,865 | |||||||||||||||
| Operating Profit (loss) | (8,215 | ) | (17,857 | ) | (19,575 | ) | (17,700 | ) | (4,845 | ) | ||||||||||
General
In view of the company's business situation and lack of available financing sources, on 21 March 2012 a decision was made to apply a strategic reorganization plan aimed a significant decrease in operational expenses, including cutting down on manpower and a pay cut for position holders. At the Valuation date, the company had stopped its R&D operations.
Operational revenue and profitability
Company revenue over the first nine months of the year totaled NIS 610 thousand, compared to NIS 1,225 thousand in the parallel period last year, mainly from sale of pump sets. The decrease in sale and the decrease in operational performance is derived mainly from lack of the resources required to support the company's ongoing operation and work in a diminished format from last March.
23
Balance sheet
The following table displays Spring's balance sheet draft for 30 September 2012 and audited balance for 31 December2011 (in NIS thousands):
| NIS in thousands | December 31, 2010 | December 31, 2011 | September 30, 2012 | |||||||||
| Current assets | ||||||||||||
| Cash and cash equivalent | 9,777 | 796 | 1,198 | |||||||||
| Short term deposits | 210 | 303 | 301 | |||||||||
| Trade receivables | 322 | 251 | 13 | |||||||||
| Other accounts receivable | 1,787 | 3,155 | 115 | |||||||||
| Fixed assets held for sale | - | - | 204 | |||||||||
| Inventory | 1,279 | 808 | 1,785 | |||||||||
| Total current assets | 13,375 | 5,313 | 3,615 | |||||||||
Non-current assets | ||||||||||||
| Long term deposits | 151 | 74 | 7 | |||||||||
| Fixed assets, net | 1,250 | 1,114 | 1,827 | |||||||||
| Intangible assets | 133 | 165 | 89 | |||||||||
Total non-current assets | 1,534 | 1,353 | 1,923 | |||||||||
| Total assets | 14,909 | 6,665 | 5,539 | |||||||||
| Current liabilities | ||||||||||||
| Trade payables and service providers | 3,125 | 296 | 195 | |||||||||
| Other accounts payable | 1,615 | 3,204 | 2,528 | |||||||||
| Loans from parent company | 22,126 | 27,657 | 35,229 | |||||||||
| Total current liabilities | 26,866 | 31,157 | 37,952 | |||||||||
Non-current liabilities | ||||||||||||
| Provision for chief scientist's royalties | 5,236 | 6,691 | 4,488 | |||||||||
| Obligations for capital lease and rent | - | - | 65 | |||||||||
| Liabilities for employee severance Benefits | 55 | 37 | - | |||||||||
| Total noncurrent obligations | 5,291 | 6,728 | 4,553 | |||||||||
| Equity | (17,248 | ) | (31,220 | ) | (36,966 | ) | ||||||
| Total liabilities and equity | 14,909 | 6,665 | 5,539 | |||||||||
Major assets in company balance for 30.9.2012 are fixed assets (approximately 33%), inventory (approximately 32%), cash and cash equivalent (approximately 27%).
Company liquidity is "weak" characterized by high reliance on parent company loans. The company's cash on 30.9.12 was only NIS 1,500 thousands. Should the company fail to raise external financing sources, its continued R&D operation is seriously threatened.
24
Section 4
Methodology and relevant accounting standards
25
Relevant Accounting Standards
The International Accounting Standard 36 (amended) (hereinafter: “standard” or “IAS 36”) is looking to ensure that the amount presented for an entity’s assets is is not bigger than their recoverable amount. An asset is presented by an amount that is bigger than its recoverable amount when the carrying amount of the asset is higher than the amount to be received from the use or sale of the asset. If this is the case, the asset is considered impaired and the standard requires the entity to recognize loss due to the decline in value of the asset.
The standard applies to all assets (except some exceptios specified in the standard) including fixed assets, intangible assets and goodwill acquired in a business combination. Goodwill acquired in a business combination represents payment made by the buyer, in anticipation of future financial benefits from assets that cannot be identified or recognized separately. Goodwill does not produce cash flows that are independent from other assets or groups of assets, and often contributes to the cash flow of several cash-generating units.
Cash generating unit is the smallest identified group of assets that generate positive cash flows, which are substantively independent of positive cash flows from other assets or groups of assets.
Determining impairment of depreciable assets. The standard defines several stages to identify, acknowledge and measure impairment of an asset that is systematically depreciated or amortized , including fixed assets. Only when one stage is realized, it passes on to the following stage.
Stage A – identifying an asset that may be impaired
An entity shall assess at the end of each reporting period whether there is any indication that an asset may be impaired. If any such indication exists, the process of evaluation should continue. Examination of the indications will be carried out on the date of each balance. The standard provides a list of examples for indications of impairment:
External sources of information
| * | During the period, as asset's market value has declined significantly more than would be expected as a result of the passage of time or normal use; |
| * | Significant changes with an adverse effect on the entity have taken place during the period, or will take place in the near future, in the technological, market, economic or legal environment in which the entity operates or in the market to which an asset is dedicated; |
| * | market interest rates or other market rates of return on investments have increased during the period, and those increases are likely to affect the discount rate used in calculating an asset's value in use and decrease the asset's recoverable amount materially; |
| * | The carrying amount of the entity’s net assets is more than the entity’s market capitalization. |
26
| Internal sources of information |
| * | There is available evidence of obsolescence or physical damage of an asset. |
| * | Significant changes with an adverse effect on the entity have taken place during the period or are expected to take place in the near future, in the extent to which, or the manner in which the asset is used or expected to be used. |
27
Relevant Accounting Standards (continued) |
| * | There is evidence showing the asset’s economic performance is, or will be, worse than expected. |
Should signs of impairment in value be found, one should examine whether impairment has occurred in view of the above signs and others. For that, the recoverable amount should be measured. Should the recoverable amount of the asset be lower than its carrying amount, the asset should be written down accordingly. In addition, the standard requires an annual impairment test to be conducted for indefinite life intangible assets, intangible assets that are not yet ready for use and goodwill acquired in a business combination; the annual test is required regardless the existence, or lack of existence, of impairment indications.
Stage B – measuring the recoverable amount
The recoverable amount of an asset or cash generating unit is the higher of its fair value less costs to selle and its value in use. The recoverable amount will be determined for a single property or the cash generating unit to which it belongs.
Fair value less costs to sell, is the amount that may be obtained from the sale of an asset or cash generating unit in a transaction not influenced by special relationships between the parties, between a willing buyer and willing seller, operating in an intelligent manner, less the costs of disposal.
Value in use, is the present value of the future cash flows expected from the asset or cash-generating unit.
The standard determines it is not always necessary to determine both the fair value less costs to sell and its value in use, this is for example the situation when the value under one of these components is higher than the book carrying amount of the asset. Furthermore, the standard notes it is sometimes impossible to establish the fair value of the asset less costs to sell, particularly when the asset is not traded in an active market. In this situation, the standard notes that the entity may use the assets’s value in use, as its recoverable amount.
According to the standard, the value in use of an asset (or cash generating unit) includes positive and negative cash flows from ongoing use of the asset (including operational overhead and cost of “maintaining the existing state”). The standard emphasizes cash flows from the asset are not to include negative flows from financing activities and payments or income tax returns.
The standard further emphasizes, the capitalization rate in which the asset’s (or cash generating unit’s) cash flows should be capitalized is the pre-tax discount rate , reflecting the market assessments of the time value of money and specific risks of the asset (or cash generating unit) for which the asset’s cash flows were not adjusted.
28
Relevant accounting standards (continued)
Stage C – recognition and measurement of loss due to impairment
As mentioned above, the recoverable amount is the highest of the assets’s fair value and/or asset’s value in use. The asset’s carrying amount must be reduced to its recoverable amount only if the asset’s recoverable amount is lower than its carrying account.
Carrying amount is defined as the amount presented in the books after deducting the accumulated depreciation and accumulated impairment losses.
This deduction constitutes loss from impairment. Additionally, the standard requires that loss due to impairment will be recognized immediately in the profit and loss statement, when the impairment of a cash generating unit will first be allocated to goodwill, if any, and then to the remaining noncurrent assets in proportion to their carrying amount.
The standard also determines a limit for allocation of loss from impairment to an asset belonging to a cash generating unit so that the asset, in the second stage, is not written down beyond the higher of its fair value less costs tosell or value in use, or zero.
29
Common Valuation Approaches
There are several commonly used methods of evaluating the financial value of businesses and companies:
* Net asset value method (NAV)
* Comparison to similar transactions
* Multiplier method, and
* Discounted cash flow (DCF) method
Net asset value (NAV) method
The net asset value (NAV) method is suited mainly for business with multiple tangible assets, such as companies holding real-estate properties. This method is based on the cost of the property held by the business minus its obligations, reflected in its balance sheet. Additionally, NAV is used to evaluate the worth of holding companies.
The approach is also suitable for valuation of the establishment costs of a similar business, but not necessarily to assess potential profit expected from the business' assets. The major drawback of the method is in the fact it overlooks existing profit potential of the business beyond the assets recorded in the books.
Comparison with similar transactions
Comparison with similar transactions uses the actual price of the sales transaction of the evaluated business or of similar businesses, providing this transaction was carried out a reasonable time before the Valuation. In order to compare with transactions in similar businesses, transactions that are similar in their line of business, operational properties, tradability rate and financial data should be located.
The Valuation stages in comparing with similar transactions are:
* Locate transactions in businesses with operational properties similar to the evaluated business.
| * | Find an appropriate base to compare the relative size of the similar businesses with the evaluated business. |
| * | Calculate a mean multiplier of the similar transactions and evaluate the business by using this multiplier. |
The advantages of this method is by properly reflecting, through prices actually determined between willing buyers and sellers, all parameters that influence value and prevents the need to base the valuation on forecasts that may be questionable. Furthermore, using transactions that were realized close to the Valuation date ensures the value produced using this method is based on similar financial reality and business environment, truly reflected by the market price.
The major drawback of this method is the difficulty, usually encountered when trying to trace similar transactions from which the value of the evaluated business may be derived.
30
Common Valuation Approaches (continued)
Multiplier method
The multiplier method resembles the comparison to similar transactions but is based on the share prices of public companies in the evaluated business' sector.
Using the multiplier method, the business is evaluated based on the mean ratio in the field in which it operates, between data based on market values and a selected accounting parameter. The acceptable parameters include net profit, operational profit, sales and equity. Sometimes operational parameters are used, including number of subscribers, sales area etc. The mean ratio in the line of business between market value and that parameter.
It is particularly worthy for obtaining an initial general assessment of the value of the business, but does not provide precise value. The advantage of the method is its simplicity and speed compared to other methods. The major disadvantage is in the fact it does not include a series of factors that may influence the specific value of the business, unlike "similar" businesses in the same field, e.g.: different growth rate, capital structure etc. Another drawback is that in most cases there is a wide range of multipliers and the average does not necessarily bring the correct result.
Discounted Cash Flow method
The discounted cash flow method is based on assessment of the ability of the business to produce cash. Accordingly, the value of the business is assessed through discounted cash flow it is expected to produce. Future cash flows are discounted at the capital rate that reflects the risk involved in the business operations and expresses the gain an investor would expect to make from a business with similar risk.
The discounted cash flow method is the most acceptable method with the soundest theoretical base. To use this method a financial model should be constructed to forecast sales, sales growth, management and selling expenses, taxes and investments, from which the expected cash flow is derived.
The major advantage of the method comes from its adaptation to a specific business and attention to unique factors within the evaluated business. This characteristic creates relatively high precision. The method's disadvantages are the difficulty in forecasting relevant future revenue, expenses and investment and determining the appropriate capital price.
Scenario analysis
In certain cases, the discounted cash flow method is applied to a series of alternative scenarios for the business and the field it operates in. Usually, this is done when the business and/or field are under significant uncertainty. In this framework, several clearly different scenarios are examined, reflecting the business operation results under different assumption on the business and field development. For each scenario an individual DCF analysis is generated. The realization probability of each scenario is calculated. The value of the business is based on the weighted average of the different scenarios.
31
Goodwill impairment examination method
Examination of goodwill impairment was carried out as of September 30, 2012, t in view of indications of impairment, as assessed by D medical management, during the reported period.
Since goodwill cannot be assessed separately from Spring's operation, the accepted method of examining impairment in goodwill value is assessing the recoverable value of each cash generating unit to which the acquired goodwill or part of it has been related.
Since Spring was identified as the smallest cash generating unit to which goodwill may be allocated, and since the company is not traded, there is no basis for reliable assessment of the expected return from its sale in an arm's lengths transaction between a willing buyer and seller, behaving rationally. Therefore, the net selling price of Spring cannot be determined and its recoverable amount will be based on its value in use.
The measurement of the recoverable amount is therefore based on the company's value in use. The value in use is assessed using the DCF method of the revenue expected from company operation, applying the scenario method, based on company management assessments, data and documents received from the company and our assumptions specified below.
Possible scenarios:
| * | Pessimistic scenario (assessed by D Medical management at 80% probability). This scenario assume the company will be terminated due to lack of external financing sources and/or failure in introducing its products to destination markets. Since the company does not have substantial tangible assets, in this case its value is zero. |
| * | Base scenario (20% probability). The company raises the financial resources required to continue its ongoing operation and markets its products according to the multi-annual business plan. |
The company's value in use composed of the scheme for the two above mentioned scenarios will, as mentioned above, constitute the recoverable amount. This amount will be compared to the company's book value (based on the 30 September 2012 financial statement).
32
Discount rate
In order to assess asset value using the revenue approach, annual cash flows from the asset must be discounted to the present value by the discount rate that enfolds the risks included in the cash flow and realization of expected cash flow.
In determining the discount rate, one must take into account that the discount rate is relative to the risk included in the specific investment. An investor compares alternative investments and chooses the one that brings him the highest return on his investment, under given risk levels. When determining the discount level, one should relate to the mean return on capital of the company in general. This discount rate is the weighted average cost of external capital and return on the shareholders' capital.
The discount rate is calculated using the WACC model, Weighted Average Cost of Capital, including cost of external capital and return on shareholders' capital, specified below.
WACC = Kd * (d%) + Ke * (e%)
In which:
Kd – debt return rate
d% = percentage of debt from total assets
Ke = percentage of return on equity
e% = percentage of equity from total assets
Debt return rate – the price of normative debt paid by the company, we value it at 0%.
Spring's capital structure – to assess the ratio of debt compared to Spring's total assets the weight of equity was assessed at 100%.
Equity return rate – determined using the CAPM (Capital Asset Pricing Model). According to this model, the return rate on equity is derived from riskless interest on the date of purchase in addition to market risk premium multiplied by the company's risk level compared to the market portfolio standard deviation (β).
Ke=Rf+b *(Rm-Rf)
In which:
Riskless Israeli interest (Rf) - is determined based on average return of State of Israel "Galilee" type long range bonds valued at 2.28%*.
Market risk premium (Rm-Rf) – was calculated according to the company's destination market risk premium valued at 8.08**.
------------------
* Source: Bank of Israel
** Source: Stern Business School, Damodaran online
33
Capitalization rate (continued)
Spring's beta (β) – the company's relative risk factor compared to market premium. This factor reflects relative risk involved in any investment, based on the correlation between investment return to general market capital return. When this factor is greater than 1, the business is highly sensitive to market fluctuations. I.e., in case of recession the field will be worse hit than others and in case of flourishing, the field will be influenced positively more than other fields. When this factor is smaller than one, the value of the business is sensitive below average to market fluctuations.
For Valuation purposes, we used the average beta of the comparison companies (specified in Appendix A). This beta is an estimated 0.81.
Small company risk premium (SFP) – another return rate related to company shares and reflecting specific risks, including additional premium demanded in case of lack of tradability and liquidity (hereinafter: "tradability premium"). Empirical data and various studies show investors in the capital market usually demand additional risk premiums for investment in companies, expressing the different parameters of their investment. The appropriate discount rate for company capital was composed in this study from the Specific Premium Size rate assessed at the date of our study at 11.77%*. And additional risk premium relating to private companies and negative operational parameters assessed in our paper at 5% (similar to previous Valuation) on interim results of the calculated Ke. Accordingly, the return rate on equity is 25.58%.
According to these parameters the capital price determined for the company is 25.58%, detailed in the table below:
WACC
| Risk-less interest rate in Israel (Rf) | 2.28% |
| Market premium (Rm-Rf) | 8.08% |
Beta (β) | 0.81 |
| Additional risk premium (Rs) | 16.77% |
| Price of capital (Re) | 25.58% |
| Weight of equity | 100.0% |
| Price of debt (Kd) | 0% |
| Percentage of tax | 25% |
| Representative debt price, before tax | 0% |
| Weight of debt | 0% |
| WACC, rounded | 25.58% |
International standard 36 requires to assess pre-tax cash flows at the pre-tax discount rate. However, post-tax cash flow discounted at the discount rate after tax, as calculated by us, will give an almost identical result. In view of this, and for completeness reasons, we decided to present the pre-tax cash flow and use the pre-tax discount rate, that is estimated at 30.8%.
-----------------
* The company in re is a private company operating in Israel while the compared company sample relates to public companies traded on leading global stock exchanges with substantially higher operation volumes than the company's. Furthermore, they have more varied operations and in most cases higher gross profit margins than the company's. Therefore, based on differences in returns between small and large American companies, a specific risk premium was selected. Valuation Edition Yearbook [2012], Boston Associates Inc.
34
Section 5
Valuation
35
Key Working assumptions
Profit and Loss Statements
Spring's valuation was carried out, as mentioned, using the income approach through discounted cash flows (DCF) expected to derive from company, while applying the scenario analysis approach. Based on the company's historical performance, multi-annual business forecast, company budget compared to execution in 2012 and public information, forecast cash flows for the forecasted period was determined.
Pessimistic scenario. As specified in the previous section, the pessimistic scenario assume the company will not manage to raise financing resources for its continued operation and/or will not manage to enter destination markets. Since the company does not have substantial tangible assets, company value in this scenario is zero.
Base scenario. In this case, since the company is a startup company due to begin sales only in 2014 and reach "relative" stability in sales growth in 2018, a six-year forecast period was used. The cash flow was discounted by the appropriate return rate for the company's development stage.
The following table presents expected profit and loss statements for Spring in the base scenario (NIS thousands):
| NIS k | 2009A | 2010A | 2011A | 2012A 9m | 2012E Q4 | 2013E | 2014E | 2015E | 2016E | 2017E | 2018E | Repre- sentative | ||||||||||||||||||||||||||||||||||||
| Sales | 368 | 1,264 | 1506 | 609 | - | - | 565 | 8,059 | 27,024 | 73,817 | 132,707 | 139,342 | ||||||||||||||||||||||||||||||||||||
| Cost of Sales | 437 | 4,778 | 4,580 | 1,006 | - | - | 648 | 7,405 | 15,821 | 42,676 | 74,316 | 78,032 | ||||||||||||||||||||||||||||||||||||
| Gross profit | (69 | ) | (3,514 | ) | (3,074 | ) | (397 | ) | - | - | (83 | ) | 654 | 11,203 | 31,140 | 58,391 | 61,311 | |||||||||||||||||||||||||||||||
| Gross profit % | (18.8 | )% | (278 | )% | (204.1 | )% | (65.2 | )% | (14.7 | )% | 8.1 | % | 41.5 | % | 42.2 | % | 44. | % | 44.0 | % | ||||||||||||||||||||||||||||
| R&D costs | 6,314 | 9,336 | 11,773 | 1,375 | - | - | 2,471 | 2,901 | 3,243 | 7,382 | 10,617 | 11,147 | ||||||||||||||||||||||||||||||||||||
| Sales and marketing costs | 611 | 2,274 | 2,099 | 1,208 | - | - | 2,259 | 3,980 | 7,490 | 12,351 | 16,044 | 16,847 | ||||||||||||||||||||||||||||||||||||
| Management and administrative costs | 1,221 | 2,733 | 2,629 | 1,865 | 419 | 1,896 | 2,305 | 2,801 | 3,405 | 4,139 | 5,031 | 5,282 | ||||||||||||||||||||||||||||||||||||
Total operating expenses | 8,146 | 14,343 | 16,501 | 4,448 | 419 | 1,896 | 7,034 | 9,638 | 14,138 | 23,872 | 31,692 | 33,276 | ||||||||||||||||||||||||||||||||||||
Operating profit (loss) rate | (8,215 | ) | (17,857 | ) | (19,575 | ) | (4,845 | ) | (419 | ) | (1,896 | ) | (7,117 | ) | (9,029 | ) | (2,935 | ) | 7,269 | 26,699 | 28,034 | |||||||||||||||||||||||||||
| Profit (loss) % on regular operation | (2232 | )% | (1413 | )% | (1300 | )% | (796 | )% | - | - | (1259.5 | )% | (112.0 | )% | (10.9 | )% | 9.8 | % | 20.1 | % | 20.1 | % | ||||||||||||||||||||||||||
36
Key working assumptions (continued)
Expected revenue
The following table shows the expected revenue according to the different products in the base scenario (NIS in thousands)
| NIS k | Q4 2012E | 2013E | 2014E | 2015E | 2016E | 2017E | 2018E | Representative | ||||||||||||||||||||||||
Springtm Zone pump | - | - | 528 | 5,468 | 8,220 | 9,852 | 8,161 | 8,569 | ||||||||||||||||||||||||
Dedicated IV set for Springtm Zone pump | - | - | 37 | 984 | 2,753 | 4,778 | 6,438 | 6,760 | ||||||||||||||||||||||||
Hybrid dressing pump Springtm Zone | - | - | - | 1,168 | 9,400 | 30,006 | 47,013 | 49,364 | ||||||||||||||||||||||||
| Dedicated IV set for hybrid pump | - | - | - | 439 | 6,651 | 29,180 | 71,095 | 74,649 | ||||||||||||||||||||||||
| Total revenue | - | - | 565 | 8,059 | 27,024 | 73,817 | 132,707 | 139,342 | ||||||||||||||||||||||||
| Growth rate | 1326 | % | 235 | % | 173 | % | 80 | % | 5 | % | ||||||||||||||||||||||
Spring's revenue forecast is founded on the company's multi-annual business plan, examining its reasonability according to public information on the market in which it operates, and discussions with D Medical management.
The company's forecast revenue is based on its expected sales in the following product lines:
* SpringTM Zone pump
* Dedicated IV set for SpringTM Zone pump
* Hybrid dressing pump SpringTM Zone
* Dedicated IV set for the hybrid pump
Details below:
SpringTM Zone pump
The multi-use insulin pump SpringTM Zone is used as the improved next generation for the company's Adi pump; part of the universal IV set Medex that the company began marketing as a pilot from 2010 to late 2011, due to its weak business situation. As far as the company is aware, SpringTM Zone pump is the only insulin pump that applies the IntellispringTM insulin delivery technology. This technology, backed by a continuous monitoring safety system Total Line ControlTM (TLC), enables a new innovative dimension in continuous monitoring and control of insulin delivery (for more information see Section 1).
Early this year, the company obtained CE permission to market the insulin pump in Europe. However, due to lack of financing, commercialization operations were put on hold. D Medical management believes the product will be launched to distributors in the fourth quarter of 2014.
37
Key Working assumptions (continued)
Here are the major working assumptions used to examine company revenue forecast for the product:
| * | Global market potential of insulin pumps (in quantitative terms): based on global market potential for insulin and scope of global population we calculated the number of insulin pumps in relation to the population. This ratio was multiplied by the European population estimate* (as mentioned, the company intends to begin marketing in Europe in the fourth quarter of 2014). Market potential considered the insulin pump's life expectancy, an estimated 4 years according to public information. |
| * | 7.9% annual growth in the number of insulin pump users.** |
| * | Gradual infiltration rate of 3% into the European market. |
| * | 25% annual wear and tear rate in the number of multiple-use pumps replaced with the hybrid pumps. |
| * | Sales prices were based on D Medical management forecast. Prices were compared to competing products and found reasonable. |
| * | Based on the body of working assumptions specified above, the expected revenues from SpringTM Zone pump sales, between NIS 530 thousands in 2014 to approximately NIS 8,160 thousands in 2018, was found to be reasonable. Additionally, a permanent growth rate of 5% was assumed. |
Dedicated IV set for SpringTM Zone pump |
Along with the SpringTM Zone pump sales, the company intends to sell its distributors the dedicated disposable IV set developed for the pump.
The major working assumptions used to examine the reasonability of the company's revenue forecast for the product are specified below:
* Amount of sales forecast for SpringTM Zone pump, assessed above.
* Annual ratio of 120 sets per pump (replacement every three days).
| * | Sales prices were based on D Medical management forecast. Prices were compared to competing products and found reasonable. |
| * | Based on the body of working assumptions specified above, the expected revenues from SpringTM Zone pump IV set sales, between NIS 40 thousand in 2014 to approximately NIS 6,440 thousands in 2018, was found to be reasonable. Additionally, a permanent growth rate of 5% was assumed. |
SpringTM Zone hybrid dressing pump |
At the date of the assessment, the company is in final stages of developing the SpringTM Zone hybrid dressing pump. The system is hybrid since it can be worn as a dressing pump directly on the body or traditionally by connecting it to the body with an IV set (for more information, see Section 1). The hybrid pump offers, in addition to small dimensions, a price that is cheaper than similar products. The company intends to exploit this advantage for future infiltration into developing markets, e.g. BRIC countries, with a low rate of medical insurance and sensitivity for product prices.
-------------------
* United Nations, Department of Economic and Social Affairs, Population Division.
** Bio Spectrum, "Global insulin pumps market to reach $1.2 billion by 2017" December 30, 2011.
38
The first version of the pump received SE approval. Company management expects to finish development and design of the pump, including regulatory permission in Europe and the USA towards the end of 2014. Company forecast does not include sale of the pump to BRIC countries due to the high uncertainty involved in entering these developing markets.
Major working assumptions that served to examine reasonability of company revenue forecast for the product are specified below:
| * | Global market potential of insulin pumps (in quantitative terms): based on global market potential for insulin and scope of global population we calculated the number of insulin pumps in relation to the population. This ratio was multiplied by the European and American population estimate* (as mentioned, the company intends to begin marketing in Europe and the USA in the fourth quarter of 2014). |
| * | 7.9% annual growth in the number of insulin pump users. |
| * | Gradual infiltration rate of 3% into the European and American markets over 6 years. |
| * | 25% annual wear and tear rate in the number of multiple-use pumps replaced by the hybrid pumps. |
| * | Sales prices were based on D Medical management forecast. Prices were compared to competing products and found reasonable. |
| * | Based on the body of working assumptions specified above, the expected revenues from SpringTM Zone hybrid dressing pump sales, between NIS 1,170 thousands in 2015 to approximately NIS 47,000 thousands in 2018, was found to be reasonable. Additionally, a permanent growth rate of 5% was assumed. |
Dedicated IV set for SpringTM Zone hybrid dressing pump |
Along with the SpringTM Zone hybrid dressing pump sales, the company intends to sell its distributors the dedicated IV set developed for the pump.
The major working assumptions used to examine the reasonability of the company's revenue forecast for the product are specified below:
* Amount of sales forecast for SpringTM Zone hybrid dressing pump, assessed above.
* Annual ratio of 120 sets per pump.
| * | Sales prices were based on D Medical management forecast. Prices were compared to competing products and found reasonable. |
| * | Based on the body of working assumptions specified above, the expected revenues from SpringTM Zone pump IV set sales, between NIS 440 thousand in 2015 to approximately NIS 71,100 thousands in 2018, was found to be reasonable. Additionally, a permanent growth rate of 5% was assumed. |
-------------------
* United Nations, Department of Economic and Social Affairs, Population Division.
39
Key working assumptions (continued)
Cost of sales and gross profitability
The following table shows the expected cost of sales and operational profit according to the different products in the base scenario (NIS in thousands)
| NIS k | Q4 2012E | 2013E | 2014E | 2015E | 2016E | 2017E | 2018E | Representative | ||||||||||||||||||||||||
Springtm Zone pump | - | - | 480 | 3,740 | 4,526 | 5,969 | 4,891 | 5,135 | ||||||||||||||||||||||||
Dedicated IV set for Springtm Zone pump | - | - | 168 | 2,845 | 4,094 | 6,349 | 8,500 | 8,925 | ||||||||||||||||||||||||
Hybrid dressing pump Springtm Zone | - | - | - | 520 | 3,560 | 13,638 | 20,603 | 21,633 | ||||||||||||||||||||||||
| Dedicated IV set for hybrid pump | - | - | - | 300 | 3,641 | 16,720 | 50,322 | 42,339 | ||||||||||||||||||||||||
| Total cost of sales | - | - | 648 | 7,405 | 15,821 | 42,676 | 74,316 | 78,032 | ||||||||||||||||||||||||
| Percentage of sales | - | - | 114.7 | % | 91.9 | % | 58.5 | % | 57.8 | % | 56.0 | % | 56.0 | % | ||||||||||||||||||
| Gross profit | - | - | (83 | ) | 654 | 11,203 | 31,140 | 58,391 | 61,311 | |||||||||||||||||||||||
| Percentage of sales | - | - | (14.7 | )% | 8.1 | % | 41.5 | % | 42.2 | % | 44.0 | % | 44.0 | % | ||||||||||||||||||
The sales price of each product was based on the company's multi-annual business plan, while examination reasonability of gross profitability compared to other companies, as specified below:
| * | As mentioned, D Medical management's key working assumption is that initial sales will only being in the fourth quarter of 2014. Therefore, gross profit in the fourth quarter of 2012 and in 2013 is zero. |
| * | Gradual growth in the gross profit was assumed to a level of 44% in 2018 and the representative year. The representative gross profit rate was examined compared to Insulet Co. gross profit rate in 2010 until the first quarter of 2012 and was found similar (44.2%), and below the average gross profit rate in compared companies for this period (range between 37% to 77%). |
| * | Gross profit margins during the forecast period reflect a more moderate improvement compared to a previous Valuation that assumed 68% in the final years of the forecast. |
40
Key working assumptions (continued)
Operational expenses and profitability
The following table shows the expected operational expenses in the base scenario (NIS k)
| NIS k | Q4 2012E | 2013E | 2014E | 2015E | 2016E | 2017E | 2018E | Representative | ||||||||||||||||||||||||
| R&D expenses | - | - | 2,471 | 2,901 | 3,243 | 7,382 | 10,617 | 11,147 | ||||||||||||||||||||||||
| Percentage from sales | - | - | 437.3 | % | 36.0 | % | 12.0 | % | 10.0 | % | 8.0 | % | 8.0 | % | ||||||||||||||||||
| Sales and marketing expenses | - | - | 2,259 | 3,980 | 7,490 | 12,351 | 16,044 | 16,847 | ||||||||||||||||||||||||
| Percentage from sales | - | - | 399.7 | % | 49.4 | % | 27.7 | % | 16.7 | % | 12.1 | % | 12.1 | % | ||||||||||||||||||
| General and administrative expenses | 419 | 1,896 | 2,305 | 2,801 | 3,405 | 4,139 | 5,031 | 5,282 | ||||||||||||||||||||||||
| Percentage from sales | 407.9 | % | 34.8 | % | 12.6 | % | 5.6 | % | 3.8 | % | 3.8 | % | ||||||||||||||||||||
| Total operational cost | 419 | 1,896 | 7,034 | 9,683 | 14,138 | 23,872 | 31,692 | 33,276 | ||||||||||||||||||||||||
| Percentage from sales | - | - | 1244.8 | % | 120.1 | % | 52.3 | % | 32.3 | % | 23.9 | % | 23.9 | % | ||||||||||||||||||
| Operating profit | (419 | ) | (1,896 | ) | (7,117 | ) | (9,029 | ) | (2,935 | ) | 7,269 | 26,699 | 28,034 | |||||||||||||||||||
| Percentage from sales | - | - | (1259.5 | )% | (112.0 | )% | (10.9 | )% | 9.8 | % | 20.1 | % | 20.1 | % | ||||||||||||||||||
Expected company operational costs are based on the following assumptions :
| * | R&D expenses. R&D expenses in the fourth quarter of 2012 and in 2013 were assumed to be according to the company's multi-annual business plan. To forecast R&D expenses in remaining forecast years we used the R&D costs of the compared companies (for details, see Appendix A). In the long term, it was assumed this expense rate would gradually decrease to a level of 8% from 2018; similar to the lower range of the compared companies in 2009-2011 and first quarter/half of 2012. |
| * | Marketing and sales costs. In order to sell its products, the company intends to use a distribution network, among other things in order to foist most marketing and sales expenses onto them. However, the company intends to invest efforts in marketing its products in the coming years in order to reach additional markets. Sales and marketing costs were assumed to conform to the company's multi-annual business plan, and in the long range it was assumed these expenses would gradually decrease to a 12% level from 2018. In order to examine the reasonability we analyzed the changing and permanent component in the expected expense structure for each of the sales and marketing expense components, including change in volume of each of the sales and marketing expense components compared to the change in revenues. |
| * | General and administrative costs. These costs were assumed to conform to company forecast throughout the forecast years. General and administrative costs will gradually decrease to 5% of revenue. |
41
Key Working Assumptions (continued)
Operational profit. Operational loss was assumed for the fourth quarter of 2012 and the years 2013-2014, as was assumed in the company's business plan. From 2015, gradual growth in operational profit was assumed to the rate of 20% in 2018 onwards. Operational profit margins were examined in comparison with other companies and found reasonable.
Investment and depreciation
The investment forecast in fixed assets was founded on management investment plan policy, and in view of the investments required due to the financial depreciation of company property. Additionally it was assumed that in the representative year investment in fixed assets will equal annual depreciation expenses.
Investment in return capital
Annual investment in return capital was calculated according to the historical average of credit days, discussions with D Medical management and reasonability examination with comparison companies, as follows:
* Customer days – 75
* Inventory days – 180
* Supplier days – 45
Price of capital
Price of capital for free cash flow discount, expressing the business risk involved in company operation, was determined at 25.6% (for details on weighted capital price calculation, see Section 4 above). This price of capital reflects a pre-tax price of 30.8%.
International standard 36 instructs assessing pre-tax cash flows at the pre-tax discount rate. However, post-tax cash flow discount at the discount rate after tax, the discount rate we calculated, will give an almost identical result. In view of this, and in order to provide a complete Valuation, we decided to present the pre-tax flow and discount rate.
42
Cash Flow Forecast
The cash flow forecast for the forecast period in the base assumption is specified below (NIS k):
| NIS k | Q4 2012E | 2013E | 2014E | 2015E | 2016E | 2017E | 2018E | Representative | ||||||||||||||||||||||||
| Net profit | (419 | ) | (1,896 | ) | (7,117 | ) | (9,029 | ) | (2,935 | ) | 7,269 | 26.699 | 28.034 | |||||||||||||||||||
| Changes in working capital | - | - | (356 | ) | (4,039 | ) | (7,010 | ) | (19,548 | ) | (23,803 | ) | (2,738 | ) | ||||||||||||||||||
| Depreciation | 104 | 441 | 774 | 1,552 | 1,571 | 1,589 | 1,608 | 1,618 | ||||||||||||||||||||||||
| Investment in fixed assets | - | (1,800 | ) | (4,200 | ) | (100 | ) | (100 | ) | (100 | ) | (100 | ) | (1,618 | ) | |||||||||||||||||
| Total | (316 | ) | (3,255 | ) | (10,898 | ) | (11,616 | ) | (8,474 | ) | (10,790 | ) | 4,404 | 25,297 | ||||||||||||||||||
| Residual value | 102,738 | |||||||||||||||||||||||||||||||
| Discounted cash flow | (305 | ) | (2,660 | ) | (6,807 | ) | (5,545 | ) | (3,091 | ) | (3,008 | ) | 938 | 20,846 | ||||||||||||||||||
| Operation value | 367 | |||||||||||||||||||||||||||||||
In order to calculate operational value, the operational cash flow was derived prior to financing expenses and after investment in return capital and fixed assets. The free cash flow was discounted at the capital price that reflects the operational risk of the operation, assessed at 30.8%. Additionally, it was assumed real growth of 5% will occur in the free cash flow after the forecast period.
Weighted returnable amount
Every scenario was weighted by its realization probability. The weighted returnable amount is the amount of the weighted scenarios.
Calculation of the weighted returnable amount (NIS k):
| Scenario | Probability | Returnable amount | Weighted amount | |||||||||
| Pessimistic | 80 | % | 0 | 0 | ||||||||
| Base | 20 | % | 367 | 74 | ||||||||
| Total | 100 | % | 74 | |||||||||
43
Examination of impairment in goodwill value
Company book value
Spring's total financial value provided by the company (NIS k):
| Item | 30.9.12 | |||
| Operational assets | ||||
| Inventory* | 18 | |||
| Total operational assets | 18 | |||
| Total operational obligations | - | |||
| Operational assets, net | 18 | |||
| Intangible assets | 89 | |||
| R&D in process | 2,201 | |||
| Total book value | 2,308 |
* Note: according to D Medical management only NIS 18 thousand from the remaining inventory belong to the company
The following table displays the examination of impairment of the company's goodwill (NIS in thousands):
| Weighted "value in use" | 74 | |||
| Book value | 2,308 | |||
| Difference | (2,234 | ) |
According to our assessment, based on our calculations, subject to exceptions mentioned above and below, Spring's operational value is valued at the date of our paper at NIS 74 thousand. This value is lower than the net book value related to the company, of NIS 2,308 thousand on 30 September 2012, therefore, in view of the above, we have found said goodwill value to be impaired.
The following table displays a dual-parameter sensitivity analysis of company operational value in the base scenario compared to company pre-tax weighted capital price and permanent growth rate (NIS k):
| Capitalization Rate | ||||||||||||||||||||||||
| 29.9 | % | 30.4 | % | 30.9 | % | 31.4 | % | 31.9 | % | |||||||||||||||
| Permanent growth rate | 2.0 | % | (643 | ) | (1,239 | ) | (1,800 | ) | (2,328 | ) | (2,825 | ) | ||||||||||||
| 3.0 | % | 110 | (529 | ) | (1,130 | ) | (1,695 | ) | (2,2260 | |||||||||||||||
| 4.0 | % | 922 | 235 | (409 | ) | (1,015 | ) | (1,584 | ) | |||||||||||||||
| 5.0 | % | 1,798 | 1,060 | 367 | (284 | ) | (895 | ) | ||||||||||||||||
| 6.0 | % | 2,748 | 1,952 | 1,206 | 505 | (152 | ) | |||||||||||||||||
44
Appeixes
45
Appendix A – Analysis of comparative companies
Analysis of comparative companies was carried out for the following purposes:
* Deriving beta in order to calculate discount rate (WACC).
* Probability check on company assumptions regarding operational parameters.
Description of comparative companies:
* Insulet Corporation
The company (NASDAQ: PODD) manufactures insulin injection systems for diabetics in the USA. The company manufactures compact systems designed to be carried and used by diabetics on their own and enabling control of the disease by injecting insulin and monitoring blood sugar levels. The company was founded in 2000 and its headquarters are in Bedford, Massachusetts.
* Medtronic Inc.
The company (NYSE:MDT) manufactures and supplies medical equipment, surgical devices and medical products for treatment of patients suffering from various chronic diseases. Company operation is organized in five business divisions, each providing products that treat urological disorders, diabetes, gastroenterological and neurological disorders. The company was established in 1949 and its headquarters are in Minneapolis, Minnesota.
It manufactures insulin IV systems for diabetics in the USA. The company manufactures compact systems designed to be carried and used by diabetics on their own and enabling control of the disease by injecting insulin and monitoring blood sugar levels. The company was founded in 2000 and its headquarters are in Bedford, Massachusetts.
* Vascular Solutions Inc.
The company (NASDAQ: VASC) develops solutions for cardiologists and renologists throughout the world. Company products include anti-bleeding dressings, mixture for prevention of bleeding under the skin, catheter system for removing arterial blood clots, laser kit for treating varicose veins etc. Additionally, the company provides niche products, including a wire for inter-venous access. The company was established in 1996 and is headquartered in Minneapolis, Minnesota.
* Retractable Technologies Inc.
The company (NASDAQ: RVP) develops, manufactures and markets safety syringes and other medical safety products. Company products include insulin syringes, antigen syringes, safety syringes to prevent infection and protect from wounds etc. The company was established in 1994 and is headquartered in Texas.
* Kensey Nash Corporation
The company (NASDAQ: KNSY) develops, manufactures and markets technologies, products, equipment biological substances and medical solutions for the health business. It flagship product is used to seal open perforations in the vascular system during surgical treatment. The company has additional products including: tissue fusion kits and other biometric products for treating orthopedic injuries etc. The company was established in 1984 and its headquarters are in Pennsylvania, USA.
46
Appendix A – Analysis of comparative companies (continued)
The following table displays the data from comparison companies used for reasonability tests for the gross profit, R&D and operational profit in 2010-2011 and the first nine months of 2012 (if published):
| Company | Gross profit | R&D cost rate | Operational profit | |||||||||
| Insulet | 44.2 | % | 14.5 | % | (29.1 | )% | ||||||
| Medtronic | 76.3 | % | 9.3 | % | 25.0 | % | ||||||
| Vascular | 66.6 | % | 11.9 | % | 16.7 | % | ||||||
| Retractable | 35.6 | % | 2.4 | % | (12.8 | )% | ||||||
| Kensey Nash | 67.2 | % | 24.0 | % | 22.0 | % | ||||||
| Average | 58.0 | % | 12.4 | % | 4.3 | % | ||||||
| Median | 66.6 | % | 11.9 | % | 16.7 | % | ||||||
47
Appendix B – Comparative analysis with pervious Valuation
We believe the decrease in operation value received in the present Valuation compared to the value from 31.12.11 (NIS 10,006 thousand in base assumption) is mainly explained by the following factors:
| * | Lack of financing sources that from March 2012 impaired the company's normal operation and postponed continued product development by two years until 2014 (current assessment) while the previous valuation assumed significant sales would begin in 2013 (approximately NIS 16,700 thousand). |
| * | Impairment in product infiltration rate in the first years. |
Comparison of the two Valuations (NIS k):
| NIS in thousands | Year 1 | Year 2 | Year 3 | Year 4 | Year 5 | |||||||||||||||
| Valuation on 31.12.11 | 375 | 16,711 | 45,662 | 81,914 | 120,142 | |||||||||||||||
| Present valuation | 565 | 8.059 | 27,024 | 73,817 | 132,707 | |||||||||||||||
| Difference | (190 | ) | 8,652 | 18,638 | 8,097 | (12,565 | ) | |||||||||||||
| * | CAGR in the present valuation was assessed at 290% compared to 325% in the previous valuation. |
| * | Representative gross profit adjustment (44%) compared to Insulet Co., the only comparison company that only manufactures insulin pumps (68% last year). |
| * | Updated sample of comparison companies. The comparison companies used last year included huge conglomerates engaged in various sectors with a large product line. The comparison companies in the present valuation includes companies with relatively low market value. |
| * | Reduction in representing operating income rate from 26% (previous estimate) to 19% (current estimate). |
| * | Deduction of representative operational profit from 29.5% before tax to 30.8%. |
| * | Permanent growth rate remained unchanged at 5%. |
| * | Probability of the pessimistic scenario (zero value) increased from 70% to 80%. |
48
Appendix C – Limited Liability
This paper is based, among other things, on data, forecasts and assessments received from D Medical management at our request. Liability for the reliability of the different types of information, data, presentations, assessments and explanations provided to us with regard to this paper lies on the providers of this information and we are unable to confirm their precision, wholeness and fairness. One should emphasize this paper does not include due diligence test or examination and verification of said information. Therefore, our paper may not be considered or provide confirmation of the truth, wholeness or precision of the data we received.
Our opinion does not constitute counseling or legal opinion. Interpretation of various documents we used was only for the purposes of this opinion.
In any case we will not be liable for any loss, damage, cost or expense incurred by any fashion or way from acts of fraud, misrepresentation, misleading, provision of incorrect or incomplete information or withholding of information by D Medical and/or anyone acting on its behalf or any other use of said information.
This paper is intended only for information and use by D Medical management and its independent auditors. It may not be used, distributed, quoted or related to in any form for any other purpose including, without limitation, registration, purchase or sale of securities. This paper may not be submitted or treated, fully or partially, in a registration statement or any other document. However, we agree this paper be attached to D Medical's financial statements.
This paper relates to the variety of aspects related to examination of the impairment in Spring's goodwill value recorded in D Medical's books. This paper does not constitute recommendation to any shareholder regarding their vote on any transaction or recommendation to buy or sell D Medical company shares in view of the findings herein.
We would like to note we do not have personal interest in D Medical and/or Spring Company shares.
For purposes herein, we assumed the data provided to us is precise, complete and fair, and nothing was brought to our attention that may attest to the lack of reasonability of the data we used. Should it turn out to the contrary, our recommendation will change accordingly. Therefore, we retain the right to update it in view of new data that was not brought to us prior to submission of the findings of this paper.
Should we be sued in a legal proceeding for any amount by any third party with regard to provision of the services we provide due to breach of our above undertakings, D Medical undertakes to bear all reasonable expenses we paid or are required to pay for legal counseling and representation, protection from legal proceedings etc. with regard to any lawsuit, claim or other proceedings due to the services we provide.
Furthermore, we are exempt from liability for any damage incurred by D Medical or anyone acting on its behalf due to D-d and/or omission related directly and/or indirectly to execution of services, except in cases of gross negligence or malice on our part. Our liability, as far as it stems from provision of said services will not exceed in any case the amount of the remuneration we received from D Medical in return for said services.
The reader must read all the assumptions made throughout the paper.
49
Appendix D – Details of the evaluating company and appraiser
Details of valuating company – Laor Consulting & Investments Ltd.
Laor Consulting and Investments Co. Ltd. specializes in providing economic-financial consultation and independent professional valuations, based on international accounting regulations US GAAP, IFRS and Israeli accounting regulations, for financial reporting purposes and as expert opinion for courts in Israel and abroad. Company customers include startup companies, public companies and government ministries and entities.
Company specialization areas include:
| Accounting standardization | Business-financial consultation | Investment banking | Project financing | Research |
| Purchase price access allocation (PPA) | Company valuation | Mergers and acquisitions | Project feasibility examination | Macro reviews |
| Damaged goodwill tests | Viability tests | Initial public issue (IPO) | Counseling for government ministries and companies | Branch reviews |
| Employee and executive option pricing | Business plans/ tenders | Counseling for private issue | Accompaniment and counseling for private companies | |
| Pricing of financial instruments and derivatives | Promotion programs and chief scientist | Accompaniment in financing and financial closure | ||
| Regular share valuation (409A) | Representing companies with the banking system | Constructing complex financial models | ||
| Planning and generating compensation plans | Opinion for courts | Model auditing | ||
| Financial risk management |
Details of supervising appraiser: Mr. Igor Litvinov
Over 11 years financial business experience. Expert in financial engineering and application of transition to international accounting, IFRS, including fair value appraisal of complex financial instruments. Igor has extensive experience in accompaniment and consultation for a large number of companies, focusing on valuation of companies and personal involvement in issuing companies on the Tel Aviv stock exchange and NASDAQ. Has an MBA in business administration and BA (with honors) in economics and administration. Also has an investment portfolio management license from the Securities Authority.
50
SIGNATURES
Pursuant to the requirements of the Securities Exchange Act of 1934, the Registrant has duly caused this report to be signed on its behalf by the undersigned, thereunto duly authorized.
Date: December 3, 2012 | D. MEDICAL INDUSTRIES LTD. (Registrant) By: /s/ David Schwartz —————————————— David Schwartz, Chairman |
51