2010 Greektown Superholdings Shareholder’s Meeting George Boyer Executive Chairman Michael Puggi Consultant Clifford Vallier President, CFO & Treasurer Jason Pasko Sr. Director of Finance June 8, 2011
Safe Harbor In addition to historical facts or statements of current conditions, this presentation contains forward - looking statements that involve risk and uncertainties. Such forward - looking statements reflect the company’s current expectations and beliefs but are not guarantees of future performance. As such actual results may vary materially from expectations. The risks and uncertainties associated with the forward - looking statements are described in the company’s filings with the Securities and Exchange Commission. The reconciliation of non - GAAP measures can be found in our report on form 8K dated May 25, 2011. Greektown Superholdings assumes no obligation to publicly update or revise any forward looking statements. 2
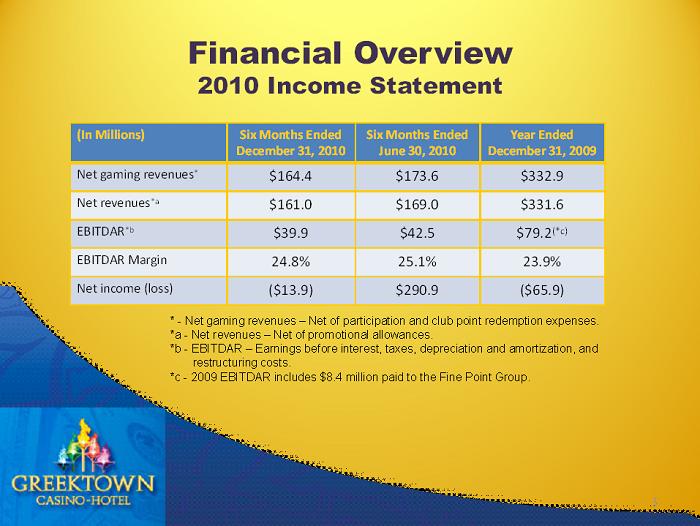
Financial Overview 2010 Income Statement (In Millions) Six Months Ended December 31, 2010 Six Months Ended June 30, 2010 Year Ended December 31, 2009 Net gaming revenues * $164.4 $173.6 $332.9 Net revenues *a $161.0 $169.0 $331.6 EBITDAR *b $39.9 $42.5 $79.2 (*c) EBITDAR Margin 24.8% 25.1% 23.9% Net income (loss) ($13.9) $290.9 ($65.9) * - Net gaming revenues – Net of participation and club point redemption expenses. *a - Net revenues – Net of promotional allowances. *b - EBITDAR – Earnings before interest, taxes, depreciation and amortization, and restructuring costs. *c - 2009 EBITDAR includes $8.4 million paid to the Fine Point Group. 3
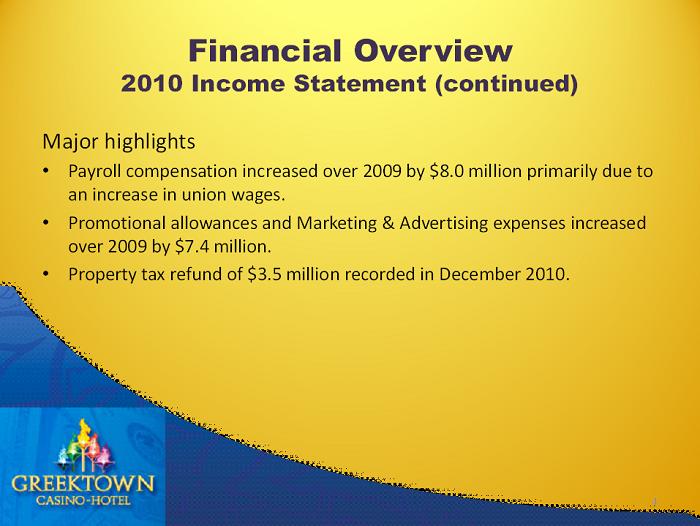
Financial Overview 2010 Income Statement (continued) Major highlights • Payroll compensation increased over 2009 by $8.0 million primarily due to an increase in union wages. • Promotional allowances and Marketing & Advertising expenses increased over 2009 by $7.4 million. • Property tax refund of $3.5 million recorded in December 2010. 4
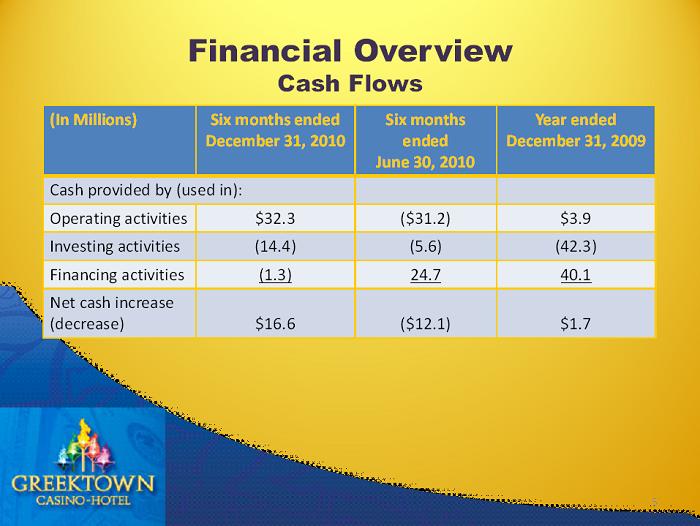
Financial Overview Cash Flows (In Millions) Six months ended December 31, 2010 Six months ended June 30, 2010 Year ended December 31, 2009 Cash provided by (used in): Operating activities $32.3 ($31.2) $3.9 Investing activities (14.4) (5.6) (42.3) Financing activities (1.3) 24.7 40.1 Net cash increase (decrease) $16.6 ($12.1) $1.7 5
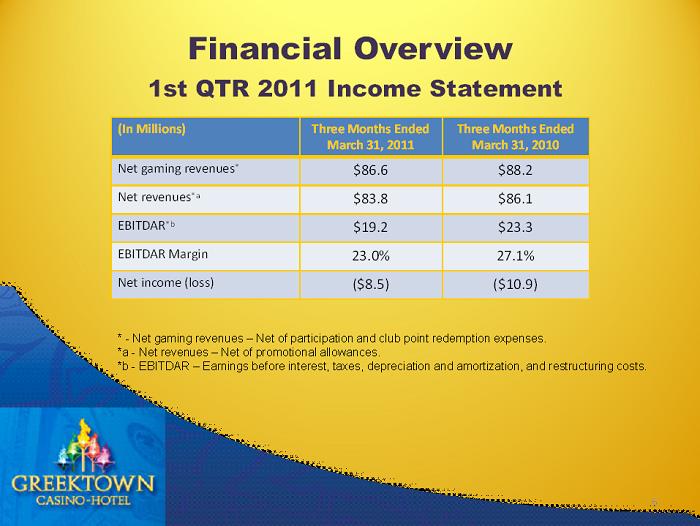
Financial Overview 1st QTR 2011 Income Statement (In Millions) Three Months Ended March 31, 2011 Three Months Ended March 31, 2010 Net gaming revenues * $86.6 $88.2 Net revenues *a $83.8 $86.1 EBITDAR *b $19.2 $23.3 EBITDAR Margin 23.0% 27.1% Net income (loss) ($8.5) ($10.9) * - Net gaming revenues – Net of participation and club point redemption expenses. *a - Net revenues – Net of promotional allowances. *b - EBITDAR – Earnings before interest, taxes, depreciation and amortization, and restructuring costs. 6
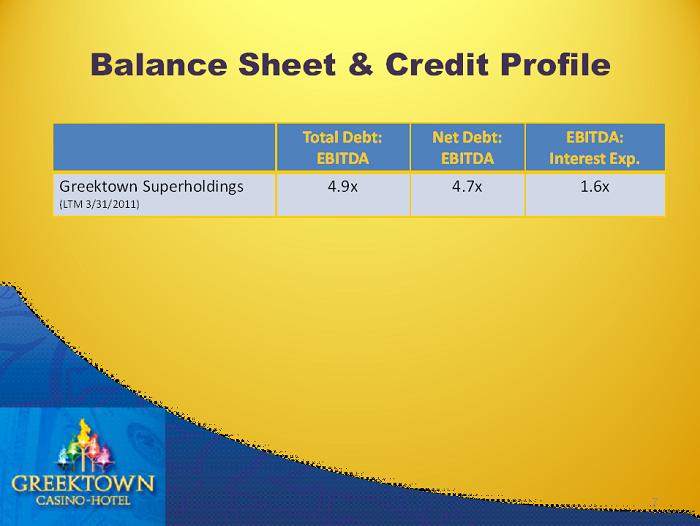
Balance Sheet & Credit Profile Total Debt: EBITDA Net Debt: EBITDA EBITDA: Interest Exp. Greektown Superholdings (LTM 3/31/2011) 4.9x 4.7x 1.6x 7
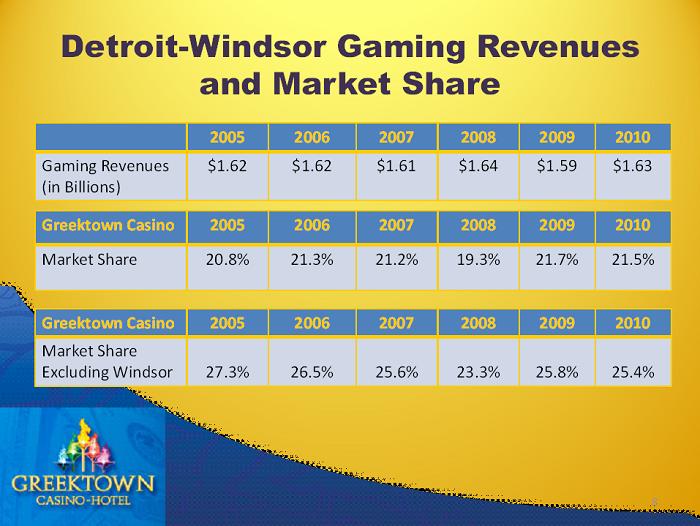
Detroit - Windsor Gaming Revenues and Market Share 2005 2006 2007 2008 2009 2010 Gaming Revenues (in Billions) $1.62 $1.62 $1.61 $1.64 $1.59 $1.63 Greektown Casino 2005 2006 2007 2008 2009 2010 Market Share 20.8% 21.3% 21.2% 19.3% 21.7% 21.5% Greektown Casino 2005 2006 2007 2008 2009 2010 Market Share Excluding Windsor 27.3% 26.5% 25.6% 23.3% 25.8% 25.4% 8

Greektown Market Share NOTE: Excluding Windsor. 9

Annual Gaming Revenues (Millions) EBITDAR: $69.1 $75.4 $58.1 $50.9* $79.5* $82.5* • Excludes restructuring costs. 10

Post Emergence Accomplishments • June 30, 2010 – Emergence from reorganization • New Board of Directors elected • New CEO (in process) • New Marketing and Slot Operations Management • New Advertising Agency • Credit Agreement Amendment to improve liquidity position • Strong Balance Sheet and Credit Profile • Several planned property improvements 11
Capital Projects Overview • Capital expenditures for 2011 estimated to be $18 million, various areas within the property and equipment. • Focus of capital spending: – Slots – Significant remodeling of specific casino areas – Renovation of Food & Beverage outlets 12
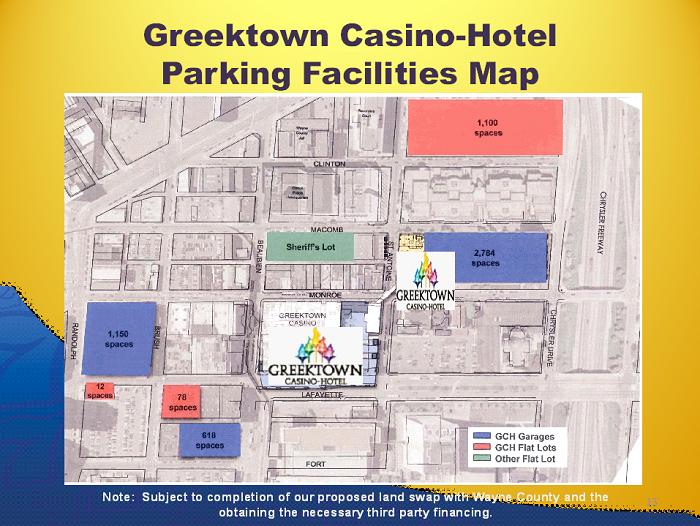
Greektown Casino - Hotel Parking Facilities Map 13 Note: Subject to completion of our proposed land swap with Wayne County and the obtaining the necessary third party financing.
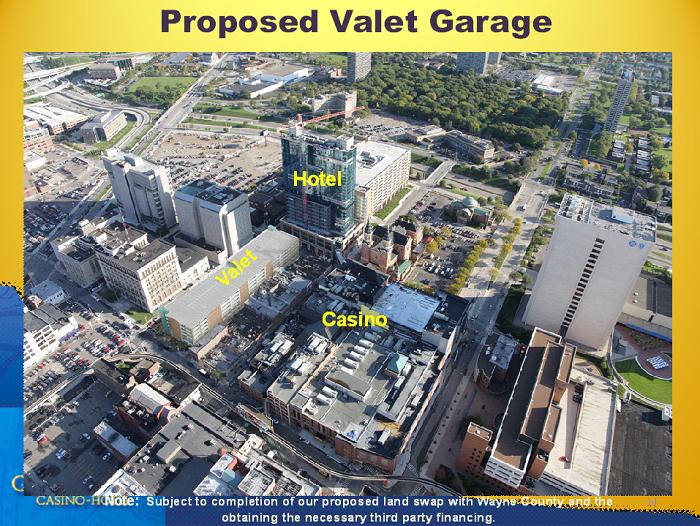
Proposed Valet Garage Hotel Casino 14 Note: Subject to completion of our proposed land swap with Wayne County and the obtaining the necessary third party financing.
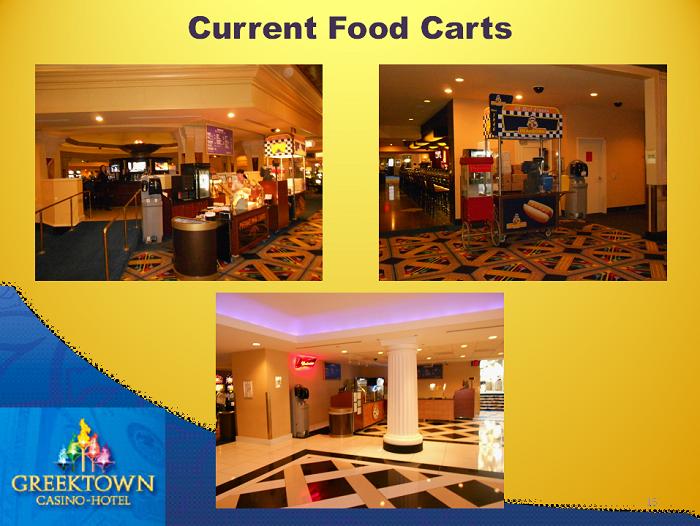
Current Food Carts 15
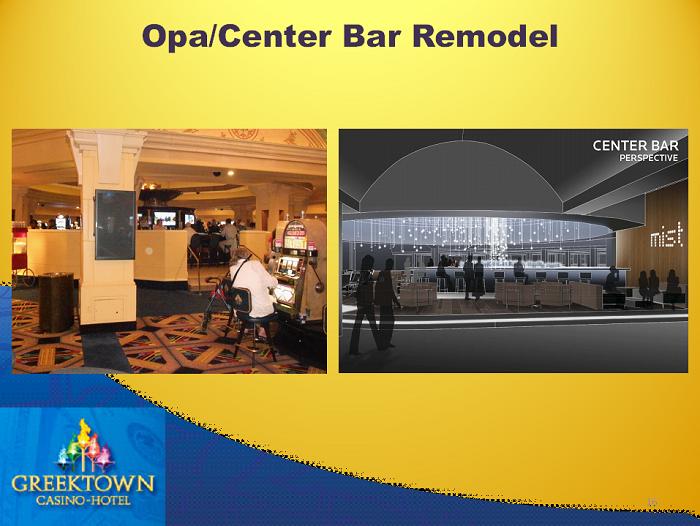
Opa /Center Bar Remodel 16
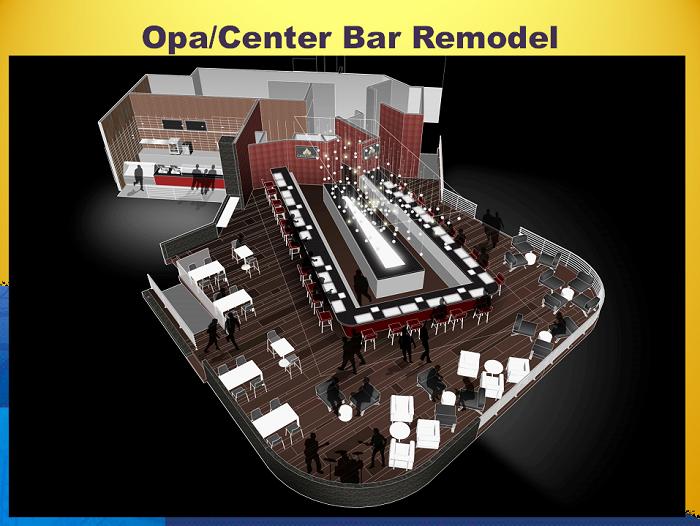
Opa /Center Bar Remodel 17
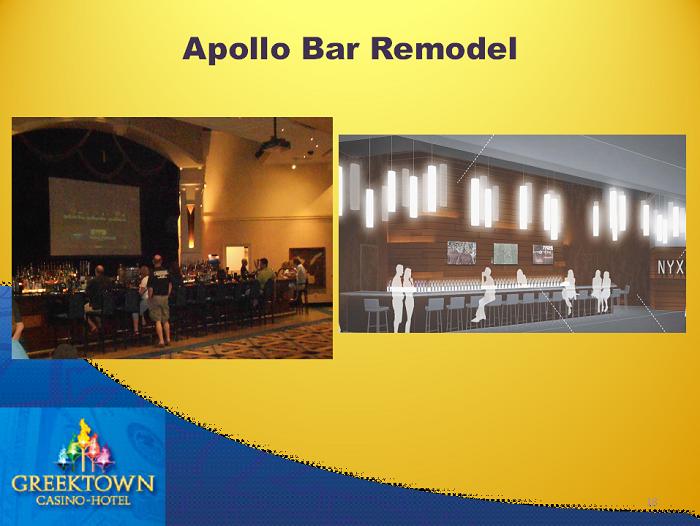
Apollo Bar Remodel 18
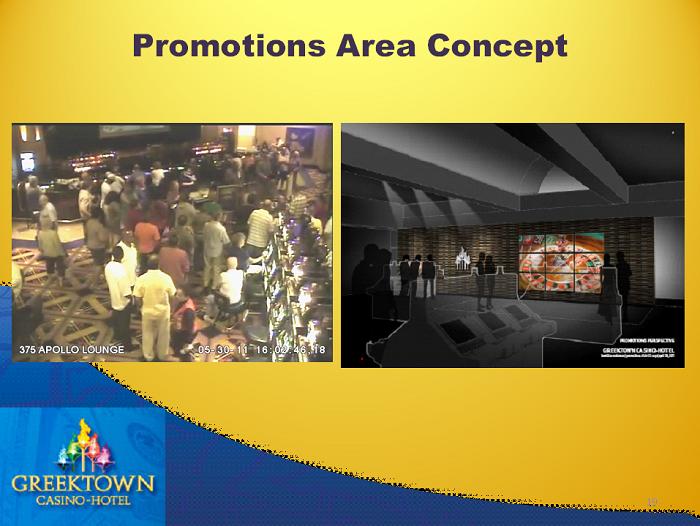
Promotions Area Concept 19
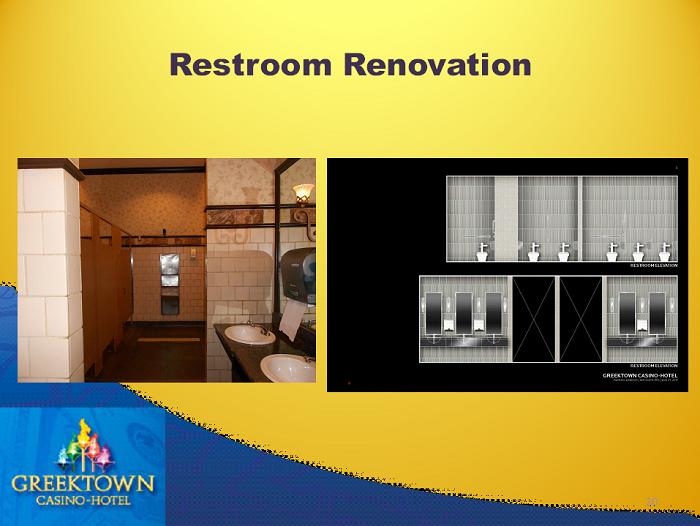
Restroom Renovation 20
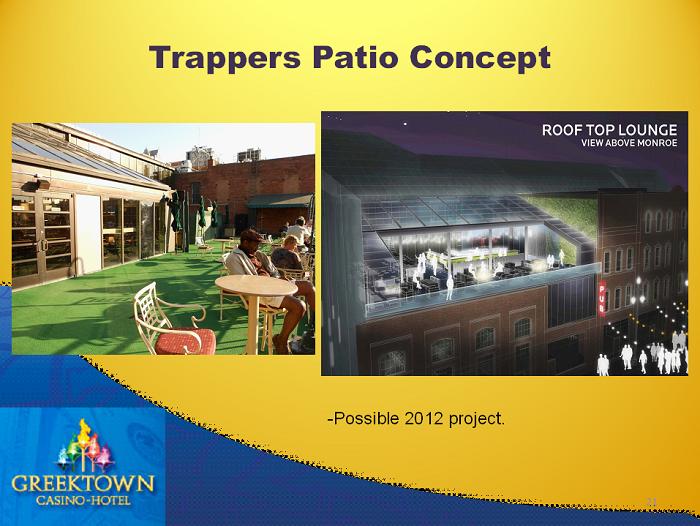
Trappers Patio Concept 21 - Possible 2012 project.

Q&A 22