Exhibit 99.1
NAREIT Investor Presentation June 7, 2018
2 Disclaimer Various statements contained in this Presentation of Reven Housing REIT, Inc. (the “Company,” “we,” “our” and “us ”), including those that express a belief, expectation or intention, as well as those that are not statements of historical fact, are forward - looking statements . These forward - looking statements may include, but are not limited to, statements related to our expectations regarding the performance of our business, our financial results, our liquidity and capital resources, and other non - historical statements. In some cases, you can identify these forward - looking statements by the use of words such as "outlook," "believes," "expects," "potential," "continues, " "may ,“ " will," "should," "could," "seeks," "projects," "predicts," "intends," "plans," "estimates," "anticipates" or the negative ver sio n of these words or other comparable words. Such forward - looking statements are subject to various risks and uncertainties, including, among others, risks inherent to the single - family rental industry sector and our business model, macroeconomic factors beyond our control, competition in identifying and acquiring our properties, competition in the leasing market for quality residents, increasing property taxes, homeowners’ association (“HOA”) and insurance costs, our dependence on third parties for key services, risks related to evaluation of properties, poor resident selection and defaults and non - renewals by our residents, performance of our information technology systems, our ability to raise the capital required to acquire additional properties, and risks related to our indebtedness. Accordingly, there are or will be important factors that could cause actual outcomes or results to differ materially from those indicated in these statements. We believe these factors include but are not limited to those described under Part I. Item 1A. “Risk Factors," in our Annual Report on Form 10 - K for the year ended December 31, 2017 as such factors may be updated from time to time in our periodic filings with the Securities and Exchange Commission. These factors should not be construed as exhaustive and should be read in conjunction with the other cautionary statements that are included in the Annual Report on Form 10 - K and in our other periodic filings. The forward - looking statements speak only as of the date made, and we expressly disclaim any obligation or undertaking to publicly update or review any forward - looking statement, whether as a result of new information, future developments or otherwise , except to the extent otherwise required by law.
Company Overview
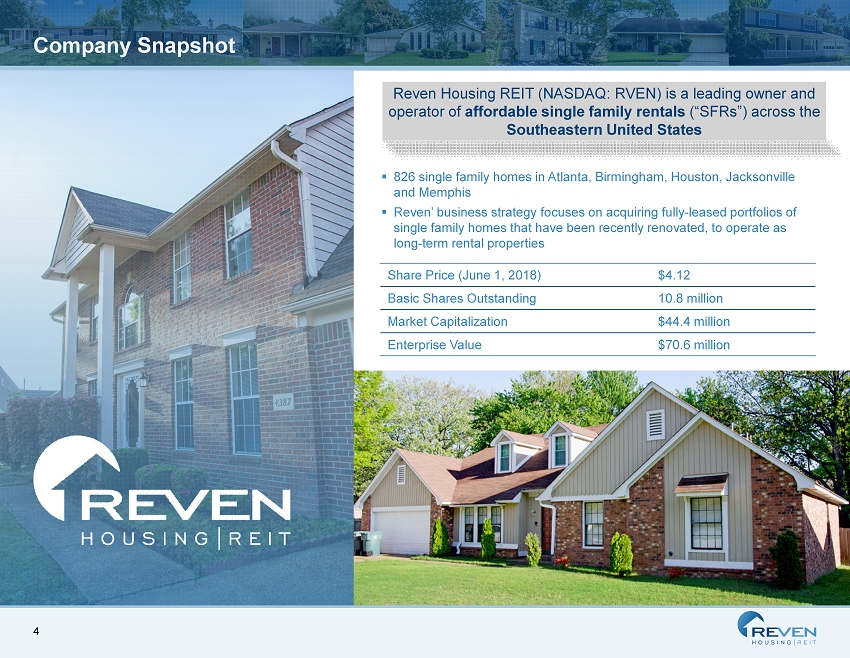
4 Company Snapshot Share Price (June 1, 2018) $4.12 Basic Shares Outstanding 10.8 million Market Capitalization $44.4 million Enterprise Value $70.6 million ▪ 826 single family homes in Atlanta, Birmingham, Houston, Jacksonville and Memphis ▪ Reven’ business strategy focuses on acquiring fully - leased portfolios of single family homes that have been recently renovated, to operate as long - term rental properties Reven Housing REIT (NASDAQ: RVEN) is a leading owner and operator of affordable single family rentals (“SFRs”) across the Southeastern United States
5 Reven Management Team Chad Carpenter | Chairman & CEO ▪ Founded Reven Housing REIT in July 2012 ▪ Executed $2.0 billion in real estate transactions over 27 years in the real estate industry, including 21 years of executive lev el experience ▪ CEO of Reven Capital and Equastone , LLC, a firm focused on investing in office properties in the western and southern regions of the United States ▪ Board member of Reven, Reven Capital and Western Residential Opportunity Fund, LLC ▪ University of Southern California (B.S. in Economics) Thad Meyer | CFO, COO & Secretary ▪ President of Alliance Turnaround Management, Inc., a problem resolution firm specializing in distressed real estate opportunities ▪ Principal and COO of Southern California Investors, Inc., a firm specializing in the acquisition, improvement and sale of dis tre ssed single family homes ▪ CFO of Equastone , LLC, a real estate private equity investment firm ▪ Certified Public Accountant, Certified Turnaround Professional and California Real Estate Broker ▪ Colorado State University (B.S. in Accounting) Michael Soni | Senior Advisor, Investments ▪ Acquired and operated over 1,500 single family homes in over 10 states including fix and flip and buy and hold strategies ▪ Special Advisor for Alliance REI, a residential real estate investment firm specializing in multifamily and single family inv est ments ▪ Managing Partner of Hospitality Investors Group, a specialist private equity firm focusing on lodging transactions on a world wid e basis ▪ President and CEO of Cronus Capital Markets, a transaction advisory firm
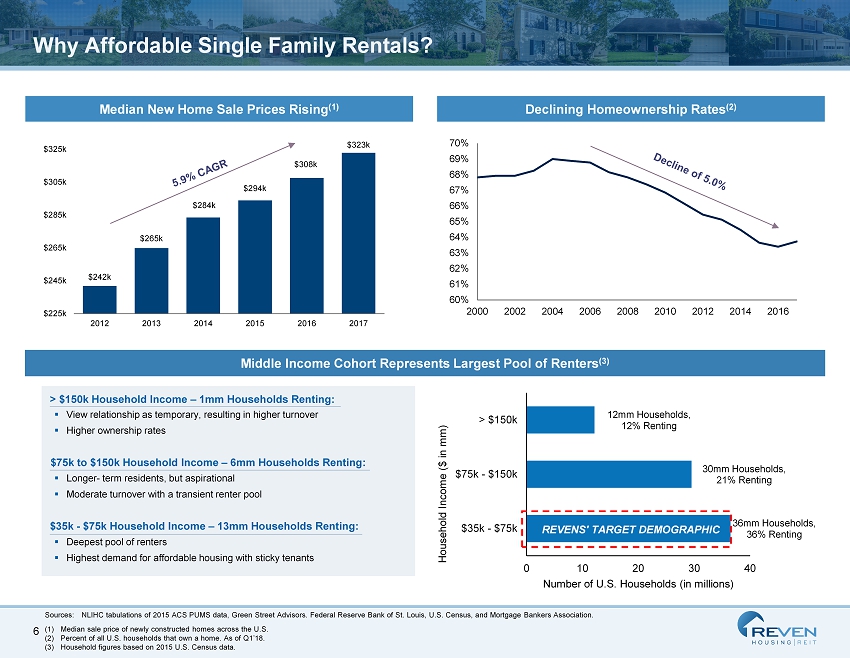
6 36 mm Households, 36% Renting 30 mm Households, 21% Renting 12mm Households, 12% Renting 0 10 20 30 40 $35k - $75k $75k - $150k > $150k Number of U.S. Households (in millions) Household Income ($ in mm) Why Affordable Single Family Rentals? Declining Homeownership Rates (2) Median New Home Sale Prices Rising (1) 60% 61% 62% 63% 64% 65% 66% 67% 68% 69% 70% 2000 2002 2004 2006 2008 2010 2012 2014 2016 Sources: NLIHC tabulations of 2015 ACS PUMS data, Green Street Advisors. Federal Reserve Bank of St. Louis, U.S. Census, and Mortgage B ankers Association . (1) Median sale price of newly constructed homes across the U.S. (2) Percent of all U.S. households that own a home . As of Q1’18. (3) Household figures based on 2015 U.S. Census data. $242k $265k $284k $294k $308k $323k $225k $245k $265k $285k $305k $325k 2012 2013 2014 2015 2016 2017 > $150k Household Income – 1 mm Households Renting: ▪ View relationship as temporary, resulting in higher turnover ▪ Higher ownership rates ▪ Longer - term residents, but aspirational ▪ Moderate turnover with a transient renter pool ▪ Deepest pool of renters ▪ Highest demand for affordable housing with sticky tenants $75k to $150k Household Income – 6mm Households Renting: $35k - $75k Household Income – 13mm Households Renting: Middle Income Cohort Represents Largest Pool of Renters (3) REVENS' TARGET DEMOGRAPHIC
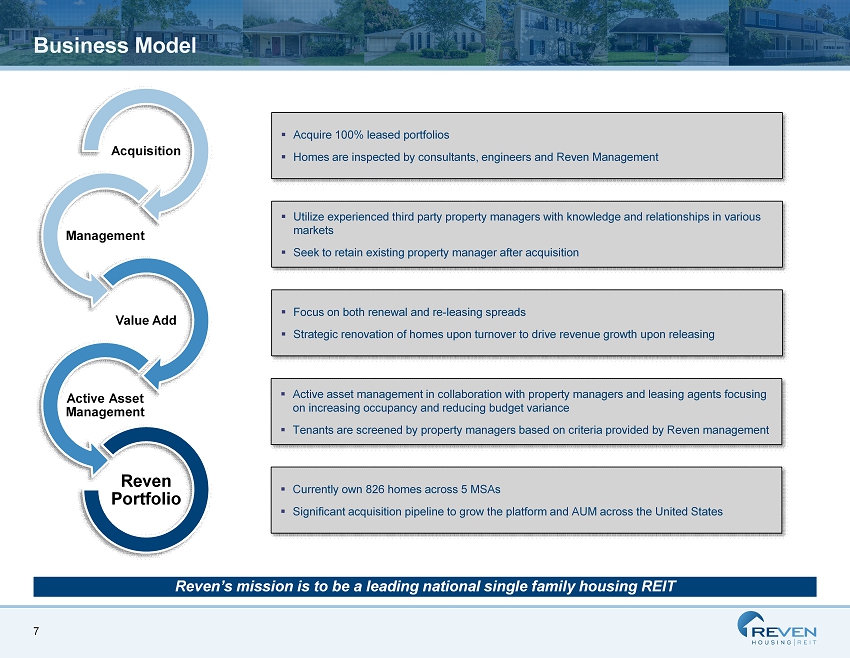
7 Business Model Acquisition Management Value Add Active Asset Management Reven Portfolio ▪ Acquire 100% leased portfolios ▪ Homes are inspected by consultants, engineers and Reven Management ▪ Utilize experienced third party property managers with knowledge and relationships in various markets ▪ Seek to retain existing property manager after acquisition ▪ Focus on both renewal and re - leasing spreads ▪ Strategic renovation of homes upon turnover to drive revenue growth upon releasing ▪ Currently own 826 homes across 5 MSAs ▪ Significant acquisition pipeline to grow the platform and AUM across the United States ▪ Active asset management in collaboration with property managers and leasing agents focusing on increasing occupancy and reducing budget variance ▪ Tenants are screened by property managers based on criteria provided by Reven management Reven’s mission is to be a leading national single family housing REIT
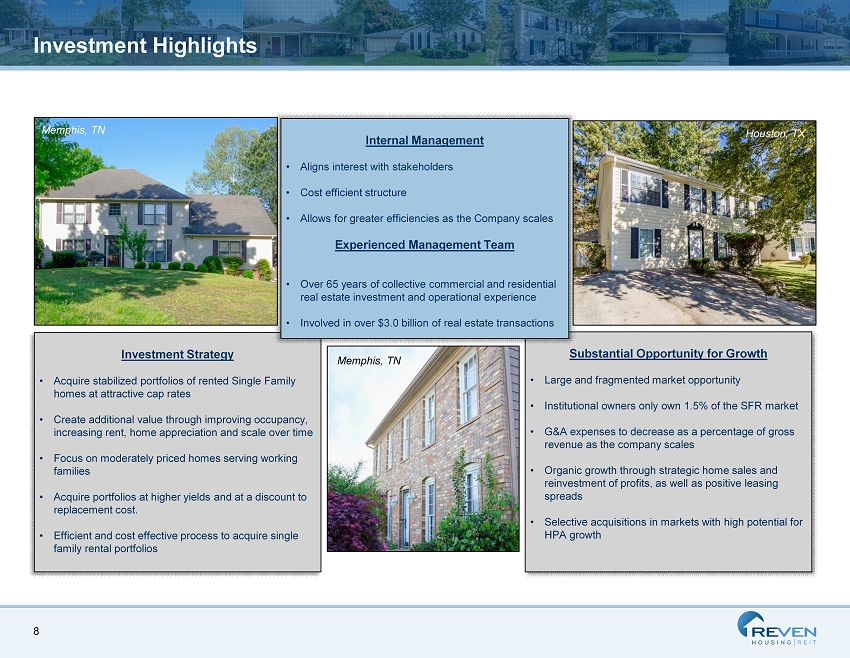
8 Investment Highlights Substantial Opportunity for Growth • Large and fragmented market opportunity • Institutional owners only own 1.5% of the SFR market • G&A expenses to decrease as a percentage of gross revenue as the company scales • Organic growth through strategic home sales and reinvestment of profits, as well as positive leasing spreads • Selective acquisitions in markets with high potential for HPA growth Investment Strategy • Acquire stabilized portfolios of rented Single Family homes at attractive cap rates • Create additional value through improving occupancy, increasing rent, home appreciation and scale over time • Focus on moderately priced homes serving working families • Acquire portfolios at higher yields and at a discount to replacement cost. • Efficient and cost effective process to acquire single family rental portfolios Memphis, TN Houston, TX Memphis, TN Internal Management • Aligns interest with stakeholders • Cost efficient structure • Allows for greater efficiencies as the Company scales Experienced Management Team • Over 65 years of collective commercial and residential real estate investment and operational experience • Involved in over $3.0 billion of real estate transactions
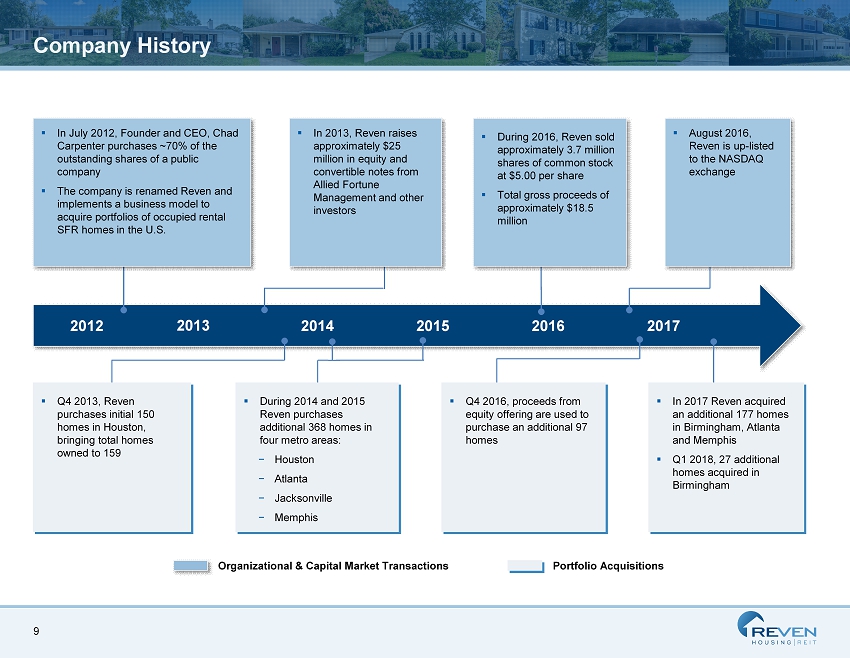
9 Company History 2012 2014 2015 2016 2017 2013 ▪ In 2013 , Reven raises approximately $25 million in equity and convertible notes from Allied Fortune Management and other investors Organizational & Capital Market Transactions Portfolio Acquisitions ▪ In July 2012, Founder and CEO, Chad Carpenter purchases ~70% of the outstanding shares of a public company ▪ The company is renamed Reven and implements a business model to acquire portfolios of occupied rental SFR homes in the U.S. ▪ In 2017 Reven acquired an additional 177 homes in Birmingham, Atlanta and Memphis ▪ Q1 2018, 27 additional homes acquired in Birmingham ▪ During 2014 and 2015 Reven purchases additional 368 homes in four metro areas: − Houston − Atlanta − Jacksonville − Memphis ▪ During 2016, Reven sold approximately 3.7 million shares of common stock at $5.00 per share ▪ Total gross proceeds of approximately $18.5 million ▪ Q4 2013, Reven purchases initial 150 homes in Houston, bringing total homes owned to 159 ▪ August 2016, Reven is up - listed to the NASDAQ exchange ▪ Q4 2016, p roceeds from equity offering are used to purchase an additional 97 homes
Portfolio Overview
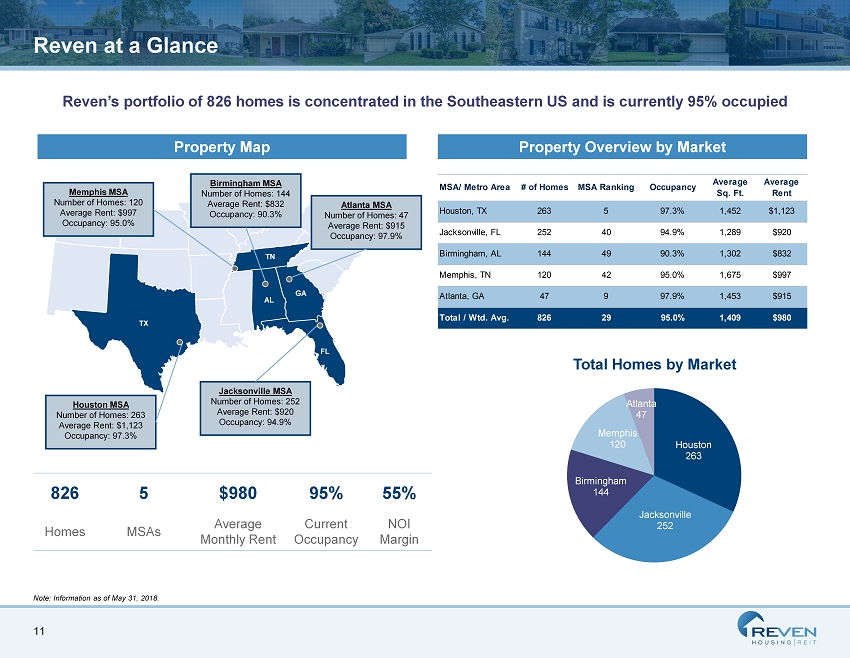
11 Houston 263 Jacksonville 252 Birmingham 144 Memphis 120 Atlanta 47 Reven at a Glance 826 5 $980 95% 55% Homes MSAs Average Monthly Rent Current Occupancy NOI Margin AL GA TX FL TN Houston MSA Number of Homes: 263 Average Rent: $1,123 Occupancy: 97.3% Birmingham MSA Number of Homes: 144 Average Rent: $832 Occupancy: 90.3% Jacksonville MSA Number of Homes: 252 Average Rent: $920 Occupancy: 94.9% Atlanta MSA Number of Homes: 47 Average Rent: $915 Occupancy: 97.9% Memphis MSA Number of Homes: 120 Average Rent: $997 Occupancy: 95.0% Property Overview by Market Total Homes by Market Note: Information as of May 31, 2018. MSA/ Metro Area # of Homes MSA Ranking Occupancy Average Sq. Ft. Average Rent Houston, TX 263 5 97.3% 1,452 $1,123 Jacksonville, FL 252 40 94.9% 1,289 $920 Birmingham, AL 144 49 90.3% 1,302 $832 Memphis, TN 120 42 95.0% 1,675 $997 Atlanta, GA 47 9 97.9% 1,453 $915 Total / Wtd. Avg. 826 29 95.0% 1,409 $980 Reven’s portfolio of 826 homes is concentrated in the Southeastern US and is currently 95% occupied Property Map
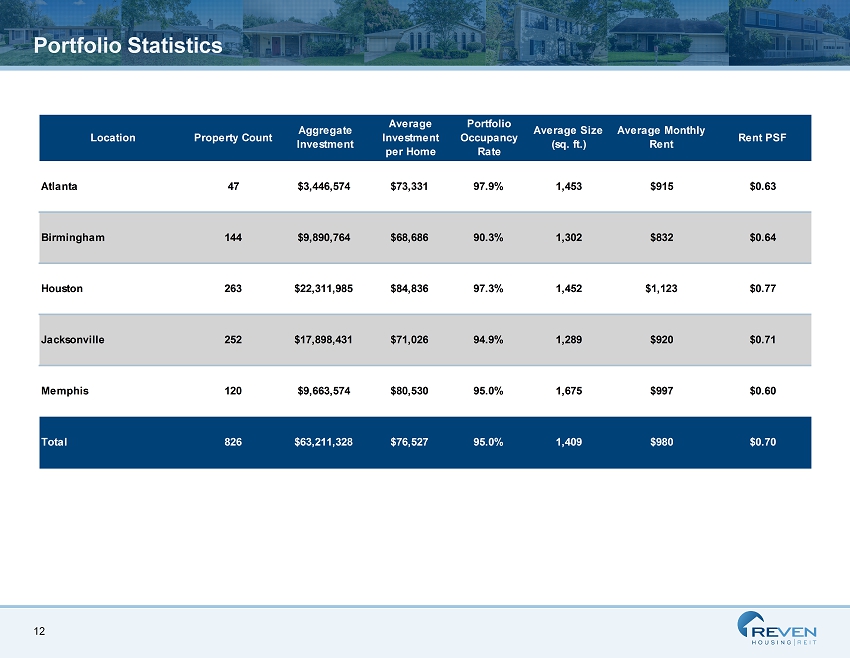
12 Portfolio Statistics Location Property Count Aggregate Investment Average Investment per Home Portfolio Occupancy Rate Average Size (sq. ft.) Average Monthly Rent Rent PSF Atlanta 47 $3,446,574 $73,331 97.9% 1,453 $915 $0.63 Birmingham 144 $9,890,764 $68,686 90.3% 1,302 $832 $0.64 Houston 263 $22,311,985 $84,836 97.3% 1,452 $1,123 $0.77 Jacksonville 252 $17,898,431 $71,026 94.9% 1,289 $920 $0.71 Memphis 120 $9,663,574 $80,530 95.0% 1,675 $997 $0.60 Total 826 $63,211,328 $76,527 95.0% 1,409 $980 $0.70
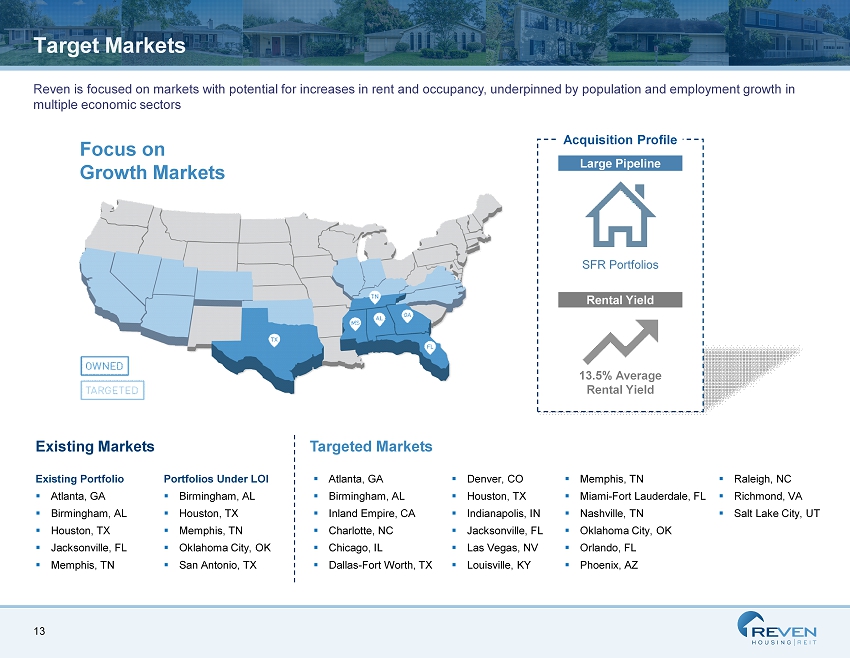
13 Target Markets Existing Markets Existing Portfolio ▪ Atlanta , GA ▪ Birmingham, AL ▪ Houston, TX ▪ Jacksonville, FL ▪ Memphis, TN Portfolios Under LOI ▪ Birmingham, AL ▪ Houston, TX ▪ Memphis, TN ▪ Oklahoma City, OK ▪ San Antonio, TX ▪ Atlanta, GA ▪ Birmingham, AL ▪ Inland Empire, CA ▪ Charlotte, NC ▪ Chicago, IL ▪ Dallas - Fort Worth, TX Targeted Markets ▪ Denver, CO ▪ Houston, TX ▪ Indianapolis, IN ▪ Jacksonville, FL ▪ Las Vegas, NV ▪ Louisville, KY ▪ Memphis, TN ▪ Miami - Fort Lauderdale, FL ▪ Nashville, TN ▪ Oklahoma City, OK ▪ Orlando, FL ▪ Phoenix, AZ ▪ Raleigh, NC ▪ Richmond, VA ▪ Salt Lake City, UT Reven is focused on markets with potential for increases in rent and occupancy, underpinned by population and employment growth in multiple economic sectors Large Pipeline Rental Yield Acquisition Profile SFR Portfolios 13.5% Average Rental Yield Focus on Growth Markets
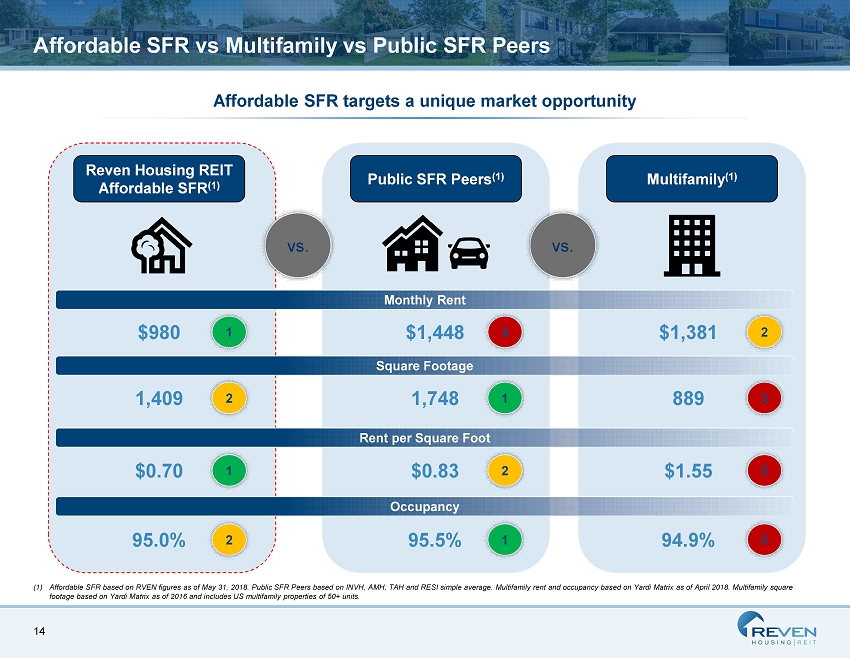
14 Affordable SFR vs Multifamily vs Public SFR Peers Reven Housing REIT Affordable SFR (1) vs. vs. $980 1,409 Public SFR Peers (1) $1,448 1,748 $0.83 Multifamily (1) $1,381 889 $1.55 $0.70 (1) Affordable SFR based on RVEN figures as of May 31, 2018. Public SFR Peers based on INVH, AMH, TAH and RESI simple average. Mu lti family rent and occupancy based on Yardi Matrix as of April 2018. Multifamily square footage based on Yardi Matrix as of 2016 and includes US multifamily properties of 50+ units. Affordable SFR targets a unique market opportunity Monthly Rent Square Footage Rent per Square Foot 1 2 3 1 3 2 2 1 3 Occupancy 95.0% 95.5% 94.9% 2 1 3
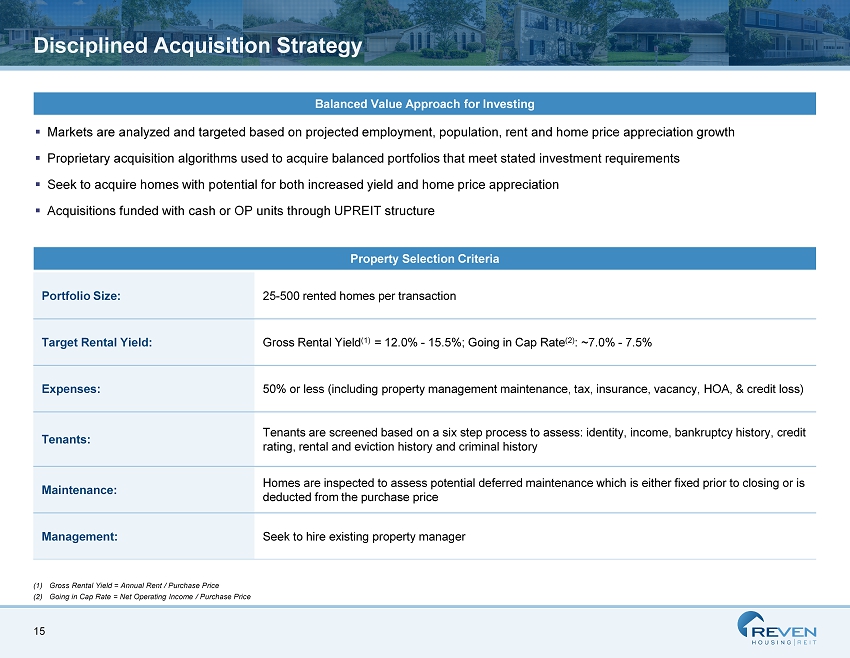
15 Disciplined Acquisition Strategy (1) Gross Rental Yield = Annual Rent / Purchase Price (2) Going in Cap Rate = Net Operating Income / Purchase Price Balanced Value Approach for Investing ▪ Markets are analyzed and targeted based on projected employment, population, rent and home price appreciation growth ▪ Proprietary acquisition algorithms used to acquire balanced portfolios that meet stated investment requirements ▪ Seek to acquire homes with potential for both increased yield and home price appreciation ▪ Acquisitions funded with cash or OP units through UPREIT structure Property Selection Criteria Portfolio Size: 25 - 500 rented homes per transaction Target Rental Yield: Gross Rental Yield (1) = 12.0% - 15.5%; Going in Cap Rate (2) : ~ 7.0% - 7.5% Expenses: 50% or less (including property management maintenance , tax, insurance , vacancy, HOA , & credit loss) Tenants: Tenants are screened based on a six step process to assess: identity, income, bankruptcy history, credit rating, rental and eviction history and criminal history Maintenance: Homes are inspected to assess potential deferred maintenance which is either fixed prior to closing or is deducted from the purchase price Management: Seek to hire existing property manager
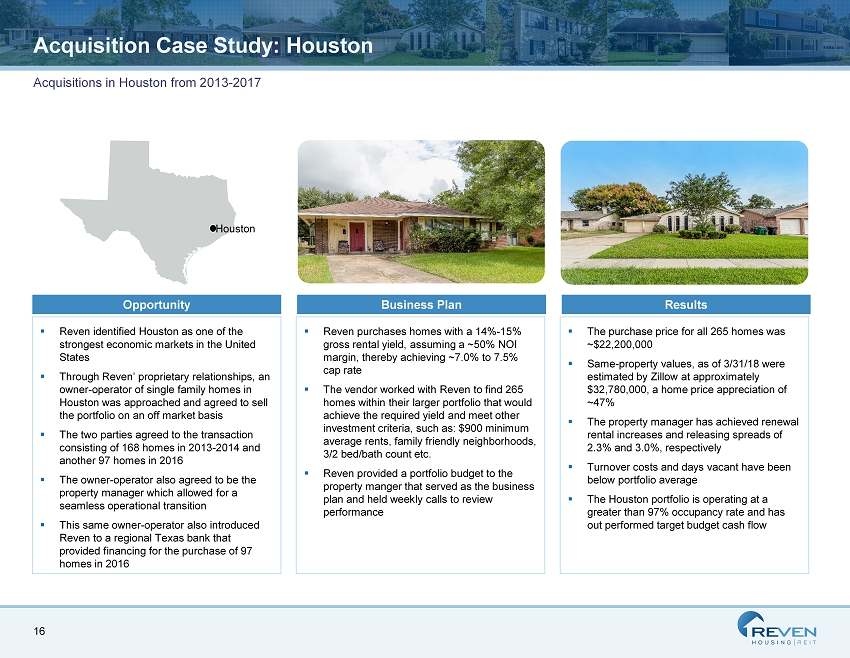
16 Acquisition Case Study: Houston ▪ The purchase price for all 265 homes was ~$22,200,000 ▪ Same - property values, as of 3/31/18 were estimated by Zillow at approximately $32,780,000, a home price appreciation of ~47% ▪ The property manager has achieved renewal rental increases and releasing spreads of 2.3% and 3.0%, respectively ▪ Turnover costs and days vacant have been below portfolio average ▪ The Houston portfolio is operating at a greater than 97% occupancy rate and has out performed target budget cash flow ▪ Reven identified Houston as one of the strongest economic markets in the United States ▪ Through Reven’ proprietary relationships, an owner - operator of single family homes in Houston was approached and agreed to sell the portfolio on an off market basis ▪ The two parties agreed to the transaction consisting of 168 homes in 2013 - 2014 and another 97 homes in 2016 ▪ The owner - operator also agreed to be the property manager which allowed for a seamless operational transition ▪ This same owner - operator also introduced Reven to a regional Texas bank that provided financing for the purchase of 97 homes in 2016 ▪ Reven purchases homes with a 14% - 15 % gross rental yield, assuming a ~50% NOI margin, thereby achieving ~ 7.0% to 7.5% cap rate ▪ The vendor worked with Reven to find 265 homes within their larger portfolio that would achieve the required yield and meet other investment criteria , such as: $900 minimum average rents, family friendly neighborhoods, 3/2 bed/bath count etc. ▪ Reven provided a portfolio budget to the property manger that served as the business plan and held weekly calls to review performance Results Opportunity Business Plan Houston Acquisitions in Houston from 2013 - 2017
Financial Highlights
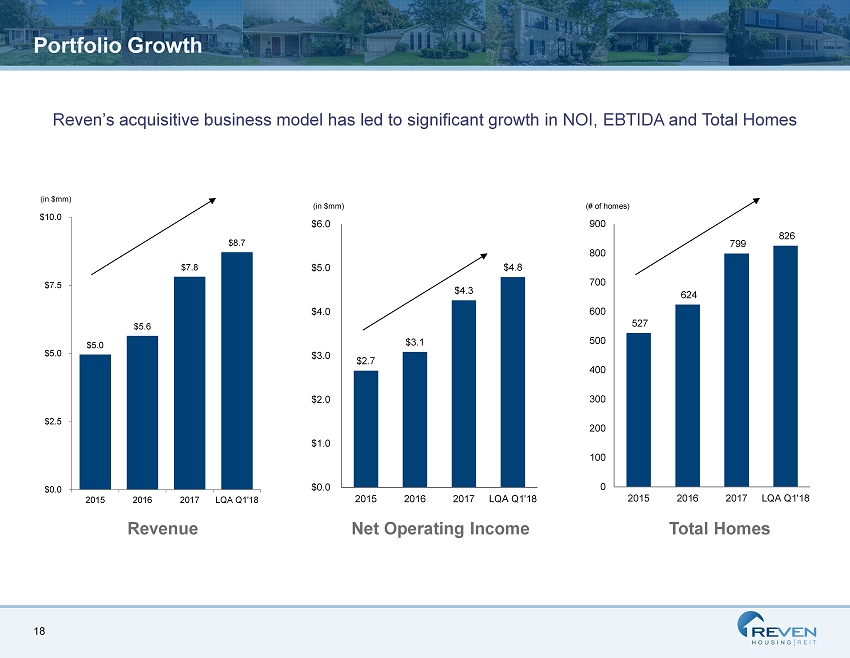
18 Portfolio Growth 527 624 799 826 0 100 200 300 400 500 600 700 800 900 2015 2016 2017 LQA Q1'18 (# of homes) Total Homes $2.7 $3.1 $4.3 $4.8 $0.0 $1.0 $2.0 $3.0 $4.0 $5.0 $6.0 2015 2016 2017 LQA Q1'18 (in $mm) Net Operating Income Reven’s acquisitive business model has led to significant growth in NOI, EBTIDA and Total Homes $5.0 $5.6 $7.8 $8.7 $0.0 $2.5 $5.0 $7.5 $10.0 2015 2016 2017 LQA Q1'18 (in $mm) Revenue
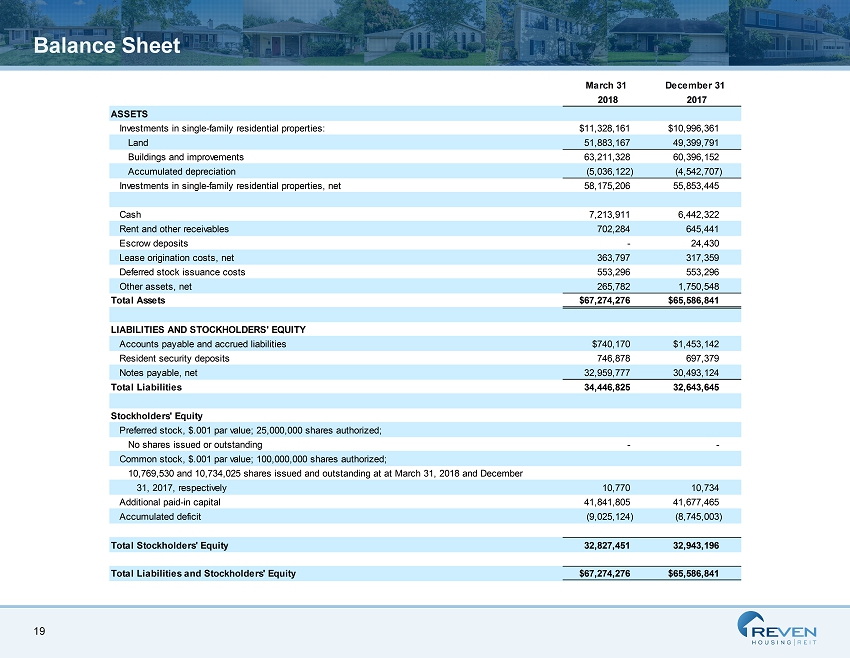
19 Balance Sheet March 31 December 31 2018 2017 ASSETS Investments in single-family residential properties: $11,328,161 $10,996,361 Land 51,883,167 49,399,791 Buildings and improvements 63,211,328 60,396,152 Accumulated depreciation (5,036,122) (4,542,707) Investments in single-family residential properties, net 58,175,206 55,853,445 Cash 7,213,911 6,442,322 Rent and other receivables 702,284 645,441 Escrow deposits - 24,430 Lease origination costs, net 363,797 317,359 Deferred stock issuance costs 553,296 553,296 Other assets, net 265,782 1,750,548 Total Assets $67,274,276 $65,586,841 LIABILITIES AND STOCKHOLDERS' EQUITY Accounts payable and accrued liabilities $740,170 $1,453,142 Resident security deposits 746,878 697,379 Notes payable, net 32,959,777 30,493,124 Total Liabilities 34,446,825 32,643,645 Stockholders' Equity Preferred stock, $.001 par value; 25,000,000 shares authorized; No shares issued or outstanding - - Common stock, $.001 par value; 100,000,000 shares authorized; 10,769,530 and 10,734,025 shares issued and outstanding at at March 31, 2018 and December 31, 2017, respectively 10,770 10,734 Additional paid-in capital 41,841,805 41,677,465 Accumulated deficit (9,025,124) (8,745,003) Total Stockholders' Equity 32,827,451 32,943,196 Total Liabilities and Stockholders' Equity $67,274,276 $65,586,841
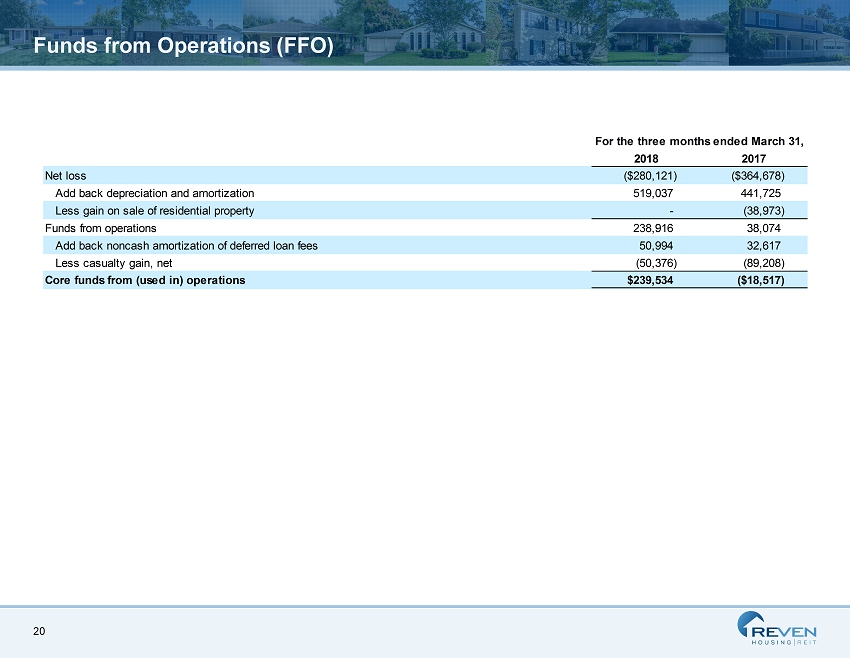
20 Funds from Operations (FFO) For the three months ended March 31, 2018 2017 Net loss ($280,121) ($364,678) Add back depreciation and amortization 519,037 441,725 Less gain on sale of residential property - (38,973) Funds from operations 238,916 38,074 Add back noncash amortization of deferred loan fees 50,994 32,617 Less casualty gain, net (50,376) (89,208) Core funds from (used in) operations $239,534 ($18,517)
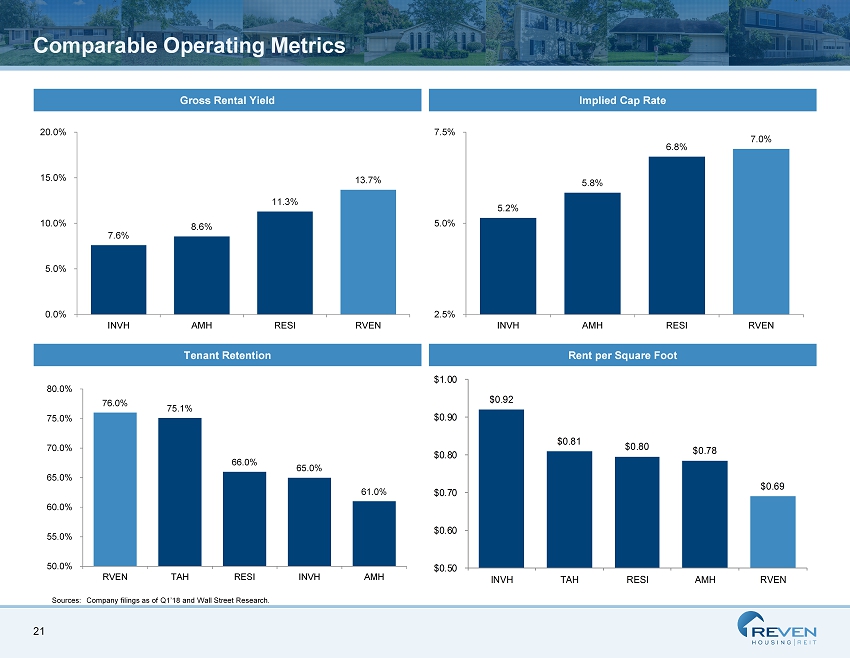
21 Comparable Operating Metrics 7.6% 8.6% 11.3% 13.7% 0.0% 5.0% 10.0% 15.0% 20.0% INVH AMH RESI RVEN 76.0% 75.1% 66.0% 65.0% 61.0% 50.0% 55.0% 60.0% 65.0% 70.0% 75.0% 80.0% RVEN TAH RESI INVH AMH Gross Rental Yield Implied Cap Rate Tenant Retention Rent per Square Foot $0.92 $0.81 $0.80 $0.78 $0.69 $0.50 $0.60 $0.70 $0.80 $0.90 $1.00 INVH TAH RESI AMH RVEN 5.2% 5.8% 6.8% 7.0% 2.5% 5.0% 7.5% INVH AMH RESI RVEN Sources: Company filings as of Q1’18 and Wall Street Research .
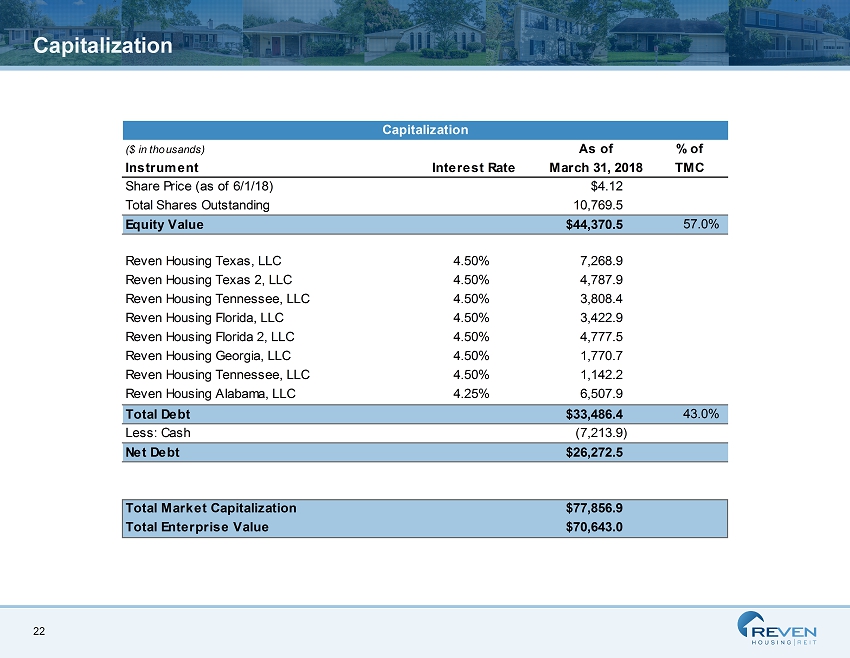
22 Capitalization Capitalization TSM ($ in thousands) As of % of Instrument Interest Rate March 31, 2018 TMC Share Price (as of 6/1/18) $4.12 Total Shares Outstanding 10,769.5 Equity Value $44,370.5 57.0% Reven Housing Texas, LLC 4.50% 7,268.9 Reven Housing Texas 2, LLC 4.50% 4,787.9 Reven Housing Tennessee, LLC 4.50% 3,808.4 Reven Housing Florida, LLC 4.50% 3,422.9 Reven Housing Florida 2, LLC 4.50% 4,777.5 Reven Housing Georgia, LLC 4.50% 1,770.7 Reven Housing Tennessee, LLC 4.50% 1,142.2 Reven Housing Alabama, LLC 4.25% 6,507.9 Total Debt $33,486.4 43.0% Less: Cash (7,213.9) Net Debt $26,272.5 Total Market Capitalization $77,856.9 Total Enterprise Value $70,643.0
Appendix
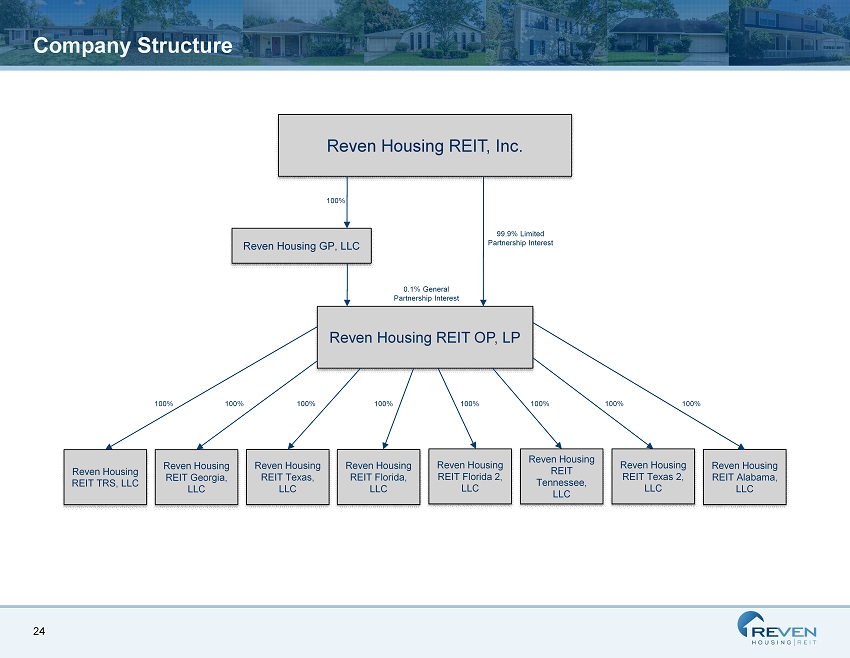
24 Company Structure Reven Housing REIT, Inc. Reven Housing GP, LLC Reven Housing REIT TRS, LLC Reven Housing REIT Georgia, LLC Reven Housing REIT Texas, LLC Reven Housing REIT Florida, LLC Reven Housing REIT Florida 2, LLC Reven Housing REIT Tennessee, LLC Reven Housing REIT Texas 2, LLC Reven Housing REIT Alabama, LLC Reven Housing REIT OP, LP 99.9% Limited Partnership Interest 100% 100% 100% 100% 100% 100% 100% 100% 100% 0.1% General Partnership Interest
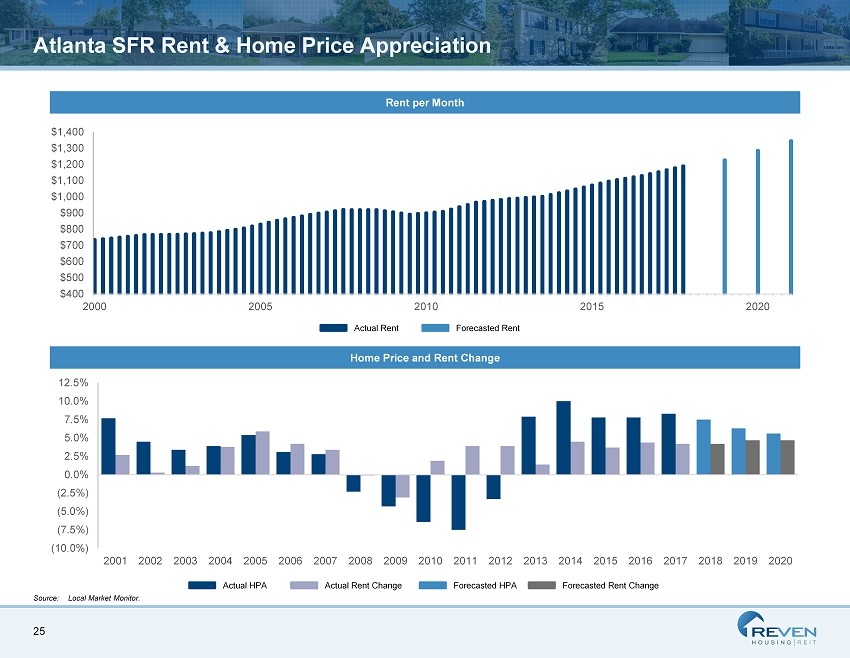
25 (10.0%) (7.5%) (5.0%) (2.5%) 0.0% 2.5% 5.0% 7.5% 10.0% 12.5% 2001 2002 2003 2004 2005 2006 2007 2008 2009 2010 2011 2012 2013 2014 2015 2016 2017 2018 2019 2020 $400 $500 $600 $700 $800 $900 $1,000 $1,100 $1,200 $1,300 $1,400 2000 2005 2010 2015 2020 Atlanta SFR Rent & Home Price Appreciation Rent per Month Home Price and Rent Change Source: Local Market Monitor. Actual HPA Actual Rent Change Forecasted HPA Forecasted Rent Change Actual Rent Forecasted Rent
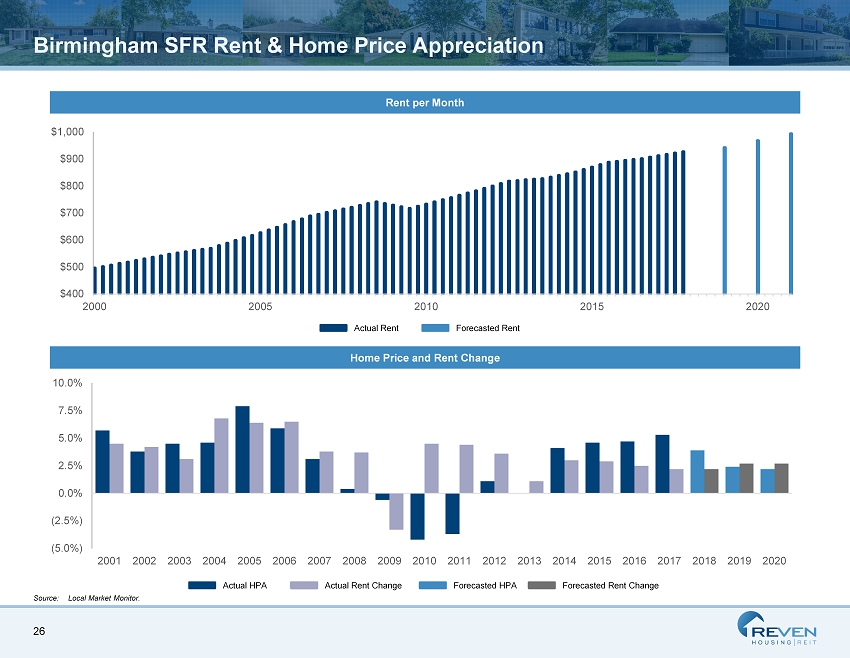
26 (5.0%) (2.5%) 0.0% 2.5% 5.0% 7.5% 10.0% 2001 2002 2003 2004 2005 2006 2007 2008 2009 2010 2011 2012 2013 2014 2015 2016 2017 2018 2019 2020 $400 $500 $600 $700 $800 $900 $1,000 2000 2005 2010 2015 2020 Birmingham SFR Rent & Home Price Appreciation Rent per Month Home Price and Rent Change Source: Local Market Monitor. Actual Rent Forecasted Rent Actual HPA Actual Rent Change Forecasted HPA Forecasted Rent Change
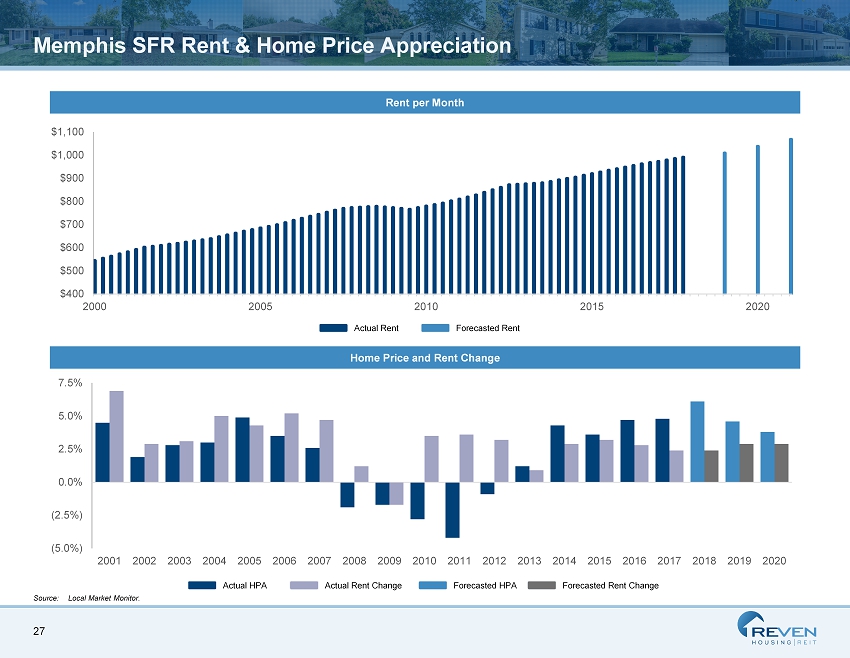
27 (5.0%) (2.5%) 0.0% 2.5% 5.0% 7.5% 2001 2002 2003 2004 2005 2006 2007 2008 2009 2010 2011 2012 2013 2014 2015 2016 2017 2018 2019 2020 $400 $500 $600 $700 $800 $900 $1,000 $1,100 2000 2005 2010 2015 2020 Memphis SFR Rent & Home Price Appreciation Rent per Month Home Price and Rent Change Source: Local Market Monitor. Actual Rent Forecasted Rent Actual HPA Actual Rent Change Forecasted HPA Forecasted Rent Change
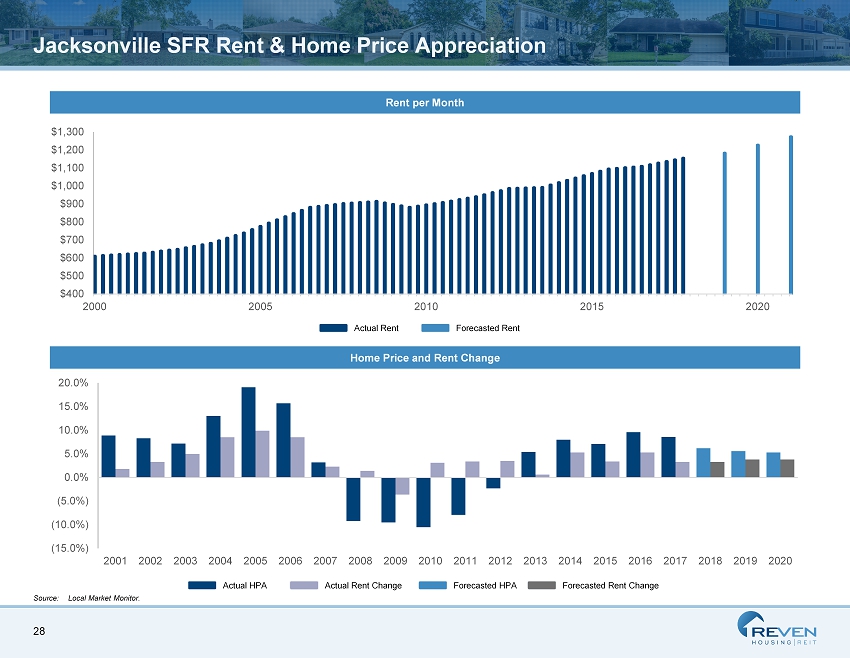
28 (15.0%) (10.0%) (5.0%) 0.0% 5.0% 10.0% 15.0% 20.0% 2001 2002 2003 2004 2005 2006 2007 2008 2009 2010 2011 2012 2013 2014 2015 2016 2017 2018 2019 2020 $400 $500 $600 $700 $800 $900 $1,000 $1,100 $1,200 $1,300 2000 2005 2010 2015 2020 Jacksonville SFR Rent & Home Price Appreciation Rent per Month Home Price and Rent Change Source: Local Market Monitor. Actual Rent Forecasted Rent Actual HPA Actual Rent Change Forecasted HPA Forecasted Rent Change
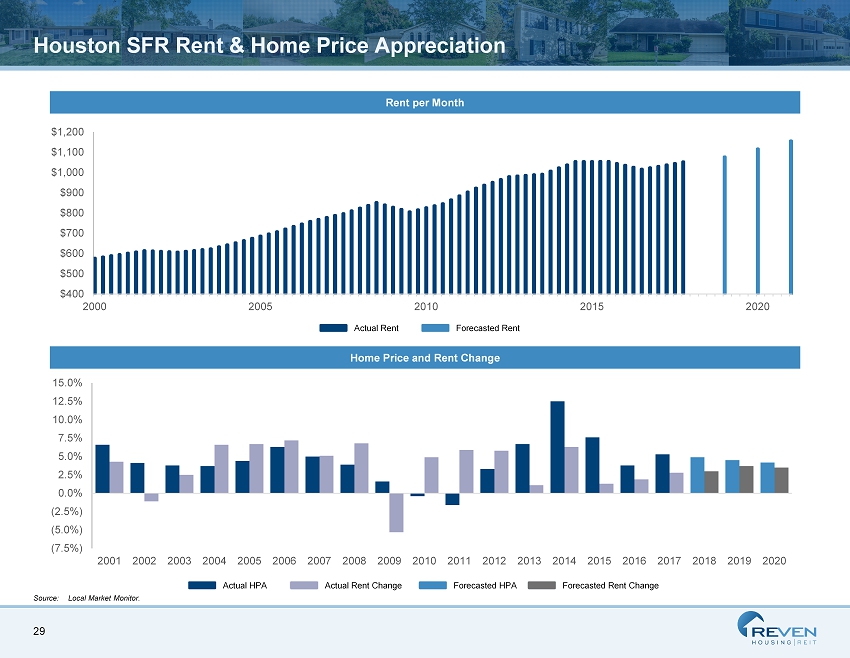
29 (7.5%) (5.0%) (2.5%) 0.0% 2.5% 5.0% 7.5% 10.0% 12.5% 15.0% 2001 2002 2003 2004 2005 2006 2007 2008 2009 2010 2011 2012 2013 2014 2015 2016 2017 2018 2019 2020 $400 $500 $600 $700 $800 $900 $1,000 $1,100 $1,200 2000 2005 2010 2015 2020 Houston SFR Rent & Home Price Appreciation Rent per Month Home Price and Rent Change Source: Local Market Monitor. Actual Rent Forecasted Rent Actual HPA Actual Rent Change Forecasted HPA Forecasted Rent Change