
Page 1 | Q2 2017 Supplemental Information|© 2017 Ameresco, Inc. All Rights Reserved. Q2 2017 Supplemental Information August 9, 2017 Exhibit 99.2

Page 2 | Q2 2017 Supplemental Information|© 2017 Ameresco, Inc. All Rights Reserved. USE OF NON-GAAP FINANCIAL MEASURES Use of Non-GAAP Financial Measures This presentation includes references to adjusted EBITDA, adjusted cash from operations, non-GAAP net income and non-GAAP earnings per share, which are non-GAAP financial measures. For a description of these non-GAAP financial measures, including the reasons management uses these measures, please see the section in the Appendix in this presentation titled “Non-GAAP Financial Measures”. For a reconciliation of these non-GAAP financial measures to the most directly comparable financial measures prepared in accordance with GAAP, please see the tables in the Appendix to this presentation titled “GAAP to Non-GAAP Reconciliation.”

Page 3 | Q2 2017 Supplemental Information|© 2017 Ameresco, Inc. All Rights Reserved. Q2 2017 HIGHLIGHTS $15.4 M $5.8M +17 % $166.7 M +2% EBITDA Q2 EBITDA driven by greater project revenue EBITDA growth EBITDA up 17% y/y Revenue growth Revenue up 2% y/y Revenue Q2 Revenue driven by favorable timing on U.S. Federal construction projects Net Income Growing Earnings faster than Revenue
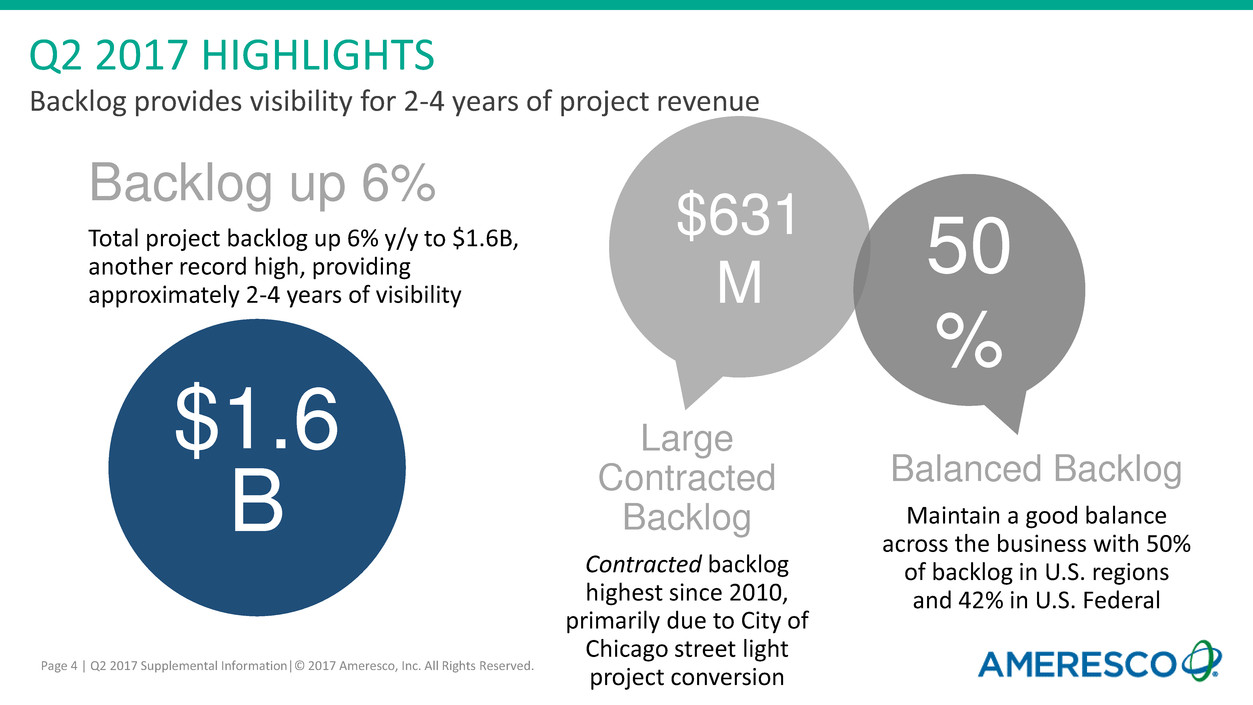
Page 4 | Q2 2017 Supplemental Information|© 2017 Ameresco, Inc. All Rights Reserved. Q2 2017 HIGHLIGHTS Backlog up 6% Total project backlog up 6% y/y to $1.6B, another record high, providing approximately 2-4 years of visibility Large Contracted Backlog Contracted backlog highest since 2010, primarily due to City of Chicago street light project conversion $631 M 50 % Balanced Backlog Maintain a good balance across the business with 50% of backlog in U.S. regions and 42% in U.S. Federal $1.6 B Backlog provides visibility for 2-4 years of project revenue
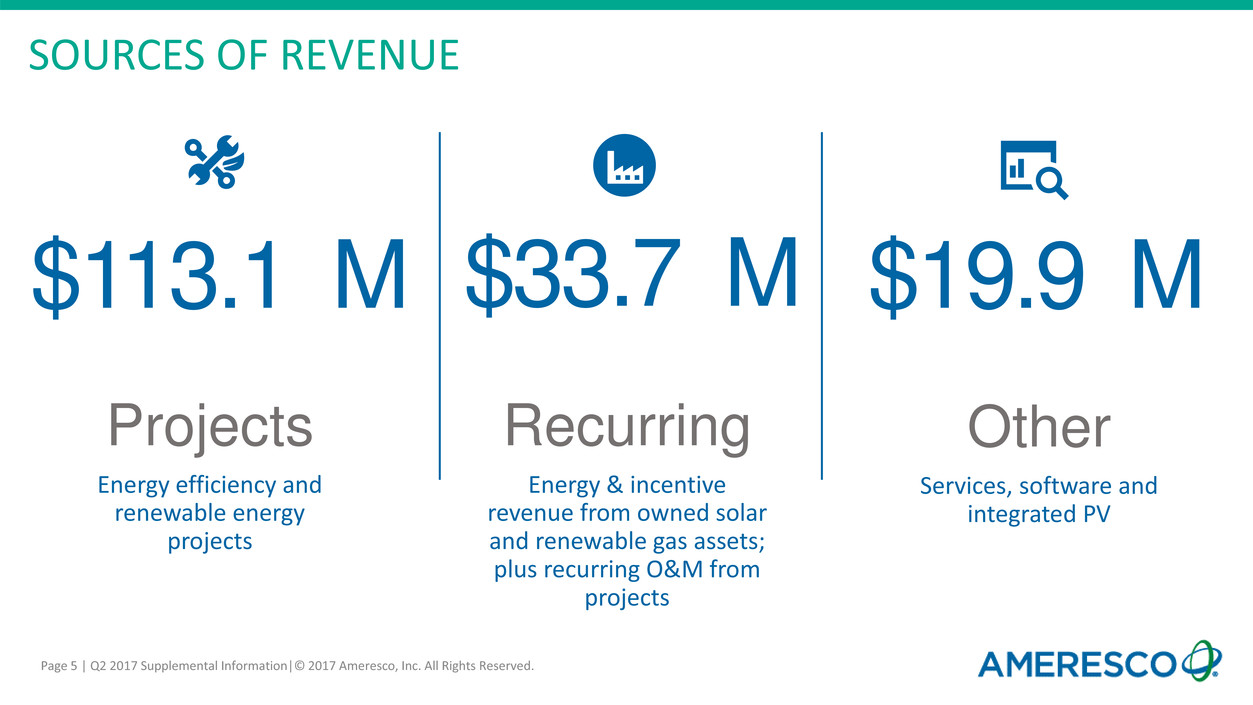
Page 5 | Q2 2017 Supplemental Information|© 2017 Ameresco, Inc. All Rights Reserved. SOURCES OF REVENUE $19.9 M $33.7 M $113.1 M Projects Energy efficiency and renewable energy projects Recurring Energy & incentive revenue from owned solar and renewable gas assets; plus recurring O&M from projects Other Services, software and integrated PV

Page 6 | Q2 2017 Supplemental Information|© 2017 Ameresco, Inc. All Rights Reserved. 60% OF PROFIT COMES FROM RECURRING LINE OF BUSINESS Projects 68% Assets 11% O&M 9% Other 12% $166.7M REVENUE 20% [CATEGORY NAME] 35% [CATEGORY NAME] 45% [CATEGORY NAME] 15% [CATEGORY NAME] 5% $15.4M Adjusted EBITDA* 60% * Adjusted EBITDA percentage amounts exclude unallocated corporate expenses. RECURRING
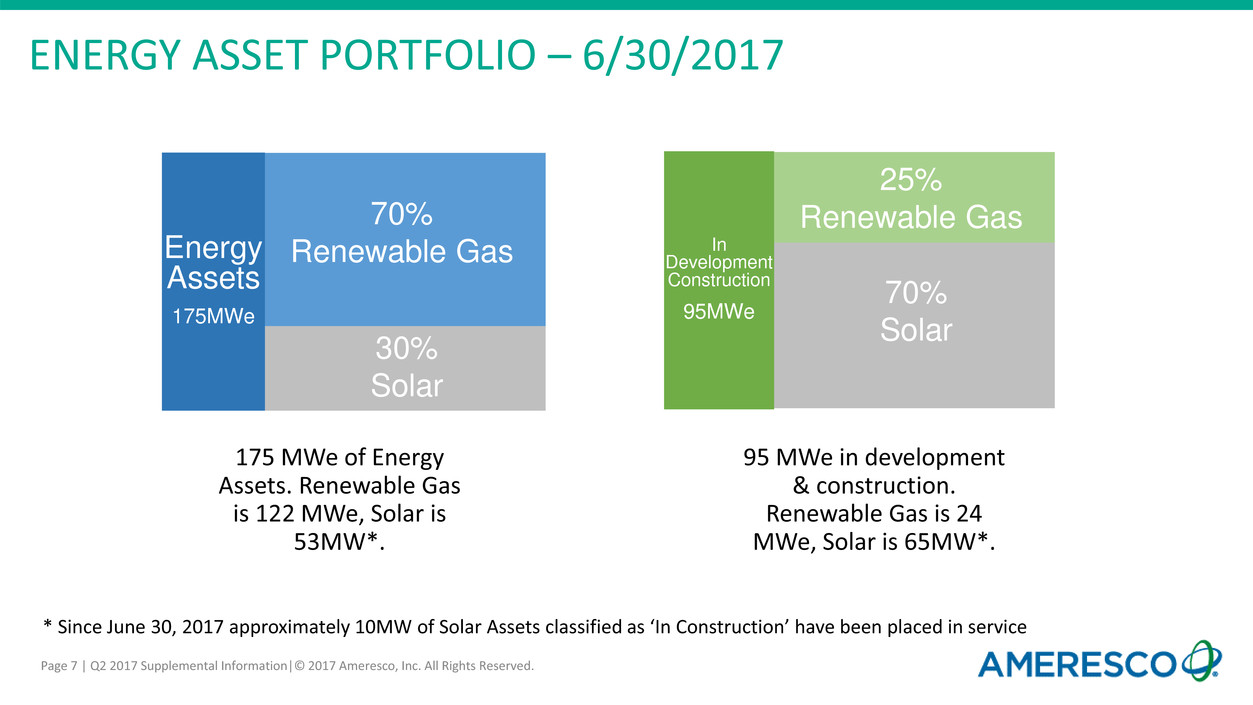
Page 7 | Q2 2017 Supplemental Information|© 2017 Ameresco, Inc. All Rights Reserved. ENERGY ASSET PORTFOLIO – 6/30/2017 Energy Assets 175MWe 70% Renewable Gas 30% Solar 175 MWe of Energy Assets. Renewable Gas is 122 MWe, Solar is 53MW*. In Development Construction 95MWe 70% Solar 25% Renewable Gas 95 MWe in development & construction. Renewable Gas is 24 MWe, Solar is 65MW*. * Since June 30, 2017 approximately 10MW of Solar Assets classified as ‘In Construction’ have been placed in service
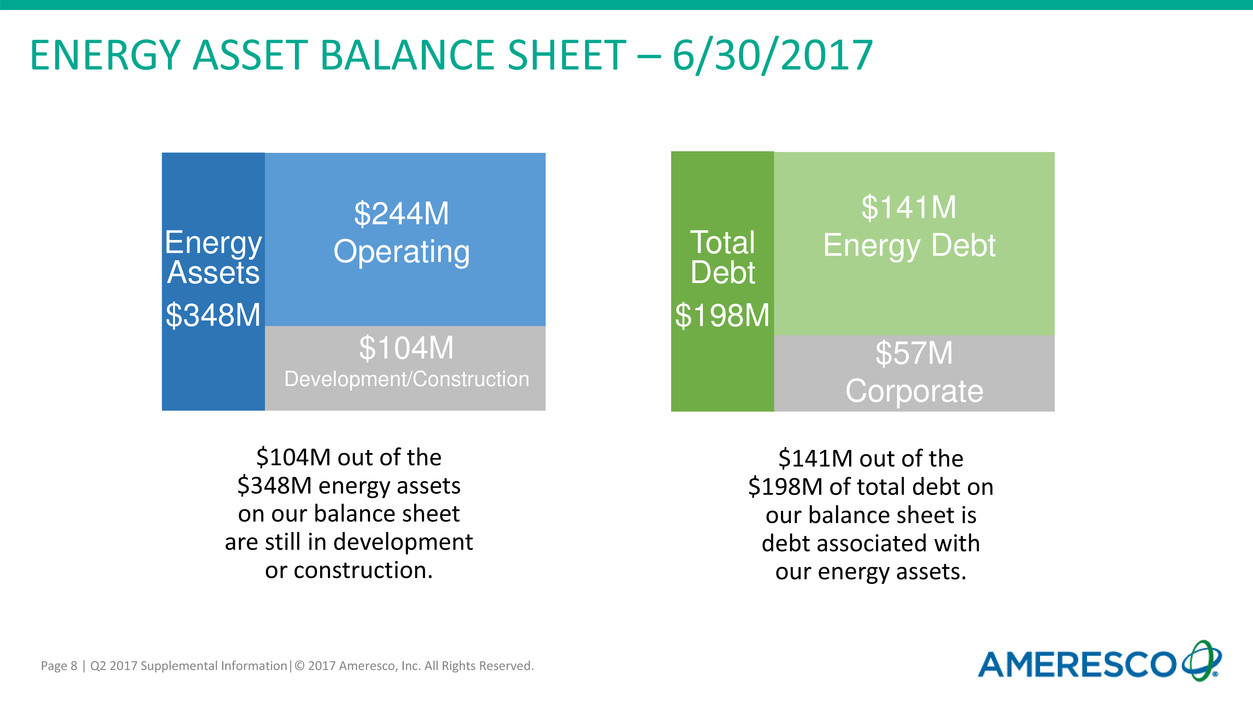
Page 8 | Q2 2017 Supplemental Information|© 2017 Ameresco, Inc. All Rights Reserved. ENERGY ASSET BALANCE SHEET – 6/30/2017 Energy Assets $348M $244M Operating $104M Development/Construction Total Debt $198M $57M Corporate $141M Energy Debt $104M out of the $348M energy assets on our balance sheet are still in development or construction. $141M out of the $198M of total debt on our balance sheet is debt associated with our energy assets.

Appendix

Page 10 | Q2 2017 Supplemental Information|© 2017 Ameresco, Inc. All Rights Reserved. ENERGY ASSET METRICS MWe $ MWe $ Energy Assets: In Operations 175.0 244,686$ 162.0 233,932$ In Construction 95.2 103,786 65.5 22,706 Total Energy Assets 270.2 348,472$ 227.5 256,638$ 2017 2016 2017 2016 Energy Assets Performance: Revenues $17,894 $15,926 $33,276 $30,569 Adjusted EBITDA $10,535 $8,213 $18,102 $15,495 2017 2016 Energy Assets Debt Financing: In Operations 106,684$ 94,505$ In Construction 34,383 - Total Debt Financing 141,067$ 94,505$ Energy Asset Metrics (in thousands, except megawatt equivalents ("MWe")) As of June 30, As of June 30, 2017 2016 Three Months Ended June 30, Six Months Ended June 30,
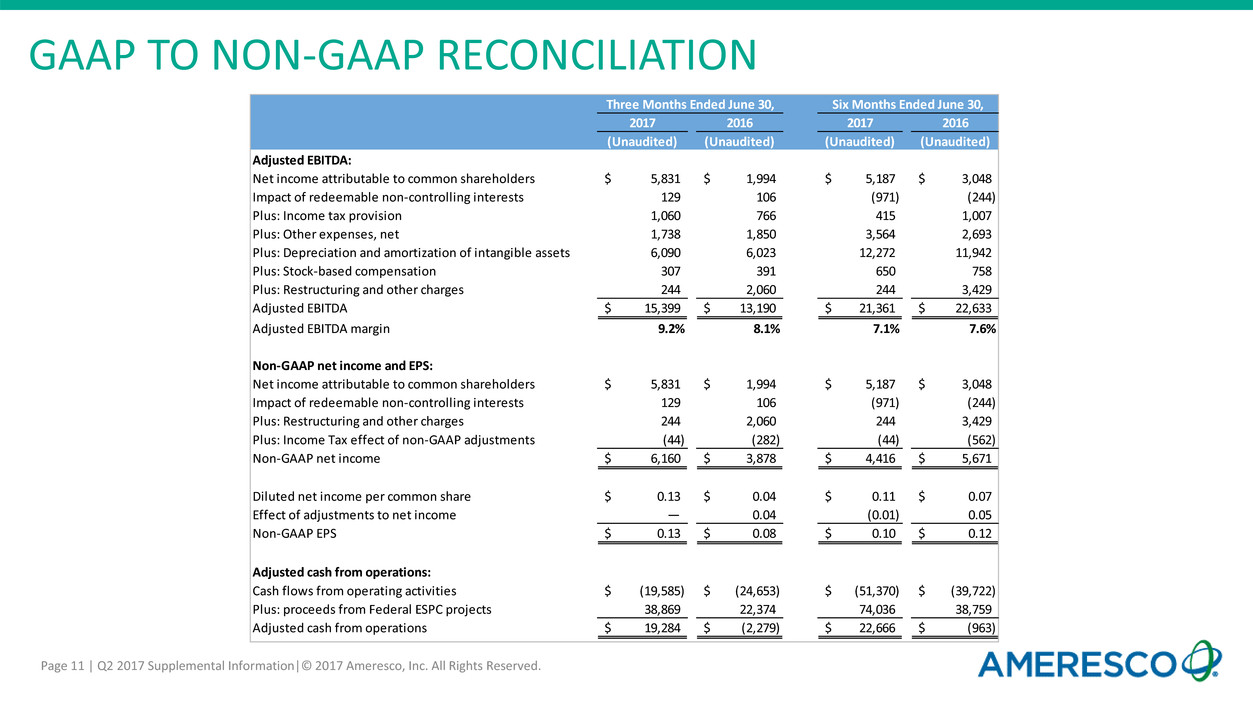
Page 11 | Q2 2017 Supplemental Information|© 2017 Ameresco, Inc. All Rights Reserved. GAAP TO NON-GAAP RECONCILIATION 2017 2016 2017 2016 (Unaudited) (Unaudited) (Unaudited) (Unaudited) Adjusted EBITDA: Net income attributable to common shareholders 5,831$ 1,994$ 5,187$ 3,048$ Impact of redeemable non-controlling interests 129 106 (971) (244) Plus: Income tax provision 1,060 766 415 1,007 Plus: Other expenses, net 1,738 1,850 3,564 2,693 Plus: Depreciation and amortization of intangible assets 6,090 6,023 12,272 11,942 Plus: Stock-based compensation 307 391 650 758 Plus: Restructuring and other charges 244 2,060 244 3,429 Adjusted EBITDA 15,399$ 13,190$ 21,361$ 22,633$ Adjusted EBITDA margin 9.2% 8.1% 7.1% 7.6% Non-GAAP net income and EPS: Net income attributable to common shareholders 5,831$ 1,994$ 5,187$ 3,048$ Impact of redeemable non-controlling interests 129 106 (971) (244) Plus: Restructuring and other charges 244 2,060 244 3,429 Plus: Income Tax effect of non-GAAP adjustments (44) (282) (44) (562) Non-GAAP net income 6,160$ 3,878$ 4,416$ 5,671$ Diluted net income per common share 0.13$ 0.04$ 0.11$ 0.07$ Effect of adjustments to net income — 0.04 (0.01) 0.05 Non-GAAP EPS 0.13$ 0.08$ 0.10$ 0.12$ Adjusted cash from operations: Cash flows from operating activities (19,585)$ (24,653)$ (51,370)$ (39,722)$ Plus: proceeds from Federal ESPC projects 38,869 22,374 74,036 38,759 Adjusted cash from operations 19,284$ (2,279)$ 22,666$ (963)$ Three Months Ended June 30, Six Months Ended June 30,
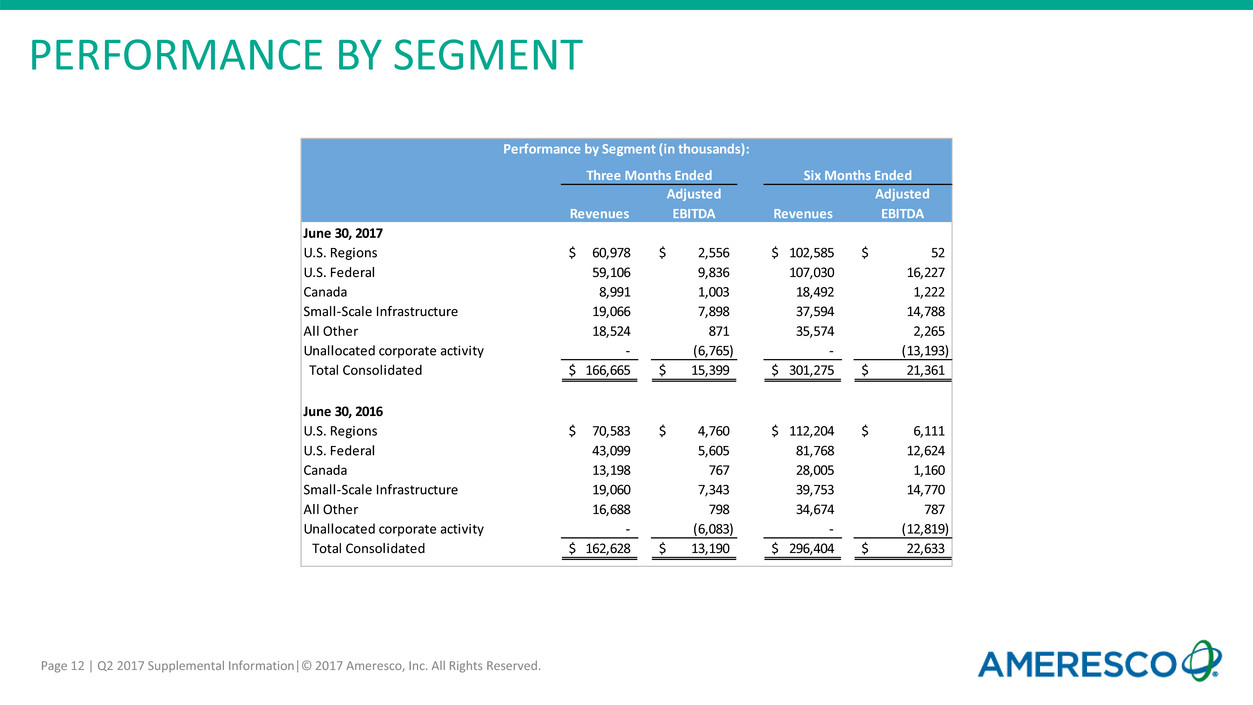
Page 12 | Q2 2017 Supplemental Information|© 2017 Ameresco, Inc. All Rights Reserved. PERFORMANCE BY SEGMENT Revenues Adjusted EBITDA Revenues Adjusted EBITDA June 30, 2017 U.S. Regions 60,978$ 2,556$ 102,585$ 52$ U.S. Federal 59,106 9,836 107,030 16,227 Canada 8,991 1,003 18,492 1,222 Small-Scale Infrastructure 19,066 7,898 37,594 14,788 All Other 18,524 871 35,574 2,265 Unallocated corporate activity - (6,765) - (13,193) Total Consolidated 166,665$ 15,399$ 301,275$ 21,361$ June 30, 2016 U.S. Regions 70,583$ 4,760$ 112,204$ 6,111$ U.S. Federal 43,099 5,605 81,768 12,624 Canada 13,198 767 28,005 1,160 Small-Scale Infrastructure 19,060 7,343 39,753 14,770 All Other 16,688 798 34,674 787 Unallocated corporate activity - (6,083) - (12,819) Total Consolidated 162,628$ 13,190$ 296,404$ 22,633$ Three Months Ended Six Months Ended Performance by Segment (in thousands):
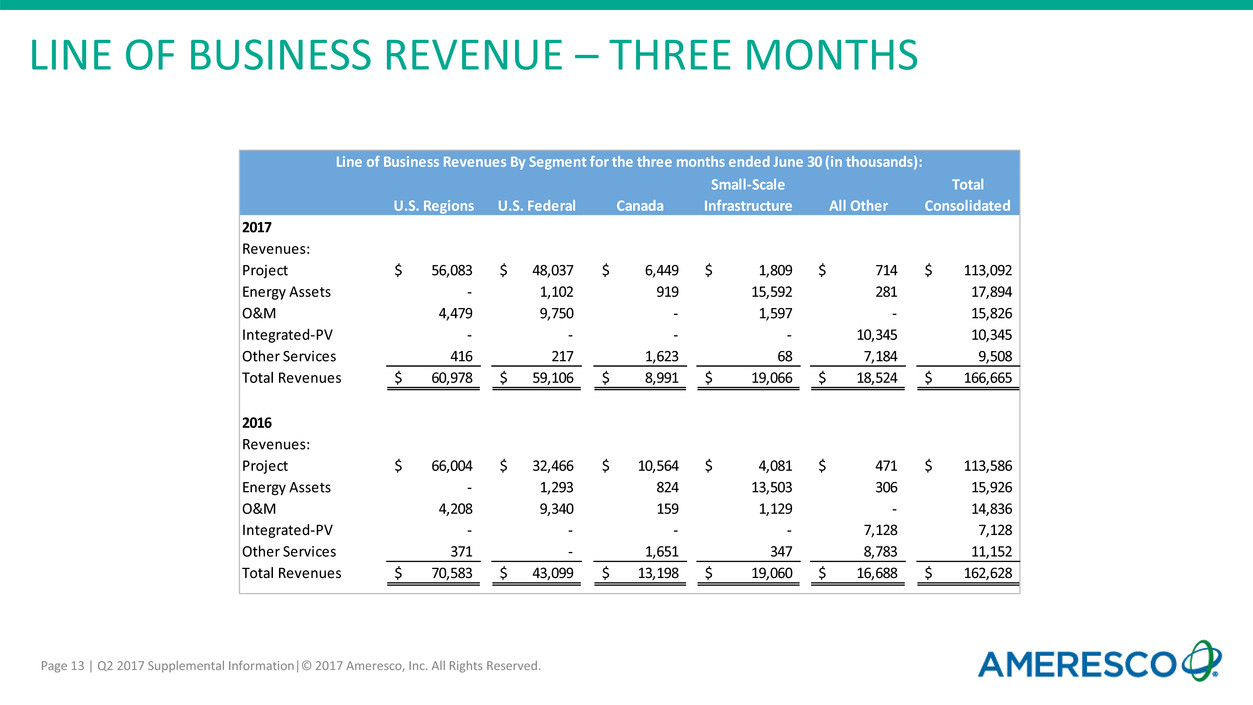
Page 13 | Q2 2017 Supplemental Information|© 2017 Ameresco, Inc. All Rights Reserved. LINE OF BUSINESS REVENUE – THREE MONTHS U.S. Regions U.S. Federal Canada Small-Scale Infrastructure All Other Total Consolidated 2017 Revenues: Project 56,083$ 48,037$ 6,449$ 1,809$ 714$ 113,092$ Energy Assets - 1,102 919 15,592 281 17,894 O&M 4,479 9,750 - 1,597 - 15,826 Integrated-PV - - - - 10,345 10,345 Other Services 416 217 1,623 68 7,184 9,508 Total Revenues 60,978$ 59,106$ 8,991$ 19,066$ 18,524$ 166,665$ 2016 Revenues: Project 66,004$ 32,466$ 10,564$ 4,081$ 471$ 113,586$ Energy Assets - 1,293 824 13,503 306 15,926 O&M 4,208 9,340 159 1,129 - 14,836 Integrated-PV - - - - 7,128 7,128 Other Services 371 - 1,651 347 8,783 11,152 Total Revenues 70,583$ 43,099$ 13,198$ 19,060$ 16,688$ 162,628$ Line of Business Revenues By Segment for the three months ended June 30 (in thousands):

Page 14 | Q2 2017 Supplemental Information|© 2017 Ameresco, Inc. All Rights Reserved. LINE OF BUSINESS REVENUE – SIX MONTHS U.S. Regions U.S. Federal Canada Small-Scale Infrastructure All Other Total Consolidated 2017 Revenues: Project 92,497$ 85,996$ 14,165$ 4,280$ 1,599$ 198,537$ Energy Assets 0 1,536 1,303 29,872 565 33,276 O&M 8,510 18,911 0 3,139 0 30,560 Integrated-PV 0 0 0 0 18,501 18,501 Other Services 1,578 587 3,024 303 14,909 20,401 Total Revenues 102,585$ 107,030$ 18,492$ 37,594$ 35,574$ 301,275$ 2016 Revenues: Project 103,165$ 59,267$ 23,382$ 10,108$ 2,766$ 198,688$ Energy Assets 0 1,905 1,117 26,935 612 30,569 O&M 8,569 20,596 315 2,057 0 31,537 Integrated-PV 0 0 0 0 14,487 14,487 Other Services 470 0 3,191 653 16,809 21,123 Total Revenues 112,204$ 81,768$ 28,005$ 39,753$ 34,674$ 296,404$ Line of Business Revenues By Segment for the six months ended June 30 (in thousands):


