UNITED STATES
SECURITIES AND EXCHANGE COMMISSION
WASHINGTON, D.C. 20549
FORM N-CSR
CERTIFIED SHAREHOLDER REPORT OF REGISTERED MANAGEMENT
INVESTMENT COMPANIES
Investment Company Act file number 811-22400
Oppenheimer Emerging Markets Local Debt Fund
(Exact name of registrant as specified in charter)
6803 South Tucson Way, Centennial, Colorado 80112-3924
(Address of principal executive offices) (Zip code)
Arthur S. Gabinet
OFI Global Asset Management, Inc.
Two World Financial Center, New York, New York 10281-1008
(Name and address of agent for service)
Registrant’s telephone number, including area code: (303) 768-3200
Date of fiscal year end: May 31
Date of reporting period: 5/30/2014
Item 1. Reports to Stockholders.
Table of Contents
Class A Shares
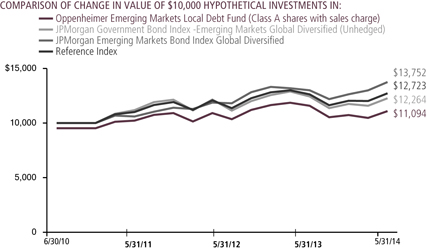
AVERAGE ANNUAL TOTAL RETURNS AT 5/30/14*
| | | | | | |
| | | Since Inception
(6/30/10) | | 1-Year | |
Class A Shares of the Fund without sales charge | | 3.97% | | | -4.20% | |
Class A Shares of the Fund with sales charge | | 2.68 | | | -8.75 | |
JPMorgan Government Bond Index -Emerging Markets Global Diversified (Unhedged) | | 5.35 | | | -1.37 | |
JPMorgan Emerging Markets Bond Index Global Diversified | | 8.47 | | | 5.77 | |
Reference Index | | 6.34 | | | 0.77 | |
Prior to February 4, 2014, the Fund was named Oppenheimer Emerging Markets Debt Fund.
Performance data quoted represents past performance, which does not guarantee future results. The investment return and principal value of an investment in the Fund will fluctuate so that an investor’s shares, when redeemed, may be worth more or less than their original cost. Fund returns include changes in share price, reinvested distributions, and a 4.75% maximum applicable sales charge except where “without sales charge” is indicated. Returns do not consider capital gains or income taxes on an individual’s investment. For performance data current to the most recent month-end, visit oppenheimerfunds.com or call 1.800.CALL OPP (225.5677).
*May 30, 2014, was the last business day of the Fund’s fiscal year end. See Note 1 of the accompanying Notes to Financial Statements. Index returns are calculated through May 31, 2014.
2 OPPENHEIMER EMERGING MARKETS LOCAL DEBT FUND
Fund Performance Discussion
The Fund’s Class A shares (without sales charge) produced a total return of -4.20% during the reporting period. On a relative basis, the JPMorgan Emerging Markets Bond Index Global Diversified returned 5.77% and the JPMorgan Government Bond Index—Emerging Markets Global Diversified (Unhedged) returned -1.37%. The bulk of the Fund’s declines occurred over the first half of the reporting period when emerging market debt as an asset class had a rough time after the initial rate rise in U. S. Treasuries.
As a reminder, on February 4, 2014, the Fund changed its name to Oppenheimer Emerging Markets Local Debt Fund. Consistent with this change, the Fund’s investment strategy was modified to reflect that the Fund will invest, under normal market conditions, determined by OppenheimerFunds, Inc. (the Sub-Adviser) in its discretion, at least 80% of its net assets (plus borrowings for investment purposes) in debt securities that are economically tied to emerging market countries and denominated in local (non-U.S.) currency. We believe a greater focus on local currencies will provide investors with a dedicated vehicle for accessing the higher-yielding local markets in the developing world. Additionally, emerging markets have been issuing more sovereign and corporate debt denominated in local currencies, which we believe will continue to support a deeper, more liquid market in local currency bonds in the long term.
3 OPPENHEIMER EMERGING MARKETS LOCAL DEBT FUND
MARKET OVERVIEW
The global economy finished 2013 with slow and steady growth throughout the developed world. U.S. growth improved during the reporting period driven by continued strength in manufacturing, reasonable employment gains and strong activity in the housing market. Japan and Europe also posted stronger economic performances, but the Eurozone’s gains masked continued divergence among member states with countries like Spain and Ireland improving and France remaining weak. At the end of May 2013, market volatility picked up measurably as remarks from former Federal Reserve (“Fed”) Chairman Ben Bernanke indicated a possible tapering of the Fed’s asset purchase program if the economy continued to show improvement. Fears about a possible slowdown in the world’s emerging economies were exacerbated by the prospect of quantitative easing, which has been a steady source of liquidity, coming to an end. As a result, risk assets sold off across the board, with higher-yielding emerging market debt absorbing the brunt of the selling, although investment grade credit was certainly not immune. Simultaneously, the intermediate and long-end of the U.S. Treasury curve steepened quite dramatically as investors began to price in the likelihood of higher interest rates in the future. Against this backdrop, the U.S. dollar strengthened in the weeks after Chairman Bernanke’s remarks, and emerging market debt denominated in both U.S. dollars and local currencies weakened.
However, when the Fed actually announced in December that it would reduce its asset purchases by $10 billion a month from $85 billion to $75 billion, its decision to “taper” was met with relative calm in financial markets. U.S. interest rates generally rose and by the end of 2013 the interest rate on 10-year Treasury bonds was roughly 3.0%. That capped a weak year for both Treasuries and investment-grade fixed income. The U.S. dollar strengthened against almost every major currency and developed market equities finished 2013 with double digit gains for the year. Emerging markets were the relative laggards in the global economy during 2013. While still growing faster than most developed market economies, growth slowed throughout the world’s emerging economies as inflation and persistent current account deficits restrained activity in countries such as India, Indonesia and Brazil. China’s economy grew, albeit at a much slower pace than prior years, as its leaders instituted several measures in an attempt to reorient the nation’s economy from an export-led model to a consumption-led one.
2014 began with heightened volatility across multiple asset classes, and emerging market debt was no exception. The declines were largely the result of broader risk aversion trades potentially spurred by disappointing U.S. economic data, as evidenced by the fact that U.S. high grade bonds and U.S. Treasuries delivered the strongest returns in January. However, as the craze surrounding
4 OPPENHEIMER EMERGING MARKETS LOCAL DEBT FUND
Fed speculation died down, both developed market and emerging market bonds largely delivered positive performance through the end of the reporting period. The global economy in general started 2014 with continued slow and steady growth throughout the developed world. U.S. growth remained reasonably strong, though data softened for the first quarter, partially attributed to cold weather effects across much of the country. The Eurozone also grew at a slightly faster pace than 2013, but has continued to struggle with very low inflation and weak bank lending. The U.S. dollar has remained relatively stable throughout the period, and U.S. equities were largely flat after a very strong 2013. In emerging markets, U.S. dollar denominated debt has generally recovered since the volatility in May, whereas much of the local universe has not. Countries such as India, Turkey, South Africa and Brazil appeared to take some of the necessary steps to deal with higher inflation by raising benchmark interest rates, while currency depreciation helped restore competitiveness. Many of these countries, however, still need longer-term structural reforms. Export growth has also remained slow to the U.S. and European Union, restraining growth. China has continued its transition from an investment-led growth model to a consumption-led one, which has caused it to see several months of slower growth as well. We also began to see growing geopolitical tension (Russia and Ukraine, Syria and Iraq) and political noise (Thailand, Turkey, Venezuela). We expect political noise stemming from upcoming
elections in many developing countries could continue to cause uncertainty throughout 2014.
FUND REVIEW
As part of the strategy changes implemented on February 4, 2014, we significantly reduced the Fund’s exposure to U.S.-dollar denominated emerging market debt and corporate bonds, and were invested primarily in emerging market local-currency denominated bonds at period end. Top allocations at period end were local-currency denominated bonds of Turkey, Brazil, South Africa, Russia and Mexico. In a difficult environment for emerging market debt, each of these positions other than Mexico detracted from performance for the full reporting period. However, Turkey and Brazil fared much better over the second half of the reporting period. While our allocation to Russia detracted from performance given the rising geopolitical tension surrounding the nation’s disputed incursion into Ukraine, it is worth mentioning that we lowered our exposure during the reporting period and we continue to monitor the situation. Outside of these allocations, the Fund’s top performing local-currency denominated bonds for the overall period were based in Poland, South Korea, India, Hungary, Colombia and Mexico. While the Fund now focuses on local-currency denominated bonds, our exposure to U.S. dollar denominated emerging market debt and corporate bonds detracted from absolute performance for the volatile reporting period.
5 OPPENHEIMER EMERGING MARKETS LOCAL DEBT FUND
STRATEGY & OUTLOOK
Emerging market countries have become highly differentiated. The introduction of taper talk in May 2013 sent reverberations through global markets and sent interest rates in many developing countries higher. The abrupt change in market sentiment laid bare some fundamental challenges to countries with high current account deficits – challenges that a prolonged period of easy money in the U.S. may have masked to some degree. However, not all emerging market countries are experiencing fragilities. Most are at a low point cyclically in their economic cycle, but very few face structural problems. As the U.S. interest rate cycle plays out, one of the most important things we will examine is whether or not emerging market policymakers are taking necessary steps to stay ahead of it. Those that do their homework and take action to keep their economies looking attractive either by “price” (high real yields) or a strong structural story may show resilience to future
volatility, while those that do not make proper adjustments may continue to suffer. At period end, the U.S. appears to be leading the global economic recovery. However, U.S. Treasury yields remain low and therefore we have exposure to emerging market currencies in an effort to gain the additional yield they may provide, which is still relatively high. When U.S. Treasury yields start to rise, that will signal to us that the U.S. dollar is on the stronger side. It is also worth noting that we believe that another large driver of global growth and liquidity conditions, the European Union, remains a few years behind the U.S. cycle. While growth in the European Union finally emerged from recession in the second quarter of 2013 - with even some periphery countries returning to positive growth more recently, we continue to believe that further easing on the part of the European Central Bank may be on the horizon given persistent low inflation and weak bank lending.
| | |
 | | 
Sara J. Zervos, Ph.D. Portfolio Manager |
| |
6 OPPENHEIMER EMERGING MARKETS LOCAL DEBT FUND
Top Holdings and Allocations*
TOP TEN GEOGRAPHICAL HOLDINGS
| | |
Turkey | | 22.2% |
Brazil | | 15.6 |
Russia | | 10.5 |
South Africa | | 9.6 |
Mexico | | 7.9 |
Indonesia | | 7.0 |
Malaysia | | 5.3 |
Hungary | | 4.9 |
South Korea | | 3.4 |
Thailand | | 3.3 |
Portfolio holdings and allocation are subject to change. Percentages are as of May 30, 2014, and are based on total market value of investments.
PORTFOLIO ALLOCATION
| | |
Foreign Government Obligations | | 83.3% |
Short-Term Notes | | 14.5 |
Corporate Bonds and Notes | | 2.0 |
Over-the-Counter Options Purchased | | 0.2 |
Portfolio holdings and allocations are subject to change. Percentages are as of May 30, 2014, and are based on the total market value of investments.
*May 30, 2014, was the last business day of the Fund’s fiscal year end. See Note 1 of the accompanying Notes to Financial Statements.
| | |
| CREDIT RATING BREAKDOWN | | NRSRO
ONLY
TOTAL |
AAA | | 0.5% |
A | | 26.2 |
BBB | | 66.3 |
BB | | 4.5 |
B | | 0.3 |
Unrated | | 2.2 |
Total | | 100.0% |
The percentages above are based on the market value of the Fund’s securities as of May 30, 2014, and are subject to change. Except for certain securities issued or guaranteed by a foreign sovereign, all securities have been rated by at least one Nationally Recognized Statistical Rating Organization (“NRSRO”), such as Standard & Poor’s (“S&P”). For securities rated only by an NRSRO other than S&P, OppenheimerFunds, Inc. (the “Sub-Adviser”) converts that rating to the equivalent S&P rating. If two or more NRSROs have assigned a rating to a security, the highest S&P equivalent rating is used. Unrated securities issued or guaranteed by a foreign sovereign are assigned a credit rating equal to the highest NRSRO rating assigned to that foreign sovereign. For securities not rated by an NRSRO, the Sub-Adviser uses its own credit analysis to assign ratings in categories similar to those of S&P. The use of similar categories is not an indication that the sub-adviser’s credit analysis process is consistent or comparable with any NRSRO’s process were that NRSRO to rate the same security. Fund assets invested in Oppenheimer Institutional Money Market Fund are assigned that fund’s S&P rating, which is currently AAA. For the purposes of this table, “investment-grade” securities are securities rated within the NRSROs’ four highest rating categories (AAA, AA, A and BBB). Unrated securities do not necessarily indicate low credit quality, and may or may not be the equivalent of investment-grade. Please consult the Fund’s prospectus and Statement of Additional Information for further information.
7 OPPENHEIMER EMERGING MARKETS LOCAL DEBT FUND
Share Class Performance
AVERAGE ANNUAL TOTAL RETURNS WITHOUT SALES CHARGE AS OF 5/30/14*
| | | | | | | | | | |
| | | Inception
Date | | | 1-Year | | | Since Inception |
Class A (OEMAX) | | | 6/30/10 | | | | -4.20% | | | 3.97% |
Class C (OEMCX) | | | 6/30/10 | | | | -4.92% | | | 3.18% |
Class I (OEMIX) | | | 9/28/12 | | | | -3.83% | | | -1.33% |
Class N (OEMNX) | | | 6/30/10 | | | | -4.45% | | | 3.71% |
Class Y (OEMYX) | | | 6/30/10 | | | | -3.91% | | | 4.25% |
AVERAGE ANNUAL TOTAL RETURNS WITH SALES CHARGE AS OF 5/30/14*
| | | | | | | | | | |
| | | Inception
Date | | | 1-Year | | | Since Inception |
Class A (OEMAX) | | | 6/30/10 | | | | -8.75% | | | 2.68% |
Class C (OEMCX) | | | 6/30/10 | | | | -5.82% | | | 3.18% |
Class I (OEMIX) | | | 9/28/12 | | | | -3.83% | | | -1.33% |
Class N (OEMNX) | | | 6/30/10 | | | | -5.35% | | | 3.71% |
Class Y (OEMYX) | | | 6/30/10 | | | | -3.91% | | | 4.25% |
STANDARDIZED YIELDS
For the 30 Days Ended 5/31/14
| | | | | | |
Class A | | | 5.19 | % | | |
Class C | | | 4.69 | | | |
Class I | | | 5.87 | | | |
Class N | | | 5.20 | | | |
Class Y | | | 5.75 | | | |
Performance data quoted represents past performance, which does not guarantee future results. The investment return and principal value of an investment in the Fund will fluctuate so that an investor’s shares, when redeemed, may be worth more or less than their original cost. Current performance may be lower or higher than the performance quoted. Returns do not consider capital gains or income taxes on an individual’s investment. For performance data current to the most recent month-end, visit oppenheimerfunds.com or call 1.800.CALL OPP (225.5677). Fund returns include changes in share price, reinvested distributions, and the applicable sales charge: for Class A shares, the current maximum initial sales charge of 4.75% and for Class C and N shares, the 1% contingent deferred sales charge (“CDSC”) for the 1-year period. As of July 1, 2014, Class N shares will be renamed Class R shares. Beginning July 1, 2014, new purchases of Class R shares will no longer be subject to a CDSC upon redemption (any CDSC will remain in effect for purchases prior to July 1, 2014). There is no sales charge for Class I and Class Y shares.
8 OPPENHEIMER EMERGING MARKETS LOCAL DEBT FUND
Standardized yield is based on net investment income for the 30-day period ended 5/31/14 and the maximum offering price at the end of the period for Class A shares and the net asset value for Class C, Class N, Class I and Class Y shares. Each result is compounded semiannually and then annualized. Falling share prices will tend to artificially raise yields.
The Fund’s performance is compared to the performance of the JPMorgan Government Bond Index—Emerging Markets Global Diversified (Unhedged), the JPMorgan Emerging Markets Bond Index Global Diversified and the Fund’s Reference Index. The JPMorgan Government Bond Index—Emerging Markets Global Diversified (Unhedged) is an emerging markets debt benchmark that tracks local currency bonds issued by emerging market governments. The JPMorgan Emerging Markets Bond Index Global Diversified tracks total returns of U.S. dollar-denominated Brady bonds, Eurobonds, traded loans, and local market debt instruments issued by sovereign and quasi-sovereign entities. The Reference Index is a customized weighted index comprised of the following underlying broad-based security indices: 70% of the JPMorgan Government Bond Index – Emerging Markets Global Diversified (Unhedged) and 30% of the JPMorgan Emerging Markets Bond Index Global Diversified. The indices are unmanaged and cannot be purchased directly by investors. While index comparisons may be useful to provide a benchmark for the Fund’s performance, it must be noted that the Fund’s investments are not limited to the investments comprising the indices. Index performance includes reinvestment of income, but does not reflect transaction costs, fees, expenses or taxes. Index performance is shown for illustrative purposes only as a benchmark for the Fund’s performance, and does not predict or depict performance of the Fund. The Fund’s performance reflects the effects of the Fund’s business and operating expenses.
The Fund’s investment strategy and focus can change over time. The mention of specific fund holdings does not constitute a recommendation by OppenheimerFunds, Inc. or its affiliates.
Before investing in any of the Oppenheimer funds, investors should carefully consider a fund’s investment objectives, risks, charges and expenses. Fund prospectuses and summary prospectuses contain this and other information about the funds, and may be obtained by asking your financial advisor, visiting oppenheimerfunds.com, or calling 1.800.CALL OPP (225.5677). Read prospectuses and summary prospectuses carefully before investing.
Shares of Oppenheimer funds are not deposits or obligations of any bank, are not guaranteed by any bank, are not insured by the FDIC or any other agency, and involve investment risks, including the possible loss of the principal amount invested.
9 OPPENHEIMER EMERGING MARKETS LOCAL DEBT FUND
Fund Expenses
Fund Expenses. As a shareholder of the Fund, you incur two types of costs: (1) transaction costs, which may include sales charges (loads) on purchase payments, contingent deferred sales charges on redemptions; and (2) ongoing costs, including management fees; distribution and service fees; and other Fund expenses. These examples are intended to help you understand your ongoing costs (in dollars) of investing in the Fund and to compare these costs with the ongoing costs of investing in other mutual funds.
The examples are based on an investment of $1,000.00 invested at the beginning of the period and held for the entire 6-month period ended May 30, 2014.
Actual Expenses. The first section of the table provides information about actual account values and actual expenses. You may use the information in this section for the class of shares you hold, together with the amount you invested, to estimate the expense that you paid over the period. Simply divide your account value by $1,000.00 (for example, an $8,600.00 account value divided by $1,000.00 = 8.60), then multiply the result by the number in the first section under the heading entitled “Expenses Paid During Period” to estimate the expenses you paid on your account during this period.
Hypothetical Example for Comparison Purposes. The second section of the table provides information about hypothetical account values and hypothetical expenses based on the Fund’s actual expense ratio for each class of shares, and an assumed rate of return of 5% per year for each class before expenses, which is not the actual return. The hypothetical account values and expenses may not be used to estimate the actual ending account balance or expenses you paid for the period. You may use this information to compare the ongoing costs of investing in the Fund and other funds. To do so, compare this 5% hypothetical example for the class of shares you hold with the 5% hypothetical examples that appear in the shareholder reports of the other funds.
Please note that the expenses shown in the table are meant to highlight your ongoing costs only and do not reflect any transactional costs, such as front-end or contingent deferred sales charges (loads). Therefore, the “hypothetical” section of the table is useful in comparing ongoing costs only, and will not help you determine the relative total costs of owning different funds. In addition, if these transactional costs were included, your costs would have been higher.
10 OPPENHEIMER EMERGING MARKETS LOCAL DEBT FUND
| | | | | | | | | | | | | | | | | | |
| Actual | | Beginning Account Value
December 1, 2013 | | Ending Account Value May 30, 2014 | | Expenses Paid During 6 Months Ended May 30, 2014 |
Class A | | $ | 1,000.00 | | | | | $ | 1,033.80 | | | | | $ | 6.37 | | | |
Class C | | | 1,000.00 | | | | | | 1,028.90 | | | | | | 10.21 | | | |
Class I | | | 1,000.00 | | | | | | 1,034.70 | | | | | | 4.35 | | | |
Class N | | | 1,000.00 | | | | | | 1,032.60 | | | | | | 7.64 | | | |
Class Y | | | 1,000.00 | | | | | | 1,034.30 | | | | | | 4.80 | | | |
| | | | | | |
| Hypothetical | | | | | | | | | | | | | | | | | | |
(5% return before expenses) | | | | | | | | | | | | | | | | | | |
Class A | | | 1,000.00 | | | | | | 1,018.55 | | | | | | 6.33 | | | |
Class C | | | 1,000.00 | | | | | | 1,014.78 | | | | | | 10.14 | | | |
Class I | | | 1,000.00 | | | | | | 1,020.53 | | | | | | 4.32 | | | |
Class N | | | 1,000.00 | | | | | | 1,017.31 | | | | | | 7.58 | | | |
Class Y | | | 1,000.00 | | | | | | 1,020.08 | | | | | | 4.77 | | | |
Expenses are equal to the Fund’s annualized expense ratio for that class, multiplied by the average account value over the period, multiplied by 181/365 (to reflect the one-half year period). Those annualized expense ratios, excluding indirect expenses from affiliated funds, based on the 6-month period ended May 30, 2014 are as follows:
| | | | | | |
| Class | | Expense Ratios | | | |
Class A | | | 1.26 | % | | |
Class C | | | 2.02 | | | |
Class I | | | 0.86 | | | |
Class N | | | 1.51 | | | |
Class Y | | | 0.95 | | | |
The expense ratios reflect voluntary and/or contractual waivers and/or reimbursements of expenses by the Fund’s Manager and Transfer Agent. Some of these undertakings may be modified or terminated at any time, as indicated in the Fund’s prospectus. The “Financial Highlights” tables in the Fund’s financial statements, included in this report, also show the gross expense ratios, without such waivers or reimbursements and reduction to custodian expenses, if applicable.
11 OPPENHEIMER EMERGING MARKETS LOCAL DEBT FUND
| | | | |
| |
| STATEMENT OF INVESTMENTS May 30, 2014* | | |
| | | | | | | | | | | | |
| | | | | | Principal Amount | | | Value | |
| |
Foreign Government Obligations—82.9% | | | | | | | | | | | | |
| |
Brazil—14.9% | | | | | | | | | | | | |
Federative Republic of Brazil Letra Tesouro Nacional Treasury Bills: | | | | | | | | | | | | |
10.219%, 7/1/144 | | | BRL | | | | 2,665,000 | | | $ | 1,179,497 | |
10.346%, 10/1/144 | | | BRL | | | | 2,170,000 | | | | 934,656 | |
10.998%, 1/1/154 | | | BRL | | | | 13,955,000 | | | | 5,851,124 | |
| |
Federative Republic of Brazil Nota Do Tesouro Nacional Unsec. Nts.: | | | | | | | | | | | | |
9.762%, 1/1/18 | | | BRL | | | | 3,215,000 | | | | 1,362,716 | |
9.762%, 1/1/21 | | | BRL | | | | 1,765,000 | | | | 721,301 | |
10.00%, 1/1/23 | | | BRL | | | | 2,275,000 | | | | 911,990 | |
| | | | | | | | | | | | |
| | | | | | | | | | | 10,961,284 | |
|
| |
Colombia—2.7% | | | | | | | | | | | | |
Republic of Colombia Sr. Unsec. Bonds, 6%, Series B, 4/28/281 | | | COP | | | | 888,000,000 | | | | 436,601 | |
| |
Republic of Colombia Sr. Unsec. Nts.: | | | | | | | | | | | | |
Series B, 7.00%, 5/4/221 | | | COP | | | | 939,000,000 | | | | 520,864 | |
Series B, 10.00%, 7/24/24 | | | COP | | | | 1,512,000,000 | | | | 1,015,515 | |
| | | | | | | | | | | | |
| | | | | | | | | | | 1,972,980 | |
|
| |
Hungary—1.8% | | | | | | | | | | | | |
Hungary Unsec. Bonds: | | | | | | | | | | | | |
Series 22/A, 7.00%, 6/24/22 | | | HUF | | | | 76,000,000 | | | | 400,734 | |
Series 23/A, 6.00%, 11/24/23 | | | HUF | | | | 181,000,000 | | | | 905,617 | |
| | | | | | | | | | | | |
| | | | | | | | | | | 1,306,351 | |
|
| |
Indonesia—7.0% | | | | | | | | | | | | |
Republic of Indonesia Treasury Bonds: | | | | | | | | | | | | |
Series FR68, 8.375%, 3/15/34 | | | IDR | | | | 16,210,000,000 | | | | 1,361,033 | |
Series FR70, 8.375%, 3/15/24 | | | IDR | | | | 25,030,000,000 | | | | 2,199,015 | |
Series FR71, 9.00%, 3/15/29 | | | IDR | | | | 17,470,000,000 | | | | 1,560,274 | |
| | | | | | | | | | | | |
| | | | | | | | | | | 5,120,322 | |
|
| |
Mexico—7.6% | | | | | | | | | | | | |
United Mexican States Bonds, 8%, Series M, 12/7/23 | | | MXN | | | | 3,300,000 | | | | 298,224 | |
| |
United Mexican States Unsec. Bonds: | | | | | | | | | | | | |
Series M, 6.50%, 6/9/22 | | | MXN | | | | 23,400,000 | | | | 1,925,631 | |
Series M20, 7.50%, 6/3/27 | | | MXN | | | | 11,000,000 | | | | 963,358 | |
Series M20, 8.50%, 5/31/29 | | | MXN | | | | 14,770,000 | | | | 1,392,089 | |
Series M30, 8.50%, 11/18/38 | | | MXN | | | | 5,100,000 | | | | 477,955 | |
Series M30, 10.00%, 11/20/36 | | | MXN | | | | 4,800,000 | | | | 513,180 | |
| | | | | | | | | | | | |
| | | | | | | | | | | 5,570,437 | |
|
| |
Peru—2.0% | | | | | | | | | | | | |
Republic of Peru Sr. Unsec. Bonds: | | | | | | | | | | | | |
7.84%, 8/12/202 | | | PEN | | | | 1,790,000 | | | | 740,952 | |
8.20%, 8/12/262 | | | PEN | | | | 1,755,000 | | | | 773,133 | |
| | | | | | | | | | | | |
| | | | | | | | | | | 1,514,085 | |
|
| |
Romania—2.1% | | | | | | | | | | | | |
Romania Unsec. Bonds: | | | | | | | | | | | | |
5.85%, 4/26/23 | | | RON | | | | 1,390,000 | | | | 468,038 | |
5.90%, 7/26/17 | | | RON | | | | 3,350,000 | | | | 1,115,301 | |
| | | | | | | | | | | | |
| | | | | | | | | | | 1,583,339 | |
12 OPPENHEIMER EMERGING MARKETS LOCAL DEBT FUND
| | | | | | | | | | | | |
| | | | | | Principal Amount | | | Value | |
Russia—9.8% | | | | | | | | | | | | |
AHML Via AHML Finance Ltd. Unsec. Nts., 7.75%, 2/13/182 | | | RUB | | | | 6,700,000 | | | $ | 174,234 | |
| |
Russian Federation Unsec. Bonds: | | | | | | | | | | | | |
Series 6203, 6.90%, 8/3/16 | | | RUB | | | | 27,200,000 | | | | 761,637 | |
Series 6205, 7.60%, 4/14/21 | | | RUB | | | | 13,600,000 | | | | 377,537 | |
Series 6206, 7.40%, 6/14/17 | | | RUB | | | | 20,100,000 | | | | 564,891 | |
Series 6209, 7.60%, 7/20/22 | | | RUB | | | | 11,400,000 | | | | 313,687 | |
Series 6210, 6.80%, 12/11/19 | | | RUB | | | | 80,500,000 | | | | 2,172,848 | |
Series 6212, 7.05%, 1/19/28 | | | RUB | | | | 10,900,000 | | | | 274,935 | |
Series 6215, 7.00%, 8/16/23 | | | RUB | | | | 22,200,000 | | | | 581,594 | |
Series 6216, 6.70%, 5/15/19 | | | RUB | | | | 62,800,000 | | | | 1,691,815 | |
| |
Vnesheconombank Sr. Unsec. Bonds, Series 9, 7.90%, 3/18/213 | | | RUB | | | | 9,000,000 | | | | 254,742 | |
| | | | | | | | | | | | |
| | | | | | | | | | | 7,167,920 | |
|
| |
Serbia—0.3% | | | | | | | | | | | | |
Republic of Serbia Treasury Bills, 10.639%, 6/12/144 | | | RSD | | | | 18,000,000 | | | | 212,070 | |
|
| |
South Africa—9.6% | | | | | | | | | | | | |
Republic of South Africa Sr. Unsec. Bonds: | | | | | | | | | | | | |
Series R207, 7.25%, 1/15/20 | | | ZAR | | | | 14,400,000 | | | | 1,328,537 | |
Series R208, 6.75%, 3/31/21 | | | ZAR | | | | 14,400,000 | | | | 1,276,394 | |
| |
Republic of South Africa Unsec. Bonds: | | | | | | | | | | | | |
Series 2023, 7.75%, 2/28/23 | | | ZAR | | | | 18,400,000 | | | | 1,698,736 | |
Series R186, 10.50%, 12/21/26 | | | ZAR | | | | 24,600,000 | | | | 2,713,030 | |
| | | | | | | | | | | | |
| | | | | | | | | | | 7,016,697 | |
|
| |
Thailand—3.3% | | | | | | | | | | | | |
Kingdom of Thailand Sr. Unsec. Bonds: | | | | | | | | | | | | |
3.25%, 6/16/17 | | | THB | | | | 22,900,000 | | | | 713,903 | |
5.125%, 3/13/18 | | | THB | | | | 20,700,000 | | | | 682,292 | |
| |
Kingdom of Thailand Sr. Unsec. Nts., 3.875%, 6/13/19 | | | THB | | | | 31,900,000 | | | | 1,006,260 | |
| | | | | | | | | | | | |
| | | | | | | | | | | 2,402,455 | |
|
| |
Turkey—21.8% | | | | | | | | | | | | |
Republic of Turkey Bonds: | | | | | | | | | | | | |
8.30%, 10/7/15 | | | TRY | | | | 2,735,000 | | | | 1,304,647 | |
8.80%, 9/27/23 | | | TRY | | | | 1,900,000 | | | | 901,807 | |
9.00%, 1/27/16 | | | TRY | | | | 700,000 | | | | 337,752 | |
10.00%, 6/17/15 | | | TRY | | | | 6,800,000 | | | | 3,298,846 | |
10.50%, 1/15/20 | | | TRY | | | | 600,000 | | | | 310,384 | |
10.70%, 2/24/16 | | | TRY | | | | 5,625,000 | | | | 2,787,827 | |
| |
Republic of Turkey Sr. Unsec. Bonds, 8%, 6/4/14 | | | TRY | | | | 5,565,000 | | | | 2,653,285 | |
| |
Republic of Turkey Unsec. Bonds: | | | | | | | | | | | | |
5.828%, 2/11/15 | | | TRY | | | | 660,000 | | | | 448,821 | |
6.30%, 2/14/18 | | | TRY | | | | 3,050,000 | | | | 1,357,478 | |
7.10%, 3/8/23 | | | TRY | | | | 1,300,000 | | | | 553,805 | |
8.50%, 9/14/22 | | | TRY | | | | 1,600,000 | | | | 746,448 | |
9.00%, 3/8/17 | | | TRY | | | | 2,600,000 | | | | 1,261,943 | |
| | | | | | | | | | | | |
| | | | | | | | | | | 15,963,043 | |
| | | | | | | | | | | | |
Total Foreign Government Obligations (Cost $59,658,348) | | | | | | | | | | | 60,790,983 | |
|
| |
Corporate Bonds and Notes—1.9% | | | | | | | | | | | | |
| |
Akbank TAS, 7.50% Sr. Unsec. Nts., 2/5/182 | | | TRY | | | | 595,000 | | | | 261,132 | |
| |
Banco ABC Brasil SA, 8.50% Sr. Unsec. Nts., 3/28/162 | | | BRL | | | | 145,000 | | | | 60,840 | |
13 OPPENHEIMER EMERGING MARKETS LOCAL DEBT FUND
| | | | |
| |
| STATEMENT OF INVESTMENTS Continued | | |
| | | | | | | | | | | | |
| | | | | | Principal Amount | | | Value | |
| |
Corporate Bonds and Notes (Continued) | | | | | | | | | | | | |
| |
Banco Santander Brasil SA (Cayman Islands), 8% Sr. Unsec. Unsub. Nts., 3/18/162 | | | BRL | | | | 370,000 | | | $ | 157,311 | |
| |
Empresas Publicas de Medellin ESP, 8.375% Sr. Unsec. Nts., 2/1/212 | | | COP | | | | 215,475,000 | | | | 121,562 | |
| |
Novatek OAO via Novatek Finance Ltd., 7.75% Sr. Unsec. Nts., 2/21/172 | | | RUB | | | | 3,070,000 | | | | 83,588 | |
| |
Odebrecht Finance Ltd., 8.25% Sr. Unsec. Nts., 4/25/182 | | | BRL | | | | 110,000 | | | | 43,208 | |
| |
Oi SA, 9.75% Sr. Unsec. Nts., 9/15/162 | | | BRL | | | | 360,000 | | | | 149,645 | |
| |
Red de Carreteras de Occidente SAPIB de CV, 9% Sr. Sec. Nts., 6/10/282 | | | MXN | | | | 2,300,000 | | | | 170,026 | |
| |
VimpelCom Holdings BV, 9% Sr. Unsec. Nts., 2/13/182 | | | RUB | | | | 6,500,000 | | | | 174,954 | |
| |
Vimpel-Communications OJSC, 8.85% Sr. Unsec. Nts., 3/8/223 | | | RUB | | | | 8,000,000 | | | | 228,730 | |
| | | | | | | | | | | | |
Total Corporate Bonds and Notes (Cost $1,696,204) | | | | | | | | | | | 1,450,996 | |
|
| |
Short-Term Notes—14.4% | | | | | | | | | | | | |
| |
Hungary—3.0% | | | | | | | | | | | | |
Hungary Treasury Bills: | | | | | | | | | | | | |
3.021%, 11/26/144 | | | HUF | | | | 250,000,000 | | | | 1,114,276 | |
Series 364D, 2.902%, 10/15/144 | | | HUF | | | | 250,000,000 | | | | 1,117,144 | |
| | | | | | | | | | | | |
| | | | | | | | | | | 2,231,420 | |
|
| |
Malaysia—5.3% | | | | | | | | | | | | |
Bank Negara Malaysia Monetary Unsec. Nts.: | | | | | | | | | | | | |
Series 3713, 2.876%, 6/17/144 | | | MYR | | | | 1,515,000 | | | | 470,962 | |
Series 4613, 2.919%, 7/24/144 | | | MYR | | | | 8,800,000 | | | | 2,727,558 | |
Series 4813, 2.905%, 8/5/144 | | | MYR | | | | 1,515,000 | | | | 469,110 | |
Series 7613, 2.924%, 7/10/144 | | | MYR | | | | 740,000 | | | | 229,621 | |
| | | | | | | | | | | | |
| | | | | | | | | | | 3,897,251 | |
|
| |
Nigeria—2.2% | | | | | | | | | | | | |
Federal Republic of Nigeria Treasury Bills: | | | | | | | | | | | | |
12.694%, 4/9/154 | | | NGN | | | | 146,000,000 | | | | 819,814 | |
12.699%, 4/23/154 | | | NGN | | | | 104,000,000 | | | | 579,691 | |
12.70%, 3/5/15 | | | NGN | | | | 31,000,000 | | | | 175,381 | |
| | | | | | | | | | | | |
| | | | | | | | | | | 1,574,886 | |
|
| |
South Korea—3.4% | | | | | | | | | | | | |
Korea Monetary Stabilization Bonds: | | | | | | | | | | | | |
Series 1411, 2.73%, 11/9/14 | | | KRW | | | | 949,000,000 | | | | 930,680 | |
Series 1412, 2.72%, 12/9/14 | | | KRW | | | | 1,551,000,000 | | | | 1,521,172 | |
| | | | | | | | | | | | |
| | | | | | | | | | | 2,451,852 | |
|
| |
United States—0.5% | | | | | | | | | | | | |
United States Treasury Bills, 0.086%, 7/24/144,5 | | | | | | | 400,000 | | | | 399,951 | |
| | | | | | | | | | | | |
Total Short-Term Notes (Cost $10,339,037) | | | | | | | | | | | 10,555,360 | |
| | | | | | | | | | | | | | | | | | | | | | | | | | | | |
| | | | | | | | | Exercise Expiration | | | | | | | | | | |
| Counterparty | | | | | | Price | | | Date | | | | | | Contracts | | | | |
| |
Over-the-Counter Options Purchased—0.2% | | | | | | | | | | | | | | | | | | | | | |
| |
CNH Currency Put6 | | | JPM | | | | CNH | | | | 6.153 | | | | 1/12/16 | | | | CNH | | | | 17,400,000 | | | | 102,556 | |
| |
INR Currency Call6 | | | JPM | | | | INR | | | | 58.750 | | | | 7/3/14 | | | | INR | | | | 356,000,000 | | | | 18,512 | |
14 OPPENHEIMER EMERGING MARKETS LOCAL DEBT FUND
| | | | | | | | | | | | | | | | | | | | | | | | | | | | |
| | | | | | | | | Exercise Expiration | | | | | | | | | | |
| Counterparty | | | | | | Price | | | Date | | | | | | Contracts | | | Value | |
| |
Over-the-Counter Options Purchased (Continued) | | | | | | | | | | | | | | | | | | | | | |
| |
RUB Currency Call6 | | | JPM | | | | RUB | | | | 33.500 | | | | 8/22/14 | | | | RUB | | | | 235,700,000 | | | $ | 10,842 | |
| | | | | | | | | | | | | | | | | | | | | | | | | | | | |
Total Over-the-Counter Options Purchased (Cost $127,142) | | | | | | | | | | | | | | | | | | | | | | | | | | | 131,910 | |
|
| |
Total Investments, at Value (Cost $71,820,731) | | | | | | | | | | | | | | | | | | | | | | | 99.4% | | | | 72,929,249 | |
| |
Assets in Excess of Other Liabilities | | | | | | | | | | | | | | | | | | | | | | | 0.6 | | | | 407,281 | |
| | | | | | | | | | | | | | | | | | | | | | | | |
Net Assets | | | | | | | | | | | | | | | | | | | | | | | 100.0% | | | $ | 73,336,530 | |
| | | | | | | | | | | | | | | | | | | | | | | | |
Footnotes to Statement of Investments
| * | May 30, 2014 represents the last business day of the Fund’s reporting period. See Note 1 of the accompanying Notes. |
1. All or a portion of the security position is when-issued or delayed delivery to be delivered and settled after May 30, 2014. See Note 1 of the accompanying Notes.
2. Represents securities sold under Rule 144A, which are exempt from registration under the Securities Act of 1933, as amended. These securities have been determined to be liquid under guidelines established by the Board of Trustees. These securities amount to $2,910,585 or 3.97% of the Fund’s net assets as of May 30, 2014.
3. Represents the current interest rate for a variable or increasing rate security.
4. Zero coupon bond reflects effective yield on the date of purchase.
5. All or a portion of the security position is held in segregated accounts and pledged to cover margin requirements under certain derivative contracts. The aggregate market value of such securities is $399,951. See Note 6 of the accompanying Notes.
6. Non-income producing security.
The following issuer is or was an affiliate, as defined in the Investment Company Act of 1940, at or during the period ended May 30, 2014 by virtue of the Fund owning at least 5% of the voting securities of the issuer or as a result of the Fund and the issuer having the same investment adviser. There were no affiliate securities held by the Fund as of May 30, 2014. Transactions during the period in which the issuer was an affiliate are as follows:
| | | | | | | | | | | | | | | | |
| | | Shares
May 31, 2013 | | | Gross
Additions | | | Gross
Reductions | | | Shares
May 30, 2014 | |
| |
Oppenheimer Institutional Money Market Fund, Cl. E | | | 1,903,985 | | | | 101,181,003 | | | | 103,084,988 | | | | — | |
| | | | | | | | | | | | | | | Income | |
| |
Oppenheimer Institutional Money Market Fund, Cl. E | | | | | | | | $1,800 | |
Distribution of investments representing geographic holdings, as a percentage of total investments at value, is as follows:
| | | | | | | | |
| Geographic Holdings | | Value | | | Percent | |
Turkey | | $ | 16,224,175 | | | | 22.2 | % |
Brazil | | | 11,372,289 | | | | 15.6 | |
Russia | | | 7,666,033 | | | | 10.5 | |
South Africa | | | 7,016,697 | | | | 9.6 | |
Mexico | | | 5,740,463 | | | | 7.9 | |
Indonesia | | | 5,120,322 | | | | 7.0 | |
Malaysia | | | 3,897,251 | | | | 5.3 | |
Hungary | | | 3,537,771 | | | | 4.9 | |
South Korea | | | 2,451,852 | | | | 3.4 | |
Thailand | | | 2,402,455 | | | | 3.3 | |
Colombia | | | 2,094,542 | | | | 2.9 | |
Romania | | | 1,583,339 | | | | 2.2 | |
15 OPPENHEIMER EMERGING MARKETS LOCAL DEBT FUND
| | | | |
| |
| STATEMENT OF INVESTMENTS Continued | | |
| | | | | | | | |
| Geographic Holdings (Continued) | | Value | | | Percent | |
Nigeria | | $ | 1,574,886 | | | | 2.2% | |
Peru | | | 1,514,085 | | | | 2.1 | |
United States | | | 399,951 | | | | 0.5 | |
Serbia | | | 212,070 | | | | 0.3 | |
China | | | 102,556 | | | | 0.1 | |
India | | | 18,512 | | | | 0.0 | |
| | | | |
Total | | $ | 72,929,249 | | | | 100.0% | |
| | | | |
| | | | | | | | | | | | | | | | | | | | | | | | | | |
| Forward Currency Exchange Contracts as of May 30, 2014 | |
| | | | | | | |
| Counterparty | | Settlement
Month(s) | | | | | Currency
Purchased
(000’s) | | | | | | Currency Sold
(000’s) | | | Unrealized
Appreciation | | | Unrealized
Depreciation | |
BAC | | 07/2014 - 10/2014 | | | BRL | | | | 11,170 | | | | USD | | | | 4,944 | | | $ | — | | | $ | 4,449 | |
BAC | | 08/2014 | | | IDR | | | | 4,487,000 | | | | USD | | | | 391 | | | | — | | | | 12,662 | |
BAC | | 09/2014 | | | THB | | | | 98,000 | | | | USD | | | | 3,018 | | | | — | | | | 46,254 | |
BAC | | 06/2014 | | | TRY | | | | 520 | | | | USD | | | | 247 | | | | 1,034 | | | | 262 | |
BAC | | 06/2014 - 01/2015 | | | USD | | | | 6,435 | | | | BRL | | | | 14,905 | | | | 2,802 | | | | 122,078 | |
BAC | | 07/2014 - 08/2014 | | | USD | | | | 5,785 | | | | RUB | | | | 210,500 | | | | 7,452 | | | | 163,424 | |
BAC | | 09/2014 | | | USD | | | | 1,899 | | | | THB | | | | 62,000 | | | | 18,912 | | | | — | |
BAC | | 06/2014 | | | USD | | | | 229 | | | | TRY | | | | 480 | | | | 379 | | | | — | |
BAC | | 08/2014 | | | USD | | | | 691 | | | | ZAR | | | | 7,370 | | | | 2,253 | | | | — | |
BAC | | 08/2014 | | | ZAR | | | | 11,300 | | | | USD | | | | 1,060 | | | | — | | | | 3,455 | |
BNP | | 07/2014 | | | RON | | | | 1,615 | | | | USD | | | | 492 | | | | 9,281 | | | | — | |
BNP | | 06/2014 | | | USD | | | | 2,542 | | | | MXN | | | | 33,500 | | | | — | | | | 60,760 | |
BNP | | 06/2014 | | | USD | | | | 2,588 | | | | TRY | | | | 5,565 | | | | — | | | | 64,827 | |
BOA | | 06/2014 | | | BRL | | | | 11,060 | | | | USD | | | | 4,908 | | | | 28,700 | | | | — | |
BOA | | 08/2014 | | | IDR | | | | 8,941,000 | | | | USD | | | | 781 | | | | — | | | | 27,477 | |
BOA | | 07/2014 - 10/2014 | | | INR | | | | 270,500 | | | | USD | | | | 4,428 | | | | 98,372 | | | | — | |
BOA | | 08/2014 | | | KRW | | | | 2,668,000 | | | | USD | | | | 2,593 | | | | 10,650 | | | | — | |
BOA | | 08/2014 | | | MYR | | | | 12,325 | | | | USD | | | | 3,809 | | | | 3,072 | | | | — | |
BOA | | 07/2014 | | | RON | | | | 175 | | | | USD | | | | 54 | | | | 129 | | | | — | |
BOA | | 09/2014 | | | THB | | | | 98,000 | | | | USD | | | | 2,991 | | | | — | | | | 19,450 | |
BOA | | 07/2014 - 01/2015 | | | USD | | | | 4,255 | | | | BRL | | | | 10,460 | | | | — | | | | 288,336 | |
BOA | | 08/2014 | | | USD | | | | 458 | | | | COP | | | | 877,000 | | | | — | | | | 1,810 | |
BOA | | 07/2014 - 10/2014 | | | USD | | | | 1,184 | | | | INR | | | | 73,500 | | | | — | | | | 30,989 | |
BOA | | 06/2014 | | | USD | | | | 357 | | | | MXN | | | | 4,800 | | | | — | | | | 16,100 | |
BOA | | 08/2014 | | | USD | | | | 292 | | | | PEN | | | | 840 | | | | — | | | | 9,395 | |
BOA | | 09/2014 | | | USD | | | | 2,062 | | | | THB | | | | 68,000 | | | | 4,202 | | | | 4,599 | |
CITNA-B | | 09/2014 | | | THB | | | | 2,000 | | | | USD | | | | 61 | | | | — | | | | 767 | |
CITNA-B | | 08/2014 | | | TRY | | | | 290 | | | | USD | | | | 135 | | | | 518 | | | | — | |
CITNA-B | | 07/2014 | | | USD | | | | 214 | | | | RON | | | | 695 | | | | — | | | | 1,732 | |
CITNA-B | | 06/2014 | | | USD | | | | 1,644 | | | | TRY | | | | 3,420 | | | | 13,800 | | | | 529 | |
CITNA-B | | 08/2014 | | | USD | | | | 160 | | | | ZAR | | | | 1,680 | | | | 3,036 | | | | — | |
CITNA-B | | 08/2014 | | | ZAR | | | | 18,850 | | | | USD | | | | 1,794 | | | | — | | | | 31,640 | |
DEU | | 07/2014 | | | RON | | | | 875 | | | | USD | | | | 271 | | | | 772 | | | | — | |
DEU | | 08/2014 | | | TRY | | | | 3,345 | | | | USD | | | | 1,557 | | | | 6,520 | | | | — | |
DEU | | 06/2014 - 08/2014 | | | USD | | | | 6,664 | | | | TRY | | | | 14,145 | | | | 27,540 | | | | 6,412 | |
GSCO-OT | | 06/2014 - 01/2015 | | | BRL | | | | 17,840 | | | | USD | | | | 7,841 | | | | 2,626 | | | | 24,089 | |
GSCO-OT | | 06/2014 | | | TRY | | | | 6,350 | | | | USD | | | | 3,059 | | | | — | | | | 31,062 | |
GSCO-OT | | 06/2014 - 01/2015 | | | USD | | | | 14,462 | | | | BRL | | | | 34,240 | | | | 16,373 | | | | 535,897 | |
JPM | | 06/2014 | | | BRL | | | | 8,770 | | | | USD | | | | 3,883 | | | | 31,460 | | | | — | |
JPM | | 01/2016 | | | CNH | | | | 17,400 | | | | USD | | | | 2,829 | | | | — | | | | 101,584 | |
JPM | | 08/2014 | | | COP | | | | 1,816,000 | | | | USD | | | | 936 | | | | 16,013 | | | | — | |
JPM | | 08/2014 | | | MYR | | | | 1,020 | | | | USD | | | | 314 | | | | 1,089 | | | | — | |
16 OPPENHEIMER EMERGING MARKETS LOCAL DEBT FUND
| | | | | | | | | | | | | | | | | | | | | | | | | | | | |
| Forward Currency Exchange Contracts (Continued) | |
| Counterparty | | Settlement Month(s) | | | | | | Currency
Purchased
(000’s) | | | | | | Currency Sold
(000’s) | | | Unrealized
Appreciation | | | Unrealized
Depreciation | |
JPM | | | 06/2014 - 08/2014 | | | | PEN | | | | 1,200 | | | | USD | | | | 424 | | | $ | 8,617 | | | $ | — | |
JPM | | | 08/2014 | | | | PLN | | | | 12,600 | | | | USD | | | | 4,100 | | | | 30,034 | | | | — | |
JPM | | | 07/2014 - 08/2014 | | | | RUB | | | | 181,000 | | | | USD | | | | 5,094 | | | | 52,705 | | | | 50,451 | |
JPM | | | 06/2014 | | | | TRY | | | | 375 | | | | USD | | | | 176 | | | | 3,026 | | | | — | |
JPM | | | 10/2014 | | | | USD | | | | 1,042 | | | | BRL | | | | 2,640 | | | | — | | | | 96,905 | |
JPM | | | 12/2014 | | | | USD | | | | 954 | | | | EUR | | | | 700 | | | | — | | | | 847 | |
JPM | | | 07/2014 - 08/2014 | | | | USD | | | | 840 | | | | IDR | | | | 9,750,000 | | | | 14,922 | | | | — | |
JPM | | | 07/2014 | | | | USD | | | | 3,430 | | | | INR | | | | 209,000 | | | | — | | | | 79,689 | |
JPM | | | 08/2014 | | | | USD | | | | 1,279 | | | | RUB | | | | 45,450 | | | | 1,519 | | | | — | |
JPM | | | 08/2014 | | | | USD | | | | 1,259 | | | | TRY | | | | 2,680 | | | | 5,993 | | | | — | |
JPM | | | 08/2014 | | | | USD | | | | 4,180 | | | | ZAR | | | | 44,645 | | | | 4,651 | | | | — | |
MSCO | | | 07/2014 | | | | BRL | | | | 7,500 | | | | USD | | | | 3,315 | | | | 5,160 | | | | — | |
MSCO | | | 08/2014 | | | | COP | | | | 1,074,000 | | | | USD | | | | 557 | | | | 6,430 | | | | — | |
MSCO | | | 06/2014 - 07/2014 | | | | MXN | | | | 67,890 | | | | USD | | | | 5,238 | | | | 33,187 | | | | — | |
MSCO | | | 07/2014 | | | | USD | | | | 537 | | | | BRL | | | | 1,240 | | | | — | | | | 12,396 | |
MSCO | | | 10/2014 - 11/2014 | | | | USD | | | | 2,196 | | | | HUF | | | | 500,000 | | | | — | | | | 40,333 | |
MSCO | | | 06/2014 - 07/2014 | | | | USD | | | | 770 | | | | MXN | | | | 10,100 | | | | — | | | | 13,445 | |
MSCO | | | 08/2014 | | | | ZAR | | | | 1,590 | | | | USD | | | | 149 | | | | — | | | | 674 | |
NOM | | | 07/2014 | | | | USD | | | | 1,025 | | | | MXN | | | | 13,200 | | | | 1,294 | | | | — | |
RBS | | | 08/2014 | | | | HUF | | | | 629,000 | | | | USD | | | | 2,802 | | | | 19,215 | | | | — | |
RBS | | | 10/2014 | | | | INR | | | | 9,000 | | | | USD | | | | 146 | | | | 2,328 | | | | — | |
TDB | | | 07/2014 | | | | USD | | | | 408 | | | | IDR | | | | 4,806,000 | | | | — | | | | 347 | |
TDB | | | 08/2014 | | | | ZAR | | | | 8,210 | | | | USD | | | | 778 | | | | — | | | | 10,424 | |
| | | | | | | | | | | | | | | | | | | | | | | | |
Total Unrealized Appreciation and Depreciation | | | | | | | | | | | | | | | $ | 496,066 | | | $ | 1,915,550 | |
| | | | | | | | | | | | | | | | | | | | | | | | |
|
| Over-the-Counter Options Written at May 30, 2014 |
| | | | | | | | | | | | | | | | | | | | | | | | | | | | | | | | |
| Description | | Counterparty | | | | | | Exercise
Price | | | Expiration
Date | | | Number of Contracts | | | Premiums
Received | | | Value | |
BRL Currency Put | | | GSG | | | | BRL | | | | 2 .316 | | | | 8/8/14 | | | | BRL | | | | (5,380,000 | ) | | $ | 31,476 | | | $ | (25,517 | ) |
EUR Currency Call | | | BAC | | | | PLN | | | | 4 .275 | | | | 8/1/14 | | | | EUR | | | | (2,100,000 | ) | | | 21,984 | | | | (7,042 | ) |
EUR Currency Call | | | GSG | | | | PLN | | | | 4 .280 | | | | 8/1/14 | | | | EUR | | | | (4,200,000 | ) | | | 41,347 | | | | (13,755 | ) |
EUR Currency Call | | | JPM | | | | PLN | | | | 4 .275 | | | | 8/4/14 | | | | EUR | | | | (3,150,000 | ) | | | 30,220 | | | | (11,637 | ) |
IDR Currency Put | | | JPM | | | | IDR | | | | 11,700 .000 | | | | 8/15/14 | | | | IDR | | | | (18,221,000,000 | ) | | | 15,561 | | | | (36,442 | ) |
| | | | | | | | | | | | | | | | | | | | | | | | | | | | |
Total Over-the-Counter Options Written | | | | | | | | | | | | | | | | | | | $ | 140,588 | | | $ | (94,393 | ) |
| | | | | | | | | | | | | | | | | | | | | | | | | | | | |
|
| Over-the-Counter Currency Swaps at May 30, 2014 |
| | | | | | | | | | | | | | | | | | | | | | | | | | | | | | | | |
| Counterparty | | Pay/Receive
Floating
Rate | | | Floating
Rate | | | Fixed
Rate | | | Maturity
Date | | | Notional
Amount Currency
Received
(000’s) | | | Notional
Amount
Currency
Delivered
(000’s) | | | Premiums
Received
/(Paid) | | | Value | |
| | | | | |
| Six-
Month |
| | | | | | | | | | | | | | | | | | | | | | | | |
| | | | | | | USD BBA | | | | | | | | | | | | | | | | | | | | | | | | | |
BOA | | | Pay | | | | LIBOR | | | | 7.100% | | | | 1/21/19 | | | | INR 43,500 | | | | USD 709 | | | $ | — | | | $ | 60,745 | |
| | | | | |
| Six-
Month |
| | | | | | | | | | | | | | | | | | | | | | | | |
| | | | | | | USD BBA | | | | | | | | | | | | | | | | | | | | | | | | | |
GSG | | | Pay | | | | LIBOR | | | | 7.210 | | | | 1/13/19 | | | | INR 44,250 | | | | USD 712 | | | | — | | | | 80,329 | |
17 OPPENHEIMER EMERGING MARKETS LOCAL DEBT FUND
| | | | |
| |
| STATEMENT OF INVESTMENTS Continued | | |
| | |
| Over-the-Counter Currency Swaps (Continued) |
| | | | | | | | | | | | | | | | | | | | | | | | | | | | | | | | |
| Counterparty | | Pay/Receive
Floating
Rate | | | Floating
Rate | | | Fixed
Rate | | | Maturity
Date | | | Notional
Amount
Currency
Received
(000’s) | | | Notional
Amount
Currency
Delivered
(000’s) | | | Premiums
Received /
(Paid) | | | Value | |
| | | | | | | Six-Month | | | | | | | | | | | | | | | | | | | | | | | | | |
| | | | | | | USD BBA | | | | | | | | | | | | | | | | | | | | | | | | | |
GSG | | | Pay | | | | LIBOR | | | | 7.100 | % | | | 1/15/19 | | | | INR 43,750 | | | | USD 706 | | | $ | — | | | $ | 72,917 | |
| | | | | | | | | | | | | | | | | | | | | | | | | | | | |
Total Over-the-Counter Currency Swap | | | | | | | | | | | | | | | | | | | $ | — | | | $ | 213,991 | |
| | | | | | | | | | | | | | | | | | | | | | | | | | | | |
| | |
| Centrally Cleared Interest Rate Swaps at May 30, 2014 |
| | | | | | | | | | | | | | | | | | | | | | | | | | | | |
| Counterparty | | Pay/Receive
Floating
Rate | | | Floating
Rate | | | Fixed
Rate | | | Maturity
Date | | | Notional
Amount
(000’s) | | | Premiums
Received /
(Paid) | | | Value | |
BAC | | | Receive | | |
| Three-
Month
USD BBA
LIBOR |
| | | 1.766 | % | | | 5/8/19 | | | | USD 3,100 | | | $ | — | | | $ | (28,233 | ) |
| | | | | |
| Three-
Month |
| | | | | | | | | | | | | | | | | | | | |
| | | | | | | USD BBA | | | | | | | | | | | | | | | | | | | | | |
BAC | | | Receive | | | | LIBOR | | | | 2.879 | | | | 1/30/24 | | | | USD 1,650 | | | | — | | | | (65,428 | ) |
| | | | | | | | | | | | | | | | | | | | | | | | |
Total Centrally Cleared Interest Rate Swaps | | | | | | | | | | | | | | | $ | — | | | $ | (93,661 | ) |
| | | | | | | | | | | | | | | | | | | | | | | | |
| | |
| Over-the-Counter Interest Rate Swaps at May 30, 2014 |
| | | | | | | | | | | | | | | | | | | | | | | | | | | | |
| Counterparty | | Pay/Receive
Floating
Rate | | | Floating
Rate | | | Fixed
Rate | | | Maturity
Date | | | Notional
Amount
(000’s) | | | Premiums
Received /
(Paid) | | | Value | |
BAC | | | Pay | | |
| Six-Month
INR MIBOR |
| | | 8.145 | % | | | 1/20/19 | | | INR | 310,000 | | | $ | — | | | $ | 9,048 | |
| | | | | | | MXN TIIE | | | | | | | | | | | | | | | | | | | | | |
BOA | | | Pay | | | | BANXICO | | | | 4.345 | | | | 1/11/16 | | | MXN | 48,100 | | | | — | | | | 17,879 | |
BOA | | | Receive | | |
| Six-Month
INR MIBOR |
| | | 8.135 | | | | 1/17/19 | | | INR | 520,000 | | | | — | | | | 10,894 | |
BOA | | | Pay | | | | BZDI | | | | 12.700 | | | | 1/4/16 | | | BRL | 1,515 | | | | — | | | | 4,801 | |
GSG | | | Pay | | |
| Three-Month
PLZ WIBOR
WIBO |
| | | 3.145 | | | | 5/5/16 | | | PLN | 42,600 | | | | — | | | | 34,827 | |
GSG | | | Pay | | |
| Three-Month
PLZ WIBOR
WIBO |
| | | 3.115 | | | | 5/6/16 | | | PLN | 42,100 | | | | — | | | | 30,344 | |
GSG | | | Pay | | | | BZDI | | | | 12.703 | | | | 1/4/16 | | | BRL | 12,150 | | | | — | | | | 38,606 | |
HSBC | | | Pay | | |
| MXN TIIE
BANXICO |
| | | 4.760 | | | | 1/13/16 | | | MXN | 77,700 | | | | — | | | | 30,242 | |
JPM | | | Pay | | | | BZDI | | | | 12.490 | | | | 1/4/16 | | | BRL | 5,950 | | | | — | | | | 14,752 | |
JPM | | | Pay | | | | BZDI | | | | 11.880 | | | | 1/4/16 | | | BRL | 18,190 | | | | — | | | | 61,406 | |
JPM | | | Pay | | | | BZDI | | | | 12.090 | | | | 1/4/16 | | | BRL | 7,730 | | | | — | | | | 35,667 | |
| | | | | | | | | | | | | | | | | | | | | | | | |
Total Over-the-Counter Interest Rate Swaps | | | | | | | | | | | | | | | $ | — | | | $ | 288,466 | |
| | | | | | | | | | | | | | | | | | | | | | | | |
18 OPPENHEIMER EMERGING MARKETS LOCAL DEBT FUND
Glossary:
| | |
| Counterparty Abbreviations |
| BAC | | Barclays Bank plc |
| BNP | | BNP Paribas |
| BOA | | Bank of America NA |
| CITNA-B | | Citibank NA |
| DEU | | Deutsche Bank AG |
| GSCO-OT | | Goldman Sachs Bank USA |
| GSG | | Goldman Sachs Group, Inc. (The) |
| HSBC | | HSBC Bank USA NA |
| JPM | | JPMorgan Chase Bank NA |
| MSCO | | Morgan Stanley Capital Services, Inc. |
| NOM | | Nomura Global Financial Products, Inc. |
| RBS | | Royal Bank of Scotland plc (The) |
| TDB | | Toronto Dominion Bank |
Currency abbreviations indicate amounts reporting in currencies
| | |
| BRL | | Brazilian Real |
| CNH | | Offshore Chinese Renminbi |
| COP | | Colombian Peso |
| EUR | | Euro |
| HUF | | Hungarian Forint |
| IDR | | Indonesia Rupiah |
| INR | | Indian Rupee |
| KRW | | South Korean Won |
| MXN | | Mexican Nuevo Peso |
| MYR | | Malaysian Ringgit |
| PEN | | Peruvian New Sol |
| PLN | | Polish Zloty |
| RON | | New Romanian Leu |
| RUB | | Russian Ruble |
| THB | | Thailand Baht |
| TRY | | New Turkish Lira |
| USD | | U.S. Dollar |
| ZAR | | South African Rand |
Definitions
| | |
| BANXICO | | Banco de Mexico |
| BBA Libor | | British Bankers’ Association London-Interbank Offered Rate |
| BZDI | | Brazil Interbank Deposit Rate |
| MIBOR | | Mumbai Interbank Offered Rate |
| TIIE | | Interbank Equilibrium Interest Rate |
| WIBOR | �� | Poland Warsaw Interbank Offer Bid Rate |
See accompanying Notes to Financial Statements.
19 OPPENHEIMER EMERGING MARKETS LOCAL DEBT FUND
| | | | |
| |
| STATEMENT OF ASSETS AND LIABILITIES May 30, 20141 | | |
| | | | |
Assets | | | | |
Investments, at value (cost $71,820,731)—see accompanying statement of investments | | $ | 72,929,249 | |
Cash | | | 315,315 | |
Cash used for collateral on centrally cleared swaps | | | 261,252 | |
Cash used for collateral on OTC derivatives | | | 890,000 | |
Unrealized appreciation on foreign currency exchange contracts | | | 496,066 | |
Swaps, at value | | | 502,457 | |
Receivables and other assets: | | | | |
Investments sold | | | 4,813,950 | |
Interest and dividends | | | 1,414,348 | |
Shares of beneficial interest sold | | | 10,904 | |
Other | | | 12,438 | |
| | | | |
Total assets | | | 81,645,979 | |
| |
| | | | | |
Liabilities | | | | |
Bank overdraft-foreign currencies | | | 5,068 | |
Unrealized depreciation on foreign currency exchange contracts | | | 1,915,550 | |
Options written, at value (premiums received $140,588) | | | 94,393 | |
Centrally cleared swaps, at value | | | 93,661 | |
Payables and other liabilities: | | | | |
Investments purchased (including $460,217 purchased on a when-issued or delayed delivery basis) | | | 5,769,842 | |
Shares of beneficial interest redeemed | | | 231,413 | |
Dividends | | | 92,361 | |
Distribution and service plan fees | | | 13,683 | |
Shareholder communications | | | 7,984 | |
Trustees’ compensation | | | 4,909 | |
Other | | | 80,585 | |
| | | | |
Total liabilities | | | 8,309,449 | |
| |
| | | | | |
Net Assets | | $ | 73,336,530 | |
| | | | |
Composition of Net Assets | | | | |
Par value of shares of beneficial interest | | $ | 7,915 | |
Additional paid-in capital | | | 82,389,502 | |
Accumulated net investment loss | | | (1,974,962) | |
Accumulated net realized loss on investments and foreign currency transactions | | | (7,294,655) | |
Net unrealized appreciation on investments and translation of assets and liabilities denominated in foreign currencies | | | 208,730 | |
| | | | |
Net Assets | | $ | 73,336,530 | |
| | | | |
20 OPPENHEIMER EMERGING MARKETS LOCAL DEBT FUND
| | | | |
Net Asset Value Per Share | | | | |
| Class A Shares: | | | | |
| Net asset value and redemption price per share (based on net assets of $45,659,810 and 4,927,895 shares of beneficial interest outstanding) | | $ | 9.27 | |
| Maximum offering price per share (net asset value plus sales charge of 4.75% of offering price) | | $ | 9.73 | |
| Class C Shares: | | | | |
| Net asset value, redemption price (excludes applicable contingent deferred sales charge) and offering price per share | | | | |
| (based on net assets of $15,128,138 and 1,631,990 shares of beneficial interest outstanding) | | $ | 9.27 | |
| Class I Shares: | | | | |
| Net asset value, redemption price and offering price per share (based on net assets of $34,052 and 3,677 shares of beneficial interest outstanding) | | $ | 9.26 | |
| Class N Shares: | | | | |
| Net asset value, redemption price (excludes applicable contingent deferred sales charge) and offering price per share | | | | |
| (based on net assets of $1,956,342 and 211,149 shares of beneficial interest outstanding) | | $ | 9.27 | |
| Class Y Shares: | | | | |
| Net asset value, redemption price and offering price per share (based on net assets of $10,558,188 and 1,140,202 shares of beneficial interest outstanding) | | $ | 9.26 | |
| 1. May | 30, 2014 represents the last business day of the Fund’s reporting period. See Note 1 of the accompanying Notes. |
See accompanying Notes to Financial Statements
21 OPPENHEIMER EMERGING MARKETS LOCAL DEBT FUND
| | | | |
| |
| STATEMENT OF OPERATIONS For the Year Ended May 30, 20141 | | |
| | | | |
Investment Income | | | | |
Interest | | $ | 5,167,155 | |
Dividends: | | | | |
Unaffiliated companies | | | 5,077 | |
Affiliated companies | | | 1,800 | |
Other income | | | 1,727 | |
Total investment income | | | 5,175,759 | |
Expenses | | | | |
Management fees | | | 614,710 | |
Distribution and service plan fees: | | | | |
Class A | | | 93,951 | |
Class C | | | 182,993 | |
Class N | | | 10,816 | |
Transfer and shareholder servicing agent fees: | | | | |
Class A | | | 113,853 | |
Class C | | | 47,474 | |
Class I | | | 6 | |
Class N | | | 5,900 | |
Class Y | | | 23,017 | |
Shareholder communications: | | | | |
Class A | | | 19,300 | |
Class C | | | 12,034 | |
Class N | | | 1,526 | |
Class Y | | | 3,344 | |
Custodian fees and expenses | | | 77,363 | |
Trustees’ compensation | | | 10,942 | |
Other | | | 81,496 | |
Total expenses | | | 1,298,725 | |
Less waivers and reimbursements of expenses | | | (163,099) | |
Net expenses | | | 1,135,626 | |
Net Investment Income | | | 4,040,133 | |
Realized and Unrealized Gain (Loss) | | | | |
Net realized gain (loss) on: | | | | |
Investments from unaffiliated companies (net of foreign capital gains tax of $1,096) | | | (7,248,706) | |
Closing and expiration of option contracts written | | | 53,624 | |
Closing and expiration of futures contracts | | | 380,207 | |
Foreign currency transactions | | | (5,597,054) | |
Swap contracts | | | (349,986) | |
Closing and expiration of swaption contracts written | | | (102,716) | |
Net realized loss | | | (12,864,631) | |
22 OPPENHEIMER EMERGING MARKETS LOCAL DEBT FUND
| | | | |
Realized and Unrealized Gain (Loss) (Continued) | | | | |
Net change in unrealized appreciation/depreciation on: | | | | |
Investments | | $ | 1,743,526 | |
Translation of assets and liabilities denominated in foreign currencies | | | 1,491,813 | |
Futures contracts | | | (131,985 | ) |
Option contracts written | | | 53,191 | |
Swap contracts | | | 291,207 | |
Swaption contracts written | | | 76,573 | |
| | | | |
Net change in unrealized appreciation/depreciation | | | 3,524,325 | |
Net Decrease in Net Assets Resulting from Operations | | $ | (5,300,173 | ) |
| | | | |
| 1. May | 30, 2014 represents the last business day of the Fund’s reporting period. See Note 1 of the accompanying Notes. |
See accompanying Notes to Financial Statements.
23 OPPENHEIMER EMERGING MARKETS LOCAL DEBT FUND
| | | | |
| |
STATEMENTS OF CHANGES IN NET ASSETS | | |
| | | | | | | | | | |
| | | Year Ended
May 30, 20141 | | | | | Year Ended
May 31, 2013 | |
Operations | | | | | | | | | | |
Net investment income | | | $ 4,040,133 | | | | | | $ 4,651,581 | |
Net realized gain (loss) | | | (12,864,631 | ) | | | | | 3,678,763 | |
Net change in unrealized appreciation/depreciation | | | 3,524,325 | | | | | | (157,274 | ) |
Net increase (decrease) in net assets resulting from operations | | | (5,300,173 | ) | | | | | 8,173,070 | |
Dividends and/or Distributions to Shareholders | | | | | | | | | | |
Dividends from net investment income: | | | | | | | | | | |
Class A | | | (692,346 | ) | | | | | (3,119,614 | ) |
Class C | | | (210,977 | ) | | | | | (811,507 | ) |
Class I | | | (287 | ) | | | | | (352 | ) |
Class N | | | (28,247 | ) | | | | | (103,847 | ) |
Class Y | | | (150,703 | ) | | | | | (616,173 | ) |
| | | | (1,082,560 | ) | | | | | (4,651,493 | ) |
Distributions from net realized gain: | | | | | | | | | | |
Class A | | | (805,007 | ) | | | | | — | |
Class C | | | (283,398 | ) | | | | | — | |
Class I | | | (593 | ) | | | | | — | |
Class N | | | (33,093 | ) | | | | | — | |
Class Y | | | (130,035 | ) | | | | | — | |
| | | | (1,252,126 | ) | | | | | — | |
Tax return of capital distribution: | | | | | | | | | | |
Class A | | | (1,883,318 | ) | | | | | — | |
Class C | | | (573,901 | ) | | | | | — | |
Class I | | | (780 | ) | | | | | — | |
Class N | | | (76,838 | ) | | | | | — | |
Class Y | | | (409,944 | ) | | | | | — | |
| | | (2,944,781 | ) | | | | | — | |
Beneficial Interest Transactions | | | | | | | | | | |
Net increase (decrease) in net assets resulting from beneficial interest transactions: | | | | | | | | | | |
Class A | | | (12,643,277 | ) | | | | | 10,505,639 | |
Class C | | | (8,432,633 | ) | | | | | 13,648,128 | |
Class I | | | 25,924 | | | | | | 10,000 | |
Class N | | | (754,824 | ) | | | | | 1,511,353 | |
Class Y | | | (3,675,823 | ) | | | | | 7,857,100 | |
| | | (25,480,633 | ) | | | | | 33,532,220 | |
24 OPPENHEIMER EMERGING MARKETS LOCAL DEBT FUND
| | | | | | | | | | | | |
| | | Year Ended
May 30, 20141 | | | | | | Year Ended
May 31, 2013 | |
Net Assets | | | | | | | | | | | | |
| Total increase (decrease) | | $ | (36,060,273 | ) | | $ | | | | | 37,053,797 | |
| Beginning of period | | | 109,396,803 | | | | | | | | 72,343,006 | |
| | | |
| End of period (including accumulated net investment loss of $1,974,962 and $114,741, respectively) | | $ | 73,336,530 | | | $ | | | | | 109,396,803 | |
| | | | | | | | | | | | |
| | | | | | | | | | | | |
| | | | | | | | | | | | |
1. May 30, 2014 represents the last business day of the Fund’s reporting period. See Note 1 of the accompanying Notes.
See accompanying Notes to Financial Statements.
25 OPPENHEIMER EMERGING MARKETS LOCAL DEBT FUND
| | | | | | | | | | | | | | | | |
| Class A | | Year Ended
May 30,
20141 | | | Year Ended
May 31,
2013 | | | Year Ended
May 31,
2012 | | | Period Ended
May 31,
20112 | |
| |
| Per Share Operating Data | | | | | | | | | | | | | | | | |
| Net asset value, beginning of period | | $ | 10.35 | | | $ | 9.73 | | | $ | 10.73 | | | $ | 10.00 | |
| |
| Income (loss) from investment operations: | | | | | | | | | | | | | | | | |
| Net investment income3 | | | 0.48 | | | | 0.53 | | | | 0.56 | | | | 0.52 | |
| Net realized and unrealized gain (loss) | | | (0.93 | ) | | | 0.62 | | | | (0.94 | ) | | | 0.75 | |
| | | | |
| Total from investment operations | | | (0.45 | ) | | | 1.15 | | | | (0.38 | ) | | | 1.27 | |
| |
| Dividends and/or distributions to shareholders: | | | | | | | | | | | | | | | | |
| Dividends from net investment income | | | (0.13 | ) | | | (0.53 | ) | | | (0.41 | ) | | | (0.52) | |
| Distributions from net realized gain | | | (0.15 | ) | | | 0.00 | | | | 0.00 | | | | (0.02) | |
| Tax return of capital distribution | | | (0.35 | ) | | | 0.00 | | | | (0.21 | ) | | | 0.00 | |
| | | | |
| Total dividends and/or distributions to shareholders | | | (0.63 | ) | | | (0.53 | ) | | | (0.62 | ) | | | (0.54) | |
| |
| Net asset value, end of period | | $ | 9.27 | | | $ | 10.35 | | | $ | 9.73 | | | $ | 10.73 | |
| | | | |
| |
| Total Return, at Net Asset Value4 | | | (4.20 | )% | | | 11.84 | % | | | (3.67 | )% | | | 12.85% | |
| |
| Ratios/Supplemental Data | | | | | | | | | | | | | | | | |
Net assets, end of period (in thousands) | | $ | 45,660 | | | $ | 64,789 | | | $ | 51,319 | | | $ | 43,912 | |
| |
Average net assets (in thousands) | | $ | 50,865 | | | $ | 62,849 | | | $ | 48,137 | | | $ | 35,869 | |
| |
Ratios to average net assets:5 | | | | | | | | | | | | | | | | |
Net investment income | | | 5.08% | | | | 4.96% | | | | 5.49% | | | | 5.31% | |
Total expenses6 | | | 1.41% | | | | 1.30% | | | | 1.26% | | | | 1.26% | |
Expenses after payments, waivers and/or reimbursements and reduction to custodian expenses | | | 1.25% | | | | 1.25% | | | | 1.23% | | | | 1.24% | |
| |
Portfolio turnover rate | | | 251% | | | | 130% | | | | 93% | | | | 80% | |
|
| 1. May 30, 2014 represents the last business day of the Fund’s reporting period. See Note 1 of the accompanying Notes. |
| 2. For the period from June 30, 2010 (commencement of operations) to May 31, 2011. |
| 3. Per share amounts calculated based on the average shares outstanding during the period. |
| 4. Assumes an initial investment on the business day before the first day of the fiscal period, with all dividends and distributions reinvested in additional shares on the reinvestment date, and redemption at the net asset value calculated on the last business day of the fiscal period. Sales charges are not reflected in the total returns. Total returns are not annualized for periods less than one full year. Returns do not reflect the deduction of taxes that a shareholder would pay on fund distributions or the redemption of fund shares. |
| 5. Annualized for periods less than one full year. |
| 6. Total expenses including indirect expenses from affiliated fund were as follows: |
| | | | | | |
| | Year Ended May 30, 2014 | | | 1.41 | % |
| | Year Ended May 31, 2013 | | | 1.30 | % |
| | Year Ended May 31, 2012 | | | 1.26 | % |
| | Period Ended May 31, 2011 | | | 1.26 | % |
See accompanying Notes to Financial Statements.
26 OPPENHEIMER EMERGING MARKETS LOCAL DEBT FUND
| | | | | | | | | | | | | | | | |
| Class C | | Year Ended
May 30,
20141 | | | Year Ended
May 31,
2013 | | | Year Ended
May 31,
2012 | | | Period Ended
May 31,
20112 | |
| |
Per Share Operating Data | | | | | | | | | | | | | | | | |
Net asset value, beginning of period | | $ | 10.35 | | | $ | 9.73 | | | $ | 10.73 | | | $ | 10.00 | |
| |
Income (loss) from investment operations: | | | | |
Net investment income3 | | | 0.41 | | | | 0.44 | | | | 0.48 | | | | 0.44 | |
Net realized and unrealized gain (loss) | | | (0.94 | ) | | | 0.63 | | | | (0.94 | ) | | | 0.75 | |
| | | | |
Total from investment operations | | | (0.53 | ) | | | 1.07 | | | | (0.46 | ) | | | 1.19 | |
| |
Dividends and/or distributions to shareholders: | | | | | | | | | | | | | | | | |
Dividends from net investment income | | | (0.11 | ) | | | (0.45 | ) | | | (0.36 | ) | | | (0.44) | |
Distributions from net realized gain | | | (0.15 | ) | | | 0.00 | | | | 0.00 | | | | (0.02) | |
Tax return of capital distribution | | | (0.29 | ) | | | 0.00 | | | | (0.18 | ) | | | 0.00 | |
| | | | |
Total dividends and/or distributions to shareholders | | | (0.55 | ) | | | (0.45 | ) | | | (0.54 | ) | | | (0.46) | |
| |
Net asset value, end of period | | $ | 9.27 | | | $ | 10.35 | | | $ | 9.73 | | | $ | 10.73 | |
| | | | |
|
| |
Total Return, at Net Asset Value4 | | | (4.92)% | | | | 11.00% | | | | (4.40)% | | | | 12.05% | |
|
| |
Ratios/Supplemental Data | | | | | | | | | | | | | | | | |
Net assets, end of period (in thousands) | | $ | 15,128 | | | $ | 26,066 | | | $ | 12,070 | | | $ | 7,241 | |
| |
Average net assets (in thousands) | | $ | 18,262 | | | $ | 19,486 | | | $ | 9,819 | | | $ | 3,962 | |
| |
Ratios to average net assets:5 | |
Net investment income | | | 4.32% | | | | 4.16% | | | | 4.73% | | | | 4.56% | |
Total expenses6 | | | 2.29% | | | | 2.26% | | | | 2.36% | | | | 2.46% | |
Expenses after payments, waivers and/or reimbursements and reduction to custodian expenses | | | 2.00% | | | | 2.00% | | | | 2.00% | | | | 2.00% | |
| |
Portfolio turnover rate | | | 251% | | | | 130% | | | | 93% | | | | 80% | |
1. May 30, 2014 represents the last business day of the Fund’s reporting period. See Note 1 of the accompanying Notes.
2. For the period from June 30, 2010 (commencement of operations) to May 31, 2011.
3. Per share amounts calculated based on the average shares outstanding during the period.
4. Assumes an initial investment on the business day before the first day of the fiscal period, with all dividends and distributions reinvested in additional shares on the reinvestment date, and redemption at the net asset value calculated on the last business day of the fiscal period. Sales charges are not reflected in the total returns. Total returns are not annualized for periods less than one full year. Returns do not reflect the deduction of taxes that a shareholder would pay on fund distributions or the redemption of fund shares.
5. Annualized for periods less than one full year.
6. Total expenses including indirect expenses from affiliated fund were as follows:
| | | | | | |
| | Year Ended May 30, 2014 | | | 2.29 | % |
| | Year Ended May 31, 2013 | | | 2.26 | % |
| | Year Ended May 31, 2012 | | | 2.36 | % |
| | Period Ended May 31, 2011 | | | 2.46 | % |
See accompanying Notes to Financial Statements.
27 OPPENHEIMER EMERGING MARKETS LOCAL DEBT FUND
| | | | |
| |
| FINANCIAL HIGHLIGHTS Continued | | |
| | | | | | | | |
| Class I | | Year Ended
May 30,
20141 | | | Period Ended
May 31,
20132 | |
| |
Per Share Operating Data | | | | | | | | |
Net asset value, beginning of period | | $ | 10.34 | | | $ | 10.53 | |
| |
Income (loss) from investment operations: | | | | | | | | |
Net investment income3 | | | 0.52 | | | | 0.37 | |
Net realized and unrealized loss | | | (0.94 | ) | | | (0.19) | |
| | | | |
Total from investment operations | | | (0.42 | ) | | | 0.18 | |
| |
Dividends and/or distributions to shareholders: | | | | | | | | |
Dividends from net investment income | | | (0.14 | ) | | | (0.37) | |
Distributions from net realized gain | | | (0.15 | ) | | | 0.00 | |
Tax return of capital distribution | | | (0.37 | ) | | | 0.00 | |
| | | | |
Total dividends and/or distributions to shareholders | | | (0.66 | ) | | | (0.37) | |
| |
Net asset value, end of period | | $ | 9.26 | | | $ | 10.34 | |
| | | | |
|
| |
Total Return, at Net Asset Value4 | | | (3.83 | )% | | | 1.69% | |
|
| |
Ratios/Supplemental Data | | | | | | | | |
Net assets, end of period (in thousands) | | $ | 34 | | | $ | 10 | |
| |
Average net assets (in thousands) | | $ | 19 | | | $ | 10 | |
| |
Ratios to average net assets:5 | | | | | | | | |
Net investment income | | | 5.63% | | | | 5.20% | |
Total expenses6 | | | 1.02% | | | | 0.95% | |
Expenses after payments, waivers and/or reimbursements and reduction to custodian expenses | | | 0.85% | | | | 0.85% | |
| |
Portfolio turnover rate | | | 251% | | | | 130% | |
1. May 30, 2014 represents the last business day of the Fund’s reporting period. See Note 1 of the accompanying Notes.
2. For the period from September 28, 2012 (commencement of operations) to May 31, 2013.
3. Per share amounts calculated based on the average shares outstanding during the period.
4. Assumes an initial investment on the business day before the first day of the fiscal period, with all dividends and distributions reinvested in additional shares on the reinvestment date, and redemption at the net asset value calculated on the last business day of the fiscal period. Sales charges are not reflected in the total returns. Total returns are not annualized for periods less than one full year. Returns do not reflect the deduction of taxes that a shareholder would pay on fund distributions or the redemption of fund shares.
5. Annualized for periods less than one full year.
6. Total expenses including indirect expenses from affiliated fund were as follows:
| | | | | | |
| | Year Ended May 30, 2014 | | | 1.02 | % |
| | Period Ended May 31, 2013 | | | 0.95 | % |
See accompanying Notes to Financial Statements.
28 OPPENHEIMER EMERGING MARKETS LOCAL DEBT FUND
| | | | | | | | | | | | | | | | |
| Class N | | Year Ended
May 30,
20141 | | | Year Ended
May 31,
2013 | | | Year Ended
May 31,
2012 | | | Period
Ended
May 31,
20112 | |
| |
Per Share Operating Data | | | | | | | | | | | | | | | | |
Net asset value, beginning of period | | $ | 10.35 | | | $ | 9.73 | | | $ | 10.73 | | | $ | 10.00 | |
| |
Income (loss) from investment operations: | | | | | | | | | | | | | | | | |
Net investment income3 | | | 0.46 | | | | 0.50 | | | | 0.53 | | | | 0.49 | |
Net realized and unrealized gain (loss) | | | (0.94 | ) | | | 0.62 | | | | (0.94 | ) | | | 0.75 | |
| | | | |
Total from investment operations | | | (0.48 | ) | | | 1.12 | | | | (0.41 | ) | | | 1.24 | |
| |
Dividends and/or distributions to shareholders: | | | | | | | | | | | | | | | | |
Dividends from net investment income | | | (0.12 | ) | | | (0.50 | ) | | | (0.39 | ) | | | (0.49) | |
Distributions from net realized gain | | | (0.15 | ) | | | 0.00 | | | | 0.00 | | | | (0.02) | |
Tax return of capital distribution | | | (0.33 | ) | | | 0.00 | | | | (0.20 | ) | | | 0.00 | |
| | | | |
Total dividends and/or distributions to shareholders | | | (0.60 | ) | | | (0.50 | ) | | | (0.59 | ) | | | (0.51) | |
| |
Net asset value, end of period | | $ | 9.27 | | | $ | 10.35 | | | $ | 9.73 | | | $ | 10.73 | |
| | | | |
| |
Total Return, at Net Asset Value4 | | | (4.45 | )% | | | 11.57 | % | | | (3.90 | )% | | | 12.59% | |
|
| |
Ratios/Supplemental Data | | | | | | | | | | | | | | | | |
Net assets, end of period (in thousands) | | $ | 1,957 | | | $ | 3,014 | | | $ | 1,452 | | | $ | 538 | |
| |
Average net assets (in thousands) | | $ | 2,189 | | | $ | 2,210 | | | $ | 1,154 | | | $ | 300 | |
| |
Ratios to average net assets:5 | | | | | | | | | | | | | | | | |
Net investment income | | | 4.82% | | | | 4.69% | | | | 5.23% | | | | 5.06% | |
Total expenses6 | | | 1.79% | | | | 1.72% | | | | 1.69% | | | | 2.07% | |
| Expenses after payments, waivers and/or reimbursements and reduction to custodian expenses | | | 1.50% | | | | 1.50% | | | | 1.50% | | | | 1.50% | |
| |
Portfolio turnover rate | | | 251% | | | | 130% | | | | 93% | | | | 80% | |
1. May 30, 2014 represents the last business day of the Fund’s reporting period. See Note 1 of the accompanying Notes.
2. For the period from June 30, 2010 (commencement of operations) to May 31, 2011.
3. Per share amounts calculated based on the average shares outstanding during the period.
4. Assumes an initial investment on the business day before the first day of the fiscal period, with all dividends and distributions reinvested in additional shares on the reinvestment date, and redemption at the net asset value calculated on the last business day of the fiscal period. Sales charges are not reflected in the total returns. Total returns are not annualized for periods less than one full year. Returns do not reflect the deduction of taxes that a shareholder would pay on fund distributions or the redemption of fund shares.
5. Annualized for periods less than one full year.
6. Total expenses including indirect expenses from affiliated fund were as follows:
| | | | | | |
| | Year Ended May 30, 2014 | | | 1.79 | % |
| | Year Ended May 31, 2013 | | | 1.72 | % |
| | Year Ended May 31, 2012 | | | 1.69 | % |
| | Period Ended May 31, 2011 | | | 2.07 | % |
See accompanying Notes to Financial Statements.
29 OPPENHEIMER EMERGING MARKETS LOCAL DEBT FUND
| | | | |
| |
| FINANCIAL HIGHLIGHTS Continued | | |
| | | | | | | | | | | | | | | | |
| Class Y | | Year Ended
May 30,
20141 | | | Year Ended
May 31,
2013 | | | Year Ended
May 31,
2012 | | | Period
Ended
May 31,
20112 | |
| |
Per Share Operating Data | | | | | | | | | | | | | | | | |
Net asset value, beginning of period | | $ | 10.34 | | | $ | 9.73 | | | $ | 10.73 | | | $ | 10.00 | |
| |
Income (loss) from investment operations: | | | | | | | | | | | | | | | | |
Net investment income3 | | | 0.51 | | | | 0.55 | | | | 0.59 | | | | 0.55 | |
Net realized and unrealized gain (loss) | | | (0.94 | ) | | | 0.62 | | | | (0.94 | ) | | | 0.74 | |
| | | | |
Total from investment operations | | | (0.43 | ) | | | 1.17 | | | | (0.35 | ) | | | 1.29 | |
| |
Dividends and/or distributions to shareholders: | | | | | | | | | | | | | | | | |
Dividends from net investment income | | | (0.13 | ) | | | (0.56 | ) | | | (0.43 | ) | | | (0.54) | |
Distributions from net realized gain | | | (0.15 | ) | | | 0.00 | | | | 0.00 | | | | (0.02) | |
Tax return of capital distribution | | | (0.37 | ) | | | 0.00 | | | | (0.22 | ) | | | 0.00 | |
| | | | |
Total dividends and/or distributions to shareholders | | | (0.65 | ) | | | (0.56 | ) | | | (0.65 | ) | | | (0.56) | |
| |
Net asset value, end of period | | $ | 9.26 | | | $ | 10.34 | | | $ | 9.73 | | | $ | 10.73 | |
| | | | |
| |
Total Return, at Net Asset Value4 | | | (3.91 | )% | | | 12.07 | % | | | (3.37 | )% | | | 13.11% | |
|
| |
Ratios/Supplemental Data | | | | | | | | | | | | | | | | |
Net assets, end of period (in thousands) | | $ | 10,558 | | | $ | 15,518 | | | $ | 7,502 | | | $ | 2,514 | |
| |
Average net assets (in thousands) | | $ | 10,338 | | | $ | 11,863 | | | $ | 5,855 | | | $ | 883 | |
| |
Ratios to average net assets:5 | | | | | | | | | | | | | | | | |
Net investment income | | | 5.43% | | | | 5.20% | | | | 5.74% | | | | 5.66% | |
Total expenses6 | | | 1.22% | | | | 1.17% | | | | 1.23% | | | | 1.33% | |
| Expenses after payments, waivers and/or reimbursements and reduction to custodian expenses | | | 0.95% | | | | 0.95% | | | | 0.95% | | | | 0.95% | |
| |
Portfolio turnover rate | | | 251% | | | | 130% | | | | 93% | | | | 80% | |
1. May 30, 2014 represents the last business day of the Fund’s reporting period. See Note 1 of the accompanying Notes.
2. For the period from June 30, 2010 (commencement of operations) to May 31, 2011.
3. Per share amounts calculated based on the average shares outstanding during the period.
4. Assumes an initial investment on the business day before the first day of the fiscal period, with all dividends and distributions reinvested in additional shares on the reinvestment date, and redemption at the net asset value calculated on the last business day of the fiscal period. Sales charges are not reflected in the total returns. Total returns are not annualized for periods less than one full year. Returns do not reflect the deduction of taxes that a shareholder would pay on fund distributions or the redemption of fund shares.
5. Annualized for periods less than one full year.
6. Total expenses including indirect expenses from affiliated fund were as follows:
| | | | | | |
| | Year Ended May 30, 2014 | | | 1.22 | % |
| | Year Ended May 31, 2013 | | | 1.17 | % |
| | Year Ended May 31, 2012 | | | 1.23 | % |
| | Period Ended May 31, 2011 | | | 1.33 | % |
See accompanying Notes to Financial Statements.
30 OPPENHEIMER EMERGING MARKETS LOCAL DEBT FUND
| | | | |
| |
| NOTES TO FINANCIAL STATEMENTS May 30, 2014 | | |
| | |
1. Significant Accounting Policies
Oppenheimer Emerging Markets Local Debt Fund (the “Fund”), formerly Oppenheimer Emerging Markets Debt Fund, is a non-diversified open-end management investment company registered under the Investment Company Act of 1940, as amended. The Fund’s investment objective is to seek total return. The Fund’s investment adviser is OFI Global Asset Management, Inc. (“OFI Global” or the “Manager”), a wholly-owned subsidiary of OppenheimerFunds, Inc. (“OFI” or the “Sub-Adviser”). The Manager has entered into a sub-advisory agreement with OFI.
The Fund offers Class A, Class C, Class I, Class N and Class Y shares. Class A shares are sold at their offering price, which is normally net asset value plus a front-end sales charge. Class C and Class N shares are sold without a front-end sales charge but may be subject to a contingent deferred sales charge (“CDSC”). Class N shares are sold only through retirement plans. Retirement plans that offer Class N shares may impose charges on those accounts. As of July 1, 2014, Class N shares will be renamed Class R shares. Class N shares subject to a CDSC on July 1, 2014, will continue to be subject to a CDSC after the shares are renamed. Purchases of Class R shares occurring on or after July 1, 2014, will not be subject to a CDSC upon redemption. Class I and Class Y shares are sold to certain institutional investors or intermediaries without either a front-end sales charge or a CDSC, however, the intermediaries may impose charges on their accountholders who beneficially own Class I and Class Y shares. All classes of shares have identical rights and voting privileges with respect to the Fund in general and exclusive voting rights on matters that affect that class alone. Earnings, net assets and net asset value per share may differ due to each class having its own expenses, such as transfer and shareholder servicing agent fees and shareholder communications, directly attributable to that class. Class A, C and N shares have separate distribution and/or service plans under which they pay fees. Class I and Class Y shares do not pay such fees.
The following is a summary of significant accounting policies consistently followed by the Fund.
Fiscal Year End. The last day of the Fund’s fiscal year was the last day the New York Stock Exchange was open for trading. The Fund’s financial statements have been presented through that date to maintain consistency with the Fund’s net asset value calculations used for shareholder transactions.
Structured Securities. The Fund invests in structured securities whose market values, interest rates and/or redemption prices are linked to the performance of underlying foreign currencies, interest rate spreads, stock market indices, prices of individual securities, commodities or other financial instruments or the occurrence of other specific events. The structured securities are often leveraged, increasing the volatility of each note’s market value relative to the change in the underlying linked financial element or event. Fluctuations in value of these securities are recorded as unrealized gains and losses in the accompanying Statement of Operations. The Fund records a realized gain or loss when a structured security is sold or matures.
31 OPPENHEIMER EMERGING MARKETS LOCAL DEBT FUND
| | | | |
| |
| NOTES TO FINANCIAL STATEMENTS Continued | | |
|
| 1. Significant Accounting Policies (Continued) | | |
Sovereign Debt Risk. The Fund invests in sovereign debt securities, which are subject to certain special risks. These risks include, but are not limited to, the risk that a governmental entity may delay or refuse, or otherwise be unable, to pay interest or repay the principal on its sovereign debt. There may also be no legal process for collecting sovereign debt that a government does not pay or bankruptcy proceedings through which all or part of such sovereign debt may be collected. In addition, a restructuring or default of sovereign debt may also cause additional impacts to the financial markets, such as downgrades to credit ratings, reduced liquidity and increased volatility, among others.
Investment in Oppenheimer Institutional Money Market Fund. The Fund is permitted to invest daily available cash balances in an affiliated money market fund. The Fund may invest the available cash in Class E shares of Oppenheimer Institutional Money Market Fund (“IMMF”) to seek current income while preserving liquidity. IMMF is a registered open-end management investment company, regulated as a money market fund under the Investment Company Act of 1940, as amended. The Manager is the investment adviser of IMMF, and the Sub-Adviser provides investment and related advisory services to IMMF. When applicable, the Fund’s investment in IMMF is included in the Statement of Investments. Shares of IMMF are valued at their net asset value per share. As a shareholder, the Fund is subject to its proportional share of IMMF’s Class E expenses, including its management fee. The Manager will waive fees and/or reimburse Fund expenses in an amount equal to the indirect management fees incurred through the Fund’s investment in IMMF.
Foreign Currency Translation. The Fund’s accounting records are maintained in U.S. dollars. The values of securities denominated in foreign currencies and amounts related to the purchase and sale of foreign securities and foreign investment income are translated into U.S. dollars as of the close of the New York Stock Exchange (the “Exchange”), normally 4:00 P.M. Eastern time, on each day the Exchange is open for trading. Foreign exchange rates may be valued primarily using a reliable bank, dealer or service authorized by the Board of Trustees.
Reported net realized gains and losses from foreign currency transactions arise from sales of portfolio securities, sales and maturities of short-term securities, sales of foreign currencies, exchange rate fluctuations between the trade and settlement dates on securities transactions, and the difference between the amounts of dividends, interest, and foreign withholding taxes recorded on the Fund’s books and the U.S. dollar equivalent of the amounts actually received or paid. Net unrealized appreciation and depreciation on the translation of assets and liabilities denominated in foreign currencies arise from changes in the values of assets and liabilities, including investments in securities at fiscal period end, resulting from changes in exchange rates.
The effect of changes in foreign currency exchange rates on investments is separately identified from the fluctuations arising from changes in market values of securities held and reported with all other foreign currency gains and losses in the Fund’s Statement of Operations.
32 OPPENHEIMER EMERGING MARKETS LOCAL DEBT FUND
| | | | |
| | |
| | | | |
| |
| 1. Significant Accounting Policies (Continued) | | |
Allocation of Income, Expenses, Gains and Losses. Income, expenses (other than those attributable to a specific class), gains and losses are allocated on a daily basis to each class of shares based upon the relative proportion of net assets represented by such class. Operating expenses directly attributable to a specific class are charged against the operations of that class.
Federal Taxes. The Fund intends to comply with provisions of the Internal Revenue Code applicable to regulated investment companies and to distribute substantially all of its investment company taxable income, including any net realized gain on investments not offset by capital loss carryforwards, if any, to shareholders. Therefore, no federal income or excise tax provision is required. The Fund files income tax returns in U.S. federal and applicable state jurisdictions. The statute of limitations on the Fund’s tax return filings generally remain open for the three preceding fiscal reporting period ends.
The tax components of capital shown in the following table represent distribution requirements the Fund must satisfy under the income tax regulations, losses the Fund may be able to offset against income and gains realized in future years and unrealized appreciation or depreciation of securities and other investments for federal income tax purposes.
| | | | | | | | | | | | |
Undistributed Net Investment Income1 | | Undistributed
Long-Term
Gain | | | Accumulated
Loss
Carryforward2,3,4 | | | Net Unrealized
Appreciation
Based on cost of
Securities and
Other Investments
for Federal Income
Tax Purposes | |
$— | | | $— | | | | $7,008,424 | | | | $1,082,050 | |
1. As of May 30, 2014, the Fund elected to defer $3,140,992 of late year ordinary losses.
2. As of May 30, 2014, the Fund had $7,008,424 of net capital loss carryforwards available to offset future realized capital gains, if any, and thereby reduce future taxable gain distributions. Details of the capital loss carryforwards are included in the table below. Capital loss carryovers with no expiration, if any, must be utilized prior to those with expiration dates.
| | | | |
| Expiring | |
No expiration | | $ | 7,008,424 | |
| | | | |
Total | | $ | 7,008,424 | |
| | | | |
3. During the fiscal year ended May 30, 2014, the Fund did not utilize any capital loss carryforward.
4. During the fiscal year ended May 31, 2013, the Fund utilized $456,095 of capital loss carryforward to offset capital gains realized in that fiscal year.
Net investment income (loss) and net realized gain (loss) may differ for financial statement and tax purposes. The character of dividends and distributions made during the fiscal year from net investment income or net realized gains may differ from their ultimate characterization for federal income tax purposes. Also, due to timing of dividends and distributions, the fiscal year in which amounts are distributed may differ from the fiscal year in which the income or net realized gain was recorded by the Fund.
33 OPPENHEIMER EMERGING MARKETS LOCAL DEBT FUND
| | | | |
| |
| NOTES TO FINANCIAL STATEMENTS Continued | | |
| |
| 1. Significant Accounting Policies (Continued) | | |
Accordingly, the following amounts have been reclassified for May 30, 2014. Net assets of the Fund were unaffected by the reclassifications.
| | | | | | | | |
Reduction to Paid-in Capital | | Increase
to Accumulated
Net Investment
Loss | | | Reduction
to Accumulated Net
Realized Loss on Investments | |
$2,728,037 | | | $1,873,013 | | | | $4,601,050 | |
The tax character of distributions paid during the years ended May 31, 2014 and May 31, 2013 was as follows:
| | | | | | | | |
| | | Year Ended
May 31, 2014 | | | Year Ended
May 31, 2013 | |
Distributions paid from: | | | | | | | | |
Ordinary income | | $ | 1,082,560 | | | $ | 4,651,493 | |
Long-term capital gain | | | 1,252,126 | | | | — | |
Return of capital | | | 2,944,782 | | | | — | |
| | | | | | | | |
Total | | $ | 5,279,467 | | | $ | 4,651,493 | |
| | | | | | | | |
The aggregate cost of securities and other investments and the composition of unrealized appreciation and depreciation of securities and other investments for federal income tax purposes as of May 30, 2014 are noted in the following table. The primary difference between book and tax appreciation or depreciation of securities and other investments, if applicable, is attributable to the tax deferral of losses or tax realization of financial statement unrealized gain or loss.
| | | | |
Federal tax cost of securities | | $ | 72,106,963 | |
Federal tax cost of other investments | | | (1,300,140 | ) |
| | | | |
Total federal tax cost | | $ | 70,806,823 | |
| | | | |
Gross unrealized appreciation | | $ | 2,580,854 | |
Gross unrealized depreciation | | | (1,498,804 | ) |
| | | | |
Net unrealized appreciation | | $ | 1,082,050 | |
| | | | |
Trustees’ Compensation. The Board of Trustees has adopted a compensation deferral plan for independent trustees that enables trustees to elect to defer receipt of all or a portion of the annual compensation they are entitled to receive from the Fund. For purposes of determining the amount owed to the Trustee under the plan, deferred amounts are treated as though equal dollar amounts had been invested in shares of the Fund or in other Oppenheimer funds selected by the Trustee. The Fund purchases shares of the funds selected for deferral by the Trustee in amounts equal to his or her deemed investment, resulting in a Fund asset equal to the deferred compensation liability. Such assets are included as a component of “Other” within the asset section of the Statement of Assets and Liabilities. Deferral of trustees’ fees under the plan will not affect the net assets of the Fund, and will not materially affect the Fund’s assets, liabilities or net investment income per share. Amounts will be deferred until distributed in accordance with the compensation deferral plan.
34 OPPENHEIMER EMERGING MARKETS LOCAL DEBT FUND
| | | | |
| | |
| | | | |
| |
| 1. Significant Accounting Policies (Continued) | | |
Dividends and Distributions to Shareholders. Dividends and distributions to shareholders, which are determined in accordance with income tax regulations and may differ from U.S. generally accepted accounting principles, are recorded on the ex-dividend date. Income distributions, if any, are declared daily and paid monthly. Capital gain distributions, if any, are declared and paid annually.
Investment Income. Dividend income is recorded on the ex-dividend date or upon ex-dividend notification in the case of certain foreign dividends where the ex-dividend date may have passed. Non-cash dividends included in dividend income, if any, are recorded at the fair market value of the securities received. Interest income is recognized on an accrual basis. Discount and premium, which are included in interest income on the Statement of Operations, are amortized or accreted daily.
Custodian Fees. “Custodian fees and expenses” in the Statement of Operations may include interest expense incurred by the Fund on any cash overdrafts of its custodian account during the period. Such cash overdrafts may result from the effects of failed trades in portfolio securities and from cash outflows resulting from unanticipated shareholder redemption activity. The Fund pays interest to its custodian on such cash overdrafts, to the extent they are not offset by positive cash balances maintained by the Fund, at a rate equal to the Federal Funds Rate plus 0.50%. The “Reduction to custodian expenses” line item, if applicable, represents earnings on cash balances maintained by the Fund during the period. Such interest expense and other custodian fees may be paid with these earnings.
Security Transactions. Security transactions are recorded on the trade date. Realized gains and losses on securities sold are determined on the basis of identified cost.
Indemnifications. The Fund’s organizational documents provide current and former trustees and officers with a limited indemnification against liabilities arising in connection with the performance of their duties to the Fund. In the normal course of business, the Fund may also enter into contracts that provide general indemnifications. The Fund’s maximum exposure under these arrangements is unknown as this would be dependent on future claims that may be made against the Fund. The risk of material loss from such claims is considered remote.
Other. The preparation of financial statements in conformity with accounting principles generally accepted in the United States of America requires management to make estimates and assumptions that affect the reported amounts of assets and liabilities and disclosure of contingent assets and liabilities at the date of the financial statements and the reported amounts of increases and decreases in net assets from operations during the reporting period. Actual results could differ from those estimates.
35 OPPENHEIMER EMERGING MARKETS LOCAL DEBT FUND
| | | | |
| |
| NOTES TO FINANCIAL STATEMENTS Continued | | |
| | | |
2. Securities Valuation
The Fund calculates the net asset value of its shares as of the close of the New York Stock Exchange (the “Exchange”), normally 4:00 P.M. Eastern time, on each day the Exchange is open for trading.
The Fund’s Board has adopted procedures for the valuation of the Fund’s securities and has delegated the day-to-day responsibility for valuation determinations under those procedures to the Manager. The Manager has established a Valuation Committee which is responsible for determining a “fair valuation” for any security for which market quotations are not “readily available.” The Valuation Committee’s fair valuation determinations are subject to review, approval and ratification by the Fund’s Board at its next regularly scheduled meeting covering the calendar quarter in which the fair valuation was determined.
Valuation Methods and Inputs
Securities are valued using unadjusted quoted market prices, when available, as supplied primarily by third party pricing services or dealers.
The following methodologies are used to determine the market value or the fair value of the types of securities described below:
Securities traded on a registered U.S. securities exchange (including exchange-traded derivatives other than futures and futures options) are valued based on the last sale price of the security reported on the principal exchange on which it is traded, prior to the time when the Fund’s assets are valued. In the absence of a sale, the security is valued at the last sale price on the prior trading day, if it is within the spread of the current day’s closing “bid” and “asked” prices, and if not, at the current day’s closing bid price. A security of a foreign issuer traded on a foreign exchange, but not listed on a registered U.S. securities exchange, is valued based on the last sale price on the principal exchange on which the security is traded, as identified by the third party pricing service used by the Manager, prior to the time when the Fund’s assets are valued. If the last sale price is unavailable, the security is valued at the most recent official closing price on the principal exchange on which it is traded. If the last sales price or official closing price for a foreign security is not available, the security is valued at the mean between the bid and asked price per the exchange or, if not available from the exchange, obtained from two dealers. If bid and asked prices are not available from either the exchange or two dealers, the security is valued by using one of the following methodologies (listed in order of priority): (1) using a bid from the exchange, (2) the mean between the bid and asked price as provided by a single dealer, or (3) a bid from a single dealer.
Shares of a registered investment company that are not traded on an exchange are valued at that investment company’s net asset value per share.
Corporate and government debt securities (of U.S. or foreign issuers) and municipal debt securities, event-linked bonds, loans, mortgage-backed securities, collateralized mortgage obligations, and asset-backed securities are valued at the mean between the “bid” and “asked” prices utilizing evaluated prices obtained from third party pricing services or broker-dealers who may use matrix pricing methods to determine the evaluated prices.
Short-term money market type debt securities with a remaining maturity of sixty days or less are valued at cost adjusted by the amortization of discount or premium to maturity (amortized cost), which approximates market value. Short-term debt securities with a
36 OPPENHEIMER EMERGING MARKETS LOCAL DEBT FUND
| | | | |
| | |
| | | | |
| |
| 2. Securities Valuation (Continued) | | |
remaining maturity in excess of sixty days are valued at the mean between the “bid” and “asked” prices utilizing evaluated prices obtained from third party pricing services or broker-dealers.
Structured securities, swaps, swaptions, and other over-the-counter derivatives are valued utilizing evaluated prices obtained from third party pricing services or broker-dealers.
Forward foreign currency exchange contracts are valued utilizing current and forward currency rates obtained from third party pricing services. When the settlement date of a contract is an interim date for which a quotation is not available, interpolated values are derived using the nearest dated forward currency rate.
Futures contracts and futures options traded on a commodities or futures exchange will be valued at the final settlement price or official closing price on the principal exchange as reported by such principal exchange at its trading session ending at, or most recently prior to, the time when the Fund’s assets are valued.
A description of the standard inputs that may generally be considered by the third party pricing vendors in determining their evaluated prices is provided below.
| | |
| Security Type | | Standard inputs generally considered by third-party pricing vendors |
| Corporate debt, government debt, municipal, mortgage-backed and asset-backed securities | | Reported trade data, broker-dealer price quotations, benchmark yields, issuer spreads on comparable securities, the credit quality, yield, maturity, and other appropriate factors. |
Loans | | Information obtained from market participants regarding reported trade data and broker-dealer price quotations. |
Event-linked bonds | | Information obtained from market participants regarding reported trade data and broker-dealer price quotations. |
Structured securities | | Relevant market information such as the price of underlying financial instruments, stock market indices, foreign currencies, interest rate spreads, commodities, or the occurrence of other specific events. |
Swaps | | Relevant market information, including underlying reference assets such as credit spreads, credit event probabilities, index values, individual security values, forward interest rates, variable interest rates, volatility measures, and forward currency rates. |
If a market value or price cannot be determined for a security using the methodologies described above, or if, in the “good faith” opinion of the Manager, the market value or price obtained does not constitute a “readily available market quotation,” or a significant event has occurred that would materially affect the value of the security the security is fair valued either (i) by a standardized fair valuation methodology applicable to the security type or the significant event as previously approved by the Valuation Committee and the Fund’s Board or (ii) as determined in good faith by the Manager’s Valuation Committee. The Valuation Committee considers all relevant facts that are reasonably available, through either public information or information available to the Manager, when determining the fair value of a security. Fair value determinations by the Manager are subject to review, approval and ratification by the Fund’s Board at its next regularly scheduled meeting covering the calendar quarter in which the fair valuation was determined. Those fair valuation standardized
37 OPPENHEIMER EMERGING MARKETS LOCAL DEBT FUND
| | | | |
| |
NOTES TO FINANCIAL STATEMENTS Continued | | |
| 2. Securities Valuation (Continued) | | |
methodologies include, but are not limited to, valuing securities at the last sale price or initially at cost and subsequently adjusting the value based on: changes in company specific fundamentals, changes in an appropriate securities index, or changes in the value of similar securities which may be further adjusted for any discounts related to security-specific resale restrictions. When possible, such methodologies use observable market inputs such as unadjusted quoted prices of similar securities, observable interest rates, currency rates and yield curves. The methodologies used for valuing securities are not necessarily an indication of the risks associated with investing in those securities nor can it be assured that the Fund can obtain the fair value assigned to a security if it were to sell the security.
To assess the continuing appropriateness of security valuations, the Manager, or its third party service provider who is subject to oversight by the Manager, regularly compares prior day prices, prices on comparable securities, and sale prices to the current day prices and challenges those prices exceeding certain tolerance levels with the third party pricing service or broker source. For those securities valued by fair valuations, whether through a standardized fair valuation methodology or a fair valuation determination, the Valuation Committee reviews and affirms the reasonableness of the valuations based on such methodologies and fair valuation determinations on a regular basis after considering all relevant information that is reasonably available.
Classifications
Each investment asset or liability of the Fund is assigned a level at measurement date based on the significance and source of the inputs to its valuation. Various data inputs are used in determining the value of each of the Fund’s investments as of the reporting period end. These data inputs are categorized in the following hierarchy under applicable financial accounting standards:
1) Level 1-unadjusted quoted prices in active markets for identical assets or liabilities (including securities actively traded on a securities exchange)
2) Level 2-inputs other than unadjusted quoted prices that are observable for the asset or liability (such as unadjusted quoted prices for similar assets and market corroborated inputs such as interest rates, prepayment speeds, credit risks, etc.)
3) Level 3-significant unobservable inputs (including the Manager’s own judgments about assumptions that market participants would use in pricing the asset or liability).
The inputs used for valuing securities are not necessarily an indication of the risks associated with investing in those securities.
The table below categorizes amounts that are included in the Fund’s Statement of Assets and Liabilities as of May 30, 2014 based on valuation input level:
38 OPPENHEIMER EMERGING MARKETS LOCAL DEBT FUND
2. Securities Valuation (Continued)
| | | | | | | | | | | | | | | | |
| | | Level 1—
Unadjusted
Quoted Prices | | | Level 2—
Other Significant
Observable Inputs | | | Level 3—
Significant
Unobservable
Inputs | | | Value | |
Assets Table | | | | | | | | | | | | | | | | |
Investments, at Value: | | | | | | | | | | | | | | | | |
Foreign Government Obligations | | $ | — | | | $ | 60,790,983 | | | $ | — | | | $ | 60,790,983 | |
Corporate Bonds and Notes | | | — | | | | 1,450,996 | | | | — | | | | 1,450,996 | |
Short-Term Notes | | | — | | | | 10,555,360 | | | | — | | | | 10,555,360 | |
Over-the-Counter Options Purchased | | | — | | | | 131,910 | | | | — | | | | 131,910 | |
| | | | |
Total Investments, at Value | | | — | | | | 72,929,249 | | | | — | | | | 72,929,249 | |
Other Financial Instruments: | | | | | | | | | | | | | | | | |
Swaps, at value | | | — | | | | 502,457 | | | | — | | | | 502,457 | |
Foreign currency exchange contracts | | | — | | | | 496,066 | | | | — | | | | 496,066 | |
| | | | |
Total Assets | | $ | — | | | $ | 73,927,772 | | | $ | — | | | $ | 73,927,772 | |
| | | | |
| | | | |
Liabilities Table | | | | | | | | | | | | | | | | |
Other Financial Instruments: | | | | | | | | | | | | | | | | |
Centrally cleared swaps, at value | | $ | — | | | $ | (93,661 | ) | | $ | — | | | $ | (93,661 | ) |
Options written, at value | | | — | | | | (94,393 | ) | | | — | | | | (94,393 | ) |
Foreign currency exchange contracts | | | — | | | | (1,915,550 | ) | | | — | | | | (1,915,550 | ) |
| | | | |
Total Liabilities | | $ | — | | | $ | (2,103,604 | ) | | $ | — | | | $ | (2,103,604 | ) |
| | | | |
Currency contracts and forwards, if any, are reported at their unrealized appreciation/ depreciation at measurement date, which represents the change in the contract’s value from trade date. Futures, if any, are reported at their variation margin at measurement date, which represents the amount due to/from the Fund at that date. All additional assets and liabilities included in the above table are reported at their market value at measurement date.
3. Shares of Beneficial Interest
The Fund has authorized an unlimited number of $0.001 par value shares of beneficial interest of each class. Transactions in shares of beneficial interest were as follows:
| | | | | | | | | | | | | | | | |
| | | Year Ended May 30, 2014 | | | Year Ended May 31, 20131 | |
| | | Shares | | | Amount | | | Shares | | | Amount | |
Class A | | | | | | | | | | | | | | | | |
Sold | | | 1,348,520 | | | $ | 12,743,557 | | | | 2,938,109 | | | $ | 31,271,647 | |
Dividends and/or distributions reinvested | | | 252,835 | | | | 2,346,148 | | | | 189,956 | | | | 2,006,813 | |
Redeemed | | | (2,935,513 | ) | | | (27,732,982 | ) | | | (2,140,646 | ) | | | (22,772,821 | ) |
| | | | |
Net increase (decrease) | | | (1,334,158 | ) | | $ | (12,643,277 | ) | | | 987,419 | | | $ | 10,505,639 | |
| | | | |
39 OPPENHEIMER EMERGING MARKETS LOCAL DEBT FUND
| | | | |
| |
NOTES TO FINANCIAL STATEMENTS Continued | | |
| | |
3. Shares of Beneficial Interest (Continued) | | |
| | | | | | | | | | | | | | | | |
| | | Year Ended May 30, 2014 | | | Year Ended May 31, 20131 | |
| | | Shares | | | Amount | | | Shares | | | Amount | |
Class C | | | | | | | | | | | | | | | | |
Sold | | | 432,441 | | | $ | 4,073,802 | | | | 1,619,600 | | | $ | 17,274,890 | |
Dividends and/or distributions reinvested | | | 101,261 | | | | 940,261 | | | | 68,819 | | | | 728,684 | |
Redeemed | | | (1,420,094 | ) | | | (13,446,696 | ) | | | (410,222 | ) | | | (4,355,446) | |
| | | | |
Net increase (decrease) | | | (886,392 | ) | | $ | (8,432,633 | ) | | | 1,278,197 | | | $ | 13,648,128 | |
| | | | |
| | | | |
| | | | | | | | | | | | | | | | |
| |
Class I | | | | | | | | | | | | | | | | |
Sold | | | 3,794 | | | $ | 35,393 | | | | 950 | | | $ | 10,000 | |
Dividends and/or distributions reinvested | | | 113 | | | | 1,027 | | | | — | | | | — | |
Redeemed | | | (1,180 | ) | | | (10,496 | ) | | | — | | | | — | |
| | | | |
Net increase | | | 2,727 | | | $ | 25,924 | | | | 950 | | | $ | 10,000 | |
| | | | |
| | | | |
| | | | | | | | | | | | | | | | |
| |
Class N | | | | | | | | | | | | | | | | |
Sold | | | 67,615 | | | $ | 640,145 | | | | 159,845 | | | $ | 1,699,422 | |
Dividends and/or distributions reinvested | | | 14,611 | | | | 135,646 | | | | 9,749 | | | | 103,152 | |
Redeemed | | | (162,331 | ) | | | (1,530,615 | ) | | | (27,536 | ) | | | (291,221) | |
| | | | |
Net increase (decrease) | | | (80,105 | ) | | $ | (754,824 | ) | | | 142,058 | | | $ | 1,511,353 | |
| | | | |
| | | | |
| | | | | | | | | | | | | | | | |
| |
Class Y | | | | | | | | | | | | | | | | |
Sold | | | 794,067 | | | $ | 7,385,037 | | | | 1,628,012 | | | $ | 17,325,843 | |
Dividends and/or distributions reinvested | | | 56,622 | | | | 527,630 | | | | 53,867 | | | | 569,756 | |
Redeemed | | | (1,210,645 | ) | | | (11,588,490 | ) | | | (952,996 | ) | | | (10,038,499) | |
| | | | |
Net increase (decrease) | | | (359,956 | ) | | $ | (3,675,823 | ) | | | 728,883 | | | $ | 7,857,100 | |
| | | | |
1. For the year ended May 31, 2013 for Class A, Class C, Class N and Class Y shares, and for the period from September 28, 2012 (inception of offering) to May 31, 2013, for Class I shares.
4. Purchases and Sales of Securities
The aggregate cost of purchases and proceeds from sales of securities, other than short-term obligations and investments in IMMF, for the year ended May 30, 2014 were as follows:
| | | | | | | | |
| | | Purchases | | | Sales | |
Investment securities | | $ | 147,773,969 | | | $ | 187,903,253 | |
U.S. government and government agency obligations | | | — | | | | 1,087,613 | |
5. Fees and Other Transactions with Affiliates
Management Fees. Under the investment advisory agreement, the Fund pays the Manager a management fee based on the daily net assets of the Fund at an annual rate as shown in the following table:
40 OPPENHEIMER EMERGING MARKETS LOCAL DEBT FUND
| | | | |
| | |
| | | | |
| |
| 5. Fees and Other Transactions with Affiliates (Continued) | | |
| | | | |
| Fee Schedule | | | |
Up to $500 million | | | 0.75 | % |
Next $500 million | | | 0.70 | |
Next $4 billion | | | 0.65 | |
Over $5 billion | | | 0.60 | |
Sub-Adviser Fees. The Manager has retained the Sub-Adviser to provide the day-to-day portfolio management of the Fund. Under the Sub-Advisory Agreement, the Manager pays the Sub-Adviser an annual fee in monthly installments, equal to a percentage of the investment management fee collected by the Manager from the Fund, which shall be calculated after any investment management fee waivers. The fee paid to the Sub-Adviser is paid by the Manager, not by the Fund.
Transfer Agent Fees. OFI Global (the “Transfer Agent”) serves as the transfer and shareholder servicing agent for the Fund. The Fund pays the Transfer Agent a fee based on annual net assets. Fees incurred by the Fund with respect to these services are detailed in the Statement of Operations.
Sub-Transfer Agent Fees. The Transfer Agent has retained Shareholder Services, Inc., a wholly-owned subsidiary of OFI (the “Sub-Transfer Agent”), to provide the day-to-day transfer agent and shareholder servicing of the Fund. Under the Sub-Transfer Agency Agreement, the Transfer Agent pays the Sub-Transfer Agent an annual fee in monthly installments, equal to a percentage of the transfer agent fee collected by the Transfer Agent from the Fund, which shall be calculated after any applicable fee waivers. The fee paid to the Sub-Transfer Agent is paid by the Transfer Agent, not by the Fund.
Distribution and Service Plan (12b-1) Fees. Under its General Distributor’s Agreement with the Fund, OppenheimerFunds Distributor, Inc. (the “Distributor”) acts as the Fund’s principal underwriter in the continuous public offering of the Fund’s classes of shares.
Service Plan for Class A Shares. The Fund has adopted a Service Plan (the “Plan”) for Class A shares under Rule 12b-1 of the Investment Company Act of 1940. Under the Plan, the Fund reimburses the Distributor for a portion of its costs incurred for services provided to accounts that hold Class A shares. Reimbursement is made periodically at an annual rate of up to 0.25% of the daily net assets of Class A shares of the Fund. The Distributor currently uses all of those fees to pay dealers, brokers, banks and other financial institutions periodically for providing personal service and maintenance of accounts of their customers that hold Class A shares. Any unreimbursed expenses the Distributor incurs with respect to Class A shares in any fiscal year cannot be recovered in subsequent periods. Fees incurred by the Fund under the Plan are detailed in the Statement of Operations.
Distribution and Service Plans for Class C and Class N Shares. The Fund has adopted Distribution and Service Plans (the “Plans”) for Class C and Class N shares under Rule 12b-1 of the Investment Company Act of 1940 to compensate the Distributor for its services in
41 OPPENHEIMER EMERGING MARKETS LOCAL DEBT FUND
| | | | |
| |
NOTES TO FINANCIAL STATEMENTS Continued | | |
| | |
5. Fees and Other Transactions with Affiliates (Continued) | | |
connection with the distribution of those shares and servicing accounts. Under the Plans, the Fund pays the Distributor an annual asset-based sales charge of 0.75% on Class C shares daily net assets and 0.25% on Class N shares daily net assets. The Distributor also receives a service fee of 0.25% per year under each plan. If either the Class C or Class N plan is terminated by the Fund or by the shareholders of a class, the Board of Trustees and its independent trustees must determine whether the Distributor shall be entitled to payment from the Fund of all or a portion of the service fee and/or asset-based sales charge in respect to shares sold prior to the effective date of such termination. Fees incurred by the Fund under the Plans are detailed in the Statement of Operations. The Distributor determines its uncompensated expenses under the Plans at calendar quarter ends. The Distributor’s aggregate uncompensated expenses under the Plans at March 31, 2014 were as follows:
| | | | |
Class C | | $ | 292,402 | |
Class N | | | 27,166 | |
Sales Charges. Front-end sales charges and contingent deferred sales charges (“CDSC”) do not represent expenses of the Fund. They are deducted from the proceeds of sales of Fund shares prior to investment or from redemption proceeds prior to remittance, as applicable. The sales charges retained by the Distributor from the sale of shares and the CDSC retained by the Distributor on the redemption of shares is shown in the following table for the period indicated.
| | | | | | | | | | | | | | | | |
| | | | | | Class A | | | Class C | | | Class N | |
| | | Class A | | | Contingent | | | Contingent | | | Contingent | |
| | | Front-End | | | Deferred Sales | | | Deferred Sales | | | Deferred Sales | |
| | | Sales Charges | | | Charges | | | Charges | | | Charges | |
| | | Retained by | | | Retained by | | | Retained by | | | Retained by | |
| Year Ended | | Distributor | | | Distributor | | | Distributor | | | Distributor | |
May 30, 2014 | | | $27,197 | | | | $1,796 | | | | $5,836 | | | | $109 | |
Waivers and Reimbursements of Expenses. The Manager has agreed to voluntarily waive a portion of its management fees and/or reimburse the Fund for certain expenses so that “Expenses after payments, waivers and/or reimbursements and reduction to custodian expenses” will not exceed 1.25% of average annual net assets for Class A shares, 2.00% for Class C shares, 0.85% for Class I, 1.50% for Class N shares and 0.95% for Class Y shares. During the year ended May 30, 2014, the Manager reimbursed the Fund $76,244, $50,455, $32, $6,207 and $27,144 for Class A, Class C, Class I, Class N and Class Y shares, respectively.
The Manager will waive fees and/or reimburse Fund expenses in an amount equal to the indirect management fees incurred through the Fund’s investment in IMMF. During the year ended May 30, 2014, the Manager waived fees and/or reimbursed the Fund $1,927 for IMMF management fees.
The Transfer Agent has contractually agreed to limit transfer and shareholder servicing agent fees for Classes C, N and Y shares to 0.35% of average annual net assets per class and for Class A shares to 0.30% of average annual net assets of the class.
42 OPPENHEIMER EMERGING MARKETS LOCAL DEBT FUND
| | | | |
| | |
| | | | |
| |
| 5. Fees and Other Transactions with Affiliates (Continued) | | |
During the year ended May 30, 2014, the Transfer Agent waived transfer and shareholder servicing agent fees as follows:
| | | | |
Class A | | $ | 326 | |
Class C | | | 171 | |
Class N | | | 6 | |
Class Y | | | 587 | |
Some of these undertakings may be modified or terminated at any time; some may not be modified or terminated until after one year from the date of the current prospectus, as indicated therein.
6. Risk Exposures and the Use of Derivative Instruments
The Fund’s investment objective not only permits the Fund to purchase investment securities, it also allows the Fund to enter into various types of derivatives contracts, including, but not limited to, futures contracts, forward currency exchange contracts, credit default swaps, interest rate swaps, total return swaps, variance swaps and purchased and written options. In doing so, the Fund will employ strategies in differing combinations to permit it to increase, decrease, or change the level or types of exposure to market risk factors. These instruments may allow the Fund to pursue its objectives more quickly and efficiently than if it were to make direct purchases or sales of securities capable of effecting a similar response to market factors. Such contracts may be entered into through a bilateral over-the-counter (“OTC”) transaction, or through a securities or futures exchange and cleared through a clearinghouse.
Market Risk Factors. In accordance with its investment objectives, the Fund may use derivatives to increase or decrease its exposure to one or more of the following market risk factors:
Commodity Risk. Commodity risk relates to the change in value of commodities or commodity indexes as they relate to increases or decreases in the commodities market. Commodities are physical assets that have tangible properties. Examples of these types of assets are crude oil, heating oil, metals, livestock, and agricultural products.
Credit Risk. Credit risk relates to the ability of the issuer to meet interest and principal payments, or both, as they come due. In general, lower-grade, higher-yield bonds are subject to credit risk to a greater extent than lower-yield, higher-quality bonds.
Equity Risk. Equity risk relates to the change in value of equity securities as they relate to increases or decreases in the general market.
Foreign Exchange Rate Risk. Foreign exchange rate risk relates to the change in the U.S. dollar value of a security held that is denominated in a foreign currency. The U.S. dollar value of a foreign currency denominated security will decrease as the dollar appreciates against the currency, while the U.S. dollar value will increase as the dollar depreciates against the currency.
Interest Rate Risk. Interest rate risk refers to the fluctuations in value of fixed-income securities resulting from the inverse relationship between price and yield. For example, an increase in general interest rates will tend to reduce the market value of already issued
43 OPPENHEIMER EMERGING MARKETS LOCAL DEBT FUND
| | | | |
| |
NOTES TO FINANCIAL STATEMENTS Continued | | |
| | |
6. Risk Exposures and the Use of Derivative Instruments (Continued) | | |
fixed-income investments, and a decline in general interest rates will tend to increase their value. In addition, debt securities with longer maturities, which tend to have higher yields, are subject to potentially greater fluctuations in value from changes in interest rates than obligations with shorter maturities.
Volatility Risk. Volatility risk refers to the magnitude of the movement, but not the direction of the movement, in a financial instrument’s price over a defined time period. Large increases or decreases in a financial instrument’s price over a relative time period typically indicate greater volatility risk, while small increases or decreases in its price typically indicate lower volatility risk.
Derivatives may have little or no initial cash investment relative to their market value exposure and therefore can produce significant gains or losses in excess of their cost due to unanticipated changes in the market risk factors and the overall market. This use of embedded leverage allows the Fund to increase its market value exposure relative to its net assets and can substantially increase the volatility of the Fund’s performance. In instances where the Fund is using derivatives to decrease, or hedge, exposures to market risk factors for securities held by the Fund, there are also risks that those derivatives may not perform as expected resulting in losses for the combined or hedged positions. Some derivatives have the potential for unlimited loss, regardless of the size of the Fund’s initial investment.
Additional associated risks from investing in derivatives also exist and potentially could have significant effects on the valuation of the derivative and the Fund. Typically, the associated risks are not the risks that the Fund is attempting to increase or decrease exposure to, per its investment objectives, but are the additional risks from investing in derivatives. Examples of these associated risks are liquidity risk, which is the risk that the Fund will not be able to sell the derivative in the open market in a timely manner, and counterparty credit risk, which is the risk that the counterparty will not fulfill its obligation to the Fund.
The Fund’s actual exposures to these market risk factors and associated risks during the period are discussed in further detail, by derivative type, below.
Forward Currency Exchange Contracts
The Fund may enter into forward currency exchange contracts (“forward contracts”) for the purchase or sale of a foreign currency at a negotiated rate at a future date. Such contracts are traded in the OTC inter-bank currency dealer market.
Forward contracts are reported on a schedule following the Statement of Investments. The unrealized appreciation (depreciation) is reported in the Statement of Assets and Liabilities as a receivable (or payable) and in the Statement of Operations within the change in unrealized appreciation (depreciation). At contract close, the difference between the original cost of the contract and the value at the close date is recorded as a realized gain (loss) in the Statement of Operations.
The Fund has entered into forward contracts with the obligation to purchase specified foreign currencies in the future at a currently negotiated forward rate in order to take a
44 OPPENHEIMER EMERGING MARKETS LOCAL DEBT FUND
| | | | |
| | |
| | | | |
| |
| 6. Risk Exposures and the Use of Derivative Instruments (Continued) | | |
positive investment perspective on the related currency. These forward contracts seek to increase exposure to foreign exchange rate risk.
The Fund has entered into forward contracts with the obligation to purchase specified foreign currencies in the future at a currently negotiated forward rate in order to decrease exposure to foreign exchange rate risk associated with foreign currency denominated securities held by the Fund.
The Fund has entered into forward contracts with the obligation to sell specified foreign currencies in the future at a currently negotiated forward rate in order to take a negative investment perspective on the related currency. These forward contracts seek to increase exposure to foreign exchange rate risk.
The Fund has entered into forward contracts with the obligation to sell specified foreign currencies in the future at a currently negotiated forward rate in order to decrease exposure to foreign exchange rate risk associated with foreign currency denominated securities held by the Fund.
During the year ended May 30, 2014, the Fund had daily average contract amounts on forward contracts to buy and sell of $58,345,433 and $65,860,600, respectively.
Additional associated risk to the Fund includes counterparty credit risk. Counterparty credit risk arises from the possibility that the counterparty to a forward contract will default and fail to perform its obligations to the Fund.
Futures Contracts
A futures contract is a commitment to buy or sell a specific amount of a commodity, financial instrument or currency at a negotiated price on a stipulated future date. The Fund may buy and sell futures contracts and may also buy or write put or call options on these futures contracts. Futures contracts and options thereon are generally entered into on a regulated futures exchange and cleared through a clearinghouse associated with the exchange.
Upon entering into a futures contract, the Fund is required to deposit either cash or securities (initial margin) in an amount equal to a certain percentage of the contract value in an account registered in the futures commission merchant’s name. Subsequent payments (variation margin) are paid to or from the futures commission merchant each day equal to the daily changes in the contract value. Such payments are recorded as unrealized gains and losses. Should the Fund fail to make requested variation margin payments, the futures commission merchant can gain access to the initial margin to satisfy the Fund’s payment obligations.
Futures contracts are reported on a schedule following the Statement of Investments. Securities held by a futures commission merchant to cover initial margin requirements on open futures contracts are noted in the Statement of Investments. Cash held by a futures commission merchant to cover initial margin requirements on open futures contracts and the receivable and/or payable for the daily mark to market for the variation margin are noted in the Statement of Assets and Liabilities. The net change in unrealized appreciation and depreciation is reported in the Statement of Operations. Realized gains (losses) are reported in the Statement of Operations at the closing or expiration of futures contracts.
45 OPPENHEIMER EMERGING MARKETS LOCAL DEBT FUND
| | | | |
| |
NOTES TO FINANCIAL STATEMENTS Continued | | |
| | |
6. Risk Exposures and the Use of Derivative Instruments (Continued) | | |
The Fund has purchased futures contracts on various bonds and notes to increase exposure to interest rate risk.
The Fund has sold futures contracts on various bonds and notes to decrease exposure to interest rate risk.
During the year ended May 30, 2014, the Fund had an ending monthly average market value of $0 and $5,747,829 on futures contracts purchased and sold, respectively.
As of May 30, 2014, the Fund had no outstanding futures.
Additional associated risks of entering into futures contracts (and related options) include the possibility that there may be an illiquid market where the Fund is unable to liquidate the contract or enter into an offsetting position and, if used for hedging purposes, the risk that the price of the contract will correlate imperfectly with the prices of the Fund’s securities.
Option Activity
The Fund may buy and sell put and call options, or write put and call options. When an option is written, the Fund receives a premium and becomes obligated to sell or purchase the underlying security, currency or other underlying financial instrument at a fixed price, upon exercise of the option.
Options can be traded through an exchange or through a privately negotiated arrangement with a dealer in an OTC transaction. Options traded through an exchange are generally cleared through a clearinghouse (such as The Options Clearing Corporation). The difference between the premium received or paid, and market value of the option, is recorded as unrealized appreciation or depreciation. The net change in unrealized appreciation or depreciation is reported in the Statement of Operations. When an option is exercised, the cost of the security purchased or the proceeds of the security sale are adjusted by the amount of premium received or paid. Upon the expiration or closing of the option transaction, a gain or loss is reported in the Statement of Operations.
The Fund has purchased call options on currencies to increase exposure to foreign exchange rate risk. A purchased call option becomes more valuable as the price of the underlying financial instrument appreciates relative to the strike price.
The Fund has purchased put options on currencies to decrease exposure to foreign exchange rate risk. A purchased put option becomes more valuable as the price of the underlying financial instrument depreciates relative to the strike price.
During the year ended May 30, 2014, the Fund had an ending monthly average market value of $76,579 and $44,186 on purchased call options and purchased put options, respectively.
Options written, if any, are reported in a schedule following the Statement of Investments and as a liability in the Statement of Assets and Liabilities. Securities held in collateral accounts to cover potential obligations with respect to outstanding written options are noted in the Statement of Investments.
The risk in writing a call option is that the market price of the security increases and if the option is exercised, the Fund must either purchase the security at a higher price for delivery or, if the Fund owns the underlying security, give up the opportunity for profit. The risk in
46 OPPENHEIMER EMERGING MARKETS LOCAL DEBT FUND
| | | | |
| | |
| | | | |
| |
| 6. Risk Exposures and the Use of Derivative Instruments (Continued) | | |
writing a put option is that the Fund may incur a loss if the market price of the security decreases and the option is exercised. The risk in buying an option is that the Fund pays a premium whether or not the option is exercised. The Fund also has the additional risk that there may be an illiquid market where the Fund is unable to close the contract.
The Fund has written put options on currencies to increase exposure to foreign exchange rate risk. A written put option becomes more valuable as the price of the underlying financial instrument appreciates relative to the strike price.
The Fund has written call options on currencies to decrease exposure to foreign exchange rate risk. A written call option becomes more valuable as the price of the underlying financial instrument depreciates relative to the strike price.
During the year ended May 30, 2014, the Fund had an ending monthly average market value of $13,595 and $50,390 on written call options and written put options, respectively.
Additional associated risks to the Fund include counterparty credit risk and liquidity risk.
Written option activity for the year ended May 30, 2014 was as follows:
| | | | | | | | | | | | | | | | |
| | | Call Options | | | Put Options | |
| | | Number of
Contracts | | | Amount
of
Premiums | | | Number of
Contracts | | | Amount of
Premiums | |
Options outstanding as of May 31, 2013 | | | 37,900,000 | | | $ | 9,878 | | | | 41,900,000 | | | $ | 17,404 | |
Options written | | | 417,450,000 | | | | 254,947 | | | | 19,841,833,000 | | | | 606,418 | |
Options closed or expired | | | (383,520,000 | ) | | | (78,919 | ) | | | (113,230,000 | ) | | | (108,844) | |
Options exercised | | | (62,380,000 | ) | | | (92,355 | ) | | | (1,544,123,000 | ) | | | (467,941) | |
| | | | |
Options outstanding as of May 30, 2014 | | | 9,450,000 | | | $ | 93,551 | | | | 18,226,380,000 | | | $ | 47,037 | |
| | | | |
Swap Contracts
The Fund may enter into swap contract agreements with a counterparty to exchange a series of cash flows based on either specified reference rates, the price or volatility of asset or non-asset references, or the occurrence of a credit event, over a specified period. Swaps can be executed in a bi-lateral privately negotiated arrangement with a dealer in an OTC transaction (“OTC swaps”) or executed on a regulated market. Certain swaps, regardless of the venue of their execution, are required to be cleared through a clearinghouse (“centrally cleared swaps”). Swap contracts may include interest rate, equity, debt, index, total return, credit default, currency, and volatility swaps.
Swap contracts are reported on a schedule following the Statement of Investments. The values of centrally cleared swap and OTC swap contracts are aggregated by positive and negative values and disclosed separately on the Statement of Assets and Liabilities. The unrealized appreciation (depreciation) related to the change in the valuation of the notional amount of the swap is combined with the accrued interest due to (owed by) the Fund, if any, at termination or settlement. The net change in this amount during the period is included on the Statement of Operations. The Fund also records any periodic payments received from (paid to) the counterparty, including at termination, under such contracts as realized gain (loss) on the Statement of Operations.
47 OPPENHEIMER EMERGING MARKETS LOCAL DEBT FUND
| | | | |
| |
NOTES TO FINANCIAL STATEMENTS Continued | | |
| | |
6. Risk Exposures and the Use of Derivative Instruments (Continued) | | |
Swap contract agreements are exposed to the market risk factor of the specific underlying reference rate or asset. Swap contracts are typically more attractively priced compared to similar investments in related cash securities because they isolate the risk to one market risk factor and eliminate the other market risk factors. Investments in cash securities (for instance bonds) have exposure to multiple risk factors (credit and interest rate risk). Because swaps have embedded leverage, they can expose the Fund to substantial risk in the isolated market risk factor.
Credit Default Swap Contracts. A credit default swap is a contract that enables an investor to buy or sell protection against a defined-issuer credit event, such as the issuer’s failure to make timely payments of interest or principal on a debt security, bankruptcy or restructuring. The Fund may enter into credit default swaps either by buying or selling protection on a corporate issuer, sovereign issuer, or a basket or index of issuers (the “reference asset”).
The buyer of protection pays a periodic fee to the seller of protection based on the notional amount of the swap contract. The seller of protection agrees to compensate the buyer of protection for future potential losses as a result of a credit event on the reference asset. The contract effectively transfers the credit event risk of the reference asset from the buyer of protection to the seller of protection.
The ongoing value of the contract will fluctuate throughout the term of the contract based primarily on the credit risk of the reference asset. If the credit quality of the reference asset improves relative to the credit quality at contract initiation, the buyer of protection may have an unrealized loss greater than the anticipated periodic fee owed. This unrealized loss would be the result of current credit protection being cheaper than the cost of credit protection at contract initiation. If the buyer elects to terminate the contract prior to its maturity, and there has been no credit event, this unrealized loss will become realized. If the contract is held to maturity, and there has been no credit event, the realized loss will be equal to the periodic fee paid over the life of the contract.
If there is a credit event, the buyer of protection can exercise its rights under the contract and receive a payment from the seller of protection equal to the notional amount of the swap less the market value of specified debt securities issued by the reference asset. Upon exercise of the contract the difference between such value and the notional amount is recorded as realized gain (loss) and is included on the Statement of Operations.
The Fund has purchased credit protection through credit default swaps to decrease exposure to the credit risk of individual issuers and/or indexes of issuers.
For the year ended May 30, 2014, the Fund had ending monthly average notional amounts of $23,846 to buy protection.
Additional associated risks to the Fund include counterparty credit risk and liquidity risk.
As of May 30, 2014 the Fund had no such credit default swap agreements outstanding.
Interest Rate Swap Contracts. An interest rate swap is an agreement between counterparties to exchange periodic payments based on interest rates. One cash flow stream will typically be a floating rate payment based upon a specified floating interest rate while the other is typically a fixed interest rate.
48 OPPENHEIMER EMERGING MARKETS LOCAL DEBT FUND
| | | | |
| | |
| | | | |
| |
| 6. Risk Exposures and the Use of Derivative Instruments (Continued) | | |
The Fund has entered into interest rate swaps in which it pays a floating interest rate and receives a fixed interest rate in order to increase exposure to interest rate risk. Typically, if relative interest rates rise, payments made by the Fund under a swap agreement will be greater than the payments received by the Fund.
The Fund has entered into interest rate swaps in which it pays a fixed interest rate and receives a floating interest rate in order to decrease exposure to interest rate risk. Typically, if relative interest rates rise, payments received by the Fund under the swap agreement will be greater than the payments made by the Fund.
For the year ended May 30, 2014, the Fund had ending monthly average notional amounts of $12,712,760 and $83,215,460 on interest rate swaps which pay a fixed rate and interest rate swaps which receive a fixed rate, respectively.
Additional associated risks to the Fund include counterparty credit risk and liquidity risk.
Currency Swap Contracts. A currency swap contract is an agreement between counterparties to exchange different currencies at contract inception that are equivalent to a notional value. The exchange at contract inception is made at the current spot rate. The contract also includes an agreement to reverse the exchange of the same notional values of those currencies at contract termination. The re-exchange at contract termination may take place at the same exchange rate, a specified rate or the then current spot rate. Certain currency swap contracts provide for exchanging the currencies only at contract termination and can provide for only a net payment in the settlement currency, typically USD. A currency swap contract may also include the exchange of periodic payments, between the counterparties, that are based on interest rates available in the respective currencies at contract inception. Other currency swap contracts may not provide for exchanging the different currencies at all, and only for exchanging interest cash flows based on the notional value in the contract.
The Fund has entered into currency swap contracts with the obligation to pay an interest rate on the dollar notional amount and receive an interest rate on the various foreign currency notional amounts in order to take a positive investment perspective on the related currencies for which the Fund receives a payment. These currency swap contracts increase exposure to foreign exchange rate risk.
For the year ended May 30, 2014, the Fund had ending monthly average notional amounts of $508,268 on currency swaps which receive a fixed rate.
Additional associated risks to the Fund include counterparty credit risk and liquidity risk.
Swaption Transactions
The Fund may enter into a swaption contract which grants the purchaser the right, but not the obligation, to enter into a swap transaction at preset terms detailed in the underlying agreement within a specified period of time. The purchaser pays a premium to the swaption writer who bears the risk of unfavorable changes in the preset terms on the underlying swap.
Purchased swaptions are reported as a component of investments in the Statement of Investments and the Statement of Assets and Liabilities. Written swaptions are reported on a schedule following the Statement of Investments and their value is reported as a separate asset or liability line item in the Statement of Assets and Liabilities. The net change in
49 OPPENHEIMER EMERGING MARKETS LOCAL DEBT FUND
| | | | |
| |
NOTES TO FINANCIAL STATEMENTS Continued | | |
| | |
6. Risk Exposures and the Use of Derivative Instruments (Continued) | | |
unrealized appreciation or depreciation on written swaptions is separately reported in the Statement of Operations. When a swaption is exercised, the cost of the swap is adjusted by the amount of premium paid or received. Upon the expiration or closing of an unexercised swaption contract, a gain or loss is reported in the Statement of Operations for the amount of the premium paid or received.
The Fund generally will incur a greater risk when it writes a swaption than when it purchases a swaption. When the Fund writes a swaption it will become obligated, upon exercise of the swaption, according to the terms of the underlying agreement. Swaption contracts written by the Fund do not give rise to counterparty credit risk prior to exercise as they obligate the Fund, not its counterparty, to perform. When the Fund purchases a swaption it only risks losing the amount of the premium it paid if the swaption expires unexercised. However, when the Fund exercises a purchased swaption there is a risk that the counterparty will fail to perform or otherwise default on its obligations under the swaption contract.
The Fund has purchased swaptions which gives it the option to enter into an interest rate swap in which it pays a floating interest rate and receives a fixed interest rate in order to increase exposure to interest rate risk. A purchased swaption of this type becomes more valuable as the reference interest rate decreases relative to the preset interest rate.
The Fund has purchased swaptions which gives it the option to enter into an interest rate swap in which it pays a fixed interest rate and receives a floating interest rate in order to decrease exposure to interest rate risk. A purchased swaption of this type becomes more valuable as the reference interest rate increases relative to the preset interest rate.
The Fund has written swaptions which gives it the obligation, if exercised by the purchaser, to enter into an interest rate swap in which it pays a floating interest rate and receives a fixed interest rate in order to increase exposure to interest rate risk. A written swaption of this type becomes more valuable as the reference interest rate decreases relative to the preset interest rate.
The Fund has written swaptions which gives it the obligation, if exercised by the purchaser, to enter into an interest rate swap in which it pays a fixed interest rate and receives a floating interest rate in order to decrease exposure to interest rate risk. A written swaption of this type becomes more valuable as the reference interest rate increases relative to the preset interest rate.
During the year ended May 30, 2014, the Fund had an ending monthly average market value of $69,485 and $89,186 on purchased and written swaptions, respectively.
Written swaption activity for the year ended May 30, 2014 was as follows:
| | | | | | | | |
| | | Call Swaptions | |
| | | Notional Amount | | | Amount of Premiums | |
Swaptions outstanding as of May 31, 2013 | | | 17,600,000 | | | $ | 198,794 | |
Swaptions written | | | 123,805,000 | | | | 257,531 | |
Swaptions closed or expired | | | (29,400,000 | ) | | | (254,844) | |
Swaptions exercised | | | (112,005,000 | ) | | | (201,481) | |
| | | | |
Swaptions outstanding as of May 30, 2014 | | | — | | | $ | — | |
| | | | |
50 OPPENHEIMER EMERGING MARKETS LOCAL DEBT FUND
| | | | |
| | |
| | | | |
| |
| 6. Risk Exposures and the Use of Derivative Instruments (Continued) | | |
As of May 30, 2014 the Fund had no outstanding swaptions.
Counterparty Credit Risk. Derivative positions are subject to the risk that the counterparty will not fulfill its obligation to the Fund. The Fund intends to enter into derivative transactions with counterparties that the Manager believes to be creditworthy at the time of the transaction.
The Fund’s risk of loss from counterparty credit risk on OTC derivatives is generally limited to the aggregate unrealized gain netted against any collateral held by the Fund. For OTC options purchased, the Fund bears the risk of loss of the amount of the premiums paid plus the positive change in market values net of any collateral held by the Fund should the counterparty fail to perform under the contracts. Options written by the Fund do not typically give rise to counterparty credit risk, as options written generally obligate the Fund and not the counterparty to perform.
To reduce counterparty risk with respect to OTC transactions, the Fund has entered into master netting arrangements, established within the Fund’s International Swap and Derivatives Association, Inc. (“ISDA”) master agreements, which allow the Fund to make (or to have an entitlement to receive) a single net payment in the event of default (close-out netting) for outstanding payables and receivables with respect to certain OTC positions in swaps, options, swaptions, and forward currency exchange contracts for each individual counterparty. In addition, the Fund may require that certain counterparties post cash and/or securities in collateral accounts to cover their net payment obligations for those derivative contracts subject to ISDA master agreements. If the counterparty fails to perform under these contracts and agreements, the cash and/or securities will be made available to the Fund.
As of May 30, 2014, the Fund has required certain counterparties to post collateral of $300,374.
ISDA master agreements include credit related contingent features which allow counterparties to OTC derivatives to terminate derivative contracts prior to maturity in the event that, for example, the Fund’s net assets decline by a stated percentage or the Fund fails to meet the terms of its ISDA master agreements, which would cause the Fund to accelerate payment of any net liability owed to the counterparty.
For financial reporting purposes, the Fund does not offset derivative assets and derivative liabilities that are subject to netting arrangements in the Statement of Assets and Liabilities. Bankruptcy or insolvency laws of a particular jurisdiction may impose restrictions on or prohibitions against the right of offset in bankruptcy, insolvency or other events.
The Fund’s risk of loss from counterparty credit risk on exchange-traded derivatives cleared through a clearinghouse and for centrally cleared swaps is generally considered lower than as compared to OTC derivatives. However, counterparty credit risk exists with respect to initial and variation margin deposited/paid by the Fund that is held in futures commission merchant, broker and/or clearinghouse accounts for such exchange-traded derivatives and for centrally cleared swaps.
51 OPPENHEIMER EMERGING MARKETS LOCAL DEBT FUND
| | | | |
| |
NOTES TO FINANCIAL STATEMENTS Continued | | |
| | |
6. Risk Exposures and the Use of Derivative Instruments (Continued) | | |
With respect to centrally cleared swaps, such transactions will be submitted for clearing, and if cleared, will be held in accounts at futures commission merchants or brokers that are members of clearinghouses. While brokers, futures commission merchants and clearinghouses are required to segregate customer margin from their own assets, in the event that a broker, futures commission merchant or clearinghouse becomes insolvent or goes into bankruptcy and at that time there is a shortfall in the aggregate amount of margin held by the broker, futures commission merchant or clearinghouse for all its customers, U.S. bankruptcy laws will typically allocate that shortfall on a pro-rata basis across all the broker’s, futures commission merchant’s or clearinghouse’s customers, potentially resulting in losses to the Fund.
There is the risk that a broker, futures commission merchant or clearinghouse will decline to clear a transaction on the Fund’s behalf, and the Fund may be required to pay a termination fee to the executing broker with whom the Fund initially enters into the transaction. Clearinghouses may also be permitted to terminate centrally cleared swaps at any time. The Fund is also subject to the risk that the broker or futures commission merchant will improperly use the Fund’s assets deposited/paid as initial or variation margin to satisfy payment obligations of another customer. In the event of a default by another customer of the broker or futures commission merchant, the Fund might not receive its variation margin payments from the clearinghouse, due to the manner in which variation margin payments are aggregated for all customers of the broker/futures commission merchant.
Collateral and margin requirements differ by type of derivative. Margin requirements are established by the broker, futures commission merchant or clearinghouse for exchange-traded and cleared derivatives, including centrally cleared swaps. Brokers, futures commission merchants and clearinghouses can ask for margin in excess of the regulatory minimum, or increase the margin amount, in certain circumstances.
Collateral terms are contract specific for OTC derivatives. For derivatives traded under an ISDA master agreement, the collateral requirements are typically calculated by netting the mark to market amount for each transaction under such agreement and comparing that amount to the value of any collateral currently pledged by the Fund or the counterparty.
For financial reporting purposes, cash collateral that has been pledged to cover obligations of the Fund, if any, is reported separately on the Statement of Assets and Liabilities as cash pledged as collateral. Non-cash collateral pledged by the Fund, if any, is noted in the Statement of Investments. Generally, the amount of collateral due from or to a party must exceed a minimum transfer amount threshold (e.g. $250,000) before a transfer has to be made. To the extent amounts due to the Fund from its counterparties are not fully collateralized, contractually or otherwise, the Fund bears the risk of loss from counterparty nonperformance.
The following table presents by counterparty the Fund’s OTC derivative assets net of the related collateral posted for the benefit of the Fund as of May 30, 2014:
52 OPPENHEIMER EMERGING MARKETS LOCAL DEBT FUND
| | | | |
| | |
| | | | |
| |
| 6. Risk Exposures and the Use of Derivative Instruments (Continued) | | |
| | | | | | | | | | | | | | | | | | | | |
| | | | | | Gross Amounts Not Offset in the Statement of
Assets & Liabilities | | | | |
| | | Gross Amount | | | | | | | | | | | | | |
| | | of Assets in the | | | Financial | | | Financial | | | | | | | |
| | | Statement of
Assets & | | | Instruments
Available for | | | Instruments
Collateral | | | Cash Collateral | | | | |
| Counterparty | | Liabilities* | | | Offset | | | Received** | | | Received** | | | Net Amount | |
Bank of America NA | | $ | 239,444 | | | $ | (239,444 | ) | | $ | — | | | $ | — | | | $ | — | |
Barclays Bank plc | | | 41,880 | | | | (41,880 | ) | | | — | | | | — | | | | — | |
BNP Paribas | | | 9,281 | | | | (9,281 | ) | | | — | | | | — | | | | — | |
Citibank NA | | | 17,354 | | | | (17,354 | ) | | | — | | | | — | | | | — | |
Deutsche Bank Securities, Inc. | | | 34,832 | | | | (6,412 | ) | | | — | | | | — | | | | 28,420 | |
Goldman Sachs Bank USA | | | 18,999 | | | | (18,999 | ) | | | — | | | | — | | | | — | |
Goldman Sachs Group, Inc. (The) | | | 257,023 | | | | (39,272 | ) | | | (217,751 | ) | | | — | | | | — | |
HSBC Bank USA NA | | | 30,242 | | | | — | | | | — | | | | — | | | | 30,242 | |
JPMorgan Chase Bank NA | | | 413,764 | | | | (377,555 | ) | | | (31,042 | ) | | | — | | | | 5,167 | |
Morgan Stanley Capital Services, Inc. | | | 44,777 | | | | (44,777 | ) | | | — | | | | — | | | | — | |
Nomura Global Financial Products, Inc. | | | 1,294 | | | | — | | | | — | | | | — | | | | 1,294 | |
Royal Bank of Scotland plc (The) | | | 21,543 | | | | — | | | | — | | | | — | | | | 21,543 | |
| | | | |
| | $ | 1,130,433 | | | $ | (794,974 | ) | | $ | (248,793 | ) | | $ | — | | | $ | 86,666 | |
| | | | |
| * | OTC derivatives are reported gross on the Statement of Assets and Liabilities. Exchange traded options and margin related to centrally cleared swaps and futures are excluded from these reported amounts. |
| ** | Reported collateral posted for the benefit of the Fund within this table is limited to the net outstanding amount due from an individual counterparty. The collateral posted for the benefit of the Fund may exceed these amounts. |
| | | | | | | | | | | | | | | | | | | | |
| | | | | | Gross Amounts Not Offset in the Statement of Assets & Liabilities | | | | |
| Counterparty | | Gross Amount
of Liabilities in
the Statement
of Assets &
Liabilities* | | | Financial
Instruments
Available
for Offset | | | Financial
Instruments
Collateral
Pledged** | | | Cash Collateral
Pledged** | | | Net Amount | |
Bank of America NA | | $ | (398,156 | ) | | $ | 239,444 | | | $ | — | | | $ | 158,712 | | | $ | — | |
Barclays Bank plc | | | (359,626 | ) | | | 41,880 | | | | 269,967 | | | | | | | | (47,779 | ) |
BNP Paribas | | | (125,587 | ) | | | 9,281 | | | | — | | | | — | | | | (116,306 | ) |
Citibank NA | | | (34,668 | ) | | | 17,354 | | | | — | | | | — | | | | (17,314 | ) |
Deutsche Bank Securities, Inc. | | | (6,412 | ) | | | 6,412 | | | | — | | | | — | | | | — | |
Goldman Sachs Bank USA | | | (591,048 | ) | | | 18,999 | | | | 109,986 | | | | 462,063 | | | | — | |
Goldman Sachs Group, Inc. (The) | | | (39,272 | ) | | | 39,272 | | | | — | | | | — | | | | — | |
JPMorgan Chase Bank NA | | | (377,555 | ) | | | 377,555 | | | | — | | | | — | | | | — | |
53 OPPENHEIMER EMERGING MARKETS LOCAL DEBT FUND
| | | | |
| |
NOTES TO FINANCIAL STATEMENTS Continued | | |
| | |
6. Risk Exposures and the Use of Derivative Instruments (Continued) | | |
| | | | | | | | | | | | | | | | | | | | |
| | | | | | Gross Amounts Not Offset in the Statement of Assets & Liabilities (Continued) | | | | |
| | | | | | | | | | | | | | | | |
| Counterparty | | Gross Amount
of Liabilities in
the Statement
of Assets &
Liabilities* | | | Financial
Instruments
Available for
Offset | | | Financial
Instruments
Collateral
Pledged** | | | Cash Collateral
Pledged** | | | Net Amount | |
Morgan Stanley Capital Services, Inc. | | $ | (66,848 | ) | | $ | 44,777 | | | $ | 9,998 | | | $ | — | | | $ | (2,073) | |
Toronto Dominion Bank | | | (10,771 | ) | | | — | | | | — | | | | — | | | | (10,771) | |
| | | | |
| | $ | (2,009,943 | ) | | $ | 794,974 | | | $ | 399,951 | | | $ | 620,775 | | | $ | (194,243) | |
| | | | |
* OTC derivatives are reported gross on the Statement of Assets and Liabitlies. Exchange traded options and margin related to centrally cleared swaps and futures are excluded from these reported amounts.
** Reported collateral pledged within this table is limited to the net outstanding amount due from the Fund. The securities pledged as collateral by the Fund as reported on the Statement of Investments may exceed these amounts.
The following table presents the valuations of derivative instruments by risk exposure as reported within the Statement of Assets and Liabilities as of May 30, 2014:
| | | | | | | | | | | | | | |
| | | Asset Derivatives | | | | | Liability Derivatives | |
Derivatives Not Accounted for as Hedging Instruments | | Statement of Assets and Liabilities Location | | Value | | | | | Statement of Assets and Liabilities Location | | Value | |
Interest rate contracts | | Swaps, at value | | $ | 288,466 | | | | | | | | | |
Currency contracts | | Swaps, at value | | | 213,991 | | | | | | | | | |
Interest rate contracts | | | | | | | | | | Centrally cleared swaps, at value | | $ | 93,661 | |
| | Unrealized appreciation on | | | | | | | | Unrealized depreciation on foreign | | | | |
Foreign exchange contracts | | foreign currency exchange contracts | | | 496,066 | | | | | currency exchange contracts | | | 1,915,550 | |
Foreign exchange contracts | | | | | | | | | | Options written, at value | | | 94,393 | |
Foreign exchange contracts Total | | Investments, at value | | | 131,910 | * | | | | | | | | |
| | | | | | | | | | | | | | |
| | | | $ | 1,130,433 | | | | | | | $ | 2,103,604 | |
| | | | | | | | | | | | | | |
| *Amount | relates to purchased option contracts. |
The effect of derivative instruments on the Statement of Operations is as follows:
54 OPPENHEIMER EMERGING MARKETS LOCAL DEBT FUND
| | | | |
| | |
| | | | |
| |
| 6. Risk Exposures and the Use of Derivative Instruments (Continued) | | |
| | | | | | | | | | | | | | | | | | | | | | | | | | | | |
| Amount of Realized Gain or (Loss) Recognized on Derivatives | |
Derivatives Not Accounted for as Hedging Instruments | | Investment
from
unaffiliated
companies
(including
premiums
on options
exercised)* | | | Closing and
expiration
of swaption
contracts
written | | | Closing
and
expiration
of option
contracts
written | | | Closing
and
expiration
of futures
contracts | | | Foreign
currency
transactions | | | Swap
contracts | | | Total | |
Credit contracts | | $ | — | | | $ | — | | | $ | — | | | $ | — | | | $ | — | | | $ | (12,362 | ) | | $ | (12,362 | ) |
Foreign exchange contracts | | | 436,834 | | | | — | | | | 53,624 | | | | — | | | | (362,235 | ) | | | (1,648 | ) | | | 126,575 | |
Interest rate contracts | | | 236,744 | | | | (102,716 | ) | | | — | | | | 380,207 | | | | — | | | | (335,977 | ) | | | 178,258 | |
| | | | |
Total | | $ | 673,578 | | | $ | (102,716) | | | $ | 53,624 | | | $ | 380,207 | | | $ | (362,235 | ) | | $ | (349,987 | ) | | $ | 292,471 | |
| | | | |
| * | Includes purchased option contracts, purchased swaption contracts and written swaption and option contacts exercised, if any. |
| | | | | | | | | | | | | | | | | | | | | | | | | | | | |
| Amount of Change in Unrealized Gain or (Loss) Recognized on Derivatives | |
Derivatives Not Accounted for as Hedging Instruments | | Investments* | | | Option
contracts
written | | | Swaption
contracts
written | | | Futures
contracts | | | Translation of
assets and
liabilities
denominated in
foreign currencies | | | Swap
contracts | | | Total | |
Foreign exchange contracts | | $ | 37,195 | | | $ | 53,191 | | | $ | — | | | $ | — | | | $ | (1,590,827) | | | $ | 213,991 | | | $ | (1,286,450) | |
Interest rate contracts | | | (32,410) | | | | — | | | | 76,573 | | | | (131,985) | | | | — | | | | 77,216 | | | | (10,606) | |
| | | | |
Total | | $ | 4,785 | | | $ | 53,191 | | | $ | 76,573 | | | $ | (131,985) | | | $ | (1,590,827) | | | $ | 291,207 | | | $ | (1,297,056) | |
| | | | |
| * | Includes purchased option contracts and purchased swaption contracts, if any. |
7. Pending Litigation
Since 2009, seven class action lawsuits have been pending in the U.S. District Court for the District of Colorado against OppenheimerFunds, Inc. (“OFI”), OppenheimerFunds Distributor, Inc., the Fund’s principal underwriter and distributor (the “Distributor”), and certain funds (but not including the Fund) advised by OFI Global Asset Management, Inc. and distributed by the Distributor (the “Defendant Funds”). The lawsuits also name as defendants certain officers and current and former trustees of the respective Defendant Funds. The lawsuits raise claims under federal securities law and allege, among other things, that the disclosure documents of the respective Defendant Funds contained misrepresentations and omissions and that the respective Defendant Funds’ investment policies were not followed. The plaintiffs in these actions seek unspecified damages, equitable relief and awards of attorneys’ fees and litigation expenses. The Defendant Funds’ Boards of Trustees have also engaged counsel to represent the Funds and the present and former Independent Trustees named in those suits. On March 5, 2014, the parties in six of these lawsuits executed stipulations and agreements of settlement resolving those actions. The settlements are subject to a variety of
55 OPPENHEIMER EMERGING MARKETS LOCAL DEBT FUND
| | | | |
| |
NOTES TO FINANCIAL STATEMENTS Continued | | |
| | |
7. Pending Litigation (Continued) | | |
contingencies, including approval by the court. The settlements do not resolve a seventh outstanding lawsuit relating to Oppenheimer Rochester California Municipal Fund.
Other class action and individual lawsuits have been filed since 2008 in various state and federal courts against OFI and certain of its affiliates by investors seeking to recover investments they allegedly lost as a result of the “Ponzi” scheme run by Bernard L. Madoff and his firm, Bernard L. Madoff Investment Securities, LLC (“BLMIS”). Plaintiffs in these suits allege that they suffered losses as a result of their investments in several funds managed by an affiliate of OFI and assert a variety of claims, including breach of fiduciary duty, fraud, negligent misrepresentation, unjust enrichment, and violation of federal and state securities laws and regulations, among others. They seek unspecified damages, equitable relief and awards of attorneys’ fees and litigation expenses. Neither the Distributor, nor any of the Oppenheimer mutual funds, their independent trustees or directors are named as defendants in these lawsuits. None of the Oppenheimer mutual funds invested in any funds or accounts managed by Madoff or BLMIS. On February 28, 2011, a stipulation of partial settlement of three groups of consolidated putative class action lawsuits relating to these matters was filed in the U.S. District Court for the Southern District of New York. On August 19, 2011, the court entered an order and final judgment approving the settlement as fair, reasonable and adequate. In September 2011, certain parties filed notices of appeal from the court’s order approving the settlement. The settlement does not resolve other outstanding lawsuits against OFI and its affiliates relating to BLMIS.
In May 2014, certain current and/or former participants in 529 plans managed by OFI Private Investments, Inc. (“OFIPI”), an affiliate of OFI, filed a lawsuit in New Mexico state court against OFI, OFIPI and the Distributor. Plaintiffs in this suit allege that they are assignees of indemnification claims The Education Trust Board of New Mexico, The Education Plan Trust of New Mexico, and the State of New Mexico (collectively, the “State”) have or may have against defendants for losses the State incurred in connection with a class action lawsuit plaintiffs previously brought against the State. On the basis of the alleged assignment of the State’s indemnification claims, plaintiffs seek unspecified damages, equitable relief and an award of attorneys’ fees and litigation expenses.
OFI believes the lawsuits and appeals described above are without legal merit and, with the exception of actions it has settled, is defending against them vigorously. While it is premature to render any opinion as to the outcome in these lawsuits, or whether any costs that the Defendant Funds may bear in defending the suits might not be reimbursed by insurance, OFI believes that these suits should not impair the ability of OFI or the Distributor to perform their respective duties to the Fund, and that the outcome of all of the suits together should not have any material effect on the operations of any of the Oppenheimer mutual funds.
56 OPPENHEIMER EMERGING MARKETS LOCAL DEBT FUND
| | | | |
| |
REPORT OF INDEPENDENT REGISTERED PUBLIC ACCOUNTING FIRM | | |
|
The Board of Trustees and Shareholders of Oppenheimer Emerging Markets Local Debt Fund:
We have audited the accompanying statement of assets and liabilities of Oppenheimer Emerging Markets Local Debt Fund, formerly Oppenheimer Emerging Markets Debt Fund, including the statement of investments, as of May 30, 2014, and the related statement of operations for the year then ended, the statements of changes in net assets for each of the years in the two-year period then ended, and the financial highlights for each of the years or periods in the three-year period then ended and for the period June 30, 2010 (commencement of operations) to May 31, 2011. These financial statements and financial highlights are the responsibility of the Fund’s management. Our responsibility is to express an opinion on these financial statements and financial highlights based on our audits.
We conducted our audits in accordance with the standards of the Public Company Accounting Oversight Board (United States). Those standards require that we plan and perform the audit to obtain reasonable assurance about whether the financial statements and financial highlights are free of material misstatement. An audit includes examining, on a test basis, evidence supporting the amounts and disclosures in the financial statements. Our procedures included confirmation of securities owned as of May 30, 2014, by correspondence with the custodian, transfer agent and brokers, or by other appropriate auditing procedures where replies from brokers were not received. An audit also includes assessing the accounting principles used and significant estimates made by management, as well as evaluating the overall financial statement presentation. We believe that our audits provide a reasonable basis for our opinion.
In our opinion, the financial statements and financial highlights referred to above present fairly, in all material respects, the financial position of Oppenheimer Emerging Markets Local Debt Fund as of May 30, 2014, the results of its operations for the year then ended, the changes in its net assets for each of the years in the two-year period then ended and the financial highlights for each of the years or periods in the three-year period then ended and for the period from June 30, 2010 (commencement of operations) to May 31, 2011, in conformity with U.S. generally accepted accounting principles.
KPMG LLP
Denver, Colorado
July 15, 2014
57 OPPENHEIMER EMERGING MARKETS LOCAL DEBT FUND
| | | | |
| |
| FEDERAL INCOME TAX INFORMATION Unaudited | | |
| |
In early 2014, if applicable, shareholders of record received information regarding all dividends and distributions paid to them by the Fund during calendar year 2013.
Capital gain distributions of $0.15107 per share were paid to Class A, Class B, Class C, Class N and Class Y shareholders, respectively, on December 30, 2013. Whether received in stock or in cash, the capital gain distribution should be treated by shareholders as a gain from the sale of the capital assets held for more than one year (long-term capital gains).
None of the dividends paid by the Fund during the fiscal year ended May 30, 2014 are eligible for the corporate dividend-received deduction.
Dividends, if any, paid by the Fund during the fiscal year ended May 30, 2014 which are not designated as capital gain distributions, may be eligible for lower individual income tax rates to the extent that the Fund has received qualified dividend income as stipulated by recent tax legislation. In early 2014, shareholders of record received information regarding the percentage of distributions that are eligible for lower individual income tax rates. The amount will be the maximum amount allowed.
Recent tax legislation allows a regulated investment company to designate distributions not designated as capital gain distributions, as either interest related dividends or short-term capital gain dividends, both of which are exempt from the U.S. withholding tax applicable to non U.S. taxpayers. For the fiscal year ended May 30, 2014, the maximum amount allowable but not less than $237,289 of the ordinary distributions to be paid by the Fund qualifies as an interest related dividend.
The foregoing information is presented to assist shareholders in reporting distributions received from the Fund to the Internal Revenue Service. Because of the complexity of the federal regulations which may affect your individual tax return and the many variations in state and local tax regulations, we recommend that you consult your tax advisor for specific guidance.
58 OPPENHEIMER EMERGING MARKETS LOCAL DEBT FUND
| | | | |
| |
PORTFOLIO PROXY VOTING POLICIESAND PROCEDURES; UPDATES TO STATEMENTS OF INVESTMENTS Unaudited | | |
| | | | |
The Fund has adopted Portfolio Proxy Voting Policies and Procedures under which the Fund votes proxies relating to securities (“portfolio proxies”) held by the Fund. A description of the Fund’s Portfolio Proxy Voting Policies and Procedures is available (i) without charge, upon request, by calling the Fund toll-free at 1.800.CALL OPP (225.5677), (ii) on the Fund’s website at oppenheimerfunds.com, and (iii) on the SEC’s website at www.sec.gov. In addition, the Fund is required to file Form N-PX, with its complete proxy voting record for the 12 months ended June 30th, no later than August 31st of each year. The Fund’s voting record is available (i) without charge, upon request, by calling the Fund toll-free at 1.800.CALL OPP (225.5677), and (ii) in the Form N-PX filing on the SEC’s website at www.sec.gov.
The Fund files its complete schedule of portfolio holdings with the SEC for the first quarter and the third quarter of each fiscal year on Form N-Q. The Fund’s Form N-Q filings are available on the SEC’s website at www.sec.gov. Those forms may be reviewed and copied at the SEC’s Public Reference Room in Washington, D.C. Information on the operation of the Public Reference Room may be obtained by calling 1-800-SEC-0330.
Householding—Delivery of Shareholder Documents
This is to inform you about OppenheimerFunds’ “householding” policy. If more than one member of your household maintains an account in a particular fund, OppenheimerFunds will mail only one copy of the fund’s prospectus (or, if available, the fund’s summary prospectus), annual and semiannual report and privacy policy. The consolidation of these mailings, called householding, benefits your fund through reduced mailing expense, and benefits you by reducing the volume of mail you receive from OppenheimerFunds. Householding does not affect the delivery of your account statements.
Please note that we will continue to household these mailings for as long as you remain an OppenheimerFunds shareholder, unless you request otherwise. If you prefer to receive multiple copies of these materials, please call us at 1.800.CALL-OPP (225-5677). You may also notify us in writing or via email. We will begin sending you individual copies of the prospectus (or, if available, the summary prospectus), reports and privacy policy within 30 days of receiving your request to stop householding.
59 OPPENHEIMER EMERGING MARKETS LOCAL DEBT FUND
| | | | |
| |
| TRUSTEES AND OFFICERS Unaudited | | |
| | | | |
| | |
Name, Position(s) Held with the Funds, Length of Service, Year of Birth | | Principal Occupation(s) During the Past 5 Years; Other Trusteeships/Directorships Held; Number of Portfolios in the Funds Complex Currently Overseen |
| |
| INDEPENDENT TRUSTEES | | The address of each Trustee in the chart below is 6803 S. Tucson Way, Centennial, Colorado 80112-3924. Each Trustee serves for an indefinite term, or until his or her resignation, retirement, death or removal. |
| |
Sam Freedman, Chairman of the Board of Trustees (since 2012) and Trustee (since 2010) Year of Birth: 1940 | | Director of Colorado UpLIFT (charitable organization) (since September 1984). Mr. Freedman held several positions with the Sub-Adviser and with subsidiary or affiliated companies of the Sub-Adviser (until October 1994). Oversees 39 portfolios in the OppenheimerFunds complex. Mr. Freedman has served on the Boards of certain Oppenheimer funds since 1996, during which time he has become familiar with the Fund’s (and other Oppenheimer funds’) financial, accounting, regulatory and investment matters and has contributed to the Boards’ deliberations. |
| |
Edward L. Cameron, Trustee (since 2010) Year of Birth: 1938 | | Member of The Life Guard of Mount Vernon (George Washington historical site) (June 2000-June 2006); Partner of PricewaterhouseCoopers LLP (accounting firm) (July 1974-June 1999); Chairman of Price Waterhouse LLP Global Investment Management Industry Services Group (accounting firm) (July 1994-June 1998). Oversees 39 portfolios in the OppenheimerFunds complex. Mr. Cameron has served on the Boards of certain Oppenheimer funds since 1999, during which time he has become familiar with the Fund’s (and other Oppenheimer funds’) financial, accounting, regulatory and investment matters and has contributed to the Boards’ deliberations. |
| |
Jon S. Fossel, Trustee (since 2010) Year of Birth: 1942 | | Chairman of the Board (2006-December 2011) and Director (June 2002-December 2011) of UNUMProvident (insurance company); Director of Northwestern Energy Corp. (public utility corporation) (November 2004-December 2009); Director of P.R. Pharmaceuticals (October 1999-October 2003); Director of Rocky Mountain Elk Foundation (non-profit organization) (February 1998-February 2003 and February 2005-February 2007); Chairman and Director (until October 1996) and President and Chief Executive Officer (until October 1995) of the Sub-Adviser; President, Chief Executive Officer and Director of the following: Oppenheimer Acquisition Corp. (“OAC”) (parent holding company of the Sub-Adviser), Shareholders Services, Inc. and Shareholder Financial Services, Inc. (until October 1995). Oversees 39 portfolios in the OppenheimerFunds complex. Mr. Fossel has served on the Boards of certain Oppenheimer funds since 1990, during which time he has become familiar with the Fund’s (and other Oppenheimer funds’) financial, accounting, regulatory and investment matters and has contributed to the Boards’ deliberations. |
| |
Richard F. Grabish, Trustee (since 2010) Year of Birth: 1948 | | Formerly Senior Vice President and Assistant Director of Sales and Marketing (March 1997-December 2007), Director (March 1987-December 2007) and Manager of Private Client Services (June 1985-June 2005) of A.G. Edwards & Sons, Inc. (broker/dealer and investment firm); Chairman and Chief Executive Officer of A.G. Edwards Trust Company, FSB (March 2001-December 2007); President and Vice Chairman of A.G. Edwards Trust Company, FSB (investment adviser) (April 1987-March 2001); President of A.G. Edwards Trust Company, FSB (investment adviser) (June 2005-December 2007). |
60 OPPENHEIMER EMERGING MARKETS LOCAL DEBT FUND
| | |
Richard F. Grabish, Continued | | Oversees 39 portfolios in the OppenheimerFunds complex. Mr. Grabish has served on the Boards of certain Oppenheimer funds since 2001, during which time he has become familiar with the Fund’s (and other Oppenheimer funds’) financial, accounting, regulatory and investment matters and has contributed to the Boards’ deliberations. |
| |
Beverly L. Hamilton, Trustee (since 2010) Year of Birth: 1946 | | Trustee of Monterey Institute for International Studies (educational organization) (since February 2000); Board Member of Middlebury College (educational organization) (December 2005-June 2011); Chairman (since 2010) of American Funds’ Emerging Markets Growth Fund, Inc. (mutual fund); Director of The California Endowment (philanthropic organization) (April 2002-April 2008); Director (February 2002-2005) and Chairman of Trustees (2006-2007) of the Community Hospital of Monterey Peninsula; Director (October 1991-2005); Vice Chairman (2006-2009) of American Funds’ Emerging Markets Growth Fund, Inc. (mutual fund); President of ARCO Investment Management Company (February 1991-April 2000); Member of the investment committees of The Rockefeller Foundation (2001-2006) and The University of Michigan (since 2000); Advisor at Credit Suisse First Boston’s Sprout venture capital unit (venture capital fund) (1994-January 2005); Trustee of MassMutual Institutional Funds (investment company) (1996-June 2004); Trustee of MML Series Investment Fund (investment company) (April 1989-June 2004); Member of the investment committee of Hartford Hospital (2000-2003); and Advisor to Unilever (Holland) pension fund (2000-2003). Oversees 39 portfolios in the OppenheimerFunds complex. Ms. Hamilton has served on the Boards of certain Oppenheimer funds since 2002, during which time she has become familiar with the Fund’s (and other Oppenheimer funds’) financial, accounting, regulatory and investment matters and has contributed to the Boards’ deliberations. |
| |
Victoria J. Herget, Trustee (since 2012) Year of Birth:1951 | | Independent Director of the First American Funds (mutual fund family) (2003-2011); former Managing Director (1993-2001), Principal (1985-1993), Vice President (1978-1985) and Assistant Vice President (1973-1978) of Zurich Scudder Investments (and its predecessor firms); Board Chair (2008-Present) and Director (2004-Present), United Educators (insurance company); Trustee (1992-2007), Chair of the Board of Trustees (1999-2007), Investment Committee Chair (1994-1999) and Investment Committee member (2007-2010) of Wellesley College; Trustee (since 2000) and Chair (since 2010), Newberry Library; Trustee, Mather LifeWays (since 2001); Trustee, BoardSource (2006-2009) and Chicago City Day School (1994-2005). Oversees 39 portfolios in the OppenheimerFunds complex. Ms. Herget has served on the Boards of certain Oppenheimer funds since 2012, during which time she has become familiar with the Fund’s (and other Oppenheimer funds’) financial, accounting, regulatory and investment matters and has contributed to the Boards’ deliberations. |
| |
Robert J. Malone, Trustee (since 2010) Year of Birth: 1944 | | Chairman of the Board (since 2012) and Director (since August 2005) of Jones International University (educational organization) (since August 2005); Chairman, Chief Executive Officer and Director of Steele Street Bank Trust (commercial banking) (since August 2003); Trustee of the Gallagher Family Foundation (non-profit organization) (since 2000); Board of Directors of Opera Colorado Foundation (non-profit organization) (2008-2012); Director of Colorado UpLIFT (charitable organization) (1986-2010); Director of Jones Knowledge, Inc. (2006-2010); Former Chairman of U.S. Bank-Colorado |
61 OPPENHEIMER EMERGING MARKETS LOCAL DEBT FUND
| | |
Robert J. Malone, Continued | | (subsidiary of U.S. Bancorp and formerly Colorado National Bank) (July 1996-April 1999); Director of Commercial Assets, Inc. (real estate investment trust) (1993-2000); Director of U.S. Exploration, Inc. (oil and gas exploration) (1997-February 2004); Chairman of the Board (1991-1994) and Trustee (1985-1994) of Regis University; and Chairman of the Board (1990-1991 and Trustee (1984-1999) of Young Presidents Organization. Oversees 39 portfolios in the OppenheimerFunds complex. Mr. Malone has served on the Boards of certain Oppenheimer funds since 2002, during which time he has become familiar with the Fund’s (and other Oppenheimer funds’) financial, accounting, regulatory and investment matters and has contributed to the Boards’ deliberations. |
| |
F. William Marshall, Jr., Trustee (since 2010) Year of Birth: 1942 | | Trustee Emeritus of Worcester Polytech Institute (WPI) (private university) (since 2009); Trustee of MassMutual Select Funds (formerly MassMutual Institutional Funds) (investment company) (since 1996), MML Series Investment Fund (investment company) (since 1996) and Mass Mutual Premier Funds (investment company) (since January 2012); President and Treasurer of the SIS Fund (private charitable fund) (January 1999 – March 2011); Former Trustee of WPI (1985-2008); Former Chairman of the Board (2004-2006) and Former Chairman of the Investment Committee of WPI (1994-2008); Chairman of SIS & Family Bank, F.S.B. (formerly SIS Bank) (commercial bank) (January 1999-July 1999); Executive Vice President of Peoples Heritage Financial Group, Inc. (commercial bank) (January 1999-July 1999); and Former President and Chief Executive Officer of SIS Bancorp. (1993-1999). Oversees 43 portfolios in the OppenheimerFunds complex. Mr. Marshall has served on the Boards of certain Oppenheimer funds since 2000, during which time he has become familiar with the Fund’s (and other Oppenheimer funds’) financial, accounting, regulatory and investment matters and has contributed to the Boards’ deliberations. |
| |
Karen L. Stuckey, Trustee (since 2012) Year of Birth: 1953 | | Partner (1990-2012) of PricewaterhouseCoopers LLP (held various positions 1975-1990); Emeritus Trustee (since 2006), Trustee (1992-2006) and member of Executive, Nominating and Audit Committees and Chair of Finance Committee of Lehigh University; and member, Women’s Investment Management Forum since inception. Oversees 39 portfolios in the OppenheimerFunds complex. Ms. Stuckey has served on the Boards of certain Oppenheimer funds since 2012, during which time she has become familiar with the Fund’s (and other Oppenheimer funds’) financial, accounting, regulatory and investment matters and has contributed to the Boards’ deliberations. |
| |
James D. Vaughn, Trustee (since 2012) Year of Birth:1945 | | Retired; former managing partner (1994-2001) of Denver office of Deloitte & Touche LLP, (held various positions 1969-1993); Trustee and Chairman of the Audit Committee of Schroder Funds (2003-2012); Board member and Chairman of Audit Committee of AMG National Trust Bank (since 2005); Trustee and Investment Committee member, University of South Dakota Foundation (since 1996); Board member, Audit Committee Member and past Board Chair, Junior Achievement (since 1993); former Board member, Mile High United Way, Boys and Girls Clubs, Boy Scouts, Colorado Business Committee for the Arts, Economic Club of Colorado and Metro Denver Network. Oversees 39 portfolios in the OppenheimerFunds complex. Mr. Vaughn has served on the Boards of certain Oppenheimer funds since 2012, during which time he has become familiar with the Fund’s (and other Oppenheimer funds’) financial, accounting, regulatory and investment matters and has contributed to the Boards’ deliberations. |
62 OPPENHEIMER EMERGING MARKETS LOCAL DEBT FUND
| | |
INTERESTED TRUSTEE AND OFFICER | | Mr. Glavin is an “Interested Trustee” because he is affiliated with the Manager and the Sub-Adviser by virtue of his positions as an officer and director of the Manager and a director of the Sub-Adviser, and as a shareholder of the Sub-Adviser’s parent company. Both as a Trustee and as an officer, he serves for an indefinite term, or until his resignation, retirement, death or removal. Mr. Glavin’s address is 225 Liberty Street, 11th Floor, New York, New York 10281-1008. |
| |
William F. Glavin, Jr., Trustee, President and Principal Executive Officer (since 2010) Year of Birth: 1958 | | Director, Chairman and Chief Executive Officer of the Manager (since January 2013); President of the Manager (January 2013-May 2013); Chairman of the Sub-Adviser (December 2009-December 2012); Chief Executive Officer (January 2009-December 2012) and Director of the Sub-Adviser (since January 2009); President of the Sub-Adviser (May 2009-December 2012); Management Director (since June 2009), President (since December 2009) and Chief Executive Officer (since January 2011) of Oppenheimer Acquisition Corp. (“OAC”) (the Sub-Adviser’s parent holding company); Director of Oppenheimer Real Asset Management, Inc. (since March 2010); Executive Vice President (March 2006-February 2009) and Chief Operating Officer (July 2007-February 2009) of Massachusetts Mutual Life Insurance Company (OAC’s parent company); Director (May 2004-March 2006) and Chief Operating Officer and Chief Compliance Officer (May 2004-January 2005), President (January 2005-March 2006) and Chief Executive Officer (June 2005-March 2006) of Babson Capital Management LLC; Director (March 2005-March 2006), President (May 2003-March 2006) and Chief Compliance Officer (July 2005-March 2006) of Babson Capital Securities, Inc. (a broker-dealer); President (May 2003-March 2006) of Babson Investment Company, Inc.; Director (May 2004-August 2006) of Babson Capital Europe Limited; Director (May 2004-October 2006) of Babson Capital Guernsey Limited; Director (May 2004-March 2006) of Babson Capital Management LLC; Non-Executive Director (March 2005-March 2007) of Baring Asset Management Limited; Director (February 2005-June 2006) Baring Pension Trustees Limited; Director and Treasurer (December 2003-November 2006) of Charter Oak Capital Management, Inc.; Director (May 2006-September 2006) of C.M. Benefit Insurance Company; Director (May 2008-June 2009) and Executive Vice President (June 2007-July 2009) of C.M. Life Insurance Company; President (March 2006-May 2007) of MassMutual Assignment Company; Director (January 2005-December 2006), Deputy Chairman (March 2005-December 2006) and President (February 2005-March 2005) of MassMutual Holdings (Bermuda) Limited; Director (May 2008-June 2009) and Executive Vice President (June 2007-July 2009) of MML Bay State Life Insurance Company; Chief Executive Officer and President (April 2007-January 2009) of MML Distributors, LLC; and Chairman (March 2006-December 2008) and Chief Executive Officer (May 2007-December 2008) of MML Investors Services, Inc. An officer of 91 portfolios in the OppenheimerFunds complex. |
| | |
| OTHER OFFICERS OF THE FUND | | The addresses of the Officers in the chart below are as follows: for Mr. Gabinet and Mss. Zervos, Nasta and Picciotto, 225 Liberty Street, New York, New York 10281-1008, for Mr. Wixted, 6803 S. Tucson Way, Centennial, Colorado 80112-3924. Each Officer serves for an indefinite term or until his or her resignation, retirement, death or removal. |
63 OPPENHEIMER EMERGING MARKETS LOCAL DEBT FUND
| | |
Sara J. Zervos, Ph.D., Vice President (since 2010) Year of Birth:1969 | | Senior Vice President of the Sub-Adviser (since January 2011); Head of the Global Debt Team (since October 2010) and the team’s Director of International Research. Ms. Zervos serves on the Board of the Emerging Market Trade Association (EMTA) (since January 2014) and is a member of the Federal Reserve Bank of New York Foreign Exchange Committee (since January 2014). Vice President of the Sub-Adviser (April 2008-December 2010). Portfolio manager with Sailfish Capital Management (May 2007-February 2008) and a portfolio manager for emerging market debt at Dillon Read Capital Management and OTA Asset Management (June 2004-April 2007). A portfolio manager and officer of other portfolios in the OppenheimerFunds complex. |
| |
Arthur S. Gabinet, Secretary and Chief Legal Officer (since 2011) Year of Birth: 1958 | | Executive Vice President, Secretary and General Counsel of the Manager (since January 2013); General Counsel OFI SteelPath, Inc. (since January 2013); Executive Vice President (May 2010-December 2012) and General Counsel (since January 2011) of the Sub-Adviser; General Counsel of the Distributor (since January 2011); General Counsel of Centennial Asset Management Corporation (January 2011-December 2012); Executive Vice President (January 2011-December 2012) and General Counsel of HarbourView Asset Management Corporation (since January 2011); Assistant Secretary (since January 2011) and Director (since January 2011) of OppenheimerFunds International Ltd. and OppenheimerFunds plc; Director of Oppenheimer Real Asset Management, Inc. (January 2011-December 2012) and General Counsel (since January 2011); Executive Vice President (January 2011-December 2011) and General Counsel of Shareholder Financial Services, Inc. and Shareholder Services, Inc. (since January 2011); Executive Vice President (January 2011-December 2012) and General Counsel of OFI Private Investments Inc. (since January 2011); Vice President of OppenheimerFunds Legacy Program (January 2011-December 2011); Executive Vice President (January 2011-December 2012) and General Counsel of OFI Institutional Asset Management, Inc. (since January 2011); General Counsel, Asset Management of the Sub-Adviser (May 2010-December 2010); Principal, The Vanguard Group (November 2005-April 2010); District Administrator, U.S. Securities and Exchange Commission (January 2003-October 2005). An officer of 91 portfolios in the OppenheimerFunds complex. |
| |
Christina M. Nasta, Vice President and Chief Business Officer (since 2011) Year of Birth: 1973 | | Senior Vice President of OppenheimerFunds Distributor, Inc. (since January 2013); Senior Vice President of the Sub-Adviser (July 2010-December 2012); Vice President of the Sub-Adviser (January 2003-July 2010); Vice President of OppenheimerFunds Distributor, Inc. (January 2003-July 2010). An officer of 91 portfolios in the OppenheimerFunds complex. |
| |
Mary Ann Picciotto, Chief Compliance Officer and Chief Anti-Money Laundering Officer (since 2014) Year of Birth: 1973 | | Senior Vice President and Chief Compliance Officer of the Manager (since March 2014); Chief Compliance Officer of the Sub-Adviser, OFI SteelPath, Inc., OFI Global Trust Company, OFI Global Institutional, Inc., Oppenheimer Real Asset Management, Inc., OFI Private Investments, Inc., Harborview Asset Management Corporation, Trinity Investment Management Corporation, and Shareholder Services, Inc. (since March 2014); Managing Director of Morgan Stanley Investment Management Inc. and certain of its various affiliated entities; Chief Compliance Officer of various Morgan Stanley Funds (May 2010-January 2014); Chief Compliance Officer of Morgan Stanley Investment Management Inc. (April 2007-January 2014). An officer of 91 portfolios in the OppenheimerFunds complex. |
64 OPPENHEIMER EMERGING MARKETS LOCAL DEBT FUND
| | |
Brian W. Wixted, Treasurer and Principal Financial & Accounting Officer (since 2010) Year of Birth: 1959 | | Senior Vice President of the Manager (since January 2013); Treasurer of the Sub-Adviser, HarbourView Asset Management Corporation, Shareholder Financial Services, Inc., Shareholder Services, Inc., and Oppenheimer Real Asset Management, Inc. (March 1999-June 2008), OFI Private Investments, Inc. (March 2000-June 2008), OppenheimerFunds International Ltd. and OppenheimerFunds plc (since May 2000), OFI Institutional Asset Management, Inc. (November 2000-June 2008), and OppenheimerFunds Legacy Program (charitable trust program established by the Sub-Adviser) (June 2003-December 2011); Treasurer and Chief Financial Officer of OFI Trust Company (since May 2000); Assistant Treasurer of Oppenheimer Acquisition Corporation (March 1999-June 2008). An officer of 91 portfolios in the OppenheimerFunds complex. |
The Fund’s Statement of Additional Information contains additional information about the Fund’s Trustees and Officers and is available without charge upon request, by calling 1.800.CALL OPP (225.5677).
65 OPPENHEIMER EMERGING MARKETS LOCAL DEBT FUND
OPPENHEIMER EMERGING MARKETS LOCAL DEBT FUND
| | |
| Manager | | OFI Global Asset Management, Inc. |
| |
| Sub-Adviser | | OppenheimerFunds, Inc. |
| |
| Distributor | | OppenheimerFunds Distributor, Inc. |
| |
| Transfer and Shareholder Servicing Agent | | OFI Global Asset Management, Inc. |
| |
| Sub-Transfer Agent | | Shareholder Services, Inc. DBA OppenheimerFunds Services |
| |
| Independent Registered Public Accounting Firm | | KPMG LLP |
| |
| Counsel | | K&L Gates LLP |
© 2014 OppenheimerFunds, Inc. All rights reserved.
66 OPPENHEIMER EMERGING MARKETS LOCAL DEBT FUND
PRIVACY POLICY NOTICE
As an Oppenheimer fund shareholder, you are entitled to know how we protect your personal information and how we limit its disclosure.
Information Sources
We obtain nonpublic personal information about our shareholders from the following sources:
| | • | | Applications or other forms |
| | • | | When you create a user ID and password for online account access |
| | • | | When you enroll in eDocs Direct, our electronic document delivery service |
| | • | | Your transactions with us, our affiliates or others |
| | • | | A software program on our website, often referred to as a “cookie,” which indicates which parts of our site you’ve visited |
| | • | | When you set up challenge questions to reset your password online |
If you visit oppenheimerfunds.com and do not log on to the secure account information areas, we do not obtain any personal information about you. When you do log on to a secure area, we do obtain your user ID and password to identify you. We also use this information to provide you with products and services you have requested, to inform you about products and services that you may be interested in and assist you in other ways.
We do not collect personal information through our website unless you willingly provide it to us, either directly by email or in those areas of the website that request information. In order to update your personal information (including your mailing address, email address and phone number) you must first log on and visit your user profile.
If you have set your browser to warn you before accepting cookies, you will receive the warning message with each cookie. You can refuse cookies by turning them off in your browser. However, doing so may limit your access to certain sections of our website.
We use cookies to help us improve and manage our website. For example, cookies help us recognize new versus repeat visitors to the site, track the pages visited, and enable some special features on the website. This data helps us provide a better service for our website visitors.
Protection of Information
We do not disclose any non-public personal information (such as names on a customer list) about current or former customers to anyone, except as permitted by law.
Disclosure of Information
We send your financial advisor (as designated by you) copies of confirmations, account statements and other documents reporting activity in your fund accounts. We may also use details about you and your investments to help us, our financial service affiliates, or firms that jointly market their financial products and services with ours, to better serve your investment needs or suggest financial services or educational material that may be of interest to you. If this requires us to provide you with an opportunity to “opt in” or “opt out” of such information sharing with a firm not affiliated with us, you will receive notification on how to do so, before any such sharing takes place.
Right of Refusal
We will not disclose your personal information to unaffiliated third parties (except as permitted by law), unless we first offer you a reasonable opportunity to refuse or “opt out” of such disclosure.
67 OPPENHEIMER EMERGING MARKETS LOCAL DEBT FUND
| | | | |
| |
| PRIVACY POLICY NOTICE Continued | | |
Internet Security and Encryption
In general, the email services provided by our website are encrypted and provide a secure and private means of communication with us. To protect your own privacy, confidential and/or personal information should only be communicated via email when you are advised that you are using a secure website.
As a security measure, we do not include personal or account information in non-secure emails, and we advise you not to send such information to us in non-secure emails. Instead, you may take advantage of the secure features of our website to encrypt your email correspondence. To do this, you will need to use a browser that supports Secure Sockets Layer (SSL) protocol.
We do not guarantee or warrant that any part of our website, including files available for download, are free of viruses or other harmful code. It is your responsibility to take appropriate precautions, such as use of an anti-virus software package, to protect your computer hardware and software.
| • | | All transactions, including redemptions, exchanges and purchases, are secured by SSL and 128-bit encryption. SSL is used to establish a secure connection between your PC and OppenheimerFunds’ server. It transmits information in an encrypted and scrambled format. |
| • | | Encryption is achieved through an electronic scrambling technology that uses a “key” to code and then decode the data. Encryption acts like the cable converter box you may have on your television set. It scrambles data with a secret code so that no one can make sense of it while it is being transmitted. When the data reaches its destination, the same software unscrambles the data. |
| • | | You can exit the secure area by either closing your browser, or for added security, you can use the Log Out button before you close your browser. |
Other Security Measures
We maintain physical, electronic and procedural safeguards to protect your personal account information. Our employees and agents have access to that information only so that they may offer you products or provide services, for example, when responding to your account questions.
How You Can Help
You can also do your part to keep your account information private and to prevent unauthorized transactions. If you obtain a user ID and password for your account, do not allow it to be used by anyone else. Also, take special precautions when accessing your account on a computer used by others.
Who We Are
This joint notice describes the privacy policies of the Oppenheimer funds, OppenheimerFunds, Inc., and each of its investment adviser subsidiaries, OppenheimerFunds Distributor, Inc. and OFI Global Trust Co. It applies to all Oppenheimer fund accounts you presently have, or may open in the future, using your Social Security number—whether or not you remain a shareholder of our funds. This notice was last updated November 2013. In the event it is updated or changed, we will post an updated notice on our website at oppenheimerfunds.com. If you have any questions about these privacy policies, write to us at P.O. Box 5270, Denver, CO 80217-5270, email us by clicking on the Contact Us section of our website at oppenheimerfunds.com or call us at 1.800.CALL OPP (225.5677).
68 OPPENHEIMER EMERGING MARKETS LOCAL DEBT FUND
THIS PAGE INTENTIONALLY LEFT BLANK.
69 OPPENHEIMER EMERGING MARKETS LOCAL DEBT FUND
THIS PAGE INTENTIONALLY LEFT BLANK.
70 OPPENHEIMER EMERGING MARKETS LOCAL DEBT FUND
THIS PAGE INTENTIONALLY LEFT BLANK.
71 OPPENHEIMER EMERGING MARKETS LOCAL DEBT FUND

Item 2. Code of Ethics.
The registrant has adopted a code of ethics that applies to the registrant’s principal executive officer, principal financial officer, principal accounting officer or controller or persons performing similar functions.
Item 3. Audit Committee Financial Expert.
The Board of Trustees of the registrant has determined that F. William Marshall, Jr., the Chairman of the Board’s Audit Committee, is the audit committee financial expert and that Mr. Marshall is “independent” for purposes of this Item 3.
Item 4. Principal Accountant Fees and Services.
The principal accountant for the audit of the registrant’s annual financial statements billed $39,500 in fiscal 2014 and $38,800 in fiscal 2013.
The principal accountant for the audit of the registrant’s annual financial statements billed no such fees in fiscal 2014 and no such fees in fiscal 2013.
The principal accountant for the audit of the registrant’s annual financial statements billed $871,571 in fiscal 2014 and $508,480 in fiscal 2013 to the registrant’s investment adviser or any entity controlling, controlled by, or under common control with the adviser that provides ongoing services to the registrant.
Such services include: Internal control reviews, GIPS attestation procedures, internal audit training, surprise exams, system conversion testing, and corporate restructuring.
The principal accountant for the audit of the registrant’s annual financial statements billed no such fees in fiscal 2014 and no such fees in fiscal 2013.
The principal accountant for the audit of the registrant’s annual financial statements billed $386,917 in fiscal 2014 and $307,163 in fiscal 2013 to the registrant’s investment adviser or any entity controlling, controlled by, or under common control with the adviser that provides ongoing services to the registrant.
Such services include: tax compliance, tax planning and tax advice. Tax compliance generally involves preparation of original and amended tax returns, claims for a refund and tax payment-planning services. Tax planning and tax advice includes assistance with tax audits and appeals, tax advice related to mergers and acquisitions and requests for rulings or technical advice from taxing authorities.
The principal accountant for the audit of the registrant’s annual financial statements billed no such fees in fiscal 2014 and no such fees in fiscal 2013.
The principal accountant for the audit of the registrant’s annual financial statements billed no such fees in fiscal 2014 and no such fees in fiscal 2013 to the registrant’s investment adviser or any entity controlling, controlled by, or under common control with the adviser that provides ongoing services to the registrant.
Such fees would include the cost to the principal accountant of attending audit committee meetings and consultations regarding the registrant’s retirement plan with respect to its Trustees.
| (e) | (1) During its regularly scheduled periodic meetings, the registrant’s audit committee will pre-approve all audit, audit-related, tax and other services to be provided by the principal accountants of the registrant. |
The audit committee has delegated pre-approval authority to its Chairman for any subsequent new engagements that arise between regularly scheduled meeting dates provided that any fees such pre-approved are presented to the audit committee at its next regularly scheduled meeting.
Under applicable laws, pre-approval of non-audit services may be waived provided that: 1) the aggregate amount of all such services provided constitutes no more than five percent of the total amount of fees paid by the registrant to its principal accountant during the fiscal year in which services are provided 2) such services were not recognized by the registrant at the time of engagement as non-audit services and 3) such services are promptly brought to the attention of the audit committee of the registrant and approved prior to the completion of the audit.
(2) 0%
| (f) | Not applicable as less than 50%. |
| (g) | The principal accountant for the audit of the registrant’s annual financial statements billed $1,258,488 in fiscal 2014 and $845,643 in fiscal 2013 to the registrant and the registrant’s investment adviser or any entity controlling, controlled by, or under common control with the adviser that provides ongoing services to the registrant related to non-audit fees. Those billings did not include any prohibited non-audit services as defined by the Securities Exchange Act of 1934. |
| (h) | The registrant’s audit committee of the board of Trustees has considered whether the provision of non-audit services that were rendered to the registrant’s investment adviser, and any entity controlling, controlled by, or under common control with the investment adviser that provides ongoing services to the registrant that were not pre-approved pursuant to paragraph (c)(7)(ii) of Rule 2-01 of Regulation S-X is compatible with maintaining the principal accountant’s independence. No such services were rendered. |
Item 5. Audit Committee of Listed Registrants
Not applicable.
Item 6. Schedule of Investments.
a) Not applicable. The complete schedule of investments is included in Item 1 of this Form N-CSR.
b) Not applicable.
Item 7. Disclosure of Proxy Voting Policies and Procedures for Closed-End Management Investment Companies.
Not applicable.
Item 8. Portfolio Managers of Closed-End Management Investment Companies.
Not applicable.
Item 9. Purchases of Equity Securities by Closed-End Management Investment Company and Affiliated Purchasers.
Not applicable.
Item 10. Submission of Matters to a Vote of Security Holders.
The Fund’s Governance Committee Provisions with Respect to Nominations of Directors/Trustees to the Respective Boards
None
Item 11. Controls and Procedures.
Based on their evaluation of the registrant’s disclosure controls and procedures (as defined in rule 30a-3(c) under the Investment Company Act of 1940 (17 CFR 270.30a-3(c)) as of 5/30/2014, the registrant’s principal executive officer and principal financial officer found the registrant’s disclosure controls and procedures to provide reasonable assurances that information required to be disclosed by the registrant in the reports that it files under the Securities Exchange Act of 1934 (a) is accumulated and communicated to registrant’s management, including its principal executive officer and principal financial officer, to allow timely decisions regarding required disclosure, and (b) is recorded, processed, summarized and reported, within the time periods specified in the rules and forms adopted by the U.S. Securities and Exchange Commission.
There have been no changes in the registrant’s internal controls over financial reporting that occurred during the registrant’s second fiscal quarter of the period covered by this report that have materially affected, or are reasonably likely to materially affect, the registrant’s internal control over financial reporting.
Item 12. Exhibits.
| (a) | (1) Exhibit attached hereto. |
(2) Exhibits attached hereto.
(3) Not applicable.
| (b) | Exhibit attached hereto. |
SIGNATURES
Pursuant to the requirements of the Securities Exchange Act of 1934 and the Investment Company Act of 1940, the registrant has duly caused this report to be signed on its behalf by the undersigned, thereunto duly authorized.
Oppenheimer Emerging Markets Local Debt Fund
| | |
| By: | | /s/ William F. Glavin, Jr. |
| | William F. Glavin, Jr. |
| | Principal Executive Officer |
| |
| Date: | | 7/9/2014 |
Pursuant to the requirements of the Securities Exchange Act of 1934 and the Investment Company Act of 1940, this report has been signed below by the following persons on behalf of the registrant and in the capacities and on the dates indicated.
| | |
| By: | | /s/ William F. Glavin, Jr. |
| | William F. Glavin, Jr. |
| | Principal Executive Officer |
| |
| Date: | | 7/9/2014 |
| | |
| By: | | /s/ Brian W. Wixted |
| | Brian W. Wixted |
| | Principal Financial Officer |
| |
| Date: | | 7/9/2014 |