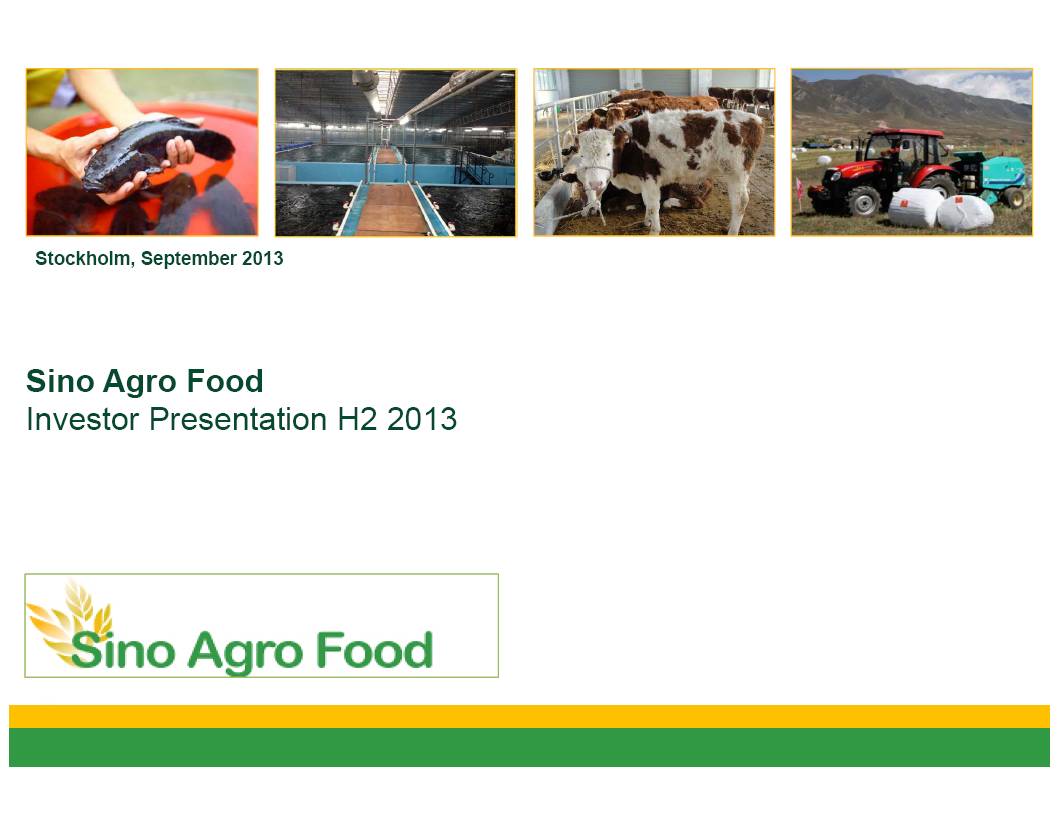
Old 1st: 49 152 68 2nd: 128 192 47 3rd: 4 74 47 Highl: 255 192 0 Text: 83 86 90 New 1st: 123 167 65 2nd: 205 220 68 3rd: 123 205 244 Highl: 201 28 26 Text: 82 94 82 Sino Agro Food Investor Presentation H2 2013 Stockholm, September 2013 Old 1st: 49 152 68 2nd: 128 192 47 3rd: 4 74 47 Highl: 255 192 0 Text: 83 86 90 New 1st: 123 167 65 2nd: 205 220 68 3rd: 123 205 244 Highl: 201 28 26 Text: 82 94 82
Old 1st: 49 152 68 2nd: 128 192 47 3rd: 4 74 47 Highl: 255 192 0 Text: 83 86 90 New 1st: 123 167 65 2nd: 205 220 68 3rd: 123 205 244 Highl: 201 28 26 Text: 82 94 82 Agenda 1 . Executive Summary 2. Company Overview 3. Financial Review 4. Industry Overview 5 . Appendix 2
Old 1st: 49 152 68 2nd: 128 192 47 3rd: 4 74 47 Highl: 255 192 0 Text: 83 86 90 New 1st: 123 167 65 2nd: 205 220 68 3rd: 123 205 244 Highl: 201 28 26 Text: 82 94 82 Sino Agro Food Sino Agro Food, Inc. (“SIAF”) is a vertically integrated specialist food producer listed on the US OTC Bulletin Board, produc ing seafood, beef, vegetables, organic fertilizer and livestock feed in China, with revenue generated through B2B and B2C sales. * Technologically mature and robust competitive advantages enable above average gross margins, through leading edge patents and proprietary technologies used in recirculating aquaculture systems (“RAS”), livestock feed, and fertilizer fermentation enzymes. • Fully integrated beef and seafood operations sell to wholesale and retail channels, implementing a “Farm to Plate” strategy that uses SIAF’s own Wholesale Centers and Food Processing facilities in Guangzhou. SIAF’s 5 - year growth strategy (2010 - 14) to become a leading vertically integrated specialist in growing niche food markets for organic beef and healthy farmed fish in China is maturing. As of H1 2013 the company is well on track to meet this goal with ramped - up operations and stable operating cash flows resulting in high sales volume and value to match assets value. • Net Assets as of H2 2013 amounted to US$257.5m and expected to reach US$500m by 2015. • Products meet the demands of China’s burgeoning middle class population. Founded in China in 2006 by current CEO and Chairman, Mr. Solomon Lee. • Company management has substantial experience in the food, agriculture and aquaculture sector in China, Malaysia and Australia totaling an aggregate of >90 years previous industry experience. Swedish Investor Influence Since 2010 the reputable Swedish Jordan Fund with members has accumulated over 50% of common shares outstanding. Since January 1st, 2013 the Jordan Fund is duly represented on the BoD through Mr. Nils - Erik Sandberg. SIAF is fully SEC Reporting and eligible to list on a Senior US Exchange, such as NASDAQ with secondary listing on the NASDAQ OMX First North stock market in Sweden with Certified Advisor Erik Penser Bank well in progress. • Legal due diligence with the Swedish Law Firm Delphi was completed in H1 2013 . Executive Summary 3
Old 1st: 49 152 68 2nd: 128 192 47 3rd: 4 74 47 Highl: 255 192 0 Text: 83 86 90 New 1st: 123 167 65 2nd: 205 220 68 3rd: 123 205 244 Highl: 201 28 26 Text: 82 94 82 • Continuing record growth in sales and operating income as businesses reach maturity with LTM EBITDA amounting to US$86m (H2 2013) • Diversification into Aquaculture, Beef Cattle, Feed and Fertilizer with control of value chain ensures robust sales, cash flows and resilience to economic downturn Key Investment Highlights Strong Financial Position High G rowth M arket E xposure Stable EBITDA Generation Highly E xperienced M anagement T eam • Management team with >90 years of experience and proven track record in the food, agriculture and aquaculture industries • No mainland Chinese board members result in a essentially foreign controlled company with a Corporate Governance culture focused on maximizing shareholder value – CEO and Chairman of the BoD Solomon Lee is an Australian citizen • Net Cash position with NTA of $231m H1 2013 • Equity Ratio of 90% • The Company has a prudent financing policy but is actively seeking to optimize capital structure through debt issuance Integrated Operations & Technological Excellence • Proven proprietary technologies deployed into vertically integrated commercial facilities and operations • High growth growth wholesale segments of Beef and Seafood • Market - leading supplier of proven, proprietary Recirculating Aquaculture Systems in China • Construction and o peration of the first indoor recirculated aquaculture prawn farm in Asia • Strong support of local Chinese government resulting from SIAF’s symbiotic collaboration with local farmers resulting in higher income, improved livelihood and quality of life 4 • China’s strong urbanization has led to diets switching from grain to meat products • Government support to agriculture indicate that policymakers emphasise the rural economy and food security • The organic, high - quality food segment is enjoying strong demand due to general Chinese food safety problems, and a dramatically growing middle class
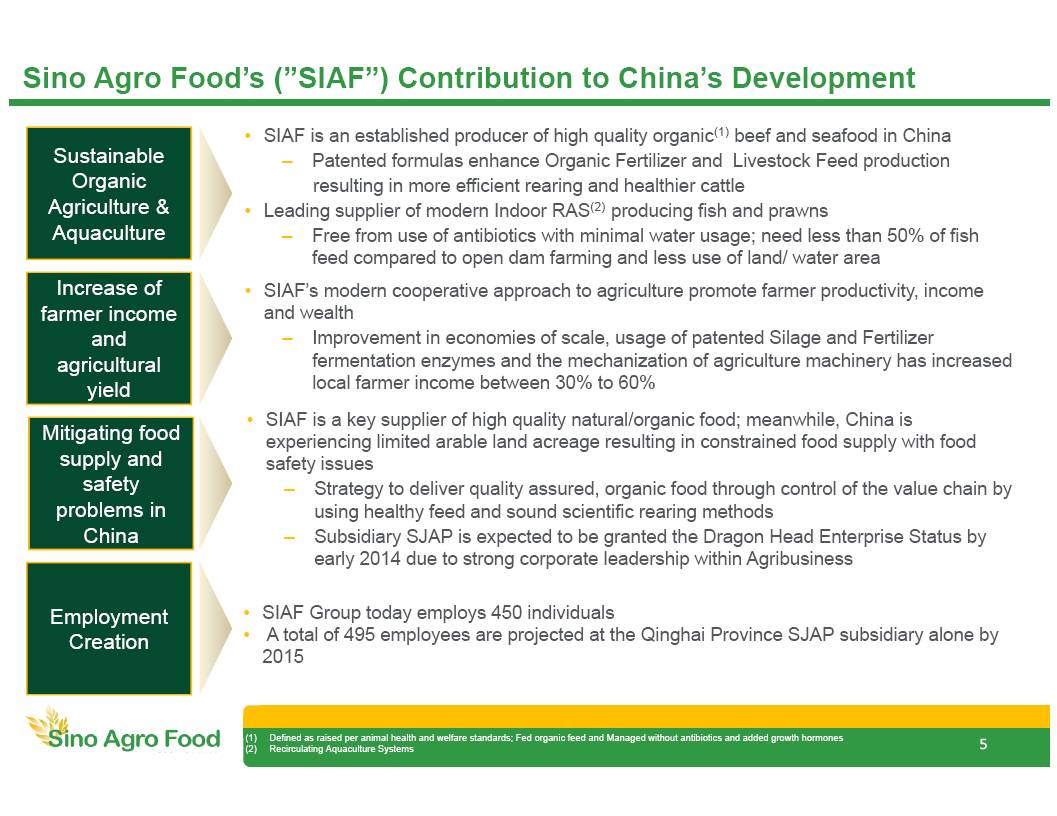
Old 1st: 49 152 68 2nd: 128 192 47 3rd: 4 74 47 Highl: 255 192 0 Text: 83 86 90 New 1st: 123 167 65 2nd: 205 220 68 3rd: 123 205 244 Highl: 201 28 26 Text: 82 94 82 • SIAF is a key supplier of high quality natural/organic food; meanwhile, China is experiencing limited arable land acreage resulting in constrained food supply with food safety issues – Strategy to deliver quality assured, organic food through control of the value chain by using healthy feed and sound scientific rearing methods – S ubsidiary SJAP is expected to be granted the Dragon Head Enterprise Status by early 2014 due to strong corporate leadership within Agribusiness Sino Agro Food’s (”SIAF”) Contribution to China’s Development Employment Creation 4 74 47 49 152 68 255 192 0 128 192 47 Increase of farmer income and agricultural yield Mitigating food supply and safety problems in China • SIAF Group today employs 450 individuals • A total of 495 employees are projected at the Qinghai Province SJAP subsidiary alone by 2015 Sustainable Organic Agriculture & Aquaculture • SIAF is an established producer of high quality organic (1) beef and seafood in China – Patented formulas enhance Organic Fertilizer and Livestock Feed production resulting in more efficient rearing and healthier cattle • Leading supplier of modern Indoor RAS (2) producing fish and prawns – Free from use of antibiotics with minimal water usage; need less than 50% of fish feed compared to open dam farming and less use of land/ water area 5 • SIAF’s modern cooperative approach to agriculture promote farmer productivity, income and wealth – Improvement in economies of scale, usage of patented Silage and Fertilizer fermentation enzymes and the mechanization of agriculture machinery has increased local farmer income between 30% to 60% (1) Defined as raised per animal health and welfare standards; Fed organic feed and Managed without antibiotics and added growth hormones (2) Recirculating Aquaculture Systems
Old 1st: 49 152 68 2nd: 128 192 47 3rd: 4 74 47 Highl: 255 192 0 Text: 83 86 90 New 1st: 123 167 65 2nd: 205 220 68 3rd: 123 205 244 Highl: 201 28 26 Text: 82 94 82 Agenda 6 1 . Executive Summary 2. Company Overview 3. Financial Review 4. Industry Overview 5 . Appendix
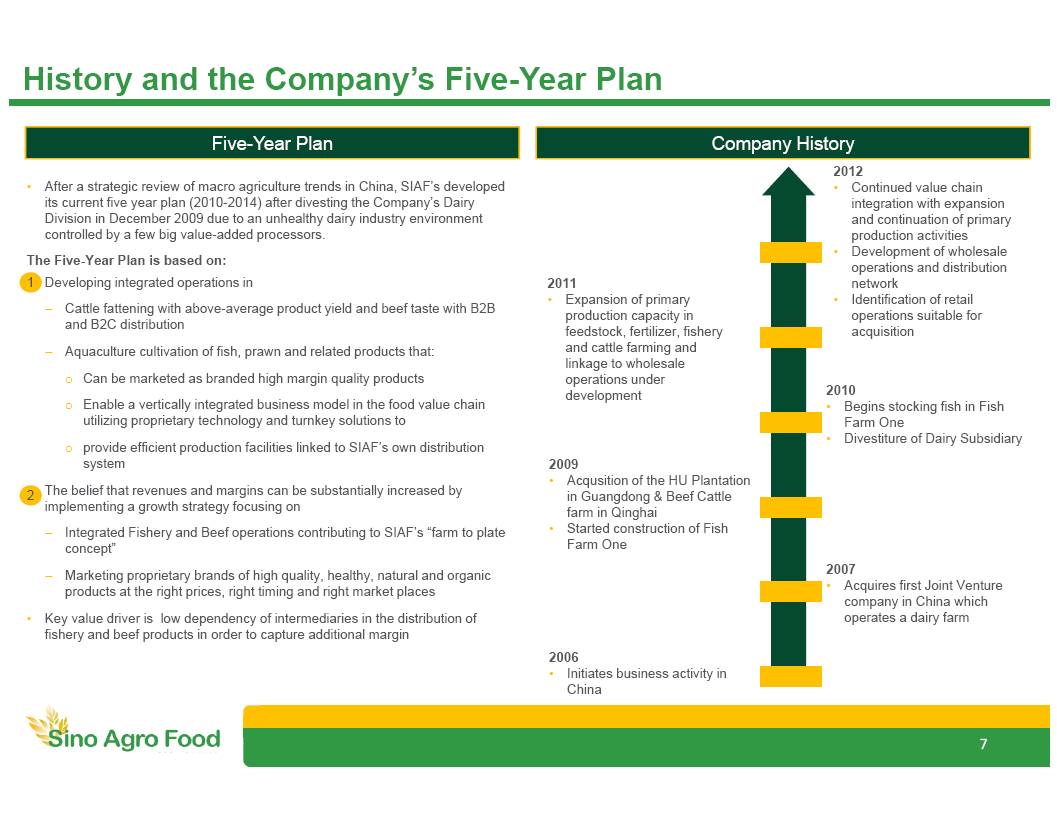
Old 1st: 49 152 68 2nd: 128 192 47 3rd: 4 74 47 Highl: 255 192 0 Text: 83 86 90 New 1st: 123 167 65 2nd: 205 220 68 3rd: 123 205 244 Highl: 201 28 26 Text: 82 94 82 History and the Company’s Five - Year P lan Company History Five - Year P lan 2007 • A cquires first Joint Venture company in China which operates a dairy farm 2012 • Continued value chain integration with expansion and continuation of primary production activities • Development of wholesale operations and distribution network • I dentification of retail operations suitable for acquisition 2011 • Expansion of primary production capacity in feedstock, fertilizer, fishery and cattle farming and linkage to wholesale operations under development 2010 • Begins stocking fish in Fish Farm One • Divestiture of Dairy Subsidiary 2009 • Acqusition of the HU Plantation in Guangdong & Beef Cattle farm in Qinghai • Started construction of Fish Farm One • After a strategic review of macro agriculture trends in China, SIAF’s developed its current five year plan (2010 - 2014) after divesting the Company’s Dairy Division in December 2009 due to an unhealthy dairy industry environment controlled by a few big value - added processors. The Five - Year Plan is based on: • Developing integrated operations in – C attle fattening with above - average product yield and beef taste with B2B and B2C distribution – Aquaculture cultivation of fish, prawn and related products that: o Can be marketed as b randed high margin quality products o Enable a vertically integrated business model in the food value chain utilizing proprietary technology and turnkey solutions to o provide efficient production facilities linked to SIAF’s own distribution system • The belief that revenues and margins can be substantially increased by implementing a growth strategy focusing on – I ntegrated Fishery and Beef operations contributing to SIAF’s “farm to plate concept” – Marketing proprietary brands of high quality, healthy, natural and organic products at the right prices, right timing and right market places • K ey value driver is low dependency of intermediaries in the distribution of fishery and beef products in order to capture additional margin 1 2 7 2006 • Initiates business activity in China
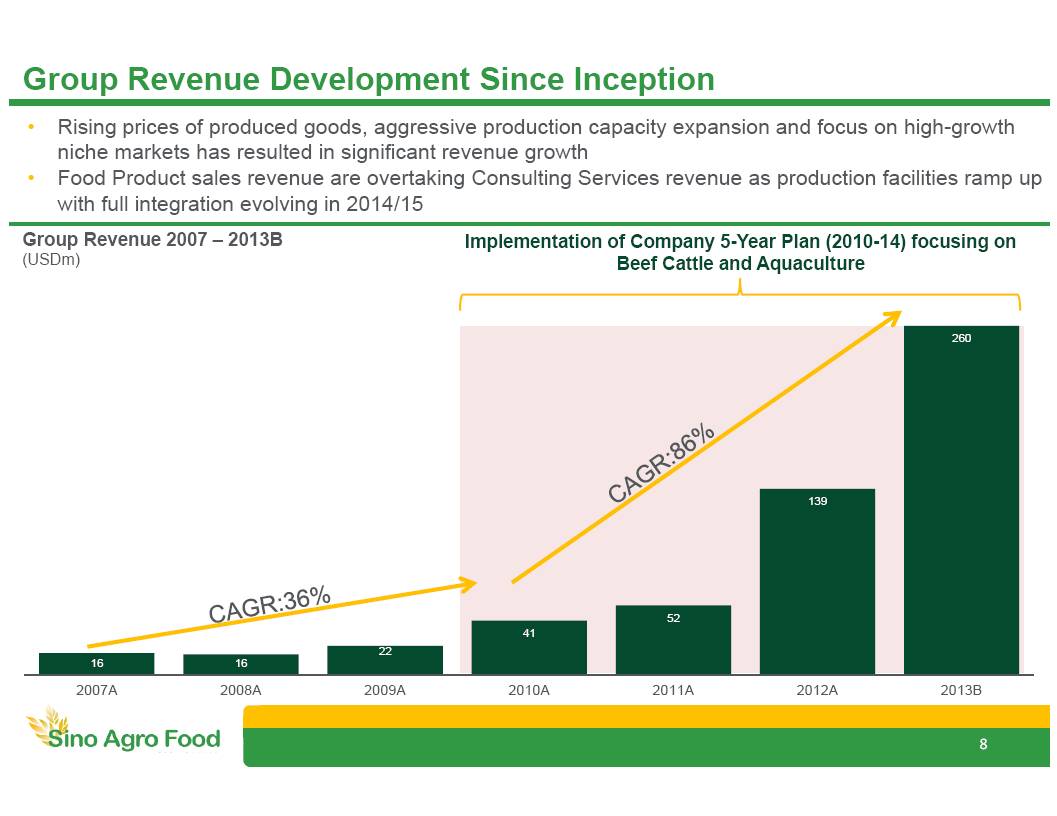
Old 1st: 49 152 68 2nd: 128 192 47 3rd: 4 74 47 Highl: 255 192 0 Text: 83 86 90 New 1st: 123 167 65 2nd: 205 220 68 3rd: 123 205 244 Highl: 201 28 26 Text: 82 94 82 16 16 22 41 52 139 260 2007A 2008A 2009A 2010A 2011A 2012A 2013B • Rising prices of produced goods, aggressive production capacity expansion and focus on high - growth niche markets has resulted in significant revenue growth • Food Product sales revenue are overtaking Consulting Services revenue as production facilities ramp up with full integration evolving in 2014/15 Group Revenue Development Since Inception Group Revenue 2007 – 2013B ( USDm ) 8 Implementation of Company 5 - Year Plan (2010 - 14) focusing on Beef Cattle and Aquaculture
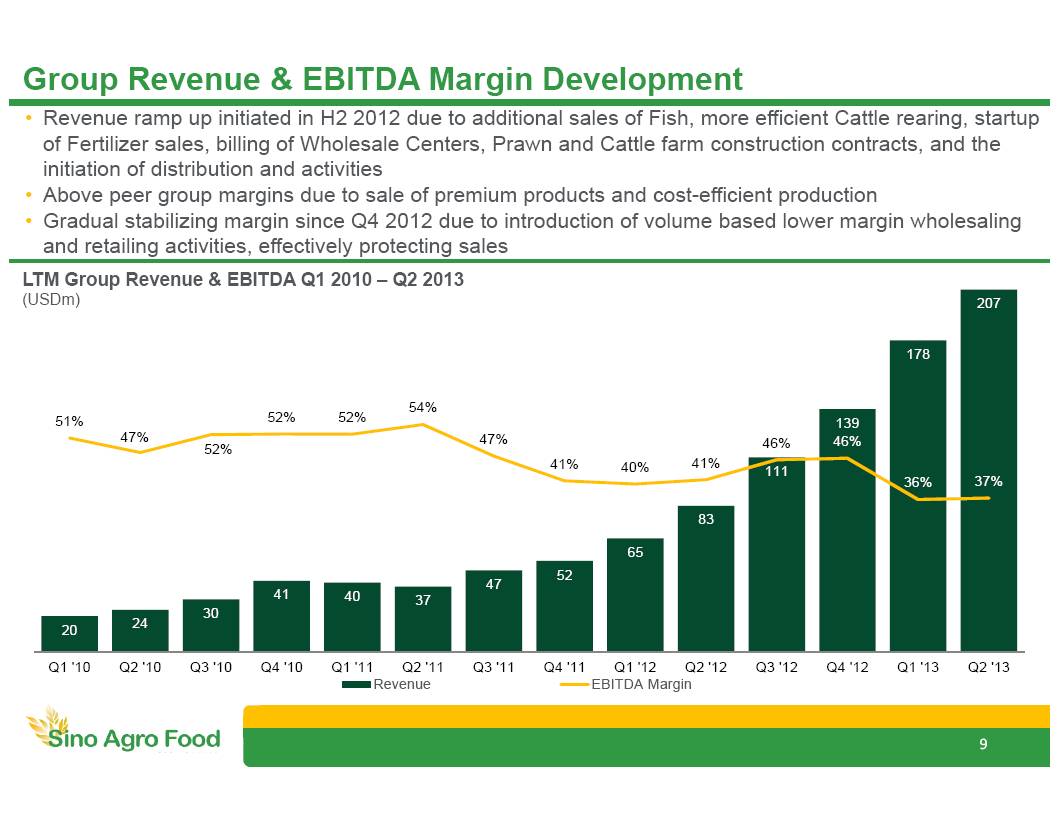
Old 1st: 49 152 68 2nd: 128 192 47 3rd: 4 74 47 Highl: 255 192 0 Text: 83 86 90 New 1st: 123 167 65 2nd: 205 220 68 3rd: 123 205 244 Highl: 201 28 26 Text: 82 94 82 20 24 30 41 40 37 47 52 65 83 111 139 178 207 51% 47% 52% 52% 52% 54% 47% 41% 40% 41% 46% 46% 36% 37% Q1 '10 Q2 '10 Q3 '10 Q4 '10 Q1 '11 Q2 '11 Q3 '11 Q4 '11 Q1 '12 Q2 '12 Q3 '12 Q4 '12 Q1 '13 Q2 '13 Revenue EBITDA Margin • Revenue ramp up initiated in H2 2012 due to additional sales of Fish , more efficient Cattle rearing, startup of Fertilizer sales, billing of Wholesale Centers, Prawn and Cattle farm construction contracts, and the initiation of distribution and activities • Above peer group margins due to sale of premium products and cost - efficient production • Gradual stabilizing margin since Q4 2012 due to introduction of volume based lower margin wholesaling and retailing activities, effectively protecting sales Group Revenue & EBITDA M argin Development LTM Group Revenue & EBITDA Q1 2010 – Q2 2013 ( USDm ) 9

Old 1st: 49 152 68 2nd: 128 192 47 3rd: 4 74 47 Highl: 255 192 0 Text: 83 86 90 New 1st: 123 167 65 2nd: 205 220 68 3rd: 123 205 244 Highl: 201 28 26 Text: 82 94 82 40 49 57 68 81 95 106 118 125 139 166 189 210 231 Q1 '10 Q2 '10 Q3 '10 Q4 '10 Q1 '11 Q2 '11 Q3 '11 Q4 '11 Q1 '12 Q2 '12 Q3 '12 Q4 '12 Q1 '13 Q2 '13 • The Company has grown its Net Tangible Assets to US$231m representing a 71% CAGR since 2010 in order to establish operations and build its assets base • Internally generated funds have financed over 80% of 2013 CapEx to date • Q1 2013 US$26m of debt was originally budgeted to complete the five year plan, generating full company positive cash flow in 2014 • Now projected debt needs have decreased to US$16.8m by Q2 due to stronger than expected operating cash flows Group Net Tangible Assets Group Development of Net Tangible Assets Q1 2010 – Q2 2013 ( USDm ) 10 Note: Net Tangible Assets defined as stockholders equity less intangible assets and non - controlling interest
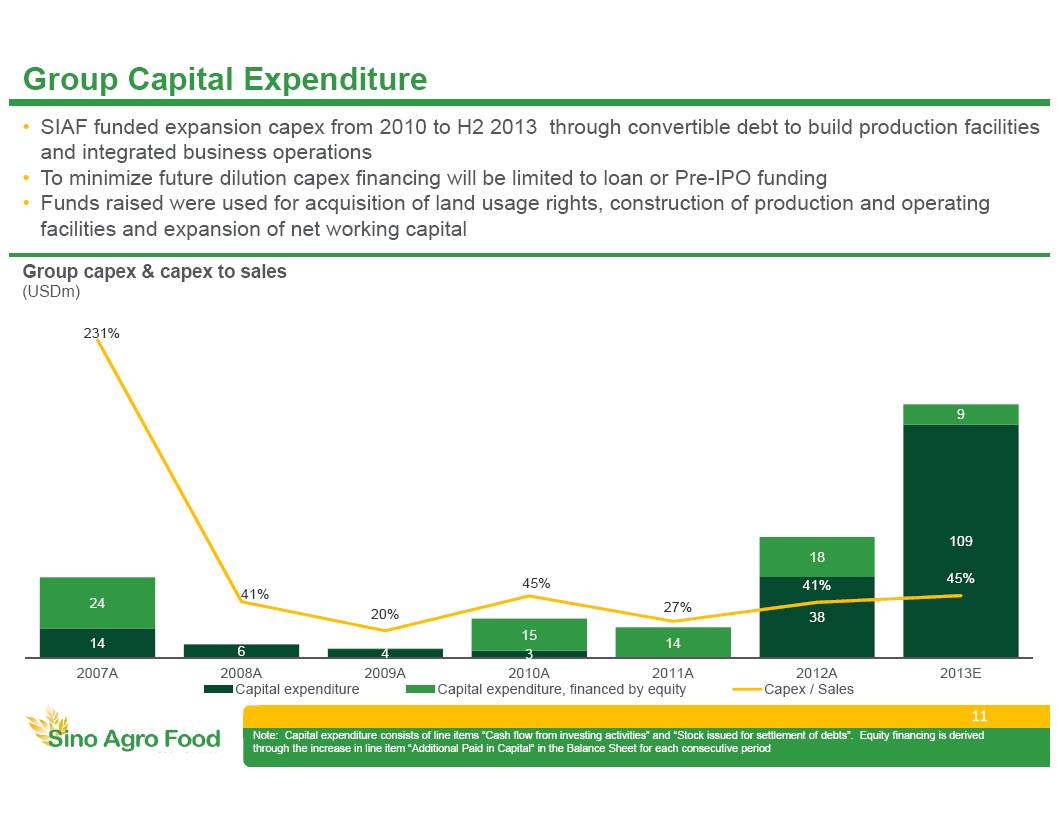
Old 1st: 49 152 68 2nd: 128 192 47 3rd: 4 74 47 Highl: 255 192 0 Text: 83 86 90 New 1st: 123 167 65 2nd: 205 220 68 3rd: 123 205 244 Highl: 201 28 26 Text: 82 94 82 14 6 4 3 38 109 24 15 14 18 9 231% 41% 20% 45% 27% 41% 45% 2007A 2008A 2009A 2010A 2011A 2012A 2013E Capital expenditure Capital expenditure, financed by equity Capex / Sales • SIAF funded expansion c apex from 2010 to H2 2013 through convertible debt to build production facilities and integrated business operations • To minimize future dilution capex financing will be limited to loan or Pre - IPO funding • Funds raised were used for acquisition of land u sage r ights , construction of production and operating facilities and expansion of net working capital Group Capital Expenditure Note: Capital expenditure consists of line items “Cash flow from investing activities” and “Stock issued for settlement of debts”. Equity financing is derived through the increase in line item “Additional Paid in Capital” in the Balance Sheet for each consecutive period Group c apex & c apex to sales (USDm) 11
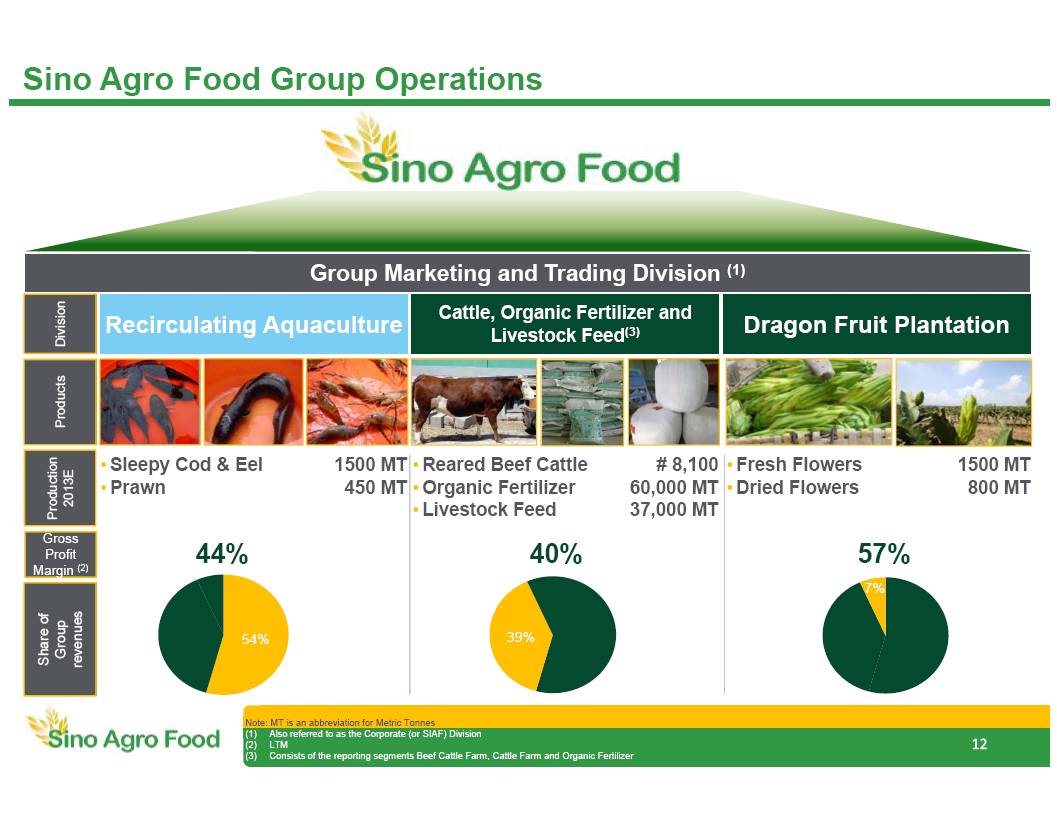
Old 1st: 49 152 68 2nd: 128 192 47 3rd: 4 74 47 Highl: 255 192 0 Text: 83 86 90 New 1st: 123 167 65 2nd: 205 220 68 3rd: 123 205 244 Highl: 201 28 26 Text: 82 94 82 7% 39% 54% Sino Agro Food Group Operations Cattle, Organic Fertilizer and Livestock Feed (3) Dragon Fruit Plantation Recirculating Aquaculture Group Marketing and Trading Division (1) 12 Note: MT is an abbreviation for Metric Tonnes (1) Also referred to as the Corporate (or SIAF) Division (2) LTM (3) Consists of the reporting segments Beef Cattle Farm, Cattle Farm and Organic Fertilizer Share of Group revenues Gross Profit Margin (2) 44% 57% 40% Production 2013E • Sleepy Cod & Eel • Prawn • Reared Beef Cattle • Organic Fertilizer • Livestock Feed • Fresh Flowers • Dried Flowers Division Products # 8,100 60,000 MT 37,000 MT 1500 MT 450 MT 1500 MT 800 MT
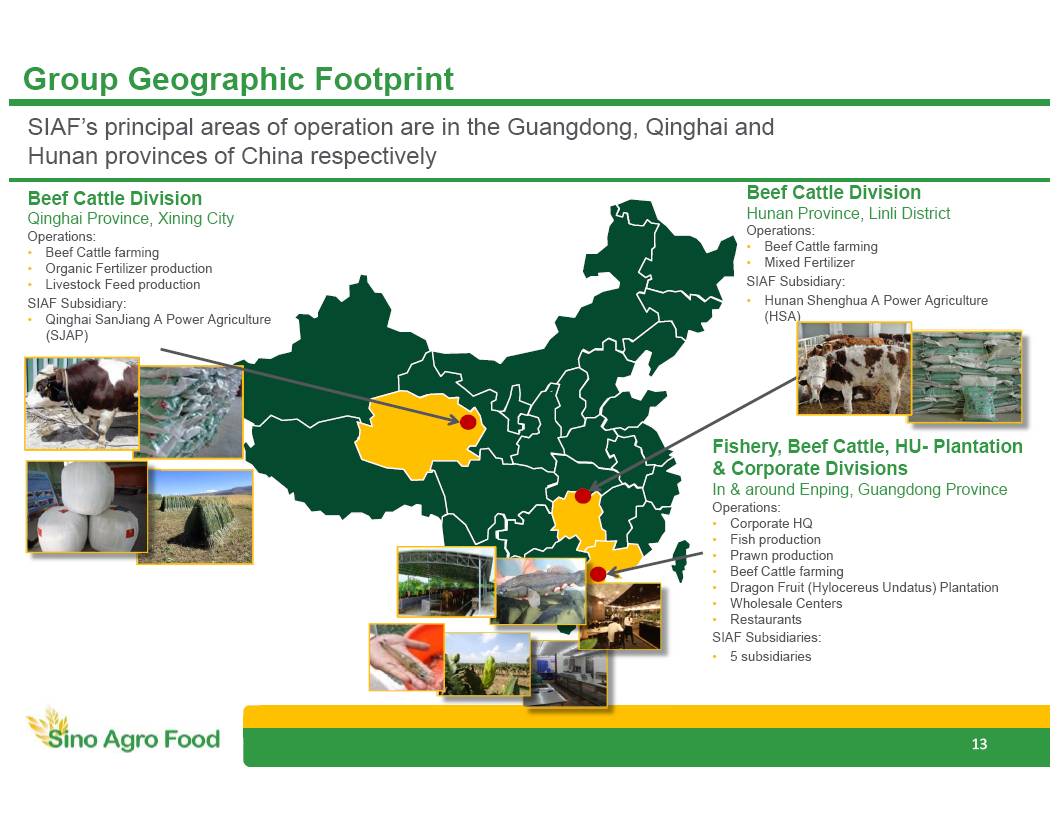
Old 1st: 49 152 68 2nd: 128 192 47 3rd: 4 74 47 Highl: 255 192 0 Text: 83 86 90 New 1st: 123 167 65 2nd: 205 220 68 3rd: 123 205 244 Highl: 201 28 26 Text: 82 94 82 Group Geographic Footprint Beef Cattle Division Qinghai Province, Xining City Operations: • Beef Cattle farming • Organic Fertilizer production • Livestock Feed production SIAF Subsidiary: • Qinghai SanJiang A Power Agriculture (SJAP) Beef Cattle Division Hunan Province, Linli District Operations: • Beef Cattle farming • Mixed Fertilizer SIAF Subsidiary: • Hunan Shenghua A Power Agriculture (HSA) Fishery, Beef Cattle, HU - Plantation & Corporate Divisions In & around Enping , Guangdong Province Operations: • Corporate HQ • Fish production • Prawn production • Beef Cattle farming • Dragon Fruit ( Hylocereus Undatus ) Plantation • Wholesale Centers • Restaurants SIAF Subsidiaries: • 5 subsidiaries SIAF’s principal areas of operation are in the Guangdong, Qinghai and Hunan provinces of China respectively 13
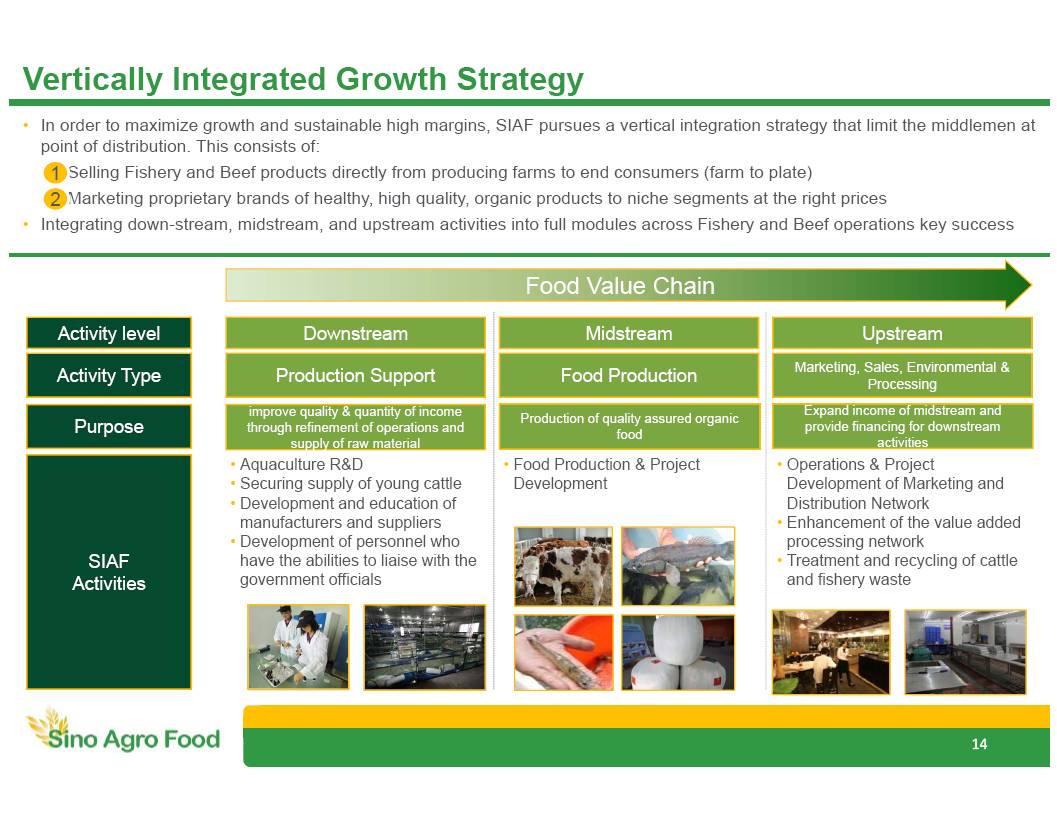
Old 1st: 49 152 68 2nd: 128 192 47 3rd: 4 74 47 Highl: 255 192 0 Text: 83 86 90 New 1st: 123 167 65 2nd: 205 220 68 3rd: 123 205 244 Highl: 201 28 26 Text: 82 94 82 • In order to maximize growth and sustainable high margins, SIAF pursues a vertical integration strategy that limit the middlemen at point of distribution. This consists of: (1) Selling Fishery and Beef products directly from producing farms to end consumers (farm to plate) (2) Marketing proprietary brands of healthy, high quality, organic products to niche segments at the right prices • Integrating down - stream, midstream , and upstream activities into full modules across Fishery and Beef operations key success Vertically Integrated Growth Strategy Downstream Midstream Upstream improve quality & quantity of income through refinement of operations and supply of raw material Production of q uality assured organic food Expand income of midstream and provide financing for downstream activities Activity level Activity Type Production Support Food Production Purpose SIAF Activities • Aquaculture R&D • Securing supply of young cattle • Development and education of manufacturers and suppliers • Development of personnel who have the abilities to liaise with the government officials • Food Production & Project Development • Operations & Project Development of Marketing and Distribution Network • Enhancement of the value added processing network • Treatment and recycling of cattle and fishery waste Marketing, Sales , Environmental & Processing Food Value Chain 1 2 14
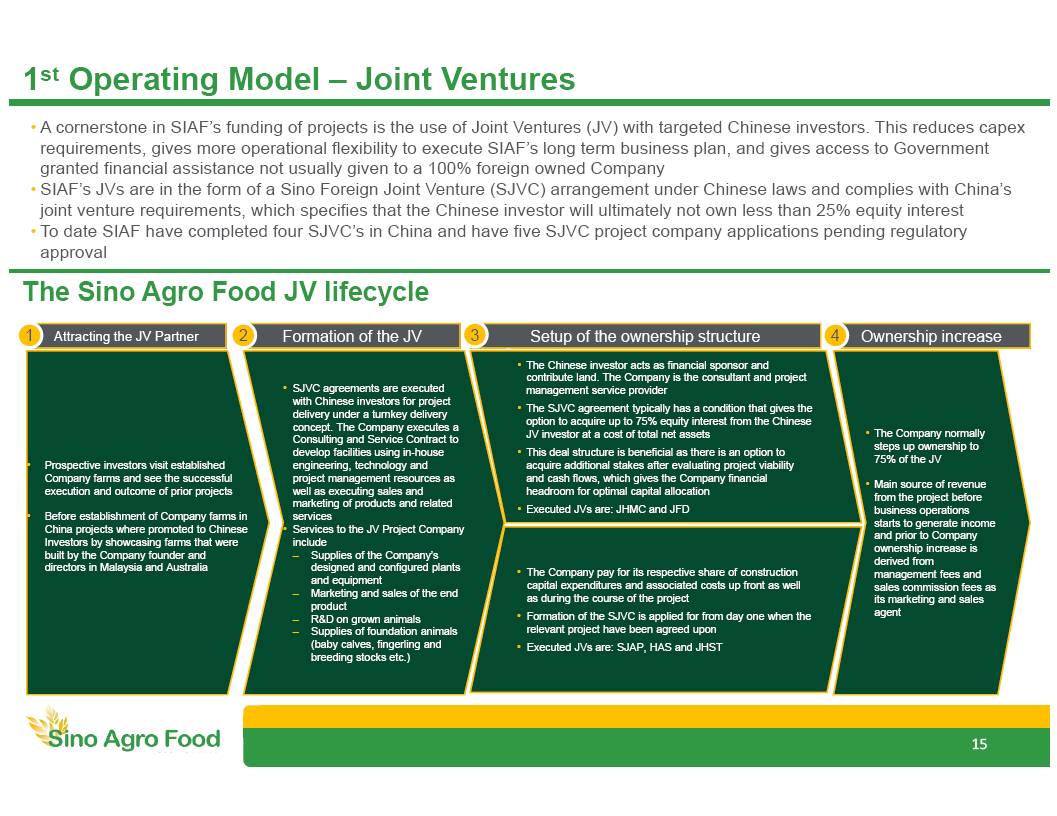
Old 1st: 49 152 68 2nd: 128 192 47 3rd: 4 74 47 Highl: 255 192 0 Text: 83 86 90 New 1st: 123 167 65 2nd: 205 220 68 3rd: 123 205 244 Highl: 201 28 26 Text: 82 94 82 1 st Operating Model – Joint Ventures • A cornerstone in SIAF’s funding of projects is the use of Joint Ventures (JV) with targeted Chinese investors. This reduces capex requirements, gives more operational flexibility to execute SIAF’s long term business plan, and gives access to Government granted financial assistance not usually given to a 100% foreign owned Company • SIAF’s JVs are in the form of a Sino Foreign Joint Venture (SJVC) arrangement under Chinese laws and complies with China’s joint venture requirements, which specifies that the Chinese investor will ultimately not own less than 25% equity interest • To date SIAF have completed four SJVC’s in China and have five SJVC project company applications pending regulatory approval • P rospective investors visit established Company farms and see the successful execution and outcome of prior projects • Before establishment of Company farms in China projects where promoted to Chinese Investors by showcasing farms that were built by the Company founder and directors in Malaysia and Australia • SJVC agreements are executed with Chinese investors for project delivery under a turnkey delivery concept. The Company executes a Consulting and Service Contract to develop facilities using in - house engineering, technology and project management resources as well as executing sales and marketing of products and related services • S ervices to the JV Project Company include – Supplies of the Company’s designed and configured plants and equipment – Marketing and sales of the end product – R&D on grown animals – Supplies of foundation animals (baby calves, fingerling and breeding stocks etc .) Attracting the JV Partner Formation of the JV Setup of the o wnership structure 15 • The Company normally steps up ownership to 75% of the JV • Main source of revenue from the project before business operations starts to generate income and prior to Company ownership increase is derived from management fees and sales commission fees as its marketing and sales agent The Sino Agro Food JV lifecycle A B Ownership i ncrease 1 2 3 4 • The Company pay for its respective share of construction capital expenditures and associated costs up front as well as during the course of the project • Formation of the SJVC is applied for from day one when the relevant project have been agreed upon • Executed JVs are: SJAP, HAS and JHST • The Chinese investor acts as financial sponsor and contribute land. The Company is the consultant and project management service provider • The SJVC agreement typically has a condition that gives the option to acquire up to 75% equity interest from the Chinese JV investor at a cost of total net assets • This deal structure is beneficial as there is an option to acquire additional stakes after evaluating project viability and cash flows, which gives the Company financial headroom for optimal capital allocation • Executed JVs are: JHMC and JFD
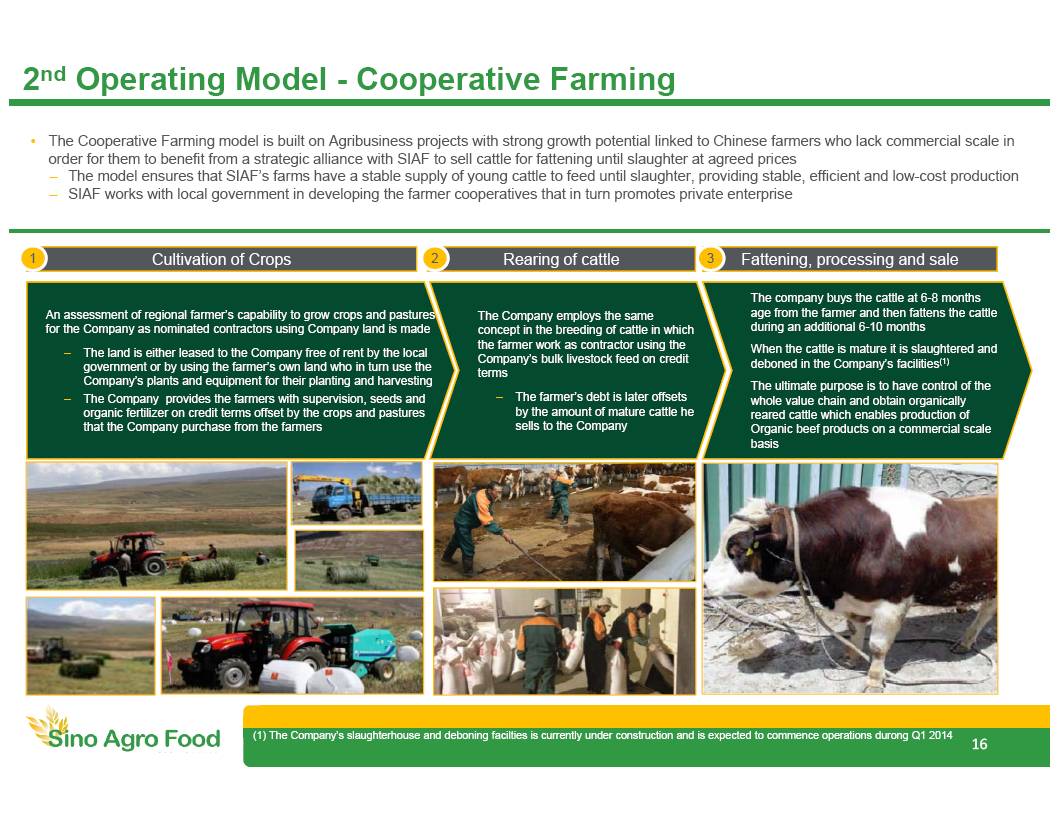
Old 1st: 49 152 68 2nd: 128 192 47 3rd: 4 74 47 Highl: 255 192 0 Text: 83 86 90 New 1st: 123 167 65 2nd: 205 220 68 3rd: 123 205 244 Highl: 201 28 26 Text: 82 94 82 2 nd Operating Model - Cooperative Farming • The Cooperative Farming model is built on Agribusiness projects with strong growth potential linked to Chinese farmers who lack commercial scale in order for them to benefit from a strategic alliance with SIAF to sell cattle for fattening until slaughter at agreed prices – The model ensures that SIAF’s farms have a stable supply of young cattle to feed until slaughter, providing stable, efficient and low - cost production – SIAF works with local government in developing the farmer cooperatives that in turn promotes private enterprise An assessment of regional farmer’s capability to grow crops and pastures for the Company as nominated contractors using Company land is made – The land is either leased to the Company free of rent by the local government or by using the farmer’s own land who in turn use the Company’s plants and equipment for their planting and harvesting – The Company provides the farmers with supervision, seeds and organic fertilizer on credit terms offset by the crops and pastures that the Company purchase from the farmers The Company employs the same concept in the breeding of cattle in which the farmer work as contractor using the Company’s bulk livestock feed on credit terms – The farmer’s debt is later offsets by the amount of mature cattle he sells to the Company The company buys the cattle at 6 - 8 months age from the farmer and then fattens the cattle during an additional 6 - 10 months When the cattle is mature it is slaughtered and deboned in the Company’s facilities (1) The ultimate purpose is to have control of the whole value chain and obtain organically reared cattle which enables production of Organic beef products on a commercial scale basis Cultivation of Crops Rearing of cattle Fattening , p rocessing and sale 16 3 (1) The Company’s slaughterhouse and deboning facilties is currently under construction and is expected to commence operations durong Q1 2014 2 1
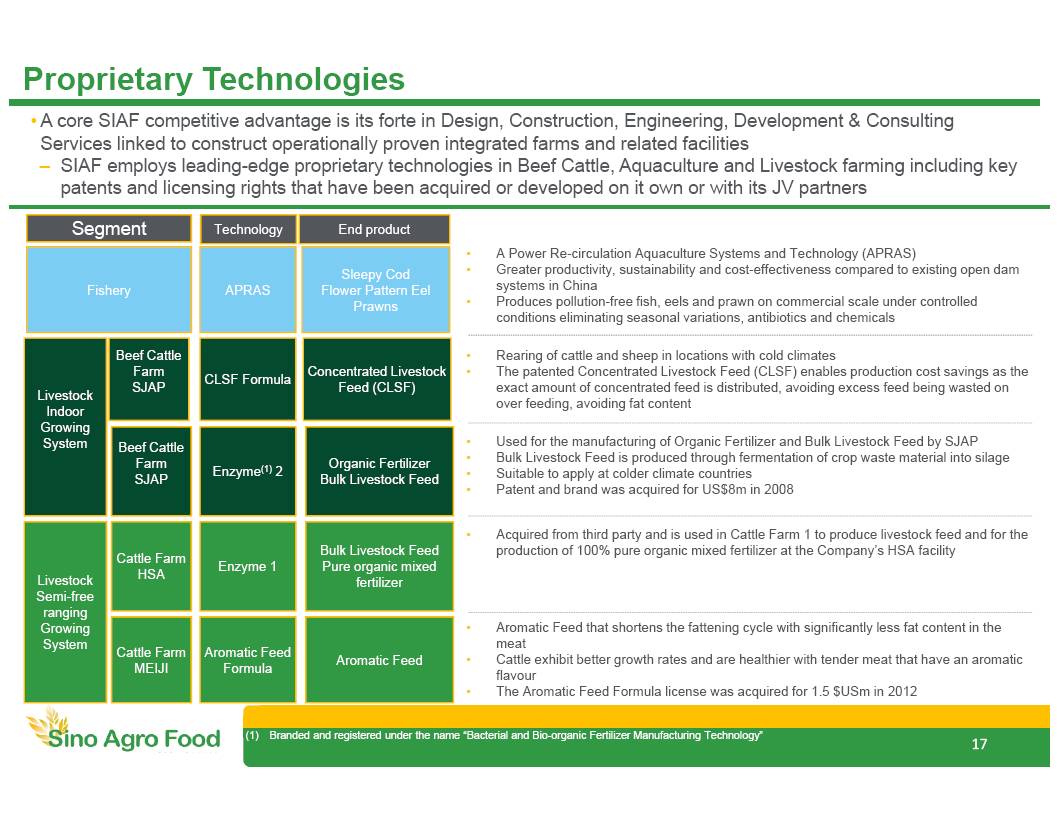
Old 1st: 49 152 68 2nd: 128 192 47 3rd: 4 74 47 Highl: 255 192 0 Text: 83 86 90 New 1st: 123 167 65 2nd: 205 220 68 3rd: 123 205 244 Highl: 201 28 26 Text: 82 94 82 Proprietary Technologies APRAS Livestock Indoor Growing System Fishery Livestock Semi - free ranging Growing System • A Power Re - circulation Aquaculture Systems and Technology (APRAS) • G reater productivity, sustainability and cost - effectiveness compared to existing open dam systems in China • Produces pollution - free fish, eels and prawn on commercial scale under controlled conditions eliminating seasonal variations, antibiotics and chemicals • A core SIAF competitive advantage is its forte in Design, Construction, Engineering, Development & Consulting Services linked to construct operationally proven integrated farms and related facilities – SIAF employs leading - edge proprietary technologies in Beef Cattle, Aquaculture and Livestock farming including key patents and licensing rights that have been acquired or developed on it own or with its JV partners Segment Technology 17 Aromatic Feed Bulk Livestock Feed Pure organic mixed fertilizer Beef Cattle Farm SJAP Organic Fertilizer Bulk Livestock Feed Enzyme (1) 2 Enzyme 1 Cattle Farm HSA Concentrated Livestock Feed (CLSF) Beef Cattle Farm SJAP Cattle Farm MEIJI Aromatic Feed Formula CLSF Formula End product Sleepy Cod Flower Pattern Eel Prawns • R earing of cattle and sheep in locations with cold climates • The patented Concentrated Livestock Feed (CLSF) e nables production cost savings as the exact amount of concentrated feed is distributed, avoiding excess feed being wasted on over feeding, avoiding fat content • Aromatic Feed that shortens the fattening cycle with significantly less fat content in the meat • Cattle exhibit better growth rates and are healthier with tender meat that have an aromatic flavour • The Aromatic Feed Formula license was acquired for 1.5 $ USm in 2012 • U sed for the manufacturing of Organic F ertilizer and Bulk L ivestock F eed by SJAP • Bulk Livestock Feed is produced through fermentation of crop waste material into silage • Suitable to apply at colder climate countries • Patent and brand was acquired for US$8m in 2008 • Acquired from third party and is used in Cattle Farm 1 to produce livestock feed and for the production of 100% pure organic mixed fertilizer at the Company’s HSA facility (1) Branded and registered under the name “Bacterial and Bio - organic Fertilizer Manufacturing Technology”
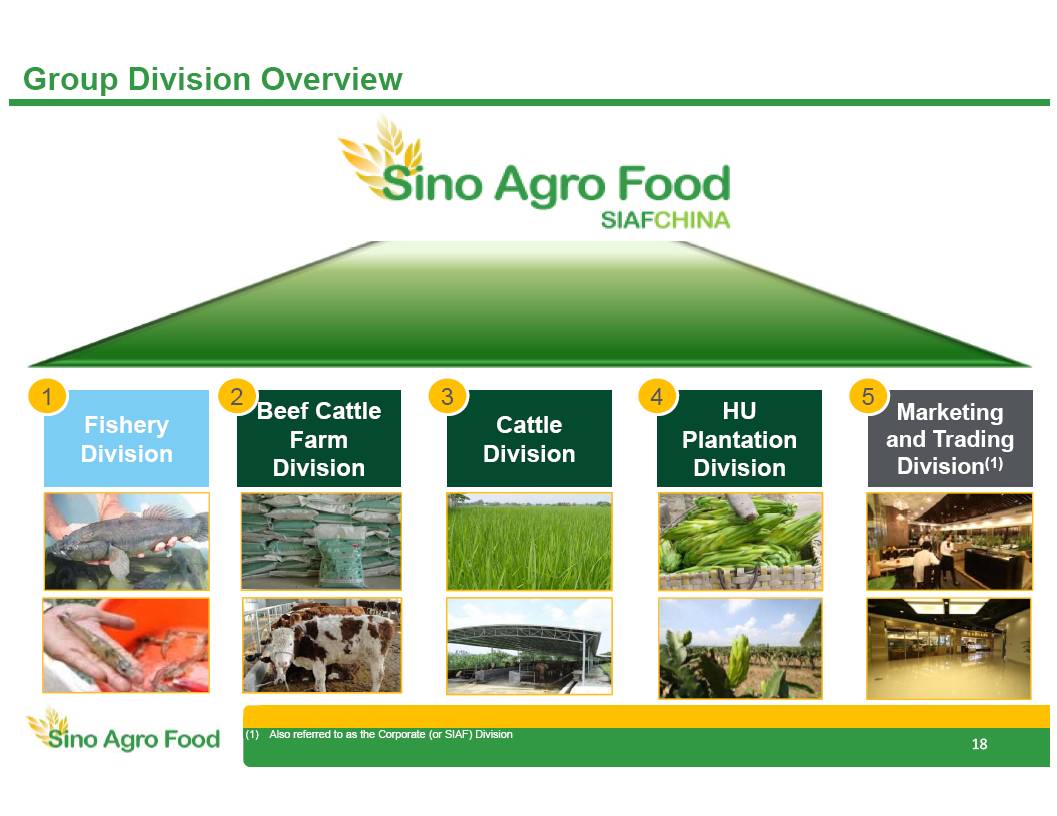
Old 1st: 49 152 68 2nd: 128 192 47 3rd: 4 74 47 Highl: 255 192 0 Text: 83 86 90 New 1st: 123 167 65 2nd: 205 220 68 3rd: 123 205 244 Highl: 201 28 26 Text: 82 94 82 Group Division Overview Beef Cattle Farm Division Cattle Division HU Plantation Division Fishery Division Marketing and Trading Division (1) 1 2 3 4 5 18 (1) Also referred to as the Corporate (or SIAF) Division
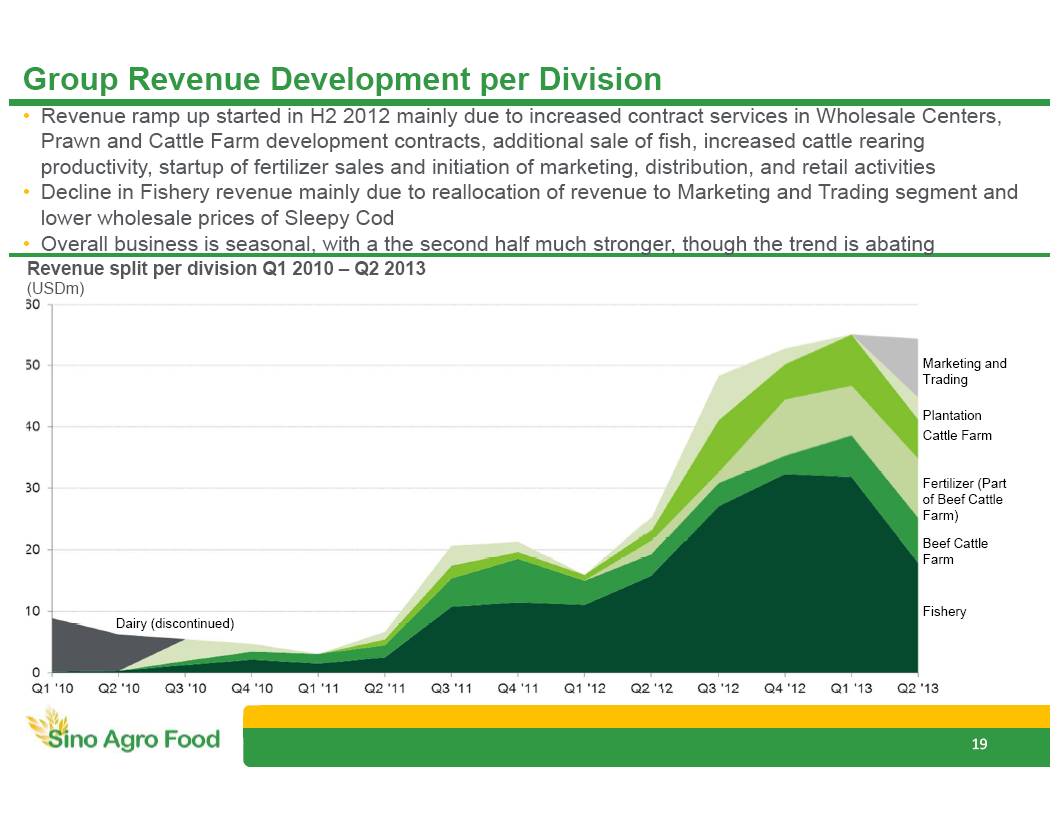
Old 1st: 49 152 68 2nd: 128 192 47 3rd: 4 74 47 Highl: 255 192 0 Text: 83 86 90 New 1st: 123 167 65 2nd: 205 220 68 3rd: 123 205 244 Highl: 201 28 26 Text: 82 94 82 Beef Cattle Farm Cattle Farm Fertilizer (Part of Beef Cattle Farm) Plantation Fishery Group Revenue Development per Division Dairy ( discontinued ) • Revenue ramp up started in H2 2012 mainly due to increased contract services in Wholesale Centers, Prawn and Cattle Farm development contracts, additional sale of fish, increased cattle rearing productivity, startup of fertilizer sales and initiation of marketing, distribution, and retail activities • Decline in Fishery r evenue mainly due to reallocation of revenue to Marketing and Trading segment and lower wholesale prices of Sleepy Cod • Overall business is seasonal, with a the second half much stronger, though the trend is abating Revenue split per division Q1 2010 – Q2 2013 ( USDm ) 19 Marketing and Trading
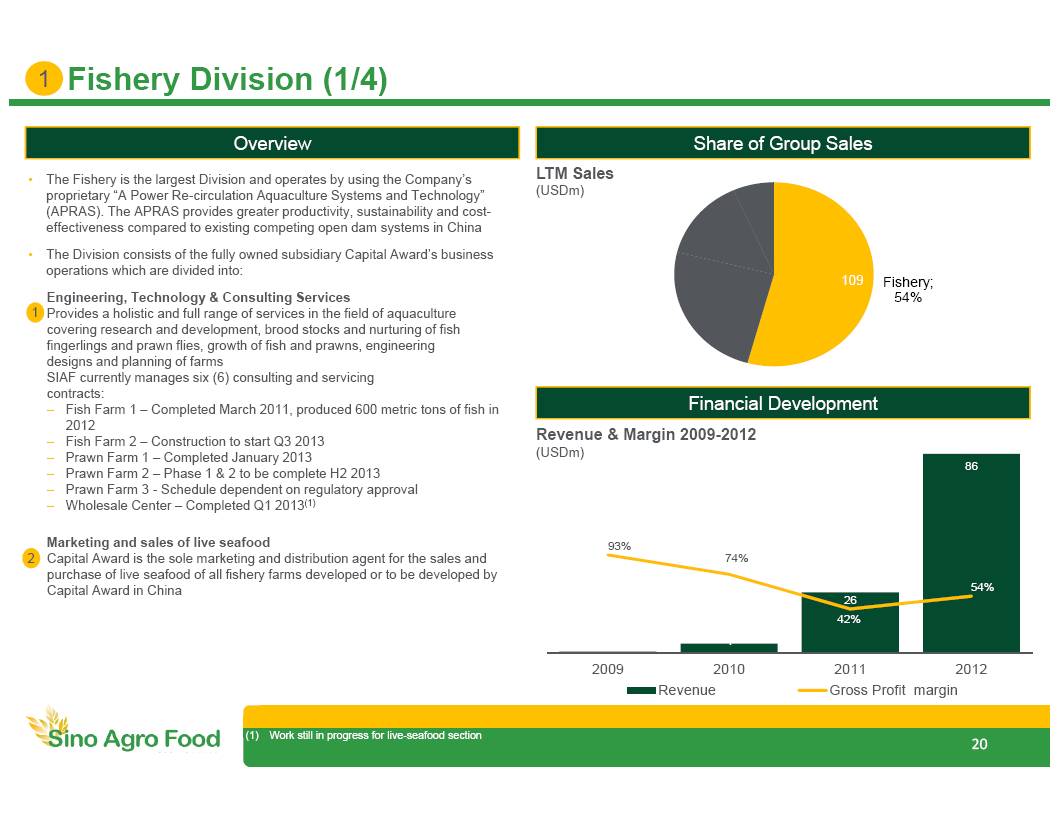
Old 1st: 49 152 68 2nd: 128 192 47 3rd: 4 74 47 Highl: 255 192 0 Text: 83 86 90 New 1st: 123 167 65 2nd: 205 220 68 3rd: 123 205 244 Highl: 201 28 26 Text: 82 94 82 Fishery; 54% 1 4 26 86 93% 74% 42% 54% 2009 2010 2011 2012 Revenue Gross Profit margin • The Fishery is the largest Division and operates by using the Company’s proprietary “A Power Re - circulation Aquaculture Systems and Technology” (APRAS). The APRAS provides greater productivity, sustainability and cost - effectiveness compared to existing competing open dam systems in China • The Division consists of the fully owned subsidiary Capital Award’s business operations which are divided into: Engineering, Technology & Consulting Services Provides a holistic and full range of services in the field of aquaculture covering research and development, brood stocks and nurturing of fish fingerlings and prawn flies, growth of fish and prawns , engineering designs and planning of farms SIAF currently manages six (6) consulting and servicing contracts: – Fish Farm 1 – Completed March 2011, produced 600 metric tons of fish in 2012 – Fish Farm 2 – Construction to start Q3 2013 – Prawn Farm 1 – Completed January 2013 – Prawn Farm 2 – Phase 1 & 2 to be complete H2 2013 – Prawn Farm 3 - Schedule dependent on regulatory approval – Wholesale Center – Completed Q1 2013 (1) Marketing and sales of live seafood Capital Award is the sole marketing and distribution agent for the sales and purchase of live seafood of all fishery farms developed or to be developed by Capital Award in China Fishery Division (1/4) Share of Group Sales Overview Financial Development Revenue & Margin 2009 - 2012 ( USDm ) LTM Sales ( USDm ) 109 (1) Work still in progress for live - seafood section 1 1 2 20
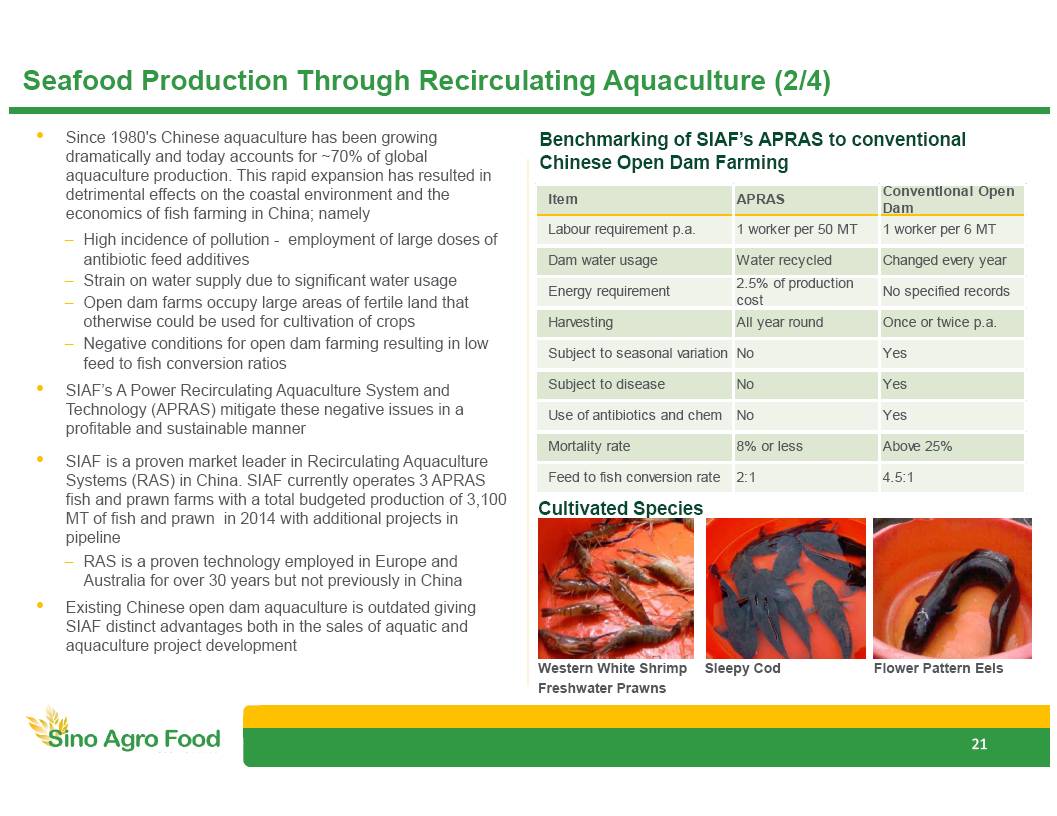
Old 1st: 49 152 68 2nd: 128 192 47 3rd: 4 74 47 Highl: 255 192 0 Text: 83 86 90 New 1st: 123 167 65 2nd: 205 220 68 3rd: 123 205 244 Highl: 201 28 26 Text: 82 94 82 21 Seafood P roduction T hrough Recirculating Aquaculture (2/4) • Since 1980's Chinese aquaculture has been growing dramatically and today accounts for ~70% of global aquaculture production. This rapid expansion has resulted in detrimental effects on the coastal environment and the economics of fish farming in China; namely – High incidence of pollution - employment of large doses of antibiotic feed additives – S train on water supply due to significant water usage – Open dam farms occupy large areas of fertile land that otherwise could be used for cultivation of crops – N egative conditions for open dam farming resulting in low feed to fish conversion ratios • SIAF’s A Power Recirculating Aquaculture System and Technology (APRAS) mitigate these negative issues in a profitable and sustainable manner • SIAF is a proven market leader in Recirculating Aquaculture Systems (RAS) in China. SIAF currently operates 3 APRAS fish and prawn farms with a total budgeted production of 3,100 MT of fish and prawn in 2014 with additional projects in pipeline – RAS is a proven technology employed in Europe and Australia for over 30 years but not previously in China • Existing Chinese open dam aquaculture is outdated giving SIAF distinct advantages both in the sales of aquatic and aquaculture project development Cultivated Species Benchmarking of SIAF’s APRAS to c onventional Chinese Open Dam Farming Western White Shrimp Freshwater Prawns Sleepy Cod Flower Pattern Eels Item APRAS Conventional Open Dam Labour requirement p.a. 1 worker per 50 MT 1 worker per 6 MT Dam water usage Water recycled Changed every year Energy requirement 2.5% of production cost No specified records Harvesting All year round Once or twice p.a. Subject to seasonal variation No Yes Subject to disease No Yes Use of antibiotics and chem No Yes Mortality rate 8% or less Above 25% Feed to fish conversion rate 2:1 4.5:1
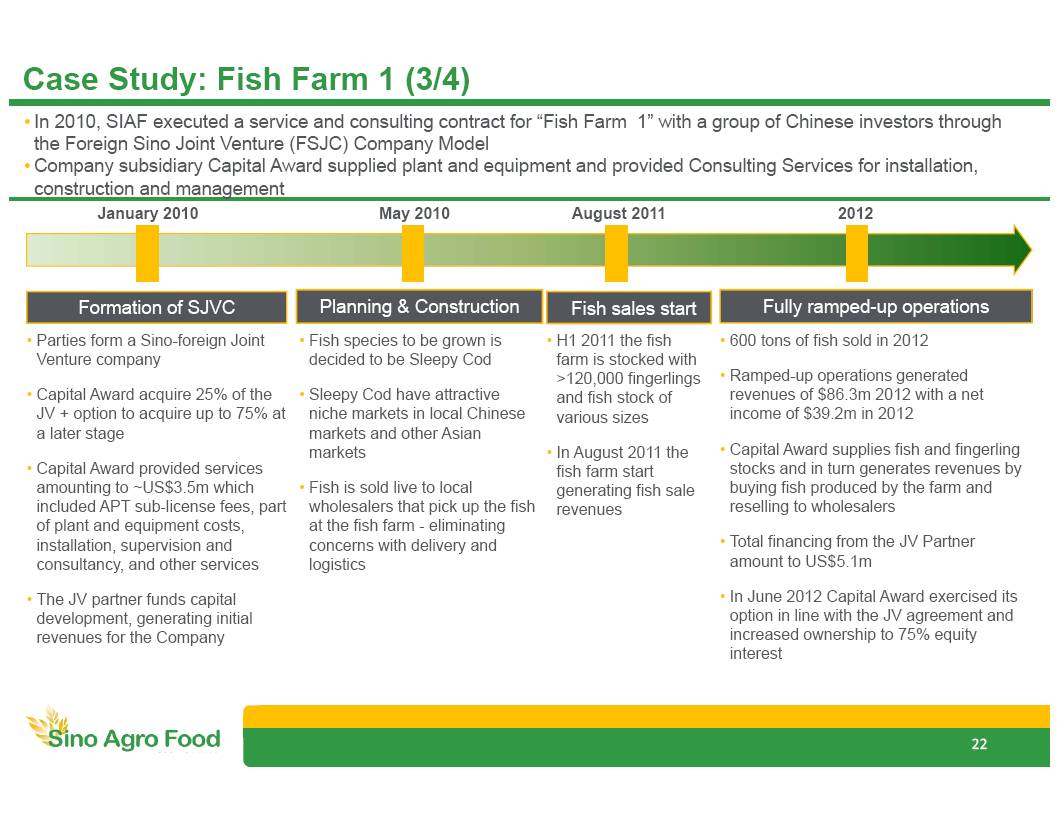
Old 1st: 49 152 68 2nd: 128 192 47 3rd: 4 74 47 Highl: 255 192 0 Text: 83 86 90 New 1st: 123 167 65 2nd: 205 220 68 3rd: 123 205 244 Highl: 201 28 26 Text: 82 94 82 Case Study : Fish Farm 1 (3/4) • In 2010, SIAF executed a service and consulting contract for “Fish Farm 1” with a group of Chinese investors through the Foreign Sino Joint Venture (FSJC) Company Model • Company subsidiary Capital Award supplied plant and equipment and provided Consulting Services for installation, construction and management Planning & Construction Formation of SJVC January 2010 Fish sales start August 2011 Fully ramped - up operations 2012 • Parties form a Sino - foreign Joint Venture company • Capital Award acquire 25% of the JV + option to acquire up to 75 % at a later stage • Capital Award provided services amounting to ~US$3.5m which included APT sub - license fees, part of plant and equipment costs, installation, supervision and consultancy, and other services • The JV partner funds capital development, generating initial revenues for the Company • F ish species to be grown is decided to be Sleepy Cod • Sleepy Cod have attractive niche markets in local Chinese markets and other Asian markets • Fish is sold live to local wholesalers that pick up the fish at the fish farm - eliminating concerns with delivery and logistics • H1 2011 the fish farm is stocked with >120,000 fingerlings and fish stock of various sizes • In August 2011 the fish farm start generating fish sale revenues • 600 tons of fish sold in 2012 • Ramped - up operations generated revenues of $86.3m 2012 with a net income of $39.2m in 2012 • Capital Award supplies fish and fingerling stocks and in turn generates revenues by buying fish produced by the farm and reselling to wholesalers • Total financing from the JV Partner amount to US$5.1m • In June 2012 Capital Award exercised its option in line with the JV agreement and increased ownership to 75% equity interest May 2010 22
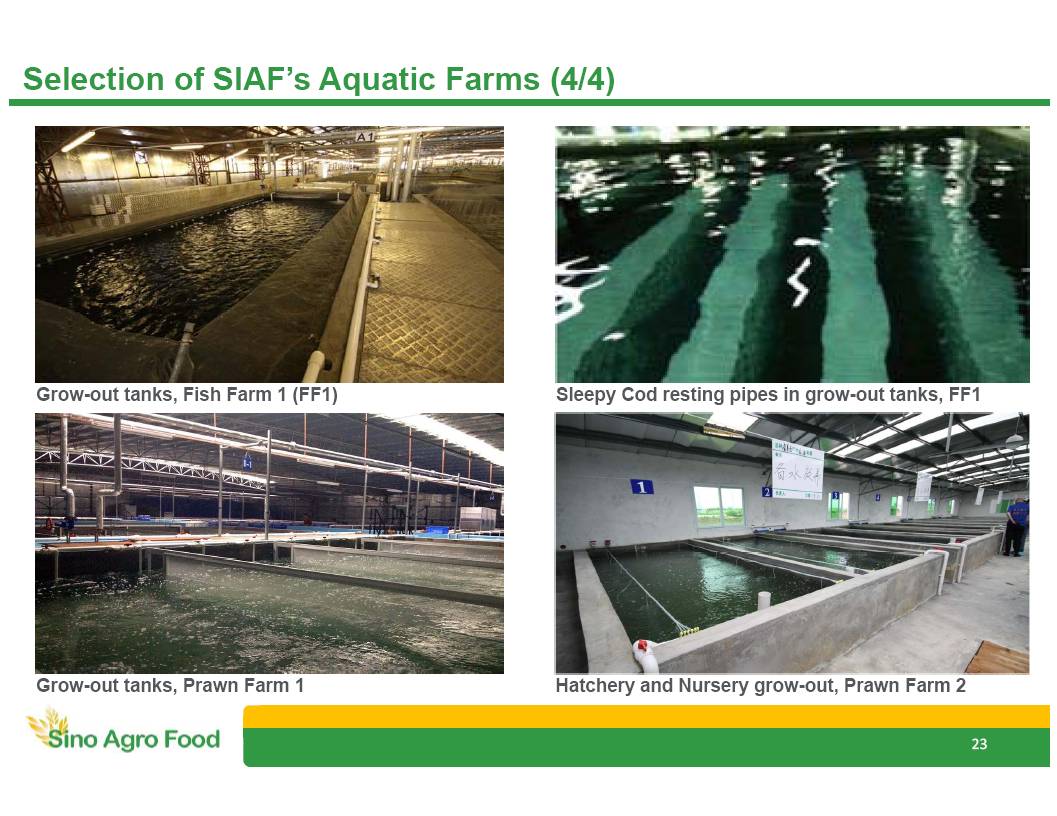
Old 1st: 49 152 68 2nd: 128 192 47 3rd: 4 74 47 Highl: 255 192 0 Text: 83 86 90 New 1st: 123 167 65 2nd: 205 220 68 3rd: 123 205 244 Highl: 201 28 26 Text: 82 94 82 Selection of SIAF’s Aquatic Farms (4/4) 23 Grow - out tanks, Fish Farm 1 (FF1) Grow - out tanks, Prawn Farm 1 Sleepy Cod resting pipes in grow - out tanks, FF1 Hatchery and Nursery grow - out, Prawn Farm 2
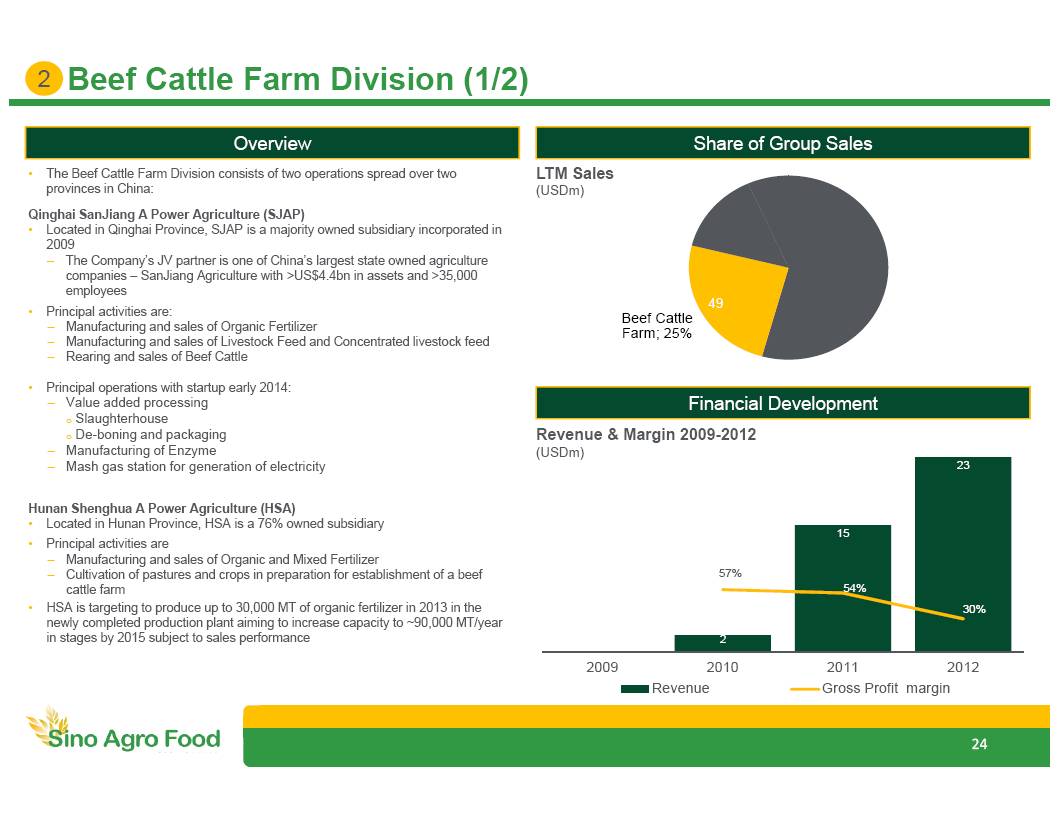
Old 1st: 49 152 68 2nd: 128 192 47 3rd: 4 74 47 Highl: 255 192 0 Text: 83 86 90 New 1st: 123 167 65 2nd: 205 220 68 3rd: 123 205 244 Highl: 201 28 26 Text: 82 94 82 Beef Cattle Farm; 25% 0 2 15 23 57% 54% 30% 2009 2010 2011 2012 Revenue Gross Profit margin Beef Cattle Farm Division (1/2) Share of Group Sales Overview Financial Development • The Beef Cattle Farm Division consists of two operations spread over two provinces in China: Qinghai SanJiang A Power Agriculture (SJAP) • Located in Qinghai Province, SJAP is a majority owned subsidiary incorporated in 2009 – The Company’s JV partner is one of China’s largest state owned agriculture companies – SanJiang Agriculture with >US$4.4bn in assets and >35,000 employees • Principal activities are: – Manufacturing and sales of Organic Fertilizer – Manufacturing and sales of Livestock Feed and Concentrated livestock feed – Rearing and sales of Beef Cattle • Principal operations with startup early 2014: – Value added processing o Slaughterhouse o De - boning and packaging – M anufacturing of Enzyme – Mash gas station for generation of electricity Hunan Shenghua A Power Agriculture (HSA) • Located in Hunan Province, HSA is a 76% owned subsidiary • Principal activities are – Manufacturing and sales of Organic and Mixed Fertilizer – Cultivation of pastures and crops in preparation for establishment of a beef cattle farm • HSA is targeting to produce up to 30,000 MT of organic fertilizer in 2013 in the newly completed production plant aiming to increase capacity to ~90,000 MT/year in stages by 2015 subject to sales performance Revenue & Margin 2009 - 2012 ( USDm ) 49 2 LTM Sales ( USDm ) 24
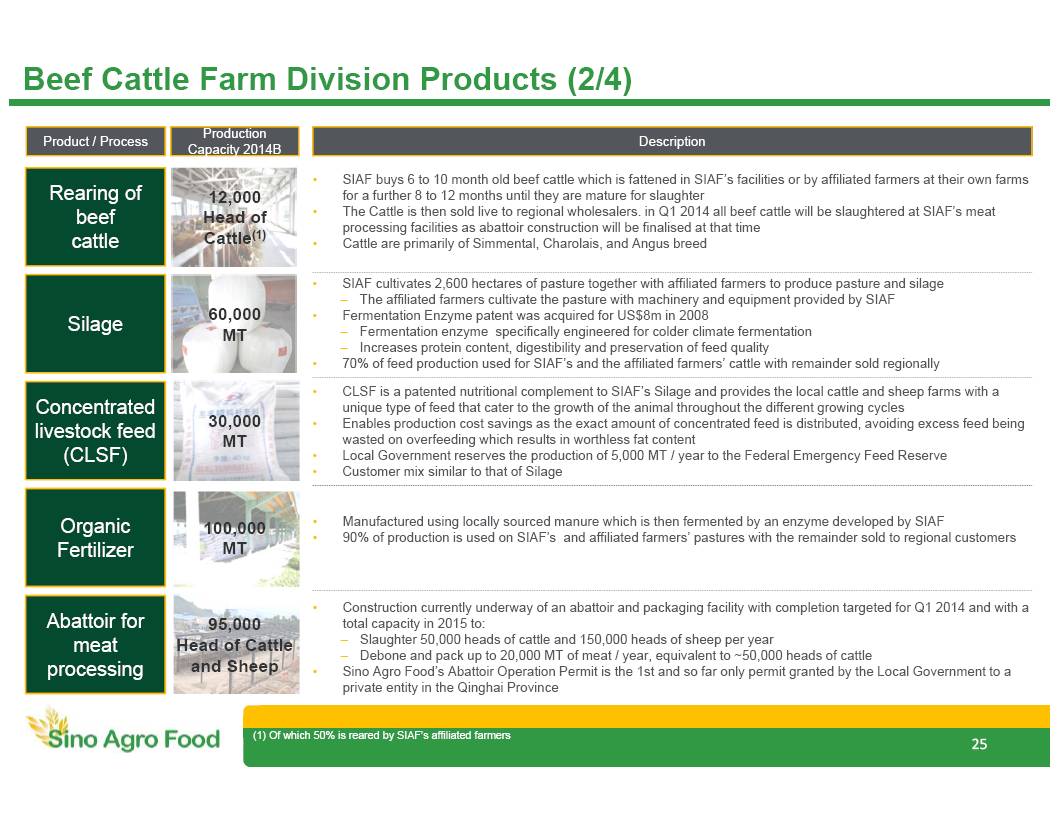
Old 1st: 49 152 68 2nd: 128 192 47 3rd: 4 74 47 Highl: 255 192 0 Text: 83 86 90 New 1st: 123 167 65 2nd: 205 220 68 3rd: 123 205 244 Highl: 201 28 26 Text: 82 94 82 95,000 Head of Cattle and Sheep • SIAF cultivates 2,600 hectares of pasture together with affiliated farmers to produce pasture and silage – T he affiliated farmers cultivate the pasture with machinery and equipment provided by SIAF • Fermentation Enzyme p atent was acquired for US$8m in 2008 – Fermentation enzyme specifically engineered for colder climate fermentation – Increases protein content, digestibility and preservation of feed quality • 70 % of feed production used for SIAF’s and the affiliated farmers’ cattle with remainder sold regionally Beef Cattle Farm Division Products (2/4) Organic Fertilizer • SIAF buys 6 to 10 month old beef cattle which is fattened in SIAF’s facilities or by affiliated farmers at their own farms for a further 8 to 12 months until they are mature for slaughter • The Cattle is then sold live to regional wholesalers . in Q1 2014 all beef cattle will be slaughtered at SIAF’s meat processing facilities as abattoir construction will be finalised at that time • Cattle are primarily of Simmental , Charolais , and Angus breed Product / Process 25 Description • Manufactured using locally sourced manure which is then fermented by an enzyme developed by SIAF • 90% of production is used on SIAF’s and affiliated farmers’ pastures with the remainder sold to regional customers Silage Concentrated livestock feed (CLSF) Rearing of beef cattle Abattoir for meat processing • CLSF is a patented nutritional complement to SIAF’s Silage and provides the local cattle and sheep farms with a unique type of feed that cater to the growth of the animal throughout the different growing cycles • Enables production cost savings as the exact amount of concentrated feed is distributed, avoiding excess feed being wasted on overfeeding which results in worthless fat content • Local Government reserves the production of 5,000 MT / year to the Federal Emergency Feed Reserve • Customer mix similar to that of Silage • Construction currently underway of an abattoir and packaging facility with completion targeted for Q1 2014 and with a total capacity in 2015 to: – Slaughter 50,000 heads of cattle and 150,000 heads of sheep per year – Debone and pack up to 20,000 MT of meat / year, equivalent to ~50,000 heads of cattle • Sino Agro Food’s Abattoir Operation Permit is the 1st and so far only permit granted by the Local Government to a private entity in the Qinghai Province Production Capacity 2014B 100,000 MT 60,000 MT 30,000 MT 12,000 Head of Cattle (1) (1) Of which 50% is reared by SIAF’s affiliated farmers
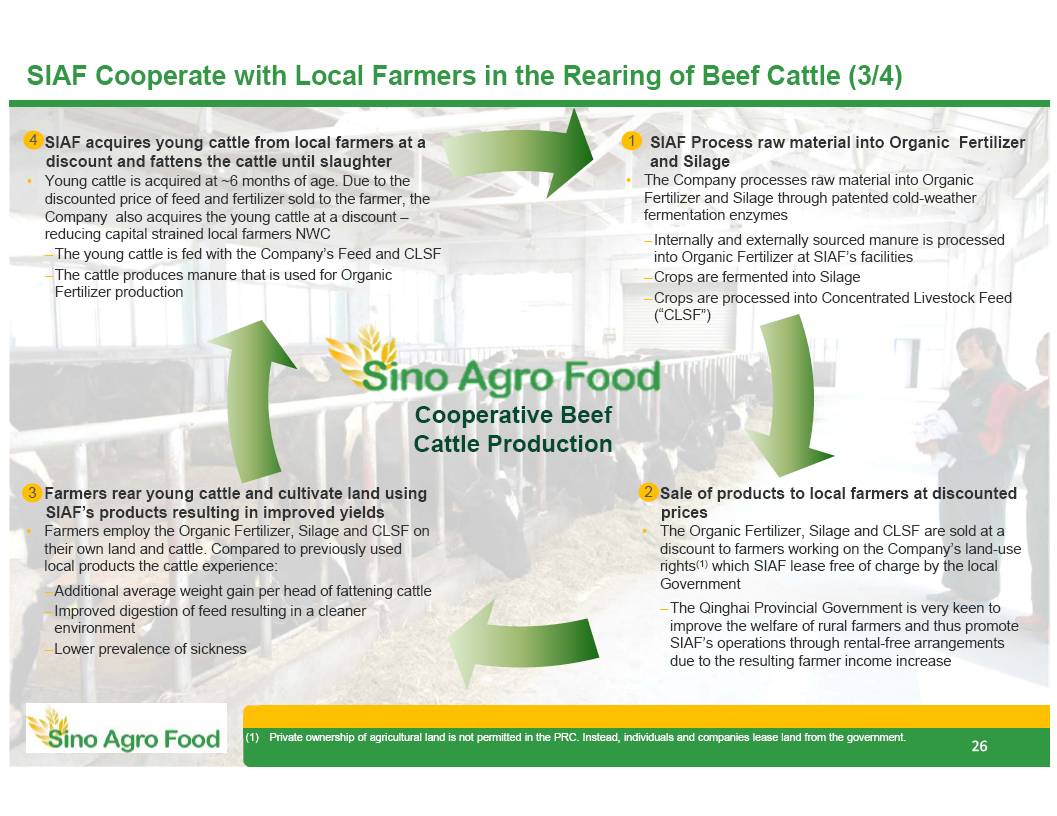
Old 1st: 49 152 68 2nd: 128 192 47 3rd: 4 74 47 Highl: 255 192 0 Text: 83 86 90 New 1st: 123 167 65 2nd: 205 220 68 3rd: 123 205 244 Highl: 201 28 26 Text: 82 94 82 SIAF C ooperate with L ocal Farmers in the R earing of Beef Cattle (3/4 ) Cooperative Beef Cattle Production 26 1. SIAF Process raw material into Organic Fertilizer and Silage • The Company processes raw material into Organic F ertilizer and Silage through patented cold - weather fermentation enzymes – Internally and externally sourced manure is processed into Organic Fertilizer at SIAF’s facilities – Crops are fermented into Silage – Crops are processed into Concentrated Livestock Feed (“CLSF”) 2. Sale of products to local farmers at discounted prices • The Organic Fertilizer, Silage and CLSF are sold at a discount to farmers working on the Company’s land - use rights (1) which SIAF lease free of charge by the local Government – The Qinghai Provincial Government is very keen to improve the welfare of rural farmers and thus promote SIAF’s operations through rental - free arrangements due to the resulting farmer income increase 3. F armers rear young cattle and cultivate land using SIAF’s products resulting in improved yields • Farmers employ the Organic Fertilizer, Silage and CLSF on their own land and cattle. Compared to previously used local products the cattle experience: – Additional average weight gain per head of fattening cattle – Improved digestion of feed resulting in a cleaner environment – Lower prevalence of sicknes s 4. SIAF acquires young cattle from local farmers at a discount and fattens the cattle until slaughter • Y oung cattle is acquired at ~6 months of age. Due to the discounted price of feed and fertilizer sold to the farmer, the Company also acquires the young cattle at a discount – reducing capital strained local farmers NWC – The young cattle is fed with the Company’s Feed and CLSF – The cattle produces manure that is used for Organic Fertilizer production 26 (1) Private ownership of agricultural land is not permitted in the PRC. Instead , individuals and companies lease land from the government. 26 1 2 3 4
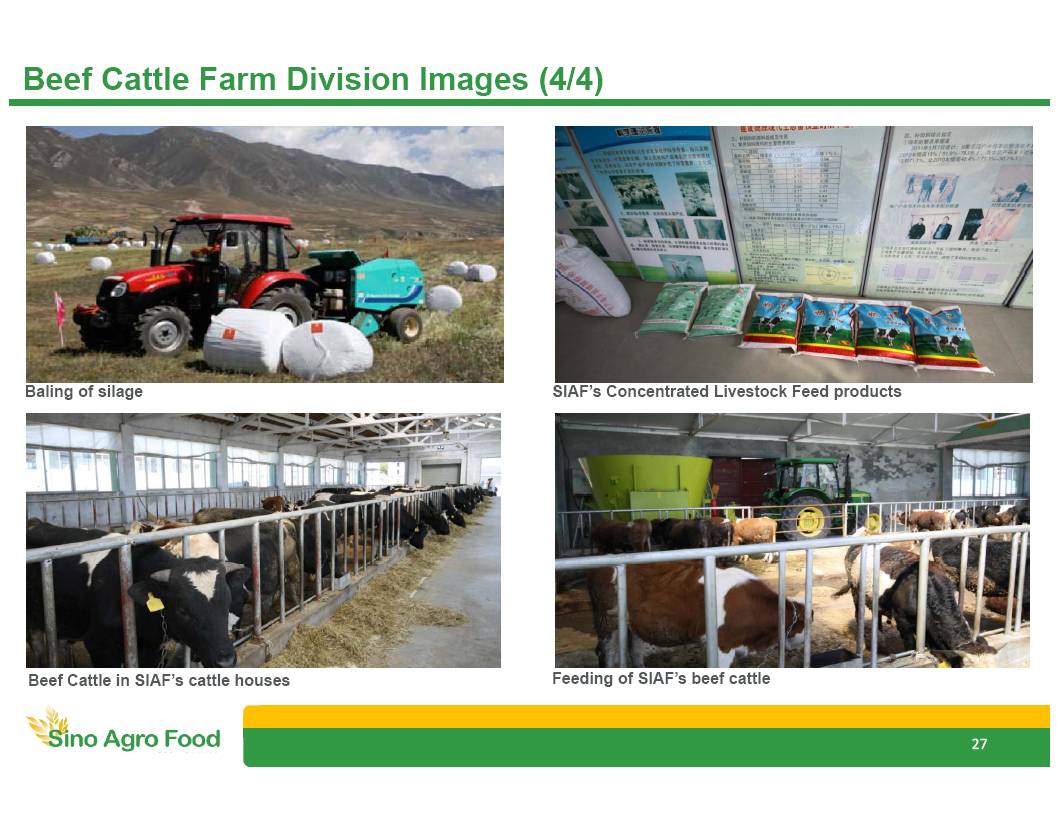
Old 1st: 49 152 68 2nd: 128 192 47 3rd: 4 74 47 Highl: 255 192 0 Text: 83 86 90 New 1st: 123 167 65 2nd: 205 220 68 3rd: 123 205 244 Highl: 201 28 26 Text: 82 94 82 Beef Cattle Farm Division Images (4/4 ) Baling of silage Beef Cattle in SIAF’s cattle houses Feeding of SIAF’s beef cattle SIAF’s Concentrated Livestock Feed products 27
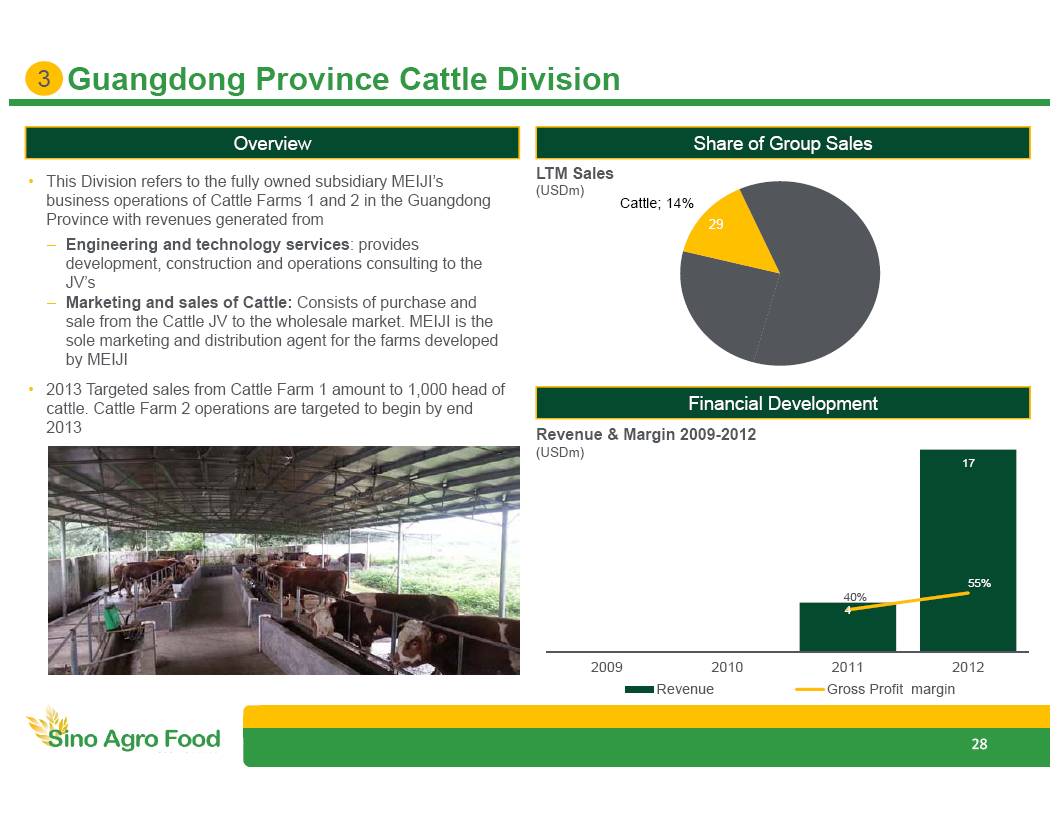
Old 1st: 49 152 68 2nd: 128 192 47 3rd: 4 74 47 Highl: 255 192 0 Text: 83 86 90 New 1st: 123 167 65 2nd: 205 220 68 3rd: 123 205 244 Highl: 201 28 26 Text: 82 94 82 Cattle; 14% 0 0 4 17 40% 55% 2009 2010 2011 2012 Revenue Gross Profit margin Guangdong Province Cattle Division Share of Group Sales Overview Financial Development • This Division refers to the fully owned subsidiary MEIJI’s business operations of Cattle Farms 1 and 2 in the Guangdong Province with revenues generated from – Engineering and technology services : provides development, construction and operations consulting to the JV’s – Marketing and sales of Cattle: Consists of purchase and sale from the Cattle JV to the wholesale market . MEIJI is the sole marketing and distribution agent for the farms developed by MEIJI • 2013 Targeted sales from Cattle Farm 1 amount to 1,000 head of cattle. Cattle Farm 2 o perations are targeted to begin by end 2013 Revenue & Margin 2009 - 2012 ( USDm ) LTM Sales ( USDm ) 29 3 28

Old 1st: 49 152 68 2nd: 128 192 47 3rd: 4 74 47 Highl: 255 192 0 Text: 83 86 90 New 1st: 123 167 65 2nd: 205 220 68 3rd: 123 205 244 Highl: 201 28 26 Text: 82 94 82 HU Plantation; 7% 3 5 6 12 72% 61% 66% 58% 2009 2010 2011 2012 Revenue Gross Profit margin HU Plantation Division Share of Group Sales Overview Financial Development • Consists of 187 cultivated acres of Hylocereus Undatus (Dragon Fruit F lowers) in the Guangdong Province • Dragon Fruit cacti take three years to reach full maturity , and thereafter produce up to 20 years • The plantation was developed in 2008 with revenues generated since year 2009 • Three types of operations – G rowth and sales of flowers consumed as vegetables – D rying and value added processing and sales of HU flower products which are used in health - related soups and teas – In 2013 a second crop will have its first harvest; “Immortal Vegetables.” Revenue & margin 2007 - 2012 ( USDm ) 13 4 LTM Sales ( USDm ) 29
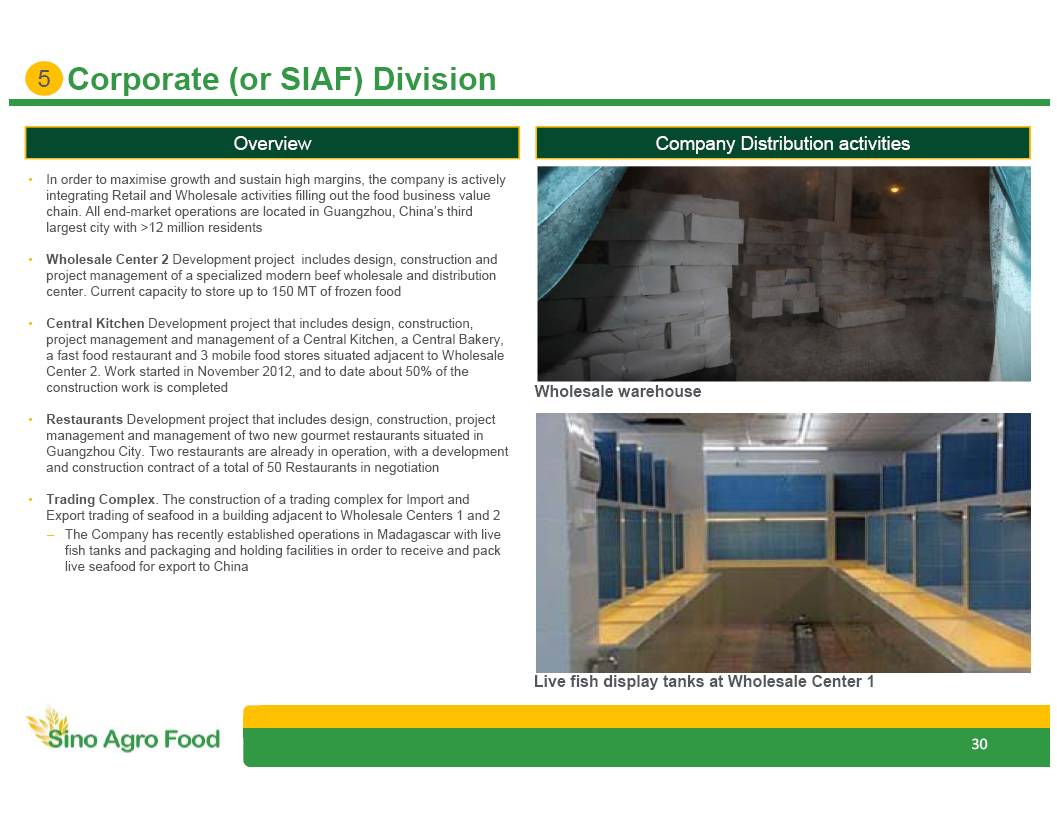
Old 1st: 49 152 68 2nd: 128 192 47 3rd: 4 74 47 Highl: 255 192 0 Text: 83 86 90 New 1st: 123 167 65 2nd: 205 220 68 3rd: 123 205 244 Highl: 201 28 26 Text: 82 94 82 Corporate (or SIAF) Division Company Distribution activitie s Overview • In order to maximise growth and sustain high margins, the company is actively integrating Retail and Wholesale activities filling out the food business value chain. All end - market operations are located in Guangzhou, China’s third largest city with >12 million residents • Wholesale Center 2 Development project includes design, construction and project management of a specialized modern beef wholesale and distribution center. Current capacity to store up to 150 MT of frozen food • Central Kitchen Development project that includes design, construction, project management and management of a Central Kitchen, a Central Bakery, a fast food restaurant and 3 mobile food stores situated adjacent to Wholesale Center 2. Work started in November 2012, and to date about 50% of the construction work is completed • Restaurants Development project that includes design, construction, project management and management of two new gourmet restaurants situated in Guangzhou City. Two restaurants are already in operation, with a development and construction contract of a total of 50 Restaurants in negotiation • Trading Complex . The construction of a trading complex for Import and Export trading of seafood in a building adjacent to Wholesale Centers 1 and 2 – The Company has recently established operations in Madagascar with live fish tanks and packaging and holding facilities in order to receive and pack live seafood for export to China 5 Wholesale warehouse Live fish display tanks at Wholesale Center 1 30
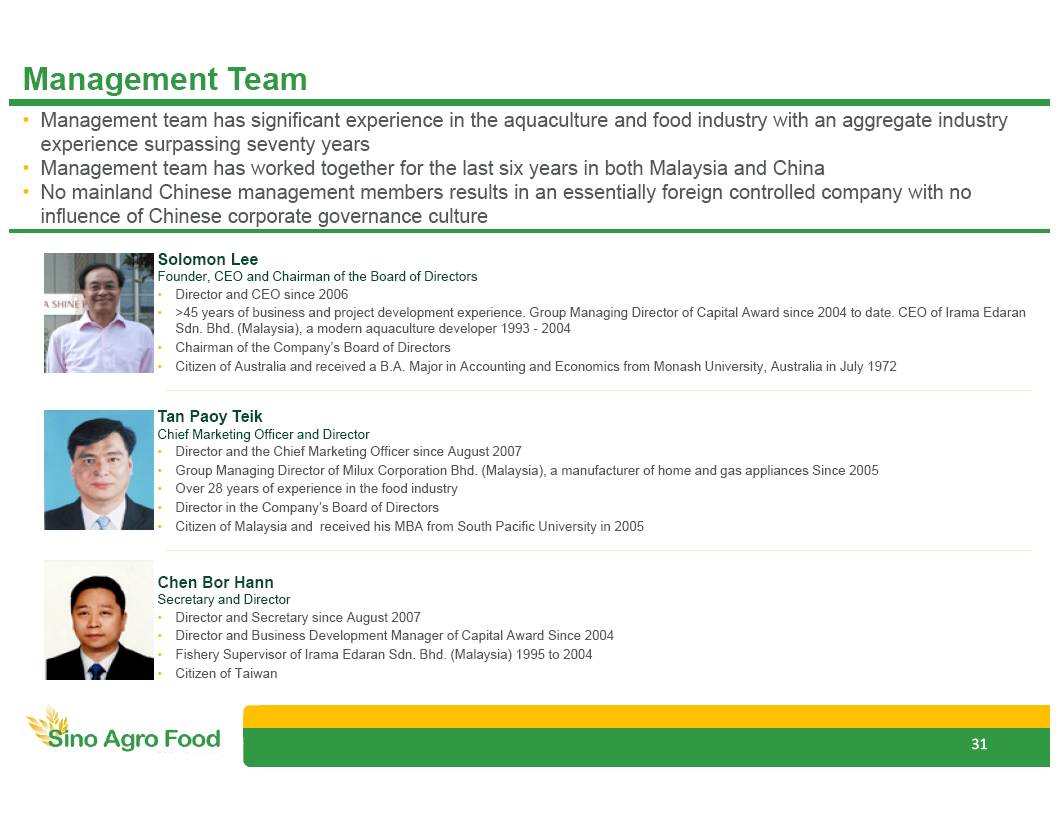
Old 1st: 49 152 68 2nd: 128 192 47 3rd: 4 74 47 Highl: 255 192 0 Text: 83 86 90 New 1st: 123 167 65 2nd: 205 220 68 3rd: 123 205 244 Highl: 201 28 26 Text: 82 94 82 Management Team • M anagement team has significant experience in the aquaculture and food industry with an aggregate industry experience surpassing seventy years • M anagement team has worked together for the last six years in both Malaysia and China • No mainland Chinese management members results in an essentially foreign controlled company with no influence of Chinese corporate g overnance culture Solomon Lee Founder, CEO and Chairman of the Board of Directors • Director and CEO since 2006 • > 45 years of business and project development experience. Group Managing Director of Capital Award since 2004 to date. CEO of Irama Edaran Sdn . Bhd . ( Malaysia), a modern aquaculture developer 1993 - 2004 • Chairman of the Company’s Board of Directors • C itizen of Australia and received a B.A . Major in Accounting and Economics from Monash University, Australia in July 1972 Tan Paoy Teik Chief Marketing Officer and Director • Director and the Chief Marketing Officer since August 2007 • Group Managing Director of Milux Corporation Bhd. (Malaysia ), a manufacturer of home and gas appliances Since 2005 • Over 28 years of experience in the food industry • Director in the Company’s Board of Directors • C itizen of Malaysia and received his MBA from South Pacific University in 2005 Chen Bor Hann Secretary and Director • Director and Secretary since August 2007 • Director and Business Development Manager of Capital Award Since 2004 • Fishery Supervisor of Irama Edaran Sdn . Bhd. (Malaysia) 1995 to 2004 • C itizen of Taiwan 31
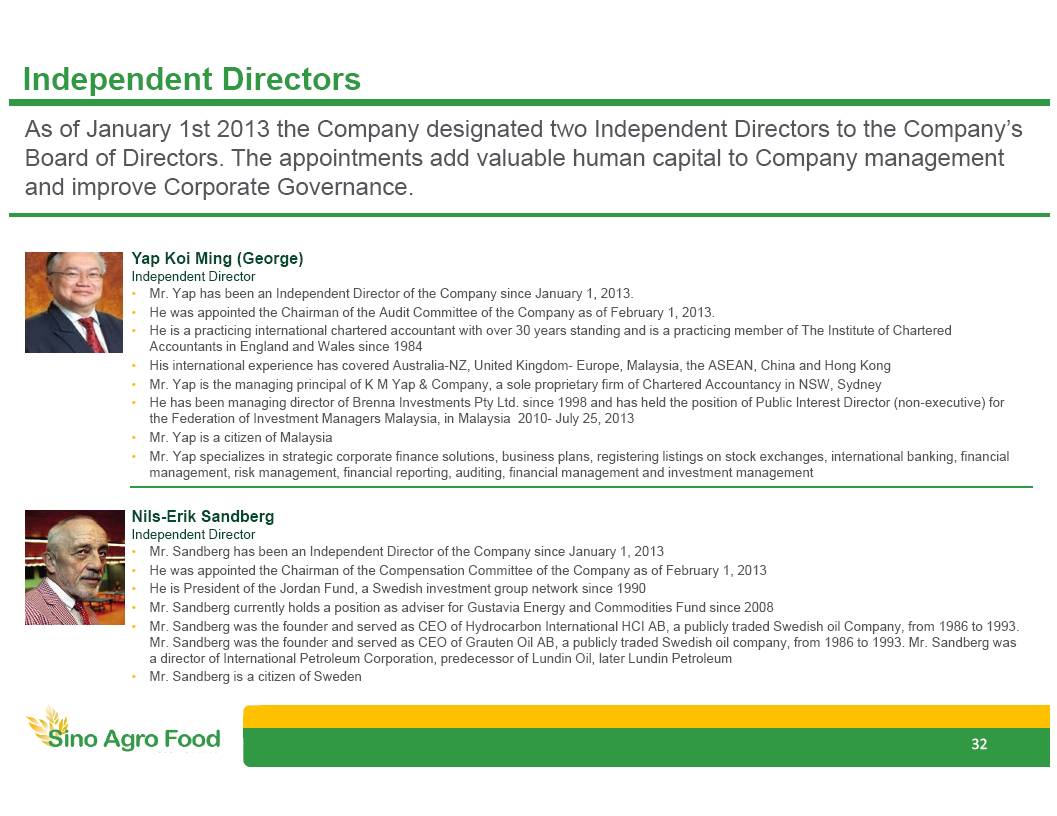
Old 1st: 49 152 68 2nd: 128 192 47 3rd: 4 74 47 Highl: 255 192 0 Text: 83 86 90 New 1st: 123 167 65 2nd: 205 220 68 3rd: 123 205 244 Highl: 201 28 26 Text: 82 94 82 Yap Koi Ming (George ) Independent Director • Mr. Yap has been an Independent Director of the Company since January 1, 2013. • He was appointed the Chairman of the Audit Committee of the Company as of February 1, 2013 . • He is a practicing international chartered accountant with over 30 years standing and is a practicing member of The Institute of Chartered Accountants in England and Wales since 1984 • His international experience has covered Australia - NZ, United Kingdom - Europe , Malaysia, the ASEAN, China and Hong Kong • Mr . Yap is the managing principal of K M Yap & Company, a sole proprietary firm of Chartered Accountancy in NSW, Sydney • He has been managing director of Brenna Investments Pty Ltd . since 1998 and has held the position of Public Interest Director (non - executive) for the Federation of Investment Managers Malaysia , in Malaysia 2010 - July 25, 2013 • Mr. Yap is a citizen of Malaysia • Mr. Yap specializes in strategic corporate finance solutions, business plans, registering listings on stock exchanges, intern ati onal banking, financial management, risk management, financial reporting, auditing, financial management and investment management Independent Directors As of January 1st 2013 the Company designated two Independent Directors to the Company’s Board of Directors. The appointments add valuable human capital to Company management and improve Corporate Governance. Nils - Erik Sandberg Independent Director • Mr . Sandberg has been an Independent Director of the Company since January 1, 2013 • He was appointed the Chairman of the Compensation Committee of the Company as of February 1, 2013 • He is President of the Jordan Fund, a Swedish investment group network since 1990 • Mr . Sandberg currently holds a position as adviser for Gustavia Energy and Commodities Fund since 2008 • Mr . Sandberg was the founder and served as CEO of Hydrocarbon International HCI AB, a publicly traded Swedish oil Company, from 1986 to 1993. Mr. Sandberg was the founder and served as CEO of Grauten Oil AB, a publicly traded Swedish oil company, from 1986 to 1993. Mr. Sandberg was a director of International Petroleum Corporation, predecessor of Lundin Oil, later Lundin Petroleum • Mr. Sandberg is a citizen of Sweden 32
Old 1st: 49 152 68 2nd: 128 192 47 3rd: 4 74 47 Highl: 255 192 0 Text: 83 86 90 New 1st: 123 167 65 2nd: 205 220 68 3rd: 123 205 244 Highl: 201 28 26 Text: 82 94 82 Agenda 33 1 . Executive Summary 2. Company Overview 3. Financial Review 4. Industry Overview 5 . Appendix
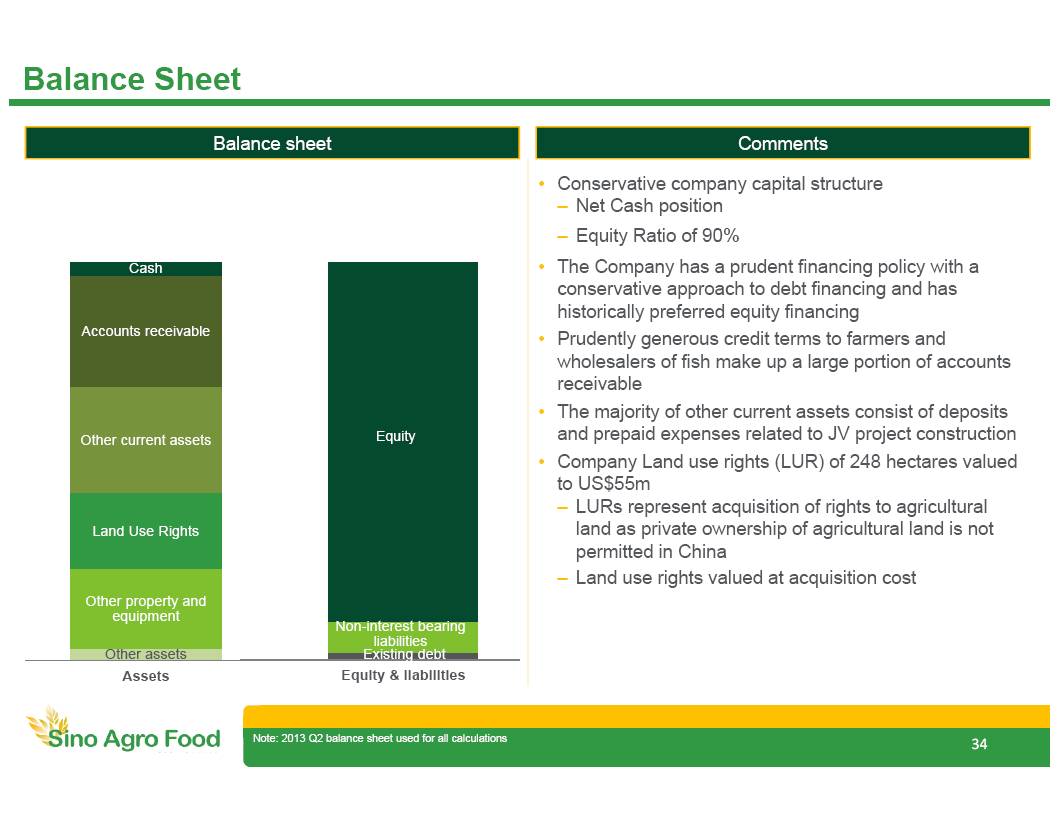
Old 1st: 49 152 68 2nd: 128 192 47 3rd: 4 74 47 Highl: 255 192 0 Text: 83 86 90 New 1st: 123 167 65 2nd: 205 220 68 3rd: 123 205 244 Highl: 201 28 26 Text: 82 94 82 Existing debt New debt Non - interest bearing liabilities Equity Equity & liabilities Other assets Other property and equipment Land Use Rights Other current assets Accounts receivable Cash Assets Balance Sheet 34 Comments Balance sheet Note: 2013 Q2 balance sheet used for all calculations (2) • Conservative company capital structure – Net Cash position – Equity Ratio of 90% • The Company has a prudent financing policy with a conservative approach to debt financing and has historically preferred equity financing • Prudently generous credit terms to farmers and wholesalers of fish make up a large portion of accounts receivable • The majority of other current assets consist of deposits and prepaid expenses related to JV project construction • Company Land use r ights (LUR) of 248 hectares valued to US$55m – LURs r epresent acquisition of rights to agricultural land as private ownership of agricultural land is not permitted in China – Land use rights valued at acquisition cost
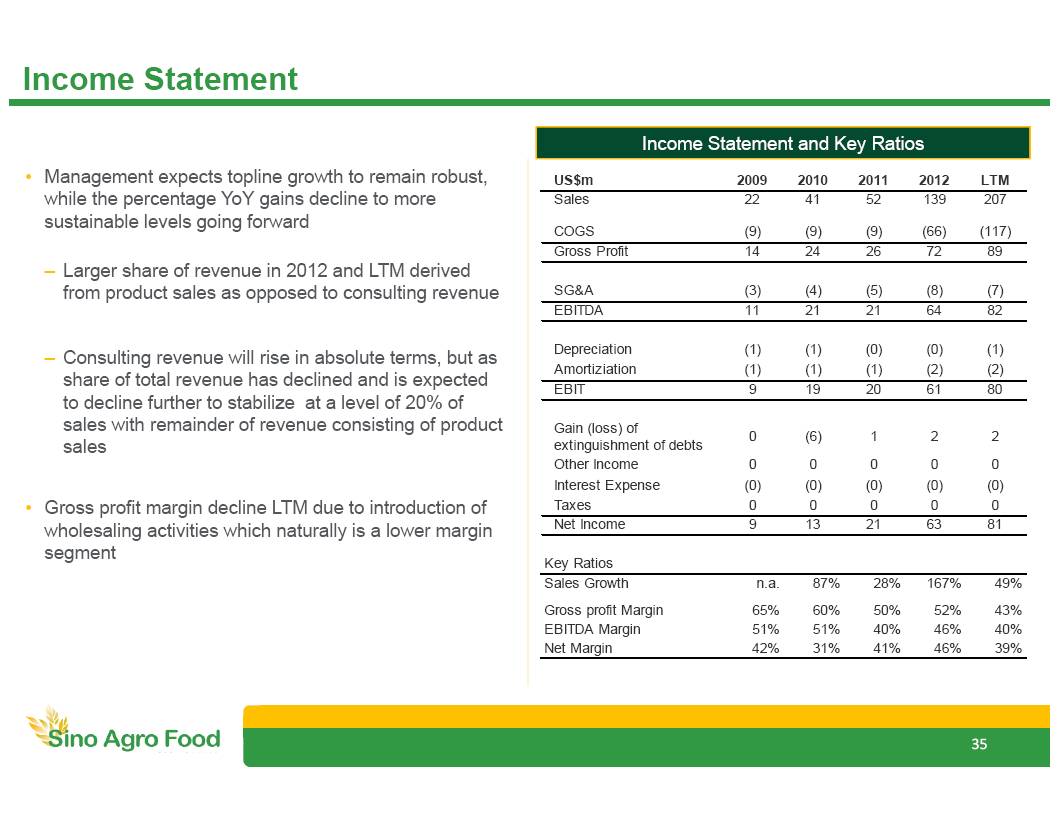
Old 1st: 49 152 68 2nd: 128 192 47 3rd: 4 74 47 Highl: 255 192 0 Text: 83 86 90 New 1st: 123 167 65 2nd: 205 220 68 3rd: 123 205 244 Highl: 201 28 26 Text: 82 94 82 Income Statement 35 Income Statement and Key Ratios (2) • Management expects topline growth to remain robust, while the percentage YoY gains decline to more sustainable levels going forward – Larger share of revenue in 2012 and LTM derived from product sales as opposed to consulting revenue – Consulting r evenue will rise in absolute terms, but as share of total r evenue has declined and is expected to decline further to stabilize at a level of 20% of sales with remainder of revenue consisting of product sales • Gross profit margin decline LTM due to introduction of wholesaling activities which naturally is a lower margin segment US$m 2009 2010 2011 2012 LTM Sales 22 41 52 139 207 COGS (9) (9) (9) (66) (117) Gross Profit 14 24 26 72 89 SG&A (3) (4) (5) (8) (7) EBITDA 11 21 21 64 82 Depreciation (1) (1) (0) (0) (1) Amortiziation (1) (1) (1) (2) (2) EBIT 9 19 20 61 80 Gain (loss) of extinguishment of debts 0 (6) 1 2 2 Other Income 0 0 0 0 0 Interest Expense (0) (0) (0) (0) (0) Taxes 0 0 0 0 0 Net Income 9 13 21 63 81 Key Ratios Sales Growth n.a. 87% 28% 167% 49% Gross profit Margin 65% 60% 50% 52% 43% EBITDA Margin 51% 51% 40% 46% 40% Net Margin 42% 31% 41% 46% 39%
Old 1st: 49 152 68 2nd: 128 192 47 3rd: 4 74 47 Highl: 255 192 0 Text: 83 86 90 New 1st: 123 167 65 2nd: 205 220 68 3rd: 123 205 244 Highl: 201 28 26 Text: 82 94 82 Agenda 36 1 . Executive Summary 2. Company Overview 3. Financial Review 4. Industry Overview 5 . Appendix
Old 1st: 49 152 68 2nd: 128 192 47 3rd: 4 74 47 Highl: 255 192 0 Text: 83 86 90 New 1st: 123 167 65 2nd: 205 220 68 3rd: 123 205 244 Highl: 201 28 26 Text: 82 94 82 1) OECD Economic Outlook No. 92 (database ) / OECD economic surveys: China 2013 2) The World Bank; China 2030, Building a Modern, Harmonious, and Creative Society, 2013 3) USITC: China’s Agricultural Trade: Competitive Conditions and Effects on U.S. Exports, March 2011 4) USDA’s GAIN Report Number: CH12073 per 12/28/2012 5) The State of World Fisheries and Aquaculture 2012, FAO 6) China and Hong Kong: Food Opportunities for Maine, March 2012 7) Rabobank 8) Frost & Sullivan: China’s beef market has great growth potential 9) Fertilizers in China, Freedonia Group; June 2012 Industry Overview Economic outlook in China Agriculture in China (3) The market for aquatic and aquaculture in China (4) The market for beef and meat in China The market for fertilizer in China (9) • The OECD expects that China’s real GDP will grow by 8.5% in 2013 and by 8.9% in 2014 (1) • The strong growth in China has delivered major improvements in living standards and poverty has been reduced dramatically recently with China graduating from lower to upper middle - income status (2) • Agricultural employment has been falling for a decade at an average rate of 3.5% annually, with massive migration from the co unt ryside to cities. Continuing migration of workers out of agriculture is expected to help boost farming profitability, leading to furthe r g ains from mechanisation (1) 1 • China is the world’s largest agricultural economy • About 40% of China’s population is employed in the agricultural sector, and agriculture contributes ~11 % to China’s GDP • Food is the largest class of household expenditure for all Chinese income groups • Government support to the agricultural sector indicates that policymakers are placing a renewed emphasis on the rural economy • H igher incomes are leading to changing food preferences, including the demand for better quality and safer foods • China is the world’s largest aquatic producer and its market share has risen from 7% in 1961 to 35% by 2010 (5) • China is the world largest aquaculture producer with total cultured aquatic production accounting for ~70 % of world total • Prices for aquatic products are expected to grow in 2013 due to increases in the price of feed and other inputs • Development of processing, distribution and improved consumer affluence boosts demand for more diversified diets , including seafood • D emand has increased for imported frozen aquatic products commonly available in supermarkets – Product identification such as brands and country of origin are important tools to attract consumer interest • By 2015 total meat output is estimated to 85 million tons, of which ~ 63% is pork (6) • Since 2007 China has gradually turned into a net importer of meats from previously maintaining self - sufficiency in meat (6 ) • Beef consumption has risen steadily over the last few years; rising incomes, dietary shift and urbanization are key drivers – Beef consumption is expected to rise by 24% per capita in the coming decade – Beef is a niche product in China accounting for only 8% of per capita meat consumption (7)(8) • Further regulation of China's beef industry will likely ensure sufficient supply of cattle and promote beef industry development (8) • Demand for fertilizer in China is forecast to increase 3.3% per annum through 2015 • Fertilizer sales is expected to be supported by an expansion of agricultural activities as sown acreage continues to grow and ru ral income levels rise • Subsidies aimed directly at cutting the cost of fertilizers is expected to encourage additional use 2 3 4 5
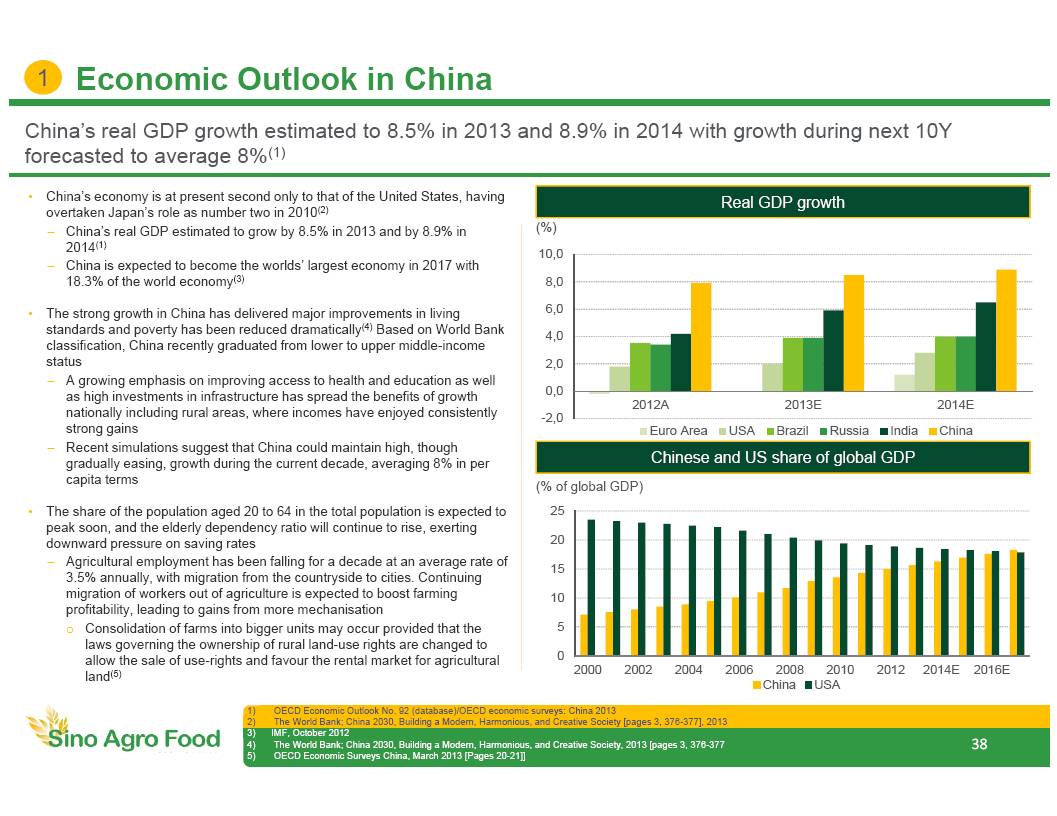
Old 1st: 49 152 68 2nd: 128 192 47 3rd: 4 74 47 Highl: 255 192 0 Text: 83 86 90 New 1st: 123 167 65 2nd: 205 220 68 3rd: 123 205 244 Highl: 201 28 26 Text: 82 94 82 -2,0 0,0 2,0 4,0 6,0 8,0 10,0 2012A 2013E 2014E Euro Area USA Brazil Russia India China China’s real GDP growth estimated to 8.5 % in 2013 and 8.9% in 2014 with growth during next 10Y forecasted to average 8% (1) Economic Outlook in China 1 38 Real GDP growth (%) • China’s economy is at present second only to that of the United States, having overtaken Japan’s role as number two in 2010 (2) – China’s real GDP estimated to grow by 8.5% in 2013 and by 8.9% in 2014 (1) – China is expected to become the worlds’ largest economy in 2017 with 18.3% of the world economy (3) • The strong growth in China has delivered major improvements in living standards and poverty has been reduced dramatically (4) Based on World Bank classification, China recently graduated from lower to upper middle - income status – A growing emphasis on improving access to health and education as well as high investments in infrastructure has spread the benefits of growth nationally including rural areas, where incomes have enjoyed consistently strong gains – Recent simulations suggest that China could maintain high, though gradually easing, growth during the current decade, averaging 8% in per capita terms • The share of the population aged 20 to 64 in the total population is expected to peak soon, and the elderly dependency ratio will continue to rise, exerting downward pressure on saving rates – Agricultural employment has been falling for a decade at an average rate of 3.5% annually, with migration from the countryside to cities. Continuing migration of workers out of agriculture is expected to boost farming profitability, leading to gains from more mechanisation o C onsolidation of farms into bigger units may occur provided that the laws governing the ownership of rural land - use rights are changed to allow the sale of use - rights and favour the rental market for agricultural land (5) 1) OECD Economic Outlook No. 92 (database)/OECD economic surveys: China 2013 2) The World Bank; China 2030, Building a Modern, Harmonious, and Creative Society [pages 3, 376 - 377], 2013 3) IMF, October 2012 4) The World Bank; China 2030, Building a Modern, Harmonious, and Creative Society, 2013 [pages 3, 376 - 377 5) OECD Economic Surveys China, March 2013 [Pages 20 - 21]] Chinese and US share of global GDP (% of global GDP) 0 5 10 15 20 25 2000 2002 2004 2006 2008 2010 2012 2014E 2016E China USA
Old 1st: 49 152 68 2nd: 128 192 47 3rd: 4 74 47 Highl: 255 192 0 Text: 83 86 90 New 1st: 123 167 65 2nd: 205 220 68 3rd: 123 205 244 Highl: 201 28 26 Text: 82 94 82 0 100 200 300 400 500 600 1984 1989 1994 1999 2004 2009 Agriculture in China (1/2) 2 39 Agriculture in Chinese economy • China is the world’s largest agricultural economy. It is the leading producer and consumer of many agricultural commodities such as pork and rice – China has historically been successful in meeting its rapidly rising demand for food and fiber by increasing domestic production, but has now emerged as a leading global importer of several agricultural commodities • About 40% of China’s population of 1.3 billion is employed in the agricultural sector with agriculture contributing ~11 % to China’s GDP (1) Government support for agriculture • The Chinese central government’s current producer and consumer support (2) policy incentivises the transition from grain self - sufficiency and low consumer prices toward raising farm household incomes, placing a renewed emphasis on the rural economy – Indirect support, in the form of general services, is very high relative to similar support programs in other countries, due largely to investments in agricultural infrastructure o General services include modern research and extension services, food safety agencies, and agricultural price information services which provide benefits to producers and consumers throughout the economy (1) Agricultural consumption • China is a major global consumer of agricultural products • The traditional Chinese diet centers around grains and starches staple foods which account for nearly one - half of the daily caloric intake • Chinese food consumption is influenced by factors including population size, demographics , income, food prices, and general preferences – Per capita income growth and urbanization are the main factors responsible for altering recent consumption patterns o Rising income translates into higher per capita food consumption o I ncreasing urbanization is driving diversification of food choices because of greater availability and choice offered through increasingly diverse sales outlet. U rban diets contain less grain and more processed non staple food items compared to the rural diet. Rural migrants to cities tend to adopt the urban diet (1) I nvestment into agricultural sector central government budget support (3) Per capita food consumption development 1980 - 2009 (3) (Billion Y uan in 2008 prices) (kg/person) 0 20 40 60 80 100 120 1980 1990 2000 2009 Rice Wheat Other grains 0 20 40 60 1980 1990 2000 2009 Milk Meat Fish Government support to the agricultural sector indicates that policymakers are placing a renewed emphasis on the rural economy (1) USITC : China’s Agricultural Trade: Competitive Conditions and Effects on U.S. Exports, March 2011 [pages 1 - 1 and1 - 8 ] (2) OECD: Producer and Consumer Support (PSE) is defined as the estimated monetary value of transfers from consumers and taxpayers to farmers, expressed as a percentage of gross farm receipts (defined as the value of total farm production at farmgate prices), plus budgetary support (3) Feeding Growing Food Demand in China , Jikun Huang Center for Chinese Agricultural Policy Chinese Academy of Sciences, April 201 2
Old 1st: 49 152 68 2nd: 128 192 47 3rd: 4 74 47 Highl: 255 192 0 Text: 83 86 90 New 1st: 123 167 65 2nd: 205 220 68 3rd: 123 205 244 Highl: 201 28 26 Text: 82 94 82 Expenditure on food • Food is the largest class of household expenditure for all Chinese income groups • Urban residents spend substantially more on food than their rural counterparts • Higher incomes lead to an increase in both the quantity and quality of food demanded • Demand for higher quantities of food stabilise in top income households while demand for higher - quality foods continues to rise with income • Spending on food consumed outside the home is rising – Most expenditures are made in restaurants. Although consumption away from the household is increasing, most foods are still eaten at home. The exception is meat, with about half of all meat consumed outside the home Food preferences • Higher incomes lead to changing food preferences, including demand for better quality, safer and more varied food – I ncome growth and urbanisation is expected to increase demand for a variety of higher quality foods • Similar to other developing countries, the traditional Chinese diet comprises mostly of grains and other starch staples – Consumption of non - staple, higher - value foods such as meat (especially pork), dairy, fruits, vegetables, and processed food has grown significantly in the past three decades o 30% of the food currently consumed in China has been processed in some way • The Chinese consume about four times as much pork as poultry, the second most popular animal protein – Pork consumption has been encouraged by improved cold storage distribution, as the product can be transported greater distances to reach more customers – Pork consumption levels are also high due to government support programs, including purchasing pork for reserves and occasionally subsidizing pork purchases for low - income consumers • Food quality and safety are important factors affecting Chinese food preferences – High income urban groups that focus their expenditure on high - quality products also seek assurance that their food is safe – Safety concerns can determine where certain foods are bought: fresh produce is usually purchased at a wet market because fresher produce is perceived to be safer, while meats are increasingly bought at a supermarket because of the availability of cold storage (1) Food; 36% Clothing; 10% Residence; 10% Household Facilities, Articles and Services ; 6% Healthcare and Medical Services; 7% Transport & Communications ; 14% Education, Cultural and Recreation Services; 13% Miscellanous goods and services ; 4% Agriculture in China (2/2) 2 40 Average per capita annual expenditure of urban households, 2009 (2) Per capita food consumption in 2009, Urban and Rural split (3) (kg) Higher incomes and urbanisation are leading to changing food preferences, including the demand for better quality and safer foods 0 20 40 60 80 100 120 Rice Wheat Fruits Red meat and poultry Milk Urban Rural (1) USITC : China’s Agricultural Trade: Competitive Conditions and Effects on U.S. Exports, March 2011 [pages 1 - 1 and1 - 8 ] (2) China Statistical Yearbook 2011 (3) Feeding Growing Food Demand in China , Jikun Huang Center for Chinese Agricultural Policy Chinese Academy of Sciences, April 2012
Old 1st: 49 152 68 2nd: 128 192 47 3rd: 4 74 47 Highl: 255 192 0 Text: 83 86 90 New 1st: 123 167 65 2nd: 205 220 68 3rd: 123 205 244 Highl: 201 28 26 Text: 82 94 82 The Market for Aquatic and Aquaculture in China 2,1% 5,6% 4,6% Wild catch Fish Farming Total Aquatic Production 3 41 • China has the world’s largest aquatic production and its market share has risen from 7% in 1961 to 35% by 2010 (1) Aquaculture • After China opened up to the outside world in the 1980's, the aquaculture sector has been growing dramatically, becoming one of the fastest growing agriculture sectors (2) • China is the world largest aquaculture producer accounting for ~70% of global aquaculture production • Aquaculture acreage and investments in production expansion is slowing overall – Government officials relate that environmental concerns and the rapid industrialization/urbanization of China’s coastal regions hamper further aquaculture expansion • Fish is the most common type of seafood cultivated through aquaculture with a total production of 22.8 million tons, accounting for 69% of all aquatic fish production in 2011 – Carp remains the most popular cultured freshwater fish accounting for 72% of total freshwater cultured fish production Aquatic Consumption • Development of processing, distribution and improved consumer affluence boosts demand for more diversified diets, including seafood • Per capita consumption of aquatic products was 14.6 Kg per urban dweller and 5.4 Kg per rural inhabitant in 2011 – Per capita consumption is expected to increase steadily, with strong growth potential in the rural sector – The per capita consumption of aquatic products is highest in coastal regions, such as Shanghai and Guangdong, and locations with relatively high disposable income • Prices for aquatic products are expected to grow in 2013, reflecting increases in the price of feed and other inputs Marketing • Demand has increased for imported frozen aquatic products commonly available in supermarkets – Product identification such as brands and country of origin are important tools to attract consumer interest – With the proper display, high - value imported items can be promoted to customers – Importers claim high value U.S. seafood products are easy to sell in both first and second tier cities (3) CAGR by production method 2008 - 2011 Consumption Trends for Pork, Beef, Poultry and Mutton in China (4) ,0 5,000 10,000 15,000 20,000 25,000 2009 2010 2011 Other Algae Shrimp, Prawn & Crab Shellfish Fish • China is the world largest aquaculture producer with production accounting for ~70% of world total • Prices for aquatic products are expected to grow in 2013 due to increases in the price of feed and other inputs (1) The State of World Fisheries and Aquaculture 2012, FAO (2) FAO – National Aquaculture Sector Overview China (3) USDA’s GAIN Report Number: CH12073 per 12/28/2012
Old 1st: 49 152 68 2nd: 128 192 47 3rd: 4 74 47 Highl: 255 192 0 Text: 83 86 90 New 1st: 123 167 65 2nd: 205 220 68 3rd: 123 205 244 Highl: 201 28 26 Text: 82 94 82 0 6 12 18 24 30 36 2006 2007 2008 2009 2010 2011 Urban Rural Asia and Pacific 56% North America 8% Europe 6% Other 4% Africa 8% Latin America and Caribbean 18% S China is the world’s largest producer and consumer of meat including pork, poultry and beef with a 27% market share The Market for Meat in China 4 42 • China is the world’s largest producer and consumer of meat including pork, poultry and beef with a 27% market share – 2011 Meat production amounted to 79 million tons consisting of ~63% pork o 2015 meat production in is targeted to reach 85 million tons, consisting of ~ 63% pork according to the Government’s 5 - year plan – Since 2007 China has gradually turned into a net importer of meat from previously maintaining self - sufficiency in meat (1) Meat Market Drivers • Improved consumer purchasing power stimulate the growth of beef markets as beef sells at premium prices and traditionally goes beyond the population's affordable level – R ising purchasing power has led to a dietary pattern change switching from consumption of traditional food grain to an increase in consumption of meat products – Chinese traditionally employ pork and chicken as meat sources due to beef being considered expensive o With the improvement of living standards Chinese have upgraded their meat consumption to include more beef – Consumption of red meat is perceived to have higher status than consumption of poultry or pork • Chinese people's diet is becoming more diversified and healthy, introducing larger amounts of beef as beef has nutritional benefits to pork – Beef has high protein content, low fat content with unsaturated fatty acids, thus making it a healthier kind of meat compared to pork • Additional regulation of China's beef industry will likely strive to ensure sufficient supply of cattle and promote the development of the beef industry – Chinese government policies are expected to support the adequate supply of cattle and improve the quality of beef products resulting in safer and healthier beef products and a more sophisticated beef consumption (2) 1 2 3 1) China’s growing appetite for meats: Implications for World meat trade. A Multi - Client Study, April 2012 2) China and Hong Kong: Food Opportunities for Maine, Maine International Trade Center, March 2012 Frost & Sullivan: China’s beef market has great growth potential China’s growing appetite for meats: Implications for World meat trade. A Multi - Client Study, April 2012 3) Meat - OECD - FAO Agricultural Outlook 2012 - 2021 4) 2011 China Statistical Yearbook Table 10 - 9 and 10 - 33 Expected increase in meat demand between 2012 and 2021 by region(3) Consumption Trends for Pork, Beef, Poultry and Mutton in China (4) (Per Capita Consumption in kilogram per year)
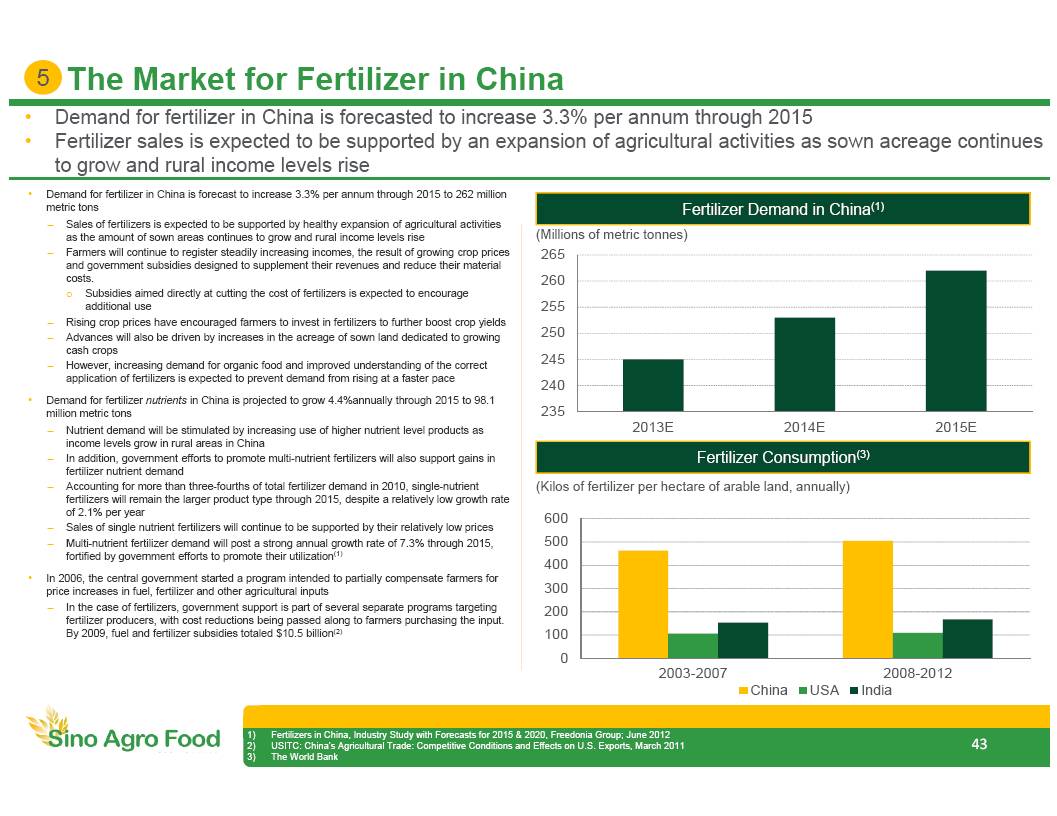
Old 1st: 49 152 68 2nd: 128 192 47 3rd: 4 74 47 Highl: 255 192 0 Text: 83 86 90 New 1st: 123 167 65 2nd: 205 220 68 3rd: 123 205 244 Highl: 201 28 26 Text: 82 94 82 235 240 245 250 255 260 265 2013E 2014E 2015E • Demand for fertilizer in China is forecasted to increase 3.3% per annum through 2015 • Fertilizer sales is expected to be supported by an expansion of agricultural activities as sown acreage continues to grow and rural income levels rise The Market for Fertilizer in China 5 43 Fertilizer Demand in China (1) ( Millions of m etric tonnes) • Demand for fertilizer in China is forecast to increase 3.3% per annum through 2015 to 262 million metric tons – Sales of fertilizers is expected to be supported by healthy expansion of agricultural activities as the amount of sown areas continues to grow and rural income levels rise – Farmers will continue to register steadily increasing incomes, the result of growing crop prices and government subsidies designed to supplement their revenues and reduce their material costs. o Subsidies aimed directly at cutting the cost of fertilizers is expected to encourage additional use – R ising crop prices have encouraged farmers to invest in fertilizers to further boost crop yields – Advances will also be driven by increases in the acreage of sown land dedicated to growing cash crops – However, increasing demand for organic food and improved understanding of the correct application of fertilizers is expected to prevent demand from rising at a faster pace • Demand for fertilizer nutrients in China is projected to grow 4.4%annually through 2015 to 98.1 million metric tons – Nutrient demand will be stimulated by increasing use of higher nutrient level products as income levels grow in rural areas in China – In addition, government efforts to promote multi - nutrient fertilizers will also support gains in fertilizer nutrient demand – Accounting for more than three - fourths of total fertilizer demand in 2010, single - nutrient fertilizers will remain the larger product type through 2015, despite a relatively low growth rate of 2.1% per year – Sales of single nutrient fertilizers will continue to be supported by their relatively low prices – Multi - nutrient fertilizer demand will post a strong annual growth rate of 7.3% through 2015, fortified by government efforts to promote their utilization (1) • In 2006, the central government started a program intended to partially compensate farmers for price increases in fuel, fertilizer and other agricultural inputs – In the case of fertilizers, government support is part of several separate programs targeting fertilizer producers, with cost reductions being passed along to farmers purchasing the input. By 2009, fuel and fertilizer subsidies totaled $10.5 billion (2) 1) Fertilizers in China, Industry Study with Forecasts for 2015 & 2020, Freedonia Group; June 2012 2) USITC : China’s Agricultural Trade: Competitive Conditions and Effects on U.S. Exports, March 2011 3) The World Bank Fertilizer Consumption (3) (Kilos of f ertilizer per hectare of arable land, annually) 0 100 200 300 400 500 600 2003-2007 2008-2012 China USA India
Old 1st: 49 152 68 2nd: 128 192 47 3rd: 4 74 47 Highl: 255 192 0 Text: 83 86 90 New 1st: 123 167 65 2nd: 205 220 68 3rd: 123 205 244 Highl: 201 28 26 Text: 82 94 82 Agenda 44 1. Transaction Summary 2 . Company Overview 3. Financial Review 4 . Industry Overview 5 . Appendix
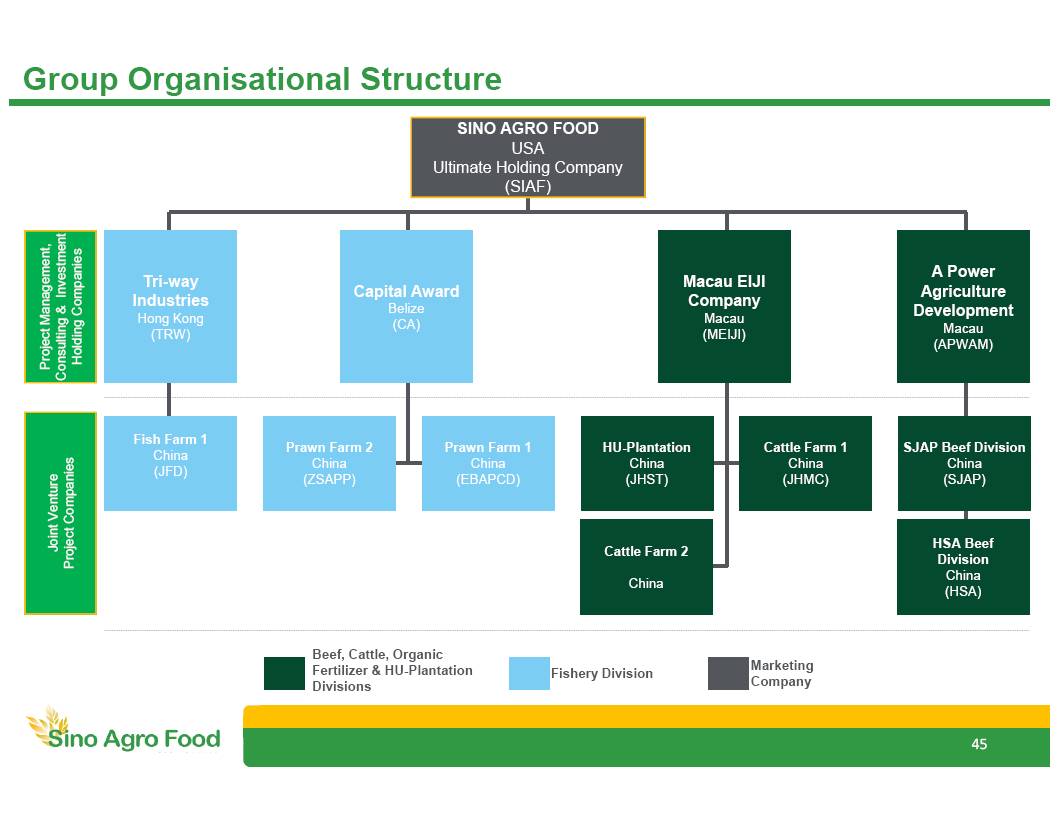
Old 1st: 49 152 68 2nd: 128 192 47 3rd: 4 74 47 Highl: 255 192 0 Text: 83 86 90 New 1st: 123 167 65 2nd: 205 220 68 3rd: 123 205 244 Highl: 201 28 26 Text: 82 94 82 Group Organisational Structure Capital Award Belize (CA) Prawn Farm 2 China (ZSAPP) Prawn Farm 1 China (EBAPCD) Cattle Farm 2 China Macau EIJI Company Macau (MEIJI) SJAP Beef Division China (SJAP) HSA Beef Division China (HSA) A Power Agriculture Development Macau (APWAM) Fish Farm 1 China (JFD) Tri - way Industries Hong Kong (TRW) Fishery Division Beef, Cattle, Organic Fertilizer & HU - Plantation Divisions Marketing Company HU - Plantation China (JHST) Cattle Farm 1 China (JHMC) Project Management, Consulting & Investment Holding Companies Joint Venture Project Companies SINO AGRO FOOD USA Ultimate Holding Company (SIAF ) 45
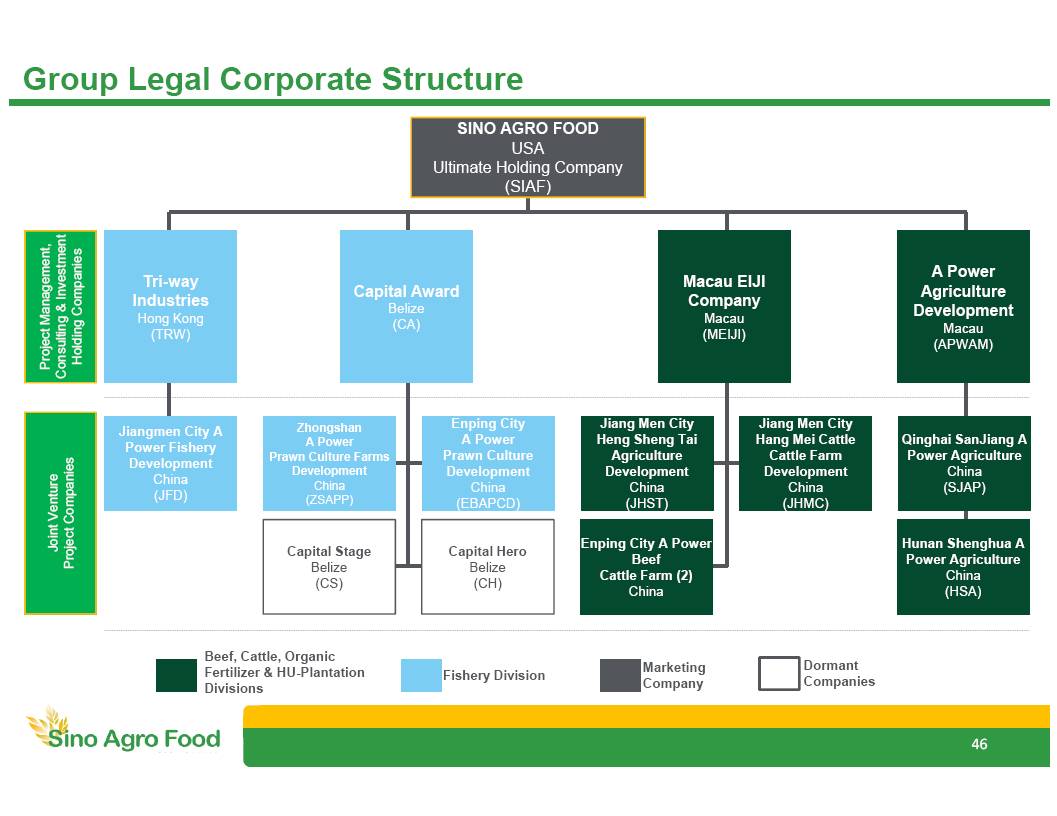
Old 1st: 49 152 68 2nd: 128 192 47 3rd: 4 74 47 Highl: 255 192 0 Text: 83 86 90 New 1st: 123 167 65 2nd: 205 220 68 3rd: 123 205 244 Highl: 201 28 26 Text: 82 94 82 Group Legal Corporate Structure Capital Award Belize (CA) Capital Stage Belize (CS) Capital Hero Belize (CH) Zhongshan A Power Prawn Culture Farms Development China (ZSAPP) Enping City A Power Prawn Culture Development China (EBAPCD) Enping City A Power Beef Cattle Farm (2) China Macau EIJI Company Macau (MEIJI) Qinghai SanJiang A Power Agriculture China (SJAP) Hunan Shenghua A Power Agriculture China (HSA) A Power Agriculture Development Macau (APWAM) Jiangmen City A Power Fishery Development China (JFD) Tri - way Industries Hong Kong (TRW) Dormant Companies Jiang Men City Heng Sheng Tai Agriculture Development China (JHST) Jiang Men City Hang Mei Cattle Cattle Farm Development China (JHMC) Project Management, Consulting & Investment Holding Companies Joint Venture Project Companies SINO AGRO FOOD USA Ultimate Holding Company (SIAF) Fishery Division Beef, Cattle, Organic Fertilizer & HU - Plantation Divisions Marketing Company 46