UNITED STATES
SECURITIES AND EXCHANGE COMMISSION
Washington, D.C. 20549
FORM 20-F
(Mark One)
[_] REGISTRATION STATEMENT PURSUANT TO SECTION 12(b) OR (g) OF THE SECURITIES EXCHANGE ACT OF 1934
OR
[X] ANNUAL REPORT PURSUANT TO SECTION 13 OR 15(d) OF THE SECURITIES EXCHANGE ACT OF 1934
For the fiscal year endedApril 30, 2012
OR
[_] TRANSITION REPORT PURSUANT TO SECTION 13 OR 15(d) OF THE SECURITIES EXCHANGE ACT OF 1934
For the transition period from ____________ to __________
OR
[_] SHELL COMPANY REPORT PURSUANT TO SECTION 13 OR 15(d) OF THE SECURITIES EXCHANGE ACT OF 1934
Date of event requiring this shell company report _______________
Commission file number000-54149
BRIDGEPORT VENTURES INC.
(Exact name of Registrant as specified in its charter)
N/A
(Translation of Registrant’s name into English)
Ontario
(Jurisdiction of incorporation or organization)
1000 - 36 Toronto Street, Toronto, Ontario M5C 2C5
(Address of principal executive offices)
Carmelo Marrelli, phone (416) 848-0106, fax (416) 361-0923, carm@marrellisupport.ca
(Name, Telephone, E-mail and/or Facsimile number and Address of Company Contact Person)
Securities registered or to be registered pursuant to Section 12(b) of the Act:
None
1
Securities registered or to be registered pursuant to Section 12(g) of the Act:
Common Shares, without par value
(Title of Class)
Securities for which there is a reporting obligation pursuant to Section 15(d) of the Act: None
Indicate the number of outstanding shares of each of the issuer’s classes of capital or common stock as of the close of the period covered by the annual report.50,579,600
Indicate by check mark if the registrant is a well-known seasoned issuer, as defined in Rule 405 of the Securities Act.
Yes [_] No [X]
If this report is an annual or transition report, indicate by check mark if the registrant is not required to file reports pursuant to Section 13 or 15(d) of the Securities Exchange Act of 1934.
Yes [_] No [X]
Indicate by check mark whether the registrant (1) has filed all reports required to be filed by Section 13 or 15(d) of the Securities Exchange Act of 1934 during the preceding 12 months (or for such shorter period that the registrant was required to file such reports), and (2) has been subject to such filing requirements for the past 90 days.
Yes [X] No [_]
Indicate by check mark whether the registrant has submitted electronically and posted on its Web site, if any, every Interactive Data File required to be submitted and posted pursuant to Rule 405 of Regulation S-T during the preceding 12 months (or for such shorter period that the registrant was required to submit and post such files).
Yes [_] No [_]
Indicate by check mark whether the registrant is a large accelerated filer, an accelerated filer, or a non-accelerated filer. See definition of “accelerated filer and large accelerated filer” in Rule 12b-2 of the Exchange Act. (Check one):
| Large accelerated filer [_] | Accelerated filer [_] | Non-accelerated filer [X] |
Indicate by check mark which basis of accounting the registrant has used to prepare the financial statements included in this filing:
| U.S. GAAP [_] | International Financial Reporting Standards as Issued by the International Accounting Standards Board [X] | Other [_] |
If “Other” has been checked in response to the previous question, indicate by check mark which financial statement item the registrant has elected to follow:
Item 17 [X] Item 18 [_]
If this is an annual report, indicate by check mark whether the registrant is a shell company (as defined in Rule 12b-2 of the Exchange Act).
Yes [_] No [X]
2
| BRIDGEPORT VENTURES INC. |
| FORM 20-F ANNUAL REPORT |
| TABLE OF CONTENTS |
| Part I | Page | |
| Item 1. | Identity of Directors, Senior Management and Advisers | 9 |
| Item 2. | Offer Statistics and Expected Timetable | 9 |
| Item 3. | Key Information | 9 |
| Item 4. | Information on the Company | 21 |
| Item 4A. | Unresolved Staff Comments | 77 |
| Item 5. | Operating and Financial Review and Prospects | 77 |
| Item 6. | Directors, Senior Management and Employees | 91 |
| Item 7. | Major Shareholders and Related Party Transactions | 101 |
| Item 8. | Financial Information | 105 |
| Item 9. | The Offer and Listing | 106 |
| Item 10. | Additional Information | 107 |
| Item 11. | Quantitative and Qualitative Disclosures About Market Risk | 117 |
| Item 12. | Description of Securities Other than Equity Securities | 117 |
| Part II | ||
| Item 13. | Defaults, Dividend Arrearages and Delinquencies | 117 |
| Item 14. | Material Modifications to the Rights of Security Holders and Use of Proceeds | 117 |
| Item 15. | Controls and Procedures | 117 |
| Item 16. | [Reserved] | 118 |
| Item 16A. | Audit committee financial expert | 118 |
| Item 16B. | Code of Ethics | 118 |
| Item 16C. | Principal Accountant Fees and Services | 118 |
| Item 16D. | Exemptions from the Listing Standards for Audit Committees | 119 |
| Item 16E. | Purchases of Equity Securities by the Issuer and Affiliated Purchasers | 119 |
| Item 16F. | Changes in Registrant’s Certifying Accountant | 119 |
| Item 16G. | Corporate Governance | 119 |
| Item 16H. | Mine Safety Disclosure | 119 |
| Part III | ||
| Item 17. | Financial Statements | 120 |
| Item 18. | Financial Statements | 168 |
| Item 19. | Exhibits | 168 |
3
GLOSSARY OF TECHNICAL TERMS
Assay means the quantitative test of minerals and ore by chemical and/or fire assay techniques.
Breccia means composed of broken rock fragments held together by a mineral cement or in a fine-grained matrix.
Clastic means pertaining to a rock or sediment composed principally of broken fragments that are derived from pre-existing rocks or minerals and that have been transported some distance from their places of origin; also said of the texture of such a rock.
Conglomerates means a coarse-grained clastic sedimentary rock, composed of rounded to subangular fragments, set in a fine-graned matrix.
Cretaceous means a geological period between 66 and 135 million years ago and which identifies the formation date of strata.
Gangue means the valueless rock or mineral aggregates in an ore.
GISmeans Geographical Information System.
gptmeans grams per ton.
Hydrothermal Alteration means the chemical and mineralogical changes in rock brought about by the addition or removal of materials by hydrothermal fluids (for example, silicification).
Igneous means a rock or mineral that solidified from molten or partly molten material.
Intrusive means a rock formed by the process of emplacement of magma in pre-existing rock.
Lithology means the description of rocks on the basis of such characteristics as color, mineralogic composition, and grain size.
Magma means naturally occurring mobile rock material, generated within the earth and capable of intrusion and extrusion and from which igneous rocks are thought to have been derived through solidification and related processes.
McCart Property means the property comprised of two mineral claims totaling approximately 534 hectares located in McCart Township, Porcupine Mining Division, Ontario known as the McCart Property, in which Bridgeport Ventures Inc. (the “Corporation”) holds a 100% interest, subject to a 2% NSR with respect to two such mineral claims and a 1% NSR with respect to three such mineral claims.
Mineral Deposit means a deposit of mineralization which may or may not be ore, the determination of which requires a comprehensive feasibility study. A mineral deposit usually has been intersected by sufficient closely spaced drill holes and/or underground sampling to support sufficient tonnage and average grade of metal(s) to warrant further exploration and development work.
Mineralized Material means a mineralized body which has been delineated by appropriately spaced drilling and/or underground sampling to support an estimate of size by tonnage and average grade of metals. Such a deposit does not qualify as “ore” or a reserve, which would require a comprehensive feasibility evaluation based upon unit cost, grade, recoveries, and other factors relating to engineering, legal, financial and economic feasibility.
4
Mineral Reserve means the economically mineable part of a Mineral Resource classified as “measured” or “indicated” demonstrated by at least a preliminary feasibility study. Mineral Reserves can be classified into “proven” and “probable” categories.
Mineral Resource means a concentration or occurrence of natural, solid, inorganic or fossilized organic material in or on the Earth’s crust in such form and quantity and of such a grade or quality that it has reasonable prospects for economic extraction. The location, quantity, grade, geological characteristics and continuity of a Mineral Resource are known, estimated or interpreted from specific geological evidence and knowledge. Mineral Resources are subdivided, in order of increasing geological confidence, into Inferred, Indicated and Measured categories.
NBMG means the Nevada Bureau of Mines and Geology.
Nevada Report means the technical report dated November 26, 2010 entitled “Summary Report on the Nevada Gold Project Portfolio Comprising the Blackrock, Argentite, Bellview and Horsethief Gold Projects, Nevada, USA” prepared by Matthew Gray, Ph.D., C.P.G. for the Corporation in respect of the Nevada Portfolio properties (as hereinafter defined) in compliance with NI 43-101.
NI 43-101 means National Instrument 43-101 – Standards of Disclosure for Mineral Projects of the Canadian Securities Administrators.
NSR means net smelter return royalty.
optmeans ounces per ton.
Ore means a mineral or aggregate of minerals more or less mixed with gangue which can be profitably mined given economic circumstances at the time. The Corporation does not own any interest in properties where the mineralization has been determined to be ore.
Oxide means mineral from which sulphur has been partially or completely removed by the action of surface water and oxygen.
Plan means the stock option plan of the Corporation which received shareholder approval on December 18, 2007.
Porphyritic means pertaining to or resembling porphyry.
Porphyry means an igneous rock containing conspicuous crystals or phenocrysts in a fine-grained groundmass; type of mineral deposit in which ore minerals are widely disseminated, generally of low grade but large tonnage.
Pyrite means a very common iron sulphide mineral often associated with gold and other economic mineral deposits.
RC means reverse circulation.
Rhyolite means an extrusive igneous (volcanic) rock with phenocrysts of quartz and alkalic feldspar, commonly of porphyritic texture.
Rosario projectmeans the property comprised of 152 hectares known as the Rosario property located in Region III of Chile near the mining centre of Copiapo, in which Rio Condor (as hereinafter defined) held the right to acquire a 100% interest subject to certain underlying royalties.
Rosario Report means the technical report dated November 27, 2009 as revised December 4, 2009, Amended December 7, 2010, entitled “Summary Report on the Rosario Copper-Gold Project, Region III, Atacama, Chile” and prepared by Matthew Gray, Ph.D, C.P.G. for the Corporation in respect of the Rosario property in compliance with NI 43-101.
5
Sedimentary means rock formed of sediment, as conglomerate, sandstone and shale, formed of fragments of other rock transported from their sources and deposited in water; rocks formed by precipitation from solution as rock salt or gypsum or non-organic secretions of organisms, e.g., most limestone.
Strata means a tabular or sheet-like body of sedimentary or volcanic rock.
Sulphide means a group of minerals consisting of metals combined with sulphur; common metallic ores. (or “Sulfide”)
Vein means a tabular or sheet-like mineral deposit with identifiable walls, often filling a fracture or fissure.
Wallrock means the rock forming the walls of a vein or other mineral deposit.
6
NOTE TO U.S. READERS – DIFFERENCES REGARDING THE DEFINITIONS OF RESOURCE AND RESERVE ESTIMATES IN THE UNITED STATES AND CANADA
| MineralReserve | Under United States standards, a “mineral reserve” is defined as a part of a mineral deposit which could be economically and legally extracted or produced at the time the mineral reserve determination is made, where: “reserve” means that part of a mineral deposit which can be economically and legally extracted or produced at the time of the reserve determination; “economically” implies that profitable extraction or production has been established or analytically demonstrated to be viable and justifiable under reasonable investment and market assumptions; and while “legally” does not imply that all permits needed for mining and processing have been obtained or that other legal issues have been completely resolved, for a reserve to exist, there should be a reasonable certainty based on applicable laws and regulations that issuance of permits or resolution of legal issues can be accomplished in a timely manner. Mineral reserves are categorized as follows on the basis of the degree of confidence in the estimate of the quantity and grade of the deposit. | |
Under United States standards, proven or measured reserves are defined as reserves for which (a) quantity is computed from dimensions revealed in outcrops, trenches, workings or drill holes, grade and/or quality are computed from the results of detailed sampling and (b) the sites for inspection, sampling and measurement are spaced so closely and the geographic character is so well defined that size, shape, depth and mineral content of reserves are well established. | ||
Under United States standards, probable reserves are defined as reserves for which quantity and grade and/or quality are computed from information similar to that of proven reserves (under United States standards), but the sites for inspection, sampling, and measurement are further apart or are otherwise less adequately spaced. The degree of assurance, although lower than that for proven mineral reserves, is high enough to assume continuity between points of observation. | ||
| MineralResource | While the terms “mineral resource,” “measured mineral resource,” “indicated mineral resource,” and “inferred mineral resource” are recognized and required by Canadian regulations, they are not defined terms under standards in the United States. As such, information contained in this report concerning descriptions of mineralization and resources under Canadian standards may not be comparable to similar information made public by U.S. companies subject to the reporting and disclosure requirements of the Securities and Exchange Commission. “Indicated mineral resource” and “inferred mineral resource” have a great amount of uncertainty as to their existence and a great uncertainty as to their economic and legal feasibility. It cannot be assumed that all or any part of an “indicated mineral resource” or “inferred mineral resource” will ever be upgraded to a higher category. Investors are cautioned not to assume that any part or all of mineral deposits in these categories will ever be converted into reserves. |
7
FORWARD-LOOKING STATEMENTS
This Annual Report contains certain forward-looking statements. Readers can identify these forward-looking statements by the use of words such as “expect”, “anticipate”, “estimate”, “believe”, “may”, “potential”, “intends”, “plans” and other similar expressions or statements that an action, event or result “may”, “could” or “should” be taken, occur or be achieved, or the negative thereof or other similar statements. These statements are only predictions and involve known and unknown risks, uncertainties and other factors which may cause the Corporation’s actual results, performance or achievements, or industry results, to be materially different from any future results, performance, or achievements expressed or implied by these forward-looking statements. Such statements include, but are not limited to: (i) the possibility that the Corporation may enter into partnerships in order to fully exploit the production potential of its exploration assets; (ii) the Corporation’s budget for fiscal 2013; (iii) the Corporation’s expectation that it has capital sufficient to fund its 2013 planned expenditures; (iv) the Corporation’s anticipation that its working capital is adequate for it to continue operations at the current level for the twelve month period ending April 30, 2013; (v) the Corporation’s expectation that it will find partners for its Nevada Portfolio to develop the project; (vi) the Corporation’s plan to acquire an advanced exploration asset at reasonable cost; (vii) the Corporation’s intent to spend $350,000 on the Nevada Portfolio to maintain its ownership rights in the project; (viii) the Corporation’s intention to concentrate on significant property acquisitions when the opportunity arises; (ix) the Corporation’s plan to attempt to acquire an advanced exploration asset at reasonable cost; (x) the Corporation’s primary business objectives of staying within the mining sector and investing in business opportunities which include exploring and, if warranted, developing gold and copper-gold properties in the Americas; (xi) the Corporation’s plans to target properties with excellent exploration potential to advance rapidly toward development, focusing on properties with million ounce potential; (xii) the Corporation’s interest in acquiring precious metal purchase agreements from companies with low production costs, significant exploration upside and strong management teams; (xiii) the Corporation’s belief that precious metal purchase agreements will provide the Corporation with strong cash inflows based on royalties from production from its new production partners; (xiv) the Corporation’s intent to follow Dr. Matthew Gray’s recommendations with respect to the Nevada Portfolio should it move forward with the project; (xv) the Corporation’s plan to complete the proposed Transaction (as defined herein) with Premier Gold Mines Limited (“Premier Gold”); and (xvi) management’s belief that the credit risk concentration with respect to the financial instruments included in cash and cash equivalents and amounts receivable is remote. The other factors that may cause actual results to differ include, among others, the following: capital expenditures, operating costs, mineral resources, recovery rates, grades and prices; business strategies and measures to implement such strategies; competitive strengths; estimated goals; expansion and growth of the business and operations; plans and references to the Corporation’s future successes; the Corporation’s history of operating losses and uncertainty of future profitability; risks related to the Corporation’s ability to continue as a going concern; the Corporation’s status as an exploration stage corporation; the Corporation’s lack of mineral reserves; the risks associated with the Corporation’s reliance on a limited number of properties; the risks associated with the Corporation’s ability to complete the Transaction with Premier Gold; the hazards associated with mining construction and production; compliance with environmental laws and regulations; risks associated with obtaining permits; risks associated with current variable economic conditions; the possible impact of future financings; the possibility for adverse results in potential litigation; risks related to potential undetected title defects; uncertainties associated with changes in government policy and regulation; the effectiveness of the Corporation’s management and its strategic relationships; risks associated with the Corporation’s ability to attract and retain key personnel and may have conflicts of interest; risks related to the fact that the Corporation’s officers do not devote all of their time to t he Corporation’s business; uncertainties regarding the Corporation’s need for additional capital; uncertainties relating to the Corporation’s status as a non-U.S. corporation; uncertainties related to the volatility of the Corporation’s share price and trading volumes; risk associated with the Corporation’s shares being adversely affected by the penny stock rules; risks associated with investors’ ability to enforce civil liabilities under U.S. securities laws outside the United States; risks associated with the Corporation’s operations in the United States; risks related to global climate change; risks associated with the Corporation’s possible status as a “passive foreign investment corporation” under the applicable provisions of the U.S. Internal Revenue Code of 1986, as amended; and other risks and uncertainties described under the heading “Risk Factors” of this Annual Report.
8
METRIC EQUIVALENTS
For ease of reference, the following factors for converting metric measurements into imperial equivalents are provided:
| To Convert From Metric | To Imperial | Multiply By |
| hectares | acres | 2.471 |
| metres | feet | 3.281 |
| kilometres | miles | 0.621 |
| tonnes | tons (2000 pounds) | 1.102 |
PART I
ITEM 1. IDENTITY OF DIRECTORS, SENIOR MANAGEMENT AND ADVISERS
Not applicable.
ITEM 2. OFFER STATISTICS AND EXPECTED TIMETABLE
Not applicable.
ITEM 3. KEY INFORMATION
3.A. Selected Financial Data
The following is selected financial data of the Corporation, expressed in Canadian dollars, for the fiscal years ended April 30, 2012 and 2011, prepared in accordance with International Financial Reporting Standards (“IFRS”) as issued by the International Accounting Standards Board (“IASB”) and prepared in accordance with Canadian generally accepted accounting principles (“Canadian GAAP”) for fiscal years ended April 30, 2010, 2009 and 2008, which differ substantially from United States generally accepted accounting principles (“US GAAP”).
The financial statements for the fiscal years ended April 30, 2012 and 2011 comply with IFRS as published by the IASB. For a description of the differences between Canadian GAAP and US GAAP, and how these differences could affect the Company’s financial statements, please see Note 16 to the audited financial statements for the years ended April 30, 2010, 2009 and 2008, which are included in Item 17 of the Company's Amendment No. 2 to its registration statement on Form 20-F filed with the Securities and Exchange Commission (the “Commission”) on December 3, 2010. Note 16 to the audited financial statements for the years ended April 30, 2010, 2009 and 2008 is incorporated by reference herein. This reconciliation is not required for financial statements prepared under IFRS, and accordingly has not been prepared for the fiscal years ended April 30, 2012 and 2011.
The selected financial data should be read in conjunction with the financial statements and other financial information included elsewhere in this Annual Report on Form 20-F.
The selected financial data below is presented in accordance with IFRS as issued by the IASB.
| Year Ended | Year Ended | |
| April 30, | April 30, | |
| 2012 | 2011 | |
| ($) | ($) | |
Description | ||
Total revenues | nil | nil |
Total loss(1)(2) | (8,386,262) | (7,374,350) |
Net loss per common share - basic(3)(4) | (0.17) | (0.20) |
Net loss per common share – diluted(3)(4) | (0.17) | (0.20) |
| As at | As at | |
| April 30, 2012 | April 30, 2011 | |
Description | ($) | ($) |
Total assets | 22,220,877 | 31,100,444 |
Total non-current financial liabilities | nil | nil |
Distribution or cash dividends(5) | nil | nil |
| (1) | Loss from continuing and discontinued operations attributable to owners of the parent, in total; |
| (2) | Loss attributable to owners of the parent, in total; |
| (3) | Loss from continuing and discontinued operations attributable to owners of the parent, on a per-share and diluted per share basis; |
| (4) | Loss attributable to owners of the parent, on a per-share and diluted per-share basis; and |
| (5) | Declared per-share for each class of share. |
9
The selected financial data below is presented in accordance with Canadian generally accepted accounting principles.
| As at April 30, 2010 | As at April 30, 2009 | As at April 30, 2008 | |||||||
| Total Current Assets | $ | 11,267,724 | $ | 113,189 | $ | 295,619 | |||
| Interest in Mineral Property and Deferred Exploration Expenditures | $ | 3,840,460 | $ | 165,932 | $ | 135,000 | |||
| Total Current Liabilities | $ | 325,079 | $ | 29,926 | $ | 8,972 | |||
Capital Stock | $ | 11,798,967 | $ | 367,100 | $ | 367,100 | |||
Total Shareholders’ Equity, 28,036,000, 7,895,000 and 7,895,000 common shares outstanding as of April 30, 2010, 2009 and 2008, respectively | $ | 14,384,923 | $ | 233,995 | $ | 357,847 | |||
| Period from | |||||||||
| incorporation on | |||||||||
| May | |||||||||
| Year Ended April | Year Ended April | 10, 2007 to April | |||||||
| 30, 2010 | 30, 2009 | 30, 2008 | |||||||
| Revenue | - | - | - | ||||||
| Net loss | $ | 1,978,198 | $ | 123,852 | $ | 9,253 | |||
| Net loss per share, basic and diluted | $ | 0.12 | $ | 0.02 | $ | 0.00 |
Exchange Rates
Unless otherwise indicated, all monetary references herein are denominated in Canadian Dollars. References to “$” or “Dollars” or “Cdn$” are to Canadian Dollars and references to “US$” or “U.S. Dollars” are to United States Dollars.
The following tables set forth, (i) for the four fiscal years ended April 30, 2009, 2010, 2011 and 2012, the average rate of exchange for the Canadian dollar, expressed in U.S. dollars, calculated by using the average of the exchange rates on the last day for which data is available for each month during such periods; and (ii) the high and low exchange rate during the previous six months, in each case based on the Bank of Canada noon rate of exchange.
The average rate, calculated by using the average of the exchange rates on the last day of each month during the period, is set out for each of the periods indicated in the table below.
| Year Ended April 30, | ||||||||||||
| 2012 | 2011 | 2010 | 2009 | |||||||||
| Average (US$) for Period | $ | 1.0078 | $ | 0.9875 | $ | 0.9358 | $ | 0.8767 | ||||
The high and low exchange rates for each month during the previous six months are as follows:
| Month Ended | |||||||||||||||||
| July | June | May | April | March | February | |||||||||||||
| 2012(1) | 2012 | 2012 | 2012 | 2012 | 2012 | |||||||||||||
| High for Period (US$) | $ | 0.9878 | $ | 0.9825 | $ | 1.0164 | $ | 1.0197 | $ | 1.0153 | $ | 1.0136 | ||||||
| Low for Period (US$) | $ | 0.9792 | $ | 0.9599 | $ | 0.9663 | $ | 0.9961 | $ | 0.9985 | $ | 0.9984 |
(1) For the period July 1, 2012 to July 9, 2012.
As of April 30, 2012, the noon rate of exchange, as reported by the Bank of Canada for the conversion of United States dollars into Canadian dollars was US$1.0117 (US$1.00 = Cdn$0.9884) .
As of July 9, 2012, the noon rate of exchange, as reported by the Bank of Canada for the conversion of United States dollars into Canadian dollars was US$0.9792 (US$1.00 = Cdn$1.0212) .
The financial statements of the Corporation for the years ended April 30, 2012 and 2011 are prepared in accordance with IFRS as issued by IASB.
10
3.B. Capitalization and Indebtedness
Not applicable.
3.C. Reasons for the Offer and Use Of Proceeds
Not applicable.
3.D. Risk Factors
The Corporation operates in a dynamic and rapidly changing environment that involves numerous risks and uncertainties. The risks described below should be considered carefully when assessing an investment in the Corporation’s common shares. The occurrence of any of the following events could harm the Corporation. If these events occur, the trading price of the Corporation’s common shares could decline, and shareholders may lose part or even all of their investment.
The Corporation’s exploration and development activities are subject to certain operating risks.
Mining exploration and development operations generally involve a high degree of risk. The Corporation’s operations are subject to all the hazards and risks normally encountered in the exploration, development and production of Au, Cu, precious metals and other minerals, including unusual and unexpected geologic formations, seismic activity, rock bursts, cave-ins, flooding and other conditions involved in the drilling and removal of material, any of which could result in damage to, or destruction of, mines and other producing facilities, damage to life or property, environmental damage and possible legal liability. Milling operations are subject to hazards such as equipment failure or failure of retaining dams around tailings disposal areas which may result in environmental pollution and consequent liability.
11
The Corporation may not discover or produce commercial quantities of minerals and may not achieve profitable operations in the future.
The exploration for and development of mineral deposits involves significant risks which even a combination of careful evaluation, experience and knowledge may not eliminate. While the discovery of a mineral-bearing structure may result in substantial rewards, few properties which are explored are ultimately developed into producing mines.
Major expenses may be required to locate and establish mineral reserves, to develop metallurgical processes and to construct mining and processing facilities at a particular site. It is impossible to ensure that the exploration or development programs planned by the Corporation will result in a profitable commercial mining operation. Whether an Au, Cu or other mineral deposit will be commercially viable depends on a number of factors, some of which are: the particular attributes of the deposit, such as quantity and quality of mineralization and proximity to infrastructure; mineral prices which are highly cyclical; and government regulations, including regulations relating to prices, taxes, royalties, land tenure, land use, importing and exporting of minerals and environmental protection. The exact effect of these factors cannot be accurately predicted, but the combination of these factors may result in the Corporation not receiving an adequate return on invested capital.
There is no certainty that the expenditures made by the Corporation towards the search and evaluation of Au, Cu or other minerals will result in discoveries of commercial quantities of Au, Cu or other minerals.
Limited exploration has been conducted by the Corporation on its properties to date. No Mineral Resources or Mineral Reserves have been identified with respect to any of the Corporation’s property interests to date and there is no certainty that the expenditures made by the Corporation towards the search and evaluation of mineral occurrences will result in discoveries of commercial quantities of Au, Cu or other minerals. The Corporation may expend substantial funds in exploring its properties only to abandon them and lose its entire expenditure on the properties if no commercial or economic quantities of minerals are found.
In addition, even in the event of the successful completion by the Corporation of initial exploration programs on its properties, there is no assurance that the results of such exploration will warrant the completion of further exploration of such properties and the properties might not be brought into a state of commercial production. The Corporation is an exploration stage company with no history of pre-tax profit and no income from its operations. There can be no assurance that the Corporation’s operations will be profitable in the future. Most exploration projects do not result in the discovery of commercially mineable deposits and no assurance can be given that any particular level of recovery of mineral reserves will in fact be realized or that any identified mineral deposit will ever qualify as a commercially mineable (or viable) mineral deposit that can be legally and economically exploited. There can be no assurance that minerals recovered in small-scale tests will be duplicated in large-scale tests under on-site conditions or in production.
In such circumstances, the Corporation may be required to acquire and focus its operations on one or more additional mineral properties. There can be no assurance that any such additional mineral properties will be available for acquisition by the Corporation or that, if available, the terms of acquisition will be favourable to the Corporation.
The Corporation may acquire additional exploration stage properties and it may face negative reactions if resources or reserves are not located on acquired properties.
The Corporation may acquire additional exploration stage properties. There can be no assurance that it will be able to identify and complete the acquisition of such properties at reasonable prices or on favorable terms and that resources or reserves will be identified on any properties that the Corporation acquires. The Corporation may also experience negative reactions from the financial markets if it is unable to successfully complete acquisitions of additional properties or if resources or reserves are not located on acquired properties. These factors may adversely affect the trading price of the Corporation’s common shares or its financial condition or results of operations.
12
The Corporation has a history of losses and expects losses to continue for the foreseeable future. As a result, it will require additional equity financings, which will cause dilution to the interests of existing shareholders.
The Corporation has limited financial resources and has no operating cash flow. As of the year ended April 30, 2012, the Corporation had incurred accumulated losses totaling $17,326,010 under IFRS. Continued exploration efforts will require additional capital to help maintain and expand exploration on the Corporation’s principal exploration properties. Additionally, if the Corporation decides to proceed with a feasibility study on any of its primary properties, substantial additional funds will be required to complete the study as well as to complete the acquisition of the projects held under option agreements. The Corporation has traditionally been required to raise funds through the sale of its common shares and has no current plans to obtain financing through means other than equity financing. However, due to current economic conditions, the Corporation may not be able to obtain additional equity financing on reasonable terms, if at all. If the Corporation is unable to obtain sufficient financing in the future, it might have to dramatically slow exploration efforts and/or lose control of its projects. If equity financing is required, then such financings could result in significant dilution to the interests of existing or prospective shareholders. These financings may be on terms less favourable to the Corporation than those obtained previously.
The Corporation’s ability to continue as a going concern is dependent on raising additional capital, which it may not be able to do on favorable terms, or at all.
The Corporation will need to raise additional capital to support its continuing operations. The Corporation can provide no assurance that additional funding will be available on a timely basis, on terms acceptable to the Corporation, or at all. If the Corporation is unsuccessful raising additional funding, its business may not continue as a going concern. Even if the Corporation does find additional funding sources, it may be required to issue securities with greater rights than those currently possessed by holders of its common shares. The Corporation may also be required to take other actions that may lessen the value of its common shares or dilute its common shareholders, including borrowing money on terms that are not favorable to the Corporation or issuing additional equity securities. If the Corporation experiences difficulties raising money in the future, its business and liquidity will be materially adversely affected.
The Corporation currently relies on a limited number of properties.
The material property interests of the Corporation are currently its interest in the Nevada Portfolio. As a result, unless the Corporation acquires additional property interests, any adverse developments affecting the Nevada Portfolio could have a material adverse effect upon the Corporation and could materially and adversely affect the potential mineral resource production, profitability, financial performance and results of operations of the Corporation.
The Corporation and Premier Gold may not be able to negotiate a definitive binding agreement or satisfy all conditions necessary to complete the proposed acquisition of Premier Royalty Corporation.
The Corporation recently entered into a non-binding letter of intent setting forth the basic terms of the proposed acquisition by the Corporation of Premier Gold’s wholly-owned subsidiary, Premier Royalty Corporation. The transaction is subject to the negotiation and execution of a definitive binding agreement, approval of the board of directors of each of Premier Gold and the Corporation, approval of the Corporation’s shareholders, regulatory approvals, completion of due diligence and the entering into of support and lock-up agreements by the Corporation’s directors and officers. There is no assurance that a definitive agreement will be entered between the parties or that the proposed transaction will be completed.
The Corporation is subject to certain uninsured risks which may result in losses and have a material adverse effect upon the financial performance and results of operations of the Corporation.
The Corporation’s business is subject to a number of risks and hazards generally, including adverse environmental conditions, industrial accidents, labour disputes, unusual or unexpected geological conditions, ground or slope failures, cave-ins, changes in the regulatory environment and natural phenomena such as inclement weather conditions, floods, fire and earthquakes. Such occurrences could result in damage to mineral properties or production facilities, personal injury or death, environmental damage to the Corporation’s properties or the properties of others, delays in exploration activities, mining, monetary losses and possible legal liability.
13
The Corporation currently maintains only general liability and director and officer insurance but no insurance against its properties or operations. Although the Corporation may in the future obtain additional insurance to protect against certain risks in such amounts as it considers to be reasonable, its insurance will not cover all the potential risks associated with a mining or mineral exploration company’s operations. The Corporation may also be unable to maintain insurance to cover these risks at economically feasible premiums. Insurance coverage may not continue to be available or may not be adequate to cover any resulting liability. Moreover, insurance against risks such as environmental pollution or other hazards as a result of exploration and production is not generally available to the Corporation or to other companies in the mining industry on acceptable terms. The Corporation might also become subject to liability for pollution or other hazards which may not be insured against or which the Corporation may elect not to insure against because of premium costs or other reasons. Losses from these events may cause the Corporation to incur significant costs that could have a material adverse effect upon its financial performance and results of operations.
The Corporation’s property interests may be subject to undetected title defects.
No assurances can be given that there are no title defects affecting the Corporation’s properties. Title insurance generally is not available, and the Corporation’s ability to ensure that it has obtained secure claim to individual mineral properties or mining concessions may be severely constrained. Furthermore, the Corporation has only conducted a preliminary legal survey of certain of the claims in which it holds an interest and, therefore, the precise area and location of such claims may be in doubt. Accordingly, the Corporation’s mineral exploration properties may be subject to prior unregistered liens, agreements, transfers or claims, including native land claims, and title may be affected by, among other things, undetected defects. In addition, the Corporation may be unable to operate its properties as permitted or to enforce its rights with respect to its properties.
There are no guarantees that title to the Corporation’s properties will not be challenged in the future.
There may be valid challenges to the title to the Corporation’s mineral exploration properties which, if successful, could impair the Corporation’s ownership rights to such properties. Any disputes with respect to title may have to be defended through the courts. In the event of an adverse judgment, the Corporation could lose its property rights which could have a material adverse effect on the Corporation.
Legislation has been proposed that would significantly affect the mining industry.
Periodically, members of the U.S. Congress have introduced bills which would supplant or alter the provisions of the General Mining Law of 1872, which governs the unpatented claims that the Corporation controls with respect to its U.S. properties. One such amendment has become law and has imposed a moratorium on the patenting of mining claims, which reduced the security of title provided by unpatented claims such as those on the Corporation’s U.S. properties. If additional legislation is enacted, it could substantially increase the cost of holding unpatented mining claims by requiring payment of royalties, and could significantly impair the Corporation’s ability to develop mineral estimates on unpatented mining claims. Such bills have proposed, among other things, to make permanent the patent moratorium, to impose a federal royalty on production from unpatented mining claims and to declare certain lands as unsuitable for mining. Although it is impossible to predict at this time what royalties may be imposed in the future, the imposition of such royalties could adversely affect the potential for development of such mining claims, and the economics of existing operating mines on federal unpatented mining claims. Passage of such legislation could adversely affect our business.
In March 2010, the State of Nevada enacted Assembly Bill No. 6 (“AB6”) which sought to balance the state budget by reducing expenditures and increasing certain fees. Among those fee increases was a one-time fee payable in conjunction with the annual filing of an affidavit of the intent to hold a mining claim, with a tiered fee structure applied for holders of 11 or more claims in Nevada. The fee ranges from US$70 per claim for holders of 11 to 199 claims up to US$195 per mining claim for holders of 1,300 or more claims as of the date of filing. The law authorizing these fees was subsequently ruled unconstitutional and was voided. Fees paid by the Corporation under terms of AB6 will be refunded. The Corporation must present the original claim payment form and proof of payment to the State of Nevada to receive a refund for the payments ruled unconstitutional. The Corporation has until 2013 to solicit the refund. The Corporation made the required deferred payment of approximately US$22,343 between May 20th and May 24th, to the local county recorder’s office for each property. Since the properties were acquired in October 2010, Fronteer made the 2011 maintenance fee payments. The Corporation’s first 2012 maintenance fee payments are due on or before September 1, 2011 and were paid to the local U.S. Bureau of Land Management offices at a rate of US$140/claim. The Corporation remains at risk that Nevada may impose additional fees or other levies affecting the mining industry in the future.
14
Amendments to certain government regulations applicable to mineral exploration and development activities may adversely impact the Corporation’s operations.
The development and mineral exploration activities of the Corporation are, and any future mining and processing activities will be, subject to various laws governing prospecting, development, production, taxes, labour standards and occupational health, mine safety, toxic substances, land use, water use, land claims of local people and other matters. Although the Corporation’s exploration and development activities are currently, and any future mining and processing operations will be, carried out in accordance with all applicable rules and regulations, no assurance can be given that new rules and regulations will not be enacted or that existing rules and regulations will not be applied in a manner which could limit or curtail production or development. Amendments to current laws and regulations governing operations and activities of mining and milling or more stringent implementation thereof could have a substantial adverse impact on the Corporation.
The Corporation relies upon a small number of key executives and directors and the loss of such individuals may adversely affect its business and operations.
The Corporation is dependent on the services of key executives, including the directors of the Corporation and a small number of highly skilled and experienced executives. Due to the relatively small size of the Corporation, the loss of these persons or the Corporation’s inability to attract and retain additional highly skilled personnel may adversely affect its business and future operations. The Corporation’s key executives include Shastri Ramnath, President, Chief Executive Officer and a director, and Carmelo Marrelli, Chief Financial Officer; and the other directors of the Corporation, including Hugh Snyder, Chairman, Graham Clow, Jon North and Wolf Seidler. The Corporation maintains no “key man” life insurance on any members of its management or directors.
Mineral operations are subject to market forces outside of the Corporation’s control, which could negatively impact the Corporation’s operations.
The marketability of minerals is affected by numerous factors beyond the control of the entity involved in their mining and processing. These factors include market fluctuations, government regulations relating to prices, taxes, royalties, allowable production, import, exports and supply and demand. One or more of these risk elements could have an impact on costs of an operation and if significant enough, reduce the profitability of the operation and threaten its continuation.
The Corporation has a limited operating history and may not achieve a return on shareholders’ investment.
The Corporation has a very limited history of operations, is in the early stage of exploration and must be considered a start-up company. As such, the Corporation is subject to many risks common to such enterprises, including under-capitalization, cash shortages, limitations with respect to personnel, financial and other resources and lack of revenues. There is no assurance that the Corporation will be successful in achieving a return on shareholders’ investment and the likelihood of success must be considered in light of its early stage of operations.
15
The Corporation operates in foreign countries and is subject to currency fluctuations which could have a negative effect on its operating results.
A substantial portion of the Corporation’s operations are located in the United States, which makes it subject to foreign currency fluctuations. The Corporation’s accounts are maintained in Canadian dollars while certain expenses are numerated in U.S. dollars. Such fluctuations may adversely affect the Corporation’s financial position and results of operations. Management may not take any steps to address foreign currency fluctuations that would eliminate all adverse effects and, accordingly, the Corporation may suffer losses due to adverse foreign currency fluctuations.
The Corporation may be unable to obtain sufficient capital for purposes of financing its operations.
The development and exploration of the Corporation’s properties will require substantial additional financing. Failure to obtain sufficient financing may result in the delay or indefinite postponement of exploration, development or production on any or all of the Corporation’s properties or even a loss of property interest. The Corporation may not have sufficient funds to finance such operations. The primary source of funding available to the Corporation consists of equity financing. There can be no assurance that additional capital or other types of financing will be available if needed or that, if available, the terms of such financing will be favourable to the Corporation.
Uncertain global economic conditions will affect the Corporation and its common share price.
Current conditions in the domestic and global economies are uncertain. There continues to be a high level of market instability and market volatility with unpredictable and uncertain financial market projections. Global financial problems and lack of confidence in the strength of global financial institutions have created many economic and political uncertainties that have impacted the global economy. As a result, it is difficult to estimate the level of growth for the world economy as a whole. It is even more difficult to estimate growth in various parts of the world economy, including the markets in which the Corporation participates. All components of the Corporation’s budgeting and forecasting are dependent on commodity prices and their fluctuations as well as political acceptance and policy. The prevailing economic uncertainties render estimates of future expenditures difficult.
There are significant uncertainties regarding the price of Au, Cu and other minerals and the availability of equity financing for the purposes of mineral exploration and development. The prices of Au, Cu and other minerals have fluctuated substantially over the past several months and financial markets have deteriorated to the point where it has become difficult for companies to raise new capital. The Corporation’s future performance is largely tied to the development of its current mineral properties and the overall financial markets. Current financial markets are likely to be volatile in Canada potentially into late 2012, reflecting ongoing concerns about the stability of the global economy and weakening global growth prospects. As well, concern about global growth has led to fluctuations in the commodity markets. Unprecedented uncertainty in the credit markets has also led to increased difficulties in borrowing and raising funds. Companies worldwide have been affected particularly negatively by these trends. As a result, the Corporation may have difficulties raising equity financing for the purposes of mineral exploration and development, particularly without excessively diluting present shareholders of the Corporation. These economic trends may limit the Corporation’s ability to develop and/or further explore its mineral property interests.
The Corporation is subject to environmental risks and hazards and a failure to comply with environmental regulations could have a material adverse effect on the Corporation’s results of operations.
All phases of the Corporation’s operations are subject to environmental regulation in the jurisdictions in which it operates. These regulations mandate, among other things, the maintenance of air, water and soil quality standards, land reclamation, and the protection of vegetation, wildlife and historical and cultural resources, if present. They also set forth limitations on the generation, transportation, storage and disposal of solid and hazardous waste. Environmental legislation is evolving in a manner which will require stricter standards and enforcement, increased fines and penalties for non-compliance, more stringent environmental assessments of proposed projects and a heightened degree of responsibility for companies and their officers, directors and employees. There is no assurance that future changes in environmental regulation, if any, will not adversely affect the Corporation’s operations.
16
Environmental hazards may exist on the properties on which the Corporation holds interests which are unknown to the Corporation at present and which have been caused by previous or existing owners or operators of the properties.
Failure to comply with applicable laws, regulations and permitting requirements may result in enforcement actions thereunder, including orders issued by regulatory or judicial authorities causing operations to cease or be curtailed, and may include corrective measures requiring capital expenditures, installation of additional equipment, or remedial actions. Parties engaged in mining operations or in the exploration or development of mineral properties may be required to compensate those suffering loss or damage by reason of the mining activities and may have civil or criminal fines or penalties imposed for violations of applicable laws or regulations.
Amendments to current laws, regulations and permits governing operations and activities of mining and exploration companies, or more stringent implementation thereof, could have a material adverse impact on the Corporation and cause increases in exploration expenses, capital expenditures or production costs or reduction in levels of production at producing properties or require abandonment or delays in development of new mining properties.
Global climate change is an international concern, and could impact the Corporation’s ability to conduct future operations.
Global climate change is an international issue and receives an enormous amount of publicity. The Corporation would expect that the imposition of international treaties or U.S. federal, state or local laws or regulations pertaining to mandatory reductions in energy consumption or emissions of greenhouse gasses could affect the feasibility of its mining projects and increase its operating costs.
Permitting, licensing and approval processes are required for the Corporation’s operations and obtaining and maintaining these permits, licenses and approvals is subject to many conditions which the Corporation may be unable to achieve.
The Corporation’s exploration activities are subject to various federal, provincial and local laws governing land use, the protection of the environment, prospecting, development, production, exports, taxes, labour standards, occupational health, waste disposal, toxic substances, and other matters. Many of the operations of the Corporation require licenses and permits from various governmental authorities. Exploration generally requires one form of permit while development and production operations require additional permits.
The Corporation believes it holds or is in the process of obtaining all necessary licenses and permits to carry on the activities which it is currently conducting under applicable laws and regulations. Such licenses and permits are subject to changes in regulations and changes in various operating circumstances. There can be no guarantee that the Corporation will be able to obtain all necessary licenses, permits and approvals that may be required to maintain its exploration and mining activities including constructing mines or milling facilities and commencing operations of any of its exploration properties. In addition, if the Corporation proceeds to production on any exploration property, it must obtain and comply with permits and licenses which may contain specific conditions concerning operating procedures, water use, the discharge of various materials into or on land, air or water, waste disposal, spills, environmental studies, abandonment and restoration plans and financial assurances. There can be no assurance that the Corporation will be able to obtain such permits and licenses or that it will be able to comply with any such conditions.
The Corporation’s operations depend upon the availability and maintenance of certain infrastructure that is necessary for purposes of mineral exploration and development activities.
Mining, processing, development and exploration activities depend, to one degree or another, on adequate infrastructure. Reliable roads, bridges, power sources and water supply are important determinants, which affect capital and operating costs. Unusual or infrequent weather phenomena, sabotage, government or other interference in the maintenance or provision of such infrastructure could adversely affect the Corporation’s operations, financial condition and results of operations.
17
The Corporation faces competition from companies with greater financial resources and operational capabilities.
The mining industry is competitive in all of its phases. The Corporation faces strong competition from other mining companies in connection with the acquisition of properties producing, or capable of producing, precious and base metals. Many of these companies have greater financial resources, operational experience and technical capabilities than the Corporation. Other companies could outbid the Corporation for potential projects or produce minerals at lower costs, which would have a negative effect on the Corporation’s operations. As a result of this competition, the Corporation may be unable to maintain or acquire attractive mining properties on terms it considers acceptable or at all. Consequently, the Corporation’s revenues, operations and financial condition could be materially adversely affected.
Declining mineral prices may adversely impact the Corporation’s financial results and operations and the price of its common shares.
The price of the common shares of the Corporation, the Corporation’s financial results and exploration, development and mining activities may in the future be significantly adversely affected by declines in the price of Au, Cu or other minerals. The price of Au, Cu or other minerals fluctuates widely and is affected by numerous factors beyond the Corporation’s control such as the sale or purchase of commodities by various central banks and financial institutions, interest rates, exchange rates, inflation or deflation, fluctuation in the value of the United States dollar and foreign currencies, global and regional supply and demand, the political and economic conditions of major mineral-producing countries throughout the world, and the cost of substitutes, inventory levels and carrying charges. Future serious price declines in the market value of Au, Cu or other minerals could cause continued development of and commercial production from the Corporation’s properties to be impracticable. Depending on the price of Au, Cu and other minerals, cash flow from mining operations may not be sufficient and the Corporation could be forced to discontinue production and may lose its interest in, or may be forced to sell, some of its properties. Future production from the Corporation’s mining properties is dependent upon the prices of Au, Cu and other minerals being adequate to make these properties economic.
In addition to adversely affecting the Corporation’s reserve estimates and its financial condition, declining commodity prices can impact operations by requiring a reassessment of the feasibility of a particular project. Such a reassessment may be the result of a management decision or may be required under financing arrangements related to a particular project. Even if the project is ultimately determined to be economically viable, the need to conduct such a reassessment may cause substantial delays or may interrupt operations until the reassessment can be completed.
The market price of the Corporation’s common shares may be subject to factors unrelated to the Corporation’s performance and such market price may not accurately reflect the long-term value of the common shares.
Securities of micro-cap and small-cap companies have experienced substantial volatility in the past, often based on factors unrelated to the financial performance or prospects of the companies involved. These factors include macroeconomic developments in North America and globally and market perceptions of the attractiveness of particular industries. The price of the securities of the Corporation is also likely to be significantly affected by short-term changes in Au, Cu or other mineral prices or in its financial condition or results of operations as reflected in its quarterly earnings reports. Other factors unrelated to the Corporation’s performance that may have an effect on the price of the Corporation’s securities include the following: the extent of analytical coverage available to investors concerning the Corporation’s business may be limited if investment banks with research capabilities do not follow the Corporation’s securities; lessening in trading volume and general market interest in the Corporation’s securities may affect an investor’s ability to trade significant numbers of securities; the size of Corporation’s public float may limit the ability of some institutions to invest in the Corporation’s securities; and a substantial decline in the price of the Corporation’s securities that persists for a significant period of time could cause the Corporation’s securities, if listed on an exchange, to be delisted from such exchange, further reducing market liquidity.
As a result of any of these factors, the market price of the securities of the Corporation at any given point in time may not accurately reflect the Corporation’s long-term value. Securities class action litigation often has been brought against companies following periods of volatility in the market price of their securities. The Corporation may in the future be the target of similar litigation. Securities litigation could result in substantial costs and damages and divert management’s attention and resources.
18
The Corporation may not pay dividends on its common shares in the foreseeable future.
The Corporation has paid no dividends on its common shares since incorporation and does not anticipate paying dividends in the foreseeable future. Payment of any future dividends will be at the discretion of the Corporation’s board of directors after taking into account many factors, including the Corporation’s operating results, financial condition and current and anticipated cash needs.
Sales of common shares by existing shareholders may impair the Corporation’s ability to raise capital in the future.
Sales of a large number of common shares of the Corporation in the public markets, or the potential for such sales, could decrease the trading price of the common shares and could impair the Corporation’s ability to raise capital through future sales of common shares. At any given time, the Corporation may have previously issued common shares at an effective price per share which is lower than the then market price of the common shares as publicly traded. Accordingly, at any time a significant number of shareholders of the Corporation may have an investment profit in the common shares of the Corporation that they may seek to liquidate.
The Corporation’s directors and officers may have conflicts of interest in connection with other mineral exploration and development companies.
Certain of the directors and officers of the Corporation also serve as directors and/or officers and/or shareholders of other companies involved in natural resource exploration and development. Specifically, Graham Clow serves as Chief Financial Officer for New Dawn Mining Corp.; Jon North serves as a director for New Dawn Mining Corp. and Northquest Ltd.; and Carmelo Marrelli serves as a director for Odyssey Resources Limited. Each of these companies is in either resource exploration or development, or mining. Consequently, it is possible that conflicts of interest may arise between these individuals’ duties as directors and officers of the Corporation and their duties as directors of other corporations. For example, certain corporate opportunities may come to the attention of such individuals where such opportunities would be attractive to both the Corporation and another corporation for which the individual serves as a director. Any decision made by any of such directors and officers involving the Corporation should be made in accordance with their duties and obligations to deal fairly and in good faith with a view to the best interests of the Corporation and its shareholders. In addition, each of the directors is required to declare and refrain from voting on any matter in which such directors may have a conflict of interest in accordance with the procedures set forth in the Business Corporations Act (Ontario) (the “Business Corporations Act”) and other applicable laws.
Some of the Corporation’s executive officers do not devote all of their time to the Corporation’s business, which may hinder its ability to operate successfully.
The Corporation’s Chief Executive Officer and Chief Financial Officer are involved in other business activities, which may result in their spending less time than may be required to manage the Corporation’s business successfully. This could have a material adverse effect on the Corporation’s business, financial condition and results of operations. In addition, the amount of time the Corporation’s Chief Executive Officer and Chief Financial Officer will allocate among the Corporation's business and other businesses could vary significantly from time to time depending on various circumstances and needs of the businesses, such as the relative levels of strategic activities of the businesses. There are no formal requirements or guidelines for the allocation of the Corporation’s officers’ time between its business and other businesses.
19
The Corporation has no history of earnings and no foreseeable earnings.
None of the properties in which the Corporation has or may acquire an interest has been determined to be commercially feasible and hence none have any commercial production. The Corporation has no history of profits and has a substantial deficit. The Corporation receives no revenues, earnings or cash flow from production or otherwise and is entirely dependent on raising additional equity and loan financing.
While the Corporation may receive funds from the exercise of outstanding share purchase warrants and stock options there are no assurances that this will occur. While the Corporation may generate additional working capital through joint ventures or sale of its properties in whole or in part, there is no assurance that this will be possible.
U.S. investors may have difficulty enforcing U.S. judgments against the Corporation.
The Corporation is incorporated under the laws of Ontario, Canada and all of the Corporation’s directors and officers are residents of Canada. Consequently, it may be difficult for U.S. investors to effect service of process within the United States upon the Corporation or upon such persons who are not residents of the United States, or to realize in the United States upon judgments of U.S. courts predicated upon civil liabilities under U.S. securities laws. A judgment of a U.S. court predicated solely upon such civil liabilities may be enforceable in Canada by a Canadian court if the U.S. court in which the judgment was obtained had jurisdiction, as determined by the Canadian court, in the matter. There is substantial doubt whether an original action could be brought successfully in Canada against any of such persons or the Corporation predicated solely upon such civil liabilities.
The Corporation may be a passive foreign investment company, which has certain adverse tax consequences for U.S. Holders.
A non-U.S. corporation generally will be considered a “passive foreign investment company” (a “PFIC”) as such term is defined in the U.S. Internal Revenue Code of 1986, as amended (the “Code”), for any taxable year if either (1) at least 75% of its gross income is passive income or (2) at least 50% of the value of its assets is attributable to assets that produce or are held for the production of passive income. If the Corporation were treated as a PFIC for any taxable year in which a U.S. Holder (as defined in “United States Federal Income Tax Considerations” below) held the Corporation’s common shares, certain adverse consequences could apply, including a material increase in the amount of tax that the U.S. Holder would owe, an imposition of tax earlier than would otherwise be imposed, interest charges and additional tax form filing requirements.
The determination of whether a corporation is a PFIC involves the application of complex tax rules. The Corporation could have qualified as a PFIC for past tax years and may qualify as a PFIC currently or in future tax years. However, no assurance can be given as to such status for prior tax years, for the current tax year or future tax years.U.S. Holders of the Corporation’s common shares are urged to consult their own tax advisors regarding the application of U.S. income tax rules and with respect to how the PFIC rules affect their situation.
Shares of the Corporation may be adversely affected by the penny stock rules.
Rules 15g-1 through 15g-9 promulgated under the Securities Exchange Act of 1934, as amended (the “Exchange Act”), impose sales practice and disclosure requirements on certain broker-dealers who engage in certain transactions involving “penny stocks.” Subject to certain exceptions, a penny stock generally includes any equity security not traded on an exchange that has a market price of less than US$5.00 per share. The Corporation’s shares are expected to be deemed penny stock for the purposes of the Exchange Act. The additional sales practice and disclosure requirements imposed upon broker-dealers may discourage broker-dealers from effecting transactions in the Corporation’s shares, which could severely limit the market liquidity of the shares and impede the sale of the shares in the secondary market.
Under the penny stock regulations, a broker-dealer selling penny stock to anyone other than an established customer or “accredited investor” (generally, an individual with net worth in excess of US$1,000,000 or joint net worth with that person’s spouse (and excluding the value of the person’s primary residence) or an annual income exceeding US$200,000, or US$300,000 together with his or her spouse in each of the two most recent fiscal years with a reasonable expectation of achieving such level in the current fiscal year) must make a special suitability determination for the purchaser and must receive the purchaser’s written consent to the transaction prior to sale, unless the broker-dealer or the transaction is otherwise exempt. In addition, the penny stock regulations require the broker-dealer to deliver, prior to any transaction involving a penny stock, a disclosure schedule prepared by the Commission relating to the penny stock market, unless the broker-dealer or the transaction is otherwise exempt. A broker-dealer is also required to disclose commissions payable to the broker-dealer and the registered representative and current quotations for the securities. Finally, a broker-dealer is required to send monthly statements disclosing recent price information with respect to the penny stock held in a customer’s account and information with respect to the limited market in penny stocks.
20
The Corporation may not be able to raise the funds necessary to fully explore and develop its properties.
There is no assurance that the Corporation would be able to raise the requisite funds necessary to fully explore and, if warranted, develop its properties. In this regard, funds may not be available to the Corporation on terms acceptable to it, if at all. If such funds are not raised and/or the exploration and development of such mineral properties does not occur or is significantly curtailed, it would likely adversely affect the Corporation and the price of its common shares.
ITEM 4. INFORMATION ON THE COMPANY
4.A. History and development of the company
The Corporation’s legal and commercial name is Bridgeport Ventures Inc. The Corporation was incorporated pursuant to the Business Corporations Act (Ontario) on May 10, 2007. The registered and principal office of the Corporation is located at 36 Toronto Street, Suite 1000, Toronto, Ontario M5C 2C5. Its phone number is 416-603-4040.
The Corporation has one remaining subsidiary being Bridgeport Gold Inc. (“BPV Gold”), which exists under the laws of Nevada. The Corporation holds all of the issued and outstanding shares of BPV Gold. During the year ended April 30, 2012, the Corporation committed to a plan to pursue the sale of its subsidiary Rio Condor Resources S.A. ("Rio Condor") and discontinued this operation since it was no longer in accordance with the Corporation's commercial objectives. The Corporation sold the interests it owned in Rio Condor on March 31, 2012 for cash consideration of $61,412. The Corporation recorded a gain on disposal of $59,657 in the consolidated financial statements as at April 30, 2012. Through Rio Condor, the Corporation held a project originally comprised of the properties known as the Rosario, Tamara, Soesmi, Trillador, Simonetta and certain other properties (collectively, the “Rio Condor Properties”) located in Chile. References to “Bridgeport” in this report refer to the Corporation, BPV Gold and Rio Condor taken as a whole.
The Corporation is a Canadian-based exploration and development company primarily focused on the acquisition, exploration and development of properties prospective for gold and copper. The Corporation currently holds an interest in ten predominantly gold prospective properties located in Nevada (the “Acquired Nevada Properties”), which the Corporation acquired from certain subsidiaries of Fronteer Gold Inc., and an additional 225 claims (the “Staked Nevada Claims”) contiguous to the Acquired Nevada Properties (the Staked Nevada Claims and together with the Acquired Nevada Properties, the “Nevada Portfolio”).
The Corporation is a reporting issuer or the equivalent under applicable securities legislation in every province in Canada, except Quebec, and in the United States. The common shares of the Corporation are listed on the Toronto Stock Exchange (the “TSX”) under the symbol “BPV”. In addition, certain warrants of the Corporation trade on the TSX under the symbols “BPV.WT” and “BPV.WT.A”.
The Corporation has no revenues, so its ability to ensure continuing operations is dependent on its completing the acquisition of its mineral property interests, the discovery of economically recoverable reserves, confirmation of its interest in the underlying mineral claims, and its ability to obtain necessary financing to complete its exploration activities, development and future profitable production.
21
The Corporation's goal is to deliver superior returns to shareholders by concentrating on the acquisition of properties that have the potential to contain precious and base metals. The Corporation currently plans to partner with other junior companies looking to focus expertise and funds on the Nevada Portfolio, as set out below under “Mineral Exploration Properties”.
Overall Performance for the Year
Highlights
In light of the current market environment, Bridgeport has halted all early stage exploration activities in Nevada and has sold the interests it owned in Rio Condor with the objective of conserving cash to support an aggressive search for a flagship advanced gold or copper-gold project in the Americas. Bridgeport is also in discussions with companies interested in either purchasing or joint venturing the projects from the Nevada Portfolio.
On July 19, 2011, the Corporation entered into an option agreement (the "Option Agreement") with Orsa Ventures Corp. (“Orsa”) whereby Orsa can earn a 51% interest in Bridgeport’s Ashby Gold Property in Nevada (one of the properties comprising the Nevada Portfolio) through phased exploration expenditures, share payments and a cash payment to Bridgeport. Pursuant to the terms of the Option Agreement, Orsa has the option (the "First Option") to earn up to a 49% interest in the Ashby Property by:
| a) | issuing to Bridgeport or its nominee an aggregate of 100,000 common shares of Orsa within three business days of receipt by Orsa of the approval of the TSX Venture Exchange (the “TSXV”) of the Option Agreement; | |
| b) | incurring an aggregate of $150,000 of exploration expenditures on the Ashby Property within one year of the date of the Option Agreement; and | |
| c) | incurring $300,000 of cumulative exploration expenditures on the Ashby Property within two years of the date of the Option Agreement. |
Further to TSXV bulletin dated September 2, 2010, the TSXV has accepted for filing documentation pertaining to an amending letter agreement (the "Amending Agreement") dated August 17, 2011, between Gondwana Gold Inc. (“Gondwana”) and the Corporation. Pursuant to the original agreement dated August 20, 2010 (the "Original Agreement"), Gondwana had an option to acquire up to a 70% interest in the Corporation’s McCart Property and was required to spend $150,000 on exploration and issue an additional 250,000 shares by August 20, 2011 (the "Commitments"), among other consideration payments. In accordance with the terms of the Amending Agreement, Gondwana and the Corporation agreed to extend the time by which the Commitments must be satisfied until February 20, 2012, in exchange for an additional 25,000 shares of Gondwana to be issued to the Corporation. On October 25, 2011, Bridgeport received the 25,000 common shares of Gondwana in accordance with the terms of the Amending Agreement.
If Orsa exercises the First Option and acquires a 49% interest in the Ashby Property, it will have the option (the "Second Option") to acquire a further 2% interest in the Ashby Property (for an aggregate 51% interest) by paying Bridgeport $100,000 in cash and issuing to Bridgeport common shares of Orsa having an aggregate value of $100,000 within a 90-day period.
Following the exercise of the First Option, and if applicable, the Second Option, Orsa and Bridgeport will form a joint venture for further exploration and development of the Ashby Property. If Orsa has exercised the Second Option, it will hold a 51% interest in the joint venture and will be the operator of the joint venture. If Orsa has not exercised the Second Option, Orsa will hold a 49% interest in the joint venture and Bridgeport will become the operator.
On November 21, 2011, the Option Agreement was approved by the TSXV and 100,000 common shares of Orsa were received on December 7, 2011.
22
- All other terms of the Original Agreement remained unchanged. On February 15, 2012, Gondwana terminated its option on the McCart Property.
During the year ended April 30, 2012, the Corporation committed to a plan to pursue the sale of its subsidiary Rio Condor and discontinued this operation since it was no longer in accordance with the Corporation's commercial objectives. Consequently, the operating results and cash flows of Rio Condor have been presented distinctly. The Corporation sold the interests it owned in Rio Condor on March 31, 2012 for a consideration of $61,412. The Corporation recorded a gain on disposal of $59,657 in the consolidated financial statements during the year ended April 30, 2012.
On June 28, 2012, the Corporation entered into a non-binding letter of intent that sets forth the basic terms of the proposed acquisition (the “Transaction”) by Bridgeport of Premier Gold’s wholly-owned subsidiary, Premier Royalty Corporation (“Premier Royalty”).
The Corporation has decided not to continue with the McCart Property and as a result, $166,489 was written-off.
Financial
During the year ended April 30, 2012, the Corporation incurred exploration expenditures on Nevada Properties of approximately $3.1 million, up from approximately $1.0 million during the year ended April 30, 2011. Work encompassed exploration drilling, geophysical studies, and geochemical surveys. Two drill rigs were operational at the Nevada Portfolio during the period. The drill rigs were dedicated to exploration drilling at the Blackrock and Hot Pot projects.
As of the date of this report, the exploration program for the Nevada Portfolio has been suspended and the Corporation is discussing the sale or joint venture of the Nevada Portfolio projects with well-funded juniors who have exploration exposure and expertise in Nevada. The Corporation intends to spend $350,000 on the Nevada Portfolio to maintain its ownership rights in the projects. The budget is discretionary, subject to change if management decides to scale back operations or accelerate exploration based on the success or failure of future exploration programs. See “Mineral Exploration Properties” and “Liquidity and capital resources” below.
At April 30, 2012, the Corporation had mineral exploration properties at a carrying cost of $4,208,534 (April 30, 2011 - $7,578,011). See “Mineral Exploration Properties” below. During the year ended April 30, 2012, the Corporation terminated its interests in Chile and incurred a write-off of mineral property interests and related receivables in the amount of $923,022. The Corporation will concentrate on significant property acquisitions when the opportunity arises.
At April 30, 2012, the Corporation had working capital of $17,898,055 (April 30, 2011 – $22,432,663). The Corporation had $17,810,583 in cash and cash equivalents (“total cash”) (April 30, 2011 - $22,870,894). The decrease in total cash and working capital during the year ended April 30, 2012, was primarily due to expenditures incurred on the Corporation’s mineral properties (as discussed above) and operating expenses.
23
Mineral Exploration Properties
The Corporation’s exploration activities are at an early stage, and there are no known commercially exploitable deposits on any of its exploration properties, so any activities of the Corporation thereon will constitute exploratory searches for minerals. See “Risk Factors” above.
McCart Township Project
Pursuant to the Original Agreement dated August 20, 2010, Gondwana had an option to acquire up to a 70% interest in the McCart Property and was required to fulfill certain Commitments, among other consideration payments. In accordance with the terms of the Amending Agreement, Gondwana and the Corporation agreed to extend the time by which the Commitments must be satisfied until February 20, 2012, in exchange for an additional 25,000 shares of Gondwana to be issued to the Corporation. On October 25, 2011, Bridgeport received 25,000 common shares of Gondwana in accordance with the terms of the Amending Agreement.
All other terms of the Original Agreement remained unchanged. On February 15, 2012, Gondwana terminated its option on the McCart property.
The Corporation has decided not to continue with the McCart Property.
During the year ended April 30, 2012, a total of $166,489 exploration properties and deferred exploration expenditures related to McCart Township Project were written off.
Rio Condor Properties
(i)Description of Rio Condor properties
During the 2011 diamond drill campaign, a total of seven drill holes (2,026 metres) were completed. Based on the results, Bridgeport has decided to terminate its rights to acquire a 100% interest in the Trillador and Tamara property blocks by not making the property payments totalling US$100,000 (US $50,000 was due on November 5, 2011, for Tamara and US $50,000 was due on January 31, 2012, for Trillador).
During the year ended April 30, 2012, the Corporation committed to a plan to pursue the sale of its subsidiary Rio Condor and discontinued this operation since it was no longer in accordance with the Corporation's commercial objectives. Consequently, the operating results, cash flows of Rio Condor have been presented distinctly. The Corporation sold the interests it owned in Rio Condor on March 31, 2012 for consideration of $61,412.
During the year ended April 30, 2012, the Corporation incurred a write-off of exploration property interests in the amount of $923,022 related to Chile operations.
Nevada Portfolio properties
Description of Nevada Portfolio properties
On November 16, 2010, BPV Gold acquired its interest in the Acquired Nevada Properties pursuant to an acquisition agreement amongst the Corporation, BPV Gold and Fronteer, in consideration of the issuance by the Corporation of an aggregate of 4,500,000 common shares to Fronteer (representing approximately 16% of the issued and outstanding common shares as of such date, prior to such issuance). The Corporation also acquired the Staked Nevada Claims.
The Nevada Portfolio is held by the Corporation’s wholly-owned subsidiary, BPV Gold. While the Nevada Portfolio is currently in the exploration phase, it is located in gold districts that have produced or are currently producing significant gold. The Nevada Portfolio consists of the properties listed in the table below, including both the 235 claims comprising the Acquired Nevada Properties and the 225 claims comprising the Staked Nevada Claims.
24
| Name of property | Number of claims comprising property | Location | |
| Acquired Nevada Properties | |||
| Blackrock | 12 | Lyon County, Nevada | |
| Argentite | 8 | Esmeralda County, Nevada | |
| Bellview | 53 | (1) | White Pine County, Nevada |
| Horsethief | 18 | Lincoln, Nevada | |
| Hot Pot | 36 | Humboldt County, Nevada | |
| Fri Gold | 56 | Nye County, Nevada | |
| Columbia | 8 | Humboldt County, Nevada | |
| Kobeh | 37 | Eureka County, Nevada | |
| Ashby | 3 | Mineral County, Nevada | |
| East Walker | 4 | Lyon County, Nevada | |
| Staked Nevada Claims | |||
| Argentite | 14 | (2) | Esmeralda County, Nevada |
| Ashby | 13 | Mineral County, Nevada | |
| Blackrock | 8 | Lyon County, Nevada | |
| Horsethief | 78 | Lincoln, Nevada | |
| Columbia | 49 | Humboldt County, Nevada | |
| East Walker | 18 | Lyon County, Nevada | |
| Bellview | 45 | White Pine County, Nevada | |
(1)Consisting of 10 claims known as the “Bellview Lease Claims” and 43 claims known as the “Bellview Project Claims”. BPV Gold holds a 50% leased interest in the Bellview Lease Claims and a 100% interest in the Belleview Project Claims.
(2)Includes partial claims and fractions.
The Corporation holds a 100% interest in the Nevada Portfolio (other than the Bellview Lease Claims, in respect of which BPV Gold holds a 50% leased interest), subject to (i) a 2% net smelter return royalty (“NSR”) retained by Fronteer with respect to the Blackrock, Argentite, Horsethief, Fri Gold, Columbia, Ashby and East Walker properties comprising, in part, the Acquired Nevada Properties; (ii) an aggregate 3% NSR held by Fronteer and certain other third parties with respect to the Bellview Project, Bellview Lease, Hot Pot and Kobeh properties comprising, in part, the Acquired Nevada Properties; and (iii) the Option Agreement between the Corporation and Orsa with respect to the Ashby Gold Property . In addition to the properties acquired from Fronteer, as at the date of this report, Bridgeport has staked the 225 Staked Nevada Claims adjacent to the Acquired Nevada Properties.
Update of Ashby Gold Property
At the date of this report, Orsa has not reported its exploration results to the Corporation.
Update of Nevada Portfolio properties
The Corporation commenced geophysical surveys of the Argentite, Fri Gold, Columbia, and Horsethief projects in March 2011. As of August 31, 2011, the geophysical surveys were complete for all projects. Soil geochemical surveys of the Argentite, Columbia, and Horsethief projects began in April 2011 and were completed in May 2011. A soil geochemical survey was initiated and completed at the East Walker property in July 2011. Phase One drill programs at the Blackrock and Hot Pot projects began in April 2011 and were completed in August 2011. Ten planned Phase One drill holes totaling 3,303 metres were completed at the Blackrock project. Drill results ranged from 83.8 metres grading less than the analytical detection limit of 0.001 gpt Au in drillhole BRKDD11-005 to as much as 1.52 metres grading 3.98 gpt Au in drillhole BRKDD-009. Significant drill results, defined as a minimum intercept length of 3 metres with a minimum grade of 0.5 gpt using a 0.1 gpt cutoff grade, are presented in the following table.
25
| Drillhole | From (m) | To (m) | Length (m) | Au gpt | Ag gpt |
| BRKDD11-001 | No significant intercepts | ||||
| BRKDD11-002 | 70.10 | 77.42 | 7.32 | 0.61 | 11.32 |
| BRKDD11-003 | No significant intercepts | ||||
| BRKDD11-004 | No significant intercepts | ||||
| BRKDD11-005 | 181.36 | 194.62 | 13.26 | 0.57 | 2.96 |
| BRKDD11-006 | 44.04 | 49.23 | 5.18 | 1.80 | 60.46 |
| BRKDD11-007 | No significant intercepts | ||||
| BRKDD11-008 | 99.67 | 102.72 | 3.05 | 0.54 | 4.58 |
| BRKDD11-008 | 172.21 | 175.26 | 3.05 | 0.52 | 4.23 |
| BRKDD11-008 | 186.05 | 190.50 | 4.45 | 0.66 | 5.63 |
| BRKDD11-009 | 156.82 | 161.33 | 4.51 | 1.12 | 6.32 |
| BRKDD11-010 | No significant intercepts | ||||
Six planned Phase One drill holes totaling 2,786 metres were completed at the Hot Pot project. Drill results ranged from 64 metres grading containing less than the analytical detection limit of 0.001 gpt Au in drillhole HOTRC11-001 to as much a 1.52 metres grading 0.30 gpt Au in drillhole HOTRC-005. No significant intercepts, defined as a minimum intercept length of 3 metres with a minimum grade of 0.5 gpt using a 0.1 gpt cutoff grade, were returned.
Potential quantity and grade is conceptual in nature. There has been insufficient exploration to define a mineral resource on any of the Nevada Portfolio properties to date and it is uncertain if further exploration will result in any such target being delineated as a mineral resource.
(i)Project Expenditures
The following table sets forth a breakdown of material components of exploration expenditures incurred by the Corporation during the year ended April 30, 2012, on the Nevada Portfolio properties.
Exploration expenditures | Year Ended April 30, 2012 $ |
| Geology | 335,947 |
| Property | 156,449 |
| Geophysics | 121,971 |
| Geochemistry | 50,178 |
| Diamond drilling | 2,134,759 |
| General and administrative | 1,265 |
| Total | 2,800,569 |
Budget
The Corporation expects to find partners for its Nevada Portfolio to develop the project.
In light of the current market environment, Bridgeport has halted all early stage exploration activities in Nevada with the objective of conserving cash to support an aggressive search for a flagship advanced gold or copper-gold project in the Americas. With total cash of approximately $18 million at April 30, 2012, Bridgeport will attempt to acquire an advanced exploration asset at reasonable cost. As a result, the Corporation’s budget of approximately $5 million for Nevada has been placed on hold. The Corporation intends to spend $350,000 on the Nevada Portfolio to maintain its ownership rights in the project. The budget of $350,000 is discretionary, subject to change if management decides to scale back operations or accelerate exploration. At the date of this report, the Nevada Portfolio is in good standing.
26
4.B. Business Overview
The Corporation is a mineral exploration company. The primary business objectives of the Corporation is stay within the mining sector and invest in business opportunities which include exploring and, if warranted, developing gold and copper-gold properties in the Americas. The Corporation seeks to target properties with excellent exploration potential to advance rapidly toward development, focusing on properties with million ounce potential. In addition, the Corporation is also interested in acquiring precious metal purchase agreements from companies with low production costs, significant exploration upside and strong management teams. The precious metal purchase agreements will provide the Corporation with strong cash inflows based on royalties from production from its new production partners (See “Subsequent Events” under Item 5.A Operating results below for further details).
Governmental Regulation
All phases of the Corporation’s operations are subject to governmental regulation in the various jurisdictions in which it operates, including regulation with respect to environmental matters. See “Risk Factors” regarding environmental regulations and permits and licensing. In particular, the Corporation’s operations with respect to the McCart property are subject to the applicable laws of the Province of Ontario and the federal laws of Canada applicable therein and its operations with respect to the Nevada Portfolio are governed by the applicable laws of Nevada and the federal laws of the United States. The Corporation maintains, and anticipates continuing to maintain, a policy of operating its business in compliance with all governmental regulations.
Various governmental economic, fiscal, monetary and political policies, such as those related to inflation or foreign exchange, may affect the economic conditions prevailing in the Corporation’s countries of operation, which may, in turn, impact its business. These government policies may also affect investments by the Corporation’s shareholders.
Competitive Conditions
The mineral exploration and mining business is competitive in all phases of exploration, development and production. The Corporation competes with a number of other entities in the search for and the acquisition of productive mineral properties. In particular, there is a high degree of competition faced by the Corporation in Canada and elsewhere for desirable mining property interests, suitable prospects for drilling operations and necessary mining equipment, and many of these companies have greater financial resources, operational experience and/or more advanced properties than the Corporation. As a result of this competition, the Corporation may be unable to acquire attractive properties in the future on terms it considers acceptable or at all.
The ability of the Corporation to acquire and explore additional properties depends on its success in exploring and developing its existing property interests and on its ability to select, acquire and bring to production suitable properties or prospects for mineral exploration and development. Factors beyond the control of the Corporation may affect the marketability of any minerals mined or discovered by the Corporation. See “Risk Factors”.
4.C. Organizational structure
The Corporation has one wholly-owned subsidiary, BPV Gold, a private company incorporated under the laws of Nevada.
27
4.D. Property, plants and equipment
As of April 30, 2012, the Corporation has one material property: the Nevada Portfolio. An excerpt of the technical report related to such property appears below.
Summary of Report on the Nevada Portfolio
Set forth below is a description of the highest priority Nevada Portfolio properties. Information for the Argentite, Bellview, and Horsethief properties has been derived from the Nevada Report, which has been updated to reflect recent events that have occurred since the Nevada Report was prepared and which is included herein with the consent of Matthew Gray, Ph.D., C.P.G on behalf of Resource Geosciences de Mexico SA de CV. Dr. Gray is a qualified person who is independent of the Corporation within the meaning of NI 43-101. The full text of the Nevada Report is available on SEDAR atwww.sedar.com. Information for the Hot Pot property has been derived from technical evaluation reports prepared by Dr. Gray, which is included with his consent.
ARGENTITE, BELLVIEW AND HORSETHIEF PROPERTIES
Set forth below is a description of the Argentite, Bellview and Horsethief properties which comprise, in part, the Acquired Nevada Properties, which summary has been derived from the Nevada Report.
Claims and Title
The map below shows the location of the Argentite, Bellview and Horsethief properties which comprise, in part, the Nevada Portfolio properties.
28

Figure 1. Priority Nevada Portfolio Properties locations map
The Corporation holds the mineral rights for the Argentite, Bellview and Horsethief properties as unpatented mining claims located on the public lands of the United States. A private party acquires such mineral rights by the location of the unpatented mining claims in accordance with the procedures prescribed in federal and state laws. The claim owner must comply with federal laws and regulations and state laws in order to maintain the mining claims in good standing. Under federal law, the claim owner is obligated to pay a federal annual mining claim maintenance fee in the amount of US$140 per mining claim. Additionally, under Nevada law, the claim owner is directed to record annually an affidavit of payment of the federal annual mining claims maintenance fee and notice of intent to hold the mining claim. The claim owner must pay a fee of US$10.50 per mining claim under current Nevada law. In March 2010, the State of Nevada enacted Assembly Bill No. 6, which sought to balance the state budget by reducing expenditures and increasing certain fees. Among those fee increases was a one-time fee payable in conjunction with the annual filing of an affidavit of the intent to hold a mining claim, with a tiered fee structure applied for holders of 11 or more claims in Nevada. The fee ranges from $70 per claim for holders of 11 to 199 claims up to $195 per mining claim for holders of 1,300 or more claims as of the date of filing. The law authorizing these fees was subsequently ruled unconstitutional and was voided. Fees paid by the Corporation under terms of AB6 will be refunded, but the timing and mechanism of the refund process has not yet been determined by the State.
29
Argentite Property
Property Description and Location
The Argentite property is in Esmeralda County, Nevada, at coordinates 426,984E, 4,179,876N UTM Zone 11 NAD83. The property is 261 kilometers southeast of Reno, Nevada and 295 kilometers northwest of Las Vegas, Nevada (see Figure 1). The property area is 159.01 hectares (392.93 acres).
30

Figure 2. Claim block boundary, Argentite project showing limit of claims staked by Bridgeport.
31
Surface Rights
The ownership of surface rights at the Argentite property is Federal, administered by the U.S. Bureau of Land Management (“BLM”).
Mineralization
Historic artisanal small mines and exploration workings are present within the Argentite property, developed on zones of outcropping quartz veins. No metals are currently produced from any of the properties.
Access, Climate, Infrastructure, and Physiography
The Argentite property is located 261 kilometers southeast of Reno, Nevada, 295 kilometers northwest of Las Vegas, Nevada, and 63 kilometers southwest of Tonopah, Nevada (see Figure 1). Access is by unsurfaced road from Silver Peak or Dyer, Nevada, and may require use of an all wheel drive vehicle. Paved state Highway 264 passes within 23 kilometers of the property on the west side. Electric transmission lines that service Dyer, Nevada are as close as 24 kilometers to the project.
All basic services are available in Tonopah. The project area is unpopulated. An adequate supply of experienced labor for mining operations can be drawn from the region.
The nearest commercial airport is located 242 kilometers northwest of the project in Carson City. The Reno, Nevada airport is located 261 kilometers northwest of the project and is served by daily flights from major US cities. A general aviation use airstrip in Tonopah is capable of serving small passenger jets.
The property is located in the southwest margin of the Great Basin physiographic province, within the Walker Lane geologic province of Nevada, in the Silver Peak mountain range. Topographic relief is moderate and elevations in the project area range from 2,250 meter above sea level (“ASL”) to over 2,500 meter ASL. Broad valleys of low relief east of the project area are suitable locations for mill sites, leach pads, rock dumps, and other mine related infrastructure.
The climate in the area is arid with total annual precipitation of 11.0 centimetres and seasonal temperatures ranging from an average annual high of 36oC in July and an average annual low temperature of -8oC in December. Exploration activities may be conducted year round.
Vegetation in the area consists predominantly of piñon-juniper forest and lesser open areas covered by small scrub and sage.
History
The Argentite property is located within the intensely explored and productive gold producing terrain of the Great Basin and has been previously explored. Historical records of previous exploration efforts at the Argentite property are shown in Table 1.
32
Table 1. Exploration History, Argentite Property.
| Company | Year | Com. | Type of Work | Comments |
| Unknown | 1920’s | Au | Prospecting | Identified mineralization |
| Au | Pits, Shafts, Drifts | Several small prospect pits; two 30-foot shafts; Drift on small low grade showing |
| WWII | Mn | Prospecting | ||
| Mineral’s Exploration Company & Hecla Mining | 1960’s | Ag | Briefly investigated the area | |
| Sunshine Mining Company | 1970’s | Unknown | Geochemical Surveys | No data |
| US Government | 1980’s | -- | Geological Mapping | Government Geology Map (1:63,360) |
| Amoco Minerals Comp. | 1979 | Ag, Zn | Rotary Drilling | 14 RC dh (5,655ft); Ag and Zn intersection |
| Hunt, Ware, and Proffett (Freeport Exploration) | 1981 | Ag, Au | Geochemistry | |
| RC Drilling | 10 RC dh (1,855ft) | |||
| Camnor | 1997 | Au | Drilling | 12 RC dh |
| Surface Mapping | ||||
| Cordex | 2004 | Au | RC Drilling | 4 RC dh (1,324 m) |
Geological Setting
Regional Geology of the Argentite Property
The Argentite property lies within the Walker Lane geologic province, which occurs at the western edge of the Great Basin physiographic province and separates the Great Basin from the Sierra Nevada batholith and structural block to the west. See “Blackrock Property – Geological Setting – Regional Geology of the Blackrock Property”.
Local Geology
The following discussion of project geology is based upon field examinations by Dr. Gray and a review of historic exploration data contained in the Fronteer project files.
The Argentite property lies in the Silver Peak Mountains within the Silver Peak mining district. The property is underlain by a Tertiary volcanic and sedimentary sequence which has been described as comprising a lowermost Tertiary ash-flow tuff dated at 21.5 million years (“Ma”) (early Miocene) which is overlain by andesitic to dacitic volcanic breccias with interlayered flows and lenses of tuffaceous sandstone. Tuffaceous shale and sandstone strata overlie the volcanic breccia unit and may represent lacustrine sedimentation in late Miocene to early Pliocene lakes or basins. Rhyolitic air-fall tuffs, flows, domes, breccias and intrusive masses rest on, or intrude, the lacustrine sediments and older rocks. The rhyolite unit has been dated at 6.0 Ma and is overlain by porphyritic latite or trachyandesite, at least 500 ft thick. This rock is characterized by abundant large plagioclase and sanidine phenocrysts and abundant biotite. Sandstone, conglomerate and tuff are interlayered with the latite flows. The unit has been dated at 5.9 Ma. The distribution, thickness, and lithology of the rhyolitic air-fall tuffs, flows, domes, breccias, intrusive masses, and of the porphyritic latite suggest the central part of the Silver Peak Mountains may have been a caldera-like structure. The flows, agglomerates, and sediments on the property form a gentle south-dipping sequence away from a proposed caldera rim a mile or so to the north, and the major structures on the property are north to northeast-trending normal faults with 300 to 500 feet of right lateral offset. The coarse grained porphyritic latite unit is exposed at the base of Argentite Canyon whereas the volcaniclastic sedimentary strata and interbedded silica sinters crop out at the higher elevations on the east side of the canyon. They appear to depositionally overlie the porphyritic latite.
Deposit Types
The exploration targets recognized for the Argentite property include epithermal gold deposits of either high sulfidation (referred to by some authors as acid sulfate or quartz alunite) or low sulfidation (referred to by some authors as quartz adularia) type, both of which have productive and economically important analogs in the region. The Argentite prospect may be prospective for either a low or a high sulfidation deposit.
33
Economically important low sulfidation epithermal gold systems in the Walker Lane include Aurora, Bullfrog, Comstock, Rawhide, Round Mountain, and Tonopah, Nevada and Bodie, California. The mineralization described for the mines and mining districts in this section is not necessarily indicative of the mineralization at the Blackrock and Argentite properties.
Low sulfidation deposits may be present as veins and/or disseminated deposits and hosted by intrusive, volcanic, and sedimentary rocks. Features common to such deposits include:
- Intermediate to felsic, calc-alkaline volcanic host rocks.
- Association with intrusive centers.
- Alteration mineral assemblages dominated by sericite, quartz, adularia, and chlorite.
- Variable Au:Ag ratios.
- Ore mineralogy characterized by argentite, tetrahedrite, tennantite, native silver, native gold, and base- metal sulfides.
- Vertical geochemical zoning, with well defined upper and lower elevation limits to economic mineralization, over vertical ranges of 200 to 700 meters.
- Open space filling vein textures.
- Quartz and carbonate gangue minerals.
- Ore and gangue mineral textures indicative of low temperature environments.
Economically important high sulfidation systems were formed in the Walker Lane at Borealis, Goldfields, and Paradise Peak, Nevada.The mineralization described for the mines and mining districts in this section is not necessarily indicative of the mineralization at the Argentite property.
High sulfidation gold-silver deposits may be present as veins and/or disseminated deposits. Some of the most intensely studied and described high sulfidation deposits (“HS deposit”) include Summitville, Colorado; Goldfield, Nevada; Lepanto, Philippines; and Julcani, Peru. Based upon these studies and others, excellent compilations of general characteristics and genetic and empirical models have been presented. General characteristics of high sulfidation deposits include:
- Located within plutonic-volcanic arcs.
- Associated with intermediate calc-alkaline rocks, often in dome complexes.
- Alteration mineral assemblages indicative of high temperature acidic hydrothermal fluids, including an advanced argillic assemblage characterized by one or more of pyrophyllite, alunite, dickite, kaolinite, and diaspore.
- Silicification and acid leaching of principal hydrothermal fluid conduits (forming the clichéd “vuggy silica” alteration).
- Presence of minerals indicative of high sulfidation states, principally the sulfosalt enargite or its low temperature polymorph luzonite.
- Economically important quantities of Au and/or Ag and/or Cu.
- Alteration zoning typified by a central zone of silica alteration flanked by a zone of advanced argillic alteration, which in turn is surrounded by illite dominated argillic alteration.
Genetic models proposed for high sulfidation systems call upon shallow emplacement of an oxidized calc-alkaline magma. As the magma crystallizes, a metal- and volatile-rich fluid phase exsolves, and at relatively low confining pressures will separate into a low salinity vapor and a hypersaline liquid. The vapor phase ascends and when absorbed into connate or meteoric waters, forms a high temperature, sulfate-rich, acidic hydrothermal fluid. As this hydrothermal fluid ascends and cools, acidity progressively increases, resulting in a vertical zonation where advanced argillic assemblages overly illite-dominated argillic assemblages. Neutralization and cooling of the fluid during lateral fluid flow repeats this zoning pattern, with proximal silicified and leached zones flanked first by advanced argillic alteration, and then by more distal illite dominated alteration. As the hydrothermal system evolves, younger, more reduced hydrothermal fluids, probably generated by interactions between ascending hypersaline magmatic fluid and meteoric water dominated convection cells, then transport and deposit metals (Au-Ag-Cu) along the same conduits utilized previously. Metals may be sourced directly from the magmatic fluids or leached from country rocks.
34
Mineralization
A gold mineralized high angle silicified structural zone is exposed in Argentite Canyon and has been the focus of historic artisanal scale mining. The mineralized zone is characterized by pervasive silicification and quartz veining and in places comprises a quartz cemented silicified breccia. An adit with no more than 50 meters of combined drifting and a few small prospect pits are the only known historic mines or exploration workings at the project. Brecciation and silicification of the structural zones is intense and iron oxide staining varies from nil to intense. Alteration and mineralization are confined to structurally broken zones. The host rock latites are not visibly altered or mineralized peripheral to the structural zones.
Work by previous project operators Camnor Resources Ltd. (“Camnor”), Cordex Exploration Co. (“Cordex”), and Fronteer partially tested the epithermal gold system exposed in Argentite Canyon and identified hot spring sinter deposits that crop out at elevations 140 meters above the canyon floor. Rock chip samples of the silicified zone exposed in the adit were reported by Camnor to yield as much as a 17 meter width assaying greater than 3.7 gpt Au. Samples collected from silicified and brecciated outcrops in Argentite Canyon were reported to yield as much as 3.3 gpt Au. The sinters were reported to contain geochemically anomalous concentrations of Au, As, Sb, and Hg. The historic rock chip assay data has not been independently confirmed by Dr. Gray but was obtained by exploration groups and personnel known to Dr. Gray and believed to be credible. Dr. Gray conducted independent sampling of the silicified zones exposed in Argentite Canyon and of the sinters cropping out above the canyon on the east side. The results verify that the silicified structural zones contain significant gold concentrations and that the sinters are geochemically anomalous. Dr. Gray’s samples across the silicified breccias zones exposed in Argentite Canyon yielded as much as 1.9 gpt Au over a width of 1.5 meters. Dr. Gray’s sample of quartz vein material from the dump at the adit yielded 17.6 gpt Au and his samples of the sinter returned assays of 0.03 gpt Au and as much as 286 ppm Sb. In cases where samples were collected at a sample site marked from prior sampling by Fronteer, gold assays matched those reported by Fronteer.
Cordex is known to have drilled exploration boreholes in Argentite Canyon but Dr. Gray does not have access to the drill data. Drilling by Camnor in 1997 was reported to have returned significant widths of gold mineralized quartz veined zones hosted in Tertiary volcanic strata, with intercepts of as much as 45.7 meters @ 1.2 gpt Au reported in public press releases. Dr. Gray has not reviewed the original drill logs nor assay certificates thus cannot comment on the accuracy of the reported drill results. The drill hole assay data was obtained from sources believed to be reliable but cannot be verified and the Camnor drillhole data has not been independently confirmed by Dr. Gray. Both Camnor and Cordex interpreted east-striking structures as controls of the gold mineralization exposed in Argentite Canyon.
35
Table 2. Sample descriptions and assay data for Argentite property rock samples collected by Gray.
During the field review mineralized zones exposed in Argentite Canyon and hydrothermal silica sinter outcrops on the east side of the canyon were visited. High angle silicified and quartz veined zones were observed in the canyon bottom, and low temperature chalcedonic silica replacement deposits and sinters were seen 140 meters above the canyon floor on the east side. The sinters comprise bedded laminated sinter, low temperature chalcedonic silica replacement of sediments possibly deposited contemporaneously with the sinters, and sinter cemented sinter breccias. Accumulated thicknesses of as much as 15 meters of sinter and related high level silicified sediments were observed at elevations of 7,880 feet. Geologic mapping by Cordex indicates that the sinters extend for at least 2,500 feet along a northwest trend.
Data Verification
Prior Exploration Campaigns
An extensive amount of exploration work has been completed on the Argentite property. Nearly all of this work is historic in nature, and as such the reported results are not NI 43-101 compliant. Digital copies of data files from exploration programs conducted prior to Bridgeport’s involvement with the project were reviewed by Dr. Gray. Data includes geologic maps, drillhole logs, drill sample assays, surface rock chip assays, and geophysical studies. Original documents are not available, nor is drill core or witness samples from RC drilling. Much of the exploration work was completed decades ago, and reclamation of drill sites and the effects of time and weathering have combined to destroy monuments and physical evidence of drillhole and surface sample locations. The only data that could be directly verified by Dr. Gray were geologic outcrop maps, some drillhole locations, and some outcrop rock chip sample assays.
36
Bridgeport has not yet commenced an exploration program at the Argentite property beyond the work completed as part of the Nevada Report, thus there is no prior data generated by Bridgeport to be verified.
Production Data
No significant historic production is reported from the Argentite property.
Adjacent Properties
The Argentite property is not contiguous with any historic or active mining or exploration property. The nearest active mining property is the Mineral Ridge gold mine, located 13 kilometers to the east.
Metallurgical Testing
No metallurgical studies have been conducted by Bridgeport, nor is historical metallurgical data available for the property.
Mineral Resource Estimate
Data is insufficient to permit estimation of a mineral resource at the Argentite property.
Other Relevant Data and Information
To the best knowledge of Dr. Gray, all relevant data has been presented in the Nevada Report.
Recommendations
Target Concepts
The target concept at Argentite is an epithermal low sulfidation gold system, in a high level and/or hot spring environment, prospective for both bulk minable near surface deposits and high grade, structurally controlled deposits minable by underground methods. Target analogs include the Mineral Ridge mine located approximately 13 kilometers east of Argentite. The host rocks at Mineral Ridge are metasediments rather than volcanics, but the mine is developed on a structurally controlled epithermal gold deposit which is reported to have produced 575,000 ounces gold from open pit and underground operations and hosts a Measured Mineral Resource and Indicated Mineral Resource of 221,000 ounces and an inferred resource of 136,000 ounces. Another possible exploration analog for the Argentite prospect is the McLaughlin deposit in Napa County, California, which comprises gold bearing epithermal sheeted veins underlying subaerial sinter. McLaughlin hosted a total gold resource (production and reserves) greater than 3.5M ounces gold. The mineralization described for the mines in this section is not necessarily indicative of the mineralization at the Argentite property.
Work by previous project operators has partially tested the epithermal gold system exposed in Argentite Canyon and identified geochemically anomalous (Au, As, Sb, Hg) hot spring sinter deposits that crop out at elevations 140 meters above the canyon floor. Historic drilling returned significant widths of gold mineralized quartz veined zones with intercepts of as much as 46 meters @ 1.2 gpt Au reported. East-striking structures were interpreted as controls of the gold mineralization exposed in Argentite Canyon.
During the field review mineralized zones exposed in Argentite Canyon and hydrothermal silica sinter outcrops on the east side of the canyon were visited. High angle silicified and quartz veined zones were observed in the canyon bottom, and low temperature chalcedonic silica replacement deposits and accumulated thicknesses of as much as 15 meters of sinter and related high level silicified sediments at the highest elevations on the east side of the canyon.
37
Sampling of the silica sinters by previous operators was reported to yield anomalous gold concentrations of as much as 0.1 ppm Au with elevated Hg concentrations. Independent sampling by Dr. Gray confirmed that the sinters contain geochemically anomalous Au, As, and Sb contents. Dr. Gray considers the low level metal anomaly in sinter to be significant supporting evidence that the sinters were deposited as part of an auriferous hot springs epithermal system. Such systems often do not produce economic gold concentrations in the near surface environment but may host economic gold concentrations at relatively shallow depths.
The data is permissive of a model in which both the gold showings in Argentite Canyon and the sinters to the east are part of the same mineralizing system, and the sinters represent the highest level of the paleo-hydrothermal system, whereas the auriferous stockwork zones represent a deeper portion of the same system. If so, a 140 meter vertical extent of the system is exposed, and potentially economic gold concentrations are present at depths of 140 meters below the paleosurface marked by the sinters, thus the sinters east of Argentite Canyon are guides to potentially economic gold concentrations at relatively shallow depths beneath them.
Exploration Program and Budget
The exploration target concept is straightforward, yet requires further data collection to define drill targets. The concept to be explored is gold mineralized zones underlying silica sinters, with gold mineralization controlled by the structural zones that served as conduits for the sinter forming hydrothermal fluids. Sinter outcrops are discontinuously present over an area of greater than 1 square kilometre. In the opinion of Dr. Gray, developing drill targets within the prospective zone of known sinter outcrops will require:
| 1. | Compilation of historic exploration data into a Geographical Information System (“GIS”) database. |
| 2. | Creation of 2D and 3D models of geology, vein structures, and mineralized zones using drillhole information and outcrop maps. |
| 3. | Detailed geologic mapping and rock chip sampling. |
| 4. | Grid soil geochemical surveys to identify hidden structural controls to gold distribution. |
| 5. | Terrestrial induced polarization (“IP”)/resistivity/magnetic surveys to seek evidence of pyritic zones (chargeability highs), silicified zones (resistors) and structures (magnetic gradient discontinuities) within the prospective area. |
| 6. | Drill testing the interpreted structural zones that controlled formation of the sinters at depths of 150 meters below the sinters. A total of 3,000 meters of RC drilling is recommended for the first phase drill test. |
Dr. Gray recommends completion of a recommended work program that is estimated to require 8 months and approximately US$0.8M. A Phase 2 drill and resource modeling program with a budget of US$1.0M would be conditional upon successful results from the Phase 1 program. The timing of proposed expenditures includes approximately US$1.4M in 2011 and US$0.4M in 2012, assuming the completion of Phase 2 is warranted based upon prior results received.
38
Table 3. Proposed exploration program and budget, Argentite property.
| Phase 1: Drilling program | |
| Phase 2: Resource modeling and infill drilling program | |
| Total Cost (US$) | |
| Item | Phase 1 | Phase 2(1) |
| Lodging/Meals/Communications | $31,500 | $42,300 |
| Geophysical Surveys (IP/Resistivity) | $150,000 | $- |
| Roads and Drill Pads | $50,000 | $75,000 |
| Resource Modeling | $- | $75,000 |
| Drilling - Reverse Circulation | $246,000 | $410,000 |
| Drilling - Diamond Drill Core | $- | $- |
| Drilling – Core | $- | $- |
| Assays, drill samples | $60,000 | $100,000 |
| Assays, rock and soil | $- | $- |
| Senior Geologist | $29,250 | $29,250 |
| Project Geologists | $73,500 | $63,000 |
| Technicians/Samplers | $25,200 | $25,200 |
| Vehicles and Fuel | $30,030 | $27,720 |
| Permits | $15,000 | $25,000 |
| Field Supplies | $40,000 | $40,000 |
| Travel Costs | $24,000 | $24,000 |
| Environmental Costs/Reclamation | $50,000 | $75,000 |
| Total | $824,480 | $1,011,470 |
| Total Phase 1 & Phase 2 | $1,835,950 | |
| (1) Conditional upon positive result from Phase 1 program | ||
The Corporation believes these recommendations are appropriate and will be followed should the Corporation move forward with this property.
As of June 30, 2011 the Corporation had completed a soil geochemical survey and ground magnetometry survey over a portion of the claim block.
Bellview Property
Property Description and Location
The Bellview property is located in White Pine County, Nevada, at coordinates 616,828E, 4,438,341N UTM Zone 11 NAD83. The property is 363 kilometers east-northeast of Reno, Nevada, and 85 kilometers south-southeast of Elko, Nevada (see Figure 1). The property area is approximately 1095 hectares (443 acres).
Surface Rights
The ownership of surface rights at the Bellview property is Federal, administered by the US National Forest Service.
39
Mineralization
Historic artisanal small mines and exploration workings are present within the Bellview property. Nearly all are developed on zones of outcropping quartz veins or silicified carbonates (jasperoids). No metals are currently produced from the property.
Access, Climate, Infrastructure, and Physiography
The Bellview property is located 363 kilometers east-northeast of Reno, Nevada and 85 kilometers south-southeast of Elko, Nevada (see Figure 1). Access is by highway 228, unsurfaced United States Forest Service (“USFS”) road 114, and Cherry Springs Road, and may require use of an all wheel drive vehicle. Paved state Highway 264 passes within 23 kilometers of the property on the west side.
All basic services are available in Elko. The project area is unpopulated. An adequate supply of experienced labor for mining operations can be drawn from the region. The nearest commercial airport is located in Elko, with turboprop commuter flight connections to Salt Lake City.
The property is located in the north-central portion of the Great Basin physiographic province, on the west flank of the Ruby Mountains. Topographic relief is moderate and elevations in the project area range from 2,000 meters ASL to 2,350 meters ASL. Broad valleys of low relief and pediments west of the project area are suitable locations for mill sites, leach pads, rock dumps, and other mine related infrastructure.
The climate in the area is temperate with total annual precipitation of 33.2 centimetres and seasonal temperatures ranging from an average annual high of 31oC in July and an average annual low temperature of -10oC in January, as measured at meteorological station Ruby Lake Nevada 267123 located at 40° 12” N, 115° 30” W, 1,831 meters ASL. Snowfall in the period December to March may preclude exploration activities.
Vegetation in the area consists predominantly of piñon-juniper forest.
History
The Bellview property reviewed is located within the intensely explored and productive gold producing terrain of the Great Basin and has been previously explored. Historical records of previous exploration efforts at the Bellview property are shown in Table 4.
Table 4. Exploration History Bellview Property.
| Company | Year | Type of Work | Comments | |
| Unknown | 1951- 1954 | Pb- Zn | Mining | Small, pits, shafts, and adits; 10% Pb and 1 oz/ton Ag |
| Kohlmoos and Zilich | 1970 | Au | Stake Claims | Claim Staking |
| Arctic Precious Metals Inc. | 1979 | Au | Optioned | |
| 1980- 1985 | Au | Soil and Rock Sampling | ||
| VLF-EM Survey | ||||
| 1983 | Mapping | Produced a 1:200 scale outcrop map | ||
| Drilling | 95 RC Drillholes (15,557ft) | |||
| Resource | 500,000 tons @ 0.034 opt AuNOT NI 43-101 COMPLIANT |
| Silver State Mining Company | 1986 | Au | Drilling | 10 vertical dh (1,105ft) |
| Pegasus Gold Inc. | 1987 | Au | Rock Chip | Across jasperoid areas |
| Teck Resources Limited | 1987- 1991 | Au | Soil Sampling | |
| Rock Chip Sampling | ||||
| TFM Survey | TFM Survey; | |||
| Geologic Mapping | 1:1000 and 1:200 scale maps | |||
| Drilling | 68 RC dh (10,630ft) | |||
| Resource | 1.12 m tons @ 0.031 opt Au( 0.96 g/t - 34,720 Au); NOT NI 43-101 COMPLIANT | |||
| Western States Minerals Corp. | 1991- 1999 | Au | Geologic Mapping | Mapping at 1:500 scale; |
| Rock Chip | With mapping in 1999 | |||
| Soil Geochemistry | ||||
| 1991 | Drilling | 3 RC dh (1,410 ft) | ||
| 1993 | Drilling | 21 RC dh (9,595 ft) | ||
| 1995 | Drilling | 2 RC dh (800 ft) | ||
| Homestake Mining Company | 1996 | Au | Drilling | 6 RC dh (2,835 ft) |
| Lyle Campbell | 1980’s | Au | Drilling | 20 RC holes Cherry Springs area, results unknown |
40
Geological Setting
Regional Geology of the Bellview Property
The Bellview property lies within the north central Great Basin. The region of the Bellview property is underlain by Archean and Proterozoic crystalline basement which was rifted in Proterozoic time, forming a rifted continental margin west of the project area. Orogenic contractional deformation associated with the Late Paleozoic Sonoma orogeny thrust allochthonous blocks of western deepwater sedimentary strata, the Roberts Mountains and Golconda allochthons, onto the eastern shallow continental shelf facies sedimentary strata. Middle, Late Jurassic, Early Cretaceous, and Late Cretaceous orogenies associated with an east dipping subduction zone resulted in further displacement of the older allochthons and compressional events were followed by intervening periods of relaxation and extension. Extensional deformation has affected the area since the Late Eocene, with extension direction changing from northwest-southeast in the late Eocene to west-southwest-east-northeast in the late Eocene and middle Miocene, then to northwest-southeast in the late Miocene to present. Subduction related calc-alkaline magmatism affected the region in Middle and Late Jurassic, Cretaceous, Late Eocene, and middle Miocene time. Magmatic activity from Late Miocene to the present has been dominated by rift related tholeiitic bimodal magmatism.
Local Geology
The following discussion of project geology is based upon field examinations by Dr. Gray and a review of historic exploration data contained in the Fronteer project files.
The Bellview property is underlain by a series of Lower and Middle Cambrian limestones, shales, and dolostones.
41
It has been reported that dioritic, fine-grained, equigranular to medium-grained, weakly porphyritic dikes are found throughout the property. The main fault orientations at Bellview have been described as follows:
- North-northeast faults striking NA035 with apparent left lateral offset;
- NA000 to NA015 striking faults with normal offsets;
- NA325 striking faults with dip slip and oblique dextral normal displacement;
- East-west faults and shear zones of unspecified relative displacement.
Linear outcrops patterns of silicified Eldorado Dolomite suggest that north and northeast striking faults have locally controlled jasperoid formation.
The Bellview property has been described as a complex of folded folds, with the elliptical exposure of the Eldorado Dolomite representing the core of a refolded, doubly plunging anticline. Small-scale, broad folds or warps trending west-northwest and northeast throughout the property have been mapped.
It has been reported that the Secret Canyon and overlying units on the east side of the Eldorado exposures strike mostly to the north and dip moderately to the east. Northwest of the resource area, medium to thick-bedded limestones dip from between 37 and 62 degrees west and postulated an anticlinal fold in the center of the property area.
It has been proposed that the structural regime at Bellview represents the sliding of a detached sheet of shale-rich, plastically flowing, Middle Cambrian sediments over a corrugated basement of east-northeast trending rotated horsts and grabens where resistive, brittle fracturing Eldorado Dolomite highs forced upward warping and ramping of the overriding plate, back thrusting, and formation of tear faults along the margins of the Eldorado Dolomite highs.
Deposit Types
The exploration target recognized for the Bellview property is a Carlin-type deposit, here defined as a sedimentary rock hosted, structurally and lithologically controlled gold deposit of moderate to low temperature of formation. Divergent ideas for the formation of Carlin-type deposits have been proposed ranging from a distal magmatic hydrothermal origin; to formation from hydrothermal fluids generated by regional metamorphic processes; to an amagmatic origin related to regional fluid circulation due to crustal extension. Although the genesis of the Carlin deposits is a matter of dispute, the general characteristics of the deposits are not, and are summarized as follows:
- Metals contained in economically significant amounts are gold and silver.
- Other metals and elements present may include arsenic, antimony, barite and mercury.
- Host rocks are generally Paleozoic silty to massive limestones, dolostones, calcareous siltstones, and shales, with lesser amounts of ore hosted by interbedded mafic flows or crosscutting felsic dikes.
- Commonly occur at intersection of major normal faults with favorable stratigraphic units or thrust contacts.
- No clear association with intrusives although intermediate to felsic intrusions are present in many Carlin districts.
- Individual deposits or mineralized systems contain from 0.1M to 30M ounces gold.
- Associated hydrothermal alteration includes bedding controlled carbonate dissolution, structurally and stratigraphically controlled silica replacement (jasperoid formation), recrystallization of limestones and dolostones, and calcite veining peripheral to mineralized areas.
- Temperatures of formation ranging from 160 to 250° C under pressure of 300 to 800 bars.
- Ore and gangue mineral assemblage of quartz, illite, kaolinite, arsenian pyrite, arsenopyrite, stibnite, realgar, orpiment.
- Gold typically present as micron sized inclusions in pyrite.
42
Mineralization
The Bellview property hosts gold mineralized jasperoids and auriferous argillized, silicified, and quartz veined sedimentary strata. Historic mine and exploration workings are comprised of shallow prospect cuts in areas of boldly outcropping silicified dolostone or jasperoid. No metal production is reported from the property. Initial exploration interest in the property was focused on a gold bearing, jasperoid replaced, carbonate unit, the Cambrian Eldorado Dolomite. Subsequently it was observed that the overlying silty sedimentary strata at the base of the Cambrian Secret Canyon Formation were mineralized and hosted significant gold concentrations. Two areas of outcropping jasperoid are present:
| 1. | A large continuous area of jasperoid replaced Eldorado Dolomite exposed in the low hills on the westflank of the Ruby Mountains, beginning at Buck Spring and roughly bounded by Walker Canyon to the north and bounded to the south by the southwest-draining unnamed arroyo located immediately south of Water Canyon. The historic resource was discovered in the northern portion of this jasperoid zone in the Secret Canyon shales immediately overlying the jasperoid. The area including the northernmost jasperoid is herein referred to as the “resource zone”. | |
| 2. | A 400 x 200 meter area of jasperoid replaced Secret Canyon silty strata located in Cherry Springs Canyon at approximately 7,000 feet elevation, herein referred to as the “Cherry Springs zone”. |
Gold concentrations are localized by both structural and stratigraphic features. Linear zones of jasperoid development in the Eldorado Dolomite and overlying strata are interpreted as high angle faults that allowed migration of mineralizing fluids into the strata of the lower Secret Canyon Formation. Within the Secret Canyon formation, hydrothermal fluids selectively mineralized the basal silty and shaly strata. The jasperoid replaced Eldorado Dolomite forms massive hill capping outcrops and linear rib like outcrops. The jasperoid is crosscut by sugary quartz veins. NA010 steeply west dipping veinlet sets were observed. The mineralized Secret Canyon shale is recessively weathering and is poorly exposed as subcrop and float boulders in the resource area, where it is observed as a drusy and chalcedonic quartz cemented clast supported angular breccia with clasts of variably silicified red-brown Fe-oxide stained siltstone. Structural controls to alteration and gold mineralization are observed in Cherry Springs Canyon and on the hills to the north. In Cherry Springs Canyon, NA015 steeply east dipping sheeted quartz veins cut siltstone of the Secret Canyon Formation and north of Cherry Springs Canyon a northeast striking structurally controlled zone of brecciation, quartz veining, and variable pervasive silicification cuts the Dunderberg Shales.
Sampling of the jasperoids and quartz veined and silicified zones by previous operators is reported to have identified geochemically anomalous gold, arsenic, and mercury concentrations, principally within the jasperoid in and near the resource zone, and lesser anomalies were reported from the Cherry Springs area. The historic rock chip assay data has not been independently confirmed by Dr. Gray but was obtained by exploration groups and personnel known to Dr. Gray and believed to be credible. Dr. Gray and RGM senior geologist Roman Solis (‘solis”) conducted independent sampling of the jasperoids and silicified and quartz veined outcrops and confirmed that they are anomalously gold, arsenic, and antimony mineralized. Samples of jasperoid replaced Eldorado Dolomite in the resource area yielded as much as 1.26 gpt Au. Samples of subcrop and float of the mineralized Secret Canyon shale collected in the resource area assayed up to 0.75 ppm Au. Silicified and quartz veined Dunderberg Shale north of Cherry Springs Canyon assayed 0.18 ppm Au and stockwork veined Secret Canyon Shale in Cherry Springs Canyon returned up to 0.15 ppm Au. Where independent samples were collected at sites previously sampled by Fronteer, assays confirmed the previously reported results.
During the last 30 years the property has been explored and drill tested by several operators. Geologic mapping, geochemical sampling, geophysical surveys, and several drilling programs have been completed. It has been reported that a total of 225 exploration drillholes have been completed at the property.
43
Table 5. Sample descriptions and assay data for Bellview project rock samples collected by M. Gray and Solis.
44
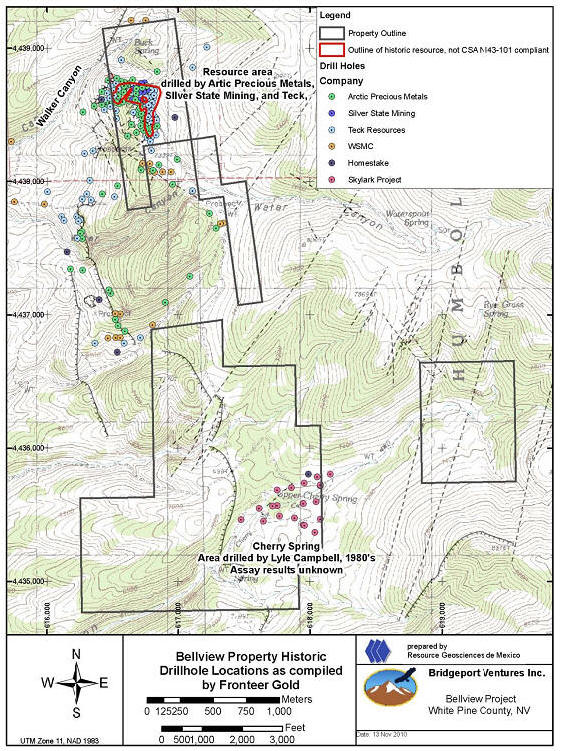
Figure 3. Historic drillhole location map, Bellview property.
45
Table 6. Historic drill programs, Bellview prospect.
| Company | Year | Drillholes | Assays Available | Comment |
| Lyle Campbell | 1980’s | 20 drillholes | No | Drilled at what are now Fronteer’s Skylark claims, no data available. |
| Artic Precious Metals | 1980 to 1985 | 95 rotary and reverse circulation drillholes totaling 4,741m | Yes | Defined geologic resource of ~500,000 tons @ 0.034 opt Au.NOT NI 43-101 COMPLIANT. |
| Silver State Mining | 1986 | 10 drillholes totaling 336 m | Yes | Infill drilling within resource area. |
| Teck Resources Limited | 1987 to 1991 | 68 reverse circulation drillholes totaling 3,240m | Yes | Mostly infill drilling within resource area. Calculated resource of 1.12M tons @ 0.031 opt Au (~34,000 ounces).NOT NI 43-101 COMPLIANT. |
| Western States Minerals | 1991 to 1999 | 26 reverse circulation drillholes totaling 3,598m | Yes | |
| Homestake | 1996 | 6 reverse circulation drillholes totaling 864m | Yes | Tested geophysical and conceptual targets. |
The most significant work is that of Teck Resources Limited (“Teck”) in the period from 1987 to 1991, when Teck drilled a gold resource estimated to contain 1,120,000 tons of ore grading 0.031 opt Au, using a 0.015 opt cutoff, for a total of 34,720 contained ounces of gold. Insufficient information is available regarding the procedures used to create the historic resource estimate to determine if it is compliant with the protocols set forth by NI 43-101. The resource estimate has not been independently verified. Dr. Gray has not reviewed the original drill logs, assay certificates, or resource model thus cannot comment on the accuracy of the reported drill results or resource estimate. The data was obtained from sources believed to be reliable but cannot be verified and the historical drillhole data and resource estimate has not been independently confirmed by Dr. Gray thus should not be used in economic assessments of the project’s value.
The mineralization was reported to be contained within the lowermost strata of the Secret Canyon Shale, immediately above the contact with the underlying jasperoid replaced Eldorado Dolomite. Lyle Campbell is reported to have drilled 20 RC drillholes in the Cherry Springs jasperoid area in the 1980’s. All that is known to Dr. Gray about these drillholes is that they were vertical and ranged from 125 to 465 feet in depth, with most less than 300 feet. Assay data is not available for these drillholes.
Data Verification
Prior Exploration Campaigns
An extensive amount of exploration work has been completed on the Bellview property. Nearly all of this work is historic in nature, and as such the reported results are not NI 43-101 compliant. Digital copies of data files from exploration programs conducted prior to Bridgeport’s involvement with the project were reviewed by Dr. Gray. Data includes geologic maps, drillhole logs, drill sample assays, surface rock chip assays, and geophysical studies. Original documents are not available, nor is drill core or witness samples from RC drilling. Much of the exploration work was completed decades ago, and reclamation of drill sites and the effects of time and weathering have combined to destroy monuments and physical evidence of drillhole and surface sample locations. The only data that could be directly verified by Dr. Gray were geologic outcrop maps, some drillhole locations, and some outcrop rock chip sample assays.
Bridgeport has not yet commenced an exploration program at the projects beyond the work completed as part of the Nevada Report, thus there is no prior data generated by Bridgeport to be verified.
46
Production Data
No significant historic production is reported from the Bellview property.
Adjacent Properties
The Bellview property is not contiguous with any historic or active mining or exploration property. The nearest active mining property is the Bald Mountain gold mine of Barrick Gold, located 13 kilometers to the south-southeast.
Metallurgical Testing
No metallurgical studies have been conducted by Bridgeport, nor is historical metallurgical data available for the Bellview property.
Mineral Resource Estimate
Data is insufficient to permit estimation of a mineral resource at the Bellview property.
The historical resource estimate for the Bellview property is discussed in the History and Mineralization chapters of the Nevada Report. Insufficient information is available regarding the procedures used to create the historic Bellview resource estimate to determine if it is compliant with the protocols set forth by NI 43-101. The resource estimate and has not been independently verified. Dr. Gray has not reviewed the original drill logs, assay certificates, or resource model thus cannot comment on the accuracy of the reported drill results or resource estimate. The data was obtained from sources believed to be reliable but cannot be verified and the historical drillhole data and resource estimate has not been independently confirmed by Dr. Gray thus should not be used in economic assessments of the project’s value.
Other Relevant Data and Information
To the best knowledge of Dr. Gray, all relevant data has been presented in the Nevada Report.
Recommendations
Target Concepts
The target concept for the Bellview property is a Carlin-style disseminated gold deposit or an intrusive related sedimentary rock hosted gold deposit. A possible analog is the Bald Mountain mine, located 13 kilometers south-southeast. The Bald Mountain mine has exploited gold mineralization hosted along the Dunderberg-Hamburg contact and from Geddes/Secret Canyon strata just above the Eldorado Formation. The Bald Mountain mine has reportedly produced over 2M ounces gold and as of 31 December 2009 hosted 4.5M ounces gold in measured and indicated reserves. The mineralization described for the mines in this section is not necessarily indicative of the mineralization at the Bellview property.
The Bellview property has been explored and drill tested by several operators. Geologic mapping, geochemical sampling, geophysical surveys, and several drilling programs have been completed. Fronteer has compiled the historic data into an integrated GIS database, conducted additional field studies, and subsequently developed three target zones proposed for drill testing, summarized as:
47
The Saddle Target, where brecciated, recrystallized, calcite-veined Hamburg Limestone is thrust over Secret Canyon strata. IP/Resistivity data suggests Eldorado Dolomite lies beneath the ground surface at shallow depths of 100-200 meters. A north-northwest trending topographic lineation passes through the target and leads to the Cherry Spring Au-As anomaly to the south.
The Cherry Spring Target, located at Cherry Spring in an area of jasperoid development at the contact of a massive, locally oolitic limestone of unknown provenance with overlying Lower Secret Canyon shales and silty limestones. Fronteer’s rock chip samples of the jasperoids returned gold values up to 331 ppb Au, and arsenic values up to 533 ppm As. High angle northeast breccia structures intersect the jasperoid and are interpreted to have controlled gold mineralization. The intersection of these structures with the unexposed Eldorado-Secret Canyon horizon may be an area of significant gold deposition and is a compelling drill target.
The CS Target, where Fronteer’s sampling returned anomalous Au (up to 1.217 ppm) and As (up to 297 ppm) from rock chip samples from silicified limestone beds within the lowermost Dunderberg Formation just above the Hamburg-Dunderberg contact, a regionally important site for gold-mineralization. Controlling structures are a series of northeast and northwest-trending faults which intersect the stratigraphy. The drill targets are the Hamburg-Dunderberg and Secret Canyon-Eldorado Dolomite contacts where they are intersected by the high angle structures. Dr. Gray’s field review of the project validated the target concepts proposed by Fronteer.
48

Figure 4. Bellview property drill target map.
49
Exploration Program and Budget
Work by Fronteer and previous operators has identified several high priority targets for drill testing and the permitting process to allow for drilling of these targets has been initiated. The property is “drill ready” pending receipt of permits. Evaluation of the project should include:
| 1. | Expansion of the property concession package to include 100% of the historic resource and areas peripheral to the three defined drill targets. | |
| 2. | Drill testing of all three target areas defined by Fronteer. A 4,500 foot RC drill program should be an adequate first test. |
Completion of the recommended work program is estimated to require 6 months (assuming permits obtained in 4th quarter 2010) and approximately US$0.8M. A Phase 2 drill and resource modeling program with a budget of US$1.0M would be conditional upon successful results from the Phase 1 program. The timing of proposed expenditures includes approximately US$1.3M in 2011 and US$0.5M in 2012, assuming the completion of Phase 2 is warranted based upon prior results received.
Table 7. Proposed exploration program and budget, Bellview property.
| Phase 1: Drilling program | ||
| Phase 2: Resource modeling and infill drilling program | ||
| Total Cost (US$) | ||
| Item | Phase 1 | Phase 2(1) |
| Lodging/Meals/Communications | $36,000 | $36,000 |
| Geophysical Surveys (IP/Resistivity) | $- | $- |
| Roads and Drill Pads | $40,000 | $100,000 |
| Resource Modeling | $- | $75,000 |
| Drilling - Reverse Circulation | $369,000 | $328,000 |
| Drilling - Diamond Drill Core | $- | $- |
| Drilling - Core | $- | $- |
| Assays, drill samples | $90,000 | $80,000 |
| Assays, rock and soil | $- | $- |
| Senior Geologist | $29,250 | $29,250 |
| Project Geologists | $52,500 | $52,500 |
| Technicians/Samplers | $21,000 | $21,000 |
| Vehicles and Fuel | $23,100 | $23,100 |
| Permits | $15,000 | $100,000 |
| Field Supplies | $40,000 | $40,000 |
| Travel Costs | $24,000 | $24,000 |
| Environmental Costs/Reclamation | $40,000 | $100,000 |
| Total | $779,850 | $1,008,850 |
| Total Phase 1 & Phase 2 | $1,788,700 | |
| (1) Conditional upon positive result from Phase 1 program | ||
50
The Corporation believes these recommendations are appropriate and will be followed should the Corporation move forward with this property.
Horsethief Property
Property Description and Location
The Horsethief property is located in Lincoln County, Nevada, at coordinates 741,187E, 4,211,966N UTM Zone 11 NAD83. The property is 223 kilometers northeast of Las Vegas, Nevada, and 19 kilometers northeast of Pioche, Nevada (see Figure 1). The property area is 802.68 hectares (1,983.47 acres).
Surface Rights
The ownership of surface rights at the Horsethief property is Federal, administered by the BLM.
Mineralization
Historic artisanal small mines and exploration workings are present within the Horsethief property. Nearly all are developed on zones of outcropping quartz veins or silicified carbonates (jasperoids). No metals are currently produced from the property.
Access, Climate, Infrastructure, and Physiography
The Horsethief property is located 223 kilometers northeast of Las Vegas, Nevada and 19 kilometers northeast of Pioche, Nevada. Access is by all weather unsurfaced roads from Pioche. In fair weather, all wheel drive vehicle is not required. Highway 93 passes within 19 kilometers of the property on the southwest side. The electric power grid that serves Pioche is 19 kilometers distant.
Basic services are available in Pioche, with additional services available in Ely, Nevada, 146 kilometers to the northwest. The project area is unpopulated. An adequate supply of experienced labor for mining operations can be drawn from the region.
The Las Vegas, Nevada airport is located 223 kilometers southwest of the project and is served by daily flights from major US cities. A general aviation use airstrip in Ely is capable of serving small passenger jets.
The property is located in the southeast portion of the Great Basin physiographic province, in the Wilson Creek mountain range. Topographic relief is moderate and elevations in the project area range from 1,980 meter ASL to 2,030 meter ASL. Broad flat valleys west of the project area are suitable locations for mill sites, leach pads, rock dumps, and other mine related infrastructure.
The climate in the area is semi arid with total annual precipitation of 30.2 centimetres and seasonal temperatures ranging from an average annual high of 31oC in July and an average annual low temperature of -13oC in January. Snowfall in the period December to February may preclude exploration activities.
Vegetation in the area consists of piñon-juniper forest.
History
The Horsethief property is located within the intensely explored and productive gold producing terrain of the Great Basin and has been previously explored. Historical records of previous exploration efforts at the Horsethief property are shown in Table 8.
51
Table 8. Exploration History Horsethief Property.
| Company | Year | Com | Type of Work | Comments |
| Canyon Resources Corp | 1981 | Au | Rock sampling | 190 samples collected |
| Unknown | Historical | Au | Mining | Two 25 foot shafts and a few shallow pits |
| Canyon Resources Corp | 1981 | Au | Rock sampling | 46 rock samples collected by Labradex Corporation for Canyon |
Copper Range Exploration | 1982- 1984 | Au | Drilling | 40 RC dh (13,890 ft) |
| Geological Mapping | 1 week program | |||
| Rock Chip Sampling | 20 samples collected | |||
| NovaGold Resources Inc. | 1987 | Au | Hand Drill Sampling | No results |
Geological Setting
Regional Geology of the Horsethief Property.
The geologic setting of the Horsethief area project has been summarized as being situated within the east-central Nevada Caldera province, a poorly understood series of nested Tertiary calderas. A public domain geologic report from the NBMG described a volcanic rock package near Horsethief, east of Caliente, Nevada, that is several thousand feet thick, and consists of flows, mud flows, breccias, and tuffs which are andesitic in appearance, but may be latitic or dacitic in chemical composition and are intruded by small dioritic and monzonitic stocks. The age of these rocks is not definitely known. The NBMG report states that they may be as old as Cretaceous or Jurassic.
It has been stated that the Horsethief window of Cambrian rocks is an unusual occurrence in a region dominated by volcanic rocks and he speculated that it may represent the tip of a larger package of autochthonous sedimentary rocks underlying the volcanic units or it could be a slide block into a caldera. He also reported that the same section of upper Cambrian rocks can be found in the Bristol/Highland Range 18 miles to the west of Horsethief.
Local Geology
The following discussion of project geology is based upon field examinations by Dr. Gray and a review of historic exploration data contained in the Fronteer project files.
The Horsethief property is centered upon a narrow, northwest trending horst of dolostone and limestone strata exposed through an erosional window in overlying Tertiary volcanic strata. The window, or area of exposed carbonates, is approximately 4.7 kilometers long and 400 to 1,300 metres wide. The surrounding Tertiary volcanic rocks comprise ash flow tuffs, air fall tuffs, flows, flow breccias, lahars and waterlain tuffs and have been mapped by the NBMG as undifferentiated Tertiary volcanics. The carbonate strata have been interpreted as Upper Cambrian strata of the Dunderberg Shale. Bedding of limestone and dolostone observed in outcrop dips gently to the northeast. An east-west trending zone of pervasive silicification of carbonate, mapped as jasperoid, covers an area of approximately 1,200 x 200 meters and was recognized by both the Nevada Bureau of Mines and Geology (“NBMG”) and Canyon Resources, and the latter mapped north-northwest trending shear zones cutting the carbonates and postulated an east-west high angle structure as a control of development of jasperoid. Igneous rocks are not exposed in outcrop but drill logs for rotary drillholes completed by Canyon Resources describe intercepts of altered felsic dikes.
52
Deposit Types
The exploration target recognized for the Horsethief property is a Carlin-type deposit, here defined as a sedimentary rock hosted, structurally and lithologically controlled gold deposit of moderate to low temperature of formation. Divergent ideas for the formation of Carlin-type deposits have been proposed ranging from a distal magmatic hydrothermal origin; to formation from hydrothermal fluids generated by regional metamorphic processes; to an amagmatic origin related to regional fluid circulation due to crustal extension. Although the genesis of the Carlin deposits is a matter of dispute, the general characteristics of the deposits are not, and are summarized as follows:
- Metals contained in economically significant amounts are gold and silver.
- Other metals and elements present may include arsenic, antimony, barite and mercury.
- Host rocks are generally Paleozoic silty to massive limestones, dolostones, calcareous siltstones, and shales, with lesser amounts of ore hosted by interbedded mafic flows or crosscutting felsic dikes.
- Commonly occur at intersection of major normal faults with favorable stratigraphic units or thrust contacts.
- No clear association with intrusives although intermediate to felsic intrusions are present in many Carlin districts.
- Individual deposits or mineralized systems contain from 0.1M to 30M ounces gold.
- Associated hydrothermal alteration includes bedding controlled carbonate dissolution, structurally and stratigraphically controlled silica replacement (jasperoid formation), recrystallization of limestones and dolostones, and calcite veining peripheral to mineralized areas.
- Temperatures of formation ranging from 160 to 250° C under pressure of 300 to 800 bars.
- Ore and gangue mineral assemblage of quartz, illite, kaolinite, arsenian pyrite, arsenopyrite, stibnite, realgar, orpiment.
- Gold typically present as micron sized inclusions in pyrite.
Mineralization
Mapping and sampling of the Horsethief property has identified a large area of variably gold mineralized jasperoid. The largest jasperoid body crops out over an area of roughly 900 x 150 meters and a smaller area of jasperoid crops out southeast of the main body. Several small prospect cuts and shafts in the area of jasperoid outcrops are the only known mine or exploration workings at the project. A joint venture between Canyon Resources and Copper Range explored the property in the period 1981 to 1984. Rock chip assay data generated by the joint venture reportedly defined gold anomalies in jasperoid, which was subsequently the focus of exploration drilling. The joint venture is reported to have completed two drill campaigns comprising a total of 40 rotary drillholes and a total of 4,233 meters.
Drillholes ranged from 39 to 195 meters depth, but were generally less than 100 meters. The drill campaigns identified a gold mineralized zone in jasperoid and a separate gold mineralized zone hosted in silty limestones. Gold mineralization was also reported from the basal portion of the volcanic units that overlie the limestones and dolostones. Significant mineralized intercepts of as much as 13.7 meters @ 1.2 gpt Au and 39.6 meters @ 0.79 gpt Au were reported. Dr. Gray has not reviewed the original drill logs nor assay certificates thus cannot comment on the accuracy of the reported drill results. The drill hole assay data was obtained from sources believed to be reliable but cannot be verified and the Canyon Resources drillhole data has not been independently confirmed by Dr. Gray. A grade-thickness plot of drillhole intercepts demonstrates an east-west trend to the most intensely mineralized portion of the jasperoid, consistent with Canyon Resources” interpretation of an east-west striking structural control to gold mineralization.
Dr. Gray and Solis conducted independent sampling of the jasperoids and silicified or quartz veined outcrops and confirmed that they are anomalously gold, arsenic, and antimony mineralized. Samples of jasperoid replaced limestone in the northern jasperoid area yielded as much as 0.176 gpt Au. The jasperoid is not everywhere gold mineralized and some samples of jasperoid did not yield gold above the 5 ppb detection limit. The jasperoid is locally an angular breccia and the color varies from brown to hematitic red. The samples of hematitic jasperoid collected by Dr. Gray and Solis all contained detectable gold whereas the brown colored jasperoid samples did not. No difference in degree of silicification was noted between the auriferous and barren jasperoids.
53
Table 9. Sample descriptions and assay data for Horsethief property rock samples collected by Gray and Solis.
Data Verification
Prior Exploration Campaigns
An extensive amount of exploration work has been completed on the property. Nearly all of this work is historic in nature, and as such the reported results are not NI 43-101 compliant. Digital copies of data files from exploration programs conducted prior to Bridgeport’s involvement with the project were reviewed by Dr. Gray. Data includes geologic maps, drillhole logs, drill sample assays, surface rock chip assays, and geophysical studies. Original documents are not available, nor is drill core or witness samples from RC drilling. Much of the exploration work was completed decades ago, and reclamation of drill sites and the effects of time and weathering have combined to destroy monuments and physical evidence of drillhole and surface sample locations. The only data that could be directly verified by Dr. Gray was geologic outcrop maps, some drillhole locations, and some outcrop rock chip sample assays.
Bridgeport has not yet commenced an exploration program at the Horsethief property beyond the work completed as part of the Nevada Report, thus there is no prior data generated by Bridgeport to be verified.
Production Data
No significant historic production is reported from the Horsethief property.
54
Adjacent Properties
The Horsethief property is not contiguous with any historic or active mining or exploration property. The nearest mining property is the Pioche gold mining district, located 24 kilometers to the southwest.
Metallurgical Testing
No metallurgical studies have been conducted by Bridgeport, nor is historical metallurgical data available for the property.
Mineral Resource Estimate
Data is insufficient to permit estimation of a mineral resource at the Horsethief property.
Other Relevant Data and Information
To the best knowledge of Dr. Gray, all relevant data has been presented in the Nevada Report.
Recommendations
Target Concepts
The target concept at Horsethief is a sediment hosted Carlin-style gold deposit. Nearby deposits that may represent geologic analogs include the Pioche district, located 24 kilometers to the southwest, which produced over 100,000 ounces gold and the Atlanta mine, located 49 kilometers north, which produced over 100,000 ounces gold and 1.7M ounces silver from jasperoid orebodies. The mineralization described for the mines in this section is not necessarily indicative of the mineralization at the Horsethief property.
A joint venture between Canyon Resources and Copper Range explored the property in the period 1981 to 1984. Their mapping and sampling identified large areas of variably auriferous jasperoid. The drill campaigns identified a gold mineralized zone in jasperoid interpreted to be controlled by an E-W striking structure, and a separate disseminated gold zone south of the jasperoid zone, hosted in silty limestones. A soil geochemical survey completed by Fronteer in 2010 identified soil gold anomalies associated with the outcropping jasperoid, but importantly also identified anomalies south and east of the drill tested jasperoid zone. Figure 22.2 on page 99 of the Nevada Report presents the drillhole intercept grade- thickness data plotted on a surface plan view (the length of an intercept in meters is multiplied by its gold grade in ppm and the subsequent result is plotted at the location of the drillhole that hosts the intercept) for the main jasperoid zone and a plot of the soil gold data for the same area. The grade x thickness map is consistent with an east-west control to mineralization and the mineralized trend projects beyond the limits of the drill pattern. The soil gold assay data indicates that additional mineralized zones may be present to the south and southeast of the main jasperoid zone. The drillhole and soil assay data indicate potential for the gold mineralized zone to extend both east and west of the drilled jasperoid zone, into areas where the sedimentary strata are concealed by volcanic rocks, and to the south and southeast. The 1981 to 1984 drill campaigns failed to define a significant gold resource in the outcropping jasperoid, however, in many Carlin-type systems, auriferous jasperoids are present but do not comprise the economically significant orebody. Dr. Gray regards the auriferous jasperoid at Horsethief as a positive indication that a significant mineralized system was active at the property, thus the property remains prospective for gold deposits hosted by favorable sedimentary strata beneath the level of current outcrop exposure or drill testing, and for the discovery of gold deposits along the trend of the mineralized zone where it projects under volcanic cover rock.
Exploration Program and Budget
The historic drilling has adequately tested, with negative results, the possibility that the outcropping jasperoid is an orebody, however drilling indicates potential for disseminated gold mineralization in silty limestones that may occupy a stratigraphic level below that of the jasperoid replaced limestone. Exploration to date has not explored favorable strata at deeper stratigraphic levels nor the projection of mineralized zones where they are concealed beneath volcanic cover rocks. In order to evaluate these targets the following work plan is recommended:
55
| 1. | Compilation of all available geology, geochemical, and drillhole data into a GIS database. |
| 2. | Creation of 2D and 3D models of geology using existing drillhole information and outcrop maps. |
| 3. | On the basis of trends identified by analysis of the historic data, expand the land package by staking additional claims along the projection of mineralized zones and favorable strata. |
| 4. | Complete soil and rock chip geochemical surveys, concurrent with geological mapping, to define stratigraphic intervals favorable for mineralization and possible structural controls to mineralization. |
| 5. | Conduct geophysical surveys to seek evidence of non-outcropping mineralized zones. Silica alteration associated with mineralization may be evidenced by resistivity highs. |
| 6. | Drill test developed targets. A 4,000 meter RC drill program will be an adequate phase one test. |
Completion of the estimated work program is estimated to require 8 months and approximately US$0.8M. A Phase 2 drill and resource modeling program with a budget of approximately US$0.4M would be conditional upon successful results from the Phase 1 program. The timing of proposed expenditures includes approximately US$0.9M in 2011 and US$0.3M in 2012, assuming the completion of Phase 2 is warranted based upon prior results received.
Table 10. Proposed exploration program and budget, Horsethief Property
| Phase 1: Drilling program | ||
| Phase 2: Resource modeling and infill drilling program | ||
| Total Cost (US$) | ||
| Item | Phase 1 | Phase 2(1) |
| Lodging/Meals/Communications | $24,300 | $14,100 |
| Geophysical Surveys (IP/Resistivity) | $100,000 | $- |
| Roads and Drill Pads | $40,000 | $20,000 |
| Resource Modeling | $- | $75,000 |
| Drilling - Reverse Circulation | $328,000 | $164,000 |
| Drilling - Diamond Drill Core | $- | $- |
| Drilling - Core | $- | $- |
| Assays, drill samples | $80,000 | $40,000 |
| Assays, rock and soil | $- | $- |
| Senior Geologist | $14,625 | $4,875 |
| Project Geologists | $63,000 | $21,000 |
| Technicians/Samplers | $12,600 | $8,400 |
| Vehicles and Fuel | $20,790 | $9,240 |
| Permits | $15,000 | $20,000 |
| Field Supplies | $40,000 | $15,000 |
| Travel Costs | $12,000 | $4,000 |
| Environmental Costs/Reclamation | $40,000 | $20,000 |
| Total | $790,315 | $415,615 |
| Total Phase 1 & Phase 2 | $1,205,930 | |
| (1) Conditional upon positive result from Phase 1 program | ||
56
The Corporation believes these recommendations are appropriate and will be followed should the Corporation move forward with this property.
As of June 30, 2011, the Corporation had completed a soil geochemical survey, terrestrial induced polarization/resistivity survyes, and a ground magnetic survey over the claim block.
General
Environmental Liability
Potential environmental liabilities associated with the historic exploration at the Blackrock, Argentite, Bellview and Horsethief properties have not been investigated or verified by Dr. Gray or RGM, but no significant environmental liabilities are apparent. Small abandoned shafts and unmineralized rock piles are present but there is no evidence of acid drainage. Old drill roads and drill pads at the properties have been adequately reclaimed by previous explorers. There are no plant facilities present within the project areas, nor are tailings piles present.
Permits
Exploration activities at the Blackrock, Argentite and Horsethief properties are subject to regulation by the BLM. Surface management regulations prescribed by regulation 43 CFR 3809 incorporates three levels of operation on BLM lands as summarized by the Nevada Bureau of Mines and Geology:
| 1. | Casual use by operator who does negligible disturbance- No notice or plan required. Need not contact BLM prior to initiating activities. Does not include use of earth moving equipment or explosives. |
| 2. | Notice- Includes exploration activities that propose disturbance of five acres or less. A written notice must be submitted to the appropriate BLM field office 15 days prior to starting operations. No approval necessary. Effective for two years. May be extended for an additional two years. |
| 3. | Plan of Operations- Includes all mining and processing activities and exploration exceeding five acres of disturbance. BLM approves plan. |
Basic exploration activities, including road construction and drilling, on BLM lands can typically be permitted in 15 days.
Exploration activities at the Bellview property are subject to regulation by the USFS. Surface management regulations prescribed for exploration on USFS lands, as summarized by the Nevada Bureau of Mines and Geology require:
Any mineral development or exploration activities conducted under the General Mining law of 1872 on National Forest System lands must be approved pursuant to the surface management Regulations (36 CFR 228). An operator must provide information describing the proposed activity to the District Ranger. Operations which will cause a significant surface disturbance will require an approved plan of operations and a reclamation bond. Road Use Permits and other Special Use Permits may be required to access and utilities. Operators must also obtain all applicable state permits.
57
Basic exploration activities, including road construction and drilling, on USFS lands can typically be permitted in 12 months.
Exploration
The Corporation has not conducted any field based exploration on any of the properties which are the subject of the Nevada Report, beyond the confirmatory visits and reconnaissance mapping and sampling completed by Dr. Gray and Solis.
Drilling
No drilling campaigns have been conducted on any of the Blackrock, Argentite, Bellview or Horsethief properties by Bridgeport.
Sampling Method and Approach
Sampling Method, Nature, and Spacing
Surface Rock Chip Samples
Concurrent with the reconnaissance review of the Blackrock, Argentite, Bellview and Horsethief properties, Dr. Gray collected representative rock chip samples of distinct mineralized and altered zones. Solis assisted Dr. Gray in reconnaissance visits and sampling at Horsethief and Bellview. Samples were collected from rock exposed in outcrop, prospects, and mine dumps. The objective of the sampling was to determine metal contents and geochemical characteristics of particular zones of interest, and to verify that the mineralized zones that were reported to contain gold were in fact auriferous. All samples were collected by Dr. Gray or Solis, and remained exclusively in the possession of Dr. Gray until such time that they were delivered by Dr. Gray to the ALS Chemex sample reception and preparation facility in Elko, Nevada.
Samples collected were representative grab samples, representative composite samples oriented perpendicular to the structural fabric of the feature of interest being sampled, and both select and random mine dump samples. All samples were collected by hand, using hardened steel geological hammers. Samples were placed in plastic or cloth sample bags and sealed. Sample weights varied from 2 to 4 kilograms. Sample spacing was variable, and was a function of exposure of mineralized or altered rock. Sample descriptions, location data, and multi-element assay data was captured in digital format.
Recovery Factors
No factors were identified that materially impact the accuracy or reliability of the sample results. Surface rock chip samples were collected manually and recovery was 100%.
Sample Quality and Representativity
In the opinion of Dr. Gray, samples collected are of high quality and representative of the mineralized areas being evaluated.
Surface sample locations were selected to be representative of the geologic feature being investigated. Representative sample was collected by chipping and collecting rock along a line perpendicular to the orientation of the structure or feature being sampled. Industry standard methods and best professional judgment were used in collection of the rock chip samples, however, by nature, manually collected rock chip samples are of lesser quality than mechanically collected continuous samples (i.e. cored or cut samples). The surface rock chip samples are of sufficient quality and confidence to be used for preliminary assessments of the project’s mineral potential but were not designed to provide detailed or reliable information of true mineralized dimensions and grades.
58
Sample Preparation, Analyses, and Security
It is the opinion of Dr. Gray that sample preparation, security, and analytical procedures used were adequate to insure the integrity and reliability of the sample data base.
Personnel
All samples were collected exclusively by Dr. Gray and Solis. Employees, officers, directors, or associates of Bridgeport were not involved in sample collection or preparation.
Bridgeport Resources Sampling Program
Sample Security/Chain of Custody
Geologic descriptions of the sample, including nature of the sample, length of sample, lithology, alteration, and mineralization, were captured in geologic field books. Samples were sealed in plastic or cloth sample bags with tie closures. Samples were stored in Dr. Gray’s locked vehicle until such time that they were delivered directly by Dr. Gray to the ALS Chemex sample reception facility in Elko, Nevada.
Sample Preparation by ALS Chemex
Analytical work was performed by ALS Chemex, an ISO 9001:2000 certified international provider of analytical services to mining and exploration companies. Sample preparation was conducted at the ALS Chemex facility in Elko, Nevada and analyses were completed at the ALS Chemex laboratory in Vancouver, British Columbia.
ALS Chemex reports the following preparation method: Each sample was dried and the entire sample was crushed to better than 70% passing a 2 millimetres (Tyler 10 mesh) screen. Using a riffle splitter, a split of up to 250 grams was taken and pulverized to better than 85% passing a 75 micron (Tyler 200 mesh) screen.
Analytical Techniques used by ALS Chemex
Gold content was first analyzed utilizing standard fire assay fusion, followed by atomic absorption analysis, of a 30 gram nominal sample weight (ALS Chemex procedure Au AA23), with a detection limit of 0.005 ppm and upper limit of 10 ppm.
All other applicable elements were analyzed utilizing four acid digestion (HF-HNO3-HClO4 acid digestion and HCl leach) and Inductively Coupled Plasma - Atomic Emission Spectroscopy methods (ALS Chemex procedure ME-ICP61).
OTHER NEVADA PORTFOLIO PROPERTIES
The Nevada Portfolio also includes seven additional properties known as the Hot Pot, Fri Gold, Columbia, Kobeh, Ashby, East Walker and Blackrock properties. Summaries of each of these additional properties are set forth below, together with the Corporation’s proposed exploration program for each such property. The aggregate expenditures allocated to explore these properties over the ensuing 12 months is $5 million.
Hot Pot
The Hot Pot property is located 273 kilometers northeast of Reno and 49 kilometers east-southeast of Winnemucca, in Humboldt County, Nevada. The property is comprised of 36 unpatented mining claims which are all located on BLM land. An aggregate 3% NSR is held by Fronteer and certain other third parties with regard to the Hot Pot property.
59
No mineralization is known to occur at the Hot Pot property. The property is considered prospective because of its location on a regional mineralized trend. It is proximal to and in between the Lone Tree and Twin Creeks gold mines which host high tonnage, low grade, sediment-hosted gold deposits occurring along the Battle Mountain-Eureka Gold Trend. The project area is blanketed by colluvium and does not host bedrock exposures. The only direct geological information for the property comes from a drill hole reported at the southern boundary of the claim block, which penetrated 160 meters of valley fill colluvium and basalt before intersecting Mississippian-Permian strata of the Havallah sequence, comprising the upper plate of the Golconda thrust, before penetrating quartzite of the lower plate Valmy Formation. Assays for this drillhole are not available.
Bridgeport intends to explore the Hot Pot property by performing a variety of ground geophysical surveys to identify structural zones that may have localized hydrothermal fluid flow and gold concentrations, and following-up with a 2,000 meter RC drill program.
As of August 30, 2011, six planned Phase One drill holes totaling 2,786 metres were completed at the Hot Pot project. Drill results ranged from 64 metres containing less than the analytical detection limit of 0.001 gpt Au in drillhole HOTRC11-001 to as much a 1.52 metres grading 0.30 gpt Au in drillhole HOTRC-005. No significant intercepts, defined as a minimum intercept length of 3 metres with a minimum grade of 0.5 gpt using a 0.1 gpt cutoff grade, were returned.

Figure 5. Overview of the Hot Pot area.
Fri Gold
The Fri Gold property is located 226 kilometers southeast of Reno and 53 kilometers northwest of Tonopah in Nye County, Nevada. The property is comprised of 28 unpatented mining claims which are all located on BLM land. A 2% NSR is held by Fronteer with regard to the Fri Gold property.
60
Two mineralized zones have been identified at the Fri Gold property, an epithermal gold system exposed on the west side of the property, referred to as Fri Gold West, and a Cu-Mo porphyry mineralized target known only through subsurface drillhole data in the east side of the property, referred to as Fri Gold East. No metal production is known to have occurred from the property. Small prospect pits are the only exploration or mine workings present outside the southeast corner of the project area. A small open cut turquoise mine lies just outside the southeast corner of the project area and the Hall Cu-Mo Porphyry Deposit is located a few miles to the south.
An epithermal mineralized showing comprised of low temperature silica replacement of clastic sedimentary strata, silicified breccias zones, and quartz veining, is exposed on the western edge of the claim block and was drill tested by a previous explorer in 1986. Host rocks are Triassic and Jurassic siltstones and limestones, overlain by Tertiary felsic volcanics. A total of 32 reverse circulation drillholes were completed, ranging from 100 to 350 foot depth, as summarized in Table 11 below. A 1,300 meter strike length of a silicified structural zone was drill tested. No potentially economic intercepts were returned but gold concentrations exceeding 0.1 ppm were reported from several drillholes, and notably, the most important anomalous intercepts came from the drillholes at the extreme northwest and southeast ends of the drill pattern. Drillholes ROY-16 and ROY-28, drilled at the northwest limit of the drill pattern reportedly yielded 65 feet @ 0.24 gpt Au and 110 feet at 0.18 gpt Au respectively and were the broadest gold anomalous intercepts returned from the drill program. This drillhole data suggests a possible continuation of the mineralized zone with increasing intensity to the northwest of the drill tested area, beneath the pediment plain.
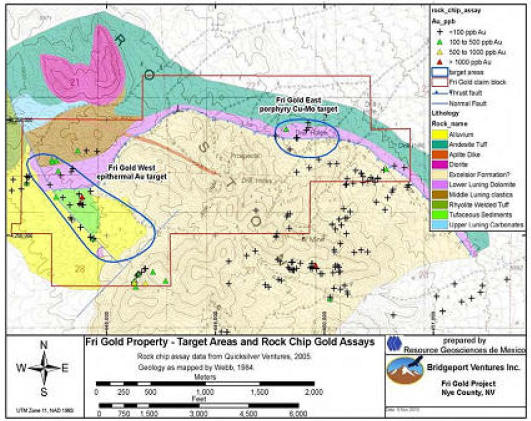
Figure 6. Plan map showing the Fri Gold West and Fri Gold East target areas.
Exploration drilling by previous explorers is reported to have intersected Cu-Mo mineralization at depths of greater than 150 meters at Fri Gold East. Mineralized intercepts came from a buried granodiorite intrusion and wallrock sedimentary strata. Narrow granodioritic dikes exposed at surface in the Fri Gold East area may be apophyses from the concealed intrusive. A gold mineralized intercept was reported from a 1972 drillhole completed by another previous explorer. The drillhole, FR3 reportedly returned 62 feet @ 0.097 opt Au (18.9m @ 3.32 gpt Au) from 810 to 872 feet, with assays provided by atomic absorption methods, however, a 2005 diamond core hole that twinned the 1972 drillhole failed to intercept any interval containing greater than 80 ppb Au, although an anomalously Cu and Mo mineralized intersection of 131 meters @ 253 ppm Cu and 129 ppm Mo was reported (Table 12). The 1972 and 2005 drillhole assays and logs confirm the presence of a Cu and Mo mineralized intrusive that supports a porphyry Cu-Mo target concept, however the modern data apparently negates the target concept of an auriferous porphyry.
61
Table 11: Summary of drillhole data, Fri Gold West area.
Table 12: Summary of drillhole data, Fri Gold East area.
62
Bridgeport intends to explore the Fri Gold property by compiling all data into a 2D GIS and 3D database, completing a detailed geological mapping program to define the structural controls to hydrothermal alteration and mineralization, performing a regional rock chip sampling program to identify gold mineralizing trends, and following-up with an extensive 3,000 meter RC drill program.
As of August 30, 2011, the Corporation had completed a terrestrial induced polarization/resistivity survey and a ground magnetic survey over the claim block.
Columbia
The Columbia property is located 234 kilometers northeast of Reno and 108 kilometers northwest of Winnemucca in Humboldt County, Nevada. The property is comprised of 57 unpatented mining claims which are all located on BLM land. A 2% NSR is held by Fronteer with regard to the Columbia property.
Gold mineralization at the Columbia project is present as auriferous arsenopyrite-quartz veins. The veins are exposed and partly developed at the abandoned Columbia and Juanita mine shafts and associated workings. Dr. Gray visited the historic workings and surrounding areas of the Columbia mine. Bedrock was seen only in exploration trenches, prospect cuts, and shafts. Fine grained, thermally metamorphosed clastic sediments with extreme planar shear fabric were observed to host irregular milky quartz veinlets.
The property is reported to have been drill tested by a previous explorer in the early 1980’s yielding narrow high grade intercepts in two of the three holes drilled. Drillhole intercepts reported include:
Drillhole C1, intercepted 3 meters wide open stope on the projection of the vein.
Drillhole C2, 3meters @ 9.6 gpt across the vein, down dip of the Columbia mine workings, with the hangingwall portion of the vein assaying 1.5 meters @ 15.8 gpt Au.
Drillhole C3, 3.6 meters vein interval, of which the hangingwall vein contact yielded 0.3 meters @ 14.4 gpt Au and the footwall contact yielded 0.3 meters @ 17.8 gpt Au.
The intervening 3.0 meters of quartz vein material was described as lacking arsenopyrite and was not significantly gold mineralized. The weighted average intercept for the entire vein intercept was 3.6 meters @ 2.7 gpt Au.
63
Figure 7. Prospect cut at Columbia workings exposing sheared metasediments and discontinuous quartz veining, in hangingwall of mined structure.
Drillhole data indicates continuity of the mineralized vein at least 100 meters downdip of the deepest mine workings, with mineralized widths of up to 3.6 meters. The mesothermal nature of the vein is consistent with vertical extents of mineralization of several hundreds of meters. The structure that controls mineralization appears to have a strike length of at least 1,300 meters as exposed on surface as measured from the Columbia workings to the southeast to the Juanita workings to the northwest. Although the structural zone appears to be continuous, it is not known if mineralization is similarly continuous along it.
Bridgeport intends to explore the Columbia property by compiling all data into a 2D GIS and 3D database, completing a detailed geological mapping and a rock chip sampling program, performing a regional grid soil sampling program to identify mineralized structures, implementing a variety of ground geophysical surveys to identify parallel mineralized structures within the larger shear zone that hosts the Columbia vein, and following-up with a 2,500 meter, RC drill program.
As of June 30, 2011, the Corporation had completed a soil geochemical survey, terrestrial induced polarization/resistivity surveys, and a ground magnetic survey over the claim block.
Kobeh
The Kobeh property is located 132 kilometers southwest of Elko, Nevada and 34 kilometers northwest of Eureka in Eureka County, Nevada. The property is comprised of 37 unpatented mining claims which are all located on BLM ground. An aggregate 3% NSR is held by Fronteer and certain other third parties with regard to the Kobeh property.
No mineralization is known to occur on the Kobeh property. Tertiary volcanic strata crop out on Kobeh Ridge on the eastern limit of the project while the remainder of the project area is covered by valley fill colluvium. The property is prospective because of its proximity to the Afghan and Gold Ridge gold deposits and its position within the regionally mineralized Battle Mountain – Eureka Trend.
It has been reported that the property has been partly drill tested by 6 drillholes completed by previous explorers. Historic drillhole logs and assays are not available to Dr. Gray but it has been reported that the drillhole data indicates that Paleozoic sedimentary strata are concealed by 5 to 60 meters of colluvial and volcanic cover and that stratigraphic sequences known to host gold mineralization elsewhere in the region underlie the property. The target concept of previous operators was a stratigraphically controlled gold deposit at the contact of the Mississippian Webb Formation and underlying Devonian Devils Gate limestone. Stratigraphically deeper Devonian mudstones and carbonate strata hosted ore at the nearby Gold Bar Project (1Moz+Au), which includes the Gold Pick and Gold Ridge mine. Pathfinder geochemical anomalies of As, Sb, and Hg, similar to those associated with the aforementioned mines are reported at the prospect.
Bridgeport intends to explore the Kobeh property by performing a stratigraphic, 1,500 meter RC drill testing program to determine if the sedimentary strata located on the property is favourable to host gold mineralization as suggested by historical records.
64
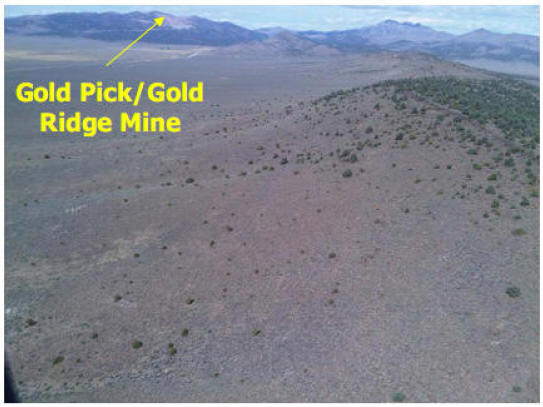
Figure 8. Aerial View of the Kobeh Property showing the Gold Pick/Gold Ridge mine pits in the distance.
Ashby
The Ashby property is located 20 kilometers southwest of Luning, 22 kilometers southeast of Hawthorne, Nevada, and 111 kilometers northwest of Tonopah in Moneral County, Nevada. The property is comprised of 3 unpatented mining claims which are all located on BLM land. A 2% NSR is held by Fronteer with regard to the Ashby property.
The property hosts two or more parallel gold mineralized zones which have been exploited by small underground mines, all serviced by shafts developed along a northwest striking, southwest dipping quartz veined structural zone. The northern portion of the property was visited however no outcrop was observed. Mine dumps have obscured the original outcrops that presumably led to discovery of the Ashby vein. Vein material on dumps consists of white milky and bull quartz with minor amounts of coarse mineral oxidizes to give malachite stain.
Historic drillhole data and artisanal mines demonstrate that a 500 meter strike length of the vein is variably gold mineralized over widths of 1.5 to 9 meters with grades varying between 0.030 and 0.26 ounces (1 and 8 g/t) gold in the Lazy Man mine area.
Bridgeport intends to explore the Ashby property by compiling all data into a 2D GIS and 3D database, and following-up with a 2,000 meter, RC drill program. The exploration program will focus on identifying a larger, much bigger, system.
65
Table 13. Historical drill data, Ashby
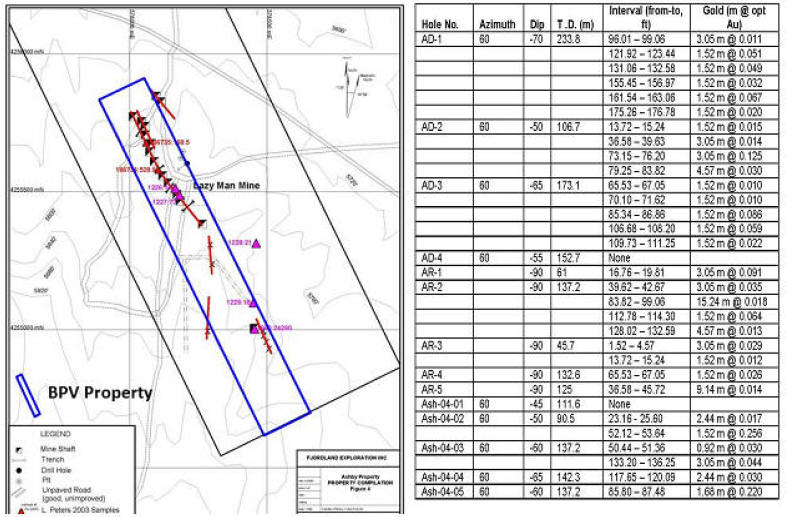
Figure 9. Drillhole location of map of the Ashbyproperty.
On July 19, 2011, the Corporation entered into an Option Agreement with Orsa Ventures granting Orsa has the option (the "First Option") to earn up to a 49% interest in the Ashby Property by:
| a) | issuing to Bridgeport or its nominee an aggregate of 100,000 common shares of Orsa within three business days of receipt by Orsa of the approval of the TSX Venture Exchange to the Option Agreement; | |
| b) | incurring an aggregate of $150,000 of exploration expenditures on the Ashby Property within one year of the date of the Option Agreeement; and | |
| c) | incurring $300,000 of cumulative exploration expenditures on the Ashby Property within two years of the date of the Option Agreement. |
If Orsa exercises the First Option and acquires a 49% interest in the Ashby Property, it will have the option (the "Second Option") to acquire a further 2% interest in the Ashby Property (for an aggregate 51% interest) by paying Bridgeport $100,000 in cash and issuing to Bridgeport common shares having an aggregate value of $100,000 within a 90 day period.
Following the exercise of the First Option, and if applicable, the Second Option, Orsa and Bridgeport will form a joint venture for further exploration and development of the Ashby Property. If Orsa has exercised the Second Option, it will hold a 51% interest in the joint venture and will be the operator of the joint venture. If Orsa has not exercised the Second Option, Orsa will hold a 49% interest in the joint venture and Bridgeport will become the operator.
66
East Walker
The East Walker property is located 102 kilometers southeast of Carson City, Nevada and 35 kilometers west-southwest of Hawthorne, Nevada in Lyon County. The property is comprised of 4 unpatented mining claims which are all located on USFS land. A 2% NSR is held by Fronteer with regard to the East Walker property.
The East Walker property is situated in the Walker Lane Trend within the Masonic Precious Metals District. The target concept recognized at East Walker is a bulk minable epithermal gold deposit, partially exposed in an erosional window and extending underneath thin cover of post mineral volcanic strata. Nearby deposits which may be target analogs include the Borealis mine, located 23 kilometers to the east-southeast, which has mined 635,000 ounces gold and currently hosts a proven and probable reserve of 377,000 ounces gold.
Gold mineralization at East Walker is epithermal and is hosted by brecciated and silicified volcanic strata. The property was previously explored in 1984 by an explorer who is reported to have mapped and sampled a 900 meter long, 60 to 140 meter wide east-west trending zone of outcropping silica and clay alteration which yielded anomalous (>0.1 gpt) gold contents, with individual channel samples of as much as 2 gpt Au. Previous exploration of the property in 1990 reported continuous trench sampling results of as much as 24 meters @ 3.39 gpt Au.
15 shallow vertical drill holes were completed on the property in 1984. The land package held by the exploration company at the time did not cover the majority of the outcropping auriferous altered zone and their 1984 drill holes were located along the southern boundary of their claim block. Most were collared outside of the rock chip gold anomaly. Because all such drill holes were vertical they did not test a possible high angle structural control to the gold mineralization. Intercepts of as much as 19.8 meters @ 0.62 ppm Au were reported. A summary of highlighted drill hole results is set forth below:
Table 14. Highlighted results from 1984 drill program.
The Corporation believes that the East Walker property mineralization projects beneath unmineralized andesites and basalts and may be significantly larger than the current exposure. Drill pads and drillhole monuments were observed in the field whose locations match those shown on historic maps. Primary controls on alteration and mineralization appear to be structural, but this does not preclude the possibility of discovering bulk minable targets controlled by broad structural zones or the intersection of mineralized structures with permeable volcanic strata.
67

Figure 10. Figure on top shows a historical soil sampling survey completed in 1984; figure on bottom is a geological section showing the property boundary and vertical drilling.
Bridgeport intends to explore the East Walker property by compiling all data into a 2D GIS and 3D database, completing a detailed geological mapping and a rock chip sampling program, implementing a variety of induced polarization/resistivity surveys to identify extensions of the mineralized zone beneath the volcanic cover, and following-up with an extensive 3,500 meter, RC drill program. Since the East Walker property is located on USFS land, it requires additional permitting time.
As of August 30, 2011, the Corporation had completed a soil geochemical survey over the claim block.
Blackrock Property
Property Description and Location
The Blackrock property is located in Lyon County, Nevada, at coordinates 287,888E, 4,342,914N UTM Zone 11 NAD83. The property is 47 kilometers southeast of Reno, Nevada and 27 kilometers east-northeast of the state capital Carson City, Nevada (see Figure 1). The property area is 167.23 hectares (413.22 acres).
Surface Rights
The ownership of surface rights at the Blackrock property is Federal, administered by the BLM.
Mineralization
Historic artisanal small mines and exploration workings are present within the Blackrock property. Nearly all such workings are developed on zones of outcropping quartz veins or silicified andesite. No metals are currently produced from the property.
68
Access, Climate, Infrastructure, and Physiography
The Blackrock property is located 27 kilometers east-northeast of the state capital of Carson City (see Figure 1). Access is by unsurfaced road from Dayton, Nevada, and may require use of an all wheel drive vehicle. Paved state Highway 50 passes within 12 kilometers of the Blackrock property on the northwest side. Electric transmission lines follow Highway 50 and are as close as 12 kilometers to the project.
All basic services are available in Carson City. The property is unpopulated and an adequate supply of experienced labor for mining operations can be drawn from the region. The nearest commercial airport is located 27 kilometers west-southwest of the property in Carson City. The Reno, Nevada airport is located 42 kilometers northwest of the property and is served by daily flights from major US cities.
The property is located in the southwest margin of the Great Basin physiographic province, within the Walker Lane geologic province of Nevada, in the Pine Nut mountain range. Topographic relief is moderate and elevations in the property range from 2,000 meter ASL to over 2,150 meter ASL. Broad valleys of low relief east of the property are suitable locations for mill sites, leach pads, rock dumps, and other mine related infrastructure.
The climate in the area is arid with total annual precipitation of 15.6 centimetres and seasonal temperatures ranging from an average annual high of 33oC in July and an average annual low temperature of -8oCelsius in December. Exploration activities may be conducted year round.
Vegetation in the area is sparse, consisting only of small scrub and sage in the valley floors and piñon-juniper forest at the highest elevations.
History
The Blackrock property is located within the intensely explored and productive gold producing terrain of the Great Basin. Historical records of previous exploration efforts at the property are shown in Table 15.
Table 15. Exploration History Blackrock Property.
| Company | Year | Type of Work | Comments | |
| Unknown | 1800’s | Au | Adits | Two adits along the structure (106m) |
| Trenches | Several trenches were completed | |||
| Bentinck and Lester | 1979 | Au | Adits | resampling the adits, old dumps, |
| Placid Oil Company | 1985 | Au | Rock Samples | 39 rock samples collected |
| Soil Samples | 30 soil samples collected | |||
| Stream Sediment | 2 stream sediment samples | |||
| VLF-EM Survey | Discontinued due to weak signals | |||
| Echo Bay Exploration | 1986 | Au | Rock sampling | No results |
| Aqua Gold Resources | 1988 | Au | Trenching | Two trenches dug with a bulldozer; |
| Almac Mineral Resources Inc. | 1989 | Au | Further Sampling | No available results |
| Geological Mapping | Grid work |
| Integrated Resources | 1990 | Au | Rock Sampling | |
| Soil Sampling | ||||
| VLF-EM Survey | ||||
| Total Field Magnetics | ||||
| Trenching | ||||
| Baughman | 1999 | Au | Staked | Staked by Jerry as the ground was open |
| Romarco Minerals Inc. | 1999 | Au | Surface sampling | 61 rock samples |
| Meridian Gold Company | 1999 | Au | Surface Sampling | 13 rock samples; all samples > 100 ppb Au |
| Teck Resources Limited | 2000 | Au | Geological Mapping | |
| Rock and soil sampling | 260 rock samples collected | |||
| Petrological Study | ||||
| Franco Nevada Corporation | 2001 | Au | Surface Samples | 17 samples |
| Pacific Rim Exploration Inc. | 2001 | Au | Surface Samples | 11 rock samples |
| Western Exploration | 2001 | Au | Drilling | 4 RC dh |
| Miranda Gold Corp. | 2001 | Au | Surface Samples | 3 samples |
| New Dimension Resources Ltd. | 2008 | Au | Drilling | 12 holes |
69
Geological Setting
Regional Geology of the Blackrock Property
The Blackrock property lies within the Walker Lane geologic province, which occurs at the western edge of the Great Basin physiographic province and separates the Great Basin from the Sierra Nevada batholith and structural block to the west. The Walker Lane is underlain by Precambrian to Cenozoic metamorphic, intrusive, and sedimentary basement rocks. Volcanism related to eastward subduction of the Pacific plate beneath the North American plate resulted in a southwest migration of Cenozoic magmatism which began at approximately 40 Ma in northeast Nevada and by 34 Ma began to affect the Walker Lane region, resulting in deposition of extensive volumes of calc-alkalic Tertiary volcanic units and emplacement of associated intrusives. Early Oligocene to Early Miocene calc-alkalic volcanism is volumetrically significant in the eastern and central parts of Nevada yet is associated with few epithermal ore deposits, however, where the subduction related volcanism affected the intensely faulted crust in the Walker Lane, mineral deposits related to the igneous activity are common. Active volcanism in the Walker Lane terminated approximately ~3 Ma. In contrast to the predominant west-northwest extension in the western Great Basin and east-west extension in the eastern Great Basin, the Walker Lane is characterized by right lateral displacement along regional scale, northwest striking, strike slip faults. Collectively these faults accommodate 15 to 25% of the current relative motion between the Pacific and North American tectonic plates. Major strike slip faults cut Miocene and younger volcanic rocks indicating that strike slip movement began in the middle and late Cenozoic.
Local Geology
The following discussion of project geology is based upon field examinations by Dr. Gray and a review of historic exploration data contained in the Fronteer project files.
The Blackrock property is within the Como mining district. The Como district has produced gold from epithermal deposits in the form of quartz veins, vein stockworks, and disseminated mineralization, all hosted by andesitic volcanic rocks. The Blackrock property is underlain by Miocene andesitic and dacitic volcanic strata similar to those exposed elsewhere in the Como district.
The andesitic flows and tuffs that underlie the Blackrock property are generally southeast-dipping and are underlain, to the north, by an undetermined thickness of volcanic lahar. The andesite is described as porphyritic with phenocrysts of feldspar, pyroxene, and hornblende and in places with textures of a crystal lithic tuff. Throughout the sequence, the andesite contains 0-5% lapilli size, rounded, dark to light brown basalt cobbles. In the north part of the property, steeply dipping, flow foliated andesites, identical in all other aspects to the other andesites in the area, may be intrusive feeders to the surrounding volcanics. A narrow basaltic dike is located in the extreme southeast corner of the property.
The dominant structural feature at Blackrock is a north-northeast striking, southeast dipping fault or fracture zone that controlled emplacement of the Blackrock vein and localized silicification of the footwall andesite. The quartz vein is discontinuously exposed over a 1,300 meter strike length. The multiphase vein is up to 15 meters wide and exhibits pinch and swell morphology. It is bordered by greater thicknesses of silicified andesite in the footwall. The vein structure exposed at surface is near vertical but drillhole data demonstrates a steep southeast dip for the southernmost 400 meters of the vein. Cross-fractures intersect the vein at angles ranging from 060º-090º and the southern exposure of the Blackrock fault is truncated by an east-west fault and that two east-west structures separate the north, central, and south portions of the vein. These faults parallel the main structural features in the Como area, 4 kilometers to the south. Offset along these faults is minor, with displacement along the cross fault at the north end of the South Zone estimated at approximately 3 meters.
70
Deposit Types
The exploration target recognized for the Blackrock property is a low sulfidation (referred to by some authors as quartz adularia) epithermal gold deposit, which has productive and economically important analogs in the region. Geologic characteristics observed at Blackrock are consistent with a low sulfidation system.
Economically important low sulfidation epithermal gold systems in the Walker Lane include Aurora, Bullfrog, Comstock, Rawhide, Round Mountain, and Tonopah, Nevada and Bodie, California. The mineralization described for the mines and mining districts in this section is not necessarily indicative of the mineralization at the Blackrock and Argentite properties.
Low sulfidation deposits may be present as veins and/or disseminated deposits and hosted by intrusive, volcanic, and sedimentary rocks. Features common to such deposits include:
- Intermediate to felsic, calc-alkaline volcanic host rocks.
- Association with intrusive centers.
- Alteration mineral assemblages dominated by sericite, quartz, adularia, and chlorite.
- Variable Au:Ag ratios.
- Ore mineralogy characterized by argentite, tetrahedrite, tennantite, native silver, native gold, and base- metal sulfides.
- Vertical geochemical zoning, with well defined upper and lower elevation limits to economic mineralization, over vertical ranges of 200 to 700 meters.
- Open space filling vein textures.
- Quartz and carbonate gangue minerals.
- Ore and gangue mineral textures indicative of low temperature environments.
Mineralization
At Blackrock a gold mineralized multistage quartz vein is exposed in outcrop. A small caved adit in the arroyo at the southern end of the vein outcrop is the only know historic mine working on the property. The vein outcrops have been mapped and sampled by previous operators and the southernmost section of the vein has been partially tested by RC drilling.
71
The data generated by previous operators supported the possibility of a bonanza lode target at Blackrock. Surface sampling of the vein by previous operators reportedly confirmed a 1,300 meter strike length over which the vein and/or silicified wall rock discontinuously crops out. Sampling of the vein yielded anomalous to potentially ore grade gold concentrations over significant true widths of as much 6.1 meters @ 6.5 gpt Au. The historic rock chip assay data has not been independently confirmed by Dr. Gray but was obtained by exploration groups and personnel known to Dr. Gray and believed to be credible. Dr. Gray conducted independent sampling of the vein and altered wallrock and confirmed that both the veins and the silicified footwall are gold and silver mineralized. Dr. Gray’s sampling of the vein and wallrock yielded anomalous results with a minimum gold assay of 0.12 ppm Au from silicified andesite and a maximum gold assay of 1.6 ppm Au across a 3 meter width of the vein. Dr. Gray’s sample of vein fragments from the dump at the adit at the south end of the vein yielded 0.35 ppm gold and 228 ppm silver.
The only known drill testing of the project was conducted in 2001 by Western Exploration and in 2008 by New Dimension Resources, a publically traded Canadian exploration company. All drilling was concentrated on the southern end of the exposed vein. The 2008 drilling tested a 400 meter strike length of the Blackrock vein at depths of less than 100 meters. The vein was reported to have been intersected in every drillhole and each drillhole yielded wide, low grade gold intercepts, which were reported to include 38.1 meters @ 0.64 gpt in drillhole BR08-06 and 70.1 meters @ 0.21 gpt Au in drillhole BR08-03. The highest grade intercept was 1.5 meters @ 6.5 gpt Au. New Dimension Resources stated that these drill assay results were consistent with the required disclosure rules outlined in NI 43-101. Dr. Gray has not reviewed the original drill logs nor assay certificates thus cannot comment on the accuracy of the reported drill results. The drill hole assay data was obtained from sources believed to be reliable but cannot be verified and the 2008 drillhole data has not been independently confirmed by Dr. Gray. It is Dr. Gray’s opinion that although the 2008 drilling failed to define an economic resource it yielded results of exploration significance. The reported drill data demonstrated:
| 1. | Continuity of the mineralized vein along strike and dip. | |
| 2. | Increasing vein widths at depth and to the north. | |
| 3. | Multiple mineralized zones, interpreted as parallel vein structures. | |
| 4. | Possible increase of grade with depth (drillhole BR08-09). |
Field inspection of the area by Dr. Gray was completed on 14 and 20 October 2010, and was sufficient to confirm a 1,000 meter strike length of the silicified vein and outcrop, with true widths locally exceeding 15 meters. The vein is a multiphase vein comprised of fine white and tan sugary crystalline silica crosscut by white sugary and chalcedonic quartz veins, often with an angular breccia texture. Dr. Gray sampled vein material and silicified footwall host rock to the vein and confirmed that both the vein and the silicified wallrock locally contain elevated gold contents. Sample descriptions and gold assays are summarized in Table 16 and complete assay data is presented in Appendix B of the Nevada Report. The outcrop, surface rock chip assays, and drillhole data validate a high grade “bonanza vein” target at the Blackrock prospect, exploitable by underground methods, analogous to the productive veins of the Comstock district. Dr. Gray believes that the potential to host a bulk minable near surface deposit is low, but not precluded by the data.
72
Table 16. Sample descriptions and assay data for Blackrock property rock samples collected by M Gray.
73
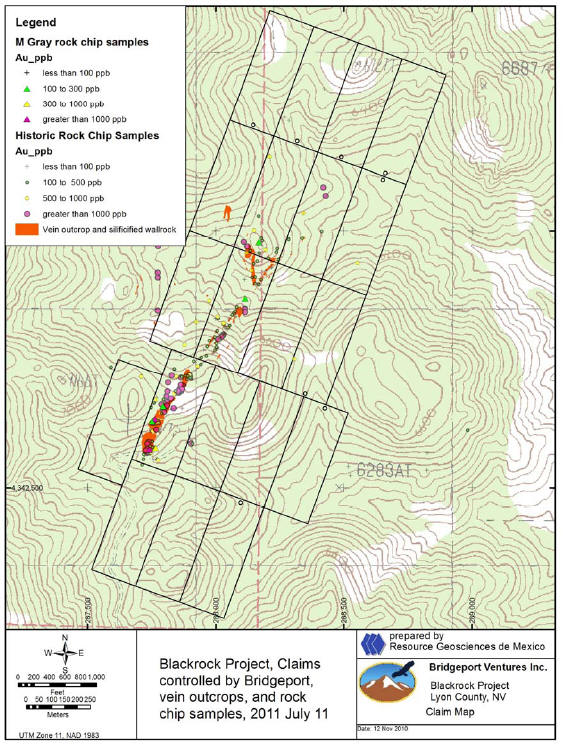
Figure 11. Map of Blackrock vein showing claims and rock chip sample gold assay data.
74
Data Verification
Prior Exploration Campaigns
An extensive amount of exploration work has been completed on the Blackrock property. Nearly all of this work is historic in nature, and as such the reported results are not NI 43-101 compliant. Digital copies of data files from exploration programs conducted prior to Bridgeport’s involvement with the project were reviewed by Dr. Gray. Data includes geologic maps, drillhole logs, drill sample assays, surface rock chip assays, and geophysical studies. Original documents are not available, nor is drill core or witness samples from RC drilling. Much of the exploration work was completed decades ago, and reclamation of drill sites and the effects of time and weathering have combined to destroy monuments and physical evidence of drillhole and surface sample locations. The only data that could be directly verified by Dr. Gray were geologic outcrop maps, some drillhole locations, and some outcrop rock chip sample assays.
Bridgeport has not yet commenced an exploration program at the Blackrock property beyond the work completed as part of the Nevada Report, thus there is no prior data generated by Bridgeport to be verified.
Production Data
No significant historic production is reported from the Blackrock property.
Adjacent Properties
The Blackrock property is not contiguous with any historic or active mining or exploration property. The nearest mining properties of economic significance are the Como and Comstock districts, located 4 kilometers south and 20 kilometers northwest respectively.
Metallurgical Testing
No metallurgical studies have been conducted by Bridgeport, nor is historical metallurgical data available for the property.
Mineral Resource Estimate
Data is insufficient to permit estimation of a mineral resource at the Blackrock property.
Other Relevant Data and Information
To the best knowledge of Dr. Gray, all relevant data has been presented in the Nevada Report.
Recommendations
Target Concepts
The target at Blackrock is an epithermal Au-Ag mineralized vein system, minable by underground methods. Target analogs are the productive deposits of the Comstock district, located 20 kilometers to the northwest, which produced greater than 8M ounces gold. The Con Virginia deposit in the Comstock district produced 1.1M tonnes of ore with an average grade of 87 gpt Au. The mineralization described for the mines in this section is not necessarily indicative of the mineralization at the Blackrock property.
Exploration data generated by previous operators has confirmed the viability of a bonanza lode target at Blackrock. Surface mapping, which was confirmed in the field by Dr. Gray, demonstrates a 1,300 meter strike length of the fault that localizes gold mineralization. Historical sampling of vein outcrops yielded anomalous (>0.1 gpt Au) to potentially ore grade gold concentrations over significant true widths (6.1 meters @ 6.5 gpt Au) and independent sampling by Dr. Gray confirmed that the vein outcrops are significantly gold mineralized. The historic drill testing of the project explored only to shallow depths a 400 meter strike length of the Blackrock vein. The vein was intersected in every drillhole and each yielded wide, low grade gold intercepts. The historic drilling failed to define an economic resource but yielded results of exploration significance. Drill data demonstrates:
75
| 1. | Continuity of the mineralized vein along strike and dip. | |
| 2. | Increasing vein widths at depth and to the north. | |
| 3. | Multiple mineralized zones, interpreted as parallel vein structures. | |
| 4. | Possible increase of grade with depth (drillhole BR08-09). |
Outcrop and drillhole data validate a high grade “bonanza vein” target at the Blackrock property, exploitable by underground methods, analogous to the productive veins of the Comstock district. Dr. Gray believes that the potential to host a bulk minable near surface deposit is low, but not precluded by the data.
Exploration Program and Budget
Testing of the prospect is straightforward. Geological mapping and surface rock chip sampling has defined the vein trace on surface and existing drillhole data constrains the vein orientation. The project can be advanced to the drill stage rapidly. Dr. Gray recommends that the Blackrock property be evaluated by:
| 1. | Compilation of exploration data into a GIS database. | |
| 2. | Confirmatory program of geologic mapping and rock chip sampling. | |
| 3. | Drill testing the projection of the vein structure at depths of 150 to 200 meters below surface at spacings of 150 meters along the strike projection of the vein. A total of 4,000 meters of RC drilling is recommended for the first phase drill test. |
Completion of the recommended Phase 1 work program is estimated to require 5 months and US$0.7M. A Phase 2 drill and resource modeling program with a budget of US$1.0M would be conditional upon successful results from the Phase 1 program. The timing of proposed expenditures includes approximately US$1.5M in 2011 and US$0.2M in 2012, assuming the completion of Phase 2 is warranted based upon prior results received.
Table 17. Proposed exploration program and budget, Blackrock property.
| Phase 1: Drilling program | ||
| Phase 2: Resource modeling and infill drilling program | ||
| Total Cost (US$) | ||
| Item | Phase 1 | Phase 2(1) |
| Lodging/Meals/Communications | $24,300 | $36,000 |
| Geophysical Surveys (IP/Resistivity) | $- | $- |
| Roads and Drill Pads | $45,000 | $50,000 |
| Resource Modeling | $- | $75,000 |
| Drilling - Reverse Circulation | $328,000 | $- |
| Drilling - Diamond Drill Core | $- | $500,000 |
| Drilling - Core | $- | $- |
| Assays, drill samples | $80,000 | $120,000 |
| Assays, rock and soil | $- | $- |
| Senior Geologist | $14,625 | $29,250 |
| Project Geologists | $63,000 | $52,500 |
| Technicians/Samplers | $12,600 | $21,000 |
| Vehicles and Fuel | $20,790 | $23,100 |
| Permits | $15,000 | $15,000 |
| Field Supplies | $40,000 | $40,000 |
| Travel Costs | $12,000 | $24,000 |
| Environmental Costs/Reclamation | $45,000 | $50,000 |
| Total | $700,315 | $1,035,850 |
| Total Phase 1 & Phase 2 | $1,736,165 | |
| (1) Conditional upon positive result from Phase 1 program | ||
76
The Corporation believes these recommendations are appropriate and will be followed should the Corporation move forward with this property.
As of August 30, 2011, ten planned Phase One drill holes totaling 3,303 metres were completed at the Blackrock project. Drill results ranged from 83.8 metres grading less than the analytical detection limit of 0.001 gpt Au in drillhole BRKDD11-005 to as much as 1.52 metres grading 3.98 gpt Au in drillhole BRKDD-009. Significant drill results, defined as minimum intercept length of 3 metres with a minimum grade of 0.5 gpt using a 0.1 gpt cutoff grade, are presented in the following table.
| Drillhole | From (m) | To (m) | Length (m) | Au gpt | Ag gpt |
| BRKDD11-001 | No significant intercepts | ||||
| BRKDD11-002 | 70.10 | 77.42 | 7.32 | 0.61 | 11.32 |
| BRKDD11-003 | No significant intercepts | ||||
| BRKDD11-004 | No significant intercepts | ||||
| BRKDD11-005 | 181.36 | 194.62 | 13.26 | 0.57 | 2.96 |
| BRKDD11-006 | 44.04 | 49.23 | 5.18 | 1.80 | 60.46 |
| BRKDD11-007 | No significant intercepts | ||||
| BRKDD11-008 | 99.67 | 102.72 | 3.05 | 0.54 | 4.58 |
| BRKDD11-008 | 172.21 | 175.26 | 3.05 | 0.52 | 4.23 |
| BRKDD11-008 | 186.05 | 190.50 | 4.45 | 0.66 | 5.63 |
| BRKDD11-009 | 156.82 | 161.33 | 4.51 | 1.12 | 6.32 |
| BRKDD11-010 | No significant intercepts | ||||
ITEM 4A. UNRESOLVED STAFF COMMENTS
Not applicable.
ITEM 5. OPERATING AND FINANCIAL REVIEW AND PROSPECTS
The following management’s discussion and analysis (“MD&A”) of the financial condition and results of the operations of the Corporation constitutes management’s review of the factors that affected the Corporation’s financial and operating performance for the fiscal year ended April 30, 2012. This discussion should be read in conjunction with the audited annual consolidated financial statements of the Corporation for the years ended April 30, 2012 and April 30, 2011, together with the notes thereto. Results are reported in Canadian dollars, unless otherwise noted. In the opinion of management, all adjustments (which consist only of normal recurring adjustments) considered necessary for a fair presentation have been included. Information contained herein is presented as at July 18, 2012, unless otherwise indicated.
77
On May 1, 2011, the Corporation adopted IFRS. The audited consolidated financial statements for the years ended April 30, 2012 and 2011 have been prepared in accordance with IFRS issued by IASB and interpretations of the International Financial Reporting Interpretations Committee, effective for the Corporation’s reporting for the year ended April 30, 2012. Readers of this discussion should refer to “Change in Accounting Policies” below for a discussion of IFRS and its effect on the Corporation’s financial presentation.
The comparative financial information of fiscal 2011 in this discussion has been restated to conform to IFRS, unless otherwise stated.
For the purposes of preparing this discussion, management, in conjunction with the Board of Directors, considers the materiality of information. Information is considered material if: (i) such information results in, or would reasonably be expected to result in, a significant change in the market price or value of the Corporation’s common shares; or (ii) there is a substantial likelihood that a reasonable investor would consider it important in making an investment decision; or (iii) it would significantly alter the total mix of information available to investors. Management, in conjunction with the Board of Directors, evaluates materiality with reference to all relevant circumstances, including potential market sensitivity.
The results for the periods presented are not necessarily indicative of the results that may be expected for any future period. Except for statements of historical fact relating to the Corporation, certain information contained in this MD&A constitutes “forward-looking information” under applicable securities laws. See “Forward-Looking Statements.”
5.A. Operating results
Twelve months ended April 30, 2012, compared with Twelve months ended April 30, 2011
The Corporation’s net loss totaled $8,386,262 for the twelve months ended April 30, 2012, with basic and diluted loss per share of $0.17. This compares with net loss of $7,374,350 with basic and diluted loss per share of $0.20 for the twelve months ended April 30, 2011. The increase of $1,011,912 in net loss was principally because:
The Corporation incurred a write-off of exploration property interests of $5,171,214 related to McCart Township and Nevada Properties. The write-off of exploration property interests and related receivables related to Rosario Properties was $1,175,229 for the year ended April 30, 2012 compared to $4,131,792 for the year ended April 30, 2011. The write-off of exploration property interests and related receivables related to Rosario Properties was included in net loss from discontinued operations.
The Corporation incurred a gain on sale of available-for-sale investment of $111,182 during the year ended April 30, 2012, through the disposal of Gondwana shares. No such gain was incurred in the comparative period.
Interest income increased by $103,585 during the twelve months ended April 30, 2012, compared to same period last year. The Corporation earned interest on high interest savings accounts and certificates of deposit from funds raised from its initial public offering, which was completed on October 7, 2009, a private placement that was completed on December 1, 2009, and the offering and over-allotment that were completed on December 20, 2010 and January 7, 2011, respectively.
78
The Corporation incurred a decrease in share-based payments of $716,981 for the year ended April 30, 2012, compared to the twelve months ended April 30, 2011. The decrease can be attributed to forfeiture of 196,666 stock options during the twelve months ended April 30, 2012, which resulted in a reversal of share-based payment of $138,886. In addition, the stock options have vesting terms that require share-based payments of $635,205 to be recorded during the twelve months ended April 30, 2012, compared to $1,352,186 in the comparative period. Readers of the financial statements should be cautious about the valuation of stock-based compensation since it can affect net income (loss) significantly.
During the twelve months ended April 30, 2012, the following stock options were issued:
On June 8, 2011, the Corporation granted 55,000 options exercisable at $0.85 to an employee and a consultant of the Corporation with an expiry date of June 8, 2016. The options will vest as to one-third on the date of grant and one-third after the first and second anniversaries of the date of grant. The grant date fair value of $11,550 was assigned to the stock options by using the Black-Scholes valuation model with the following assumptions: expected dividend yield of 0%, expected volatility of 72%, risk-free rate of return of 2.05% and an expected maturity of five years. For the year ended April 30, 2012, $9,422 was expensed to share-based payments.
On July 26, 2011, the Corporation granted 417,500 options exercisable at $0.50 to certain directors, officers, employees and consultants of the Corporation with an expiry date of July 26, 2016. The options will vest as to one-third on the date of grant and one-third after the first and second anniversaries of the date of grant. The grant date fair value of $119,823 was assigned to the stock options by using the Black- Scholes valuation model with the following assumptions: expected dividend yield of 0%, expected volatility of 71%, risk-free rate of return of 1.93% and an expected maturity of five years. For the year ended April 30, 2012, $95,126 was expensed to share-based payments.
On September 6, 2011, the Corporation granted 215,000 options exercisable at $0.50 to certain employees of the Corporation with an expiry date of September 6, 2016. The options will vest as to one-third on the date of grant and one-third after the first and second anniversaries of the date of grant. The grant date fair value of $61,920 was assigned to the stock options by using the Black-Scholes valuation model with the following assumptions: expected dividend yield of 0%, expected volatility of 70%, risk-free rate of return of 1.24% and an expected maturity of five years. For the year ended April 30, 2012, $40,734 was expensed to share-based payments.
Several variables are used when determining the value of stock options using the Black-Scholes valuation model:
The expected term: the Corporation used the expected terms of five years, which is the maximum term ascribed to the stock options issued, for the purposes of calculating their value; the Corporation chose the maximum term because it is difficult to determine with any reasonable degree of accuracy when these stock options will be exercised.
Volatility: the Corporation used historical information on the market price of a similar company to determine the degree of volatility at the date the stock options were granted. Therefore, depending on when the stock options are granted and the period of historical information examined, the degree of volatility can be different when calculating the value of different stock options.
Risk-free interest rate: the Corporation used the interest rate available for government securities of an equivalent expected term at the date of the grant of the stock options. The risk-free interest rate will vary depending on the date of the grant of the stock options and their expected term.
Dividend yield: the Corporation has not paid dividends in the past because it is in the exploration stage and has not yet earned any significant income. Also, the Corporation does not expect to pay dividends in the foreseeable future because it does not expect to bring its mineral properties into production and earn significant revenue in the foreseeable future. Therefore, a dividend rate of 0% was used for the purposes of the valuation of the stock options.
79
The Corporation incurred professional fees of $226,459 for the year ended April 30, 2012, compared to $768,066 during the year ended April 30, 2011. The decrease can be attributed to reduced corporate activity requiring legal assistance;
The Corporation had a decrease in travel costs of $147,921 for the year ended April 30, 2012, compared to the year ended April 30, 2011. The Corporation incurred less travel costs in fiscal year 2012 due to its concentration on the Nevada Portfolio. In addition, management had fewer site visits to potential properties of interest in fiscal 2012 compared to fiscal 2011.
Administrative and general expenses decreased by $26,911 for the year ended April 30, 2012, compared to the year ended April 30, 2011, and consisted of administrative costs such as advertising and promotion, telephone, rent, travel, insurance, postage, support costs for the Nevada Portfolio and courier charges. The decrease can be attributed to more cost savings initiatives during the year ended April 30, 2012 compared to the same period in the previous year.
The Corporation incurred salaries and benefits costs of $279,151 for the year ended April 30, 2012, compared to $347,180 for the year ended April 30, 2011. The decrease can be attributed to lower employee costs to support the Nevada Portfolio paid by BPV Gold during the year ended April 30, 2012, than the same period last year.
The Corporation incurred a foreign exchange gain of $18,471 during the year ended April 30, 2012 compared foreign exchange loss of $6,998 during the year ended April 30, 2011. The increase in foreign exchange loss can be attributed to transactions in Chile and the United States and the US dollar exchange rate fluctuations.
The Corporation incurred an increase in business development fees of $546,843 for the year ended April 30, 2012, compared to the year ended April 30, 2011. These costs were incurred to develop the Corporation’s investor profile and business opportunities.
All other expenses related to general working capital purposes.
Three months ended April 30, 2012 compared with three months ended April 30, 2011
The Corporation’s net loss totaled $5,669,404 for the three months ended April 30, 2012, with basic and diluted loss per share of $0.12. This compares with net loss of $3,698,899 with basic and diluted loss per share of $0.09 for the three months ended April 30, 2011. The increase of $1,970,505 in net loss was principally because:
The Corporation incurred a write-off of exploration property interests of $5,171,214 related to McCart Township and Nevada Properties in the three months ended April 30, 2012 compared to $nil during the three months ended April 30, 2011. The write-off of exploration property interests and related receivables related to the Rosario Properties, which include the concessions known as the Rosario, Julia, Eliana I, Eliana II and Eliana III mining concessions was $84,734 for the three months ended April 30, 2012 compared to $3,309,120 for the three months ended April 30, 2011. The write-off of exploration property interests and related receivables related to Rosario Properties was included in net loss from discontinued operations.
The Corporation had a decrease in share-based payments of $149,040 for the three months ended April 30, 2012, compared to the three months ended April 30, 2011. The decrease can be attributed to the reason that the stock options have vesting terms that require share-based payments of $88,861 to be recorded during the three months ended April 30, 2012, compared to $237,901 in the comparative period. Readers of the financial statements should be cautious about the valuation of stock-based compensation since it can affect net income (loss) significantly.
During the three months ended April 30, 2012, no stock options were issued.
80
- The variables used in the Black-Scholes valuation model are similar to that described in share-based compensation on page 79;
The Corporation incurred professional fees of $8,960 for the three months ended April 30, 2012, compared to $180,392 during the three months ended April 30, 2011. The decrease can be attributed to reduced corporate activity requiring legal assistance;
The Corporation incurred salaries and benefits of $40,418 for the three months ended April 30, 2012, compared to $137,035 for the three months ended April 30, 2011. The decrease can be attributed to lower employee costs to support the Nevada Portfolio paid by BPV Gold during the three months ended April 30, 2012, than the same period last year.
The Corporation incurred a foreign exchange gain of $126,485 during the three months ended April 30, 2012, compared with a foreign exchange gain of $55,516 during the three months ended April 30, 2011. The increase in foreign exchange gain can be attributed to transactions in Chile and the United States and US dollar exchange rate fluctuations.
The Corporation incurred an increase in business development fees of $376,550 for the three months ended April 30, 2012, compared to the three months ended April 30, 2011. These costs were incurred to develop the Corporation’s investor profile and business opportunities.
All other expenses related to general working capital purposes.
Impact of Governmental Policies and Factors on the Corporation’s Exploration Activities
The mining, processing, development and mineral exploration activities of the Corporation are subject to various laws governing prospecting, development, production, taxes, labour standards and occupational health, mine safety, toxic substances, land use, water use, land claims of local people and other matters. Various governmental economic, fiscal, monetary and political policies, such as those related to inflation or foreign exchange, may affect the economic conditions prevailing in the Corporation’s countries of operation, which may, in turn, impact its business. These government policies may also affect investments by the Corporation’s shareholders.
Exploration may also be affected in varying degrees by government regulations with respect to, but not limited to, restrictions on future exploration and production, price controls, export controls, currency availability, foreign exchange controls, income taxes, delays in obtaining or the inability to obtain necessary permits, opposition to mining from environmental and other non-governmental organizations, limitations on foreign ownership, expropriation of property, ownership of assets, environmental legislation, labour relations, limitations on repatriation of income and return of capital, limitations on mineral exports, high rates of inflation, increased financing costs, and site safety. This may affect both the Corporation’s ability to undertake exploration and development activities in respect of present and future properties in the manner contemplated, as well as its ability to continue to explore, develop and operate those properties in which it has an interest or in respect of which it has obtained exploration and development rights to date.
Although the Corporation believes that its exploration and development activities are currently carried out in accordance with all applicable rules and regulations, no assurance can be given that new rules and regulations will not be enacted or that existing rules and regulations will not be applied in a manner which could limit or curtail development or future potential production. Amendments to current laws and regulations governing operations and activities of mining and milling or more stringent implementation thereof could have a substantial adverse impact on the Corporation.
81
Critical Accounting Estimates
Significant assumptions about the future that management has made that could result in a material adjustment to the carrying amounts of assets and liabilities, in the event actual results differ from assumptions made, relate to, but are not limited to, the following:
- Assets' carrying values and impairment charges
In the determination of carrying values and impairment charges, management looks at the higher of recoverable amount or fair value less costs to sell in the case of assets and at objective evidence, significant or prolonged decline of fair value on financial assets indicating impairment. These determinations and their individual assumptions require that management make a decision based on the best available information at each reporting period.
- Capitalization of exploration and evaluation costs
Management has determined that exploration and evaluation costs incurred during the year have future economic benefits and are economically recoverable. In making this judgement, management has assessed various sources of information including but not limited to the geologic and metallurgic information, history of conversion of mineral deposits to proven and probable mineral reserves, scoping and feasibility studies, proximity of operating facilities, operating management expertise and existing permits.
- Impairment of exploration properties and deferred exploration expenditures
While assessing whether any indications of impairment exist for interest in exploration properties and deferred exploration expenditures, consideration is given to both external and internal sources of information. Information the Corporation considers includes changes in the market, economic and legal environment in which the Corporation operates that are not within its control that could affect the recoverable amount of exploration and evaluation assets. Internal sources of information include the manner in which exploration and evaluation assets are being used or are expected to be used and indications of expected economic performance of the assets. Estimates include but are not limited to estimates of the discounted future after-tax cash flows expected to be derived from the Corporation's exploration properties, costs to sell the properties and the appropriate discount rate. Reductions in metal price forecasts, increases in estimated future costs of production, increases in estimated future capital costs, reductions in the amount of recoverable mineral reserves and mineral resources and/or adverse current economics can result in a write-down of the carrying amounts of the Corporation's exploration properties.
- Estimation of decommissioning and restoration costs and the timing of expenditure
Management has made the assumption of no material restoration, rehabilitation and environmental provisions, based on the facts and circumstances that existed during the periods presented. Decommissioning, restoration and similar liabilities are estimated based on the Corporation's interpretation of current regulatory requirements, constructive obligations and are measured at fair value. Fair value is determined based on the net present value of estimated future cash expenditures for the settlement of decommissioning, restoration or similar liabilities that may occur upon decommissioning of the mine. Such estimates are subject to change based on changes in laws and regulations and negotiations with regulatory authorities.
- Income taxes and recoverability of potential deferred tax assets
In assessing the probability of realizing income tax assets recognized, management makes estimates related to expectations of future taxable income, applicable tax planning opportunities, expected timing of reversals of existing temporary differences and the likelihood that tax positions taken will be sustained upon examination by applicable tax authorities. In making its assessments, management gives additional weight to positive and negative evidence that can be objectively verified. Estimates of future taxable income are based on forecasted cash flows from operations and the application of existing tax laws in each jurisdiction. The Corporation considers whether relevant tax planning opportunities are within the Corporation's control, are feasible, and are within management's ability to implement. Examination by applicable tax authorities is supported based on individual facts and circumstances of the relevant tax position examined in light of all available evidence. Where applicable tax laws and regulations are either unclear or subject to ongoing varying interpretations, it is reasonably possible that changes in these estimates can occur that materially affect the amounts of income tax assets recognized. Also, future changes in tax laws could limit the Corporation from realizing the tax benefits from the deferred tax assets. The Corporation reassesses unrecognized income tax assets at each reporting period.
82
- Share-based payments
Management determines costs for share-based payments using market-based valuation techniques. The fair value of the market-based and performance-based share awards are determined at the date of grant using generally accepted valuation techniques. Assumptions are made and judgment used in applying valuation techniques. These assumptions and judgments include estimating the future volatility of the stock price, expected dividend yield, future employee turnover rates and future employee stock option exercise behaviors and corporate performance. Such judgments and assumptions are inherently uncertain. Changes in these assumptions affect the fair value estimates.
- Contingencies
(i) Environmental contingencies
The Corporation's activities are subject to environmental regulation (including regular environmental impact assessments and permitting) in each of the jurisdictions in which its mineral properties are located. Such regulations cover a wide variety of matters including, without limitation, prevention of waste, pollution and protection of the environment, labour relations and worker safety. The Corporation may also be subject under such regulations to clean-up costs and liability for toxic or hazardous substances which may exist on or under any of its properties or which may be produced as a result of its operations. It is likely that environmental legislation and permitting will evolve in a manner which will require stricter standards and enforcement. This may include increased fines and penalties for non-compliance, more stringent environmental assessments of proposed projects and a higher degree of responsibility for companies, their directors and employees.
The Corporation has not determined and is not aware whether any provision for such costs is required and is unable to determine the impact on its financial position, if any, of environmental laws and regulations that may be enacted in the future due to the uncertainty surrounding the form that these laws and regulations may take.
(ii) Management contracts
At April 30, 2012, the Corporation was party to certain management and consulting contracts. Minimum commitments under the agreements are approximately $253,333 all payable within one year.
Change in Accounting Policies
Impact of Adopting IFRS on the Corporation’s Accounting Policies
Effective the first quarter of fiscal 2012, the Corporation began preparing its financial statements in accordance with IFRS. Reconciliations, descriptions and explanations of how the transition to IFRS has affected the reported financial position, financial performance and cash flows of the Corporation are provided in Note 21 “Conversion to IFRS”, to the audited consolidated financial statements for the year ended April 30, 2012. This note also includes reconciliations of equity and comprehensive income (loss) for comparative periods reported under Canadian GAAP with amounts reported for those periods under IFRS.
The Corporation has changed certain accounting policies to be consistent with IFRS as it is expected to be effective or available on April 30, 2012, the Corporation’s first annual IFRS reporting date. The changes to its accounting policies have resulted in certain changes to the recognition and measurement of assets, liabilities, equity, revenue and expenses within its financial statements.
The following summarizes the significant changes to the Corporation’s accounting policies on adoption of IFRS.
83
(a) Impairment of Non-financial Assets
IFRS requires a write-down of assets if the higher of the fair market value and the value in use of a group of assets is less than its carrying value. Value in use is determined using discounted estimated future cash flows. Current Canadian GAAP requires a write-down to estimated fair value only if the undiscounted estimated future cash flows of a group of assets are less than its carrying value.
The Corporation's accounting policies related to impairment of non-financial assets have been changed to reflect these differences. There was no impact on the audited consolidated financial statements as there were no impairment indicators on the Transition Date or as at April 30, 2011.
(b) Decommissioning Liabilities (Asset Retirement Obligations)
IFRS requires the recognition of a decommissioning liability for legal or constructive obligations, while current Canadian GAAP only requires the recognition of such liabilities for legal obligations. A constructive obligation exists when an entity has created reasonable expectations that it will take certain actions.
The Corporation's accounting policies related to decommissioning liabilities have been changed to reflect these differences. There is no impact on the audited consolidated financial statements as there was no legal or constructive obligation on the Transition Date or as at April 30, 2011.
(c) Income Taxes
Under Canadian GAAP, the Corporation has recognized deferred tax on temporary differences arising on the acquisition of assets where the carrying amount of the assets acquired exceeded the tax base.
IFRS provides for a specific exemption from recording a deferred tax liability on initial recognition when the transaction is not a business combination and at the time of the transaction, affects neither accounting profit/loss nor tax profit/loss. As the acquisition of certain interests in exploration properties meets the IFRS exemption criteria, the recognition of deferred tax liabilities in relation to these assets acquired under Canadian GAAP is reversed under IFRS.
Impact of Adopting IFRS on the Corporation’s Business
The adoption of IFRS has resulted in some changes to the Corporation’s accounting systems and business processes. However, the impact has been minimal. The Corporation has not identified any contractual arrangements that are significantly impacted by the adoption of IFRS.
The Corporation's staff and advisers involved in the preparation of financial statements have been appropriately trained on the relevant aspects of IFRS and the changes to accounting policies.
The Board of Directors and Audit Committee have been regularly updated throughout the Corporation’s IFRS transition process, and are aware of the key aspects of IFRS affecting the Corporation.
New accounting standards and interpretations
The following standards have not yet been adopted and are being evaluated to determine their impact on the Corporation.
(i) IFRS 9 – Financial instruments (“IFRS 9”) was issued by the IASB in October 2010 and will replace IAS 39 Financial Instruments: Recognition and Measurement (“IAS 39”). IFRS 9 uses a single approach to determine whether a financial asset is measured at amortized cost or fair value, replacing the multiple rules in IAS 39. The approach in IFRS 9 is based on how an entity manages its financial instruments in the context of its business model and the contractual cash flow characteristics of the financial assets. Most of the requirements in IAS 39 for classification and measurement of financial liabilities were carried forward unchanged to IFRS 9. The new standard also requires a single impairment method to be used, replacing the multiple impairment methods in IAS 39. IFRS 9 is effective for annual periods beginning on or after January 1, 2015.
84
(ii) IFRS 10 – Consolidated financial statements (“IFRS 10”) was issued by the IASB in May 2011. IFRS 10 is a new standard which identifies the concept of control as the determining factor in assessing whether an entity should be included in the consolidated financial statements of the parent company. Control consists of three elements: power over an investee; exposure to variable returns from an investee; and the ability to use power to affect the reporting entity’s returns. IFRS 10 is effective for annual periods beginning on or after January 1, 2013. Earlier adoption is permitted.
(iii) IFRS 11 – Joint arrangements (“IFRS 11”) was issued by the IASB in May 2011. IFRS 11 is a new standard which focuses on classifying joint arrangements by their rights and obligations rather than their legal form. Entities are classified into two groups: parties having rights to the assets and obligations for the liabilities of an arrangement, and rights to the net assets of an arrangement. Entities in the former case account for assets, liabilities, revenues and expenses in accordance with the arrangement, whereas entities in the latter case account for the arrangement using the equity method. IFRS 11 is effective for annual periods beginning on or after January 1, 2013. Earlier application is permitted.
(iv) IFRS 12 – Disclosure of interests in other entities (“IFRS 12”) was issued by the IASB in May 2011. IFRS 12 is a new standard which provides disclosure requirements for entities reporting interests in other entities, including joint arrangements, special purpose vehicles, and off-balance-sheet vehicles. IFRS 12 is effective for annual periods beginning on or after January 1, 2013. Earlier application is permitted.
(v) IFRS 13 – Fair value measurement (“IFRS 13”) was issued by the IASB in May 2011. IFRS 13 is a new standard which provides a precise definition of fair value and a single source of fair value measurement considerations for use across IFRSs. The key points of IFRS 13 are as follows:
- fair value is measured using the price in a principal market for the asset or liability, or in the absence of a principal market, the most advantageous market;
- financial assets and liabilities with offsetting positions in market risks or counterparty credit risks can be measured on the basis of an entity’s net risk exposure;
- disclosure regarding the fair value hierarchy has been moved from IFRS 7 to IFRS 13, and further guidance has been added to the determination of classes of assets and liabilities;
- a quantitative sensitivity analysis must be provided for financial instruments measured at fair value;
- a narrative must be provided discussing the sensitivity of fair value measurements categorized under Level 3 of the fair value hierarchy to significant unobservable inputs;
- and information must be provided on an entity’s valuation processes for fair value measurements categorized under Level 3 of the fair value hierarchy.
IFRS 13 is effective for annual periods beginning on or after January 1, 2013. Earlier application is permitted.
(vi) IAS 1 – Presentation of financial statements (“IAS 1”) was amended by the IASB in June 2011 in order to align the presentation of items in other comprehensive income with US GAAP standards. Items in other comprehensive income will be required to be presented in two categories: items that will be reclassified into profit or loss and those that will not be reclassified. The flexibility to present a statement of comprehensive income as one statement or two separate statements of profit and loss and other comprehensive income remains unchanged. The amendments to IAS 1 are effective for annual periods beginning on or after July 1, 2012.
Subsequent Events
(i) On June 28, 2012, the Corporation entered into a non-binding letter of intent that sets forth the basic terms of the Transaction by Bridgeport of Premier Gold’s wholly-owned subsidiary, Premier Royalty.
Pursuant to the Transaction, Bridgeport will issue shares to Premier Gold in such amount as is equal to 60% of the issued and outstanding shares of Bridgeport (prior to giving effect to any convertible securities or instruments). Bridgeport will also issue warrants to its existing shareholders on the basis of 0.375 of a warrant for each common share of Bridgeport held by such shareholders. Each whole warrant (a “Bridgeport Warrant”) will be exercisable at a price of $0.50 for a period commencing on the date that is six months following the completion of the Transaction and ending on the date that is four years following completion of the Transaction, subject to early expiry upon the occurrence of certain events.
85
Premier Gold has previously provided a bridge loan facility to Premier Royalty in connection with the acquisition by Premier Royalty of certain royalties. In addition to stipulated cash payback provisions, Premier Gold will be granted a one-time right in its sole discretion to convert all or a portion of the bridge loan into units of Bridgeport, each such unit consisting of one common share of Bridgeport and 0.375 of a Bridgeport Warrant. In addition, Premier Gold will receive 616,400 Bridgeport Warrants, and convertible securities of Premier Royalty granted to certain vendors of royalty interests will convert into common shares or warrants of Bridgeport in connection with the Transaction.
Premier Gold shall have the right to rename Bridgeport and set its new management team upon completion of the Transaction. Bridgeport shall be entitled to two seats on the resulting Board of Directors.
On July 10, 2012, Premier Gold announced the closing of a private placement (the “Financing”) by its wholly-owned subsidiary, Premier Royalty, of an aggregate $11,500,000.00 principal amount of convertible debentures of Premier Royalty, which accrue interest at a rate of 8% per annum. The convertible debentures mature on May 31, 2013 unless, among other things, they are automatically converted as a result of the occurrence of a going public transaction by Premier Royalty, including the closing of the Transaction. If the Transaction is completed, the convertible debentures will convert into Bridgeport units. Each unit will consist of one common share of Bridgeport and 0.375 of a Bridgeport warrant, which warrants will have the same terms as the Bridgeport Warrants discussed above. The proceeds will be used for royalty acquisitions and working capital.
In addition, in connection with the Transaction, the common shares of Bridgeport will be consolidated on such basis as is determined at the time of the definitive agreement. The dollar figures and amounts referenced above do not give effect to the consolidation. The options and existing warrants of Bridgeport will also be adjusted to reflect the consolidation of Bridgeport shares and the distribution of Bridgeport Warrants.
The Transaction is subject to, among other things, the negotiation and execution of a definitive binding agreement (the “Definitive Agreement”), approval of the board of directors of each of Premier Gold and Bridgeport, approval of Bridgeport’s shareholders, regulatory approvals, including approval of the TSX, completion of due diligence and the entering into of support and lock-up agreements by Bridgeport’s directors and officers. Premier Gold and Bridgeport have agreed to deal exclusively with each other until July 31, 2012. It is anticipated that the Definitive Agreement will be executed in the near future. Further details will be announced upon the entering into of the Definitive Agreement. CIBC World Markets Inc. is acting as financial advisor to Premier Gold and Premier Royalty in connection with the Transaction and PowerOne Capital Markets Limited is acting as financial advisor to Bridgeport in connection with the Transaction.
(ii) Subsequent to April 30, 2012, the Corporation made termination payments in the amount of $253,333 pursuant to certain management and consulting contracts. Effective June 1, 2012, the Chief Executive Officer will commit a minimum 50% of her time towards her duties.
5.B. Liquidity and capital resources
The activities of the Corporation, principally the acquisition and exploration of properties that have the potential to contain precious and base metals, are financed through equity offerings and the exercise of stock options and warrants. During the year ended April 30, 2012, the Corporation did not have any equity transactions.
Amounts payable and other liabilities decreased to $97,233 at April 30, 2012, compared to $1,046,868 at April 30, 2011, primarily due to payments made during the year ended April 30, 2012. The Corporation’s cash and cash equivalents as at April 30, 2012, are sufficient to pay these liabilities.
The Corporation has no operating revenues and therefore must utilize its current cash reserves and other financing transactions to maintain its capacity to meet ongoing internal budgetary requirements. See “Trend information” below.
As of April 30, 2012, and to the date of this report, substantially all cash resources of the Corporation are held with select Canadian financial institutions.
The Corporation has no debt and its credit and interest rate risk is minimal. Amounts payable and other liabilities are short term and non-interest bearing.
86
Management estimates the Corporation’s operating expenses are estimated to average approximately $60,000 to $80,000 per month for fiscal 2013. The $60,000 to $80,000 covers legal fees, reporting issuer costs, salaries and benefits, business development costs and general and administrative costs. This does not take into account the Transaction with Premier Gold’s wholly-owned subsidiary, Premier Royalty. A budget subsequent to the Transaction will be developed at that time.
On November 15, 2010, BPV Gold acquired its interest in the Acquired Nevada Properties, subject to a 2% NSR in certain properties and an aggregate 3% NSR in certain properties, in consideration of the issuance by the Corporation of an aggregate of 4,500,000 common shares to Fronteer. A budget of approximately $3,123,698 was previously proposed to fund the Phase I recommended program on the Blackrock, Argentite, Bellview and Horsethief properties comprising, in part, the Nevada Portfolio properties. If warranted based on the results of Phase I, the Corporation anticipated that it would spend approximately $3,504,022 for completion of the Phase II recommended program on the Blackrock, Argentite, Bellview and Horsethief properties comprising, in part, the Nevada Portfolio properties. As of the date of this report, the exploration program for the Nevada Portfolio has been suspended and the Corporation is in discussions with companies who are interested in purchasing or joint venturing the Nevada projects. The $13.65 million use of proceeds disclosed in the short-form prospectus of the Corporation dated December 13, 2010, related to a prior financing completed by the Corporation, has been modified due to the current market environment. In particular, Bridgeport’s objective has changed to conserving cash to support an aggressive search for a flagship advanced gold or copper-gold project in the Americas. The Corporation intends to spend $350,000 on the Nevada Portfolio to maintain its ownership rights in the projects. The budget is discretionary, subject to change if management decides to scale back operations or accelerate exploration based on the success or failure of future exploration programs.
The Corporation believes it currently has sufficient funds to meet its fiscal 2013 planned expenditures. The Corporation’s working capital of $17,898,055 as of April 30, 2012, is anticipated to be adequate for it to continue operations at the current level for the twelve month period ending April 30, 2013, even if its expected plans discussed above do not materialize and new plans are developed. However, to meet long-term business plans, acquiring a flagship advanced gold or copper-gold project in the Americas is an important component of the Corporation’s financial success.
Financial Instruments
The Corporation’s financial instruments consist of:
| Description | As at | As at | ||||
| April 30, | April 30, | |||||
| 2012 | 2011 | |||||
| $ | $ | |||||
| Cash and cash equivalents | 17,810,583 | 22,870,894 | ||||
| Available-for-sale investment | 24,250 | 280,000 | ||||
| Amounts receivable | 61,513 | - | ||||
| Amounts payable and other liabilities | 97,233 | 1,046,868 | ||||
| Year ended | Year ended | |||||
| April 30, 2012 | April 30, 2011 | |||||
| Unrealized loss (gain) on available-for-sale investment | 3,875 | (175,000 | ) |
The primary goals of the Corporation’s financial risk management policies are to ensure that the outcome of activities involving elements of risk are consistent with the Corporation’s objectives and risk tolerance, while maintaining an appropriate risk/reward balance and protecting the Corporation’s balance sheet from events that have the potential to materially impair its financial strength. Balancing risk and reward is achieved through: identifying risk appropriately, aligning risk with overall business strategy, diversifying risk, pricing appropriately for risk, mitigation through preventive controls, and transferring risk to third parties.
87
The long-term corporate objective and strategic plan remain unchanged. However, the short-term objective and plan continue to be modified to reflect global economic financial conditions and general market conditions, which will inevitably have an impact on the overall risk assessment of the Corporation. Such modifications include streamlining operational costs and preserving cash to the extent possible.
The Corporation’s exposure to potential loss from financial instruments relates primarily to fair value risk, credit risk, liquidity risk, and market risks including interest rate risk and commodity price risk.
The Corporation's risk exposures and the impact on the Corporation's financial instruments are summarized below:
Credit Risk
The Corporation's credit risk is primarily attributable to cash and cash equivalents and amounts receivable. Cash and cash equivalents consist of cash, high interest savings accounts and certificates of deposit at select Canadian financial institutions, from which management believes the risk of loss to be remote. Financial assets included in amounts receivable consist of goods and services tax and harmonized sales tax due from the Government of Canada and deposits with service providers. Amounts receivable are in good standing as of April 30, 2012. Management believes that the credit risk concentration with respect to the financial instruments included in cash and cash equivalents and amounts receivable is remote.
Liquidity Risk
Liquidity risk is the risk that the Corporation will not have sufficient cash resources to meet its financial obligations as they come due. The Corporation’s liquidity and operating results may be adversely affected if its access to the capital market is hindered, whether as a result of a downturn in stock market conditions generally or matters specific to the Corporation. The Corporation generates cash flow primarily from its financing activities. As at April 30, 2012, the Corporation had cash and cash equivalents of $17,810,583 (April 30, 2011 - $22,870,894 and May 1, 2010 - $11,137,382) to settle current liabilities of $97,233 (April 30, 2011 - $1,046,868 and May 1, 2010 - $325,079). All of the Corporation's financial liabilities have contractual maturities of less than 30 days and are subject to normal trade terms. The Corporation regularly evaluates its cash position to ensure preservation and security of capital as well as liquidity. The Corporation’s ability to continually meet its obligations and carry out its planned exploration activities is uncertain and dependent upon the continued financial support of its shareholders and securing additional financing.
Market Risk
a) Interest Rate Risk
The Corporation has cash and cash equivalents and no interest-bearing debt. The Corporation's current policy is to invest excess cash in high interest savings accounts and investment-grade certificates of deposit issued by its Canadian financial institutions. The Corporation periodically monitors the investments it makes and is satisfied with the credit ratings of its Canadian financial institutions. Currently, the Corporation does not hedge against interest rate risk.
b) Foreign Currency Risk
The Corporation's functional and reporting currency is the Canadian dollar and purchases are transacted in Canadian and US dollars and Chilean pesos. The Corporation funds certain operations, exploration and administrative expenses in Chile and the United States on a cash call basis using US dollar currency converted from select bank accounts held in Canada. The Corporation maintains US dollar bank accounts in Canada and the United Sates. The Corporation is subject to gains and losses from fluctuations in the US dollar and Chilean peso against the Canadian dollar. The Corporation had the following significant balances in foreign currencies:
88
The Corporation had the following significant balances in foreign currencies:
| Description | As at | As at | |||||
| April 30, | April 30, | ||||||
| 2012 | 2011 | ||||||
| $ | $ | ||||||
| United States Dollars | |||||||
| Cash (Bank indebtedness) | 24,862 | (1) | (375,361 | ) (1) | |||
| Amounts receivable and other assets | 15,000 | (1) | 1,082 | (1) | |||
| Amounts payable and other liabilities | 1,958 | (1) | 20,196 | (1) | |||
| Chilean Peso | |||||||
| Amounts receivable and other assets | 30,118,500 | (2) | 112,182,936 | (2) | |||
| Amounts payable and other liabilities | -- | 199,755,213 | (2) |
(1) Denoted in United States Dollars: (April 30, 2012 - 1 United States Dollar = 0.9879 Canadian Dollars); and (April 30, 2011 - 1 United States Dollar = 0.9464 Canadian Dollars); and
(2) Denoted in Chilean Pesos: (April 30, 2012 - 1 Chilean Peso = 0.002039 Canadian Dollars); and (April 30, 2011 - 1 Chilean Peso = 0.00206 Canadian Dollars).
c) Price Risk
The Corporation is exposed to price risk with respect to commodity and equity prices. Equity price risk is defined as the potential adverse impact on the Corporation's earnings due to movements in individual equity prices or general movements in the level of the stock market. Commodity price risk is defined as the potential adverse impact on earnings and economic value due to commodity price movements and volatilities. The Corporation closely monitors commodity prices as they relate to gold and copper, individual equity movements, and the stock market to determine the appropriate course of action to be taken by the Corporation. Because the Corporation's mineral properties are in the exploration stage, it does not hedge against commodity price risk.
The Corporation's available-for-sale investment in Gondwana and Orsa are subject to fair value fluctuations arising from changes in the equity and commodity markets.
Sensitivity Analysis
Based on management's knowledge and experience of the financial markets, the Corporation believes the following movements are "reasonably possible" over a twelve month period:
(i) Cash equivalents are subject to floating interest rates. A 1% change in the interest rates with all other variables held constant, would result in a corresponding increase/decrease in interest income of approximately $177,000 based on the balance of cash equivalents at April 30, 2012.
(ii) The Corporation is exposed to foreign currency risk on fluctuations of financial instruments that are denominated in US dollars related to cash balances, amounts receivable and accounts payable and accrued liabilities. As at April 30, 2012, a plus or minus 5% change in the foreign exchange rate with all other variables held constant would decrease/increase the loss for the year ended April 30, 2012 and the reported equity as at April 30, 2012 by $4,202.
89
(iii) The Corporation’s available-for-sale investments in the common shares of Gondwana and Orsa are subject to fair value fluctuations. As at April 30, 2012, a plus or minus 10% change in the bid price of the common shares of Gondwana and Orsa with all other variables held constant would decrease/increase the comprehensive loss for the year ended April 30, 2012, and the reported equity as at April 30, 2012 by $2,450.
Capital Management
The Corporation manages its capital with the following objectives:
- to ensure sufficient financial flexibility to achieve the ongoing business objectives including funding of future growth opportunities and pursuit of accretive acquisitions; and
- to maximize shareholder return.
The Corporation monitors its capital structure and actively makes adjustments according to market conditions in an effort to meet its objectives given the current outlook of the business and industry in general. The Corporation may manage its capital structure by issuing new shares, repurchasing outstanding shares, adjusting capital spending, or disposing of assets. The capital structure is reviewed by management and the Board of Directors on an ongoing basis. The Corporation's ability to continue to carry out its planned exploration activities is uncertain and dependent upon the continued financial support of its shareholders and securing additional financing.
The Corporation manages capital through its financial and operational forecasting processes. The Corporation reviews its working capital and forecasts its future cash flows based on operating expenditures and other investing and financing activities. The forecast is updated based on activities related to its mineral properties. Selected information is provided to the Board of Directors. The Corporation’s capital management objectives, policies and processes have remained unchanged during the year ended April 30, 2012.
The Corporation is not subject to any capital requirements imposed by a lending institution.
5.C. Research and development, patents and licenses, etc.
Not applicable.
5.D. Trend information.
The Corporation is a mineral exploration company, focused on the acquisition, exploration and development of properties for the mining of precious and base metals. The Corporation currently has operations in the United States and Canada. The Corporation’s financial success will be dependent upon the extent to which it can make discoveries and on the economic viability of any such discoveries. The development of such assets may take years to complete and the resulting income, if any, is difficult to determine with any certainty. The Corporation lacks mineral resources and mineral reserves and to date has not produced any revenues. The sales value of any minerals discovered by the Corporation is largely dependent upon factors beyond its control, such as the market value of the commodities produced.
There are significant uncertainties regarding the price of copper, silver, gold and other minerals and the availability of equity financing for the purposes of exploration and development. The future performance of the Corporation is largely tied to the development of the Nevada Portfolio through partnerships with other junior companies, and to other prospective business opportunities and the overall financial markets. Financial markets are likely to be volatile, reflecting ongoing concerns about the stability of the global economy and weakening global growth prospects. Unprecedented uncertainty in the credit markets has also led to increased difficulties in borrowing and raising funds. Companies worldwide have been affected particularly negatively by these trends. As a result, the Corporation may have difficulties raising equity financing for the purposes of copper, silver, gold and other minerals exploration and development, particularly without excessively diluting the interests of existing shareholders. These trends may limit the ability of the Corporation to develop and/or further explore its current mineral exploration properties and any other property interests that may be acquired in the future.
90
Bridgeport has also identified the extreme volatility occurring in the financial markets as at the date hereof as a significant risk for the Corporation. As a result of the market turmoil, investors are moving away from assets they perceive as risky to those they perceive as safe. Companies like Bridgeport are considered risk assets and are highly speculative. The volatility in the markets and investor sentiment may make it difficult for Bridgeport to access the capital markets in order to raise the capital it will need to fund its current level of expenditures.
5.E. Off-balance sheet arrangements
As of the date hereof, the Corporation does not have any off-balance sheet arrangements that have, or are reasonably likely to have, a current or future effect on the results of operations or financial condition of the Corporation, including, and without limitation, such considerations as liquidity, capital expenditures and capital resources.
5.F. Tabular disclosure of contractual obligations
As of the date hereof, the Corporation does not have any contractual obligations.
ITEM 6. DIRECTORS, SENIOR MANAGEMENT AND EMPLOYEES
6.A. Directors and senior management
The following table sets forth the name and municipality of residence of each director and executive officer of the Corporation, as well as such individual’s age, position with the Corporation, principal occupation within the five preceding years and period of service as a director (if applicable). Similar information has been provided for Dr. Gray, upon whose work the Corporation is dependent.
| Name and Province of Residence | Age | Position with Corporation | Principal Occupation for Five Preceding Years | Director Since |
| Shastri Ramnath | 36 | President, Chief Executive Officer and Director | Area Geologist – Special Projects, Quadra FNX Mining Ltd., an exploration and resource group (2002 to 2010) | 2010 |
| Hugh Snyder Ontario, Canada | 76 | Chairman | President, H.R. Snyder Consultants, a consulting firm | 2009 |
| Graham Clow Ontario, Canada | 63 | Director | Chief Financial Officer, New Dawn Mining Corp., a gold exploration and production company | 2011 |
| Jon North Ontario, Canada | 50 | Director | President, Northquest Ltd., mineral exploration company (2008 to present) President and Chief Executive Officer, North Atlantic Resources Ltd. (formerly North Atlantic Nickel Corp.), a mineral exploration company (1997 to 2007) | 2007 |
| Wolf Seidler Ontario, Canada | 66 | Director | Consultant/project manager for French Nuclear Waste Agency (Andra) | 2010 |
| Carmelo Marrelli Ontario, Canada | 41 | Chief Financial Officer | President, Marrelli Support Services Inc., a corporate services firm (2009 to present) Partner, Marrelli & Drake Corporate Services, a corporate services firm (2004 to 2009) | N/A |
| Matthew Gray, Ph.D., C.P.G. | 49 | Technical Report Author | President, Resource Geosciences de Mexico SA de CV, a geological and technical services firm specializing in mining and natural resources exploration | N/A |
91
A description of each of the executive officers and directors of the Corporation (including details with regard to their principal occupations for the last five years) follows:
Shastri Ramnath was appointed the Corporation’s President and Chief Executive Officer effective September 29, 2010 and appointed as a director of the Corporation effective October 14, 2010. Ms. Ramnath received a B.Sc. (Hons) in Geology from the University of Manitoba, Canada in 1999, an M.Sc. (Exploration Geology) from Rhodes University, South Africa in 2001, and recently completed an MBA from Athabasca University, Edmonton in 2012. Ms. Ramnath has been working in the exploration and mining industry for over 12 years and has worked on projects in the United States, Nunavut, Manitoba, Ontario, Quebec, West Africa, and Chile. Her experience includes two years at Falconbridge Limited in Winnipeg, Canada and over eight years with the Exploration and Resource Group of FNX Mining (now KGHM International) in Sudbury, Canada. As of June 1, 2012, Ms. Ramnath is required to commit a minimum 50% of her time towards her duties as Chief Executive Officer. Ms. Ramnath currently devotes approximately 65% of her professional time to the Corporation’s business.
Hugh Snyder was appointed as the Corporation’s Chief Executive Officer effective January 11, 2010 and as Chairman and a director of the Corporation effective November 11, 2009.Mr. Snyder resigned as Chief Executive Officer on September 29, 2010. Mr. Snyderreceived a B.Sc. (Eng.) from the University of Witwatersrand, Johannesburg, South Africa, in 1958 and completed the P.M.D. from Harvard Business School in 1969. Since 1985, has has served as president of H.R. Snyder Consultants, a consulting firm providing services to junior resource companies, including as a former director and chairman of Fronteer Gold Inc. (TSX:FRG) and a director and occasional chairman of Frontera Copper Corp. (TSX:FCC). Mr. Snyder has also served as a director of Rio Narcea Gold Mines Ltd. and chairman and director of Greenstone Resources Ltd. (TSX: GRE). Mr. Snyder was also the president and a director of Southern Era Resources Limited, Brinko Limited and Western Mines Limited.
Graham Clow was appointed as a director and chair of the audit committee of the Corporation in January 2011. Mr. Clow is a Chartered Accountant, and a member of the Institute of Chartered Accountants of Ontario and the Institute of Chartered Accountants in England and Wales and received a B.Sc. (Hons.) from University College, University of London, United Kingdom. Mr. Clow was appointed as the Chief Financial Officer of New Dawn Mining Corp. (TSX:ND) in August 2005. Since 1983, Mr. Clow has been self-employed as a public accountant.
Jon North serves as a director of the Corporation. Dr. North is a professional exploration geologist with 26 years of experience in mineral exploration with certain major and junior mining companies world-wide including Western Mining Corp. (WMC) International, BHP Minerals International and Agip Mining Zambia Ltd. Dr. North holds a B.Sc. (1984) from the University of Western Ontario, an M.Sc. (1988) from Memorial University of Newfoundland and a Ph.D. (1993) from the University of Western Ontario. Dr. North’s industry experience is primarily in area selection and target evaluation in the exploration for a wide variety of mineral deposits including Proterozoic Ni-Cu deposits and IOCG deposits. Dr. North currently serves as President of Northquest Ltd., a private mineral exploration company, and previously served as President and a director of North Atlantic Resources Ltd. (formerly North Atlantic Nickel Corp.) from 1997 to 2007. Dr. North was a director of Grange Gold Corporation which was the subject of a cease trade order issued in June 2003 for failure to file financial statements. The cease trade order was subsequently revoked in July 2003. Dr. North is also currently a director of Continental Nickel Limited (TSXV:CNI) and New Dawn Mining Corp. (TSX:ND).
92
Wolf Seidler was appointed as a director of the Corporation effective January 11, 2010. Mr. Seidler is a past director of Baja Mining Corp. (TSX:BAJ) and Inmet Mining Corp. (TSX: IMN). Mr. Seidler has over 41 years of international mining experience and has held senior executive positions at Normandy LaSource SAS (TSX:NDY), Quebec Cartier Mining (U.S. Steel), Inmet Mining Corp., J.S. Redpath Ltd., and senior operating positions at Teck Corporation and Gold Fields Mining Corp.
Carmelo Marrelli serves as the Corporation’s Chief Financial Officer. Mr. Marrelli holds a Bachelor of Commerce degree from the University of Toronto and is qualified as a Chartered Accountant and as a Certified General Accountant in Canada. Since February 1, 2009, Mr. Marrelli has been a principal of Marrelli Support Services Inc., a bookkeeping firm. From 2004 to 2009, Mr. Marrelli was a partner with Marrelli & Drake Corporate Services, a firm which provided administration services to public companies in Canada. Mr. Marrelli also currently serves as Chief Financial Officer of several publicly listed junior mining companies, and as a director of Odyssey Resources Limited (TSXV:ODX) and Focused Capital II Corp., a capital pool company. Mr. Marrelli devotes 10% of his professional time through his firm, Marrelli Support Services Inc., to the Corporation’s business.
Matthew Gray, Ph.D., C.P.G. holds degrees from the Colorado School of Mines (B.Sc. - Geological Engineering; Ph.D. - Geology, with Minor in Mineral Economics) and the University of Arizona (M.Sc. - Geosciences). He is an A.I.P.G. Certified Professional Geologist (C.P.G. 10688) and a CSA NI43-101 Qualified Person. His 24 years of international exploration experience including directing generative exploration programs and managing advanced project evaluations for Placer Dome and Cambior in the United States, Brazil, Chile, Ecuador, Papua New Guinea, and Mexico. Dr. Gray has successfully managed mine permitting, water rights, and community relocation issues related to mine development in Mexico. Since 2000 he has been the President of Resource Geosciences de Mexico, a firm comprised of 30 geoscientists providing technical, administrative, and logistical services to clients throughout the Americas. Acting in the capacity of a CSA NI43-101 Qualified Person, Dr. Gray has co-authored Feasibility Studies and Preliminary Economic Assessments of active mines and advanced development projects, most recently for Grayd Resource Corporation’s La India gold project in Mexico (December 2010) and Frontera Copper Corporation’s Piedras Verdes copper mine in Mexico (February 2010).
6.B. Compensation
COMPENSATION OF EXECUTIVE OFFICERS
The following table provides a summary of all annual and long-term compensation for services rendered in all capacities to the Corporation for the fiscal years ended April 30, 2010, 2011 and 2012 in respect of the individuals who served, during the fiscal year ended April 30, 2012, as the Chief Executive Officer and the Chief Financial Officer of the Corporation (the “Named Executive Officers”). The Corporation had no other executive officers during the fiscal year ended April 30, 2012.
93
Summary Compensation Table
| Name and Principal Position | Fiscal Year Ended April30, | Salary | Share- based awards | Option- based awards(1) | Non-equity incentive plan compensation | Pension value | All other compensation | Total compensation | |
| Annual | Long- | ||||||||
| Incentive term Plans | incentive Plans | ||||||||
| Shastri Ramnath, President and Chief Executive Officer | 2012 | $200,000 | Nil | $28,700(2) | Nil | Nil | Nil | Nil | $228,700 |
| 2011 | $91,250 | Nil | $1,214,400(3) | Nil | Nil | Nil | Nil | $1,305,650 | |
| Carmelo Marrelli, Chief Financial Officer | 2012 | $47,337(4) | Nil | $5,470(5) | Nil | Nil | Nil | Nil | $53,117 |
| 2011 | $40,000(4) | Nil | Nil | Nil | Nil | Nil | Nil | $40,000 | |
| 2010 | $36,000(4) | Nil | $8,000(6) | Nil | Nil | Nil | Nil | $44,000 | |
Notes:
| (1) | Caution should be exercised with regard to the Black-Scholes option valuation model as its calculation is subjective, is based on variables at the date of issue of the related stock options and is not adjusted for future changes in the Corporation’s share price. |
| (2) | On July 26, 2011, the Corporation granted 417,500 options exercisable at $0.50 to certain directors, officers, employees and consultants of the Corporation with an expiry date of July 26, 2016, of which the number of options granted to Ms. Ramnath was 100,000. The options vest as to one-third on the date of grant and one- third after the first and second anniversaries of the date of grant. The grant date fair value of $119,823 was assigned to the stock options as estimated by using the Black-Scholes valuation model with the following assumptions: expected dividend yield of 0%, expected volatility of 71%, risk-free rate of return of 1.93% and an expected maturity of 5 years. The value attributable to Ms. Ramnath was $28,700. |
| (3) | On September 23, 2010, the Corporation granted 400,000 stock options to Ms. Ramnath pursuant to the Corporation’s stock option plan, exercisable for one common share each at a price of $1.05 per share for a period of five years expiring on September 23, 2015. The options vest as to one-third on the date of grant and one-third on each of the first and second anniversaries of the date of grant. The grant date fair value of $273,600 was assigned to the stock options as estimated by using the Black-Scholes valuation model with the following assumptions: expected dividend yield of 0%, expected volatility of 81%, risk-free rate of return of 2.11% and an expected maturity of 5 years. On December 21, 2010, the Corporation granted 1,600,000 stock options to Ms. Ramnath pursuant to the Corporation’s stock option plan, exercisable for one common share each at a price of $1.00 per share for a period of five years expiring on December 21, 2015. The options vest as to one-third on the date of grant and one-third on each of the first and second anniversaries of the date of grant. The grant date fair value of $940,800 was assigned to the stock options as estimated by using the Black- Scholes valuation model with the following assumptions: expected dividend yield of 0%, expected volatility of 77%, risk-free rate of return of 2.17% and an expected maturity of 5 years. |
| (4) | Amounts paid to MSSI for the services of Mr. Marrelli. |
| (5) | On July 26, 2011, the Corporation granted 417,500 options exercisable at $0.50 to certain directors, officers, employees and consultants of the Corporation with an expiry date of July 26, 2016, of which the number of options granted to Mr. Marrelli was 20,000. The options vest as to one-third on the date of grant and one-third after the first and second anniversaries of the date of grant. The grant date fair value of $119,823 was assigned to the stock options as estimated by using the Black-Scholes valuation model with the following assumptions: expected dividend yield of 0%, expected volatility of 71%, risk-free rate of return of 1.93% and an expected maturity of 5 years. The value attributable to Mr. Marrelli was $5,740. |
| (6) | On August 20, 2009, the Corporation granted 100,000 stock options to Mr. Marrelli, exercisable for one common share each at a price of $0.35 per share for a five-year period. These stock options vested immediately. The grant date fair value of $8,000 was assigned to the stock options as estimated by using the Black-Scholes valuation model with the following assumptions: expected dividend yield 0%, expected volatility 100%, risk-free rate of return 2.6% and an expected maturity of 5 years. |
94
Outstanding Share-Based Awards and Option-Based Awards
Set forth in the table below is a summary of all share-based and option-based awards held by each of the Named Executive Officers outstanding as of April 30, 2012.
| Option-Based Awards | Share-Based Awards | |||||
| Name | Number ofsecuritiesunderlyingunexercisedoptions (#) | Optionexercise price | Optionexpirationdate | Value ofunexercisedin-the-moneyoptions(1) | Number ofshares orunits ofshares thathave notvested (#) | Market orpayout valueof share-based awardsthat have notvested |
| Shastri Ramnath | 400,000 | $1.05 | September 23, 2015 | $Nil | Nil | Nil |
| 1,600,000 | $1.00 | December 21, 2015 | $Nil | Nil | Nil | |
| 100,000 | $0.50 | July 26, 2016 | $Nil | Nil | Nil | |
| Carmelo Marrelli | 100,000 | $0.35 | August 20, 2014 | $Nil | Nil | Nil |
| 20,000 | $0.50 | July 26, 2016 | $Nil | Nil | Nil | |
Incentive Plan Awards – Value Vested During the Year
Set forth below is a summary of the value vested during the financial year of the Corporation ended April 30, 2012 in respect of all option-based and share-based awards and non-equity incentive plan compensation granted to the Named Executive Officers.
| Name | Option-based awards –value vested during theyear(1) | Share-based awards –value vested during theyear | Non-equity incentive plancompensation – valueearned during the year |
| Shastri Ramnath | $461,286 | Nil | Nil |
| Carmelo Marrelli | $4,557 | Nil | Nil |
Note:
| (1) | The fair value of the options granted was calculated using the Black-Scholes valuation method using the assumptions set forth in the notes to the table under the heading “Summary Compensation Table” above. Caution should be exercised with regard to the Black-Scholes option valuation model as its calculation is subjective, is based on variables at the date of issue of the related stock options and is not adjusted for future changes in the Corporation’s share price. |
For further details concerning the incentive plans of the Corporation, please see “Stock Option Plan” under Item 6.E. below.
95
COMPENSATION DISCUSSION AND ANALYSIS
The Corporation’s approach to executive compensation has been to provide suitable compensation for executives that is internally equitable, externally competitive and reflects individual achievement. The Corporation attempts to maintain compensation arrangements that will attract and retain highly qualified individuals who are able and capable of carrying out the objectives of the Corporation.
The Corporation’s compensation arrangements for the Named Executive Officers may, in addition to salary, include compensation in the form of bonuses and, over a longer term, benefits arising from the grant of stock options. Given the stage of development of the Corporation, compensation of the Named Executive Officers to date has emphasized meaningful stock option awards to attract and retain Named Executive Officers and to a certain extent, conserve cash. This policy may be re-evaluated in the future to instead emphasize increased base salaries and/or cash bonuses with a reduced reliance on option awards, depending upon the future development of the Corporation and other factors which may be considered relevant by the board from time to time.
During fiscal 2012, (i) Ms. Ramnath, the President and Chief Executive Officer of the Corporation, received a salary of $200,000 and stock option grants valued at $28,700; and (ii) Mr. Marrelli, the Chief Financial Officer of the Corporation, was paid a salary, through MSSI, of $47,337 and received option grants valued at $5,470. The compensation program of the Corporation is designed to reward such matters as exploration success, market success, share performance, and the ability to implement strategic plans. The board of directors of the Corporation establishes and reviews the Corporation’s overall compensation philosophy and its general compensation policies with respect to the Chief Executive Officer and other officers, including the corporate goals and objectives and the annual performance objectives relevant to such officers. The board then evaluates each officer’s performance in light of these goals and objectives. In determining compensation matters, the board may consider a number of factors, including the Corporation’s performance, the value of similar incentive awards to officers performing similar functions at comparable companies, the awards given in past years and other factors it considers relevant. The current overall objectives of the Corporation’s compensation strategy is to reward management for their efforts, while conserving cash where advisable given market conditions and current exploration and development plans. With respect to any bonuses or incentive plan grants which may be awarded to executive officers in the future, the Corporation has not currently set any objective criteria and will instead rely upon any recommendations and discussion at the board level with respect to the above-noted considerations and any other matters which the board may consider relevant on a going-forward basis, including the cash position of the Corporation.
Existing options held by the Named Executive Officers at the time of subsequent option grants are taken into consideration in determining the quantum or terms of any such subsequent option grants. Options have been granted to directors, management, employees and certain service providers as long-term incentives to align the individual’s interests with those of the Corporation. The size of the option awards is in proportion to the deemed ability of the individual to make an impact on the Corporation’s success.
TERMINATION OF EMPLOYMENT, CHANGE IN RESPONSIBILITIES AND EMPLOYMENT CONTRACTS
Except as indicated below, there are currently no employment contracts between the Corporation and any Named Executive Officer, nor any compensatory plan, contract or arrangement where a Named Executive Officer is entitled to receive payments from the Corporation in the event of a resignation, retirement or any other termination of the Named Executive Officer’s employment with the Corporation, a change of control of the Corporation or a change in the Named Executive Officer’s responsibilities following a change of control.
On May 17, 2012, the Corporation entered into an arrangement with Shastri Ramnath whereby Ms. Ramnath continues to serve in the role of President and Chief Executive Officer of the Corporation on a part-time basis. In accordance with the arrangement, Ms. Ramnath’s base salary of $200,000 was continued until the end of May 2012. At the end of May, she received a payment of $200,000 less statutory deductions as a result of the change in Ms. Ramnath’s responsibilities. Beginning June 1, 2012, services rendered are to be billed by Ms. Ramnath’s personal services company and payment is now made in accordance with invoices received from that company.
96
Ms. Ramnath now receives remuneration for her services at a monthly rate of $10,000 and Ms. Ramnath works 11 days each month. She is remunerated at the rate of $1,000 per day for days worked in excess of 11 days in any month, with such further payment to be agreed upon in writing before it is incurred.
COMPENSATION OF DIRECTORS
Historically, directors of the Corporation who were not officers did not receive any cash fees for their services. Directors who were not officers were entitled to receive compensation to the extent that they provided services to the Corporation at rates that would be charged by such directors for such services to arm’s length parties. During the years ended April 30, 2009, 2010 and 2011, no such fees were paid to any director of the Corporation. Beginning in May 1, 2010, members of the Corporation’s Technical Committee have been entitled to be paid for their service on such committee.
Directors are eligible to participate in the stock option plan of the Corporation. As of July 9, 2012, the Corporation had outstanding options to purchase 4,507,500 common shares, of which 3,550,000 options have been granted to current directors of the Corporation.
The Corporation maintains liability insurance for the directors. The current policy of insurance is in effect until January 7, 2013 and a premium of $13,000 has been paid by the Corporation. No portion of the premium is directly paid by any of the directors. The aggregate insurance coverage obtained under the policy is limited to $5,000,000 with a deductible limit of $20,000 per claim, except for non-indemnifiable losses where the deductible is $Nil. No claims have been made or paid under such policy.
Director Compensation
The following table provides a summary of all annual and long-term compensation for services rendered in all capacities to the Corporation for the fiscal year ended April 30, 2012, in respect of the individuals who were, during the fiscal year ended April 30, 2012, directors of the Corporation other than the Named Executive Officers.
| Name | FeesEarned | Share-basedawards | Option-basedawards(1) | Non-equityincentiveplancompensation | Pensionvalue | All othercompensation | Total |
| Jon North | Nil | Nil | $14,350 | Nil | Nil | Nil | $14,350 |
| Hugh Snyder | $78,685(2) | Nil | $14,350 | Nil | Nil | Nil | $93,035 |
| Wolf Seidler | Nil | Nil | $28,700 | Nil | Nil | $42,707(3) | $71,407 |
| Graham Clow | $33,750 | Nil | $14,350(4) | Nil | Nil | Nil | $48,100 |
Notes:
| (1) | Caution should be exercised with regard to the Black-Scholes option valuation model as its calculation is subjective, is based on variables at the date of issue of the related stock options and is not adjusted for future changes in the Corporation’s share price. |
| (2) | Amounts paid to H.R. Snyder Consultants for the services of Mr. Snyder. |
| (3) | Paid in consideration of consulting services provided to the Corporation for service on the Technical Committee. |
| (4) | On July 26, 2011, the Corporation granted 417,500 options exercisable at $0.50 to certain directors, officers, employees and consultants of the Corporation with an expiry date of July 26, 2016, of which the number of options granted to Jon North, Hugh Snyder, Wolf Seidler and Graham Clow was 50,000, 50,000, 100,000 and 50,000 respectively. The options vest as to one-third on the date of grant and one-third after the first and second anniversaries of the date of grant. The grant date fair value of $119,823 was assigned to the stock options as estimated by using the Black-Scholes valuation model with the following assumptions: expected dividend yield of 0%, expected volatility of 71%, risk-free rate of return of 1.93% and an expected maturity of 5 years. The values attributable to Jon North, Hugh Snyder, Wolf Seidler and Graham Clow were $14,350, $14,350, $28,700 and $14,350 respectively. |
97
Outstanding Share-Based Awards and Option-Based Awards
Set forth in the table below is a summary of all share-based and option-based awards held by each of the directors of the Corporation other than the Named Executive Officers as of April 30, 2012.
| Option-Based Awards | Share-Based Awards | |||||
| Name | Number ofsecuritiesunderlyingunexercisedoptions (#) | Optionexercise price ($) | Optionexpirationdate | Value ofunexercisedin-the-moneyoptions ($)(1) | Number ofshares orunits ofshares thathave notvested (#) | Market orpayout valueof share-based awardsthat have notvested ($) |
| Jon North | 200,000 | $0.35 | August 20, 2014 | Nil | Nil | Nil |
| 50,000 | $0.50 | July 26, 2016 | Nil | Nil | Nil | |
| Hugh Snyder | 200,000 | $1.20 | November 12, 2014 | Nil | Nil | Nil |
| 300,000 | $1.40 | December 7, 2014 | Nil | Nil | Nil | |
| 50,000 | $0.50 | July 26, 2016 | Nil | Nil | Nil | |
| Wolf Seidler | 250,000 | $2.15 | January 11, 2015 | Nil | Nil | Nil |
| 100,000 | $0.50 | July 26, 2016 | Nil | Nil | Nil | |
| Graham Clow | 250,000 | $1.00 | January 7, 2016 | Nil | Nil | Nil |
| 50,000 | $0.50 | July 26, 2016 | Nil | Nil | Nil | |
Note:
(1) Based upon the closing price of the common shares as at April 30, 2012, which was $0.34 per share.
Incentive Plan Awards – Value Vested During the Year
Set forth below is a summary of the value vested during the financial year of the Corporation ended April 30, 2012 in respect of all option-based and share-based awards and non-equity incentive plan compensation granted to the directors of the Corporation, other than the Named Executive Officers.
98
| Name | Option-based awards –value vested during theyear ($)(1) | Share-based awards –value vested during theyear ($) | Non-equity incentive plancompensation – valueearned during the year ($) |
| Jon North | $11,392 | Nil | Nil |
| Hugh Snyder | $57,197 | Nil | Nil |
| Wolf Seidler | $67,176 | Nil | Nil |
| Graham Clow | $57,646 | Nil | Nil |
Note:
(1) The fair value of the options granted was calculated using the Black-Scholes valuation method using the assumptions set forth in the notes to the table under the heading “Director Compensation” above. Caution should be exercised with regard to the Black-Scholes option valuation model as its calculation is subjective, is based on variables at the date of issue of the related stock options and is not adjusted for future changes in the Corporation’s share price.
6.C. Board practices
Each of the directors of the Corporation will hold office until the next annual meeting of shareholders and until such director’s successor is elected and qualified, or until the director’s earlier death, resignation or removal. Each of the officers of the Corporation serves at the pleasure of the board of directors of the Corporation. Please also refer to Item 6.A. above for further details regarding the periods of service of each of the current directors and officers of the Corporation.
Except as described under “Termination of Employment, Change in Responsibilities and Employment Contracts” above with respect to an arrangement with Ms. Ramnath, during the fiscal year ended April 30, 2012 and since such time, there have been no employment contracts between the Corporation and any officer or director of the Corporation, nor any compensatory plan, contract or arrangement where any officer or director was entitled to receive payments from the Corporation in the event of a resignation, retirement or any other termination of his or her employment with the Corporation, a change of control of the Corporation or a change in his or her responsibilities following a change of control.
The Corporation’s audit committee was comprised of Messrs. Clow (Chair), Seidler and North. Each member of the audit committee is considered to be “independent. The audit committee is governed by the terms of an audit committee charter which has been adopted by the board of directors of the Corporation.
The charter provides that the audit committee shall consist of at least three members, the majority of whom shall be independent directors, and shall assist the board of directors in its oversight responsibilities relating to financial accounting and reporting process and internal control for the Corporation. The audit committee is responsible for reviewing the Corporation’s annual and quarterly financial statements and management’s discussion and analysis and then reporting thereon to the board for approval of the same. The audit committee is responsible for appointing and monitoring the performance of the Corporation’s outside auditors. The audit committee is responsible for inquiring of management and the independent auditors about significant risks or exposures, both internal and external, to which the Corporation may be subject, and assessing the steps management has taken to minimize such risks. The audit committee shall establish procedures for (i) the receipt, retention and treatment of complaints received by the Corporation regarding accounting, internal accounting controls or auditing matters; and (ii) the confidential, anonymous submission by employees of the Corporation of concerns regarding questionable accounting or auditing matters. Finally the audit committee is responsible for overseeing related party transactions entered into by the Corporation.
The board of directors of the Corporation does not presently have a remuneration committee.
6.D. Employees
As of April 30, 2012, the Corporation had five employees. All five employees were based out of Ontario Canada.
99
6.E. Share Ownership
| Holder | Number/Typeof SharesUnder OptionsExercisableCurrently orWithin 60 daysof July 9,2012 | Number/Typeof SharesUnderWarrantsExercisableCurrently orWithin 60 daysof July 9,2012 | Number ofCommonShares Heldas of July 9,2012 | Percentage ofCommon SharesBeneficially Heldas of July 9,2012(1) |
| Shastri Ramnath(2)(3) | 1,399,998 Common Shares | 7,500 Common Shares | 60,000 | 2.82% |
| Jon North(3) | 166,666 Common Shares | 25,000 Common Shares | 25,000 | * |
| Wolf Seidler(3) | 233,332 Common Shares | 10,000 Common Shares | 20,000 | * |
| Hugh Snyder(3)(4) | 533,333 Common Shares | 3,000,000 Common Shares | 2,350,000 | 10.87% |
| Carmelo Marrelli(5) | 113,333 Common Shares | Nil | Nil | * |
| Graham Clow(3) | 199,999 Common Shares | Nil | 4,500 | * |
* Represents less than 1%.
| (1) | Based on 50,579,600 shares outstanding as of July 9, 2012 and calculated in accordance with Rule 13d-3 under the Exchange Act. |
| (2) | On September 23, 2010, the Corporation granted 400,000 stock options to Ms. Ramnath pursuant to the Corporation’s stock option plan, exercisable for one common share each at a price of $1.05 per share for a period of five years expiring on September 23, 2015. The options vest as to one-third on the date of grant and one-third on each of the first and second anniversaries of the date of grant. On December 21, 2010, the Corporation granted 1,600,000 stock options to Ms. Ramnath pursuant to the Corporation’s stock option plan, exercisable for one common share each at a price of $1.00 per share for a period of five years expiring on December 21, 2015. The options vest as to one-third on the date of grant and one-third on each of the first and second anniversaries of the date of grant. On July 26, 2011, the Corporation granted 100,000 stock options to Ms. Ramnath pursuant to the Corporation’s stock option plan, exercisable for one common share each at a price of $0.50 per share for a period of five years expiring on July 26, 2016. The options vest as to one-third on the date of grant and one-third on each of the first and second anniversaries of the date of grant. |
| (3) | Currently a director of the Corporation. |
| (4) | Currently the Chairman of the Corporation. |
| (5) | Currently the Chief Financial Officer of the Corporation. |
Stock Option Plan
The shareholders of the Corporation approved the Plan on December 18, 2007. Up to such number of common shares as is equal to 10% of the aggregate number of common shares of the Corporation issued and outstanding from time to time may be reserved for issue upon the exercise of options granted pursuant to the Plan. As of July 9, 2012, an aggregate of 4,507,500 options have been granted by the Corporation under the Plan.
100
The purpose of the Plan is to attract, retain and motivate directors, officers, employees and other service providers by providing them with the opportunity, through share options, to acquire a proprietary interest in the Corporation and benefit from its growth. The options are non-assignable and may be granted for a term not exceeding five years.
Options may be granted under the Plan only to directors, officers, employees and other service providers subject to the rules and regulations of applicable regulatory authorities and any stock exchange upon which the common shares of the Corporation may be listed or may trade from time to time. The total number of common shares which may be reserved for issuance to any one individual under the Plan within any one year period shall not exceed 5% of the outstanding issue. The maximum number of common shares which may be reserved for issuance to insiders under the Plan, any other employer stock option plans or options for services, shall be 10% of the common shares issued and outstanding at the time of the grant (on a non-diluted basis). The maximum number of common shares which may be issued to insiders under the Plan, together with any other previously established or proposed share compensation arrangements, within any one year period shall be 10% of the outstanding issue. The maximum number of common shares which may be issued to any one insider and his or her associates under the Plan, together with any other previously established or proposed share compensation arrangements, within a one year period shall be 5% of the common shares outstanding at the time of the grant (on a non-diluted basis).
The maximum number of stock options which may be granted to any one consultant under the Plan, any other employer stock options plans or options for services, within any 12-month period, must not exceed 2% of the common shares issued and outstanding at the time of the grant (on a non-diluted basis). The maximum number of stock options which may be granted to any persons performing investor relations services under the Plan, any other employer stock options plans or options for services, within any 12-month period must not exceed, in the aggregate, 2% of the common shares issued and outstanding at the time of the grant (on a non-diluted basis).
The exercise price of options issued may not be less than the fair market value of the common shares at the time the option is granted, less any allowable discounts.
ITEM 7. MAJOR SHAREHOLDERS AND RELATED PARTY TRANSACTIONS
7.A. Major shareholders
Set forth below are the names and shareholdings of all major shareholders of the Corporation (meaning shareholders that are the beneficial owners of 5% or more of each class of the Corporation’s voting securities) as at July 9, 2012:
| Name of Major Shareholder | Number of Common Shares Beneficially Held as at July 9, 2012 | Percentage of Common Shares Held as at July 9, 2012(1) |
| Sheldon Inwentash | 7,547,500(2) | 14.67% |
| Wayne Beach | 6,112,900(3) | 11.49% |
| Hugh Snyder | 5,883,333(4) | 10.87% |
| Pinetree Capital Ltd. | 5,352,500(5) | 10.43% |
| Fronteer Gold Inc. | 4,500,000 | 8.90% |
| Libra Advisors, LLC | 3,000,000(6) | 5.93% |
(1) Based on 50,579,600 shares outstanding as of July 9, 2012 and calculated in accordance with Rule 13d-3 under the Exchange Act.
(2) Includes 4,602,500 common shares and 750,000 common shares issuable upon exercise of warrants held by Pinetree Capital Ltd. Also includes an additional 125,000 common shares issuable upon the exercise of warrants.
(3) Includes 2,631,000 common shares issuable upon the exercise of warrants.
(4) Includes 533,333 common shares issuable upon the exercise of options and 3,000,000 common shares issuable upon the exercise of warrants.
(5) Includes 750,000 common shares issuable upon the exercise of warrants.
(6) Ownership of these securities is shared by Libra Advisors, LLC, Libra Associates, LLC, Libra Fund II (Luxembourg), Libra Fund (Luxembourg), S.a.r.l. and Ranjan Tandon. Ownership of 2,583,000 of the securities is also shared by Libra Fund, L.P.
101
During the last three years, there have been significant changes in the percentage ownership held by each of Wayne Beach, Hugh Snyder, Pinetree Capital Ltd., Fronteer Gold Inc. and Libra Advisors, LLC
On October 7, 2009, Mr. Beach acquired 1,255,000 units of the Corporation, each unit consisting of one common share and one share purchase warrant. On October 9, 2009, Mr. Beach acquired an additional 2,000,000 share purchase warrants. On December 1, 2009, Mr. Beach acquired 1,000,000 units of the Corporation, each unit consisting of one common share and one share purchase warrant.
On October 7, 2009, Mr. Snyder acquired 2,000,000 units of the Corporation, each unit consisting of one common share and one share purchase warrant. On October 9, 2009, Mr. Snyder disposed of 600,000 shares and 2,000,000 share purchase warrants. On December 1, 2009, Mr. Snyder acquired 1,000,000 units of the Corporation, each unit consisting of one common share and one share purchase warrant.
On December 21, 2007, Pinetree Capital Ltd. (“Pinetree”) acquired 1,000,000 common shares of the Corporation. On December 1, 2009, Pinetree acquired 500,000 common shares of the Corporation and 500,000 share purchase warrants.
On November 15, 2010, Fronteer Gold Inc. acquired 4,500,000 common shares of the Corporation.
Libra Advisors, LLC acquired its securities of the Corporation as part of an offering by the Corporation.
The major shareholders of the Corporation listed above do not have different voting rights than other holders of Common Shares of the Corporation.
To the knowledge of the Corporation, an aggregate of 8,526,700 common shares of the Corporation are held in the United States by an aggregate of eight shareholders.
The Corporation is not directly or indirectly owned or controlled by another corporation(s), by any foreign government or by any other natural or legal person(s) severally or jointly.
The Corporation is not aware of any arrangements, the operation of which may at a subsequent date result in a change in control of the Corporation.
7.B. Related party transactions
Related party transactions conducted in the normal course of operations are measured at the exchange value (the amount established and agreed to by the related parties). The amounts due to related parties are unsecured, non-interest bearing and due on demand.
The Corporation entered into the following transactions with related parties:
102
| YearEndedApril 30,2012 $ | YearEndedApril 30,2011 $ | |
| Marrelli Support Services Inc.("MSSI")(1) | 47,377 | 40,000 |
| DSA Corporate Services Inc. ("DSA")(2) | 10,592 | 10,696 |
| H.R. Snyder Consultants(3) | 78,685 | 65,625 |
| Total | 136,654 | 116,321 |
| (1) | The Chief Financial Officer of the Corporation is the president of MSSI. Fees relate to accounting services provided by MSSI. These costs are reflected in professional fees in the consolidated statements of loss. As at April 30, 2012, MSSI was owed $25,750 (April 30, 2011 - $12,562 and May 1, 2010 - $12,226) and the amount was included in amounts payable and other liabilities. |
| (2) | The Chief Financial Officer of the Corporation is an officer of DSA. Fees relate to corporate secretarial services provided by DSA. These costs are reflected in professional fees in the consolidated statements of loss. As at April 30, 2012, DSA was owed $1,300 (April 30, 2011 - $989 and May 1, 2010 - $919) and the amount was included in amounts payable and other liabilities. |
| (3) | Fees were paid to H.R. Snyder Consultants for Hugh Snyder to act as Chairman of the Corporation. H.R. Snyder Consultants is controlled by Hugh Snyder. These costs are reflected in salaries and benefits in the consolidated statements of loss. |
| Names | May 1 toJuly 10,2012 $ |
| Marrelli Support Services Inc.("MSSI")(1) | 9,366 |
| DSA Corporate Services Inc. ("DSA")(2) | 1,345 |
| H.R. Snyder Consultants(3) | 1,042 |
| Total | 11,753 |
| (1) | The Chief Financial Officer of the Corporation is the president of MSSI. Fees relate to accounting services provided by MSSI. These costs are reflected in professional fees in the consolidated statements of loss. As at July 10, 2012, MSSI was owed $30,366. |
| (2) | The Chief Financial Officer of the Corporation is an officer of DSA. Fees relate to corporate secretarial services provided by DSA. These costs are reflected in professional fees in the consolidated statements of loss. As at July 10, 2012, DSA was owed $1,345. |
| (3) | Fees were paid to H.R. Snyder Consultants for Hugh Snyder to act as Chairman of the Corporation. H.R. Snyder Consultants is controlled by Hugh Snyder. These costs are reflected in salaries and benefits in the consolidated statements of loss. |
103
Remuneration of Directors and key management personnel of the Corporation was as follows:
Year Ended April 30, 2012
| Salaries and benefits $ | Share based payments $ | Total $ | |
| Graham Clow, Director and Audit Chair | 33,750 | 57,646 | 91,396 |
| Shastri M. Ramnath, Director and CEO | 200,000 | 461,286 | 661,286 |
| Wolf Seidler, Director | 42,707 | 67,176 | 109,883 |
| Hugh Snyder, Chairman and Director | nil | 57,197 | 57,197 |
| Carmelo Marrelli, CFO | nil | 4,557 | 4,557 |
| Jon W. North, Director | nil | 11,392 | 11,392 |
| Total | 276,457 | 659,254 | 935,711 |
Year Ended April 30, 2011
| Salaries and benefits $ | Share based payments $ | Total $ | |
| John McBride, Director | 20,000 | nil | 20,000 |
| Wolf Seidler, Director | 49,500 | 152,073 | 201,573 |
| Shastri M. Ramnath, Director and CEO | 91,250 | 653,291 | 744,541 |
| Graham Clow, Director and Audit Chair | 10,000 | 56,859 | 66,859 |
| Hugh Snyder, Chairman/Director | nil | 170,276 | 170,276 |
| Total | 170,750 | 1,032,499 | 1,203,249 |
Note: During the year ended April 30, 2011, John McBride resigned as director as at January 7, 2011, and became a service provider.
104
May 1 to July 10, 2012
| Salaries and benefits $ | Share based payments $ | Total $ | |
| Graham Clow, Director and Audit Chair | 833 | 4,237 | 5,070 |
| Shastri M. Ramnath, Director and CEO | 200,000 | 39,797 | 239,797 |
| Wolf Seidler, Director | 667 | 929 | 1,596 |
| Hugh Snyder, Chairman and Director | nil | 46,270 | 46,270 |
| Carmelo Marrelli, CFO | nil | 186 | 186 |
| Jon W. North, Director | nil | 465 | 465 |
| Total | 201,500 | 91,884 | 293,384 |
The above transactions are in the normal course of business and are measured at the exchange amount, which is the amount of consideration established and agreed to by the related parties. The amounts due to related parties as disclosed above are unsecured, non-interest bearing and due on demand.
Except as mentioned above, no director, executive officer, principal holder of securities or any associate or affiliate thereof of the Corporation has or has had any material interest, directly or indirectly, in any transaction involving the Corporation since its incorporation, or in any proposed transaction involving the Corporation, that has materially affected or will materially affect the Corporation.
No individual who is, or at any time since the incorporation of the Corporation was, a director, executive officer or employee of the Corporation, or any of their associates, is or has been indebted to the Corporation, or has had any indebtedness to another entity which has been the subject of a guarantee, support agreement, letter of credit, or similar arrangement provided by the Corporation.
See “Item 5. Operating and Financial Review and Prospects.”
7.C. Interests of experts and counsel
Not Applicable.
ITEM 8. FINANCIAL INFORMATION
8.A. Consolidated Statements and Other Financial Information
There are no legal proceedings or regulatory actions involving the Corporation or its properties as at July 9, 2012, nor have there been since the date of incorporation of the Corporation, and the Corporation knows of no such proceedings or actions currently contemplated that are reasonably expected to have a significant effect on the Corporation’s financial position or profitability.
The Corporation has never declared or paid cash dividends on its common shares and does not intend to do so in the near future. Any dividends declared in the future will be at the discretion of the board of directors. See “Risk Factors” regarding the Corporation’s dividend policy.
See “Item 17. Financial Statements.”
8.B. Significant Changes
Since the date of the most recent financial statements of the Corporation (April 30, 2012), no significant changes have occurred with respect to the business of the Corporation, except as follows:
105
(i) On June 28, 2012, the Corporation entered into a non-binding letter of intent that sets forth the basic terms of the proposed acquisition by Bridgeport of Premier Gold’s wholly-owned subsidiary, Premier Royalty.
Pursuant to the Transaction, Bridgeport will issue shares to Premier Gold in such amount as is equal to 60% of the issued and outstanding shares of Bridgeport (prior to giving effect to any convertible securities or instruments). Bridgeport will also issue warrants to its existing shareholders on the basis of 0.375 of a warrant for each common share of Bridgeport held by such shareholders. Each Bridgeport Warrant will be exercisable at a price of $0.50 for a period commencing on the date that is six months following the completion of the Transaction and ending on the date that is four years following completion of the Transaction, subject to early expiry upon the occurrence of certain events.
Premier Gold has previously provided a bridge loan facility to Premier Royalty in connection with the acquisition by Premier Royalty of certain royalties. In addition to stipulated cash payback provisions, Premier Gold will be granted a one-time right in its sole discretion to convert all or a portion of the bridge loan into units of Bridgeport, each such unit consisting of one common share of Bridgeport and 0.375 of a Bridgeport Warrant. In addition, Premier Gold will receive 616,400 Bridgeport Warrants, and convertible securities of Premier Royalty granted to certain vendors of royalty interests will convert into common shares or warrants of Bridgeport in connection with the Transaction.
Premier Gold shall have the right to rename Bridgeport and set its new management team upon completion of the Transaction. Bridgeport shall be entitled to two seats on the resulting Board of Directors.
On July 10, 2012, Premier Gold announced the closing of a private placement (the “Financing”) by its wholly-owned subsidiary, Premier Royalty, of an aggregate $11,500,000.00 principal amount of convertible debentures of Premier Royalty, which accrue interest at a rate of 8% per annum. The convertible debentures mature on May 31, 2013 unless, among other things, they are automatically converted as a result of the occurrence of a going public transaction by Premier Royalty, including the closing of the Transaction. If the Transaction is completed, the convertible debentures will convert into Bridgeport units. Each unit will consist of one common share of Bridgeport and 0.375 of a Bridgeport warrant, which warrants will have the same terms as the Bridgeport Warrants discussed above. The proceeds will be used for royalty acquisitions and working capital.
In addition, in connection with the Transaction, the common shares of Bridgeport will be consolidated on such basis as is determined at the time of the definitive agreement. The dollar figures and amounts referenced above do not give effect to the consolidation. The options and existing warrants of Bridgeport will also be adjusted to reflect the consolidation of Bridgeport shares and the distribution of Bridgeport Warrants.
The Transaction is subject to, among other things, the negotiation and execution of a Definitive Agreement, approval of the board of directors of each of Premier Gold and Bridgeport, approval of Bridgeport’s shareholders, regulatory approvals, including approval of the TSX, completion of due diligence and the entering into of support and lock-up agreements by Bridgeport’s directors and officers. Premier Gold and Bridgeport have agreed to deal exclusively with each other until July 31, 2012. It is anticipated that the Definitive Agreement will be executed in the near future. Further details will be announced upon the entering into of the Definitive Agreement. CIBC World Markets Inc. is acting as financial advisor to Premier Gold and Premier Royalty in connection with the Transaction and PowerOne Capital Markets Limited is acting as financial advisor to Bridgeport in connection with the Transaction.
(ii) Subsequent to April 30, 2012, the Corporation made termination payments in the amount of $253,333 pursuant to certain management and consulting contracts. Effective June 1, 2012, the Chief Executive Officer will commit a minimum 50% of her time towards her duties.
ITEM 9. THE OFFER AND LISTING
9.A. Offer and listing details
The common shares, without par value, of the Corporation are listed and traded on the TSX under the symbol “BPV”. The following table indicates the high and low market prices with respect to trading activity for the common shares on an annual, quarterly and monthly basis since the commencement of the listing of the common shares on the TSX Venture Exchange (“TSXV”), which occurred on October 9, 2009.(1)
| Year | High | Low |
| April 30, 2012 | $0.65 | $0.28 |
| April 30, 2011 | $2.15 | $0.55 |
| April 30, 2010 | $2.75 | $0.20 |
106
| Quarter Ended | High | Low |
| April 30, 2012 | $0.55 | $0.295 |
| January 31, 2011 | $0.65 | $0.29 |
| October 31, 2011 | $0.49 | $0.28 |
| July 31, 2011 | $0.65 | $0.40 |
| April 30, 2011 | $0.91 | $0.55 |
| January 31, 2011 | $1.18 | $0.76 |
| October 31, 2010 | $1.14 | $0.91 |
| July 31, 2010 | $2.15 | $1.10 |
| Month | High | Low |
| June 2012 | $0.43 | $0.30 |
| May 2012 | $0.335 | $0.25 |
| April 2012 | $0.335 | $0.295 |
| March 2012 | $0.38 | $0.31 |
| February 2012 | $0.55 | $0.35 |
| January 2012 | $0.65 | $0.32 |
(1) The common shares of the Corporation commenced trading on the TSXV on October 9, 2009. The Corporation subsequently graduated to the Toronto Stock Exchange and the common shares ceased trading on the TSXV and commenced trading on the TSX effective April 16, 2010.
There are no arrangements for transfer of the Corporation’s common shares or any restrictions on the free transferability of the shares.
9.B. Plan of distribution
Not applicable.
9.C. Markets
The common shares of the Corporation are listed and posted for trading on the TSX and the Pink Sheets.
9.D. Selling shareholders
Not applicable.
9.E. Dilution
Not applicable.
9.F. Expenses of the issue
Not applicable.
ITEM 10. ADDITIONAL INFORMATION
10.A. Share capital
Not applicable.
107
10.B. Memorandum and articles of association
Holders of common shares are entitled to receive notice of any meetings of shareholders of the Corporation, and to attend and to cast one vote per common share at all such meetings. Holders of common shares do not have cumulative voting rights with respect to the election of directors and, accordingly, holders of a majority of the common shares entitled to vote in any election of directors may elect all directors standing for election. Holders of common shares are entitled to receive on a pro rata basis such dividends on the common shares, if any, as and when declared by the Corporation’s board of directors at its discretion from funds legally available therefor, and upon the liquidation, dissolution or winding up of the Corporation are entitled to receive on a pro rata basis the net assets of the Corporation after payment of debts and other liabilities, in each case subject to the rights, privileges, restrictions and conditions attaching to any other series or class of shares ranking senior in priority to or on a pro rata basis with the holders of common shares with respect to dividends or liquidation. The common shares do not carry any preemptive, subscription, redemption or conversion rights, nor do they contain any sinking or purchase fund provisions.
In order to amend the rights attaching to the common shares of the Corporation, shareholder approval would be required to be obtained in accordance with applicable corporate law, and the Corporation’s articles of incorporation would then be amended accordingly.
There are no restrictions on the business the Corporation may carry on or the powers the Corporation may exercise.
Without in any way restricting the powers conferred upon the Corporation or its board of directors by the Business Corporations Act, as now enacted or as the same may from time to time be amended, re-enacted or replaced, the board of directors may from time to time, without authorization of the shareholders, in such amounts and on such terms as it deems expedient:
(a) borrow money upon the credit of the Corporation;
(b) issue, re-issue, sell or pledge debt obligations of the Corporation;
(c) subject to the provisions of the Business Corporations Act, as now enacted or as the same may from time to time be amended, re-enacted or replaced, give a guarantee on behalf of the Corporation to secure performance of an obligation of any person; and
(d) mortgage, hypothecate, pledge or otherwise create a security interest in all or any property of the Corporation owned or subsequently acquired, to secure any obligation of the Corporation.
The board of directors may from time to time delegate to a director, a committee of directors or an officer of the Corporation any or all of the powers conferred on the board as set out above, to such extent and in such manner as the board shall determine at the time of such delegation.
Pursuant to the bylaws of the Corporation, a director who is a party to, or who is a director of or has a material interest in any person who is a party to, a material contract or transaction with the Corporation shall be referred to the board or shareholders for approval and the interested director shall not vote on any resolution to approve such contract except as permitted by the Business Corporations Act.
Pursuant to the bylaws of the Corporation, the directors shall be paid such remuneration for their services as the board of directors may from time to time determine.
There are no limitations contained in the articles or bylaws of the Corporation restricting non-Canadian persons from holding, or exercising voting rights of, common shares of the Corporation.
The annual meeting of shareholders shall be held at such time in each year as the board, the Chairman of the board (if any) or the President of the Corporation may from time to time determine. The board, the Chairman of the board (if any) or the President of the Corporation also has power to call a special meeting of shareholders at any time. The board may fix in advance a date, preceding the date of any meeting of shareholders by not more than 50 days and not less than 21 days, as a record date for the determination of the shareholders entitled to notice of the meeting, provided that notice of any such record date shall be given not less than seven days before such record date by newspaper advertisement and, if any shares of the Corporation are listed for trading on a stock exchange in Canada, by written notice to each such stock exchange. If no record date is so fixed, the record date for the determination of the shareholders entitled to notice of the meeting shall be at the close of business on the day immediately preceding the day on which the notice is given or, if no notice is given, the day on which the meeting is held.
108
10.C. Material contracts
The only material contracts entered into by the Corporation, other than in the ordinary course of business, since the date of incorporation of the Corporation are as follows:
| (i) | the Agency Agreement dated September 25, 2009 between the Corporation and Toll Cross Securities Inc. governing the terms of the initial public offering of the Corporation; |
| (ii) | the Acquisition Agreement between the Corporation and William Brereton dated November 11, 2008 pursuant to which the Corporation acquired its 100% interest in two of the claims comprising, in part, the McCart property, subject to a 2% NSR; |
| (iii) | the Acquisition Agreement between the Corporation and William Brereton dated July 30, 2009 pursuant to which the Corporation granted a 1% NSR to William Brereton with respect to three of the claims comprising, in part, the McCart property; |
| (iv) | the Amended and Restated Warrant Indenture entered into between the Corporation and Valiant Trust Company dated September 25, 2009 governing the terms of the share purchase warrants of the Corporation issued on October 7, 2009; |
| (v) | the Warrant Indenture entered into between the Corporation and Valiant Trust Company dated December 1, 2009 governing the terms of the share purchase warrants of the Corporation issued on December 1, 2009; |
| (vi) | the Purchase Agreement dated November 10, 2009 between the Corporation, Francisco Schubert Seiffert and Rio Condor Resources S.A. pursuant to which the Corporation acquired 100% of the issued and outstanding shares of Rio Condor, save and except for one nominee share; |
| (vii) | Acquisition Agreement dated January 23, 2010 among the Rio Condor Resources S.A., Mario Leoncio Contreras Villar and Asesorías e Inversiones Invermondo Limitada in connection with the Simonetta property; |
| (viii) | Acquisition Agreement dated December 3, 2009 between the Rio Condor Resources S.A. and Maria Teresa Ortiz Carrasco in connection with the SOESMI property; |
| (ix) | Letter of Intent – Option Agreement related to the Rosario I / 10 with its Demasias dated September 11, 2009. |
| (x) | Option Agreement for Purchase of Mining Concessions between Rio Condor Resources S.A. and Sociedad Legal Minera Eliana I Una de la Sierra San Marcos related to the Eliana I concessions dated November 5, 2009; |
| (xi) | Option Agreement for Purchase of Mining Concessions between Rio Condor Resources S.A., Sociedad Legal Minera Eliana II Una de la Sierra San Marcos and Sociedad Legal Minera Eliana III Una de la Sierra San Marcos related to the Eliana II and Eliana III concessions dated November 5, 2009; |
| (xii) | Option Agreement for Purchase of Mining Concessions between Rio Condor Resources S.A. and Sociedad Legal Minera Julia Una de la Sierra San Marcos related to the Julia concessions dated November 5, 2009; |
| (xiii) | Option Agreement for Purchase of Mining Concessions between Rio Condor Resources S.A. and Sociedad Legal Minera Rosario Una de la Sierra San Marcos related to the Rosario concessions dated November 5, 2009; |
109
| (xiv) | Option Agreement for Purchase of Mining Concessions between Rio Condor Resources S.A. and Sociedad Legal Minera Tamara I Una de la Sierra San Marcos related to the Tamara concessions dated November 5, 2009; |
| (xv) | Amendment of Option Agreement for Purchase of Mining Concessions between Rio Condor Resources S.A. and Sociedad Legal Minera Tamara I Una de la Sierra San Marcos related to the Tamara concessions dated November 5, 2009; |
| (xvi) | Option Agreement related to the McCart property dated August 20, 2010 between the Corporation and Gondwana Gold (formerly China Opportunity); |
| (xvii) | Letter of Intent – Option Agreement related to the Trillador property dated June 23, 2010; |
| (xviii) | First Modification to Letter of Intent – Option Agreement related to the Trillador property dated August 27, 2010; |
| (xix) | Purchase Agreement dated October 22, 2010 among the Corporation, BPV Gold, Fronteer Development (USA) Inc. and Nevada Eagle Resources LLC in connection with certain mining claims located in Nevada; |
| (xx) | Modification to Acquisition Agreement among the Rio Condor Resources S.A., Mario Leoncio Contreras Villar and Asesorías e Inversiones Invermondo Limitada in connection with the Simonetta property dated September 15, 2010; |
| (xxi) | Agency Agreement dated December 13, 2010 between the Corporation and RBC Dominion Securities Inc. and MGI Securities Inc. governing the terms of the public offering of the Corporation, which closed on December 20, 2010; |
| (xxii) | Warrant Indenture entered into between the Corporation and Valiant Trust Company dated December 20, 2010 governing the terms of the share purchase warrants of the Corporation issued on December 20, 2010; |
| (xxiii) | Option Agreement for Purchase of Mining Concessions between Rio Condor Resources S.A. and Sociedad Legal Mineral Trillador Una de la Sierra San Marco related to the Trillador concessions dated January 31, 2011; |
| (xxiv) | Letter Agreement related to the Ashby Gold property dated July 19, 2011 between the Corporation and Orsa Ventures Corp.; |
| (xxv) | Amending Letter Agreement related to the McCart Property dated August 17, 2011 between the Corporation and Gondwana Gold; and |
| (xxvi) | Employment Arrangement dated May 17, 2012 between the Corporation and Shastri Ramnath. |
10.D. Exchange controls
There is no law, governmental decree or regulation in Canada that restricts the export or import of capital or affects the remittance of dividends, interest or other payments to a non-resident holder of common shares other than withholding tax requirements. Any such remittances to United States residents are subject to withholding tax. See “Taxation.” There is no limitation imposed by the laws of Canada or by the charter or other constituent documents of the Corporation on the right of a non-resident to hold or vote the common shares, other than as provided in the Investment Canada Act.
110
The following discussion summarizes the principal features of the Investment Canada Act for a non-resident who proposes to acquire the common shares. The Investment Canada Act generally prohibits implementation of a reviewable investment by an individual, government or agency thereof, corporation, partnership, trust or joint venture (each an “entity”) that is not a “Canadian” as defined in the Investment Canada Act (a “non-Canadian”), unless after review, the minister responsible for the Investment Canada Act is satisfied that the investment is likely to be of net benefit to Canada. Certain Government of Canada uranium policies may be material in respect of such a review.
A directinvestment in the common shares by a non-Canadian other than a “WTO Investor” (as that term is defined by the Investment Canada Act, and which term includes entities which are nationals of or are controlled by nationals of member states of the World Trade Organization) when the Corporation was not controlled by a WTO Investor, would be reviewable under the Investment Canada Act if it was an investment to acquire control of the Corporation and the book value of the assets of the Corporation, as determined in accordance with the regulations promulgated under the Investment Canada Act, was $5 million or more. An indirect investment in the common shares by a non-Canadian who is not a WTO Investor when the Corporation was not controlled by a WTO Investor would be reviewable if the book value of the assets of the Corporation was $50 million or more. However, this threshold falls to $5 million where the Canadian assets constitute more than 50% of the value of total worldwide assets acquired in the transaction. A direct investment in the common shares by a WTO Investor, or by a non-Canadian when the Corporation was controlled by a WTO Investor, would be reviewable under the Investment Canada Act if it was an investment to acquire control of the Corporation and the book value of the assets of the Corporation, as determined in accordance with the regulations promulgated under the Investment Canada Act was not less than a specified amount, which for 2012 was any amount in excess of $330 million. An indirect investment in the common shares by a WTO Investor, or by a non-Canadian when the Corporation was controlled by a WTO Investor would not be reviewable. All non-reviewable investments, however, would be subject to post-closing notification. Amendments to the Investment Canada Act could come into force in 2011 that will change the financial threshold that will trigger a review. These amendments will make direct acquisitions of control by WTO Investors, or investments by non-Canadians when the Corporation was controlled by a WTO Investor reviewable if the enterprise value (which term is to be defined in regulations not yet in force) of the Corporation $600 million (which amount will increase in subsequent years). The monetary thresholds will remain the same for investments by non-WTO Investors or investments by non-Canadians when the Corporation was not controlled by a WTO Investor.
A non-Canadian would acquire control of the Corporation for the purposes of the Investment Canada Act if the non-Canadian acquired a majority of the common shares. The acquisition of one third or more, but less than a majority of the common shares would be presumed to be an acquisition of control of the Corporation unless it can be established that, on the acquisition, the Corporation was not controlled in fact by the acquirer through the ownership of the common shares.
A completed or proposed acquisition of common shares of the Corporation (whether or not control is acquired) may also be reviewable if the Minister of Industry, after consultation with the Minister of Public Safety and Emergency Preparedness, considers that the investment could be injurious to national security and the Canadian federal cabinet makes an order for the review of the investment. Furthermore, to the extent that the investor has not implemented the proposed acquisition of common shares of the Corporation and the Minister of Industry has reasonable grounds to believe that the investment could be injurious to national security, the investor may not implement the acquisition without clearance if the minister sends a notice to the investor that an order for the review of the investment may be made.
Certain transactions relating to the common shares may be exempt from the Investment Canada Act, including: (a) an acquisition of the common shares by a person in the ordinary course of that person’s business as a trader or dealer in securities; (b) an acquisition of control of the Corporation in connection with the realization of security granted for a loan or other financial assistance and not for a purpose related to the provisions of the Investment Canada Act; and (c) an acquisition of control of the Corporation by reason of an amalgamation, merger, consolidation or corporate reorganization following which the ultimate direct or indirect control in fact of the Corporation, through the ownership of the common shares, remained unchanged.
111
10.E. Taxation
Canadian Federal Income Tax Considerations
The following is a summary of the principal Canadian federal income tax consequences generally applicable to the holding and disposition of common shares in the capital of the Corporation by a person who is a resident of the United States (and not resident in Canada for purposes of the Income Tax Act (Canada) (the “Tax Act”) and the Canada-United States Income Tax Convention, 1980, as amended (the “Treaty”)), who is entitled to the benefit of the Treaty, who holds common shares solely as capital property and does not use or hold a common share in carrying on business in Canada (a “US Shareholder”). Generally the common shares will be considered to be capital property to a US Shareholder provided the holder does not hold the common shares in the course of carrying on a business of trading in securities and has not acquired them in one or more transactions considered to be an adventure in the nature of trade. Special rules, which are not discussed herein, may apply to a holder of common shares who is a non-resident insurer which carries on business in Canada and elsewhere.
This summary is based on the current provisions of the Tax Act and the regulations thereunder (the “Regulations”), the Treaty, all specific proposals to amend the Tax Act, the Regulations and the Treaty publicly announced by or on behalf of the Minister of Finance (Canada) prior to the date hereof (the “Proposals”) and the administrative practices and assessing policies of the of Canada Revenue Agency published in writing by it prior to the date hereof.
This summary is not exhaustive of all possible Canadian federal income tax considerations and except for the Proposals, does not take into account or anticipate any changes in the law or practice, whether by judicial, governmental, or legislative decision or action, nor does it take into account any provincial, territorial or foreign (including without limitation, any United States) tax law or treaty, which may differ significantly from those discussed herein. It is assumed that all Proposals will be enacted substantially as proposed and that there is no other relevant change in any governing law or practice, although no assurance can be given in these respects. Each US Shareholder is advised to obtain tax and legal advice applicable to such US Shareholder’s particular circumstances.
Dividends
Dividends on common shares paid or credited by the Corporation to non-residents of Canada are normally subject to Canadian withholding tax at the rate of 25% of the gross amount of the dividends. In general, the Treaty reduces the rate of withholding with respect to dividends paid to a US Shareholder to 15% of the gross amount of the dividend. If the US Shareholder is a company that owns at least 10% of the voting stock of the Corporation and beneficially owns the dividend, the rate of withholding tax is reduced to 5% under the Treaty. Further, under the Treaty, dividends paid to certain religious, scientific, literary, educational or charitable organizations and certain pension organizations that are resident in, and generally exempt from tax in the United States, are generally exempt from Canadian withholding tax. The Corporation is required to withhold the applicable tax from the dividend payable to the US Shareholder, and to remit the tax to the Receiver General of Canada for the account of the US Shareholder.
Disposition of Common Shares
A US Shareholder will not be subject to tax under the Tax Act on any capital gain realized on an actual or deemed disposition of a common share of the Corporation unless the common share is “taxable Canadian property” to the US Shareholder and relief is not available under the Treaty. Generally, the common shares will not be taxable Canadian property to a US Shareholder with respect to a particular disposition if the common shares are listed on a “designated stock exchange” (which includes Tiers 1 and 2 of the TSXV) unless at any time in the 60 month period preceding the disposition (i) the US Shareholder, persons with whom the US Shareholder did not deal at arm’s length, or the US Shareholder together with all such persons, owned 25% or more of the issued shares of any class or series of shares of the capital stock of the Corporation, and (ii) more than 50% of the fair market value of the shares was derived directly or indirectly from one or any combination of real or immovable property situated in Canada, Canadian resource properties (as defined in the Tax Act), timber resource properties (as defined in the Tax Act), and options in respect of, or interests in, or for civil law rights in, any such properties (whether or not such property exists).
112
United States Federal Income Tax Considerations
TO ENSURE COMPLIANCE WITH TREASURY DEPARTMENT CIRCULAR 230, PROSPECTIVE INVESTORS ARE HEREBY NOTIFIED THAT: (A) ANY DISCUSSION OF U.S. FEDERAL TAX ISSUES IN THIS ANNUAL REPORT IS NOT INTENDED OR WRITTEN TO BE RELIED UPON, AND CANNOT BE RELIED UPON, BY INVESTORS FOR THE PURPOSE OF AVOIDING PENALTIES THAT MAY BE IMPOSED UNDER THE U.S. INTERNAL REVENUE CODE OF 1986, AS AMENDED; (B) SUCH DISCUSSION IS BEING USED IN CONNECTION WITH THE PROMOTION OR MARKETING OF THE TRANSACTIONS OR MATTERS ADDRESSED HEREIN; AND (C) PROSPECTIVE INVESTORS SHOULD SEEK ADVICE BASED ON THEIR PARTICULAR CIRCUMSTANCES FROM AN INDEPENDENT TAX ADVISOR.
The following summary describes certain material U.S. federal income tax considerations generally applicable to “U.S. Holders” (as defined below) with respect to the ownership and disposition of the Corporation’s common shares . This summary is based on the u.s. Internal Revenue Code of 1986, as amended (the “Code”), Treasury Regulations (whether final, temporary or proposed), administrative rulings of the Internal Revenue Service (“IRS”), judicial decisions and the Treaty (as defined above under “Canadian Federal Income Tax Considerations”), as in effect and available as of the date of this annual report, all of which are subject to change, possibly with retroactive effect. It addresses only U.S. Holders that hold the Corporation’s common shares as capital assets within the meaning of Section 1221 of the Code (generally, assets held for investment purposes). The following summary does not purport to be a complete analysis of all of the potential U.S. federal income tax considerations that may be relevant to U.S. Holders in light of their particular circumstances, nor does it deal with persons that are subject to special tax rules, such as brokers, dealers in securities or currencies, financial institutions, mutual funds, insurance companies, tax-exempt entities, qualified retirement plans, regulated investment companies, common trust funds, U.S. Holders subject to the alternative minimum tax, U.S. Holders holding the Corporation’s common shares as part of a straddle, hedge or conversion transaction or as part of a synthetic security or other integrated transaction, U.S. Holders that own, or are deemed to own, 10% or more of the Corporation’s voting stock, traders in securities that elect to use a mark-to market method of accounting for their securities holdings, U.S. Holders that have a “functional currency” other than the U.S. dollar, U.S. expatriates, and persons that acquired the Corporation’s common shares in connection with the performance of services. In addition, this summary does not address persons that hold an interest in a partnership or other pass-through entity that holds the Corporation’s common shares, or tax considerations arising under the laws of any state, local or non-U.S. jurisdiction or other U.S. federal tax considerations (e.g., estate or gift tax) other than those pertaining to the income tax.
As used herein, the term “U.S. Holder” means a beneficial owner of the Corporation’s common shares that is (i) a citizen or individual resident of the U.S. for U.S. federal income tax purposes, (ii) a corporation (or an entity classified as a corporation for U.S. federal income tax purposes) created or organized in or under the laws of the U.S. or any political subdivision thereof, (iii) an estate, the income of which is subject to U.S. federal income taxation regardless of its source, or (iv) a trust if (A) a U.S. court is able to exercise primary supervision over its administration and one or more U.S. persons, within the meaning of Section 7701(a)(30) of the Code, have authority to control all of its substantial decisions or (B) it has properly elected under applicable Treasury Regulations to be treated as a U.S. person.
The tax treatment of a partner in a partnership (or other entity classified as a partnership for U.S. federal income tax purposes) may depend on both the partner’s and the partnership’s status and the activities of such partnership. Partnerships that are beneficial owners of the Corporation’s common shares, and partners in such partnerships, should consult their own tax advisors regarding the U.S. federal, state, local and non-U.S. tax considerations applicable to them with respect to the ownership and disposition of the Corporation’s common shares.
113
This summary is of a general nature only. It is not intended to constitute, and should not be construed to constitute, legal or tax advice to any particular U.S. Holder. U.S. Holders should consult their own tax advisors as to the tax considerations applicable to them in their particular circumstances.
Ownership and Disposition of the Corporation’s Common Shares
Distributions. Subject to the discussion below under “Passive Foreign Investment Company Rules,” distributions made with respect to the Corporation’s common shares (including any Canadian taxes withheld from such distributions) generally will be included in the gross income of a U.S. Holder as dividend income to the extent of the Corporation’s current and accumulated earnings and profits, as determined under U.S. federal income tax principles. Distributions in excess of the Corporation’s current and accumulated earnings and profits, if made with respect to the Corporation’s common shares, will be treated as a return of capital to the extent of the U.S. Holder’s adjusted tax basis in such common shares, and thereafter as capital gain.
For taxable years beginning before January 1, 2013, a dividend paid by the Corporation generally will be taxed at the preferential tax rates applicable to long-term capital gains if various requirements are met including if (a) the Corporation is a “qualified foreign corporation” (as defined below), (b) the U.S. Holder receiving such dividends is an individual, estate, or trust, and (c) such dividend is paid on the Corporation’s shares that have been held by such U.S. Holder for at least 61 days during the 121-day period beginning 60 days before the ex-dividend date.
The Corporation generally will be a “qualified foreign corporation” under Section 1(h)(11) of the Code (a “QFC”) if the Corporation is eligible for the benefits of the Treaty or, if not, the Corporation’s shares are readily tradable on an established securities market in the U.S. While the U.S. Treasury Department has determined that the Treaty meets these requirements, we cannot provide any assurance as to whether the Corporation is eligible for the benefits of the Treaty. In addition, even if the Corporation satisfies one or more of such requirements, the Corporation will not be treated as a QFC if the Corporation is a PFIC for the taxable year during which it pays a dividend or for the preceding taxable year.
If any dividends are paid in Canadian dollars, the amount includible in gross income will be the U.S. dollar value of such dividend, calculated by reference to the exchange rate in effect on the date of actual or constructive receipt of the payment, regardless of whether the payment is actually converted into U.S. dollars. If any Canadian dollars actually or constructively received by a U.S. Holder are later converted into U.S. dollars, such U.S. Holder may recognize gain or loss on the conversion, which will be treated as ordinary gain or loss. Such gain or loss generally will be treated as gain or loss from sources within the U.S. for U.S. foreign tax credit purposes.
A U.S. Holder may be entitled to deduct or claim a credit for Canadian withholding taxes, subject to applicable limitations in the Code. Complex limitations apply to the foreign tax credit, including the general limitation that the credit cannot exceed the proportionate share of a U.S. Holder’s U.S. federal income tax liability that such U.S. Holder’s “foreign source” taxable income bears to such U.S. Holder’s worldwide taxable income. In applying this limitation, a U.S. Holder’s various items of income and deduction must be classified, under complex rules, as either “foreign source” or “U.S. source.” However, the amount of a distribution with respect to the common shares that is treated as “dividend” may be lower for U.S. federal income tax purposes than it is for Canadian federal income tax purposes, resulting in a reduced foreign tax credit allowance to a U.S. Holder. In addition, this limitation is calculated separately with respect to specific categories of income. Dividends paid to a U.S. Holder generally will constitute “foreign source” income and generally will be categorized as “passive category” income. U.S. Holders should consult their own tax advisors regarding the availability of the foreign tax credit in their particular circumstances.
Dispositions.Subject to the discussion below under “Passive Foreign Investment Company Rules,” upon the sale, exchange or other taxable disposition of the Corporation’s common shares, a U.S. Holder generally will recognize capital gain or loss equal to the difference between (i) the amount of cash and the fair market value of any other property received upon the sale, exchange or other taxable disposition and (ii) the U.S. Holder’s adjusted tax basis in such common shares. Capital gain or loss recognized upon a sale, exchange or other taxable disposition of the Corporation’s common shares will generally be long-term capital gain or loss if the U.S. Holder’s holding period with respect to such common shares disposed of is more than one year at the time of the sale, exchange or other taxable disposition. The deductibility of capital losses is subject to limitations.
114
Passive Foreign Investment Company Rules
Certain adverse U.S. federal income tax rules generally apply to a U.S. person that owns or disposes of stock in a non-U.S. corporation that is treated as a passive foreign investment company (“PFIC”). In general, a non-U.S. corporation will be treated as a PFIC for any taxable year during which, after applying relevant look-through rules with respect to the income and assets of subsidiaries, either (i) 75% or more of the non-U.S. corporation’s gross income is passive income, or (ii) 50% or more of the average value of the non-U.S. corporation’s assets produce or are held for the production of passive income. Special rules apply where a non-U.S. corporation owns, directly or indirectly, at least 25% (by value) of the shares of another corporation (a “lower-tier corporation”). For purposes of determining whether the Corporation is a PFIC, it will be treated as if it held its proportionate share of the assets of any lower-tier corporation and received directly its proportionate share of the income of any lower-tier corporation.
For purposes of the PFIC rules, and subject to certain exceptions, passive income generally includes dividends, interest, certain rents and royalties, and the excess of gains over losses from certain commodities transactions, including transactions involving oil and gas. However, gains and losses from commodities transactions generally are excluded from the definition of passive income if (i) such gains or losses are derived by a non-U.S. corporation in the active conduct of a commodity business, and (ii) “substantially all” of such corporation’s business is as an active producer, processor, merchant or handler of commodities of like kind (the “active commodities business exclusion”).
The Corporation may be a PFIC currently and in future tax years, and may have been a PFIC for prior tax years. PFIC classification is factual in nature, generally cannot be determined until the close of the taxable year in question, and is determined annually. Thus, there can be no assurance regarding the Corporation’s PFIC status for the current taxable year, for any past taxable years, or for any future taxable years.
A U.S. Holder will be required to file IRS Form 8621 if it holds the Corporation’s common shares in any year in which it is classified as a PFIC. In addition, the following U.S. federal income tax consequences generally will apply to a U.S. Holder of the Corporation’s common shares if the Corporation is treated as a PFIC:
Distributions.Distributions made by the Corporation with respect to its common shares, to the extent such distributions are treated as “excess distributions” pursuant to Section 1291 of the Code, must be allocated ratably to each day of the U.S. Holder’s holding period for such common shares. The amounts allocated to the taxable year during which the distribution is made, and to any taxable years in such U.S. Holder’s holding period which are prior to the first taxable year in which the Corporation is treated as a PFIC, are included in such U.S. Holder’s gross income as ordinary income for the taxable year of the distribution. The amount allocated to each other taxable year is taxed as ordinary income in the taxable year of the distribution at the highest tax rate in effect for the U.S. Holder in that other taxable year and is subject to an interest charge at the rate applicable to underpayments of tax. Any distribution made by the Corporation that does not constitute an excess distribution would be treated in the manner described under “Ownership and Disposition of the Corporation’s Common Shares — Distributions,” above.
Dispositions.The entire amount of any gain realized upon the U.S. Holder’s disposition of the Corporation’s common shares generally will be treated as an excess distribution made in the taxable year during which such disposition occurs, with the cons0equences described above.
Elections.In general, the adverse U.S. federal income tax consequences of holding stock of a PFIC described above may be mitigated if a U.S. shareholder of the PFIC is able to, and timely makes, a valid qualified electing fund (“QEF”) election with respect to the PFIC or a valid mark-to-market election with respect to the stock of the PFIC. U.S. Holders should be aware that there can be no assurance that the Corporation will supply U.S. Holders with the information and statements that such U.S. Holders require to make a QEF election under Section 1295 of the Code.
115
U.S. Holders should consult their own tax advisors as to the tax consequences of owning and disposing of stock in a PFIC, including the availability of any elections that may mitigate the adverse U.S. federal income tax consequences of holding stock of a PFIC.
Surtax on Unearned Income
For tax years beginning after December 31, 2012, certain U.S. persons, including individuals, estates and trusts, will be subject to an additional 3.8% Medicare tax on “net investment income.” Investment income generally includes passive income such as interest, dividends, annuities, royalties, rents, and capital gains. Net investment income would be reduced by properly allocable deductions to such income.
Information Reporting and Backup Withholding Tax
Dividend payments made with respect to the Corporation’s common shares and proceeds from the sale, exchange or other disposition of common shares may be subject to information reporting requirements, and to possible U.S. backup withholding (currently at a rate of 28%). In general, backup withholding will apply with respect to reportable payments made to a U.S. Holder unless (i) the U.S. Holder is a corporation or other exempt recipient and, if required, demonstrates such exemption, or (ii) the U.S. Holder furnishes the payor with a taxpayer identification number on IRS Form W-9 in the manner required, certifies under penalty of perjury that such U.S. Holder is not currently subject to backup withholding and otherwise complies with the backup withholding requirements.
Backup withholding is not an additional tax. Rather, the amount of any backup withholding imposed on a payment to a holder will be allowed as a refund or a credit against such holder’s U.S. federal income tax liability, provided that the required information is furnished to the IRS.
Additional Reporting Requirements
Recently-enacted U.S. tax legislation generally requires a U.S. individual to report to the IRS certain interests owned by such individual in stock issued by a non-U.S. person (such as the Corporation’s common shares), if the aggregate value of all such interests exceeds $50,000. This reporting requirement is subject to certain exceptions (including an exception for stock held in custodial accounts maintained by a U.S. financial institution). Prior to filing their annual income tax returns, U.S. Holders should consult their tax advisors regarding this reporting requirement.
THE ABOVE SUMMARY IS NOT INTENDED TO CONSTITUTE A COMPLETE ANALYSIS OF ALL TAX CONSIDERATIONS APPLICABLE TO U.S. HOLDERS WITH RESPECT TO THE OWNERSHIP AND DISPOSITION OF THE CORPORATION’S COMMON SHARES. U.S. HOLDERS SHOULD CONSULT THEIR OWN TAX ADVISORS AS TO THE TAX CONSIDERATIONS APPLICABLE TO THEM IN THEIR PARTICULAR CIRCUMSTANCES.
10.F. Dividends and paying agents
Not applicable.
10.G. Statement by experts
Not applicable.
10.H. Documents on display
All documents referenced in this Annual Report on Form 20-F concerning the Corporation may be examined during regular business hours of the Corporation at the principal office address of the Corporation at 36 Toronto Street, Suite 1000, Toronto, Ontario M5C 2C5.
116
The Corporation has filed with the Commission this Annual Report on Form 20-F, including exhibits, under the Exchange Act.
You may read and copy all or any portion of the Annual Report of other information in our files in the Commission’s public reference room at 100 F. Street, NE, Room 1580, Washington, D.C. 20549. You may request copies of these documents upon payment of a duplicating fee, by writing to the Commission. Please call the Commission at 1-800-SEC-0330 for further information on the operation of the public reference rooms.
10.I. Subsidiary Information
Not applicable.
ITEM 11. QUANTITATIVE AND QUALITATIVE DISCLOSURES ABOUT MARKET RISK
See “Item 5. Operating and Financial Review and Prospects.”
ITEM 12. DESCRIPTION OF SECURITIES OTHER THAN EQUITY SECURITIES
None.
PART II
ITEM 13. DEFAULTS, DIVIDEND ARREARAGES AND DELINQUENCIES
Not applicable.
ITEM 14. MATERIAL MODIFICATIONS TO THE RIGHTS OF SECURITYHOLDERS AND USE OFPROCEEDS
Not applicable.
ITEM 15. CONTROLS AND PROCEDURES
Disclosure Controls and Procedures
Disclosure controls and procedures are designed to provide reasonable assurance that all relevant information is gathered and reported to senior management, including the Corporation’s Chief Executive Officer and Chief Financial Officer, on a timely basis so that appropriate decisions can be made regarding public disclosure.
As of the end of the period covered by this Annual Report on Form 20-F, management of the Corporation, with the participation of the Chief Executive Officer and the Chief Financial Officer, evaluated the effectiveness of the Corporation’s disclosure controls and procedures as required by applicable United States and Canadian securities laws and regulations. Based on that evaluation, the Chief Executive Officer and the Chief Financial Officer have concluded that, because various reports were not timely filed or furnished to the Commission, as of the end of the period covered by this Annual Report, the Corporation’s disclosure controls and procedures were not effective to provide reasonable assurance that information required to be disclosed in the Corporation’s annual filings and interim filings and other reports filed or submitted is recorded, processed, summarized and reported within time periods specified and that material information is accumulated and communicated to management of the Corporation, including the Chief Executive Officer and the Chief Financial Officer, as appropriate to allow timely decisions regarding required disclosure. As a result, management is instituting procedures to ensure the reports the Corporation is required to furnish or file in the U.S. in the future are timely furnished or filed simultaneously with reports that the Corporation files in Canada.
117
Management’s Annual Report on Internal Control Over Financial Reporting
Management is responsible for establishing and maintaining adequate internal control over financial reporting and has designed such internal control over financial reporting to provide reasonable assurance regarding the reliability of financial reporting and preparation of financial statements for external purposes in accordance with IFRS.
In designing and evaluating the Corporation’s internal control over financial reporting, management recognizes that any controls and procedures, no matter how well designed and operated, can provide only reasonable assurance of achieving their objectives and management necessarily applies its reasonable judgment in evaluating the cost-benefit relationship of possible controls and procedures. Because of its inherent limitations, internal control over financial reporting may not prevent or detect misstatements.
Management assessed the effectiveness of the Corporation’s internal control over financial reporting as of April 30, 2012. In making this assessment, management used the criteria set forth by the Committee of Sponsoring Organizations of the Treadway Commission in Internal Control - Integrated Framework for Smaller Public Companies. Based on this assessment, management believes that, as of April 30, 2012, the Corporation’s internal control over financial reporting was effective based on those criteria.
Attestation Report of the Registered Public Accounting Firm
This Annual Report on Form 20-F does not include an attestation report of the Corporation’s registered public accounting firm regarding internal control over financial reporting. Management’s report was not subject to attestation by the registered public accounting firm because the Corporation is a non-accelerated filer.
Changes in Internal Control Over Financial Reporting
No changes in the Corporation’s internal controls or other factors that have materially affected, or are reasonably likely to materially affect, these controls have occurred during the year ended April 30, 2012.
ITEM 16. [RESERVED]
ITEM 16A. AUDIT COMMITTEE FINANCIAL EXPERT
The board of directors has determined that Mr. Clow is an audit committee financial expert as defined in Form 20-F.
ITEM 16B. CODE OF ETHICS
The Corporation has adopted a code of ethics within the meaning of such term as it is used in Form 20-F. The code is available on the Corporation’s website at www.bridgeportventures.net/information/code-of-ethics.
ITEM 16C. PRINCIPAL ACCOUNTANT FEES AND SERVICES
McGovern, Hurley, Cunningham, LLP was the Corporation’s independent registered chartered accountants for fiscal years ended April 30, 2012 and 2011. The chart below sets forth the total amount billed to the Corporation by McGovern, Hurley, Cunningham, LLP for services performed and breaks down these amounts by category of service:
| Principal Accountant | Billed during the year | Billed during the year | |
| Fees and Services | ended April 30, 2012 | ended April 30, 2011 | |
| Audit fees | $90,000 | $142,500 | |
| Audit Related fees | $Nil | $Nil | |
| Tax Fees | $4,000 | $4,000 | |
| All Other Fees | $Nil | $Nil |
118
“Audit Fees” are the aggregate fees billed for the audit of the Corporation’s consolidated annual financial statements, reviews of prospectus disclosures and interim financial statements, attestation services that are provided in connection with statutory and regulatory filings or engagements, assistance in responding to comment letters from securities regulatory bodies and consultations with our management as to accounting treatment of transactions or events and/or the actual or potential impact of final or proposed rules, standards or interpretation by the securities regulatory authorities, accounting standard setting bodies or other regulatory or standard setting bodies.
“Tax Fees” are fees for professional services rendered for tax compliance and tax advice on actual or contemplated transactions.
Audit committee’s pre-approval policies and procedures
The audit committee engages the independent registered chartered accountants to audit the financial statements, and approves all audit services, audit-related services, tax services and other services provided by the auditors. Any services provided by the auditors that are not specifically included within the scope of the audit must be pre-approved by the audit committee prior to any engagement. The audit committee is permitted to approve certain fees for audit-related services, tax services and other services pursuant to ade minimisexception before the completion of the engagement. Of the total aggregate fees paid by the Corporation to its accountants during the fiscal year ended April 30, 2012, 4.6% of the aggregate fees, were approved by the Audit Committee pursuant to thede minimisexception provided by Section (c)(7)(i)(C) of Rule 2-01 of Regulation S-X.
ITEM 16D. EXEMPTIONS FROM THE LISTING STANDARDS FOR AUDIT COMMITTEES
Not applicable.
ITEM 16E. PURCHASES OF EQUITY SECURITIES BY THE ISSUER AND AFFILIATEDPURCHASERS
Not applicable.
ITEM 16F. CHANGE IN REGISTRANT’s CERTIFYING ACCOUNTANT
Not applicable.
ITEM 16G. CORPORATE GOVERNANCE
Not applicable.
ITEM 16H. MINE SAFETY DISCLOSURE
As of the date hereof, the Corporation has nothing to disclose in response to the required information concerning mine safety violations or other regulatory matters under Section 1503(a) of the Dodd-Frank Wall Street Reform and Consumer Protection Act.
119
PART III
ITEM 17. FINANCIAL STATEMENTS
| BRIDGEPORT VENTURES INC. |
| CONSOLIDATED FINANCIAL STATEMENTS |
| FOR THE YEARS ENDED |
| APRIL 30, 2012 AND 2011 |
| (EXPRESSED IN CANADIAN DOLLARS) |
120
Management's Responsibility for
Consolidated Financial Statements
The accompanying audited annual consolidated financial statements of Bridgeport Ventures Inc. (the "Company") are the responsibility of management and the Board of Directors.
The audited annual consolidated financial statements have been prepared by management, on behalf of the Board of Directors, in accordance with the accounting policies disclosed in the notes to the audited annual consolidated financial statements. Where necessary, management has made informed judgments and estimates in accounting for transactions which were not complete at the statement of financial position date. In the opinion of management, the audited annual consolidated financial statements have been prepared within acceptable limits of materiality and are in compliance with all applicable International Financial Reporting Standards.
Management has established systems of internal control over the financial reporting process, which are designed to provide reasonable assurance that relevant and reliable financial information is produced.
The Board of Directors is responsible for reviewing and approving the audited annual consolidated financial statements together with other financial information of the Company and for ensuring that management fulfills its financial reporting responsibilities. An Audit Committee assists the Board of Directors in fulfilling this responsibility. The Audit Committee meets with management to review the financial reporting process and the audited annual consolidated financial statements together with other financial information of the Company. The Audit Committee reports its findings to the Board of Directors for its consideration in approving the audited annual consolidated financial statements together with other financial information of the Company for issuance to the shareholders.
Management recognizes its responsibility for conducting the Company’s affairs in compliance with established financial standards, and applicable laws and regulations, and for maintaining proper standards of conduct for its activities.
| (signed)"Shastri Ramnath" | (signed)"Carmelo Marrelli" |
| Shastri Ramnath | Carmelo Marrelli |
| President and Chief Executive Officer | Chief Financial Officer |
| Toronto, Canada | |
| July 18, 2012 | |
121
![]()
REPORT OF INDEPENDENT REGISTERED CHARTERED ACCOUNTANTS
To the Shareholders of Bridgeport Ventures Inc.
We have audited the accompanying consolidated financial statements of Bridgeport Ventures Inc.and its subsidiaries, which comprise the consolidated statements of financial position as at April 30, 2012, April 30, 2011 and May 1, 2010, and the consolidated statements of loss and comprehensive loss, consolidated statements of cash flows, and consolidated statements of changes in equity for the years ended April 30, 2012 and 2011, and a summary of significant accounting policies and other explanatory information.
Management's Responsibility for the Consolidated Financial Statements
Management is responsible for the preparation and fair presentation of these consolidated financial statements in accordance with International Financial Reporting Standards as issued by the International Accounting Standards Board and for such internal control as management determines is necessary to enable the preparation of consolidated financial statements that are free from material misstatement, whether due to fraud or error.
Auditor’s Responsibility
Our responsibility is to express an opinion on these consolidated financial statements based on our audits. We conducted our audits in accordance with Canadian generally accepted auditing standards and the standards of the Public Company Accounting Oversight Board (United States). Those standards require that we plan and perform the audit to obtain reasonable assurance about whether the consolidated financial statements are free from material misstatement. Canadian generally accepted auditing standards require that we comply with ethical requirements.
An audit involves performing procedures to obtain audit evidence about the amounts and disclosures in the consolidated financial statements. The procedures selected depend on the auditor's judgment, including the assessment of the risks of material misstatement of the consolidated financial statements, whether due to fraud or error. In making those risk assessments, the auditor considers internal control relevant to the entity's preparation and fair presentation of the consolidated financial statements in order to design audit procedures that are appropriate in the circumstances, but not for the purpose of expressing an opinion on the effectiveness of the entity's internal control. An audit also includes evaluating the appropriateness of accounting policies used and the reasonableness of accounting estimates made by management, as well as evaluating the overall presentation of the consolidated financial statements.
We believe that the audit evidence we have obtained is sufficient and appropriate to provide a basis for our audit opinion.
Opinion
In our opinion, the consolidated financial statements present fairly, in all material respects, the financial position of Bridgeport Ventures Inc. and its subsidiaries as at April 30, 2012, April 30, 2011 and May 1, 2010, and their financial performance and cash flows for the years ended April 30, 2012 and April 30, 2011 in accordance with International Financial Reporting Standards as issued by the International Accounting Standards Board.
McGOVERN, HURLEY, CUNNINGHAM, LLP
/s/ McGOVERN, HURLEY, CUNNINGHAM, LLP
Chartered Accountants
Licensed Public Accountants
TORONTO, Canada
July 18, 2012
![]()
122
| Bridgeport Ventures Inc. |
| Consolidated Statements of Financial Position |
| (Expressed in Canadian dollars) |
| As at | As at | As at | ||||||
| April 30, | April 30, | May 1, | ||||||
| 2012 | 2011 | 2010 | ||||||
| (note 21) | (note 21) | |||||||
| |||||||||
ASSETS | |||||||||
| |||||||||
Current assets | |||||||||
Cash and cash equivalents (note 7) | $ | 17,810,583 | $ | 22,870,894 | $ | 11,137,382 | |||
Amounts receivable and other assets (note 8) | 160,455 | 328,637 | 130,342 | ||||||
Available-for-sale investments (note 9) | 24,250 | 280,000 | - | ||||||
Total current assets | 17,995,288 | 23,479,531 | 11,267,724 | ||||||
| |||||||||
Interest in exploration properties and deferred exploration expenditures (note 9) | 4,208,534 | 7,578,011 | 3,416,271 | ||||||
Equipment (note 10) | 17,055 | 42,902 | 26,007 | ||||||
Total assets | $ | 22,220,877 | $ | 31,100,444 | 14,710,002 | ||||
| |||||||||
EQUITY AND LIABILITIES | |||||||||
| |||||||||
Current liabilities | |||||||||
Amounts payable and other liabilities (notes 11 and 17) | $ | 97,233 | $ | 1,046,868 | $ | 325,079 | |||
| |||||||||
Equity | |||||||||
Share capital (note 12) | 31,364,501 | 31,364,501 | 11,798,967 | ||||||
Reserves | 8,089,028 | 7,999,728 | 4,697,259 | ||||||
Accumulated other comprehensive (loss) income | (3,875 | ) | 175,000 | - | |||||
Accumulated deficit | (17,326,010 | ) | (9,485,653 | ) | (2,111,303 | ) | |||
Total equity | 22,123,644 | 30,053,576 | 14,384,923 | ||||||
Total equity and liabilities | $ | 22,220,877 | $ | 31,100,444 | 14,710,002 |
The accompanying notes to the consolidated financial statements are an integral part of these statements.
Nature of operations and going concern (note 1)
Contingencies and commitments (notes 9 and 20)
Approved on behalf of the Board:
(Signed) "Hugh Snyder", Director
(Signed) "Graham Clow", Director
123
| Bridgeport Ventures Inc. |
| Consolidated Statements of Loss and Comprehensive Loss |
| (Expressed in Canadian dollars) |
| 2012 | 2011 | ||||
For the year ended April 30, | (note 21) | |||||
| ||||||
Operating expenses | ||||||
General and administrative (note 16) | $ | 2,382,791 | $ | 3,307,037 | ||
Total general and administrative expenses | (2,382,791 | ) | (3,307,037 | ) | ||
Interest income | 257,151 | 153,566 | ||||
Gain on sale of available-for-sale investment (note 9(a)) | 111,182 | - | ||||
Foreign exchange gain (loss) | 18,471 | (6,998 | ) | |||
Write-off of exploration property interests (note 9) | (5,171,214 | ) | - | |||
Net loss before tax | (7,167,201 | ) | (3,160,469 | ) | ||
Deferred income tax (expense) recovery | (25,000 | ) | 25,000 | |||
Net loss from continuing operations | (7,192,201 | ) | (3,135,469 | ) | ||
Net loss from discontinued operation(note 6) | (1,194,061 | ) | (4,238,881 | ) | ||
Net loss for the year | (8,386,262 | ) | (7,374,350 | ) | ||
| ||||||
Net loss from continuing operations | (7,192,201 | ) | (3,135,469 | ) | ||
Reclassification of net realized (loss) on available-for-sale investment,net of tax | (175,000 | ) | - | |||
Unrealized (loss) gain on available-for-sale investment, net of tax of $nil (2011-$25,000) (note 9(a)) | (3,875 | ) | 175,000 | |||
Net loss and comprehensive loss for the year from continuing operations | (7,371,076 | ) | (2,960,469 | ) | ||
Net loss and comprehensive loss for the year from discontinued operation(note 6) | (1,194,061 | ) | (4,238,881 | ) | ||
Net loss and comprehensive loss for the year | $ | (8,565,137 | ) | $ | (7,199,350 | ) |
Basic and diluted net loss per share - continuing operations(note 13) | $ | (0.14 | ) | $ | (0.09 | ) |
Basic and diluted net loss per share - discontinued operation(note 13) | $ | (0.02 | ) | $ | (0.12 | ) |
Basic and diluted net loss per share - total(note 13) | $ | (0.17 | ) | $ | (0.20 | ) |
Weighted average number of common shares outstanding-basic and diluted | 50,579,600 | 36,402,004 |
The accompanying notes to the consolidated financial statements are an integral part of these statements.
124
| Bridgeport Ventures Inc. |
| Consolidated Statements of Cash Flows |
| (Expressed in Canadian dollars) |
| 2012 | 2011 | ||||
For the year ended April 30, | (note 21) | |||||
| ||||||
Operating activities | ||||||
Net loss for the year from continuing operations | $ | (7,192,201 | ) | $ | (3,135,469 | ) |
Adjustments for: | ||||||
Amortization | 6,241 | 3,606 | ||||
Share-based payments | 635,205 | 1,352,186 | ||||
Gain on sale of investment | (111,182 | ) | - | |||
Deferred income tax expense (recovery) | 25,000 | (25,000 | ) | |||
Write-off of exploration property interests | 5,171,214 | - | ||||
Non-cash working capital items: | ||||||
Amounts receivable and other assets | (60,961 | ) | (215,935 | ) | ||
Amounts payable and other liabilities | (147,421 | ) | (50,356 | ) | ||
Cash flows from discontinued operation (note 6) | 16,882 | (65,051 | ) | |||
Net cash used in operating activities | (1,657,223 | ) | (2,136,019 | ) | ||
| ||||||
Investing activities | ||||||
Expenditure on exploration properties | (3,147,106 | ) | (1,034,826 | ) | ||
Proceeds from sale of investment | 191,182 | - | ||||
Option payment received | - | 20,000 | ||||
Additions to equipment | - | (21,747 | ) | |||
Cash flows from discontinued operation (note 6) | (447,164 | ) | (1,434,713 | ) | ||
Net cash used in investing activities | (3,403,088 | ) | (2,471,286 | ) | ||
| ||||||
Financing activities | ||||||
Issue of securities | - | 17,702,600 | ||||
Share issue costs | - | (1,361,783 | ) | |||
Net cash provided by financing activities | - | 16,340,817 | ||||
| ||||||
Net change in cash and cash equivalents | (5,060,311 | ) | 11,733,512 | |||
Cash and cash equivalents, beginning of year | 22,870,894 | 11,137,382 | ||||
Cash and cash equivalents, end of year | $ | 17,810,583 | $ | 22,870,894 | ||
Common shares issued pursuant to acquisition of Nevada properties | - | 5,175,000 | ||||
Warrants issued as share issuance costs | - | 380,428 | ||||
Value of warrants exercised | - | 100,144 | ||||
Value of warrants expired | - | 25,772 | ||||
Value of stock options expired | 545,905 | - | ||||
Change in accrued exploration property expenditures | (783,278 | ) | 753,208 | |||
Common shares received for interest in exploration property (note 9) | 28,125 | 80,000 |
The accompanying notes to the consolidated financial statements are an integral part of these statements.
125
| Bridgeport Ventures Inc. |
| Consolidated Statements of Changes in Equity |
| (Expressed in Canadian dollars) |
Equity attributable to shareholders | ||||||||||||||||||
| ||||||||||||||||||
| Reserves | |||||||||||||||||
| Accumulated | |||||||||||||||||
| Share | Share-based | other | Accumulated | ||||||||||||||
| capital | Warrants | payments | comprehensive income | deficit | Total | ||||||||||||
| ||||||||||||||||||
Balance, May 1, 2010 | $ | 11,798,967 | $ | 3,679,500 | $ | 1,017,759 | $ | - | $ | (2,111,303 | ) | $ | 14,384,923 | |||||
Public offering, net of costs | 13,885,090 | 2,003,127 | - | - | - | 15,888,217 | ||||||||||||
Exercise of warrants | 452,600 | - | - | - | - | 452,600 | ||||||||||||
Value of warrants exercised | 100,144 | (100,144 | ) | - | - | - | - | |||||||||||
Warrants expired | - | (25,772 | ) | 25,772 | - | - | - | |||||||||||
Acquisition of exploration properties | 5,175,000 | - | - | - | - | 5,175,000 | ||||||||||||
Step-up warrants issued | (47,300 | ) | 47,300 | - | - | - | - | |||||||||||
Share-based payments | ||||||||||||||||||
Officers and directors | - | - | 1,032,500 | - | - | 1,032,500 | ||||||||||||
Employee | - | - | 30,081 | - | - | 30,081 | ||||||||||||
Consultants | - | - | 289,605 | - | - | 289,605 | ||||||||||||
Unrealized gain on available-for-sale securities, net of tax | - | - | - | 175,000 | - | 175,000 | ||||||||||||
Net loss for the year | - | - | - | - | (7,374,350 | ) | (7,374,350 | ) | ||||||||||
| ||||||||||||||||||
Balance, April 30, 2011 | $ | 31,364,501 | $ | 5,604,011 | $ | 2,395,717 | $ | 175,000 | $ | (9,485,653 | ) | $ | 30,053,576 | |||||
The accompanying notes to the consolidated financial statements are an integral part of these statements.
126
| Bridgeport Ventures Inc. |
| Consolidated Statements of Changes in Equity (continued) |
| (Expressed in Canadian dollars) |
Equity attributable to shareholders | ||||||||||||||||||
| ||||||||||||||||||
| Reserves | |||||||||||||||||
| Accumulated | |||||||||||||||||
| Share | Share-based | other comprehensive | Accumulated | ||||||||||||||
| capital | Warrants | payments | income (loss) | deficit | Total | ||||||||||||
| ||||||||||||||||||
Balance, April 30, 2011 | $ | 31,364,501 | $ | 5,604,011 | $ | 2,395,717 | $ | 175,000 | $ | (9,485,653 | ) | $ | 30,053,576 | |||||
Share-based payments | ||||||||||||||||||
Officers and directors | - | - | 659,254 | - | - | 659,254 | ||||||||||||
Employee | - | - | 57,032 | - | - | 57,032 | ||||||||||||
Consultants | - | - | (81,081 | ) | - | - | (81,081 | ) | ||||||||||
Stock options expired | - | - | (545,905 | ) | - | 545,905 | - | |||||||||||
Loss on available-for-sale securities | - | - | - | (178,875 | ) | - | (178,875 | ) | ||||||||||
Net loss for the year | - | - | - | - | (8,386,262 | ) | (8,386,262 | ) | ||||||||||
Balance, April 30, 2012 | $ | 31,364,501 | $ | 5,604,011 | $ | 2,485,017 | $ | (3,875 | ) | $ | (17,326,010 | ) | $ | 22,123,644 | ||||
The accompanying notes to the consolidated financial statements are an integral part of these statements.
127
| Bridgeport Ventures Inc. |
| Notes to the Consolidated Financial Statements |
| Years Ended April 30, 2012 and 2011 |
| (Expressed in Canadian dollars) |
| 1. | Nature of operations and going concern |
Bridgeport Ventures Inc. (the “Company” or "Bridgeport") was incorporated under the laws of the Province of Ontario, Canada by Articles of Incorporation dated May 10, 2007. The Company is engaged in the acquisition, exploration and development of properties for the mining of precious and base metals. Bridgeport has operations in the United States and Canada. The Company is in the process of exploring its exploration properties for mineral resources and has not determined whether the properties contain economically recoverable reserves. The primary office of the Company is located at 36 Toronto St. Suite 1000, Toronto, Ontario, M5C 2C5.
The consolidated financial statements of the Company were reviewed by the Audit Committee and approved and authorized for issue by the Board of Directors on July 18, 2012.
The business of mining and exploring for minerals involves a high degree of risk and there can be no assurance that current exploration programs will result in profitable mining operations. The Company's mineral exploration property interests are subject to the risk of increases in taxes and royalties, renegotiation of contracts, currency exchange fluctuations and political uncertainty. The recoverability of the carrying value of exploration properties and the Company's continued existence is dependent upon the preservation of its interest in the underlying properties, the discovery of economically recoverable reserves, the achievement of profitable operations, or the ability of the Company to raise alternative financing, if necessary, or alternatively upon the Company's ability to dispose of its interests on an advantageous basis. Changes in future conditions could require material write-downs of the carrying values.
Although the Company has taken steps to verify title to the properties on which it is conducting exploration and in which it has an interest, in accordance with industry standards for the current stage of exploration of such properties, these procedures do not guarantee the Company's title. Property title may be subject to unregistered prior agreements and non-compliance with regulatory requirements. The Company's assets may also be subject to increases in taxes and royalties, renegotiations of contracts, currency exchange fluctuations and restrictions and political uncertainty.
These consolidated financial statements have been prepared on the basis of accounting principles applicable to a going concern, which assume that the Company will continue in operation for the foreseeable future and will be able to realize its assets and discharge its liabilities in the normal course of operations as they come due. The Company has incurred losses in the current and prior periods, with a net loss of $8,386,262 for the year ended April 30, 2012 and has an accumulated deficit of $17,326,010 to April 30, 2012 (April 30, 2011 - $9,485,653 and May 1, 2010 - $2,111,303). As at April 30, 2012, the Company had cash and cash equivalents of $17,810,583 and working capital of $17,898,055. Management of the Company believes that it has sufficient funds to pay its ongoing administrative expenses and to meet its liabilities for the ensuing twelve months as they fall due.
These consolidated financial statements do not reflect the adjustments to the carrying values of assets and liabilities and the reported expenses and consolidated statement of financial position classifications that would be necessary if the Company were unable to realize its assets and settle its liabilities as a going concern in the normal course of operations. Such adjustments could be material.
128
| Bridgeport Ventures Inc. |
| Notes to the Consolidated Financial Statements |
| Years Ended April 30, 2012 and 2011 |
| (Expressed in Canadian dollars) |
| 2. | Significant accounting policies |
| (a) | Basis of preparation and adoption of International Financial Reporting Standards ("IFRS") |
The Company prepares its financial statements in accordance with Canadian generally accepted accounting principles ("GAAP") as set out in the Handbook of the Canadian Institute of Chartered Accountants (“CICA Handbook”). In 2010, the CICA Handbook was revised to incorporate IFRS, and require publicly accountable enterprises to apply such standards effective for years beginning on or after January 1, 2011. Accordingly, the Company has commenced reporting on this basis with an adoption date of May 1, 2011 and a transition date of May 1, 2010. In the financial statements, the term “Canadian GAAP” refers to GAAP before the adoption of IFRS.
These are the Company’s first annual consolidated financial statements for the year ended April 30, 2012 to be presented in accordance with IFRS as issued by the International Accounting Standards Board ("IASB") effective for the year ended April 30, 2012. IFRS 1 First-Time Adoption of IFRS ("IFRS 1") has been applied and the impact of the transition from Canadian GAAP to IFRS is explained in note 21.
The accounting policies set out below have been applied consistently to all periods presented, including the opening consolidated statement of financial position at May 1, 2010 (note 21) for purposes of transition to IFRS.
| (b) | Basis of consolidation |
The consolidated financial statements incorporate the financial statements of Bridgeport Ventures Inc. and its subsidiaries. All intercompany transactions, balances, income and expenses are eliminated upon consolidation.
Subsidiaries are those entities which Bridgeport Ventures Inc. controls by having the power to govern the financial and operating policies. The existence and effect of potential voting rights that are currently exercisable or convertible are considered when assessing whether Bridgeport Ventures Inc. controls another entity. Subsidiaries are fully consolidated from the date on which control is obtained by Bridgeport and are de-consolidated from the date that control ceases.
The following entities have been consolidated within the consolidated financial statements:
| Country of incorporation | Principal activity | |
| Bridgeport Ventures Inc. | Canada | Parent company |
| Bridgeport Gold Inc.(1) | United States of America | Exploration company |
| Rio Condor Resources S.A.(2) | Chile | Exploration company |
(1) 100% owned by Bridgeport
(2) During the year ended April 30, 2012, the Company disposed of its 100% interest in Rio Condor Resources S.A. (see note 6)
| (c) | Foreign currency translation |
The functional currency, as determined by management, of Bridgeport and its subsidiaries (on comparative basis) is the Canadian dollar. For the purpose of the consolidated financial statements, the results and financial position are expressed in Canadian dollars.
Transactions in currencies other than the functional currency are translated into the functional currency using the exchange rates prevailing at the dates of the transactions. Foreign exchange gains and losses resulting from the settlement of such transactions and from the translation of monetary assets and liabilities denominated in foreign currencies at the period end exchange rates are recognised in the consolidated statement of loss and comprehensive loss. Non monetary items that are measured in terms of historical cost in a foreign currency are not retranslated.
129
| Bridgeport Ventures Inc. |
| Notes to the Consolidated Financial Statements |
| Years Ended April 30, 2012 and 2011 |
| (Expressed in Canadian dollars) |
| 2. | Significant accounting policies (continued) |
| (d) | Financial instruments |
The Company’s financial instruments consist of the following:
| Financial assets: | Classification: |
| Cash | Loans and receivables |
| Cash equivalents | FVTPL ("Fair value through profit and loss") |
| Available-for-sale investments | Available for sale |
| Amounts receivable | Loans and receivables |
| Financial liabilities: | Classification: |
| Amounts payable and other liabilities | Other financial liabilities |
FVTPL:
Financial assets and liabilities classified as FVTPL include financial assets and liabilities held for trading and financial assets and liabilities designated upon initial recognition as FVTPL. Fair value changes on financial assets and liabilities classified as FVTPL are recognized through the consolidated statement of comprehensive loss.
Loans and receivables:
Loans and receivables are financial assets with fixed or determinable payments that are not quoted in an active market. Such assets are initially recognized at fair value plus any directly attributable transaction costs. Subsequent to initial recognition, loans and receivables are measured at amortized cost using the effective interest method, less any impairment losses.
Available for sale:
Available-for-sale investments are non-derivative financial assets that are either designated in this category or not classed in any other categories. Available-for-sale investments are carried at fair value at initial recognition. Changes to the fair value of available-for-sale investments are recognized in other comprehensive income. When available-for-sale investments are sold or impaired, the accumulated fair value adjustments recognized in accumulated other comprehensive income are included in the statement of loss as "gains and losses from available-for-sale investments".
Other financial liabilities:
Other financial liabilities are recognized initially at fair value net of any directly attributable transaction costs. Subsequent to initial recognition, these financial liabilities are measured at amortized cost using the effective interest method. The effective interest method is a method of calculating the amortized cost of a financial liability and of allocating interest and any transaction costs over the relevant period. The effective interest rate is the rate that exactly discounts estimated future cash payments through the expected life of the financial liability or (where appropriate) to the net carrying amount on initial recognition.
Other financial liabilities are de-recognized when the obligations are discharged, cancelled or expired.
Impairment of financial assets:
Financial assets are assessed for indicators of impairment at the end of each reporting period. Financial assets are impaired when there is objective evidence that, as a result of one or more events that occurred after the initial recognition of the financial assets, the estimated future cash flows of the financial assets have been negatively impacted.
130
| Bridgeport Ventures Inc. |
| Notes to the Consolidated Financial Statements |
| Years Ended April 30, 2012 and 2011 |
| (Expressed in Canadian dollars) |
| 2. | Significant accounting policies (continued) |
| (d) | Financial instruments (continued) |
Financial instruments recorded at fair value:
Financial instruments recorded at fair value on the consolidated statements of financial position are classified using a fair value hierarchy that reflects the significance of the inputs used in making the measurements. The fair value hierarchy has the following levels:
Level 1 - valuation based on quoted prices (unadjusted) in active markets for identical assets or liabilities;
Level 2 - valuation techniques based on inputs other than quoted prices included in Level 1 that are observable for the asset or liability, either directly (i.e. as prices) or indirectly (i.e. derived from prices); and
Level 3 - valuation techniques using inputs for the asset or liability that are not based on observable market data (unobservable inputs).
Available-for-sale investments and cash equivalents are classified as Level 1 and Level 2 financial instruments respectively.
The carrying amount of financial assets is reduced by any impairment loss directly for all financial assets with the exception of amounts receivable, where the carrying amount is reduced through the use of an allowance account. When an amount receivable is considered uncollectible, it is written off against the allowance account. Subsequent recoveries of amounts previously written off are credited against the allowance account. Changes in the carrying amount of the allowance account are recognized in profit or loss.
As of April 30, 2012, April 30, 2011 and May 1, 2010, other than the available-for-sale investment and cash equivalents, none of the Company’s financial instruments are recorded at fair value on the consolidated statement of financial position based on their classification.
| (e) | Impairment of non-financial assets |
At the end of each reporting period, the Company reviews the carrying amounts of its non-financial assets with finite lives to determine whether there is any indication that those assets are impaired. Where such an indication exists, the recoverable amount of the asset is estimated. For the purpose of measuring recoverable amounts, assets are grouped at the lowest levels for which there are separately identifiable cash flows (cash-generating units or CGUs which includes building and equipment in the exploration and evaluation property). The recoverable amount is the higher of an asset’s fair value less costs to sell and value in use (being the present value of the expected future cash flows of the relevant CGU). An impairment loss is recognized for the amount by which the asset’s carrying amount exceeds its recoverable amount. The Company evaluates impairment losses for potential reversals when events or circumstances warrant such consideration.
| (f) | Exploration and evaluation expenditures |
The Company is in the exploration stage with respect to its investment in exploration properties and accordingly follows the practice of capitalizing all costs relating to the acquisition of, exploration for and development of its interest in properties. Such costs include, but are not exclusive to, geological, geophysical studies, exploratory drilling and sampling. The costs incurred pre-acquisition of right to explore are expensed. The aggregate costs related to abandoned exploration properties are charged to operations at the time of any abandonment or when it has been determined that there is evidence of a permanent impairment. An impairment charge relating to an exploration property is subsequently reversed when new exploration results or actual or potential proceeds on sale or farmout of the property result in a revised estimate of the recoverable amount but only to the extent that this does not exceed the original carrying value of the property that would have resulted if no impairment had been recognized.
131
| Bridgeport Ventures Inc. |
| Notes to the Consolidated Financial Statements |
| Years Ended April 30, 2012 and 2011 |
| (Expressed in Canadian dollars) |
| 2. | Significant accounting policies (continued) |
| (f) | Exploration and evaluation expenditures (continued) |
The recoverability of amounts shown for interest in exploration properties is dependent upon the discovery of economically recoverable reserves, the ability of the Company to obtain financing to complete development of the properties, and on future production or proceeds of disposition.
The carrying value is reduced by option proceeds received until such time as the property cost and deferred expenditures are reduced to nominal amounts. The Company recognizes in income costs recovered on exploration properties when amounts received or receivable are in excess of the carrying amount.
All capitalized exploration and evaluation expenditures are monitored for indications of impairment. Where a potential impairment is indicated, assessments are performed for each area of interest. To the extent that exploration expenditure is not expected to be recovered, it is charged to the statement of loss. Exploration areas where reserves have been discovered, but require major capital expenditure before production can begin, are continually evaluated to ensure that commercial quantities of reserves exist or to ensure that additional exploration work is underway as planned.
| (g) | Cash and cash equivalents |
Cash and cash equivalents in the statements of financial position comprise cash at banks, and guaranteed investment certificates with an original maturity of three months or less, and which are readily convertible into a known amount of cash. The Company’s cash and cash equivalents are invested with major financial institutions in business accounts and guaranteed investment certificates that are available on demand by the Company for its programs. The Company does not invest in any asset-backed deposits/investments.
| (h) | Equipment |
Equipment is carried at cost, less accumulated amortization and accumulated impairment losses.
The cost of an item of equipment consists of the purchase price, any costs directly attributable to bringing the asset to the location and condition necessary for its intended use and an initial estimate of the costs of dismantling and removing the item and restoring the site on which it is located.
Amortization is recognized based on the cost of an item of equipment, less its estimated residual value, over its estimated useful life at the following rates:
| Detail | Percentage | Method |
| Computer equipment | 30% | Declining balance |
| Software | 20% | Declining balance |
| Office equipment | 20% | Declining balance |
| Structures | 20% | Declining balance |
| Machinery and equipment | 30% | Declining balance |
An asset's residual value, useful life and depreciation method are reviewed, and adjusted if appropriate, on an annual basis.
132
| Bridgeport Ventures Inc. |
| Notes to the Consolidated Financial Statements |
| Years Ended April 30, 2012 and 2011 |
| (Expressed in Canadian dollars) |
| 2. | Significant accounting policies (continued) |
| (i) | Provisions |
A provision is recognized when the Company has a present legal or constructive obligation as a result of a past event, it is probable that an outflow of economic benefits will be required to settle the obligation, and the amount of the obligation can be reliably estimated. If the effect is material, provisions are determined by discounting the expected future cash flows at a pre-tax rate that reflects current market assessments of the time value of money and, where appropriate, the risks specific to the liability.
A provision for onerous contracts is recognized when the expected benefits to be derived by the Company from a contract are lower than the unavoidable cost of meeting its obligations under the contract.
The Company had no material provisions at April 30, 2012, April 30, 2011 and May 1, 2010.
| (j) | Share based payment transactions |
The fair value of stock options granted to employees and non-employees is recognized as an expense over the vesting period using the graded vesting method with a corresponding increase in equity. An individual is classified as an employee when the individual is an employee for legal or tax purposes (direct employee) or provides services similar to those performed by a direct employee, including directors of the Company.
The fair value is measured at the grant date and recognized over the period during which the options vest. The fair value of the options granted is measured using the Black-Scholes option-pricing model, taking into account the terms and conditions upon which the options were granted. At each financial position reporting date, the amount recognized as an expense is adjusted to reflect the actual number of stock options that are expected to vest based on an estimate of the forfeiture rate. Unexercised expired stock options and warrants are transferred to deficit.
| (k) | Income taxes |
Income tax on the profit or loss for the periods presented comprises current and deferred tax. Income tax is recognized in statement of loss and comprehensive loss except to the extent that it relates to items recognized directly in equity, in which case it is recognized in equity.
Current tax expense is the expected tax payable on the taxable income for the year, using tax rates enacted or substantively enacted at period end, adjusted for amendments to tax payable with regards to previous years.
In general, deferred tax is recognized in respect of temporary differences arising between the tax bases of assets and liabilities and their carrying amounts in the financial statements unless such differences arise from goodwill or the initial recognition (other than in a business combination) of other assets or liabilities in a transaction that affects neither the taxable profit nor the accounting profit or loss. Deferred income tax is determined on a non-discounted basis using tax rates and laws that have been enacted or substantively enacted at the statement of financial position date and are expected to apply when the deferred tax asset or liability is settled. Deferred tax assets are recognized to the extent that it is probable that the assets can be recovered.
Deferred income tax is provided on temporary differences arising on investments in subsidiaries and associates, except, in the case of subsidiaries, where the timing of the reversal of the temporary difference is controlled by the Company and it is probable that the temporary difference will not reverse in the foreseeable future.
Deferred income tax assets and liabilities are presented as non-current. Deferred tax assets and liabilities are offset when there is a legally enforceable right to set off current tax assets against current tax liabilities and when they relate to income taxes levied by the same taxation authority and the Company intends to settle its current tax assets and liabilities on a net basis.
133
| Bridgeport Ventures Inc. |
| Notes to the Consolidated Financial Statements |
| Years Ended April 30, 2012 and 2011 |
| (Expressed in Canadian dollars) |
| 2. | Significant accounting policies (continued) |
| (l) | Restoration, rehabilitation and environmental obligations |
A legal or constructive obligation to incur restoration, rehabilitation and environmental costs may arise when environmental disturbance is caused by the exploration, development or ongoing production of a mineral property interest. Such costs are discounted to their net present value using a risk-free rate and are provided for and capitalized at the start of each project to the carrying amount of the asset, as soon as the obligation to incur such costs arises. Discount rates using a pretax rate that reflects the time value of money are used to calculate the net present value. These costs are charged against profit or loss over the economic life of the related asset, through amortization using either a unit-of-production or the straight-line method as appropriate. The related liability is adjusted for each period for the unwinding of the discount rate and for changes to the current market-based discount rate, amount or timing of the underlying cash flows needed to settle the obligation. Costs for restoration of subsequent site damage that is created on an ongoing basis during production are provided for at their net present values and charged against profits as extraction progresses.
The Company has no material restoration, rehabilitation and environmental costs at April 30, 2012, April 30, 2011 and May 1, 2010 as the disturbance to date is minimal.
| (m) | Loss per share |
The Company presents basic and diluted loss per share data for its common shares, calculated by dividing the loss attributable to common shareholders of the Company by the weighted average number of common shares outstanding during the period. Diluted loss per share is determined by adjusting the loss attributable to common shareholders and the weighted average number of common shares outstanding for the effects of all warrants and options outstanding that may add to the total number of common shares. The Company's diluted loss per share for all periods presented does not include the effect of stock options and warrants as they are anti-dilutive.
| (n) | Significant accounting judgments and estimates |
The preparation of these consolidated financial statements requires management to make certain estimates, judgments and assumptions that affect the reported amounts of assets and liabilities at the date of the financial statements and reported amounts of expenses during the reporting period. Actual outcomes could differ from these estimates. These consolidated financial statements include estimates that, by their nature, are uncertain. The impacts of such estimates are pervasive throughout the consolidated financial statements, and may require accounting adjustments based on future occurrences. Revisions to accounting estimates are recognized in the period in which the estimate is revised and future periods if the revision affects both current and future periods. These estimates are based on historical experience, current and future economic conditions and other factors, including expectations of future events that are believed to be reasonable under the circumstances.
Critical accounting estimates
Significant assumptions about the future that management has made that could result in a material adjustment to the carrying amounts of assets and liabilities, in the event that actual results differ from assumptions made, relate to, but are not limited to, the following:
- Assets' carrying values and impairment charges
In the determination of carrying values and impairment charges, management looks at the higher of recoverable amount or fair value less costs to sell in the case of assets and at objective evidence, significant or prolonged decline of fair value on financial assets indicating impairment. These determinations and their individual assumptions require that management make a decision based on the best available information at each reporting period.
134
| Bridgeport Ventures Inc. |
| Notes to the Consolidated Financial Statements |
| Years Ended April 30, 2012 and 2011 |
| (Expressed in Canadian dollars) |
| 2. | Significant accounting policies (continued) |
| (n) | Significant accounting judgments and estimates (continued) |
- Capitalization of exploration and evaluation costs
Management has determined that exploration and evaluation costs incurred during the year have future economic benefits and are economically recoverable. In making this judgement, management has assessed various sources of information including but not limited to the geologic and metallurgic information, history of conversion of mineral deposits to proven and probable mineral reserves, scoping and feasibility studies, proximity of operating facilities, operating management expertise and existing permits. See Note 9 for details of capitalized exploration and evaluation costs.
- Impairment of exploration properties and deferred exploration expenditures
While assessing whether any indications of impairment exist for interest in exploration properties and deferred exploration expenditures, consideration is given to both external and internal sources of information. Information the Company considers includes changes in the market, economic and legal environment in which the Company operates that are not within its control that could affect the recoverable amount of exploration and evaluation assets. Internal sources of information include the manner in which exploration and evaluation assets are being used or are expected to be used and indications of expected economic performance of the assets. Estimates include but are not limited to estimates of the discounted future after-tax cash flows expected to be derived from the Company's exploration properties, costs to sell the properties and the appropriate discount rate. Reductions in metal price forecasts, increases in estimated future costs of production, increases in estimated future capital costs, reductions in the amount of recoverable mineral reserves and mineral resources and/or adverse current economics can result in a write-down of the carrying amounts of the Company's exploration properties.
- Estimation of decommissioning and restoration costs and the timing of expenditure
Management has made the assumption of no material restoration, rehabilitation and environmental provisions, based on the facts and circumstances that existed during the periods presented. Decommissioning, restoration and similar liabilities are estimated based on the Company's interpretation of current regulatory requirements, constructive obligations and are measured at fair value. Fair value is determined based on the net present value of estimated future cash expenditures for the settlement of decommissioning, restoration or similar liabilities that may occur upon decommissioning of the mine. Such estimates are subject to change based on changes in laws and regulations and negotiations with regulatory authorities.
- Income taxes and recoverability of potential deferred tax assets
In assessing the probability of realizing income tax assets recognized, management makes estimates related to expectations of future taxable income, applicable tax planning opportunities, expected timing of reversals of existing temporary differences and the likelihood that tax positions taken will be sustained upon examination by applicable tax authorities. In making its assessments, management gives additional weight to positive and negative evidence that can be objectively verified. Estimates of future taxable income are based on forecasted cash flows from operations and the application of existing tax laws in each jurisdiction. The Company considers whether relevant tax planning opportunities are within the Company's control, are feasible, and are within management's ability to implement. Examination by applicable tax authorities is supported based on individual facts and circumstances of the relevant tax position examined in light of all available evidence. Where applicable tax laws and regulations are either unclear or subject to ongoing varying interpretations, it is reasonably possible that changes in these estimates can occur that materially affect the amounts of income tax assets recognized. Also, future changes in tax laws could limit the Company from realizing the tax benefits from the deferred tax assets. The Company reassesses unrecognized income tax assets at each reporting period.
135
| Bridgeport Ventures Inc. |
| Notes to the Consolidated Financial Statements |
| Years Ended April 30, 2012 and 2011 |
| (Expressed in Canadian dollars) |
| 2. | Significant accounting policies (continued) |
| (n) | Significant accounting judgments and estimates (continued) |
- Share-based payments
Management determines costs for share-based payments using market-based valuation techniques. The fair value of the market-based and performance-based share awards are determined at the date of grant using generally accepted valuation techniques. Assumptions are made and judgment used in applying valuation techniques. These assumptions and judgments include estimating the future volatility of the stock price, expected dividend yield, future employee turnover rates and future employee stock option exercise behaviors and corporate performance. Such judgments and assumptions are inherently uncertain. Changes in these assumptions affect the fair value estimates.
- Contingencies
Refer to Note 20.
| (o) | New accounting standards and interpretations |
Certain pronouncements were issued by the IASB or the IFRIC ("International Financial Reporting Interpretation Committee") that are mandatory for accounting periods after April 30, 2012 or later periods. Many are not applicable or do not have a significant impact to the Company and have been excluded from the table below. The following have not yet been adopted and are being evaluated to determine their impact on the Company.
(i) IFRS 9 – Financial instruments (“IFRS 9”) was issued by the IASB in October 2010 and will replace IAS 39 Financial Instruments: Recognition and Measurement (“IAS 39”). IFRS 9 uses a single approach to determine whether a financial asset is measured at amortized cost or fair value, replacing the multiple rules in IAS 39. The approach in IFRS 9 is based on how an entity manages its financial instruments in the context of its business model and the contractual cash flow characteristics of the financial assets. Most of the requirements in IAS 39 for classification and measurement of financial liabilities were carried forward unchanged to IFRS 9. The new standard also requires a single impairment method to be used, replacing the multiple impairment methods in IAS 39. IFRS 9 is effective for annual periods beginning on or after January 1, 2015.
(ii) IFRS 10 – Consolidated financial statements (“IFRS 10”) was issued by the IASB in May 2011. IFRS 10 is a new standard which identifies the concept of control as the determining factor in assessing whether an entity should be included in the consolidated financial statements of the parent company. Control is comprised of three elements: power over an investee; exposure to variable returns from an investee; and the ability to use power to affect the reporting entity’s returns. IFRS 10 is effective for annual periods beginning on or after January 1, 2013. Earlier adoption is permitted.
(iii) IFRS 11 – Joint arrangements (“IFRS 11”) was issued by the IASB in May 2011. IFRS 11 is a new standard which focuses on classifying joint arrangements by their rights and obligations rather than their legal form. Entities are classified into two groups: parties having rights to the assets and obligations for the liabilities of an arrangement, and rights to the net assets of an arrangement. Entities in the former case account for assets, liabilities, revenues and expenses in accordance with the arrangement, whereas entities in the latter case account for the arrangement using the equity method. IFRS 11 is effective for annual periods beginning on or after January 1, 2013. Earlier application is permitted.
(iv) IFRS 12 – Disclosure of interests in other entities (“IFRS 12”) was issued by the IASB in May 2011. IFRS 12 is a new standard which provides disclosure requirements for entities reporting interests in other entities, including joint arrangements, special purpose vehicles, and off balance sheet vehicles. IFRS 12 is effective for annual periods beginning on or after January 1, 2013. Earlier application is permitted.
136
| Bridgeport Ventures Inc. |
| Notes to the Consolidated Financial Statements |
| Years Ended April 30, 2012 and 2011 |
| (Expressed in Canadian dollars) |
| 2. | Significant accounting policies (continued) |
| (o) | New accounting standards and interpretations (continued) |
(v) IFRS 13 – Fair value measurement (“IFRS 13”) was issued by the IASB in May 2011. IFRS 13 is a new standard which provides a precise definition of fair value and a single source of fair value measurement considerations for use across IFRSs. The key points of IFRS 13 are as follows:
fair value is measured using the price in a principal market for the asset or liability, or in the absence of a principal market, the most advantageous market;
financial assets and liabilities with offsetting positions in market risks or counterparty credit risks can be measured on the basis of an entity’s net risk exposure;
disclosures regarding the fair value hierarchy has been moved from IFRS 7 to IFRS 13, and further guidance has been added to the determination of classes of assets and liabilities;
a quantitative sensitivity analysis must be provided for financial instruments measured at fair value;
a narrative must be provided discussing the sensitivity of fair value measurements categorised under Level 3 of the fair value hierarchy to significant unobservable inputs;
and information must be provided on an entity’s valuation processes for fair value measurements categorized under Level 3 of the fair value hierarchy.
IFRS 13 is effective for annual periods beginning on or after January 1, 2013. Earlier application is permitted.
(vi) IAS 1 – Presentation of financial statements (“IAS 1”) was amended by the IASB in June 2011 in order to align the presentation of items in other comprehensive income with US GAAP standards. Items in other comprehensive income will be required to be presented in two categories: items that will be reclassified into profit or loss and those that will not be reclassified. The flexibility to present a statement of comprehensive income as one statement or two separate statements of profit and loss and other comprehensive income remains unchanged. The amendments to IAS 1 are effective for annual periods beginning on or after July 1, 2012.
| 3. | Capital risk management |
The Company manages its capital with the following objectives:
to ensure sufficient financial flexibility to achieve the ongoing business objectives including funding of future growth opportunities, and pursuit of accretive acquisitions; and
to maximize shareholder return through enhancing the share value.
The Company monitors its capital structure and actively makes adjustments according to market conditions in an effort to meet its objectives given the current outlook of the business and industry in general. The Company may manage its capital structure by issuing new shares, repurchasing outstanding shares, adjusting capital spending, or disposing of assets. The capital structure is reviewed by management and the Board of Directors on an ongoing basis. As discussed in Note 1, the Company's ability to continue to carry out its planned exploration activities is uncertain and dependent upon the continued financial support of its shareholders and securing additional financing.
The Company manages capital through its financial and operational forecasting processes. The Company reviews its working capital and forecasts its future cash flows based on operating expenditures, and other investing and financing activities. The forecast is updated based on activities related to its mineral properties. Relevant information is provided to the Board of Directors of the Company.
The Company is not subject to any capital requirements imposed by a lending institution.
137
| Bridgeport Ventures Inc. |
| Notes to the Consolidated Financial Statements |
| Years Ended April 30, 2012 and 2011 |
| (Expressed in Canadian dollars) |
| 4. | Financial risk management |
The Company's activities expose it to a variety of financial risks: credit risk, liquidity risk and market risk (including interest rate, foreign currency risk and commodity and equity price risk). Financial risk management is carried out by the Company's management team with guidance from the Audit Committee and Board of Directors. There have been no changes in the risks, objectives, policies and procedures from the previous period.
(i) Credit risk
The Company's credit risk is primarily attributable to cash and cash equivalents and amounts receivable. Cash and cash equivalents consist of cash, high interest savings accounts and certificates of deposit at select Canadian financial institutions, from which management believes the risk of loss to be remote. Financial assets included in amounts receivable consist of goods and services tax and harmonized sales tax due from the Government of Canada and deposits with service providers. Amounts receivable are in good standing as of April 30, 2012. Management believes that the credit risk concentration with respect to the financial instruments included in cash and cash equivalents and amounts receivable is remote.
(ii) Liquidity risk
Liquidity risk is the risk that the Company will not have sufficient cash resources to meet its financial obligations as they come due. The Company’s liquidity and operating results may be adversely affected if its access to the capital market is hindered, whether as a result of a downturn in stock market conditions generally or matters specific to the Company. The Company generates cash flow primarily from its financing activities. As at April 30, 2012, the Company had cash and cash equivalents of $17,810,583 (April 30, 2011 - $22,870,894 and May 1, 2010 - $11,137,382) to settle current liabilities of $97,233 (April 30, 2011 - $1,046,868 and May 1, 2010 - $325,079). All of the Company's financial liabilities have contractual maturities of less than 30 days and are subject to normal trade terms. The Company regularly evaluates its cash position to ensure preservation and security of capital as well as liquidity. As discussed in Note 1, the Company’s ability to continually meet its obligations and carry out its planned exploration activities is uncertain and dependent upon the continued financial support of its shareholders and securing additional financing.
(iii) Market risk
Market risk is the risk of loss that may arise from changes in market factors such as interest rates, foreign exchange rates and commodity and equity prices.
(a) Interest rate risk
The Company has cash and cash equivalents and no interest-bearing debt. The Company's current policy is to invest excess cash in high interest savings accounts and investment-grade certificates of deposit issued by its Canadian financial institutions. The Company periodically monitors the investments it makes and is satisfied with the credit ratings of its Canadian financial institutions. Currently, the Company does not hedge against interest rate risk.
(b) Foreign currency risk
The Company's functional and reporting currency is the Canadian dollar and purchases are transacted in Canadian and US dollars and Chilean pesos. The Company funds certain operations, exploration and administrative expenses in Chile and the United States on a cash call basis using US dollar currency converted from select bank accounts held in Canada. The Company maintains US dollar bank accounts in Canada and the United Sates. The Company is subject to gains and losses from fluctuations in the US dollar and Chilean peso against the Canadian dollar. The Company had the following significant balances in foreign currencies:
138
| Bridgeport Ventures Inc. |
| Notes to the Consolidated Financial Statements |
| Years Ended April 30, 2012 and 2011 |
| (Expressed in Canadian dollars) |
| 4. | Financial risk management (continued) |
(iii) Market risk (continued)
(b) Foreign currency risk (continued)
| April 30 | April 30 | May 1 | ||||||
| 2012 | 2011 | 2010 | ||||||
| |||||||||
United States Dollars | |||||||||
Cash (Bank indebtedness) | $ | 24,862 | (1) | $ | (375,361 | )(1) | $ | 508,464 | (1) |
Amounts receivable and other assets | $ | 15,000 | (1) | $ | 1,082 | (1) | $ | - | (1) |
Amounts payable and other liabilities | $ | 1,958 | (1) | $ | 20,196 | (1) | $ | 82,208 | (1) |
| |||||||||
Chilean Peso | |||||||||
Amounts receivable and other assets | 30,118,500 | (2) | 112,182,936 | (2) | 17,138,310 | (2) | |||
Amounts payable and other liabilities | - | (2) | 199,755,213 | (2) | 10,568,652 | (2) |
(1) Denoted in United States Dollars: (April 30, 2012 - 1 United States Dollar = 0.9879 Canadian Dollars); (April 30, 2011 - 1 United States Dollar = 0.9464 Canadian Dollars); and (May 1, 2010 - 1 United States Dollar = 1.0158 Canadian Dollars)
(2) Denoted in Chilean Peso: (April 30, 2012 - 1 Chilean Peso = 0.002039 Canadian Dollars); (April 30, 2011 - 1 Chilean Peso = 0.00206 Canadian Dollars); and (May 1, 2010 - 1 Chilean Peso = 0.001957 Canadian Dollars)
(c) Price risk
The Company is exposed to price risk with respect to commodity and equity prices. Equity price risk is defined as the potential adverse impact on the Company's earnings due to movements in individual equity prices or general movements in the level of the stock market. Commodity price risk is defined as the potential adverse impact on earnings and economic value due to commodity price movements and volatilities. The Company closely monitors commodity prices, as they relate to gold and copper, individual equity movements, and the stock market to determine the appropriate course of action to be taken by the Company. As the Company's mineral properties are in the exploration stage, the Company does not hedge against commodity price risk. The Company's available-for-sale investment in Gondwana Gold Inc. ("Gondwana") and investment in Orsa Ventures Corp. ("Orsa") are subject to fair value fluctuations arising from changes in the equity and commodity markets.
Sensitivity analysis
Based on management's knowledge and experience of the financial markets, the Company believes the following movements are reasonably possible over a twelve month period:
(i) Cash equivalents are subject to floating interest rates. A 1% change in the interest rates with all other variables held constant, would result in a corresponding increase/decrease in interest income of approximately $177,000 based on the balance of cash equivalents at April 30, 2012.
139
| Bridgeport Ventures Inc. |
| Notes to the Consolidated Financial Statements |
| Years Ended April 30, 2012 and 2011 |
| (Expressed in Canadian dollars) |
| 4. | Financial risk management (continued) |
(iii) Market risk (continued)
Sensitivity analysis (continued)
(ii) The Company is exposed to foreign currency risk on fluctuations of financial instruments that are denominated in US dollars related to cash balances, amounts receivable and accounts payable and accrued liabilities. As at April 30, 2012, a plus or minus 5% change in the foreign exchange rate with all other variables held constant would decrease/increase the loss for the year ended April 30, 2012 and the reported equity as at April 30, 2012 by $4,202.
(iii) The Company's available-for-sale investments in the common shares of Gondwana and Orsa are subject to fair value fluctuations. As at April 30, 2012, a plus or minus 10% change in the bid price of the common shares of Gondwana and Orsa with all other variables held constant would decrease/increase the comprehensive loss for the year ended April 30, 2012 and the reported equity as at April 30, 2012 by $2,450.
| 5. | Categories of financial instruments |
| As at | As at | As at | |||||||
| April 30, | April 30, | May 1, | |||||||
| 2012 | 2011 | 2010 | |||||||
| Financial assets: | |||||||||
| Loans and receivables | |||||||||
| Cash | $ | 79,195 | $ | (365,965 | ) | $ | 981,301 | ||
| Amounts receivable | 61,513 | - | - | ||||||
| FVTPL - cash equivalents | 17,731,388 | 23,236,859 | 10,156,081 | ||||||
| Available for sale investments | 24,250 | 280,000 | - | ||||||
| Financial liabilities: | |||||||||
| Other financial liabilities | |||||||||
| Amounts payable and other liabilities | $ | 97,233 | $ | 1,046,868 | $ | 325,079 |
As at April 30, 2012, April 30, 2011 and May 1, 2010, the fair value of all the Company's financial instruments, other than available for sale investments and cash equivalents which are carried at fair value, approximates the carrying value, due to their short-term nature.
| 6. | Discontinued operation |
During the year ended April 30, 2012, the Company committed to a plan to pursue the sale of its subsidiary Rio Condor Resources S.A. ("Rio Condor") and discontinued this operation since it was no longer in the Company's commercial objectives. Consequently, the operating results and cash flows of Rio Condor have been presented distinctly. The Company sold the interests it owned in Rio Condor on March 31, 2012 for cash consideration of US$62,100 ($61,412). The Company recorded a gain on disposal of $59,657 in the consolidated financial statements during the year ended April 30, 2012.
140
| Bridgeport Ventures Inc. |
| Notes to the Consolidated Financial Statements |
| Years Ended April 30, 2012 and 2011 |
| (Expressed in Canadian dollars) |
| 6. | Discontinued operation (continued) |
The following tables summarize the additional financial information related to the discontinued operation as at April 30, 2012:
Statement of loss and comprehensive loss of the discontinued operation until the date of disposal of March 31, 2012:
| April 30, 2012 | Year ended | ||||
| (11 months | ) | April 30, 2011 | |||
General and administrative | $ | 16,079 | $ | 203,914 | ||
Total general and administrative expenses | (16,079 | ) | (203,914 | ) | ||
Write-off of equipment | (17,382 | ) | - | |||
Write-off of Rosario exploration property interests and related receivables | (1,175,229 | ) | (4,131,792 | ) | ||
Gain on disposition of Rio Condor | 59,657 | - | ||||
Foreign exchange loss | (45,028 | ) | 96,825 | |||
Net loss and comprehensive loss from discontinued operation | $ | (1,194,061 | ) | $ | (4,238,881 | ) |
Statement of cash flows from the discontinued operation:
| April 30, 2012 | Year ended | |||||
| (11 months | ) | April 30, 2011 | ||||
| Cash flows from operating activities | $ | 16,882 | $ | (65,051 | ) | |
| Cash flows from investing activities | (447,164 | ) | (1,434,713 | ) | ||
| $ | (430,282 | ) | $ | (1,499,764 | ) |
| 7. | Cash and cash equivalents |
| As at | As at | As at | |||||||
| April 30, | April 30, | May 1, | |||||||
| 2012 | 2011 | 2010 | |||||||
| Cash (bank indebtedness) | $ | 79,195 | $ | (365,965 | ) | $ | 981,301 | ||
| Cash equivalents | 17,731,388 | 23,236,859 | 10,156,081 | ||||||
| Total | $ | 17,810,583 | $ | 22,870,894 | $ | 11,137,382 |
141
| Bridgeport Ventures Inc. |
| Notes to the Consolidated Financial Statements |
| Years Ended April 30, 2012 and 2011 |
| (Expressed in Canadian dollars) |
| 8. | Amounts receivable and other assets |
| As at | As at | As at | |||||||
| April 30, | April 30, | May 1, | |||||||
| 2012 | 2011 | 2010 | |||||||
| Sales tax receivable - (Canada) | $ | 38,459 | $ | 48,787 | $ | 48,993 | |||
| Sales tax receivable - (Chile) (note 9(b)) | - | 230,784 | 16,586 | ||||||
| Amounts receivable | 61,513 | - | - | ||||||
| Prepaid expenses | 60,483 | 49,066 | 64,763 | ||||||
| $ | 160,455 | $ | 328,637 | $ | 130,342 |
| 9. | Interest in exploration properties and deferred exploration expenditures |
| Year Ended April 30, 2012 | ||||||||||||
| Nevada | McCart | Rosario | ||||||||||
| Properties | Township | Properties | ||||||||||
| (USA) | (Canada) | (Chile) | ||||||||||
| (f) | (a) | (b)(c)(d)(e) | Total | |||||||||
| Opening balance | $ | 6,430,690 | $ | 171,596 | $ | 975,725 | $ | 7,578,011 | ||||
| Acquisition | - | - | (94,701 | ) | (94,701 | ) | ||||||
| Exploration | 2,800,569 | 351 | 41,998 | 2,842,918 | ||||||||
| Salaries and benefits | - | 4,667 | - | 4,667 | ||||||||
| Option payment received | (18,000 | ) | (10,125 | ) | - | (28,125 | ) | |||||
| Write-off of exploration properties | (5,004,725 | ) | (166,489 | ) | (923,022 | ) | (6,094,236 | ) | ||||
| Ending balance | $ | 4,208,534 | $ | - | $ | - | $ | 4,208,534 | ||||
| Year Ended April 30, 2011 | ||||||||||||
| Nevada | McCart | Rosario | ||||||||||
| Properties | Township | Properties | ||||||||||
| (USA) | (Canada) | (Chile) | ||||||||||
| (f) | (a) | (b)(c)(d)(e) | Total | |||||||||
| Opening balance | $ | - | $ | 263,860 | $ | 3,152,411 | $ | 3,416,271 | ||||
| Acquisition | 5,175,000 | - | 170,855 | 5,345,855 | ||||||||
| Exploration | 1,255,690 | 7,736 | 1,784,251 | 3,047,677 | ||||||||
| Option payment received | - | (100,000 | ) | - | (100,000 | ) | ||||||
| Write-off of exploration properties | - | - | (4,131,792 | ) | (4,131,792 | ) | ||||||
| Ending balance | $ | 6,430,690 | $ | 171,596 | $ | 975,725 | $ | 7,578,011 | ||||
142
| Bridgeport Ventures Inc. |
| Notes to the Consolidated Financial Statements |
| Years Ended April 30, 2012 and 2011 |
| (Expressed in Canadian dollars) |
| 9. | Interest in exploration properties and deferred exploration expenditures (continued) |
(a) McCart Township
On November 11, 2008, the Company entered into an agreement to acquire a 100% interest in two mining claims (the “Claims”) located near McCart Township, Ontario. The Claims are subject to a 2% net smelter royalty (“NSR”). To acquire this interest, the Company is required to:
Make a cash payment of $5,000 (paid); and
Issue 150,000 common shares of the Company (issued and valued at $19,500).
Effective July 29, 2009, the Company issued an aggregate of 150,000 common shares in partial satisfaction of its obligations to acquire a 100% interest in the Claims. The value of the 150,000 common shares was calculated by applying the unit price of $0.13 pursuant to the initial public offering of the Company.
At anytime after the commencement of commercial production, the Company has the right to purchase 1% of the 2% NSR for $1,000,000.
During the year ended April 30, 2010, the Company acquired three additional mining claims located in the same Township subject to a 1% NSR (50% of which the Company has the right to purchase for $1,000,000), for cash consideration of $nil. Subsequent to the April 30, 2011, these three claims were cancelled.
On August 24, 2010, Bridgeport granted to Gondwana an option to acquire up to a 70% interest in the McCart Property. Gondwana could earn an initial 50% interest in the McCart Property by satisfying the following commitments:
(i) making an initial cash payment to Bridgeport in the amount of $20,000 (received);
(ii) issuing an aggregate of 1,050,000 common shares (400,000 issued) to Bridgeport in tranches over a three year period; and
(iii) incurring an aggregate of $400,000 in exploration expenditures on the McCart Property in tranches over a three year period.
Gondwana could earn an additional 20% interest in the McCart Property (for a total 70% interest) in the event it completes a bankable feasibility study within three years of earning its 50% interest.
On August 24, 2010, Bridgeport received $20,000 cash and 400,000 common shares of Gondwana in accordance with the terms of the Agreement. The 400,000 common shares received were valued at $80,000 on August 24, 2010 and $280,000 on April 30, 2011. During the year ended April 30, 2012, the 400,000 common shares of Gondwana were sold for cash proceeds of $191,182 resulting in a gain on disposal of $111,182.
On August 17, 2011, the Company signed an amending letter agreement (the "Amending Agreement") with Gondwana to extend the time by which the commitments must be satisfied until February 20, 2012 in exchange for an additional 25,000 Gondwana shares to be issued to Bridgeport.
On February 15, 2012, Gondwana terminated its option on the McCart property. As a result, the Company has taken possession of the property and decided to discontinue the exploration activities on the McCart Property. Accordingly, the Company wrote off capitalized costs of $166,489 during the year ended April 30, 2012.
On October 25, 2011, Bridgeport received 25,000 common shares of Gondwana in accordance with the terms of the Amending Agreement. The 25,000 common shares received were valued at $10,125 on October 25, 2011 based on the bid price on October 25, 2011. As of April 30, 2012, the bid price of Gondwana was $0.39 resulting in a unrealized loss of $375 which was recorded in other comprehensive loss for the year ended April 30, 2012. At April 30, 2012, the shares of Gondwana were valued at $9,750 using the bid price of the security.
143
| Bridgeport Ventures Inc. |
| Notes to the Consolidated Financial Statements |
| Years Ended April 30, 2012 and 2011 |
| (Expressed in Canadian dollars) |
| 9. | Interest in exploration properties and deferred exploration expenditures (continued) |
(b) Trillador Property
On July 5, 2010, the Company executed a letter of intent which provides that the Company would enter into an option agreement with an arm's length party to acquire a 100% interest in the Trillador property through its subsidiary, Rio Condor. Under the terms of the proposed agreement with the property owners, the Company would be required to pay US$1.5 million over five years in order to acquire a 100% interest in the Trillador property. This acquisition was royalty free.
On August 27, 2010, the Trillador letter of intent was modified, whereby US$25,000 was required on signing (paid) as an advance payment of the first installment of the option agreement price. This amendment allowed Rio Condor a 120 business day grace period. As of January 31, 2011 (“Date of Closing”) the option agreement was executed and payment of US$25,000 was made (completing the total amount of the first installment of US$50,000). The option agreement was subsequently finalized. Cash payments in the aggregate of US$1.5 million were due as follows:
| US$ | ||||||
| Date of Closing | $ | 25,000 | (paid)(1) | |||
| January 17, 2011 | 25,000 | (paid)(1) | ||||
| January 31, 2012 | 50,000 | (not paid) | ||||
| January 31, 2013 | 60,000 | |||||
| January 31, 2014 | 250,000 | |||||
| January 31, 2015 | 1,090,000 | |||||
| $ | 1,500,000 |
(1) US$50,000 Canadian equivalent equals $51,795.
During the year ended April 30, 2012, the Company decided to terminate the Trillador Property and Tamara Property option agreements and as a result, a total of $1,175,229 of exploration properties and deferred exploration expenditures and related receivables were written off during the year ended April 30, 2012.
(c) SOESMI Property
Pursuant to an agreement entered into on December 3, 2009, Rio Condor would have paid US$1,000,000 over three years to acquire a 100% interest in the SOESMI mining concessions, which are contiguous to the concessions comprising the Rosario Property. The SOESMI claim group was subject to a 2% NSR that could be purchased for US$1,000,000. US$75,000 ($79,020) was paid on closing. In addition, in accordance with the payment terms, a further US$50,000 ($52,590) was paid on June 3, 2010. Cash payments in the aggregate of US$1,000,000 were due as follows:
| US$ | ||||||
| Date of signing the agreement | $ | 75,000 | (paid) | |||
| June 3, 2010 | 50,000 | (paid) | ||||
| December 3, 2010 | 50,000 | (not paid) | ||||
| June 3, 2011 | 100,000 | (not paid) | ||||
| December 3, 2011 | 150,000 | (not paid) | ||||
| December 3, 2012 | 575,000 | |||||
| $ | 1,000,000 |
144
| Bridgeport Ventures Inc. |
| Notes to the Consolidated Financial Statements |
| Years Ended April 30, 2012 and 2011 |
| (Expressed in Canadian dollars) |
| 9. | Interest in exploration properties and deferred exploration expenditures (continued) |
(c) SOESMI Property (continued)
During the year ended April 30, 2011, the Company determined not to make the next option payment due in respect of the SOESMI property, and to allow its rights in respect of such property to lapse. As a result, the Company wrote off all costs associated with this project in the amount of $611,352.
(d) Simonetta Property
Pursuant to an agreement entered into on January 23, 2010, Rio Condor would have paid US$1,000,000 over four years to acquire a 100% interest in the Simonetta mining concessions, which are contiguous to the concessions comprising the Rosario Property. This acquisition was royalty free. US$30,000 ($30,782) was paid on closing. Cash payments in the aggregate of US$1,000,000 were due as follows:
| US$ | ||||||
| Date of signing the agreement | $ | 30,000 | (paid) | |||
| July 23, 2010 | 10,000 | (paid) | ||||
| January 23, 2011 | 65,000 | (not paid) | ||||
| January 23, 2012 | 150,000 | (not paid) | ||||
| January 23, 2013 | 245,000 | |||||
| January 23, 2014 | 500,000 | |||||
| $ | 1,000,000 |
The Company paid $10,359 (US$10,000) during the year ended April 30, 2011 relating to the Simonetta option agreement. Subsequent to the payment, through a letter and a public deed, both dated on February 7, 2011, Rio Condor provided notice to the owner of the Simonetta property that the payment due January 23, 2011 (US$65,000) and subsequent payments would not be made. As a result, Rio Condor's rights in respect of such property were forfeited and costs of $554,473 associated with the project were written off during the year ended April 30, 2011.
(e) Rosario Project
The Company had an option to pay US$10.4 million over a four year period to acquire a 100% interest in the properties known as the Rosario property (which includes the concessions known as the Rosario, Julia, Eliana I, Eliana II and Eliana III mining concessions) and the Tamara property. The Rosario property is subject to a 2% NSR which may be purchased for US$2 million. Tamara is royalty free. The Company was required to pay a total commission or management fee of US$500,000 over the same four year period. The vendors of Rosario and Eliana I were entitled to excavate a total of 6,000 tons per month from the property until the last payment is made.
The Company had focused its exploration efforts on the Rosario property, and based on the assay results, style of copper mineralization, and discontinuity of the zones, management decided that the property did not have the size potential for the Company to make a significant copper-gold discovery of 100 million tonnes or more. Accordingly, Bridgeport decided to terminate its rights to the Rosario, Eliana I, II and III, and Julia mining concessions, which decision was carried out by not making the November 5, 2010 property payment of US$720,000. As a result, Rio Condor's rights in respect of such properties were forfeited and costs of $2,965,967 associated with the project were written-off during the year ended April 30, 2011.
The Company had retained its rights to the Tamara property. During the year ended April 30, 2011, the Company paid $56,111 (US$50,000) pursuant to the agreement relating to the Tamara property. The Company was entitled to maintain its rights to the Tamara property by making the following cash payments:
145
| Bridgeport Ventures Inc. |
| Notes to the Consolidated Financial Statements |
| Years Ended April 30, 2012 and 2011 |
| (Expressed in Canadian dollars) |
| 9. | Interest in exploration properties and deferred exploration expenditures (continued) |
(e) Rosario Project (continued)
| Cash payments (US$) | ||||||
| November 5, 2009 | $ | 15,000 | (paid) | |||
| November 5, 2010 | 35,000 | (paid) | ||||
| November 5, 2011 | 50,000 | (not paid) | ||||
| November 5, 2012 | 70,000 | |||||
| November 5, 2013 | 230,000 | |||||
| $ | 400,000 | |||||
During the year ended April 30, 2012, the Company decided to terminate the Trillador Property and Tamara Property option agreements and as a result, a total of $1,175,229 of exploration properties and deferred exploration expenditures and a receivable related to Chile was written off for the year ended April 30, 2012. As a result, the payment due on November 5, 2011 was not made.
(f) Nevada Portfolio
On November 16, 2010, Bridgeport acquired from Fronteer Gold Inc. (“Fronteer”) a 100% interest in certain mineral properties and a 50% leasehold interest in one property, in Nevada, USA. The properties are subject to a NSR of up to 3%. On November 16, 2010, Bridgeport issued to Fronteer 4.5 million common shares (valued atapproximately $5.2 million (see Note 12(b)(ii)) in consideration of the acquisition. In addition to the properties acquired from Fronteer, Bridgeport has staked additional claims adjacent to the properties and intends to continue with its land acquisition effort. During the year ended April 30, 2012, the Company has decided to discontinue exploration activities on select areas of the Nevada Portfolio and as a result, certain properties were written off in the amount of $5,004,725.
(g) Option Agreement with Orsa Ventures Corp.
On July 19, 2011, the Company entered into an option agreement (the "Option Agreement") with Orsa whereby Orsa can earn a 51% interest in Bridgeport’s Ashby Gold Property in Nevada through phased exploration expenditures, share payments and a cash payment to Bridgeport. Pursuant to the terms of the Option Agreement, Orsa has the option (the "First Option") to earn up to a 49% interest in the Ashby Property by:
| a. | issuing to Bridgeport or its nominee an aggregate of 100,000 common shares of Orsa within three business days of receipt by Orsa of the approval by the TSX Venture Exchange of the Option Agreement; | |
| b. | incurring an aggregate of $150,000 of exploration expenditures on the Ashby Property within one year of the date of the Option Agreement; and | |
| c. | incurring $300,000 of cumulative exploration expenditures on the Ashby Property within two years of the date of the Option Agreement. |
If Orsa exercises the First Option and acquires a 49% interest in the Ashby Property, it will have the option (the "Second Option") to acquire a further 2% interest in the Ashby Property (for an aggregate 51% interest) by paying Bridgeport $100,000 in cash and issuing to Bridgeport common shares having an aggregate value of $100,000 within a 90 day period.
Following the exercise of the First Option, and if applicable, the Second Option, Orsa and Bridgeport will form a joint venture for further exploration and development of the Ashby Property. If Orsa has exercised the Second Option, it will hold a 51% interest in the joint venture and will be the operator of the joint venture. If Orsa has not exercised the Second Option, Orsa will hold a 49% interest in the joint venture and Bridgeport will become the operator.
146
| Bridgeport Ventures Inc. |
| Notes to the Consolidated Financial Statements |
| Years Ended April 30, 2012 and 2011 |
| (Expressed in Canadian dollars) |
| 9. | Interest in exploration properties and deferred exploration expenditures (continued) |
(g) Option Agreement with Orsa Ventures Corp. (continued)
On November 21, 2011, the Option Agreement with Orsa was approved by the TSX Venture Exchange and on December 7, 2011, 100,000 common shares of Orsa were received. The 100,000 common shares received were valued at $18,000 on December 7, 2011 based on the bid price on December 7, 2011. As of April 30, 2012, the bid price of the Orsa shares was $0.145 resulting in a unrealized loss of $3,500 which was recorded in other comprehensive loss for the year ended April 30, 2012. At April 30, 2012, the shares of Orsa were valued at $14,500 using the bid price of the security.
| 10. | Equipment |
| Computer | Office | Machinery and | ||||||||||||||||
| Cost | equipment | Software | equipment | Structures | equipment | Total | ||||||||||||
| Balance, May 1, 2010 | $ | 7,852 | $ | - | $ | 336 | $ | 13,754 | $ | 5,056 | $ | 26,998 | ||||||
| Additions | 22,382 | 315 | 1,452 | 1,813 | 1 | 25,963 | ||||||||||||
| Balance, April 30, 2011 | 30,234 | 315 | 1,788 | 15,567 | 5,057 | 52,961 | ||||||||||||
| (Disposal) | (2,970 | ) | (315 | ) | (1,788 | ) | (15,567 | ) | (5,057 | ) | (25,697 | ) | ||||||
| Balance, April 30, 2012 | $ | 27,264 | $ | - | $ | - | $ | - | $ | - | $ | 27,264 |
| Computer | Office | Machinery and | ||||||||||||||||
| Accumulated amortization | equipment | Software | equipment | Structures | equipment | Total | ||||||||||||
| Balance, May 1, 2010 | $ | 450 | $ | - | $ | 8 | $ | 344 | $ | 189 | $ | 991 | ||||||
| Amortization | 4,375 | 158 | 211 | 2,863 | 1,461 | 9,068 | ||||||||||||
| Balance, April 30, 2011 | 4,825 | 158 | 219 | 3,207 | 1,650 | 10,059 | ||||||||||||
| Amortization | 6,546 | 69 | 153 | 1,205 | 492 | 8,465 | ||||||||||||
| (Disposal) | (1,162 | ) | (227 | ) | (372 | ) | (4,412 | ) | (2,142 | ) | (8,315 | ) | ||||||
| Balance, April 30, 2012 | $ | 10,209 | $ | - | $ | - | $ | - | $ | - | $ | 10,209 |
| Computer | Office | Machinery and | ||||||||||||||||
| Carrying value | equipment | Software | equipment | Structures | equipment | Total | ||||||||||||
| Balance, May 1, 2010 | $ | 7,402 | $ | - | $ | 328 | $ | 13,410 | $ | 4,867 | $ | 26,007 | ||||||
| Balance, April 30, 2011 | $ | 25,409 | $ | 157 | $ | 1,569 | $ | 12,360 | $ | 3,407 | $ | 42,902 | ||||||
| Balance, April 30, 2012 | $ | 17,055 | $ | - | $ | - | $ | - | $ | - | $ | 17,055 |
| 11. | Amounts payable and other liabilities |
| As at | As at | As at | |||||||
| April 30, | April 30, | May 1, | |||||||
| 2012 | 2011 | 2010 | |||||||
| Falling due within the year | |||||||||
| Trade payables | $ | 18,084 | $ | 857,529 | 129,916 | ||||
| Accrued liabilities | 79,149 | 189,339 | 195,163 | ||||||
| $ | 97,233 | $ | 1,046,868 | 325,079 |
147
| Bridgeport Ventures Inc. |
| Notes to the Consolidated Financial Statements |
| Years Ended April 30, 2012 and 2011 |
| (Expressed in Canadian dollars) |
| 12. | Share capital |
a) Authorized share capital
The authorized share capital consisted of unlimited number of common shares. The common shares do not have a par value. All issued shares are fully paid.
b) Common shares issued
The change in issued share capital for the years ended April 30, 2012 and 2011 were as follows:
| Number of | |||||
| common | |||||
| shares | Amount | ||||
| ||||||
Balance, May 1, 2010 | 28,036,000 | $ | 11,798,967 | |||
Public offering, net of costs (i) | 17,250,000 | 13,885,090 | ||||
Acquisition of mineral properties (ii) | 4,500,000 | 5,175,000 | ||||
Exercise of warrants | 793,600 | 452,600 | ||||
Value of warrants exercised | - | 100,144 | ||||
Step-up warrants issued (note 14) | - | (47,300 | ) | |||
Balance, April 30, 2011 and April 30, 2012 | 50,579,600 | $ | 31,364,501 |
(i) On December 20, 2010 and January 7, 2011, the Company closed a public offering (the "Offering") and over allotment of 15,000,000 and 2,250,000 units ("Units"), respectively, of the Company at a price of $1.00 per Unit for cash consideration of $17,250,000. In connection with the Offering, the underwriters were paid a 6% agency fee totaling $1,035,000. Share issuance costs of $326,783 were incurred in relation to the Offering. Each Unit consisted of one common share of the Company and one-half of one common share purchase warrant (each whole such common share purchase warrant, a "Warrant"). Each Warrant will entitle the holder thereof to acquire one additional common share of the Company at an exercise price of $1.40 until December 20, 2012.
The grant date fair value of $1,805,000 was assigned to the 8,625,000 Warrants issued as part of the Offering as estimated by using a fair value market technique incorporating the Black-Scholes option valuation model with the following assumptions: expected dividend yield of 0%, expected volatility of 66%, risk-free rate of return of 1.62% and an expected maturity of 2 years. In addition, 1,035,000 compensation warrants ("Compensation Warrants") were issued to the underwriters. Each Compensation Warrant is exercisable into a unit for $1.00 with each unit comprised of one common share and one-half of one Warrant. The grant date fair value of $380,428 was assigned to the Compensation Warrants using the Black-Scholes valuation model with the following assumptions: expected dividend yield of 0%, expected volatility of 66%, risk-free rate of return of 1.62% and an expected maturity of 2 years.
(ii) On November 15, 2010, Bridgeport issued to Fronteer 4.5 million common shares at $1.15 per share based on the market value of the shares at the time of issue, in consideration of the acquisition of certain Nevada properties (note 9 (f)).
148
| Bridgeport Ventures Inc. |
| Notes to the Consolidated Financial Statements |
| Years Ended April 30, 2012 and 2011 |
| (Expressed in Canadian dollars) |
| 13. | Net loss per common share |
The calculation of basic and diluted loss per share for the years ended April 30, 2012 and 2011 was based on the loss attributable to common shareholders of $8,386,262 and $7,374,350 respectively and the weighted average number of common shares outstanding of 50,579,600 and 36,402,004. Diluted loss per share did not include the effect of 28,825,000 warrants and 4,507,500 stock options as they are anti-dilutive.
| 14. | Warrants |
The following table reflects the continuity of warrants for the years ended April 30, 2012 and 2011:
| Number of | |||||
| warrants | Amount | ||||
Balance, May 1, 2010 | 19,690,200 | $ | 3,679,500 | |||
Granted (note 12(b)(i)) | 9,660,000 | 2,003,127 | ||||
Step-up warrants issued (i)(ii)(iii) | 420,000 | 47,300 | ||||
Exercised | (793,600 | ) | (100,144 | ) | ||
Expired | (151,600 | ) | (25,772 | ) | ||
Balance, April 30, 2011 and April 30, 2012 | 28,825,000 | $ | 5,604,011 |
(i) On January 31, 2011, 210,000 broker warrants with an exercise price of $0.20 and expiry date of April 7, 2011 were exercised into common shares and warrants for cash proceeds of $42,000. As a result, 210,000 additional warrants were issued with an exercise price of $0.50 and an expiry date of October 7, 2014. The grant date fair value of $24,100 was assigned to the 210,000 warrants as estimated by using the Black-Scholes valuation model with the following assumptions: expected dividend yield of 0%, expected volatility of 73%, risk-free rate of return of of 1.84% and an expected maturity of 3.68 years.
(ii) On February 24, 2011, 100,000 broker warrants with an exercise price of $0.20 and expiry date of April 7, 2011 were exercised into common shares and warrants for cash proceeds of $20,000. As a result, 100,000 additional warrants were issued from the step up feature of the units with an exercise price of $0.50 and expiry date of October 7, 2014. The grant date fair value of $11,300 was assigned to the 100,000 warrants as estimated by using the Black-Scholes valuation model with the following assumptions: expected dividend yield of 0%, expected volatility of 74%, risk-free rate of return of 2.36% and an expected maturity of 3.62 years.
(iii) On April 6, 2011, 110,000 broker warrants with an exercise price of $0.20 per unit and expiry date of April 7, 2011 were exercised into common shares and warrants for cash proceeds of $22,000. As a result, 110,000 warrants were issued from the step up feature of the units with an exercise price of $0.50 and expiry date of October 7, 2014. The grant date fair value of $11,900 was assigned to the 110,000 warrants as estimated by using the Black-Scholes valuation model with the following assumptions: expected dividend yield of 0%, expected volatility of 74%, risk-free rate of return of 2.51% and an expected maturity of 3.51 years.
149
| Bridgeport Ventures Inc. |
| Notes to the Consolidated Financial Statements |
| Years Ended April 30, 2012 and 2011 |
| (Expressed in Canadian dollars) |
| 14. | Warrants (continued) |
The following table reflects the actual warrants issued and outstanding as of April 30, 2012:
| Number of | |||||||||
| Warrants | Grant date ($) | ||||||||
| Outstanding | fair value | Exercise Price ($) | Expiry Date | ||||||
| 6,575,000 | 374,925 | 0.50 | October 7, 2014 | ||||||
| 12,590,000 | 3,225,959 | 1.50 | December 1, 2012 | ||||||
| 8,625,000 | 1,622,699 | 1.40 | December 20, 2012 | ||||||
| 1,035,000 | (1) | 380,428 | 1.00 | December 20, 2012 | |||||
| 28,825,000 | 5,604,011 | 1.22 |
(1) Each exercisable to acquire one unit, each unit consisting of one common share and one-half of one warrant with each whole warrant exercisable to acquire one additional common share at an exercise price of $1.40 until December 20, 2012.
| 15. | Stock options |
The shareholders of the Company approved the stock option plan on December 18, 2007. Up to such number of common shares as is equal to 10% of the aggregate number of common shares issued and outstanding from time to time may be reserved for issue upon the exercise of options granted pursuant to the stock option plan.
The purpose of the stock option plan is to attract, retain and motivate directors, officers, employees and other service providers by providing them with the opportunity, through share options, to acquire a proprietary interest in the Company and benefit from its growth. The options are non-assignable and may be granted for a term not exceeding five years.
Stock options may be granted under the stock option plan only to directors, officers, employees and other service providers subject to the rules and regulations of applicable regulatory authorities and any Canadian stock exchange upon which the common shares may be listed or may trade from time to time. The total number of common shares which may be reserved for issuance to any one individual under the stock option plan within any one year period shall not exceed 5% of the outstanding issue. The maximum number of common shares which may be reserved for issuance to insiders under the stock option plan, any other employer stock option plans or options for services, shall be 10% of the common shares issued and outstanding at the time of the grant (on a non-diluted basis).
150
| Bridgeport Ventures Inc. |
| Notes to the Consolidated Financial Statements |
| Years Ended April 30, 2012 and 2011 |
| (Expressed in Canadian dollars) |
| 15. | Stock options (continued) |
The maximum number of common shares which may be issued to insiders under the stock option plan, together with any other previously established or proposed share compensation arrangements, within any one year period shall be 10% of the outstanding issue. The maximum number of common shares which may be issued to any one insider and his or her associates under the stock option plan, together with any other previously established or proposed share compensation arrangements, within a one year period shall be 5% of the common shares outstanding at the time of the grant (on a non-diluted basis).
The maximum number of stock options which may be granted to any one consultant under the stock option plan, any other employer stock options plans or options for services, within any 12 month period, must not exceed 2% of the common shares issued and outstanding at the time of the grant (on a non-diluted basis). The maximum number of stock options which may be granted to any persons performing investor relations services under the stock option plan, any other employer stock options plans or options for services, within any 12 month period must not exceed, in the aggregate, 2% of the common shares issued and outstanding at the time of the grant (on a non-diluted basis).
The exercise price of options issued may not be less than the fair market value of the common shares at the time the option is granted, less any allowable discounts.
The following reflects the continuity of stock options for the years ended April 30, 2012 and 2011:
| Weighted Average | ||||||
| Number of | Exercise Price | |||||
| Stock Options | ($) | |||||
| Balance, May 1, 2010 | 2,400,000 | 1.21 | ||||
| Granted(10)(11)(12)(13)(14) | 2,340,000 | 1.01 | ||||
| Forfeited(5)(7)(9) | (75,000 | ) | 2.31 | |||
| Expired(5)(7)(9) | (100,000 | ) | 2.24 | |||
| Balance, April 30, 2011 | 4,565,000 | 1.06 | ||||
| Granted(16)(17)(18) | 687,500 | 0.53 | ||||
| Forfeited(5)(14) | (196,666 | ) | 1.34 | |||
| Expired(1)(5)(14) | (548,334 | ) | 1.01 | |||
| Balance, April 30, 2012 | 4,507,500 | 0.98 |
151
| Bridgeport Ventures Inc. |
| Notes to the Consolidated Financial Statements |
| Years Ended April 30, 2012 and 2011 |
| (Expressed in Canadian dollars) |
| 15. | Stock options (continued) |
(1) On August 20, 2009, the Company granted 700,000 stock options to officers and directors of the Company exercisable for one common share each at a price of $0.35 per share for a five-year period. These stock options vested immediately. 500,000 of these stock options expire on August 20, 2014 and the remaining 200,000 stock options expired on January 7, 2012. During the year ended April 30, 2012, 200,000 stock options expired unexercised and as at April 30, 2012, 500,000 stock options remain outstanding. The grant date fair value of $56,000 was assigned to the stock options as estimated by using the Black-Scholes valuation model with the following assumptions: expected dividend yield 0%, expected volatility 100%, risk-free rate of return 2.6% and an expected maturity of 5 years. For the year ended April 30, 2012 $nil (year ended April 30, 2011 - $nil) was expensed to share-based payments.
(2) On November 12, 2009, the Company granted 200,000 stock options to a director of the Company pursuant to the Company's stock option plan, exercisable for one common share each at a price of $1.20 per share for a five-year period expiring on November 12, 2014. The options vest as to one-third on the date of grant and one-third each on the first and second anniversaries of the date of grant. The grant date fair value of $172,000 was assigned to the stock options as estimated by using the Black-Scholes valuation model with the following assumptions: expected dividend yield of 0%, expected volatility of 93%, risk-free rate of return of 2.7% and an expected maturity of 5 years. For the year ended April 30, 2012, $15,394 (year ended April 30, 2011 - $59,454) was expensed to share-based payments.
(3) On November 17, 2009, the Company granted 250,000 stock options to a consultant of the Company pursuant to the Company's stock option plan, exercisable for one common share each at a price of $1.20 per share for a period of five years expiring on November 17, 2014. The options vest as to one-third on the date of grant and one-third on the first and second anniversaries of the date of grant. The grant date fair value of $205,000 was assigned to the stock options as estimated by using the Black-Scholes valuation model with the following assumptions: expected dividend yield of 0%, expected volatility of 93%, risk-free rate of return of 2.6% and an expected maturity of 5 years. For the year ended April 30, 2012, $18,815 (year ended April 30, 2011 - $71,797) was expensed to share-based payments.
(4) On December 8, 2009, the Company granted 300,000 options to a director of the Company pursuant to the Company's stock option plan, exercisable for one common share each at a price of $1.40 per share for a period of five years expiring on December 7, 2014. The options vest as to one-third on the date of grant and one-third on the first and second anniversaries of the date of grant. The grant date fair value of $300,000 was assigned to the stock options as estimated by using the Black-Scholes valuation model with the following assumptions: expected dividend yield of 0%, expected volatility of 92%, risk-free rate of return of 2.5% and an expected maturity of 5 years. For the year ended April 30, 2012, $30,411 (year ended April 30, 2011 - $110,822) was expensed to share-based payments.
(5) On December 8, 2009, the Company granted 525,000 options to consultants of the Company pursuant to the Company's stock option plan, exercisable for one common share each at a price of $1.40 per share for a period of five years expiring on December 7, 2014. During the year ended April 30, 2011, 16,667 of these options expired and 8,333 of these options were forfeited and during the year ended April 30, 2012, 166,666 options were forfeited, 166,667 options expired on November 30, 2011 and the remaining 166,667 expired on December 12, 2011. As of April 30, 2012, nil options remain outstanding. The options vest as to one-third on the date of grant and one-third on the first and second anniversaries of the date of grant. The grant date fair value of $525,000 was assigned to the stock options as estimated by using the Black-Scholes valuation model with the following assumptions: expected dividend yield of 0%, expected volatility of 92%, risk-free rate of return of 2.5% and an expected maturity of 5 years. For the year ended April 30, 2012, ($115,297) (year ended April 30, 2011 -$189,612) was credited to share-based payments as a result of the forfeiture.
152
| Bridgeport Ventures Inc. |
| Notes to the Consolidated Financial Statements |
| Years Ended April 30, 2012 and 2011 |
| (Expressed in Canadian dollars) |
| 15. | Stock options (continued) |
(6) On January 11, 2010, the Company granted 250,000 stock options to a director pursuant to the Company's stock option plan, exercisable for one common share each at a price of $2.15 per share for a period of five years expiring on January 11, 2015. The options vest as to one-third on the date of grant and one-third on the first and second anniversaries of the date of grant. The grant date fair value of $379,750 was assigned to the stock options as estimated by using the Black-Scholes valuation model with the following assumptions: expected dividend yield of 0%, expected volatility of 90%, risk-free rate of return of 2.7% and an expected maturity of 5 years. For the year ended April 30, 2012, $44,391 (year ended April 30, 2011 - $152,073) was expensed to share-based payments.
(7) On January 25, 2010, the Company granted 100,000 stock options to a consultant pursuant to the Company's stock option plan, exercisable for one common share each at a price of $2.40 per share for a period of five years expiring on January 25, 2015. During the year ended April 30, 2011, 66,667 of these stock options expired and 33,333 of these stock options were forfeited and as of April 30, 2012, nil options remain outstanding. The options vest as to one-third on the date of grant and one-third on the first and second anniversaries of the date of grant. The grant date fair value of $167,900 was assigned to the stock options as estimated by using the Black-Scholes valuation model with the following assumptions: expected dividend yield of 0%, expected volatility of 89%, risk-free rate of return of 2.5% and an expected maturity of 5 years. For the year ended April 30, 2012, $nil (year ended April 30, 2011 - $34,117) was credited to share-based payments as a result of the forfeiture.
(8) On February 1, 2010, the Company granted 25,000 stock options to an employee pursuant to the Company's stock option plan, exercisable for one common share each at a price of $2.40 per share for a period of five years expiring on February 1, 2015. The options vest as to one-third on the date of grant and one-third on the first and second anniversaries of the date of grant. The grant date fair value of $45,150 was assigned to the stock options as estimated by using the Black-Scholes valuation model with the following assumptions: expected dividend yield of 0%, expected volatility of 89%, risk-free rate of return of 2.47% and an expected maturity of 5 years. For the year ended April 30, 2012, $5,711 (year ended April 30, 2011 - $18,947) was expensed to share-based payments.
(9) On March 10, 2010, the Company granted 50,000 stock options to a consultant pursuant to the Company's stock option plan, exercisable for one common share each at a price of $2.45 per share for a period of five years expiring on March 10, 2015. During the year ended April 30, 2011, 16,666 of these stock options expired and 33,334 were forfeited and as of April 30, 2012, nil options remain outstanding. The options vest as to one-third on the date of grant and one-third on the first and second anniversaries of the date of grant. The grant date fair value of $84,750 was assigned to the stock options as estimated by using the Black-Scholes valuation model with the following assumptions: expected dividend yield of 0%, expected volatility of 87%, risk-free rate of return of 2.81% and an expected maturity of 5 years. For the year ended April 30, 2012, $nil (year ended April 30, 2011 - ($5,920)) was credited to share-based payments.
(10) On September 23, 2010, the Company granted 400,000 stock options to an officer pursuant to the Company's stock option plan, exercisable for one common share each at a price of $1.05 per share for a period of five years expiring on September 23, 2015. The options vest as to one-third on the date of grant and one-third on each of the first and second anniversaries of the date of grant. The grant date fair value of $273,600 was assigned to the stock options as estimated by using the Black-Scholes valuation model with the following assumptions: expected dividend yield of 0%, expected volatility of 81%, risk-free rate of return of 2.11% and an expected maturity of 5 years. For the year ended April 30, 2012, $79,580 (year ended April 30, 2011 - $172,227) was expensed to share-based payments.
153
| Bridgeport Ventures Inc. |
| Notes to the Consolidated Financial Statements |
| Years Ended April 30, 2012 and 2011 |
| (Expressed in Canadian dollars) |
| 15. | Stock options (continued) |
(11) On December 21, 2010, the Company granted 1,600,000 stock options to an officer pursuant to the Company's stock option plan, exercisable for one common share each at a price of $1.00 per share for a period of five years expiring on December 21, 2015. The options vest as to one-third on the date of grant and one-third on each of the first and second anniversaries of the date of grant. The grant date fair value of $940,800 was assigned to the stock options as estimated by using the Black-Scholes valuation model with the following assumptions: expected dividend yield of 0%, expected volatility of 77%, risk-free rate of return of 2.17% and an expected maturity of 5 years. For the year ended April 30, 2012, $358,921 (year ended April 30, 2011 - $481,064) was expensed to share-based payments.
(12) On January 7, 2011, the Company granted 250,000 stock options to a director pursuant to the Company's stock option plan, exercisable for one common share each at a price of $1.00 per share for a period of five years expiring on January 7, 2016. The options vest as to one-third on the date of grant and one-third on the first and second anniversaries of the date of grant. The grant date fair value of $116,500 was assigned to the stock options as estimated by using the Black-Scholes valuation model with the following assumptions: expected dividend yield of 0%, expected volatility of 76%, risk-free rate of return of 2.24% and an expected maturity of 5 years. For the year ended April 30, 2012, $46,254 (year ended April 30, 2011 - $56,859) was expensed to share-based payments.
(13) On March 15, 2011, the Company granted 35,000 options exercisable at $0.85 to an employee of the Company with an expiry date of March 15, 2016. The options vest as to on-third on the date of grant and one-third after the first and second anniversaries of the date of grant. The grant date fair value of $11,375 was assigned to the stock options as estimated by using the Black-Scholes valuation model with the following assumptions: expected dividend yield of 0%, expected volatility of 74%, risk-free rate of return of 2.22% and an expected maturity of 5 years. For the year ended April 30, 2012, $5,212 (year ended April 30, 2011 - $4,508) was expensed to share-based payments.
(14) On March 15, 2011, the Company granted 55,000 options exercisable at $1.00 to employees of the Company with an expiry date of March 15, 2016. During the year ended April 30, 2012, 30,000 options were forfeited and 15,000 expired unexercised on September 14, 2011. As at April 30, 2012, 10,000 options remaining outstanding. The options vest as to one-third on the date of grant and one-third after the first and second anniversaries of the date of grant. The grant date fair value of $16,720 was assigned to the stock options as estimated by using the Black-Scholes valuation model with the following assumptions: expected dividend yield of 0%, expected volatility of 74%, risk-free rate of return of 2.22% and an expected maturity of 5 years. For the year ended April 30, 2012, $531 (year ended April 30, 2011 - $6,626) was credited to share-based payments as a result of the forfeiture.
(15)During the year ended April 30, 2011, the expiry date of 200,000 fully vested options granted on August 20, 2009 to a former director was modified. The expiry date changed from August 20, 2014 to January 7, 2012. The former director resigned and became a consultant to the Company. During the year ended April 30, 2012, the 200,000 stock options expired unexercised (see Note 15(1)).
(16) On June 8, 2011, the Company granted 55,000 options exercisable at $0.85 to an employee and a consultant of the Company with an expiry date of June 8, 2016. The options vest as to one-third on the date of grant and one-third after the first and second anniversaries of the date of grant. The grant date fair value of $11,550 was assigned to the stock options as estimated by using the Black-Scholes valuation model with the following assumptions: expected dividend yield of 0%, expected volatility of 72%, risk-free rate of return of 2.05% and an expected maturity of 5 years. For the year ended April 30, 2012, $9,422 (year ended April 30, 2011 - $nil) was expensed to share-based payments.
154
| Bridgeport Ventures Inc. |
| Notes to the Consolidated Financial Statements |
| Years Ended April 30, 2012 and 2011 |
| (Expressed in Canadian dollars) |
| 15. | Stock options (continued) |
(17) On July 26, 2011, the Company granted 417,500 options exercisable at $0.50 to certain directors, officers, employees and consultants of the Company with an expiry date of July 26, 2016. The options vest as to one-third on the date of grant and one-third after the first and second anniversaries of the date of grant. The grant date fair value of $119,823 was assigned to the stock options as estimated by using the Black-Scholes valuation model with the following assumptions: expected dividend yield of 0%, expected volatility of 71%, risk-free rate of return of 1.93% and an expected maturity of 5 years. For the year ended April 30, 2012, $95,126 (year ended April 30, 2011 - $nil) was expensed to share-based payments.
(18) On September 6, 2011, the Company granted 215,000 options exercisable at $0.50 to certain employees of the Company with an expiry date of September 6, 2016. The options vest as to one-third on the date of grant and one-third after the first and second anniversaries of the date of grant. The grant date fair value of $61,920 was assigned to the stock options as estimated by using the Black-Scholes valuation model with the following assumptions: expected dividend yield of 0%, expected volatility of 70%, risk-free rate of return of 1.24% and an expected maturity of 5 years. For the year ended April 30, 2012, $40,734 (year ended April 30, 2011 - $nil) was expensed to share-based payments.
Details of the stock options outstanding at April 30, 2012 are as follows:
| Weighted average | |||||
| remaining contractual | |||||
| Number of | Exercisable | life (years) for | Weighted average | ||
| stock | stock | Exercise | number of stock | grant date fair | Expiry |
| options | options | price ($) | options granted | value per option ($) | date |
| 500,000 | 500,000 | 0.35 | 2.31 | 0.08 | August 20, 2014 |
| 200,000 | 200,000 | 1.20 | 2.54 | 0.86 | November 12, 2014 |
| 250,000 | 250,000 | 1.20 | 2.55 | 0.82 | November 17, 2014 |
| 300,000 | 300,000 | 1.40 | 2.61 | 1.00 | December 7, 2014 |
| 250,000 | 250,000 | 2.15 | 2.70 | 1.52 | January 11, 2015 |
| 25,000 | 25,000 | 2.40 | 2.76 | 1.81 | February 1, 2015 |
| 400,000 | 266,667 | 1.05 | 3.40 | 0.68 | September 23, 2015 |
| 1,600,000 | 1,066,667 | 1.00 | 3.64 | 0.59 | December 21, 2015 |
| 250,000 | 166,667 | 1.00 | 3.69 | 0.47 | January 7, 2016 |
| 35,000 | 23,333 | 0.85 | 3.88 | 0.33 | March 15, 2016 |
| 10,000 | 6,667 | 1.00 | 3.88 | 0.30 | March 15, 2016 |
| 55,000 | 18,333 | 0.85 | 4.11 | 0.21 | June 8, 2016 |
| 417,500 | 139,167 | 0.50 | 4.24 | 0.29 | July 26, 2016 |
| 215,000 | 71,667 | 0.50 | 4.36 | 0.29 | September 6, 2016 |
| 4,507,500 | 3,284,168 | 0.98 | 3.34 | 0.60 |
The weighted average exercise price of exercisable stock options as at April 30, 2012 is $1.03 (April 30, 2011 - $1.02) .
155
| Bridgeport Ventures Inc. |
| Notes to the Consolidated Financial Statements |
| Years Ended April 30, 2012 and 2011 |
| (Expressed in Canadian dollars) |
| 16. | General and administrative |
| For the year ended April 30, | 2012 | 2011 | ||||
| Share-based payments (note 15) | $ | 635,205 | $ | 1,352,186 | ||
| Salaries and benefits (note 17) | 279,151 | 347,180 | ||||
| Professional fees (note 17) | 226,459 | 768,066 | ||||
| Insurance | 65,901 | 41,354 | ||||
| Rent | 108,715 | 109,854 | ||||
| Administrative and general | 146,041 | 172,952 | ||||
| Investor relations | 87,351 | 24,963 | ||||
| Reporting issuer costs | 67,374 | 120,173 | ||||
| Business development | 730,639 | 183,796 | ||||
| Travel and accommodation | 13,397 | 161,318 | ||||
| Amortization (note 10) | 6,241 | 3,606 | ||||
| Meals | 16,317 | 21,589 | ||||
| $ | 2,382,791 | $ | 3,307,037 |
| 17. | Related party balances and transactions |
Related parties include the Board of Directors, close family members and enterprises that are controlled by these individuals as well as certain persons performing similar functions.
Related party transactions conducted in the normal course of operations are measured at the exchange value (the amount established and agreed to by the related parties). The amounts due to related parties are unsecured, non-interest bearing and due on demand.
(a) the Company entered into the following transactions with related parties:
| Notes | April 30, | ||||||||
| Years ended | 2012 | 2011 | |||||||
| Marrelli Support Services Inc.("MSSI") | (i) | $ | 47,377 | $ | 40,000 | ||||
| DSA Corporate Services Inc. ("DSA") | (ii) | $ | 10,592 | $ | 10,696 | ||||
| H.R. Snyder Consultants | (iii) | $ | 78,685 | $ | 65,625 | ||||
(i) The Chief Financial Officer ("CFO") of the Company is the president of MSSI. Fees relate to accounting services provided by MSSI. These costs are reflected in professional fees in the consolidated statements of loss. As at April 30, 2012, MSSI was owed $25,750 (April 30, 2011 - $12,562 and May 1, 2010 - $12,226) and the amount was included in amounts payable and other liabilities.
(ii) The CFO of the Company is an officer of DSA. Fees relate to corporate secretarial services provided by DSA. These costs are reflected in professional fees in the consolidated statements of loss. As at April 30, 2012, DSA was owed $1,300 (April 30, 2011 - $989 and May 1, 2010 - $919) and the amount was included in amounts payable and other liabilities.
(iii) Fees were paid to H.R. Snyder Consultants for Hugh Snyder to act as Chairman of the Company. H.R. Snyder Consultants is controlled by Hugh Snyder. These costs are reflected in salaries and benefits in the consolidated statements of loss.
156
| Bridgeport Ventures Inc. |
| Notes to the Consolidated Financial Statements |
| Years Ended April 30, 2012 and 2011 |
| (Expressed in Canadian dollars) |
| 17. | Related party balances and transactions (continued) |
(b) In accordance with IAS 24, key management personnel are those persons having authority and responsibility for planning, directing and controlling the activities of the Company directly or indirectly, including any directors (executive and non-executive) of the Company.
Remuneration of Directors and key management personnel of the Company was as follows:
| 2012 | 2011 | |||||
| Years ended April 30, | $ | $ | ||||
| Salaries and benefits(1) | 276,457 | 170,750 | ||||
| Share based payments | 659,254 | 1,032,499 |
(1)The board of directors do not have employment or service contracts with the Company. Directors are entitled to director fees and stock options for their services and officers are entitled to stock options and cash remuneration for their services.
| 18. | Income taxes |
a) Provision for Income Taxes
The reconciliation of the combined Canadian federal and provincial income tax rate on the net loss of the Company for the years ended April 30, 2012 and 2011:
| 2012 | 2011 | |||||
| (Loss) before income taxes from continuing operations | $ | (7,167,201 | ) | $ | (3,160,469 | ) |
| Expected income tax recovery | (1,899,300 | ) | (942,900 | ) | ||
| Increase (decrease) resulting from: | ||||||
| Non-deductible share-based payments | 168,300 | 406,300 | ||||
| Difference in tax rates and other | (728,000 | ) | 152,500 | |||
| Loss on sale of Rio Condor | (638,100 | ) | - | |||
| Change in tax benefits not recognized | 3,203,300 | 435,700 | ||||
| Share issue cost | (106,200 | ) | (51,600 | ) | ||
| Deferred income tax (recovery) | $ | - | $ | - |
The 2012 statutory tax rate of 26.5% differs from the 2011 statutory tax rate of 29.8% because of the reduction in federal and provincial substantively enacted tax rates.
157
| Bridgeport Ventures Inc. |
| Notes to the Consolidated Financial Statements |
| Years Ended April 30, 2012 and 2011 |
| (Expressed in Canadian dollars) |
| 18. | Income taxes (continued) |
b) Deferred Tax Balances
The following table summarizes the components of the deferred income tax:
| Available-for-sale | |||||||||
| Investment | Tax Losses | Total | |||||||
| At April 30, 2011 | $ | 25,000 | $ | (25,000 | ) | $ | - | ||
| Charged to net loss from continuing operations | - | 25,000 | 25,000 | ||||||
| Credited to comprehensive loss from continuing operations | (25,000 | ) | - | (25,000 | ) | ||||
| At April 30, 2012 | $ | - | $ | - | $ | - |
The tax effects of temporary differences that give rise to deferred income tax assets and liabilities in Canada and US approximate the following:
| 2012 | 2011 | |||||
| Non-capital losses | $ | 1,096,200 | $ | 507,200 | ||
| Capital losses | 588,300 | - | ||||
| Deferred exploration expenditures | 2,014,700 | 183,000 | ||||
| Share issue costs | 295,900 | 123,300 | ||||
| Equipment | (2,900 | ) | 900 | |||
| Available-for-sale investments | 500 | (25,000 | ) | |||
| Deferred income tax assets not recognized | $ | 3,992,700 | $ | 789,400 |
c) Tax Loss Carry-Forwards
The Company's non-capital income tax losses expire as follows:
| Canada | US | |||||
| 2027 | $ | 2,000 | $ | - | ||
| 2028 | 2,000 | - | ||||
| 2029 | 900 | - | ||||
| 2030 | 843,700 | - | ||||
| 2031 | 1,368,500 | 118,300 | ||||
| 2032 | 1,637,700 | 260,400 | ||||
| Total | $ | 3,854,800 | $ | 378,700 |
The Company also has approximately $1,052,000 and $9,200,000 of cumulative exploration and development expenditure pools in Canada and the US, respectively, which may, in certain circumstances be used to reduce taxable income in future years.
158
| Bridgeport Ventures Inc. |
| Notes to the Consolidated Financial Statements |
| Years Ended April 30, 2012 and 2011 |
| (Expressed in Canadian dollars) |
| 19. | Segmented information |
April 30, 2012 | Canada | Chile | United States | Total | ||||||||
| ||||||||||||
Cash and cash equivalents | $ | 17,797,694 | $ | - | $ | 12,889 | $ | 17,810,583 | ||||
Amounts receivable and other assets | 145,636 | - | 14,819 | 160,455 | ||||||||
Available-for-sale investment | 24,250 | - | - | 24,250 | ||||||||
| ||||||||||||
| 17,967,580 | - | 27,708 | 17,995,288 | ||||||||
Interest in exploration properties and deferred exploration expenditures | - | - | 4,208,534 | 4,208,534 | ||||||||
Equipment | 17,055 | - | - | 17,055 | ||||||||
| ||||||||||||
| $ | 17,984,635 | $ | - | $ | 4,236,242 | $ | 22,220,877 |
April 30, 2011 | Canada | Chile | United States | Total | ||||||||
| ||||||||||||
Cash and cash equivalents | $ | 22,861,023 | $ | (1,828 | ) | $ | 11,699 | $ | 22,870,894 | |||
Amounts receivable and other assets | 82,633 | 231,808 | 14,196 | 328,637 | ||||||||
Available-for-sale investment | 280,000 | - | - | 280,000 | ||||||||
| ||||||||||||
| 23,223,656 | 229,980 | 25,895 | 23,479,531 | ||||||||
Interest in exploration properties and deferred exploration expenditures | 171,596 | 975,725 | 6,430,690 | 7,578,011 | ||||||||
Equipment | 23,297 | 19,605 | - | 42,902 | ||||||||
| ||||||||||||
| $ | 23,418,549 | $ | 1,225,310 | $ | 6,456,585 | $ | 31,100,444 |
May 1, 2010 | Canada | Chile | United States | Total | ||||||||
| ||||||||||||
Cash and cash equivalents | $ | 11,027,755 | $ | 109,627 | $ | - | $ | 11,137,382 | ||||
Amounts receivable and other assets | 96,681 | 33,661 | - | 130,342 | ||||||||
| ||||||||||||
| 11,124,436 | 143,288 | - | 11,267,724 | ||||||||
Interest in exploration properties and deferred exploration expenditures | 263,860 | 3,152,411 | - | 3,416,271 | ||||||||
Equipments | 5,156 | 20,851 | - | 26,007 | ||||||||
| ||||||||||||
| $ | 11,393,452 | $ | 3,316,550 | $ | - | $ | 14,710,002 |
159
| Bridgeport Ventures Inc. |
| Notes to the Consolidated Financial Statements |
| Years Ended April 30, 2012 and 2011 |
| (Expressed in Canadian dollars) |
| 20. | Commitment and contingencies |
(i) Environmental contingencies
The Company's activities are subject to environmental regulation (including regular environmental impact assessments and permitting) in each of the jurisdictions in which its mineral properties are located. Such regulations cover a wide variety of matters including, without limitation, prevention of waste, pollution and protection of the environment, labour relations and worker safety. The Company may also be subject under such regulations to clean-up costs and liability for toxic or hazardous substances which may exist on or under any of its properties or which may be produced as a result of its operations. It is likely that environmental legislation and permitting will evolve in a manner which will require stricter standards and enforcement. This may include increased fines and penalties for non-compliance, more stringent environmental assessments of proposed projects and a higher degree of responsibility for companies, their directors and employees.
The Company has not determined and is not aware whether any provision for such costs is required and is unable to determine the impact on its financial position, if any, of environmental laws and regulations that may be enacted in the future due to the uncertainty surrounding the form that these laws and regulations may take.
(ii) Management contracts
At April 30, 2012, the Company was party to certain management and consulting contracts. These contracts contain certain clauses requiring that additional payments of up to $253,333 be made upon termination without cause or as a result of the occurrence of certain events such as a change of control (see note 22(ii)).
160
| Bridgeport Ventures Inc. |
| Notes to the Consolidated Financial Statements |
| Years Ended April 30, 2012 and 2011 |
| (Expressed in Canadian dollars) |
| 21. | Conversion to IFRS |
| (i) | Overview |
As stated in significant accounting policies (note 2), these are the Company’s first annual consolidated financial statements prepared in accordance with IFRS as issued by the IASB.
| (ii) | First-time adoption of IFRS |
The adoption of IFRS requires the application of IFRS 1, which provides guidance for an entity’s initial adoption of IFRS. IFRS 1 generally requires retrospective application of IFRS as effective at the end of its first annual IFRS reporting period. However, IFRS 1 also provides certain optional exemptions and mandatory exceptions to this retrospective treatment.
The Company has elected to apply the following optional exemptions in its preparation of an opening IFRS statement of financial position as at May 1, 2010.
To apply IFRS 3 Business Combination only to past business combinations that occurred after the date of transition to IFRS (May 1, 2010).
To apply IFRS 2 Share-based Payments only to equity instruments that were issued after November 7, 2002 and had not vested by the Transition Date.
IFRS 1 does not permit changes to estimates that have been made previously. Accordingly, estimates used in the preparation of the Company’s opening IFRS statement of financial position as at the Transition Date are consistent with those that were made under Canadian GAAP.
| (iii) | Changes to accounting policies |
The Company has changed certain accounting policies to be consistent with IFRS effective on April 30, 2012 (see note 2), the Company’s first annual IFRS reporting date. The changes to its accounting policies have resulted in certain changes to the recognition and measurement of assets, liabilities, equity, revenue and expenses within its financial statements.
The following summarizes the significant changes to the Company’s accounting policies on adoption of IFRS.
| (a) | Impairment of non-financial assets |
IFRS requires a write down of assets if the higher of the fair market value and the value in use of a group of assets is less than its carrying value. Value in use is determined using discounted estimated future cash flows. Canadian GAAP requires a write down to estimated fair value only if the undiscounted estimated future cash flows of a group of assets are less than its carrying value.
The Company's accounting policies related to impairment of non-financial assets have been changed to reflect these differences. There was no material impact on the consolidated financial statements as at April 30, 2012.
161
| Bridgeport Ventures Inc. |
| Notes to the Consolidated Financial Statements |
| Years Ended April 30, 2012 and 2011 |
| (Expressed in Canadian dollars) |
| 21. | Conversion to IFRS (continued) |
| (iii) | Changes to accounting policies (continued) |
| (b) | Decommissioning Liabilities (Asset Retirement Obligations) |
IFRS requires the recognition of a decommissioning liability for legal or constructive obligations, while current Canadian GAAP only requires the recognition of such liabilities for legal obligations. A constructive obligation exists when an entity has created reasonable expectations that it will take certain actions.
The Company's accounting policies related to decommissioning liabilities have been changed to reflect these differences. There is no impact on the consolidated financial statements as there was no legal or constructive obligation on the Transition Date or as at April 30, 2011 or April 30, 2012.
| (c) | Income Taxes |
Under Canadian GAAP, the Company had recognized deferred tax on temporary differences arising on the acquisition of assets where the carrying amount of the assets acquired exceeded the tax base.
IFRS provides for a specific exemption from recording a deferred tax liability on initial recognition when the transaction is not a business combination and at the time of the transaction, affects neither accounting profit/loss nor tax profit/loss. As the acquisition of certain interests in exploration properties meet the IFRS exemption criteria, the recognition of deferred tax liabilities in relation to these assets acquired under Canadian GAAP is reversed under IFRS.
| (iv) | Presentation |
Certain amounts in the consolidated statements of financial position, statements of loss and comprehensive loss and statements of cash flows have been reclassified to conform to the presentation adopted under IFRS.
162
| Bridgeport Ventures Inc. |
| Notes to the Consolidated Financial Statements |
| Years Ended April 30, 2012 and 2011 |
| (Expressed in Canadian dollars) |
| 21. | Conversion to IFRS (continued) |
| (v) | Reconciliation between IFRS and Canadian GAAP (continued) |
The May 1, 2010 Canadian GAAP balance sheet has been reconciled to IFRS as follows:
| May 1, 2010 | ||||||||
| |||||||||
| Effect of | ||||||||
| Canadian | transition to | |||||||
| GAAP | IFRS | IFRS | ||||||
| |||||||||
ASSETS | |||||||||
| |||||||||
Current assets | |||||||||
Cash and cash equivalents | $ | 11,137,382 | $ | - | $ | 11,137,382 | |||
Amounts receivable and other assets | 130,342 | - | 130,342 | ||||||
Total current assets | 11,267,724 | - | 11,267,724 | ||||||
| |||||||||
Interest in exploration properties and deferred exploration expenditures (note 21(iii)(c)) | 3,840,460 | (424,189 | ) | 3,416,271 | |||||
Equipment | 26,007 | - | 26,007 | ||||||
Total assets | $ | 15,134,191 | $ | (424,189 | ) | $ | 14,710,002 | ||
| |||||||||
EQUITY AND LIABILITIES | |||||||||
| |||||||||
Current liabilities | |||||||||
Amounts payable and other liabilities | $ | 325,079 | $ | - | $ | 325,079 | |||
| |||||||||
Future income tax liability (note 21(iii)(c)) | 424,189 | (424,189 | ) | - | |||||
Total liabilities | 749,268 | (424,189 | ) | 325,079 | |||||
| |||||||||
Equity | |||||||||
Share capital | 11,798,967 | - | 11,798,967 | ||||||
Reserves | 4,697,259 | - | 4,697,259 | ||||||
Accumulated deficit | (2,111,303 | ) | - | (2,111,303 | ) | ||||
Total equity | 14,384,923 | - | 14,384,923 | ||||||
Total equity and liabilities | $ | 15,134,191 | $ | (424,189 | ) | $ | 14,710,002 | ||
163
| Bridgeport Ventures Inc. |
| Notes to the Consolidated Financial Statements |
| Years Ended April 30, 2012 and 2011 |
| (Expressed in Canadian dollars) |
| 21. | Conversion to IFRS (continued) |
| (v) | Reconciliation between IFRS and Canadian GAAP (continued) |
The April 30, 2011 Canadian GAAP balance sheet has been reconciled to IFRS as follows:
| April 30, 2011 | ||||||||
| |||||||||
| Effect of | ||||||||
| Canadian | transition to | |||||||
| GAAP | IFRS | IFRS | ||||||
| |||||||||
ASSETS | |||||||||
| |||||||||
Current assets | |||||||||
Cash and cash equivalents | $ | 22,870,894 | $ | - | $ | 22,870,894 | |||
Amounts receivable and other assets | 328,637 | - | 328,637 | ||||||
Available-for-sale investment | 280,000 | - | 280,000 | ||||||
Total current assets | 23,479,531 | - | 23,479,531 | ||||||
| |||||||||
Interest in exploration properties and deferred exploration expenditures (note 21(iii)(c)) | 7,659,047 | (81,036 | ) | 7,578,011 | |||||
Equipment | 42,902 | - | 42,902 | ||||||
Total assets | $ | 31,181,480 | $ | (81,036 | ) | $ | 31,100,444 | ||
| |||||||||
EQUITY AND LIABILITIES | |||||||||
| |||||||||
Current liabilities | |||||||||
Amounts payable and other liabilities | $ | 1,046,868 | $ | - | $ | 1,046,868 | |||
| |||||||||
Equity | |||||||||
Share capital | 31,364,501 | - | 31,364,501 | ||||||
Reserves | 7,999,728 | - | 7,999,728 | ||||||
Accumulated deficit (note 21(iii)(c)) | (9,404,617 | ) | (81,036 | ) | (9,485,653 | ) | |||
Accumulated other comprehensive income | 175,000 | - | 175,000 | ||||||
Total equity | 30,134,612 | (81,036 | ) | 30,053,576 | |||||
Total equity and liabilities | $ | 31,181,480 | $ | (81,036 | ) | $ | 31,100,444 | ||
164
| Bridgeport Ventures Inc. |
| Notes to the Consolidated Financial Statements |
| Years Ended April 30, 2012 and 2011 |
| (Expressed in Canadian dollars) |
| 21. | Conversion to IFRS (continued) |
| (v) | Reconciliation between IFRS and Canadian GAAP (continued) |
The Canadian GAAP statement of loss and comprehensive loss for the year ended April 30, 2011 has been reconciled to IFRS as follows:
| Year ended April 30, 2011 | ||||||||
| |||||||||
| Effect of | ||||||||
| Canadian | transition to | |||||||
| GAAP | IFRS | IFRS | ||||||
| |||||||||
Operating expenses | |||||||||
General and administrative | $ | 3,307,037 | $ | - | $ | 3,307,037 | |||
Total general and administrative expenses | (3,307,037 | ) | - | (3,307,037 | ) | ||||
Interest income (expense) | 153,566 | - | 153,566 | ||||||
Foreign exchange gain | (6,998 | ) | - | (6,998 | ) | ||||
Net loss before tax | (3,160,469 | ) | - | (3,160,469 | ) | ||||
Future income tax recovery (note 21(iii)(c)) | 449,189 | (424,189 | ) | 25,000 | |||||
Net loss from continuing operations | (2,711,280 | ) | (424,189 | ) | (3,135,469 | ) | |||
Net loss from discontinued operation (note 21(iii)(c)) | (4,582,034 | ) | 343,153 | (4,238,881 | ) | ||||
Net loss for the year | (7,293,314 | ) | (81,036 | ) | (7,374,350 | ) | |||
| |||||||||
Net loss from continuing operations | (2,711,280 | ) | (424,189 | ) | (3,135,469 | ) | |||
Unrealized gain on available-for-sale securities, net of tax of $25,000 | 175,000 | - | 175,000 | ||||||
Net loss and comprehensive loss for the year from continuing operations | (2,536,280 | ) | (424,189 | ) | (2,960,469 | ) | |||
Net loss and comprehensive loss for the year from discontinued operation | (4,582,034 | ) | 343,153 | (4,238,881 | ) | ||||
Net comprehensive loss for the year | $ | (7,118,314 | ) | $ | (81,036 | ) | $ | (7,199,350 | ) |
Basic and diluted net loss per share: | |||||||||
- continuing operations | $ | (0.08 | ) | $ | (0.01 | ) | $ | (0.09 | ) |
- discontinued operation | $ | (0.13 | ) | $ | 0.01 | $ | (0.12 | ) | |
- total | $ | (0.20 | ) | $ | - | $ | (0.20 | ) | |
165
| Bridgeport Ventures Inc. |
| Notes to the Consolidated Financial Statements |
| Years Ended April 30, 2012 and 2011 |
| (Expressed in Canadian dollars) |
| 21. | Conversion to IFRS (continued) |
| (v) | Reconciliation between IFRS and Canadian GAAP (continued) |
The Canadian GAAP statement of cash flows for the year ended April 30, 2011 has been reconciled to IFRS as follows:
| Year ended April 30, 2011 | ||||||||
| |||||||||
| Effect of | ||||||||
| Canadian | transition to | |||||||
| GAAP | IFRS | IFRS | ||||||
| |||||||||
Operating activities | |||||||||
Net loss for the year from continuing operations | $ | (2,711,280 | ) | $ | (424,189 | ) | $ | (3,135,469 | ) |
Adjustment for: | |||||||||
Amortization | 3,606 | - | 3,606 | ||||||
Shares-based payments | 1,352,186 | - | 1,352,186 | ||||||
Future income tax recovery (note 21 (iii) (c)) | (449,189 | ) | 424,189 | (25,000 | ) | ||||
Non-cash working capital items: | |||||||||
Amounts receivable and other assets | (215,935 | ) | - | (215,935 | ) | ||||
Amounts payable and other liabilities | (50,356 | ) | - | (50,356 | ) | ||||
Cash flow from discontinued operation | (65,051 | ) | - | (65,051 | ) | ||||
Net cash used in operating activities | (2,136,019 | ) | - | (2,136,019 | ) | ||||
Investing activities | |||||||||
Expenditures on exploration properties | (1,034,826 | ) | - | (1,034,826 | ) | ||||
Option payment received | 20,000 | - | 20,000 | ||||||
Additions to equipments | (21,747 | ) | - | (21,747 | ) | ||||
Cash flow from discontinued operation | (1,434,713 | ) | - | (1,434,713 | ) | ||||
Net cash used in investing activities | (2,471,286 | ) | - | (2,471,286 | ) | ||||
Financing activities | |||||||||
Issue of securities | 17,702,600 | - | 17,702,600 | ||||||
Share issue costs | (1,361,783 | ) | - | (1,361,783 | ) | ||||
Net cash provided by financing activities | 16,340,817 | - | 16,340,817 | ||||||
Net change in cash and cash equivalents | 11,733,512 | - | 11,733,512 | ||||||
Cash and cash equivalents, beginning of year | 11,137,382 | - | 11,137,382 | ||||||
Cash and cash equivalents, end of year | $ | 22,870,894 | $ | - | $ | 22,870,894 | |||
166
| Bridgeport Ventures Inc. |
| Notes to the Consolidated Financial Statements |
| Years Ended April 30, 2012 and 2011 |
| (Expressed in Canadian dollars) |
| 22. | Subsequent events |
(i) June 28, 2012, the Company entered into a non-binding letter of intent that sets forth the basic terms of the proposed acquisition (the “Transaction”) by Bridgeport of Premier Gold Mines Limited’s wholly-owned subsidiary, Premier Royalty Corporation (“Premier Royalty”).
Pursuant to the Transaction, Bridgeport will issue shares to Premier Gold Mines Limited ("Premier Gold") in such amount as is equal to 60% of the issued and outstanding shares of Bridgeport (prior to giving effect to any convertible securities or instruments). Bridgeport will also issue warrants to its existing shareholders on the basis of 0.375 of a warrant for each common share of Bridgeport held by such shareholders. Each whole warrant (a “Bridgeport Warrant”) will be exercisable at a price of $0.50 for a period commencing on the date that is six months following the completion of the Transaction and ending on the date that is four years following completion of the Transaction, subject to early expiry upon the occurrence of certain events.
Premier Gold has previously provided a bridge loan facility to Premier Royalty in connection with the acquisition by Premier Royalty of certain royalties. In addition to stipulated cash payback provisions, Premier Gold will be granted a one-time right in its sole discretion to convert all or a portion of the bridge loan into units of Bridgeport, each such unit consisting of one common share of Bridgeport and 0.375 of a Bridgeport Warrant. In addition, Premier Gold will receive 616,400 Bridgeport Warrants, and convertible securities of Premier Royalty granted to certain vendors of royalty interests will convert into common shares or warrants of Bridgeport in connection with the Transaction.
Premier Gold shall have the right to rename Bridgeport and set its new management team upon completion of the Transaction. Bridgeport shall be entitled to two seats on the resulting Board of Directors.
On July 10, 2012, Premier Gold announced the closing of a private placement (the “Financing”) by its wholly-owned subsidiary, Premier Royalty, of an aggregate $11,500,000.00 principal amount of convertible debentures of Premier Royalty, which accrue interest at a rate of 8% per annum. The convertible debentures mature on May 31, 2013 unless, among other things, they are automatically converted as a result of the occurrence of a going public transaction by Premier Royalty, including the closing of the Transaction. If the Transaction is completed, the convertible debentures will convert into Bridgeport units. Each unit will consist of one common share of Bridgeport and 0.375 of a Bridgeport warrant, which warrants will have the same terms as the Bridgeport Warrants discussed above. The proceeds will be used for royalty acquisitions and working capital.
In addition, in connection with the Transaction, the common shares of Bridgeport will be consolidated on such basis as is determined at the time of the definitive agreement. The dollar figures and amounts referenced above do not give effect to the consolidation. The options and existing warrants of Bridgeport will also be adjusted to reflect the consolidation of Bridgeport shares and the distribution of Bridgeport Warrants.
The Transaction is subject to, among other things, the negotiation and execution of a definitive binding agreement (the “Definitive Agreement”), approval of the board of directors of each of Premier Gold and Bridgeport, approval of Bridgeport’s shareholders, regulatory approvals, including approval of the TSX, completion of due diligence and the entering into of support and lock-up agreements by Bridgeport’s directors and officers. Premier Gold and Bridgeport have agreed to deal exclusively with each other until July 31, 2012. It is anticipated that the Definitive Agreement will be executed in the near future. Further details will be announced upon the entering into of the Definitive Agreement. CIBC World Markets Inc. is acting as financial advisor to Premier Gold and Premier Royalty in connection with the Transaction and PowerOne Capital Markets Limited is acting as financial advisor to Bridgeport in connection with the Transaction.
(ii) Subsequent to April 30, 2012, the Company made termination payments in the amount of $253,333 pursuant to management and consulting contracts described in note 20(ii). Effective June 1, 2012, the Chief Executive Officer will commit a minimum 50% of her time towards her duties.
167
ITEM 18. FINANCIAL STATEMENTS
Not applicable.
ITEM 19. EXHIBITS
| Exhibit | |
| No. Item | Description of Exhibit |
| 1.1 | Articles of Incorporation (incorporated by reference to Exhibit 1.1 to the Corporation’s registration statement on Form 20-F filed with the Commission on October 7, 2010) |
| 1.2 | Bylaw No. 1 of the Corporation (incorporated by reference to Exhibit 1.2 to the Corporation’s registration statement on Form 20-F filed with the Commission on October 7, 2010) |
| 1.3 | Bylaw No. 2 of the Corporation (incorporated by reference to Exhibit 1.3 to the Corporation’s registration statement on Form 20-F filed with the Commission on October 7, 2010) |
| 4.1 | 2007 Stock Option Plan (incorporated by reference to Exhibit 4.1 to the Corporation’s registration statement on Form 20-F filed with the Commission on October 7, 2010) |
| 4.2 | Agency Agreement dated September 25, 2009 between the Corporation and Toll Cross Securities Inc. (incorporated by reference to Exhibit 4.2 to the Corporation’s registration statement on Form 20-F filed with the Commission on October 7, 2010) |
| 4.3 | Acquisition Agreement dated November 11, 2008 between the Corporation and William Brereton in connection with the McCart property (incorporated by reference to Exhibit 4.3 to the Corporation’s registration statement on Form 20-F filed with the Commission on October 7, 2010) |
| 4.4 | Acquisition Agreement dated July 30, 2009 between the Corporation and William Brereton in connection with the McCart property (incorporated by reference to Exhibit 4.4 to the Corporation’s registration statement on Form 20-F filed with the Commission on October 7, 2010) |
| 4.5 | Purchase Agreement dated November 10, 2009 among the Corporation, Francisco Schubert Seiffert and Rio Condor Resources S.A. in connection with the acquisition of Rio Condor Resources S.A. (incorporated by reference to Exhibit 4.5 to the Corporation’s registration statement on Form 20-F filed with the Commission on October 7, 2010) |
| 4.6 | Acquisition Agreement dated January 23, 2010 among the Rio Condor Resources S.A., Mario Leoncio Contreras Villar and Asesorías e Inversiones Invermondo Limitada in connection with the Simonetta property (incorporated by reference to Exhibit 4.6 to the Corporation’s registration statement on Form 20-F filed with the Commission on October 7, 2010) |
| 4.7 | Acquisition Agreement dated December 3, 2009 between the Rio Condor Resources S.A. and Maria Teresa Ortiz Carrasco in connection with the SOESMI property (incorporated by reference to Exhibit 4.7 to the Corporation’s registration statement on Form 20-F filed with the Commission on October 7, 2010) |
| 4.8 | Amended and Restated Warrant Indenture between the Corporation and Valiant Trust Company dated September 25, 2009 governing the terms of the share purchase warrants of the Corporation issued on October 7, 2009 (incorporated by reference to Exhibit 4.8 to the Corporation’s registration statement on Form 20-F filed with the Commission on October 7, 2010) |
168
| 4.9 | Warrant Indenture between the Corporation and Valiant Trust Company dated December 1, 2009 governing the terms of the share purchase warrants of the Corporation issued on December 1, 2009 (incorporated by reference to Exhibit 4.9 to the Corporation’s registration statement on Form 20-F filed with the Commission on October 7, 2010) |
| 4.10 | Letter of Intent – Option Agreement related to the Rosario I / 10 with its Demasias dated September 11, 2009 (incorporated by reference to Exhibit 4.10 to the Corporation’s registration statement on Form 20-F filed with the Commission on October 7, 2010) |
| 4.11 | Base Salaries of Chief Executive Officer and Chief Financial Officer (incorporated by reference to Exhibit 4.11 to the Corporation’s registration statement on Form 20-F filed with the Commission on October 7, 2010) |
| 4.12 | Option Agreement for Purchase of Mining Concessions between Rio Condor Resources S.A. and Sociedad Legal Minera Eliana I Una de la Sierra San Marcos related to the Eliana I concessions dated November 5, 2009 (incorporated by reference to Exhibit 4.12 to the Corporation’s registration statement on Form 20-F filed with the Commission on October 7, 2010) |
| 4.13 | Option Agreement for Purchase of Mining Concessions between Rio Condor Resources S.A., Sociedad Legal Minera Eliana II Una de la Sierra San Marcos and Sociedad Legal Minera Eliana III Una de la Sierra San Marcos related to the Eliana II and Eliana III concessions dated November 5, 2009 (incorporated by reference to Exhibit 4.13 to the Corporation’s registration statement on Form 20-F filed with the Commission on October 7, 2010) |
| 4.14 | Option Agreement for Purchase of Mining Concessions between Rio Condor Resources S.A. and Sociedad Legal Minera Julia Una de la Sierra San Marcos related to the Julia concessions dated November 5, 2009 (incorporated by reference to Exhibit 4.14 to the Corporation’s registration statement on Form 20-F filed with the Commission on October 7, 2010) |
| 4.15 | Option Agreement for Purchase of Mining Concessions between Rio Condor Resources S.A. and Sociedad Legal Minera Rosario Una de la Sierra San Marcos related to the Rosario concessions dated November 5, 2009 (incorporated by reference to Exhibit 4.15 to the Corporation’s registration statement on Form 20-F filed with the Commission on October 7, 2010) |
| 4.16 | Option Agreement for Purchase of Mining Concessions between Rio Condor Resources S.A. and Sociedad Legal Minera Tamara I Una de la Sierra San Marcos related to the Tamara concessions dated November 5, 2009 (incorporated by reference to Exhibit 4.16 to the Corporation’s registration statement on Form 20-F filed with the Commission on October 7, 2010) |
| 4.17 | Amendment of Option Agreement for Purchase of Mining Concessions between Rio Condor Resources S.A. and Sociedad Legal Minera Tamara I Una de la Sierra San Marcos related to the Tamara concessions dated November 5, 2009 (incorporated by reference to Exhibit 4.17 to the Corporation’s registration statement on Form 20-F filed with the Commission on October 7, 2010) |
| 4.18 | Option Agreement related to the McCart property dated August 20, 2010 between the Corporation and Gondwana Gold (formerly China Opportunity) (incorporated by reference to Exhibit 4.18 to the Corporation’s registration statement on Form 20-F filed with the Commission on October 7, 2010) |
| 4.19 | Letter of Intent – Option Agreement related to the Trillador property dated June 23, 2010 (incorporated by reference to Exhibit 4.19 to the Corporation’s registration statement on Form 20-F filed with the Commission on October 7, 2010) |
| 4.20 | First Modification to Letter of Intent – Option Agreement related to the Trillador property dated August 27, 2010 (incorporated by reference to Exhibit 4.20 to the Corporation’s Amendment No. 1 to registration statement on Form 20-F filed with the Commission on November 1, 2010) |
169
| 4.21 | Purchase Agreement dated October 22, 2010 among the Corporation, BPV Gold, Fronteer Development (USA) Inc. and Nevada Eagle Resources LLC in connection with certain mining claims located in Nevada (incorporated by reference to Exhibit 4.21 to the Corporation’s Amendment No. 1 to registration statement on Form 20-F filed with the Commission on November 1, 2010) |
| |
| 4.22 | Modification to Acquisition Agreement among the Rio Condor Resources S.A., Mario Leoncio Contreras Villar and Asesorías e Inversiones Invermondo Limitada in connection with the Simonetta property dated September 15, 2010 (incorporated by reference to Exhibit 4.22 to the Corporation’s Amendment No. 1 to registration statement on Form 20-F filed with the Commission on November 1, 2010) |
| |
| 4.23 | Agency Agreement dated December 13, 2010 between the Corporation and RBC Dominion Securities Inc. and MGI Securities Inc. (incorporated by reference to Exhibit 4.23 to the Corporation’s annual report on Form 20-F for the fiscal year ended April 30, 2011 filed with the Commission on July 25, 2011) |
| |
| 4.24 | Warrant Indenture between the Corporation and Valiant Trust Company dated December 20, 2010 governing the terms of the share purchase warrants of the Corporation issued on December 20, 2010 (incorporated by reference to Exhibit 4.24 to the Corporation’s annual report on Form 20-F for the fiscal year ended April 30, 2011 filed with the Commission on July 25, 2011) |
| |
| 4.25 | Option Agreement for Purchase of Mining Concessions between Rio Condor Resources S.A. and Sociedad Legal Minera Trillador Una de la Sierra San Marco related to the Trillador concessions dated January 31, 2011 (incorporated by reference to Exhibit 4.25 to the Corporation’s annual report on Form 20-F for the fiscal year ended April 30, 2011 filed with the Commission on July 25, 2011) |
| |
| 4.26 | Letter Agreement related to the Ashby Gold property dated July 19, 2011 between the Corporation and Orsa Ventures Corp. (incorporated by reference to Exhibit 4.26 to the Corporation’s annual report on Form 20-F for the fiscal year ended April 30, 2011 filed with the Commission on July 25, 2011) |
| |
| 4.27 | |
| |
| 4.28 | |
| |
| 8.1 | |
| |
| 12.1 | Certification of Chief Executive Officer pursuant to Rule 13a-14(a) or Rule 15d-14(a) |
| |
| 12.2 | Certification of Chief Financial Officer pursuant to Rule 13a-14(a) or Rule 15d-14(a) |
| |
| 13.1 | |
| |
| 13.2 | |
| |
| 15.1 | |
| |
| 15.2 |
170
SIGNATURES
The registrant hereby certifies that it meets all of the requirements for filing on Form 20-F and that it has duly caused and authorized the undersigned to sign this annual report on its behalf.
| BRIDGEPORT VENTURES INC. | |
| Registrant | |
| Date: July 18, 2012 | /s/ Carmelo Marrelli |
| Carmelo Marrelli | |
| Chief Financial Officer |
171