Exhibit 99.1
Highly Focused, Low Risk, Above Average Growth
Bank Holding Company
Investor Presentation
July, 2015
NYSE: CUBI

2
Forward-Looking Statements
This presentation as well as other written or oral communications made from time to time by us, may contain certain forward-looking information
within the meaning of the Securities Act of 1933, as amended, and the Securities Exchange Act of 1934, as amended. These statements relate to future
events or future predictions, including events or predictions relating to our future financial performance, and are generally identifiable by the use of
forward-looking terminology such as “believes,” “expects,” “may,” “will,” “should,” “plan,” “intend,” “target,” or “anticipates” or the negative thereof
or comparable terminology, or by discussion of strategy or goals that involve risks and uncertainties. These forward-looking statements are only
predictions and estimates regarding future events and circumstances and involve known and unknown risks, uncertainties and other factors that may
cause our actual results, levels of activity, performance or achievements to be materially different from any future results, levels of activity,
performance or achievements expressed or implied by such forward-looking statements. This information is based on various assumptions by us that
may not prove to be correct. Important factors to consider and evaluate in such forward-looking statements include:
•changes in the external competitive market factors that might impact our results of operations;
•changes in laws and regulations, including without limitation changes in capital requirements under the federal prompt corrective action regulations;
•changes in our business strategy or an inability to execute our strategy due to the occurrence of unanticipated events;
•our ability to identify potential candidates for, and consummate, acquisition or investment transactions;
•the timing of acquisition or investment transactions;
•constraints on our ability to consummate an attractive acquisition or investment transaction because of significant competition for these
opportunities;
opportunities;
•the failure of the Bank to complete any or all of the transactions described herein on the terms currently contemplated;
•local, regional and national economic conditions and events and the impact they may have on us and our customers;
•ability to attract deposits and other sources of liquidity;
•changes in the financial performance and/or condition of our borrowers;
•changes in the level of non-performing and classified assets and charge-offs;
•changes in estimates of future loan loss reserve requirements based upon the periodic review thereof under relevant regulatory and accounting
requirements;
requirements;
•inflation, interest rate, securities market and monetary fluctuations;
•the timely development and acceptance of new banking products and services and perceived overall value of these products and services by users;
•changes in consumer spending, borrowing and saving habits;
•technological changes;
•the ability to increase market share and control expenses;

3
Forward-Looking Statements
• continued volatility in the credit and equity markets and its effect on the general economy;
• the effect of changes in accounting policies and practices, as may be adopted by the regulatory agencies, as well as the Public Company
Accounting Oversight Board, the Financial Accounting Standards Board and other accounting standard setters;
Accounting Oversight Board, the Financial Accounting Standards Board and other accounting standard setters;
• the businesses of the Bank and any acquisition targets or merger partners and subsidiaries not integrating successfully or such integration being
more difficult, time-consuming or costly than expected;
more difficult, time-consuming or costly than expected;
• material differences in the actual financial results of merger and acquisition activities compared with expectations, such as with respect to the full
realization of anticipated cost savings and revenue enhancements within the expected time frame;
realization of anticipated cost savings and revenue enhancements within the expected time frame;
• revenues following any merger being lower than expected;
• deposit attrition, operating costs, customer loss and business disruption following the merger, including, without limitation, difficulties in
maintaining relationships with employees being greater than expected.
maintaining relationships with employees being greater than expected.
These forward-looking statements are subject to significant uncertainties and contingencies, many of which are beyond our control. Although we
believe that the expectations reflected in the forward-looking statements are reasonable, we cannot guarantee future results, levels of activity,
performance or achievements. Accordingly, there can be no assurance that actual results will meet expectations or will not be materially lower
than the results contemplated in this presentation. You are cautioned not to place undue reliance on these forward-looking statements, which
speak only as of the date of this document or, in the case of documents referred to or incorporated by reference, the dates of those documents.
We do not undertake any obligation to release publicly any revisions to these forward-looking statements to reflect events or circumstances after
the date of this document or to reflect the occurrence of unanticipated events, except as may be required under applicable law.
This presentation is for discussion purposes only, and shall not constitute any offer to sell or the solicitation of an offer to buy any security, nor is it
intended to give rise to any legal relationship between Customers Bancorp, Inc. (the "Company") and you or any other person, nor is it a
recommendation to buy any securities or enter into any transaction with the Company. This presentation also includes estimated guidance
regarding our fully diluted earnings per share for the year 2015, which we have previously disclosed and is subject to the assumptions and
qualifications included in that previous disclosure. The guidance consists solely of estimates prepared by management based on currently
available information and assumptions of future performance of the company and the general economy. Our independent registered public
accounting firm has not audited, reviewed or performed any procedures with respect to the guidance and, accordingly, does not express an
opinion or any other form of assurance with respect to this data. Our actual results may differ from the guidance, and any such differences could
be material. Accordingly, undue reliance should not be placed on this information. The factors discussed above should be considered and
evaluated with respect to our guidance.
A $7.6 billion asset business
bank serving privately held
businesses
bank serving privately held
businesses
A consumer bank start up, set
up as a division of Customers
Bank, serving millennials,
middle income families and
underbanked throughout the
United States
up as a division of Customers
Bank, serving millennials,
middle income families and
underbanked throughout the
United States
5
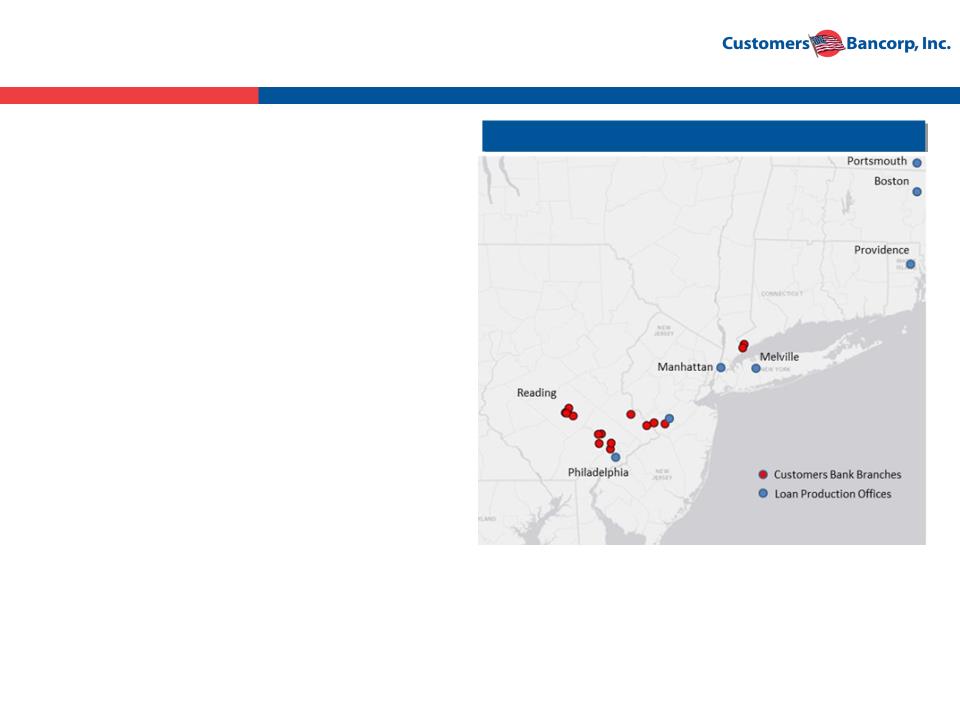
Customers Bank Overview
$7.6 bn Business Bank with 21 sales offices with
target market from Boston to Philadelphia
target market from Boston to Philadelphia
Operating in key Mid-Atlantic and Northeast
markets
markets
§ Greater New York City area (Westchester County,
Manhattan and Melville)
Manhattan and Melville)
§ Philadelphia area (Bucks, Berks, Chester, Delaware
and Philadelphia Counties in southeastern
Pennsylvania and Greater Princeton area in New
Jersey)
and Philadelphia Counties in southeastern
Pennsylvania and Greater Princeton area in New
Jersey)
§ Greater Boston area (Boston, Providence and
Portsmouth, NH)
Portsmouth, NH)
“High-touch, supported with high-tech” value
proposition
proposition
§ Very experienced teams using “Single Point of
Contact” model
Contact” model
§ Provides exceptional customer service supported by
state-of-the-art technology support
state-of-the-art technology support
§ Risk based incentive compensation plans supported
by P&L statements created by teams
by P&L statements created by teams
Branches and Loan Production Offices
6
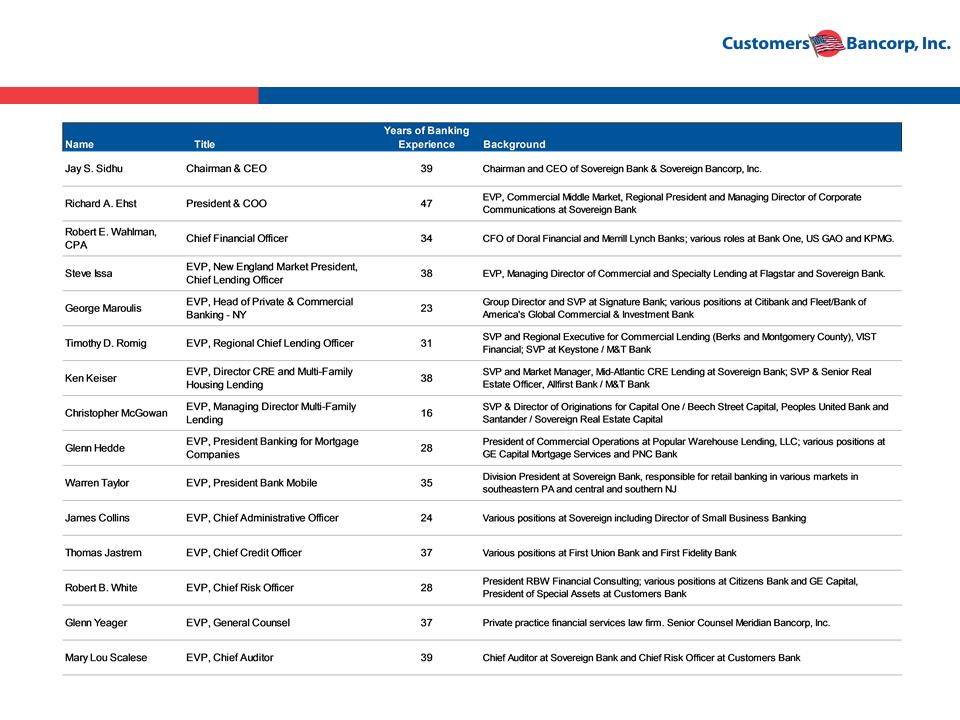
Our Competitive Advantage: A Highly Experienced Management Team

7
Investment Proposition
Strong Organic Growth, Well Capitalized, Branch Lite Bank in Attractive Markets
§ $7.6 billion asset bank with only 21 sales offices
§ Well capitalized at 11.1% total risk based capital (estimated), 7.4% tier 1 leverage, and 6.1% tangible equity to tangible assets
§ Target market from Boston to Philadelphia along Interstate 95
Strong Core Profitability, Growth & Efficient Operations
§ Q2 2015 core diluted earnings per share up 41% over Q2 2014 with a core ROA of .87% and a core ROE of 12.5%
§ Q2 2015 core net income of $14.9 million up 46% over Q2 2014
§ ROA goal of ~1% + and ROE of 12% + within 2-3 years, ROE goal already achieved
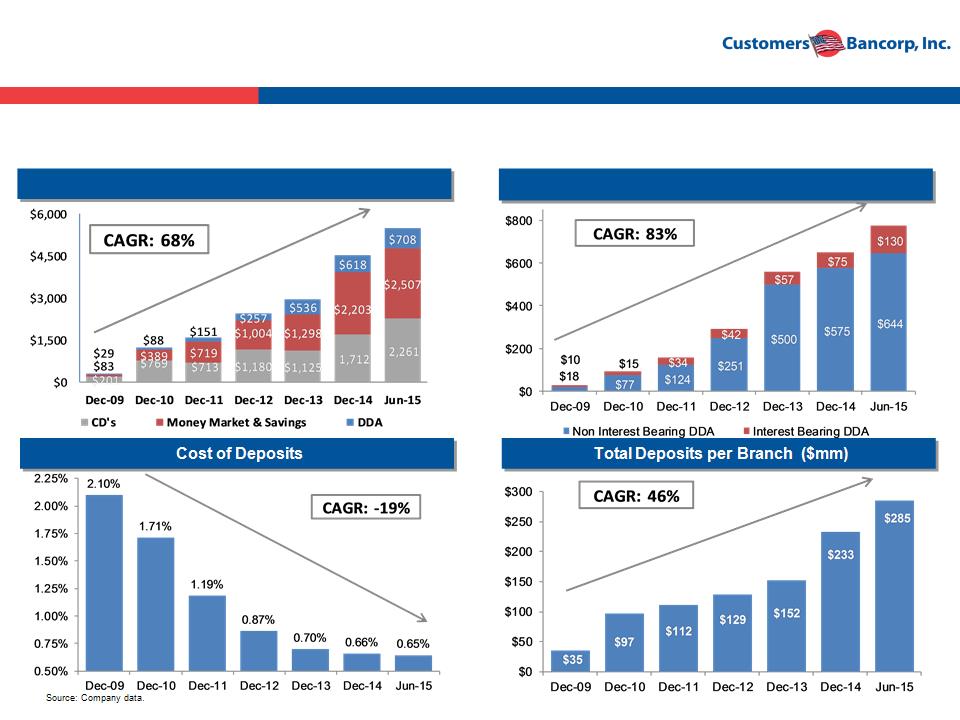
§ DDA and total deposits compounded annual growth of 83% and 68% respectively since 2009
§ Q2 2015 net interest margin was 2.73%
§ Operating efficiencies offset tighter margins and generate sustainable profitability
§ Q2 2015 efficiency ratio was 48.4%
Strong Credit Quality & Low Interest Rate Risk
§ 0.16% non-performing loans at June 30, 2015
§ Total core reserves to non-performing loans of 313.1%
§ Minimal risk of margin compression from modestly higher short term rates and flatter curve
Attractive Valuation
§ Current share price, as of June 30, 2015 $26.89 is 13.4x estimated 2015 core earnings
§ Price/tangible book only 1.5x estimated for year end 2015 core tangible book value
§ Peers, by size, trading at 14x LTM earnings and 1.7x price/tangible book; Peers with unique models trading at much higher
multiples
multiples
§ June 30, 2015 core tangible book value of $17.42, up 98% since July 2009 with a CAGR of 13%
• Non-GAAP core results including profitability measures, earnings, credit quality measures and valuation metrics exclude
the $6.0 million specific reserve for a potential fraudulent loan (see GAAP to non-GAAP core reconciliation on page 35).
the $6.0 million specific reserve for a potential fraudulent loan (see GAAP to non-GAAP core reconciliation on page 35).

8
Customers Bank
Executing On Our Unique High Performing
Banking Model

9
Disciplined Model for Increasing Shareholder Value
§ Strong organic revenue growth + scalable infrastructure =
sustainable double digit EPS = growth and increased shareholder
value
sustainable double digit EPS = growth and increased shareholder
value
§ A very robust risk management driven business strategy
§ Build tangible book value per share each quarter via earnings
§ Any book value dilution from any acquisitions must be overcome
within 1-2 years; otherwise stick with organic growth strategy
within 1-2 years; otherwise stick with organic growth strategy
§ Superior execution through proven management team
Disciplined Model for Superior Shareholder Value Creation
10
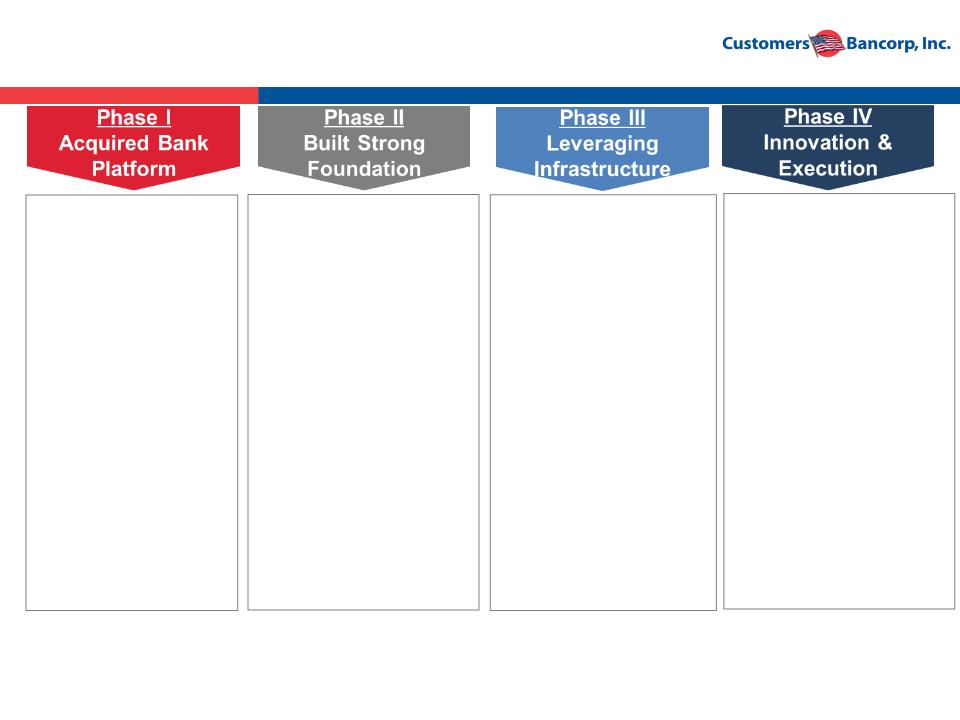
Execution Timeline
§ We invested in and
took control of a $270
million asset
Customers Bank (FKA
New Century Bank)
took control of a $270
million asset
Customers Bank (FKA
New Century Bank)
§ Identified existing
credit problems,
adequately reserved
and recapitalized the
bank
credit problems,
adequately reserved
and recapitalized the
bank
§ Actively worked out
very extensive loan
problems
very extensive loan
problems
§ Recruited experienced
management team
management team
§ Enhanced credit and risk
management
management
§ Developed infrastructure
for organic growth
for organic growth
§ Built out warehouse
lending platform and
doubled deposit and loan
portfolio
lending platform and
doubled deposit and loan
portfolio
§ Completed 3 small
acquisitions:
acquisitions:
– ISN Bank (FDIC-
assisted) ~ $70 mm
assisted) ~ $70 mm
– USA Bank (FDIC-
assisted) ~ $170 mm
assisted) ~ $170 mm
– Berkshire Bancorp
(Whole bank) ~ $85
mm
(Whole bank) ~ $85
mm
§ Recruited proven lending
teams
teams
§ Built out Commercial and
Multi-family lending
platforms
Multi-family lending
platforms
§ De Novo expansion;4-6
sales offices or teams
added each year
sales offices or teams
added each year
§ Continue to show strong
loan and deposit growth
loan and deposit growth
§ Built a “branch lite” high
growth Community Bank
and model for future
growth
growth Community Bank
and model for future
growth
§ Goals to ~12%+ ROE;
~1% ROA
~1% ROA
2009
Assets: $350M
Equity: $22M
2010-2011
Assets: $2.1B
Equity: $148M
2012-2013
Assets: $4.2B
Equity: $387M
Q2 2015
Assets: $7.6B
Core Equity: $527M
Core ROE: 12.5%
§ Single Point of Contact
Banking model executed -
commercial focus
Banking model executed -
commercial focus
§ Continued recruitment of
experienced teams
experienced teams
§ Introduce bankmobile -
banking of the future for
consumers
banking of the future for
consumers
§ Continue to show strong
loan and deposit growth
loan and deposit growth
§ ~12%+ ROE; ~1% ROA
expected within 36
months
expected within 36
months
§ ~$6.5+ billion asset bank
by end of 2014
by end of 2014
§ ~$9 billion asset bank by
end of 2017
end of 2017
Non-GAAP core results including profitability measures, earnings, equity, credit quality measures and valuation metrics exclude the $6.0 million
specific reserve for a potential fraudulent loan (see GAAP to non-GAAP core reconciliation on page 35)
specific reserve for a potential fraudulent loan (see GAAP to non-GAAP core reconciliation on page 35)

11
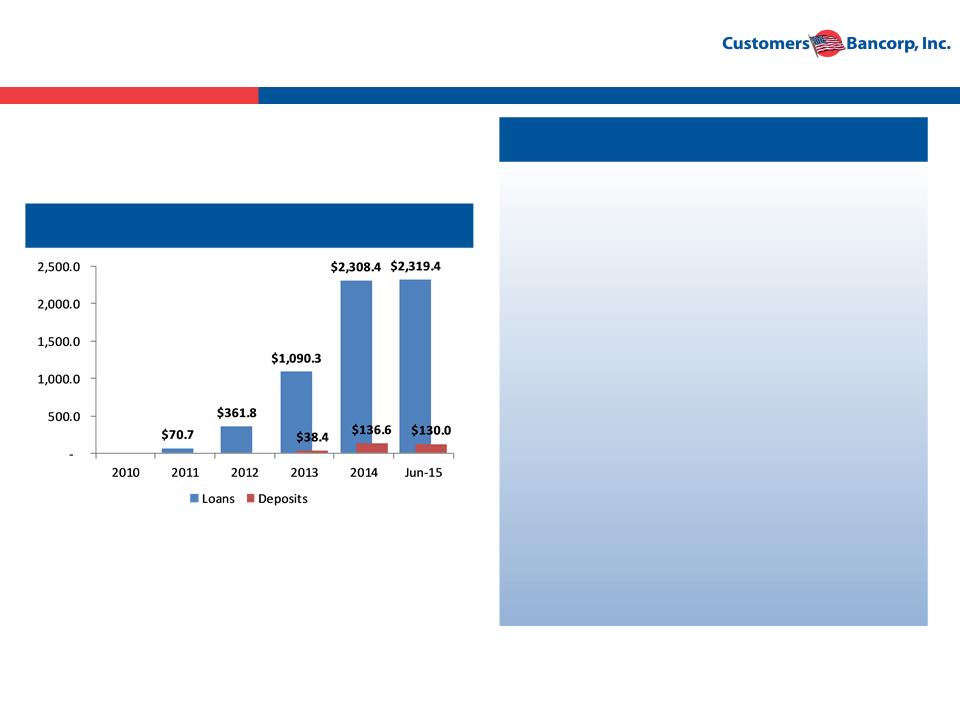
Banking Strategy - Customers Bank
Business Banking Focus - ~95% of revenues come from business segments
• Loan and deposit business through these segments:
• Banking Privately Held Businesses
• Banking High Net Worth Families
• Banking Privately Held Mortgage Companies
• Selected Commercial Real Estate
All Consumer
Products
Products
All Business
Products
Products
All Non-Credit
Products
Products
Client
Makes
One Call
Makes
One Call
Client
Private /
Personal
Bankers
Personal
Bankers
Concierge
Bankers
Bankers
Single Point of Contact
High Touch / High Tech
12
Results in: Organic Growth of Deposits with Controlled Costs
Total Deposit Growth ($mm)
Average DDA Growth ($mm)
Customers strategies of single point of contact and recruiting known teams in target markets produce
rapid deposit growth with low total cost
rapid deposit growth with low total cost
13
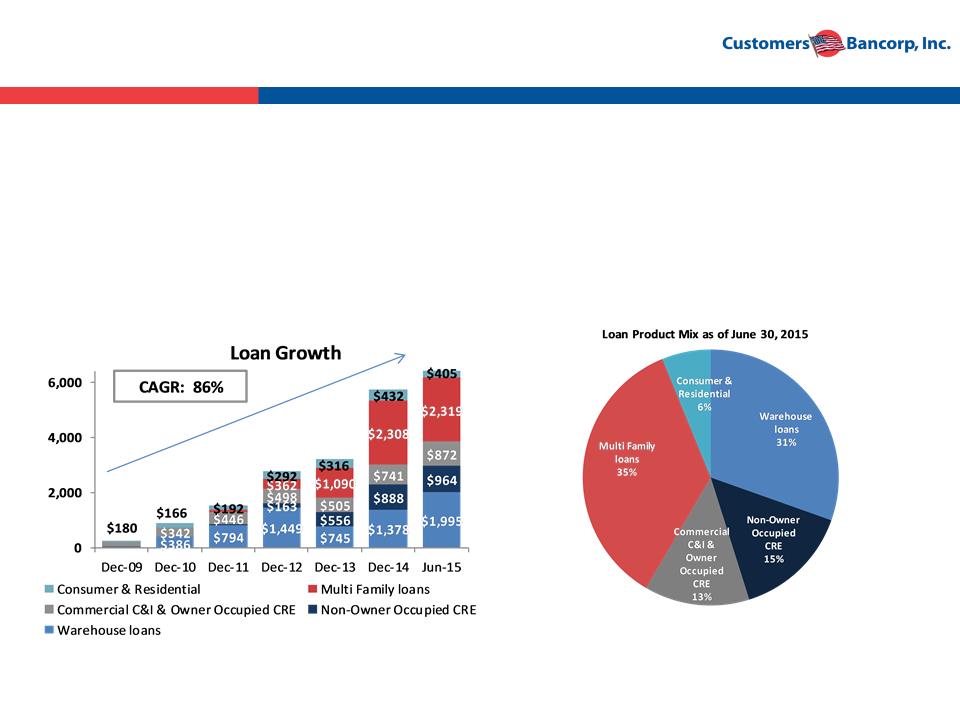
Lending Strategy
High Growth with Strong Credit Quality
§Continuous recruitment and retention of high quality teams
§Centralized credit committee approval for all loans
§Loans are stress tested for higher rates and a slower economy
§No losses on loans originated since new management team took over
§Creation of solid foundation for future earnings
Source: Company documents.
14
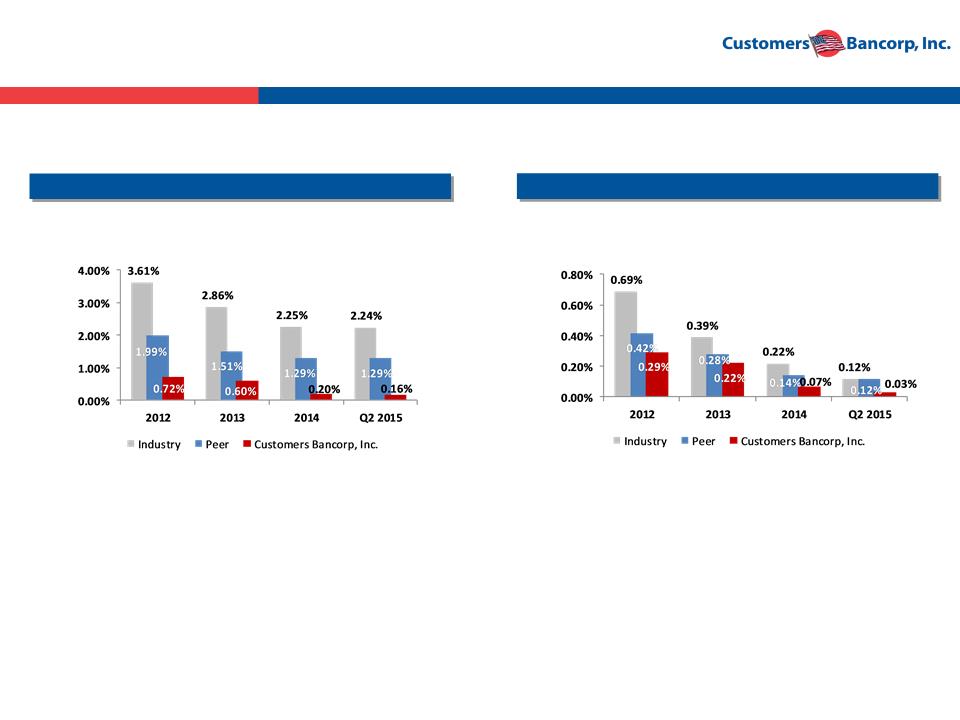
NPL
Source: SNL Financial, Company documents. Peer data consists of Northeast and Mid-Atlantic banks and thrifts with assets between $3.0 billion and $8.0 billion. Industry data includes all FDIC insured banks.
Peer and Industry data as of March 31, 2015.
Peer and Industry data as of March 31, 2015.
Build an Outstanding Loan Quality Portfolio
Charge Offs
Customers non-performing loans at June 2015 excluding loans guaranteed by the FDIC were 0.12% of total loans.
Asset Quality Indicators Continue to Improve

15
C&I & Owner Occupied CRE Banking Strategy
Private & Commercial Banking
§Target companies with up to $100 million
annual revenues
annual revenues
§Very experienced teams
§Two new teams with 10 professionals added
year to date
year to date
§Single point of contact
§NE, NY, PA & NJ markets
Small Business
§Target companies with less than $5.0 million
annual revenue
annual revenue
§Principally SBA loans originated by small
business relationship managers or branch
network
business relationship managers or branch
network
§Current focus PA & NJ markets. Expanding
to National Markets
to National Markets
Banking Privately Held Business
C&I / Owner Occupied CRE Loan and Deposit
Growth ($mm)
Growth ($mm)
Source: Company documents.
16
Multi-Family Banking Strategy
Banking High Net Worth Families
Multi-Family Loan and Deposit Growth ($mm)
§ Focus on families that have income
producing real estate in their portfolios
producing real estate in their portfolios
§ Private banking approach
§ Focus Markets: New York & Philadelphia
MSAs
MSAs
§ Average Loan Size: $4.0 - $5.0 million
§ Remote banking for deposits and other
relationship based loans
relationship based loans
§ Portfolio grown organically from a start up
with very experienced teams hired in the
past 3 years
with very experienced teams hired in the
past 3 years
§ Strong credit quality niche
§ Interest rate risk managed actively
Source: Company documents.
17
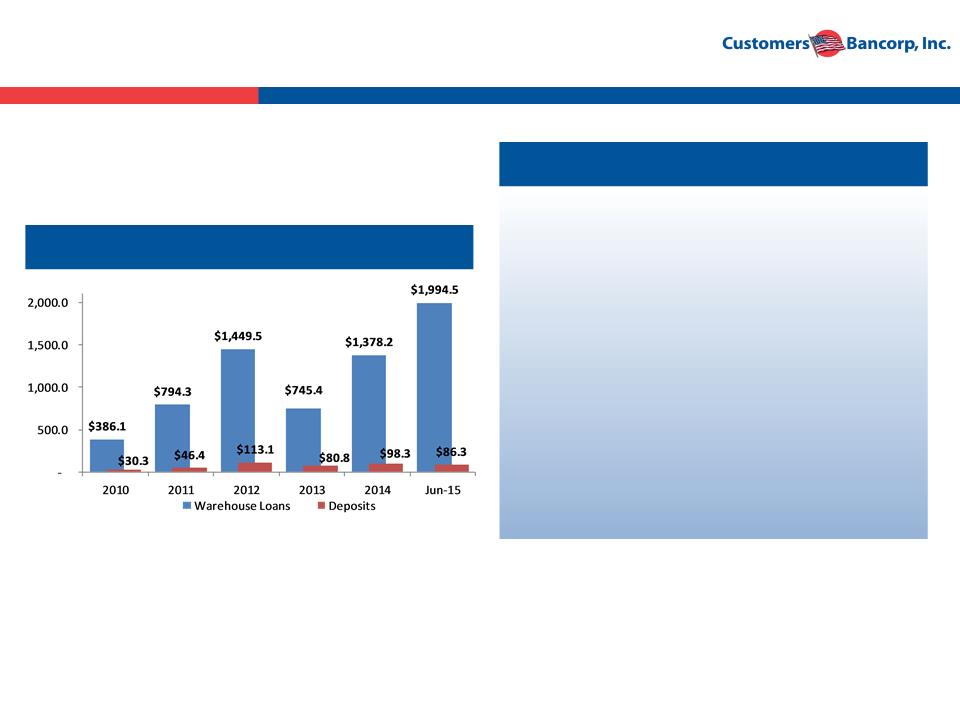
Mortgage Warehouse Banking Strategy
§Private banking focused on mortgage
companies with $5 to $10 million equity
companies with $5 to $10 million equity
§Very strong credit quality relationship
business with good fee income and deposits
business with good fee income and deposits
§~75 strong warehouse clients
§All outstanding loans are variable rate and
classified as held for sale
classified as held for sale
§All deposits are non-interest bearing DDA’s
§Balances rebounding from 2013 low and
expected to stay at this level
expected to stay at this level
Banking Mortgage Companies
Mortgage Warehouse Banking Loan and Deposit
Growth ($mm)
Growth ($mm)
Source: Company documents.
18
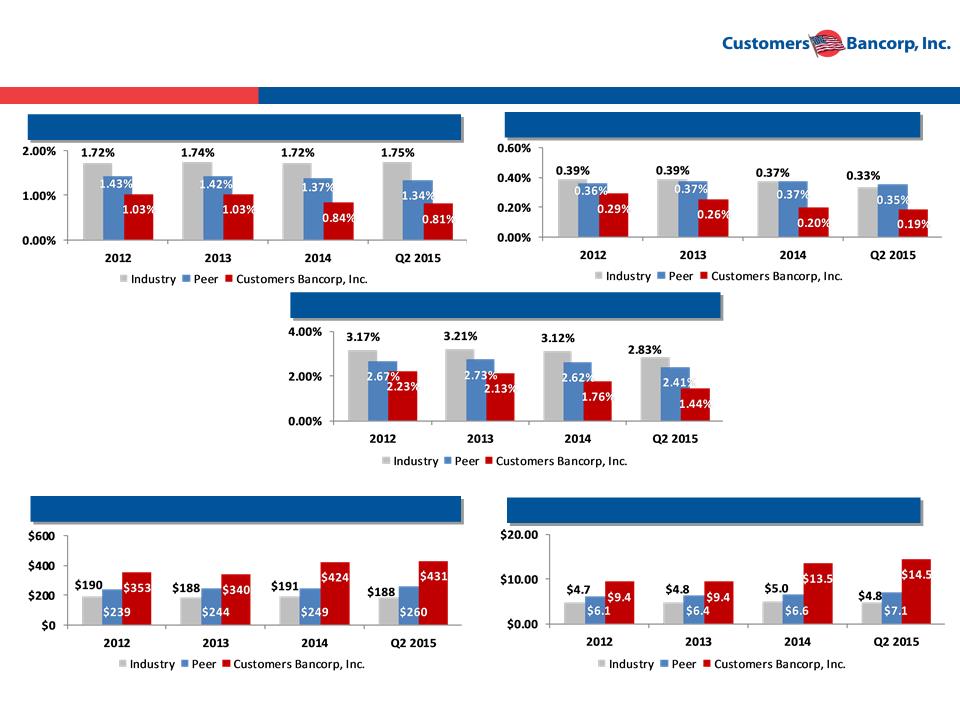
Staff Expense Ratio
Build Efficient Operations
Source: SNL Financial, Company documents. Peer data consists of Northeast, and Mid-Atlantic banks and thrifts with assets between $3.0 billion and $8.0 billion. Industry data includes all FDIC insured banks.
Peer and Industry data as of March 31, 2015.
Peer and Industry data as of March 31, 2015.
Occupancy Expense Ratio
Total Costs as a % of Assets
Total Revenue per Employee ($000s)
Assets per Employee ($mm)
19
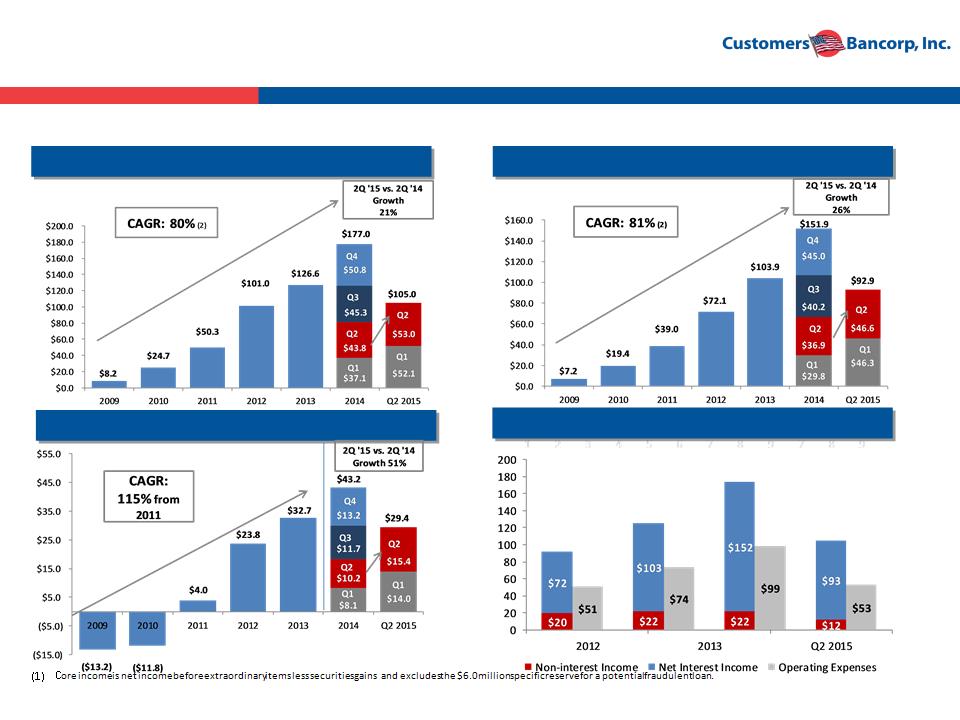
Deposit, Lending and Efficiency Strategies Results in
Disciplined & Profitable Growth
Disciplined & Profitable Growth
Core Revenue ($mm)
Core Net Income ($mm) (1)
(2) CAGR calculated from Dec-09 to June 2015 (annualized).
(3) Non-GAAP core results including profitability measures, earnings, credit quality measures and valuation metrics exclude the $6.0 million specific reserve for a potential fraudulent
loan (see GAAP to non-GAAP core reconciliation on page 35).
loan (see GAAP to non-GAAP core reconciliation on page 35).
Net Interest Income ($mm)
• Strategy execution has produced superior growth in revenues and core earnings
Income / Expense Growth ($mm)

20
Customers Bank
Risk Management
21
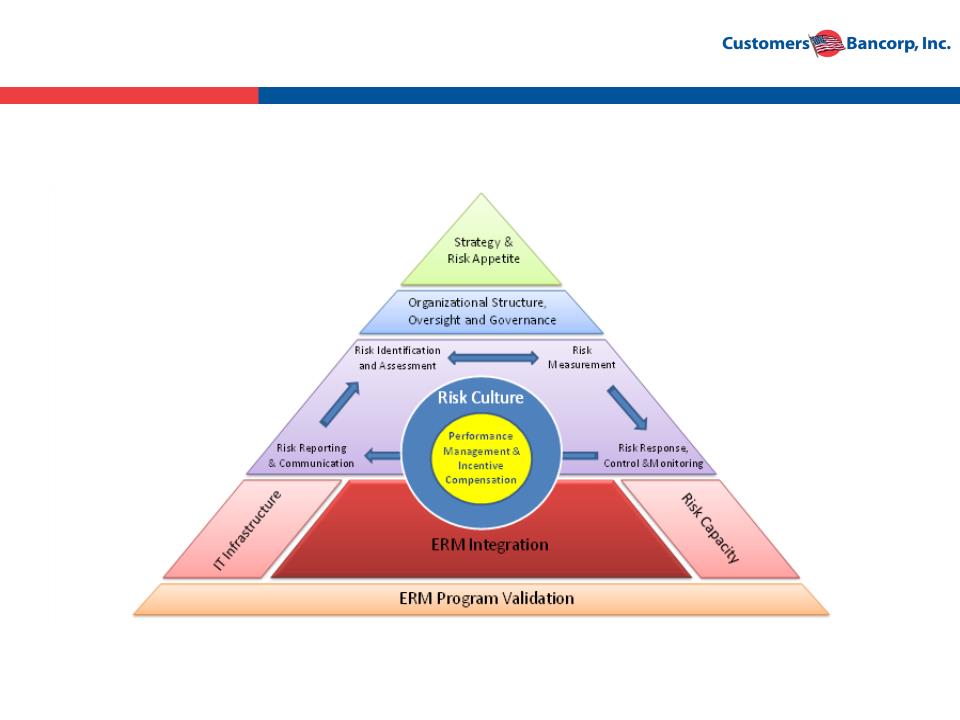
Elements of an Effective Risk Management Program
22
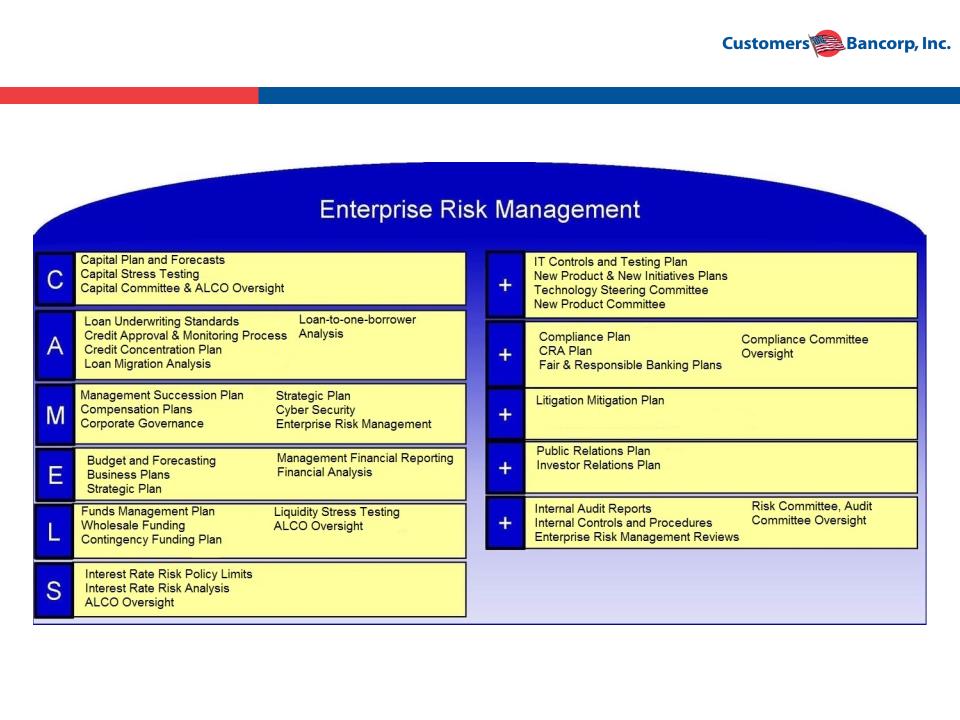
ERM Framework at Customers Bancorp, Inc.
Well Defined ERM Plan - ERM Integration into CAMELS +++++

23
Current Banking Environment and
How We are Positioned
How We are Positioned

24
What We See as The Role of CEO and Board …
Especially in this Environment
Especially in this Environment
1. Absolute clarity of your vision, strategy, goals and tactics;
there must be absolute alignment between board and
management
there must be absolute alignment between board and
management
2. Become a master of your internal environment
§ Our authentic internal assessment of strengths,
weaknesses and opportunities
weaknesses and opportunities
3. Be a master of your external environment
§ What is happening with customer trends, technology,
competition, economy, regulatory environment, etc. -
How does this impact us?
competition, economy, regulatory environment, etc. -
How does this impact us?
4. Highest level of integrity and fairness in all we do
5. Passion for continuous improvement
25
Banking Industry Trends……
How Do We Deal with These Issues
Impediments to Growth
External Forces
• Role of traditional bank branches
changing very rapidly
changing very rapidly
• Mobile banking fastest growing channel
• Banks of all sizes revisiting their
business strategies, revenue generation
models and cost structures
business strategies, revenue generation
models and cost structures
• Technology & customer needs, desires
and style changing rapidly
and style changing rapidly
• Traditional CRE lending very difficult to do
• Very little consumer loan growth;
headwinds for consumer credit quality
headwinds for consumer credit quality
• Growth exists only at niche players
• Mortgage banking revenues are
extremely volatile
extremely volatile
• Pressure to reduce or eliminate Overdraft
and other nuisance fees by CFPB
and other nuisance fees by CFPB
• Regulators have no appreciation or
incentive to see banks grow profitability
incentive to see banks grow profitability
Business Issues
Shareholder Expectations
• Start bank and sell at 2 to 3x book no
longer an option - what do shareholders of
small privately held banks do?
longer an option - what do shareholders of
small privately held banks do?
• Equity markets not available to small
banks
banks
• Banks need to earn 10% or more ROE if
they want to remain independent
they want to remain independent
• Consistent ROE of 12% or greater and
ROA of 1% or greater being rewarded well
by market
ROA of 1% or greater being rewarded well
by market
• Slow economic growth
• Low good quality consumer and business
loan demand
loan demand
• Pressure continues on margin. Days of
3.5%-4.0% margin are gone. Banks need
to reduce efficiency ratios
3.5%-4.0% margin are gone. Banks need
to reduce efficiency ratios
• Difficult to attract good talent
• Very difficult and inconsistent regulatory
environment
environment
• Shareholders want 10%+ ROE, consistent
quality growth and strong risk
management infrastructure
quality growth and strong risk
management infrastructure
Issues facing
Boards &
CEO’s
Boards &
CEO’s
What is our unique strategy
for revenue and profitable
growth
for revenue and profitable
growth
How do we attract and retain
best talent?
best talent?
How do we take advantage of
technology?
technology?
How do we deal with growing
compliance burden?
compliance burden?
How do we manage our risks
better than peers?
better than peers?
How do we lower our
efficiency ratios?
efficiency ratios?
26
§ Innovator / disruptor / not
branch dependent
branch dependent
§ Differentiated / Unique model
§ Technology savvy
Our Thesis on Current
U.S. Banking Environment
Credit Improving - Though Banks Face a Number of Operational Headwinds
§ Credit Improving
§ Quality Asset Generation Remains A Challenge
4 Banks are starved for interest-earning assets and exploring new asset classes, competing on price and looking into specialty finance business / lending
§ NIM Compression
4 Low rate environment for the foreseeable future will continue to compress NIM
4 Many institutions wither betting on rates or otherwise taking excessive interest rate risk
4 Industry NIM continues to decline
4 Down over 100 bps since 1995
4 Low interest rate environment, competitive pressures likely to prevent return to historical levels
§ Operational leverage
4 Expense management is top of mind as banks try to improve efficiency in light of revenue pressure and increased regulatory / compliance costs
4 Regulatory pressure expected to stay robust
§ New Strategies
4 Yesterdays strategies may not be appropriate tomorrow
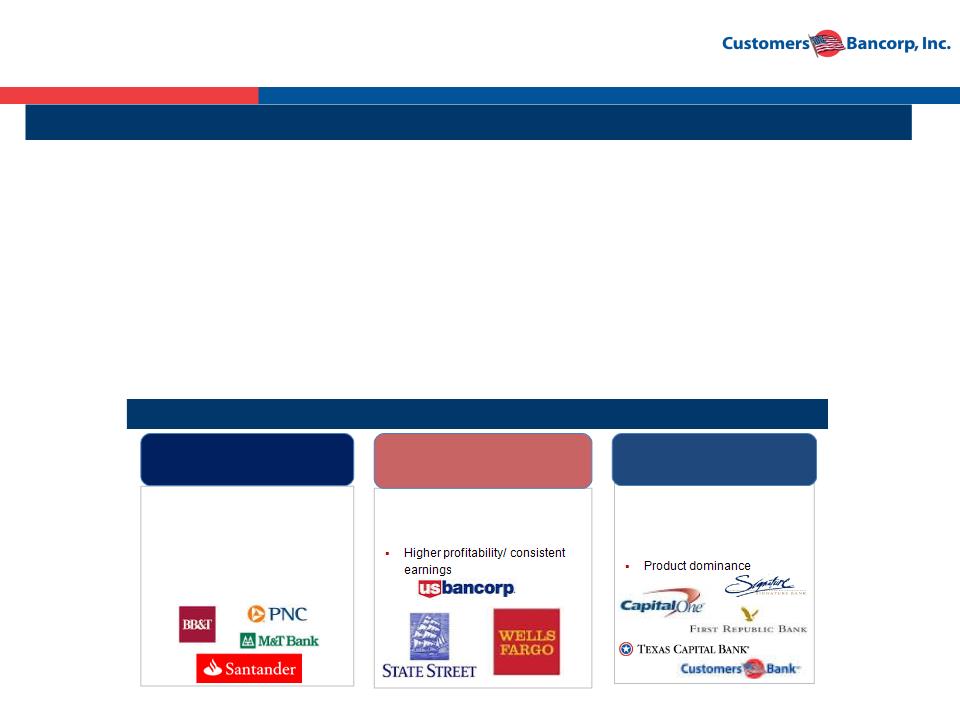
Critical to Have a Winning Business Model
§ Heavy branch based delivery
system
system
§ Strong credit quality
§ Core deposits
§ Dependent on OD fees
§ Expense management
Traditional Banks
§ Diversified revenue sources
§ Cross sell strength
§ Capital efficiency
Fee Income Leaders
Relationship & Innovative
Banks
Banks
Source: SNL Financial.
1Includes data for top 50 U.S. banks by assets.

27
Our Approach to Developing a Winning Business
Model
1. Must focus on both “Relationship” or “High Touch” banking combined with
“Highly Efficient” or “High Tech”. Strategy should be unique as to not be copied
easily
“Highly Efficient” or “High Tech”. Strategy should be unique as to not be copied
easily
2. Attract and retain best high quality talent. Business Bankers / Relationship
Bankers with approximately 15 years+ experience who bring a book of business
with them
Bankers with approximately 15 years+ experience who bring a book of business
with them
3. Compensate leaders based upon risk and profitability with both cash and equity
4. Never deviate from following critical success factors
• Only focus on very strong credit quality niches
• Have very strong risk management culture
• Have significantly lower efficiency ratio than peers to deliver sustainable
strong profitability and growth with lower margin and lower risk profile
strong profitability and growth with lower margin and lower risk profile
• Always attract and retain top quality talent
• Culture of innovation and continuous improvement
28

29
Startling Facts about Banks
§ Banks each year charge $32 billion in overdraft fees - that’s
allowing or creating over 1 billion overdrafts each year….Why??
allowing or creating over 1 billion overdrafts each year….Why??
§ Payday lenders charge consumers another $7 billion in fees
§ That’s more than 3x what America spends on Breast Cancer and
Lung Cancer combined
Lung Cancer combined
§ This is about 50% of all America spends on Food Stamps
§ Some of banking industries most profitable consumer customers
hate banks
hate banks
§ Another estimated 25% consumers are unbanked or under banked
This should not be happening in America
We hope to start, in a small way, a new revolution
to profitably address this problem
to profitably address this problem
30
§ New no fee banking, 25 bps higher interest savings, line of credit, 55,000 ATM’s, Personal
Banker and more, all in the palm of your hand
Banker and more, all in the palm of your hand
§ Marketing Strategy
§ Target technology dependent younger consumers; including underserved /
underbanked and middle income Americans
underbanked and middle income Americans
§ Capitalize on retaining at least 25% of our ~ one million student customers over a 5
year period
year period
§ Reach middle income markets also through Affinity Banking Groups
§ Revenue generation from debit card interchange and margin from low cost core
deposits
deposits
§ Durbin Amendment a unique opportunity for Bank Mobile
§ Total investment not to exceed about $6.0 million by end of 2015
§ Expected to achieve profitability in 2-3 years and above average, franchise value, ROA and
ROE within 5 years
ROE within 5 years
Creating a Virtual Bank
for the Future for Consumers
for the Future for Consumers
31
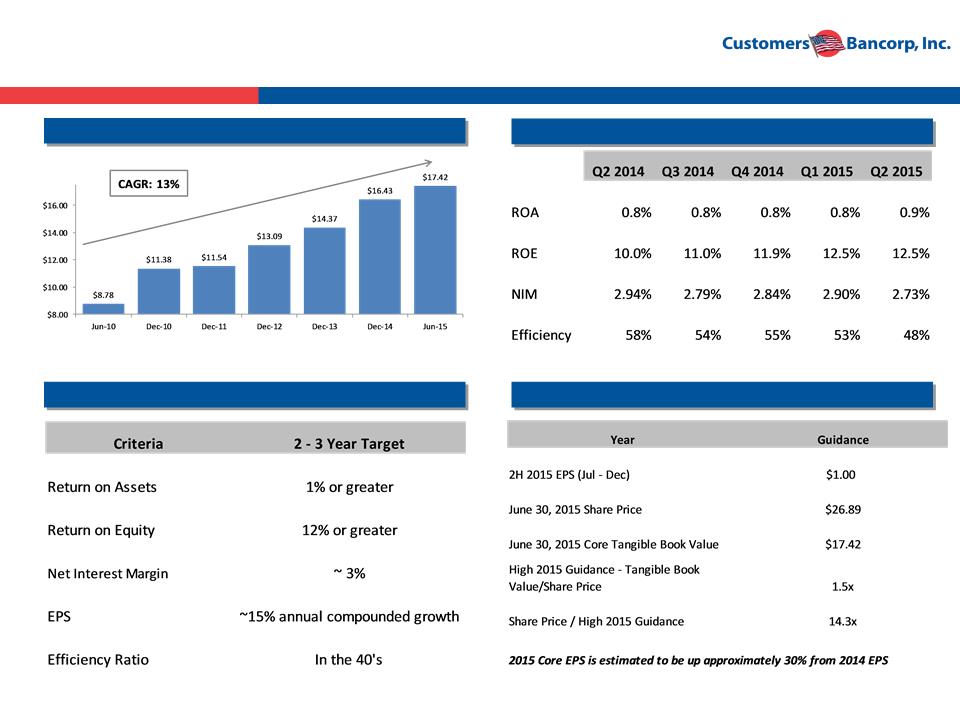
Core Tangible BV per Share
Building Customers to Provide Superior Returns to
Investors
Investors
Recent Core Performance Results
Financial Performance Targets
Earnings per Share Guidance / Valuation Multiples
• Non-GAAP core results including profitability measures, earnings, credit quality measures and valuation metrics exclude
the $6.0 million specific reserve for a potential fraudulent loan (see GAAP to Non-GAAP reconciliation on page 35)
the $6.0 million specific reserve for a potential fraudulent loan (see GAAP to Non-GAAP reconciliation on page 35)

32
Summary
§ Strong high performing $7.6 billion bank with significant growth opportunities
§ Very experienced management team delivers strong results
§ Ranked #1 overall by Bank Director Magazine in the 2012 and 2013 Growth
Leader Rankings
Leader Rankings
§ “High touch, high tech” processes and technologies result in superior growth,
returns and efficiencies
returns and efficiencies
§ Shareholder value results from the combination of increasing tangible book, ROE
and strong and consistent earnings growth
and strong and consistent earnings growth
§ Attractive risk-reward: growing several times faster than industry average but
yet trading at a significant discount to peers
yet trading at a significant discount to peers
§ Building the first real mobile bank in the palm of your hand for consumers in the
U.S.
U.S.

33
Contacts
Company:
Robert Wahlman, CFO
Tel: 610-743-8074
rwahlman@customersbank.com
rwahlman@customersbank.com
www.customersbank.com
Jay Sidhu
Chairman & CEO
Tel: 610-301-6476
jsidhu@customersbank.com
jsidhu@customersbank.com
www.customersbank.com
Investor Relations:
Ted Haberfield
President, MZ North America
Tel: 760-755-2716
thaberfield@mzgroup.us
www.mzgroup.us

Appendix

35
Non GAAP Reconciliation
CUSTOMERS BANCORP, INC. AND SUBSIDIARIES | ||||||||||||
Reconciliation of GAAP to Non-GAAP Measures (Unaudited) | ||||||||||||
Reconciliation of GAAP Net Income to Core Earnings | ||||||||||||
(amounts in thousands) | Three Months Ended June 30, 2015 | Six Months Ended June 30, 2015 | ||||||||||
Net Income | Diluted EPS | Net Income | Diluted EPS | |||||||||
GAAP net income available to common shareholders | $ | 11,049 | $ | 0.39 | $ | 25,001 | $ | 0.88 | ||||
After-tax effect of the $6.0 million specific allowance | 3,870 | 0.13 | 3,870 | 0.14 | ||||||||
Core Earnings | $ | 14,919 | $ | 0.52 | $ | 28,871 | $ | 1.02 | ||||
Weighted average shares | 28,681 | 28,522 | ||||||||||
Reconciliation of GAAP to Non-GAAP Financial Metrics | |||||||||
(amounts in thousands) | Three Months Ended June 30, 2015 | ||||||||
GAAP Amounts | Reconciling Item | Non-GAAP Amounts | |||||||
Net Income | $ | 11,556 | $ | 3,870 | $ | 15,426 | |||
Average Total Assets | 7,110,199 | 43 | 7,110,242 | ||||||
Average Equity | 496,557 | 43 | 496,660 | ||||||
Return on Average Assets | 0.65 | % | 0.22 | % | 0.87 | % | |||
Return on Average Equity | 9.33 | % | 3.13 | % | 12.46 | % | |||

36
Income Statement
CUSTOMERS BANCORP, INC. AND SUBSIDIARIES | |||||||||||
CONSOLIDATED STATEMENTS OF OPERATIONS FOR THE THREE MONTHS ENDED - UNAUDITED | |||||||||||
(Dollars in thousands, except per share data) | |||||||||||
Q2 | Q1 | Q2 | |||||||||
2015 | 2015 | 2014 | |||||||||
Interest income: | |||||||||||
Loans receivable, including fees | $ | 42,801 | $ | 43,093 | $ | 35,220 | |||||
Loans held for sale | 13,522 | 10,900 | 6,715 | ||||||||
Investment securities | 2,253 | 2,363 | 2,543 | ||||||||
Other | 1,107 | 2,362 | 614 | ||||||||
Total interest income | 59,683 | 58,718 | 45,092 | ||||||||
Interest expense: | |||||||||||
Deposits | 8,145 | 7,526 | 5,727 | ||||||||
Other borrowings | 1,496 | 1,488 | 1,184 | ||||||||
FHLB Advances | 1,799 | 1,689 | 1,141 | ||||||||
Subordinated debt | 1,685 | 1,685 | 110 | ||||||||
Total interest expense | 13,125 | 12,388 | 8,162 | ||||||||
Net interest income | 46,558 | 46,330 | 36,930 | ||||||||
Provision for loan losses | 9,335 | 2,964 | 2,886 | ||||||||
Net interest income after provision for loan losses | 37,223 | 43,366 | 34,044 | ||||||||
Non-interest income: | |||||||||||
Mortgage warehouse transactional fees | 2,799 | 2,273 | 2,215 | ||||||||
Mortgage loan and banking income | 287 | 151 | 1,554 | ||||||||
Bank-owned life insurance income | 1,169 | 1,061 | 836 | ||||||||
Gain on sale of loans | 827 | 1,231 | 572 | ||||||||
Gain (loss) on sale of investment securities | (69 | ) | — | 359 | |||||||
Deposit fees | 247 | 179 | 212 | ||||||||
Other | 1,133 | 838 | 1,163 | ||||||||
Total non-interest income | 6,393 | 5,733 | 6,911 | ||||||||
Non-interest expense: | |||||||||||
Salaries and employee benefits | 14,448 | 13,952 | 11,591 | ||||||||
FDIC assessments, taxes, and regulatory fees | 995 | 3,278 | 3,078 | ||||||||
Occupancy | 2,199 | 2,101 | 1,911 | ||||||||
Professional services | 2,792 | 1,913 | 1,881 | ||||||||
Technology, communication and bank operations | 2,838 | 2,531 | 2,305 | ||||||||
Other real estate owned expense (income) | (580 | ) | 884 | 890 | |||||||
Loan workout expense (income) | (13 | ) | 269 | 477 | |||||||
Advertising and promotion | 429 | 347 | 428 | ||||||||
Other | 2,552 | 2,190 | 2,644 | ||||||||
Total non-interest expense | 25,660 | 27,465 | 25,205 | ||||||||
Income before tax expense | 17,956 | 21,634 | 15,750 | ||||||||
Income tax expense | 6,400 | 7,682 | 5,517 | ||||||||
Net income | 11,556 | 13,952 | 10,233 | ||||||||
Preferred stock dividend | 507 | — | — | ||||||||
Net income available to common shareholders | $ | 11,049 | $ | 13,952 | $ | 10,233 | |||||
Basic earnings per share | $ | 0.41 | $ | 0.52 | $ | 0.38 | |||||
Diluted earnings per share | 0.39 | 0.49 | 0.37 | ||||||||

37
Income Statement
CUSTOMERS BANCORP, INC. AND SUBSIDIARIES | |||||||
CONSOLIDATED STATEMENTS OF OPERATIONS FOR THE SIX MONTHS ENDED - UNAUDITED | |||||||
(Dollars in thousands, except per share data) | |||||||
June 30, | June 30, | ||||||
2015 | 2014 | ||||||
Interest income: | |||||||
Loans receivable, including fees | $ | 85,894 | $ | 63,576 | |||
Loans held for sale | 24,422 | 11,798 | |||||
Investment securities | 4,616 | 5,583 | |||||
Other | 3,469 | 1,011 | |||||
Total interest income | 118,401 | 81,968 | |||||
Interest expense: | |||||||
Deposits | 15,671 | 11,142 | |||||
Other borrowings | 2,984 | 2,340 | |||||
FHLB Advances | 3,488 | 1,637 | |||||
Subordinated debt | 3,370 | 126 | |||||
Total interest expense | 25,513 | 15,245 | |||||
Net interest income | 92,888 | 66,723 | |||||
Provision for loan losses | 12,299 | 7,253 | |||||
Net interest income after provision for loan losses | 80,589 | 59,470 | |||||
Non-interest income: | |||||||
Mortgage warehouse transactional fees | 5,072 | 3,974 | |||||
Mortgage loan and banking income | 438 | 1,963 | |||||
Bank-owned life insurance income | 2,230 | 1,670 | |||||
Gain on sale of loans | 2,058 | 571 | |||||
Gain (loss) on sale of investment securities | (69 | ) | 3,191 | ||||
Deposit fees | 426 | 426 | |||||
Other | 1,971 | 2,425 | |||||
Total non-interest income | 12,126 | 14,220 | |||||
Non-interest expense: | |||||||
Salaries and employee benefits | 28,400 | 20,942 | |||||
FDIC assessments, taxes, and regulatory fees | 4,273 | 5,209 | |||||
Occupancy | 4,300 | 3,942 | |||||
Professional services | 4,705 | 4,163 | |||||
Technology, communication and bank operations | 5,369 | 4,470 | |||||
Other real estate owned expense | 304 | 1,242 | |||||
Loan workout | 256 | 918 | |||||
Advertising and promotion | 776 | 843 | |||||
Other | 4,742 | 4,642 | |||||
Total non-interest expense | 53,125 | 46,371 | |||||
Income before tax expense | 39,590 | 27,319 | |||||
Income tax expense | 14,082 | 8,945 | |||||
Net income | 25,508 | 18,374 | |||||
Preferred stock dividend | 507 | — | |||||
Net income available to common shareholders | $ | 25,001 | $ | 18,374 | |||
Basic earnings per share | $ | 0.93 | $ | 0.69 | |||
Diluted earnings per share | 0.88 | 0.66 | |||||

38
Balance Sheet
CUSTOMERS BANCORP, INC. AND SUBSIDIARIES | |||||||||||
CONSOLIDATED BALANCE SHEET - UNAUDITED | |||||||||||
(Dollars in thousands, except per share data) | |||||||||||
June 30, | December 31, | June 30, | |||||||||
2015 | 2014 | 2014 | |||||||||
ASSETS | |||||||||||
Cash and due from banks | $ | 44,064 | $ | 62,746 | $ | 48,521 | |||||
Interest-earning deposits | 347,525 | 308,277 | 217,013 | ||||||||
Cash and cash equivalents | 391,589 | 371,023 | 265,534 | ||||||||
Investment securities available for sale, at fair value | 373,953 | 416,685 | 425,061 | ||||||||
Loans held for sale | 2,030,348 | 1,435,459 | 1,061,395 | ||||||||
Loans receivable | 4,524,825 | 4,312,173 | 3,644,104 | ||||||||
Allowance for loan losses | (37,491 | ) | (30,932 | ) | (28,186 | ) | |||||
Total loans receivable, net of allowance for loan losses | 4,487,334 | 4,281,241 | 3,615,918 | ||||||||
FHLB, Federal Reserve Bank, and other restricted stock | 78,148 | 82,002 | 75,558 | ||||||||
Accrued interest receivable | 15,958 | 15,205 | 11,613 | ||||||||
FDIC loss sharing receivable | — | 2,320 | 8,919 | ||||||||
Bank premises and equipment, net | 11,453 | 10,810 | 11,075 | ||||||||
Bank-owned life insurance | 155,940 | 138,676 | 106,668 | ||||||||
Other real estate owned | 13,319 | 15,371 | 12,885 | ||||||||
Goodwill and other intangibles | 3,658 | 3,664 | 3,670 | ||||||||
Other assets | 55,943 | 52,914 | 37,432 | ||||||||
Total assets | $ | 7,617,643 | $ | 6,825,370 | $ | 5,635,728 | |||||
LIABILITIES AND SHAREHOLDERS' EQUITY | |||||||||||
Demand, non-interest bearing | $ | 584,380 | $ | 546,436 | $ | 555,936 | |||||
Interest-bearing deposits | 4,892,777 | 3,986,102 | 3,134,958 | ||||||||
Total deposits | 5,477,157 | 4,532,538 | 3,690,894 | ||||||||
FHLB advances | 1,388,000 | 1,618,000 | 1,301,500 | ||||||||
Other borrowings | 88,250 | 88,250 | 88,250 | ||||||||
Subordinated debt | 110,000 | 110,000 | 112,000 | ||||||||
Accrued interest payable and other liabilities | 30,735 | 33,437 | 29,344 | ||||||||
Total liabilities | 7,094,142 | 6,382,225 | 5,221,988 | ||||||||
Preferred Stock | 55,569 | — | — | ||||||||
Common stock | 27,402 | 27,278 | 27,262 | ||||||||
Additional paid in capital | 359,455 | 355,822 | 353,371 | ||||||||
Retained earnings | 93,422 | 68,421 | 43,581 | ||||||||
Accumulated other comprehensive loss | (4,114 | ) | (122 | ) | (2,220 | ) | |||||
Treasury stock, at cost | (8,233 | ) | (8,254 | ) | (8,254 | ) | |||||
Total shareholders' equity | 523,501 | 443,145 | 413,740 | ||||||||
Total liabilities & shareholders' equity | $ | 7,617,643 | $ | 6,825,370 | $ | 5,635,728 | |||||

39
Net Interest Margin
CUSTOMERS BANCORP, INC. AND SUBSIDIARIES | |||||||||
AVERAGE BALANCE SHEET / NET INTEREST MARGIN (UNAUDITED) | |||||||||
(Dollars in thousands, except per share data) | |||||||||
Six Months Ended June 30, | |||||||||
2015 | 2014 | ||||||||
Average Balance | Average yield or cost (%) | Average Balance | Average yield or cost (%) | ||||||
Assets | |||||||||
Interest earning deposits | $ | 286,945 | 0.25 | $ | 199,069 | 0.25 | |||
Investment securities | 395,401 | 2.33 | 482,290 | 2.32 | |||||
Loans held for sale | 1,530,938 | 3.22 | 672,308 | 3.54 | |||||
Loans receivable | 4,383,102 | 3.95 | 3,195,396 | 4.01 | |||||
Other interest-earning assets | 76,453 | 8.19 | 51,108 | 3.01 | |||||
Total interest earning assets | 6,672,839 | 3.58 | 4,600,171 | 3.59 | |||||
Non-interest earning assets | 272,937 | 211,368 | |||||||
Total assets | $ | 6,945,776 | $ | 4,811,539 | |||||
Liabilities | |||||||||
Total interest bearing deposits (1) | $ | 4,260,980 | 0.74 | $ | 2,906,457 | 0.77 | |||
Borrowings | 1,491,598 | 1.33 | 863,267 | 0.95 | |||||
Total interest-bearing liabilities | 5,752,578 | 0.89 | 3,769,724 | 0.81 | |||||
Non-interest-bearing deposits (1) | 689,047 | 625,847 | |||||||
Total deposits & borrowings | 6,441,625 | 0.80 | 4,395,571 | 0.70 | |||||
Other non-interest bearing liabilities | 29,089 | 14,134 | |||||||
Total liabilities | 6,470,714 | 4,409,705 | |||||||
Shareholders' equity | 475,062 | 401,834 | |||||||
Total liabilities and shareholders' equity | $ | 6,945,776 | $ | 4,811,539 | |||||
Net interest margin | 2.81 | 2.92 | |||||||
Net interest margin tax equivalent | 2.81 | 2.93 | |||||||
(1) Total costs of deposits (including interest bearing and non-interest bearing) were 0.64% and 0.64% for the six months ended June 30, 2015 and 2014, respectively. | |||||||||

40
Net Interest Margin
CUSTOMERS BANCORP, INC. AND SUBSIDIARIES | |||||||||
AVERAGE BALANCE SHEET / NET INTEREST MARGIN (UNAUDITED) | |||||||||
(Dollars in thousands, except per share data) | |||||||||
Three Months Ended June 30, | |||||||||
2015 | 2014 | ||||||||
Average Balance | Average yield or cost (%) | Average Balance | Average yield or cost (%) | ||||||
Assets | |||||||||
Interest earning deposits | $ | 290,241 | 0.26 | $ | 211,438 | 0.25 | |||
Investment securities | 384,324 | 2.34 | 448,059 | 2.27 | |||||
Loans held for sale | 1,692,622 | 3.20 | 776,919 | 3.47 | |||||
Loans receivable | 4,404,304 | 3.90 | 3,544,859 | 3.98 | |||||
Other interest-earning assets | 77,822 | 4.75 | 64,063 | 3.01 | |||||
Total interest earning assets | 6,849,313 | 3.49 | 5,045,338 | 3.58 | |||||
Non-interest earning assets | 260,886 | 202,651 | |||||||
Total assets | $ | 7,110,199 | $ | 5,247,989 | |||||
Liabilities | |||||||||
Total interest bearing deposits (1) | $ | 4,399,164 | 0.74 | $ | 3,065,597 | 0.75 | |||
Borrowings | 1,511,481 | 1.32 | 1,171,766 | 0.83 | |||||
Total interest bearing liabilities | 5,910,645 | 0.89 | 4,237,363 | 0.77 | |||||
Non-interest bearing deposits (1) | 669,411 | 585,370 | |||||||
Total deposits & borrowings | 6,580,056 | 0.80 | 4,822,733 | 0.68 | |||||
Other non-interest bearing liabilities | 33,586 | 16,622 | |||||||
Total liabilities | 6,613,642 | 4,839,355 | |||||||
Shareholders' equity | 496,557 | 408,634 | |||||||
Total liabilities and shareholders' equity | $ | 7,110,199 | $ | 5,247,989 | |||||
Net interest margin | 2.73 | 2.93 | |||||||
Net interest margin tax equivalent | 2.73 | 2.94 | |||||||
(1) Total costs of deposits (including interest bearing and non-interest bearing) were 0.65% and 0.63% for the three months ended June 30, 2015 and 2014, respectively. | |||||||||
41
Asset Quality
CUSTOMERS BANCORP, INC. AND SUBSIDIARIES | |||||||||||||||||||||||||
Asset Quality as of June 30, 2015 (Unaudited) | |||||||||||||||||||||||||
(Dollars in thousands, except per share data) | |||||||||||||||||||||||||
Total Loans | Non Accrual /NPLs | Other Real Estate Owned | Non Performing Assets (NPAs) | Allowance for loan losses | Cash Reserve | Total Credit Reserves | NPLs / Total Loans | Total Reserves to Total NPLs | |||||||||||||||||
Loan Type | |||||||||||||||||||||||||
New Century Originated Loans | |||||||||||||||||||||||||
Legacy | $ | 46,580 | $ | 2,158 | $ | 3,327 | $ | 5,485 | $ | 1,676 | $ | — | $ | 1,676 | 4.63 | % | 77.66 | % | |||||||
Troubled debt restructurings (TDRs) | 2,052 | 881 | — | 881 | 5 | — | 5 | 42.93 | % | 0.57 | % | ||||||||||||||
Total New Century Originated Loans | 48,632 | 3,039 | 3,327 | 6,366 | 1,681 | — | 1,681 | 6.25 | % | 55.31 | % | ||||||||||||||
Originated Loans | |||||||||||||||||||||||||
Multi-Family | 2,232,273 | — | — | — | 8,734 | — | 8,734 | — | % | — | % | ||||||||||||||
Commercial & Industrial (1) | 792,701 | 1,173 | 618 | 1,791 | 13,476 | — | 13,476 | 0.15 | % | 1,148.85 | % | ||||||||||||||
Commercial Real Estate- Non-Owner Occupied | 840,922 | 271 | — | 271 | 3,335 | — | 3,335 | 0.03 | % | 1,230.63 | % | ||||||||||||||
Residential | 105,332 | 9 | — | 9 | 1,722 | — | 1,722 | 0.01 | % | — | % | ||||||||||||||
Construction | 68,073 | — | — | — | 844 | — | 844 | — | % | — | % | ||||||||||||||
Other Consumer | 347 | — | — | — | 11 | — | 11 | — | % | — | % | ||||||||||||||
TDRs | 543 | — | — | — | 5 | — | 5 | — | % | — | % | ||||||||||||||
Total Originated Loans | 4,040,191 | 1,453 | 618 | 2,071 | 28,127 | — | 28,127 | 0.04 | % | 1,935.79 | % | ||||||||||||||
Acquired Loans | |||||||||||||||||||||||||
Covered | 25,329 | 2,710 | 8,877 | 11,587 | 506 | — | 506 | 10.70 | % | 18.67 | % | ||||||||||||||
Non-Covered | 354,426 | 817 | 497 | 1,314 | 290 | 1,556 | 1,846 | 0.23 | % | 225.95 | % | ||||||||||||||
TDRs Covered | 526 | — | — | — | — | — | — | — | % | — | % | ||||||||||||||
TDRs Non-Covered | 6,926 | 2,537 | — | 2,537 | — | — | — | 36.63 | % | — | % | ||||||||||||||
Total Acquired Loans | 387,207 | 6,064 | 9,374 | 15,438 | 796 | 1,556 | 2,352 | 1.57 | % | 38.79 | % | ||||||||||||||
Acquired Purchased Credit-impaired Loans | |||||||||||||||||||||||||
Covered | 5,834 | — | — | — | 1,114 | — | 1,114 | — | % | — | % | ||||||||||||||
Non-Covered | 42,031 | — | — | — | 5,773 | — | 5,773 | — | % | — | % | ||||||||||||||
Total Acquired Purchased Credit-impaired Loans | 47,865 | — | — | — | 6,887 | — | 6,887 | — | % | — | % | ||||||||||||||
Deferred Origination Fees/Unamortized Premium/Discounts, net | 930 | — | — | — | — | — | — | — | % | — | % | ||||||||||||||
Total Loans Held for Investment | 4,524,825 | 10,556 | 13,319 | 23,875 | 37,491 | 1,556 | 39,047 | 0.23 | % | 369.90 | % | ||||||||||||||
Total Loans Held for Sale | 2,030,348 | — | — | — | — | — | — | — | % | — | % | ||||||||||||||
Total Portfolio | $ | 6,555,173 | 10,556 | 13,319 | 23,875 | 37,491 | 1,556 | 39,047 | 0.16 | % | 369.90 | % | |||||||||||||