Exhibit 99.2

Highly Focused, Low Risk, Above Average Growth Bank Holding Company Investor PresentationOctober, 2016NYSE: CUBI Member FDIC
Forward-Looking Statements This presentation, as well as other written or oral communications made from time to time by us, contains forward-looking information within the meaning of the safe harbor provisions of the U.S. Private Securities Litigation Reform Act of 1995. These statements relate to future events or future predictions, including events or predictions relating to future financial performance, and are generally identifiable by the use of forward-looking terminology such as “believe,” “expect,” “may,” “will,” “should,” “plan,” “intend,” or “anticipate” or the negative thereof or comparable terminology. Forward- looking statements in this presentation include, among other matters, guidance for our financial performance, our two-year financial performance targets, the future financial performance, prospects and goals for our BankMobile division, and the timing for when BankMobile is expected to achieve profitability. Forward-looking statements reflect numerous assumptions, estimates and forecasts as to future events. No assurance can be given that the assumptions, estimates and forecasts underlying such forward-looking statements will accurately reflect future conditions, or that any guidance, goals, targets or projected results will be realized. The assumptions, estimates and forecasts underlying such forward-looking statements involve judgments with respect to, among other things, future economic, competitive, regulatory and financial market conditions and future business decisions, which may not be realized and which are inherently subject to significant business, economic, competitive and regulatory uncertainties and known and unknown risks, including the risks described under “Risk Factors” in our Annual Report on Form 10-K for the year ended December 31, 2015 and subsequent Quarterly Reports on Form 10-Q, as such factors may be updated from time to time in our filings with the SEC. Our actual results may differ materially from those reflected in the forward-looking statements.In addition to the risks described under “Risk Factors” in our filings with the SEC, important factors to consider and evaluate with respect to our forward-looking statements include:changes in external competitive market factors that might impact our results of operations;changes in laws and regulations, including without limitation changes in capital requirements under Basel III;changes in our business strategy or an inability to execute our strategy due to the occurrence of unanticipated events;our ability to identify potential candidates for, and consummate, acquisition or investment transactions;the timing of acquisition, investment or disposition transactions;constraints on our ability to consummate an attractive acquisition or investment transaction because of significant competition for these opportunities;local, regional and national economic conditions and events and the impact they may have on us and our customers;costs and effects of regulatory and legal developments, including the results of regulatory examinations and the outcome of regulatory or other governmental inquiries and proceedings, such as fines or restrictions on our business activities;our ability to attract deposits and other sources of liquidity;changes in the financial performance and/or condition of our borrowers;changes in the level of non-performing and classified assets and charge-offs;changes in estimates of future loan loss reserve requirements based upon the periodic review thereof under relevant regulatory and accounting requirements; inflation, interest rate, securities market and monetary fluctuations;timely development and acceptance of new banking products and services and perceived overall value of these products and services by users, including the products and services being developed and introduced to the market by the BankMobile division of Customers Bank;changes in consumer spending, borrowing and saving habits;technological changes;
Forward-Looking Statements our ability to increase market share and control expenses;continued volatility in the credit and equity markets and its effect on the general economy;effects of changes in accounting policies and practices, as may be adopted by the regulatory agencies, as well as the Public Company Accounting Oversight Board, the Financial Accounting Standards Board and other accounting standard setters;the businesses of Customers Bank and any acquisition targets or merger partners and subsidiaries not integrating successfully or such integration being more difficult, time-consuming or costly than expected;material differences in the actual financial results of merger and acquisition activities compared with our expectations, such as with respect to the full realization of anticipated cost savings and revenue enhancements within the expected time frame;our ability to successfully implement our growth strategy, control expenses and maintain liquidity;Customers Bank's ability to pay dividends to Customers Bancorp;unforeseen challenges that may arise in connection with the consummation of our recently-completed acquisition of certain assets and assumption of certain liabilities from Higher One, including that integration may be less successful, more difficult, time-consuming or costly than expected, and that BankMobile may be unable to realize anticipated cost savings and revenue enhancements within the expected time frame or at all;the number of existing student customers who transfer their accounts to BankMobile from one of Higher One's former bank partners;material variances in the adoption rate of BankMobile's services by new students and/or the usage rate of BankMobile's services by current student customers compared to our expectations;material variances in the number of BankMobile student accounts retained following graduation compared to our expectations;the levels of usage of other BankMobile student customers following graduation of additional product and service offerings of BankMobile or Customers Bank, including mortgages and consumer loans, and the mix of products and services used;our ability to implement changes to BankMobile's product and service offerings under current and future regulations and governmental policies;our ability to effectively manage revenue and expense fluctuations that may occur with respect to BankMobile's student-oriented business activities, which result from seasonal factors related to the higher-education academic year;our ability to implement our strategy regarding BankMobile, including with respect to our intent to sell or otherwise dispose of the BankMobile business in the future, depending upon market conditions and opportunities; andBankMobile's ability to successfully implement its growth strategy and control expenses.You are cautioned not to place undue reliance on any forward-looking statements we make, which speak only as of the date they are made. We do not undertake any obligation to release publicly or otherwise provide any revisions to any forward-looking statements we may make, including any forward-looking financial information, to reflect events or circumstances occurring after the date hereof or to reflect the occurrence of unanticipated events, except as may be required under applicable law.
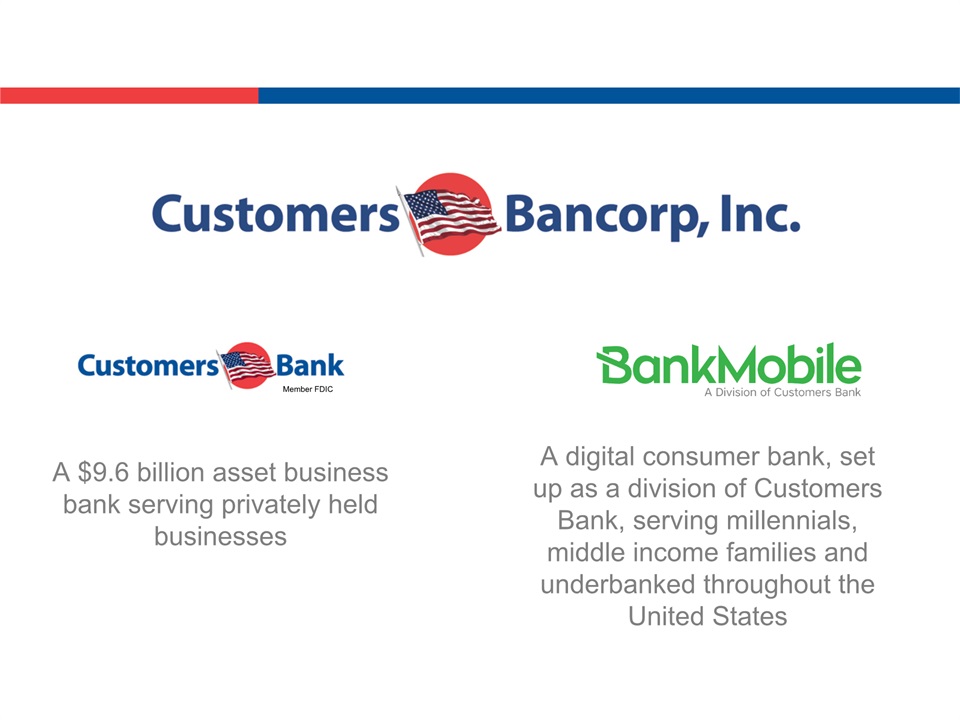
A $9.6 billion asset business bank serving privately held businesses A digital consumer bank, set up as a division of Customers Bank, serving millennials, middle income families and underbanked throughout the United States Member FDIC
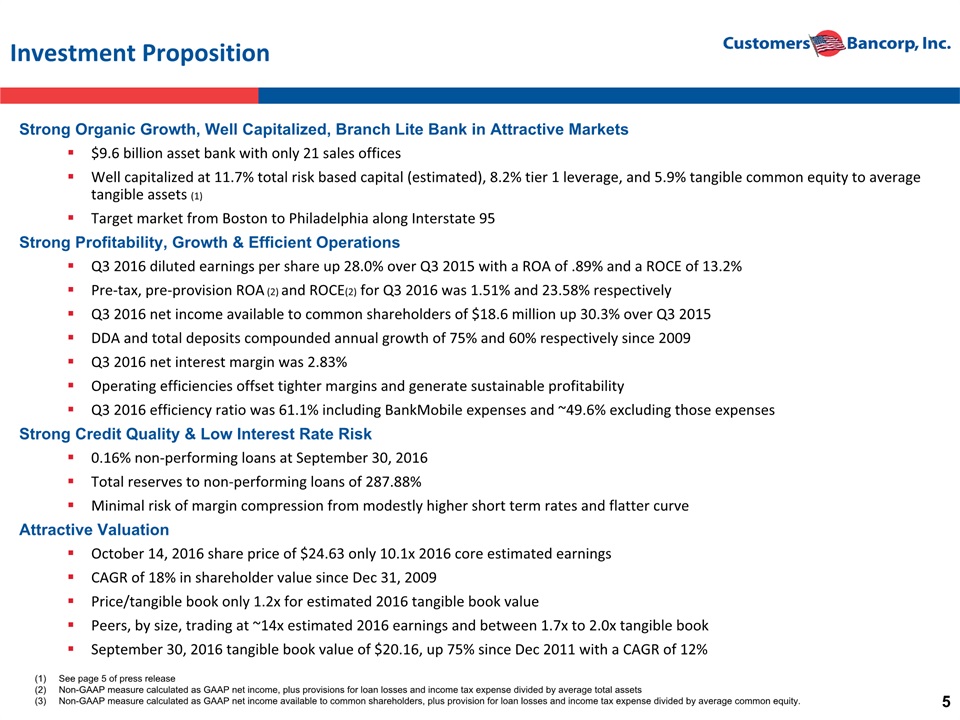
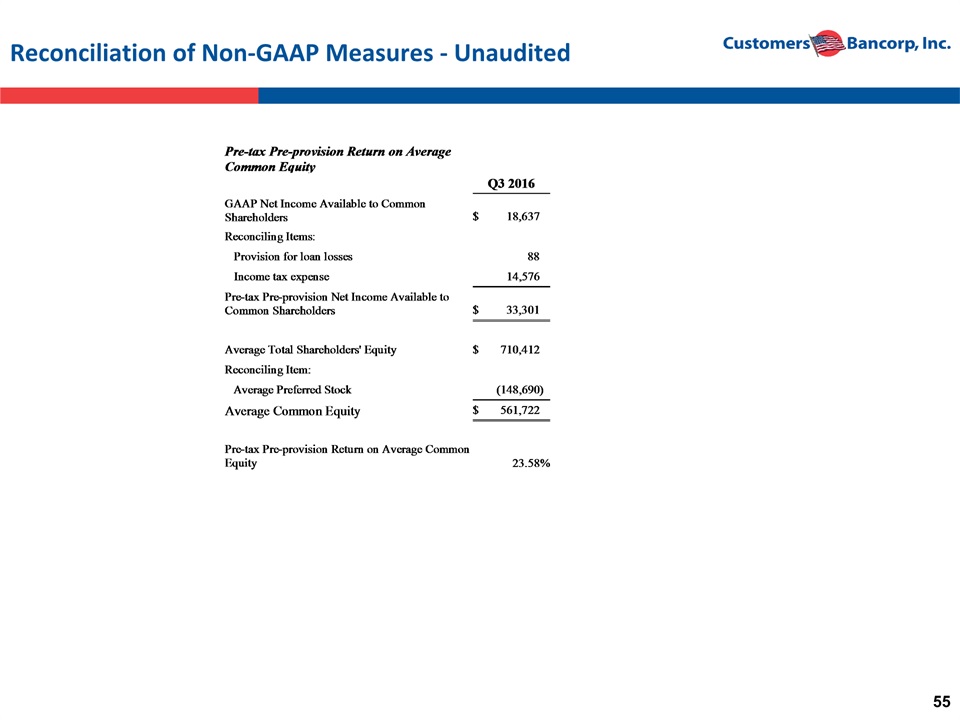
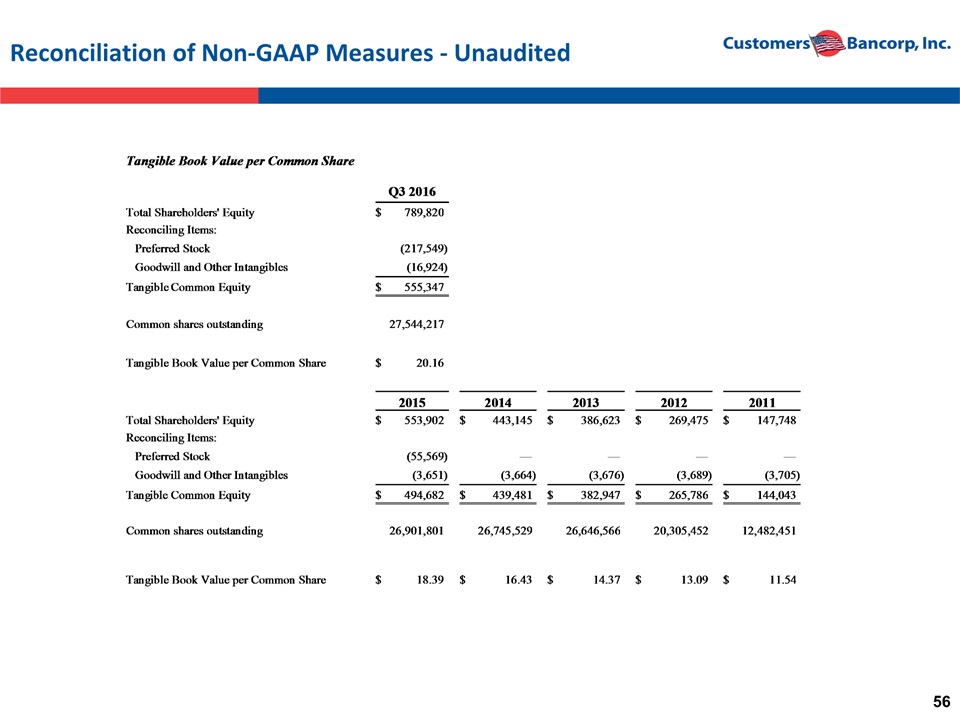
Investment Proposition Strong Organic Growth, Well Capitalized, Branch Lite Bank in Attractive Markets$9.6 billion asset bank with only 21 sales officesWell capitalized at 11.7% total risk based capital (estimated), 8.2% tier 1 leverage, and 5.9% tangible common equity to average tangible assets (1)Target market from Boston to Philadelphia along Interstate 95Strong Profitability, Growth & Efficient OperationsQ3 2016 diluted earnings per share up 28.0% over Q3 2015 with a ROA of .89% and a ROCE of 13.2%Pre-tax, pre-provision ROA (2) and ROCE(2) for Q3 2016 was 1.51% and 23.58% respectively Q3 2016 net income available to common shareholders of $18.6 million up 30.3% over Q3 2015 DDA and total deposits compounded annual growth of 75% and 60% respectively since 2009 Q3 2016 net interest margin was 2.83%Operating efficiencies offset tighter margins and generate sustainable profitabilityQ3 2016 efficiency ratio was 61.1% including BankMobile expenses and ~49.6% excluding those expensesStrong Credit Quality & Low Interest Rate Risk0.16% non-performing loans at September 30, 2016Total reserves to non-performing loans of 287.88%Minimal risk of margin compression from modestly higher short term rates and flatter curveAttractive ValuationOctober 14, 2016 share price of $24.63 only 10.1x 2016 core estimated earningsCAGR of 18% in shareholder value since Dec 31, 2009Price/tangible book only 1.2x for estimated 2016 tangible book valuePeers, by size, trading at ~14x estimated 2016 earnings and between 1.7x to 2.0x tangible bookSeptember 30, 2016 tangible book value of $20.16, up 75% since Dec 2011 with a CAGR of 12% See page 5 of press releaseNon-GAAP measure calculated as GAAP net income, plus provisions for loan losses and income tax expense divided by average total assetsNon-GAAP measure calculated as GAAP net income available to common shareholders, plus provision for loan losses and income tax expense divided by average common equity.
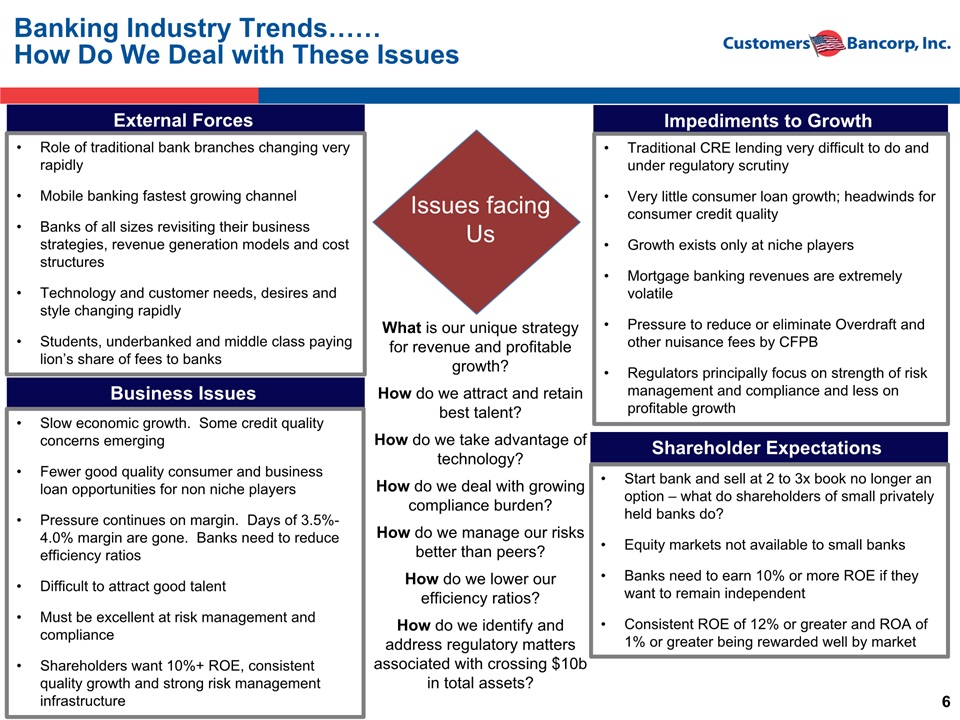
Banking Industry Trends……How Do We Deal with These Issues Impediments to Growth External Forces Role of traditional bank branches changing very rapidlyMobile banking fastest growing channelBanks of all sizes revisiting their business strategies, revenue generation models and cost structuresTechnology and customer needs, desires and style changing rapidlyStudents, underbanked and middle class paying lion’s share of fees to banks Traditional CRE lending very difficult to do and under regulatory scrutinyVery little consumer loan growth; headwinds for consumer credit qualityGrowth exists only at niche playersMortgage banking revenues are extremely volatilePressure to reduce or eliminate Overdraft and other nuisance fees by CFPBRegulators principally focus on strength of risk management and compliance and less on profitable growth Business Issues Shareholder Expectations Start bank and sell at 2 to 3x book no longer an option – what do shareholders of small privately held banks do?Equity markets not available to small banksBanks need to earn 10% or more ROE if they want to remain independentConsistent ROE of 12% or greater and ROA of 1% or greater being rewarded well by market Slow economic growth. Some credit quality concerns emergingFewer good quality consumer and business loan opportunities for non niche playersPressure continues on margin. Days of 3.5%-4.0% margin are gone. Banks need to reduce efficiency ratiosDifficult to attract good talentMust be excellent at risk management and complianceShareholders want 10%+ ROE, consistent quality growth and strong risk management infrastructure Issues facing Us What is our unique strategy for revenue and profitable growth?How do we attract and retain best talent?How do we take advantage of technology?How do we deal with growing compliance burden?How do we manage our risks better than peers?How do we lower our efficiency ratios?How do we identify and address regulatory matters associated with crossing $10b in total assets?
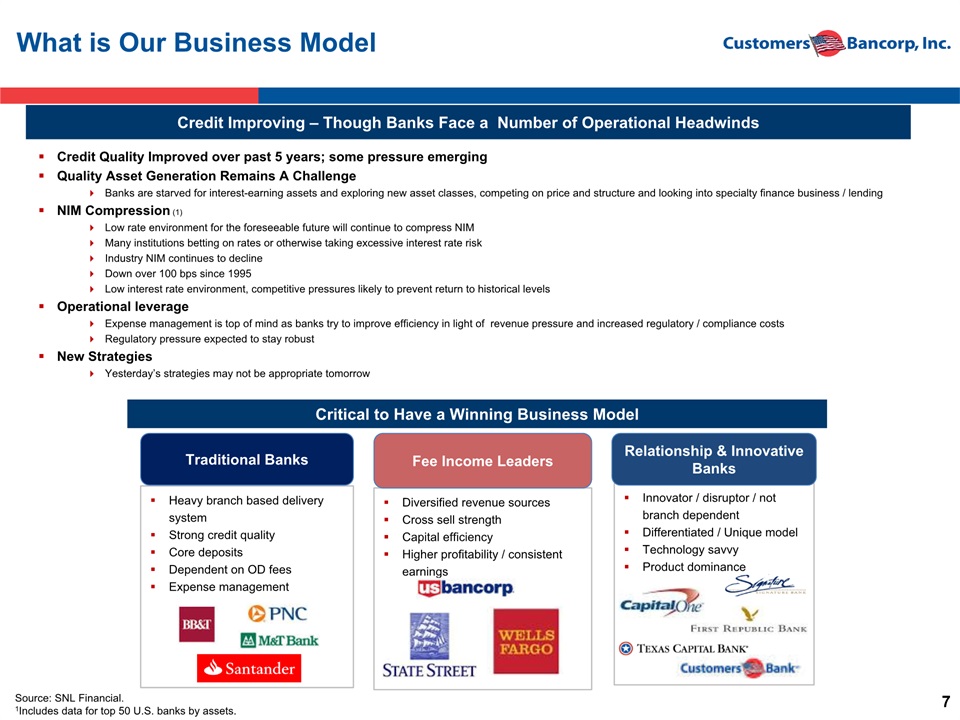
Innovator / disruptor / not branch dependentDifferentiated / Unique modelTechnology savvyProduct dominance What is Our Business Model Credit Improving – Though Banks Face a Number of Operational Headwinds Credit Quality Improved over past 5 years; some pressure emergingQuality Asset Generation Remains A ChallengeBanks are starved for interest-earning assets and exploring new asset classes, competing on price and structure and looking into specialty finance business / lendingNIM Compression (1)Low rate environment for the foreseeable future will continue to compress NIMMany institutions betting on rates or otherwise taking excessive interest rate riskIndustry NIM continues to declineDown over 100 bps since 1995Low interest rate environment, competitive pressures likely to prevent return to historical levelsOperational leverage Expense management is top of mind as banks try to improve efficiency in light of revenue pressure and increased regulatory / compliance costsRegulatory pressure expected to stay robustNew StrategiesYesterday’s strategies may not be appropriate tomorrow Critical to Have a Winning Business Model Heavy branch based delivery systemStrong credit qualityCore depositsDependent on OD feesExpense management Traditional Banks Diversified revenue sourcesCross sell strengthCapital efficiencyHigher profitability / consistent earnings Fee Income Leaders Relationship & Innovative Banks Source: SNL Financial. 1Includes data for top 50 U.S. banks by assets.

Our Approach to Developing a Winning Business Model Must focus on both “Relationship” or “High Touch” banking combined with “Highly Efficient” or “High Tech”. Strategy should be unique as to not be copied easilyAttract and retain best high quality talent. Business Bankers / Relationship Bankers with approximately 15 years+ experience who bring a book of business with themCompensate leaders based upon risk and profitability with both cash and equityNever deviate from following critical success factorsOnly focus on very strong credit quality nichesHave very strong risk management cultureHave significantly lower efficiency ratio than peers to deliver sustainable strong profitability and growth with lower margin and lower risk profileAlways attract and retain top quality talentCulture of innovation and continuous improvement

Our Competitive Advantage: A Highly Experienced Management Team

Customers Bank Executing On Our Unique High Performing Banking Model
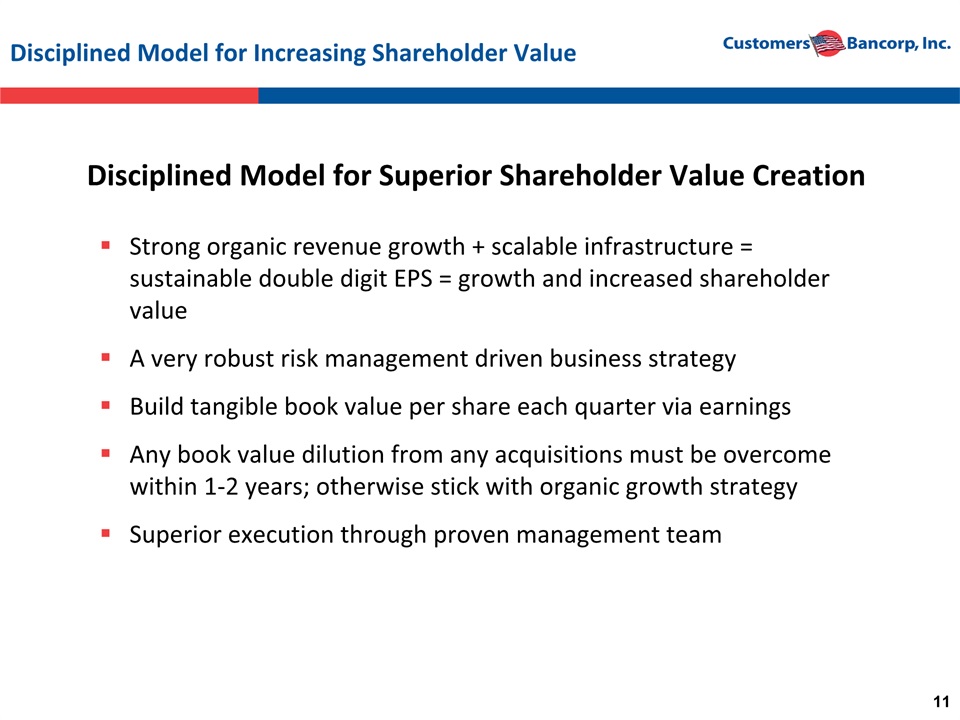
Disciplined Model for Increasing Shareholder Value Strong organic revenue growth + scalable infrastructure = sustainable double digit EPS = growth and increased shareholder valueA very robust risk management driven business strategyBuild tangible book value per share each quarter via earningsAny book value dilution from any acquisitions must be overcome within 1-2 years; otherwise stick with organic growth strategySuperior execution through proven management team Disciplined Model for Superior Shareholder Value Creation
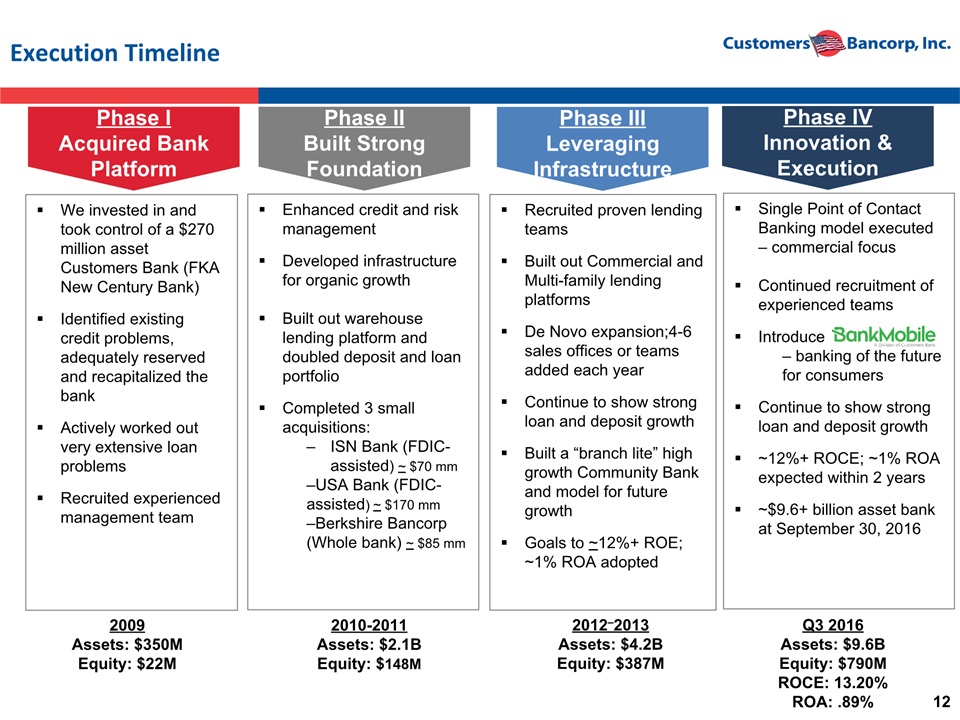
Execution Timeline We invested in and took control of a $270 million asset Customers Bank (FKA New Century Bank)Identified existing credit problems, adequately reserved and recapitalized the bankActively worked out very extensive loan problemsRecruited experienced management team Enhanced credit and risk managementDeveloped infrastructure for organic growthBuilt out warehouse lending platform and doubled deposit and loan portfolioCompleted 3 small acquisitions:ISN Bank (FDIC-assisted) ~ $70 mmUSA Bank (FDIC-assisted) ~ $170 mmBerkshire Bancorp (Whole bank) ~ $85 mm Recruited proven lending teamsBuilt out Commercial and Multi-family lending platformsDe Novo expansion;4-6 sales offices or teams added each yearContinue to show strong loan and deposit growthBuilt a “branch lite” high growth Community Bank and model for future growthGoals to ~12%+ ROE; ~1% ROA adopted Phase IAcquired Bank Platform 2009Assets: $350MEquity: $22M Phase IIBuilt Strong Foundation Phase IIILeveraging Infrastructure 2010-2011Assets: $2.1BEquity: $148M 2012–2013Assets: $4.2BEquity: $387M Phase IVInnovation & Execution Q3 2016Assets: $9.6BEquity: $790MROCE: 13.20%ROA: .89% Single Point of Contact Banking model executed – commercial focusContinued recruitment of experienced teamsIntroduce – banking of the future for consumersContinue to show strong loan and deposit growth~12%+ ROCE; ~1% ROA expected within 2 years~$9.6+ billion asset bank at September 30, 2016
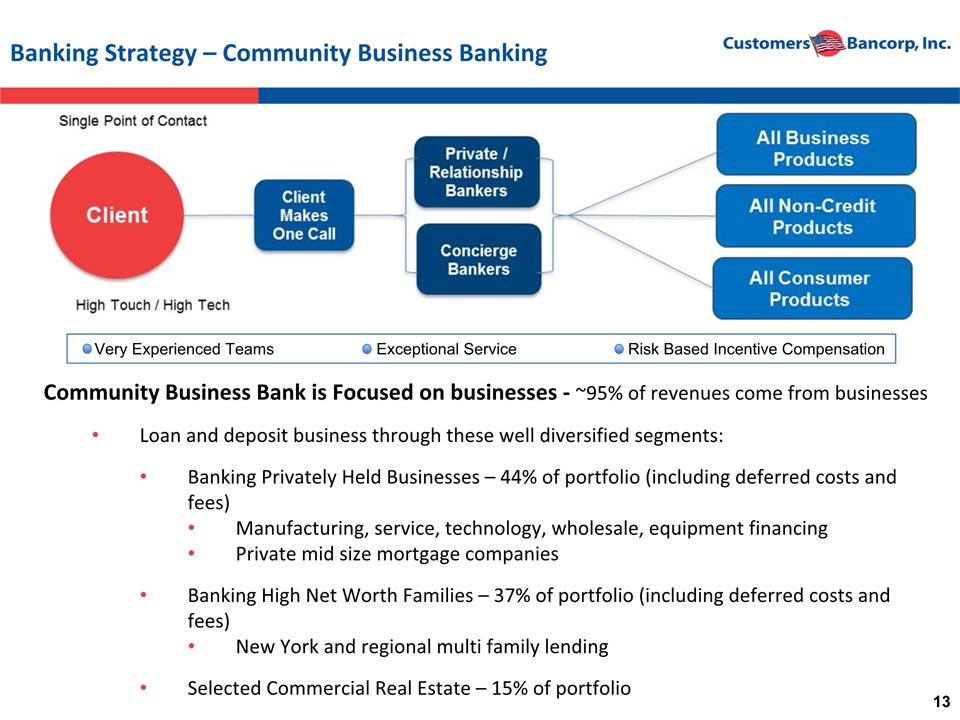
Very Experienced Teams Exceptional Service Risk Based Incentive Compensation Banking Strategy – Community Business Banking Community Business Bank is Focused on businesses - ~95% of revenues come from businessesLoan and deposit business through these well diversified segments:Banking Privately Held Businesses – 44% of portfolio (including deferred costs and fees)Manufacturing, service, technology, wholesale, equipment financingPrivate mid size mortgage companiesBanking High Net Worth Families – 37% of portfolio (including deferred costs and fees)New York and regional multi family lendingSelected Commercial Real Estate – 15% of portfolio
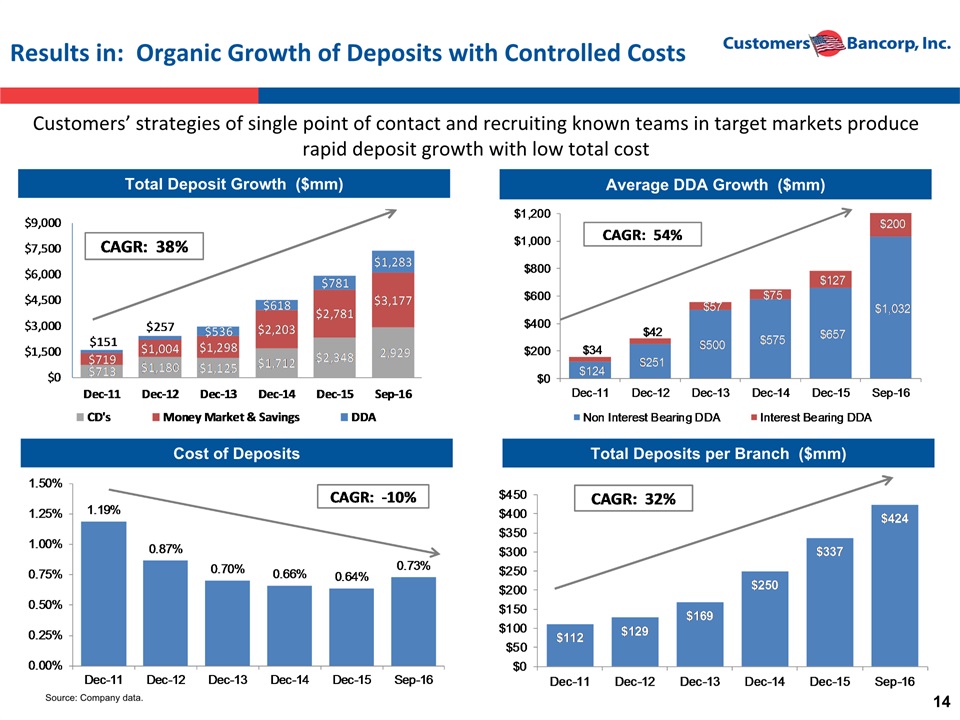
Results in: Organic Growth of Deposits with Controlled Costs Source: Company data. Total Deposit Growth ($mm) Average DDA Growth ($mm) Cost of Deposits Total Deposits per Branch ($mm) Customers’ strategies of single point of contact and recruiting known teams in target markets produce rapid deposit growth with low total cost

Lending Strategy High Growth with Strong Credit QualityContinuous recruitment and retention of high quality teamsCentralized credit committee approval for all loansLoans are stress tested for higher rates and a slower economyInsignificant delinquencies on loans originated since new management team took overCreation of solid foundation for future earnings Source: Company data. Includes deferred costs and fees.
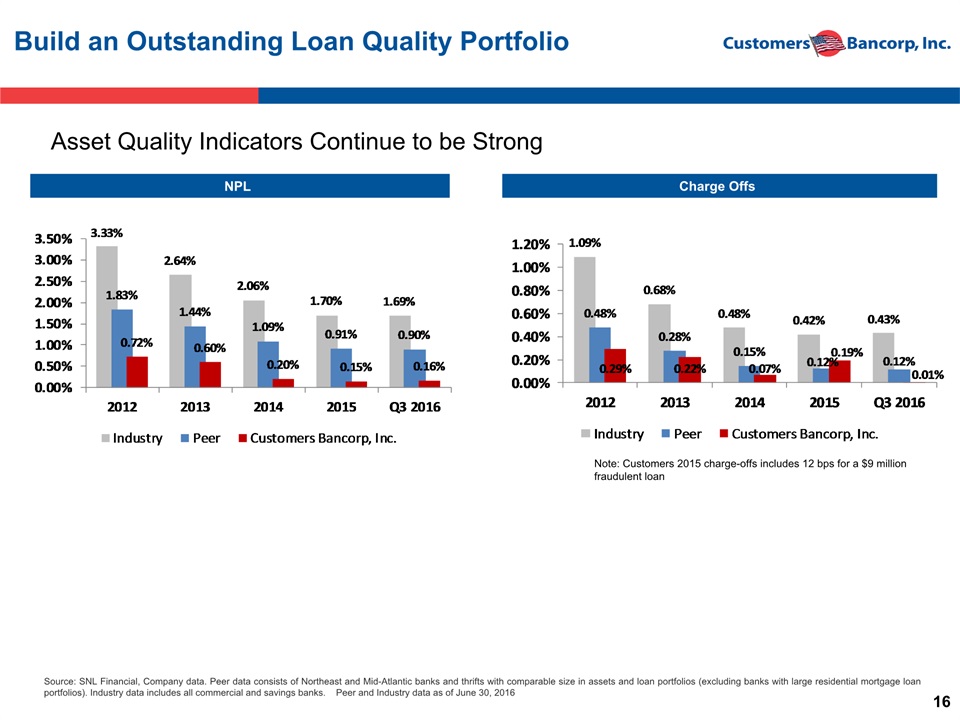
NPL Source: SNL Financial, Company data. Peer data consists of Northeast and Mid-Atlantic banks and thrifts with comparable size in assets and loan portfolios (excluding banks with large residential mortgage loan portfolios). Industry data includes all commercial and savings banks. Peer and Industry data as of June 30, 2016 Build an Outstanding Loan Quality Portfolio Charge Offs Asset Quality Indicators Continue to be Strong Note: Customers 2015 charge-offs includes 12 bps for a $9 million fraudulent loan
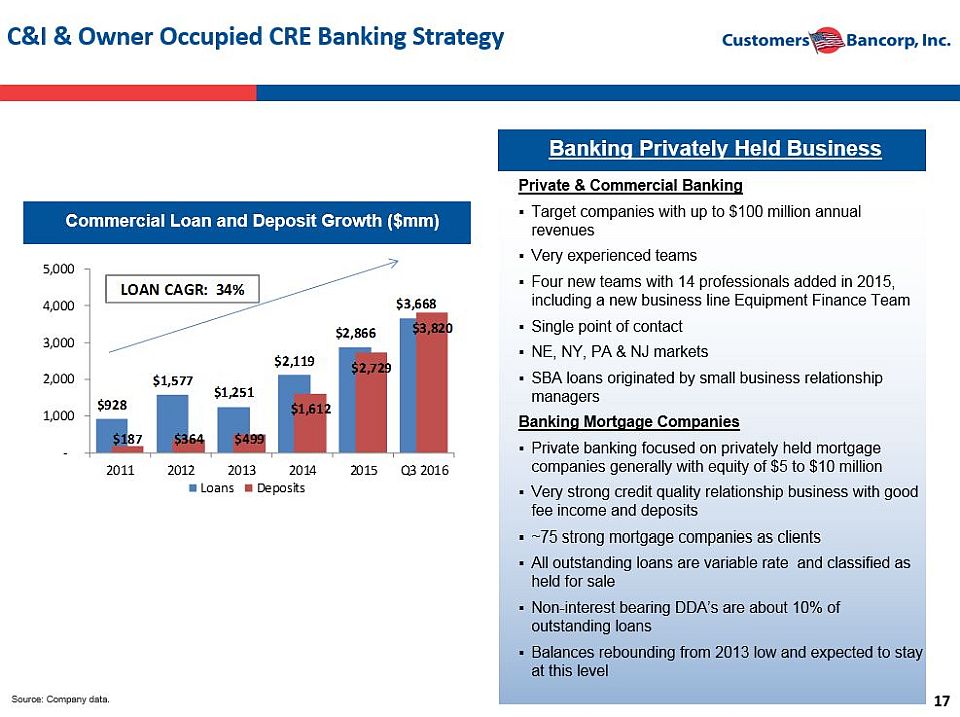
C&I & Owner Occupied CRE Banking Strategy Private & Commercial BankingTarget companies with up to $100 million annual revenuesVery experienced teamsFour new teams with 14 professionals added in 2015, including a new business line Equipment Finance TeamSingle point of contactNE, NY, PA & NJ marketsSBA loans originated by small business relationship managersBanking Mortgage CompaniesPrivate banking focused on privately held mortgage companies generally with equity of $5 to $10 million Very strong credit quality relationship business with good fee income and deposits~75 strong mortgage companies as clients All outstanding loans are variable rate and classified as held for saleNon-interest bearing DDA’s are about 10% of outstanding loansBalances rebounding from 2013 low and expected to stay at this level Banking Privately Held Business Commercial Loan and Deposit Growth ($mm) Source: Company data.
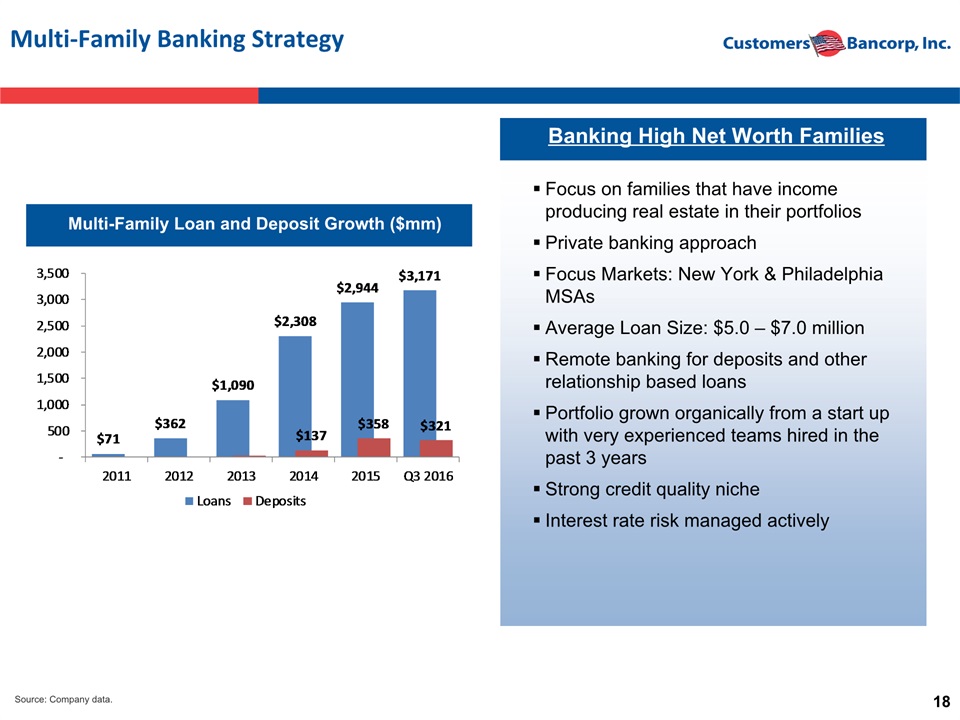
Multi-Family Banking Strategy Banking High Net Worth Families Multi-Family Loan and Deposit Growth ($mm) Focus on families that have income producing real estate in their portfoliosPrivate banking approachFocus Markets: New York & Philadelphia MSAsAverage Loan Size: $5.0 – $7.0 millionRemote banking for deposits and other relationship based loansPortfolio grown organically from a start up with very experienced teams hired in the past 3 yearsStrong credit quality nicheInterest rate risk managed actively Source: Company data.
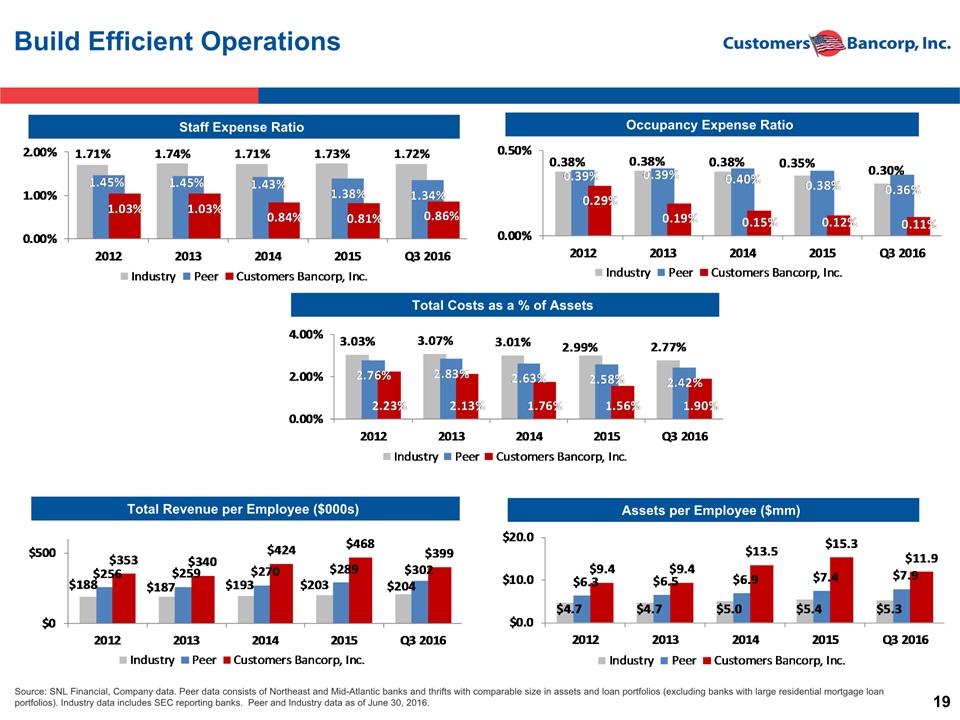
Staff Expense Ratio Build Efficient Operations Source: SNL Financial, Company data. Peer data consists of Northeast and Mid-Atlantic banks and thrifts with comparable size in assets and loan portfolios (excluding banks with large residential mortgage loan portfolios). Industry data includes SEC reporting banks. Peer and Industry data as of June 30, 2016. Occupancy Expense Ratio Total Costs as a % of Assets Total Revenue per Employee ($000s) Assets per Employee ($mm)
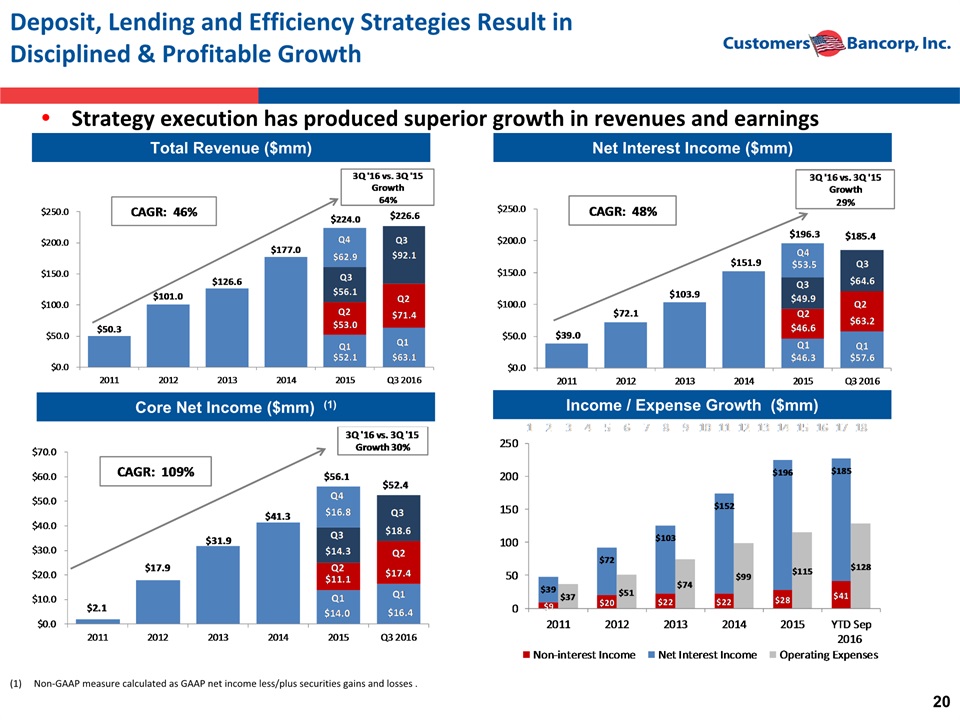
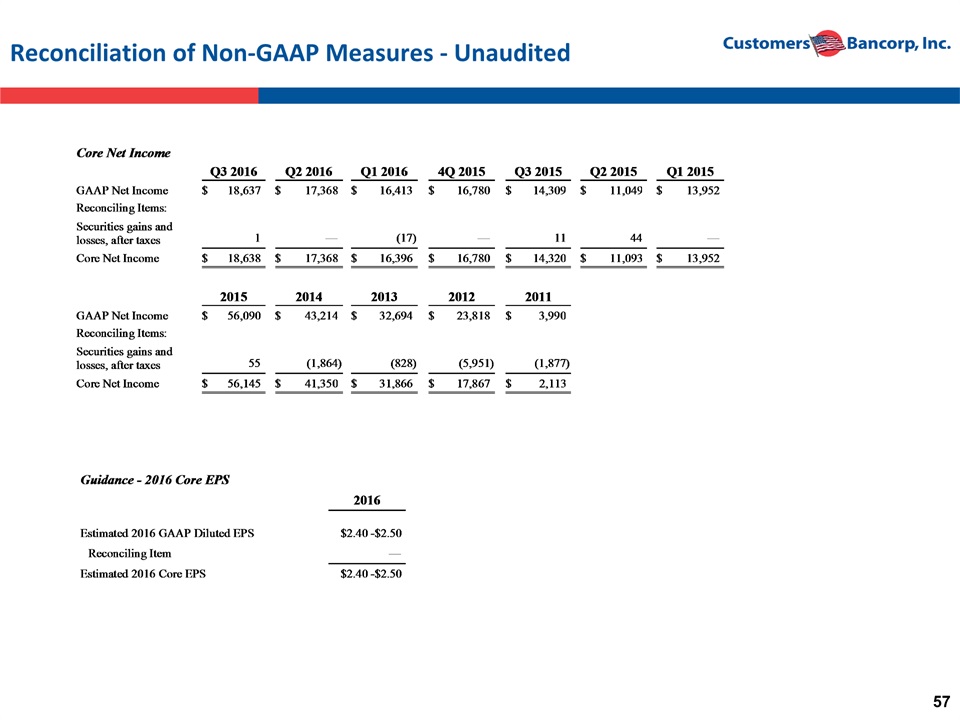
Deposit, Lending and Efficiency Strategies Result in Disciplined & Profitable Growth Total Revenue ($mm) Core Net Income ($mm) (1) Net Interest Income ($mm) Strategy execution has produced superior growth in revenues and earnings Income / Expense Growth ($mm) Non-GAAP measure calculated as GAAP net income less/plus securities gains and losses .

Tangible BV per Share Building Customers to Provide Superior Returns to Investors Recent Performance Results Financial Performance Targets Earnings per Share Guidance / Valuation Multiples
Customers BankCommunity Business Banking and BankMobile Business Segments
Business Segment Disclosures Customers Bank acquired the Disbursements Business of Higher One, Inc. on June 15, 2016The acquired Disbursements Business was combined with Customers Bank’s existing BankMobile product line in Q2 2016Effective for the 2016 third quarter, Customers begins reporting Community Business Banking and BankMobile as separate business segments to the investor community
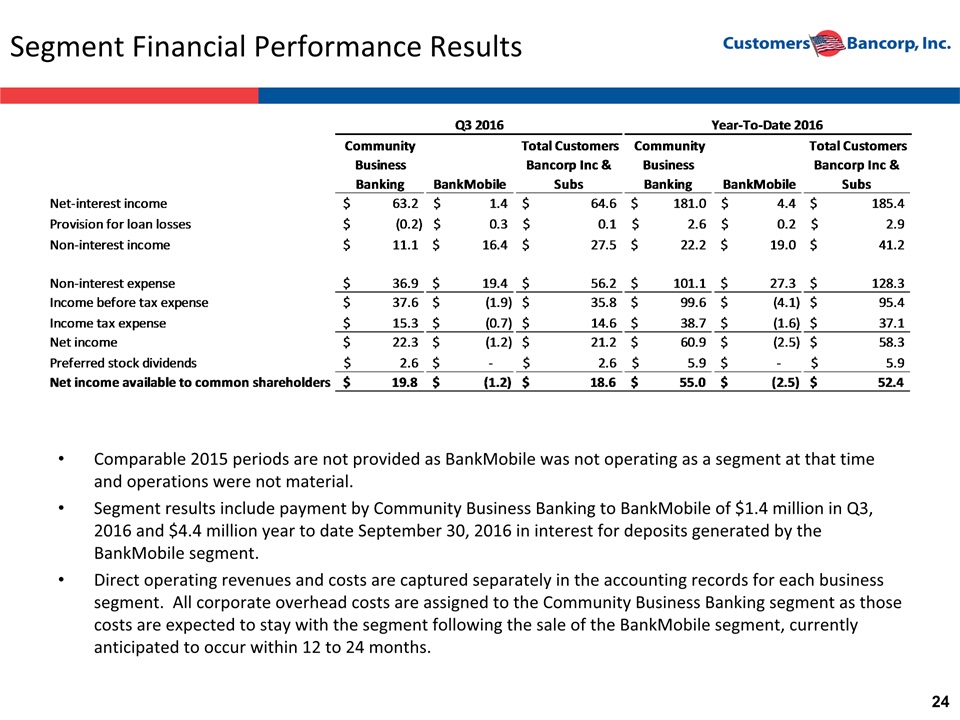
Segment Financial Performance Results Comparable 2015 periods are not provided as BankMobile was not operating as a segment at that time and operations were not material.Segment results include payment by Community Business Banking to BankMobile of $1.4 million in Q3, 2016 and $4.4 million year to date September 30, 2016 in interest for deposits generated by the BankMobile segment.Direct operating revenues and costs are captured separately in the accounting records for each business segment. All corporate overhead costs are assigned to the Community Business Banking segment as those costs are expected to stay with the segment following the sale of the BankMobile segment, currently anticipated to occur within 12 to 24 months.
Other BankMobile Results Migrated 304,000 checking accounts previously with another Higher One, Inc. partner bank since acquisition at the customers’ election with transferred balances totaling approximately $700 million between starting balances and incoming deposits. Opened over 200,000 new checking during Q3 (since June 16, 2016).40% of Title IV funds received by students were deposited into accounts with BankMobile. Other students receiving funds requested the transfer of funds to existing accounts at other banks or received a check.Signed contracts to provide disbursement services to 16 educational institutions with student enrollment totaling 130,000 since May 2016, which will be online for the fall 2017 student enrollment cycle.Funds received from educational institutions and processed to students totaled $3.14 billion during Q3, 2016.Active checking accounts (checking accounts with at least one transaction in the past year) serviced number 1.93 million as of September 30, 2016, with balances of $665.7 million on that date.
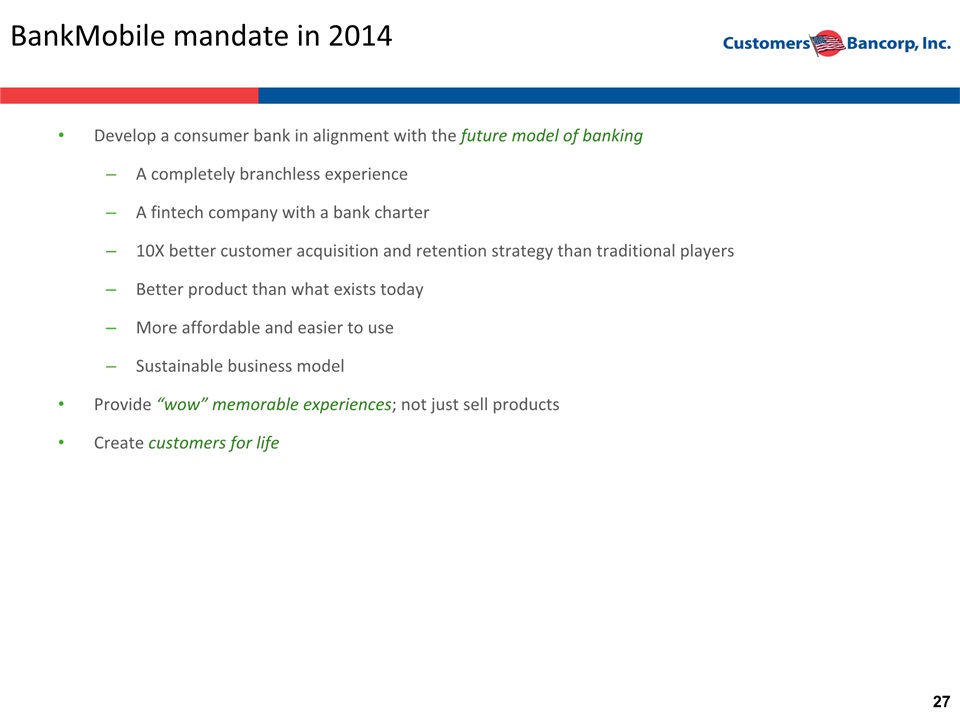
BankMobile mandate in 2014 Develop a consumer bank in alignment with the future model of banking A completely branchless experience A fintech company with a bank charter10X better customer acquisition and retention strategy than traditional playersBetter product than what exists today More affordable and easier to useSustainable business model Provide “wow” memorable experiences; not just sell products Create customers for life
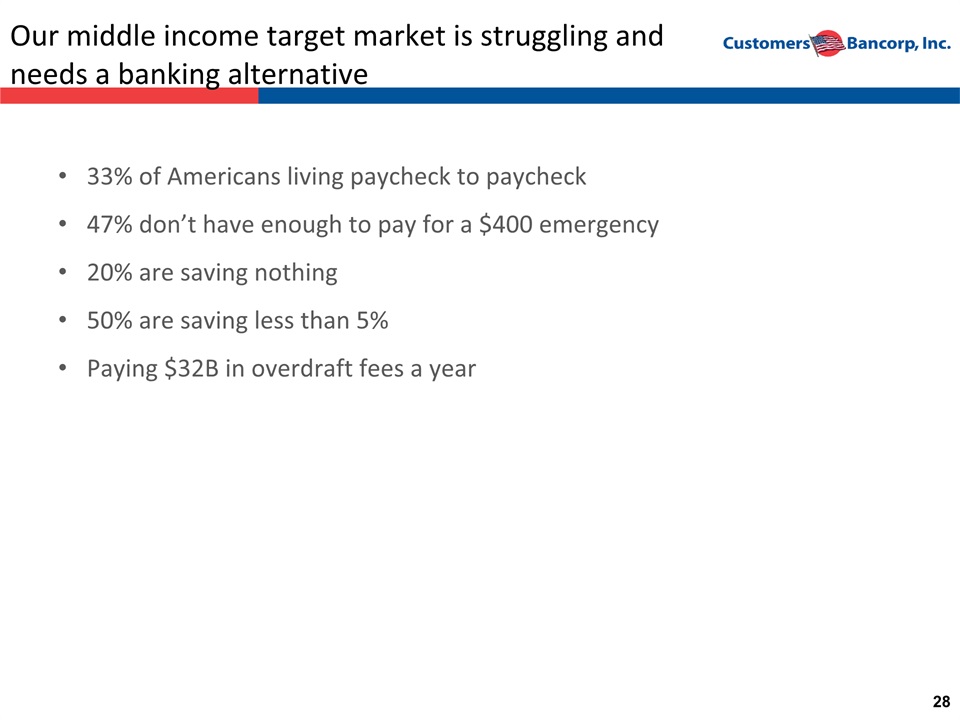
Our middle income target market is struggling and needs a banking alternative 33% of Americans living paycheck to paycheck 47% don’t have enough to pay for a $400 emergency 20% are saving nothing 50% are saving less than 5%Paying $32B in overdraft fees a year
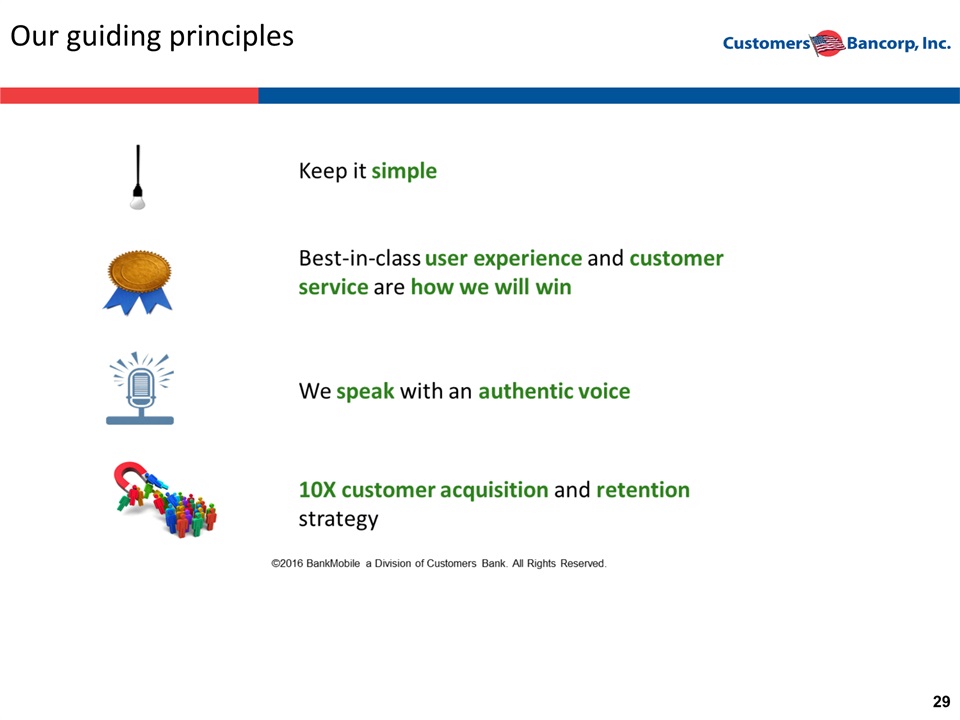
Our guiding principles
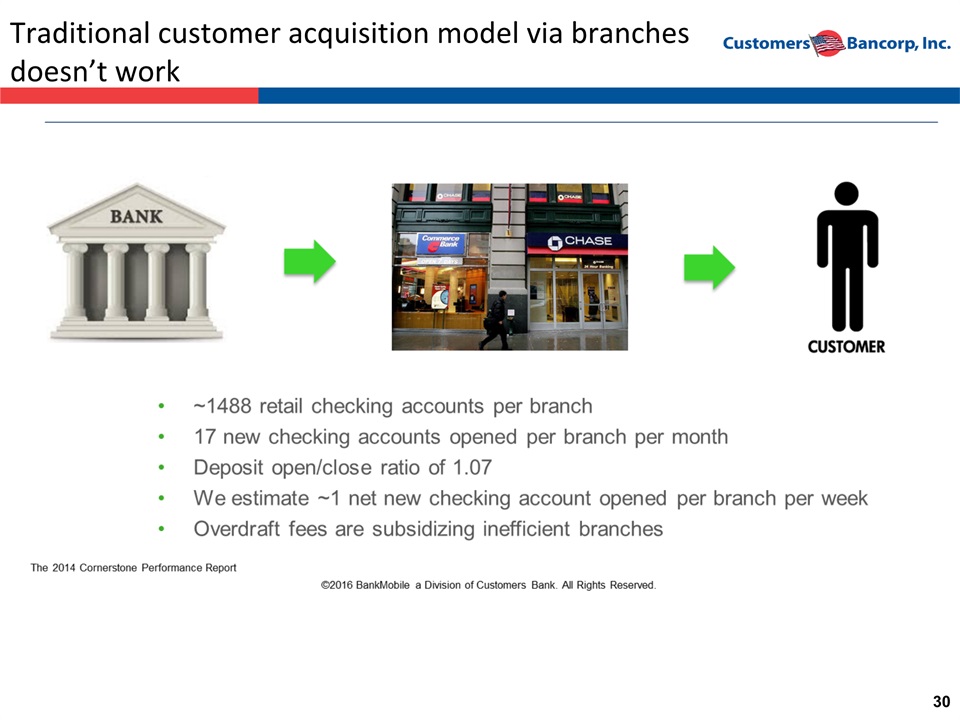
Traditional customer acquisition model via branches doesn’t work
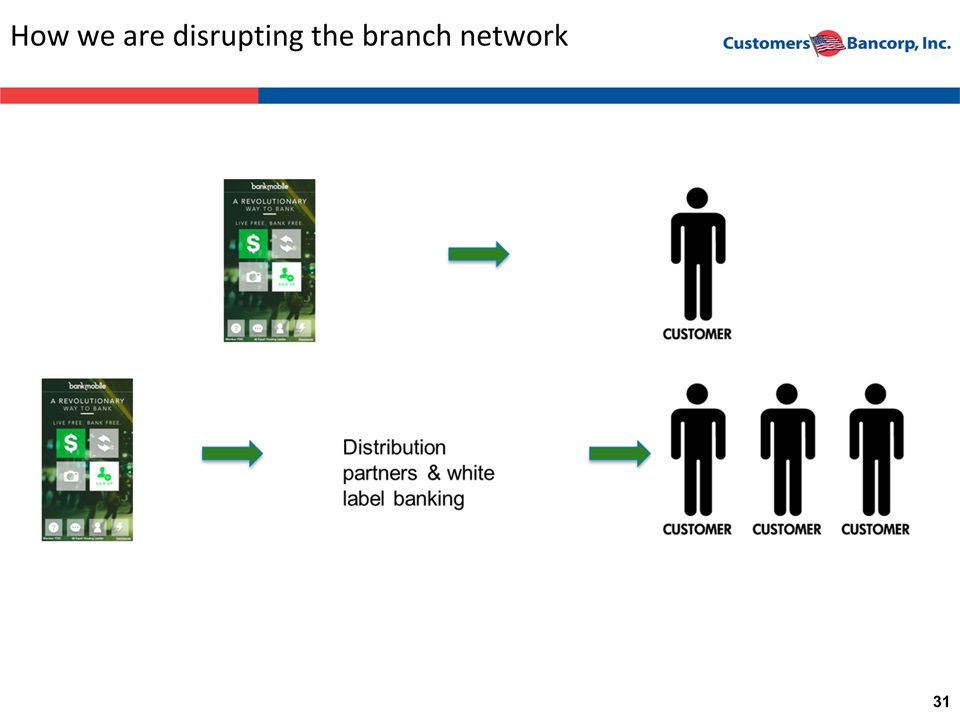
How we are disrupting the branch network
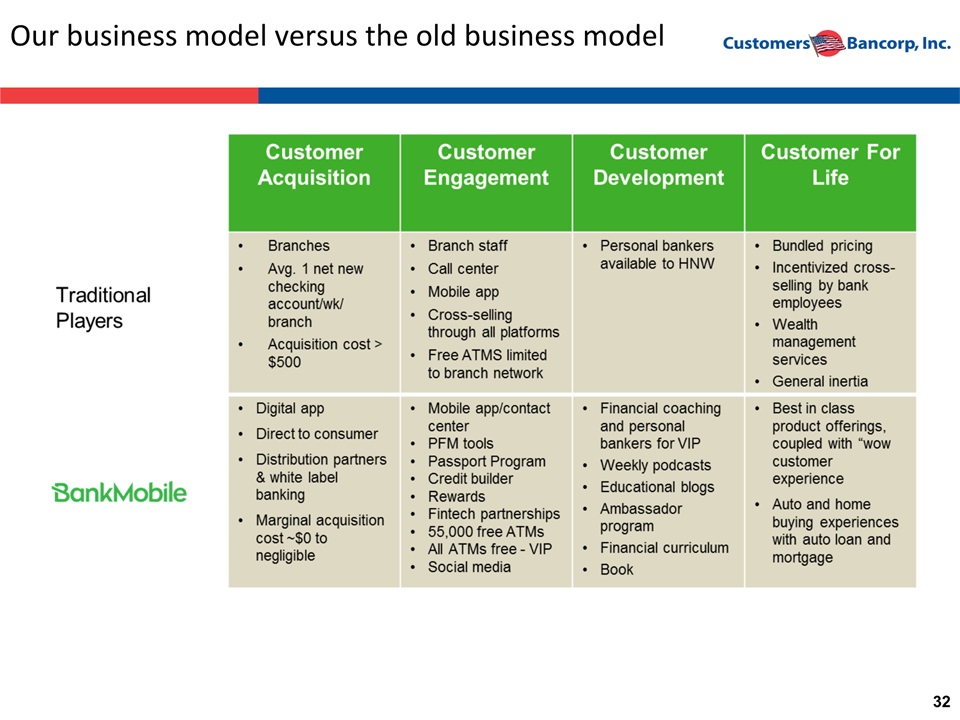
Our business model versus the old business model

BankMobile’s Customer Lifecycle Ecosystem BankMobile is well positioned to be its customers' primary banking relationship throughout their lives
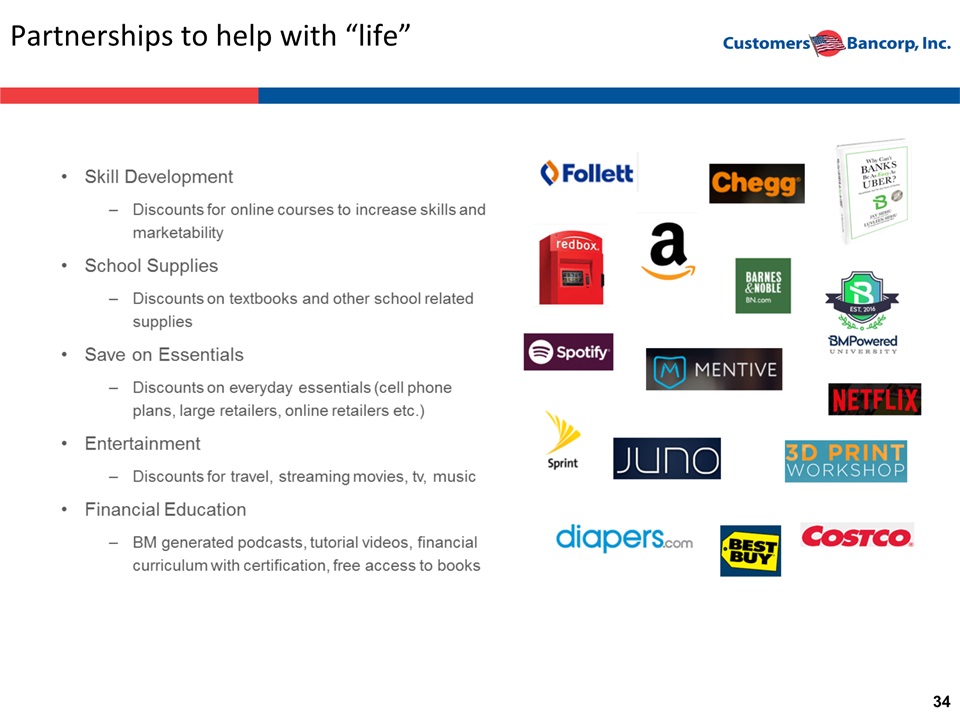
Partnerships to help with “life”
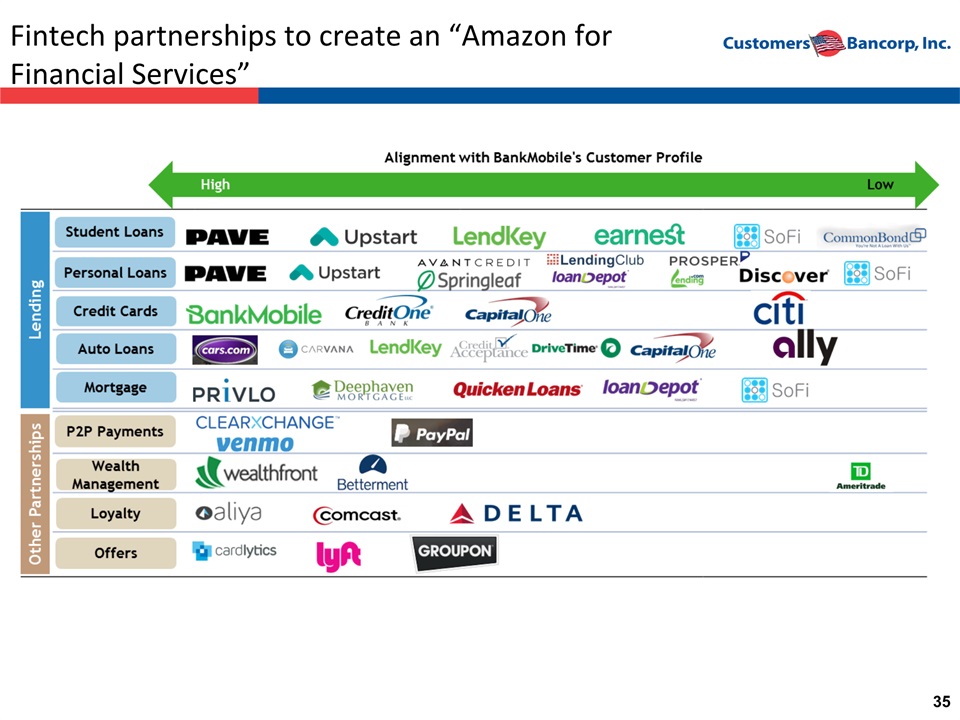
Fintech partnerships to create an “Amazon for Financial Services”
Distribution partnerships and white label banking opportunities significant
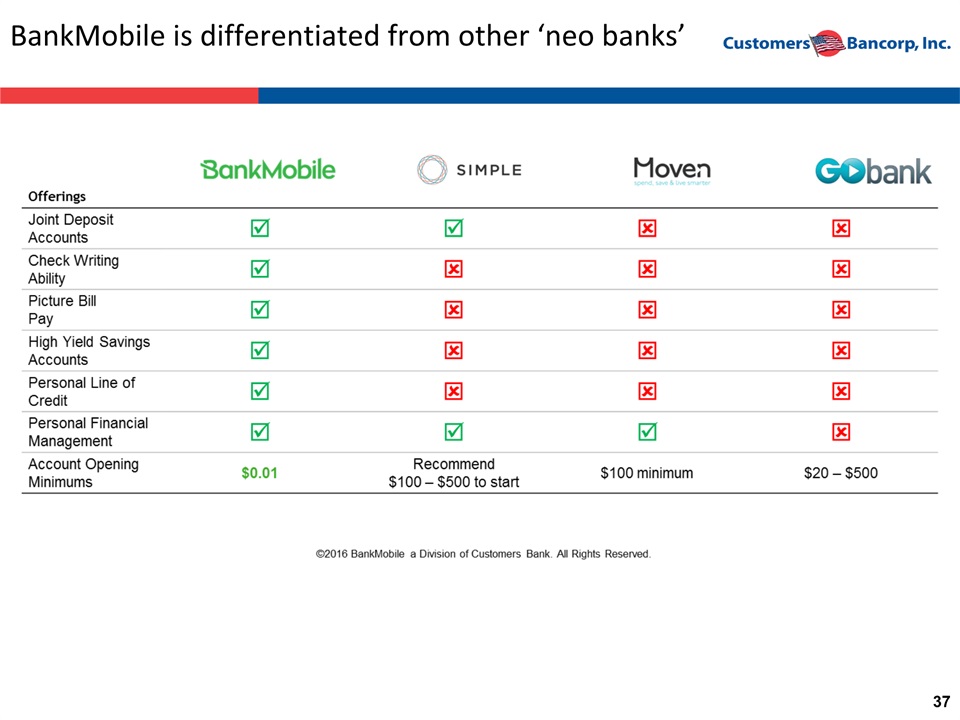
BankMobile is differentiated from other ‘neo banks’
BankMobile results to date through D2C and first B2B2C partner Bankmobile today is one of the top digital banks in the U.S.~1.5 million checking accounts; ~450,000 to 500,000 new checking accounts opened each year~$60 million per year non interest income revenues ~$600 million DDA’sExpected to be profitable by year end 2016Future growth opportunities are very significant
The future of banking A fintech company with a bank charter Use data analytics to improve the banking experience Move away from money transactions to money management Use APIs to share info and create a financial marketplaceTake part in the Internet of Things Conversational AI for human touchAdvanced biometrics
Contacts Company:Robert Wahlman, CFO Tel: 610-743-8074 rwahlman@customersbank.comwww.customersbank.com Jay SidhuChairman & CEOTel: 610-301-6476 jsidhu@customersbank.comwww.customersbank.com
Appendix
Customers Bank Risk Management
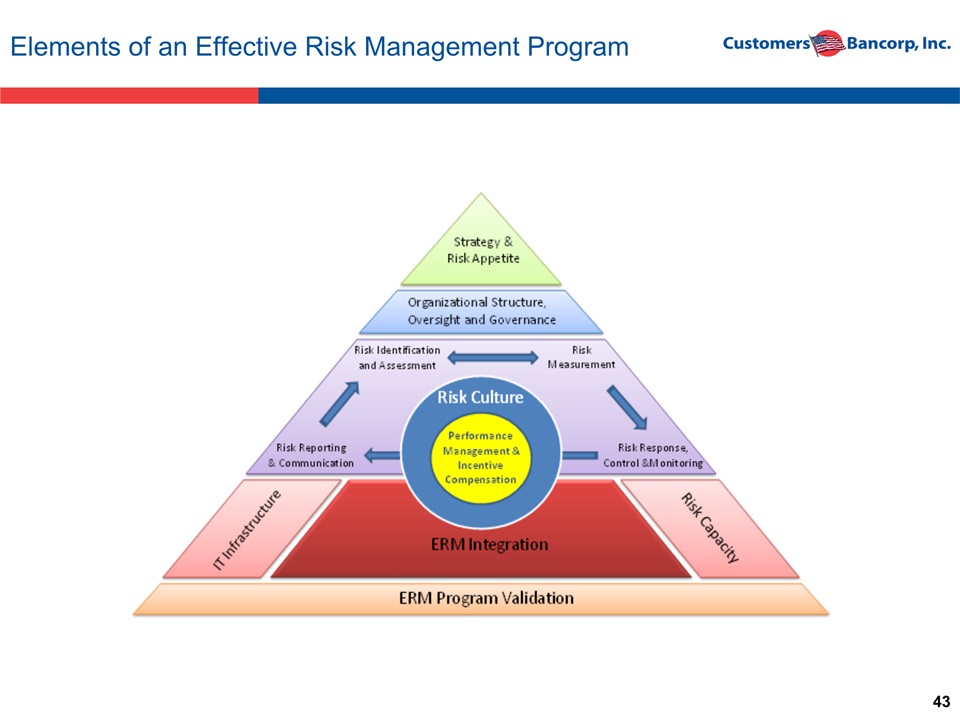
Elements of an Effective Risk Management Program
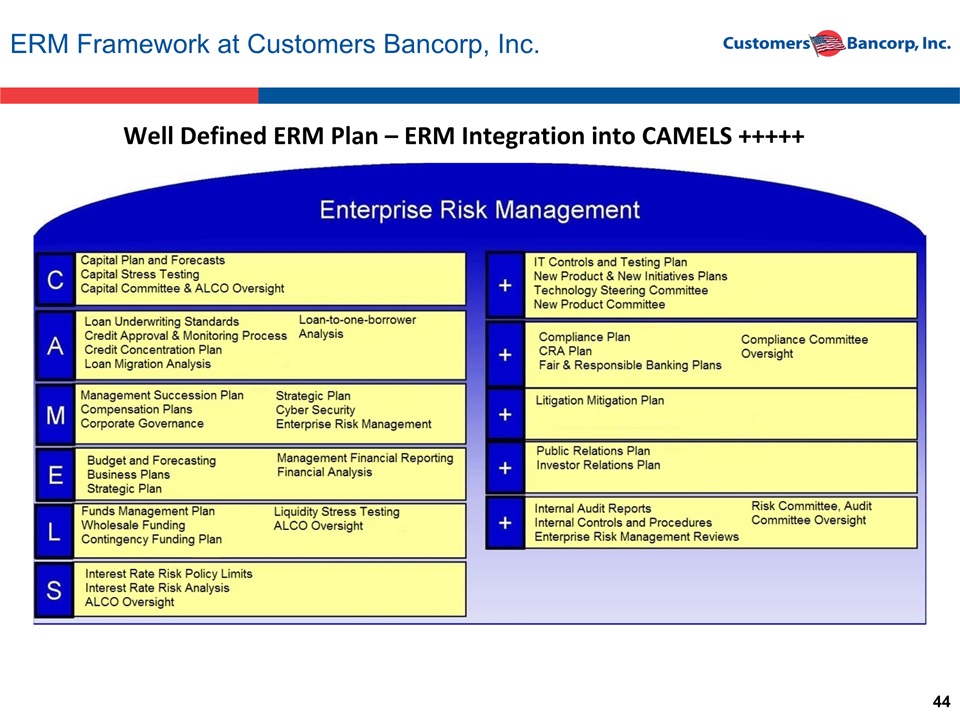
ERM Framework at Customers Bancorp, Inc. Well Defined ERM Plan – ERM Integration into CAMELS +++++
Customers Bancorp, Inc. Financial Statements
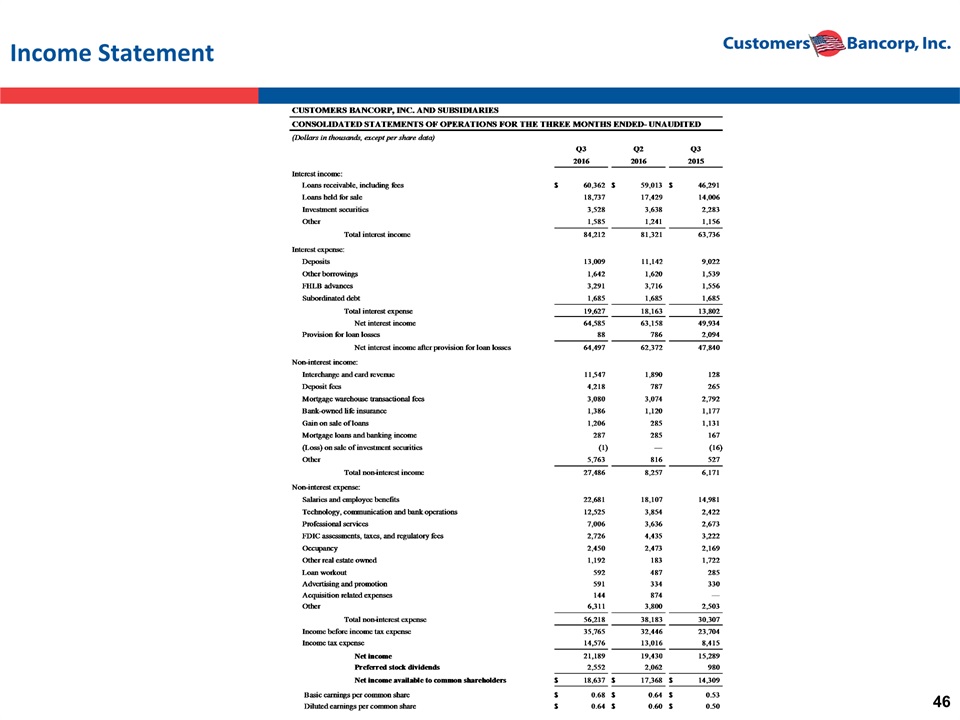
Income Statement
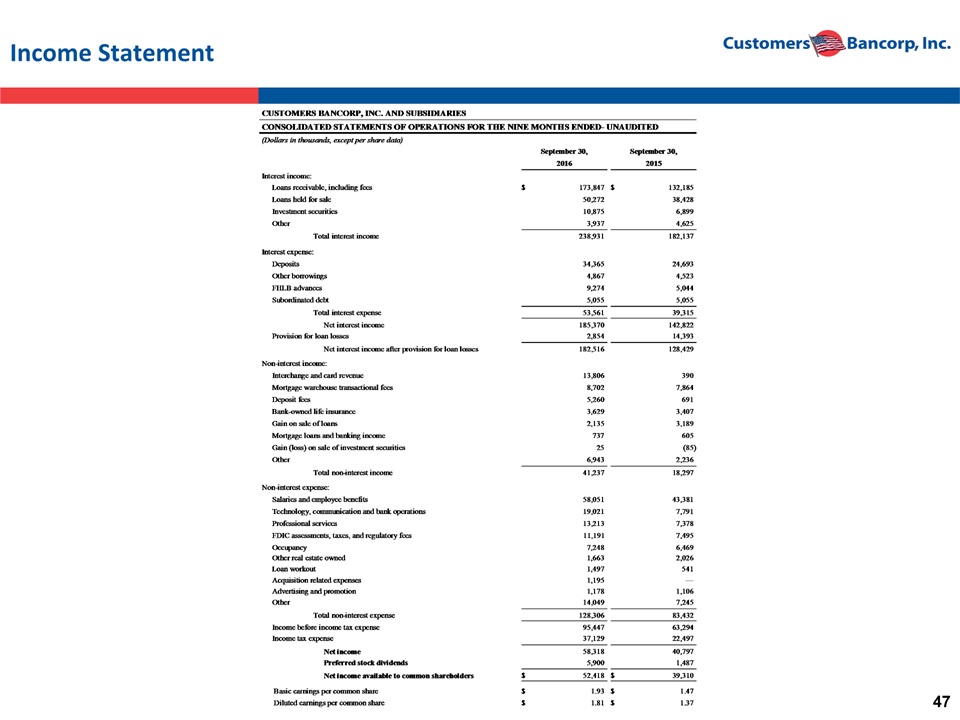
Income Statement
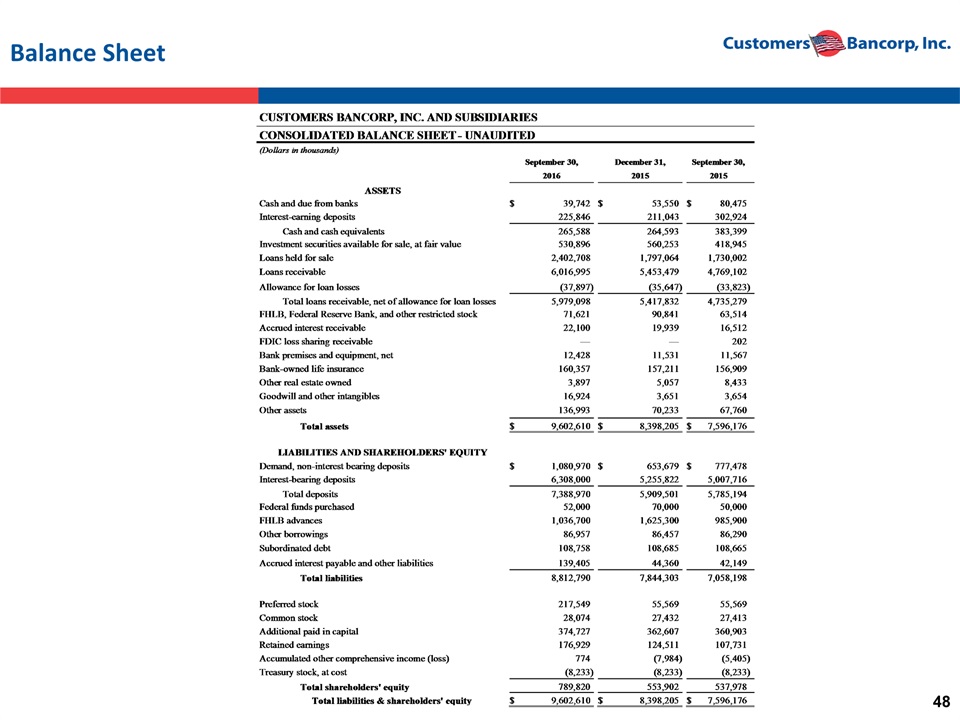
Balance Sheet

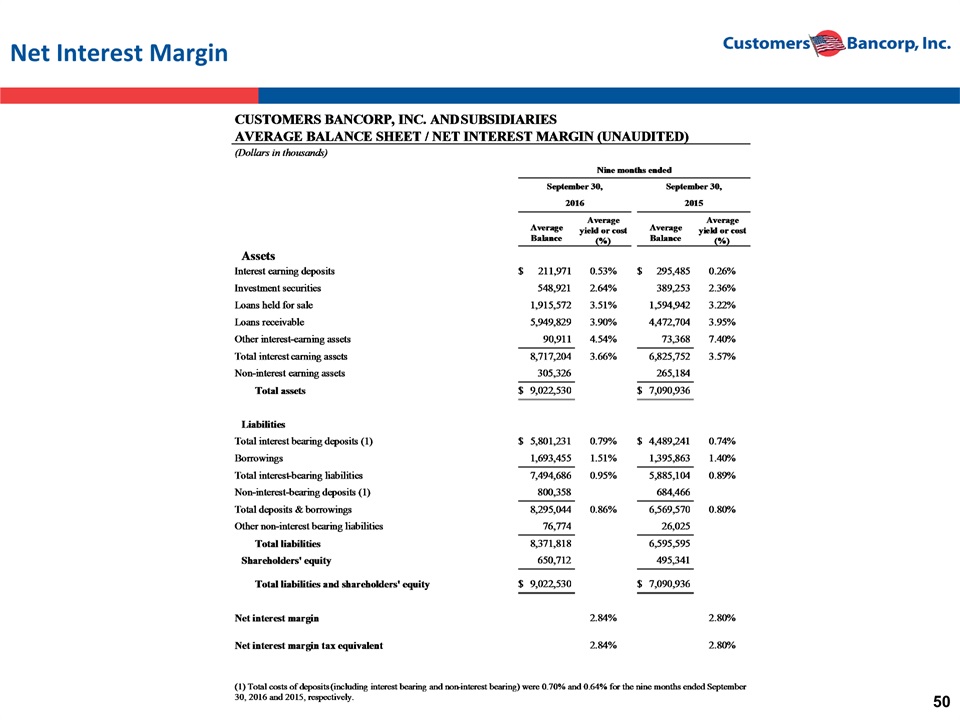
Net Interest Margin
Net Interest Margin
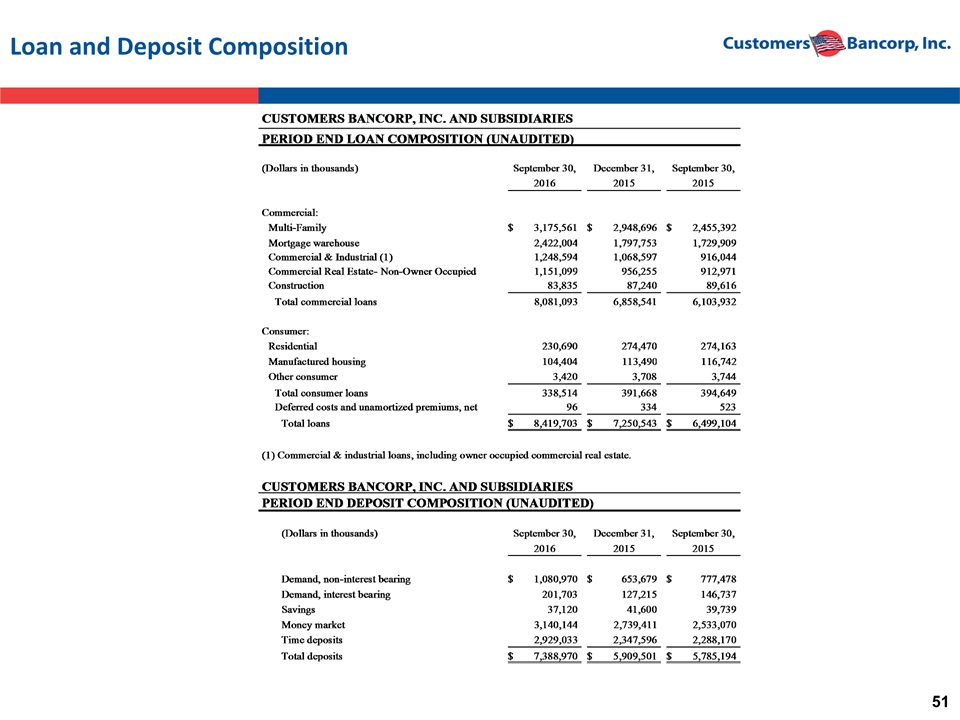
Loan and Deposit Composition
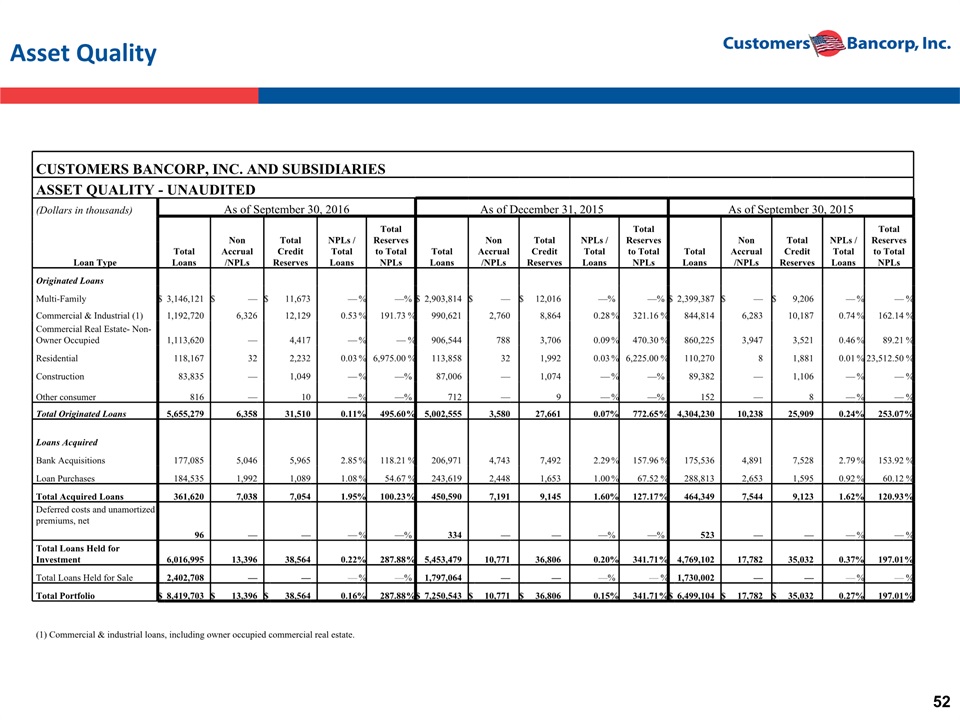
Asset Quality CUSTOMERS BANCORP, INC. AND SUBSIDIARIES ASSET QUALITY - UNAUDITED (Dollars in thousands) As of September 30, 2016 As of December 31, 2015 As of September 30, 2015 Total Loans Non Accrual /NPLs Total Credit Reserves NPLs / Total Loans Total Reserves to Total NPLs Total Loans Non Accrual /NPLs Total Credit Reserves NPLs / Total Loans Total Reserves to Total NPLs Total Loans Non Accrual /NPLs Total Credit Reserves NPLs / Total Loans Total Reserves to Total NPLs Loan Type Originated Loans Multi-Family $ 3,146,121 $ — $ 11,673 — % —% $ 2,903,814 $ — $ 12,016 —% —% $ 2,399,387 $ — $ 9,206 — % — % Commercial & Industrial (1) 1,192,720 6,326 12,129 0.53 % 191.73 % 990,621 2,760 8,864 0.28 % 321.16 % 844,814 6,283 10,187 0.74 % 162.14 % Commercial Real Estate- Non-Owner Occupied 1,113,620 — 4,417 — % — % 906,544 788 3,706 0.09 % 470.30 % 860,225 3,947 3,521 0.46 % 89.21 % Residential 118,167 32 2,232 0.03 % 6,975.00 % 113,858 32 1,992 0.03 % 6,225.00 % 110,270 8 1,881 0.01 % 23,512.50 % Construction 83,835 — 1,049 — % —% 87,006 — 1,074 — % —% 89,382 — 1,106 — % — % Other consumer 816 — 10 — % —% 712 — 9 — % —% 152 — 8 — % — % Total Originated Loans 5,655,279 6,358 31,510 0.11 % 495.60 % 5,002,555 3,580 27,661 0.07 % 772.65 % 4,304,230 10,238 25,909 0.24 % 253.07 % Loans Acquired Bank Acquisitions 177,085 5,046 5,965 2.85 % 118.21 % 206,971 4,743 7,492 2.29 % 157.96 % 175,536 4,891 7,528 2.79 % 153.92 % Loan Purchases 184,535 1,992 1,089 1.08 % 54.67 % 243,619 2,448 1,653 1.00 % 67.52 % 288,813 2,653 1,595 0.92 % 60.12 % Total Acquired Loans 361,620 7,038 7,054 1.95 % 100.23 % 450,590 7,191 9,145 1.60 % 127.17 % 464,349 7,544 9,123 1.62 % 120.93 % Deferred costs and unamortized premiums, net 96 — — — % —% 334 — — —% —% 523 — — — % — % Total Loans Held for Investment 6,016,995 13,396 38,564 0.22 % 287.88 % 5,453,479 10,771 36,806 0.20 % 341.71 % 4,769,102 17,782 35,032 0.37 % 197.01 % Total Loans Held for Sale 2,402,708 — — — % —% 1,797,064 — — —% — % 1,730,002 — — — % — % Total Portfolio $ 8,419,703 $ 13,396 $ 38,564 0.16 % 287.88 % $ 7,250,543 $ 10,771 $ 36,806 0.15 % 341.71 % $ 6,499,104 $ 17,782 $ 35,032 0.27 % 197.01 % (1) Commercial & industrial loans, including owner occupied commercial real estate.
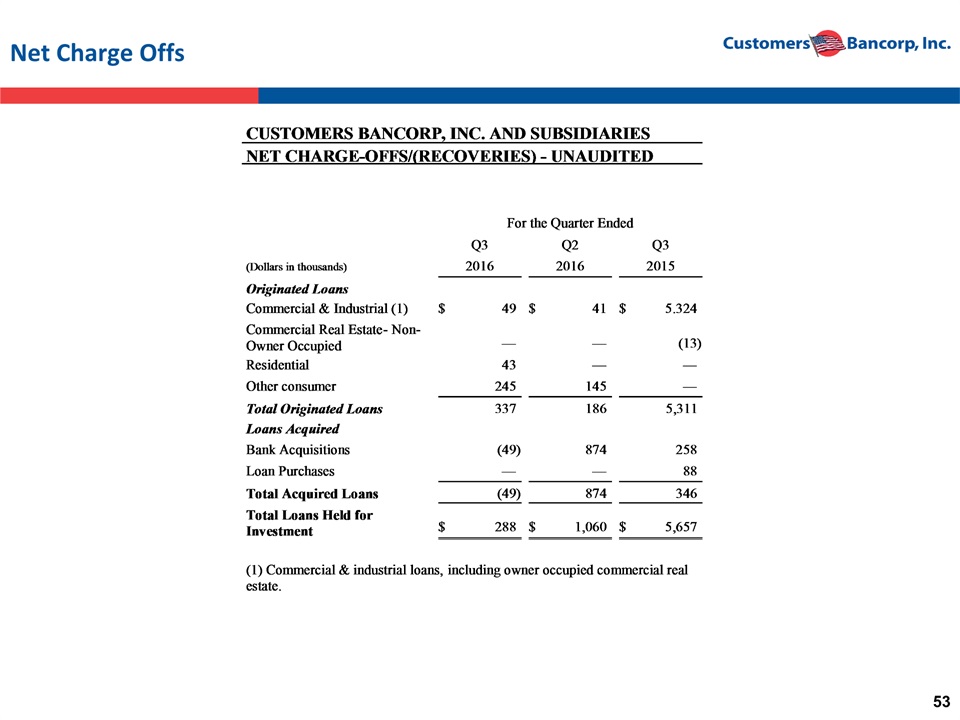
Net Charge Offs

Reconciliation of Non-GAAP Measures - Unaudited
Reconciliation of Non-GAAP Measures - Unaudited
Reconciliation of Non-GAAP Measures - Unaudited
Reconciliation of Non-GAAP Measures - Unaudited