Exhibit 99.1
Highly Focused, Low Risk, Above Average Growth Bank Holding Company Investor PresentationApril, 2017NYSE: CUBI
Forward-Looking Statements This presentation, as well as other written or oral communications made from time to time by us, contains forward-looking information within the meaning of the safe harbor provisions of the U.S. Private Securities Litigation Reform Act of 1995. These statements relate to future events or future predictions, including events or predictions relating to future financial performance, and are generally identifiable by the use of forward-looking terminology such as “believe,” “expect,” “may,” “will,” “should,” “plan,” “intend,” or “anticipate” or the negative thereof or comparable terminology. Forward- looking statements in this presentation include, among other matters, guidance for our financial performance, and our financial performance targets. Forward-looking statements reflect numerous assumptions, estimates and forecasts as to future events. No assurance can be given that the assumptions, estimates and forecasts underlying such forward-looking statements will accurately reflect future conditions, or that any guidance, goals, targets or projected results will be realized. The assumptions, estimates and forecasts underlying such forward-looking statements involve judgments with respect to, among other things, future economic, competitive, regulatory and financial market conditions and future business decisions, which may not be realized and which are inherently subject to significant business, economic, competitive and regulatory uncertainties and known and unknown risks, including the risks described under “Risk Factors” in our Annual Report on Form 10-K for the year ended December 31, 2016 and subsequent Quarterly Reports on Form 10-Q, as such factors may be updated from time to time in our filings with the SEC. Our actual results may differ materially from those reflected in the forward-looking statements.In addition to the risks described under “Risk Factors” in our filings with the SEC, important factors to consider and evaluate with respect to our forward-looking statements include:changes in external competitive market factors that might impact our results of operations;changes in laws and regulations, including without limitation changes in capital requirements under Basel III;changes in our business strategy or an inability to execute our strategy due to the occurrence of unanticipated events;our ability to identify potential candidates for, and consummate, acquisition or investment transactions;the timing of acquisition, investment or disposition transactions;constraints on our ability to consummate an attractive acquisition or investment transaction because of significant competition for these opportunities;local, regional and national economic conditions and events and the impact they may have on us and our customers;costs and effects of regulatory and legal developments, including the results of regulatory examinations and the outcome of regulatory or other governmental inquiries and proceedings, such as fines or restrictions on our business activities;our ability to attract deposits and other sources of liquidity;changes in the financial performance and/or condition of our borrowers;changes in the level of non-performing and classified assets and charge-offs;changes in estimates of future loan loss reserve requirements based upon the periodic review thereof under relevant regulatory and accounting requirements; inflation, interest rate, securities market and monetary fluctuations;

Forward-Looking Statements timely development and acceptance of new banking products and services and perceived overall value of these products and services by users, including the products and services being developed and introduced to the market by the BankMobile division of Customers Bank;changes in consumer spending, borrowing and saving habits;technological changes;our ability to increase market share and control expenses;continued volatility in the credit and equity markets and its effect on the general economy;effects of changes in accounting policies and practices, as may be adopted by the regulatory agencies, as well as the Public Company Accounting Oversight Board, the Financial Accounting Standards Board and other accounting standard setters;the businesses of Customers Bank and any acquisition targets or merger partners and subsidiaries not integrating successfully or such integration being more difficult, time-consuming or costly than expected;material differences in the actual financial results of merger and acquisition activities compared with our expectations, such as with respect to the full realization of anticipated cost savings and revenue enhancements within the expected time frame;our ability to successfully implement our growth strategy, control expenses and maintain liquidity;Customers Bank's ability to pay dividends to Customers Bancorp;risks related to our proposed sale of BankMobile to Flagship Bank, including:our ability to successfully complete the proposed sale and the timing of completion; the ability of Customers and Flagship Bank to meet all of the conditions to completion of the proposed sale; the impact of the announcement of the proposed sale on the value of our securities, our business and our relationship with employees and customers; our use of the proceeds from the sale; the effect on Customers' business if the proposed sale is not completed and Customers is unable to sell or otherwise dispose of BankMobile before exceeding $10 billion in assets; risks relating to BankMobile, including: that integration of the Higher One Disbursement business with BankMobile may be less successful, more difficult, time-consuming or costly than expected, and that BankMobile may be unable to realize anticipated cost savings and revenue enhancements within the expected time frame or at all; the number of existing student customers who transfer their accounts to BankMobile from one of Higher One's former bank partners; material variances in the adoption rate of BankMobile's services by new students and/or the usage rate of BankMobile's services by current student customers compared to our expectations;

Forward-Looking Statements the levels of usage of other BankMobile student customers following graduation of additional product and service offerings of BankMobile or Customers Bank, including mortgages and consumer loans, and the mix of products and services used; our ability to implement changes to BankMobile's product and service offerings under current and future regulations and governmental policies; our ability to effectively manage revenue and expense fluctuations that may occur with respect to BankMobile's student-oriented business activities, which result from seasonal factors related to the higher-education academic year; our ability to implement our strategy regarding BankMobile, including with respect to our intent to sell or otherwise dispose of the BankMobile business in the future, depending upon market conditions and opportunities; and BankMobile's ability to successfully implement its growth strategy and control expenses.You are cautioned not to place undue reliance on any forward-looking statements we make, which speak only as of the date they are made. We do not undertake any obligation to release publicly or otherwise provide any revisions to any forward-looking statements we may make, including any forward-looking financial information, to reflect events or circumstances occurring after the date hereof or to reflect the occurrence of unanticipated events, except as may be required under applicable law.
Investment Proposition Customers Bank’s BankMobile Division is Classified as Held for Sale in all Customers’ Consolidated Financial Statements released since January 2017, Including the January and April Earnings Releases and the Form 10K as of, and for the Period Ending December 31, 2016. Amounts Included in this Investor Presentation are “Combined”, Including Both Continuing and Discontinued Operations, Unless Otherwise Indicated
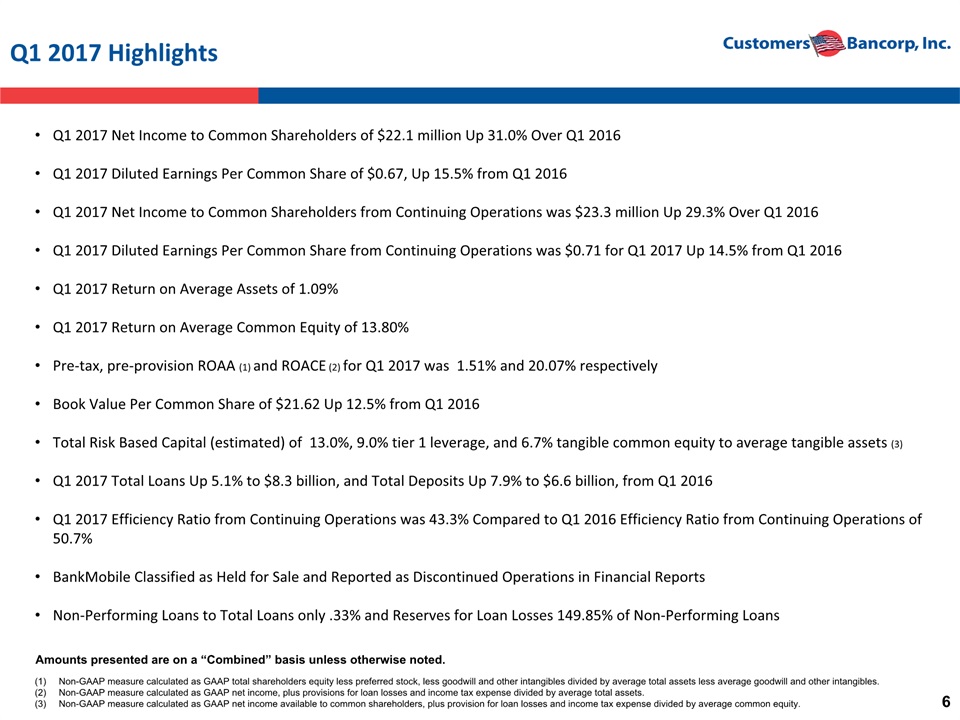
Q1 2017 Highlights Amounts presented are on a “Combined” basis unless otherwise noted. Q1 2017 Net Income to Common Shareholders of $22.1 million Up 31.0% Over Q1 2016 Q1 2017 Diluted Earnings Per Common Share of $0.67, Up 15.5% from Q1 2016 Q1 2017 Net Income to Common Shareholders from Continuing Operations was $23.3 million Up 29.3% Over Q1 2016 Q1 2017 Diluted Earnings Per Common Share from Continuing Operations was $0.71 for Q1 2017 Up 14.5% from Q1 2016 Q1 2017 Return on Average Assets of 1.09% Q1 2017 Return on Average Common Equity of 13.80% Pre-tax, pre-provision ROAA (1) and ROACE (2) for Q1 2017 was 1.51% and 20.07% respectivelyBook Value Per Common Share of $21.62 Up 12.5% from Q1 2016Total Risk Based Capital (estimated) of 13.0%, 9.0% tier 1 leverage, and 6.7% tangible common equity to average tangible assets (3)Q1 2017 Total Loans Up 5.1% to $8.3 billion, and Total Deposits Up 7.9% to $6.6 billion, from Q1 2016 Q1 2017 Efficiency Ratio from Continuing Operations was 43.3% Compared to Q1 2016 Efficiency Ratio from Continuing Operations of 50.7% BankMobile Classified as Held for Sale and Reported as Discontinued Operations in Financial ReportsNon-Performing Loans to Total Loans only .33% and Reserves for Loan Losses 149.85% of Non-Performing Loans Non-GAAP measure calculated as GAAP total shareholders equity less preferred stock, less goodwill and other intangibles divided by average total assets less average goodwill and other intangibles.Non-GAAP measure calculated as GAAP net income, plus provisions for loan losses and income tax expense divided by average total assets.Non-GAAP measure calculated as GAAP net income available to common shareholders, plus provision for loan losses and income tax expense divided by average common equity.
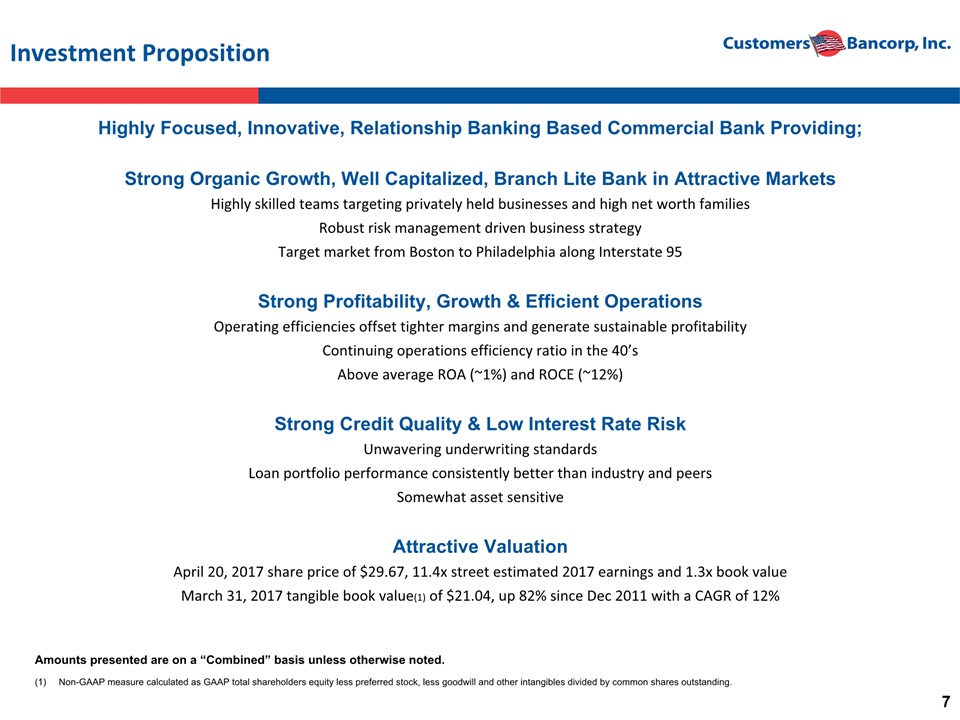
Investment Proposition Highly Focused, Innovative, Relationship Banking Based Commercial Bank Providing;Strong Organic Growth, Well Capitalized, Branch Lite Bank in Attractive MarketsHighly skilled teams targeting privately held businesses and high net worth familiesRobust risk management driven business strategyTarget market from Boston to Philadelphia along Interstate 95Strong Profitability, Growth & Efficient OperationsOperating efficiencies offset tighter margins and generate sustainable profitabilityContinuing operations efficiency ratio in the 40’sAbove average ROA (~1%) and ROCE (~12%)Strong Credit Quality & Low Interest Rate RiskUnwavering underwriting standardsLoan portfolio performance consistently better than industry and peersSomewhat asset sensitive Attractive ValuationApril 20, 2017 share price of $29.67, 11.4x street estimated 2017 earnings and 1.3x book valueMarch 31, 2017 tangible book value(1) of $21.04, up 82% since Dec 2011 with a CAGR of 12% Amounts presented are on a “Combined” basis unless otherwise noted. Non-GAAP measure calculated as GAAP total shareholders equity less preferred stock, less goodwill and other intangibles divided by common shares outstanding.
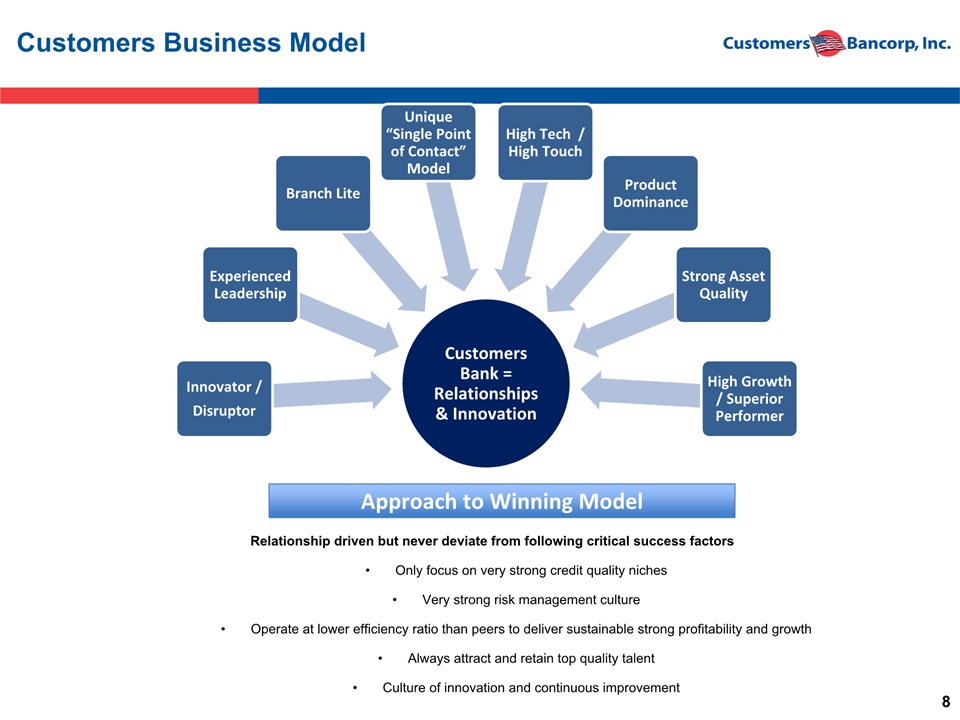
Customers Business Model Approach to Winning Model Relationship driven but never deviate from following critical success factorsOnly focus on very strong credit quality nichesVery strong risk management cultureOperate at lower efficiency ratio than peers to deliver sustainable strong profitability and growth Always attract and retain top quality talentCulture of innovation and continuous improvement
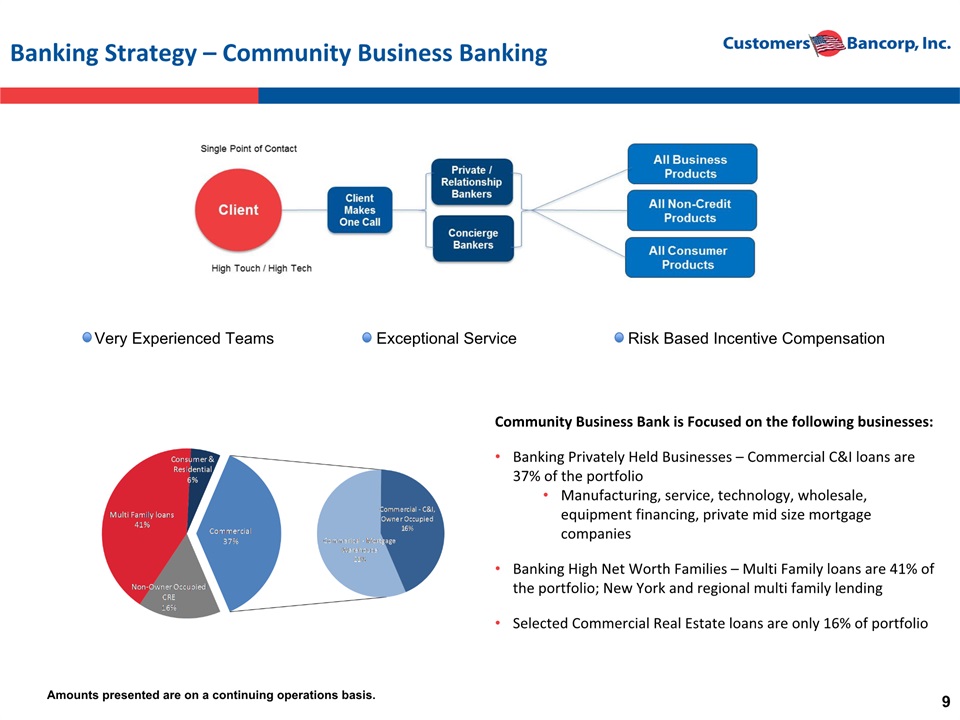
Very Experienced Teams Exceptional Service Risk Based Incentive Compensation Banking Strategy – Community Business Banking Community Business Bank is Focused on the following businesses:Banking Privately Held Businesses – Commercial C&I loans are 37% of the portfolio Manufacturing, service, technology, wholesale, equipment financing, private mid size mortgage companiesBanking High Net Worth Families – Multi Family loans are 41% of the portfolio; New York and regional multi family lendingSelected Commercial Real Estate loans are only 16% of portfolio Amounts presented are on a continuing operations basis.

Our Competitive Advantage: A Highly Experienced Management Team
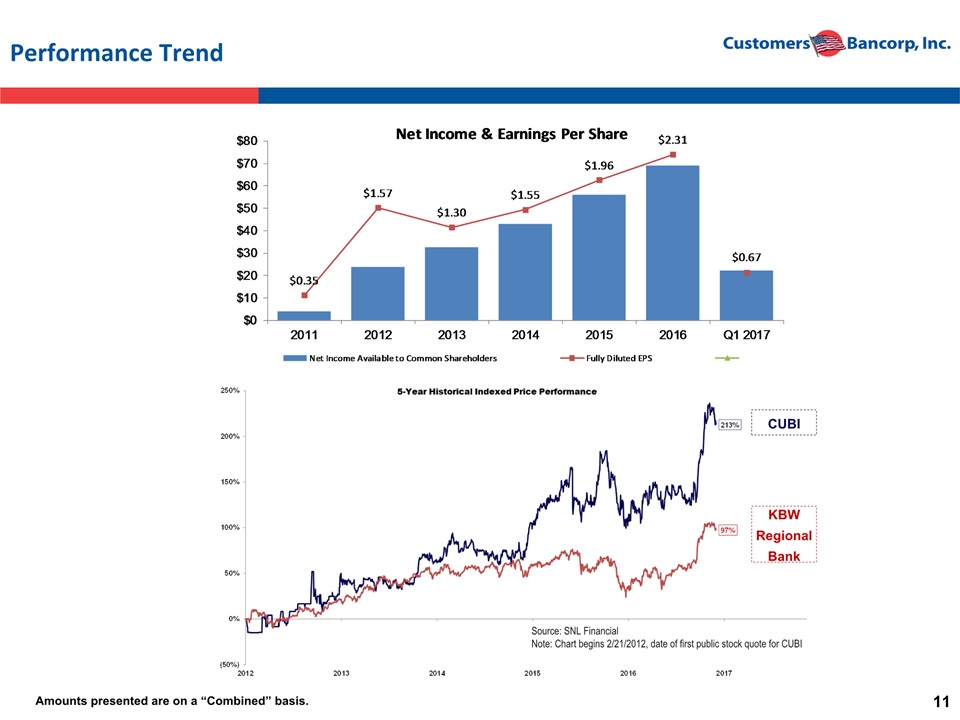
Performance Trend Amounts presented are on a “Combined” basis. Source: SNL FinancialNote: Chart begins 2/21/2012, date of first public stock quote for CUBI CUBI KBW Regional Bank
Customers Bank Executing On Our Unique High Performing Banking Model

Results in: Organic Growth of Deposits with Controlled Costs Source: Company data. Total Deposit Growth ($mm) Average DDA Growth ($mm) Cost of Deposits Total Deposits per Branch ($mm) Customers’ strategies of single point of contact and recruiting known teams in target markets produce rapid deposit growth with low total cost Amounts presented are on a “Combined” basis.
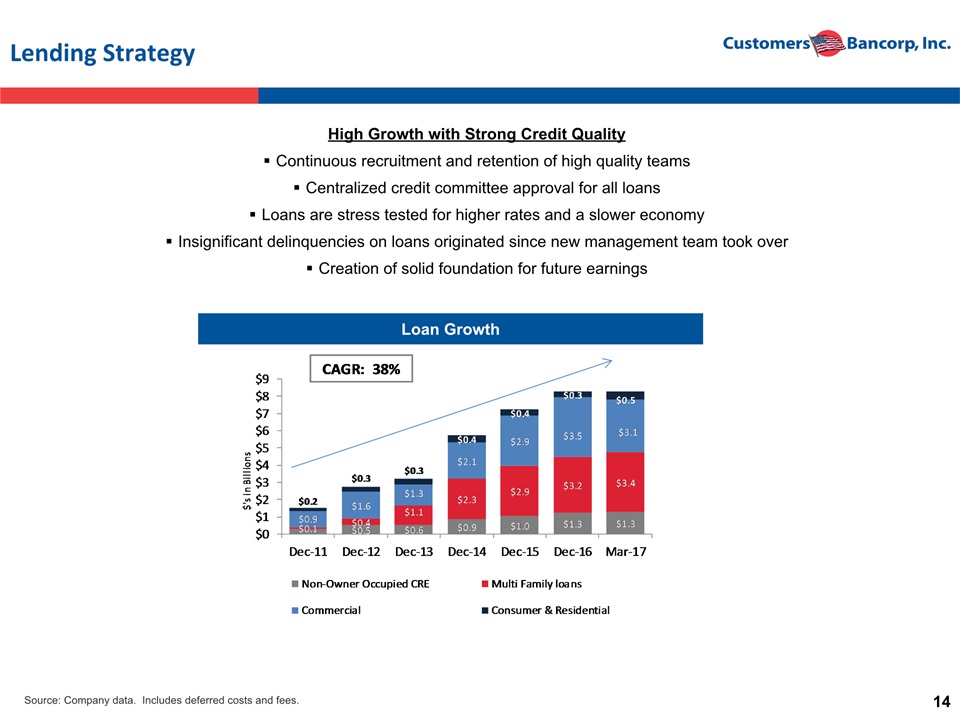
Lending Strategy High Growth with Strong Credit QualityContinuous recruitment and retention of high quality teamsCentralized credit committee approval for all loansLoans are stress tested for higher rates and a slower economyInsignificant delinquencies on loans originated since new management team took overCreation of solid foundation for future earnings Source: Company data. Includes deferred costs and fees. Loan Growth

NPL Source: SNL Financial, Company data. Peer data consists of Northeast and Mid-Atlantic banks and thrifts with comparable size in assets and loan portfolios (excluding banks with large residential mortgage loan portfolios). Industry data includes all commercial and savings banks. Peer and Industry data as of December 31, 2016 Build an Outstanding Loan Quality Portfolio Charge Offs Asset Quality Indicators Continue to be Strong Note: Customers 2015 charge-offs includes 12 bps for a $9 million fraudulent loan Charge Off amounts presented are on a “Combined” basis and include $592 thousand of charge offs related to BankMobile in 2016.
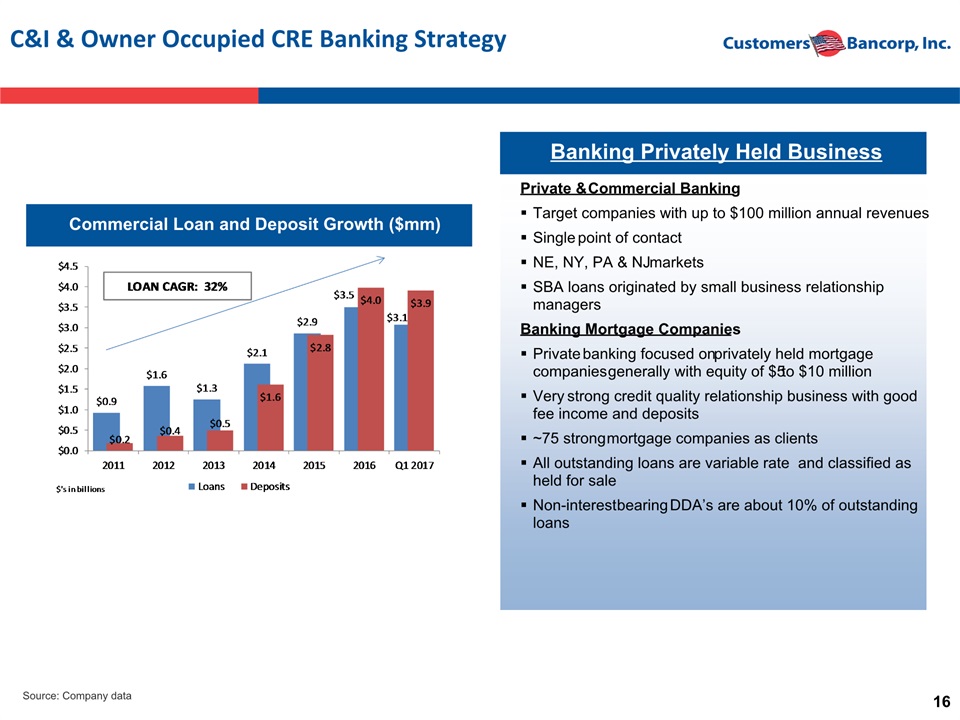
C&I & Owner Occupied CRE Banking Strategy Private & Commercial BankingTarget companies with up to $100 million annual revenuesSingle point of contactNE, NY, PA & NJ marketsSBA loans originated by small business relationship managersBanking Mortgage CompaniesPrivate banking focused on privately held mortgage companies generally with equity of $5 to $10 million Very strong credit quality relationship business with good fee income and deposits~75 strong mortgage companies as clients All outstanding loans are variable rate and classified as held for saleNon-interest bearing DDA’s are about 10% of outstanding loans Banking Privately Held Business Commercial Loan and Deposit Growth ($mm) Source: Company data
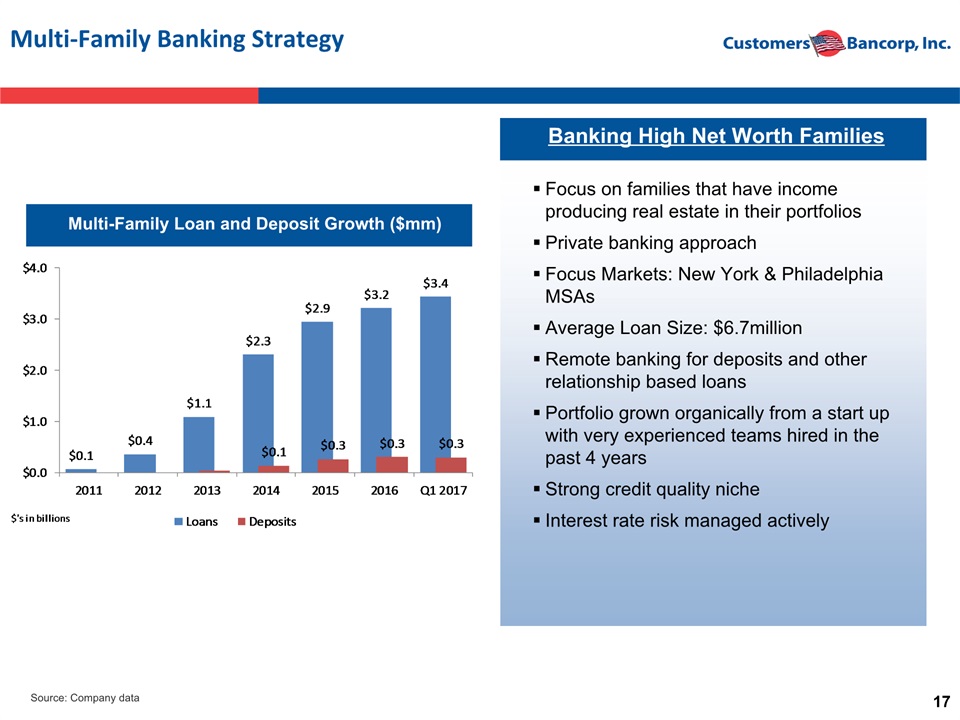
Multi-Family Banking Strategy Banking High Net Worth Families Multi-Family Loan and Deposit Growth ($mm) Focus on families that have income producing real estate in their portfoliosPrivate banking approachFocus Markets: New York & Philadelphia MSAsAverage Loan Size: $6.7millionRemote banking for deposits and other relationship based loansPortfolio grown organically from a start up with very experienced teams hired in the past 4 yearsStrong credit quality nicheInterest rate risk managed actively Source: Company data
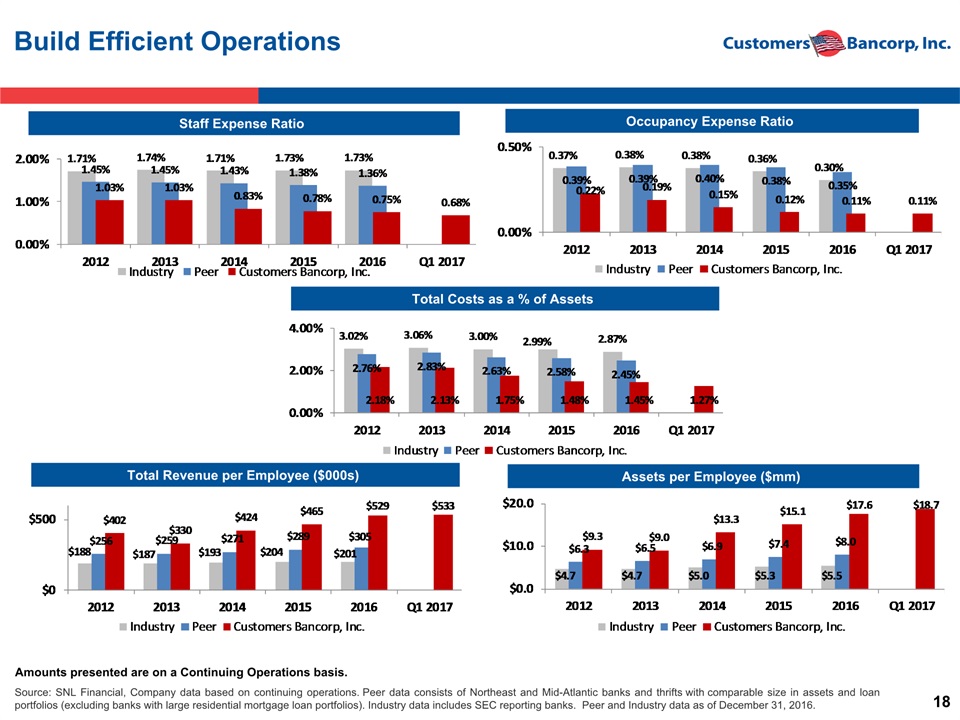
Staff Expense Ratio Build Efficient Operations Source: SNL Financial, Company data based on continuing operations. Peer data consists of Northeast and Mid-Atlantic banks and thrifts with comparable size in assets and loan portfolios (excluding banks with large residential mortgage loan portfolios). Industry data includes SEC reporting banks. Peer and Industry data as of December 31, 2016. Occupancy Expense Ratio Total Costs as a % of Assets Total Revenue per Employee ($000s) Assets per Employee ($mm) Amounts presented are on a Continuing Operations basis.
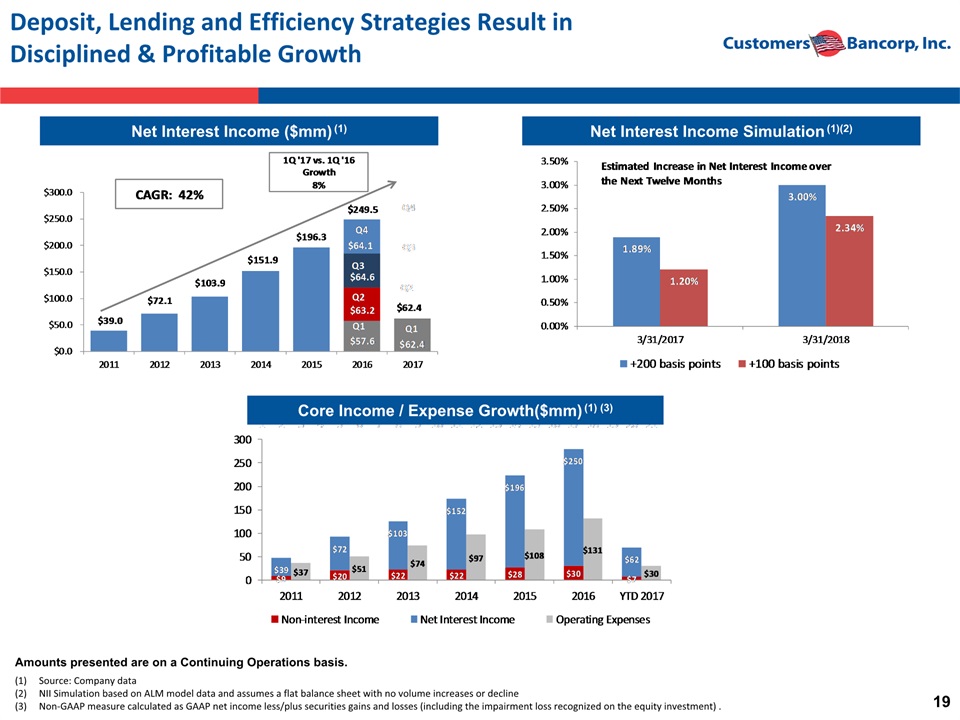
Deposit, Lending and Efficiency Strategies Result in Disciplined & Profitable Growth Net Interest Income ($mm) (1) Source: Company dataNII Simulation based on ALM model data and assumes a flat balance sheet with no volume increases or declineNon-GAAP measure calculated as GAAP net income less/plus securities gains and losses (including the impairment loss recognized on the equity investment) . Amounts presented are on a Continuing Operations basis. Net Interest Income Simulation (1)(2) Core Income / Expense Growth($mm) (1) (3)
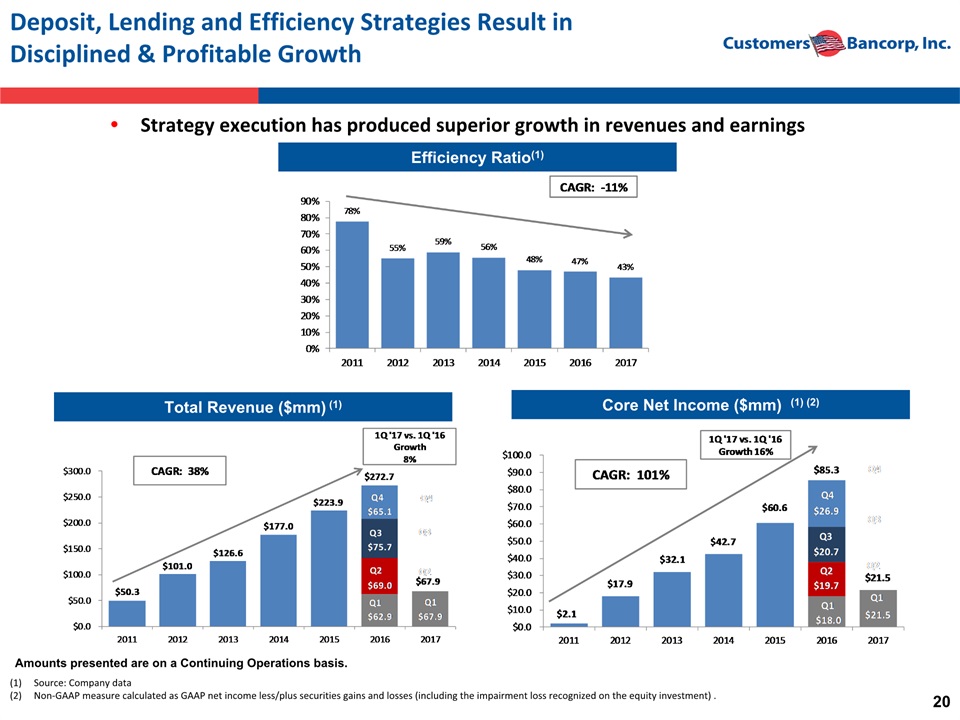
Deposit, Lending and Efficiency Strategies Result in Disciplined & Profitable Growth Strategy execution has produced superior growth in revenues and earnings Efficiency Ratio(1) Source: Company dataNon-GAAP measure calculated as GAAP net income less/plus securities gains and losses (including the impairment loss recognized on the equity investment) . Amounts presented are on a Continuing Operations basis. Core Net Income ($mm) (1) (2) Total Revenue ($mm) (1)
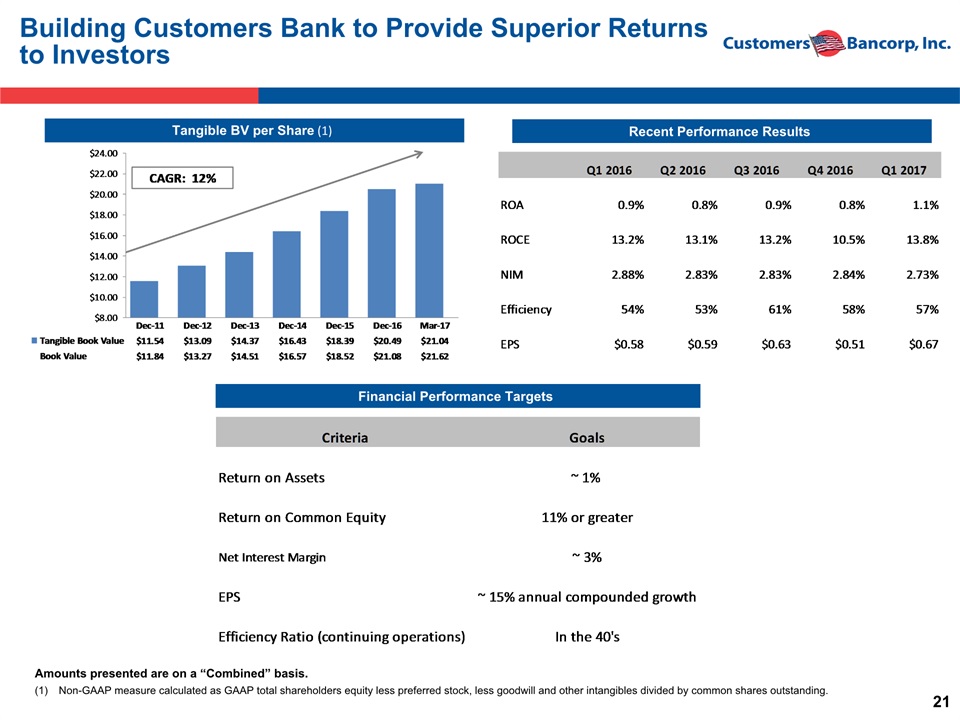
Tangible BV per Share (1) Building Customers Bank to Provide Superior Returns to Investors Recent Performance Results Financial Performance Targets Non-GAAP measure calculated as GAAP total shareholders equity less preferred stock, less goodwill and other intangibles divided by common shares outstanding. Amounts presented are on a “Combined” basis.
Customers BankCommunity Business Banking and BankMobile Business Segments
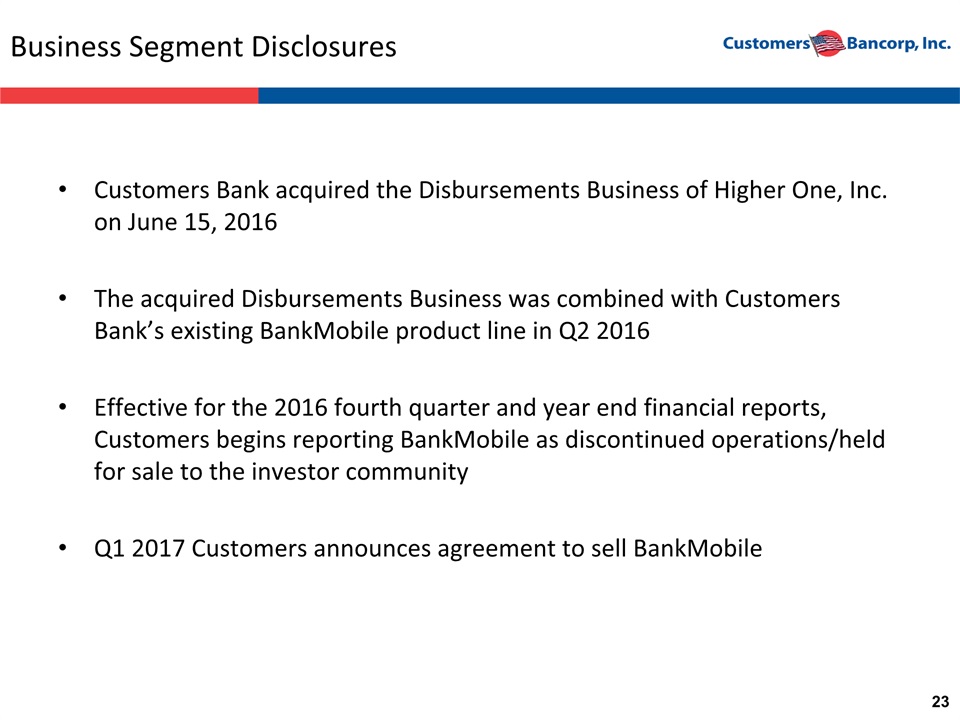
Business Segment Disclosures Customers Bank acquired the Disbursements Business of Higher One, Inc. on June 15, 2016The acquired Disbursements Business was combined with Customers Bank’s existing BankMobile product line in Q2 2016Effective for the 2016 fourth quarter and year end financial reports, Customers begins reporting BankMobile as discontinued operations/held for sale to the investor communityQ1 2017 Customers announces agreement to sell BankMobile
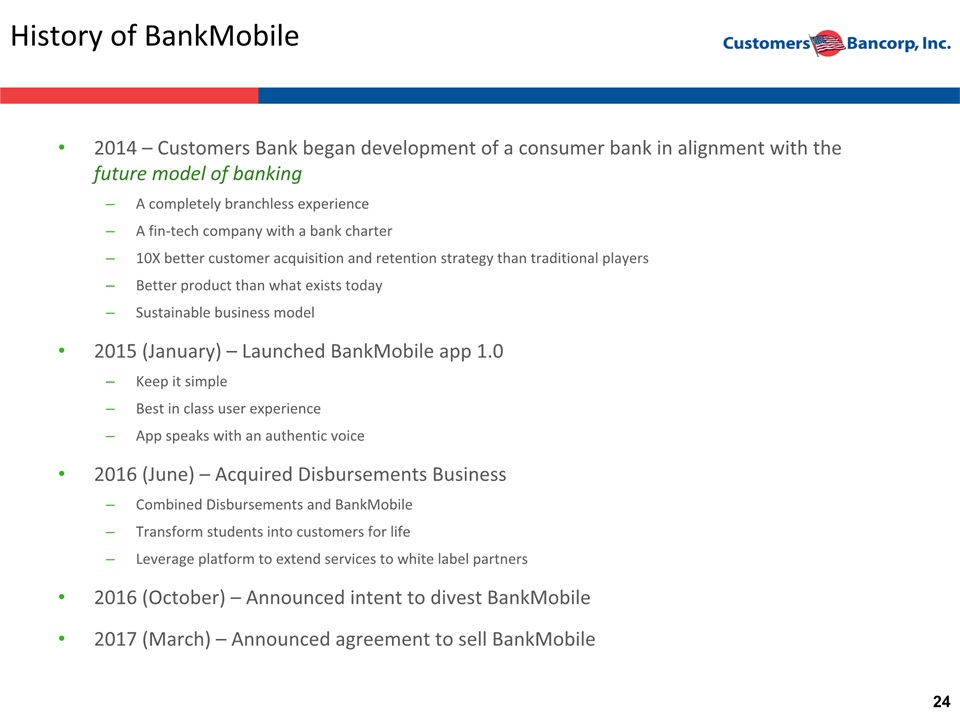
History of BankMobile 2014 – Customers Bank began development of a consumer bank in alignment with the future model of banking A completely branchless experience A fin-tech company with a bank charter10X better customer acquisition and retention strategy than traditional playersBetter product than what exists today Sustainable business model 2015 (January) – Launched BankMobile app 1.0Keep it simpleBest in class user experienceApp speaks with an authentic voice2016 (June) – Acquired Disbursements BusinessCombined Disbursements and BankMobile Transform students into customers for lifeLeverage platform to extend services to white label partners2016 (October) – Announced intent to divest BankMobile2017 (March) – Announced agreement to sell BankMobile

Segment Financial Performance Results Comparable 2016 periods are not provided as BankMobile was not operating as a segment in the first quarter of 2016 and its operations were not material.Segment results presented above include an internal allocation from Community Business Banking to BankMobile of $4.3 million in Q1 2017 for interest on deposits generated by the BankMobile segment used to fund the Community Business Banking Segment. The discontinued operations loss disclosed in the income statement prepared in accordance with generally accepted accounting principles (“GAAP”) does not consider the funds transfer pricing benefits of deposits.Direct operating revenues and costs are captured separately in the accounting records for each business segment. All corporate overhead costs are assigned to the Community Business Banking segment as those costs are expected to stay with the segment following the sale of the BankMobile segment, currently anticipated to occur within 6 to 12 months. Amounts presented are on a “Combined” basis.
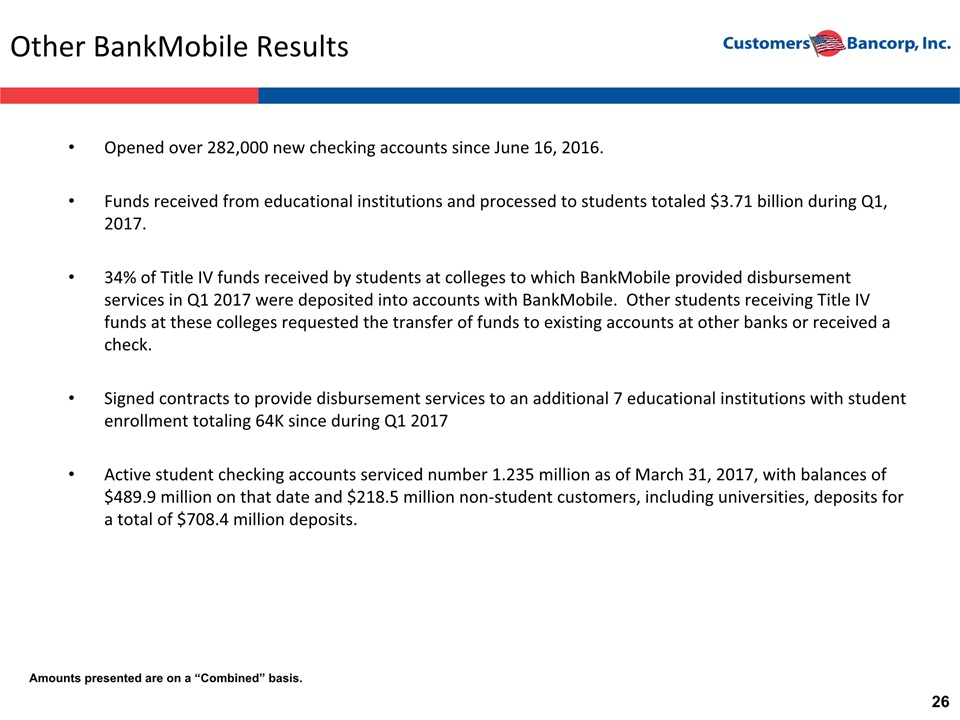
Other BankMobile Results Opened over 282,000 new checking accounts since June 16, 2016.Funds received from educational institutions and processed to students totaled $3.71 billion during Q1, 2017.34% of Title IV funds received by students at colleges to which BankMobile provided disbursement services in Q1 2017 were deposited into accounts with BankMobile. Other students receiving Title IV funds at these colleges requested the transfer of funds to existing accounts at other banks or received a check.Signed contracts to provide disbursement services to an additional 7 educational institutions with student enrollment totaling 64K since during Q1 2017Active student checking accounts serviced number 1.235 million as of March 31, 2017, with balances of $489.9 million on that date and $218.5 million non-student customers, including universities, deposits for a total of $708.4 million deposits. Amounts presented are on a “Combined” basis.
Contacts Company:Robert Wahlman, CFO Tel: 610-743-8074 rwahlman@customersbank.comwww.customersbank.com Jay SidhuChairman & CEOTel: 610-301-6476 jsidhu@customersbank.comwww.customersbank.com

Appendix
Customers Bank Risk Management

Elements of an Effective Risk Management Program

ERM Framework at Customers Bancorp, Inc. Well Defined ERM Plan – ERM Integration into CAMELS +++++

Customers Bancorp, Inc. Financial Statements
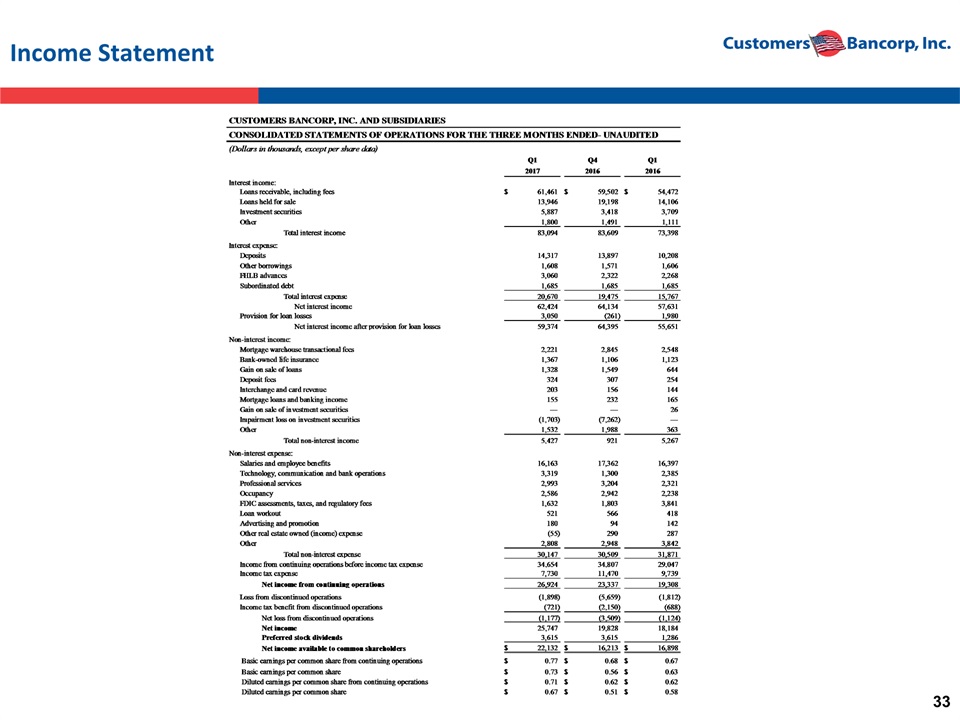
Income Statement

Balance Sheet
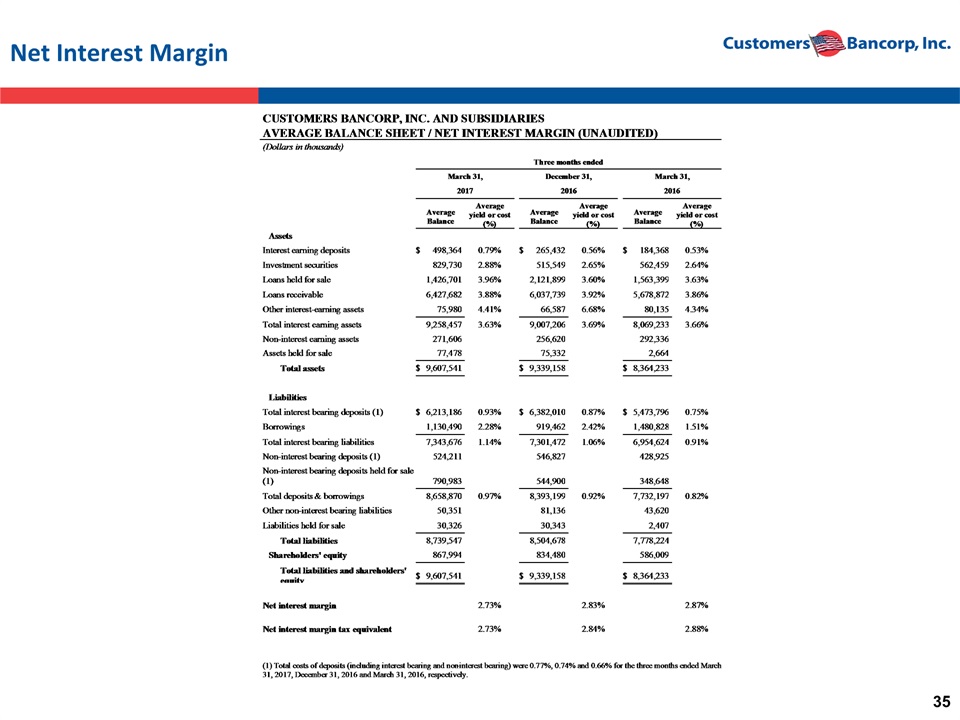
Net Interest Margin
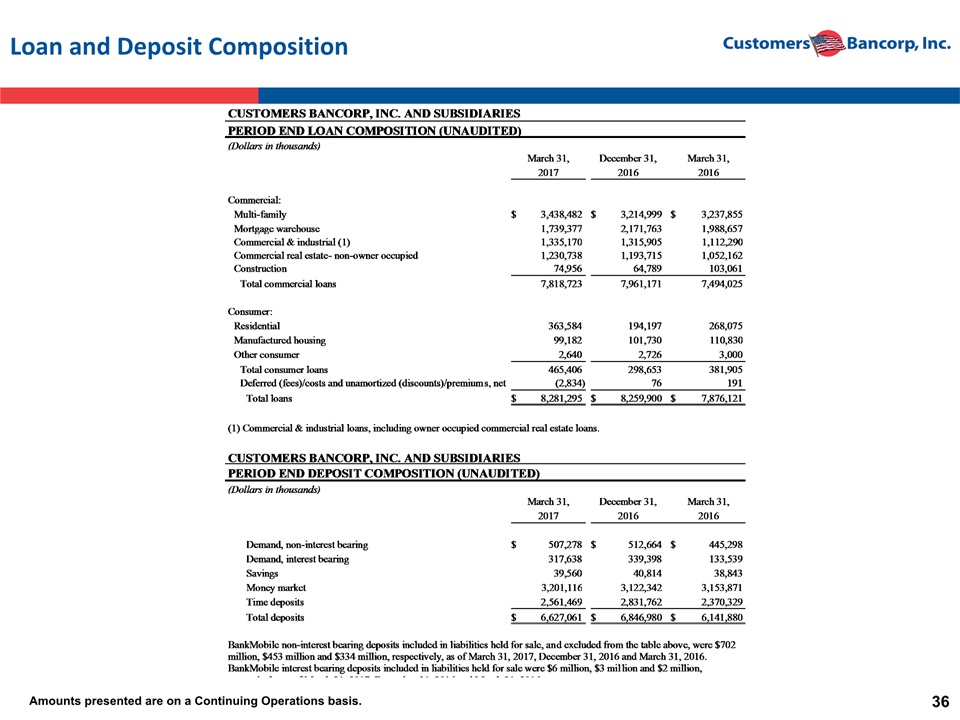
Loan and Deposit Composition Amounts presented are on a Continuing Operations basis.
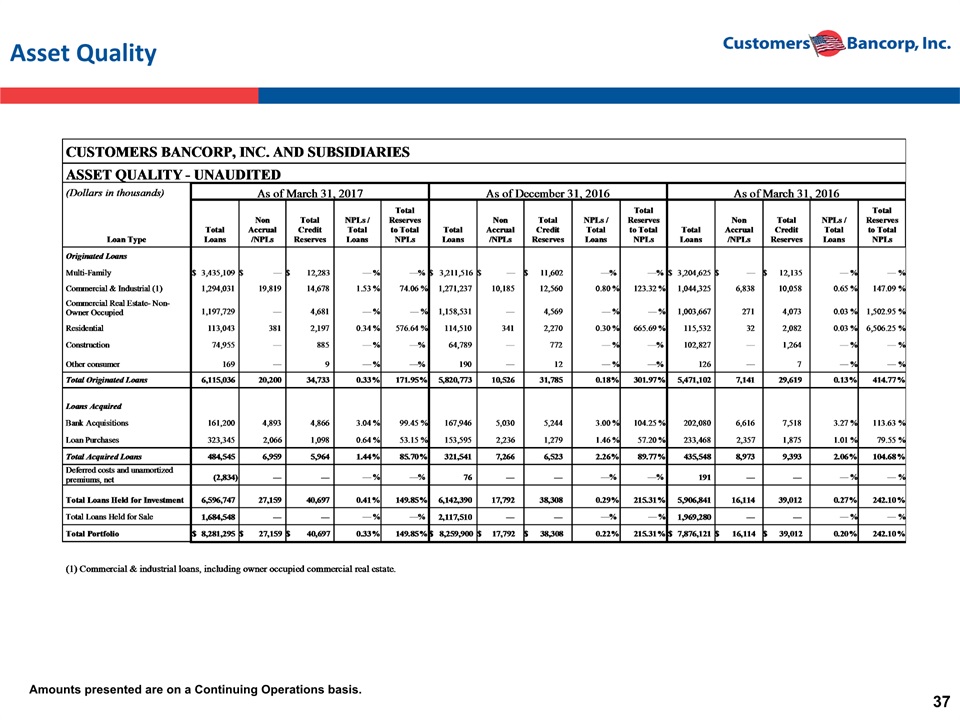
Asset Quality Amounts presented are on a Continuing Operations basis.
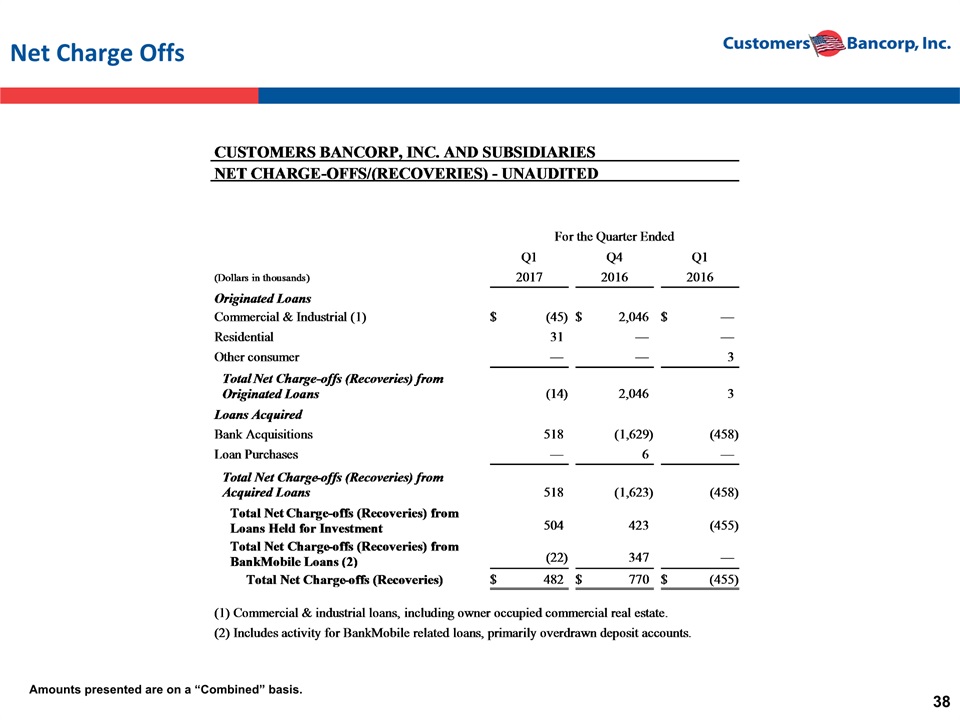
Net Charge Offs Amounts presented are on a “Combined” basis.
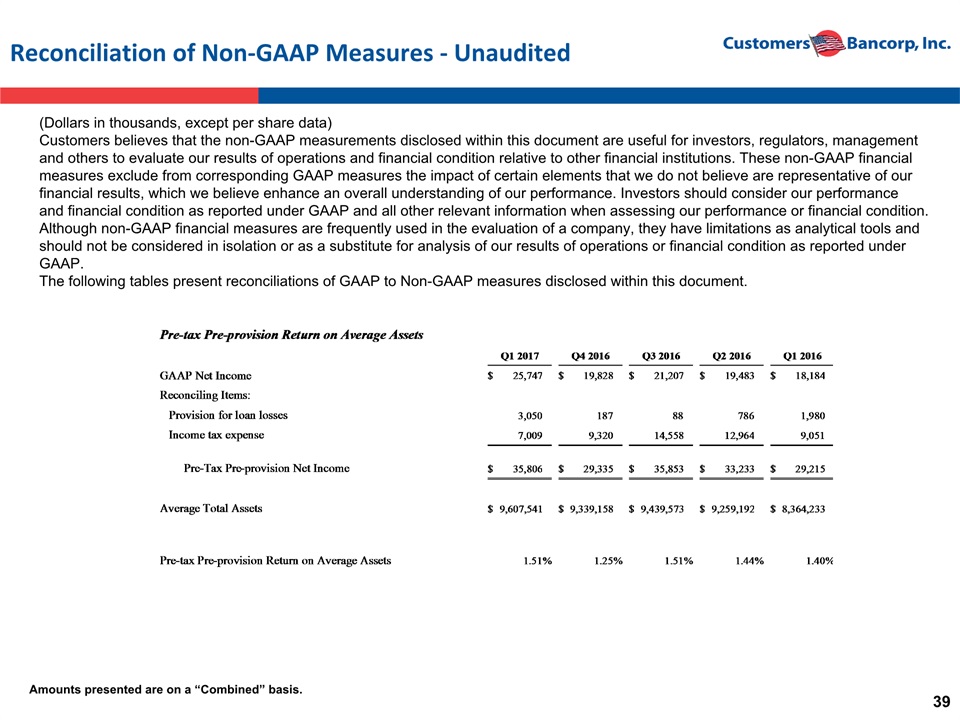
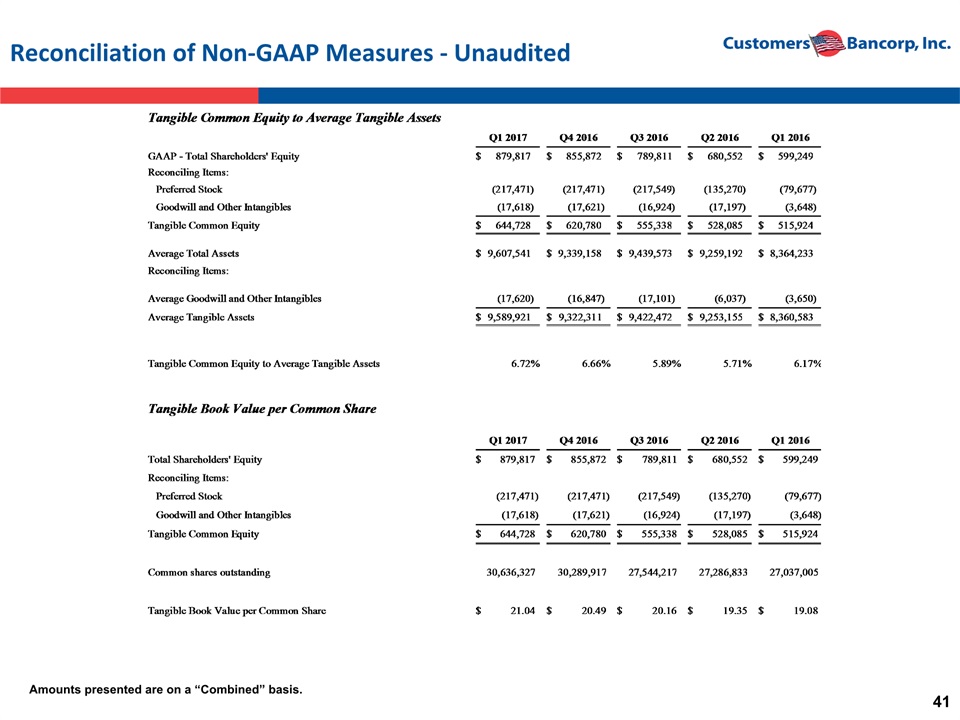
Reconciliation of Non-GAAP Measures - Unaudited (Dollars in thousands, except per share data)Customers believes that the non-GAAP measurements disclosed within this document are useful for investors, regulators, management and others to evaluate our results of operations and financial condition relative to other financial institutions. These non-GAAP financial measures exclude from corresponding GAAP measures the impact of certain elements that we do not believe are representative of our financial results, which we believe enhance an overall understanding of our performance. Investors should consider our performance and financial condition as reported under GAAP and all other relevant information when assessing our performance or financial condition. Although non-GAAP financial measures are frequently used in the evaluation of a company, they have limitations as analytical tools and should not be considered in isolation or as a substitute for analysis of our results of operations or financial condition as reported under GAAP.The following tables present reconciliations of GAAP to Non-GAAP measures disclosed within this document. Amounts presented are on a “Combined” basis.

Reconciliation of Non-GAAP Measures - Unaudited Amounts presented are on a “Combined” basis.
Reconciliation of Non-GAAP Measures - Unaudited Amounts presented are on a “Combined” basis.
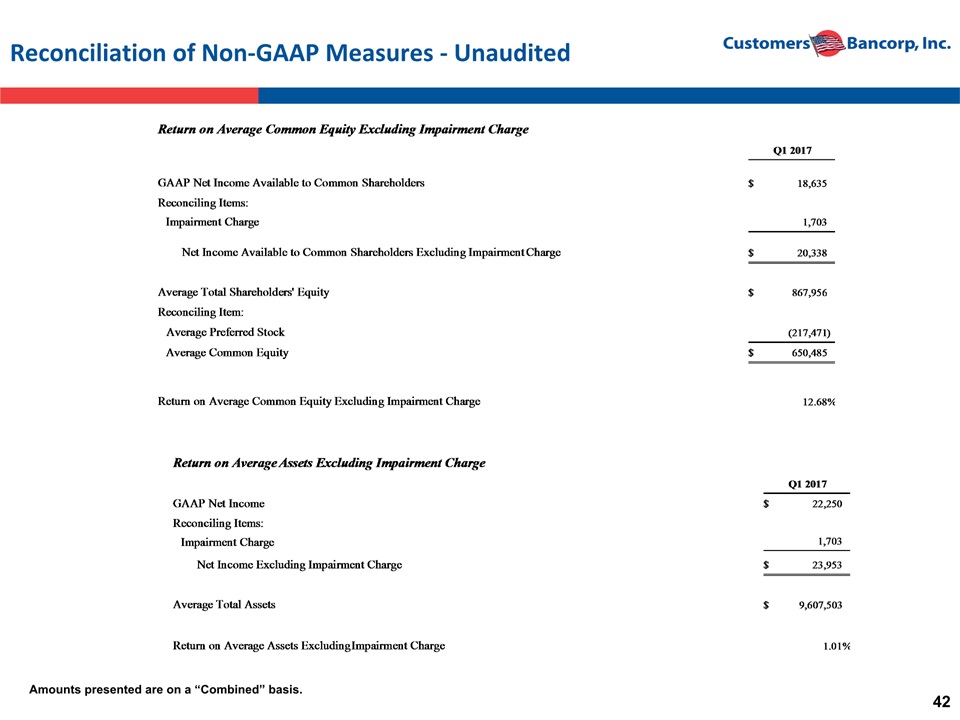
Reconciliation of Non-GAAP Measures - Unaudited Amounts presented are on a “Combined” basis.