
“A Digital-Forward Super-Community Bank“ Investor Presentation: Q4 2021 / FY 2021 Let’s take on tomorrow. January 2022
2 © 2022 C USTO M ERS BAN K / ALL RIG HTS RESERVED In addition to historical information, this presentation may contain “forward-looking statements” within the meaning of the “safe harbor” provisions of the Private Securities Litigation Reform Act of 1995. These forward-looking statements include statements with respect to Customers Bancorp, Inc.’s strategies, goals, beliefs, expectations, estimates, intentions, capital raising efforts, financial condition and results of operations, future performance and business. Statements preceded by, followed by, or that include the words “may,” “could,” “should,” “pro forma,” “looking forward,” “would,” “believe,” “expect,” “anticipate,” “estimate,” “intend,” “plan,” “project”, or similar expressions generally indicate a forward-looking statement. These forward-looking statements involve risks and uncertainties that are subject to change based on various important factors (some of which, in whole or in part, are beyond Customers Bancorp, Inc.’s control). Numerous competitive, economic, regulatory, legal and technological events and factors, among others, could cause Customers Bancorp, Inc.’s financial performance to differ materially from the goals, plans, objectives, intentions and expectations expressed in such forward-looking statements, including: The impact of the ongoing pandemic on the U.S. economy and customer behavior, the impact that changes in economy have on the performance of our loan and lease portfolio, the market value of our investment securities, the demand for our products and services and the availability of sources of funding, the continued success and acceptance of our blockchain payments system; the effects of actions by the federal government, including the Board of Governors of the Federal Reserve System and other government agencies, that effect market interest rates and the money supply; the actions that we and our customers take in response to these developments and the effects such actions have on our operations, products, services and customer relationships; and the effects of changes in accounting standards or policies. Customers Bancorp, Inc. cautions that the foregoing factors are not exclusive, and neither such factors nor any such forward-looking statement takes into account the impact of any future events. All forward-looking statements and information set forth herein are based on management’s current beliefs and assumptions as of the date hereof and speak only as of the date they are made. For a more complete discussion of the assumptions, risks and uncertainties related to our business, you are encouraged to review Customers Bancorp, Inc.’s filings with the Securities and Exchange Commission, including its most recent annual report on Form 10- K for the year ended December 31, 2020, subsequently filed quarterly reports on Form 10-Q and current reports on Form 8-K, including any amendments thereto, that update or provide information in addition to the information included in the Form 10-K and Form 10-Q filings, if any. Customers Bancorp, Inc. does not undertake to update any forward-looking statement whether written or oral, that may be made from time to time by Customers Bancorp, Inc. or by or on behalf of Customers Bank, except as may be required under applicable law. This does not constitute an offer to sell, or a solicitation of an offer to buy, any security in any state or jurisdiction in which such offer, solicitation or sale would be unlawful. Forward-Looking Statements

3 © 2022 C USTO M ERS BAN K / ALL RIG HTS RESERVED Community Banking Specialty Banking Digital Banking o C&I o Multi-Family o CRE o SMB Lending o SBA o Residential Mortgage o Warehouse Lending o Lender Finance o Fund Finance o Real Estate Specialty Finance o Equipment Finance o Healthcare Lending o Technology and Venture Capital Banking o Financial Institutions Group Consumer o Checking & Savings o Personal Installment o Student Loan Refinancing o Medical/Dental o Credit Card Commercial o Instant Payments o Digital Asset Banking o SMB Bundle o Credit Card BaaS o MPL Program Customers Bancorp Snapshot Customers Bancorp, Inc. NYSE: CUBI Headquarters West Reading, PA Offices1 39 FTE Employees 641 Market Capitalization2 As of 01/21/22 $2.0B Total Assets $19.6B Tangible Book Value3 $37.21 Data as of 12/31/2021, unless otherwise noted. (1) Offices includes branches, executive offices, Private Banking Offices and Loan Production Offices. (2) Calculated based on shares outstanding of 32.9M. (3) Non-GAAP Measure, refer to Appendix for reconciliation. New Lines of Business or Geographies in 2021 Lines of Business
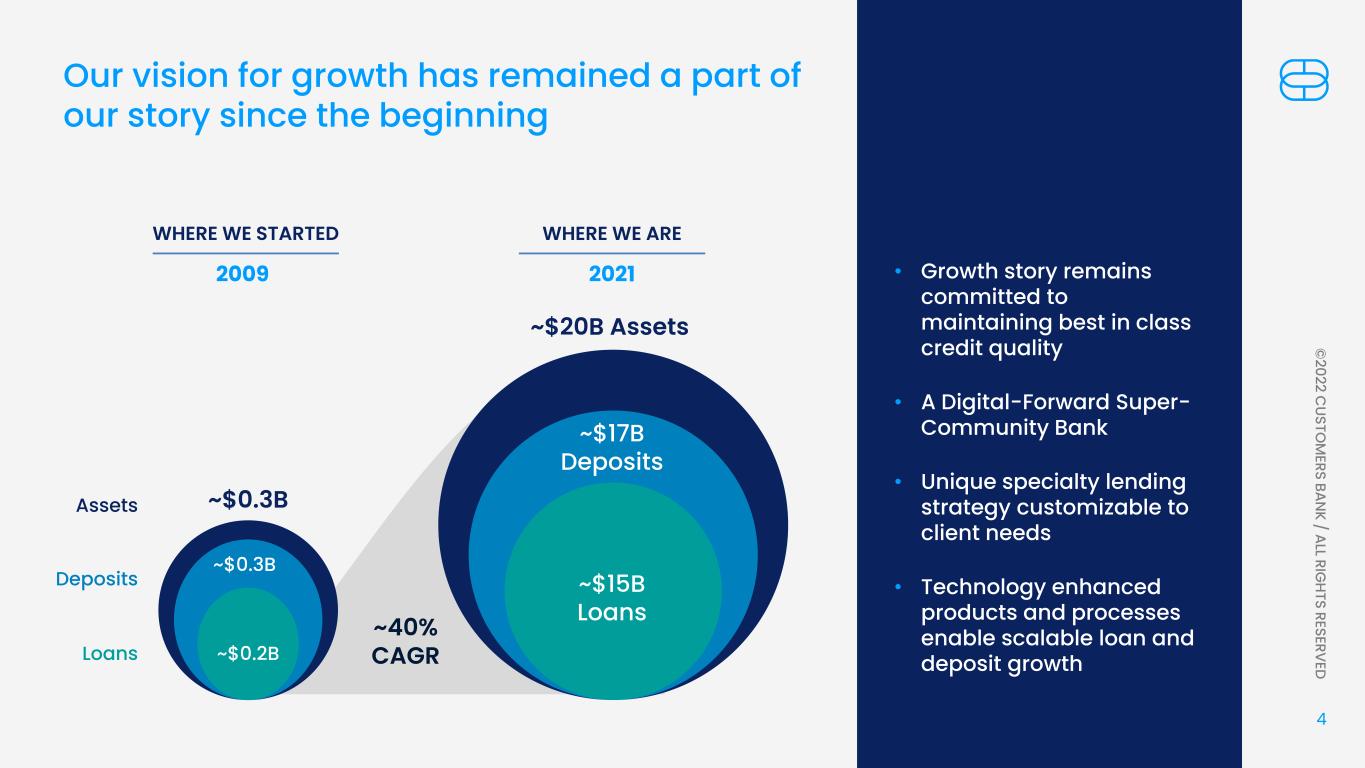
4 © 2022 C USTO M ERS BAN K / ALL RIG HTS RESERVED ~$20B Assets ~$17B Deposits ~$15B Loans • Growth story remains committed to maintaining best in class credit quality • A Digital-Forward Super- Community Bank • Unique specialty lending strategy customizable to client needs • Technology enhanced products and processes enable scalable loan and deposit growth ~$0.3B ~$0.3B ~$0.2B Assets Deposits Loans WHERE WE STARTED 2009 Our vision for growth has remained a part of our story since the beginning WHERE WE ARE 2021 ~40% CAGR
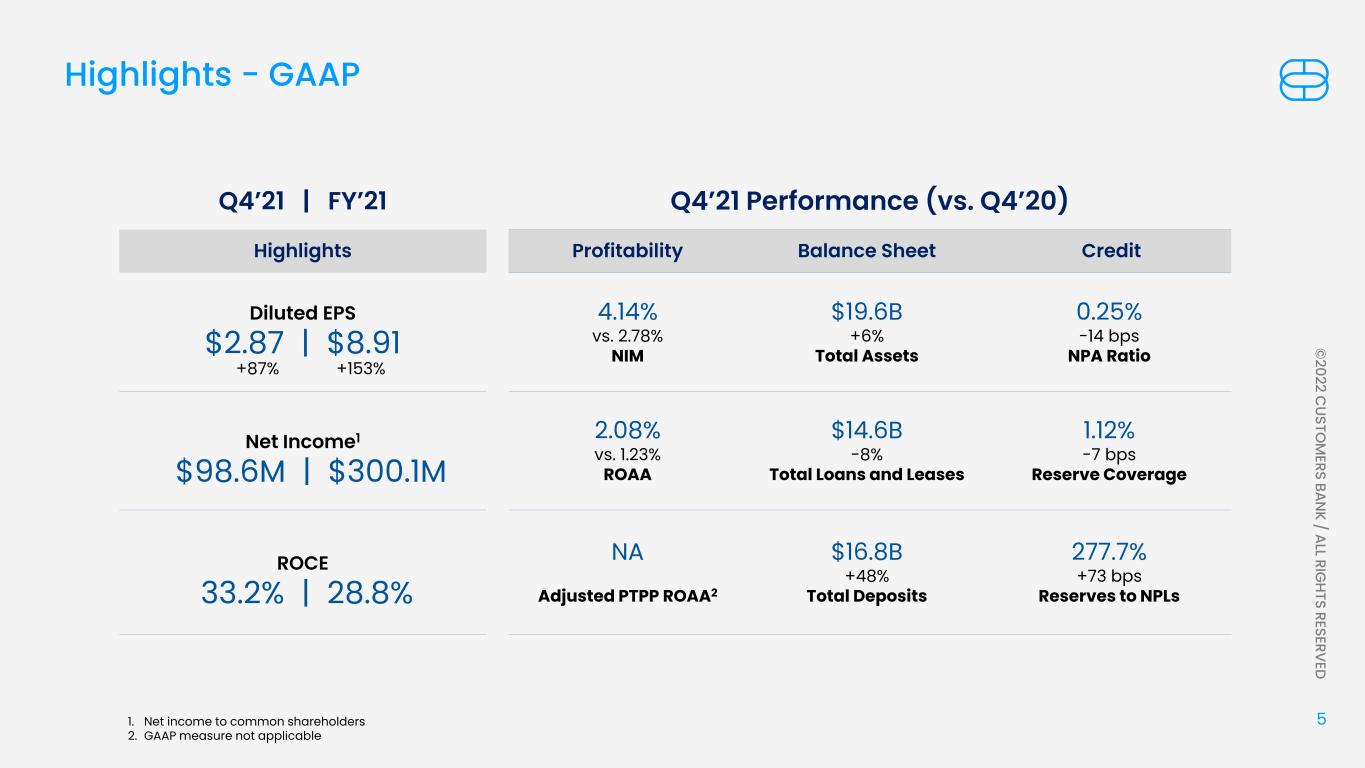
5 © 2022 C USTO M ERS BAN K / ALL RIG HTS RESERVED Q4’21 Performance (vs. Q4’20) Profitability Balance Sheet Credit 4.14% vs. 2.78% NIM $19.6B +6% Total Assets 0.25% -14 bps NPA Ratio 2.08% vs. 1.23% ROAA $14.6B -8% Total Loans and Leases 1.12% -7 bps Reserve Coverage NA Adjusted PTPP ROAA2 $16.8B +48% Total Deposits 277.7% +73 bps Reserves to NPLs Q4’21 | FY’21 Highlights - GAAP Highlights Diluted EPS $2.87 | $8.91 Net Income1 $98.6M | $300.1M ROCE 33.2% | 28.8% +87% +153% 1. Net income to common shareholders 2. GAAP measure not applicable
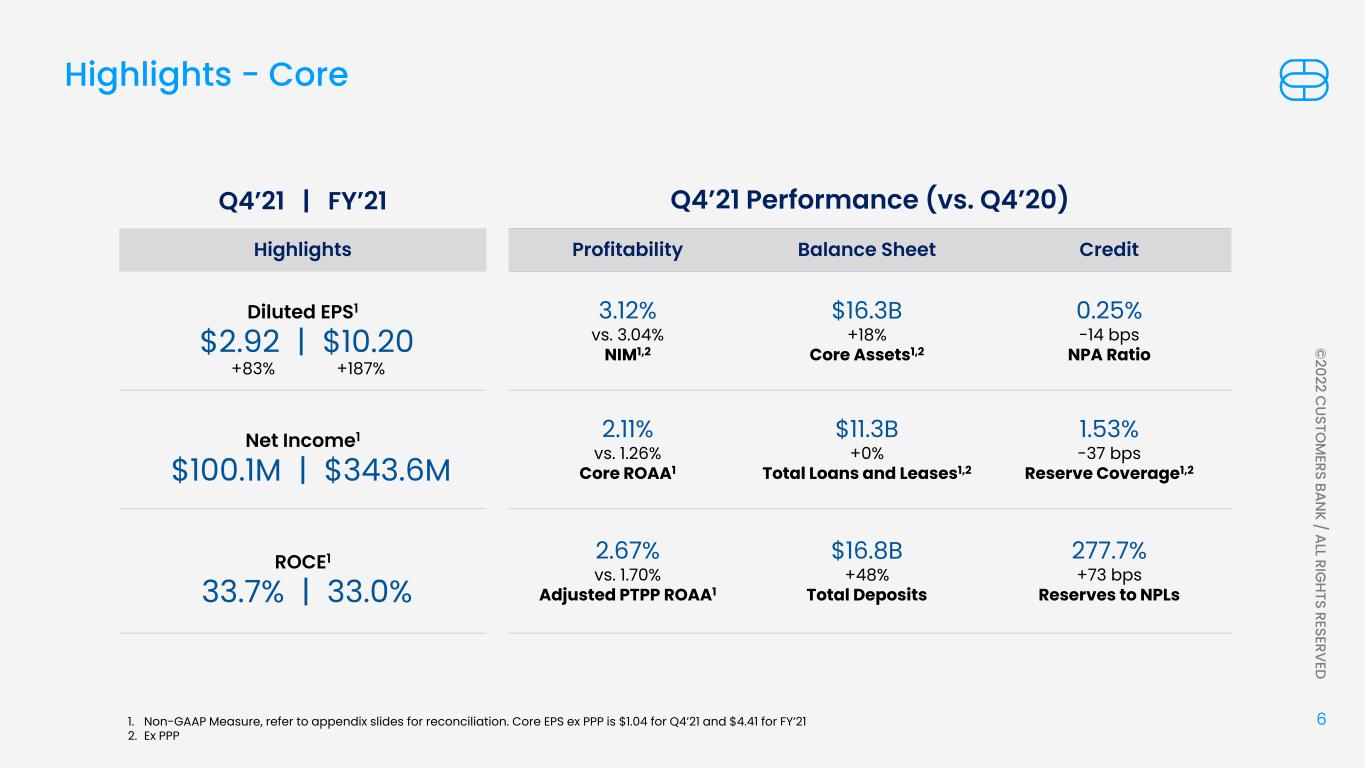
6 © 2022 C USTO M ERS BAN K / ALL RIG HTS RESERVED Q4’21 Performance (vs. Q4’20) Profitability Balance Sheet Credit 3.12% vs. 3.04% NIM1,2 $16.3B +18% Core Assets1,2 0.25% -14 bps NPA Ratio 2.11% vs. 1.26% Core ROAA1 $11.3B +0% Total Loans and Leases1,2 1.53% -37 bps Reserve Coverage1,2 2.67% vs. 1.70% Adjusted PTPP ROAA1 $16.8B +48% Total Deposits 277.7% +73 bps Reserves to NPLs Highlights - Core Highlights Diluted EPS1 $2.92 | $10.20 Net Income1 $100.1M | $343.6M ROCE1 33.7% | 33.0% Q4’21 | FY’21 +83% +187% 1. Non-GAAP Measure, refer to appendix slides for reconciliation. Core EPS ex PPP is $1.04 for Q4’21 and $4.41 for FY’21 2. Ex PPP
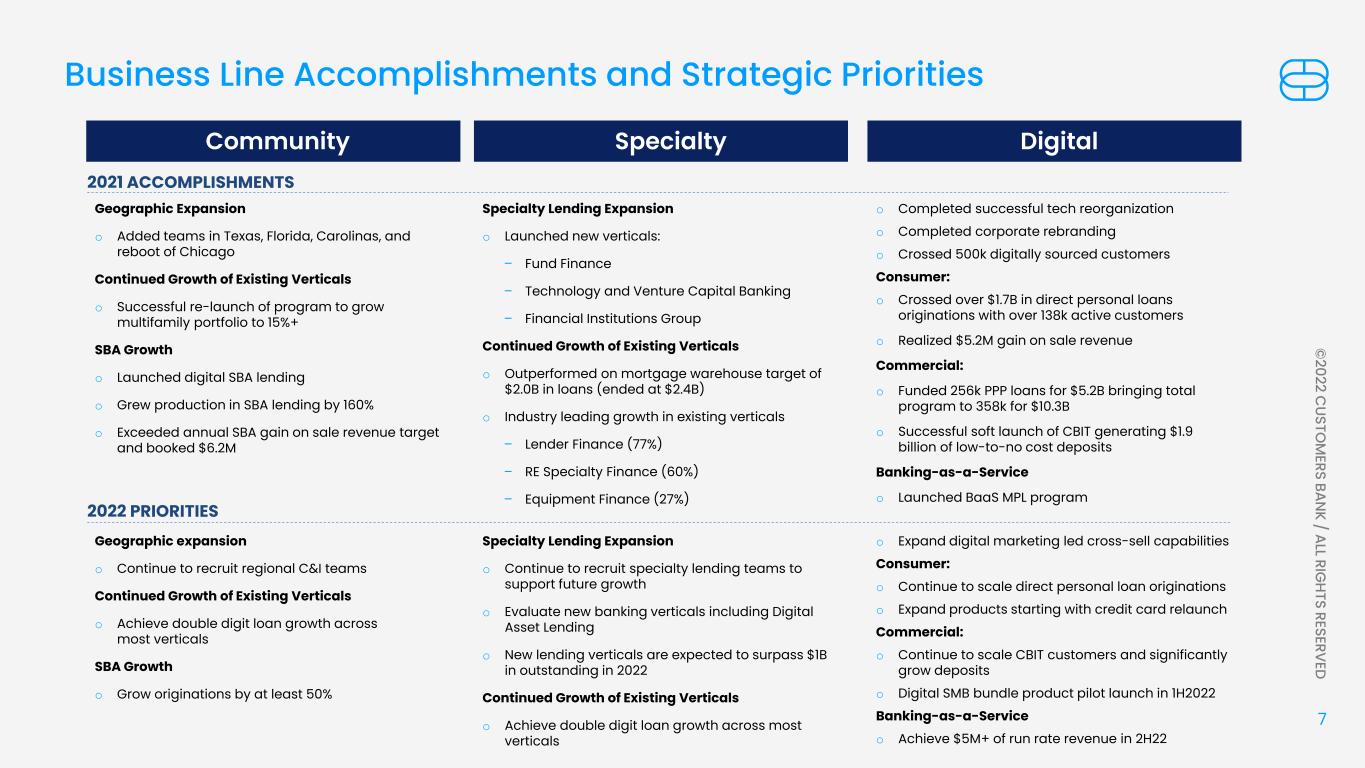
7 © 2022 C USTO M ERS BAN K / ALL RIG HTS RESERVED Business Line Accomplishments and Strategic Priorities Community Geographic Expansion o Added teams in Texas, Florida, Carolinas, and reboot of Chicago Continued Growth of Existing Verticals o Successful re-launch of program to grow multifamily portfolio to 15%+ SBA Growth o Launched digital SBA lending o Grew production in SBA lending by 160% o Exceeded annual SBA gain on sale revenue target and booked $6.2M 2021 ACCOMPLISHMENTS 2022 PRIORITIES Geographic expansion o Continue to recruit regional C&I teams Continued Growth of Existing Verticals o Achieve double digit loan growth across most verticals SBA Growth o Grow originations by at least 50% Specialty Lending Expansion o Continue to recruit specialty lending teams to support future growth o Evaluate new banking verticals including Digital Asset Lending o New lending verticals are expected to surpass $1B in outstanding in 2022 Continued Growth of Existing Verticals o Achieve double digit loan growth across most verticals o Expand digital marketing led cross-sell capabilities Consumer: o Continue to scale direct personal loan originations o Expand products starting with credit card relaunch Commercial: o Continue to scale CBIT customers and significantly grow deposits o Digital SMB bundle product pilot launch in 1H2022 Banking-as-a-Service o Achieve $5M+ of run rate revenue in 2H22 Specialty Lending Expansion o Launched new verticals: – Fund Finance – Technology and Venture Capital Banking – Financial Institutions Group Continued Growth of Existing Verticals o Outperformed on mortgage warehouse target of $2.0B in loans (ended at $2.4B) o Industry leading growth in existing verticals – Lender Finance (77%) – RE Specialty Finance (60%) – Equipment Finance (27%) o Completed successful tech reorganization o Completed corporate rebranding o Crossed 500k digitally sourced customers Consumer: o Crossed over $1.7B in direct personal loans originations with over 138k active customers o Realized $5.2M gain on sale revenue Commercial: o Funded 256k PPP loans for $5.2B bringing total program to 358k for $10.3B o Successful soft launch of CBIT generating $1.9 billion of low-to-no cost deposits Banking-as-a-Service o Launched BaaS MPL program Specialty Digital
Let’s take on tomorrow. Recruiting top talent
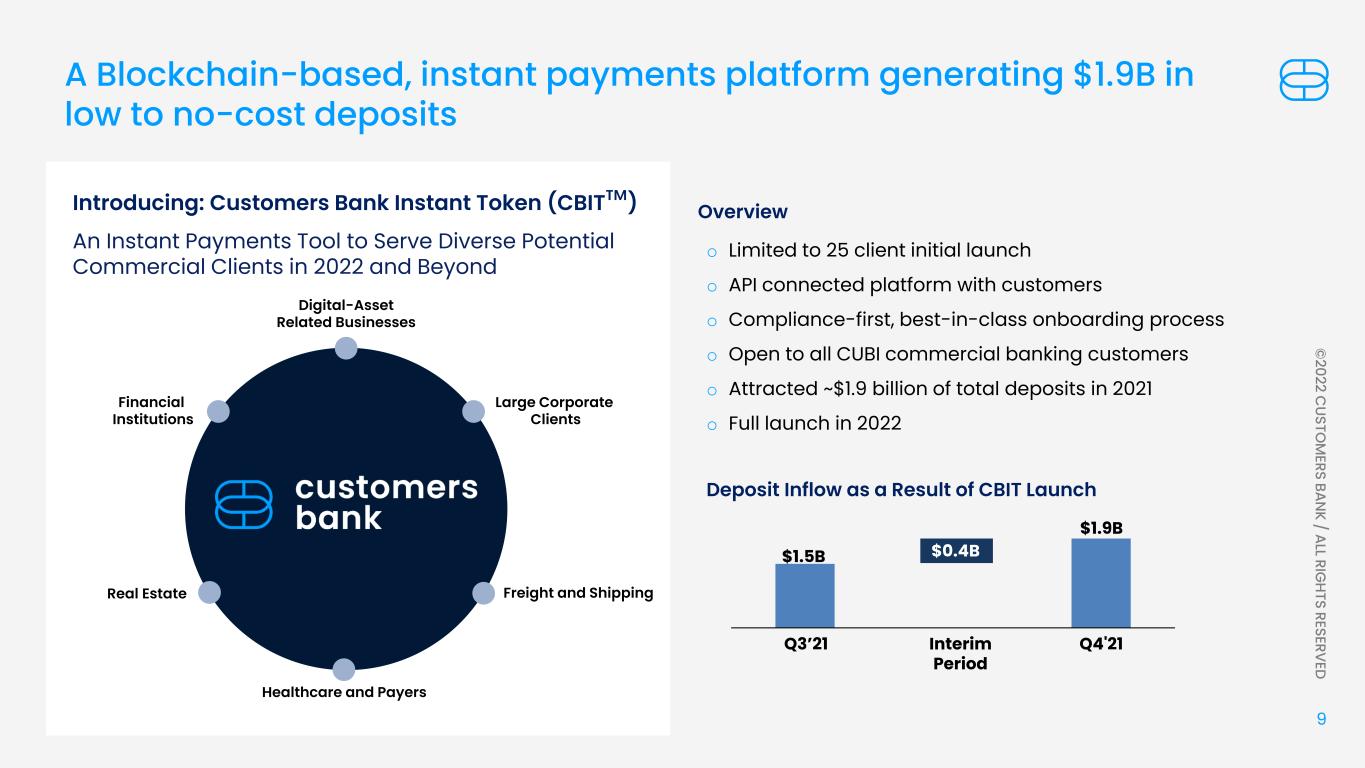
9 © 2022 C USTO M ERS BAN K / ALL RIG HTS RESERVED A Blockchain-based, instant payments platform generating $1.9B in low to no-cost deposits Overview Deposit Inflow as a Result of CBIT Launch o Limited to 25 client initial launch o API connected platform with customers o Compliance-first, best-in-class onboarding process o Open to all CUBI commercial banking customers o Attracted ~$1.9 billion of total deposits in 2021 o Full launch in 2022 Introducing: Customers Bank Instant Token (CBIT™) An Instant Payments Tool to Serve Diverse Potential Commercial Clients in 2022 and Beyond Freight and Shipping Large Corporate Clients Digital-Asset Related Businesses Healthcare and Payers Real Estate Financial Institutions $0.4B$1.5B $1.9B Q3’21 Interim Period Q4'21
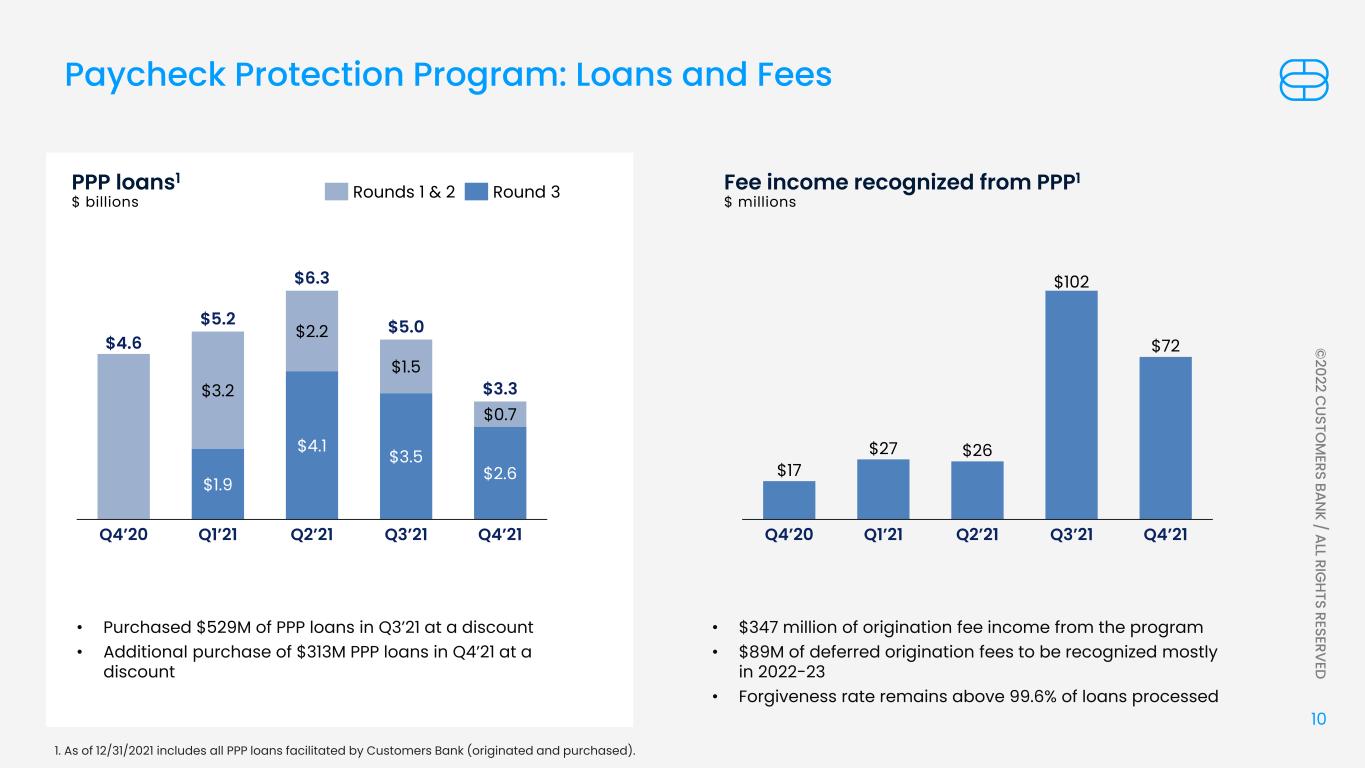
10 © 2022 C USTO M ERS BAN K / ALL RIG HTS RESERVED $4.6 $1.9 $4.1 $3.5 $2.6 $3.2 $2.2 $1.5 $0.7 Q4’20 $5.2 Q3’21Q2’21Q1’21 Q4’21 $6.3 $5.0 $3.3 Rounds 1 & 2 Round 3 $17 $27 $26 $102 $72 Q1’21Q4’20 Q2’21 Q3’21 Q4’21 PPP loans1 $ billions Fee income recognized from PPP1 $ millions • Purchased $529M of PPP loans in Q3’21 at a discount • Additional purchase of $313M PPP loans in Q4’21 at a discount • $347 million of origination fee income from the program • $89M of deferred origination fees to be recognized mostly in 2022-23 • Forgiveness rate remains above 99.6% of loans processed 1. As of 12/31/2021 includes all PPP loans facilitated by Customers Bank (originated and purchased). Paycheck Protection Program: Loans and Fees
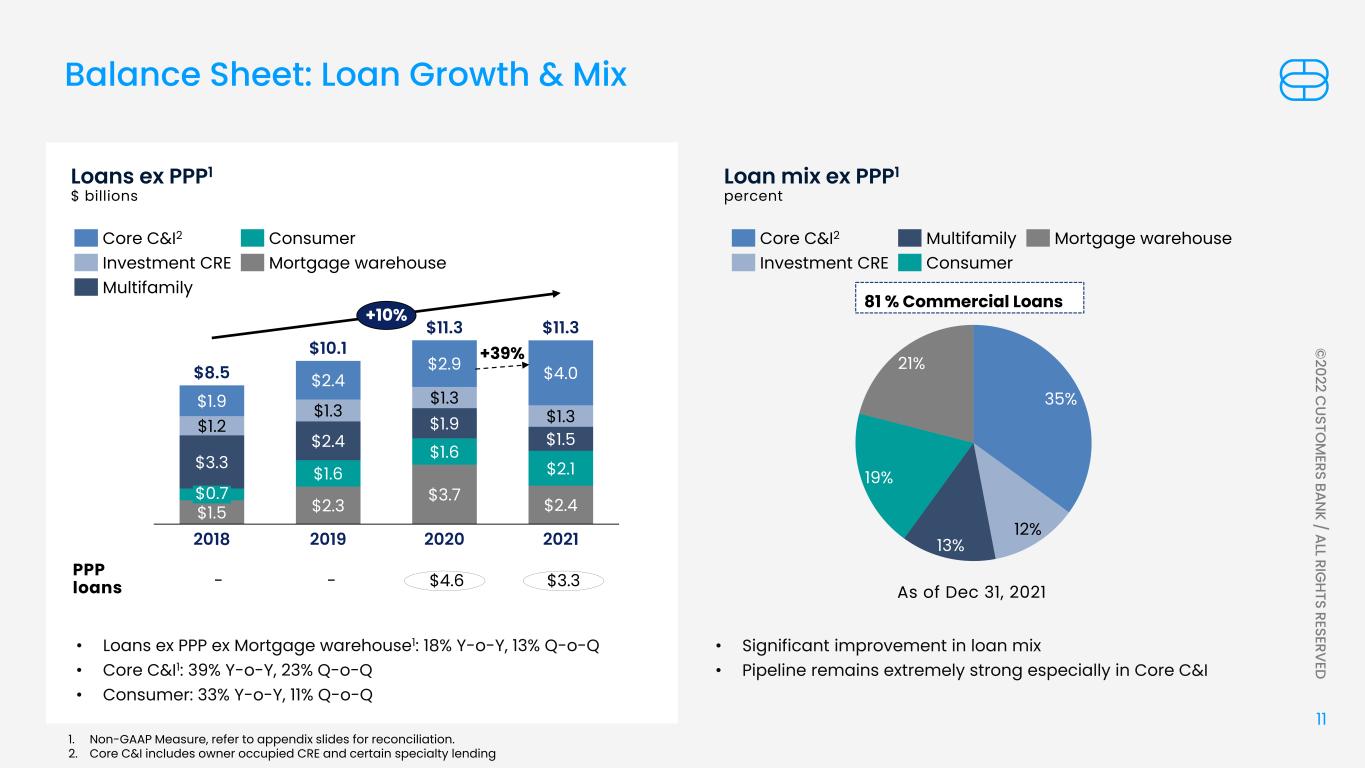
11 © 2022 C USTO M ERS BAN K / ALL RIG HTS RESERVED 35% 12% 13% 19% 21% Loans ex PPP1 $ billions Loan mix ex PPP1 percent • Loans ex PPP ex Mortgage warehouse1: 18% Y-o-Y, 13% Q-o-Q • Core C&I1: 39% Y-o-Y, 23% Q-o-Q • Consumer: 33% Y-o-Y, 11% Q-o-Q • Significant improvement in loan mix • Pipeline remains extremely strong especially in Core C&I MultifamilyCore C&I2 Investment CRE Consumer Mortgage warehouse $4.6 $3.3PPP loans Balance Sheet: Loan Growth & Mix $1.5 $2.3 $3.7 $2.4 $1.6 $1.6 $2.1$3.3 $2.4 $1.9 $1.5 $1.2 $1.3 $1.3 $1.3 $1.9 $2.4 $2.9 $4.0 $0.7 2018 2019 20212020 $8.5 $10.1 $11.3 $11.3 +10% Core C&I2 Investment CRE Mortgage warehouse Multifamily Consumer 1. Non-GAAP Measure, refer to appendix slides for reconciliation. 2. Core C&I includes owner occupied CRE and certain specialty lending -- +39% As of Dec 31, 2021 81 % Commercial Loans

12 © 2022 C USTO M ERS BAN K / ALL RIG HTS RESERVED $6.0 $7.3 $9.0 $12.3 $1.3 $2.4 $4.5 202120202018 2019 $7.1 $8.6 $11.3 $16.8+33% +48% Non interest bearing deposits Interest bearing deposits Deposits $ billions Funding cost percent • Proportion of non-interest-bearing deposits has increased from 16% in 2020 to 27% in 2021 • Total cost of deposits has declined significantly due to decrease in funding cost of interest bearing deposits by 22 bps 0.60% 0.70% 0.00% 0.80% 0.40% 0.50% 0.76% 0.58% Q4’20 Q1’21 Q2’21 Q3’21 0.50% 0.36% 29.9 bps Q4’21 Spot cost of deposits Cost of interest bearing deposits Total deposit costs Balance Sheet: Deposit Growth & Mix +89% $1.1
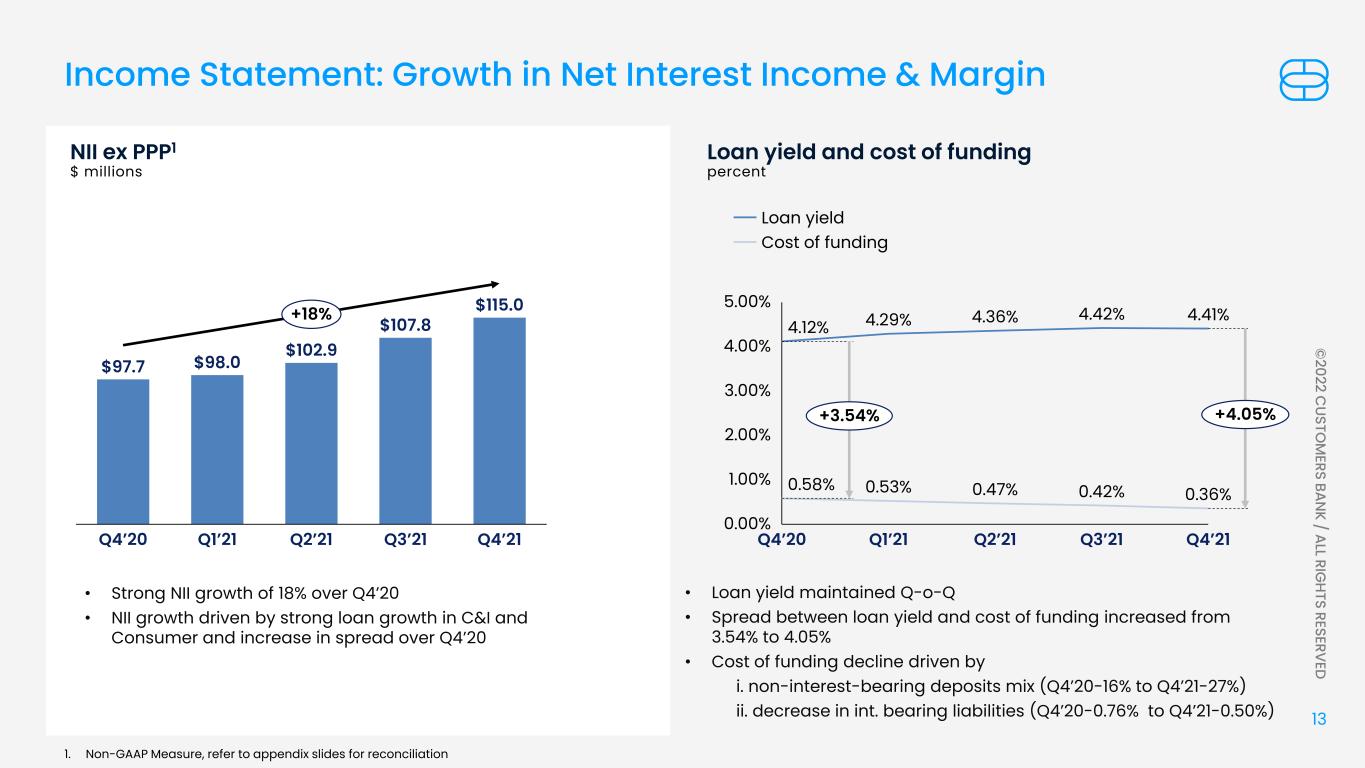
13 © 2022 C USTO M ERS BAN K / ALL RIG HTS RESERVED Q4’21Q4’20 Q1’21 Q2’21 Q3’21 $97.7 $98.0 $102.9 $107.8 $115.0+18% 4.12% 4.29% 4.36% 4.42% 4.41% 0.58% 0.53% 0.47% 0.42% 0.36% 3.00% 0.00% 4.00% 1.00% 2.00% 5.00% Q2’21Q4’20 Q1’21 Q3’21 Q4’21 +4.05%+3.54% NII ex PPP1 $ millions Loan yield and cost of funding percent Loan yield Cost of funding • Strong NII growth of 18% over Q4’20 • NII growth driven by strong loan growth in C&I and Consumer and increase in spread over Q4’20 • Loan yield maintained Q-o-Q • Spread between loan yield and cost of funding increased from 3.54% to 4.05% • Cost of funding decline driven by i. non-interest-bearing deposits mix (Q4’20-16% to Q4’21-27%) ii. decrease in int. bearing liabilities (Q4’20-0.76% to Q4’21-0.50%) Income Statement: Growth in Net Interest Income & Margin 1. Non-GAAP Measure, refer to appendix slides for reconciliation
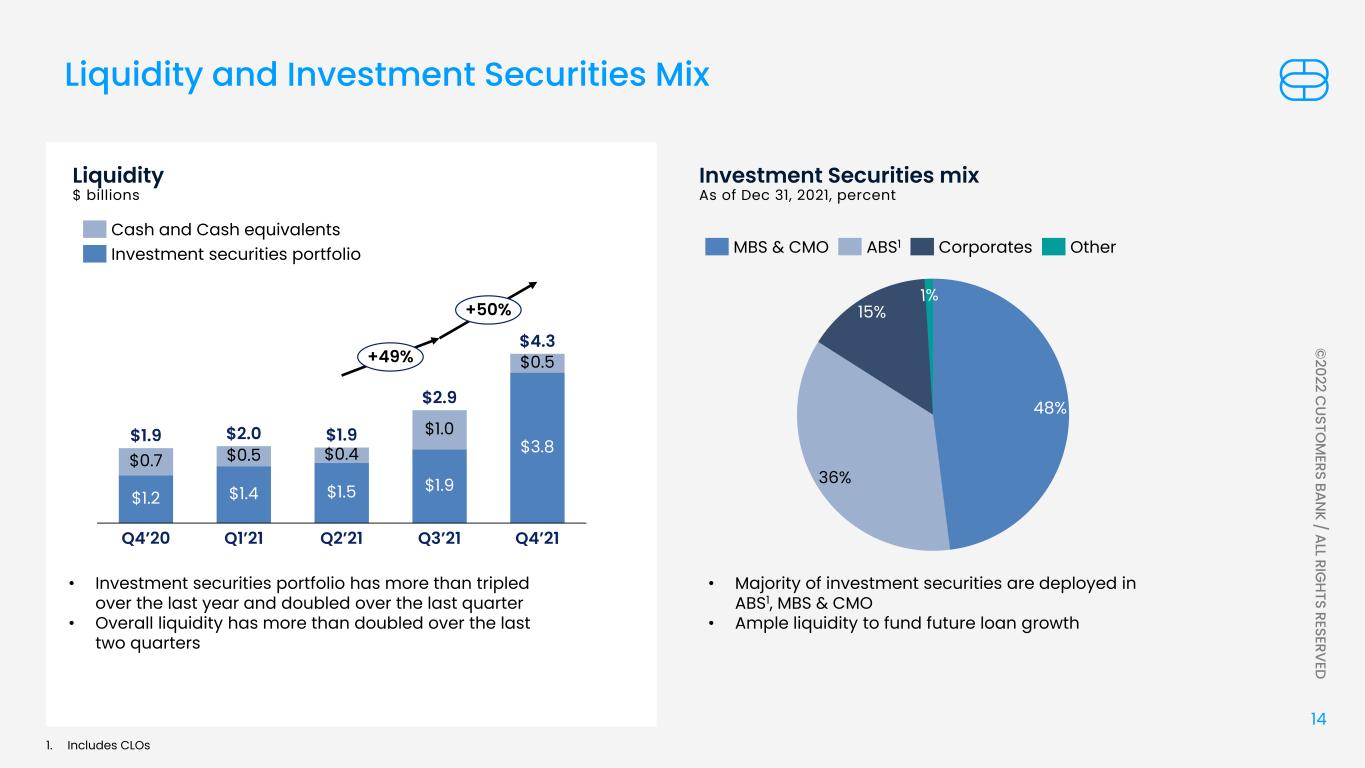
14 © 2022 C USTO M ERS BAN K / ALL RIG HTS RESERVED $0.5$0.7 Q1’21 $1.2 Q4’20 $1.4 $1.5 $0.4 Q2’21 $1.0 $1.9 Q3’21 $1.9 $0.5 $3.8 Q4’21 $1.9 $2.0 $2.9 $4.3 +49% +50% Investment securities portfolio Cash and Cash equivalents Liquidity $ billions Investment Securities mix As of Dec 31, 2021, percent • Investment securities portfolio has more than tripled over the last year and doubled over the last quarter • Overall liquidity has more than doubled over the last two quarters • Majority of investment securities are deployed in ABS1, MBS & CMO • Ample liquidity to fund future loan growth Liquidity and Investment Securities Mix 48% 36% 15% MBS & CMO CorporatesABS1 Other 1. Includes CLOs
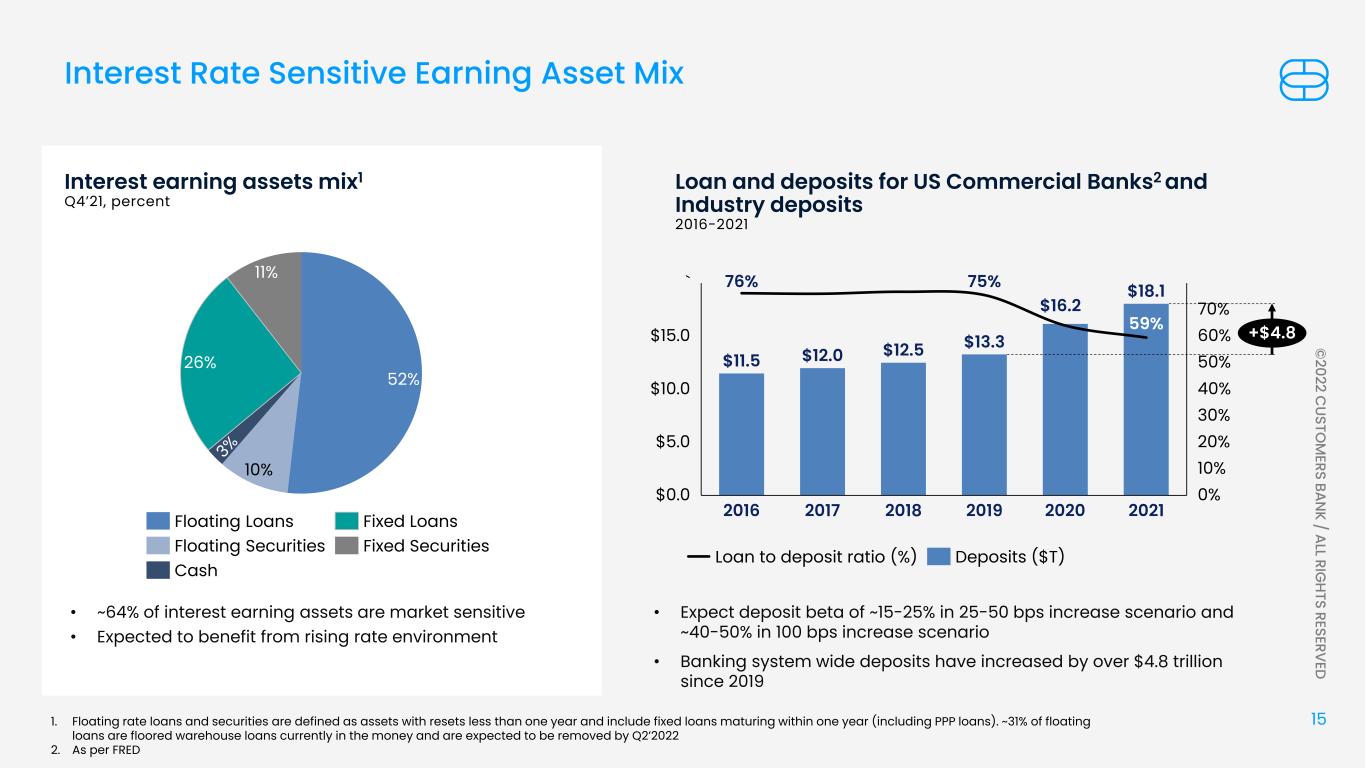
15 © 2022 C USTO M ERS BAN K / ALL RIG HTS RESERVED 40% c Loan and deposits for US Commercial Banks2 and Industry deposits 2016-2021 • Expect deposit beta of ~15-25% in 25-50 bps increase scenario and ~40-50% in 100 bps increase scenario • Banking system wide deposits have increased by over $4.8 trillion since 2019 Interest earning assets mix1 Q4’21, percent Interest Rate Sensitive Earning Asset Mix • ~64% of interest earning assets are market sensitive • Expected to benefit from rising rate environment 52% 10% 26% 11% Floating Loans Fixed SecuritiesFloating Securities Cash Fixed Loans 76% 75% 59% $10.0 $5.0 $0.0 $15.0 ` 0% 20% 30% 10% 50% 60% 70% $18.1 2016 2017 2018 2019 2020 2021 $11.5 $12.0 $12.5 $13.3 +$4.8 Loan to deposit ratio (%) Deposits ($T) 1. Floating rate loans and securities are defined as assets with resets less than one year and include fixed loans maturing within one year (including PPP loans). ~31% of floating loans are floored warehouse loans currently in the money and are expected to be removed by Q2’2022 2. As per FRED $16.2
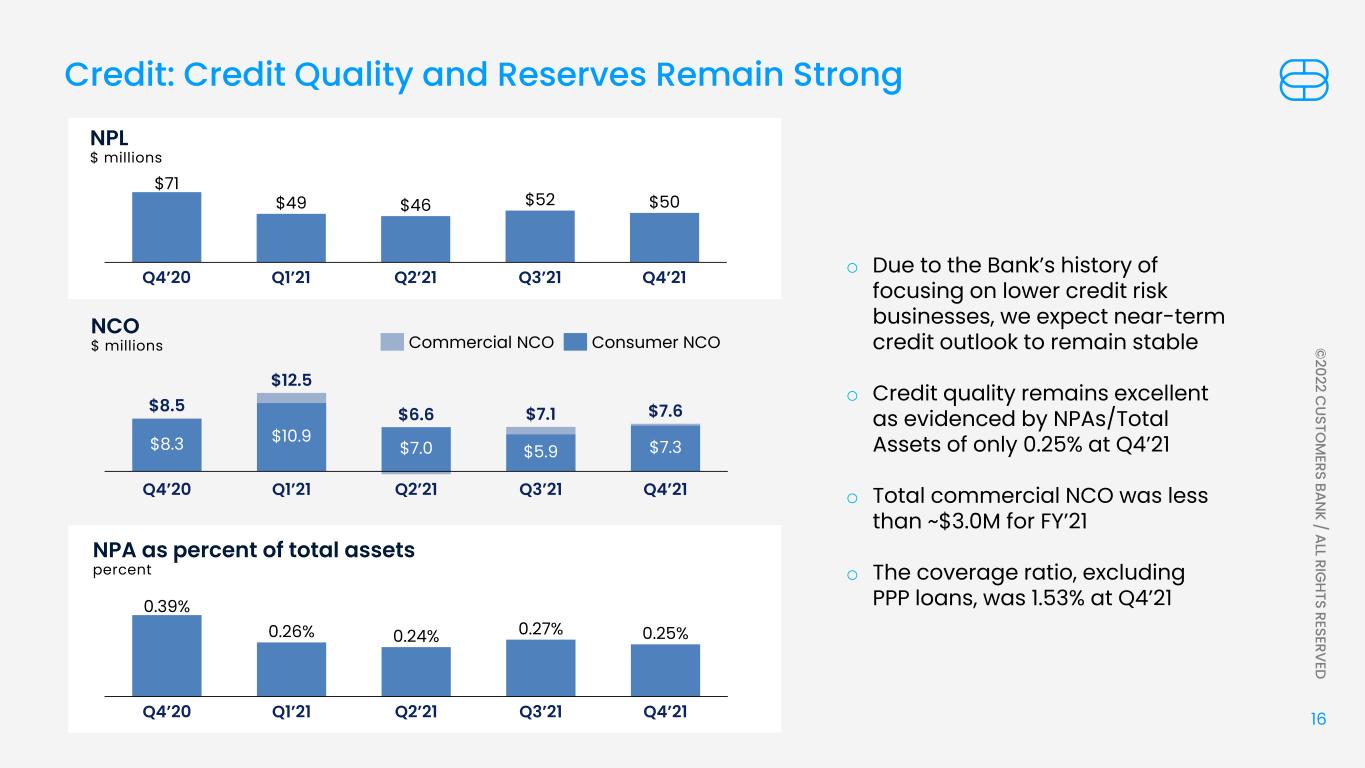
16 © 2022 C USTO M ERS BAN K / ALL RIG HTS RESERVED $71 $49 $46 $52 $50 Q4’20 Q4’21Q3’21Q2’21Q1’21 NPL $ millions Q4’20 $8.3 Q2’21 $7.0 $10.9 $7.1 Q3’21Q1’21 $5.9 $7.3 Q4’21 $8.5 $12.5 $6.6 $7.6 NCO $ millions 0.39% 0.26% 0.24% 0.27% 0.25% Q4’20 Q2’21Q1’21 Q4’21Q3’21 NPA as percent of total assets percent o Due to the Bank’s history of focusing on lower credit risk businesses, we expect near-term credit outlook to remain stable o Credit quality remains excellent as evidenced by NPAs/Total Assets of only 0.25% at Q4’21 o Total commercial NCO was less than ~$3.0M for FY’21 o The coverage ratio, excluding PPP loans, was 1.53% at Q4’21 Commercial NCO Consumer NCO Credit: Credit Quality and Reserves Remain Strong
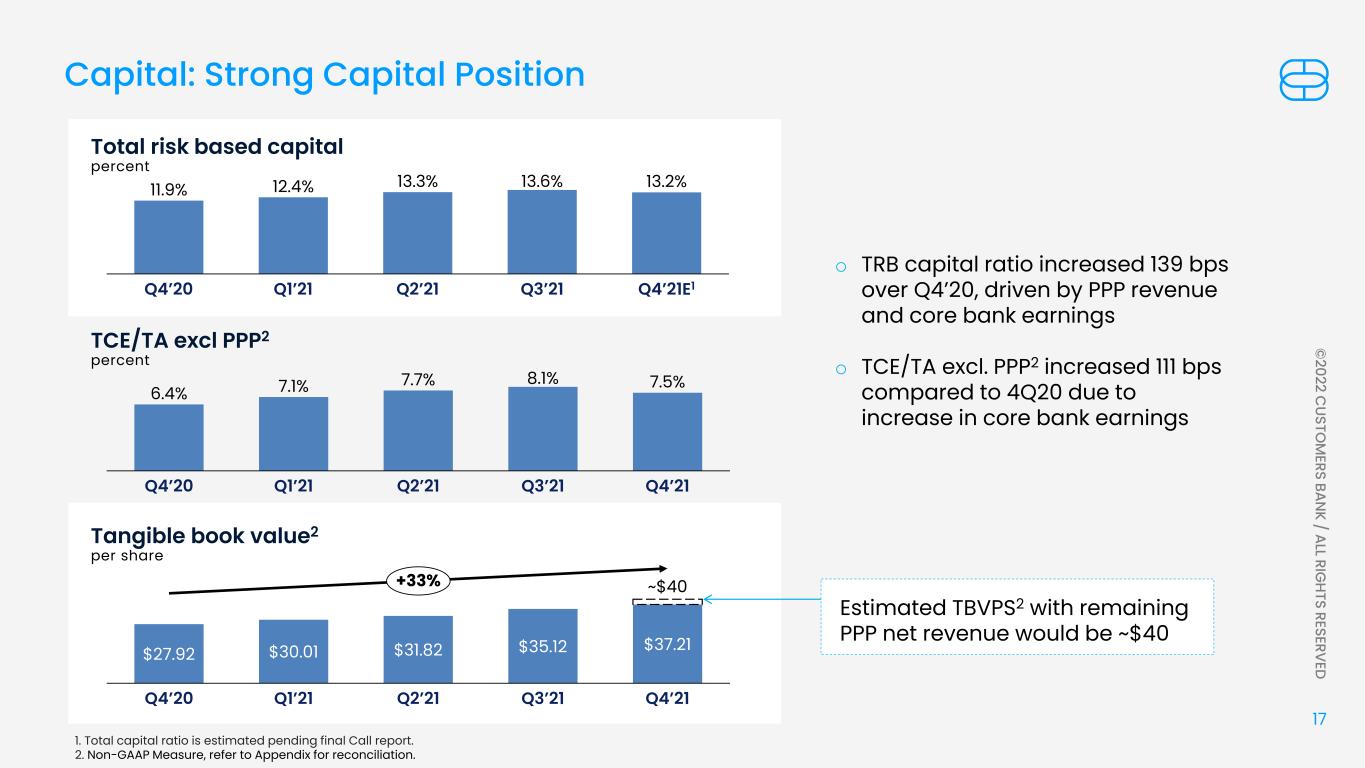
17 © 2022 C USTO M ERS BAN K / ALL RIG HTS RESERVED 11.9% 12.4% 13.3% 13.6% 13.2% Q4’21E1Q4’20 Q1’21 Q2’21 Q3’21 Total risk based capital percent 6.4% 7.1% 7.7% 8.1% 7.5% Q4’20 Q1’21 Q2’21 Q3’21 Q4’21 TCE/TA excl PPP2 percent $27.92 $30.01 $31.82 $35.12 $37.21 Q3’21Q4’20 Q4’21Q1’21 Q2’21 ~$40+33% Tangible book value2 per share o TRB capital ratio increased 139 bps over Q4’20, driven by PPP revenue and core bank earnings o TCE/TA excl. PPP2 increased 111 bps compared to 4Q20 due to increase in core bank earnings 1. Total capital ratio is estimated pending final Call report. 2. Non-GAAP Measure, refer to Appendix for reconciliation. Capital: Strong Capital Position Estimated TBVPS2 with remaining PPP net revenue would be ~$40
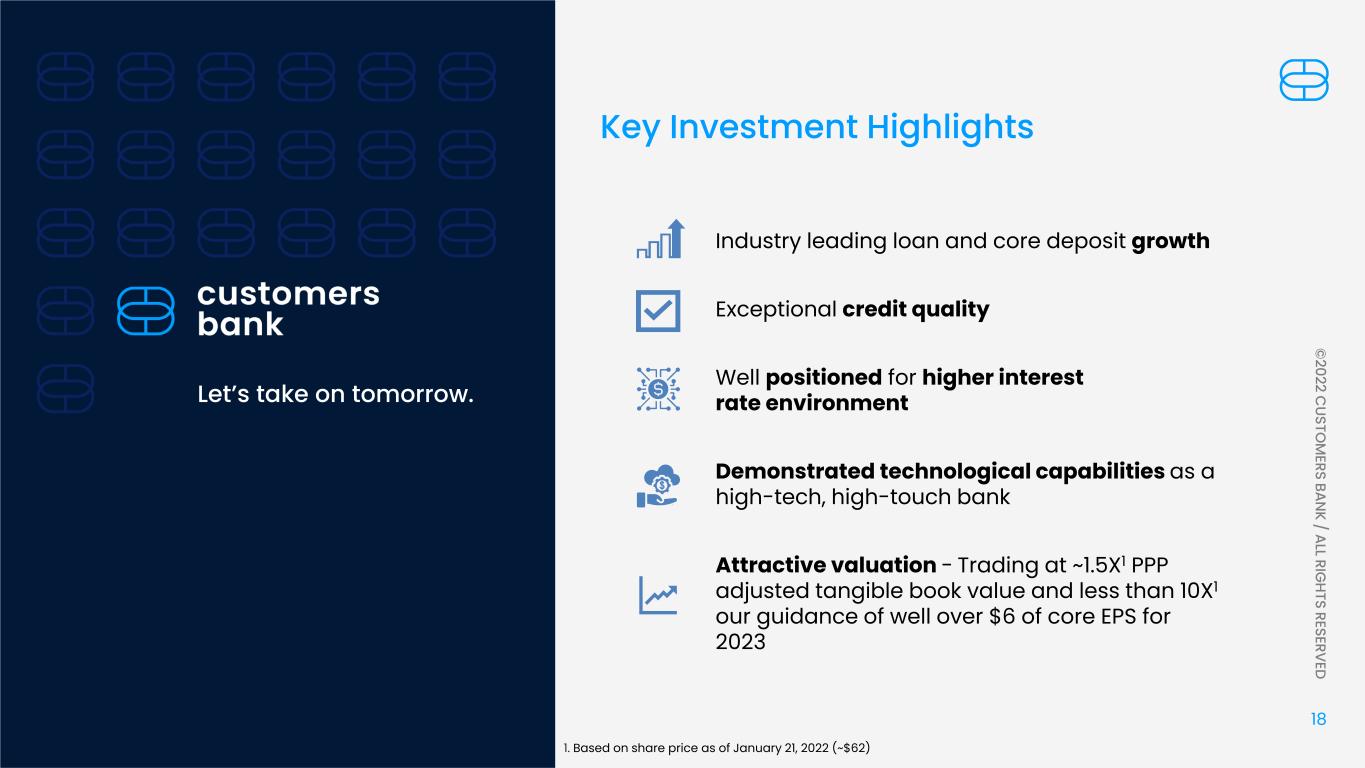
18 © 2022 C USTO M ERS BAN K / ALL RIG HTS RESERVED Industry leading loan and core deposit growth Exceptional credit quality Well positioned for higher interest rate environment Demonstrated technological capabilities as a high-tech, high-touch bank Attractive valuation - Trading at ~1.5X1 PPP adjusted tangible book value and less than 10X1 our guidance of well over $6 of core EPS for 2023 Let’s take on tomorrow. Key Investment Highlights 1. Based on share price as of January 21, 2022 (~$62)

ANALYST COVERAGE B. Riley Financial, Inc. Steve Moss D.A. Davidson Companies Russell Gunther Hovde Group Will Curtiss Jefferies Group LLC Casey Haire Keefe, Bruyette & Woods Inc. Michael Perito Maxim Group Inc. Michael Diana Piper Sandler Companies Frank Schiraldi Wedbush Securities Inc. Peter Winter

20 © 2022 C USTO M ERS BAN K / ALL RIG HTS RESERVED Appendix
21 © 2022 C USTO M ERS BAN K / ALL RIG HTS RESERVED Environmental, Social & Governance (ESG) considerations are integrated across our business units and incorporated into the policies and principles that govern how our company operates. We continuously seek to address some of the practical challenges in balancing short- and long-term business trade-offs in order to ensure that our stakeholders and shareholders prosper together. Customers Bank’s approach to ESG management includes promoting sound corporate governance, risk management and controls, investing in our Team Members and cultivating a diverse and inclusive work environment, strengthening the communities in which our Team Members live and work, and operating our business in a way that demonstrates Customers’ dedication to environmental sustainability. Our Communities Use of investment and philanthropic capital to expand access to economic opportunity in the communities where we do business has been core to Customers since its founding more than 10 years ago. Our Team Members Customers Bank is committed to developing high performing Team Members and fostering a richly diverse and inclusive workplace culture. Our Environment Customers Bank provides financing solutions that generate positive environmental and social impacts and actively manages the environmental impacts of the company’s branches and office locations. Our Risk Culture Customers Bank’s tone at the top and risk culture underpins our ability to function with integrity and accountability and to systematically and independently review risks and opportunities while building sustainable value for the company. Our Corporate Governance & Ethics Supported by unwavering management commitment and an engaged Board, Customers Bank is continually focused on enhancing the structures, processes and controls in place that support and promote accountability, transparency and ethical behavior. Environmental, Social & Governance Report
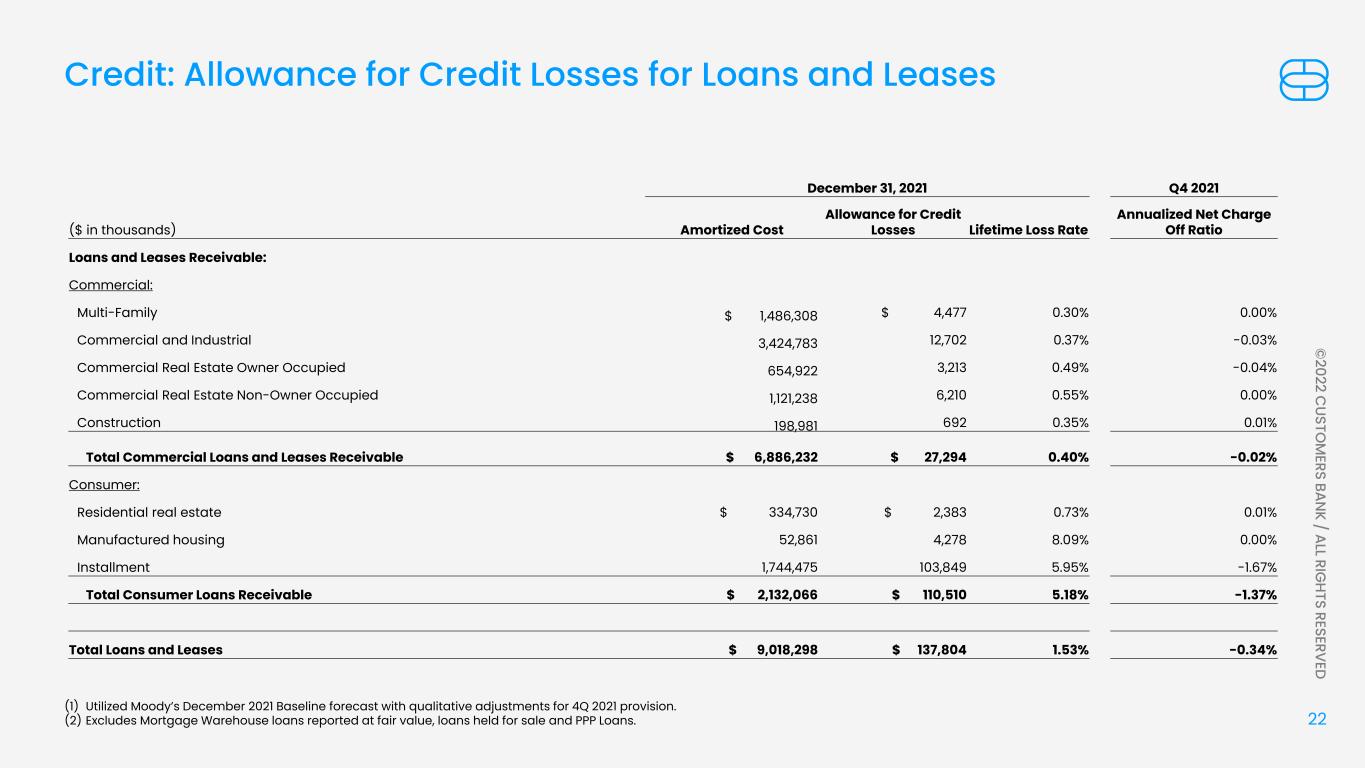
22 © 2022 C USTO M ERS BAN K / ALL RIG HTS RESERVED (1) Utilized Moody’s December 2021 Baseline forecast with qualitative adjustments for 4Q 2021 provision. (2) Excludes Mortgage Warehouse loans reported at fair value, loans held for sale and PPP Loans. Credit: Allowance for Credit Losses for Loans and Leases December 31, 2021 Q4 2021 ($ in thousands) Amortized Cost Allowance for Credit Losses Lifetime Loss Rate Annualized Net Charge Off Ratio Loans and Leases Receivable: Commercial: Multi-Family $ 1,486,308 $ 4,477 0.30% 0.00% Commercial and Industrial 3,424,783 12,702 0.37% -0.03% Commercial Real Estate Owner Occupied 654,922 3,213 0.49% -0.04% Commercial Real Estate Non-Owner Occupied 1,121,238 6,210 0.55% 0.00% Construction 198,981 692 0.35% 0.01% Total Commercial Loans and Leases Receivable $ 6,886,232 $ 27,294 0.40% -0.02% Consumer: Residential real estate $ 334,730 $ 2,383 0.73% 0.01% Manufactured housing 52,861 4,278 8.09% 0.00% Installment 1,744,475 103,849 5.95% -1.67% Total Consumer Loans Receivable $ 2,132,066 $ 110,510 5.18% -1.37% Total Loans and Leases $ 9,018,298 $ 137,804 1.53% -0.34%
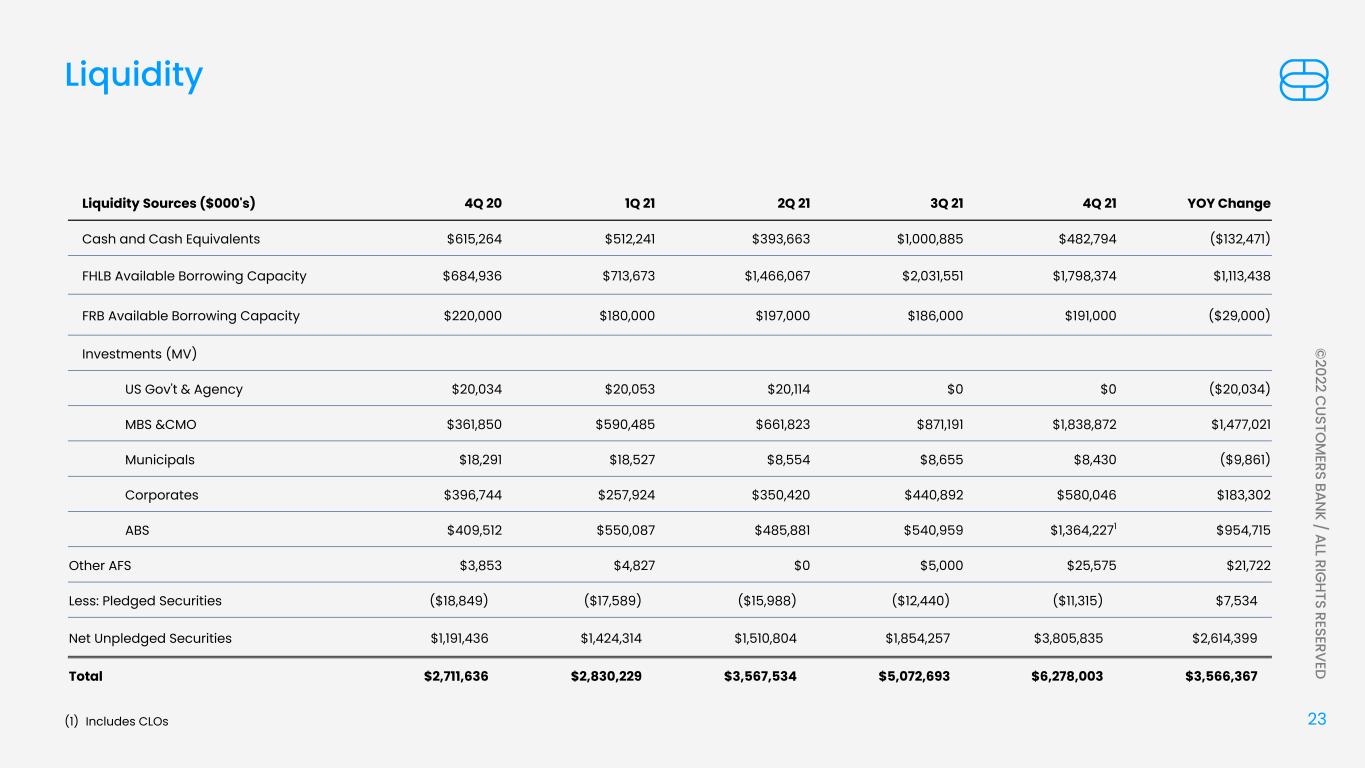
23 © 2022 C USTO M ERS BAN K / ALL RIG HTS RESERVED Liquidity Liquidity Sources ($000's) 4Q 20 1Q 21 2Q 21 3Q 21 4Q 21 YOY Change Cash and Cash Equivalents $615,264 $512,241 $393,663 $1,000,885 $482,794 ($132,471) FHLB Available Borrowing Capacity $684,936 $713,673 $1,466,067 $2,031,551 $1,798,374 $1,113,438 FRB Available Borrowing Capacity $220,000 $180,000 $197,000 $186,000 $191,000 ($29,000) Investments (MV) US Gov't & Agency $20,034 $20,053 $20,114 $0 $0 ($20,034) MBS &CMO $361,850 $590,485 $661,823 $871,191 $1,838,872 $1,477,021 Municipals $18,291 $18,527 $8,554 $8,655 $8,430 ($9,861) Corporates $396,744 $257,924 $350,420 $440,892 $580,046 $183,302 ABS $409,512 $550,087 $485,881 $540,959 $1,364,2271 $954,715 Other AFS $3,853 $4,827 $0 $5,000 $25,575 $21,722 Less: Pledged Securities ($18,849) ($17,589) ($15,988) ($12,440) ($11,315) $7,534 Net Unpledged Securities $1,191,436 $1,424,314 $1,510,804 $1,854,257 $3,805,835 $2,614,399 Total $2,711,636 $2,830,229 $3,567,534 $5,072,693 $6,278,003 $3,566,367 (1) Includes CLOs
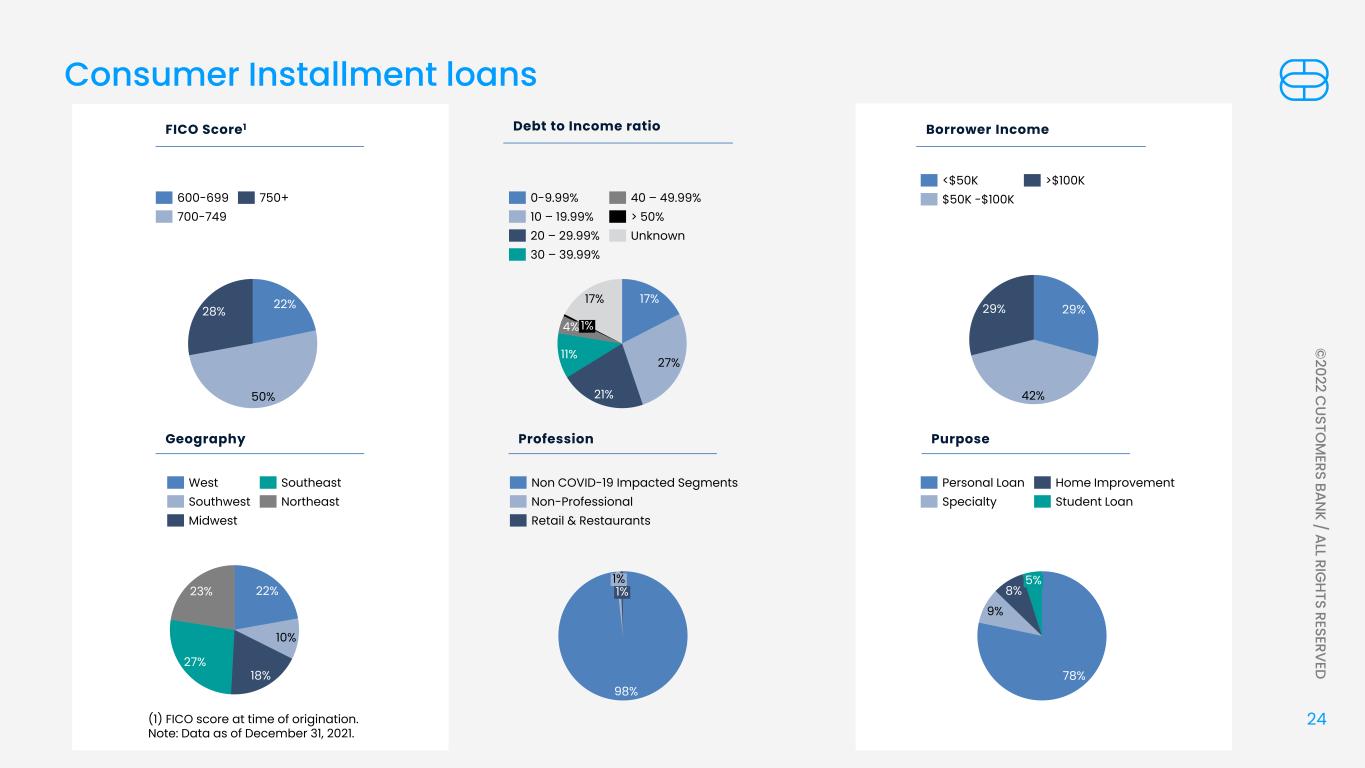
24 © 2022 C USTO M ERS BAN K / ALL RIG HTS RESERVED (1) FICO score at time of origination. Note: Data as of December 31, 2021. 22% 50% 28% FICO Score1 600-699 700-749 750+ 17% 27% 21% 11% 17% 4% 1% 0-9.99% > 50% 30 – 39.99% 10 – 19.99% 20 – 29.99% 40 – 49.99% Unknown Geography Profession Purpose Debt to Income ratio Borrower Income 29% 42% 29% <$50K $50K -$100K >$100K 22% 10% 18% 27% 23% West Southwest Midwest Southeast Northeast 98% 1% 1% Non COVID-19 Impacted Segments Retail & Restaurants Non-Professional 78% 9% 8% 5% Personal Loan Home Improvement Specialty Student Loan Consumer Installment loans
25 © 2022 C USTO M ERS BAN K / ALL RIG HTS RESERVED Customers believes that the non-GAAP measurements disclosed within this document are useful for investors, regulators, management and others to evaluate our core results of operations and financial condition relative to other financial institutions. These non-GAAP financial measures are frequently used by securities analysts, investors, and other interested parties in the evaluation of companies in Customers' industry. These non-GAAP financial measures exclude from corresponding GAAP measures the impact of certain elements that we do not believe are representative of our ongoing financial results, which we believe enhance an overall understanding of our performance and increases comparability of our period to period results. Investors should consider our performance and financial condition as reported under GAAP and all other relevant information when assessing our performance or financial condition. The non-GAAP measures presented are not necessarily comparable to non-GAAP measures that may be presented by other financial institutions. Although non-GAAP financial measures are frequently used in the evaluation of a company, they have limitations as analytical tools and should not be considered in isolation or as a substitute for analysis of our results of operations or financial condition as reported under GAAP. The following tables present reconciliations of GAAP to non-GAAP measures disclosed within this document. Reconciliation of Non-GAAP Measures - Unaudited
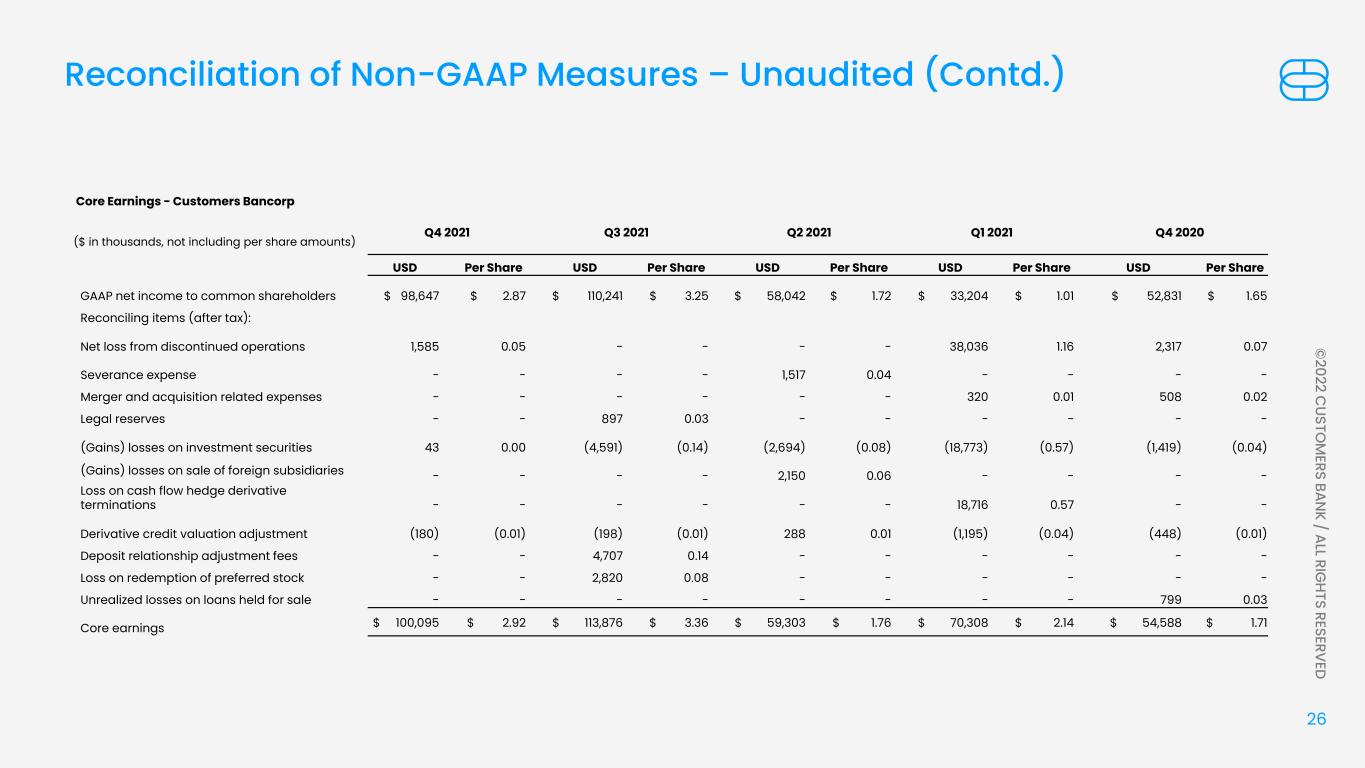
26 © 2022 C USTO M ERS BAN K / ALL RIG HTS RESERVED Core Earnings - Customers Bancorp ($ in thousands, not including per share amounts) Q4 2021 Q3 2021 Q2 2021 Q1 2021 Q4 2020 USD Per Share USD Per Share USD Per Share USD Per Share USD Per Share GAAP net income to common shareholders $ 98,647 $ 2.87 $ 110,241 $ 3.25 $ 58,042 $ 1.72 $ 33,204 $ 1.01 $ 52,831 $ 1.65 Reconciling items (after tax): Net loss from discontinued operations 1,585 0.05 - - - - 38,036 1.16 2,317 0.07 Severance expense - - - - 1,517 0.04 - - - - Merger and acquisition related expenses - - - - - - 320 0.01 508 0.02 Legal reserves - - 897 0.03 - - - - - - (Gains) losses on investment securities 43 0.00 (4,591) (0.14) (2,694) (0.08) (18,773) (0.57) (1,419) (0.04) (Gains) losses on sale of foreign subsidiaries - - - - 2,150 0.06 - - - - Loss on cash flow hedge derivative terminations - - - - - - 18,716 0.57 - - Derivative credit valuation adjustment (180) (0.01) (198) (0.01) 288 0.01 (1,195) (0.04) (448) (0.01) Deposit relationship adjustment fees - - 4,707 0.14 - - - - - - Loss on redemption of preferred stock - - 2,820 0.08 - - - - - - Unrealized losses on loans held for sale - - - - - - - - 799 0.03 Core earnings $ 100,095 $ 2.92 $ 113,876 $ 3.36 $ 59,303 $ 1.76 $ 70,308 $ 2.14 $ 54,588 $ 1.71 Reconciliation of Non-GAAP Measures – Unaudited (Contd.)
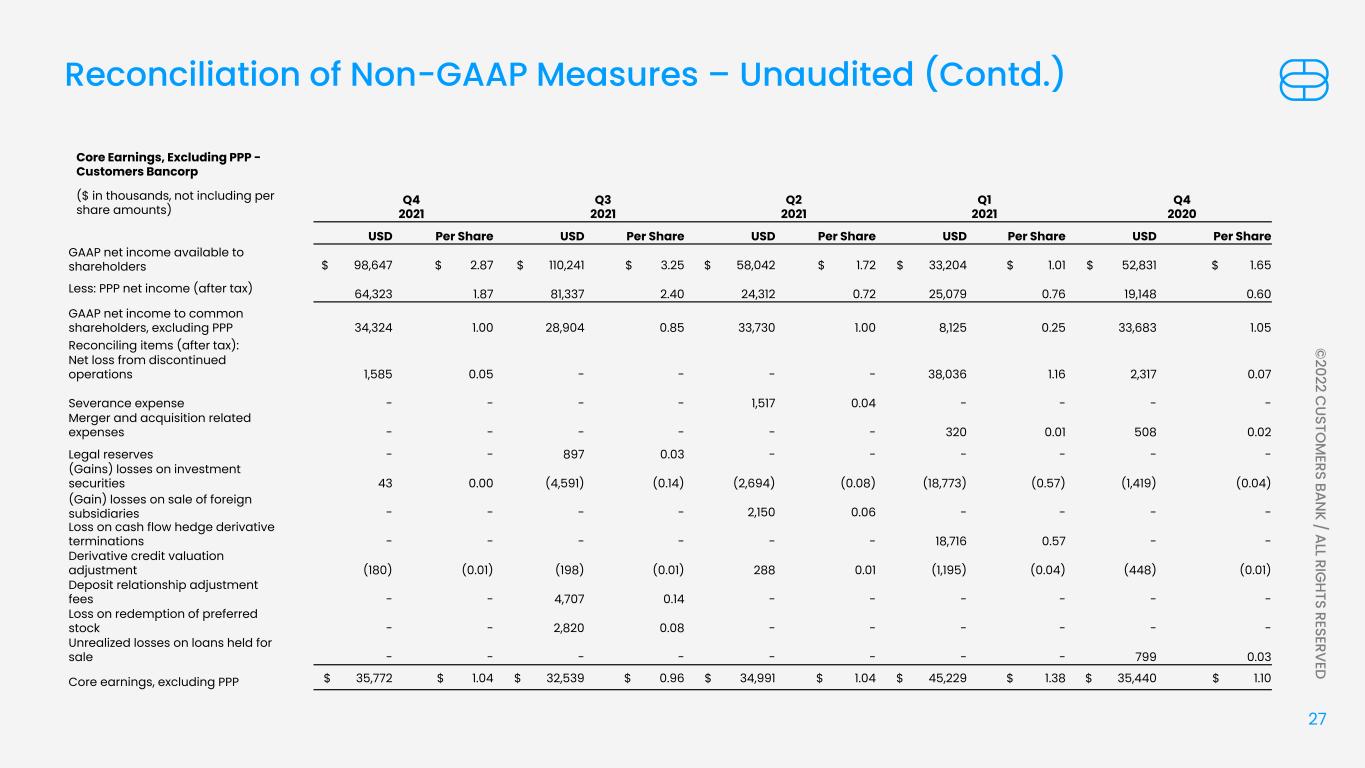
27 © 2022 C USTO M ERS BAN K / ALL RIG HTS RESERVED Reconciliation of Non-GAAP Measures – Unaudited (Contd.) Core Earnings, Excluding PPP - Customers Bancorp ($ in thousands, not including per share amounts) Q4 2021 Q3 2021 Q2 2021 Q1 2021 Q4 2020 USD Per Share USD Per Share USD Per Share USD Per Share USD Per Share GAAP net income available to shareholders $ 98,647 $ 2.87 $ 110,241 $ 3.25 $ 58,042 $ 1.72 $ 33,204 $ 1.01 $ 52,831 $ 1.65 Less: PPP net income (after tax) 64,323 1.87 81,337 2.40 24,312 0.72 25,079 0.76 19,148 0.60 GAAP net income to common shareholders, excluding PPP 34,324 1.00 28,904 0.85 33,730 1.00 8,125 0.25 33,683 1.05 Reconciling items (after tax): Net loss from discontinued operations 1,585 0.05 - - - - 38,036 1.16 2,317 0.07 Severance expense - - - - 1,517 0.04 - - - - Merger and acquisition related expenses - - - - - - 320 0.01 508 0.02 Legal reserves - - 897 0.03 - - - - - - (Gains) losses on investment securities 43 0.00 (4,591) (0.14) (2,694) (0.08) (18,773) (0.57) (1,419) (0.04) (Gain) losses on sale of foreign subsidiaries - - - - 2,150 0.06 - - - - Loss on cash flow hedge derivative terminations - - - - - - 18,716 0.57 - - Derivative credit valuation adjustment (180) (0.01) (198) (0.01) 288 0.01 (1,195) (0.04) (448) (0.01) Deposit relationship adjustment fees - - 4,707 0.14 - - - - - - Loss on redemption of preferred stock - - 2,820 0.08 - - - - - - Unrealized losses on loans held for sale - - - - - - - - 799 0.03 Core earnings, excluding PPP $ 35,772 $ 1.04 $ 32,539 $ 0.96 $ 34,991 $ 1.04 $ 45,229 $ 1.38 $ 35,440 $ 1.10
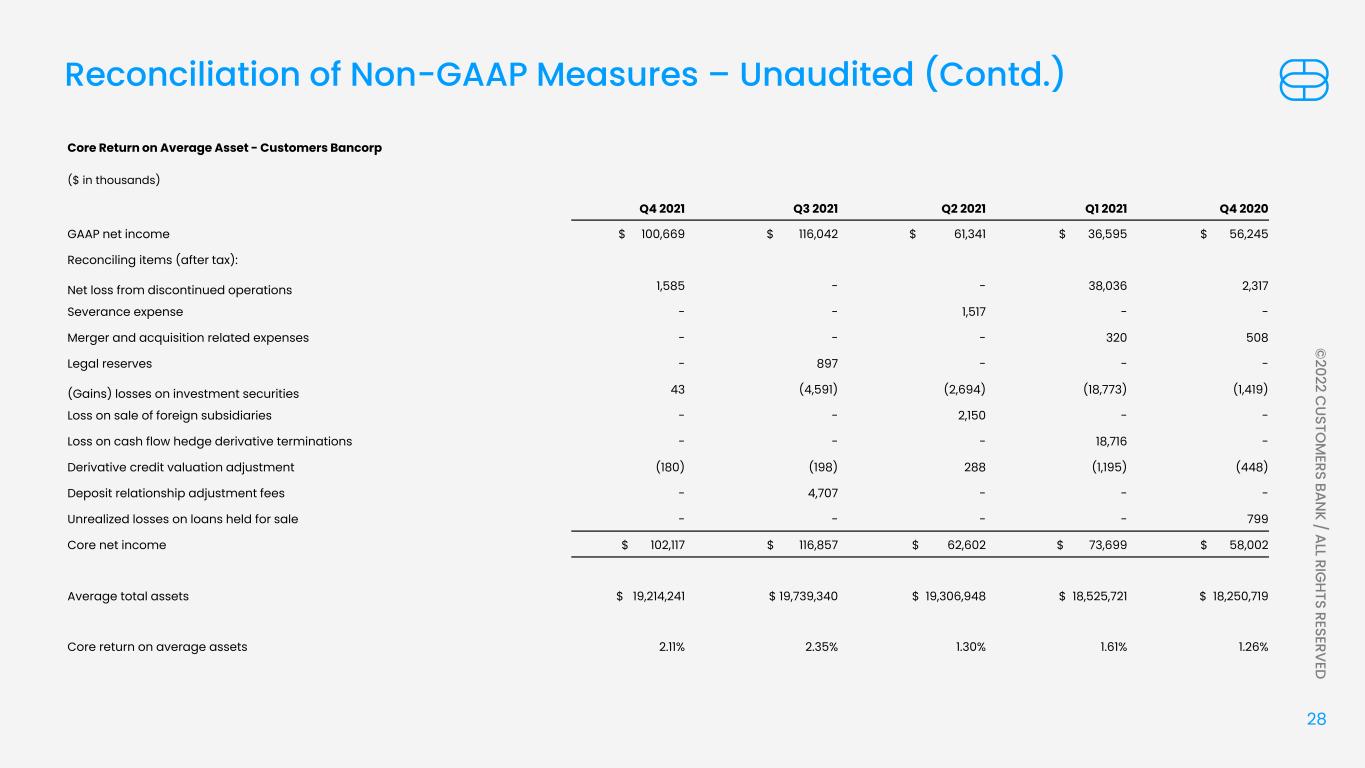
28 © 2022 C USTO M ERS BAN K / ALL RIG HTS RESERVED Core Return on Average Asset - Customers Bancorp ($ in thousands) Q4 2021 Q3 2021 Q2 2021 Q1 2021 Q4 2020 GAAP net income $ 100,669 $ 116,042 $ 61,341 $ 36,595 $ 56,245 Reconciling items (after tax): Net loss from discontinued operations 1,585 - - 38,036 2,317 Severance expense - - 1,517 - - Merger and acquisition related expenses - - - 320 508 Legal reserves - 897 - - - (Gains) losses on investment securities 43 (4,591) (2,694) (18,773) (1,419) Loss on sale of foreign subsidiaries - - 2,150 - - Loss on cash flow hedge derivative terminations - - - 18,716 - Derivative credit valuation adjustment (180) (198) 288 (1,195) (448) Deposit relationship adjustment fees - 4,707 - - - Unrealized losses on loans held for sale - - - - 799 Core net income $ 102,117 $ 116,857 $ 62,602 $ 73,699 $ 58,002 Average total assets $ 19,214,241 $ 19,739,340 $ 19,306,948 $ 18,525,721 $ 18,250,719 Core return on average assets 2.11% 2.35% 1.30% 1.61% 1.26% Reconciliation of Non-GAAP Measures – Unaudited (Contd.)
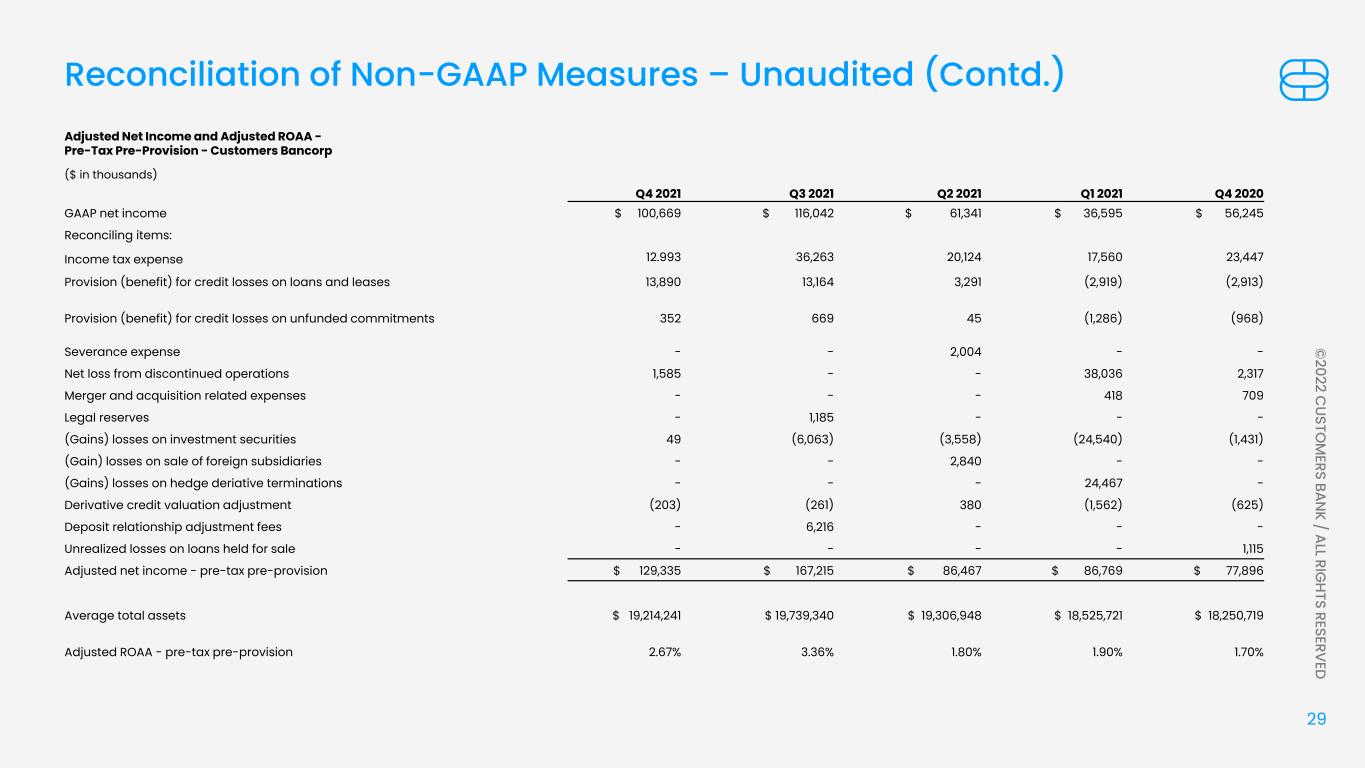
29 © 2022 C USTO M ERS BAN K / ALL RIG HTS RESERVED Adjusted Net Income and Adjusted ROAA - Pre-Tax Pre-Provision - Customers Bancorp ($ in thousands) Q4 2021 Q3 2021 Q2 2021 Q1 2021 Q4 2020 GAAP net income $ 100,669 $ 116,042 $ 61,341 $ 36,595 $ 56,245 Reconciling items: Income tax expense 12.993 36,263 20,124 17,560 23,447 Provision (benefit) for credit losses on loans and leases 13,890 13,164 3,291 (2,919) (2,913) Provision (benefit) for credit losses on unfunded commitments 352 669 45 (1,286) (968) Severance expense - - 2,004 - - Net loss from discontinued operations 1,585 - - 38,036 2,317 Merger and acquisition related expenses - - - 418 709 Legal reserves - 1,185 - - - (Gains) losses on investment securities 49 (6,063) (3,558) (24,540) (1,431) (Gain) losses on sale of foreign subsidiaries - - 2,840 - - (Gains) losses on hedge deriative terminations - - - 24,467 - Derivative credit valuation adjustment (203) (261) 380 (1,562) (625) Deposit relationship adjustment fees - 6,216 - - - Unrealized losses on loans held for sale - - - - 1,115 Adjusted net income - pre-tax pre-provision $ 129,335 $ 167,215 $ 86,467 $ 86,769 $ 77,896 Average total assets $ 19,214,241 $ 19,739,340 $ 19,306,948 $ 18,525,721 $ 18,250,719 Adjusted ROAA - pre-tax pre-provision 2.67% 3.36% 1.80% 1.90% 1.70% Reconciliation of Non-GAAP Measures – Unaudited (Contd.)

30 © 2022 C USTO M ERS BAN K / ALL RIG HTS RESERVED Core Return on Average Common Equity ($ in thousands) Q4 2021 Q3 2021 Q2 2021 Q1 2021 Q4 2020 GAAP net income to common shareholders $ 98,647 $ 110,241 $ 58,042 $ 33,204 $ 52,831 Reconciling items (after tax): Net loss from discontinued operations 1,585 - - 38,036 2,317 Severance expense - - 1,517 - - Merger and acquisition related expenses - - - 320 508 Legal reserves - 897 - - - (Gains) losses on investment securities 43 (4,591) (2,694) (18,773) (1,419) Loss on sale of foreign subsidiaries - - 2,150 - - Loss on cash flow hedge derivative terminations - - - 18,716 - Derivative credit valuation adjustment (180) (198) 288 (1,195) (448) Deposit relationship adjustment fees - 4,707 - - - Loss on redemption of preferred stock - 2,820 - - - Unrealized losses on loans held for sale - - - - 799 Core earnings $ 100,095 $ 113,876 $ 59,303 $ 70,308 $ 54,588 Average total common shareholders' equity $ 1,179,478 $ 1,071,566 $ 1,002,624 $ 918,795 $ 866,411 Core return on average common equity 33.67% 42.16% 23.72% 31.03% 25.06% Reconciliation of Non-GAAP Measures – Unaudited (Contd.)
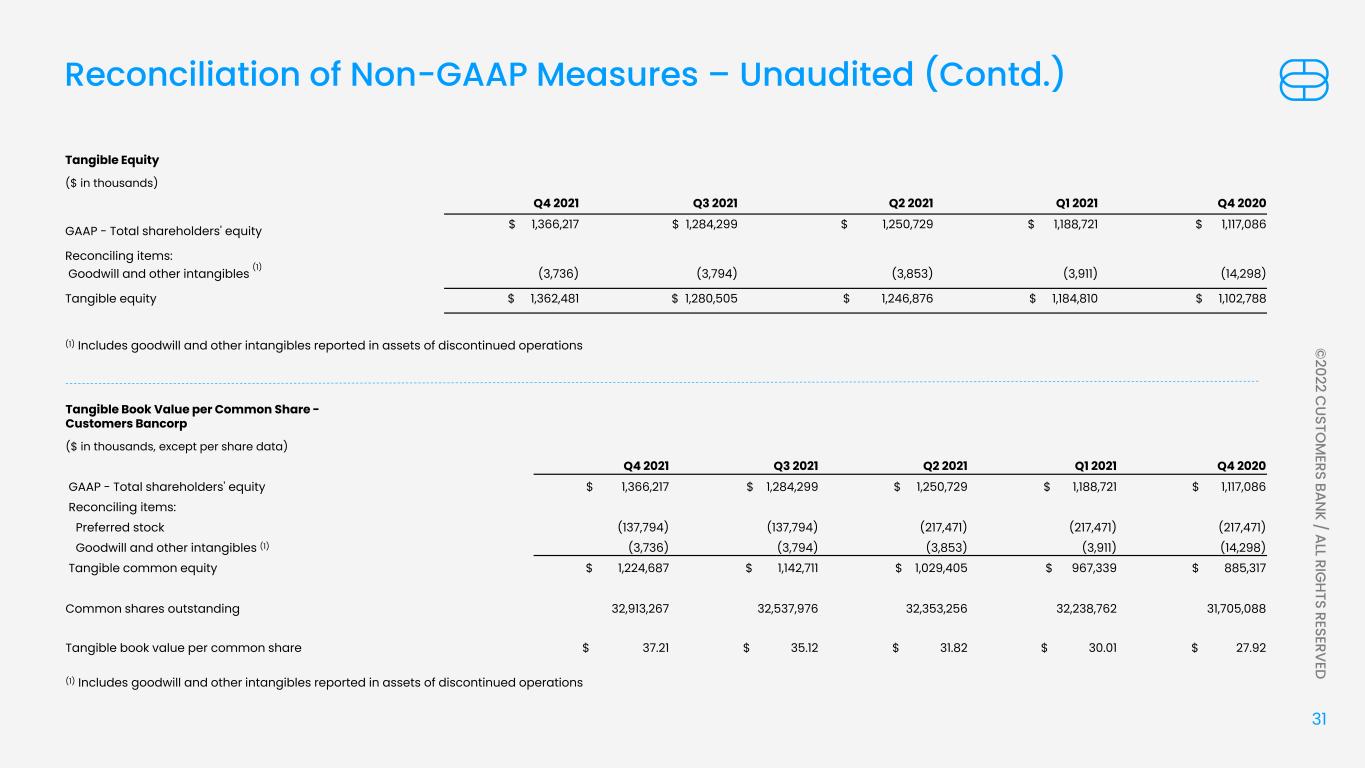
31 © 2022 C USTO M ERS BAN K / ALL RIG HTS RESERVED Reconciliation of Non-GAAP Measures – Unaudited (Contd.) Tangible Equity ($ in thousands) Q4 2021 Q3 2021 Q2 2021 Q1 2021 Q4 2020 GAAP - Total shareholders' equity $ 1,366,217 $ 1,284,299 $ 1,250,729 $ 1,188,721 $ 1,117,086 Reconciling items: Goodwill and other intangibles (1) (3,736) (3,794) (3,853) (3,911) (14,298) Tangible equity $ 1,362,481 $ 1,280,505 $ 1,246,876 $ 1,184,810 $ 1,102,788 (1) Includes goodwill and other intangibles reported in assets of discontinued operations Tangible Book Value per Common Share - Customers Bancorp ($ in thousands, except per share data) Q4 2021 Q3 2021 Q2 2021 Q1 2021 Q4 2020 GAAP - Total shareholders' equity $ 1,366,217 $ 1,284,299 $ 1,250,729 $ 1,188,721 $ 1,117,086 Reconciling items: Preferred stock (137,794) (137,794) (217,471) (217,471) (217,471) Goodwill and other intangibles (1) (3,736) (3,794) (3,853) (3,911) (14,298) Tangible common equity $ 1,224,687 $ 1,142,711 $ 1,029,405 $ 967,339 $ 885,317 Common shares outstanding 32,913,267 32,537,976 32,353,256 32,238,762 31,705,088 Tangible book value per common share $ 37.21 $ 35.12 $ 31.82 $ 30.01 $ 27.92 (1) Includes goodwill and other intangibles reported in assets of discontinued operations
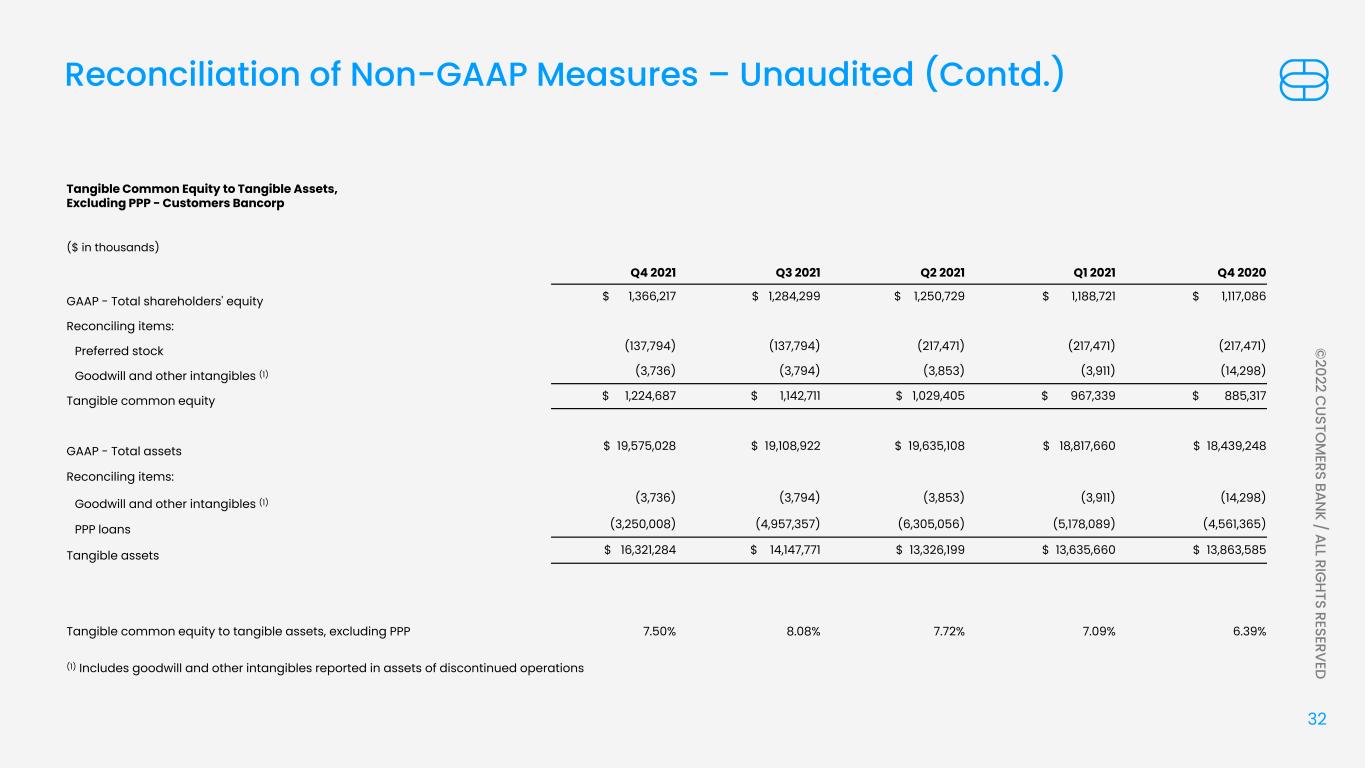
32 © 2022 C USTO M ERS BAN K / ALL RIG HTS RESERVED Reconciliation of Non-GAAP Measures – Unaudited (Contd.) Tangible Common Equity to Tangible Assets, Excluding PPP - Customers Bancorp ($ in thousands) Q4 2021 Q3 2021 Q2 2021 Q1 2021 Q4 2020 GAAP - Total shareholders' equity $ 1,366,217 $ 1,284,299 $ 1,250,729 $ 1,188,721 $ 1,117,086 Reconciling items: Preferred stock (137,794) (137,794) (217,471) (217,471) (217,471) Goodwill and other intangibles (1) (3,736) (3,794) (3,853) (3,911) (14,298) Tangible common equity $ 1,224,687 $ 1,142,711 $ 1,029,405 $ 967,339 $ 885,317 GAAP - Total assets $ 19,575,028 $ 19,108,922 $ 19,635,108 $ 18,817,660 $ 18,439,248 Reconciling items: Goodwill and other intangibles (1) (3,736) (3,794) (3,853) (3,911) (14,298) PPP loans (3,250,008) (4,957,357) (6,305,056) (5,178,089) (4,561,365) Tangible assets $ 16,321,284 $ 14,147,771 $ 13,326,199 $ 13,635,660 $ 13,863,585 Tangible common equity to tangible assets, excluding PPP 7.50% 8.08% 7.72% 7.09% 6.39% (1) Includes goodwill and other intangibles reported in assets of discontinued operations
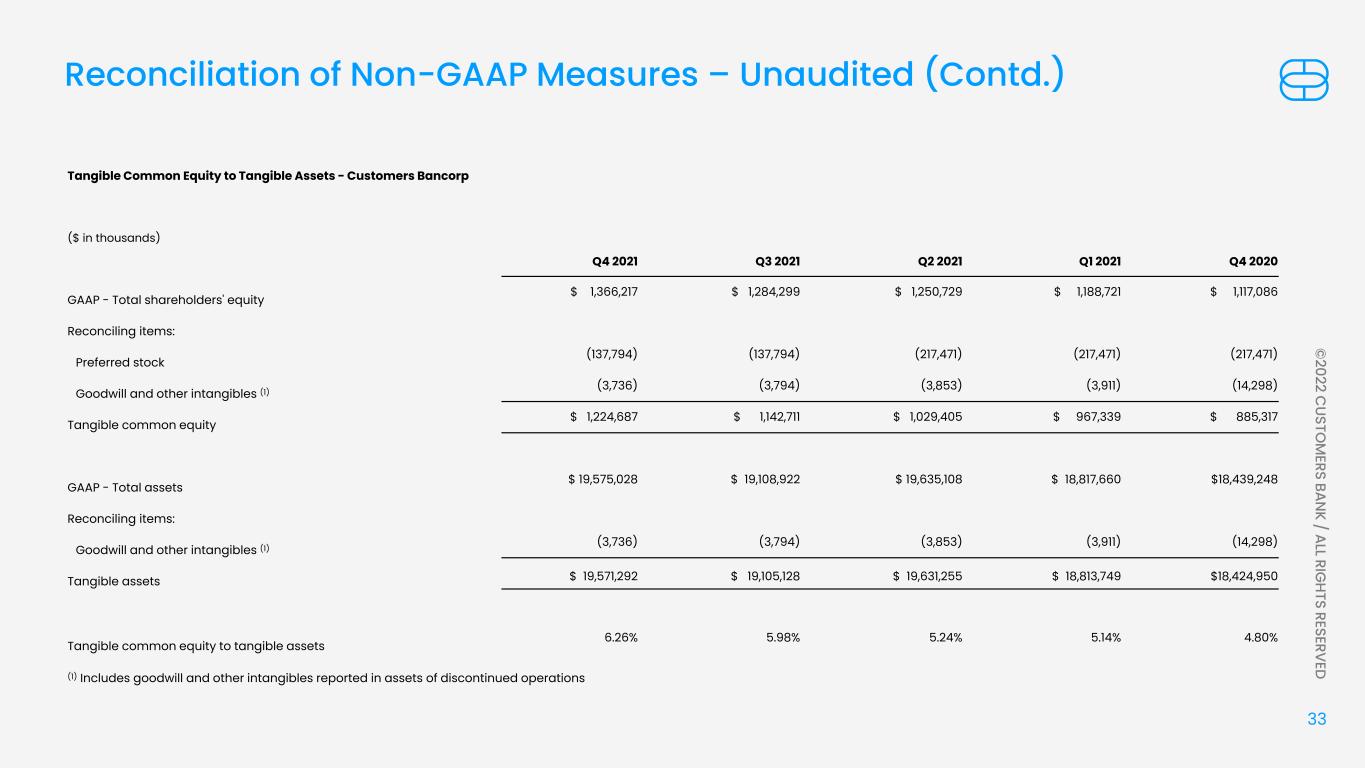
33 © 2022 C USTO M ERS BAN K / ALL RIG HTS RESERVED Reconciliation of Non-GAAP Measures – Unaudited (Contd.) Tangible Common Equity to Tangible Assets - Customers Bancorp ($ in thousands) Q4 2021 Q3 2021 Q2 2021 Q1 2021 Q4 2020 GAAP - Total shareholders' equity $ 1,366,217 $ 1,284,299 $ 1,250,729 $ 1,188,721 $ 1,117,086 Reconciling items: Preferred stock (137,794) (137,794) (217,471) (217,471) (217,471) Goodwill and other intangibles (1) (3,736) (3,794) (3,853) (3,911) (14,298) Tangible common equity $ 1,224,687 $ 1,142,711 $ 1,029,405 $ 967,339 $ 885,317 GAAP - Total assets $ 19,575,028 $ 19,108,922 $ 19,635,108 $ 18,817,660 $18,439,248 Reconciling items: Goodwill and other intangibles (1) (3,736) (3,794) (3,853) (3,911) (14,298) Tangible assets $ 19,571,292 $ 19,105,128 $ 19,631,255 $ 18,813,749 $18,424,950 Tangible common equity to tangible assets 6.26% 5.98% 5.24% 5.14% 4.80% (1) Includes goodwill and other intangibles reported in assets of discontinued operations
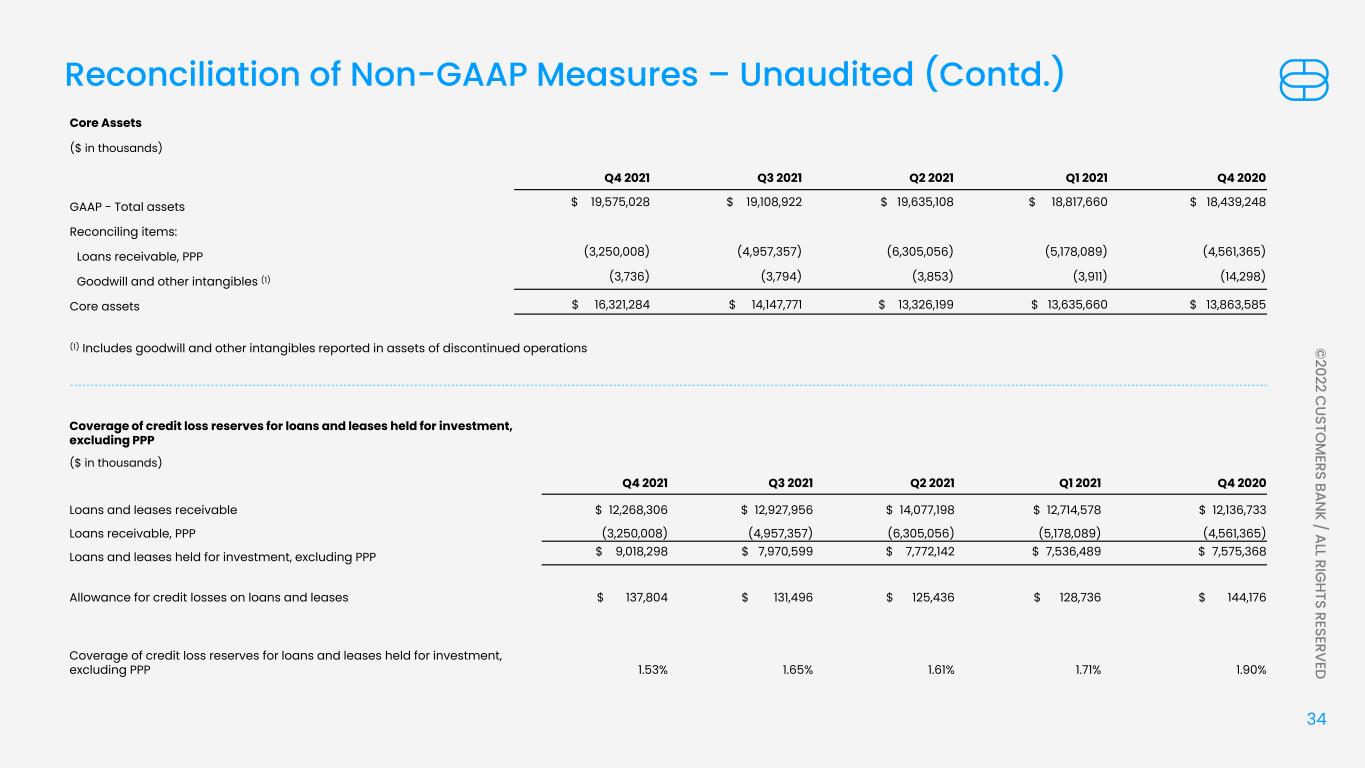
34 © 2022 C USTO M ERS BAN K / ALL RIG HTS RESERVED Reconciliation of Non-GAAP Measures – Unaudited (Contd.) Coverage of credit loss reserves for loans and leases held for investment, excluding PPP ($ in thousands) Q4 2021 Q3 2021 Q2 2021 Q1 2021 Q4 2020 Loans and leases receivable $ 12,268,306 $ 12,927,956 $ 14,077,198 $ 12,714,578 $ 12,136,733 Loans receivable, PPP (3,250,008) (4,957,357) (6,305,056) (5,178,089) (4,561,365) Loans and leases held for investment, excluding PPP $ 9,018,298 $ 7,970,599 $ 7,772,142 $ 7,536,489 $ 7,575,368 Allowance for credit losses on loans and leases $ 137,804 $ 131,496 $ 125,436 $ 128,736 $ 144,176 Coverage of credit loss reserves for loans and leases held for investment, excluding PPP 1.53% 1.65% 1.61% 1.71% 1.90% Core Assets ($ in thousands) Q4 2021 Q3 2021 Q2 2021 Q1 2021 Q4 2020 GAAP - Total assets $ 19,575,028 $ 19,108,922 $ 19,635,108 $ 18,817,660 $ 18,439,248 Reconciling items: Loans receivable, PPP (3,250,008) (4,957,357) (6,305,056) (5,178,089) (4,561,365) Goodwill and other intangibles (1) (3,736) (3,794) (3,853) (3,911) (14,298) Core assets $ 16,321,284 $ 14,147,771 $ 13,326,199 $ 13,635,660 $ 13,863,585 (1) Includes goodwill and other intangibles reported in assets of discontinued operations
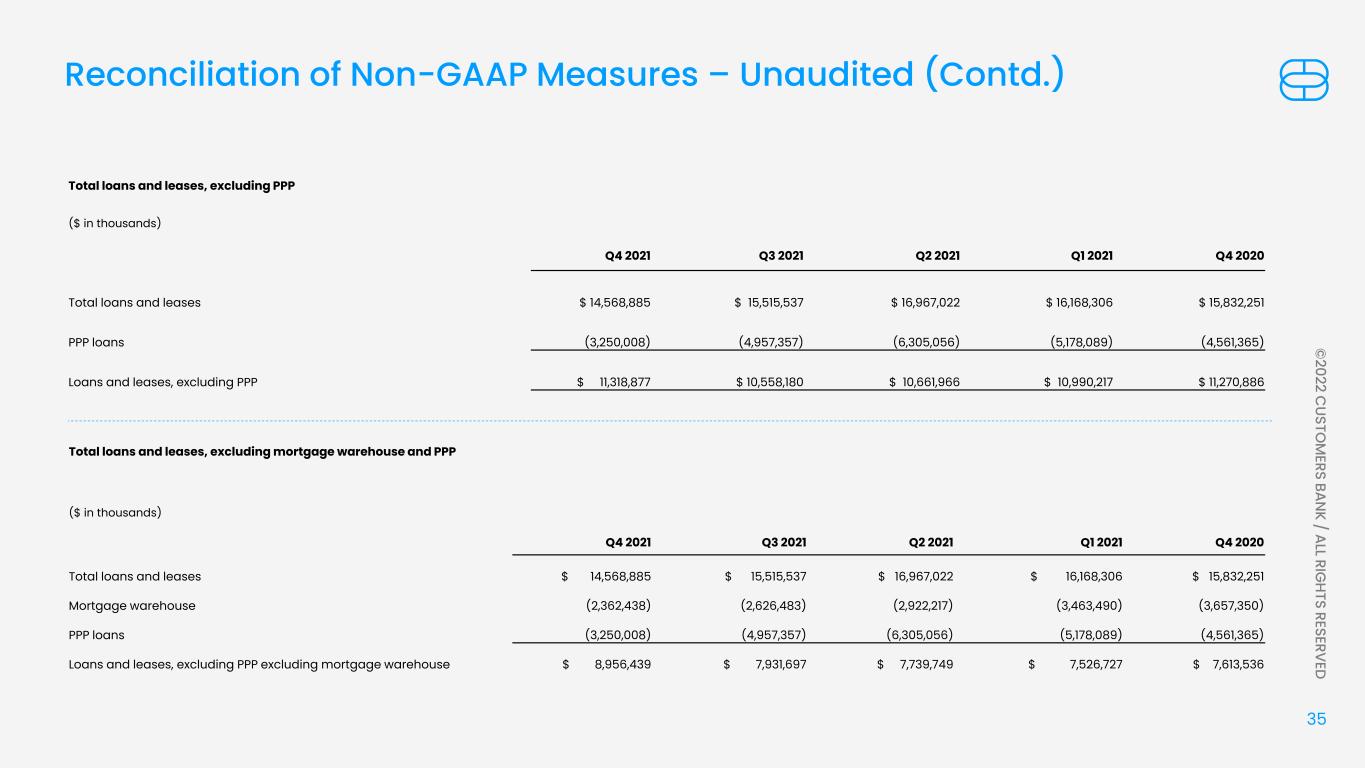
35 © 2022 C USTO M ERS BAN K / ALL RIG HTS RESERVED Reconciliation of Non-GAAP Measures – Unaudited (Contd.) Total loans and leases, excluding PPP ($ in thousands) Q4 2021 Q3 2021 Q2 2021 Q1 2021 Q4 2020 Total loans and leases $ 14,568,885 $ 15,515,537 $ 16,967,022 $ 16,168,306 $ 15,832,251 PPP loans (3,250,008) (4,957,357) (6,305,056) (5,178,089) (4,561,365) Loans and leases, excluding PPP $ 11,318,877 $ 10,558,180 $ 10,661,966 $ 10,990,217 $ 11,270,886 Total loans and leases, excluding mortgage warehouse and PPP ($ in thousands) Q4 2021 Q3 2021 Q2 2021 Q1 2021 Q4 2020 Total loans and leases $ 14,568,885 $ 15,515,537 $ 16,967,022 $ 16,168,306 $ 15,832,251 Mortgage warehouse (2,362,438) (2,626,483) (2,922,217) (3,463,490) (3,657,350) PPP loans (3,250,008) (4,957,357) (6,305,056) (5,178,089) (4,561,365) Loans and leases, excluding PPP excluding mortgage warehouse $ 8,956,439 $ 7,931,697 $ 7,739,749 $ 7,526,727 $ 7,613,536
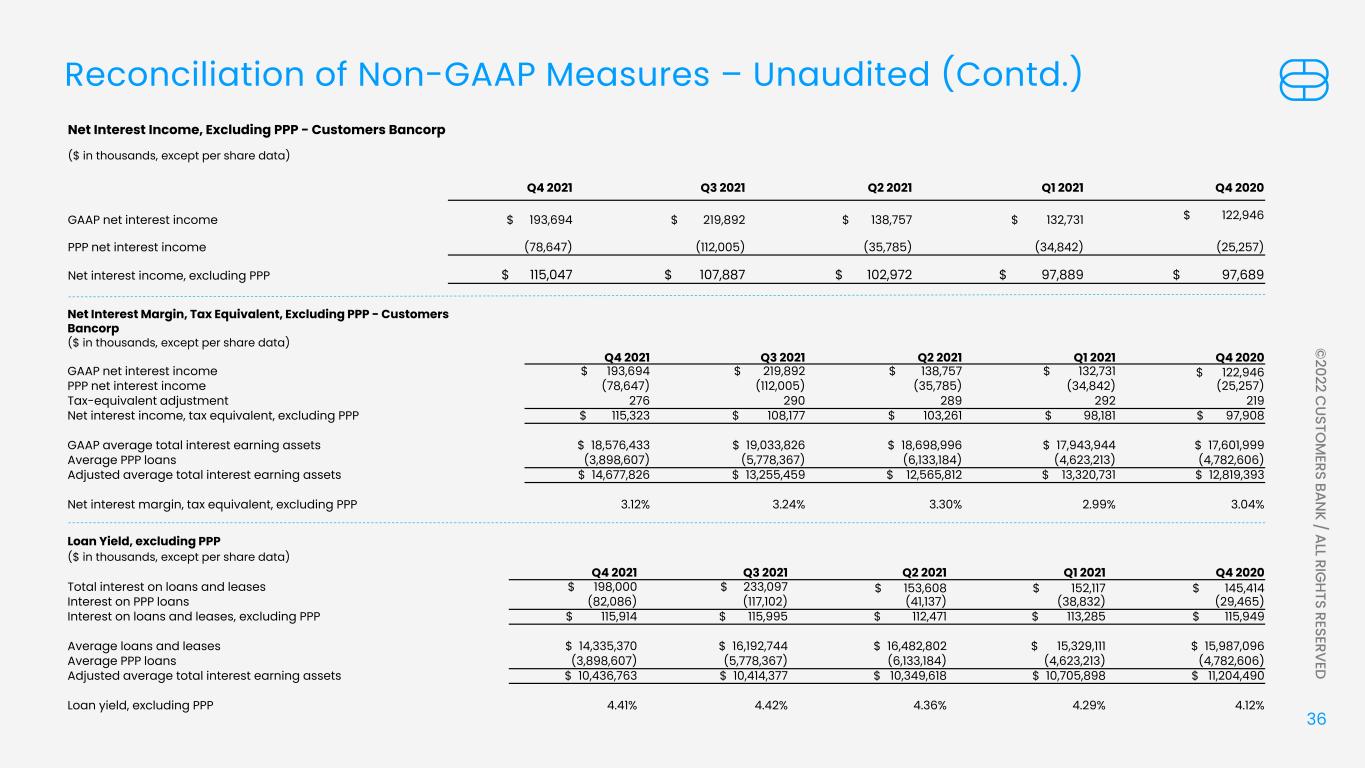
36 © 2022 C USTO M ERS BAN K / ALL RIG HTS RESERVED Reconciliation of Non-GAAP Measures – Unaudited (Contd.) Net Interest Margin, Tax Equivalent, Excluding PPP - Customers Bancorp ($ in thousands, except per share data) Q4 2021 Q3 2021 Q2 2021 Q1 2021 Q4 2020 GAAP net interest income $ 193,694 $ 219,892 $ 138,757 $ 132,731 $ 122,946 PPP net interest income (78,647) (112,005) (35,785) (34,842) (25,257) Tax-equivalent adjustment 276 290 289 292 219 Net interest income, tax equivalent, excluding PPP $ 115,323 $ 108,177 $ 103,261 $ 98,181 $ 97,908 GAAP average total interest earning assets $ 18,576,433 $ 19,033,826 $ 18,698,996 $ 17,943,944 $ 17,601,999 Average PPP loans (3,898,607) (5,778,367) (6,133,184) (4,623,213) (4,782,606) Adjusted average total interest earning assets $ 14,677,826 $ 13,255,459 $ 12,565,812 $ 13,320,731 $ 12,819,393 Net interest margin, tax equivalent, excluding PPP 3.12% 3.24% 3.30% 2.99% 3.04% Loan Yield, excluding PPP ($ in thousands, except per share data) Q4 2021 Q3 2021 Q2 2021 Q1 2021 Q4 2020 Total interest on loans and leases $ 198,000 $ 233,097 $ 153,608 $ 152,117 $ 145,414 Interest on PPP loans (82,086) (117,102) (41,137) (38,832) (29,465) Interest on loans and leases, excluding PPP $ 115,914 $ 115,995 $ 112,471 $ 113,285 $ 115,949 Average loans and leases $ 14,335,370 $ 16,192,744 $ 16,482,802 $ 15,329,111 $ 15,987,096 Average PPP loans (3,898,607) (5,778,367) (6,133,184) (4,623,213) (4,782,606) Adjusted average total interest earning assets $ 10,436,763 $ 10,414,377 $ 10,349,618 $ 10,705,898 $ 11,204,490 Loan yield, excluding PPP 4.41% 4.42% 4.36% 4.29% 4.12% Net Interest Income, Excluding PPP - Customers Bancorp ($ in thousands, except per share data) Q4 2021 Q3 2021 Q2 2021 Q1 2021 Q4 2020 GAAP net interest income $ 193,694 $ 219,892 $ 138,757 $ 132,731 $ 122,946 PPP net interest income (78,647) (112,005) (35,785) (34,842) (25,257) Net interest income, excluding PPP $ 115,047 $ 107,887 $ 102,972 $ 97,889 $ 97,689
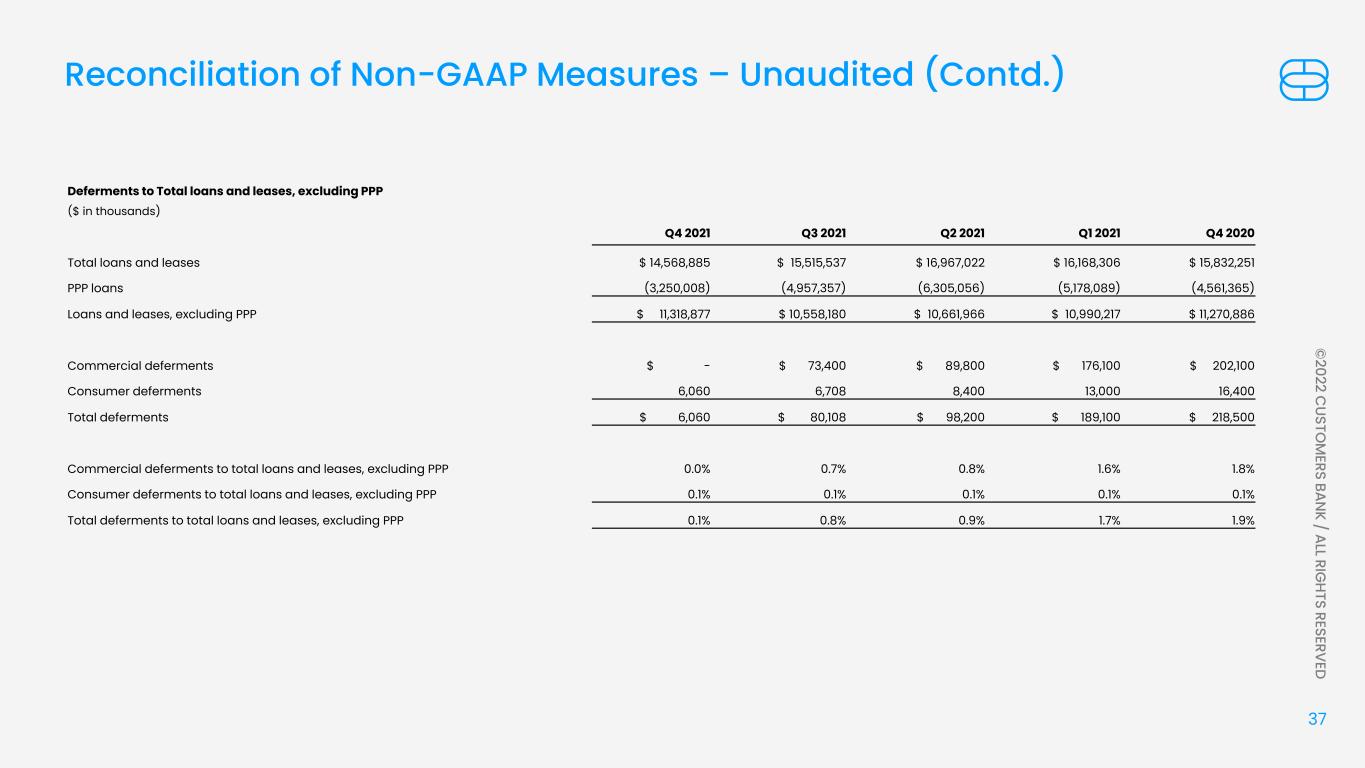
37 © 2022 C USTO M ERS BAN K / ALL RIG HTS RESERVED Reconciliation of Non-GAAP Measures – Unaudited (Contd.) Deferments to Total loans and leases, excluding PPP ($ in thousands) Q4 2021 Q3 2021 Q2 2021 Q1 2021 Q4 2020 Total loans and leases $ 14,568,885 $ 15,515,537 $ 16,967,022 $ 16,168,306 $ 15,832,251 PPP loans (3,250,008) (4,957,357) (6,305,056) (5,178,089) (4,561,365) Loans and leases, excluding PPP $ 11,318,877 $ 10,558,180 $ 10,661,966 $ 10,990,217 $ 11,270,886 Commercial deferments $ - $ 73,400 $ 89,800 $ 176,100 $ 202,100 Consumer deferments 6,060 6,708 8,400 13,000 16,400 Total deferments $ 6,060 $ 80,108 $ 98,200 $ 189,100 $ 218,500 Commercial deferments to total loans and leases, excluding PPP 0.0% 0.7% 0.8% 1.6% 1.8% Consumer deferments to total loans and leases, excluding PPP 0.1% 0.1% 0.1% 0.1% 0.1% Total deferments to total loans and leases, excluding PPP 0.1% 0.8% 0.9% 1.7% 1.9%


