Exhibit 99.1
| 1 Investor Presentation Electromed, Inc. Investor Presentation August 2024 NYSE American: ELMD Innovation Leader in Airway Clearance Technologies
| 2 Investor Presentation Forward Looking Statements Certain statements in this press release constitute forward - looking statements as defined in the US Private Securities Litigation Reform Act of 1995 . Forward - looking statements can generally be identified by words such as “anticipate,” “believe,” “estimate,” “expect,” “intend,” “may,” “plan,” “potential,” “should,” “will,” and similar expressions, including the negative of these terms, but they are not the exclusive means of identifying such statements . Forward - looking statements cannot be guaranteed, and actual results may vary materially due to the uncertainties and risks, known or unknown associated with such statements . Examples of risks and uncertainties for the Company include, but are not limited to the competitive nature of our market ; changes to Medicare, Medicaid, or private insurance reimbursement policies ; changes to state and federal health care laws ; changes affecting the medical device industry ; our ability to develop new sales channels for our products such as the homecare distributor channel ; our need to maintain regulatory compliance and to gain future regulatory approvals and clearances ; new drug or pharmaceutical discoveries ; general economic and business conditions ; our ability to renew our line of credit or obtain additional credit as necessary ; our ability to protect and expand our intellectual property portfolio ; the risks associated with expansion into international markets, as well as other factors we may describe from time to time in the Company’s reports filed with the Securities and Exchange Commission (including the Company’s most recent Annual Report on Form 10 - K, as amended from time to time, and subsequent Quarterly Reports on Form 10 - Q and Current Reports on Form 8 - K) . Investors should not consider any list of such factors to be an exhaustive statement of all of the risks, uncertainties or potentially inaccurate assumptions investors should take into account when making investment decisions . Shareholders and other readers should not place undue reliance on “forward - looking statements,” as such statements speak only as of the date of this press release . We undertake no obligation to update them in light of new information or future events .

| 3 Investor Presentation Electromed – Who We Are Electromed, Inc. is a growing medical device company focused on airway management to help people around the world breathe better, stay healthier, and lead active and fulfilling lives. As of and for trailing 12 months ended 3/31/2024 Key Stats : Headquarters: New Prague, MN Ticker: ELMD Established: 1992 Annual Revenue: $53.5M Market Cap: $139M Share Count: 8.7M 174 Employees Manufacturing in Minnesota HFCWO Market Focus
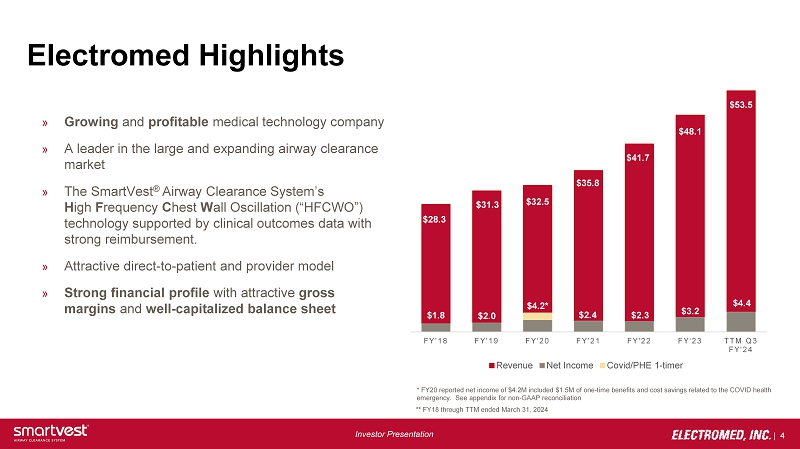
| 4 Investor Presentation Electromed Highlights » Growing and profitable medical technology company » A leader in the large and expanding airway clearance market » The SmartVest ® Airway Clearance System’s H igh F requency C hest W all Oscillation (“HFCWO”) technology supported by clinical outcomes data with strong reimbursement. » Attractive direct - to - patient and provider model » Strong financial profile with attractive gross margins and well - capitalized balance sheet $28.3 $31.3 $32.5 $35.8 $41.7 $48.1 $53.5 $1.8 $2.0 $4.2* $2.4 $2.3 $3.2 $4.4 FY'18 FY'19 FY'20 FY'21 FY'22 FY'23 TTM Q3 FY'24 Revenue Net Income Covid/PHE 1-timer * FY20 reported net income of $4.2M included $1.5M of one - time benefits and cost savings related to the COVID health emergency. See appendix for non - GAAP reconciliation ** FY18 through TTM ended March 31, 2024

| 5 Investor Presentation What is Bronchiectasis (BE)? » Irreversible lung condition characterized by abnormal widening of one or more of the bronchi (airways) » Repeated episodes of pulmonary inflammation and infection leads to mucus accumulating in the airways » Mean prevalence of bronchiectasis in patients with COPD is 54%¹ 1.Chalmers J. and Sethi S. Raising awareness of bronchiectasis in primary care: overview of diagnosis and management strategi es in adults. NPJ Prim Care Respir Med . 2017;27:18 HFCWO Under - prescribed Disease Underdiagnosed Disease Misdiagnosed

| 6 Investor Presentation U.S. Market: Large, Growing, Underpenetrated 1. Internal company estimates derived from GUIDEHOUSE 2023 NASM claims database 2.Internal company estimates derived from GUIDEHOUSE 2023 literature review and 2023 CDC NHANES data Bronchiectasis HFCWO penetration ~15% 1 Diagnosed BE population growing at ~12% annually 1 Estimated Net Bronchiectasis prevalence, DIAGNOSED 1 Estimated bronchiectasis prevalence, UNDIAGNOSED with COPD/BE overla p 2 Estimated HFCWO bronchiectasis penetration, treated population 1 ~824K U.S. BE Diagnosed 1 4.1 million U.S. Undiagnosed 2 ~127K HFCWO ADOPTED 1

| 7 Investor Presentation How is Bronchiectasis Treated? Antibiotics, Anti - Inflammatories, Airway Clearance
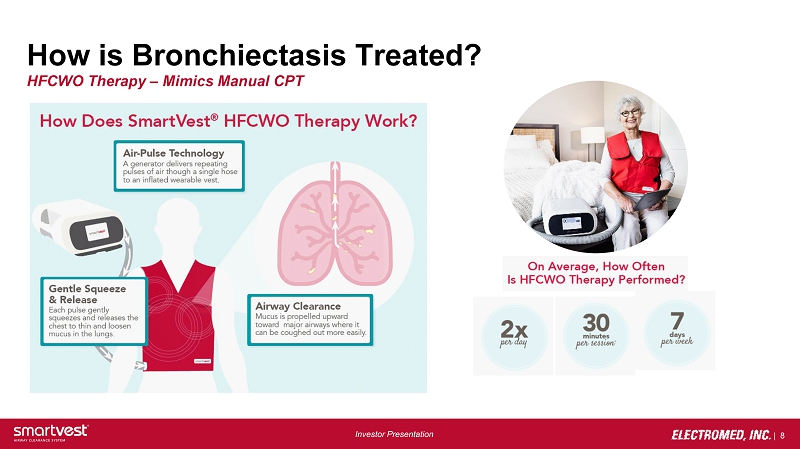
| 8 Investor Presentation How is Bronchiectasis Treated? HFCWO Therapy – Mimics Manual CPT
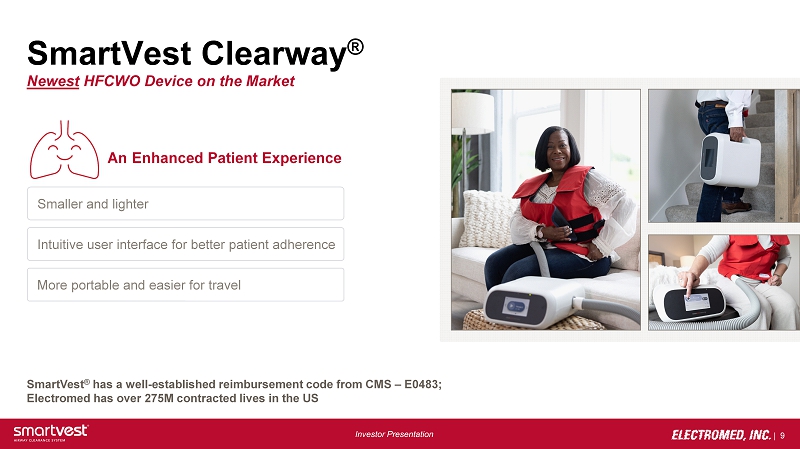
| 9 Investor Presentation Smaller and lighter Intuitive user interface for better patient adherence More portable and easier for travel SmartVest Clearway ® Newest HFCWO Device on the Market An Enhanced Patient Experience SmartVest ® has a well - established reimbursement code from CMS – E0483; Electromed has over 275M contracted lives in the US

| 10 Investor Presentation SmartNotes™ Patient Progress Report SmartNotes combine patient Quality of Life and Therapy Utilization data to provide physicians with extended views into disease management » TeleRespiratory Services : A team of Respiratory Therapists stay connected with patients and support their therapy utilization. » Outcomes Management : Easy - to - read report provides physicians with a comprehensive view of disease progression and therapy impact. Patient Outcomes and Treatment Progress to Physicians

| 11 Investor Presentation Clinical Evidence Electromed has Published Studies Showing Effectiveness of HFCWO to Treat Bronchiectasis 1.Sievert CE, et al 2016. Using High Frequency Chest Wall Oscillation in a Bronchiectasis Patient Population: An Outcomes - Based Case Review. Respiratory Therapy, 11(4), 34 - 38. 2. Sievert CE, et al 2018. Incidence of Bronchiectasis - Related Exacerbation Rates After HFCWO Treatment — A Longitudinal Outcome - B ased Study, Respiratory Therapy, 13(2), 38 - 41. 57 % Reduction in antibiotic prescriptions 1 59 % Decrease in hospitalizations 1 75 % Fewer emergency department visits 2 Therapy with SmartVest® significantly decreased exacerbations requiring hospitalization, antibiotic use, and stabilizes lung function. Powner (2018) Therapy with HFCWO demonstrated key health outcomes improved in post - compared to pre - index period: cough, all - cause hospitalizations, pneumonia, and pulmonary hospitalizations. DeKoven (2022)

| 12 Investor Presentation Direct - to - Patient Model Drives Attractive Margin Profile Manufacturer DME Patient $ $ vs. Electromed Patient $$ Traditional Medical Equipment Channel Direct - to - Patient Distribution (Electromed) ELMD expects gross margins in the mid - 70s and improving with the SmartVest ® Clearway ®
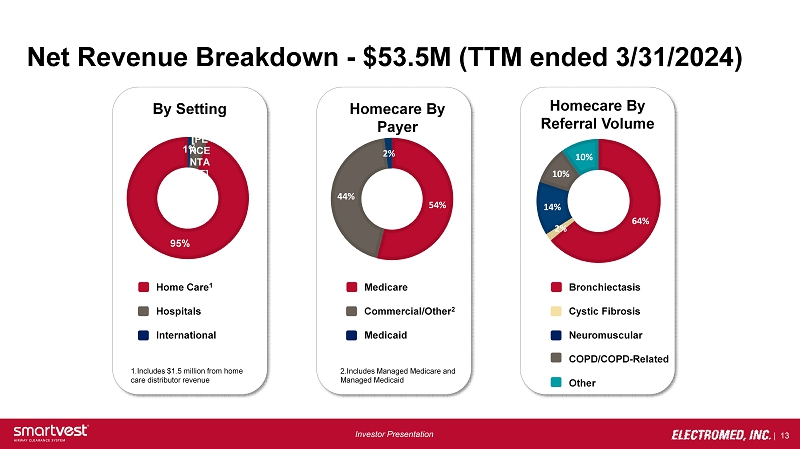
| 13 Investor Presentation Net Revenue Breakdown - $53.5M (TTM ended 3/31/2024) 1% [PE RCE NTA GE] 95% By Setting Homecare By Payer Homecare By Referral Volume 64% 2% 14% 10% 10% 54% 44% 2% Home Care 1 Hospitals International Medicare Commercial/Other 2 Medicaid Bronchiectasis Cystic Fibrosis Neuromuscular COPD/COPD - Related Other 1.Includes $1.5 million from home care distributor revenue 2.Includes Managed Medicare and Managed Medicaid

| 14 Investor Presentation Growth Strategy How will Electromed Increase Market Share? Continued sales force expansion along with complementary infrastructure investments Increase brand awareness and revenue with direct - to - consumer and physician marketing Market development to improve diagnosis rates and evidence to support the adoption of the SmartVest system for patients SmartAdvantage ™ best - in - class customer care and support Expand e - prescribing capability
| 15 Investor Presentation Long - Term Objectives Electromed is committed to delivering long - term profitable growth Double - digit Revenue Growth Operating Margin Improvement Increase market share Deeper penetration of current SmartVest prescribers Operating leverage as revenue increases

| 16 Investor Presentation Why Invest? Large, expanding chronic lung diseases market Clinically proven technology Broad payor coverage Consistent double - digit organic revenue growth High gross margins , robust cash flow and expanding operating leverage
| 17 Investor Presentation Management Incentives Aligned w/Investors CEO Incentive Management’s Incentive Compensation Reward based on increasing total shareholder return . Focused solely on delivering financial results .

| 18 Investor Presentation Attractive Valuation (TTM ended 3/31/2024 Results) Metric ELMD RUS ME Sales Growth 17.0% > 3.7% EV / Revenue Gross Margin 2.6x 76.4% > > 4.6x 54.7% Operating Margin 10.7% > (9.1%)
| 19 Investor Presentation Mike Cavanaugh ( 617) 877 - 8641 m ike.cavanaugh@westwicke.com Callie Conway (332) 242 - 4336 Callie.Conway@Westwicke.com Jim Cunniff , President & CEO (952) 758 - 9299 jcunniff @Electromed.com Brad Nagel, CFO (952) 758 - 9299 bnagel@Electromed.com

| 20 Investor Presentation APPENDIX
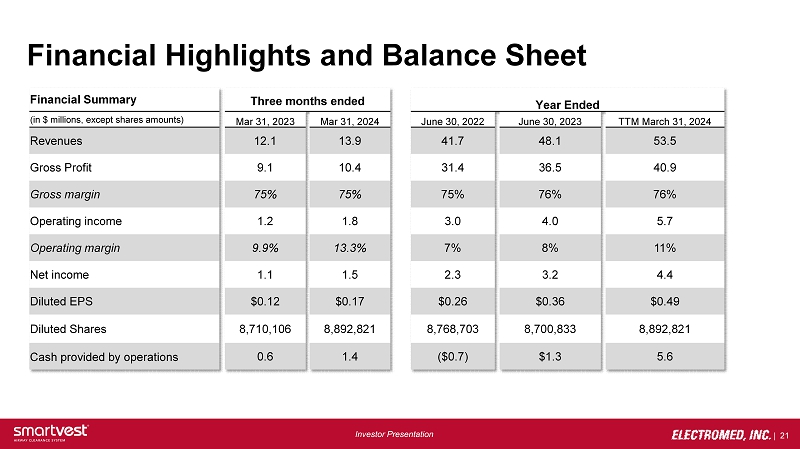
| 21 Investor Presentation Financial Highlights and Balance Sheet Financial Summary Three months ended Year Ended ( in $ millions, except shares amounts) Mar 31, 2023 Mar 31, 2024 June 30, 2022 June 30, 2023 TTM March 31, 2024 Revenues 12.1 13.9 41.7 48.1 53.5 Gross Profit 9.1 10.4 31.4 36.5 40.9 Gross margin 75% 75% 75% 76% 76% Operating income 1.2 1.8 3.0 4.0 5.7 Operating margin 9.9% 13.3% 7% 8% 11% Net income 1.1 1.5 2.3 3.2 4.4 Diluted EPS $0.12 $0.17 $0.26 $0.36 $0.49 Diluted Shares 8,710,106 8,892,821 8,768,703 8,700,833 8,892,821 Cash provided by operations 0.6 1.4 ($0.7) $1.3 5.6

| 22 Investor Presentation Non - GAAP Reconciliation Slide 4 GAAP Net Income $4.2 Reconciling Items: Government Stimulus Income ($0.9) Expense reductions from COVID - 19 related furloughs and role eliminations ($0.7) Expense reductions from COVID - 19 related travel limitations and fewer headcount, traveling ($0.4) Tax impact $0.5 Non - GAAP Net Income $2.7