Exhibit 99.3
MANAGEMENT’S DISCUSSION AND ANALYSIS
For the three and six months ended June 30, 2014
Tables are expressed in USD $000’s except share and per share amounts
The following provides management’s discussion and analysis (‘‘MD&A’’) of IMRIS Inc.’s consolidated results of operations and financial condition for the three and six months ended June 30, 2014. In this MD&A, “IMRIS”, the “Company”, “we”, “our” and “us” are used to refer to IMRIS Inc.
This MD&A is dated as of August 7, 2014 and should be read in conjunction with the interim unaudited consolidated financial statements and the notes thereto for the three and six months ended June 30, 2014 and with the audited consolidated financial statements and notes thereto for the year ending December 31, 2013.
This MD&A contains forward-looking statements about future events or future performance and reflects management’s expectations and assumptions regarding our growth, results of operations, performance and business prospects and opportunities. Such forward-looking statements reflect management’s current beliefs and are based on information currently available to us. In some cases, forward-looking statements can be identified by terminology such as “may”, “would”, “could”, “will”, “should”, “expect”, “plan”, “intend”, “anticipate”, “believe”, “estimate”, “predict”, “potential”, “continue” or the negative of these terms or other similar expressions concerning matters that are not historical facts. In particular, statements regarding our future operating results, economic performance and product development efforts are or involve forward-looking statements.
A number of factors could cause actual events, performance or results, including those in respect of the foregoing items, to differ materially from the events, performance and results discussed in the forward-looking statements. Factors which could cause future outcomes to differ materially from those set forth in the forward-looking statements include, but are not limited to: [i] timing and amount of revenue recognition of order backlog and our expectation of sales and margin growth [ii] maintaining sufficient and suitable financing to support operations and commercialization of products, [iii] adequately protecting proprietary information and technology from competitors, [iv] obtaining regulatory approvals and successfully completing new product launches, [v] successfully competing in the targeted markets, and [vi] maintaining third party relationships, including key personnel, and key suppliers, as well as various factors set forth from time to time in Item 3.2, Risks Related to Our Business, of our Annual Information Form (AIF) available at www.sedar.com and on the United States Securities and Exchange Commission (SEC) website at www.sec.gov. The AIF is located in the Company’s Annual Report on Form 40-F. In evaluating these forward-looking statements, readers should specifically consider various factors, including the risks outlined under “Risks and Uncertainties”, which may cause actual events, performance or results to differ materially from any forward-looking statement.
Readers are cautioned that our expectation, beliefs, projections and assumptions used in preparation of such information, although considered reasonable at the time of preparation, may prove to be wrong, and as such, undue reliance should not be placed on forward-looking statements. By their nature, forward-looking statements are subject to numerous known and unknown risks and uncertainties so as a result, we can give no assurance that any of the actual events, performance, results, or expectations will occur or be realized. These forward-looking statements are expressly qualified by this cautionary statement as of the date of this MD&A and we do not intend, and do not assume any obligation, to update or revise them to reflect new or future events or circumstances.
IMRIS Inc. Management’s Discussion and Analysis– August 7, 2014 Page 1 of 21 |
OVERVIEW
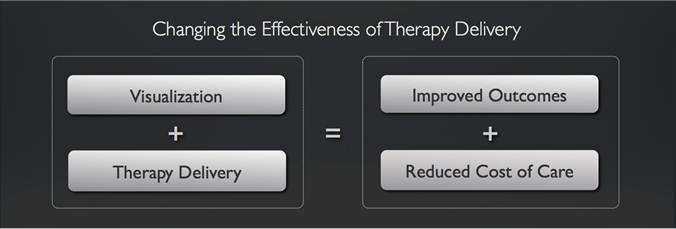
IMRIS designs, manufactures and marketsImage Guided Therapy Systems that enhance the effectiveness of therapy delivery. Our image guided therapy systems are a combination of real time visualization products and therapy delivery products that are designed to improve patient outcomes and reduce the cost of patient care. We accomplish this by combining our visualization technology products with therapy delivery products in a single integrated system that has the ability to provide timely information to clinicians to properly assess the treatment plan at the point of therapy delivery. We believe this approach to patient care not only improves patient outcomes, but also contributes to reduced cost of care for those patients. Our goal is to continuously deliver products that improve therapy delivery for an increasing number of medical procedures while at the same time are supported by peer reviewed published measurement of improved outcomes and reduced cost of care.
Visualization and Therapy Delivery
In 2005 at the founding of the Company, we created a visualization platform based on a single Magnetic Resonance (MR) Imaging product. Since then we have introduced a variety of next generation imaging capabilities into our visualization products. These include multiple field strength MR systems, X-Ray Fluoroscopy (AX) systems, and Computed Tomography (CT) systems, all designed to provide imaging capabilities for different therapy delivery products. All of these imaging capabilities are marketed as theVISIUS Surgical Theatre.
Our goal is to design visualization products that have the ability to be used in a large number of surgical and interventional procedures and to become a foundational investment in every hospital. To do this the system must be flexible enough to meet current and evolving procedural requirements while at the same time improving patient care and reducing costs to the hospital. The VISIUS Surgical Theatre can incorporate multiple configurations and imaging modalities while reducing patient risk and delivering real-time information to clinicians while preserving optimal surgical access and techniques.
Our visualization product, the VISIUS Surgical Theatre, is used in combination with multiple therapy delivery systems including traditional surgery, surgeon directed robotic surgery and radiosurgery. It is our goal to provide a means for clinicians to improve therapy delivery by moving toward a minimally invasive surgical (MIS) procedure whenever possible. The transition to an MIS procedure is expected to contribute to improved outcomes and reduced costs of care versus traditional surgical methods.
We sell our VISIUS Surgical Theatre globally to hospitals that deliver clinical services to patients in the neurosurgical, spinal, cerebrovascular and cardiovascular markets. Historically our products have enabled therapy delivery through traditional surgical techniques, primarily for neurosurgical applications. We believe that the VISIUS Surgical Theatre, in combination with therapy delivery, has the ability to continue to expand across a large number of clinical procedures. As we continue to work with clinicians to promote and identify potential new areas of clinical application, new high value procedures are expected, resulting in increased utilization and further adoption of the products.
Value Proposition
We believe that the combination of the VISIUS Surgical Theatre with therapy delivery benefits patients, physicians and hospitals:
IMRIS Inc. Management’s Discussion and Analysis– August 7, 2014 Page 2 of 21 |
Patients
| • | Improved Outcomes: Peer reviewed published research has shown significant improvements in patient outcomes when the intraoperative imaging available in the VISIUS Surgical Theatre is used in a procedure. |
| • | Risk Reduction: The risk of requiring a repeat operation because of incomplete procedures is significantly reduced due to improved levels of complete resection in the case of brain tumors as a result of the intraoperative visualization. |
Clinicians
| • | Enhanced Efficiency and Effectiveness for Clinicians: High resolution imaging information is captured rapidly and presented in a manner designed to enhance clinician efficiency and effectiveness. |
| • | Enhanced Workflow for Clinicians: The patient can be maintained in the optimal surgical position throughout the procedure and the MRI or CT imaging system is removed from the surgical or interventional theatre when not required resulting in unrestricted access to the patient by the surgical team. |
Hospitals
| • | Greater Utilization of the VISIUS Surgical Theatre:The VISIUS Surgical Theatre permits greater utilization of the imaging equipment as the MR or CT scanner can be shared by multiple operating rooms and a diagnostic imaging suite allowing for a single asset to be used by numerous clinicians. |
| • | Increased Patient Volumes: Improved patient outcomes may result in higher patient volumes and revenue for hospitals. |
| • | Technology Attracts Clinicians: Access to technologies such as the VISIUS Surgical Theatre can assist in both the recruitment and retention of clinicians. |
PRODUCT PORTFOLIO
The VISIUS Surgical Theatre is the foundational technology of our Company and continues to evolve in its utilization across numerous surgical and interventional applications. We have invested in research and development to further broaden our product portfolio by introducing new procedures into the VISIUS Surgical Theatre as well as combining it with new therapy products.
Our product portfolio consists of three therapy delivery systems made up of the VISIUS Surgical Theatre in combination with:
| 1: | Traditional surgical techniques, |
| 2: | The SYMBIS Surgical System, a surgeon controlled surgical robot, and |
| 3: | The TrueBeamTM radiation therapy product from Varian Medical Systems, Inc. (Varian). |
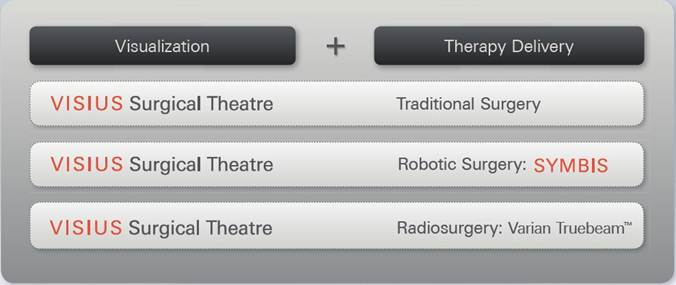
(The SYMBIS surgical system and the Radiosurgery product with the TrueBeamTM system are both works in progress and not available for commercial sale)
All of these Image Guided Therapy systems include our proprietary VISIUS Surgical Theatre in combination with therapy delivery systems that are integrated with multiple proprietary supporting products and technologies. These include patient handling systems, data management and information presentation systems, surgical devices, imaging and system control software platforms and safety and remote management products. These are proprietary products that underlay the VISIUS Surgical Theatre’s ability to be integrated with each therapy delivery product.
IMRIS Inc. Management’s Discussion and Analysis– August 7, 2014 Page 3 of 21 |
| I. | VISIUS Surgical Theatre and Traditional Surgical Procedures |
The VISIUS Surgical Theatrecan be configured to support the delivery of a wide rangeof neurosurgical, cardiovascular, cerebrovascular and spinal procedures using traditional surgical techniques. The VISIUS Surgical Theatre can be equipped with intraoperative imaging utilizing MRI, x-ray angiography and computed tomography, alone or in multimodality combinations.
The VISIUS Surgical Theatre provides a fully integrated surgical environment with the availability of high-resolution images for use in a number of surgical procedures. These procedures include neurological tumor resection, epilepsy foci resection, arteriovenous malformation, aneurysm, upper C-spine and frame-based stereotaxy. Due to the invasive nature of brain surgery and the importance of minimizing disturbance to healthy brain tissue, neurosurgical procedures may particularly benefit from an MRI's unique ability to distinguish between diseased and healthy brain tissue. The VISIUS Surgical Theatre provides visualization information to allow clinicians to make adjustments to the procedure while the procedure is in progress, which may lead to improved patient outcomes and reduce the likelihood that repeat surgeries will be needed.
When equipped with an MR scanner and integrated x-ray angiography system, the VISIUS Surgical Theatre provides clinicians with timely and accurate images for visualizing the patient anatomy before, during and after interventions for the treatment of a wide variety of cardiovascular and cerebrovascular conditions, such as atrial fibrillation, certain structural heart disorders and stroke. With seamless transitions between MR and x-ray angiography systems, the VISIUS Surgical Theatre enables surgical and catheter-based treatments and real-time assessment of therapy in a single integrated suite. The single integrated system in a VISIUS Surgical Theatre eliminates patient transport between imaging modalities and streamlines workflow. After MR scanning, the patient can be transitioned to image-guided intervention on the angiography system without moving the patient from the table. During and immediately after the procedure, new MR images can be taken to assess treatment and to determine if further intervention is required.
Our introduction of a ceiling mounted CT based version of the VISIUS Surgical Theatre in July 2013 leverages our know-how from our existing VISIUS Surgical Theatre offering in MR systems for use in certain cranial and spine procedures. This system has the ability to move over the top of a stationary patient, and to provide intraoperative images of diagnostic quality at low dose, without the additional risk of moving the patient, while still preserving optimal surgical access and techniques. This system has the ability to move between multiple operating rooms, using a 64-slice scanner that features advanced software applications that minimize radiation exposure in real time and industry leading post-processing software to enhance surgical diagnosis and intervention. This product received regulatory clearance by the FDA in July 2013 and got its CE Mark for the European Union in August 2013.
| II. | VISIUS Surgical Theatre and the SYMBIS Surgical System |
In February 2010, we acquired NeuroArm Surgical Ltd and all of its intellectual property. Since then we have been developing the SYMBIS Surgical System, a surgeon controlled surgical robot designed to enable minimally invasive procedures that are currently performed in a more invasive manner. This system consists of an MR compatible robot and surgical control console integrated together with the VISIUS Surgical Theatre. We believe that the combination of optical and MR or CT imaging integrated with a surgical robot may have the ability to transform a number of surgical procedures to minimally invasive procedures. The robot has been designed to operate in the bore of a high field MR system and a CT gantry that can provide unprecedented visualization of the surgical site by providing both optical and MR views of the surgical target. The SYMBIS Surgical System is a micro-surgical system that has all of the traditional attributes of a robotic system such as accuracy, repeatability and control, but also has integrated MR, CT and optical imaging, along with haptic feedback to the clinician. The haptic feedback or “sense of touch” may enable surgeons to complete procedures in a way never before possible. The SYMBIS Surgical System is designed to be installed in both existing VISIUS Surgical Theatre systems, and in new installations.
We are developing surgical instruments for the SYMBIS that are procedure specific and are designed to enable greater precision and flexibility for the surgeon. We believe that the SYMBIS Surgical System will be applicable for a large number of high volume surgical procedures with the potential to be clinically meaningful and thereby further adoption of the system.
As part of our clinical strategy, we have engaged a Medical Advisory Board consisting of key clinical thought leaders in the field of robotics. The advisory board helps to define clinical strategy and future products as we develop surgical applications for the SYMBIS Surgical System.
| III. | VISIUS Surgical Theatre and the TrueBeamTM System for Radiosurgery |
On October 5, 2010 we announced our agreement with Varian to integrate the capabilities of the VISIUS Surgical Theatre together with the therapy capability of Varian’s TrueBeamTM radiotherapy system.This product has the potential to provide a number of high value capabilities to radiation oncology centers that are hospital based or standalone clinics. This system is designed to provide a radiation oncology center with the ability to deliver MR guided radiation therapy, MR simulation and MR guided brachytherapy from a single integrated system. The system consists of three connected rooms that provide radiosurgery, simulation and brachytherapy all with a common MR imaging platform.
IMRIS Inc. Management’s Discussion and Analysis– August 7, 2014 Page 4 of 21 |
MR simulation is a planning and imaging procedure that is done in conjunction with a patient’s preparation for radiation therapy delivery. Our system allows for a high field MR to be used in a diagnostic simulation suite and then, on demand, be available for use in MR guided radiosurgery, or MR guided brachy therapy. This may provide a significant economic advantage over other means of completing the same procedure.
For MR guided radiation therapy (MRgRT), the patient is located in the radiation therapy bunker and a high field MR moves into the bunker over top of a stationary patient. The MR image is acquired, the MR moves out of the room, and the therapy treatment plan is developed and delivered to the TrueBeamTM radiosurgery system which executes the treatment. The ability to image soft tissue lesions with MR, immediately before the application of radiation therapy may allow for more accurate targeting of the lesion, resulting in a reduction in the radiation delivered to adjacent healthy tissue. This improved targeting may also result in the ability to increase the energy delivered at a treatment session, which may result in fewer treatment sessions for the patient. This new approach to treatment delivery is expected to provide improved patient outcomes versus existing radiosurgery technology systems and have the opportunity to reduce the cost of care.
We believe that the ability to deliver MR guided brachytherapy in a single suite may have compelling advantages over other means of delivering brachytherapy to patients. Brachytherapy is the deposition of high dose radiation seeds into target tissue for the delivery of radiation. It requires the ability to image, target, and deliver the seeds with precision and confidence. Our system is designed to enhance the workflow and provide improved procedural outcomes. This product is currently under development with Varian with an application for regulatory submission anticipated in 2015 or 2016.
Technology and Product Development
Underlying all of our image guided therapy solutions is advanced proprietary technology and intellectual property that we have developed as part of our unique solutions. The protection of these products, our processes and know-how is integral to our business. We currently have 52 patents either issued or pending. As we develop our technologies, we will continue to seek patent protection to contribute to our competitive advantage. We have patents in place in the United States, Canada and other countries, where available, to protect our core patent family and we have filed a number of additional patent applications that are directed to specific aspects of our technology.
Innovation and the creation of high value novel products is a cornerstone of IMRIS’ development activities.To grow the Company and to remain competitive, we are continuously engaged in new product development and enhancement and each year we invest significantly in research and development to drive continuing innovations that support our competitive position.
As we move forward our product development efforts will be focused on enhancing the capabilities of the VISIUS Surgical Theatre so that we are increasing the number and quantity of traditional procedures that can be completed in our theatres. Following commercialization of our products that combine robotics and radiosurgery with the VISIUS Surgical Theatre, we expect to continue to expand the capabilities of these systems to continue to grow their value proposition.
Regulatory
IMRIS is a global company serving global markets. We have registered our core MR VISIUS Surgical Theatre in the United States, Canada, European Union, Australia, Japan, China, Singapore and South Korea. We continue to maintain our facility and product registrations to serve these global markets. We successfully completed certification to ISO-13485 of our Minnetonka, Minnesota facility in August 2013, which is a requirement for many of our global markets. During this period, IMRIS cleared the industry’s first MRI wireless coil and ceiling-mounted iCT system.
IMRIS maintains a proven network of global regulatory partners and will seek product registrations based on market demand and product launch strategy as the new products and technologies are developed.
Market and Sales Cycle
We sell our VISIUS Surgical Theatres globally to hospitals that deliver clinical services to patients in the neurosurgical, spinal, cerebrovascular and cardiovascular markets. We believe that the primary market for our iMR product portfolio is comprised of those hospitals having relatively large neurosurgical, cerebrovascular or cardiovascular practices. The VISIUS iCT serves this group as well, but extends into orthopedic and neurosurgical spine practices in hospitals and surgery centers alike. Clinical appreciation for the benefits of VISIUS Surgical Theatres for neurosurgical and orthopedic applications is growing supported by repeat purchases from hospitals and market penetration within regions in which our product is being sold.
We have a direct sales force in the United States, Canada, China, Singapore, Japan and Europe, excluding Italy and Eastern European countries. Our investment in sales management in Singapore during 2013 is the result of the market opportunities we foresee in the Asia Pacific region. In all other markets where we do not have a direct sales force, we utilize distributors.
Our sales force is focusing its efforts on hospitals with the greatest ability to benefit from neurosurgical and spinal applications. They are aggressively working our sales pipeline and we are increasing our marketing efforts. As a result, we expect that market interest will develop for new applications of the product and the new products being developed, which can be utilized within our Theatres.
IMRIS Inc. Management’s Discussion and Analysis– August 7, 2014 Page 5 of 21 |
The purchase and installation of a VISIUS Surgical Theatre for traditional surgical procedures represents a significant capital project for our customers that can range in price from approximately $1.5 million to $3.5 million for CT based systems and $4 million to $12 million for MR systems, each depending on the product solution, the configuration of the VISIUS Surgical Theatre layout and system options selected. In addition to the capital equipment sale, most of our customers enter into equipment service contracts that are generally 4-5 years in duration. These contracts begin after the typical one-year warranty period and are on average equal to approximately 5 to 10 percent of the original equipment purchase price per year in revenues. In addition to our equipment and services, customers may require further capital expenditures for construction and ancillary equipment. The sales cycle for our VISIUS Surgical Theatres is both complex and lengthy and can be more than 12 months from initial customer engagement to receipt of a purchase order, though the iCT system has a significantly shorter sales cycle of three to nine months.
Following the receipt of a customer purchase order, the delivery and installation cycle for one of our VISIUS Surgical Theatres typically ranges from 8 months to 18 months or more the larger scale iMR products depending on the configuration of our system and the amount of additional construction work that may be required to be completed by the customer. The VISIUS Surgical Theatre using CT installation cycles are significantly shorter ranging from as little as 3 months to 9 months depending on the availability of the customer site. We invoice customers for a VISIUS Surgical Theatre in installments spread over a number of milestones, which typically include a deposit at the time of order and a percentage of the remaining total price upon delivery of the equipment, completion of installation and final acceptance. Due to the project nature of our VISIUS Surgical Theatre sales, we recognize revenues and related cost of sales on a percentage-of-completion basis as the VISIUS Surgical Theatre is installed.
As our newer products are commercialized, we believe we can leverage our significant customer relationships to accelerate new product introductions. Moreover, our VISIUS Surgical Theatres equipped with the SYMBIS Surgical System are being designed to have shorter installation timeframes. These factors together are expected to result in significantly shorter sales and installation cycles for our Company.
IMRIS Inc. Management’s Discussion and Analysis– August 7, 2014 Page 6 of 21 |
Overall Performance
Highlights from the second quarter of 2014 include:
| • | New order bookings of $22.6 million in second quarter, $40.5 million in first half; |
| • | Four VISIUS Surgical Theatres booked in the second quarter across the globe; |
| • | Backlog increases 26 percent in first six months to record $128.7 million; |
| • | Quarterly revenues of $4.3 million; |
| • | Gross margin 45.0 percent versus 30.4 percent in prior-year quarter; |
SUMMARY OF SELECTED FINANCIAL INFORMATION
Quarterly Results
The following table sets forth selected financial information for the dates and periods indicated:
| | Selected Financial Information | | | | | | | |
| | (Thousands of US dollars, except per share amounts) | | | | | |
| | (Unaudited) | | | | | | | |
| | | | | | | | | | |
| | | | Three months ended | | | Six months ended | |
| | | | June 30 | % | | June 30 | % |
| | | | 2014 | 2013 | Change | | 2014 | 2013 | Change |
| | | | | | | | | | |
| | Sales | $ 4,258 | $ 10,226 | -58.4% | | $ 12,409 | $ 18,292 | -32.2% |
| | Gross profit | $ 1,916 | $ 3,109 | -38.4% | | $ 3,841 | $ 6,129 | -37.3% |
| | Gross profit % | 45.0% | 30.4% | | | 31.0% | 33.5% | |
| | | | | | | | | | |
| | Operating expenses | $ 8,698 | $ 10,816 | -19.6% | | $ 16,742 | $ 21,610 | -22.5% |
| | Operating loss | $ (6,782) | $ (7,707) | -12.0% | | $ (12,901) | $ (15,481) | -16.7% |
| | | | | | | | | | |
| | Income taxes (benefit) | $ (138) | $ 10 | -1480.0% | | $ (121) | $ 26 | -565.4% |
| | | | | | | | | | |
| | Net loss | $ (7,027) | $ (8,203) | -14.3% | | $ (14,928) | $ (16,581) | -10.0% |
| | | | | | | | | | |
| | Basic and diluted loss per share | $ (0.14) | $ (0.16) | -12.5% | | $ (0.29) | $ (0.34) | -14.7% |
| | | | | | | | | | |
| | Balance Sheet Data | | | | | | As of
June 30,
2014 | As of
December 31,
2013 |
| | | | | | | | | | |
| | Cash and restricted cash | | | | | | $ 10,236 | $ 13,882 |
| | Total assets | | | | | | 69,628 | 85,561 |
| | Deferred revenue | | | | | | 13,544 | 9,500 |
| | Long term debt, net of discount | | | | | | 21,649 | 21,204 |
| | Total liabilities | | | | | | 48,655 | 50,540 |
| | Shareholders' equity | | | | | | 20,973 | 35,021 |
IMRIS Inc. Management’s Discussion and Analysis– August 7, 2014 Page 7 of 21 |
Revenues
Revenues by sales classification
| (Thousands of US dollars) | Three months ended | | | Six months ended | |
| | June 30 | % | | June 30 | % |
| | 2014 | 2013 | Change | | 2014 | 2013 | Change |
| | | | | | | | |
| VISIUS Surgical Theatres | $ 1,575 | $ 8,047 | -80.4% | | $ 7,050 | $ 14,311 | -50.7% |
| Extended maintenance contracts | 2,683 | 2,179 | 23.1% | | 5,359 | 3,981 | 34.6% |
| Total revenues | $ 4,258 | $ 10,226 | -58.4% | | $ 12,409 | $ 18,292 | -32.2% |
| | | | | | | | |
| VISIUS Surgical Theatres as a percentage of total revenues | 37.0% | 78.7% | | | 56.8% | 78.2% | |
| Extended maintenance contracts as a percentage of total revenues | 63.0% | 21.3% | | | 43.2% | 21.8% | |
Revenues by region
| (Thousands of US dollars) | Three months ended | | | Six months ended | |
| | June 30 | % | | June 30 | % |
| | 2014 | 2013 | Change | | 2014 | 2013 | Change |
| | | | | | | | |
| North America | $ 3,352 | $ 4,579 | -26.8% | | $ 11,252 | $ 9,580 | 17.5% |
| Europe and Middle East | 331 | 694 | -52.3% | | 239 | 3,627 | -93.4% |
| Asia Pacfic | 575 | 4,953 | -88.4% | | 918 | 5,085 | -81.9% |
| | $ 4,258 | $ 10,226 | -58.4% | | $ 12,409 | $ 18,292 | -32.2% |
Revenue for the three months ended June 30, 2014 decreased $6.0 million compared with the same period last year. Revenue from VISIUS Surgical Theaters was $6.5 million lower due to fewer system deliveries and less installation activities for projects which were at varying stages of installation. Revenue from VISIUS Surgical Theatres includes revenue from disposables and upgrades which was flat compared with the same period last year. Extended maintenance contract revenue was $0.5 million higher reflecting additional extended maintenance contracts as a result of a higher installation base of VISIUS Surgical Theatres which have transitioned off warranty to chargeable service programs.
Revenue for the six months ended June 30, 2014 decreased $5.9 million compared with the same period last year. Revenue from VISIUS Surgical Theaters was $7.3 million lower due to fewer system deliveries and reduced installation activities for active projects during the period. Revenue from VISIUS Surgical Theatres includes revenue from disposables and upgrades which was $0.3 million higher compared with the same period last year due to an increased focus on selling into the existing install base. Extended maintenance contract revenue was $1.4 million higher reflecting additional extended maintenance contracts as a result of a higher installation base of VISIUS Surgical Theatres which have transitioned off warranty to chargeable service programs.
Revenue for the three months ended June 30, 2014 was lower in North America compared with the same period last year due to fewer VISIUS Surgical Theatre system deliveries in 2014 partially offset by increased service revenue. Revenue was lower in Europe and the Middle East due less installation activities in 2014 for a project in Qatar. Revenue was lower in Asia Pacific due to a system delivery in 2013 compared with no delivery activity in 2014, partially offset by higher service revenue.
Revenue for the six months ended June 30, 2014 was higher in North America compared with the same period last year due to increased service revenue as a result of additional extended maintenance contracts, as well as higher and more installation activities. Revenue was lower in Europe and the Middle East due to a system delivery in 2013 and limited activity in 2014 as well as cost overruns resulting in revenue adjustments in 2014. Revenue was lower in Asia Pacific due to a system delivery in 2013 compared with none in 2014, partially offset by higher service revenue.
IMRIS Inc. Management’s Discussion and Analysis– August 7, 2014 Page 8 of 21 |
Gross Profit
| (Thousands of US dollars) | Three months ended | | | Six months ended | |
| | June 30 | % | | June 30 | % |
| | 2014 | 2013 | Change | | 2014 | 2013 | Change |
| | | | | | | | |
| Gross profit | $ 1,916 | $ 3,109 | -38.4% | | $ 3,841 | $ 6,129 | -37.3% |
| As a percentage of sales | 45.0% | 30.4% | | | 31.0% | 33.5% | |
Gross profit for the three months ended June 30, 2014 decreased $1.2 million compared with the same period last year due to lower revenue on fewer scheduled equipment deliveries, partially offset by increased gross profit earned from additional service contracts.
Gross profit as a percentage of sales for the three months ended June 30, 2014 was 45.0 percent, up from 30.4 percent during the same period last year. Gross profit as a percentage of sales from VISIUS Theatres was higher compared with the same period last year primarily due to lower installation costs in the period which had a more significant impact on a low revenue base in the current quarter. Gross profit as a percentage of sales from extended maintenance contracts was higher as a result of improved service experience on the customer base in the period.
Gross profit for the six months ended June 30, 2014 decreased $2.3 million compared with the same period last year due to lower revenue as a result of fewer scheduled equipment deliveries and installation activities and higher installation costs as a result of additional cost overruns on certain installations, as well as higher service costs at a customer site and not yet achieving anticipated cost synergies through operations. This impact was partially offset by increased gross profit earned from additional service contracts.
Gross profit as a percentage of sales for the six months ended June 30, 2013 was 31.0 percent, down from 33.5 percent during the same period last year. Gross profit as a percentage of sales from VISIUS Theatres was lower primarily due to higher installation costs which had a more significant impact on a low revenue base in the first six months of the year, as well as cost reductions and recoveries on a number of projects in the prior year period. Gross profit as a percentage of sales from extended maintenance contracts was higher as a result of improved service experience on the customer base in the period.
Operating Expenses
| (Thousands of US dollars) | Three months ended | | | Six months ended | |
| | June 30 | % | | June 30 | % |
| | 2014 | 2013 | Change | | 2014 | 2013 | Change |
| | | | | | | | |
| Operating expenses | $ 8,698 | $ 10,816 | -19.6% | | $ 16,742 | $ 21,610 | -22.5% |
Operating expenses for the three months ended June 30, 2014 decreased $2.1 million compared with the same period last year. The decrease is primarily due to higher transition expenses incurred in the prior year of $0.8 million related to staffing redundancies which arose from the timing of adding new employees while retaining existing employees to allow for a smoother transition of certain functions as we relocated our operations to Minnesota. The decrease is also due to higher relocation costs of $0.7 million incurred during the prior year, lower facilities expense of $0.3 million primarily due to redundant facilities in 2013, lower staff related and other expense in the current period of $0.6 million, as well as lower depreciation expense of $0.2 million due to certain assets which were in service becoming fully depreciated. The decrease was partially offset by an increase in technical development expense of $0.5 million primarily due to the favorable impact of additional research tax benefits recorded in the prior year. The relocation was substantially complete as of December 31, 2013 and we incurred substantially no relocation costs during the three months ended June 30, 2014. The relocation costs during the three months ended June 30, 2013 consisted of recruiting and staff related expenses of $0.4 million, and travel, professional fees and other expenses of $0.3 million.
Operating expenses for the six months ended June 30, 2014 decreased $4.9 million compared with the same period last year. The decrease is primarily due to higher expenses incurred in 2013 of $1.4 million related to staffing redundancies which arose from the timing of adding new employees while retaining existing employees as we relocated our operations to Minnesota. The decrease is also due to higher relocation costs of $1.4 million incurred during the prior year, lower staff related and other expense of $0.8 million, lower depreciation expense of $0.4 million due to certain assets which were in service becoming fully depreciated in 2014, lower business travel and professional fees of $0.5 million due to our cost reduction efforts, and lower facilities expense of $0.4 million primarily due to redundant facilities in 2013. The relocation was substantially complete as of December 31, 2013 and we incurred substantially no relocation costs during the six months ended June 30, 2014. The relocation costs during the six months ended June 30, 2013 consisted primarily of recruiting of $0.6 million, retention and severance costs of $0.3 million, and travel, professional services fees and other expenses of $0.3 million.
IMRIS Inc. Management’s Discussion and Analysis– August 7, 2014 Page 9 of 21 |
Administrative
| (Thousands of US dollars) | Three months ended | | | Six months ended | |
| | June 30 | % | | June 30 | % |
| | 2014 | 2013 | Change | | 2014 | 2013 | Change |
| | | | | | | | |
| Administrative | $ 1,839 | $ 2,833 | -35.1% | | $ 3,579 | $ 5,243 | -31.7% |
Administrative expense for the three months ended June 30, 2014 decreased $1.0 million compared with the same period last year. The decrease is primarily due to higher expenses incurred in 2013 of $0.3 million related to staffing redundancies which arose from the timing of adding new employees while retaining existing employees as we relocated our operations to Minnesota. The decrease is also due to higher relocation costs of $0.2 million incurred during the prior year, lower facilities expense of $0.3 million primarily due to the redundant operations facility in Canada in 2013, and lower business travel and professional fees of $0.2 million due to our cost reduction efforts. The relocation costs during the three months ended June 30, 2013 consisted of recruiting expenses of $0.1 million and staff retention and severance costs of $0.1 million.
Administrative expense for the six months ended June 30, 2014 decreased $1.7 million compared with the same period last year. The decrease is primarily due to higher expenses incurred in 2013 of $0.6 million related staffing redundancies which arose from the timing of adding new employees while retaining existing employees as we relocated our operations to Minnesota. The decrease is also due to higher relocation costs of $0.6 million incurred during the prior year, lower facilities expense of $0.2 million primarily due to the redundant Canadian facility in 2013, lower staffing and other expense of $0.2 million, and lower business travel and professional fees of $0.1 million due to our cost reduction efforts. The relocation costs during the six months ended June 30, 2013 consisted of professional services fees and other expenses of $0.3 million, recruiting expenses of $0.2 million and staff retention and severance costs of $0.1 million.
Sales and marketing
| (Thousands of US dollars) | Three months ended | | | Six months ended | |
| | June 30 | % | | June 30 | % |
| | 2014 | 2013 | Change | | 2014 | 2013 | Change |
| | | | | | | | |
| Sales and marketing | $ 2,008 | $ 2,522 | -20.4% | | $ 3,715 | $ 4,781 | -22.3% |
Sales and marketing expense for the three months ended June 30, 2014 decreased $0.5 million compared with the same period last year. The decrease is primarily related to lower staff related expense of $0.5 million as a result of lower headcount within the sales team.
Sales and marketing expense for the six months ended June 30, 2014 decreased $1.1 million compared with the same period last year. The decrease is primarily related to lower staff related expense of $0.9 million as a result of lower headcount within sales, as well as lower travel and other general expenses of $0.2 millionprimarily related to customer activities as part of our expense management efforts.
Customer support and operations
| (Thousands of US dollars) | Three months ended | | | Six months ended | |
| | June 30 | % | | June 30 | % |
| | 2014 | 2013 | Change | | 2014 | 2013 | Change |
| | | | | | | | |
| Customer support and operations | $ 2,388 | $ 2,984 | -20.0% | | $ 4,616 | $ 5,420 | -14.8% |
Customer support and operations expense for the three months ended June 30, 2014 decreased $0.6 million compared with the same period last year.The decrease is primarily due to higher relocation costs of $0.4 million incurred during the prior year, and lower staffing related and other costs of $0.2 million. The relocation costs during the three months ended June 30, 2013 consisted of recruiting expenses of $0.2 million and other expenses of $0.2 million.
Customer support and operations expense for the six months ended June 30, 2014 decreased $0.8 million compared with the same period last year.The decrease is primarily due to higher relocation costs of $0.5 million incurred during the prior year, and lower staffing related and other costs of $0.3 million. The relocation costs during the six months ended June 30, 2013 consisted of recruiting expenses of $0.2 million, staff retention and severance expenses of $0.2 million and other expenses of $0.1 million.
IMRIS Inc. Management’s Discussion and Analysis– August 7, 2014 Page 10 of 21 |
Research and development
| (Thousands of US dollars) | Three months ended | | | Six months ended | |
| | June 30 | % | | June 30 | % |
| | 2014 | 2013 | Change | | 2014 | 2013 | Change |
| | | | | | | | |
| Research and development | $ 1,761 | $ 1,534 | 14.8% | | $ 3,363 | $ 4,273 | -21.3% |
Research and development expense for the three months ended June 30, 2014 increased $0.2 million compared with the same period last year. The increase is due to the favorable impact of $0.3 million in technical expenses for additional research tax benefits recorded in the prior year. The increase is partially offset by higher relocation costs of $0.1 million incurred during the prior year. The relocation costs during the three months ended June 30, 2013 consisted of professional fees of $0.1 million.
Research and development expense for the six months ended June 30, 2014 decreased $0.9 million compared with the same period last year. The decrease is due to higher relocation costs of $0.3 million incurred during the prior year, lower technical spending of $0.3 million, and lower business, travel and other expenses of $0.3 million as a result of cost management. The relocation costs during the six months ended June 30, 2013 consisted of recruiting and other fees $0.2 million and staffing related expenses of $0.1 million.
As we move forward our product development efforts will be focused on developing and testing our image-guided surgical robotics platform and also enhancing the capabilities of the VISIUS Surgical Theatre so that we are increasing the number and quantity of traditional procedures that can be completed in our theatres. Following commercialization of our products that combine robotics and radiosurgery with the VISIUS Surgical Theatre, we expect to continue to expand the capabilities of these systems to continue to grow their value proposition
Amortization and depreciation
| (Thousands of US dollars) | Three months ended | | | Six months ended | |
| | June 30 | % | | June 30 | % |
| | 2014 | 2013 | Change | | 2014 | 2013 | Change |
| | | | | | | | |
| Amortization and depreciation | $ 702 | $ 943 | -25.6% | | $ 1,469 | $ 1,893 | -22.4% |
Amortization and depreciation expense for the three and six months ended June 30, 2014 decreased compared with the same period last year due to certain assets that were in service becoming fully depreciated in 2014.
Other income (expense)
| (Thousands of US dollars) | Three months ended | | | Six months ended | |
| | June 30 | % | | June 30 | % |
| | 2014 | 2013 | Change | | 2014 | 2013 | Change |
| | | | | | | | |
| Gain on asset disposals | $ 12 | $ - | N/M | | $ 12 | $ - | N/M |
| Foreign exchange income (loss) | 677 | (483) | -240.2% | | (33) | (1,038) | -96.8% |
| Interest and other expense | (1,072) | (3) | N/M | | (2,127) | (36) | N/M |
| N/M - Not Meaningful | | | | | | | |
Foreign exchange income for the three and six months ended June 30, 2014 increased compared with the same period last year due to a weakening of the U.S. dollar against our higher net foreign denominated monetary assets, which resulted in foreign exchange income on revaluation during the three months ended June 30, 2014 and a lower foreign exchange loss on revaluation during the six months ended June 30, 2014.
Interest and other expense for the three and six months ended June 30, 2014 is primarily a result of our secured loan facility which we entered into in September 2013, resulting in interest expense, amortization of the related deferred debt acquisition costs, and warrant discount amortization. Interest and other expense for the three months ended June 30, 2014 includes interest expense of $0.6 million, debt discount amortization of $0.3 million, debt issuance cost amortization of $0.1 million and other net interest expense and banking fees of $0.1 million. Interest and other expense for the six months ended June 30, 2014 includes interest expense of $1.2 million, debt discount amortization of $0.6 million, debt issuance cost amortization of $0.2 million and other net interest expense and banking fees of $0.1 million.
IMRIS Inc. Management’s Discussion and Analysis– August 7, 2014 Page 11 of 21 |
Income tax (benefit) provision
| (Thousands of US dollars) | Three months ended | | | Six months ended | |
| | June 30 | % | | June 30 | % |
| | 2014 | 2013 | Change | | 2014 | 2013 | Change |
| | | | | | | | |
| Income tax (benefit) provision | $ (138) | $ 10 | N/M | | $ (121) | $ 26 | N/M |
| N/M - Not Meaningful | | | | | | | |
Income tax benefit increased for the three and six months ended June 30, 2014 compared with the same period last year. We generate taxable income in several of our foreign subsidiaries due to transfer pricing policies used in those foreign jurisdictions. As a result of activities in these foreign subsidiaries, we recognize tax expense (benefit). During the three and six months ended June 30, 2014, the change in income tax (benefit) expense compared with the same period last year is primarily due to adjustments of the related tax accruals partially offset by slightly higher taxable income in those foreign jurisdictions .
Operating Loss and Net Loss
| (Thousands of US dollars) | Three months ended | | | Six months ended | |
| | June 30 | % | | June 30 | % |
| | 2014 | 2013 | Change | | 2014 | 2013 | Change |
| | | | | | | | |
| Operating loss | $ (6,782) | $ (7,707) | -12.0% | | $ (12,901) | $ (15,481) | -16.7% |
| | | | | | | | |
| Net loss | $ (7,027) | $ (8,203) | -14.3% | | $ (14,928) | $ (16,581) | -10.0% |
Operating loss for the three months ended June 30, 2014 decreased $0.9 million compared with the same period last year due to lower operating expenses of $2.1 million primarily tied to transition related activities in 2013, offset by lower gross profit of $1.2 million, each as described above. Operating expenses for the three months ended June 30, 2013 included $0.8 million of relocation costs which were recorded within the affected functional area, primarily including administrative expense of$0.2 million, customer support and operations expense of $0.4 million and research and development expense of $0.1 million.
Net loss for the three months ended June 30, 2014 decreased $1.2 million compared with the same period last year. The decrease in net loss was due to the operating loss decrease of $0.9 million, foreign exchange income increase $1.2 million and tax benefit of $0.2 million, partially offset by higher interest expense of $1.1 million, each as described above.
Operating loss for the six months ended June 30, 2014 decreased $2.6 million compared with the same period last year due to lower operating expenses of $4.9 million, offset by lower gross profit of $2.3 million, each as described above. Operating expenses for the six months ended June 30, 2013 included $1.5 million of relocation costs which were recorded within the affected functional area, including administrative expense of $0.6 million, customer support and operations expense of $0.6 million and research and development expense of $0.3 million.
Net loss for the six months ended June 30, 2014 decreased $1.7 million compared with the same period last year. The decrease in net loss was due to the operating loss decrease of $2.6 million, foreign exchange income increase of $1.0 million and tax benefit of $0.2 million. This was partially offset by higher interest expense of $2.1 million, each as described above.
IMRIS Inc. Management’s Discussion and Analysis– August 7, 2014 Page 12 of 21 |
Adjusted EBITDA
| (Thousands of US dollars) | Three months ended | | | Six months ended | |
| | June 30 | % | | June 30 | % |
| | 2014 | 2013 | Change | | 2014 | 2013 | Change |
| | | | | | | | |
| Adjusted EBITDA | $ (5,676) | $ (6,260) | -9.3% | | $ (10,592) | $ (12,632) | -16.1% |
We use the non-GAAP measure Adjusted EBITDA to measure aspects of our financial performance (see “Non-GAAP Financial Measures” for a reconciliation of adjusted EBITDA to GAAP measures). The Company defines Adjusted EBITDA as earnings (loss) before stock based compensation, gain (loss) on asset disposals, interest income (expense), foreign exchange gain (loss), income taxes and amortization and depreciation.
Adjusted EBITDA for the three months ended June 30, 2014 was negative $5.7 million, compared with negative $6.3 million for the same period last year. The improvement in Adjusted EBITDA was primarily due to lower operating expenses, partially offset by lower gross profit.
Adjusted EBITDA for the six months ended June 30, 2014 was negative $10.6 million, compared with negative $12.6 million for the same period last year. The improvement in Adjusted EBITDA was primarily due to lower operating expenses, partially offset by lower gross profit.
IMRIS Inc. Management’s Discussion and Analysis– August 7, 2014 Page 13 of 21 |
SUMMARY OF QUARTERLY RESULTS
The following table is a summary of our financial results for the past eight quarters:
| | | | | | | | | | | |
| | | | | | | | | | |
| (Thousands of US dollars) | Q2 | Q1 | Q4 | Q3 | Q2 | Q1 | Q4 | Q3 |
| | 2014 | 2014 | 2013 | 2013 | 2013 | 2013 | 2012 | 2012 |
| | | | | | | | | | |
| Sales | $ 4,258 | $ 8,151 | $ 9,985 | $ 17,765 | $ 10,226 | $ 8,066 | $ 20,095 | $ 11,569 |
| Cost of sales | | 2,342 | 6,226 | 7,222 | 10,984 | 7,117 | 5,046 | 13,100 | 8,818 |
| Gross profit | | 1,916 | 1,925 | 2,763 | 6,781 | 3,109 | ��3,020 | 6,995 | 2,751 |
| As a percentage of sales | 45.0% | 23.6% | 27.7% | 38.2% | 30.4% | 37.4% | 34.8% | 23.8% |
| | | | | | | | | | |
| Operating expenses | | | | | | | | |
| | Administration | 1,839 | 1,740 | 4,803 | 2,280 | 2,833 | 2,410 | 2,664 | 2,000 |
| | Sales and marketing | 2,008 | 1,707 | 2,905 | 2,300 | 2,522 | 2,259 | 2,785 | 2,427 |
| | Customer support and operations | 2,388 | 2,228 | 3,048 | 2,889 | 2,984 | 2,436 | 3,062 | 2,007 |
| | Research and development | 1,761 | 1,602 | 11,211 | 2,339 | 1,534 | 2,739 | 3,729 | 3,840 |
| | Amortization | 702 | 767 | 630 | 963 | 943 | 950 | 1,071 | 1,067 |
| | | 8,698 | 8,044 | 22,597 | 10,771 | 10,816 | 10,794 | 13,311 | 11,341 |
| | | | | | | | | | |
| Operating loss before the following: | (6,782) | (6,119) | (19,834) | (3,990) | (7,707) | (7,774) | (6,316) | (8,590) |
| | Foreign exchange | 677 | (710) | (557) | 387 | (483) | (555) | (232) | 118 |
| | Interest | (1,072) | (1,055) | (992) | (195) | (3) | (33) | (55) | - |
| | Loss (gain) on sale of asset disposal | 12 | - | (120) | - | - | - | 19 | - |
| Loss before taxes | $ (7,165) | $ (7,884) | $ (21,503) | $ (3,798) | $ (8,193) | $ (8,362) | $ (6,584) | $ (8,472) |
| | | | | | | | | | | |
| Income tax (benefit) provision | (138) | 17 | 112 | 6 | 10 | 16 | 20 | 48 |
| | | | | | | | | | | |
| Net loss for the quarter | $ (7,027) | $ (7,901) | $ (21,615) | $ (3,804) | $ (8,203) | $ (8,378) | $ (6,604) | $ (8,520) |
| | | | | | | | | | |
| Loss per share | | | | | | | | | |
| | Basic | | $ (0.14) | $ (0.15) | $ (0.42) | $ (0.07) | $ (0.16) | $ (0.18) | $ (0.14) | $ (0.19) |
| | Diluted | | $ (0.14) | $ (0.15) | $ (0.42) | $ (0.07) | $ (0.16) | $ (0.18) | $ (0.14) | $ (0.19) |
| | | | | | | | | | | |
The financial results for the eight most recent quarters reflect the progression of an early stage company with a limited operating history. Factors that have caused our results to vary are described below.
| • | As a result of the limited number of VISIUS Surgical Theatres sold and installed to date and the high dollar value associated with each sale, our revenues recorded from quarter to quarter have varied depending on the number and stage of active projects in any given quarter. |
| • | Gross profit and gross profit as a percentage of sales for the VISIUS Surgical Theatre are largely dependent on whether a particular product application has achieved acceptance amongst clinical thought leaders. The past few years have included a number of research related projects which are focused on new product applications. Due to the nature of these programs, gross profit as a percentage of sales have been negatively impacted in certain quarters as installation activities take place. The more mature applications which have clinical data such as the neurosurgical application of the VISIUS Surgical Theatre, have generally carried stronger gross profit margins compared with newer clinical applications and recently released imaging modalities. |
| • | The increase in margins in the second quarter of 2014 reflects improving margin profiles on programs and service performance in the period. The decrease in margins in the first quarter of 2014 and fourth quarter of 2013 is primarily tied to the delivery of certain research systems to customers as well as additional costs related to the delivery of the first clinical VISIUS iCT and latest generation MR systems. The decrease in gross margins in the third quarter of 2012 is mainly due to higher installation costs and the provision of certain equipment for research purposes and lower margins for the Company’s first customer installation in Japan. |
| • | Net losses generally vary depending on the timing of when specific projects were installed and the pricing associated with the respective projects. Net losses in all periods have largely been the result of lower product installations and planned increases in research and development activity for our MRgRT program and the robotics program and additional product costs related to new product installations. |
IMRIS Inc. Management’s Discussion and Analysis– August 7, 2014 Page 14 of 21 |
| • | Operating expenses during the fourth quarter of 2012 and all of 2013 reflect costs related to the relocation of our operations from Winnipeg, Canada to Minneapolis, Minnesota, including additional efforts to recruit qualified personnel and severance and retention, along with costs related to duplicate facilities and the eventual accrual for the discontinued use of our Winnipeg facility when it was vacated. Additionally, research and development expenses in the fourth quarter of 2013 reflect charges of $8.3 million related to the planned completion of the collaborative arrangement clinical MRgRT system. |
| • | Although the majority of our sales are denominated in U.S. dollars, we sell our VISIUS Surgical Theatres in a variety of foreign currencies. This gives rise to foreign exchange gains or losses each quarter depending on the change in value of the U.S. dollar versus these foreign currencies in each quarter. |
| • | We generated taxable income in several of our foreign subsidiaries because of our transfer pricing methodology. As a result, we recognize tax expense related to these subsidiaries when appropriate. |
Backlog
During the three months ended June 30, 2014, total order bookings were $22.6 million, consisting of $17.3 million for systems bookings and $5.3 million for new service contracts.We converted $4.3 million of backlog into revenues and changes in foreign exchange were insignificant in the period. We evaluate our backlog and individual order conversion on a regular basis and our experience is that orders typically convert into revenues over 12 to 18 months on average.
The table below provides the Company’s backlog as of June 30, 2014 and its comparable periods for each of the last three years as of December 31:
| | December 31, 2011 | December 31, 2012 | December 31, 2013 | March 31, 2014 | June 30, 2014 |
| | (Thousands of U.S. dollars) | |
| VISIUS Surgical Theatres | $ 58,583 | $ 69,213 | $ 40,517 | $ 46,744 | $ 62,188 |
| Service contracts | 36,430 | 53,326 | 61,881 | 63,633 | 66,484 |
| Total backlog | $ 95,013 | $ 122,539 | $ 102,398 | $ 110,377 | $ 128,672 |
To June 30, 2014, we have sold our products into 87 surgical suites and 52 diagnostic rooms to 61 customers worldwide, of which 67 surgical suites are installed and 20 are in the delivery phase. Of the surgical suites sold, 60 are in the United States, 6 are in Canada, 16 are in Asia Pacific and 5 are in Europe and the Middle East.
We use the non-GAAP measure “backlog” to measure aspects of our financial performance. Backlog is defined as the unrecognized portion of (i) revenues anticipated to be recorded from VISIUS Surgical Theatre orders, including confirmed orders and orders subject to the completion of formal documentation and (ii) service contracts with a term of 4 to 5 years and which commence at the conclusion of the warranty period on our VISIUS Surgical Theatres, which are typically 1 year in length. Service contract revenue is recognized ratably over the term of the contract.
OUTLOOK
Our priorities for managing the business in 2014 are:
Convert Prospects to Purchase Orders - Our primary focus in 2014 is on improving our order bookings performance and working to convert our large base of qualified customer prospects to new sales orders. The plan includes leveraging our existing product platform and its proven clinical value proposition, and exploiting new product offerings such as the new state of the art MR imaging modalities from our OEM partner Siemens. The introduction of the VISIUS iCT has further expanded our potential customer base as the spine market it serves is significantly larger than the neurosurgery market with a significantly reduced cost and complexity to a customer to procure and install. The introduction of the multi-source pricing strategy is also gaining traction as a number of new order bookings recorded to date are the direct result of this strategy. We believe the clinical benefits of our systems and the broadening of our market with these new product offerings and pricing strategies will contribute to strengthened bookings.
IMRIS Inc. Management’s Discussion and Analysis– August 7, 2014 Page 15 of 21 |
Deliver on Revenue - Conversion of our order backlog is key to meeting our revenue goals. Traditionally our installation timelines for any given customer are often in excess of a year or more, so our ability to influence the timing of such installations and its corresponding revenue is often not in our control. With the introduction of the VISIUS iCT, the complexity of installation has been reduced, providing us with an opportunity to take an order and deliver it within a three to six month timeframe. This changes our ability to influence our revenue opportunity and reduce the execution risk associated with more complex installations. We have also taken positive steps to increase our recurring revenue - we have continued to increase our installed base covered under service contracts, identified capital equipment options upgrades for our existing customers and recently introduced and launched a new line of disposable products. The introduction of disposables gives us the ability to take advantage of our growing procedural volume within our installed base, allowing us to drive consistent revenues and providing opportunities to maintain relationships with our customers we did not have before.
Manage our Cash - The transition of our operations from Canada to the U.S. and the costs to complete our research programs in robotics and our MRgRT system required a significant capital commitment in 2013. With most of these activities largely completed, our focus in 2014 is to drive the business to be cash flow neutral including cost reduction activities, gross margin expansion through active management of our customer programs and supply chain, generating cash deposits on new order bookings and driving system order book and bill business that generates 2014 in period cash flows. We have commenced and undertaken a number of initiatives, some of which have already shown to be providing results with the goal of becoming a self-sustaining business.
New Product Development
We continue to make significant progress with the development of the SYMBIS Surgical System, the world's first commercialized MR compatible surgical robot. Our first pre-clinical commercial version of the system is expected to be delivered in the latter half of 2014 at the University of Calgary, Foothills hospital. We expect this to be our initial clinical validation site under the direction of Dr. Garnette Sutherland, who is a member of our clinical advisory board. We expect that this microsurgical version of the robot will follow a 510(k) process and may require clinical trial data for evaluation.
Financial Outlook
Revenues
Our revenue success remains largely dependent on our ability to convert existing backlog into recognized revenue on a timely basis. Our ability to complete installations and recognize revenue of a timely basis is directly influenced by the circumstances of each hospital where unique customer circumstances can influence the schedule.
A reduction in the order backlog in 2013, particularly in new systems orders, has had a negative impact on our ability to convert that backlog into revenues in 2014. We believed we would be able to mitigate some of the shortfall in the conversion of 2013 backlog with the introduction of new revenue sources in iCT systems orders, upgrades and disposables, but given the progression of certain customer prospects, our ability to deliver more immediate revenue opportunities in 2014 are limited. As a result, we now expect 2014 full year revenues in the range of $30 million to $34 million. As we review our current order pipeline, we are optimistic about continuing to build our order backlog in 2014 that can be converted into 2015 revenues, and as a result we expect revenues in 2015 to be in the range of $60 million to $65 million.
IMRIS’s quarterly revenue profile varies depending on the underlying system installations in each period. We anticipate that Q3 2014 revenues will be in the $6 million to $7 million range, and similar to prior years, the strongest quarterly revenue performance will once again occur in the second half of 2014.
Gross Profit
While we continue to expect improved gross profit performance from the prior year, due to the shortfall in the revenue outlook described above, we now expect full year gross profit as a percentage of sales of approximately 35 percent to 36 percent. Quarterly gross profit as a percentage of sales will vary depending on the underlying system installations in each quarter.
Operating Expenses
Carefully managing expenses is a priority for our Company and in 2014 we continue to expect our departmental cash operating expenses to decrease approximately $7 million from 2013 levels to approximately $27 million.
Total research and development expenses are anticipated to be approximately $6.5 million. This is a significant decrease from prior year as 2013 included the impact of $8.3 million in charges related to completion of the collaborative arrangement with Princess Margaret Hospital for their clinical MRgRT system, relocation costs, and costs for technical development associated with image-guided surgical robotics, which are substantially complete.
Taken together, we anticipate total cash and non-cash operating expenses in 2014 to be approximately $33 million, as summarized below:
IMRIS Inc. Management’s Discussion and Analysis– August 7, 2014 Page 16 of 21 |
| 2014 Forecast | $ Millions |
| Cash operating expenses | $ 27.0 |
| Amortization and depreciation (non-cash) | 4.0 |
| Stock based compensation (non-cash) | 2.0 |
| Total operating expenses | $ 33.0 |
Liquidity and Capital Resources
With cash, restricted cash and accounts receivable at June 30, 2014 of $16.9 million and order backlog of $128.7 million, we believe we have a good base from which to continue to build the business.
Cash, restricted cash and accounts receivable at December 31, 2013 were $27.9 million. Our cash requirements in 2014 include funding for operations, and capital investments related to the development test lab in the Minnetonka facility. Our total capital expenditures for the year are expected to be approximately $2.5 million this year.
LIQUIDITY AND CAPITAL RESOURCES
Our principal capital needs are for funding scientific research and development programs, supporting our sales and marketing activities and funding capital expenditures and working capital. We have financed our cash requirements primarily through long term debt, issuances of securities and advanced customer deposits from new orders.
The following table sets forth the summary statement of cash flows for the dates and periods indicated:
| | | |
| | | Six months ended |
| | | June 30 |
| | | 2014 | 2013 | Change |
| Cash flows: | | | |
| | Used in Operating Activities | $ (2,277) | $ (21,560) | $ 19,283 |
| | From Financing Activities | 500 | 18,666 | (18,166) |
| | Used in Investing Activities | (1,870) | (3,253) | 1,383 |
| | Foreign exchange translation adjustment | 1 | 751 | (750) |
| Net decrease | (3,646) | (5,396) | 1,750 |
| | | | | |
| Cash and cash equivalents, opening | 6,382 | 19,060 | |
| Cash and cash equivalents, closing | $ 2,736 | $ 13,664 | $ (10,928) |
Operating Activities
The cash used in operating activities for the six months ended June 30, 2014 was $2.3 million. The cash used in operating activities was comprised of an operating loss (excluding non-cash related items) of $11.8 million partially offset by cash provided by changes in working capital of $9.5 million. The cash provided by changes in working capital consists of a decrease in accounts receivable of $7.3 million, a decrease in unbilled receivables of $4.2 million, a decrease in inventory of $1.0 million, and an increase in deferred revenue of $4.0 million, partially offset by a decrease in accounts payable of $6.7 million and a decrease in prepaid expense of $0.4 million.
Financing Activities
The cash provided by financing activities for the six months ended June 30, 2014 was $0.5 million compared with $18.7 million in the same period last year. Cash provided by financing activities of $0.5 million is the result of a loan agreement with the City of Minnetonka and the Minnesota Department of Employment and Economic Development. The cash generated in financing activities during the six months ended June 30, 2013 included net proceeds from the issuance of share capital of $18.5 million along with cash from employee share options being exercised of $0.2 million.
IMRIS Inc. Management’s Discussion and Analysis– August 7, 2014 Page 17 of 21 |
Investing Activities
The cash used in investing activities for the six months ended June 30, 2014 was $1.9 million compared with $3.3 million in the same period last year. Investing activities include acquisition of tangible and intangible capital assets of $1.9 million.
Liquidity and Capital Resources Summary
Our cash and restricted cash as of June 30, 2014 totaled $10.2 million. Our primary sources of liquidity include cash deposits and cash flows generated by the sale of our products. Our primary operating liquidity needs relate to our costs of goods sold and general operating expenses. Our cash position combined with our planned operating performance and expected other sources of liquidity is expected to provide sufficient liquidity to meet the anticipated needs of current operations and existing projects and budgeted capital asset expenditures.
OUTSTANDING SHARE DATA
The following table sets forth our outstanding share data as of the dates given:
| | Authorized | August 7, 2014 | December 31, 2013 |
Common shares | unlimited | $166,959,000 (52,030,966 common shares) | $166,959,000 (52,030,966 common shares) |
| Preferred shares | unlimited | Nil | Nil |
| Additional paid-in capital | | $12,177,000 | $11,337,000 |
As of August 7, 2014, a total of 4,551,365 stock options were outstanding under the Company’s stock option plan.
NON-GAAP FINANCIAL MEASURES
In this MD&A, we use the non-GAAP measure “Backlog” and "Adjusted EBITDA". We define backlog as the unrecognized portion of the revenues anticipated to be recorded from VISIUS Surgical Theatre orders, including confirmed orders and orders subject to completion of formal documentation and the unrecognized portion of service contracts which have a term of 4-5 years commencing at the conclusion of the warranty period on our theatres, which is typically one year in length. In view of the long sales cycle, high unit price and limited quarterly installations that are characteristic of our business, we believe that our backlog provides a better measure at any particular point in time of the long-term performance prospects of our business than our quarterly operating results. Backlog does not have any standardized meaning prescribed by U.S GAAP and is, therefore, unlikely to be comparable to similar measures presented by other companies.
We define Adjusted EBITDA as earnings before stock based compensation, gain on asset disposals, interest and other, foreign exchange income (expense), income tax (benefit) provision, and amortization and depreciation. We report Adjusted EBITDA because we believe investors use it as another measure of our operating performance. Adjusted EBITDA does not have a standardized meaning as prescribed by U.S. GAAP and it is not necessarily comparable to similarly titled measures used by other companies.
IMRIS Inc. Management’s Discussion and Analysis– August 7, 2014 Page 18 of 21 |
Reconciliation to the most comparable U.S. GAAP measure for Adjusted EBITDA is as follows:
| (Thousands of US dollars) | Three months ended | Six months ended |
| (Unaudited) | June 30 | June 30 |
| | 2014 | 2013 | 2014 | 2013 |
| | | | | |
| Net loss | $ (7,027) | $ (8,203) | $ (14,928) | $ (16,581) |
| Stock based compensation | 404 | 504 | 840 | 956 |
| Gain on asset disposals | (12) | - | (12) | - |
| Foreign exchange | (677) | 483 | 33 | 1,038 |
| Interest and other | 1,072 | 3 | 2,127 | 36 |
| Amortization and depreciation | 702 | 943 | 1,469 | 1,893 |
| Income tax (benefit) provision | (138) | 10 | (121) | 26 |
| Adjusted EBITDA | $ (5,676) | $ (6,260) | $ (10,592) | $ (12,632) |
FINANCIAL INSTRUMENTS
Our financial instruments consist of cash, cash equivalents, accounts receivables, unbilled receivables, and accounts payable and accrued liabilities.
We are subject to credit risk with respect to our accounts receivable and unbilled receivables to the extent debtors do not meet their obligations and we are subject to foreign exchange risk with respect to financial instruments denominated in a currency other than the U.S. dollar.
Our accounts receivable at June 30, 2014 were $6.6 million, of which $4.3 million is considered current (less than 60 days old). Accounts receivable includes $1.7 million denominated in a currency other than the U.S. dollar.
RELATED PARTY TRANSACTIONS
During the three months ended March 31, 2013, we leased air travel time from a corporation that is controlled by the Chairman of IMRIS Inc. There have been no charges for the three and six months ended June 30, 2014. The amount charged to travel expenses during the three and six months ended June 30, 2013 with respect to transactions with this related party totaled $0 and $55. As of June 30, 2014 and December 31, 2013 there were no receivable or payable balances owing to this corporation.
CRITICAL ACCOUNTING POLICIES AND ESTIMATES
Use of Estimates
The preparation of financial statements in accordance with U.S. GAAP requires us to make estimates and assumptions that affect the reported amounts of assets and liabilities and disclosures of contingent assets and liabilities at the date of the financial statements and the reported amounts of revenues and expenses during the year. Among the accounting estimates described in the notes to the financial statements, we consider the accounting estimates used in the determination of recognized revenues, the value of goodwill and the valuation of stock options to be critical. Our results as determined by actual events could differ materially from the previously mentioned estimates.
Revenue Recognition
We recognize revenues for our VISIUS Surgical Theatre sales on a percentage-of-completion basis as the theatre is installed. The percentage-of-completion is determined by the ratio of actual costs incurred to date to the estimated cost of completion for the project. Actual costs include only those costs that are directly attributable to contract performance with respect to the revenue recognized. In the event that the actual costs of completion differ from the estimated cost we have used in determining the percentage-of-completion, recognized revenues may be over or under-estimated until all costs have been incurred and the project is complete. Funds received from our customers in advance of meeting the criteria for recognition of revenues are recorded as deferred revenue until the revenue is recognized. Revenues recognized in advance of the criteria for invoicing to our customer are recorded as unbilled receivables. Accordingly, the reported amounts shown on the balance sheet under deferred revenue or unbilled receivables may be over or understated.
IMRIS Inc. Management’s Discussion and Analysis– August 7, 2014 Page 19 of 21 |
Value of Goodwill
We recorded goodwill on the purchase of the assets of a predecessor company. The value of goodwill is tested for impairment annually or more frequently, if an event or circumstance occurs which we feel may result in an impairment of the value of goodwill.
During the three months ended June 30, 2014, the Company’s stock price declined from $1.58 USD per share at April 1, 2014 to $1.13 USD per share at June 30, 2014, resulting in a market capitalization reduction of approximately $23.4 million ending in a market capitalization at June 30, 2014 of approximately $58.8 million. As a result, we performed an assessment to determine if this stock price decline was a triggering event that required further impairment testing. We considered, among other things, the excess of the market capitalization of the Company as of June 30, 2014 over the Company’s net assets. Based on our assessment, we believe there to be no triggering event requiring further impairment testing at this time.
Stock Based Compensation Plan
From time to time we issue stock options to employees, directors, officers or consultants. The Company measures compensation expense at the date of granting stock options to employees and recognizes the expense based on their fair values determined in accordance with the U.S. GAAP codification Accounting Standards Codification 718. The fair value of options is determined using the Black-Scholes option-pricing model. The fair value amount is amortized to earnings over the vesting period, with the related credit recorded as additional paid-in capital. Amortization takes into consideration estimated forfeitures, determined on a historical basis, at the time of grant to determine the number of awards that will ultimately vest. Upon exercise of these stock options, amounts previously credited to additional paid-in capital are reversed and credited to share capital.
FUTURE ACCOUNTING STANDARDS
On May 28, 2014, the Financial Accounting Standards Board (“FASB”) issued authoritative guidance (ASU 2014-09), Revenue from Contracts with Customers, a standard convergence project with the International Accounting Standards Board (“IASB”). The guidance will replace most existing revenue recognition guidance in U.S. GAAP when it becomes effective. The new standard is effective for us on January 1, 2017. Early application is not permitted. The standard permits the use of either the retrospective or cumulative effect transition method. We are evaluating the effect the guidance will have on our consolidated financial statements and related disclosures. We have not yet selected a transition method nor have we determined the effect of the standard on our ongoing financial reporting.
DISCLOSURE AND INTERNAL CONTROLS
We have established and maintain disclosure controls and procedures in order to provide reasonable assurance that material information relating to IMRIS is made known in a timely manner. We have evaluated the effectiveness of our disclosure controls and procedures as of the date of our 2013 Financial Statements and are not aware of any material changes that are required to be made to these controls and procedures; we believe them to be effective in providing such reasonable assurance.
We are also responsible for the design of our internal controls over financial reporting (ICFR) in order to provide reasonable assurance regarding the reliability of financial reporting and the preparation of financial statements for external purposes in accordance with U.S. GAAP. Management used the framework established inInternal Control-Integrated Framework (1992) issued by the Committee of Sponsoring Organizations of the Treadway Commission (COSO) to evaluate the effectiveness of internal controls in fiscal 2013, based on this evaluation management concluded that our internal control over financial reporting was effective as of December 31, 2013. The Company’s independent registered public accounting firm, Deloitte & Touche LLP, has issued an unqualified opinion on the Company’s internal controls over financial reporting as of December 31, 2013.
As of the date of this report, there have been no changes to the Company’s internal controls over financial reporting that materially affect, or are reasonably likely to materially affect, its internal controls over financial reporting.
In compliance with rules of the Canadian Securities Administration and the U.S. Securities and Exchange Commission, we have filed certificates signed by our Chief Executive Officer (‘‘CEO’’) and Chief Financial Officer (‘‘CFO’’) regarding the effectiveness of our disclosure controls and our internal controls over financial reporting. It should be noted however, that while the Company’s CEO and CFO believe the organization’s disclosure controls and internal controls over financial reporting are effective any system of internal control has inherent limitations and cannot prevent all errors or fraud. Even systems determined to be effective can provide only reasonable assurance of the reliability of financial statement preparation and presentation.
IMRIS Inc. Management’s Discussion and Analysis– August 7, 2014 Page 20 of 21 |
RISKS AND UNCERTAINTIES
The operating results, business prospects and financial position of the Company are subject to a number of risks and uncertainties.Risks relating to our business include: our long sales cycle; high unit price and limited quarterly installations; our limited operating history and accumulated deficit; our lack of product diversity; our dependence on our suppliers; the development of VISIUS Surgical Theatres for cardiovascular, cerebrovascular and spinal procedures; market competition and technological advances; patent protection and trade secrets; intellectual property litigation; our ability to shift from research and development to commercialization; our ability to manage growth; foreign exchange fluctuations; additional financing requirements; our ability to achieve the synergies expected as part of our relocation to Minnesota; and regulatory mattersas well as various factors set forth from time to time.
Our common stock has been and is likely to continue to be volatile, and an investment in our common stock could decline in value. During the three months ended June 30, 2014 and since, on several days our common stock’s closing price on the NASDAQ was less than $1.00 per share. If our common stock price closes below $1.00 per share for thirty consecutive days, we may receive notification from the NASDAQ that our common stock will be delisted from the exchanges unless the stock closes at or above $1.00 per share for at least ten consecutive days during the 90-day period following such notification, the result being that our common stock might be delisted, which could adversely affect the liquidity and price of our common stock and which could have a long-term impact on our ability to raise future capital through the sale of our common stock.
We evaluate assets on our balance sheet, including intangible assets and goodwill, annually as of November 30 or whenever events or changes in circumstances indicate that their carrying value may not be recoverable. We monitor factors or indicators, such as unfavorable variances from forecasted cash flows, established business plans or volatility inherent to external markets and industries that would require an impairment test. The test for impairment of tangible and intangible assets requires a comparison of the carrying value of the asset or asset group with their estimated undiscounted future cash flows. The test for impairment of goodwill requires a comparison of the carrying value of the goodwill with its estimated fair value. If the carrying value of the asset or asset group is considered impaired, an impairment charge is recorded for the amount by which the carrying value of the asset or asset group exceeds its fair value. Negative or uncertain global economic conditions could result in circumstances such as a sustained decline in our stock price and market capitalization and/or a decrease in our forecasted cash flow such that they are insufficient, indicating that the carrying value of our acquired goodwill may be impaired. If we are required to record a significant charge to earnings because an impairment of our acquired goodwill is determined, our results of operations will be adversely impacted.
During the three months ended June 30, 2014, the Company’s stock price declined from $1.58 USD per share at April 1, 2014 to $1.13 USD per share at June 30, 2014, resulting in a market capitalization reduction of approximately $23.4 million ending in a market capitalization at June 30, 2014 of approximately $58.8 million. As a result, we performed an assessment to determine if this stock price decline was a triggering event that requires further impairment testing. Based on our assessment, we believe there to be no triggering event requiring further impairment testing at this time.
There has been no other material change in risks since our Form 40-F for the year ended December 31, 2013. If any of the events described as risks or uncertainties actually occurs, our business, prospects, financial condition and operating results would likely suffer, possibly materially. For a more comprehensive list of the risks and uncertainties affecting the business, readers are advised to refer to our 2013 Annual Information Form (AIF). The AIF and Base Shelf are available at www.sedar.com and on the United States Securities and Exchange Commission (SEC) website at www.sec.gov. The AIF is located in the Company’s Annual Report on Form 40-F. - see Item 3.2Risks Related to Our Business.
ADDITIONAL INFORMATION
Additional information about IMRIS, including our annual information form, can be found on the SEDAR website at www.sedar.com or the United States Securities and Exchange Commission (SEC) website at www.sec.gov.
IMRIS Inc. Management’s Discussion and Analysis– August 7, 2014 Page 21 of 21 |