
The Fresh Market Investor Day Analyst Day October 8, 2014
This presentation contains, and statements made by The Fresh Market’s executives may contain, forward-looking statements. Any statements that are not statements of historical fact should be considered forward-looking statements. These forward-looking statements are based on Management’s current expectations and beliefs, as well as a number of assumptions, estimates and projections concerning future events and do not constitute guarantees of future performance. These statements are subject to risks, uncertainties, changes in circumstances, assumptions and other important factors, many of which are outside Management’s control, that could cause actual results to differ materially from the results discussed in the forward-looking statements. Such factors include, but are not limited to: our ability to successfully implement our growth strategy on a timely basis; the burden new stores may place on our existing resources; the competitive nature of our business; our ability to anticipate and/or react to changes in customer demand; changes in consumer confidence and spending; customer perceptions regarding food safety; commodity, energy, and fuel cost increases; our ability to maintain cybersecurity, including with respect to customer information; order errors or product supply disruptions relating to our perishable goods; disruptions in our relationship with certain key third-party vendors and other risks detailed in our filings with the SEC. You are cautioned not to put undue reliance on such forward-looking statements because actual results may vary materially from those expressed or implied. All forward- looking statements are based on information available to Management on this date, and The Fresh Market, Inc. assumes no obligation to, and expressly disclaims any obligation to, update or revise any forward-looking statements, whether as a result of new information, future events or otherwise. Forward Looking Statement
This presentation also contains references to Earnings Per Diluted Share on an adjusted basis ("Adjusted Diluted EPS") and Earnings Before Interest, Taxes, Depreciation and Amortization on an adjusted basis (“Adjusted EBITDA”). Adjusted Diluted EPS and Adjusted EBITDA are non-GAAP financial measures. Management believes that Adjusted Diluted EPS and Adjusted EBITDA are commonly reported by issuers and widely used by investors as indicators of a company’s operating performance. In addition, management believes that Adjusted Diluted EPS is helpful to investors because it allows more meaningful period-to- period comparisons. These and other non-GAAP financial measures, while providing useful information, should not be considered in isolation or as a substitute for The Fresh Market's net earnings as an indicator of operating performance. Investors should carefully consider the specific items included in our computations of Adjusted Diluted EPS and Adjusted EBITDA. Adjusted Diluted EPS and Adjusted EBITDA do not have any standardized meaning prescribed by GAAP and, therefore, are unlikely to be comparable to similar measures presented by other companies. A reconciliation between Adjusted Diluted EPS and Earnings Per Diluted Share, a U.S. GAAP financial measure, and between Adjusted EBITDA and Net Income, a GAAP financial measure, is included in the last slide of this presentation. Non-GAAP Financial Measures

Agenda Management Presentation: 10:30 am – 12:00 pm – The Fresh Market: “Positioned to Win” – Craig Carlock, President & Chief Executive Officer – Consumer Research Insights and Opportunities – Chris Miller, VP Strategy & Marketing – Merchandising Overview – Marc Jones, SVP Chief Merchandising & Supply Chain Officer – Real Estate Strategy – Randy Young, SVP Real Estate & Development – Financial Overview - Jeff Ackerman, EVP & Chief Financial Officer Q&A Concluding Remarks
The Fresh Market: “Positioned to Win” Craig Carlock President & Chief Executive Officer

Today’s Key Themes The Fresh Market Provides a Unique and Differentiated Grocery Shopping Experience Successfully Compete Head-to-Head Across Markets Robust Store Unit Growth Opportunities in Existing and New Markets Structural and Operational Initiatives = Strong Operating Margin Opportunities

A History of Steady Growth • Store Unit Growth • Comparable Store Sales Growth • Balanced Transaction / Basket Growth Strong Annual Sales Growth • Attractive Operating Margins • Leverage Growth to Realize Economies of Scale • On-going Improvement Processes and Systems Operational Discipline Drives Earnings 1. Adjusted EBITDA excludes certain IPO and secondary transaction expense in 2010-2012 and excludes impairment charges for certain real estate and store related assets in 2013. A reconciliation between Adjusted EBITDA and Net Income is included later in this presentation. 05 06 07 08 09 10 11 12 13 05 06 07 08 09 10 11 12 13 Sales ($ Million) Adjusted EBITDA ($ Million)1

Distinct Market Position Customer View Unique, Enjoyable Shopping Experience High Quality & Curated Product Selection Strong Assortment of Fresh Perishables Stimulating Sense of Discovery Convenient, Relaxing Atmosphere High-touch Customer Service Customer Profile Customer Priorities 1. Fresh 2. Convenience 3. Value Medium Income and Higher Well-Educated Seek High Quality to Price Ratio, Not Just Low Absolute Prices Desire a Deeper Engagement with Food Enjoy More Inspiring Eating Experiences Source: TFM 2014 quantitative consumer study (n=3,549) conducted by The Hartman Group
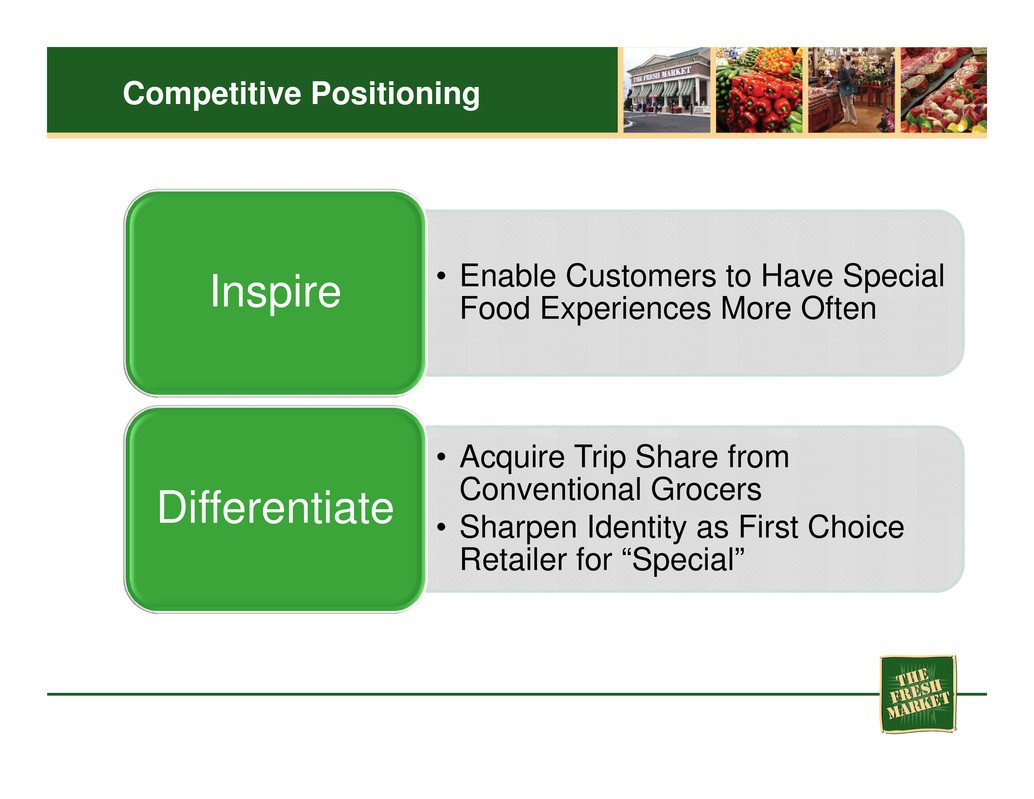
Competitive Positioning • Enable Customers to Have Special Food Experiences More OftenInspire • Acquire Trip Share from Conventional Grocers • Sharpen Identity as First Choice Retailer for “Special” Differentiate
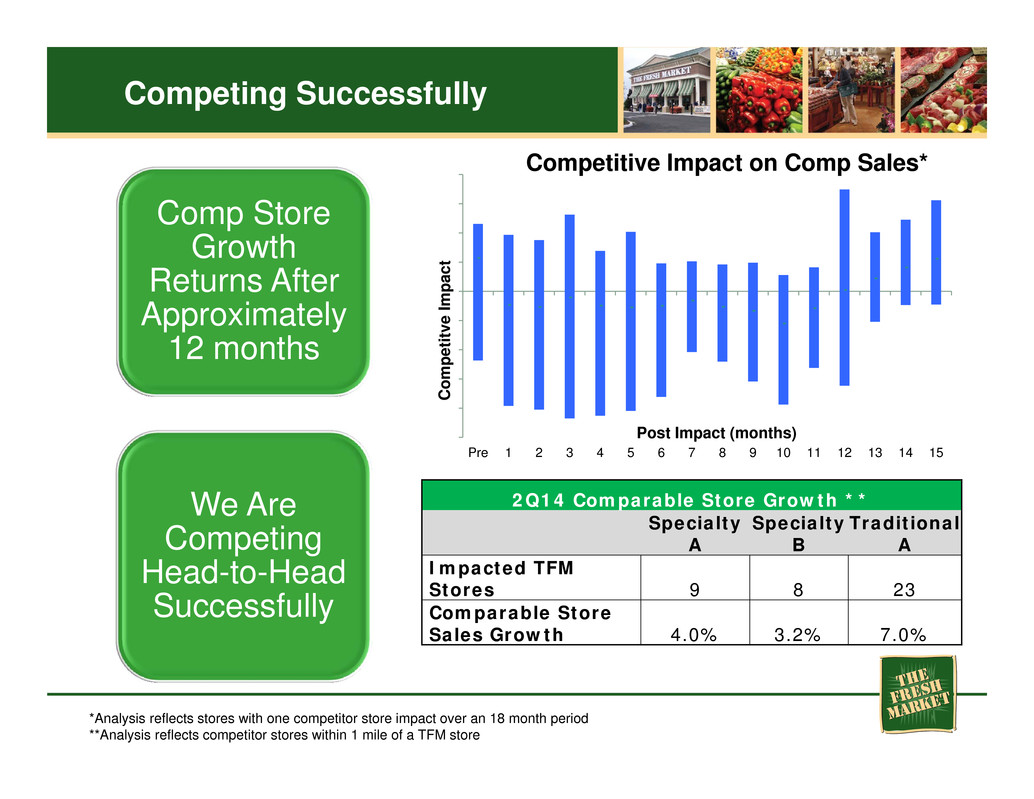
Competing Successfully Comp Store Growth Returns After Approximately 12 months We Are Competing Head-to-Head Successfully 2Q14 Comparable Store Growth ** Specialty A Specialty B Traditional A Impacted TFM Stores 9 8 23 Comparable Store Sales Growth 4.0% 3.2% 7.0% Pre 1 2 3 4 5 6 7 8 9 10 11 12 13 14 15 C o m p e t i t v e I m p a c t Post Impact (months) Competitive Impact on Comp Sales* *Analysis reflects stores with one competitor store impact over an 18 month period **Analysis reflects competitor stores within 1 mile of a TFM store

Unit Growth • Operating Margin has Improved • Sales Levels Remain Solid • New Sites will have Lower Occupancy Costs Performance in New Markets • Extensive Growth Opportunity in Core Markets • Opportunity to Double Store Base in Southeast • Less Cannibalization • More Small Markets Core Markets
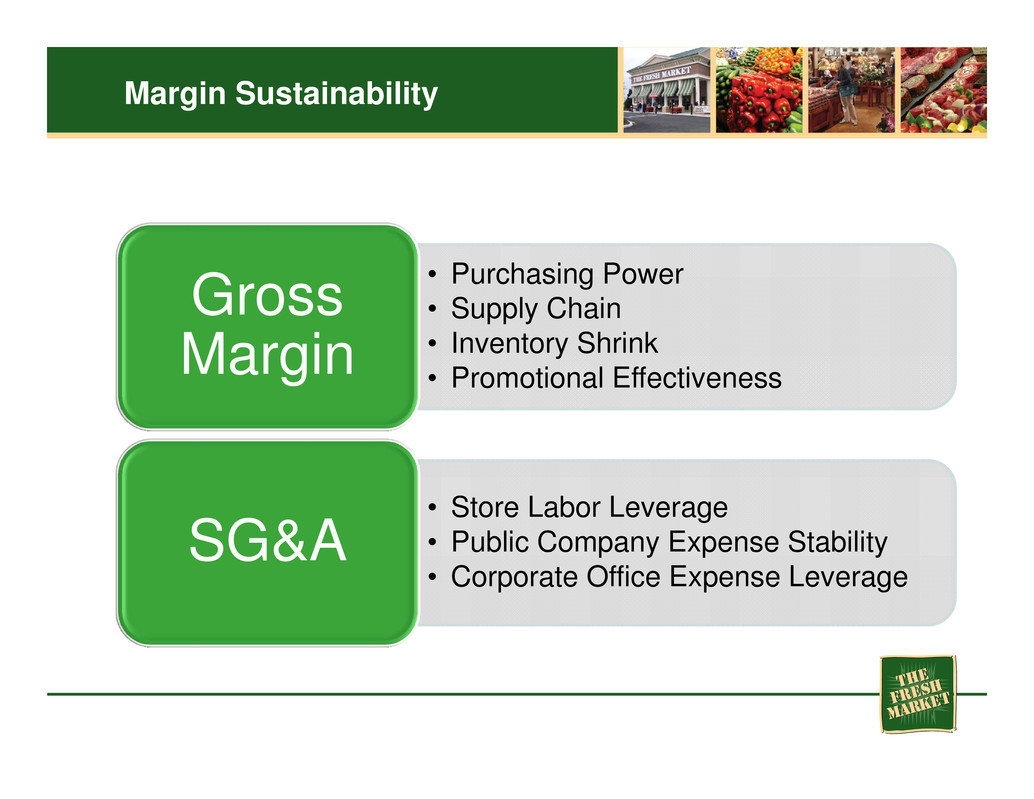
Margin Sustainability • Purchasing Power • Supply Chain • Inventory Shrink • Promotional Effectiveness Gross Margin • Store Labor Leverage • Public Company Expense Stability • Corporate Office Expense Leverage SG&A
Consumer Research Insights and Opportunities Chris Miller, VP Strategy & Marketing
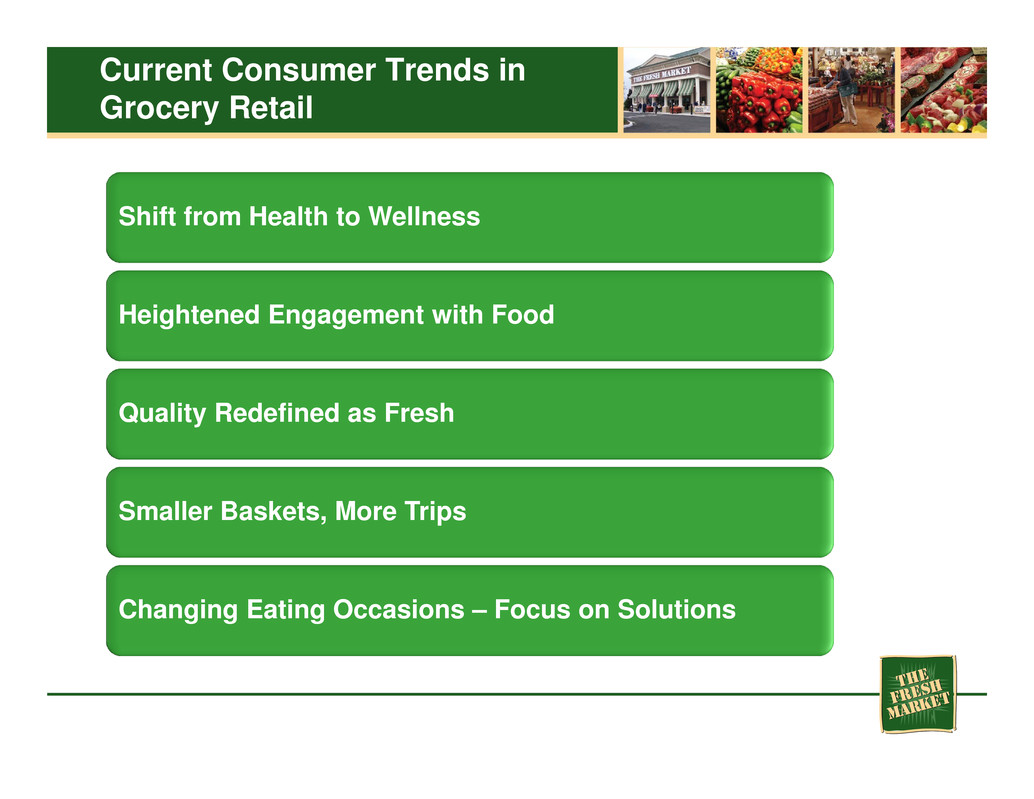
Shift from Health to Wellness Heightened Engagement with Food Quality Redefined as Fresh Smaller Baskets, More Trips Changing Eating Occasions – Focus on Solutions Current Consumer Trends in Grocery Retail

Consumer Trend: Shift from Health to Wellness Now… WELLNESS “Know thyself” Balanced Self-assessed Common sense Holistic Integrates emotional and physical wellbeing Then… HEALTH “Do as I say!” Authoritative Right vs. Wrong Narrow definition of Health Compliance Source: The Hartman Group

25% DISENGAGED Least interested in food for pleasure and inspiration Choices driven by price, convenience and familiar brands Level of food engagement 14% HYPER- GOURMET The most highly committed to elevating their food experiences Trends emanate from this group Chefs and foodies 33% MAINSTREAM Seeks some new food experiences but prioritizes other concerns Choices driven by value, expert opinion, and simple enjoyment 28% ASPIRATIONAL Wants more from food – looking for “special” food experiences. Adopts some hyper-gourmet attitudes and behaviors but with less consistency or experience Choices driven by food quality, experiences, and value Consumer Trend: Heightened Engagement with Food Source: TFM 2014 quantitative consumer study (n=3,549) conducted by The Hartman Group
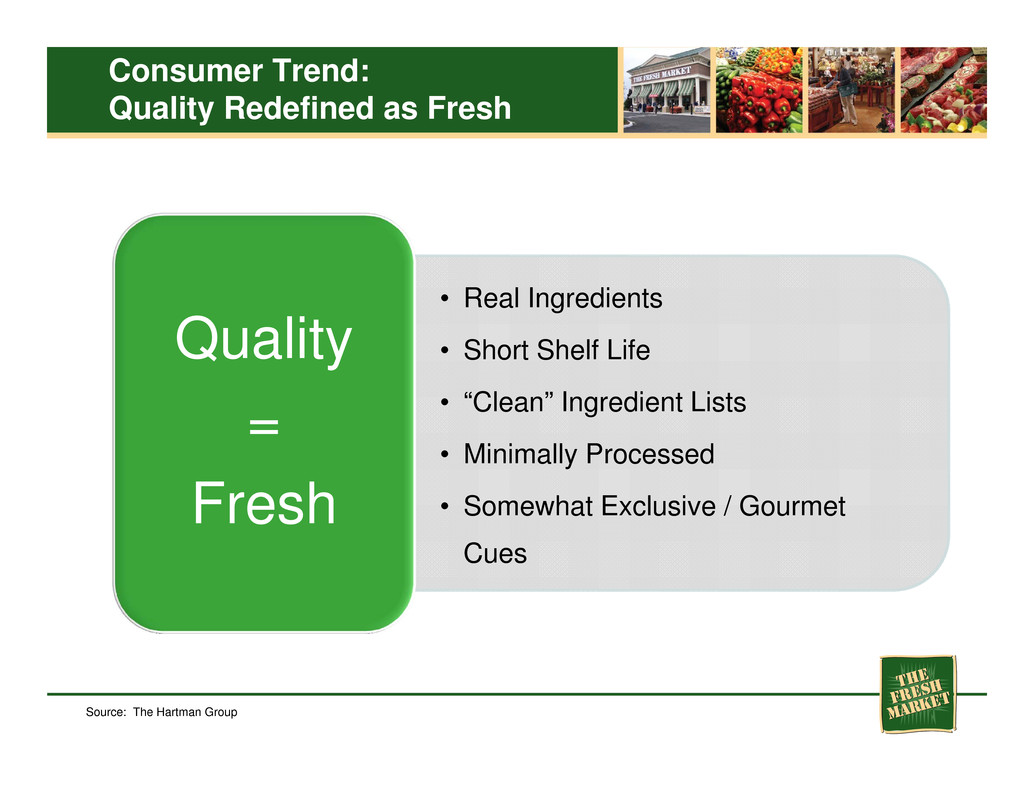
• Real Ingredients • Short Shelf Life • “Clean” Ingredient Lists • Minimally Processed • Somewhat Exclusive / Gourmet Cues Quality = Fresh Source: The Hartman Group Consumer Trend: Quality Redefined as Fresh

• 5+ Channels per Month • 2+ Retailers per Trip Consumer Shopping Behavior • More “Fresh” Trips • More Variety and Exploration • More Spontaneity, Less Planning Drivers Source: The Hartman Group Consumer Trend: Smaller Baskets, More Trips
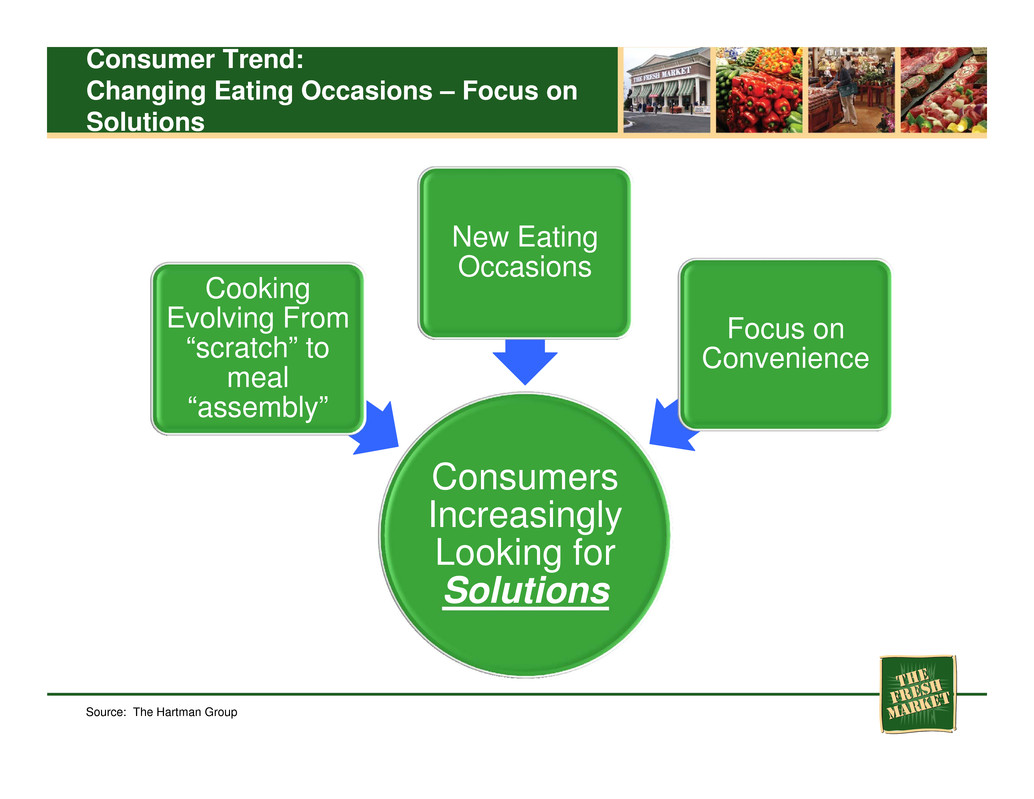
Consumers Increasingly Looking for Solutions Cooking Evolving From “scratch” to meal “assembly” New Eating Occasions Focus on Convenience Consumer Trend: Changing Eating Occasions – Focus on Solutions Source: The Hartman Group
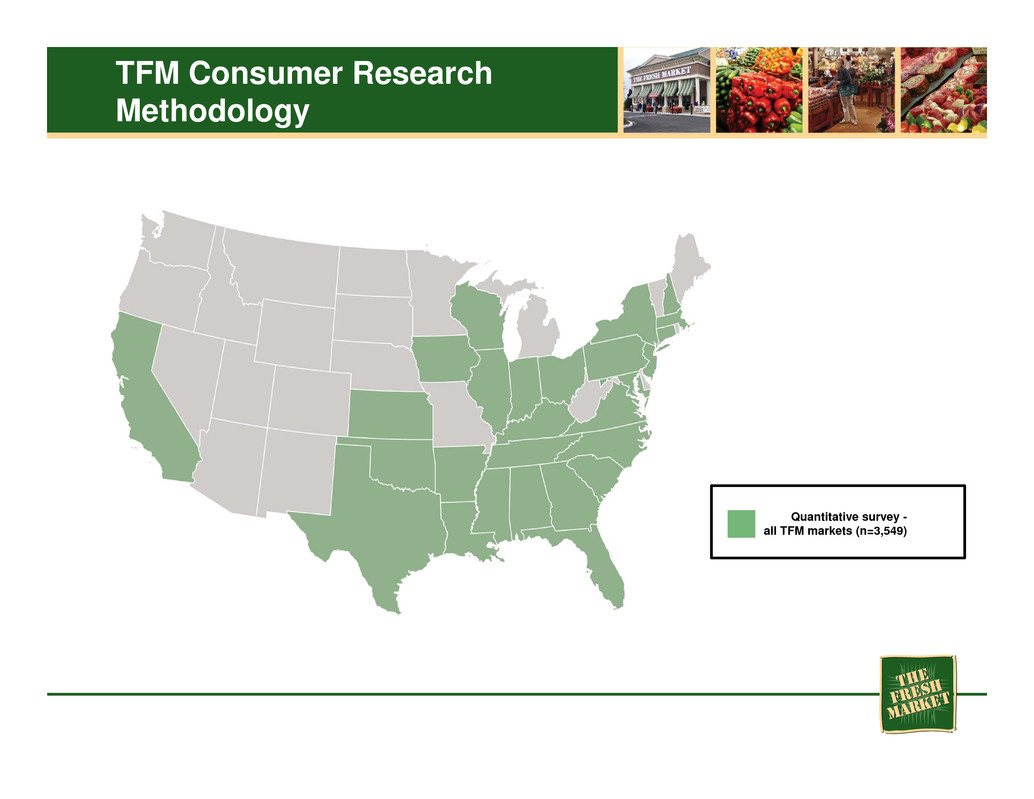
TFM Consumer Research Methodology Quantitative survey - all TFM markets (n=3,549)
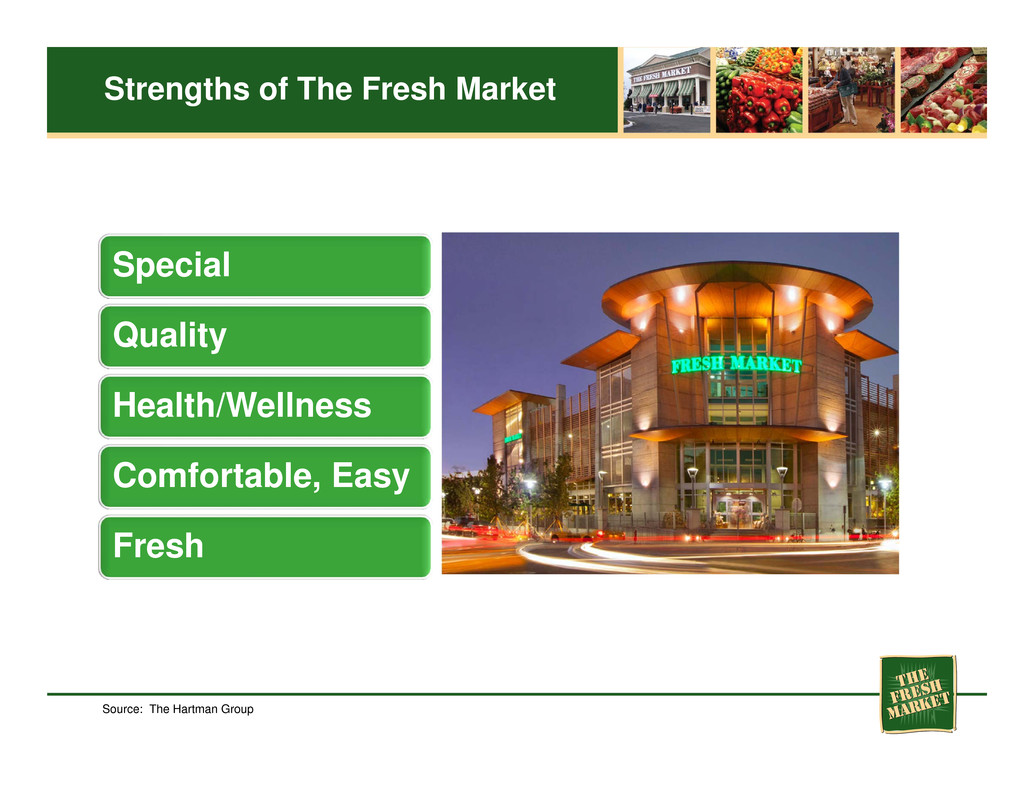
Strengths of The Fresh Market Special Quality Health/Wellness Comfortable, Easy Fresh Source: The Hartman Group
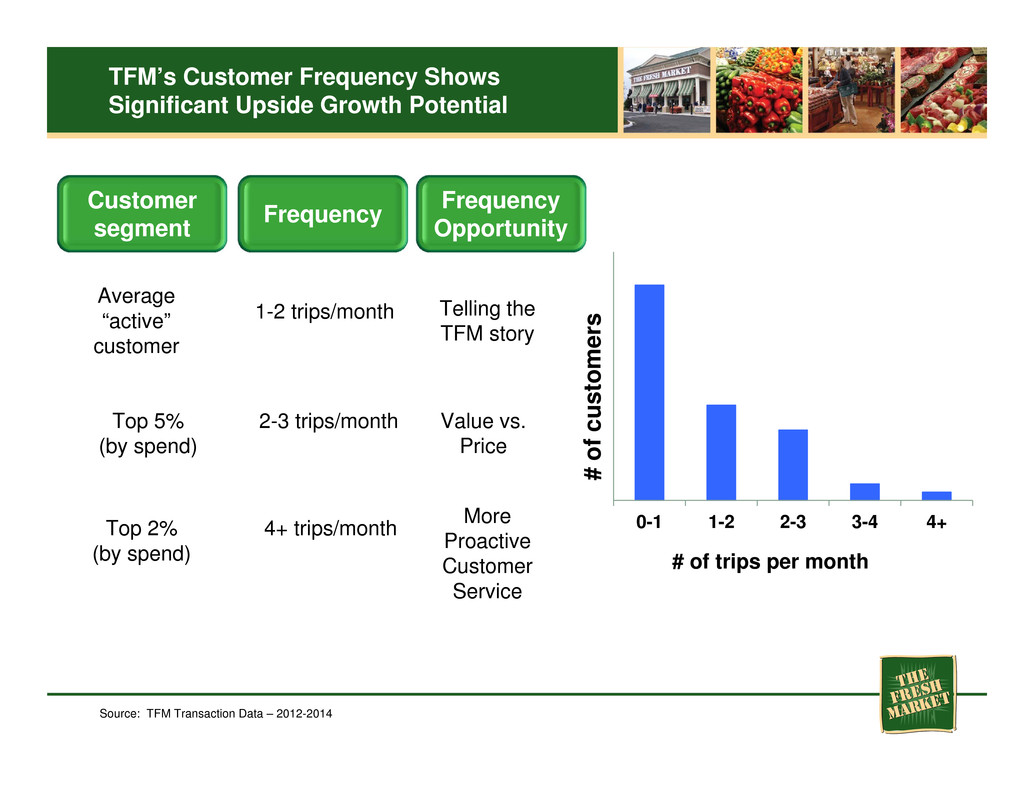
0-1 1-2 2-3 3-4 4+ # of trips per month # o f c u s t o m e r s Average “active” customer Top 5% (by spend) Top 2% (by spend) 1-2 trips/month 2-3 trips/month 4+ trips/month Source: TFM Transaction Data – 2012-2014 Customer segment Frequency TFM’s Customer Frequency Shows Significant Upside Growth Potential Frequency Opportunity More Proactive Customer Service Value vs. Price Telling the TFM story
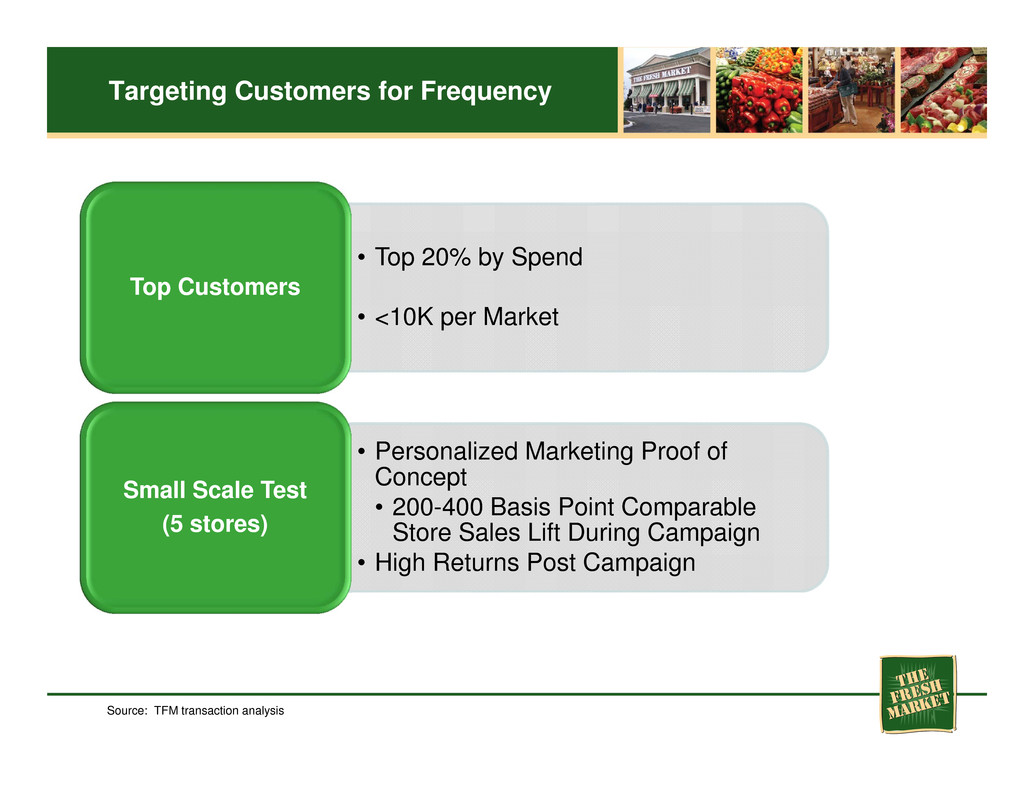
Source: TFM transaction analysis Targeting Customers for Frequency • Top 20% by Spend • <10K per Market Top Customers • Personalized Marketing Proof of Concept • 200-400 Basis Point Comparable Store Sales Lift During Campaign • High Returns Post Campaign Small Scale Test (5 stores)

*Plotted index values show how much more or less likely Aspirational shoppers are to frequent each retailer compared to non-Aspirational shoppers, based upon the % share of shoppers visiting each retailer at least once a month. Aspirational Shopper Affinity Index* Conventional grocer Specialty small format Specialty large format Specialty organic The Fresh Market Source: TFM 2014 quantitative consumer study (n=3,549) 72% of Retailers Visited by TFM Aspirational Shoppers on a Monthly Basis were Conventional Grocers Index = 100 TFM Over-indexes with Aspirational Shoppers, Who Use TFM to Supplement Conventional Trips
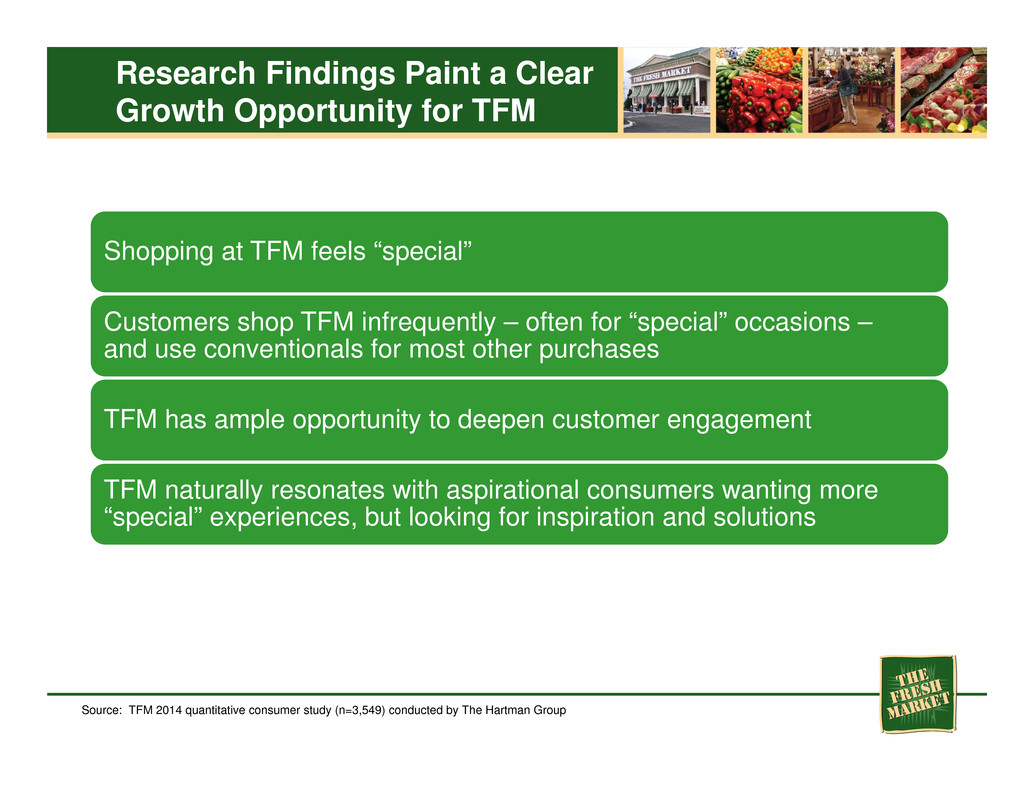
Shopping at TFM feels “special” Customers shop TFM infrequently – often for “special” occasions – and use conventionals for most other purchases TFM has ample opportunity to deepen customer engagement TFM naturally resonates with aspirational consumers wanting more “special” experiences, but looking for inspiration and solutions Research Findings Paint a Clear Growth Opportunity for TFM Source: TFM 2014 quantitative consumer study (n=3,549) conducted by The Hartman Group

Our Positioning • Food that enables customers to reach their goal • Customer service that is knowledgeableInspire • Food that is accessible • Healthy and indulgent • Not just for special occasions Everyday • Delicious, high quality, differentiated food • Attribute-driven choices are more and more relevant Eating • A special place to shop • An environment that is a respite from daily hustleExtraordinary “We inspire people to make everyday eating extraordinary”
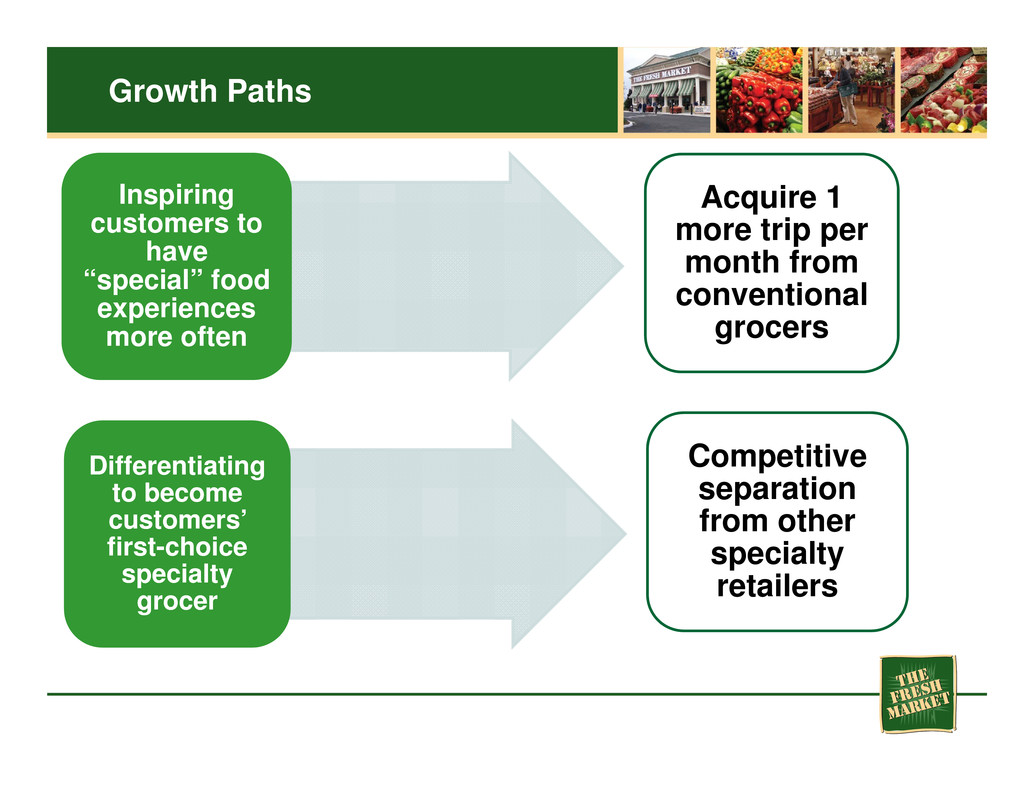
Inspiring customers to have “special” food experiences more often Acquire 1 more trip per month from conventional grocers Competitive separation from other specialty retailers Growth Paths Differentiating to become customers’ first-choice specialty grocer

TFM Video
Merchandising Overview Marc Jones SVP Chief Merchandising & Supply Chain Officer
Merchandising Approach Offer Unique, High Quality Product Selection Merchandise Assortment Lends Itself to Attractive Margins Customer Perception In-line with Merchandise Pricing Strategy Supply Chain Overview and Opportunities Margin Levers

Unique, High Quality Products

Unique, High Quality Products
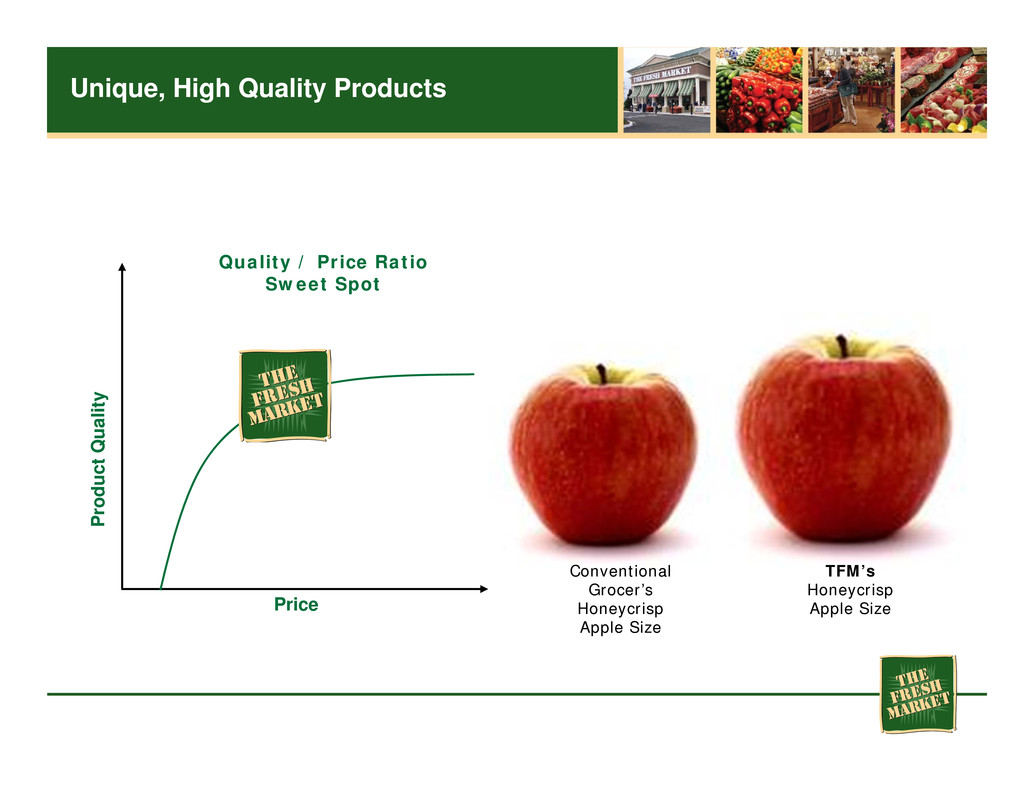
Unique, High Quality Products P r o d u c t Q u a l i t y Price Quality / Price Ratio Sweet Spot Conventional Grocer’s Honeycrisp Apple Size TFM’s Honeycrisp Apple Size

How CAN We Achieve These Results? 0.00% 2.00% 4.00% 6.00% 8.00% 10.00% 12.00% 14.00% Natural Specialty TFM Percent of Revenue from New Items Value Added Mix and Margin 10.0% 12.0% 14.0% 16.0% 18.0% 20.0% 22.0% 24.0% 26.0% 28.0% 2010 2011 2012 2013 P e r c e n t o f D e p a r t m e n t Key Product Attributes OG % of Produce PL % of Grocery Convenience Attributes New Mix Source: SPINS Data Non Value Added Value Added

Sources: Perception – TFM Customer Surveys; Actual – Tracking Retail Data (N=861) Pricing Approach 70 80 90 100 110 120 130 Price Index to TFM Price Pricing Surveys Perception Surveys Like Items Differentiated Items Use of Promotions TFM Actual Basket Survey Perception Survey
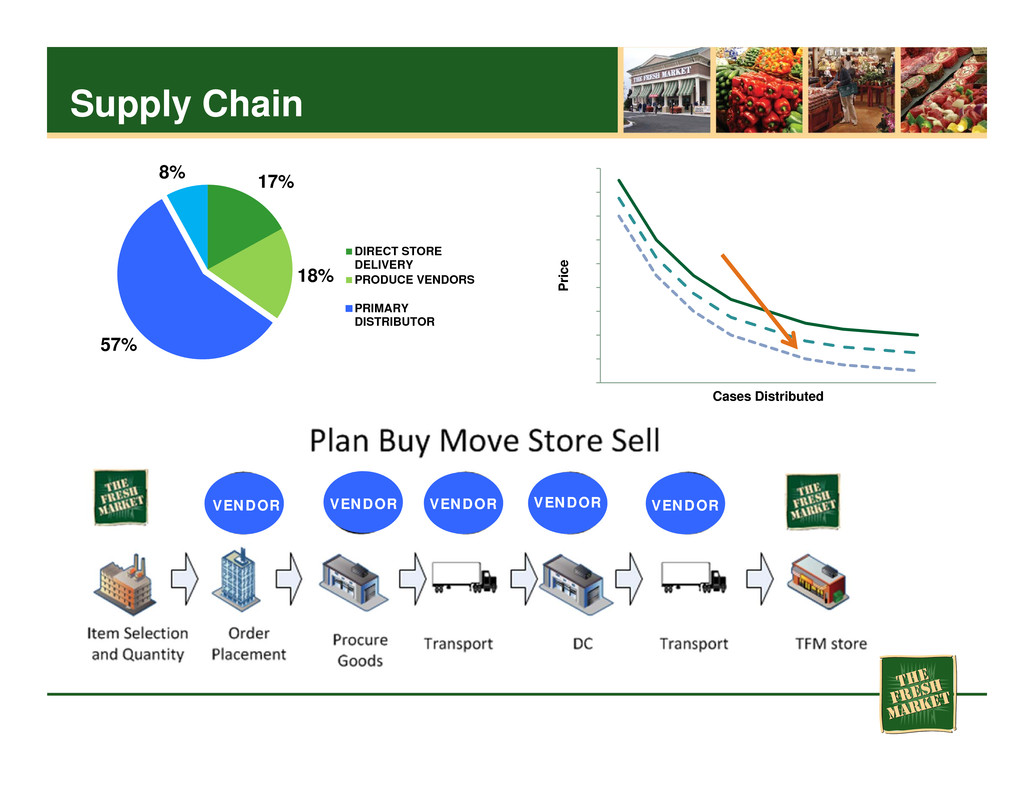
Supply Chain 17% 18% 57% 8% DIRECT STORE DELIVERY PRODUCE VENDORS PRIMARY DISTRIBUTOR 0 2 4 6 8 10 12 14 16 18 P r i c e Cases Distributed VENDOR VENDOR VENDOR VENDOR VENDOR VENDOR
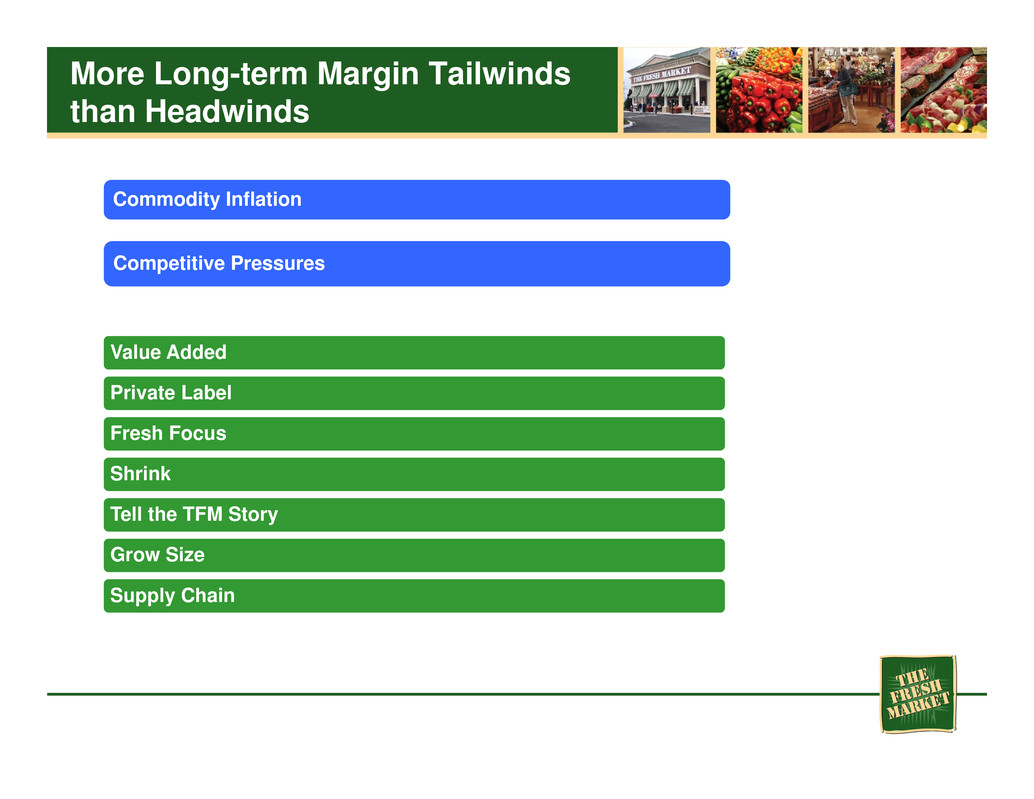
More Long-term Margin Tailwinds than Headwinds Value Added Private Label Fresh Focus Shrink Tell the TFM Story Grow Size Supply Chain Commodity Inflation Competitive Pressures

Real Estate Strategy Randy Young SVP Real Estate & Development
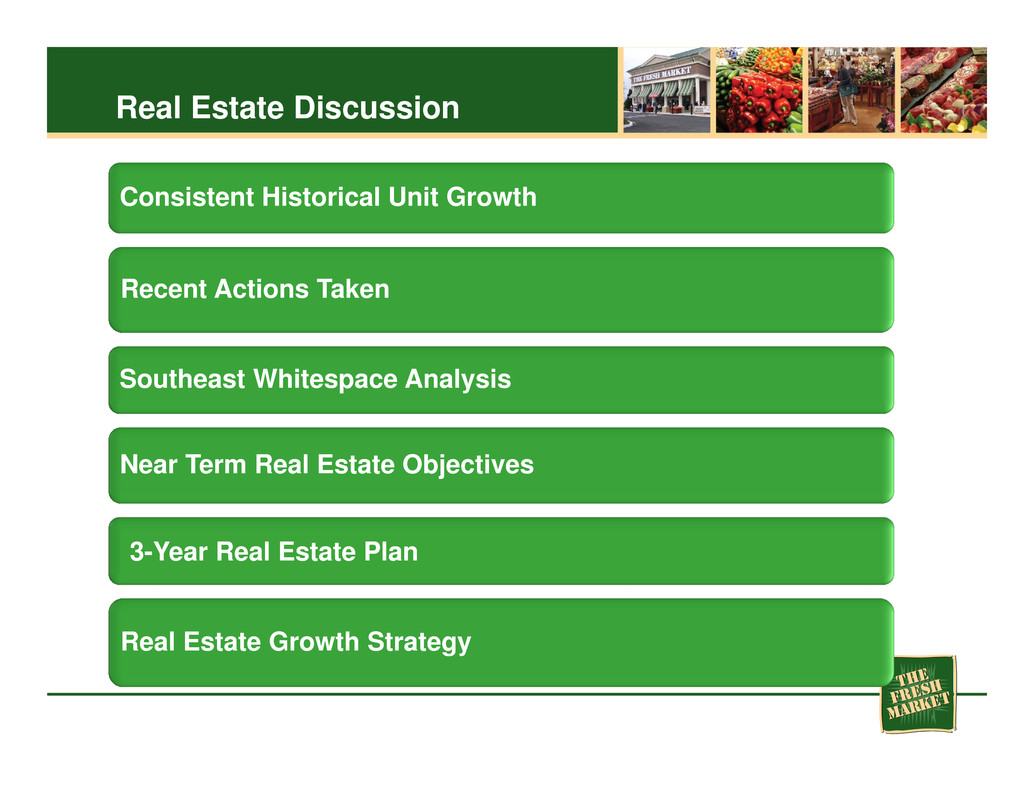
Consistent Historical Unit Growth Recent Actions Taken Southeast Whitespace Analysis Near Term Real Estate Objectives 3-Year Real Estate Plan Real Estate Growth Strategy Real Estate Discussion

Historical Real Estate Review Deliver More Predictable Results • Demonstrated History of Growth • 8-Year Unit CAGR 14% Historical Unit Growth 53 63 77 86 92 100 113 129 151 Dec '05 Dec '06 Dec '07 Dec '08 Dec '09 Dec '10 Jan '12 Jan '13 Jan '14 Stores (End of Period)
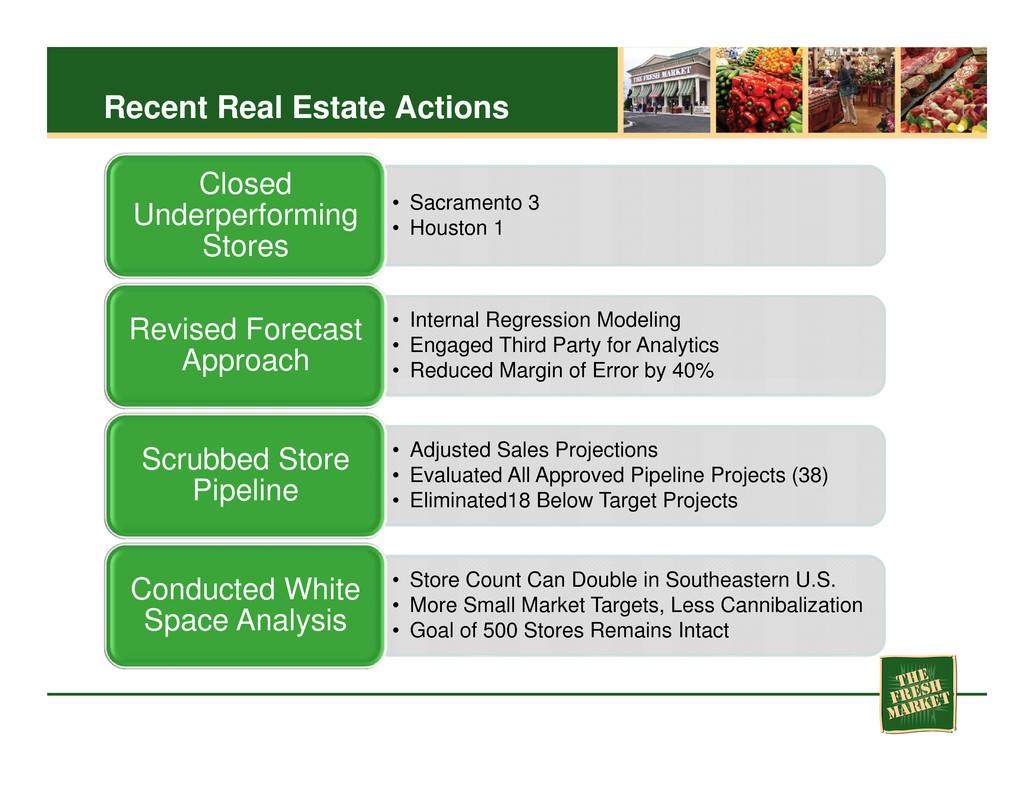
Recent Real Estate Actions • Sacramento 3 • Houston 1 Closed Underperforming Stores • Internal Regression Modeling • Engaged Third Party for Analytics • Reduced Margin of Error by 40% Revised Forecast Approach • Adjusted Sales Projections • Evaluated All Approved Pipeline Projects (38) • Eliminated18 Below Target Projects Scrubbed Store Pipeline • Store Count Can Double in Southeastern U.S. • More Small Market Targets, Less Cannibalization • Goal of 500 Stores Remains Intact Conducted White Space Analysis
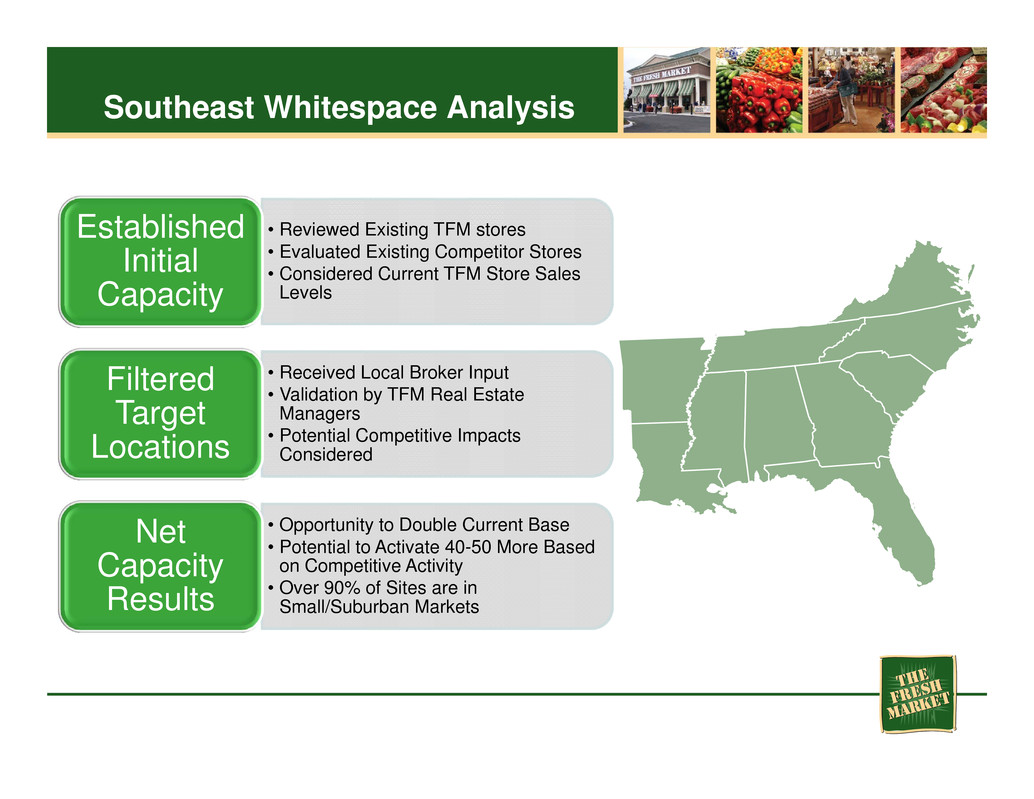
Southeast Whitespace Analysis • Reviewed Existing TFM stores • Evaluated Existing Competitor Stores • Considered Current TFM Store Sales Levels Established Initial Capacity • Received Local Broker Input • Validation by TFM Real Estate Managers • Potential Competitive Impacts Considered Filtered Target Locations • Opportunity to Double Current Base • Potential to Activate 40-50 More Based on Competitive Activity • Over 90% of Sites are in Small/Suburban Markets Net Capacity Results
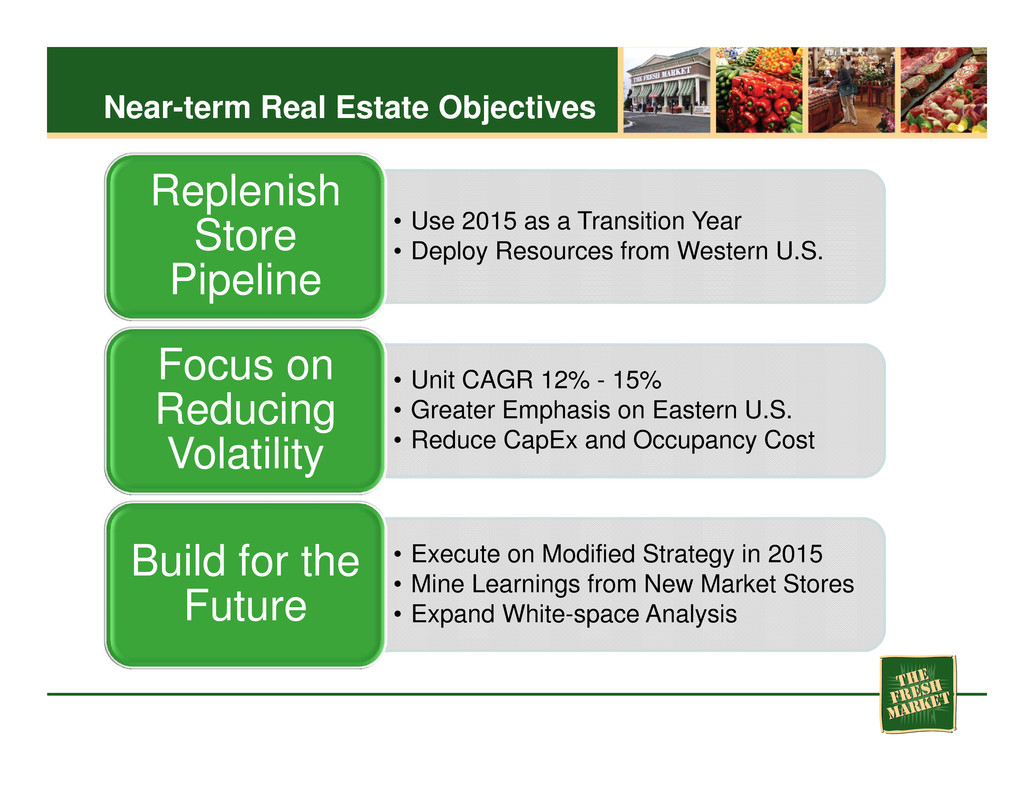
Near-term Real Estate Objectives • Use 2015 as a Transition Year • Deploy Resources from Western U.S. Replenish Store Pipeline • Unit CAGR 12% - 15% • Greater Emphasis on Eastern U.S. • Reduce CapEx and Occupancy Cost Focus on Reducing Volatility • Execute on Modified Strategy in 2015 • Mine Learnings from New Market Stores • Expand White-space Analysis Build for the Future

3-Year Real Estate Plan • 70+ New Stores in Next 3 Years • Annual Growth Rate: 12% - 15% • Regional Mix: Southeast ~50% Plan Highlights • Reduced Volatility • Reduced CapEx to Fund Remodels • Improved Returns Financial Implications Area Base 2014 2017 Mix Southeast 99 112 60%-65% Northeast 19 22 12%-16% Midwest 24 26 12%-16% New Markets 5 9 8%-12% Total 147 169 100%
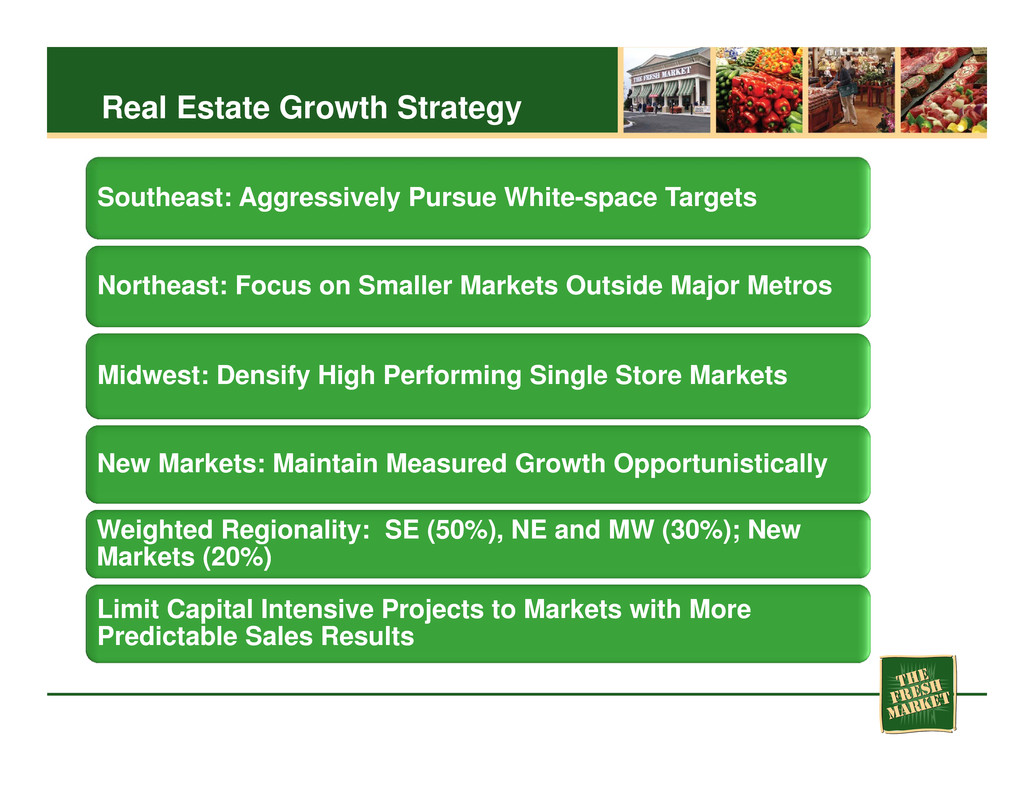
Southeast: Aggressively Pursue White-space Targets Northeast: Focus on Smaller Markets Outside Major Metros Midwest: Densify High Performing Single Store Markets New Markets: Maintain Measured Growth Opportunistically Weighted Regionality: SE (50%), NE and MW (30%); New Markets (20%) Limit Capital Intensive Projects to Markets with More Predictable Sales Results Real Estate Growth Strategy
Financial Overview Jeff Ackerman EVP & Chief Financial Officer
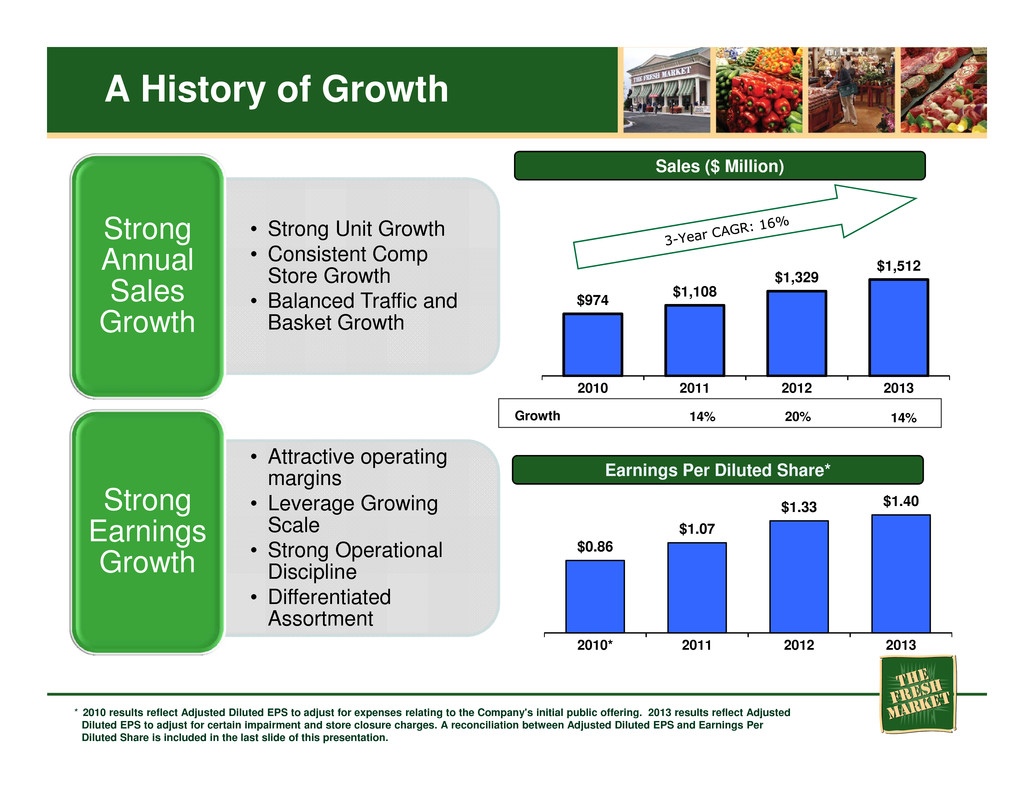
A History of Growth $0.86 $1.07 $1.33 $1.40 2010* 2011 2012 2013 $974 $1,108 $1,329 $1,512 2010 2011 2012 2013 Sales ($ Million) Growth 14% Earnings Per Diluted Share* 14% • Strong Unit Growth • Consistent Comp Store Growth • Balanced Traffic and Basket Growth Strong Annual Sales Growth • Attractive operating margins • Leverage Growing Scale • Strong Operational Discipline • Differentiated Assortment Strong Earnings Growth * 2010 results reflect Adjusted Diluted EPS to adjust for expenses relating to the Company's initial public offering. 2013 results reflect Adjusted Diluted EPS to adjust for certain impairment and store closure charges. A reconciliation between Adjusted Diluted EPS and Earnings Per Diluted Share is included in the last slide of this presentation. 20%
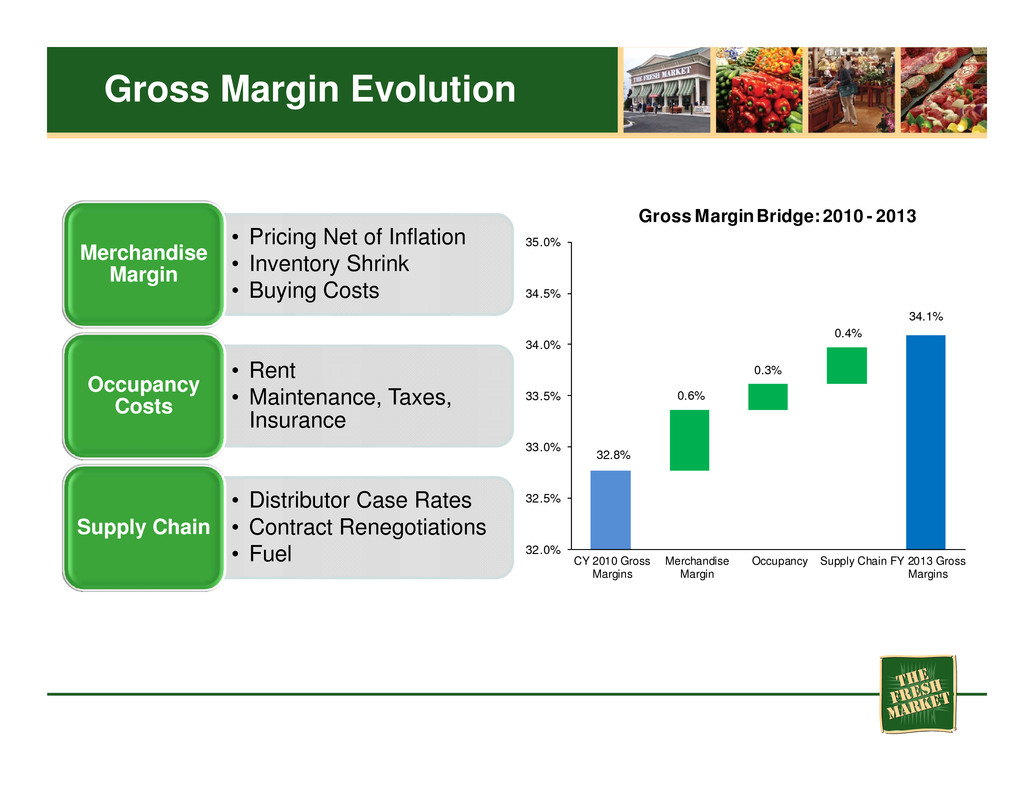
Gross Margin Evolution • Pricing Net of Inflation • Inventory Shrink • Buying Costs Merchandise Margin • Rent • Maintenance, Taxes, Insurance Occupancy Costs • Distributor Case Rates • Contract Renegotiations • Fuel Supply Chain 32.8% 0.6% 0.3% 0.4% 34.1% 32.0% 32.5% 33.0% 33.5% 34.0% 34.5% 35.0% CY 2010 Gross Margins Merchandise Margin Occupancy Supply Chain FY 2013 Gross Margins Gross Margin Bridge: 2010 - 2013

SG&A Evolution • Wages • Benefits • Marketing Store Operating Costs • Headcount • Administrative Corporate G&A • Professional Fees • Equity Compensation Public Co. Expenses 22.1% 0.5% 0.5% 0.4% 0.5% 23.1% 21.0% 21.5% 22.0% 22.5% 23.0% 23.5% 24.0% CY '10 SG&A Store Costs Corp G&A Public Co Exp CA/TX FY '13 SG&A SG&A Expense Bridge: 2010 - 2013 *CY 2010 SG&A excludes ~$29MM in IPO Related Expense
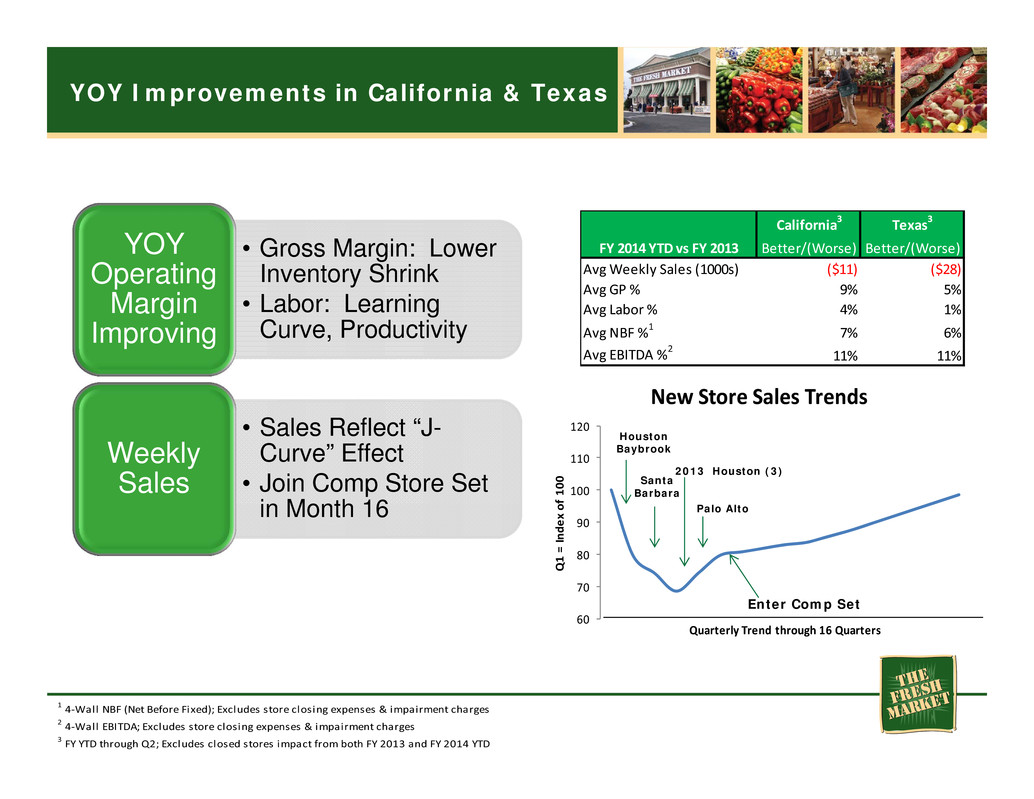
60 70 80 90 100 110 120 Q 1 = I n d e x o f 1 0 0 Quarterly Trend through 16 Quarters New Store Sales Trends YOY Improvements in California & Texas • Gross Margin: Lower Inventory Shrink • Labor: Learning Curve, Productivity YOY Operating Margin Improving • Sales Reflect “J- Curve” Effect • Join Comp Store Set in Month 16 Weekly Sales FY 2014 YTD vs FY 2013 Better/(Worse) Better/(Worse) Avg Weekly Sales (1000s) ($11) ($28) Avg GP % 9% 5% Avg Labor % 4% 1% Avg NBF %1 7% 6% Avg EBITDA %2 11% 11% California3 Texas3 1 4‐Wall NBF (Net Before Fixed); Excludes store closing expenses & impairment charges 2 4‐Wall EBITDA; Excludes store closing expenses & impairment charges 3 FY YTD through Q2; Excludes closed stores impact from both FY 2013 and FY 2014 YTD Houston Baybrook Santa Barbara 2013 Houston (3) Palo Alto Enter Comp Set

New Markets • Seed Store Manager in New Market Earlier • Greater Flexibility with Initial StaffingStaffing • Selective Direct Mail • Advertising Campaigns (8-12 weeks) • Taste of TFM (post grand opening) • Food Blogger & Media “Tweet Up” Events • Local Field Marketers • Community Involvement Increase Brand Awareness & Trial
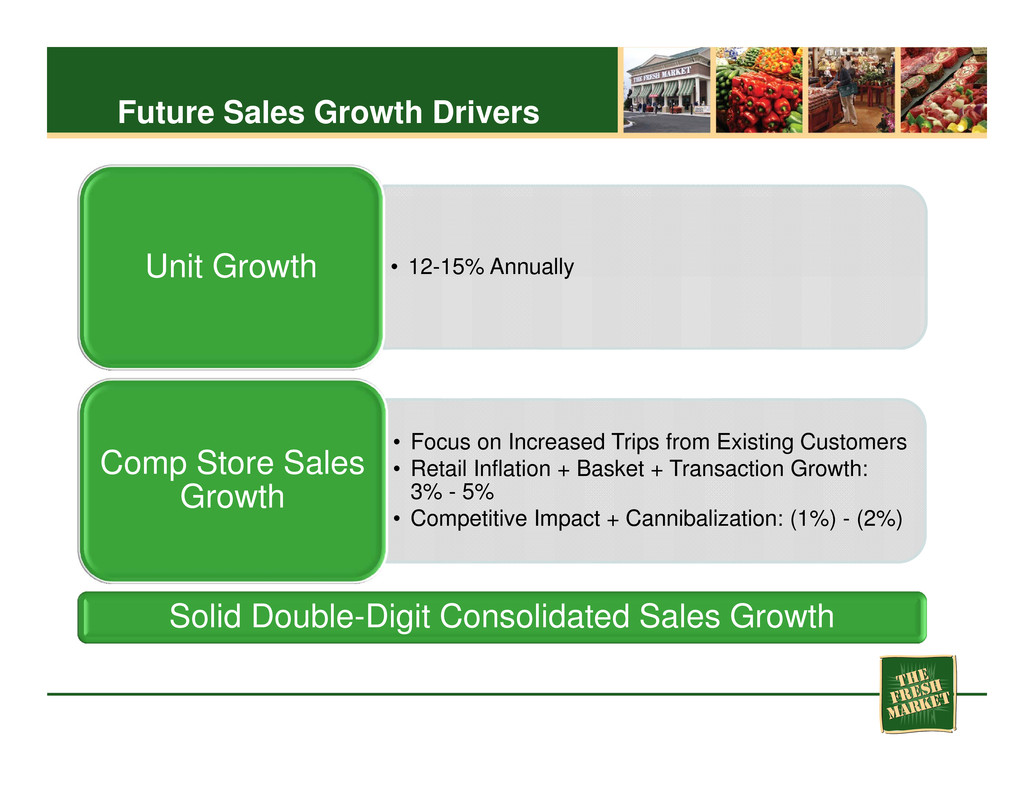
Future Sales Growth Drivers • 12-15% AnnuallyUnit Growth • Focus on Increased Trips from Existing Customers • Retail Inflation + Basket + Transaction Growth: 3% - 5% • Competitive Impact + Cannibalization: (1%) - (2%) Comp Store Sales Growth Solid Double-Digit Consolidated Sales Growth
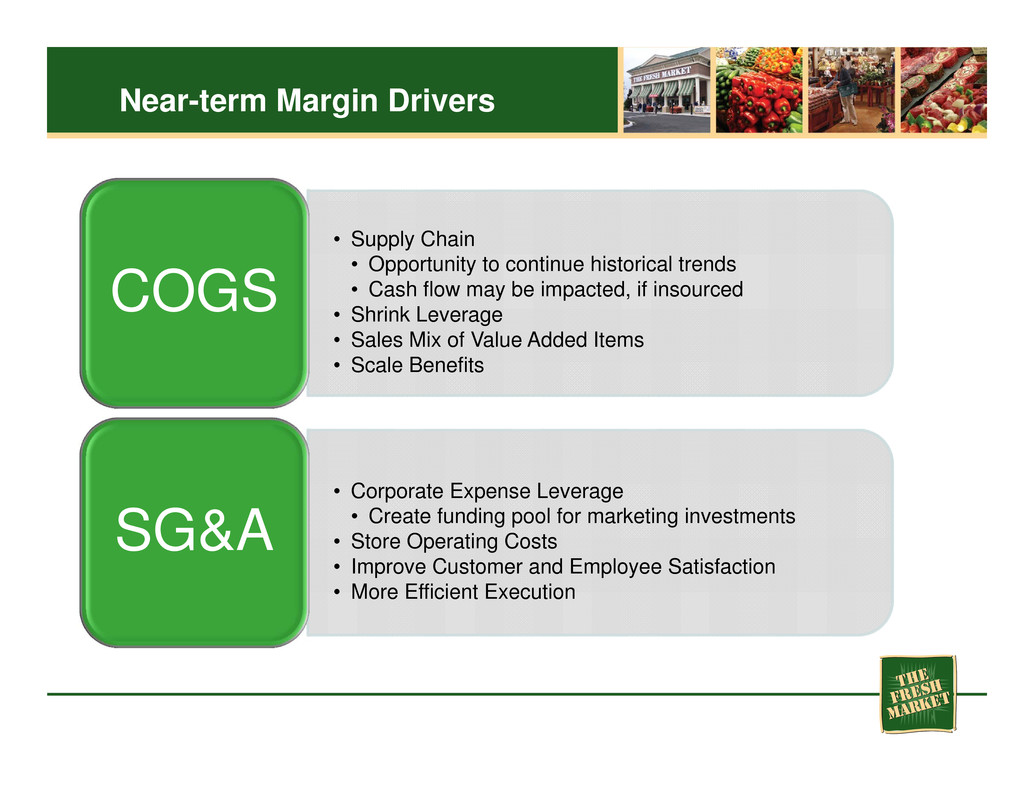
Near-term Margin Drivers • Supply Chain • Opportunity to continue historical trends • Cash flow may be impacted, if insourced • Shrink Leverage • Sales Mix of Value Added Items • Scale Benefits COGS • Corporate Expense Leverage • Create funding pool for marketing investments • Store Operating Costs • Improve Customer and Employee Satisfaction • More Efficient Execution SG&A

Capital Expenditures Expect construction capital expenditures and costs similar to FY14 adjusted for inflation Average New Store CapEx: $3.5MM - $4MM plus annual inflation of 2% Anticipate other capital expenditures to rise slower than sales Returns on investments in new stores improving All capital to be funded by cash flow from operations 1 Estimated 1st Year Returns through Q2 FY 2014; Return is calculated by the stores’ 1st Year 4-Wall Adjusted EBITDA / Net Capital Outlay (Capital excluding land purchases, but including $TI Improvement allowance); Includes FY 2013 Class excludes capital and expenses for the closed stores Year FY11 FY12 FY13 FY14 # Stores 13 16 19 22 1st Year Return 1 19.8% 35.6% 7.0-12.0% 25.0-35.0%

Investment Thesis Summary • Natural/Specialty One of the Fastest Growing Channels in Food Retail • Greatest Potential to Take Market Share from Conventional Grocers • Growing Consumer Demand for Fresh/healthy Shopping and Outpaced Trends in Perishable Categories Outstanding Industry Dynamics • Unique Grocery Atmosphere • Distinctive Assortment of Products • Outstanding Quality • High-touch Customer Service Differentiated Customer Experience • Industry Leading Operating Margins • Disciplined, High-growth Culture and Strong Management Team • Extensive White-space Opportunity for Expansion in Core and New Markets • Well Positioned to Mitigate Inflationary and Competitive Margin Pressures Superior Financial Returns
Q&A
Appendix
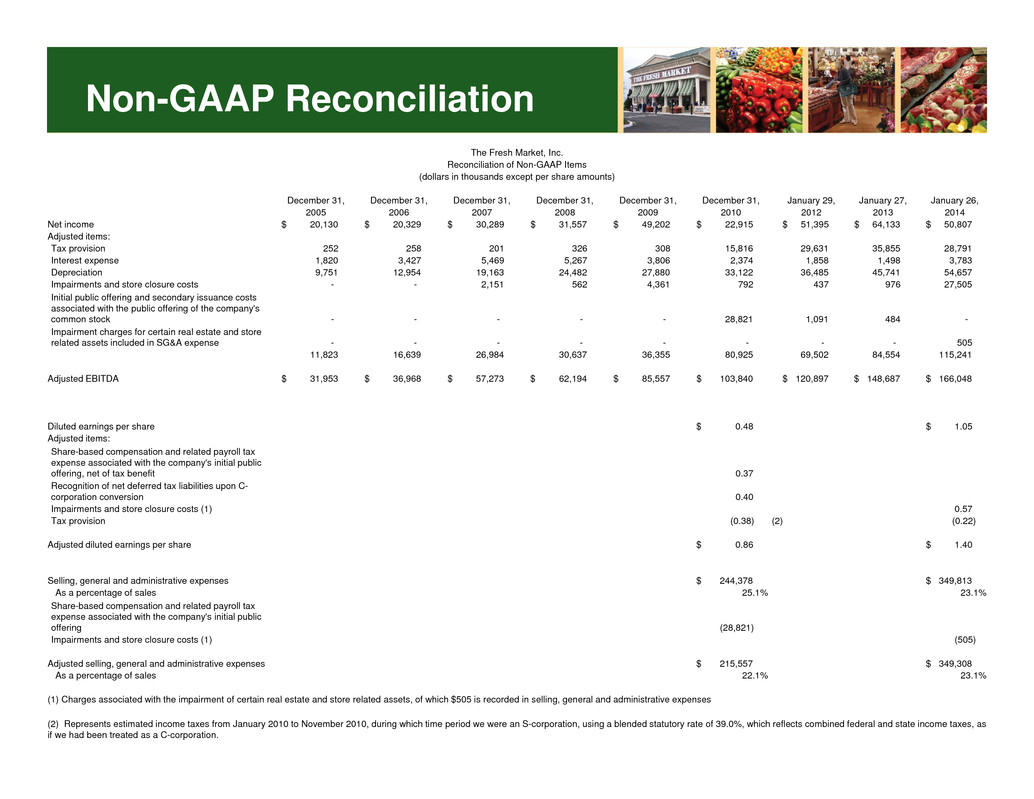
Non-GAAP Reconciliation The Fresh Market, Inc. Reconciliation of Non-GAAP Items (dollars in thousands except per share amounts) December 31, December 31, December 31, December 31, December 31, December 31, January 29, January 27, January 26, 2005 2006 2007 2008 2009 2010 2012 2013 2014 Net income $ 20,130 $ 20,329 $ 30,289 $ 31,557 $ 49,202 $ 22,915 $ 51,395 $ 64,133 $ 50,807 Adjusted items: Tax provision 252 258 201 326 308 15,816 29,631 35,855 28,791 Interest expense 1,820 3,427 5,469 5,267 3,806 2,374 1,858 1,498 3,783 Depreciation 9,751 12,954 19,163 24,482 27,880 33,122 36,485 45,741 54,657 Impairments and store closure costs - - 2,151 562 4,361 792 437 976 27,505 Initial public offering and secondary issuance costs associated with the public offering of the company's common stock - - - - - 28,821 1,091 484 - Impairment charges for certain real estate and store related assets included in SG&A expense - - - - - - - - 505 11,823 16,639 26,984 30,637 36,355 80,925 69,502 84,554 115,241 Adjusted EBITDA $ 31,953 $ 36,968 $ 57,273 $ 62,194 $ 85,557 $ 103,840 $ 120,897 $ 148,687 $ 166,048 Diluted earnings per share $ 0.48 $ 1.05 Adjusted items: Share-based compensation and related payroll tax expense associated with the company's initial public offering, net of tax benefit 0.37 Recognition of net deferred tax liabilities upon C- corporation conversion 0.40 Impairments and store closure costs (1) 0.57 Tax provision (0.38) (2) (0.22) Adjusted diluted earnings per share $ 0.86 $ 1.40 Selling, general and administrative expenses $ 244,378 $ 349,813 As a percentage of sales 25.1% 23.1% Share-based compensation and related payroll tax expense associated with the company's initial public offering (28,821) Impairments and store closure costs (1) (505) Adjusted selling, general and administrative expenses $ 215,557 $ 349,308 As a percentage of sales 22.1% 23.1% (1) Charges associated with the impairment of certain real estate and store related assets, of which $505 is recorded in selling, general and administrative expenses (2) Represents estimated income taxes from January 2010 to November 2010, during which time period we were an S-corporation, using a blended statutory rate of 39.0%, which reflects combined federal and state income taxes, as if we had been treated as a C-corporation.


