Exhibit 99.2
Ken DeCubellis, CEO August 13, 2013 OTCBB/OTCQB: ANFC © Black Ridge Oil & Gas, Inc.
2 Forward Looking Statements Statements made by representatives of Black Ridge Oil & Gas, Inc . (“Black Ridge” or the “Company”) during the course of this presentation that are not historical facts are “forward-looking statements” within the meaning of federal securities laws . These statements are based on certain assumptions and expectations made by the Company which reflect management’s experience, estimates and perception of historical trends, current conditions, anticipated future developments and other factors believed to be appropriate . No assurances can be given that such assumptions and expectations will occur as anticipated and actual results may differ materially from those implied or anticipated in the forward looking statements . Such statements are subject to a number of risks and uncertainties, many of which are beyond the control of the Company, and which include risks relating to the global financial crisis, our ability to obtain additional capital needed to implement our business plan, declines in prices and demand for gas, oil and natural gas liquids, our minimal operating history, loss of key personnel, lack of business diversification, reliance on strategic third-party relationships, ability to obtain rights to explore and develop oil and gas reserves, the rate of in - fill drilling on our leased acreage, financial performance and results, our indebtedness under our line of credit, our ability to replace reserves and efficiently develop our current reserves, our ability to make acquisitions on economically acceptable terms, our ability to become listed on a national exchange, and other important factors . Black Ridge undertakes no obligation to publicly update any forward-looking statements, whether as a result of new information or future events .
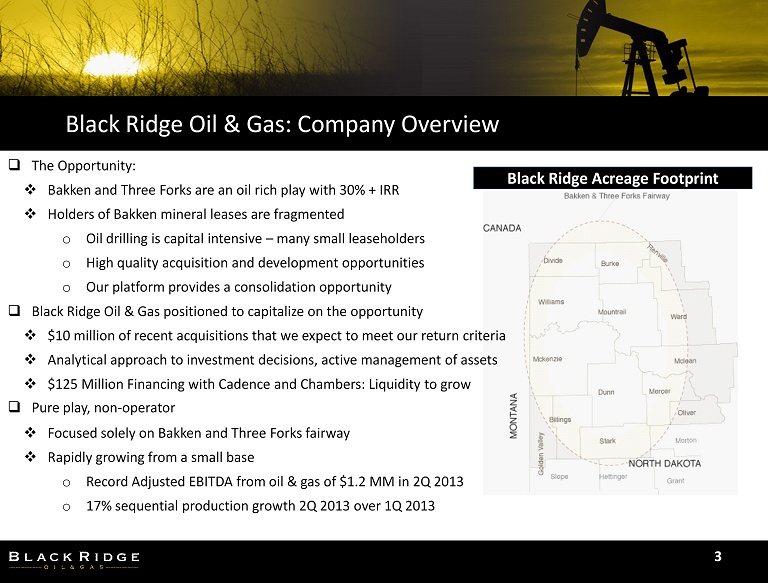
Black Ridge Oil & Gas: Company Overview 3 Black Ridge Acreage Footprint □ The Opportunity: □ Bakken and Three Forks are an oil rich play with 30% + IRR □ Holders of Bakken mineral leases are fragmented o Oil drilling is capital intensive – many small leaseholders o High quality acquisition and development opportunities o Our platform provides a consolidation opportunity □ Black Ridge Oil & Gas positioned to capitalize on the opportunity □ $10 million of recent acquisitions that we expect to meet our return criteria □ Analytical approach to investment decisions, active management of assets □ $125 Million Financing with Cadence and Chambers: Liquidity to grow □ Pure play, non - operator □ Focused solely on Bakken and Three Forks fairway □ Rapidly growing from a small base o Record Adjusted EBITDA from oil & gas of $1.2 MM in 2Q 2013 o 17% sequential production growth 2Q 2013 over 1Q 2013
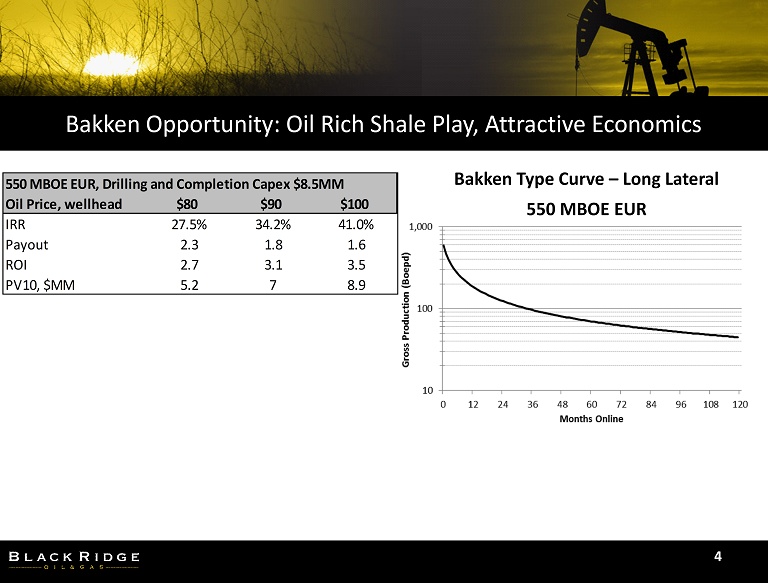
Bakken Opportunity: Oil Rich Shale Play, Attractive Economics 4 Bakken Type Curve – Long Lateral 550 MBOE EUR 550 MBOE EUR, Drilling and Completion Capex $8.5MM Oil Price, wellhead $80 $90 $100 IRR 27.5% 34.2% 41.0% Payout 2.3 1.8 1.6 ROI 2.7 3.1 3.5 PV10, $MM 5.2 7 8.9
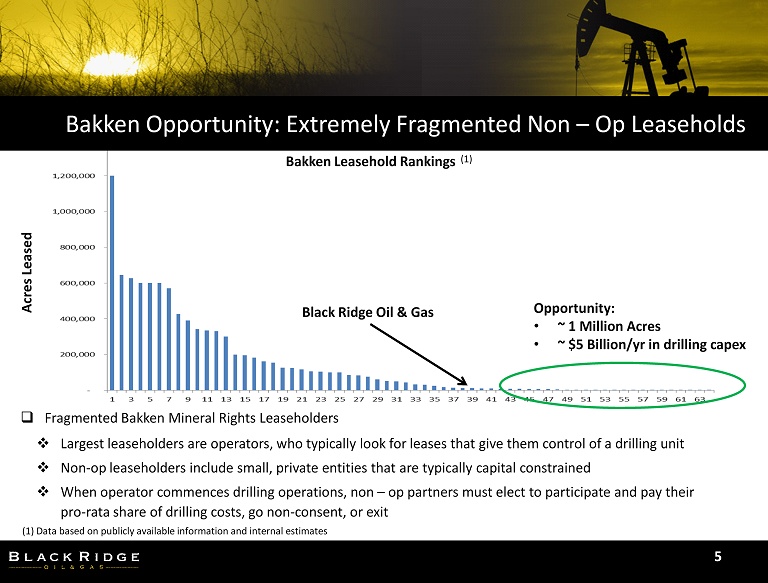
(1) Data based on publicly available information and internal estimates Bakken Leasehold Rankings Bakken Opportunity: Extremely Fragmented Non – Op Leaseholds 5 □ Fragmented Bakken Mineral Rights Leaseholders □ Largest leaseholders are operators, who typically look for leases that give them control of a drilling unit □ Non - op leaseholders include small, private entities that are typically capital constrained □ When operator commences drilling operations, non – op partners must elect to participate and pay their pro - rata share of drilling costs, go non - consent, or exit (1) Acres Leased Black Ridge Oil & Gas Opportunity: • ~ 1 Million Acres • ~ $5 Billion/ yr in drilling capex
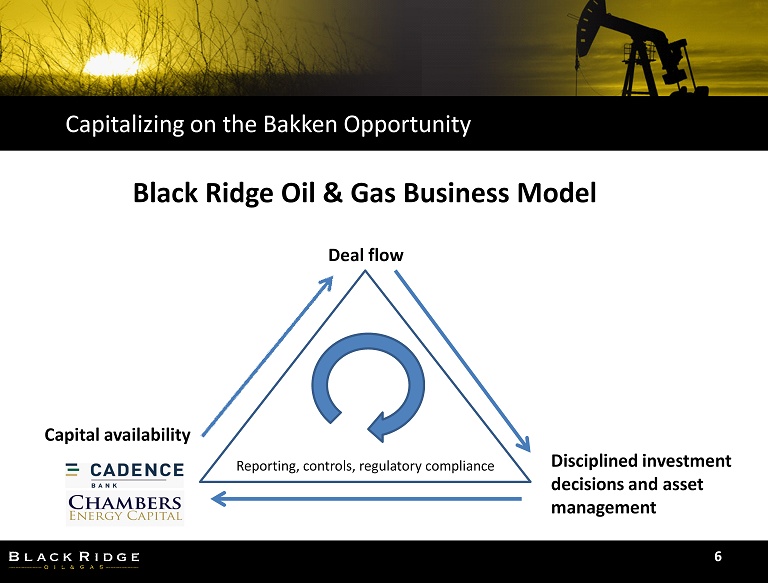
Capitalizing on the Bakken Opportunity 6 Deal flow Disciplined investment decisions and asset management Capital availability Reporting, controls, regulatory compliance Black Ridge Oil & Gas Business Model
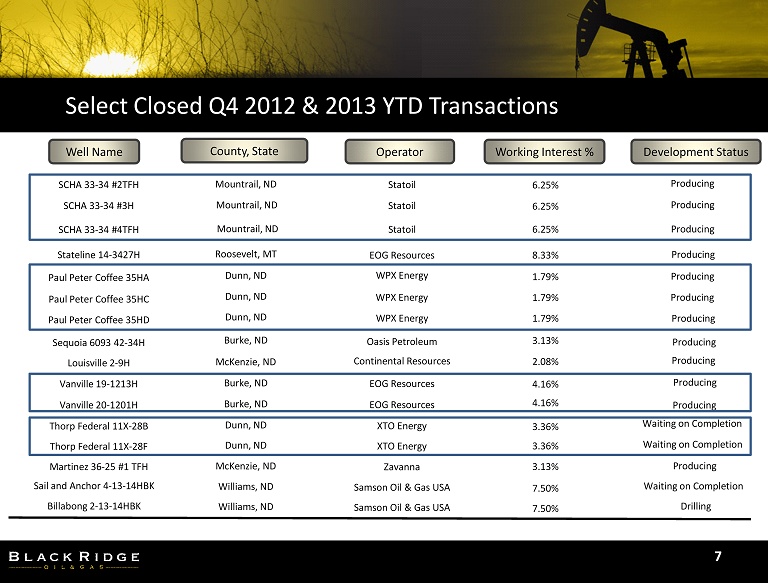
7 Well Name County, State Operator Working Interest % Development Status Stateline 14 - 3427H EOG Resources Roosevelt, MT Producing 8.33% SCHA 33 - 34 #2TFH SCHA 33 - 34 #3H SCHA 33 - 34 #4TFH Statoil Statoil Statoil Mountrail, ND Mountrail, ND Mountrail, ND Producing Producing 6.25% 6.25% 6.25% Producing Paul Peter Coffee 35HA Paul Peter Coffee 35HC Paul Peter Coffee 35HD WPX Energy WPX Energy WPX Energy Dunn, ND Dunn, ND Dunn, ND Producing 1.79% 1.79% 1.79% Producing Producing Sequoia 6093 42 - 34H Burke, ND Oasis Petroleum 3.13% Producing Producing 2.08% Continental Resources McKenzie, ND Louisville 2 - 9H Producing 4.16% EOG Resources Burke, ND Vanville 19 - 1213H Producing 4.16% EOG Resources Burke, ND Vanville 20 - 1201H Waiting on Completion 3.36% XTO Energy Dunn, ND Thorp Federal 11X - 28B Waiting on Completion 3.36% XTO Energy Dunn, ND Thorp Federal 11X - 28F Producing 3.13% Zavanna McKenzie, ND Martinez 36 - 25 #1 TFH Waiting on Completion 7.50% Samson Oil & Gas USA Williams, ND Sail and Anchor 4 - 13 - 14HBK Select Closed Q4 2012 & 2013 YTD Transactions Drilling 7.50% Samson Oil & Gas USA Williams, ND Billabong 2 - 13 - 14HBK
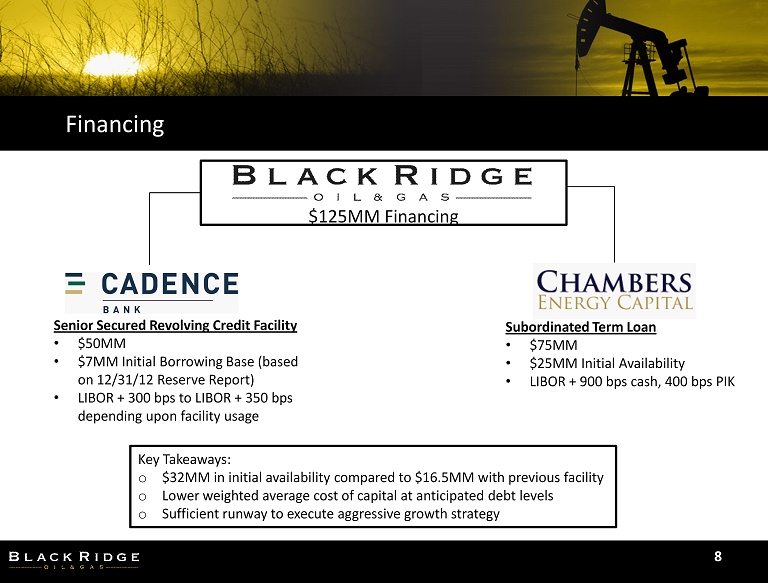
$125MM Financing Financing 8 Senior Secured Revolving Credit Facility • $50MM • $7MM Initial Borrowing Base (based on 12/31/12 Reserve Report) • LIBOR + 300 bps to LIBOR + 350 bps depending upon facility usage Subordinated Term Loan • $75MM • $25MM Initial Availability • LIBOR + 900 bps cash, 400 bps PIK Key Takeaways: o $32MM in initial availability compared to $16.5MM with previous facility o Lower weighted average cost of capital at anticipated debt levels o Sufficient runway to execute aggressive growth strategy
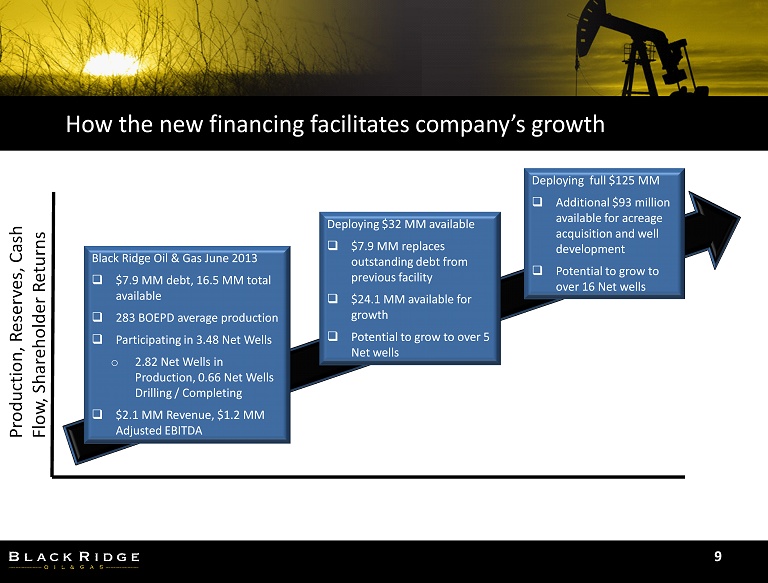
How the new financing facilitates company’s growth 9 Black Ridge Oil & Gas June 2013 □ $7.9 MM debt, 16.5 MM total available □ 283 BOEPD average production □ Participating in 3.48 Net Wells o 2.82 Net Wells in Production, 0.66 Net Wells Drilling / Completing □ $2.1 MM Revenue, $1.2 MM Adjusted EBITDA Deploying $32 MM available □ $7.9 MM replaces outstanding debt from previous facility □ $24.1 MM available for growth □ Potential to grow to over 5 Net wells Deploying full $125 MM □ Additional $93 million available for acreage acquisition and well development □ Potential to grow to over 16 Net wells Production, Reserves, Cash Flow, Shareholder Returns
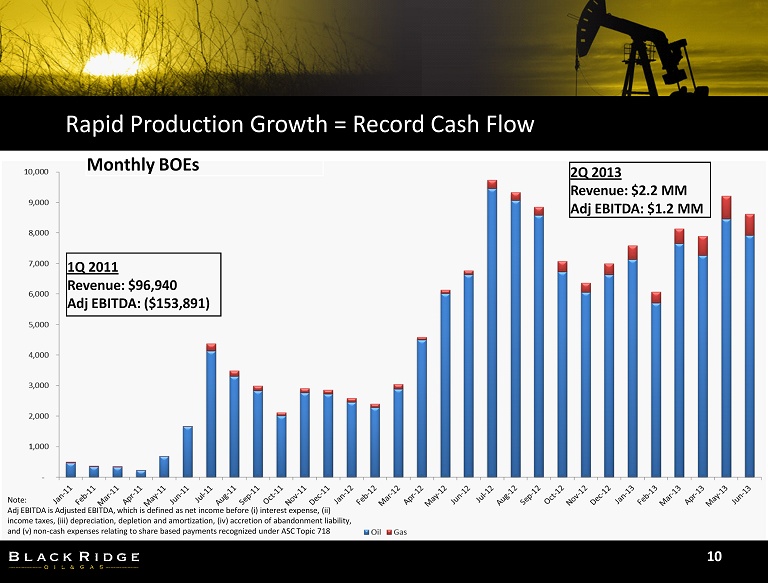
Rapid Production Growth = Record Cash Flow 10 Monthly BOEs 1Q 2011 Revenue: $96,940 Adj EBITDA: ($153,891) 2Q 2013 Revenue: $2.2 MM Adj EBITDA: $1.2 MM Note: Adj EBITDA is Adjusted EBITDA, which is defined as net income before ( i ) interest expense, (ii) income taxes, (iii) depreciation, depletion and amortization, (iv) accretion of abandonment liability, and (v) non - cash expenses relating to share based payments recognized under ASC Topic 718

Ken DeCubellis Chief Executive Officer ken.decubellis@blackridgeoil.com 952 - 426 - 1851 For More Information 11 Stay Up to Date on Black Ridge Oil & Gas www.blackridgeoil.com
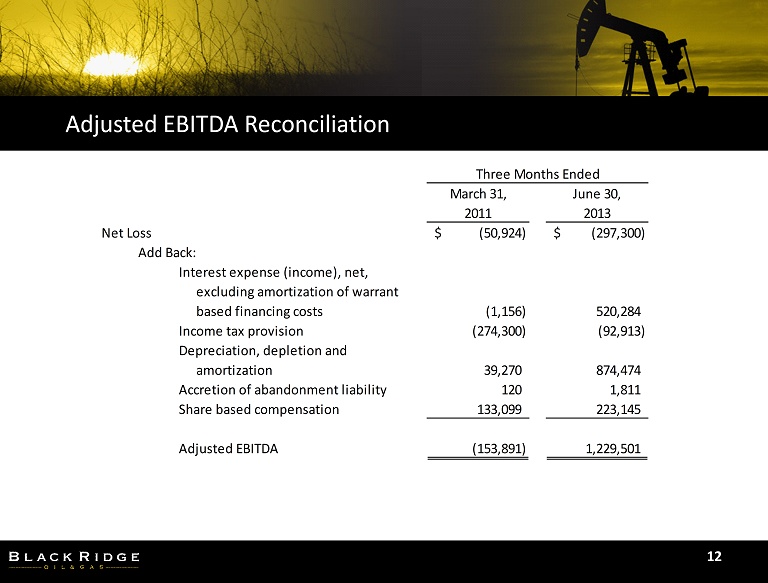
Adjusted EBITDA Reconciliation 12 March 31, June 30, 2011 2013 Net Loss (50,924)$ (297,300)$ Add Back: Interest expense (income), net, excluding amortization of warrant based financing costs (1,156) 520,284 Income tax provision (274,300) (92,913) Depreciation, depletion and amortization 39,270 874,474 Accretion of abandonment liability 120 1,811 Share based compensation 133,099 223,145 Adjusted EBITDA (153,891) 1,229,501 Three Months Ended