Use these links to rapidly review the document
TABLE OF CONTENTS
INDEX TO FINANCIAL STATEMENTS
Table of Contents
UNITED STATES
SECURITIES AND EXCHANGE COMMISSION
WASHINGTON, D.C. 20549
Form 10-K
| | |
ý |
|
ANNUAL REPORT PURSUANT TO SECTION 13 OR 15(d) OF THE SECURITIES EXCHANGE ACT OF 1934 |
For the fiscal year ended December 31, 2011 |
or |
o |
|
TRANSITION REPORT PURSUANT TO SECTION 13 OR 15(d) OF THE SECURITIES EXCHANGE ACT OF 1934 |
For the transition period from to
|
Commission file number: 001-34892
Rhino Resource Partners LP
(Exact name of registrant as specified in its charter)
| | |
Delaware
(State or other jurisdiction of
incorporation or organization) | | 27-2377517
(I.R.S. Employer
Identification No.) |
424 Lewis Hargett Circle, Suite 250
Lexington, KY
(Address of principal executive offices) |
|
40503
(Zip Code) |
Registrant's telephone number, including area code:(859) 389-6500
Securities registered pursuant to Section 12(b) of the Act:
| | |
| Title of each class | | Name of each exchange on which registered |
|---|
Common Units representing Limited
Partner Interests | | New York Stock Exchange |
Securities registered pursuant to Section 12(g) of the Act:
None
Indicate by check mark if the registrant is a well-known seasoned issuer, as defined in Rule 405 of the Securities Act. Yes o No ý
Indicate by check mark if the registrant is not required to file reports pursuant to Section 13 or Section 15(d) of the Act. Yes o No ý
Indicate by check mark whether the registrant (1) has filed all reports required to be filed by Section 13 or 15(d) of the Securities Exchange Act of 1934 during the preceding 12 months (or for such shorter period that the registrant was required to file such reports), and (2) has been subject to such filing requirements for the past 90 days. Yes ý No o
Indicate by check mark whether the registrant has submitted electronically and posted on its corporate Web site, if any, every Interactive Data File required to be submitted and posted pursuant to Rule 405 of Regulation S-T (§232.405 of this chapter) during the preceding 12 months (or for such shorter period that the registrant was required to submit and post such files). Yes ý No o
Indicate by check mark if disclosure of delinquent filers pursuant to Item 405 of Regulation S-K (§ 229.405 of this chapter) is not contained herein, and will not be contained, to the best of registrant's knowledge, in definitive proxy or information statements incorporated by reference in Part III of this Form 10-K or any amendment to this Form 10-K. o
Indicate by check mark whether the registrant is a large accelerated filer, an accelerated filer, a non-accelerated filer, or a smaller reporting company. See the definitions of "large accelerated filer," "accelerated filer" and "smaller reporting company" in Rule 12b-2 of the Exchange Act.
| | | | | | |
| Large accelerated filer o | | Accelerated filer ý | | Non-accelerated filer o
(Do not check if a
smaller reporting company) | | Smaller reporting company o |
Indicate by check mark whether the registrant is a shell company (as defined in Rule 12b-2 of the Exchange Act). Yes o No ý
As of June 30, 2011, the last business day of the registrant's most recently completed second fiscal quarter, the aggregate market value of the registrant's equity held by non-affiliates of the registrant was approximately $90.2 million based on the closing price of the registrant's common units on the New York Stock Exchange. As of March 9, 2012, the registrant had 15,318,178 common units and 12,397,000 subordinated units outstanding.
DOCUMENTS INCORPORATED BY REFERENCE
Documents incorporated by reference in this report are listed in the Exhibit Index of this Form 10-K
Table of Contents
TABLE OF CONTENTS
| | | | | | |
PART I | |
Item 1. | | Business | | | 1 | |
Item 1A. | | Risk Factors | | | 26 | |
Item 1B. | | Unresolved Staff Comments | | | 55 | |
Item 2. | | Properties | | | 55 | |
Item 3. | | Legal Proceedings | | | 58 | |
Item 4. | | Mine Safety Disclosure | | | 58 | |
PART II
|
|
Item 5. | | Market for Registrant's Common Equity, Related Stockholder Matters and Issuer Purchases of Equity Securities | | | 59 | |
Item 6. | | Selected Financial Data | | | 62 | |
Item 7. | | Management's Discussion and Analysis of Financial Condition and Results of Operations | | | 66 | |
Item 7A. | | Quantitative and Qualitative Disclosures About Market Risk | | | 97 | |
Item 8. | | Financial Statements and Supplementary Data | | | 98 | |
Item 9. | | Changes in and Disagreements with Accountants on Accounting and Financial Disclosure | | | 98 | |
Item 9A. | | Controls and Procedures | | | 98 | |
Item 9B. | | Other Information | | | 100 | |
PART III
|
|
Item 10. | | Directors, Executive Officers and Corporate Governance | | | 100 | |
Item 11. | | Executive Compensation | | | 106 | |
Item 12. | | Security Ownership of Certain Beneficial Owners and Management and Related Unitholder Matters | | | 119 | |
Item 13. | | Certain Relationships and Related Transactions, and Director Independence | | | 121 | |
Item 14. | | Principal Accounting Fees and Services | | | 124 | |
PART IV
|
|
Item 15. | | Exhibits, Financial Statement Schedules | | | 125 | |
FINANCIAL STATEMENTS
|
|
| | Index to Financial Statements | | | F-1 | |
i
Table of Contents
GLOSSARY OF KEY TERMS
ash: Inorganic material consisting of iron, alumina, sodium and other incombustible matter that are contained in coal. The composition of the ash can affect the burning characteristics of coal.
assigned reserves: Proven and probable reserves that have the permits and infrastructure necessary for mining.
as received: Represents an analysis of a sample as received at a laboratory.
Btu: British thermal unit, or Btu, is the amount of heat required to raise the temperature of one pound of water one degree Fahrenheit.
Central Appalachia: Coal producing area in eastern Kentucky, Virginia and southern West Virginia.
coal seam: Coal deposits occur in layers typically separated by layers of rock. Each layer is called a "seam." A seam can vary in thickness from inches to a hundred feet or more.
coke: A hard, dry carbon substance produced by heating coal to a very high temperature in the absence of air. Coke is used in the manufacture of iron and steel.
EIA: Energy Information Administration.
fossil fuel: A hydrocarbon such as coal, petroleum or natural gas that may be used as a fuel.
GAAP: Generally accepted accounting principles in the United States.
high-vol metallurgical coal: Metallurgical coal that has a volatility content of 32% or greater of its total weight.
Illinois Basin: Coal producing area in Illinois, Indiana and western Kentucky.
limestone: A rock predominantly composed of the mineral calcite (calcium carbonate (CaCO3)).
lignite: The lowest rank of coal. It is brownish-black with a high moisture content commonly above 35% by weight and heating value commonly less than 8,000 Btu.
low-vol metallurgical coal: Metallurgical coal that has a volatility content of 17% to 22% of its total weight.
mid-vol metallurgical coal: Metallurgical coal that has a volatility content of 23% to 31% of its total weight.
metallurgical coal: The various grades of coal suitable for carbonization to make coke for steel manufacture. Its quality depends on four important criteria: volatility, which affects coke yield; the level of impurities including sulfur and ash, which affects coke quality; composition, which affects coke strength; and basic characteristics, which affect coke oven safety. Metallurgical coal typically has a particularly high Btu but low ash and sulfur content.
non-reserve coal deposits: Non-reserve coal deposits are coal-bearing bodies that have been sufficiently sampled and analyzed in trenches, outcrops, drilling and underground workings to assume continuity between sample points, and therefore warrants further exploration stage work. However, this coal does not qualify as a commercially viable coal reserve as prescribed by standards of the SEC until a final comprehensive evaluation based on unit cost per ton, recoverability and other material factors concludes legal and economic feasibility. Non-reserve coal deposits may be classified as such by either limited property control or geologic limitations, or both.
ii
Table of Contents
non-reserve limestone deposits: Similar to non-reserve coal deposits, non-reserve limestone deposits are limestone-bearing bodies that have been sufficiently sampled and analyzed in trenches, outcrops, drilling, and underground workings to assume continuity between sample points, and therefore warrants further exploration stage work. However, this limestone does not qualify as a commercially viable limestone reserve as prescribed by standards of the SEC until a final comprehensive evaluation based on unit cost per ton, recoverability, and other material factors concludes legal and economic feasibility. Non-reserve limestone deposits may be classified as such by either limited property control or geologic limitations, or both.
Northern Appalachia: Coal producing area in Maryland, Ohio, Pennsylvania and northern West Virginia.
overburden: Layers of earth and rock covering a coal seam. In surface mining operations, overburden is removed prior to coal extraction.
preparation plant: Usually located on a mine site, although one plant may serve several mines. A preparation plant is a facility for crushing, sizing and washing coal to prepare it for use by a particular customer. The washing process separates higher ash coal and may also remove some of the coal's sulfur content.
probable (indicated) reserves: Reserves for which quantity and grade and/or quality are computed from information similar to that used for proven (measured) reserves, but the sites for inspection, sampling, and measurement are farther apart or are otherwise less adequately spaced. The degree of assurance, although lower than that for proven (measured) reserves, is high enough to assume continuity between points of observation.
proven (measured) reserves: Reserves for which (a) quantity is computed from dimensions revealed in outcrops, trenches, workings or drill holes; grade and/or quality are computed from the results of detailed sampling and (b) the sites for inspection, sampling and measurement are spaced so closely and the geologic character is so well defined that size, shape, depth and mineral content of reserves are well-established.
reclamation: The process of restoring land to its prior condition, productive use or other permitted condition following mining activities. The process commonly includes "recontouring" or reshaping the land to its approximate original contour, restoring topsoil and planting native grass and shrubs. Reclamation operations are typically conducted concurrently with mining operations, but the majority of reclamation costs are incurred once mining operations cease. Reclamation is closely regulated by both state and federal laws.
reserve: That part of a mineral deposit which could be economically and legally extracted or produced at the time of the reserve determination.
steam coal: Coal used by power plants and industrial steam boilers to produce electricity, steam or both. It generally is lower in Btu heat content and higher in volatile matter than metallurgical coal.
sulfur: One of the elements present in varying quantities in coal that contributes to environmental degradation when coal is burned. Sulfur dioxide (SO2) is produced as a gaseous by-product of coal combustion.
surface mine: A mine in which the coal lies near the surface and can be extracted by removing the covering layer of soil overburden. Surface mines are also known as open-pit mines.
tons: A "short" or net ton is equal to 2,000 pounds. A "long" or British ton is 2,240 pounds. A "metric" tonne is approximately 2,205 pounds. The short ton is the unit of measure referred to in this report.
Western Bituminous region: Coal producing area located in western Colorado and eastern Utah.
iii
Table of Contents
CAUTIONARY STATEMENT REGARDING FORWARD-LOOKING INFORMATION
This report contains "forward-looking statements." Statements included in this report that are not historical facts, that address activities, events or developments that we expect or anticipate will or may occur in the future, including things such as our plans, strategies, prospects and expectations concerning our business, operating results, financial condition and similar matters, are forward-looking statements. These statements can be identified by the use of forward-looking terminology, including "may," "believe," "expect," "anticipate," "estimate," "continue" or similar words. These statements are made by us based on our past experience and our perception of historical trends, current conditions and expected future developments as well as other considerations we believe are appropriate under the circumstances. Whether actual results and developments in the future will conform to our expectations is subject to numerous risks and uncertainties, many of which are beyond our control or our ability to predict. Therefore, actual outcomes and results could materially differ from what is expressed, implied or forecast in these statements. The following factors are among those that may cause actual results to differ materially from our forward-looking statements:
- •
- changes in governmental regulation of the mining industry or the electric utility industry;
- •
- adverse weather conditions and natural disasters;
- •
- weakness in global economic conditions;
- •
- decreases in demand for electricity and changes in demand for coal;
- •
- poor mining conditions resulting from geological conditions or the effects of prior mining;
- •
- equipment problems at mining locations;
- •
- the availability of transportation for coal shipments;
- •
- the availability and costs of key supplies and commodities such as steel, diesel fuel and explosives;
- •
- the availability and prices of competing electricity generation fuels;
- •
- our ability to secure or acquire high-quality coal reserves;
- •
- our ability to successfully diversify our operations into other non-coal natural resources;
- •
- our ability to find buyers for coal under favorable supply contracts; and
- •
- certain factors discussed elsewhere in this report, including those factors listed under "Risk Factors."
Readers are cautioned not to place undue reliance on forward-looking statements. The forward-looking statements speak only as of the date made, and we undertake no obligation to publicly update or revise any forward-looking statements, whether as a result of new information, future events or otherwise.
iv
Table of Contents
PART I
Unless the context clearly indicates otherwise, references in this report to "Rhino Predecessor," "we," "our," "us" or similar terms when used for periods prior to the completion of the initial public offering of common units of Rhino Resource Partners LP on October 5, 2010 (the "IPO") refer to Rhino Energy LLC and its subsidiaries. When used for periods subsequent to the completion of the IPO, "we,""our,""us," or similar terms refer to Rhino Resource Partners LP and its subsidiaries. References to our "general partner" refer to Rhino GP LLC, the general partner of Rhino Resource Partners LP.
Item 1. Business.
We are a growth oriented Delaware limited partnership formed to control and operate coal properties and invest in other natural resource assets. We produce, process and sell high quality coal of various steam and metallurgical grades. We market our steam coal primarily to electric utility companies as fuel for their steam powered generators. Customers for our metallurgical coal are primarily steel and coke producers who use our coal to produce coke, which is used as a raw material in the steel manufacturing process. In addition to operating coal properties, we manage and lease coal properties and collect royalties from such management and leasing activities. We have also invested in oil and gas mineral rights that we expect to generate royalty revenues in future periods.
We have a geographically diverse asset base with coal reserves located in Central Appalachia, Northern Appalachia, the Illinois Basin and the Western Bituminous region. As of December 31, 2011, we controlled an estimated 437.0 million tons of proven and probable coal reserves, consisting of an estimated 415.6 million tons of steam coal and an estimated 21.4 million tons of metallurgical coal. In addition, as of December 31, 2011, we controlled an estimated 417.1 million tons of non-reserve coal deposits. As of December 31, 2011, Rhino Eastern LLC, a joint venture in which we own a 51% membership interest and for which we serve as manager, controlled an estimated 43.4 million tons of proven and probable coal reserves at the Rhino Eastern mining complex located in Central Appalachia, consisting entirely of premium mid-vol and low-vol metallurgical coal, and an estimated 17.9 million tons of non-reserve coal deposits. As of December 31, 2011, we operated ten mines, including five underground and five surface mines, located in Kentucky, Ohio, West Virginia and Utah. In addition, our joint venture operates one underground mine in West Virginia. During 2010, we operated one underground mine in Colorado, but we temporarily idled this mine at year end 2010 and this mine remained idle at the end of 2011. The number of mines that we operate may vary from time to time depending on a number of factors, including the existing demand for and price of coal, depletion of economically recoverable reserves and availability of experienced labor. Excluding results from the joint venture, for the year ended December 31, 2011, we produced approximately 4.6 million tons of coal, purchased approximately 0.3 million tons of coal and sold approximately 4.9 million tons of coal. Additionally, the joint venture produced and sold approximately 0.3 million tons of premium mid-vol metallurgical coal for the year ended December 31, 2011. Additionally, lessees produced approximately 2.0 million tons of coal from our Elk Horn properties for the year ended December 31, 2011.
Our principal business strategy is to safely, efficiently and profitably produce, sell and lease both steam and metallurgical coal from our diverse asset base in order to maintain, and, over time, increase our quarterly cash distributions. In addition, we intend to expand our operations through strategic acquisitions, including the acquisition of stable, cash generating natural resource assets. We believe that such assets would allow us to grow our cash available for distribution and enhance stability of our cash flow.
History
Our predecessor was formed in April 2003 by Wexford Capital LP ("Wexford Capital", and together with certain of its affiliates and principals, "Wexford"). Wexford Capital is an SEC registered investment advisor which was formed in 1994 and manages a series of investment funds and has over $5.6 billion of assets under management. Since the formation of our predecessor, we have significantly grown our coal reserves. Since April 2003, we have completed numerous coal asset acquisitions with a
Table of Contents
total purchase price of approximately $353.0 million. Through these acquisitions and coal lease transactions, we have substantially increased our proven and probable coal reserves and non-reserve coal deposits. In addition, we have successfully grown our production through internal development projects.
Included in our coal asset acquisitions, in June 2011 we completed the acquisition of 100% of the ownership interests in The Elk Horn Coal Company ("Elk Horn") for approximately $119.7 million in cash consideration. Elk Horn is primarily a coal leasing company located in eastern Kentucky that provides us with coal royalty revenues, which we believe helps to diversify our income stream while limiting our direct operational risk.
In addition to our coal acquisitions, in 2011 we invested in oil and gas mineral rights in the Utica Shale region of eastern Ohio as well as the Cana Woodford region of western Oklahoma. During 2011, we invested a total of approximately $28.0 million in oil and gas mineral rights in these regions. While we continue to evaluate our options for our investments in these regions, we expect that royalty revenues can be generated in future periods from these investments, which we believe would help to further diversify our income stream.
On October 5, 2010, we completed our IPO, in which we sold an aggregate of 3,730,600 common units to the public. Our common units are listed on the New York Stock Exchange under the symbol "RNO". In connection with the IPO, Wexford contributed their membership interests in Rhino Energy LLC to us, and we issued 12,397,000 subordinated units representing limited partner interests in us and 8,666,400 common units to Wexford and issued incentive distribution rights to our general partner. Principals of Wexford Capital, including certain directors of our general partner, own the majority of the membership interests in our general partner.
In addition, on July 18, 2011, we completed a public offering of 2,875,000 common units, representing limited partner interests in us, at a price of $24.50 per common unit. Of the common units issued, 375,000 units were issued in connection with the exercise of the underwriters' option to purchase additional units.
We are managed by the board of directors and executive officers of our general partner. Our operations are conducted through, and our operating assets are owned by, our wholly owned subsidiary, Rhino Energy LLC, and its subsidiaries.
Coal Operations
Mining and Leasing Operations
As of December 31, 2011, we operated four mining complexes located in Central Appalachia (Tug River, Rob Fork, Deane and Rhino Eastern (owned by the joint venture with an affiliate of Patriot Coal Corporation, or "Patriot")) along with our Elk Horn coal leasing operations in Central Appalachia that were purchased in June 2011. In addition, we operated two mining complexes located in Northern Appalachia (Hopedale and Sands Hill). In the Western Bituminous region, we operated one mining complex beginning in early 2011 located in Emery and Carbon Counties, Utah (Castle Valley) that was purchased out of bankruptcy in August 2010. During 2010, we operated one mine located in the Western Bituminous region in Colorado (McClane Canyon) that has been temporarily idled since the end of 2010 and remained idle at the end of 2011. We have received a conditional permit to build a rail loadout at this location, pending bonding, and we plan to restart production at the McClane Canyon mine when market conditions are favorable.
We define a mining complex as a central location for processing raw coal and loading coal into railroad cars or trucks for shipment to customers. These mining complexes include six active preparation plants and/or loadouts (including one owned by our joint venture partner), each of which receive, blend, process and ship coal that is produced from one or more of our active surface and
2
Table of Contents
underground mines. All of the preparation plants are modern plants that have both coarse and fine coal cleaning circuits. In addition to our six active preparation plants and/or loadouts, we are currently constructing an additional preparation plant at our Tug River mining complex that we expect to be operating in the second quarter of 2012. As of December 31, 2011, we had capital expenditure commitments of approximately $12.2 million related to completing the construction of the preparation plant.
3
Table of Contents
The following map shows the location of our coal mining and leasing operations as of December 31, 2011:
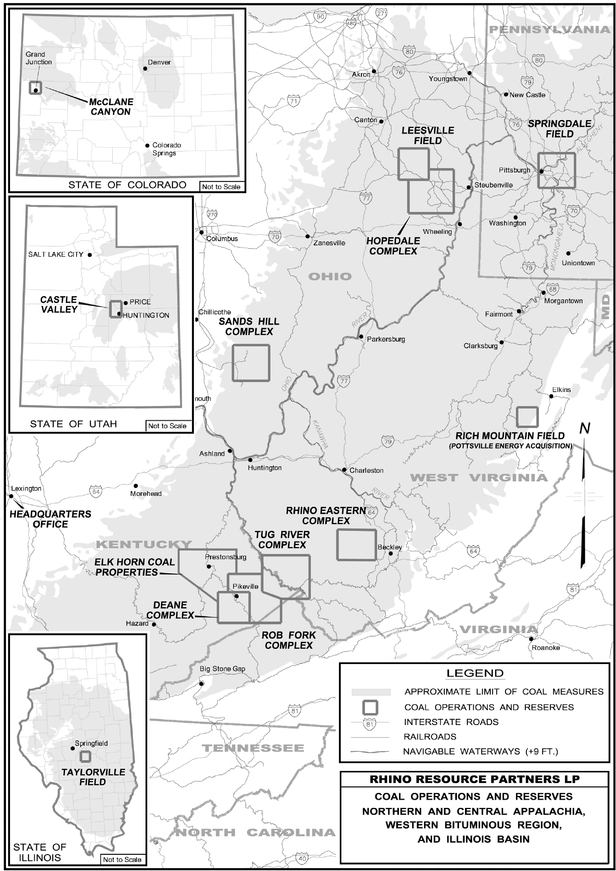
4
Table of Contents
Our surface mines include area mining and contour mining. These operations use truck and wheel loader equipment fleets along with large production tractors and shovels. Our underground mines utilize the room and pillar mining method. These operations generally consist of one or more single or dual continuous miner sections which are made up of the continuous miner, shuttle cars, roof bolters, feeder and other support equipment. We currently own most of the equipment utilized in our mining operations. We employ preventive maintenance and rebuild programs to ensure that our equipment is modern and well-maintained. The rebuild programs are performed either by an on-site shop or by third-party manufacturers. The mobile equipment utilized at our mining operations is scheduled for replacement on an on-going basis with new, more efficient units according to a predetermined schedule.
The following table summarizes our and the joint venture's mining complexes and production by region as of December 31, 2011. The tons produced by the Elk Horn lessees are not included in the table below since we did not directly mine these tons, but rather collected royalty revenues from the lessees.
| | | | | | | | | | | | | | | | | |
| |
| |
| | Number and
Type of Active Mines(2) | |
| |
|---|
| |
| |
| | Tons Produced
for the
Year Ended
December 31,
2011(3) | |
|---|
Region | | Preparation
Plants and
Loadouts | | Transportation
to Customers(1) | | Company
Operated
Mines | | Contractor
Operated
Mines | | Total
Mines | |
|---|
| |
| |
| |
| |
| |
| | (in million tons)
| |
|---|
Central Appalachia | | | | | | | | | | | | | | | | | |
Tug River Complex (KY, WV) | | Jamboree(4) | | Truck, Barge, Rail (NS) | | | 1S | | | — | | | 1S | | | 0.4 | |
Rob Fork Complex (KY) | | Rob Fork | | Truck, Barge, Rail (CSX) | | | 1U, 2S | | | — | | | 1U, 2S | | | 1.3 | |
Deane Complex (KY) | | Rapid Loader | | Rail (CSX) | | | 1U | | | 1U | | | 2U | | | 0.3 | |
Northern Appalachia | | | | | | | | | | | | | | | | | |
Hopedale Complex (OH) | | Nelms | | Truck, Rail (OHC, WLE) | | | 1U | | | — | | | 1U | | | 1.3 | |
Sands Hill Complex (OH) | | Sands Hill(5) | | Truck, Barge | | | 2S | | | — | | | 2S | | | 0.7 | |
Illinois Basin | | | | | | | | | | | | | | | | | |
Taylorville Field (IL) | | n/a | | Rail (NS) | | | — | | | — | | | — | | | — | |
Western Bituminous | | | | | | | | | | | | | | | | | |
Castle Valley Complex (UT) | | Truck loadout | | Truck | | | 1U | | | — | | | 1U | | | 0.6 | |
McClane Canyon Mine (CO)(6) | | n/a | | Truck | | | — | | | — | | | — | | | — | |
| | | | | | | | | | | | | | |
Total | | | | | | | 4U,5S | | | 1U | | | 5U,5S | | | 4.6 | |
| | | | | | | | | | | | | | |
Central Appalachia | | | | | | | | | | | | | | | | | |
Rhino Eastern Complex (WV)(7) | | Rocklick | | Truck, Rail (NS, CSX) | | | 2U | | | — | | | 2U | | | | |
- (1)
- NS = Norfolk Southern Railroad; CSX = CSX Railroad; OHC = Ohio Central Railroad; WLE = Wheeling & Lake Erie Railroad.
- (2)
- Numbers indicate the number of active mines. U = underground; S = surface.
- (3)
- Total production based on actual amounts and not rounded amounts shown in this table.
- (4)
- Includes only a loadout facility.
- (5)
- Includes only a preparation plant.
- (6)
- The McClane Canyon mine was temporarily idled as of December 31, 2010 and remained idle as of December 31, 2011.
- (7)
- Owned by a joint venture in which we have a 51% membership interest and for which we serve as manager. Amounts shown include 100% of the production. The Rocklick preparation plant is owned and operated by our joint venture partner with whom the joint venture has a transloading agreement for use of the facility.
Central Appalachia. As of December 31, 2011, we operated four mining complexes located in Central Appalachia consisting of five active underground mines, four of which are company-operated and one that is contractor-operated. In addition, we operated three company-operated surface mines. For the year ended December 31, 2011, the mines at our Tug River, Rob Fork and Deane mining complexes produced an aggregate of approximately 1.3 million tons of steam coal and an estimated 0.7 million tons of metallurgical coal, and the underground mines at the Rhino Eastern mining
5
Table of Contents
complex, owned by the joint venture in which we have a 51% membership interest and for which we serve as manager, produced approximately 0.3 million tons of metallurgical coal. In addition, for the year ended December 31, 2011, lessees of our Elk Horn properties produced approximately 2.0 million tons of coal since our acquisition of Elk Horn in June 2011.
Tug River Mining Complex. Our Tug River mining complex consists of property in Kentucky and West Virginia that borders the Tug River. Our Tug River mining complex produces coal from one company-operated surface mine. Coal production from this mine is delivered by truck to the Jamboree loadout for blending and loading or to the Rob Fork facilities for processing, blending and loading. The Jamboree loadout is located on the Norfolk Southern Railroad and is a modern unit train loadout with batch weighing equipment. The Jamboree loadout is used primarily to process surface mined coal which is sold as steam coal to electric utilities. This mining complex produced approximately 0.3 million tons of steam coal and approximately 0.1 million tons of metallurgical coal for the year ended December 31, 2011. As mentioned earlier, we are currently constructing an additional preparation plant at our Tug River mining complex that we expect to be operating in the first quarter of 2012. This new preparation plant will allow us to discontinue our need to transport coal from this complex to our Rob Fork preparation plant, which we believe will provide us cost savings in future periods.
Rob Fork Mining Complex. Our Rob Fork mining complex is located in eastern Kentucky and currently produces coal from two company-operated surface mines and one company-operated underground mine. The Rob Fork mining complex is located on the CSX Railroad and consists of a modern preparation plant utilizing heavy media circuitry that is capable of cleaning coarse and fine coal size fractions and a unit train loadout with batch weighing equipment. The mining complex has significant blending capabilities allowing the blending of raw coals with washed coals to meet a wide variety of customers' needs. The Rob Fork mining complex produced approximately 0.8 million tons of steam coal and 0.5 million tons of metallurgical coal for the year ended December 31, 2011.
Deane Mining Complex. Our Deane mining complex is located in eastern Kentucky and produces steam coal from one company-operated underground mine and one contractor-operated underground mine. The infrastructure consists of a preparation plant utilizing heavy media circuitry capable of cleaning coarse and fine coal size fractions, as well as a unit train loadout facility with batch weighing equipment capable of loading in excess of 10,000 tons into railcars in approximately four hours. The facility has significant blending capabilities allowing the blending of raw coals with washed coals to meet a wide variety of customers' needs. The Deane complex produced approximately 0.3 million tons of steam coal for the year ended December 31, 2011.
Rhino Eastern Mining Complex. The Rhino Eastern mining complex is located in Raleigh and Wyoming Counties, West Virginia. We have a 51% membership interest in, and serve as manager for, the joint venture that owns the Rhino Eastern mining complex. Pursuant to the terms of a coal purchase agreement entered into under the joint venture agreement, an affiliate of our joint venture partner, Patriot, controls the amount and terms of sales of the coal produced from the Rhino Eastern mining complex.
The Rhino Eastern mining complex currently produces premium metallurgical coal from two company-operated underground mines. Raw coal is trucked from the mine to a facility owned by our joint venture partner to be sized, washed and shipped by truck or via one of two rail loadouts, located on the CSX Railroad and the Norfolk Southern Railroad. The Rhino Eastern mining complex produced approximately 0.3 million tons of premium mid-vol metallurgical coal for the year ended December 31, 2011.
Elk Horn Coal Leasing. In June 2011, we completed the acquisition of 100% of the ownership interests in Elk Horn for approximately $119.7 million in cash consideration. Elk Horn is a primarily coal leasing company located in eastern Kentucky that provides us with coal royalty revenues. For the
6
Table of Contents
year ended December 31, 2011, Elk Horn lessees produced approximately 2.0 million tons of coal from our Elk Horn properties.
Northern Appalachia. We operate two mining complexes located in Northern Appalachia consisting of one company-operated underground mine and two company-operated surface mines. For the year ended December 31, 2011, these mines produced an aggregate of approximately 2.1 million tons of steam coal.
Hopedale Mining Complex. The Hopedale mining complex includes an underground mine located in Hopedale, Ohio approximately five miles northeast of Cadiz, Ohio. Coal produced from the Hopedale mine is first cleaned at our Nelms preparation plant located on the Ohio Central Railroad and the Wheeling & Lake Erie Railroad in Cadiz, Ohio and then shipped by train or truck to our customers. The infrastructure includes a full-service loadout facility. This underground mining operation produced approximately 1.3 million tons of steam coal for the year ended December 31, 2011.
Sands Hill Mining Complex. We operate two surface mines at our Sands Hill mining complex, located near Hamden, Ohio. In 2009, we completed construction of a river-front barge and dock facility on the Ohio River. The infrastructure also includes a preparation plant. The Sands Hill mining complex produced approximately 0.7 million tons of steam coal and approximately 0.4 million tons of limestone aggregate for the year ended December 31, 2011.
Western Bituminous Region. In January 2011, we began production at an underground mine in Emery and Carbon Counties, Utah. During 2010, we operated an underground mine in the Western Bituminous region of Colorado, which has been temporarily idled.
Castle Valley Mining Complex. In August 2010, we completed the acquisition of certain mining assets of C.W. Mining Company out of bankruptcy. The assets acquired are located in Emery and Carbon Counties, Utah and include coal reserves and non-reserve coal deposits, underground mining equipment and infrastructure, an overland belt conveyor system, a loading facility and support facilities. In January 2011, we began production at one underground mine at this complex. The Castle Valley mining complex produced approximately 0.6 million tons of steam coal for the year ended December 31, 2011.
McClane Canyon Mine. The McClane Canyon mine is located near Loma, Colorado and is on property leased from the Bureau of Land Management ("BLM"). We temporarily idled production at this mine at the end of 2010 and the mine remained idle at the end of 2011. We have received a conditional permit to build a rail loadout at this location, pending bonding, and we believe access to a rail loadout will enable us to expand our customer base. We plan to restart production at the McClane Canyon mine when market conditions are favorable.
In addition to the McClane Canyon mine, we currently control three nearby federal leases consisting of approximately 7,600 acres, two of which have the potential to support a future underground coal mining operation with procurement of an adjacent federal leasehold. We began the permitting process and leasehold procurement in 2005 and expect the process to last approximately one to three more years. We are currently in an exploration process to define the volume, quality, and mineability of the coal reserves.
Other Non-Mining Operations
In addition to our mining operations, we operate several subsidiaries which provide auxiliary services for our coal mining operations. Rhino Trucking provides our Kentucky coal operations with dependable, safe coal hauling to our preparation plants and loadout facilities and our southeastern Ohio coal operations with reliable transportation to our customers where rail is not available. Rhino Services is responsible for mine-related construction, site and roadway maintenance and post-mining reclamation. Through Rhino Services, we plan and monitor each phase of our mining projects as well
7
Table of Contents
as the post-mining reclamation efforts. We also perform the majority of our drilling and blasting activities at our company-operated surface mines in-house rather than contracting to a third party. Our Triad Roof Support Systems subsidiary manufactures roof control products used in underground coal mining.
Other Natural Resource Assets
Oil and Gas
In addition to our coal operations, we have invested in oil and gas mineral rights that we expect to generate royalty revenues in future periods, which we believe will help to diversify our income stream.
We and an affiliate of Wexford Capital have participated with Gulfport Energy, a publicly traded company, to acquire an interest in a portfolio of oil and gas leases in the Utica Shale. As of February 20, 2012, an affiliate of Wexford Capital owned approximately 13.3% of the common stock of Gulfport Energy. During 2011, we completed the acquisitions of interests in a portfolio of leases in the Utica Shale region of eastern Ohio for a total purchase price of approximately $19.9 million.
During 2011, we completed the acquisition of certain oil and gas mineral rights in the Cana Woodford region of western Oklahoma for a total purchase price of approximately $8.1 million. We expect royalty revenues to be generated from these mineral rights in future periods.
Limestone
Incidental to our coal mining process, we mine limestone from reserves located at our Sands Hill mining complex and sell it as aggregate to various construction companies and road builders that are located in close proximity to the mining complex when market conditions are favorable. We believe that our production of limestone provides us with an additional source of revenues at low incremental capital cost.
Customers
General
Our primary customers for our steam coal are electric utilities, and the metallurgical coal we produce is sold primarily to domestic and international steel producers. Excluding results from the joint venture, for the year ended December 31, 2011, approximately 87% of our coal sales tons consisted of steam coal and approximately 13% consisted of metallurgical coal. For the year ended December 31, 2011, 100% of the joint venture's coal sales tons consisted of metallurgical coal. For the year ended December 31, 2011, excluding results from the joint venture, approximately 63% of our coal sales tons that we produced were sold to electric utilities. The majority of our electric utility customers purchase coal for terms of one to three years, but we also supply coal on a spot basis for some of our customers. Excluding the results from the joint venture, for the year ended December 31, 2011, we derived approximately 82.1% of our total coal revenues from sales to our ten largest customers, with affiliates of our top three customers accounting for approximately 44.8% of our coal revenues for that period: GenOn Energy, Inc. (fka Mirant Corporation) (17.1%); PPL Corporation (14.3%); and American Electric Power Company, Inc. (13.4%). Additionally, pursuant to the terms of a coal purchase agreement entered into under the joint venture agreement, we sell 100% of the joint venture's production to an affiliate of our joint venture partner, Patriot, which controls the amount and terms of sales of the coal produced from the joint venture. Incidental to our coal mining process, we mine limestone and sell it as aggregate to various construction companies and road builders that are located in close proximity to our Sands Hill mining complex.
8
Table of Contents
Coal Supply Contracts
For the years ended December 31, 2011 and 2010, approximately 77% and 96%, respectively, of our aggregate coal tons sold were sold through supply contracts. We expect to continue selling a significant portion of our coal under supply contracts.
Quality and volumes for the coal are stipulated in coal supply contracts, and in some instances buyers have the option to vary annual or monthly volumes. Most of our coal supply contracts contain provisions requiring us to deliver coal within certain ranges for specific coal characteristics such as heat content, sulfur, ash, hardness and ash fusion temperature. Failure to meet these specifications can result in economic penalties, suspension or cancellation of shipments or termination of the contracts. Some of our contracts specify approved locations from which coal may be sourced. Some of our contracts set out mechanisms for temporary reductions or delays in coal volumes in the event of a force majeure, including events such as strikes, adverse mining conditions, mine closures, or serious transportation problems that affect us or unanticipated plant outages that may affect the buyers.
The terms of our coal supply contracts result from competitive bidding procedures and extensive negotiations with customers. As a result, the terms of these contracts, including price adjustment features, price re-opener terms, coal quality requirements, quantity parameters, permitted sources of supply, future regulatory changes, extension options, force majeure, termination and assignment provisions, vary significantly by customer.
Lease Agreements
With respect to our Elk Horn leasing operations, we enter into leases with coal mine operators granting them the right to mine and sell coal from our Elk Horn properties in exchange for a royalty payment. Generally the lease terms provide us with a royalty fee of 6% to 9% of the gross sales price of the coal, with a minimum royalty fee ranging from $1.85 to $4.75 per ton. The terms of such leases vary from five years to the life of the reserves. A minimum royalty is required annually or monthly whether or not the property is mined.
Transportation
We ship coal to our customers by rail, truck or barge. For the year ended December 31, 2011, the majority of our coal sales tonnage was shipped by rail. The majority of our coal is transported to customers by either the CSX Railroad or the Norfolk Southern Railroad in eastern Kentucky and by the Ohio Central Railroad or the Wheeling & Lake Erie Railroad in Ohio. In addition, in southeastern Ohio, we use our own trucking operations to transport coal to our customers where rail is not available. We used third-party trucking to transport coal to our customers in Utah. We temporarily idled the McClane Canyon mine at December 31, 2010, and we have received a conditional permit to build a rail loadout at this location, pending bonding. This mine remained idle at December 31, 2011. In addition, coal from certain of our mines is located within economical trucking distance to the Big Sandy River and/or the Ohio River and can be transported by barge. It is customary for customers to pay the transportation costs to their location.
We believe that we have good relationships with rail carriers and truck companies due, in part, to our modern coal-loading facilities at our loadouts and the working relationships and experience of our transportation and distribution employees.
Suppliers
Principal supplies used in our business include diesel fuel, explosives, maintenance and repair parts and services, roof control and support items, tires, conveyance structures, ventilation supplies and
9
Table of Contents
lubricants. We use third-party suppliers for a significant portion of our equipment rebuilds and repairs, drilling services and construction.
We have a centralized sourcing group for major supplier contract negotiation and administration, for the negotiation and purchase of major capital goods and to support the mining and coal preparation plants. We are not dependent on any one supplier in any region. We promote competition between suppliers and seek to develop relationships with those suppliers whose focus is on lowering our costs. We seek suppliers who identify and concentrate on implementing continuous improvement opportunities within their area of expertise.
Competition
The coal industry is highly competitive. There are numerous large and small producers in all coal producing regions of the United States and we compete with many of these producers. Our main competitors include Alliance Resource Partners LP, Alpha Natural Resources, Inc., Arch Coal, Inc., Booth Energy Group, CONSOL Energy Inc., James River Coal Company, Murray Energy Corporation, Oxford Resource Partners, LP, Patriot and TECO Energy, Inc.
The most important factors on which we compete are coal price, coal quality and characteristics, transportation costs and the reliability of supply. Demand for coal and the prices that we will be able to obtain for our coal are closely linked to coal consumption patterns of the domestic electric generation industry and international consumers. These coal consumption patterns are influenced by factors beyond our control, including demand for electricity, which is significantly dependent upon economic activity and summer and winter temperatures in the United States, government regulation, technological developments and the location, availability, quality and price of competing sources of fuel such as natural gas, oil and nuclear, and alternative energy sources such as hydroelectric power.
Regulation and Laws
The coal mining industry is subject to regulation by federal, state and local authorities on matters such as:
- •
- employee health and safety;
- •
- mine permits and other licensing requirements;
- •
- air quality standards;
- •
- water quality standards;
- •
- storage, treatment, use and disposal of petroleum products and other hazardous substances;
- •
- plant and wildlife protection;
- •
- reclamation and restoration of mining properties after mining is completed;
- •
- the discharge of materials into the environment, including waterways or wetlands;
- •
- storage and handling of explosives;
- •
- wetlands protection;
- •
- surface subsidence from underground mining;
- •
- the effects, if any, that mining has on groundwater quality and availability; and
- •
- legislatively mandated benefits for current and retired coal miners.
In addition, many of our customers are subject to extensive regulation regarding the environmental impacts associated with the combustion or other use of coal, which could affect demand for our coal.
10
Table of Contents
The possibility exists that new laws or regulations, or new interpretations of existing laws or regulations, may be adopted that may have a significant impact on our mining operations or our customers' ability to use coal.
We are committed to conducting mining operations in compliance with applicable federal, state and local laws and regulations. However, because of extensive and comprehensive regulatory requirements, violations during mining operations occur from time to time. Violations, including violations of any permit or approval, can result in substantial civil and in severe cases, criminal fines and penalties, including revocation or suspension of mining permits. None of the violations to date have had a material impact on our operations or financial condition.
While it is not possible to quantify the costs of compliance with applicable federal and state laws and regulations, those costs have been and are expected to continue to be significant. Nonetheless, capital expenditures for environmental matters have not been material in recent years. We have accrued for the present value of estimated cost of reclamation and mine closings, including the cost of treating mine water discharge when necessary. The accruals for reclamation and mine closing costs are based upon permit requirements and the costs and timing of reclamation and mine closing procedures. Although management believes it has made adequate provisions for all expected reclamation and other costs associated with mine closures, future operating results would be adversely affected if we later determined these accruals to be insufficient. Compliance with these laws and regulations has substantially increased the cost of coal mining for all domestic coal producers.
Mining Permits and Approvals
Numerous governmental permits or approvals are required for coal mining operations. When we apply for these permits and approvals, we are often required to assess the effect or impact that any proposed production of coal may have upon the environment. The permit application requirements may be costly and time consuming, and may delay or prevent commencement or continuation of mining operations in certain locations. Future laws and regulations may emphasize more heavily the protection of the environment and, as a consequence, our activities may be more closely regulated. Laws and regulations, as well as future interpretations or enforcement of existing laws and regulations, may require substantial increases in equipment and operating costs, or delays, interruptions or terminations of operations, the extent of any of which cannot be predicted. The permitting process for certain mining operations can extend over several years, and can be subject to judicial challenge, including by the public. Some required mining permits are becoming increasingly difficult to obtain in a timely manner, or at all. We may experience difficulty and/or delay in obtaining mining permits in the future.
Regulations provide that a mining permit can be refused or revoked if the permit applicant or permittee owns or controls, directly or indirectly through other entities, mining operations which have outstanding environmental violations. Although, like other coal companies, we have been cited for violations in the ordinary course of business, we have never had a permit suspended or revoked because of any violation, and the penalties assessed for these violations have not been material.
Before commencing mining on a particular property, we must obtain mining permits and approvals by state regulatory authorities of a reclamation plan for restoring, upon the completion of mining, the mined property to its approximate prior condition, productive use or other permitted condition.
Mine Health and Safety Laws
Stringent safety and health standards have been in effect since the adoption of the Coal Mine Health and Safety Act of 1969. The Federal Mine Safety and Health Act of 1977 (the "Mine Act"), and regulations adopted pursuant thereto, significantly expanded the enforcement of health and safety standards and imposed comprehensive safety and health standards on numerous aspects of mining operations, including training of mine personnel, mining procedures, blasting, the equipment used in
11
Table of Contents
mining operations and other matters. The Mine Safety and Health Administration ("MSHA") monitors compliance with these laws and regulations. In addition, the states where we operate also have state programs for mine safety and health regulation and enforcement. Federal and state safety and health regulations affecting the coal industry are complex, rigorous and comprehensive, and have a significant effect on our operating costs.
The Mine Act is a strict liability statute that requires mandatory inspections of surface and underground coal mines and requires the issuance of enforcement action when it is believed that a standard has been violated. A penalty is required to be imposed for each cited violation. Negligence and gravity assessments result in a cumulative enforcement scheme that may result in the issuance of an order requiring the immediate withdrawal of miners from the mine or shutting down a mine or any section of a mine or any piece of mine equipment. The Mine Act contains criminal liability provisions. For example, criminal liability may be imposed for corporate operators who knowingly or willfully authorize, order or carry out violations. The Mine Act also provides that civil and criminal penalties may be assessed against individual agents, officers and directors who knowingly authorize, order or carry out violations.
We have developed a health and safety management system that, among other things, educates our employees about health and safety requirements including those arising under federal and state laws that apply to our mines. In addition, our health and safety management system tracks the performance of each operational facility in meeting the requirements of safety laws and company safety policies. As an example of the resources we allocate to health and safety matters, our safety management system includes a company-wide safety director and local safety directors who oversee safety and compliance at operations on a day-to-day basis. We continually monitor the performance of our safety management system and from time-to-time modify that system to address findings or reflect new requirements or for other reasons. We have even integrated safety matters into our compensation and retention decisions. For instance, our bonus program includes a meaningful evaluation of each eligible employee's role in complying with, fostering and furthering our safety policies.
We evaluate a variety of safety-related metrics to assess the adequacy and performance of our safety management system. For example, we monitor and track performance in areas such as "accidents, reportable accidents, lost time accidents and the lost-time accident frequency rate" and a number of others. Each of these metrics provides insights and perspectives into various aspects of our safety systems and performance at particular locations or mines generally and, among other things, can indicate where improvements are needed or further evaluation is warranted with regard to the system or its implementation. An important part of this evaluation is to assess our performance relative to certain national benchmarks.
Our non-fatal days lost time incidence rate for all operations for the year ended December 31, 2011 was 1.64 as compared to the most recent national average of 2.44, as reported by MSHA, or 32.8% below this national average. Non-fatal days lost incidence rate is an industry standard used to describe occupational injuries that result in loss of one or more days from an employee's scheduled work. In addition, for the year ended December 31, 2011 our average MSHA violations per inspection day was 0.75 as compared to the most recent national average of 0.82 violations per inspection day as reported by MSHA, or 8.5% below this national average.
In 2006, in response to underground mine accidents, the Mine Improvement and New Emergency Response Act of 2006, or MINER Act, was enacted. The MINER Act significantly amended the Mine Act, requiring improvements in mine safety practices, increasing criminal penalties and establishing a maximum civil penalty for non-compliance, and expanding the scope of federal oversight, inspection and enforcement activities. Since passage of the MINER Act, enforcement scrutiny has increased, including more inspection hours at mine sites, increased numbers of inspections and increased issuance of the number and the severity of enforcement actions and related penalties. Various states also have
12
Table of Contents
enacted their own new laws and regulations addressing many of these same subjects. MSHA continues to interpret and implement various provisions of the MINER Act, along with introducing new proposed regulations and standards. Among these new proposed regulations is MSHA's proposed rule titled "Lowering Miner's Exposure to Respirable Coal Mine Dust, Including Continuous Personal Dust Monitors." The rule, which is in the final rule stage, would require a 50% reduction in the allowable respirable coal mine dust exposure limits and require each operation to significantly increase the number of respirable coal mine dust samples taken. The rule would also increase oversight by MSHA regarding coal mine dust and ventilation issues at each mine, including the approval process for ventilation plans at each mine. MSHA also adopted a final rule incorporating the requirements contained in the 2010 Emergency Temporary Standard that requires the application and continued maintenance of a significantly increased amount of rock dust throughout underground coal mines. Another proposal in the final rule stage is titled "Examinations of Work Areas in Underground Coal Mines for Violations of Mandatory Health or Safety Standards," and would require mine operators to locate, record, and correct all violations of mandatory health or safety standards, and no longer focus on hazardous conditions. The rule would also require that mine operators review with mine examiners, on a quarterly basis, all citations and orders issued in areas where examinations are required.
Mining accidents in the last several years in West Virginia, Kentucky and Utah have received national attention and instigated responses at the state and national levels that have resulted in increased scrutiny of current safety practices and procedures at all mining operations, particularly underground mining operations. More stringent mine safety laws and regulations promulgated by these states and the federal government have included increased sanctions for non-compliance. Other states have proposed or passed similar bills, resolutions or regulations addressing mine safety practices. Moreover, workplace accidents, such as the April 5, 2010, Upper Big Branch Mine incident, have resulted in more inspection hours at mine sites, increased number of inspections and increased issuance of the number and severity of enforcement actions and the passage of new laws and regulations. These trends are likely to continue.
Following the April 5, 2010 Upper Big Branch mine incident, public scrutiny of large mining operations has increased among government officials as well as regulatory agencies. On April 14, 2010, U.S. Representative George Miller publicly released a list of mining operations which would have faced "pattern of violation" sanctions were it not for contested notices of violation. This list included our Mine 28 in Pike County, Kentucky. After additional inspections on April 20, 2010, MSHA issued various citations related to Mine 28. Although we took steps to immediately abate certain of these citations, we may incur various penalties or sanctions, in part due to MSHA's proposed rule on pattern of violations ("POV"). Under the rule, which is in the final rule stage, MSHA may consider non-final citations and orders when determining POV status. In addition, mine operators would no longer receive notice of a potential POV, and thus not have the opportunity to mitigate the problem by developing a remediation plan. Instead, operators would be expected to monitor compliance by reviewing criteria for POV posted on MSHA's website.
From time to time, certain portions of individual mines have been required to suspend or shut down operations temporarily in order to address a compliance requirement or because of an accident. For instance, MSHA issues orders pursuant to Section 103(k) that, among other things, call for operations in the area of the mine at issue to suspend operations until compliance is restored. Likewise, if an accident occurs within a mine, the MSHA requirements call for all operations in that area to be suspended until the circumstance leading to the accident has been resolved. During the fiscal year ended December 31, 2011 (as in earlier years), we received such orders from government agencies and have experienced accidents within our mines requiring the suspension or shutdown of operations in those particular areas until the circumstances leading to the accident have been resolved. While the violations or other circumstances that caused such an accident were being addressed, other areas of the mine could and did remain operational. These circumstances did not require us to suspend
13
Table of Contents
operations on a mine-wide level or otherwise entail material financial or operational consequences for us. Any suspension of operations at any one of our locations that may occur in the future may have material financial or operational consequences for us.
It is our practice to contest notices of violations in cases in which we believe we have a good faith defense to the alleged violation or the proposed penalty and/or other legitimate grounds to challenge the alleged violation or the proposed penalty. In December 2008 and March 2009, MSHA assessed proposed penalties in excess of $100,000 with regard to three separate notices of violation, all of which relate to our operations at Mine 28. Each of these notices of violation alleged an "unwarrantable failure" under the Mine Act with specific regard to the accumulation of combustible materials. The combustible materials typically underlying such citations are coal, loose coal, and float coal dust. We have contested these violations on grounds that the underlying circumstances did not support the issuance of a notice of violation and/or the gravity of the proposed penalty. These contests are still pending and we cannot predict the outcome of these proceedings or assure you that the fines and penalties will not be assessed in full against us. These alleged violations were abated at the time or immediately after the notices of violation were issued, and we have not been issued any notices of violation from MSHA proposing a penalty in excess of $100,000 since March 2009.
We exercise substantial efforts toward achieving compliance at our mines. In light of the recent citations issued with respect to our mines, we have further increased our focus with regard to health and safety at all of our mines and at Mine 28 and Eagle #1 Mine in particular. These efforts include hiring additional skilled personnel, providing training programs, hosting quarterly safety meetings with MSHA personnel and making capital expenditures in consultation with MSHA aimed at increasing mine safety. We believe that these efforts have contributed, and continue to contribute, positively to safety and compliance at our mines.
Implementing and complying with these state and federal safety laws and regulations could adversely affect our results of operations and financial position. Some safety measures may decrease our production rates or cause us not to pursue certain reserves due to safety concerns, adversely affecting our revenues.
Black Lung Laws
Under federal black lung benefits laws, businesses that conduct current mining operations must make payments of black lung benefits to coal miners with black lung disease and to some survivors of a miner who dies from this disease. To help fund these benefits, a tax is levied on production of $1.10 per ton for underground-mined coal and $0.55 per ton for surface-mined coal, but not to exceed 4.4% of the applicable sales price, in order to compensate miners who are totally disabled due to black lung disease and some survivors of miners who died from this disease, and who were last employed as miners prior to 1970 or subsequently where no responsible coal mine operator has been identified for claims. In addition, some claims for which coal operators had previously been responsible will be obligations of the government trust funded by the tax. The Revenue Act of 1987 extended the termination date of this tax from January 1, 1996, to the earlier of January 1, 2014, or the date on which the government trust becomes solvent. In 2011, we recorded approximately $3.0 million of expense related to this excise tax.
On March 23, 2010, President Obama signed into law health care reform legislation, known as the Patient Protection and Affordable Care Act, which includes significant changes to the federal black lung program. Among other things, these changes include provisions, retroactive to 2005, which would (1) provide an automatic survivor benefit paid upon the death of a miner with an awarded black lung claim, without requiring proof that the death was due to pneumoconiosis and (2) establish a rebuttable presumption with regard to pneumoconiosis among miners with 15 or more years of coal mine
14
Table of Contents
employment that are totally disabled by a respiratory condition. These changes could have a material impact on our costs expended in association with the federal black lung program.
For miners last employed as miners after 1969 and who are determined to have contracted black lung, we maintain insurance coverage sufficient to cover the cost of present and future claims or we participate in state programs that provide this coverage. We may also be liable under state laws for black lung claims and are covered through either insurance policies or state programs. Congress and state legislatures regularly consider various items of black lung legislation, which, if enacted, could adversely affect our business, results of operations and financial position.
Workers' Compensation
We are required to compensate employees for work-related injuries under various state workers' compensation laws. The states in which we operate consider changes in workers' compensation laws from time to time. Our costs will vary based on the number of accidents that occur at our mines and other facilities, and our costs of addressing these claims. We are insured under the Ohio State Workers Compensation Program for our operations in Ohio. Our remaining operations, including Central Appalachia and the Western Bituminous region, are insured through Rockwood Casualty Insurance Company.
Surface Mining Control and Reclamation Act ("SMCRA")
SMCRA establishes operational, reclamation and closure standards for all aspects of surface mining, including the surface effects of underground coal mining. SMCRA requires that comprehensive environmental protection and reclamation standards be met during the course of and upon completion of mining activities. In conjunction with mining the property, we reclaim and restore the mined areas by grading, shaping and preparing the soil for seeding. Upon completion of mining, reclamation generally is completed by seeding with grasses or planting trees for a variety of uses, as specified in the approved reclamation plan. We believe we are in compliance in all material respects with applicable regulations relating to reclamation.
SMCRA and similar state statutes require, among other things, that mined property be restored in accordance with specified standards and approved reclamation plans. The act requires that we restore the surface to approximate the original contours as soon as practicable upon the completion of surface mining operations. The mine operator must submit a bond or otherwise secure the performance of these reclamation obligations. Mine operators can also be responsible for replacing certain water supplies damaged by mining operations and repairing or compensating for damage to certain structures occurring on the surface as a result of mine subsidence, a consequence of long-wall mining and possibly other mining operations. In addition, the Abandoned Mine Lands Program, which is part of SMCRA, imposes a tax on all current mining operations, the proceeds of which are used to restore mines closed prior to SMCRA's adoption in 1977. The maximum tax is 31.5 cents per ton on surface-mined coal and 13.5 cents per ton on underground-mined coal. As of December 31, 2011, we had accrued approximately $34.1 million for the estimated costs of reclamation and mine closing, including the cost of treating mine water discharge when necessary. In addition, states from time to time have increased and may continue to increase their fees and taxes to fund reclamation of orphaned mine sites and abandoned mine drainage control on a statewide basis.
After the application is submitted, public notice or advertisement of the proposed permit action is required, which is followed by a public comment period. It is not uncommon for a SMCRA mine permit application to take over two years to prepare and review, depending on the size and complexity of the mine, and another two years or even longer for the permit to be issued. The variability in time frame required to prepare the application and issue the permit can be attributed primarily to the various regulatory authorities' discretion in the handling of comments and objections relating to the
15
Table of Contents
project received from the general public and other agencies. Also, it is not uncommon for a permit to be delayed as a result of judicial challenges related to the specific permit or another related company's permit.
Federal laws and regulations also provide that a mining permit or modification can be delayed, refused or revoked if owners of specific percentages of ownership interests or controllers (i.e., officers and directors or other entities) of the applicant have, or are affiliated with another entity that has outstanding violations of SMCRA or state or tribal programs authorized by SMCRA. This condition is often referred to as being "permit blocked" under the federal Applicant Violator Systems, or AVS. Thus, non-compliance with SMCRA can provide the bases to deny the issuance of new mining permits or modifications of existing mining permits, although we know of no basis by which we would be (and we are not now) permit-blocked.
In addition, on November 30, 2009, the Office of Surface Mining Reclamation and Enforcement ("OSM") published an advance notice of proposed rulemaking to revise the "stream buffer zone rule," or SBZ Rule, that prohibits mining disturbances within 100 feet of streams if there would be a negative effect on water quality. OSM had previously issued a Stream Buffer Zone rule in December 2008 that would have provided certain exemptions to the requirement for a 100-foot buffer around all waters, including streams, lakes, ponds, and wetlands. OSM announced on April 29, 2010 its intention to propose a new Stream Protection Rule in 2011, to be finalized in 2012, and to prepare an Environmental Impact Statement evaluating the environmental consequences of the proposed rule. The new rule is anticipated to be much more stringent than the December 2008 rule and eliminate many of the exemptions in that rule. The new rule has not yet been proposed or finalized. We are unable to predict the impact, if any, of these actions by the OSM, although the actions potentially could result in additional delays and costs associated with obtaining permits, prohibitions or restrictions relating to mining activities near streams, and additional enforcement actions. In addition, Congress has proposed, and may in the future propose, legislation to restrict the placement of mining material in streams. The requirements of the revised Stream Protection Rule or future legislation, when adopted, will likely be stricter than the prior SBZ Rule to further protect streams from the impact of surface mining, and may adversely affect our business and operations.
Surety Bonds
Federal and state laws require a mine operator to secure the performance of its reclamation obligations required under SMCRA through the use of surety bonds or other approved forms of performance security to cover the costs the state would incur if the mine operator were unable to fulfill its obligations. It has become increasingly difficult for mining companies to secure new surety bonds without the posting of partial collateral. In addition, surety bond costs have increased while the market terms of surety bonds have generally become less favorable. It is possible that surety bonds issuers may refuse to renew bonds or may demand additional collateral upon those renewals. Our failure to maintain, or inability to acquire, surety bonds that are required by state and federal laws would have a material adverse effect on our ability to produce coal, which could affect our profitability and cash flow.
As of December 31, 2011, we had approximately $69.9 million in surety bonds outstanding to secure the performance of our reclamation obligations. We may be required to increase these amounts as a result of recent developments in West Virginia and Kentucky. In 2011, West Virginia passed legislation that provides for a minimum incremental bonding rate in lieu of a minimum bond amount that applies regardless of acreage. In addition, the Kentucky Department for Natural Resources and the Office of Surface Mining Reclamation and Enforcement Lexington Field Office executed an Action Plan for Improving the Adequacy of Kentucky Performance Bond Amounts, which provides for, among other things, revised bond computation protocols.
16
Table of Contents
Air Emissions
The Federal Clean Air Act, or the CAA, and similar state and local laws and regulations, which regulate emissions into the air, affect coal mining operations both directly and indirectly. The CAA directly impacts our coal mining and processing operations by imposing permitting requirements and, in some cases, requirements to install certain emissions control equipment, on sources that emit various hazardous and non-hazardous air pollutants. The CAA also indirectly affects coal mining operations by extensively regulating the air emissions of coal-fired electric power generating plants and other industrial consumers of coal, including air emissions of sulfur dioxide, nitrogen oxides, particulates, mercury and other compounds. There have been a series of recent federal rulemakings that are focused on emissions from coal-fired electric generating facilities. Installation of additional emissions control technology and additional measures required under laws and regulations related to air emissions will make it more costly to operate coal-fired power plants and possibly other facilities that consume coal and, depending on the requirements of individual state implementation plans, or SIPs, could make coal a less attractive fuel alternative in the planning and building of power plants in the future. Stricter air emission regulation would impact the operation of existing power plants and the construction of new power plants and may lead to changes in our customers' cost structure and purchasing patterns. Coal-fired power plants without up-to-date pollution controls may have to continue to install pollution control technology and upgrades, and might not be able to recover costs for these upgrades in the prices they charge for power due, in part, to the control exercised by state public utility commissions over such rate matters. As a result, the regulation of emissions under the CAA may impact our operations due to any resulting change in the use and demand for coal by our steam coal customers, which could have a material adverse effect on our business, financial condition and results of operations.
EPA's Acid Rain Program, provided in Title IV of the CAA, regulates emissions of sulfur dioxide from electric generating facilities. Sulfur dioxide is a by-product of coal combustion. Affected facilities purchase or are otherwise allocated sulfur dioxide emissions allowances, which must be surrendered annually in an amount equal to a facility's sulfur dioxide emissions in that year. Affected facilities may sell or trade excess allowances to other facilities that require additional allowances to offset their sulfur dioxide emissions. In addition to purchasing or trading for additional sulfur dioxide allowances, affected power facilities can satisfy the requirements of the EPA's Acid Rain Program by switching to lower sulfur fuels, installing pollution control devices such as flue gas desulfurization systems, or "scrubbers," or by reducing electricity generating levels.
EPA has promulgated rules, referred to as the "NOx SIP Call," that require coal-fired power plants in 22 eastern states and Washington D.C. to make substantial reductions in nitrogen oxide emissions in an effort to reduce the impacts of ozone transport between states. As a result of the program, many power plants have been or will be required to install additional emission control measures, such as selective catalytic reduction devices. Installation of additional emission control measures will make it more costly to operate coal-fired power plants, potentially making coal a less attractive fuel.
Additionally, in March 2005, EPA issued the final Clean Air Interstate Rule, or CAIR, which would have permanently capped nitrogen oxide and sulfur dioxide emissions in 28 eastern states and Washington, D.C. CAIR required those states to achieve the required emission reductions by requiring power plants to either participate in an EPA-administered "cap-and-trade" program that caps emission in two phases, or by meeting an individual state emissions budget through measures established by the state. The stringency of the caps under CAIR may have required many coal-fired sources to install additional pollution control equipment, such as wet scrubbers, to comply. This increased sulfur emission removal capability required by the rule could have resulted in decreased demand for lower sulfur coal, which may have potentially driven down prices for lower sulfur coal. A December 2008 court decision found flaws in CAIR, but kept CAIR requirements in place temporarily while directing the EPA to issue a replacement rule.
17
Table of Contents
On July 6, 2011, EPA finalized a rule intended to replace CAIR called the Cross-State Air Pollution Rule, or CSAPR, which requires 28 states in the eastern half of the US to reduce power plant emissions that cross state lines and contribute to ground-level ozone and fine particle pollution in other states. CSAPR was scheduled to replace CAIR starting January 1, 2012. However, on December 30, 2011, the U.S. Court of Appeals for the D.C. Circuit stayed the implementation of CSAPR pending judicial review. This was not a decision on the merits of the rule. While this decision delays implementation of CSAPR, it also leaves CAIR in place while the court considers the merits of the legal challenges to CSAPR. For states to meet their requirements under CSAPR, a number of coal-fired power plants will likely need to be retired, rather than be retrofitted with the necessary emission control technologies, reducing the demand for steam coal.
On February 16, 2012, the EPA formally adopted its "MATS rule," which imposes a new suite of limits on coal- and oil-fired electric generating unit ("EGU") emissions of mercury, other metals, acid gases, and organic air toxics. As specified under the CAA, all regulated EGUs have three years to comply with MATS, starting on April 16, 2012. Affected power plants must comply with the MATS requirements by April 16, 2015 except where the deadlines have been extended pursuant to mechanisms in the act. Under MATS, state permitting authorities may grant a fourth-year to achieve compliance to sources that require extra time to install controls. The EPA also signed revisions to the new source performance standards (NSPS) for fossil-fuel-fired EGUs. This NSPS revises the standards that new coal-fired and oil-fired power plants must meet for particulate matter, sulfur dioxide, and nitrogen oxides. Currently, the MATS rule is subject to various judicial and administrative challenges, and challenges at the congressional level that seek to block or repeal the regulations, the outcome of which cannot be determined at this time.
In addition, on March 21, 2011, the EPA issued new MACT standards for several classes of boilers and process heaters, including large coal-fired boilers and process heaters (Boiler MACT), which would have required significant reductions in the emission of particulate matter, carbon monoxide, hydrogen chloride, dioxins and mercury. On May 18, 2011, the EPA stayed the effective date of the Boiler MACT. On January, 9, 2012, the federal district court for the District of Columbia issued a decision vacating and remanding the May 2011 delay notice. However, on February 7, 2012, the EPA issued a "No Action Assurance" letter regarding the original deadlines indicating it will exercise enforcement discretion not to pursue enforcement for violations of deadlines that occurred during the stay. The EPA has indicated they will revise the Boiler MACT rules in the Spring of 2012. The effect of the regulatory proceedings will depend on the final form of the revised regulations and the outcome of any legal challenges and cannot be determined at this time.
The EPA has adopted new, more stringent national air quality standards, or NAAQS, for ozone, fine particulate matter, and sulfur dioxide. As a result, some states will be required to amend their existing SIPs to attain and maintain compliance with the new air quality standards. For example, in December 2004, the EPA designated specific areas in the United States as in "non-attainment" with the new NAAQS for fine particulate matter. In March 2007, the EPA published final rules addressing how states would implement plans to bring applicable non-attainment regions into compliance with the new air quality standard. On June 3, 2010, the EPA issued a final rule setting forth a more stringent primary NAAQS applicable to sulfur dioxide. The rule also modifies the monitoring increment for the sulfur dioxide standard, establishing a 1-hour standard, and expands the sulfur dioxide monitoring network. Attainment designations will be made pursuant to the modified standards by June 2012. States with non-attainment areas will have until 2014 to submit SIP revisions which must meet the modified standard by August 1, 2017; for all other areas, states will be required to submit "maintenance" SIPs by 2013. The EPA also plans to address the secondary sulfur dioxide standard, which continues to be under review. Because coal mining operations and coal-fired electric generating facilities emit particulate matter and sulfur dioxide, our mining operations and customers could be affected when the standards are implemented by the applicable states.
18
Table of Contents
In June 2005, the EPA amended its regional haze program to improve visibility in national parks and wilderness areas. Affected states were required to develop SIPs by December 2007 that, among other things, identify facilities that will have to reduce emissions and comply with stricter emission limitations. This program may restrict construction of new coal-fired power plants where emissions are projected to reduce visibility in protected areas. In addition, this program may require certain existing coal-fired power plants to install emissions control equipment to reduce haze-causing emissions such as sulfur dioxide, nitrogen oxide, and particulate matter. Demand for our steam coal could be affected when these standards are implemented by the applicable states.
The Department of Justice, on behalf of the EPA, has filed lawsuits against a number of coal-fired electric generating facilities alleging violations of the new source review provisions of the CAA. The EPA has alleged that certain modifications have been made to these facilities without first obtaining certain permits issued under the new source review program. Several of these lawsuits have settled, but others remain pending. Depending on the ultimate resolution of these cases, demand for our coal could be affected.
On June 16, 2010, several environmental groups petitioned the EPA to list coal mines as a source of air pollution and establish emissions standards under the CAA for several pollutants, including particulate matter, nitrogen oxide gases, volatile organic compounds, and methane. Petitioners further requested that the EPA regulate other emissions from mining operations, including dust and clouds of nitrogen oxides associated with blasting operations. These same groups filed suit against the EPA in November of 2011in the federal court for the District of Columbia seeking the EPA's listing of coal mines as a New Source Performance Standard category. If the petitioners are successful, emissions of these or other materials associated with our mining operations could become subject to further regulation pursuant to existing laws such as the CAA. In that event, we may be required to install additional emissions control equipment or take other steps to lower emissions associated with our operations, thereby reducing our revenues and adversely affecting our operations.
Carbon Dioxide Emissions
One by-product of burning coal is carbon dioxide, which EPA considers a greenhouse gas ("GHG") and a major source of concern with respect to climate change and global warming.
Future regulation of GHG in the United States could occur pursuant to future U.S. treaty commitments, new domestic legislation that may impose a carbon emissions tax or establish a cap-and-trade program or regulation by the EPA. The Obama Administration has indicated its support for a mandatory cap and trade program to reduce GHG emissions and it is possible federal legislation could be adopted in the future. Passage of any comprehensive climate change and energy legislation could impact the demand for coal. Any reduction in the amount of coal consumed by North American electric power generators could reduce the price of coal that we mine and sell, thereby reducing our revenues and materially and adversely affecting our business and results of operations.
Even in the absence of new federal legislation, the EPA has begun to regulate GHG emissions pursuant to the CAA based on the April 2007 United States Supreme Court ruling inMassachusetts, et al. v. EPA that the EPA has authority to regulate carbon dioxide emissions. EPA's GHG regulations consist of seven main rules:
(1) the October 2009 Mandatory Reporting Rule, which requires GHG sources above certain thresholds to monitor and report their emissions;
(2) the December 2009 "Endangerment Finding," determining that air pollution from six GHGs endangers public health and welfare, and that mobile sources cause or contribute to that air pollution;
19
Table of Contents
(3) the May 2010 "Tailpipe Rule," issued jointly with the National Highway Traffic Safety Administration setting GHG emission and fuel economy standards for new light-duty vehicles;
(4) the June 2010 "Final Mandatory Reporting of GHGs Rule," requiring all stationary sources that emit more than 25,000 tons of GHGs per year to collect and report to the EPA data regarding such emissions. This rule affects many of our customers, as well as additional source categories, including all underground mines subject to quarterly methane sampling by MSHA. Underground mines subject to this rule were required to begin monitoring GHG emissions on January 1, 2011 and must begin reporting to the EPA on March 31, 2012.
(5) the April 2010 "Timing Rule," concluding that stationary source regulation under Titles I and V of the CAA (involving Prevention of Significant Deterioration regulations and operating permits, respectively) must regulate GHG emissions beginning when such emissions are subject to controls under the mobile source provisions of the Act;
(6) the June 2010 "Tailoring Rule," temporarily exempting small stationary sources from PSD and Title V requirements through regulations modifying the CAA's emissions thresholds; and
(7) the December 2010 "SIP Call" rule, finding 13 SIPs inadequate because they did not regulate GHGs from stationary sources, and directing those States to correct the inadequacies or face federalization of their permitting programs.
All of these regulations are subject to legal challenges, but the D.C. Circuit has refused to stay their implementation while the challenges are pending. Finally, in December 2010, the EPA issued its plan to update New Source Performance Standards (NSPS) for fossil fuel power plants. The EPA had stated its intention to propose standards for power plants by July of 2011 and issue final standards in May 2012 and November 2012, respectively. However, the EPA confirmed in September that it would miss a September 30, 2011 deadline extension to propose the NSPS to regulate GHG from new and existing power plants. As of early December 2011, the EPA reportedly had prepared a proposal to regulate GHG emissions from only new plants, not existing ones, but that proposal is pending review at the Office of Management and Budget, and is not yet public. The EPA's failure to propose rules by the required date will delay final action, as well. Any new NSPS, along with the current EPA's GHG regulations, could adversely affect the demand for coal.
Many states and regions have adopted greenhouse gas initiatives and certain governmental bodies have or are considering the imposition of fees or taxes based on the emission of greenhouse gases by certain facilities, including coal-fired electric generating facilities. For example, in December 2005, seven northeastern states signed the Regional Greenhouse Gas Initiative agreement, or RGGI, calling for implementation of a cap and trade program aimed at reducing carbon dioxide emissions from power plants in the participating states. The members of RGGI have established in statute and/or regulation a carbon dioxide trading program. Auctions for carbon dioxide allowances under the program began in September 2008. Since its inception, several additional northeastern states and Canadian provinces have joined as participants or observers.
Following the RGGI model, seven Western states and four Canadian provinces launched the Western Regional Climate Action Initiative to identify, evaluate and implement collective and cooperative methods of reducing greenhouse gases in the region to 15% below 2005 levels by 2020. At a January 12, 2012 stakeholder meeting, this group confirmed a commitment and timetable to create the largest carbon market in North America and provide a model to guide future efforts to establish national approaches in both Canada and the U.S. to reduce GHG emissions. Similarly in 2007, six Midwestern states and one Canadian province signed the Midwestern Greenhouse Gas Reduction Accord (MGGRA) to develop and implement steps to reduce GHG emissions. A Final Model Rule was released in April 2010 and calls for a 20% reduction below 2005 emissions levels by 2020 and additional reductions to 80% below 2005 emissions levels by 2050, and implementation of a cap and
20
Table of Contents
trade program. Though MGGRA has not been formally suspended, participating states are no longer pursuing it. However, it is likely that these regional efforts will continue.
Our customers' coal-fired coal plants have also come under additional scrutiny with respect to GHG emissions. There have been an increasing number of protests and challenges to the permitting of new coal-fired power plants by environmental organizations and state regulators for concerns related to greenhouse gas emissions. For instance, in October 2007, state regulators in Kansas denied an air emissions construction permit for a new coal-fueled power plant based on the plant's projected emissions of carbon dioxide. Other state regulatory authorities have also rejected the construction of new coal-fueled power plants based on the uncertainty surrounding the potential costs associated with GHG emissions from these plants under future laws limiting the emissions of carbon dioxide. In addition, several permits issued to new coal-fired power plants without limits on GHG emissions have been appealed to the EPA's Environmental Appeals Board. In addition, over 30 states have adopted mandatory "renewable portfolio standards," which require electric utilities to obtain a certain percentage of their electric generation portfolio from renewable resources by a certain date. These standards range generally from 10% to 30%, over time periods that generally extend from the present until between 2020 and 2030. Other states may adopt similar requirements, and federal legislation is a possibility in this area. To the extent these requirements affect our current and prospective customers, they may reduce the demand for coal-fired power, and may affect long-term demand for our coal. Finally, a federal appeals court has allowed a lawsuit pursuing federal common law claims to proceed against certain utilities on the basis that they may have created a public nuisance due to their emissions of carbon dioxide, while a second federal appeals court dismissed a similar case on procedural grounds. On June 20, 2011, the U.S. Supreme Court ruled unanimously inAEP v. Connecticut that the authority to regulate large stationary sources of GHG emissions granted to the EPA under the CAA displaces federal common law public nuisance claims against those sources.
If mandatory restrictions on carbon dioxide emissions are imposed, the ability to capture and store large volumes of carbon dioxide emissions from coal-fired power plants may be a key mitigation technology to achieve emissions reductions while meeting projected energy demands. A number of recent legislative and regulatory initiatives to encourage the development and use of carbon capture and storage technology have been proposed or enacted. On February 3, 2010, President Obama sent a memorandum to the heads of fourteen Executive Departments and Federal Agencies establishing an Interagency Task Force on Carbon Capture and Storage ("CCS"). The goal was to develop a comprehensive and coordinated Federal strategy to speed the commercial development and deployment of clean coal technologies. On August 12, 2010, the Task Force delivered a series of recommendations on overcoming the barriers to the widespread, cost-effective deployment of CCS within ten years. The report concludes that CCS can play an important role in domestic GHG emissions reductions while preserving the option of using abundant domestic fossil energy resources. However, widespread cost-effective deployment of CCS will occur only if the technology is commercially available at economically competitive prices and supportive national policy frameworks are in place.
Clean Water Act
The Federal Clean Water Act, or the CWA, and similar state and local laws and regulations affect coal mining operations by imposing restrictions on the discharge of pollutants, including dredged or fill material, into waters of the U.S. The CWA establishes in-stream water quality and treatment standards for wastewater discharges that are applied to wastewater dischargers through Section 402 National Pollutant Discharge Elimination System, or NPDES, permits. Regular monitoring, as well as compliance with reporting requirements and performance standards, are preconditions for the issuance and renewal of Section 402 NPDES permits. Individual permits or general permits under Section 404 of the CWA are required to discharge dredged or fill materials into waters of the U.S. including wetlands, streams, and other areas meeting the regulatory definition. Our surface coal mining and preparation plant
21
Table of Contents
operations typically require such permits to authorize activities such as the creation of slurry ponds, stream impoundments, and valley fills. The EPA, or a state that has been delegated such authority by the EPA, issues NPDES permits for the discharge of pollutants into navigable waters, while the U.S. Army Corps of Engineers, or the Corps, issues dredge and fill permits under Section 404 of the CWA. Where Section 402 NPDES permitting authority has been delegated to a state, the EPA retains a limited oversight role. The CWA also gives the EPA an oversight role in the Section 404 permitting program, including drafting substantive rules governing permit issuance by the Corps, providing comments on proposed permits, and, in some cases, exercising the authority to delay or pre-empt Corps issuance of a Section 404 permit. The EPA has recently asserted these authorities more forcefully to question, delay, and prevent issuance of some Section 402 and 404 permits for surface coal mining in Appalachia. Currently, significant uncertainty exists regarding the obtaining of permits under the CWA for coal mining operations in Appalachia due to various initiatives launched by the EPA regarding these permits.
For instance, even though the Commonwealth of Kentucky and the State of West Virginia have been delegated the authority to issue NPDES permits for coal mines in those states, the EPA is taking a more active role in its review of NPDES permit applications for coal mining operations in Appalachia. The EPA has stated that it plans to review all applications for NPDES permits and has formally objected to the issuance of numerous NPDES permits in Kentucky, requiring those permits to go through additional regulatory reviews and putting into doubt their ultimate issuance. Indeed, final guidance issued by the EPA on July 21, 2011, encourages EPA Regions 3, 4 and 5 to (1) object to the issuance of state program NPDES permits where the Region does not believe that the proposed permit satisfies the requirements of the CWA, and (2) exercise a greater degree of oversight with regard to state issued general Section 404 permits. This final guidance followed and confirmed an interim final guidance document that was originally issued on April 1, 2010.
In addition, the July 21, 2011 final guidance also addresses the Regions' involvement in Section 404 permitting decisions. This guidance expands on the June 11, 2009 Memorandum of Understanding among the EPA, the Corps, and the U.S. Department of the Interior, which established the Enhanced Coordination Process ("ECP") for the issuance of Section 404 permits, whereby the EPA undertook a new level of review of certain Section 404 permits than was significantly greater than it had previously undertaken. On October 6, 2011, the District Court for the District of Columbia granted partial summary judgment rejecting the EPA's ECP on several different legal grounds including the lack of authority under the CWA and the failure to provide appropriate notice and comment pursuant to the Administrative Procedures Act. The challenge to the July 21, 2011 final guidance is still pending, and the EPA continues to apply that guidance to its review of Section 402 and 404 permits for surface coal mining in Appalachia.
The EPA also has statutory "veto" power to effectively revoke a previously issued Section 404 permit if the EPA determines, after notice and an opportunity for a public hearing, that the permit will have an "unacceptable adverse effect." On January 14, 2011, the EPA exercised its Section 404(c) authority to withdraw or restrict the use of a previously issued permit for the Spruce No. 1 Surface Mine in West Virginia, which is one of the largest surface mining operations ever authorized in Appalachia. This action was the first time that such power was exercised with regard to a previously permitted coal mining project. A challenge to the EPA's exercise of this authority is currently pending in the federal District Court in the District of Columbia. More frequent use of the EPA's Section 404 "veto" power as well as the increased risk of application of this power to previously permitted projects could create uncertainty with regard to our lessees' continued use of their current permits, as well as impose additional time and cost burdens on future operations, potentially adversely affecting our coal royalties revenues.
These various initiatives by the EPA have extended the time required to obtain permits for coal mining and we anticipate further delays in obtaining permits and that the costs associated with
22
Table of Contents
obtaining and complying with those permits will increase substantially. It is possible that some of our projects may not be able to obtain these permits because of the manner in which these rules are being interpreted and applied. It is also possible that we may be unable to obtain or may experience delays in securing, utilizing or renewing additional Section 404 individual permits for surface mining operations due to agency or court decisions stemming from the above developments.
The Corps is authorized to issue general "nationwide" permits for specific categories of activities that are similar in nature and that are determined to have minimal adverse environmental effects. We may no longer seek general permits under Nationwide Permit 21, or NWP 21, because on June 17, 2010, the Corps suspended the use of NWP 21, but NWP 21 authorizations already granted remain in effect. While the suspension is in effect, proposed surface coal mining projects that involve discharges of dredged or fill material into waters of the United States will have to obtain individual permits from the Corps subject to the additional EPA measures discussed below with the uncertainties and delays attendant to that process.
We currently have a number of Section 404 permit applications pending with the Corps. Not all of these permit applications seek approval for valley fills or other obvious "fills"; some relate to other activities, such as mining through streams and the associated post-mining reconstruction efforts. We sought to prepare all pending permit applications consistent with the requirements of the Section 404 program. Our five year plan of mining operations does not rely on the issuance of these pending permit applications. However, the Section 404 permitting requirements are complex, and regulatory scrutiny of these applications, particularly in Appalachia, has increased such that our applications may not be granted or, alternatively, the Corps may require material changes to our proposed operations before it grants permits. While we will continue to pursue the issuance of these permits in the ordinary course of our operations, to the extent that the permitting process creates significant delay or limits our ability to pursue certain reserves beyond our current five year plan, our revenues may be negatively affected.
Total Maximum Daily Load, or TMDL, regulations under the CWA establish a process to calculate the maximum amount of a pollutant that a water body can receive and still meet state water quality standards, and to allocate pollutant loads among the point- and non-point pollutant sources discharging into that water body. This process applies to those waters that states have designated as impaired (i.e., as not meeting present water quality standards). Industrial dischargers, including coal mines, will be required to meet new TMDL load allocations for these stream segments. The adoption of new TMDLs and load allocations for streams near our coal mines could limit our ability to obtain NPDES permits, require more costly water treatment, and adversely affect our coal production.
Under the CWA, states also must conduct an antidegradation review before approving permits for the discharge of pollutants to waters that have been designated as high quality. A state's antidegradation regulations must prohibit the diminution of water quality in these streams absent an analysis of alternatives to the discharge and a demonstration of the socio-economic necessity for the discharge. Several environmental groups and individuals have challenged West Virginia's antidegradation policy. In general, waters discharged from coal mines to high quality streams in West Virginia will be required to meet or exceed new "high quality" standards. This could cause increases in the costs, time and difficulty associated with obtaining and complying with NPDES permits in West Virginia, and could adversely affect our coal production. Several other environmental groups also challenged the EPA's approval of Kentucky's antidegradation policy, including its alternative antidegradation implementation methodology for permits associated with coal mining discharges, which recognized that those discharges are subject to comparable regulation under SMCRA and Section 404 of the CWA. As a result of this litigation, in 2011 Kentucky finalized revisions to its antidegradation rules that no longer include the alternative implementation methodology for coal mining discharges. The elimination of the alternative implementation methodology for coal mining discharges and other changes to Kentucky's antidegradation rules could mean that our operations in Kentucky may be
23
Table of Contents
required to comply with more complex and costly antidegradation procedures and cause increases in the costs, time and difficulty associated with obtaining and complying with NPDES permits in Kentucky, and thereby adversely affect our coal production.
Hazardous Substances and Wastes
The federal Comprehensive Environmental Response, Compensation and Liability Act, or CERCLA, also known as the "Superfund" law, and analogous state laws, impose liability, without regard to fault or the legality of the original conduct, on certain classes of persons that are considered to have contributed to the release of a "hazardous substance" into the environment. These persons include the owner or operator of the site where the release occurred and companies that disposed or arranged for the disposal of the hazardous substances found at the site. Persons who are or were responsible for releases of hazardous substances under CERCLA may be subject to joint and several liability for the costs of cleaning up the hazardous substances that have been released into the environment and for damages to natural resources. Some products used by coal companies in operations generate waste containing hazardous substances. We are not aware of any material liability associated with the release or disposal of hazardous substances from our past or present mine sites.
The federal Resource Conservation and Recovery Act, or RCRA, and corresponding state laws regulating hazardous waste affect coal mining operations by imposing requirements for the generation, transportation, treatment, storage, disposal and cleanup of hazardous wastes. Many mining wastes are excluded from the regulatory definition of hazardous wastes, and coal mining operations covered by SMCRA permits are by statute exempted from RCRA permitting. RCRA also allows the EPA to require corrective action at sites where there is a release of hazardous wastes. In addition, each state has its own laws regarding the proper management and disposal of waste material. While these laws impose ongoing compliance obligations, such costs are not believed to have a material impact on our operations.
On June 21, 2010, EPA released a proposed rule to regulate the disposal of certain coal combustion by-products, or CCB. The proposed rule sets forth two proposed avenues for the regulation of CCB under RCRA. The first option calls for regulation of CCB under Subtitle C as a hazardous waste, which creates a comprehensive program of federally enforceable requirements for waste management and disposal. The second option calls for regulation of CCB under Subtitle D as a solid waste, which gives EPA authority to set performance standards for solid waste management facilities and would be enforced primarily through state agencies and citizen suits. Under both options, the EPA would establish dam safety requirements to address structural integrity of surface impoundments to prevent catastrophic releases. The proposal leaves intact the Bevill exemption for beneficial uses of CCB, except for land application. If CCB were re-classified as hazardous waste, regulations may impose restrictions on ash disposal, provide specifications for storage facilities, require groundwater testing and impose restrictions on storage locations, which could increase our customers' operating costs and potentially reduce their ability to purchase coal. In addition, contamination caused by the past disposal of CCB, including coal ash, can lead to material liability to our customers under RCRA or other federal or state laws and potentially reduce the demand for coal.
It is not possible to determine with certainty the potential permitting requirements or performance standards that may be imposed on the disposal of CCB by future regulations or lawsuits. Any costs associated with new requirements applicable to CCB handling or disposal could increase our customers' operating costs and potentially reduce their ability to purchase coal.
National Environmental Policy Act
Certain of our planned activities and operations include acreage located on federal land and, thus, require governmental approvals that are subject to the requirements of the National Environmental
24
Table of Contents
Policy Act ("NEPA"). NEPA requires federal agencies, including the Department of the Interior, to evaluate major agency actions such as issuing an approval that have the potential to significantly impact the environment. In the course of such evaluations, an agency will typically prepare an environmental assessment to assess the potential direct, indirect and cumulative impacts of a proposed project. Where the activities in question have significant impacts to the environment, the agency, in this instance, must prepare an environmental impact statement, or EIS. The preparation of an EIS can be time consuming and may result in the imposition of mitigation measures that could affect the amount of coal that we are able to produce from mines on federal lands. Moreover, an EIS is subject to protest, appeal or litigation, which can delay or halt projects. Our proposed Red Cliffs project, which includes acreage on federal land in Colorado, is subject to NEPA. The BLM has published a draft EIS for the Red Cliffs project. Although we do not expect any delays in our development of the Red Cliffs project because of the NEPA review process, the NEPA review may extend the time and/or increase the costs for obtaining the necessary governmental approvals.
Endangered Species Act
The federal Endangered Species Act and counterpart state legislation protect species threatened with possible extinction. Protection of threatened and endangered species may have the effect of prohibiting or delaying us from obtaining mining permits and may include restrictions on timber harvesting, road building and other mining or agricultural activities in areas containing the affected species or their habitats. A number of species indigenous to our properties are protected under the Endangered Species Act. Based on the species that have been identified to date and the current application of applicable laws and regulations, however, we do not believe there are any species protected under the Endangered Species Act that would materially and adversely affect our ability to mine coal from our properties in accordance with current mining plans.
Use of Explosives
We use explosives in connection with our surface mining activities. The Federal Safe Explosives Act, or SEA, applies to all users of explosives. Knowing or willful violations of the SEA may result in fines, imprisonment, or both. In addition, violations of SEA may result in revocation of user permits and seizure or forfeiture of explosive materials.
The storage of explosives is also subject to regulatory requirements. For example, pursuant to a rule issued by the Department of Homeland Security in 2007, facilities in possession of chemicals of interest (including ammonium nitrate at certain threshold levels) are required to complete a screening review in order to help determine whether there is a high level of security risk, such that a security vulnerability assessment and a site security plan will be required. It is possible that our use of explosives in connection with blasting operations may subject us to the Department of Homeland Security's new chemical facility security regulatory program.
The costs of compliance with these requirements should not have a material adverse effect on our business, financial condition or results of operations.
Other Environmental and Mine Safety Laws
We are required to comply with numerous other federal, state and local environmental and mine safety laws and regulations in addition to those previously discussed. These additional laws include, for example, the Safe Drinking Water Act, the Toxic Substance Control Act and the Emergency Planning and Community Right-to-Know Act. The costs of compliance with these requirements should not have a material adverse effect on our business, financial condition or results of operations.
25
Table of Contents
Employees
To carry out our operations, our general partner and our subsidiaries employed 1,033 full-time employees as of December 31, 2011. None of the employees are subject to collective bargaining agreements. We believe that we have good relations with these employees and since our inception we have had no history of work stoppages or union organizing campaigns.
Available Information
Our internet address ishttp://www.rhinolp.com, and we make available free of charge on our website our Annual Reports on Form 10-K, our Quarterly Reports on Form 10-Q, our Current Reports on Form 8-K and Forms 3, 4 and 5 for our Section 16 filers (and amendments and exhibits, such as press releases, to such filings) as soon as reasonably practicable after we electronically file with or furnish such material to the SEC. Also included on our website are our "Code of Business Conduct and Ethics", our "Insider Trading Policy," "Whistleblower Policy" and our "Corporate Governance Guidelines" adopted by the board of directors of our general partner and the charters for the Audit Committee and Compensation Committee. Information on our website or any other website is not incorporated by reference into this report and does not constitute a part of this report.
We file or furnish annual, quarterly and current reports and other documents with the SEC under the Securities Exchange Act of 1934, or the Exchange Act. The public may read and copy any materials that we file with the SEC at the SEC's Public Reference Room at 100 F Street, N.E., Washington, D.C. 20549. The public may obtain information on the operation of the Public Reference Room by calling the SEC at 1-800-SEC-0330. Additionally, the SEC's website,http://www.sec.gov, contains reports, proxy and information statements, and other information regarding issuers, including us, that file electronically with the SEC.
Item 1A. Risk Factors.
In addition to the factors discussed elsewhere in this report, including the financial statements and related notes, you should consider carefully the risks and uncertainties described below, which could materially adversely affect our business, financial condition and results of operations. If any of these risks or uncertainties were to occur, our business, financial condition or results of operation could be adversely affected.
Risks Inherent in Our Business
We may not have sufficient cash to enable us to pay the minimum quarterly distribution on our common units following establishment of cash reserves and payment of costs and expenses, including reimbursement of expenses to our general partner.
We may not have sufficient cash each quarter to pay the full amount of our minimum quarterly distribution of $0.445 per unit, or $1.78 per unit per year, which will require us to have available cash of approximately $12.6 million per quarter, or $50.3 million per year, based on the number of common and subordinated units outstanding as of December 31, 2011 and the general partner interest. The amount of cash we can distribute on our common and subordinated units principally depends upon the amount of cash we generate from our operations, which will fluctuate from quarter to quarter based on, among other things:
- •
- the amount of coal we are able to produce from our properties, which could be adversely affected by, among other things, operating difficulties and unfavorable geologic conditions;
- •
- the price at which we are able to sell coal, which is affected by the supply of and demand for domestic and foreign coal;
26
Table of Contents
- •
- the level of our operating costs, including reimbursement of expenses to our general partner and its affiliates. Our partnership agreement does not set a limit on the amount of expenses for which our general partner and its affiliates may be reimbursed;
- •
- the proximity to and capacity of transportation facilities;
- •
- the price and availability of alternative fuels;
- •
- the impact of future environmental and climate change regulations, including those impacting coal-fired power plants;
- •
- the level of worldwide energy and steel consumption;
- •
- prevailing economic and market conditions;
- •
- difficulties in collecting our receivables because of credit or financial problems of customers;
- •
- the effects of new or expanded health and safety regulations;
- •
- domestic and foreign governmental regulation, including changes in governmental regulation of the mining industry, the electric utility industry or the steel industry;
- •
- changes in tax laws;
- •
- weather conditions; and
- •
- force majeure.
A decline in coal prices could adversely affect our results of operations and cash available for distribution to our unitholders.
Our results of operations and the value of our coal reserves are significantly dependent upon the prices we receive for our coal as well as our ability to improve productivity and control costs. The prices we receive for coal depend upon factors beyond our control, including:
- •
- the supply of domestic and foreign coal;
- •
- the demand for domestic and foreign coal, which is significantly affected by the level of consumption of steam coal by electric utilities and the level of consumption of metallurgical coal by steel producers;
- •
- the proximity to, and capacity of, transportation facilities;
- •
- domestic and foreign governmental regulations, particularly those relating to the environment, climate change, health and safety;
- •
- the level of domestic and foreign taxes;
- •
- the price and availability of alternative fuels for electricity generation;
- •
- weather conditions;
- •
- terrorist attacks and the global and domestic repercussions from terrorist activities; and
- •
- prevailing economic conditions.
Any adverse change in these factors could result in weaker demand and lower prices for our products. In addition, the recent global economic downturn, coupled with the global financial and credit market disruptions, has had an impact on the coal industry generally and may continue to do so. The demand for electricity may remain at low levels or further decline if economic conditions remain weak. If these trends continue, we may not be able to sell all of the coal we are capable of producing or sell our coal at prices comparable to recent years. Recent low prices for natural gas, which is a
27
Table of Contents
substitute for coal generated power, may also lead to continued decreased coal consumption by electricity-generating utilities. A substantial or extended decline in the prices we receive for our coal supply contracts could materially and adversely affect our results of operations.
We could be negatively impacted by the competitiveness of the global markets in which we compete and declines in the market demand for coal.
We compete with coal producers in various regions of the United States and overseas for domestic and international sales. The domestic demand for, and prices of, our coal primarily depend on coal consumption patterns of the domestic electric utility industry and the domestic steel industry. Consumption by the domestic electric utility industry is affected by the demand for electricity, environmental and other governmental regulations, technological developments and the price of competing coal and alternative fuel sources, such as natural gas, nuclear, hydroelectric power and other renewable energy sources. Consumption by the domestic steel industry is primarily affected by economic growth and the demand for steel used in construction as well as appliances and automobiles. In recent years, the competitive environment for coal was impacted by sustained growth in a number of the largest markets in the world, including the United States, China, Japan and India, where demand for both electricity and steel have supported prices for steam and metallurgical coal. The economic stability of these markets has a significant effect on the demand for coal and the level of competition in supplying these markets. The cost of ocean transportation and the value of the U.S. dollar in relation to foreign currencies significantly impact the relative attractiveness of our coal as we compete on price with foreign coal producing sources. During the last several years, the U.S. coal industry has experienced increased consolidation, which has contributed to the industry becoming more competitive. Increased competition by coal producers or producers of alternate fuels could decrease the demand for, or pricing of, or both, for our coal, adversely impacting our results of operations and cash available for distribution.
Portions of our coal reserves possess quality characteristics that enable us to mine, process and market them as either metallurgical coal or high quality steam coal, depending on prevailing market conditions. A decline in the metallurgical market relative to the steam market could cause us to shift coal from the metallurgical market to the steam market, potentially reducing the price we could obtain for this coal and adversely impacting our cash flows, results of operations and cash available for distribution.
Our mining operations are subject to extensive and costly environmental laws and regulations, and such current and future laws and regulations could materially increase our operating costs or limit our ability to produce and sell coal.
The coal mining industry is subject to numerous and extensive federal, state and local environmental laws and regulations, including laws and regulations pertaining to permitting and licensing requirements, air quality standards, plant and wildlife protection, reclamation and restoration of mining properties, the discharge of materials into the environment, the storage, treatment and disposal of wastes, protection of wetlands, surface subsidence from underground mining and the effects that mining has on groundwater quality and availability. The costs, liabilities and requirements associated with these laws and regulations are significant and time-consuming and may delay commencement or continuation of our operations. Moreover, the possibility exists that new laws or regulations (or new judicial interpretations or enforcement policies of existing laws and regulations) could materially affect our mining operations, results of operations and cash available for distribution to our unitholders, either through direct impacts such as those regulating our existing mining operations, or indirect impacts such as those that discourage or limit our customers' use of coal. Although we believe that we are in substantial compliance with existing laws and regulations, we may, in the future, experience violations that would subject us to administrative, civil and criminal penalties
28
Table of Contents
and a range of other possible sanctions. The enforcement of laws and regulations governing the coal mining industry has increased substantially. As a result, the consequences for any noncompliance may become more significant in the future.
Our operations use petroleum products, coal processing chemicals and other materials that may be considered "hazardous materials" under applicable environmental laws and have the potential to generate other materials, all of which may affect runoff or drainage water. In the event of environmental contamination or a release of these materials, we could become subject to claims for toxic torts, natural resource damages and other damages and for the investigation and cleanup of soil, surface water, groundwater, and other media, as well as abandoned and closed mines located on property we operate. Such claims may arise out of conditions at sites that we currently own or operate, as well as at sites that we previously owned or operated, or may acquire.
The government extensively regulates mining operations, especially with respect to mine safety and health, which imposes significant actual and potential costs on us, and future regulation could increase those costs or limit our ability to produce coal.
Coal mining is subject to inherent risks to safety and health. As a result, the coal mining industry is subject to stringent safety and health standards. Fatal mining accidents in the United States in recent years have received national attention and have led to responses at the state and federal levels that have resulted in increased regulatory scrutiny of coal mining operations, particularly underground mining operations. More stringent state and federal mine safety laws and regulations have included increased sanctions for non-compliance. Moreover, future workplace accidents are likely to result in more stringent enforcement and possibly the passage of new laws and regulations.
Within the last few years, the industry has seen enactment of the Federal Mine Improvement and New Emergency Response Act of 2006, or the MINER Act, subsequent additional legislation and regulation imposing significant new safety initiatives and the Dodd-Frank Act, which, among other things, imposes new mine safety information reporting requirements. The MINER Act significantly amended the Federal Mine Safety and Health Act of 1977, or the Mine Act, imposing more extensive and stringent compliance standards, increasing criminal penalties and establishing a maximum civil penalty for non-compliance, and expanding the scope of federal oversight, inspection, and enforcement activities. Following the passage of the MINER Act, the U.S. Mine Safety and Health Administration, or MSHA, issued new or more stringent rules and policies on a variety of topics, including:
- •
- sealing off abandoned areas of underground coal mines;
- •
- mine safety equipment, training and emergency reporting requirements;
- •
- substantially increased civil penalties for regulatory violations;
- •
- training and availability of mine rescue teams;
- •
- underground "refuge alternatives" capable of sustaining trapped miners in the event of an emergency;
- •
- flame-resistant conveyor belt, fire prevention and detection, and use of air from the belt entry; and
- •
- post-accident two-way communications and electronic tracking systems.
Subsequent to passage of the MINER Act, various coal producing states, including West Virginia, Ohio and Kentucky, have enacted legislation addressing issues such as mine safety and accident reporting, increased civil and criminal penalties, and increased inspections and oversight. Other states may pass similar legislation in the future. Additional federal and state legislation that would further
29
Table of Contents
increase mine safety regulation, inspection and enforcement, particularly with respect to underground mining operations, has also been considered.
MSHA is also considering a new rule regarding respirable coal mine dust that, if promulgated, would lower the allowable average concentration of respirable dust, allow for single shift sampling to determine noncompliance and establish regulations for the use of Continuous Personal Dust Monitors (CPDM), among other things. Although still in the comment stage, this proposed rule could require significant expenditures in order to comply.
Although we are unable to quantify the full impact, implementing and complying with these new laws and regulations could have an adverse impact on our results of operations and cash available for distribution to our unitholders and could result in harsher sanctions in the event of any violations. Please read "Item 1. Business—Regulation and Laws" of our Annual Report on Form 10-K.
Penalties, fines or sanctions levied by MSHA could have a material adverse effect on our business, results of operations and cash available for distribution.
Surface and underground mines like ours are continuously inspected by MSHA, which often leads to notices of violation. Recently, MSHA has been conducting more frequent and more comprehensive inspections.
On November 19, 2010, Rhino Eastern received an MSHA notification of a potential pattern of violations under Section 104(e) of the Mine Act for Rhino Eastern's Eagle #1 Mine located in Bolt, West Virginia, based on MSHA's initial screening of compliance records for the twelve months ended August 31, 2010 and of accident and employment records for the twelve months ended June 30, 2010. On December 7, 2010, Rhino Eastern submitted a Corrective Action Plan to MSHA and this plan became effective on December 31, 2010. In a letter dated March 15, 2011, MSHA notified Rhino Eastern that MSHA concluded that Rhino Eastern's Eagle #1 Mine achieved the target for its significant and substantial ("S&S") violations during the potential pattern of violations period. Because Rhino Eastern reduced its S&S violations to the targeted rate of S&S violations, MSHA decided to not consider Eagle #1 Mine for a pattern of violations notice pursuant to Section 104(e)(1) of the Mine Act at such time. We cannot predict whether or not future violations would cause MSHA to reconsider Eagle #1 Mine for a pattern of violations notice.
On March 18, 2011, Rhino Eastern received two imminent danger orders under Section 107(a) of the Mine Act for Eagle #1 Mine. The orders stated that mining was being conducted beneath a previously mined area that was holding an unspecified amount of water and that water was observed entering the mine through the roof. According to MSHA, the water entering the mine has created a risk for miners working in the mine. On April 8, 2011, MSHA terminated the imminent danger orders after we successfully drained the pools of water that caused MSHA to issue the two imminent danger orders, which allowed Rhino Eastern to resume production at the Eagle #1 Mine.
On June 24, 2011, our subsidiary, CAM Mining LLC received notice that on June 23, 2011, MSHA commenced an action in the United States District Court of the Eastern District of Kentucky seeking injunctive relief as a result of alleged violations of Sections 103, 104, and 108 of the Mine Act occurring at Mine 28 in connection with an inspection on June 17, 2011 by MSHA inspectors. More specifically, MSHA was notified that CAM Mining LLC employees had allegedly been smoking underground at Mine 28, which has an alleged history of methane and hydrocarbon production and ignition. The complaint alleges that when MSHA inspectors arrived at Mine 28 to inspect the mine with respect to the smoking allegation, CAM Mining LLC employees gave advance notice of the inspection to miners working underground and that this advance notice hindered, interfered with and delayed the inspection by MSHA. The complaint asserts that the MSHA inspectors did not find any evidence of smoking paraphernalia during the inspection, which was allegedly the result of this advance notice. Although the mine safety laws permit MSHA to pursue a number of remedies for violations of
30
Table of Contents
the advance warning prohibitions, the complaint seeks an injunction to enjoin CAM Mining LLC from any further violations of Sections 103, 104, and 108 of the Mine Act. On June 30, 2011, MSHA obtained a temporary restraining order prohibiting such further violations. We are currently investigating the allegations in the complaint and intends to continue to fully cooperate with MSHA to ensure that all mine safety and health regulations are being complied with at its mines.
As a result of these and future inspections and alleged violations and potential violations, we could be subject to material fines, penalties or sanctions. Any of our mines could be subject to a temporary or extended shut down as a result of an alleged MSHA violation. Any such penalties, fines or sanctions could have a material adverse effect on our business, results of operations and cash available for distribution.
We may be unable to obtain and/or renew permits necessary for our operations, which could prevent us from mining certain reserves.
Numerous governmental permits and approvals are required for mining operations, and we can face delays, challenges to, and difficulties in acquiring, maintaining or renewing necessary permits and approvals, including environmental permits. The permitting rules, and the interpretations of these rules, are complex, change frequently, and are often subject to discretionary interpretations by regulators, all of which may make compliance more difficult or impractical, and may possibly preclude the continuance of ongoing mining operations or the development of future mining operations. In addition, the public has certain statutory rights to comment upon and otherwise impact the permitting process, including through court intervention. Over the past few years, the length of time needed to bring a new surface mine into production has increased because of the increased time required to obtain necessary permits. The slowing pace at which permits are issued or renewed for new and existing mines has materially impacted production in Appalachia, but could also affect other regions in the future.
Section 402 National Pollutant Discharge Elimination System permits and Section 404 CWA permits are required to discharge wastewater and discharge dredged or fill material into waters of the United States. Our surface coal mining operations typically require such permits to authorize such activities as the creation of slurry ponds, stream impoundments, and valley fills. Although the CWA gives the EPA a limited oversight role in the Section 404 permitting program, the EPA has recently asserted its authorities more forcefully to question, delay, and prevent issuance of some Section 404 permits for surface coal mining in Appalachia. Currently, significant uncertainty exists regarding the obtaining of permits under the CWA for coal mining operations in Appalachia due to various initiatives launched by the EPA regarding these permits.
Please read "Part I, Item 1. Business—Regulation and Laws—Clean Water Act" for a discussion of recent litigation and regulatory developments related to the CWA. An inability to obtain the necessary permits to conduct our mining operations or an inability to comply with the requirements of applicable permits would reduce our production and cash flows, which could limit our ability to make distributions to our unitholders.
Our mining operations are subject to operating risks that could adversely affect production levels and operating costs.
Our mining operations are subject to conditions and events beyond our control that could disrupt operations, resulting in decreased production levels and increased costs.
These risks include:
- •
- unfavorable geologic conditions, such as the thickness of the coal deposits and the amount of rock embedded in or overlying the coal deposit;
- •
- inability to acquire or maintain necessary permits or mining or surface rights;
31
Table of Contents
- •
- changes in governmental regulation of the mining industry or the electric utility industry;
- •
- adverse weather conditions and natural disasters;
- •
- accidental mine water flooding;
- •
- labor-related interruptions;
- •
- transportation delays;
- •
- mining and processing equipment unavailability and failures and unexpected maintenance problems; and
- •
- accidents, including fire and explosions from methane.
Any of these conditions may increase the cost of mining and delay or halt production at particular mines for varying lengths of time, which in turn could adversely affect our results of operations and cash available for distribution to our unitholders.
In general, mining accidents present a risk of various potential liabilities depending on the nature of the accident, the location, the proximity of employees or other persons to the accident scene and a range of other factors. Possible liabilities arising from a mining accident include workmen's compensation claims or civil lawsuits for workplace injuries, claims for personal injury or property damage by people living or working nearby and fines and penalties including possible criminal enforcement against us and certain of our employees. In addition, a significant accident that results in a mine shut-down could give rise to liabilities for failure to meet the requirements of coal-supply agreements especially if the counterparties dispute our invocation of the force majeure provisions of those agreements. We maintain insurance coverage to mitigate the risks of certain of these liabilities, including business interruption insurance, but those policies are subject to various exclusions and limitations and we cannot assure you that we will receive coverage under those policies for any personal injury, property damage or business interruption claims that may arise out of such an accident. Moreover, certain potential liabilities such as fines and penalties are not insurable risks. Thus, a serious mine accident may result in material liabilities that adversely affect our results of operations and cash available for distribution.
Fluctuations in transportation costs or disruptions in transportation services could increase competition or impair our ability to supply coal to our customers, which could adversely affect our results of operations and cash available for distribution to our unitholders.
Transportation costs represent a significant portion of the total cost of coal for our customers and, as a result, the cost of transportation is a critical factor in a customer's purchasing decision. Increases in transportation costs could make coal a less competitive energy source or could make our coal production less competitive than coal produced from other sources.
Significant decreases in transportation costs could result in increased competition from coal producers in other regions. For instance, coordination of the many eastern U.S. coal loading facilities, the large number of small shipments, the steeper average grades of the terrain and a more unionized workforce are all issues that combine to make shipments originating in the eastern United States inherently more expensive on a per-mile basis than shipments originating in the western United States. Historically, high coal transportation rates from the western coal producing regions limited the use of western coal in certain eastern markets. The increased competition could have an adverse effect on our results of operations and cash available for distribution to our unitholders.
We depend primarily upon railroads, barges and trucks to deliver coal to our customers. Disruption of any of these services due to weather-related problems, strikes, lockouts, accidents, mechanical difficulties and other events could temporarily impair our ability to supply coal to our
32
Table of Contents
customers, which could adversely affect our results of operations and cash available for distribution to our unitholders.
In recent years, the states of Kentucky and West Virginia have increased enforcement of weight limits on coal trucks on their public roads. It is possible that other states may modify their laws to limit truck weight limits. Such legislation and enforcement efforts could result in shipment delays and increased costs. An increase in transportation costs could have an adverse effect on our ability to increase or to maintain production and could adversely affect our results of operations and cash available for distribution.
A shortage of skilled labor in the mining industry could reduce productivity and increase operating costs, which could adversely affect our results of operations and cash available for distribution to our unitholders.
Efficient coal mining using modern techniques and equipment requires skilled laborers. The coal industry is experiencing a shortage of skilled labor as well as rising labor and benefit costs, due in large part to demographic changes as existing miners retire at a faster rate than new miners are entering the workforce. If the shortage of experienced labor continues or worsens or coal producers are unable to train enough skilled laborers, there could be an adverse impact on labor productivity, an increase in our costs and our ability to expand production may be limited. If coal prices decrease or our labor prices increase, our results of operations and cash available for distribution to our unitholders could be adversely affected.
Unexpected increases in raw material costs, such as steel, diesel fuel and explosives could adversely affect our results of operations.
Our coal mining operations are affected by commodity prices. We use significant amounts of steel, diesel fuel, explosives and other raw materials in our mining operations, and volatility in the prices for these raw materials could have a material adverse effect on our operations. Steel prices and the prices of scrap steel, natural gas and coking coal consumed in the production of iron and steel fluctuate significantly and may change unexpectedly. Additionally, a limited number of suppliers exist for explosives, and any of these suppliers may divert their products to other industries. Shortages in raw materials used in the manufacturing of explosives, which, in some cases, do not have ready substitutes, or the cancellation of supply contracts under which these raw materials are obtained, could increase the prices and limit the ability of us or our contractors to obtain these supplies. Future volatility in the price of steel, diesel fuel, explosives or other raw materials will impact our operating expenses and could adversely affect our results of operations and cash available for distribution.
If we are not able to acquire replacement coal reserves that are economically recoverable, our results of operations and cash available for distribution to our unitholders could be adversely affected.
Our results of operations and cash available for distribution to our unitholders depend substantially on obtaining coal reserves that have geological characteristics that enable them to be mined at competitive costs and to meet the coal quality needed by our customers. Because we deplete our reserves as we mine coal, our future success and growth will depend, in part, upon our ability to acquire additional coal reserves that are economically recoverable. If we fail to acquire or develop additional reserves, our existing reserves will eventually be depleted. Replacement reserves may not be available when required or, if available, may not be capable of being mined at costs comparable to those characteristic of the depleting mines. We may not be able to accurately assess the geological characteristics of any reserves that we acquire, which may adversely affect our results of operations and cash available for distribution to our unitholders. Exhaustion of reserves at particular mines with certain valuable coal characteristics also may have an adverse effect on our operating results that is disproportionate to the percentage of overall production represented by such mines. Our ability to obtain other reserves in the future could be limited by restrictions under our existing or future debt
33
Table of Contents
agreements, competition from other coal companies for attractive properties, the lack of suitable acquisition candidates or the inability to acquire coal properties on commercially reasonable terms.
Inaccuracies in our estimates of coal reserves and non-reserve coal deposits could result in lower than expected revenues and higher than expected costs.
We base our and the joint venture's coal reserve and non-reserve coal deposit estimates on engineering, economic and geological data assembled and analyzed by our staff, which is periodically audited by independent engineering firms. These estimates are also based on the expected cost of production and projected sale prices and assumptions concerning the permitability and advances in mining technology. The estimates of coal reserves and non-reserve coal deposits as to both quantity and quality are periodically updated to reflect the production of coal from the reserves, updated geologic models and mining recovery data, recently acquired coal reserves and estimated costs of production and sales prices. There are numerous factors and assumptions inherent in estimating quantities and qualities of coal reserves and non-reserve coal deposits and costs to mine recoverable reserves, including many factors beyond our control. Estimates of economically recoverable coal reserves necessarily depend upon a number of variable factors and assumptions, all of which may vary considerably from actual results. These factors and assumptions relate to:
- •
- quality of coal;
- •
- geological and mining conditions and/or effects from prior mining that may not be fully identified by available exploration data or which may differ from our experience in areas where we currently mine;
- •
- the percentage of coal in the ground ultimately recoverable;
- •
- the assumed effects of regulation, including the issuance of required permits, taxes, including severance and excise taxes and royalties, and other payments to governmental agencies;
- •
- historical production from the area compared with production from other similar producing areas;
- •
- the timing for the development of reserves; and
- •
- assumptions concerning equipment and productivity, future coal prices, operating costs, capital expenditures and development and reclamation costs.
For these reasons, estimates of the quantities and qualities of the economically recoverable coal attributable to any particular group of properties, classifications of coal reserves and non-reserve coal deposits based on risk of recovery, estimated cost of production and estimates of net cash flows expected from particular reserves as prepared by different engineers or by the same engineers at different times may vary materially due to changes in the above factors and assumptions. Actual production from identified coal reserve and non-reserve coal deposit areas or properties and revenues and expenditures associated with our and the joint venture's mining operations may vary materially from estimates. Accordingly, these estimates may not reflect our and the joint venture's actual coal reserves or non-reserve coal deposits. Any inaccuracy in our estimates related to our and the joint venture's coal reserves and non-reserve coal deposits could result in lower than expected revenues and higher than expected costs, which could have a material adverse effect on our ability to make cash distributions.
We invest in non-coal natural resource assets, which could result in a material adverse effect on our results of operations and cash available for distribution to our unitholders.
Part of our business strategy is to expand our operations through strategic acquisitions, which includes investing in non-coal natural resources assets. Our executive officers do not have experience
34
Table of Contents
investing in or operating non-coal natural resources assets and we may be unable to hire additional management with relevant expertise in operating such assets. Acquisitions of non-coal natural resource assets could expose us to new and additional operating and regulatory risks, including commodity price risk, which could result in a material adverse effect on our results of operations and cash available for distribution to our unitholders.
During 2011, we invested approximately $8.1 million and $19.9 million for mineral rights in the Cana Woodford region of Oklahoma and oil and gas leases in the Utica Shale region of northeastern Ohio, respectively. The oil and natural gas markets are highly volatile, and we cannot predict future oil and natural gas prices. Prices for oil and natural gas may fluctuate widely in response to relatively minor changes in the supply of and demand for oil and natural gas, market uncertainty and a variety of additional factors that are beyond our control. Such fluctuations could cause us not to realize the full benefits from such investments.
In addition, the natural gas industry could be impacted by the controversy surrounding hydraulic fracturing to extract shale gas. This could include additional regulations imposed on the industry.
The amount of estimated maintenance capital expenditures our general partner is required to deduct from operating surplus each quarter could increase in the future, resulting in a decrease in available cash from operating surplus that could be distributed to our unitholders.
Our partnership agreement requires our general partner to deduct from operating surplus each quarter estimated maintenance capital expenditures as opposed to actual maintenance capital expenditures in order to reduce disparities in operating surplus caused by fluctuating maintenance capital expenditures, such as reserve replacement costs or refurbishment or replacement of mine equipment. Our annual estimated maintenance capital expenditures for purposes of calculating operating surplus is $16 to $19 million for 2012. This amount is based on our current estimates of the amounts of expenditures we will be required to make in the future to maintain our long-term operating capacity, which we believe to be reasonable. Our partnership agreement does not cap the amount of maintenance capital expenditures that our general partner may estimate. The amount of our estimated maintenance capital expenditures may be more than our actual maintenance capital expenditures, which will reduce the amount of available cash from operating surplus that we would otherwise have available for distribution to unitholders. The amount of estimated maintenance capital expenditures deducted from operating surplus is subject to review and change by the board of directors of our general partner at least once a year, with any change approved by the conflicts committee. In addition to estimated maintenance capital expenditures, reimbursement of expenses incurred by our general partner and its affiliates will reduce the amount of available cash from operating surplus that we would otherwise have available for distribution to our unitholders. Please read "—Risks Inherent in an Investment in Us—Cost reimbursements due to our general partner and its affiliates for services provided to us or on our behalf will reduce cash available for distribution to our unitholders. The amount and timing of such reimbursements will be determined by our general partner."
Existing and future laws and regulations regulating the emission of sulfur dioxide and other compounds could affect coal consumers and as a result reduce the demand for our coal. A reduction in demand for our coal could adversely affect our results of operations and cash available for distribution to our unitholders.
Federal, state and local laws and regulations extensively regulate the amount of sulfur dioxide, particulate matter, nitrogen oxides, mercury and other compounds emitted into the air from electric power plants and other consumers of our coal. These laws and regulations can require significant emission control expenditures, and various new and proposed laws and regulations may require further emission reductions and associated emission control expenditures. A certain portion of our coal has a medium to high sulfur content, which results in increased sulfur dioxide emissions when combusted and therefore the use of our coal imposes certain additional costs on customers. Accordingly, these laws
35
Table of Contents
and regulations may affect demand and prices for our higher sulfur coal. Please read "Part I, Item 1. Business—Regulation and Laws."
Federal and state laws restricting the emissions of greenhouse gases in areas where we conduct our business or sell our coal could adversely affect our operations and demand for our coal.
Recent scientific studies have suggested that emissions of certain gases, commonly referred to as greenhouse gases and including carbon dioxide and methane, may be contributing to warming of the Earth's atmosphere and impacting climate. In response to such studies, the U.S. Congress is considering legislation to reduce emissions of GHG. Many states have already taken legal measures to reduce emissions of GHG, primarily through the development of regional GHG cap-and-trade programs.
In the wake of the Supreme Court's April 2, 2007 decision inMassachusetts, et al. v. EPA, which held that GHG fall under the definition of "air pollutant" in the federal Clean Air Act, or CAA, in December 2009 the EPA issued a final rule declaring that six GHG, including carbon dioxide and methane, "endanger both the public health and the public welfare of current and future generations." The issuance of this "endangerment finding" allows the EPA to begin regulating GHG emissions under existing provisions of the CAA. There are many regulatory approaches currently in effect or being considered to address GHG, including possible future U.S. treaty commitments, new federal or state legislation that may impose a carbon emissions tax or establish a cap-and-trade program and regulation by the EPA.
The permitting of new coal-fired power plants has also been contested by state regulators and environmental organizations for concerns related to GHG emissions from the new plants. In addition, several permits issued to new coal-fired power plants without limits on GHG emissions have been appealed to EPA's Environmental Appeals Board. As state permitting authorities continue to consider GHG control requirements as part of major source permitting Best Available Control Technology (BACT) requirements, costs associated with new facility permitting and use of coal could increase substantially. A growing concern is the possibility that BACT will be determined to be the use of an alternative fuel to coal.
As a result of these current and proposed laws, regulations and trends, electricity generators may elect to switch to other fuels that generate less GHG emissions, possibly further reducing demand for our coal, which could adversely affect our results of operations and cash available for distribution to our unitholders. Please read "Part I, Item 1. Business—Regulation and Laws—Carbon Dioxide Emissions."
Federal and state laws require bonds to secure our obligations to reclaim mined property. Our inability to acquire or failure to maintain, obtain or renew these surety bonds could have an adverse effect on our ability to produce coal, which could adversely affect our results of operations and cash available for distribution to our unitholders.
We are required under federal and state laws to place and maintain bonds to secure our obligations to repair and return property to its approximate original state after it has been mined (often referred to as "reclamation") and to satisfy other miscellaneous obligations. Federal and state governments could increase bonding requirements in the future. Certain business transactions, such as coal leases and other obligations, may also require bonding. We may have difficulty procuring or maintaining our surety bonds. Our bond issuers may demand higher fees, additional collateral, including supporting letters of credit or posting cash collateral, or other terms less favorable to us upon those renewals. The failure to maintain or the inability to acquire sufficient surety bonds, as required
36
Table of Contents
by state and federal laws, could subject us to fines and penalties as well as the loss of our mining permits. Such failure could result from a variety of factors, including:
- •
- the lack of availability, higher expense or unreasonable terms of new surety bonds;
- •
- the ability of current and future surety bond issuers to increase required collateral; and
- •
- the exercise by third-party surety bond holders of their right to refuse to renew the surety bonds.
We maintain surety bonds with third parties for reclamation expenses and other miscellaneous obligations. It is possible that we may in the future have difficulty maintaining our surety bonds for mine reclamation. Due to current economic conditions and the volatility of the financial markets, surety bond providers may be less willing to provide us with surety bonds or maintain existing surety bonds or may demand terms that are less favorable to us than the terms we currently receive. We may have greater difficulty satisfying the liquidity requirements under our existing surety bond contracts. As of December 31, 2011, we had $69.9 million in reclamation surety bonds, secured by $21.3 million in letters of credit outstanding under our credit agreement. Our credit agreement provides for a $300 million working capital revolving credit facility, of which up to $75.0 million may be used for letters of credit. If we do not maintain sufficient borrowing capacity under our revolving credit facility for additional letters of credit, we may be unable to obtain or renew surety bonds required for our mining operations. For more information, please read "Part II, Item 7. Management's Discussion and Analysis of Financial Condition and Results of Operations—Liquidity and Capital Resources—Credit Agreement." If we do not maintain sufficient borrowing capacity or have other resources to satisfy our surety and bonding requirements, our operations and cash available for distribution to our unitholders could be adversely affected.
We depend on a few customers for a significant portion of our revenues. If a substantial portion of our supply contracts terminate or if any of these customers were to significantly reduce their purchases of coal from us, and we are unable to successfully renegotiate or replace these contracts on comparable terms, then our results of operations and cash available for distribution to our unitholders could be adversely affected.
We sell a material portion of our coal under supply contracts. As of December 31, 2011 we had sales commitments for approximately 93% of our estimated coal production (including purchased coal to supplement our production and excluding results from the joint venture) for the year ending December 31, 2012. When our current contracts with customers expire, our customers may decide not to extend or enter into new contracts. Of these committed tons, under the terms of the supply contracts, we will ship 44% in 2012, 33% in 2013, 20% in 2014 and 3% in 2015. We derived approximately 82.1% of our total revenues from coal sales (excluding results from the joint venture) to our ten largest customers for the year ended December 31, 2011, with affiliates of our top three customers accounting for approximately 44.8% of our coal revenues during that period.
In the absence of long-term contracts, our customers may decide to purchase fewer tons of coal than in the past or on different terms, including different pricing terms. Negotiations to extend existing contracts or enter into new long-term contracts with those and other customers may not be successful, and those customers may not continue to purchase coal from us under long-term coal supply contracts or may significantly reduce their purchases of coal from us. In addition, interruption in the purchases by or operations of our principal customers could significantly affect our results of operations and cash available for distribution. Unscheduled maintenance outages at our customers' power plants and unseasonably moderate weather are examples of conditions that might cause our customers to reduce their purchases. Our mines may have difficulty identifying alternative purchasers of their coal if their existing customers suspend or terminate their purchases. The amount and terms of sales of coal produced from our Rhino Eastern mining complex are controlled by an affiliate of Patriot pursuant to the joint venture agreement. We cannot guarantee that Patriot will be successful in obtaining coal supply contracts at favorable prices, if at all, which could have a material adverse effect on our results
37
Table of Contents
of operations and cash available for distribution to our unitholders. For additional information relating to these contracts, please read "Part I, Item 1. Business—Customers—Coal Supply Contracts."
Any change in consumption patterns by utilities away from the use of coal, such as resulting from current low natural gas prices, could affect our ability to sell the coal we produce, which could adversely affect our results of operations and cash available for distribution to our unitholders.
Excluding results from the joint venture, steam coal accounted for approximately 87% of our coal sales volume for the year ended December 31, 2011. The majority of our sales of steam coal during this period were to electric utilities for use primarily as fuel for domestic electricity consumption. The amount of coal consumed by the domestic electric utility industry is affected primarily by the overall demand for electricity, environmental and other governmental regulations, and the price and availability of competing fuels for power plants such as nuclear, natural gas and oil as well as alternative sources of energy. We compete generally with producers of other fuels, such as natural gas and oil. A decline in price for these fuels could cause demand for coal to decrease and adversely affect the price of our coal. For example, low natural gas prices have led, in some instances, to decreased coal consumption by electricity-generating utilities. If alternative energy sources, such as nuclear, hydroelectric, wind or solar, become more cost-competitive on an overall basis, demand for coal could decrease and the price of coal could be materially and adversely affected. Further, legislation requiring, subsidizing or providing tax benefit for the use of alternative energy sources and fuels, or legislation providing financing or incentives to encourage continuing technological advances in this area, could further enable alternative energy sources to become more competitive with coal. A decrease in coal consumption by the domestic electric utility industry could adversely affect the price of coal, which could materially adversely affect our results of operations and cash available for distribution to our unitholders.
Certain provisions in our long-term supply contracts may provide limited protection during adverse economic conditions, may result in economic penalties to us or permit the customer to terminate the contract.
Price adjustment, "price re-opener" and other similar provisions in our supply contracts may reduce the protection from short-term coal price volatility traditionally provided by such contracts. Price re-opener provisions typically require the parties to agree on a new price. Failure of the parties to agree on a price under a price re-opener provision can lead to termination of the contract. Any adjustment or renegotiations leading to a significantly lower contract price could adversely affect our results of operations and cash available for distribution to our unitholders.
Coal supply contracts also typically contain force majeure provisions allowing temporary suspension of performance by us or our customers during the duration of specified events beyond the control of the affected party. Most of our coal supply contracts also contain provisions requiring us to deliver coal meeting quality thresholds for certain characteristics such as Btu, sulfur content, ash content, hardness and ash fusion temperature. Failure to meet these specifications could result in economic penalties, including price adjustments, the rejection of deliveries or termination of the contracts. In addition, certain of our supply contracts permit the customer to terminate the agreement in the event of changes in regulations affecting our industry that increase the price of coal beyond a specified limit.
Our lessees' mining operations and their financial condition and results of operations are subject to some of the same risks and uncertainties that we face as a mine operator.
The mining operations and financial condition and results of operations of our lessees are subject to the same risks and uncertainties that we face as a mine operator. If any such risks were to occur, the business, financial condition and results of operations of the lessees could be adversely affected and as a result our coal royalty revenues and cash available for distribution could be adversely affected.
38
Table of Contents
If our lessees do not manage their operations well, their production volumes and our royalty revenues could decrease.
We depend on our lessees to effectively manage their operations on the leased properties. The lessees make their own business decisions with respect to their operations within the constraints of their leases, including decisions relating to:
- •
- marketing of the coal mined;
- •
- mine plans, including the amount to be mined and the method of mining;
- •
- processing and blending coal;
- •
- expansion plans and capital expenditures;
- •
- credit risk of their customers;
- •
- permitting;
- •
- insurance and surety bonding;
- •
- acquisition of surface rights and other coal estates;
- •
- employee wages;
- •
- transportation arrangements;
- •
- compliance with applicable laws, including environmental laws; and
- •
- mine closure and reclamation.
A failure on the part of one of the lessees to make royalty payments could give us the right to terminate the lease, repossess the property and enforce payment obligations under the lease. If we repossessed any of our properties, we might not be able to find a replacement lessee or enter into a new lease on favorable terms within a reasonable period of time. In addition, the existing lessee could be subject to bankruptcy proceedings that could further delay the execution of a new lease or the assignment of the existing lease to another operator. If we enter into a new lease, the replacement operator might not achieve the same levels of production or sell coal at the same price as the lessee it replaced. In addition, it may be difficult to secure new or replacement lessees for small or isolated coal reserves, since industry trends toward consolidation favor larger-scale, higher-technology mining operations in order to increase productivity.
Lessees could satisfy obligations to their customers with coal from properties other than ours, depriving us of the ability to receive amounts in excess of minimum royalty payments.
Coal supply contracts often require operators to satisfy their obligations to their customers with resources mined from specific reserves or may provide the operator flexibility to source the coal from various reserves. Several factors may influence a lessee's decision to supply its customers with coal mined from properties we do not own or lease, including the royalty rates under the lessee's lease with us, mining conditions, mine operating costs, cost and availability of transportation, and customer specifications. If a lessee satisfies its obligations to its customers with coal from properties we do not own or lease, production on our properties will decrease, and we will receive lower royalty revenues.
A lessee may incorrectly report royalty revenues, which might not be identified by our lessee audit process or our mine inspection process or, if identified, might be identified in a subsequent period.
We depend on our lessees to correctly report production and royalty revenues on a monthly basis. Our regular lessee audits and mine inspections may not discover any irregularities in these reports or, if we do discover errors, we might not identify them in the reporting period in which they occurred. Any
39
Table of Contents
undiscovered reporting errors could result in a loss of royalty revenues and errors identified in subsequent periods could lead to accounting disputes as well as disputes with the lessees, or internal control deficiencies.
Disruption in supplies of coal produced by contractors operating at our mines could temporarily impair our ability to fill our customers' orders or increase our costs.
We at times use contractors to operate certain of our mines. For the year ended December 31, 2011, approximately 4% of our total coal production was from contractor-operated mines. Disruption in our supply of coal produced by these contractors could temporarily impair our ability to fill our customers' orders or require us to pay higher prices in order to obtain the required coal from other sources. Operational difficulties at contractor-operated mines, changes in demand for contract miners from other coal producers and other factors beyond our control could affect the availability, pricing and quality of coal produced by our contractors. Any increase in the prices we pay for contractor-produced coal could increase our costs and therefore adversely affect our results of operations and cash available for distribution to our unitholders.
Defects in title in the properties that we own or loss of any leasehold interests could limit our ability to mine these properties or result in significant unanticipated costs.
We conduct a significant part of our mining operations on leased properties. A title defect or the loss of any lease could adversely affect our ability to mine the associated reserves. Title to most of our owned and leased properties and the associated mineral rights is not usually verified until we make a commitment to develop a property, which may not occur until after we have obtained necessary permits and completed exploration of the property. In some cases, we rely on title information or representations and warranties provided by our grantors or lessors, as the case may be. Our right to mine some reserves would be adversely affected by defects in title or boundaries or if a lease expires. Any challenge to our title or leasehold interest could delay the exploration and development of the property and could ultimately result in the loss of some or all of our interest in the property. Mining operations from time to time may rely on a lease that we are unable to renew on terms at least as favorable, if at all. In such event, we may have to close down or significantly alter the sequence of mining operations or incur additional costs to obtain or renew such leases, which could adversely affect our future coal production. If we mine on property that we do not control, we could incur liability for such mining. Our sponsor, Wexford Capital, will not indemnify us for losses attributable to title defects in the properties that we own or lease.
Our work force could become unionized in the future, which could adversely affect our production and labor costs and increase the risk of work stoppages.
Currently, none of our employees are represented under collective bargaining agreements. However, all of our work force may not remain union-free in the future. If some or all of our work force were to become unionized, it could adversely affect our productivity and labor costs and increase the risk of work stoppages.
We depend on key personnel for the success of our business.
We depend on the services of our senior management team and other key personnel. The loss of the services of any member of senior management or key employee could have an adverse effect on our business and reduce our ability to make distributions to our unitholders. We may not be able to locate or employ on acceptable terms qualified replacements for senior management or other key employees if their services were no longer available.
40
Table of Contents
If the assumptions underlying our reclamation and mine closure obligations are materially inaccurate, we could be required to expend greater amounts than anticipated.
The Federal Surface Mining Control and Reclamation Act of 1977 and counterpart state laws and regulations establish operational, reclamation and closure standards for all aspects of surface mining as well as most aspects of underground mining. Estimates of our total reclamation and mine closing liabilities are based upon permit requirements and our engineering expertise related to these requirements. The estimate of ultimate reclamation liability is reviewed both periodically by our management and annually by independent third-party engineers. The estimated liability can change significantly if actual costs vary from assumptions or if governmental regulations change significantly. Please read "Part II, Item 7. Management's Discussion and Analysis of Financial Condition and Results of Operations—Critical Accounting Policies and Estimates—Asset Retirement Obligations." Wexford will not indemnify us against any reclamation or mine closing liabilities associated with our assets.
Our debt levels may limit our flexibility in obtaining additional financing and in pursuing other business opportunities.
Our level of indebtedness could have important consequences to us, including the following:
- •
- our ability to obtain additional financing, if necessary, for working capital, capital expenditures (including acquisitions) or other purposes may be impaired or such financing may not be available on favorable terms;
- •
- covenants contained in our existing and future credit and debt arrangements will require us to meet financial tests that may affect our flexibility in planning for and reacting to changes in our business, including possible acquisition opportunities;
- •
- we will need a portion of our cash flow to make principal and interest payments on our indebtedness, reducing the funds that would otherwise be available for operations, distributions to unitholders and future business opportunities;
- •
- we may be more vulnerable to competitive pressures or a downturn in our business or the economy generally; and
- •
- our flexibility in responding to changing business and economic conditions.
Increases in our total indebtedness would increase our total interest expense, which would in turn reduce our forecasted cash available for distribution. As of December 31, 2011 our current portion of long-term debt that will be funded from cash flows from operating activities during 2012 was approximately $1.3 million. Our ability to service our indebtedness will depend upon, among other things, our future financial and operating performance, which will be affected by prevailing economic conditions and financial, business, regulatory and other factors, some of which are beyond our control. If our operating results are not sufficient to service our current or future indebtedness, we will be forced to take actions such as reducing distributions, reducing or delaying our business activities, acquisitions, investments and/or capital expenditures, selling assets, restructuring or refinancing our indebtedness, or seeking additional equity capital or bankruptcy protection. We may not be able to effect any of these remedies on satisfactory terms, or at all.
Our credit agreement contains operating and financial restrictions that may restrict our business and financing activities and limit our ability to pay distributions upon the occurrence of certain events.
The operating and financial restrictions and covenants in our credit agreement and any future financing agreements could restrict our ability to finance future operations or capital needs or to
41
Table of Contents
engage, expand or pursue our business activities. For example, our credit agreement restricts our ability to:
- •
- incur additional indebtedness or guarantee other indebtedness;
- •
- grant liens;
- •
- make certain loans or investments;
- •
- dispose of assets outside the ordinary course of business, including the issuance and sale of capital stock of our subsidiaries;
- •
- change the line of business conducted by us or our subsidiaries;
- •
- enter into a merger, consolidation or make acquisitions; or
- •
- make distributions if an event of default occurs.
In addition, our payment of principal and interest on our debt will reduce cash available for distribution on our units. Our credit agreement limits our ability to pay distributions upon the occurrence of the following events, among others, which would apply to us and our subsidiaries:
- •
- failure to pay principal, interest or any other amount when due;
- •
- breach of the representations or warranties in the credit agreement;
- •
- failure to comply with the covenants in the credit agreement;
- •
- cross-default to other indebtedness;
- •
- bankruptcy or insolvency;
- •
- failure to have adequate resources to maintain, and obtain, operating permits as necessary to conduct our operations substantially as contemplated by the mining plans used in preparing the financial projections; and
- •
- a change of control.
Any subsequent refinancing of our current debt or any new debt could have similar restrictions. Our ability to comply with the covenants and restrictions contained in our credit agreement may be affected by events beyond our control, including prevailing economic, financial and industry conditions. If market or other economic conditions deteriorate, our ability to comply with these covenants may be impaired. If we violate any of the restrictions, covenants, ratios or tests in our credit agreement, a significant portion of our indebtedness may become immediately due and payable, and our lenders' commitment to make further loans to us may terminate. We might not have, or be able to obtain, sufficient funds to make these accelerated payments. In addition, our obligations under our credit agreement will be secured by substantially all of our assets, and if we are unable to repay our indebtedness under our credit agreement, the lenders could seek to foreclose on such assets. For more information, please read "Part II, Item 7. Management's Discussion and Analysis of Financial Condition and Results of Operations—Liquidity and Capital Resources—Credit Agreement."
Risks Inherent in an Investment in Us
Wexford owns and controls our general partner. Our general partner has fiduciary duties to its owners, and the interests of its owners may differ significantly from, or conflict with, the interests of our public common unitholders.
Wexford owns and controls our general partner. Although our general partner has a fiduciary duty to manage us in a manner beneficial to us and our unitholders, the executive officers and directors of our general partner have a fiduciary duty to manage our general partner in a manner beneficial to its
42
Table of Contents
owners. Therefore, conflicts of interest may arise between its owners and our general partner, on the one hand, and us and our unitholders, on the other hand. In resolving these conflicts of interest, our general partner may favor its own interests and the interests of its owners over the interests of our common unitholders. These conflicts include the following situations:
- •
- our general partner is allowed to take into account the interests of parties other than us, such as its owners, in resolving conflicts of interest, which has the effect of limiting its fiduciary duty to our unitholders;
- •
- neither our partnership agreement nor any other agreement requires Wexford to pursue a business strategy that favors us;
- •
- our partnership agreement limits the liability of and reduces fiduciary duties owed by our general partner and also restricts the remedies available to unitholders for actions that, without the limitations, might constitute breaches of fiduciary duty;
- •
- except in limited circumstances, our general partner has the power and authority to conduct our business without unitholder approval;
- •
- our general partner determines the amount and timing of asset purchases and sales, borrowings, issuances of additional partnership securities and the level of reserves, each of which can affect the amount of cash that is distributed to our unitholders;
- •
- our general partner determines the amount and timing of any capital expenditure and whether a capital expenditure is classified as a maintenance capital expenditure, which reduces operating surplus, or an expansion capital expenditure, which does not reduce operating surplus;
- •
- our general partner may cause us to borrow funds in order to permit the payment of cash distributions, even if the purpose or effect of the borrowing is to make a distribution on the subordinated units, to make incentive distributions or to accelerate the expiration of the subordination period;
- •
- our partnership agreement permits us to distribute up to $25.0 million as operating surplus, even if it is generated from asset sales, non-working capital borrowings or other sources that would otherwise constitute capital surplus. This cash may be used to fund distributions on our subordinated units or the incentive distribution rights;
- •
- our general partner determines which costs incurred by it and its affiliates are reimbursable by us;
- •
- our partnership agreement does not restrict our general partner from causing us to pay it or its affiliates for any services rendered to us or entering into additional contractual arrangements with its affiliates on our behalf;
- •
- our general partner intends to limit its liability regarding our contractual and other obligations;
- •
- our general partner may exercise its right to call and purchase common units if it and its affiliates own more than 80% of the common units;
- •
- our general partner controls the enforcement of obligations that it and its affiliates owe to us;
- •
- our general partner decides whether to retain separate counsel, accountants or others to perform services for us; and
- •
- our general partner may elect to cause us to issue common units to it in connection with a resetting of the target distribution levels related to our general partner's incentive distribution rights without the approval of the conflicts committee of the board of directors of our general
43
Table of Contents
In addition, Wexford currently holds substantial interests in other companies in the energy and natural resource sectors. We may compete directly with entities in which Wexford has an interest for acquisition opportunities and potentially will compete with these entities for new business or extensions of the existing services provided by us. Please read "—Our sponsor, Wexford Capital, and affiliates of our general partner may compete with us."
Common units held by unitholders who are not eligible citizens will be subject to redemption.
In order to comply with U.S. laws with respect to the ownership of interests in mineral leases on federal lands, we have adopted certain requirements regarding those investors who own our common units. As used in this report, an eligible citizen means a person or entity qualified to hold an interest in mineral leases on federal lands. As of the date hereof, an eligible citizen must be: (1) a citizen of the United States; (2) a corporation organized under the laws of the United States or of any state thereof; or (3) an association of U.S. citizens, such as a partnership or limited liability company, organized under the laws of the United States or of any state thereof, but only if such association does not have any direct or indirect foreign ownership, other than foreign ownership of stock in a parent corporation organized under the laws of the United States or of any state thereof. For the avoidance of doubt, onshore mineral leases or any direct or indirect interest therein may be acquired and held by aliens only through stock ownership, holding or control in a corporation organized under the laws of the United States or of any state thereof. Unitholders who are not persons or entities who meet the requirements to be an eligible citizen run the risk of having their units redeemed by us at the lower of their purchase price cost or the then-current market price. The redemption price will be paid in cash or by delivery of a promissory note, as determined by our general partner.
Our general partner intends to limit its liability regarding our obligations.
Our general partner intends to limit its liability under contractual arrangements so that the counterparties to such arrangements have recourse only against our assets, and not against our general partner or its assets. Our general partner may therefore cause us to incur indebtedness or other obligations that are nonrecourse to our general partner. Our partnership agreement provides that any action taken by our general partner to limit its liability is not a breach of our general partner's fiduciary duties, even if we could have obtained more favorable terms without the limitation on liability. In addition, we are obligated to reimburse or indemnify our general partner to the extent that it incurs obligations on our behalf. Any such reimbursement or indemnification payments would reduce the amount of cash otherwise available for distribution to our unitholders.
Our partnership agreement requires that we distribute all of our available cash, which could limit our ability to grow and make acquisitions.
We expect that we will distribute all of our available cash to our unitholders and will rely primarily upon external financing sources, including commercial bank borrowings and the issuance of debt and equity securities, to fund our acquisitions and expansion capital expenditures. As a result, to the extent we are unable to finance growth externally, our cash distribution policy will significantly impair our ability to grow.
In addition, because we distribute all of our available cash, our growth may not be as fast as that of businesses that reinvest their available cash to expand ongoing operations. To the extent we issue additional units in connection with any acquisitions or expansion capital expenditures, the payment of distributions on those additional units may increase the risk that we will be unable to maintain or increase our per unit distribution level. There are no limitations in our partnership agreement or our
44
Table of Contents
credit agreement on our ability to issue additional units, including units ranking senior to the common units. The incurrence of additional commercial borrowings or other debt to finance our growth strategy would result in increased interest expense, which, in turn, may impact the available cash that we have to distribute to our unitholders.
Our partnership agreement limits our general partner's fiduciary duties to holders of our common and subordinated units.
Our partnership agreement contains provisions that modify and reduce the fiduciary standards to which our general partner would otherwise be held by state fiduciary duty law. For example, our partnership agreement permits our general partner to make a number of decisions in its individual capacity, as opposed to in its capacity as our general partner, or otherwise free of fiduciary duties to us and our unitholders. This entitles our general partner to consider only the interests and factors that it desires and relieves it of any duty or obligation to give any consideration to any interest of, or factors affecting, us, our affiliates or our limited partners. Examples of decisions that our general partner may make in its individual capacity include:
- •
- how to allocate business opportunities among us and its affiliates;
- •
- whether to exercise its limited call right;
- •
- how to exercise its voting rights with respect to the units it owns;
- •
- whether to exercise its registration rights;
- •
- whether to elect to reset target distribution levels; and
- •
- whether or not to consent to any merger or consolidation of the partnership or amendment to the partnership agreement.
By purchasing a common unit, a unitholder is treated as having consented to the provisions in the partnership agreement, including the provisions discussed above.
Our partnership agreement restricts the remedies available to holders of our common and subordinated units for actions taken by our general partner that might otherwise constitute breaches of fiduciary duty.
Our partnership agreement contains provisions that restrict the remedies available to unitholders for actions taken by our general partner that might otherwise constitute breaches of fiduciary duty under state fiduciary duty law. For example, our partnership agreement:
- •
- provides that whenever our general partner makes a determination or takes, or declines to take, any other action in its capacity as our general partner, our general partner is required to make such determination, or take or decline to take such other action, in good faith, and will not be subject to any other or different standard imposed by our partnership agreement, Delaware law, or any other law, rule or regulation, or at equity;
- •
- provides that our general partner will not have any liability to us or our unitholders for decisions made in its capacity as a general partner so long as it acted in good faith, meaning that it believed that the decision was in the best interest of our partnership;
- •
- provides that our general partner and its officers and directors will not be liable for monetary damages to us or our limited partners resulting from any act or omission unless there has been a final and non-appealable judgment entered by a court of competent jurisdiction determining that our general partner or its officers and directors, as the case may be, acted in bad faith or engaged in fraud or willful misconduct or, in the case of a criminal matter, acted with knowledge that the conduct was criminal; and
45
Table of Contents
- •
- provides that our general partner will not be in breach of its obligations under the partnership agreement or its fiduciary duties to us or our limited partners if a transaction with an affiliate or the resolution of a conflict of interest is:
- (1)
- approved by the conflicts committee of the board of directors of our general partner, although our general partner is not obligated to seek such approval;
- (2)
- approved by the vote of a majority of the outstanding common units, excluding any common units owned by our general partner and its affiliates;
- (3)
- on terms no less favorable to us than those generally being provided to or available from unrelated third parties; or
- (4)
- fair and reasonable to us, taking into account the totality of the relationships among the parties involved, including other transactions that may be particularly favorable or advantageous to us.
In connection with a situation involving a transaction with an affiliate or a conflict of interest, any determination by our general partner must be made in good faith. If an affiliate transaction or the resolution of a conflict of interest is not approved by our common unitholders or the conflicts committee and the board of directors of our general partner determines that the resolution or course of action taken with respect to the affiliate transaction or conflict of interest satisfies either of the standards set forth in subclauses (3) and (4) above, then it will be presumed that, in making its decision, the board of directors acted in good faith, and in any proceeding brought by or on behalf of any limited partner or the partnership, the person bringing or prosecuting such proceeding will have the burden of overcoming such presumption.
Our sponsor, Wexford Capital, and affiliates of our general partner may compete with us.
Our partnership agreement provides that our general partner will be restricted from engaging in any business activities other than acting as our general partner and those activities incidental to its ownership interest in us. Affiliates of our general partner, including our sponsor, Wexford Capital, and its investment funds, are not prohibited from engaging in other businesses or activities, including those that might be in direct competition with us. Through its investment funds, Wexford Capital currently holds substantial interests in other companies in the energy and natural resources sectors. Wexford Capital, through its investment funds and managed accounts, makes investments and purchases entities in the coal and oil and natural gas sectors. These investments and acquisitions may include entities or assets that we would have been interested in acquiring. Therefore, Wexford Capital may compete with us for investment opportunities and Wexford may own an interest in entities that compete with us.
Pursuant to the terms of our partnership agreement, the doctrine of corporate opportunity, or any analogous doctrine, does not apply to our general partner or any of its affiliates, including its executive officers, directors and Wexford Capital. Any such person or entity that becomes aware of a potential transaction, agreement, arrangement or other matter that may be an opportunity for us will not have any duty to communicate or offer such opportunity to us. Any such person or entity will not be liable to us or to any limited partner for breach of any fiduciary duty or other duty by reason of the fact that such person or entity pursues or acquires such opportunity for itself, directs such opportunity to another person or entity or does not communicate such opportunity or information to us. This may create actual and potential conflicts of interest between us and affiliates of our general partner and result in less than favorable treatment of us and our unitholders.
46
Table of Contents
Our general partner may elect to cause us to issue common units to it in connection with a resetting of the target distribution levels related to its incentive distribution rights, without the approval of the conflicts committee of its board of directors or the holders of our common units. This could result in lower distributions to holders of our common units.
Our general partner has the right, at any time when there are no subordinated units outstanding and it has received incentive distributions at the highest level to which it is entitled (48.0%) for each of the prior four consecutive fiscal quarters, to reset the initial target distribution levels at higher levels based on our distributions at the time of the exercise of the reset election. Following a reset election by our general partner, the minimum quarterly distribution will be adjusted to equal the reset minimum quarterly distribution and the target distribution levels will be reset to correspondingly higher levels based on percentage increases above the reset minimum quarterly distribution.
If our general partner elects to reset the target distribution levels, it will be entitled to receive a number of common units and will retain its then-current general partner interest. The number of common units to be issued to our general partner will equal the number of common units which would have entitled the holder to an average aggregate quarterly cash distribution in the prior two quarters equal to the average of the distributions to our general partner on the incentive distribution rights in the prior two quarters. We anticipate that our general partner would exercise this reset right in order to facilitate acquisitions or internal growth projects that would not be sufficiently accretive to cash distributions per common unit without such conversion. It is possible, however, that our general partner could exercise this reset election at a time when it is experiencing, or expects to experience, declines in the cash distributions it receives related to its incentive distribution rights and may, therefore, desire to be issued common units rather than retain the right to receive incentive distributions based on the initial target distribution levels. As a result, a reset election may cause our common unitholders to experience a reduction in the amount of cash distributions that our common unitholders would have otherwise received had we not issued new common units to our general partner in connection with resetting the target distribution levels.
Holders of our common units have limited voting rights and are not entitled to elect our general partner or its directors, which could reduce the price at which the common units will trade.
Unlike the holders of common stock in a corporation, unitholders have only limited voting rights on matters affecting our business and, therefore, limited ability to influence management's decisions regarding our business. Unitholders will have no right on an annual or ongoing basis to elect our general partner or its board of directors. The board of directors of our general partner, including the independent directors, is chosen entirely by Wexford, as a result of it owning our general partner, and not by our unitholders. Unlike publicly traded corporations, we do not conduct annual meetings of our unitholders to elect directors or conduct other matters routinely conducted at annual meetings of stockholders of corporations. As a result of these limitations, the price at which the common units will trade could be diminished because of the absence or reduction of a takeover premium in the trading price.
Even if holders of our common units are dissatisfied, they cannot currently remove our general partner without its consent.
If our unitholders are dissatisfied with the performance of our general partner, they will have limited ability to remove our general partner. Unitholders are currently unable to remove our general partner without its consent because our general partner and its affiliates own sufficient units to be able to prevent its removal. The vote of the holders of at least 662/3% of all outstanding common and subordinated units voting together as a single class is required to remove our general partner. As of March 9, 2012, Wexford owned an aggregate of approximately 72% of our common and subordinated units. Also, if our general partner is removed without cause during the subordination period and no
47
Table of Contents
units held by the holders of the subordinated units or their affiliates are voted in favor of that removal, all remaining subordinated units will automatically be converted into common units and any existing arrearages on the common units will be extinguished. Cause is narrowly defined in our partnership agreement to mean that a court of competent jurisdiction has entered a final, non-appealable judgment finding our general partner liable for actual fraud or willful or wanton misconduct in its capacity as our general partner. Cause does not include most cases of charges of poor management of the business.
Our general partner interest or the control of our general partner may be transferred to a third party without unitholder consent.
Our general partner may transfer its general partner interest to a third party in a merger or in a sale of all or substantially all of its assets without the consent of our unitholders. Furthermore, our partnership agreement does not restrict the ability of the members of our general partner to transfer their respective membership interests in our general partner to a third party. The new members of our general partner would then be in a position to replace the board of directors and executive officers of our general partner with their own designees and thereby exert significant control over the decisions taken by the board of directors and executive officers of our general partner. This effectively permits a "change of control" without the vote or consent of the unitholders.
Our general partner has a limited call right that may require unitholders to sell their common units at an undesirable time or price.
If at any time our general partner and its affiliates own more than 80% of the common units, our general partner will have the right, but not the obligation, which it may assign to any of its affiliates or to us, to acquire all, but not less than all, of the common units held by unaffiliated persons at a price equal to the greater of (1) the average of the daily closing price of the common units over the 20 trading days preceding the date three days before notice of exercise of the call right is first mailed and (2) the highest per-unit price paid by our general partner or any of its affiliates for common units during the 90-day period preceding the date such notice is first mailed. As a result, unitholders may be required to sell their common units at an undesirable time or price and may not receive any return or a negative return on their investment. Unitholders may also incur a tax liability upon a sale of their units. Our general partner is not obligated to obtain a fairness opinion regarding the value of the common units to be repurchased by it upon exercise of the limited call right. There is no restriction in our partnership agreement that prevents our general partner from issuing additional common units and exercising its call right. If our general partner exercised its limited call right, the effect would be to take us private and, if the units were subsequently deregistered, we would no longer be subject to the reporting requirements of the Securities Exchange Act of 1934, or the Exchange Act. As of March 9, 2012, Wexford owned an aggregate of approximately 54% of our common units and approximately 95% of our subordinated units.
We may issue additional units without unitholder approval, which would dilute existing unitholder ownership interests.
Our partnership agreement does not limit the number of additional limited partner interests we may issue at any time without the approval of our unitholders. The issuance of additional common units or other equity interests of equal or senior rank will have the following effects:
- •
- our existing unitholders' proportionate ownership interest in us will decrease;
- •
- the amount of cash available for distribution on each unit may decrease;
- •
- because a lower percentage of total outstanding units will be subordinated units, the risk that a shortfall in the payment of the minimum quarterly distribution will be borne by our common unitholders will increase;
48
Table of Contents
- •
- the ratio of taxable income to distributions may increase;
- •
- the relative voting strength of each previously outstanding unit may be diminished; and
- •
- the market price of the common units may decline.
The market price of our common units could be adversely affected by sales of substantial amounts of our common units in the public or private markets, including sales by Wexford or other large holders.
As of December 31, 2011, we had 15,318,178 common units and 12,397,000 subordinated units outstanding. All of the subordinated units will convert into common units on a one-for-one basis at the end of the subordination period. Sales by Wexford or other large holders of a substantial number of our common units in the public markets, or the perception that such sales might occur, could have a material adverse effect on the price of our common units or could impair our ability to obtain capital through an offering of equity securities. In addition, we have agreed to provide registration rights to Wexford. Under our agreement, our general partner and its affiliates have registration rights relating to the offer and sale of any units that they hold, subject to certain limitations.
Our partnership agreement restricts the voting rights of unitholders owning 20% or more of our common units.
Our partnership agreement restricts unitholders' voting rights by providing that any units held by a person or group that owns 20% or more of any class of units then outstanding, other than our general partner and its affiliates, their transferees and persons who acquired such units with the prior approval of the board of directors of our general partner, cannot vote on any matter.
Cost reimbursements due to our general partner and its affiliates for services provided to us or on our behalf will reduce cash available for distribution to our unitholders. The amount and timing of such reimbursements will be determined by our general partner.
Prior to making any distribution on the common units, we will reimburse our general partner and its affiliates for all expenses they incur and payments they make on our behalf. Our partnership agreement does not set a limit on the amount of expenses for which our general partner and its affiliates may be reimbursed. These expenses include salary, bonus, incentive compensation and other amounts paid to persons who perform services for us or on our behalf and expenses allocated to our general partner by its affiliates. Our partnership agreement provides that our general partner will determine in good faith the expenses that are allocable to us. The reimbursement of expenses and payment of fees, if any, to our general partner and its affiliates will reduce the amount of available cash to pay cash distributions to our unitholders.
While our partnership agreement requires us to distribute all of our available cash, our partnership agreement, including provisions requiring us to make cash distributions contained therein, may be amended.
While our partnership agreement requires us to distribute all of our available cash, our partnership agreement, including provisions requiring us to make cash distributions contained therein, may be amended. Our partnership agreement generally may not be amended during the subordination period without the approval of our public common unitholders. However, our partnership agreement can be amended with the consent of our general partner and the approval of a majority of the outstanding common units (including common units held by Wexford) after the subordination period has ended. As of March 9, 2012, Wexford owned approximately 54% of the outstanding common units and 95% of our outstanding subordinated units.
49
Table of Contents
Unitholders may have liability to repay distributions and in certain circumstances may be personally liable for our obligations.
Under certain circumstances, unitholders may have to repay amounts wrongfully returned or distributed to them. Under Section 17-607 of the Delaware Revised Uniform Limited Partnership Act, or the Delaware Act, we may not make a distribution to our unitholders if the distribution would cause our liabilities to exceed the fair value of our assets. Delaware law provides that for a period of three years from the date of the impermissible distribution, limited partners who received the distribution and who knew at the time of the distribution that it violated Delaware law will be liable to the limited partnership for the distribution amount. A purchaser of units who becomes a limited partner is liable for the obligations of the transferring limited partner to make contributions to the partnership that are known to the purchaser of units at the time it became a limited partner and for unknown obligations if the liabilities could be determined from the partnership agreement. Liabilities to partners on account of their partnership interests and liabilities that are non-recourse to the partnership are not counted for purposes of determining whether a distribution is permitted.
It may be determined that the right, or the exercise of the right by the limited partners as a group, to (i) remove or replace our general partner, (ii) approve some amendments to our partnership agreement or (iii) take other action under our partnership agreement constitutes "participation in the control" of our business. A limited partner that participates in the control of our business within the meaning of the Delaware Act may be held personally liable for our obligations under the laws of Delaware, to the same extent as our general partner. This liability would extend to persons who transact business with us under the reasonable belief that the limited partner is a general partner. Neither our partnership agreement nor the Delaware Act specifically provides for legal recourse against our general partner if a limited partner were to lose limited liability through any fault of our general partner.
The New York Stock Exchange does not require a publicly traded limited partnership like us to comply with certain of its corporate governance requirements.
Because we are a publicly traded limited partnership, the New York Stock Exchange, or NYSE, does not require us to have a majority of independent directors on our general partner's board of directors or to establish a compensation committee or a nominating and corporate governance committee. Accordingly, unitholders will not have the same protections afforded to certain corporations that are subject to all of the NYSE corporate governance requirements.
We may not be able to establish and maintain effective internal controls in accordance with applicable federal securities laws and regulations, and we may incur significant costs in our efforts.
We have only recently become subject to the public reporting requirements of the Exchange Act. We prepare our consolidated financial statements in accordance with GAAP, but our internal accounting controls may not currently meet all standards applicable to companies with publicly traded securities. Effective internal controls are necessary for us to provide reliable financial reports, prevent fraud and operate successfully as a publicly traded partnership. Although we have taken measures to improve our internal control over financial reporting, material weaknesses may result in a material misstatement of our financial statements in the future.
50
Table of Contents
Tax Risks
Our tax treatment depends on our status as a partnership for federal income tax purposes. If the IRS were to treat us as a corporation for U.S. federal income tax purposes or we become subject to additional amounts of entity-level taxation, then our cash available for distribution to our unitholders would be substantially reduced.
The anticipated after-tax economic benefit of an investment in the common units depends largely on our being treated as a partnership for U.S. federal income tax purposes. A publicly traded partnership such as us may be treated as a corporation for federal income tax purposes unless it satisfies a "qualifying income" requirement. Based on our current operations we believe that we are treated as a partnership rather than a corporation for such purposes; however, a change in our business could cause us to be treated as a corporation for federal income tax purposes or otherwise subject us to taxation as an entity.
If we were treated as a corporation for U.S. federal income tax purposes, we would pay federal income tax on our taxable income at the corporate tax rate, which is currently a maximum of 35%, and would likely pay state and local income tax at varying rates. Distributions to you would generally be taxed again as corporate distributions, and no income, gains, losses, deductions, or credits would flow through to you. Because a tax would be imposed upon us as a corporation, our cash available for distribution to you would be substantially reduced. Therefore, treatment of us as a corporation would result in a material reduction in the anticipated cash flow and after-tax return to the unitholders, likely causing a substantial reduction in the value of our common units.
The tax treatment of publicly traded partnerships or an investment in our common units could be subject to potential legislative, judicial or administrative changes and differing interpretations, possibly on a retroactive basis.
Current law may change so as to cause us to be treated as a corporation for U.S. federal income tax purposes or otherwise subjecting us to entity-level taxation. Additionally, the present federal income tax treatment of publicly traded partnerships, including us, or an investment in our common units may be modified by administrative or judicial interpretation at any time. For example, at the federal level, legislation has been considered that would have eliminated partnership tax treatment for certain publicly traded partnerships. Although such legislation would not have applied to us as considered, it could be reintroduced and amended prior to enactment in a manner that does apply to us. Any modification to the federal income tax laws and interpretations thereof may or may not be applied retroactively. We are unable to predict whether any of such change, or other proposals, will ultimately be enacted. Any such change could negatively impact the value of an investment in our common units.
If we were subjected to a material amount of additional entity-level taxation by individual states, it would reduce our cash available for distribution to our unitholders.
Changes in current state law may subject us to additional entity-level taxation by individual states. Because of widespread state budget deficits and other reasons, several states are evaluating ways to subject partnerships to entity-level taxation through the imposition of state income, franchise and other forms of taxation. Imposition of any such taxes may substantially reduce the cash available for distribution to you.
Our partnership agreement provides that if a law is enacted or existing law is modified or interpreted in a manner that subjects us to additional amounts of entity-level taxation for federal or state tax purposes, the minimum quarterly distribution amount and the target distribution amounts may be adjusted to reflect the impact of that law on us.
51
Table of Contents
If the IRS contests the federal income tax positions we take, the market for our common units may be adversely impacted and the cost of any IRS contest will reduce our cash available for distribution to our unitholders.
We have not requested a ruling from the IRS with respect to our treatment as a partnership for U.S. federal income tax purposes or any other matter affecting us. The IRS may adopt positions that differ from the positions we take, and the IRS's positions may ultimately be sustained. It may be necessary to resort to administrative or court proceedings to sustain some or all of the positions we take. A court may not agree with some or all of the positions we take. Any contest with the IRS may materially and adversely impact the market for our common units and the price at which they trade. In addition, our costs of any contest with the IRS will be borne indirectly by our unitholders and our general partner because the costs will reduce our cash available for distribution.
Unitholders' share of our income will be taxable for U.S. federal income tax purposes even if they do not receive any cash distributions from us.
Because our unitholders will be treated as partners to whom we will allocate taxable income which could be different in amount than the cash we distribute, a unitholder's allocable share of our taxable income will be taxable to it, which may require the payment of federal income taxes and, in some cases, state and local income taxes on their share of our taxable income even if they receive no cash distributions from us. Unitholders may not receive cash distributions from us equal to their share of our taxable income or even equal to the actual tax liability resulting from such income.
Tax gain or loss on the disposition of our common units could be more or less than expected.
If you sell your common units, you will recognize a gain or loss for U.S. federal income tax purposes equal to the difference between the amount you realize on the sale and your tax basis in those common units. Because distributions in excess of your allocable share of our net taxable income decrease your tax basis in your common units, the amount, if any, of such prior excess distributions with respect to the units you sell will, in effect, become taxable income to you if you sell such units at a price greater than your tax basis in those units, even if the price you receive is less than your original cost. Furthermore, a substantial portion of the amount realized, whether or not representing gain, may be taxed as ordinary income due to potential recapture items, including depletion and depreciation recapture. In addition, because the amount realized includes your share of our nonrecourse liabilities, if you sell your units, you may incur a tax liability in excess of the amount of cash you receive from the sale.
Tax-exempt entities and non-U.S. persons face unique tax issues from owning our common units that may result in adverse tax consequences to them.
Investment in common units by tax-exempt entities, such as individual retirement accounts (known as IRAs), and non-U.S. persons raises issues unique to them. For example, virtually all of our income allocated to organizations that are exempt from federal income tax, including IRAs and other retirement plans, will be unrelated business taxable income and will be taxable to them. Distributions to non-U.S. persons will be reduced by withholding taxes at the highest applicable tax rate, and non-U.S. persons will be required to file U.S. federal tax returns and pay tax on their share of our taxable income. If you are a tax-exempt entity or a non-U.S. person, you should consult a tax advisor before investing in our common units.
52
Table of Contents
We treat each purchaser of common units as having the same tax benefits without regard to the actual common units purchased. The IRS may challenge this treatment, which could adversely affect the value of the common units.
Due to a number of factors, including our inability to match transferors and transferees of common units, we have adopted depreciation and amortization positions that may not conform to all aspects of existing Treasury Regulations. A successful IRS challenge to those positions could adversely affect the amount of tax benefits available to you. It also could affect the timing of these tax benefits or the amount of gain from your sale of common units and could have a negative impact on the value of our common units or result in audit adjustments to your tax returns.
We prorate our items of income, gain, loss and deduction, for U.S. federal income tax purposes, between transferors and transferees of our units each month based upon the ownership of our units on the first day of each month, instead of on the basis of the date a particular unit is transferred. The IRS may challenge this treatment, which could change the allocation of items of income, gain, loss and deduction among our unitholders.
We prorate our items of income, gain, loss and deduction, for U.S. federal income tax purposes, between transferors and transferees of our units each month based upon the ownership of our units on the first day of the month, instead of on the basis of the date a particular unit is transferred. Nonetheless, we allocate certain deductions for depreciation of capital additions based upon the date the underlying property is placed in service. The use of this proration method may not be permitted under existing Treasury Regulations. Recently, the U.S. Treasury Department issued proposed Treasury Regulations that provide a safe harbor pursuant to which publicly traded partnerships may use a similar monthly simplifying convention to allocate tax items among transferor and transferee unitholders. Nonetheless, the proposed regulations do not specifically authorize the use of the proration method we have adopted. If the IRS were to challenge our proration method or new Treasury Regulations were issued, we may be required to change our allocation of items of income, gain, loss and deduction among our unitholders.
A unitholder whose units are loaned to a "short seller" to cover a short sale of units may be considered as having disposed of those units. If so, the unitholder would no longer be treated for tax purposes as a partner with respect to those units during the period of the loan and may recognize gain or loss from the disposition.
Because a unitholder whose units are loaned to a "short seller" to cover a short sale of units may be considered as having disposed of the loaned units, the unitholder may no longer be treated for tax purposes as a partner with respect to those units during the period of the loan to the short seller and the unitholder may recognize gain or loss from such disposition. Moreover, during the period of the loan to the short seller, any of our income, gain, loss or deduction with respect to those units may not be reportable by the unitholder and any cash distributions received by the unitholder as to those units could be fully taxable as ordinary income. Unitholders desiring to assure their status as partners and avoid the risk of gain recognition from a loan to a short seller are urged to consult a tax advisor to discuss whether it is advisable to modify any applicable brokerage account agreements to prohibit their brokers from borrowing their units.
We will adopt certain valuation methodologies, for U.S. federal income tax purposes, that may result in a shift of income, gain, loss and deduction between our general partner and the unitholders. The IRS may challenge this treatment, which could adversely affect the value of the common units.
When we issue additional units or engage in certain other transactions, we will determine the fair market value of our assets and allocate any unrealized gain or loss attributable to our assets to the capital accounts of our unitholders and our general partner. Our methodology may be viewed as understating the value of our assets. In that case, there may be a shift of income, gain, loss and
53
Table of Contents
deduction between certain unitholders and our general partner, which may be unfavorable to such unitholders. Moreover, under our valuation methods, subsequent purchasers of common units may have a greater portion of their Internal Revenue Code Section 743(b) adjustment allocated to our tangible assets and a lesser portion allocated to our intangible assets. The IRS may challenge our valuation methods, or our allocation of the Section 743(b) adjustment attributable to our tangible and intangible assets, and allocations of taxable income, gain, loss and deduction between our general partner and certain of our unitholders.
A successful IRS challenge to these methods or allocations could adversely affect the amount of taxable income or loss being allocated to our unitholders. It also could affect the amount of taxable gain from our unitholders' sale of common units and could have a negative impact on the value of the common units or result in audit adjustments to our unitholders' tax returns without the benefit of additional deductions.
The sale or exchange of 50% or more of our capital and profits interests during any twelve-month period will result in the termination of our partnership for federal income tax purposes.
We will be considered to have technically terminated for U.S. federal income tax purposes if there is a sale or exchange of 50% or more of the total interests in our capital and profits within a twelve-month period. For purposes of determining whether a technical tax termination has occurred, a sale or exchange of 50% or more of the total interests in our capital and profits could occur if, for example, Rhino Energy Holdings LLC, which currently owns approximately 67% of the total interests in our capital and profits, sells or exchanges a majority of the interests it owns in us within a period of twelve months of the total interests in our capital and profits, sells or exchanges a majority of the interests it owns in us within a period of twelve months. For purposes of determining whether the 50% threshold has been met, multiple sales of the same unit will be counted only once. While we would continue our existence as a Delaware limited partnership, our technical termination would, among other things, result in the closing of our taxable year for all unitholders, which would result in us filing two tax returns (and our unitholders could receive two Schedules K-1) for one fiscal year and could result in a deferral of depreciation deductions allowable in computing our taxable income. In the case of a unitholder reporting on a taxable year other than a fiscal year ending December 31, the closing of our taxable year may also result in more than twelve months of our taxable income or loss being includable in the unitholder's taxable income for the year of termination. A technical termination would not affect our classification as a partnership for federal income tax purposes, but instead, we would be treated as a new partnership for tax purposes. If treated as a new partnership, we must make new tax elections and could be subject to penalties if we are unable to determine that a technical termination occurred. The IRS has recently announced a relief procedure whereby if a publicly traded partnership that has technically terminated requests and the IRS grants special relief, among other things, the partnership will be required to provide only a single Schedule K-1 to unitholders for the tax years in which the termination occurs.
Certain U.S. federal income tax preferences currently available with respect to coal exploration and development may be eliminated as a result of future legislation.
President Obama's Proposed Fiscal Year 2012 budget recommends elimination of certain key U.S. federal income tax preferences relating to coal exploration and development (the "Budget Proposal"). The Budget Proposal would (1) eliminate current deductions and 60-month amortization for exploration and development costs relating to coal and other hard mineral fossil fuels, (2) repeal the percentage depletion allowance with respect to coal properties, (3) repeal capital gains treatment of coal and lignite royalties, and (4) exclude from the definition of domestic production gross receipts all gross receipts derived from the sale, exchange, or other disposition of coal, other hard mineral fossil fuels, or primary products thereof. The passage of any legislation as a result of the Budget Proposal or
54
Table of Contents
any other similar changes in U.S. federal income tax laws could eliminate certain tax deductions that are currently available with respect to coal exploration and development, and any such change could increase the taxable income allocable to our unitholders and negatively impact the value of an investment in our units.
Unitholders will likely be subject to state and local taxes and return filing requirements in states where they do not live as a result of investing in our common units.
In addition to U.S. federal income taxes, unitholders will likely be subject to other taxes, including state and local taxes, unincorporated business taxes and estate, inheritance or intangible taxes that are imposed by the various jurisdictions in which we do business or control property now or in the future, even if they do not live in any of those jurisdictions. Unitholders will likely be required to file state and local income tax returns and pay state and local income taxes in some or all of these various jurisdictions. Further, unitholders may be subject to penalties for failure to comply with those requirements. We conduct business in a number of states, most of which also impose an income tax on corporations and other entities. In addition, many of these states also impose a personal income tax on individuals. As we make acquisitions or expand our business, we may control assets or conduct business in additional states that impose a personal income tax. It is your responsibility to file all U.S. federal, state and local tax returns.
Item 1B. Unresolved Staff Comments
None.
Item 2. Properties.
See "Part I, Item 1. Business" for information about our mining operations.
Coal Reserves and Non-Reserve Coal Deposits
We base our coal reserve and non-reserve coal deposit estimates on engineering, economic and geological data assembled and analyzed by our staff. These estimates are also based on the expected cost of production and projected sale prices and assumptions concerning the permitability and advances in mining technology. The estimates of coal reserves and non-reserve coal deposits as to both quantity and quality are periodically updated to reflect the production of coal from the reserves, updated geologic models and mining recovery data, coal reserves recently acquired and estimated costs of production and sales prices. Changes in mining methods may increase or decrease the recovery basis for a coal seam as will plant processing efficiency tests. We maintain reserve and non-reserve coal deposit information in secure computerized databases, as well as in hard copy. The ability to update and/or modify the estimates of our coal reserves and non-reserve coal deposits is restricted to a few individuals and the modifications are documented.
Periodically, we retain outside experts to independently verify our coal reserve and our non-reserve coal deposit estimates. The most recent audit by an independent engineering firm of our and the joint venture's coal reserve and non-reserve coal deposit estimates was completed by Marshall Miller & Associates, Inc., as of December 31, 2011, and covered a majority of the coal reserves and non-reserve coal deposits that we and the joint venture controlled as of such date. The coal reserve and non-reserve coal deposit estimates for the Castle Valley mining complex in Utah were audited by Norwest Corporation as of December 31, 2011 due to this firm's familiarity with the coal reserves at this location, as Norwest Corporation performed the initial coal reserve audit when we purchased Castle Valley in August 2010. Additionally, the coal reserve and non-reserve coal deposit information for our Elk Horn operation was audited by John T. Boyd Company in September 2011 in connection with our acquisition of Elk Horn in June 2011. Our estimates as of December 31, 2011 for Elk Horn's reserves
55
Table of Contents
were prepared by our staff of geologists and engineers. We intend to continue to periodically retain outside experts to assist management with the verification of our estimates of our coal reserves and non-reserve coal deposits going forward.
As of December 31, 2011, we controlled an estimated 437.0 million tons of proven and probable reserves and an estimated 417.1 million tons of non-reserve coal deposits. As of December 31, 2011, the joint venture controlled an estimated 43.4 million tons of proven and probable coal reserves and an estimated 17.9 million tons of non-reserve coal deposits.
Coal Reserves
The following table provides information as of December 31, 2011 on the type, amount and ownership of the coal reserves:
| | | | | | | | | | | | | | | | | | | | | | | | | | | | |
| | Proven and Probable Reserves(1) | |
|---|
Region | | Total(3) | | Proven | | Probable | | Assigned | | Unassigned | | Owned | | Leased | | Steam(2) | | Metallurgical(2) | |
|---|
| | (in million tons)
| |
|---|
Central Appalachia | | | | | | | | | | | | | | | | | | | | | | | | | | | | |
Tug River Complex (KY, WV) | | | 23.0 | | | 17.8 | | | 5.2 | | | 19.0 | | | 4.0 | | | 5.0 | | | 18.0 | | | 17.2 | | | 5.8 | |
Rob Fork Complex (KY) | | | 24.5 | | | 20.8 | | | 3.7 | | | 24.5 | | | — | | | 7.6 | | | 16.9 | | | 17.5 | | | 7.0 | |
Deane Complex (KY) | | | 39.5 | | | 23.8 | | | 15.7 | | | 7.1 | | | 32.4 | | | 39.5 | | | — | | | 39.5 | | | — | |
Rich Mountain Field (WV) | | | 8.6 | | | 1.5 | | | 7.1 | | | — | | | 8.6 | | | 8.6 | | | — | | | — | | | 8.6 | |
Elk Horn (KY) | | | 117.5 | | | 80.1 | | | 37.4 | | | 58.1 | | | 59.4 | | | 115.1 | | | 2.4 | | | 117.5 | | | — | |
| | | | | | | | | | | | | | | | | | | | |
Total Central Appalachia(3) | | | 213.1 | | | 144.0 | | | 69.1 | | | 108.7 | | | 104.4 | | | 175.8 | | | 37.3 | | | 191.7 | | | 21.4 | |
| | | | | | | | | | | | | | | | | | | | |
Northern Appalachia | | | | | | | | | | | | | | | | | | | | | | | | | | | | |
Hopedale Complex (OH) | | | 27.7 | | | 21.0 | | | 6.7 | | | 10.5 | | | 17.2 | | | 11.2 | | | 16.5 | | | 27.7 | | | — | |
Sands Hill Complex (OH) | | | 10.7 | | | 9.1 | | | 1.6 | | | 10.7 | | | — | | | 1.4 | | | 9.3 | | | 10.7 | | | — | |
Leesville Field (OH) | | | 27.0 | | | 7.8 | | | 19.2 | | | — | | | 27.0 | | | 27.0 | | | — | | | 27.0 | | | — | |
Springdale Field (PA) | | | 13.8 | | | 8.8 | | | 5.0 | | | — | | | 13.8 | | | 13.8 | | | — | | | 13.8 | | | — | |
| | | | | | | | | | | | | | | | | | | | |
Total Northern Appalachia(3) | | | 79.2 | | | 46.7 | | | 32.5 | | | 21.2 | | | 58.0 | | | 53.4 | | | 25.8 | | | 79.2 | | | — | |
| | | | | | | | | | | | | | | | | | | | |
Illinois Basin | | | | | | | | | | | | | | | | | | | | | | | | | | | | |
Taylorville Field (IL) | | | 111.0 | | | 38.7 | | | 72.3 | | | — | | | 111.0 | | | — | | | 111.0 | | | 111.0 | | | — | |
Western Bituminous | | | | | | | | | | | | | | | | | | | | | | | | | | | | |
Castle Valley Complex (UT) | | | 27.2 | | | 15.7 | | | 11.5 | | | 27.2 | | | — | | | — | | | 27.2 | | | 27.2 | | | — | |
McClane Canyon Mine (CO) | | | 6.5 | | | 4.4 | | | 2.1 | | | 6.5 | | | — | | | 0.2 | | | 6.3 | | | 6.5 | | | — | |
| | | | | | | | | | | | | | | | | | | | |
Total Western Bituminous(3) | | | 33.7 | | | 20.1 | | | 13.6 | | | 33.7 | | | — | | | 0.2 | | | 33.5 | | | 33.7 | | | — | |
| | | | | | | | | | | | | | | | | | | | |
Total(3) | | | 437.0 | | | 249.5 | | | 187.5 | | | 163.6 | | | 273.4 | | | 229.4 | | | 207.6 | | | 415.6 | | | 21.4 | |
| | | | | | | | | | | | | | | | | | | | |
Percentage of total(3) | | | | | | 57.1 | % | | 42.9 | % | | 37.4 | % | | 62.6 | % | | 52.5 | % | | 47.5 | % | | 95.1 | % | | 4.9 | % |
Central Appalachia | | | | | | | | | | | | | | | | | | | | | | | | | | | | |
Rhino Eastern Complex (WV)(4) | | | 43.4 | | | 23.7 | | | 19.7 | | | 38.7 | | | 4.7 | | | — | | | 43.4 | | | — | | | 43.4 | |
Percentage of total(3) | | | | | | 54.6 | % | | 45.4 | % | | 89.2 | % | | 10.8 | % | | — | | | 100 | % | | — | | | 100 | % |
- (1)
- Represents recoverable tons.
- (2)
- For purposes of this table, we have defined metallurgical coal reserves as reserves located in those seams that historically have been of sufficient quality and characteristics to be able to be used in the steel making process. All other coal reserves are defined as steam coal. However, some of the reserves in the metallurgical category can also be used as steam coal.
56
Table of Contents
- (3)
- Totals and percentages of totals are calculated based on actual amounts and not the rounded amounts presented in this table.
- (4)
- Owned by a joint venture in which we have a 51% membership interest and for which we serve as manager. Amounts shown include 100% of the reserves.
The majority of our leases have an initial term denominated in years but also provide for the term of the lease to continue until exhaustion of the "mineable and merchantable" coal in the lease area so long as the terms of the lease are complied with. Some of our leases have terms denominated in years rather than mine-to-exhaustion provisions, but in all such cases, we believe that the term of years will allow the recoverable reserve to be fully extracted in accordance with our projected mine plan. Consistent with industry practice, we conduct only limited investigations of title to our and the joint venture's coal properties prior to leasing. Title to lands and reserves of the lessors or grantors and the boundaries of our and the joint venture's leased priorities are not completely verified until we prepare to mine those reserves.
The following table provides information on particular characteristics of our and the joint venture's coal reserves as of December 31, 2011:
| | | | | | | | | | | | | | | | | | | | | | | | | | | | |
| | As Received Basis(1) | | Proven and Probable Coal Reserves(2)(3) | |
|---|
| |
| |
| |
| |
| |
| | Sulfur Content | |
|---|
| |
| |
| |
| | S02/mm
Btu | |
| |
|---|
Region | | % Ash | | % Sulfur | | Btu/lb. | | Total | | <1% | | 1 - 1.5% | | >1.5% | | Unknown | |
|---|
| |
| |
| |
| |
| |
| | (in million tons)
| |
| |
|---|
Central Appalachia | | | | | | | | | | | | | | | | | | | | | | | | | | | | |
Tug River Complex (KY, WV) | | | 10.61 | % | | 1.23 | % | | 12,899 | | | 1.91 | | | 23.0 | | | 13.7 | | | 5.5 | | | 2.5 | | | 1.3 | |
Rob Fork Complex (KY) | | | 6.04 | % | | 1.17 | % | | 13,395 | | | 1.74 | | | 24.5 | | | 14.8 | | | 5.8 | | | 2.3 | | | 1.6 | |
Deane Complex (KY) | | | 5.39 | % | | 0.91 | % | | 13,442 | | | 1.35 | | | 39.5 | | | 21.0 | | | 11.5 | | | 0.9 | | | 6.1 | |
Rich Mountain Field (WV) | | | 6.56 | % | | 0.64 | % | | 13,509 | | | 0.94 | | | 8.6 | | | 8.6 | | | — | | | — | | | — | |
Elk Horn (KY) | | | 11.80 | % | | 1.50 | % | | 13,047 | | | 2.30 | | | 117.5 | | | 19.8 | | | 42.3 | | | 55.0 | | | 0.4 | |
| | | | | | | | | | | | | | | | | | | | |
Total Central Appalachia(3) | | | 9.76 | % | | 1.30 | % | | 13,154 | | | 1.98 | | | 213.1 | | | 77.9 | | | 65.1 | | | 60.7 | | | 9.4 | |
| | | | | | | | | | | | | | | | | | | | |
Northern Appalachia | | | | | | | | | | | | | | | | | | | | | | | | | | | | |
Hopedale Complex (OH) | | | 6.59 | % | | 2.25 | % | | 12,999 | | | 3.46 | | | 27.7 | | | — | | | — | | | 27.7 | | | — | |
Sands Hill Complex (OH) | | | 9.29 | % | | 3.13 | % | | 11,779 | | | 5.31 | | | 10.7 | | | — | | | — | | | 10.2 | | | 0.5 | |
Leesville Field (OH) | | | 6.21 | % | | 2.21 | % | | 13,152 | | | 3.36 | | | 27.0 | | | — | | | — | | | 27.0 | | | — | |
Springdale Field (PA) | | | 6.63 | % | | 1.72 | % | | 13,443 | | | 2.55 | | | 13.8 | | | — | | | — | | | 13.8 | | | — | |
| | | | | | | | | | | | | | | | | | | | |
Total Northern Appalachia(3) | | | 6.82 | % | | 2.26 | % | | 12,972 | | | 3.48 | | | 79.2 | | | — | | | — | | | 78.7 | | | 0.5 | |
| | | | | | | | | | | | | | | | | | | | |
Illinois Basin | | | | | | | | | | | | | | | | | | | | | | | | | | | | |
Taylorville Field (IL) | | | 7.75 | % | | 3.53 | % | | 11,057 | | | 6.38 | | | 111.0 | | | — | | | — | | | 111.0 | | | — | |
Western Bituminous | | | | | | | | | | | | | | | | | | | | | | | | | | | | |
Castle Valley Complex (UT) | | | 10.99 | % | | 0.72 | % | | 12,127 | | | 1.16 | | | 27.2 | | | 27.0 | | | 0.2 | | | — | | | — | |
McClane Canyon Mine (CO) | | | 11.19 | % | | 0.57 | % | | 11,241 | | | 1.01 | | | 6.5 | | | 6.5 | | | — | | | — | | | — | |
| | | | | | | | | | | | | | | | | | | | |
Total Western Bituminous(3) | | | 11.03 | % | | 0.69 | % | �� | 11,957 | | | 1.16 | | | 33.7 | | | 33.5 | | | 0.2 | | | — | | | — | |
| | | | | | | | | | | | | | | | | | | | |
Total(3) | | | 8.79 | % | | 2.01 | % | | 12,481 | | | 3.22 | | | 437.0 | | | 111.4 | | | 65.3 | | | 250.4 | | | 9.9 | |
| | | | | | | | | | | | | | | | | | | | |
Percentage of total(3) | | | | | | | | | | | | | | | | | | 25.5 | % | | 14.9 | % | | 57.3 | % | | 2.3 | % |
Central Appalachia | | | | | | | | | | | | | | | | | | | | | | | | | | | | |
Rhino Eastern Complex (WV)(4) | | | 4.42 | % | | 0.68 | % | | 14,019 | | | 0.97 | | | 43.4 | | | 38.0 | | | 4.9 | | | — | | | 0.5 | |
- (1)
- As received represents an analysis of a sample as received at a laboratory.
- (2)
- Represents recoverable tons.
- (3)
- Totals and percentages of totals are calculated based on actual amounts and not the rounded amounts presented in this table.
57
Table of Contents
- (4)
- Owned by a joint venture in which we have a 51% membership interest and for which we serve as manager. Amounts shown include 100% of the reserves.
Non-Reserve Coal Deposits
The following table provides information on our and the joint venture's non-reserve coal deposits as of December 31, 2011:
| | | | | | | | | | |
| | Non-Reserve Coal Deposits | |
|---|
| |
| | Total Tons | |
|---|
| | Total Tons | |
|---|
Region | | Owned | | Leased | |
|---|
| | (in million tons)
| |
|---|
Central Appalachia | | | 177.6 | | | 166.4 | | | 11.2 | |
Northern Appalachia | | | 30.8 | | | 25.8 | | | 5.0 | |
Illinois Basin | | | 33.0 | | | — | | | 33.0 | |
Western Bituminous | | | 175.7 | | | — | | | 175.7 | |
| | | | | | | | |
Total | | | 417.1 | | | 192.2 | | | 224.9 | |
| | | | | | | | |
Percentage of total | | | | | | 46.1 | % | | 53.9 | % |
Rhino Eastern (Central Appalachia)(1) | | | 17.9 | | | — | | | 17.9 | |
- (1)
- Owned by a joint venture in which we have a 51% membership interest and for which we serve as manager. Amounts shown include 100% of the non-reserve coal deposits.
The joint venture leased all of its non-reserve coal deposits from third-party landowners. Consistent with industry practice, we conduct only limited investigations of title to our coal properties prior to leasing. Title to lands and non-reserve coal deposits of the lessors or grantors and the boundaries of our leased priorities are not completely verified until we prepare to mine the coal.
Office Facilities
We lease office space in Lexington, Kentucky for our executives and administrative support staff. We lease our executive office space at 424 Lewis Hargett Circle, Lexington, Kentucky, which lease expires August 2013, subject to us having two consecutive three-year renewal options. In addition, we lease a building primarily for our administrative support staff at 265 Hambley Boulevard, Pikeville, Kentucky, which lease expires June 2015, subject to us having a five-year renewal option.
Item 3. Legal Proceedings
We may, from time to time, be involved in various legal proceedings and claims arising out of our operations in the normal course of business. While many of these matters involve inherent uncertainty, we do not believe that we are a party to any legal proceedings or claims that will have a material adverse impact on our business, financial condition or results of operations.
Item 4. Mine Safety Disclosure
Information concerning mine safety violations or other regulatory matters required by Section 1503(a) of the Dodd-Frank Wall Street Reform and Consumer Protection Act and Item 104 of Regulation S-K for the year ended December 31, 2011 is included in Exhibit 95.1 to this report.
58
Table of Contents
PART II
Item 5. Market for Registrant's Common Equity, Related Stockholder Matters and Issuer Purchases of Equity Securities.
Our Limited Partnership Interests
Our common units began trading on the NYSE under the symbol "RNO" on September 30, 2010. On March 9, 2012, the closing market price for our common units was $20.17 per unit. The following table sets forth the range of the daily high and low sales prices and cash distribution per common unit for the periods indicated:
| | | | | | | | | | |
| | Price Range | |
| |
|---|
| | Cash
Distribution(1) | |
|---|
| | High | | Low | |
|---|
Year ended December 31, 2011 | | | | | | | | | | |
Fourth Quarter | | $ | 22.68 | | $ | 15.02 | | $ | 0.4800 | |
Third Quarter | | $ | 28.23 | | $ | 17.05 | | $ | 0.4800 | |
Second Quarter | | $ | 26.43 | | $ | 21.55 | | $ | 0.4550 | |
First Quarter | | $ | 27.31 | | $ | 22.78 | | $ | 0.4550 | |
Year ended December 31, 2010 | | | | | | | | | | |
Fourth Quarter (from September 30, 2010) | | $ | 24.86 | | $ | 21.10 | | $ | 0.4208 | (2) |
- (1)
- Represents cash distributions attributable to the quarter. Cash distributions declared in respect of a calendar quarter are paid in the following calendar quarter.
- (2)
- The distribution of $0.4208 per common unit corresponds to the minimum quarterly distribution of $0.445 per unit prorated for the portion of the quarter after October 5, 2010, the closing date of our IPO.
As of March 9, 2012, we had outstanding 15,318,178 common units, 12,397,000 subordinated units, a 2% general partner interest and incentive distribution rights, or IDRs. As of March 9, 2012, Rhino Energy Holdings LLC owned approximately 49.8% of our outstanding common units and 87.9% of our subordinated units. Our general partner currently owns a 2.0% general partner interest in us and all of our IDRs.
As of March 9, 2012, there were 64 holders of record of our common units. The number of record holders does not include holders of shares in "street names" or persons, partnerships, associations, corporations or other entities identified in security position listings maintained by depositories.
Cash Distribution Policy
We will make a minimum quarterly distribution of $0.445 per common unit (or $1.78 per common unit on an annualized basis) to the extent we have sufficient available cash. Available cash is generally defined as cash from operations after establishment by our general partner of cash reserves to provide for the conduct of our business, to comply with applicable law, any of our debt instruments or other agreements or to provide for future distributions to unitholders for any one or more of the next four quarters, and payment of costs and expenses, including reimbursement of expenses to our general partner and its affiliates. These expenses include salary, bonus, incentive compensation and other amounts paid to persons who perform services for us or on our behalf and expenses allocated to our general partner by its affiliates. Our partnership agreement does not set a limit on the amount of cash reserves that our general partner may establish or the amount of expenses for which our general partner and its affiliates may be reimbursed. Available cash may also include, if our general partner so determines, all or any portion of the cash on hand on the date of determination of available cash for the quarter resulting from working capital borrowings made subsequent to the end of such quarter. We
59
Table of Contents
may also borrow to fund distributions in quarters when we generate less available cash than necessary to sustain or grow our cash distributions per unit.
There is no guarantee that we will distribute quarterly cash distributions to our unitholders. Our distribution policy is subject to certain restrictions and may be changed at any time. The reasons for such uncertainties in our stated cash distribution policy include the following factors:
- •
- Our cash distribution policy is subject to restrictions on distributions under our credit agreement. Our credit agreement contains financial tests and covenants that we must satisfy. These financial tests and covenants are described in "Item 7. Management's Discussion and Analysis of Financial Condition and Results of Operations—Liquidity and Capital Resources—Credit Agreement." Should we be unable to satisfy these restrictions or if we are otherwise in default under our credit agreement, we would be prohibited from making cash distributions notwithstanding our cash distribution policy.
- •
- Our general partner will have the authority to establish cash reserves for the prudent conduct of our business and for future cash distributions to our unitholders, and the establishment of or increase in those reserves could result in a reduction in cash distributions from levels we currently anticipate pursuant to our stated cash distribution policy. Our partnership agreement does not set a limit on the amount of cash reserves that our general partner may establish.
- •
- Prior to making any distribution on the common units, we will reimburse our general partner and its affiliates for all expenses they incur and payments they make on our behalf. Our partnership agreement provides that our general partner will determine in good faith the expenses that are allocable to us. The reimbursement of expenses and payment of fees, if any, to our general partner and its affiliates will reduce the amount of available cash to pay cash distributions to our unitholders.
- •
- While our partnership agreement requires us to distribute all of our available cash, our partnership agreement, including provisions requiring us to make cash distributions contained therein, may be amended. Our partnership agreement generally may not be amended during the subordination period without the approval of our public common unitholders. However, our partnership agreement can be amended with the consent of our general partner and the approval of a majority of the outstanding common units (including common units held by Wexford) after the subordination period has ended. Wexford currently owns approximately 54% of the outstanding common units and 95% of our outstanding subordinated units.
- •
- Even if our cash distribution policy is not modified or revoked, the amount of distributions we pay under our cash distribution policy and the decision to make any distribution is determined by our general partner, taking into consideration the terms of our partnership agreement.
- •
- Under Section 17-607 of the Delaware Act, we may not make a distribution if the distribution would cause our liabilities to exceed the fair value of our assets.
- •
- We may lack sufficient cash to pay distributions to our unitholders due to cash flow shortfalls attributable to a number of operational, commercial or other factors as well as increases in our operating or selling, general and administrative expenses, principal and interest payments on our outstanding debt, tax expenses, working capital requirements and anticipated cash needs.
- •
- If we make distributions out of capital surplus, as opposed to operating surplus, such distributions will result in a reduction in the minimum quarterly distribution and the target distribution levels. However, we do not anticipate that we will make any distributions from capital surplus.
- •
- Our ability to make distributions to our unitholders depends on the performance of our subsidiaries and their ability to distribute cash to us. The ability of our subsidiaries to make
60
Table of Contents
distributions to us may be restricted by, among other things, the provisions of existing and future indebtedness, applicable state partnership and limited liability company laws and other laws and regulations.
Our partnership agreement requires us to distribute all of our available cash each quarter in the following manner:
- •
- first, 98.0% to the holders of common units and 2.0% to our general partner, until each common unit has received the minimum quarterly distribution of $0.445 plus any arrearages from prior quarters;
- •
- second, 98.0% to the holders of subordinated units and 2.0% to our general partner, until each subordinated unit has received the minimum quarterly distribution of $0.445; and
- •
- third, 98.0% to all unitholders, pro rata, and 2.0% to our general partner, until each unit has received a distribution of $0.51175.
If cash distributions to our unitholders exceed $0.51175 per unit in any quarter, our unitholders and our general partner will receive distributions according to the following percentage allocations:
| | | | | | | |
| | Marginal Percentage
Interest in
Distributions | |
|---|
Total Quarterly Distribution Target Amount | | Unitholders | | General
Partner | |
|---|
Above $0.51175 up to $0.55625 | | | 85.0 | % | | 15.0 | % |
Above $0.55625 up to $0.6675 | | | 75.0 | % | | 25.0 | % |
Above $0.6675 | | | 50.0 | % | | 50.0 | % |
The percentage interest shown of our general partner include its 2.0% general partner interest. Our general partner is entitled to 2.0% of all distributions that we make prior to our liquidation. Our partnership agreement provides our general partner the right, but not the obligation, to contribute capital to maintain its 2.0% general partner interest in us if we issue additional units in the future. Thus, if our general partner elects not to make such a capital contribution, its interest will be proportionately reduced.
During the subordination period, before we make any quarterly distributions to our subordinated unitholders, our common unitholders are entitled to receive payment of the minimum quarterly distribution plus any arrearages in distributions from prior quarters. The subordination period will end on the first business day after we have earned and paid at least (i) $1.78 (the minimum quarterly distribution on an annualized basis) on each outstanding unit and the corresponding distribution on our general partner's general partner interest for each of three consecutive, non-overlapping four quarter periods ending on or after September 30, 2013 or (ii) $2.67 (150.0% of the annualized minimum quarterly distribution) on each outstanding unit and the corresponding distributions on our general partner's general partner interest and the incentive distribution rights for the four-quarter period immediately preceding that date. The subordination period also will end upon the removal of our general partner other than for cause if no subordinated units or common units held by the holders of subordinated units or their affiliates are voted in favor of that removal. When the subordination period ends, all subordinated units will convert into common units on a one-for-one basis, and all common units thereafter will no longer be entitled to arrearages.
We will pay our distributions on or about the 15th day of each of February, May, August and November to holders of record on or about the 1st day of each such month. If the distribution date does not fall on a business day, we will make the distribution on the business day immediately preceding the indicated distribution date.
61
Table of Contents
Item 6. Selected Financial Data.
The following table shows our selected financial and operating data for the periods and as of the dates indicated, which is derived from our consolidated financial statements. On October 5, 2010, we closed our IPO of 3,730,600 common units. In conjunction with the IPO, on September 29, 2010 Wexford became obligated to contribute their membership interests in Rhino Energy LLC to us. For ease of reference, we present the historical results of Rhino Energy LLC as our historical results which also includes the portion of fiscal year 2010 results prior to the IPO that contributed to the total 2010 figures presented below as a total for us. The selected historical consolidated financial data presented as of December 31, 2009, 2008 and 2007 and for the years ended December 31, 2008 and 2007 are derived from the audited historical consolidated financial statements of Rhino Energy LLC that are not included in this report. The selected historical consolidated financial data presented for the year ended December 31, 2009 are derived from the audited historical consolidated financial statements of Rhino Energy LLC that are included elsewhere in this report. The selected historical consolidated financial data presented as of December 31, 2011 and 2010 and for the years ended December 31, 2011 and 2010 are derived from our audited historical consolidated financial statements that are included elsewhere in this report.
The following selected consolidated financial data should be read in conjunction with "Part II, Item 7. Management's Discussion and Analysis of Financial Condition and Results of Operations" and "Item 8. Financial Statements and Supplementary Data."
The following table presents a non-GAAP financial measure, Adjusted EBITDA, which we use in our business as it is an important supplemental measure of our performance and liquidity. Adjusted EBITDA represents net income before interest expense, income taxes and depreciation, depletion and amortization ("DD&A"), including our proportionate share of DD&A and interest expense for our Rhino Eastern joint venture that is accounted for under the equity method. Adjusted EBITDA also excludes the effect of certain non-recurring items. This measure is not calculated or presented in accordance with GAAP. We explain this measure under "—Non-GAAP Financial Measure" and
62
Table of Contents
reconcile it to its most directly comparable financial measures calculated and presented in accordance with GAAP.
| | | | | | | | | | | | | | | | |
| | For the Year Ended December 31, | |
|---|
(in thousands, except per unit and per ton data) | | 2011 | | 2010 | | 2009 | | 2008 | | 2007 | |
|---|
Statement of Operations Data: | | | | | | | | | | | | | | | | |
Total revenues | | $ | 367,221 | | $ | 305,647 | | $ | 419,790 | | $ | 438,924 | | $ | 403,452 | |
Costs and Expenses: | | | | | | | | | | | | | | | | |
Cost of operations (exclusive of depreciation, depletion and amortization) | | | 267,180 | | | 220,756 | | | 336,335 | | | 364,912 | | | 318,405 | |
Freight and handling costs | | | 4,329 | | | 2,634 | | | 3,991 | | | 10,223 | | | 4,021 | |
Depreciation, depletion and amortization | | | 36,325 | | | 34,108 | | | 36,279 | | | 36,428 | | | 30,750 | |
Selling, general and administrative (exclusive of depreciation, depletion and amortization) | | | 21,815 | | | 16,449 | | | 16,754 | | | 19,042 | | | 15,370 | |
Asset impairment loss | | | — | | | 652 | | | — | | | — | | | — | |
(Gain) loss on sale/acquisition of assets—net | | | (3,172 | ) | | (10,716 | ) | | 1,710 | | | 451 | | | (944 | ) |
| | | | | | | | | | | | |
Total costs and expenses | | | 326,477 | | | 263,883 | | | 395,069 | | | 431,056 | | | 367,602 | |
| | | | | | | | | | | | |
Income from operations | | | 40,744 | | | 41,764 | | | 24,721 | | | 7,868 | | | 35,850 | |
Interest and other income (expense): | | | | | | | | | | | | | | | | |
Interest expense and other | | | (6,062 | ) | | (5,338 | ) | | (6,222 | ) | | (5,500 | ) | | (5,579 | ) |
Interest income and other | | | 51 | | | 24 | | | 70 | | | 148 | | | 317 | |
Equity in net income (loss) of unconsolidated affiliate(1) | | | 3,338 | | | 4,699 | | | 893 | | | (1,587 | ) | | — | |
| | | | | | | | | | | | |
Total interest and other income (expense) | | | (2,673 | ) | | (615 | ) | | (5,259 | ) | | (6,939 | ) | | (5,262 | ) |
| | | | | | | | | | | | |
Income before income tax | | | 38,071 | | | 41,149 | | | 19,462 | | | 929 | | | 30,588 | |
Income taxes | | | — | | | — | | | — | | | — | | | (126 | ) |
| | | | | | | | | | | | |
Net income | | $ | 38,071 | | $ | 41,149 | | $ | 19,462 | | $ | 929 | | $ | 30,714 | |
| | | | | | | | | | | | |
Basic and diluted net income per limited partner common unit(1) | | $ | 1.43 | | $ | 0.22 | | | n/a | | | n/a | | | n/a | |
Distributions paid per limited partner unit | | $ | 1.8108 | | | n/a | | | n/a | | | n/a | | | n/a | |
Weighted average number of limited partner common units outstanding: | | | | | | | | | | | | | | | | |
Basic | | | 13,725 | | | 12,400 | | | n/a | | | n/a | | | n/a | |
Diluted | | | 13,744 | | | 12,413 | | | n/a | | | n/a | | | n/a | |
Balance Sheet Data: | | | | | | | | | | | | | | | | |
Cash and cash equivalents | | $ | 449 | | $ | 76 | | $ | 687 | | $ | 1,937 | | $ | 3,583 | |
Property and equipment, net | | | 450,116 | | | 282,577 | | | 270,680 | | | 282,863 | | | 211,657 | |
Total assets | | | 538,794 | | | 358,645 | | | 339,984 | | | 352,536 | | | 275,992 | |
Total liabilities | | | 231,696 | | | 111,028 | | | 201,583 | | | 234,225 | | | 158,152 | |
Total debt—short term and long term | | | 143,098 | | | 36,528 | | | 122,138 | | | 138,027 | | | 83,954 | |
Partners' capital/Members' equity | | $ | 307,098 | | $ | 247,617 | | $ | 138,401 | | $ | 118,311 | | $ | 117,841 | |
Operating Data(2): | | | | | | | | | | | | | | | | |
Tons of coal sold | | | 4,876 | | | 4,306 | | | 6,699 | | | 7,977 | | | 8,159 | |
Tons of coal produced/purchased | | | 4,873 | | | 4,312 | | | 6,732 | | | 8,017 | | | 8,024 | |
Coal revenues per ton(3) | | $ | 68.47 | | $ | 67.32 | | $ | 59.98 | | $ | 51.25 | | $ | 48.30 | |
Cost of operations per ton(4) | | $ | 54.79 | | $ | 51.27 | | $ | 50.21 | | $ | 45.75 | | $ | 39.02 | |
Other Financial Data: | | | | | | | | | | | | | | | | |
Net cash provided by operating activities | | $ | 66,916 | | $ | 55,001 | | $ | 41,495 | | $ | 57,211 | | $ | 52,493 | |
Net cash used in investing activities | | | (188,024 | ) | | (37,644 | ) | | (27,344 | ) | | (106,638 | ) | | (28,098 | ) |
Net cash provided by (used in) financing activities | | | 121,481 | | | (17,968 | ) | | (15,401 | ) | | 47,781 | | | (21,192 | ) |
Adjusted EBITDA | | | 81,994 | | | 71,473 | | | 63,643 | | | 43,134 | | | 66,917 | |
Capital expenditures(5) | | $ | 211,473 | | $ | 41,250 | | $ | 29,657 | | $ | 92,741 | | $ | 32,773 | |
- (1)
- Basic and diluted earnings per unit for 2010 reflects the period from October 6, 2010 to December 31, 2010, which is the period that net income was attributable to us as a publicly traded partnership.
- (2)
- In May 2008, we entered into a joint venture with an affiliate of Patriot that acquired the Rhino Eastern mining complex, which commenced production in August 2008. We have a 51% membership interest in, and
63
Table of Contents
serve as manager for, the joint venture. The operating data do not include data with respect to the Rhino Eastern mining complex. The joint venture produced and sold approximately 0.3 million tons of premium mid-vol metallurgical coal for the years ended December 31, 2011 and 2010.
- (3)
- Coal revenues per ton represent total coal revenues derived from the sale of coal from all business segments, divided by total tons of coal sold for all segments.
- (4)
- Cost of operations per ton represents the cost of operations (exclusive of depreciation, depletion and amortization) from all business segments divided by total tons of coal sold for all segments.
- (5)
- The following table presents a reconciliation of total capital expenditures to net cash used for capital expenditures on a historical basis for each of the periods indicated:
| | | | | | | | | | | | | | | | |
| | For the Year Ended December 31, | |
|---|
| | 2011 | | 2010 | | 2009 | | 2008 | | 2007 | |
|---|
| | (in thousands)
| |
|---|
Reconciliation of total capital expenditures to net cash used for capital expenditures: | | | | | | | | | | | | | | | | |
Additions to property, plant and equipment | | $ | 91,856 | | $ | 26,248 | | $ | 27,836 | | $ | 78,076 | | $ | 14,599 | |
Acquisitions of coal companies and coal properties | | | 119,617 | | | 15,002 | | | — | | | 14,665 | | | 18,174 | |
Acquisition of roof bolt manufacturing company | | | — | | | — | | | 1,821 | | | — | | | — | |
| | | | | | | | | | | | |
Total capital expenditures | | $ | 211,473 | | $ | 41,250 | | $ | 29,657 | | $ | 92,741 | | $ | 32,773 | |
| | | | | | | | | | | | |
Non-GAAP Financial Measure
The following tables present reconciliations of Adjusted EBITDA to the most directly comparable GAAP financial measures for each of the periods indicated. We believe the presentation of Adjusted EBITDA that includes our proportionate share of DD&A and interest expense for our Rhino Eastern joint venture is appropriate since our portion of Rhino Eastern's net income that is recognized as a single line item in our financial statements is affected by these expense items. Since we do not reflect these proportionate expense items of DD&A and interest expense in our consolidated financial statements, we believe that the adjustment for these expense items in the Adjusted EBITDA calculation is more representative of how we review our results and also provides investors with additional information that they can use to evaluate our results. Adjusted EBITDA also excludes the effect of certain non-recurring items.
Adjusted EBITDA should not be considered an alternative to net income, income from operations, cash flows from operating activities or any other measure of financial performance or liquidity presented in accordance with GAAP. Adjusted EBITDA excludes some, but not all, items that affect net income, income from operations and cash flows from operating activities, and these measures may vary among other companies.
64
Table of Contents
| | | | | | | | | | | | | | | | |
| | For the Year Ended December 31, | |
|---|
(in thousands) | | 2011 | | 2010 | | 2009 | | 2008 | | 2007 | |
|---|
Reconciliation of Adjusted EBITDA to net income: | | | | | | | | | | | | | | | | |
Net income | | $ | 38,071 | | $ | 41,149 | | $ | 19,462 | | $ | 929 | | $ | 30,714 | |
Plus: | | | | | | | | | | | | | | | | |
DD&A | | | 36,325 | | | 34,108 | | | 36,279 | | | 36,428 | | | 30,750 | |
Interest expense | | | 6,062 | | | 5,338 | | | 6,222 | | | 5,501 | | | 5,579 | |
Less: | | | | | | | | | | | | | | | | |
Income tax benefit | | | — | | | — | | | — | | | — | | | 126 | |
| | | | | | | | | | | | |
EBITDA(a) | | $ | 80,458 | | $ | 80,595 | | $ | 61,964 | | $ | 42,858 | | $ | 66,917 | |
| | | | | | | | | | | | |
Plus: Rhino Eastern DD&A-51% | | | 1,509 | | | 1,630 | | | 1,460 | | | 260 | | | — | |
Plus: Rhino Eastern interest expense-51% | | | 27 | | | 37 | | | 219 | | | 16 | | | — | |
Less: Gain from Castle Valley acquisition(b) | | | — | | | (10,789 | ) | | — | | | — | | | — | |
| | | | | | | | | | | | |
Adjusted EBITDA(a) | | $ | 81,994 | | $ | 71,473 | | $ | 63,643 | | $ | 43,134 | | $ | 66,917 | |
| | | | | | | | | | | | |
Reconciliation of Adjusted EBITDA to net cash provided by operating activities: | | | | | | | | | | | | | | | | |
Net cash provided by (used in) operating activities | | $ | 66,916 | | $ | 55,001 | | $ | 41,495 | | $ | 57,211 | | $ | 52,493 | |
Plus: | | | | | | | | | | | | | | | | |
Increase in net operating assets | | | 8,889 | | | 10,260 | | | 17,190 | | | — | | | 10,553 | |
Decrease in provision for doubtful accounts | | | 19 | | | — | | | — | | | — | | | 175 | |
Gain on sale of assets | | | 3,172 | | | — | | | — | | | — | | | 944 | |
Gain on acquisition | | | — | | | 10,789 | | | — | | | — | | | — | |
Gain on retirement of advance royalties | | | — | | | — | | | — | | | — | | | 115 | |
Amortization of deferred revenue | | | 532 | | | — | | | — | | | — | | | — | |
Interest expense | | | 6,062 | | | 5,338 | | | 6,222 | | | 5,501 | | | 5,579 | |
Settlement of litigation | | | — | | | — | | | 1,773 | | | — | | | — | |
Equity in net income of unconsolidated affiliate | | | 3,338 | | | 4,699 | | | 893 | | | — | | | — | |
Less: | | | | | | | | | | | | | | | | |
Decrease in net operating assets | | | — | | | — | | | — | | | 10,440 | | | — | |
Accretion on interest-free debt | | | 210 | | | 206 | | | 200 | | | 569 | | | 360 | |
Amortization of advance royalties | | | 1,104 | | | 865 | | | 215 | | | 471 | | | 700 | |
Amortization of debt issuance costs | | | 1,043 | | | 844 | | | — | | | — | | | — | |
Increase in provision for doubtful accounts | | | — | | | — | | | 19 | | | — | | | — | |
Equity-based compensation | | | 727 | | | 291 | | | — | | | — | | | — | |
Loss on sale of assets | | | — | | | 73 | | | 1,710 | | | 451 | | | — | |
Loss on asset impairments | | | — | | | 652 | | | — | | | — | | | — | |
Loss on retirement of advance royalties | | | 79 | | | 396 | | | 712 | | | 45 | | | — | |
Income tax benefit | | | — | | | — | | | — | | | — | | | 126 | |
Accretion on asset retirement obligations | | | 1,956 | | | 2,165 | | | 2,753 | | | 2,709 | | | 1,757 | |
Equity in net loss of unconsolidated affiliate | | | — | | | — | | | — | | | 1,587 | | | — | |
Distributions from unconsolidated affiliate | | | 3,351 | | | — | | | — | | | — | | | — | |
Payment of abandoned public offering expenses(c) | | | — | | | — | | | — | | | 3,582 | | | — | |
| | | | | | | | | | | | |
EBITDA(a) | | $ | 80,458 | | $ | 80,595 | | $ | 61,964 | | $ | 42,858 | | $ | 66,917 | |
| | | | | | | | | | | | |
Plus: Rhino Eastern DD&A-51% | | | 1,509 | | | 1,630 | | | 1,460 | | | 260 | | | — | |
Plus: Rhino Eastern interest expense-51% | | | 27 | | | 37 | | | 219 | | | 16 | | | — | |
Less: Gain from Castle Valley acquisition(b) | | | — | | | (10,789 | ) | | — | | | — | | | — | |
| | | | | | | | | | | | |
Adjusted EBITDA(a) | | $ | 81,994 | | $ | 71,473 | | $ | 63,643 | | $ | 43,134 | | $ | 66,917 | |
| | | | | | | | | | | | |
- (a)
- Calculated based on actual amounts and not the rounded amounts presented in this table. Totals may not foot due to rounding.
- (b)
- During 2010, we acquired certain assets for cash consideration of approximately $15.0 million from the Trustee of the Federal Bankruptcy Court charged with the sale of the C.W. Mining Company assets, located in Emery and Carbon Counties, Utah (referred to as our Castle Valley mining complex).
65
Table of Contents
Because the fair value of the assets acquired exceeded the purchase price, we recorded a non-cash gain of $10.8 million that is reflected in our 2010 financial results. A gain resulted from this acquisition since the assets were purchased in a distressed sale out of bankruptcy. Management believes that the isolation and presentation of this specific item to arrive at Adjusted EBITDA is useful because it enhances investors' understanding of how management assesses the performance of our business. Management believes the adjustment of this item provides investors with additional information that they can utilize in evaluating our performance. Additionally, management believes the isolation of this item provides investors with enhanced comparability to prior and future periods of our operating results
- (c)
- In 2008, we attempted an initial public offering, which was not consummated. We recorded the related deferred costs as a selling, general and administrative expense in August of that year.
Item 7. Management's Discussion and Analysis of Financial Condition and Results of Operations.
For ease and comparability purposes in comparing 2011 to 2010 results and 2010 to 2009 results, the results of Rhino Resource Partners LP and Rhino Energy LLC for 2010 have been combined as if Rhino Resource Partners LP was in existence for the entirety of 2010. Since Rhino Resource Partners LP maintained the historical basis of the Rhino Predecessor's net assets, management believes that the combined Rhino Resource Partners LP and Rhino Predecessor results for 2011 are comparable with 2010, as well as 2010 to 2009. The following discussion of the historical financial condition and results of operations should be read in conjunction with the historical financial statements and accompanying notes included elsewhere in this report.
In addition, this discussion includes forward-looking statements that are subject to risks and uncertainties that may result in actual results differing from statements we make. See "Cautionary Note Regarding Forward- Looking Statements." Factors that could cause actual results to differ include those risks and uncertainties discussed in Part I, Item 1A. "Risk Factors."
Overview
We are a growth oriented Delaware limited partnership formed to control and operate coal properties and invest in other natural resource assets. We produce, process and sell high quality coal of various steam and metallurgical grades. We market our steam coal primarily to electric utility companies as fuel for their steam powered generators. Customers for our metallurgical coal are primarily steel and coke producers who use our coal to produce coke, which is used as a raw material in the steel manufacturing process. In addition to operating coal properties, we manage and lease coal properties and collect royalties from those management and leasing activities. In addition to our coal operations, we have invested in oil and gas mineral rights that we expect to generate royalty revenues in future periods.
We have a geographically diverse asset base with coal reserves located in Central Appalachia, Northern Appalachia, the Illinois Basin and the Western Bituminous region. As of December 31, 2011, we controlled an estimated 437.0 million tons of proven and probable coal reserves, consisting of an estimated 415.6 million tons of steam coal and an estimated 21.4 million tons of metallurgical coal. In addition, as of December 31, 2011, we controlled an estimated 417.1 million tons of non-reserve coal deposits. As of December 31, 2011, Rhino Eastern LLC, a joint venture in which we have a 51% membership interest and for which we serve as manager, controlled an estimated 43.4 million tons of proven and probable coal reserves at the Rhino Eastern mining complex located in Central Appalachia, consisting entirely of premium mid-vol and low-vol metallurgical coal, and an estimated 17.9 million tons of non-reserve coal deposits. As of December 31, 2011, we operated ten mines, including five underground and five surface mines, located in Kentucky, Ohio, West Virginia and Utah. In addition, our joint venture operates one underground mine in West Virginia. During 2010, we operated one underground mine in Colorado, but we temporarily idled this mine at the end of 2010 and the mine remained idle at the end of 2011. The number of mines that we operate may vary from time to time
66
Table of Contents
depending on a number of factors, including the demand for and price of coal, depletion of economically recoverable reserves and availability of experienced labor.
Our principal business strategy is to safely, efficiently and profitably produce, sell and lease both steam and metallurgical coal from our diverse asset base in order to maintain and, over time, increase our quarterly cash distributions. In addition, we intend to expand our operations through strategic acquisitions, including the acquisition of stable, cash generating natural resource assets. We believe that such assets would allow us to grow our cash available for distribution and enhance stability of our cash flow.
For the year ended December 31, 2011, we generated revenues of approximately $367.2 million and net income of approximately $38.1 million. Excluding results from the joint venture, for the year ended December 31, 2011, we produced approximately 4.6 million tons of coal, purchased approximately 0.3 million tons of coal and sold approximately 4.9 million tons of coal, approximately 77% of which were pursuant to supply contracts. Additionally, the joint venture produced and sold approximately 0.3 million tons of premium mid-vol metallurgical coal for the year ended December 31, 2011.
Recent Developments
Acquisitions
Acquisition of The Elk Horn Coal Company, LLC
In June 2011, we completed the acquisition of 100% of the ownership interests in Elk Horn for approximately $119.7 million in cash consideration. Elk Horn is primarily a coal leasing company located in eastern Kentucky that is expected to provide us with royalty revenues in future periods. We believe there is potential upside from this acquisition to be provided by Elk Horn's currently unleased proven and probable reserves in Southern Floyd County, Kentucky ("Southern Floyd"). We also believe there are additional synergies to this acquisition as a large portion of Elk Horn's property is contiguous with our Deane complex property and the potential addition of infrastructure that would facilitate the increase of Southern Floyd production would also help accelerate development of our contiguous northern Deane complex properties. The Elk Horn acquisition was funded with borrowings available under our credit facility, which were subsequently repaid with proceeds from an offering of our common units.
Acquisition of Oil and Gas Mineral Rights
During the year ended 2011, we completed the acquisition of certain oil and gas mineral rights in the Cana Woodford region of western Oklahoma for a total purchase price of approximately $8.1 million. We expect royalty revenues to be generated from these mineral rights in future periods.
We and an affiliate of Wexford Capital have participated with Gulfport Energy, a publicly traded company, to acquire an interest in a portfolio of oil and gas leases in the Utica Shale. As of February 20, 2012, an affiliate of Wexford Capital owned approximately 13.3% of the common stock of Gulfport Energy. During the year ended 2011, we completed the acquisitions of interests in a portfolio of leases in the Utica Shale region of eastern Ohio for a total purchase price of approximately $19.9 million.
Acquisition of Coal Property
In August 2011, we purchased non-reserve coal deposits at our Sands Hill operation for approximately $2.5 million, which is estimated to include approximately 2.5 million tons.
67
Table of Contents
In June 2011, we acquired approximately 32,600 acres and associated surface rights in Randolph and Upshur Counties, West Virginia for approximately $7.5 million. These development stage properties are not permitted and contain no infrastructure. We plan to fully explore these properties and intend to prove up additional mineable underground metallurgical coal reserves for future mining.
Acquisition of the C.W. Mining Company
In August 2010, we acquired certain mining assets of C.W. Mining Company out of bankruptcy (the "Castle Valley Acquisition") for cash consideration of approximately $15.0 million. The assets acquired are located in Emery and Carbon Counties, Utah and include coal reserves and non-reserve coal deposits, underground mining equipment and infrastructure, an overland belt conveyor system, a loading facility and support facilities. Production from these assets began at one underground mine in January 2011 and the steam coal produced is being sold into the utility and industrial markets.
Sale of Mining Assets
In August 2011, we sold and assigned certain non-core mining assets and related liabilities located in the Phelps, Kentucky area of our Tug River mining complex for approximately $20 million. The mining assets included leasehold interests and permits to surface and mineral interests that included steam coal reserves and non-reserve coal deposits. Additionally, the sales agreement includes the potential for additional payments of approximately $8.75 million dependent upon the future issuance of certain permits and the commencement of mining activities by the purchaser. These contingent payments are being accounted for as gain contingencies and will be recognized in the future when and if the contingencies are resolved. The transaction also transferred certain liabilities related to the assets sold that we believe will positively impact future cash flows. Since we had limited mining operations on the assets that were sold, we believe the sale of these assets will not have a negative impact on our future financial results. In relation to the sale of these assets and transfer of liabilities, we recorded a gain of approximately $2.4 million.
On February 29, 2012, the Partnership completed an agreement to sell certain non-core mining assets located in Pike County Kentucky to a third party for approximately $0.6 million. The transaction also extinguished certain liabilities related to the assets sold.
Lease of Mineral Acres
On March 6, 2012, we completed a lease agreement with a third party for an estimated 1,500 acres we own in the Utica Shale region of Harrison County Ohio. The lease agreement is for an initial five year term with an optional three year renewal period and conveys rights to the third party to perform drilling and operating activities for producing oil, natural gas or other hydrocarbons. As part of the lease agreement, the third party agreed to pay us the sum of $6,000 per acre as a lease bonus, of which $500,000 was paid at the signing of the lease agreement. The remainder of the lease bonus payment shall be paid by the third party to us within 90 days from the date the lease agreement was signed. In addition, the lease agreement stipulates that the third party shall pay us a 20% royalty based upon the gross proceeds received from the sale of oil and/or natural gas recovered from the leased property.
Initial Public Offering
On October 5, 2010, we completed our IPO, in which we sold an aggregate of 3,730,600 common units, representing limited partner interests in us, at a price of $20.50 per common unit. Of the common units issued, 486,600 units were issued in connection with the exercise of the underwriters' option to purchase additional units. Net proceeds from the offering were approximately $71.3 million, after deducting underwriting discounts of approximately $5.2 million, of which approximately $62.0 million was received by us and approximately $9.3 million was paid directly to our sponsor, Wexford
68
Table of Contents
Capital, as reimbursement for capital expenditures incurred by affiliates of Wexford Capital with respect to the assets contributed to us in connection with the offering. We used the net proceeds from this offering, less offering expenses of approximately $3.0 million incurred at the IPO date, and a related capital contribution by our general partner of approximately $10.4 million, to repay approximately $69.4 million of outstanding indebtedness under our credit facility. We paid additional offering expenses after the IPO date of approximately $0.7 million for total offering expenses of approximately $3.7 million.
In connection with the closing of the IPO, the owners of Rhino Energy LLC contributed their membership interests in Rhino Energy LLC to us, and we issued 12,397,000 subordinated units representing limited partner interests in us and 8,666,400 common units to Rhino Energy Holdings LLC, an affiliate of Wexford Capital, and issued incentive distribution rights to our general partner.
Follow-on Offering
On July 18, 2011, we completed a public offering of 2,875,000 common units, representing limited partner interests in us, at a price of $24.50 per common unit. Of the common units issued, 375,000 units were issued in connection with the exercise of the underwriters' option to purchase additional units. Net proceeds from the offering were approximately $66.4 million, after deducting underwriting discounts and offering expenses of approximately $4.1 million. We used the net proceeds from this offering, and a related capital contribution by our general partner of approximately $1.4 million, to repay approximately $67.8 million of outstanding indebtedness under our credit facility.
Credit Facility
The original maximum availability under our credit facility with PNC Bank, N.A. as administrative agent, was $200.0 million. On June 8, 2011, with the consent of the lenders, we exercised the option to increase the amount available to borrow under the credit agreement by $50.0 million to $250.0 million as part of the Elk Horn acquisition.
On July 29, 2011, we executed an amended and restated senior secured credit facility with PNC Bank, N.A., as administrative agent, and a group of lenders, which are parties thereto. The maximum availability under the amended and restated credit facility is $300.0 million, with a one-time option to increase the availability by an amount not to exceed $50.0 million.
Factors That Impact Our Business
Our results of operations in the near term could be impacted by a number of factors, including (1) adverse weather conditions and natural disasters, (2) poor mining conditions resulting from geological conditions or the effects of prior mining, (3) equipment problems at mining locations, (4) the availability of transportation for coal shipments or (5) the availability and costs of key supplies and commodities such as steel, diesel fuel and explosives.
On a long-term basis, our results of operations could be impacted by, among other factors, (1) changes in governmental regulation, (2) the availability and prices of competing electricity-generation fuels, (3) our ability to secure or acquire high-quality coal reserves and (4) our ability to find buyers for coal under favorable supply contracts.
We have historically sold a majority of our coal through supply contracts and anticipate that we will continue to do so. As of December 31, 2011, we had commitments under supply contracts to deliver annually scheduled base quantities of 4.5 million, 3.4 million, 2.0 million and 0.3 million tons of coal to 13 customers in 2012, 7 customers in 2013, 5 customers in 2014 and 2 customers in 2015,
69
Table of Contents
respectively. Some of the contracts have sales price adjustment provisions, subject to certain limitations and adjustments, based on a variety of factors and indices.
Results of Operations
We conduct business through four reportable business segments: Central Appalachia, Northern Appalachia, Eastern Met and Rhino Western. Additionally, we have an Other category that includes our ancillary businesses. Our Central Appalachia segment consists of three mining complexes: Tug River, Rob Fork and Deane, which, as of December 31, 2011, together included three underground mines, three surface mines and three preparation plants and loadout facilities in eastern Kentucky and southern West Virginia. Additionally, our Central Appalachia segment includes the Elk Horn operations. Our Northern Appalachia segment consists of the Hopedale mining complex, the Sands Hill mining complex, the Leesville field and the Springdale field. The Hopedale mining complex, located in northern Ohio, included one underground mine and one preparation plant and loadout facility as of December 31, 2011. Our Sands Hill mining complex, located in southern Ohio, included two surface mines, a preparation plant and a river terminal as of December 31, 2011. The Eastern Met segment includes our 51% equity interest in the results of operations of the joint venture, which owns the Rhino Eastern mining complex, located in West Virginia, and for which we serve as manager. As of December 31, 2011, this complex was comprised of two underground mines and a preparation plant and loadout facility (owned by our joint venture partner). Our Rhino Western segment includes our two underground mines in the Western Bituminous region that consist of our McClane Canyon mine in Colorado that has been temporarily idled since the end of 2010, and remained idle at the end of 2011, and our Castle Valley mining complex in Utah that began production in January 2011. Our Other category includes our ancillary businesses that consist of a roof bolt manufacturing operation, limestone operations and various businesses that provide support services such as reclamation, maintenance and transportation, the cost of which is reflected in our cost of operations.
Our management uses a variety of financial measurements to analyze our performance, including (1) Adjusted EBITDA, (2) coal revenues per ton and (3) cost of operations per ton.
Adjusted EBITDA. The discussion of our results of operations below includes references to, and analysis of, our segments' Adjusted EBITDA results. Adjusted EBITDA represents net income before deducting interest expense, income taxes and depreciation, depletion and amortization, including our proportionate share of these expense items from our Rhino Eastern LLC joint venture, while also excluding certain non-recurring items. Adjusted EBITDA is used by management primarily as a measure of our segments' operating performance. Adjusted EBITDA should not be considered an alternative to net income, income from operations, cash flows from operating activities or any other measure of financial performance or liquidity presented in accordance with GAAP. Because not all companies calculate EBITDA identically, our calculation may not be comparable to similarly titled measures of other companies. Please read "—Reconciliation of Adjusted EBITDA to Net Income by Segment" for reconciliations of Adjusted EBITDA to net income by segment for each of the periods indicated.
Coal Revenues Per Ton. Coal revenues per ton represents coal revenues divided by tons of coal sold. Coal revenues per ton is a key indicator of our effectiveness in obtaining favorable prices for our product.
Cost of Operations Per Ton. Cost of operations per ton sold represents the cost of operations (exclusive of DD&A) divided by tons of coal sold. Management uses this measurement as a key indicator of the efficiency of operations.
70
Table of Contents
Summary
The following table sets forth certain information regarding our revenues, operating expenses, other income and expenses, and operational data for years ended December 31, 2011, 2010 and 2009:
| | | | | | | | | | |
| | Year Ended December 31, | |
|---|
| | 2011 | | 2010 | | 2009 | |
|---|
| | (in millions)
| |
|---|
Statement of Operations Data: | | | | | | | | | | |
Total revenues | | $ | 367.2 | | $ | 305.6 | | $ | 419.8 | |
Costs and expenses: | | | | | | | | | | |
Cost of operations (exclusive of DD&A shown separately below) | | | 267.2 | | | 220.8 | | | 336.3 | |
Freight and handling costs | | | 4.3 | | | 2.6 | | | 4.0 | |
DD&A | | | 36.3 | | | 34.1 | | | 36.3 | |
Selling, general and administrative (exclusive of DD&A shown separately above) | | | 21.8 | | | 16.4 | | | 16.8 | |
Asset impairment loss | | | — | | | 0.7 | | | — | |
(Gain) loss on sale/acquisition of assets | | | (3.2 | ) | | (10.7 | ) | | 1.7 | |
| | | | | | | | |
Income from operations | | | 40.8 | | | 41.7 | | | 24.7 | |
Interest and other income (expense): | | | | | | | | | | |
Interest expense and other | | | (6.1 | ) | | (5.3 | ) | | (6.2 | ) |
Interest income and other | | | 0.1 | | | — | | | 0.1 | |
Equity in net income of unconsolidated affiliate | | | 3.3 | | | 4.7 | | | 0.9 | |
| | | | | | | | |
Total interest and other income (expense) | | | (2.7 | ) | | (0.6 | ) | | (5.2 | ) |
| | | | | | | | |
Net income | | $ | 38.1 | | $ | 41.1 | | $ | 19.5 | |
| | | | | | | | |
Other Financial Data | | | | | | | | | | |
Adjusted EBITDA | | $ | 82.0 | | $ | 71.5 | | $ | 63.6 | |
| | | | | | | | |
Year Ended December 31, 2011 Compared to Year Ended December 31, 2010
Summary. For the year ended December 31, 2011, our total revenues increased to $367.2 million from $305.6 million for the year ended December 31, 2010. We sold 4.9 million tons of coal for the year ended December 31, 2011, which is 0.6 million more tons, or a 13.2% increase, than the 4.3 million tons of coal sold for the year ended December 31, 2010. The increase in tons sold was primarily the result of starting production at our Castle Valley operation in Utah.
For the year ended December 31, 2011, our tons of coal inventories were relatively unchanged from the year ended December 31, 2010.
Net income was $38.1 million for the year ended December 31, 2011compared to $41.1 million (or $30.3 million excluding a $10.8 million gain from the Castle Valley acquisition) for year ended December 31, 2010. Excluding the Castle Valley gain, net income increased in 2011 due to an increase in revenue from higher tons sold, partially offset by higher cost of operations, primarily in our Central Appalachia segment. Adjusted EBITDA increased to $82.0 million for the year ended December 31, 2011, from $71.5 million for the year ended December 31, 2010. The increase in Adjusted EBITDA was primarily due to an increase in net income, excluding the $10.8 million gain from the Castle Valley acquisition in 2010, along with higher DD&A and interest expense.
71
Table of Contents
Tons Sold. The following table presents tons of coal sold by reportable segment for the years ended December 31, 2011 and 2010:
| | | | | | | | | | | | | |
Segment | | Year
Ended
December 31,
2011 | | Year
Ended
December 31,
2010 | | Increase
(Decrease)
Tons | | %* | |
|---|
| | (in millions, except %)
| |
|---|
Central Appalachia | | | 2.3 | | | 2.2 | | | 0.1 | | | 7.0 | % |
Northern Appalachia | | | 2.1 | | | 1.9 | | | 0.2 | | | 5.9 | % |
Rhino Western | | | 0.5 | | | 0.2 | | | 0.3 | | | 150.6 | % |
| | | | | | | | | | |
Total*† | | | 4.9 | | | 4.3 | | | 0.6 | | | 13.2 | % |
| | | | | | | | | | |
- *
- Calculated percentages and the rounded totals presented are based upon on actual whole ton amounts and not the rounded amounts presented in this table.
- †
- Excludes tons sold by the joint venture, which owns the Rhino Eastern mining complex located in West Virginia and for which we serve as manager.
We sold 4.9 million tons of coal in the year ended December 31, 2011 as compared to 4.3 million tons sold for the year ended December 31, 2010. This increase in tons sold was primarily due to the start of production at our Castle Valley operation in Utah, partially offset by the idling of our McClane Canyon mine in Colorado. Tons of coal sold in our Central Appalachia segment increased by 0.1 million, or 7.0%, to 2.3 million tons for the year ended December 31, 2011 from 2.2 million tons for the year ended December 31, 2010. For our Northern Appalachia segment, tons of coal sold increased by 0.2 million, or 5.9%, to 2.1 million tons for the year ended December 31, 2011 from 1.9 million tons for the year ended December 31, 2010. Coal sales from our Rhino Western segment increased by 0.3 million, or 150.6%, to 0.5 million tons for the year ended December 31, 2011 from 0.2 million tons for the year ended December 31, 2010.
72
Table of Contents
Revenues. The following table presents revenues and coal revenues per ton by reportable segment for the years ended December 31, 2011 and 2010:
| | | | | | | | | | | | | |
| |
| |
| | Increase/
(Decrease) | |
|---|
| | Year
ended
December 31,
2011 | | Year
ended
December 31,
2010 | |
|---|
Segment | | $ | | %* | |
|---|
| | (in millions, except per ton data and %)
| |
|---|
Central Appalachia | | | | | | | | | | | | | |
Coal revenues | | $ | 202.9 | | $ | 194.9 | | $ | 8.0 | | | 4.1 | % |
Freight and handling revenues | | | — | | | — | | | — | | | n/a | |
Other revenues | | | 16.3 | | | 0.7 | | | 15.6 | | | 2127.9 | % |
| | | | | | | | | | | |
Total revenues | | $ | 219.2 | | $ | 195.6 | | $ | 23.6 | | | 12.1 | % |
| | | | | | | | | | | |
Coal revenues per ton* | | $ | 87.92 | | $ | 90.30 | | $ | (2.38 | ) | | (2.6 | )% |
Northern Appalachia | | | | | | | | | | | | | |
Coal revenues | | $ | 109.3 | | $ | 86.2 | | $ | 23.1 | | | 26.8 | % |
Freight and handling revenues | | | 5.7 | | | 4.2 | | | 1.5 | | | 37.8 | % |
Other revenues | | | 5.0 | | | 5.0 | | | — | | | (2.0 | )% |
| | | | | | | | | | | |
Total revenues | | $ | 120.0 | | $ | 95.4 | | $ | 24.6 | | | 25.7 | % |
| | | | | | | | | | | |
Coal revenues per ton* | | $ | 53.00 | | $ | 44.30 | | $ | 8.70 | | | 19.6 | % |
Rhino Western | | | | | | | | | | | | | |
Coal revenues | | $ | 21.7 | | $ | 8.8 | | $ | 12.9 | | | 145.5 | % |
Freight and handling revenues | | | — | | | — | | | — | | | n/a | |
Other revenues | | | — | | | — | | | — | | | 22.2 | % |
| | | | | | | | | | | |
Total revenues | | $ | 21.7 | | $ | 8.8 | | $ | 12.9 | | | 145.4 | % |
| | | | | | | | | | | |
Coal revenues per ton* | | $ | 42.78 | | $ | 43.67 | | $ | (0.89 | ) | | (2.0 | )% |
Other | | | | | | | | | | | | | |
Coal revenues | | | n/a | | | n/a | | | n/a | | | n/a | |
Freight and handling revenues | | | n/a | | | n/a | | | n/a | | | n/a | |
Other revenues | | $ | 6.3 | | $ | 5.8 | | $ | 0.5 | | | 8.6 | % |
| | | | | | | | | | | |
Total revenues | | $ | 6.3 | | $ | 5.8 | | $ | 0.5 | | | 8.6 | % |
| | | | | | | | | | | |
Coal revenues per ton* | | | n/a | | | n/a | | | n/a | | | n/a | |
Total | | | | | | | | | | | | | |
Coal revenues | | $ | 333.9 | | $ | 289.9 | | $ | 44.0 | | | 15.2 | % |
Freight and handling revenues | | | 5.7 | | | 4.2 | | | 1.5 | | | 37.8 | % |
Other revenues | | | 27.6 | | | 11.5 | | | 16.1 | | | 138.1 | % |
| | | | | | | | | | | |
Total revenues | | $ | 367.2 | | $ | 305.6 | | $ | 61.6 | | | 20.1 | % |
| | | | | | | | | | | |
Coal revenues per ton* | | $ | 68.47 | | $ | 67.32 | | $ | 1.15 | | | 1.7 | % |
- *
- Percentages and per ton amounts are calculated based on actual amounts and not the rounded amounts presented in this table.
Our total revenues for the year ended December 31, 2011 increased by $61.6 million, or 20.1%, to $367.2 million from $305.6 million for the year ended December 31, 2010. The increase in coal revenues was due to increased volume in tons sold as well as higher contracted and spot prices for our steam coal. Coal revenues per ton were $68.47 for the year ended December 31, 2011, an increase of $1.15, or 1.7%, from $67.32 per ton for the year ended December 31, 2010. This increase in coal revenues per ton was primarily the result of higher contracted and spot prices for steam coal, partially offset by a lower mix of tons sold of metallurgical coal in 2011.
73
Table of Contents
For our Central Appalachia segment, coal revenues increased by $8.0 million, or 4.1%, to $202.9 million for the year ended December 31, 2011 from $194.9 million for the year ended December 31, 2010 due to increased volume in tons sold. Coal revenues per ton for our Central Appalachia segment decreased by $2.38, or 2.6%, to $87.92 per ton for the year ended December 31, 2011 as compared to $90.30 for the year ended December 31, 2010, primarily due to fewer tons of metallurgical coal sold. Other revenues increased for our Central Appalachia segment primarily due to coal royalty revenue from Elk Horn.
For our Northern Appalachia segment, coal revenues were $109.3 million for the year ended December 31, 2011, an increase of $23.1 million, or 26.8%, from $86.2 million for the year ended December 31, 2010, primarily as a result of higher contracted and spot prices for steam coal. Coal revenues per ton for our Northern Appalachia segment increased by $8.70, or 19.6%, to $53.00 per ton for the year ended December 31, 2011 as compared to $44.30 per ton for the year ended December 31, 2010. This increase was primarily due to higher contracted and spot prices for steam coal.
For our Rhino Western segment, coal revenues increased by $12.9 million, or 145.5%, to $21.7 million for the year ended December 31, 2011 from $8.8 million for the year ended December 31, 2010 due to the start of production at our Castle Valley operation. Coal revenues per ton for our Rhino Western segment were $42.78 for the year ended December 31, 2011, a decrease of $0.89, or 2.0%, from $43.67 for the year ended December 31, 2010. The decrease in coal revenues per ton was due to lower market prices for coal produced at our Castle Valley mine compared to coal sold from our McClane Canyon mine in 2010.
Other revenues for our Other category increased by $0.5 million for the year ended December 31, 2011 from the year ended December 31, 2010. This increase was primarily due to an increase in sales from our roof bolt manufacturing operations.
Central Appalachia Overview of Results by Product. Additional information for the Central Appalachia segment detailing the types of coal produced and sold, premium high-vol metallurgical coal ("met coal") and steam coal, is presented below. Note that our Northern Appalachia and Rhino Western segments currently produce and sell only steam coal.
| | | | | | | | | | |
(In thousands, except per ton data and %) | | Year
ended
December 31,
2011 | | Year
ended
December 31,
2010 | | Increase
(Decrease)
%* | |
|---|
Met coal tons sold | | | 654.6 | | | 683.4 | | | (4.2 | )% |
Steam coal tons sold | | | 1,653.4 | | | 1,474.5 | | | 12.1 | % |
| | | | | | | | |
Total tons sold† | | | 2,308.0 | | | 2,157.9 | | | 7.0 | % |
| | | | | | | | |
Met coal revenue | | $ | 79,227 | | $ | 88,570 | | | (10.5 | )% |
Steam coal revenue | | $ | 123,706 | | $ | 106,281 | | | 16.4 | % |
| | | | | | | | |
Total coal revenue† | | $ | 202,933 | | $ | 194,851 | | | 4.1 | % |
| | | | | | | | |
Met coal revenues per ton | | $ | 121.04 | | $ | 129.59 | | | (6.6 | )% |
Steam coal revenues per ton | | $ | 74.82 | | $ | 72.08 | | | 3.8 | % |
| | | | | | | | |
Total coal revenues per ton† | | $ | 87.92 | | $ | 90.30 | | | (2.6 | )% |
| | | | | | | | |
Met coal tons produced | | | 660.5 | | | 700.2 | | | (5.7 | )% |
Steam coal tons produced | | | 1,573.5 | | | 1,454.3 | | | 8.2 | % |
| | | | | | | | |
Total tons produced† | | | 2,234.0 | | | 2,154.5 | | | 3.7 | % |
| | | | | | | | |
- *
- Percentages and per ton amounts are calculated based on actual amounts and not the rounded amounts presented in this table.
- †
- Excludes data for the Rhino Eastern mining complex located in West Virginia for which we serve as manager.
74
Table of Contents
Costs and Expenses. The following table presents costs and expenses (including the cost of purchased coal) and cost of operations per ton by reportable segment for the years ended December 31, 2011 and 2010:
| | | | | | | | | | | | | |
| |
| |
| | Increase/(Decrease) | |
|---|
| | Year ended
December 31,
2011 | | Year ended
December 31,
2010 | |
|---|
Segment | | $ | | %* | |
|---|
| | (in millions, except per ton data and %)
| |
|---|
Central Appalachia | | | | | | | | | | | | | |
Cost of operations (exclusive of depreciation, depletion and amortization shown separately below) | | $ | 154.2 | | $ | 133.5 | | $ | 20.7 | | | 15.5 | % |
Freight and handling costs | | | — | | | — | | | — | | | n/a | |
Depreciation, depletion and amortization | | | 22.1 | | | 20.1 | | | 2.0 | | | 10.1 | % |
Selling, general and administrative | | | 20.2 | | | 15.3 | | | 4.9 | | | 32.0 | % |
Cost of operations per ton* | | $ | 66.79 | | $ | 61.87 | | $ | 4.92 | | | 7.9 | % |
Northern Appalachia | | | | | | | | | | | | | |
Cost of operations (exclusive of depreciation, depletion and amortization shown separately below) | | $ | 75.1 | | $ | 65.1 | | $ | 10.0 | | | 15.5 | % |
Freight and handling costs | | | 4.3 | | | 3.1 | | | 1.2 | | | 39.1 | % |
Depreciation, depletion and amortization | | | 8.1 | | | 9.3 | | | (1.2 | ) | | (12.7 | )% |
Selling, general and administrative | | | 0.4 | | | 0.3 | | | 0.1 | | | 2.5 | % |
Cost of operations per ton* | | $ | 36.45 | | $ | 33.43 | | $ | 3.02 | | | 9.0 | % |
Rhino Western | | | | | | | | | | | | | |
Cost of operations (exclusive of depreciation, depletion and amortization shown separately below) | | $ | 17.9 | | $ | 6.9 | | $ | 11.0 | | | 159.5 | % |
Freight and handling costs | | | — | | | — | | | — | | | n/a | |
Depreciation, depletion and amortization | | | 3.1 | | | 0.6 | | | 2.5 | | | 414.6 | % |
Selling, general and administrative | | | 0.1 | | | 0.1 | | | — | | | 17.2 | % |
Cost of operations per ton* | | $ | 35.42 | | $ | 34.20 | | $ | 1.22 | | | 3.6 | % |
Other | | | | | | | | | | | | | |
Cost of operations (exclusive of depreciation, depletion and amortization shown separately below) | | $ | 20.0 | | $ | 15.3 | | $ | 4.7 | | | 30.7 | % |
Freight and handling costs | | | — | | | (0.5 | ) | | 0.5 | | | n/a | |
Depreciation, depletion and amortization | | | 3.0 | | | 4.1 | | | (1.1 | ) | | (26.7 | )% |
Selling, general and administrative | | | 1.1 | | | 0.7 | | | 0.4 | | | 64.2 | % |
Cost of operations per ton** | | | n/a | | | n/a | | | n/a | | | n/a | |
Total | | | | | | | | | | | | | |
Cost of operations (exclusive of depreciation, depletion and amortization shown separately below) | | $ | 267.2 | | $ | 220.8 | | $ | 46.4 | | | 21.0 | % |
Freight and handling costs | | | 4.3 | | | 2.6 | | | 1.7 | | | 64.3 | % |
Depreciation, depletion and amortization | | | 36.3 | | | 34.1 | | | 2.2 | | | 6.5 | % |
Selling, general and administrative | | | 21.8 | | | 16.4 | | | 5.4 | | | 32.6 | % |
Cost of operations per ton* | | $ | 54.79 | | $ | 51.27 | | $ | 3.52 | | | 6.9 | % |
- *
- Percentages and per ton amounts are calculated based on actual amounts and not the rounded amounts presented in this table.
- **
- Cost of operations presented for our Other category includes costs incurred by our ancillary businesses. The activities performed by these ancillary businesses do not directly relate to coal production. As a result, per ton measurements are not presented for this category.
75
Table of Contents
Cost of Operations. Total cost of operations was $267.2 million for the year ended December 31, 2011 as compared to $220.8 million for the year ended December 31, 2010. Our cost of operations per ton was $54.79 for the year ended December 31, 2011, an increase of $3.52, or 6.9%, from the year ended December 31, 2010. These overall increases in the cost of operations and cost of operations on a per ton basis were due to increased costs in our Rhino Western segment due to preparing our Castle Valley mine to begin production early in 2011 along with costs associated with temporarily idling our McClane Canyon mine. In addition, we experienced higher costs in our Central Appalachia operations due to an increased number of regulatory actions at Mine 28 in our Rob Fork mining complex along with increased transportation and maintenance costs from our Grapevine surface mine located in the Tug River complex. In our Northern Appalachia segment, we also experienced increased roof support costs at our Hopedale mine. Cost of operations also increased across all of the operating segments due to higher fuel prices.
Our cost of operations for the Central Appalachia segment increased by $20.7 million, or 15.5%, to $154.2 million for the year ended December 31, 2011 from $133.5 million for the year ended December 31, 2010. Our cost of operations per ton increased to $66.79 per ton for the year ended December 31, 2011 from $61.87 per ton for year ended December 31, 2010. The increases in cost of operations and costs of operations per ton were primarily due to an increased number of regulatory actions at Mine 28 located in the Rob Fork mining complex along with increased transportation and maintenance costs from the Grapevine surface mine located in the Tug River complex.
In our Northern Appalachia segment, our cost of operations increased by $10.0 million, or 15.5%, to $75.1 million for the year ended December 31, 2011 from $65.1 million for the year ended December 31, 2010. Our cost of operations per ton increased to $36.45 for the year ended December 31, 2011 from $33.43 for the year ended December 31, 2010, an increase of $3.02 per ton, or 9.0%. The increases in cost of operations and costs of operations per ton were primarily due to increased commodity prices driven by higher fuel costs as well as roof control and methane issues encountered at our Hopedale underground mine.
Cost of operations in our Rhino Western segment increased by $11.0 million, or 159.5%, to $17.9 million for the year ended December 31, 2011 from $6.9 million for the year ended December 31, 2010. Our cost of operations per ton increased to $35.42 for the year ended December 31, 2011 from $34.20 for the year ended December 31, 2010, an increase of $1.22 per ton, or 3.6%. These increases in cost of operations and cost of operations per ton were primarily due to increased costs associated with preparing our Castle Valley mine to begin production early in 2011 along with costs associated with temporarily idling our McClane Canyon mine.
Cost of operations in our Other category increased by $4.7 million for the year ended December 31, 2011 as compared to the year ended December 31, 2010. This increase was primarily due to an increase in amounts spent for professional fees and outside services.
Freight and Handling. Total freight and handling cost for the year ended December 31, 2011 increased by $1.7 million, or 64.3%, to $4.3 million from $2.6 million for the year ended December 31, 2010. This increase was primarily due to a 0.6 million increase in the number of tons sold for the year ended December 31, 2011 as compared to the year ended December 31, 2010, along with higher fuel prices.
Depreciation, Depletion and Amortization. Total DD&A expense for the year ended December 31, 2011 was $36.3 million as compared to $34.1 million for the year ended December 31, 2010.
For the year ended December 31, 2011, our depreciation cost was $26.5 million as compared to $26.8 million for the year ended December 31, 2010. The decrease in depreciation cost in 2011 was primarily due to the disposal and idling of assets at certain less profitable surface mining operations.
76
Table of Contents
For the year ended December 31, 2011, our depletion cost was $5.1 million as compared to $1.8 million for the year ended December 31, 2010. The increase in depletion cost in 2011 was primarily due to depletion cost incurred as a result of coal produced by lessees of our Elk Horn properties that was not included in our results in 2010, along with an increase in tons of coal produced at our other mining operations in 2011 when compared to 2010.
For the year ended December 31, 2011, our amortization cost was $4.7 million as compared to $5.5 million for the year ended December 31, 2010. This decrease is primarily attributable to changes in the amortization for both mine development costs and asset retirement costs based on revisions to reserve valuations and useful lives.
Selling, General and Administrative. Selling, general and administrative ("SG&A") expense for the year ended December 31, 2011 was $21.8 million as compared to $16.4 million for the year ended December 31, 2010. The increase in SG&A expense is primarily attributable to the costs associated with being a publicly traded partnership, including an increase in expenditures for legal fees and other professional fees.
Interest Expense. Interest expense for the year ended December 31, 2011 was $6.1 million as compared to $5.3 million for the year ended December 31, 2010, an increase of $0.8 million, or 13.6%. This increase was the result of an increase in the balance outstanding under our credit facility, primarily resulting from the acquisition of Elk Horn.
Eastern Met Supplemental Data. Operational and financial data for the Rhino Eastern joint venture in which we have a 51% membership interest and for which we serve as manager (referred to as the "Eastern Met" segment) is presented below. Our consolidated revenue and costs do not include any portion of the revenue or costs of Rhino Eastern since we account for this operation under the equity method. We only record our proportionate share of net income of Rhino Eastern as a single item in our financial statements, but we believe the presentation of these items for Rhino Eastern provides additional insight into how this operation contributes to our overall performance.
| | | | | | | | | | |
(In thousands, except per ton data and %) | | Year ended
December 31,
2011 | | Year ended
December 31,
2010 | | Increase
(Decrease)
%* | |
|---|
Eastern Met 100% Basis | | | | | | | | | | |
Coal revenues | | $ | 49,999 | | $ | 40,028 | | | 24.9 | % |
Total revenues | | $ | 50,073 | | $ | 40,094 | | | 24.9 | % |
Coal revenues per ton* | | $ | 198.97 | | $ | 158.74 | | | 25.3 | % |
Cost of operations | | $ | 37,582 | | $ | 25,153 | | | 49.4 | % |
Cost of operations per ton* | | $ | 149.55 | | $ | 99.75 | | | 49.9 | % |
Depreciation, depletion and amortization | | $ | 2,959 | | $ | 3,196 | | | (7.4 | )% |
Interest expense | | $ | 52 | | $ | 72 | | | (28.1 | )% |
Net income | | $ | 6,545 | | $ | 8,946 | | | (26.8 | )% |
Partnership's portion of net income | | $ | 3,338 | | $ | 4,699 | | | (26.8 | )% |
Tons produced | | | 266.2 | | | 258.6 | | | 3.0 | % |
Tons sold | | | 251.3 | | | 252.2 | | | (0.3 | )% |
- *
- Percentages and per ton amounts are calculated based on actual amounts and not the rounded amounts presented in this table.
Rhino Eastern's Eagle #1 mine was removed from the potential pattern of violation list in March 2011 by MSHA. However, beginning on March 18, 2011, MSHA issued two orders requiring this mine to be idled until water located in previous mine works above the mine was removed. Rhino Eastern lost production at this mine for approximately three weeks while this water was removed. Additionally,
77
Table of Contents
on June 27, 2011, a fatality occurred at Rhino Eastern's Eagle #1 mine due to a rib fall that tragically killed one miner. Production was idled at this mine while we and MSHA investigated the events surrounding this accident. Production resumed at Rhino Eastern's Eagle #1 mine in July once the investigations were completed. On August 25, 2011, Rhino Eastern again received an MSHA notification of a potential pattern of violations based on MSHA's continued monitoring of the Eagle #1 Mine for long-term compliance after the evaluation period that ended in March 2011. Rhino Eastern developed a corrective action program in an effort to avoid a final finding of a pattern of violations and the imposition of sanctions. On January 19, 2012, MSHA notified Rhino Eastern that MSHA had determined not to consider Eagle #1 Mine for a pattern of violations. Despite the interruptions from the activities listed above, tons produced for the year ended December 31, 2011 increased slightly compared to the year ended December 31, 2010 while tons sold was relatively flat. Revenue increased year-to-year due to favorable pricing for coal sold in 2011, but net income decreased due to higher cost of operations, primarily from increased labor costs.
Net Income (Loss). The following table presents net income (loss) by reportable segment for the years ended December 31, 2011 and 2010:
| | | | | | | | | | |
Segment | | Year ended
December 31,
2011 | | Year ended
December 31,
2010 | | Increase
(Decrease) | |
|---|
| | (in millions)
| |
|---|
Central Appalachia | | $ | 19.2 | | $ | 20.6 | | $ | (1.4 | ) |
Northern Appalachia | | | 23.0 | | | 10.1 | | | 12.9 | |
Rhino Western* | | | (2.8 | ) | | 11.2 | | | (14.0 | ) |
Eastern Met** | | | 3.3 | | | 4.7 | | | (1.4 | ) |
Other | | | (4.6 | ) | | (5.5 | ) | | 0.9 | |
| | | | | | | | |
Total | | $ | 38.1 | | $ | 41.1 | | $ | (3.0 | ) |
| | | | | | | | |
- *
- During the third quarter of 2010, we acquired certain assets for cash consideration of approximately $15.0 million from the Trustee of the Federal Bankruptcy Court charged with the sale of the C.W. Mining Company assets, located in Emery and Carbon Counties, Utah (referred to as our Castle Valley mining complex). Because the fair value of the assets acquired exceeded the purchase price, we recorded a non-cash gain of $10.8 million that is reflected in our 2010 financial results for Rhino Western. A gain resulted from this acquisition since the assets were purchased in a distressed sale out of bankruptcy.
- **
- Includes our 51% equity interest in the results of the joint venture, which owns the Rhino Eastern mining complex located in West Virginia and for which we serve as manager.
For the year ended December 31, 2011, total net income was $38.1 million compared to $41.1 million (or $30.3 million excluding the $10.8 million gain from the Castle Valley acquisition) for the year ended December 31, 2010. Excluding the Castle Valley gain from 2010 net income, net income increased in 2011 due to an increase in revenue from higher tons sold, partially offset by higher cost of operations, primarily in our Central Appalachia segment. For our Central Appalachia segment, net income decreased to $19.2 million for the year ended December 31, 2011, a decrease of $1.4 million, as compared to the year ended December 31, 2010. This decrease was primarily due to lower amounts of metallurgical coal sold and an increase in costs of operations, partially offset by coal royalty income generated from our Elk Horn operation. Net income in our Northern Appalachia segment increased by $12.9 million to $23.0 million for the year ended December 31, 2011, from $10.1 million for the year ended December 31, 2010. This increase was primarily the result of an increase in sales. Net income in our Rhino Western segment decreased by $14.0 million to a loss of $2.8 million for the year ended December 31, 2011, compared to income of $11.2 million for the year ended December 31, 2010. This
78
Table of Contents
decrease was primarily the result of the $10.8 million Castle Valley gain in 2010 along with an increase in costs associated with preparing our Castle Valley operation to begin production in early 2011. Our Eastern Met segment recorded net income of $3.3 million for the year ended December 31, 2011, a decrease of $1.4 million from $4.7 million recorded for the year ended December 31, 2010. For the Other category, we had a net loss of $4.6 million for the year ended December 31, 2011, a reduction of $0.9 million as compared to a net loss of $5.5 million for the year ended December 31, 2010. This decrease in the loss from year to year was primarily due to an asset impairment charge recorded for certain assets in two of our ancillary businesses in 2010, partially offset by an increase in costs of operations in 2011.
Adjusted EBITDA. The following table presents Adjusted EBITDA by reportable segment for the years ended December 31, 2011 and 2010:
| | | | | | | | | | |
Segment | | Year ended
December 31,
2011 | | Year ended
December 31,
2010 | | Increase
(Decrease) | |
|---|
| | (in millions)
| |
|---|
Central Appalachia | | $ | 43.6 | | $ | 43.0 | | $ | 0.6 | |
Northern Appalachia | | | 33.2 | | | 21.4 | | | 11.8 | |
Rhino Western | | | 0.8 | | | 1.2 | | | (0.4 | ) |
Eastern Met* | | | 4.9 | | | 6.4 | | | (1.5 | ) |
Other | | | (0.5 | ) | | (0.5 | ) | | — | |
| | | | | | | | |
Total Adjusted EBITDA | | $ | 82.0 | | $ | 71.5 | | $ | 10.5 | |
| | | | | | | | |
- *
- Includes our 51% equity interest in the results of the joint venture, which owns the Rhino Eastern mining complex located in West Virginia and for which we serve as manager.
Total Adjusted EBITDA for the year ended December 31, 2011 was $82.0 million, an increase of $10.5 million from $71.5 million for the year ended December 31, 2010, primarily due to an increase in net income, excluding the $10.8 million gain from the Castle Valley acquisition in 2010, along with higher DD&A and interest expense. Please read "—Reconciliation of Adjusted EBITDA to Net Income by Segment" for reconciliations of Adjusted EBITDA to net income on a segment basis.
Year Ended December 31, 2010 Compared to Year Ended December 31, 2009
Summary. In the early part of 2009, we experienced eroding margins at certain operations in our Central Appalachia segment due to increased cost of operations when compared to committed sales prices. We made a strategic decision at that time to reduce production at those mines and purchase coal on the open market at prices that allowed us to sustain acceptable margins on these sales.
For the year ended December 31, 2010, our total revenues decreased to $305.6 million from $419.8 million for the year ended December 31, 2009. We sold 4.3 million tons of coal for the year ended year ended December 31, 2010, which is 2.4 million fewer tons, or 35.7% less, than the 6.7 million tons of coal sold for the year ended December 31, 2009. These decreases were the result of a strategic decision made in 2010 to only sell tons that were contracted at acceptable margins based on current market conditions and increased cost of operations.
For the year ended December 31, 2010, we increased our coal inventories by approximately 0.9 million tons while our coal inventories were approximately unchanged for the year ended December 31, 2009.
Despite the decrease in the volume of tons sold, both net income and Adjusted EBITDA increased for the year ended December 31, 2010 from the year ended December 31, 2009. Net income increased to $41.1 million for year ended December 31, 2010 from $19.5 million for the year ended
79
Table of Contents
December 31, 2009. Adjusted EBITDA increased to $71.5 million for the year ended December 31, 2010, from $63.6 million for the year ended December 31, 2009. The increases in net income and Adjusted EBITDA were primarily due to increased revenue on a per ton basis and a reduction in the amount of coal purchased, offset by higher costs of operations in our Central Appalachia segment. Net income in 2010 also benefited by a $10.8 million gain recognized on the Castle Valley Acquisition.
Tons Sold. The following table presents tons of coal sold by reportable segment for the years ended December 31, 2010 and 2009:
| | | | | | | | | | | | | |
Segment | | Year Ended
December 31,
2010 | | Year Ended
December 31,
2009 | | Increase
(Decrease)
Tons | | %* | |
|---|
| | (in millions, except %)
| |
|---|
Central Appalachia | | | 2.2 | | | 4.2 | | | (2.0 | ) | | (49.5 | )% |
Northern Appalachia | | | 1.9 | | | 2.2 | | | (0.3 | ) | | (10.0 | )% |
Rhino Western | | | 0.2 | | | 0.3 | | | (0.1 | ) | | (23.6 | )% |
| | | | | | | | | | |
Total*† | | | 4.3 | | | 6.7 | | | (2.4 | ) | | (35.7 | )% |
| | | | | | | | | | |
- *
- Calculated percentages and the rounded totals presented are based upon on actual whole ton amounts and not the rounded amounts presented in this table.
- †
- Excludes tons sold by the joint venture, which owns the Rhino Eastern mining complex located in West Virginia and for which we serve as manager.
We sold 4.3 million tons of coal in the year ended December 31, 2010 as compared to 6.7 million tons sold for the year ended December 31, 2009. This decrease in tons sold was primarily due to management decisions made to match cost of operations with supply contracts that provided acceptable margins in our Central Appalachia segment. Tons of coal sold in our Central Appalachia segment decreased by 2.0 million, or 49.5%, to 2.2 million tons for the year ended December 31, 2010 from 4.2 million tons for the year ended December 31, 2009. For our Northern Appalachia segment, tons of coal sold decreased by 0.3 million, or 10.0%, to 1.9 million tons for the year ended December 31, 2010 from 2.2 million tons for the year ended December 31, 2009. Coal sales from our Rhino Western segment decreased by 0.1 million, or 23.6%, to 0.2 million tons for the year ended December 31, 2010 from 0.3 million tons for the year ended December 31, 2009.
80
Table of Contents
Revenues. The following table presents revenues and coal revenues per ton by reportable segment for the years ended December 31, 2010 and 2009:
| | | | | | | | | | | | | |
| |
| |
| | Increase/
(Decrease) | |
|---|
| | Year ended
December 31, 2010 | | Year ended
December 31, 2009 | |
|---|
Segment | | $ | | %* | |
|---|
| | (in millions, except per ton data and %)
| |
|---|
Central Appalachia | | | | | | | | | | | | | |
Coal revenues | | $ | 194.9 | | $ | 295.1 | | $ | (100.2 | ) | | (34.0 | )% |
Freight and handling revenues | | | — | | | — | | | — | | | n/a | |
Other revenues | | | 0.7 | | | 2.6 | | | (1.9 | ) | | (72.0 | )% |
| | | | | | | | | | | |
Total revenues | | $ | 195.6 | | $ | 297.7 | | $ | (102.1 | ) | | (34.3 | )% |
| | | | | | | | | | | |
Coal revenues per ton* | | $ | 90.30 | | $ | 69.10 | | $ | 21.20 | | | 30.7 | % |
Northern Appalachia | | | | | | | | | | | | | |
Coal revenues | | $ | 86.2 | | $ | 95.5 | | $ | (9.3 | ) | | (9.7 | )% |
Freight and handling revenues | | | 4.2 | | | 5.0 | | | (0.8 | ) | | (17.4 | )% |
Other revenues | | | 5.0 | | | 6.2 | | | (1.2 | ) | | (19.1 | )% |
| | | | | | | | | | | |
Total revenues | | $ | 95.4 | | $ | 106.7 | | $ | (11.3 | ) | | (10.6 | )% |
| | | | | | | | | | | |
Coal revenues per ton* | | $ | 44.30 | | $ | 44.12 | | $ | 0.18 | | | 0.4 | % |
Rhino Western | | | | | | | | | | | | | |
Coal revenues | | $ | 8.8 | | $ | 11.2 | | $ | (2.4 | ) | | (21.2 | )% |
Freight and handling revenues | | | — | | | — | | | — | | | n/a | |
Other revenues | | | — | | | — | | | — | | | 12.3 | % |
| | | | | | | | | | | |
Total revenues | | $ | 8.8 | | $ | 11.2 | | $ | (2.4 | ) | | (21.1 | )% |
| | | | | | | | | | | |
Coal revenues per ton* | | $ | 43.67 | | $ | 42.35 | | $ | 1.32 | | | 3.1 | % |
Other | | | | | | | | | | | | | |
Coal revenues | | | n/a | | | n/a | | | n/a | | | n/a | |
Freight and handling revenues | | | n/a | | | n/a | | | n/a | | | n/a | |
Other revenues | | $ | 5.8 | | $ | 4.2 | | $ | 1.6 | | | 40.7 | % |
| | | | | | | | | | | |
Total revenues | | $ | 5.8 | | $ | 4.2 | | $ | 1.6 | | | 40.7 | % |
| | | | | | | | | | | |
Coal revenues per ton* | | | n/a | | | n/a | | | n/a | | | n/a | |
Total | | | | | | | | | | | | | |
Coal revenues | | $ | 289.9 | | $ | 401.8 | | $ | (111.9 | ) | | (27.8 | )% |
Freight and handling revenues | | | 4.2 | | | 5.0 | | | (0.8 | ) | | (17.4 | )% |
Other revenues | | | 11.5 | | | 13.0 | | | (1.5 | ) | | (10.8 | )% |
| | | | | | | | | | | |
Total revenues | | $ | 305.6 | | $ | 419.8 | | $ | (114.2 | ) | | (27.2 | )% |
| | | | | | | | | | | |
Coal revenues per ton* | | $ | 67.32 | | $ | 59.98 | | $ | 7.34 | | | 12.2 | % |
- *
- Percentages and per ton amounts are calculated based on actual amounts and not the rounded amounts presented in this table.
Our total revenues for the year ended December 31, 2010 decreased by $114.2 million, or 27.2%, to $305.6 million from $419.8 million for the year ended December 31, 2009. The decrease in total revenues was due to the strategic decision to sell only tons that provided an acceptable margin as discussed earlier. Coal revenues per ton were $67.32 for the year ended December 31, 2010, an increase of $7.34, or 12.2%, from $59.98 per ton for the year ended December 31, 2009. This increase
81
Table of Contents
in coal revenues per ton was primarily the result of the sale of a higher percentage of metallurgical coal being sold and higher contracted prices for the steam coal.
For our Central Appalachia segment, coal revenues decreased by $100.2 million, or 34.0%, to $194.9 million for the year ended December 31, 2010 from $295.1 million for the year ended December 31, 2009 due to strategic decisions made to match cost of operations with coal supply contracts that provided acceptable margins. Coal revenues per ton for our Central Appalachia segment increased by $21.20, or 30.7%, to $90.30 per ton for the year ended December 31, 2010 as compared to $69.10 for the year ended December 31, 2009, due to a higher percentage of metallurgical coal being sold and higher contracted prices for the steam coal.
For our Northern Appalachia segment, coal revenues were $86.2 million for the year ended December 31, 2010, a decrease of $9.3 million, or 9.7%, from $95.5 million for the year ended December 31, 2009, due to market conditions. Coal revenues per ton for our Northern Appalachia segment increased by $0.18, or 0.4%, to $44.30 per ton for the year ended December 31, 2010 as compared to $44.12 per ton for the year ended December 31, 2009. This increase was primarily due to higher contracted prices on our supply contracts.
For our Rhino Western segment, coal revenues decreased by $2.4 million, or 21.2%, to $8.8 million for the year ended December 31, 2010 from $11.2 million for the year ended December 31, 2009. Coal revenues per ton for our Rhino Western segment were $43.67 for the year ended December 31, 2010, an increase of $1.32, or 3.1%, from $42.35 for the year ended December 31, 2009 due to a contracted increase in the selling price to our customer for coal produced at our McClane Canyon mine.
Other revenues for our Other category increased by $1.6 million for the year ended December 31, 2010 from the year ended December 31, 2009. This increase was primarily due to an increase in sales from our roof bolt manufacturing operations of $1.5 million.
Central Appalachia Overview of Results by Product. Additional information for the Central Appalachia segment detailing the types of coal produced and sold, met coal and steam coal, is presented below. Note that our Northern Appalachia and Rhino Western segments currently produce and sell only steam coal.
| | | | | | | | | | |
(In thousands, except per ton data and %) | | Year
ended
December 31,
2010 | | Year
ended
December 31,
2009 | | Increase
(Decrease)
%* | |
|---|
Met coal tons sold | | | 683.4 | | | 353.7 | | | 93.2 | % |
Steam coal tons sold | | | 1,474.5 | | | 3,917.1 | | | (62.4 | )% |
| | | | | | | | |
Total tons sold† | | | 2,157.9 | | | 4,270.8 | | | (49.5 | )% |
| | | | | | | | |
Met coal revenue | | $ | 88,570 | | $ | 57,505 | | | 54.0 | % |
Steam coal revenue | | $ | 106,281 | | $ | 237,602 | | | (55.3 | )% |
| | | | | | | | |
Total coal revenue† | | $ | 194,851 | | $ | 295,107 | | | (34.0 | )% |
| | | | | | | | |
Met coal revenues per ton | | $ | 129.59 | | $ | 162.57 | | | (20.3 | )% |
Steam coal revenues per ton | | $ | 72.08 | | $ | 60.66 | | | 18.8 | % |
| | | | | | | | |
Total coal revenues per ton† | | $ | 90.30 | | $ | 69.10 | | | 30.7 | % |
| | | | | | | | |
Met coal tons produced | | | 700.2 | | | 379.0 | | | 84.8 | % |
Steam coal tons produced | | | 1,454.3 | | | 3,928.9 | | | (63.0 | )% |
| | | | | | | | |
Total tons produced† | | | 2,154.5 | | | 4,307.9 | | | (50.0 | )% |
| | | | | | | | |
- *
- Percentages and per ton amounts are calculated based on actual amounts and not the rounded amounts presented in this table.
- †
- Excludes data for the Rhino Eastern mining complex located in West Virginia for which we serve as manager.
82
Table of Contents
Costs and Expenses. The following table presents costs and expenses (including the cost of purchased coal) and cost of operations per ton by reportable segment for the years ended December 31, 2010 and 2009:
| | | | | | | | | | | | | |
| |
| |
| | Increase/
(Decrease) | |
|---|
| | Year ended
December 31, 2010 | | Year ended
December 31, 2009 | |
|---|
Segment | | $ | | %* | |
|---|
| | (in millions, except per ton data and %)
| |
|---|
Central Appalachia | | | | | | | | | | | | | |
Cost of operations (exclusive of depreciation, depletion and amortization shown separately below) | | $ | 133.5 | | $ | 249.1 | | $ | (115.6 | ) | | (46.4 | )% |
Freight and handling costs | | | — | | | — | | | — | | | n/a | |
Depreciation, depletion and amortization | | | 20.1 | | | 23.9 | | | (3.8 | ) | | (15.9 | )% |
Selling, general and administrative | | | 15.3 | | | 15.5 | | | (0.2 | ) | | (1.0 | )% |
Cost of operations per ton* | | $ | 61.87 | | $ | 58.32 | | $ | 3.55 | | | 6.1 | % |
Northern Appalachia | | | | | | | | | | | | | |
Cost of operations (exclusive of depreciation, depletion and amortization shown separately below) | | $ | 65.1 | | $ | 71.5 | | $ | (6.4 | ) | | (9.0 | )% |
Freight and handling costs | | | 3.1 | | | 4.0 | | | (0.9 | ) | | (22.0 | )% |
Depreciation, depletion and amortization | | | 9.3 | | | 7.9 | | | 1.5 | | | 18.9 | % |
Selling, general and administrative | | | 0.3 | | | 0.4 | | | (0.1 | ) | | (10.9 | )% |
Cost of operations per ton* | | $ | 33.43 | | $ | 33.04 | | $ | 0.39 | | | 1.2 | % |
Rhino Western | | | | | | | | | | | | | |
Cost of operations (exclusive of depreciation, depletion and amortization shown separately below) | | $ | 6.9 | | $ | 6.2 | | $ | 0.7 | | | 10.9 | % |
Freight and handling costs | | | — | | | — | | | — | | | n/a | |
Depreciation, depletion and amortization | | | 0.6 | | | 0.7 | | | (0.1 | ) | | (18.1 | )% |
Selling, general and administrative | | | 0.1 | | | 0.1 | | | — | | | 20.9 | % |
Cost of operations per ton* | | $ | 34.20 | | $ | 23.56 | | $ | 10.63 | | | 45.1 | % |
Other | | | | | | | | | | | | | |
Cost of operations (exclusive of depreciation, depletion and amortization shown separately below) | | $ | 15.3 | | $ | 9.5 | | $ | 5.8 | | | 60.1 | % |
Freight and handling costs | | | (0.5 | ) | | — | | | (0.5 | ) | | n/a | |
Depreciation, depletion and amortization | | | 4.1 | | | 3.8 | | | 0.3 | | | 7.0 | % |
Selling, general and administrative | | | 0.7 | | | 0.8 | | | (0.1 | ) | | (15.0 | )% |
Cost of operations per ton** | | | n/a | | | n/a | | | n/a | | | n/a | |
Total | | | | | | | | | | | | | |
Cost of operations (exclusive of depreciation, depletion and amortization shown separately below) | | $ | 220.8 | | $ | 336.3 | | $ | (115.5 | ) | | (34.4 | )% |
Freight and handling costs | | | 2.6 | | | 4.0 | | | (1.4 | ) | | (34.0 | )% |
Depreciation, depletion and amortization | | | 34.1 | | | 36.3 | | | (2.2 | ) | | (6.0 | )% |
Selling, general and administrative | | | 16.4 | | | 16.8 | | | (0.4 | ) | | (1.8 | )% |
Cost of operations per ton* | | $ | 51.27 | | $ | 50.21 | | $ | 1.06 | | | 2.1 | % |
- *
- Percentages and per ton amounts are calculated based on actual amounts and not the rounded amounts presented in this table.
- **
- Cost of operations presented for our Other category includes costs incurred by our ancillary businesses. The activities performed by these ancillary businesses do not directly relate to coal production. As a result, per ton measurements are not presented for this category.
Cost of Operations. Total cost of operations was $220.8 million for the year ended December 31, 2010 as compared to $336.3 million for the year ended December 31, 2009, primarily as a result of a decrease in the amount of purchased coal offset by increased costs associated with heightened regulatory scrutiny. Our cost of operations per ton was $51.27 for the year ended December 31, 2010, an increase of $1.06, or 2.1%, from the year ended December 31, 2009. This overall increase in the
83
Table of Contents
cost of operations on a per ton basis was due to increased costs associated with heightened regulatory scrutiny.
Our cost of operations for the Central Appalachia segment decreased by $115.6 million, or 46.4%, to $133.5 million for the year ended December 31, 2010 from $249.1 million for the year ended December 31, 2009, primarily due to purchasing fewer tons at a lower total cost offset by increases in cost of operations associated with labor, contract services, royalties and maintenance. Our cost of operations per ton increased to $61.87 per ton for the year ended December 31, 2010 from $58.32 per ton for year ended December 31, 2009. This increase in cost of operations per ton was primarily due to higher costs of operations associated with heightened regulatory scrutiny.
In our Northern Appalachia segment, our cost of operations decreased by $6.4 million, or 9.0%, to $65.1 million for the year ended December 31, 2010 from $71.5 million for the year ended December 31, 2009, primarily due to decreased expenditures for operating supplies offset by increases in costs such as maintenance and outside services. Our cost of operations per ton increased to $33.43 for the year ended December 31, 2010 from $33.04 for the year ended December 31, 2009, an increase of $0.39 per ton, or 1.2%. This increase in cost of operations per ton was primarily due to higher roof control costs at our underground operation due to ground control issues requiring additional materials to be used.
Cost of operations in our Rhino Western segment increased by $0.7 million, or 10.9%, to $6.9 million for the year ended December 31, 2010 from $6.2 million for the year ended December 31, 2009, primarily due to an increase in amounts spent for outside services. Our cost of operations per ton increased to $34.20 for the year ended December 31, 2010 from $23.56 for the year ended December 31, 2009, an increase of $10.63 per ton, or 45.1%. This increase in cost of operations per ton was primarily due to charges associated with the temporary idling of the McClane Canyon mine and the rehabilitation of the Castle Valley mine.
Cost of operations in our Other category increased by $5.8 million for the year ended December 31, 2010 as compared to the year ended December 31, 2009. This increase was primarily due to an increase in amounts spent for outside services.
Freight and Handling. Total freight and handling cost for the year ended December 31, 2010 decreased by $1.4 million, or 34.0%, to $2.6 million from $4.0 million for the year ended December 31, 2009. This decrease was primarily due to a 2.4 million decrease in the number of tons sold for the period ended December 31, 2010 as compared to the period ended December 31, 2009.
Depreciation, Depletion and Amortization. Total DD&A expense for the year ended December 31, 2010 was $34.1 million as compared to $36.3 million for the year ended December 31, 2009.
For the year ended December 31, 2010, our depreciation cost was $26.8 million as compared to $29.3 million for the year ended December 31, 2009. The decrease in depreciation cost in 2010 was primarily due to the disposal and idling of assets at certain less profitable surface mining operations.
For the year ended December 31, 2010, our depletion cost was $1.8 million as compared to $2.3 million for the year ended December 31, 2009. The decrease in depletion cost in 2010 was primarily due to a decrease in tons of coal produced in 2010 when compared to 2009.
For the year ended December 31, 2010, our amortization cost was $5.5 million as compared to $4.7 million for the year ended December 31, 2009. This increase is primarily attributable to the acceleration of amortization for both mine development costs and asset retirement costs based on revisions to reserve valuations and useful lives.
Selling, General and Administrative. SG&A expense for the year ended December 31, 2010 was $16.4 million as compared to $16.8 million for the year ended December 31, 2009. This decrease in
84
Table of Contents
SG&A expense was primarily due to a gain recognized on a litigation settlement, partially offset by an increase in expenditures for legal fees associated with the Castle Valley acquisition and other professional fees.
Interest Expense. Interest expense for the year ended December 31, 2010 was $5.3 million as compared to $6.2 million for the year ended December 31, 2009, a decrease of $0.9 million, or 14.2%. This decrease was primarily the result of a reduction in the balance due under our credit facility in the fourth quarter of 2010 as we reduced our credit facility balance with the proceeds from our initial public offering that was completed on October 5, 2010.
Eastern Met Supplemental Data. Operational and financial data for the Rhino Eastern joint venture in which we have a 51% membership interest and for which we serve as manager (referred to as the "Eastern Met" segment) is presented below. Our consolidated revenue and costs do not include any portion of the revenue or costs of Rhino Eastern since we account for this operation under the equity method. We only record our proportionate share of net income of Rhino Eastern as a single item in our financial statements, but we believe the presentation of these items for Rhino Eastern provides additional insight into how this operation contributes to our overall performance.
| | | | | | | | | | |
(In thousands, except per ton data and %) | | Year ended
December 31,
2010 | | Year ended
December 31,
2009 | | Increase
(Decrease)
%* | |
|---|
Eastern Met 100% Basis | | | | | | | | | | |
Coal revenues | | $ | 40,028 | | $ | 28,809 | | | 38.9 | % |
Total revenues | | $ | 40,094 | | $ | 28,820 | | | 39.1 | % |
Coal revenues per ton* | | $ | 158.74 | | $ | 145.01 | | | 9.5 | % |
Cost of operations | | $ | 25,153 | | $ | 19,862 | | | 26.6 | % |
Cost of operations per ton* | | $ | 99.75 | | $ | 99.97 | | | (0.2 | )% |
Depreciation, depletion and amortization | | $ | 3,196 | | $ | 2,863 | | | 11.6 | % |
Interest expense | | $ | 72 | | $ | 429 | | | (83.3 | )% |
Net income | | $ | 8,946 | | $ | 1,751 | | | 411.0 | % |
Partnership's portion of net income | | $ | 4,699 | | $ | 893 | | | 411.0 | % |
Tons produced | | | 258.6 | | | 164.1 | | | 57.5 | % |
Tons sold | | | 252.2 | | | 198.7 | | | 26.9 | % |
- *
- Percentages and per ton amounts are calculated based on actual amounts and not the rounded amounts presented in this table.
85
Table of Contents
Net Income (Loss). The following table presents net income (loss) by reportable segment for the years ended December 31, 2010 and 2009:
| | | | | | | | | | |
Segment | | Year ended
December 31,
2010 | | Year ended
December 31,
2009 | | Increase
(Decrease) | |
|---|
| | (in millions)
| |
|---|
Central Appalachia | | $ | 20.6 | | $ | 0.6 | | $ | 20.0 | |
Northern Appalachia | | | 10.1 | | | 17.6 | | | (7.5 | ) |
Rhino Western* | | | 11.2 | | | 3.3 | | | 7.9 | |
Eastern Met** | | | 4.7 | | | 0.9 | | | 3.8 | |
Other | | | (5.5 | ) | | (2.9 | ) | | (2.6 | ) |
| | | | | | | | |
Total | | $ | 41.1 | | $ | 19.5 | | $ | 21.6 | |
| | | | | | | | |
- *
- During the third quarter of 2010, we acquired certain assets for cash consideration of approximately $15.0 million from the Trustee of the Federal Bankruptcy Court charged with the sale of the C.W. Mining Company assets, located in Emery and Carbon Counties, Utah (referred to as our Castle Valley mining complex). Because the fair value of the assets acquired exceeded the purchase price, we recorded a non-cash gain of $10.8 million that is reflected in our 2010 financial results for Rhino Western. A gain resulted from this acquisition since the assets were purchased in a distressed sale out of bankruptcy.
- **
- Includes our 51% equity interest in the results of the joint venture, which owns the Rhino Eastern mining complex located in West Virginia and for which we serve as manager.
For the year ended December 31, 2010, total net income increased to $41.1 million from $19.5 million for the year ended December 31, 2009. This increase was primarily due to the sale of a higher percentage of metallurgical coal, higher contracted prices for the steam coal, a reduction in the amount of coal purchased that was sold near breakeven in 2009 and the $10.8 million gain recognized on the Castle Valley acquisition. For our Central Appalachia segment, net income increased to $20.6 million for the year ended December 31, 2010, an improvement of $20.0 million as compared to the year ended December 31, 2009, primarily due an increase in our higher margin metallurgical coal sales. Net income in our Northern Appalachia segment decreased by $7.5 million to $10.1 million for the year ended December 31, 2010, from $17.6 million for the year ended December 31, 2009. This decrease was primarily due to higher costs of operations at both the surface and underground mines in addition to a decrease in sales as dictated by market conditions. For our Rhino Western segment, we recorded net income of $11.2 million for the year ended December 31, 2010, an increase of $7.9 million from $3.3 million recorded for the year ended December 31, 2009. This increase in net income was primarily due to the $10.8 million gain recorded on the Castle Valley acquisition. Our Eastern Met segment recorded net income of $4.7 million for the year ended December 31, 2010, an increase of $3.8 million from $0.9 million recorded for the year ended December 31, 2009. For the Other category, we had a net loss of $5.5 million for the year ended December 31, 2010, a decrease of $2.6 million as compared to a net loss of $2.9 million recorded for the year ended December 31, 2009. This decrease was primarily due to an increase in costs of operations as well as an asset impairment charge recorded for certain assets in two of our ancillary businesses.
86
Table of Contents
Adjusted EBITDA. The following table presents Adjusted EBITDA by reportable segment for the years ended December 31, 2010 and 2009:
| | | | | | | | | | |
Segment | | Year
ended
December 31,
2010 | | Year
ended
December 31,
2009 | | Increase
(Decrease) | |
|---|
| | (in millions)
| |
|---|
Central Appalachia | | $ | 43.0 | | $ | 28.0 | | $ | 15.0 | |
Northern Appalachia | | | 21.4 | | | 27.3 | | | (5.9 | ) |
Rhino Western | | | 1.2 | | | 4.2 | | | (3.0 | ) |
Eastern Met* | | | 6.4 | | | 2.5 | | | 3.9 | |
Other | | | (0.5 | ) | | 1.6 | | | (2.1 | ) |
| | | | | | | | |
Total Adjusted EBITDA | | $ | 71.5 | | $ | 63.6 | | $ | 7.9 | |
| | | | | | | | |
- *
- Includes our 51% equity interest in the results of the joint venture, which owns the Rhino Eastern mining complex located in West Virginia and for which we serve as manager.
Total Adjusted EBITDA for the year ended December 31, 2010 was $71.5 million, an increase of $7.9 million from the year ended December 31, 2009 primarily due to an increase in net income of $21.6 million, or $10.8 million excluding the Castle Valley gain, offset by a decrease in depreciation expense of $2.2 million and a decrease in interest expense of $0.9 million. Please read "—Reconciliation of Adjusted EBITDA to Net Income by Segment" for reconciliations of Adjusted EBITDA to net income on a segment basis.
The following tables present reconciliations of Adjusted EBITDA to net income on a segment basis for each of the periods indicated. We believe the presentation of Adjusted EBITDA that includes the proportionate share of DD&A and interest expense for our Rhino Eastern joint venture is appropriate since our portion of Rhino Eastern's net income that is recognized as a single line item in our financial statements is affected by these expense items. Since we do not reflect these proportionate expense items of DD&A and interest expense in our consolidated financial statements, we believe that the adjustment for these expense items in the Adjusted EBITDA calculation is more representative of how we review our results and also provides investors with additional information that they can use to evaluate our results. Adjusted EBITDA also excludes the effect of certain non-recurring items.
| | | | | | | | | | | | | | | | | | | |
Year ended December 31, 2011 | | Central
Appalachia | | Northern
Appalachia | | Rhino
Western | | Eastern
Met* | | Other | | Total** | |
|---|
| | (in millions)
| |
|---|
Net income (loss) | | $ | 19.2 | | $ | 23.0 | | $ | (2.8 | ) | $ | 3.3 | | $ | (4.6 | ) | $ | 38.1 | |
Plus: | | | | | | | | | | | | | | | | | | | |
DD&A | | | 22.1 | | | 8.1 | | | 3.1 | | | — | | | 3.0 | | | 36.3 | |
Interest expense | | | 2.3 | | | 2.1 | | | 0.6 | | | — | | | 1.1 | | | 6.1 | |
| | | | | | | | | | | | | | |
EBITDA†** | | $ | 43.6 | | $ | 33.2 | | $ | 0.8 | | $ | 3.3 | | $ | (0.5 | ) | $ | 80.4 | |
| | | | | | | | | | | | | | |
Plus: Rhino Eastern DD&A-51% | | | — | | | — | | | — | | | 1.5 | | | — | | | 1.5 | |
Plus: Rhino Eastern interest expense-51% | | | — | | | — | | | — | | | 0.1 | | | — | | | 0.1 | |
| | | | | | | | | | | | | | |
Adjusted EBITDA† | | $ | 43.6 | | $ | 33.2 | | $ | 0.8 | | $ | 4.9 | | $ | (0.5 | ) | $ | 82.0 | |
| | | | | | | | | | | | | | |
87
Table of Contents
| | | | | | | | | | | | | | | | | | | |
Year ended December 31, 2010 | | Central
Appalachia | | Northern
Appalachia | | Rhino
Western | | Eastern
Met* | | Other | | Total** | |
|---|
| | (in millions)
| |
|---|
Net income (loss) | | $ | 20.6 | | $ | 10.1 | | $ | 11.2 | | $ | 4.7 | | $ | (5.5 | ) | $ | 41.1 | |
Plus: | | | | | | | | | | | | | | | | | | | |
DD&A | | | 20.1 | | | 9.3 | | | 0.6 | | | — | | | 4.1 | | | 34.1 | |
Interest expense | | | 2.3 | | | 2.0 | | | 0.2 | | | — | | | 0.9 | | | 5.3 | |
| | | | | | | | | | | | | | |
EBITDA†** | | $ | 43.0 | | $ | 21.4 | | $ | 12.0 | | $ | 4.7 | | $ | (0.5 | ) | $ | 80.6 | |
| | | | | | | | | | | | | | |
Plus: Rhino Eastern DD&A-51% | | | — | | | — | | | — | | | 1.6 | | | — | | | 1.6 | |
Plus: Rhino Eastern interest expense-51% | | | — | | | — | | | — | | | 0.1 | | | — | | | 0.1 | |
Less: Gain from Castle Valley acquisition*** | | | — | | | — | | | (10.8 | ) | | — | | | — | | | (10.8 | ) |
| | | | | | | | | | | | | | |
Adjusted EBITDA† | | $ | 43.0 | | $ | 21.4 | | $ | 1.2 | | $ | 6.4 | | $ | (0.5 | ) | $ | 71.5 | |
| | | | | | | | | | | | | | |
| | | | | | | | | | | | | | | | | | | |
Year ended December 31, 2009 | | Central
Appalachia | | Northern
Appalachia | | Rhino
Western | | Eastern
Met* | | Other | | Total** | |
|---|
| | (in millions)
| |
|---|
Net income (loss) | | $ | 0.6 | | $ | 17.6 | | $ | 3.3 | | $ | 0.9 | | $ | (2.9 | ) | $ | 19.5 | |
Plus: | | | | | | | | | | | | | | | | | | | |
DD&A | | | 23.9 | | | 7.9 | | | 0.7 | | | — | | | 3.8 | | | 36.3 | |
Interest expense | | | 3.5 | | | 1.8 | | | 0.2 | | | — | | | 0.7 | | | 6.2 | |
| | | | | | | | | | | | | | |
EBITDA†** | | $ | 28.0 | | $ | 27.3 | | $ | 4.2 | | $ | 0.9 | | $ | 1.6 | | $ | 62.0 | |
| | | | | | | | | | | | | | |
Plus: Rhino Eastern DD&A-51% | | | — | | | — | | | — | | | 1.4 | | | — | | | 1.4 | |
Plus: Rhino Eastern interest expense-51% | | | — | | | — | | | — | | | 0.2 | | | — | | | 0.2 | |
| | | | | | | | | | | | | | |
Adjusted EBITDA† | | $ | 28.0 | | $ | 27.3 | | $ | 4.2 | | $ | 2.5 | | $ | 1.6 | | $ | 63.6 | |
| | | | | | | | | | | | | | |
- *
- Includes our 51% equity interest in the results of the joint venture, which owns the Rhino Eastern mining complex located in West Virginia and for which we serve as manager.
- †
- Calculated based on actual amounts and not the rounded amounts presented in this table.
- **
- Totals may not foot due to rounding
- ***
- During 2010, we acquired certain assets for cash consideration of approximately $15.0 million from the Trustee of the Federal Bankruptcy Court charged with the sale of the C.W. Mining Company assets, located in Emery and Carbon Counties, Utah (referred to as our Castle Valley mining complex). Because the fair value of the assets acquired exceeded the purchase price, we recorded a non-cash gain of $10.8 million that is reflected in our 2010 financial results. A gain resulted from this acquisition since the assets were purchased in a distressed sale out of bankruptcy. Management believes that the isolation and presentation of this specific item to arrive at Adjusted EBITDA is useful because it enhances investors' understanding of how management assesses the performance of our business. Management believes the adjustment of this item provides investors with additional information that they can utilize in evaluating our performance. Additionally, management believes the isolation of this item provides investors with enhanced comparability to prior and future periods of our operating results.
Liquidity and Capital Resources
Our business is capital intensive and requires substantial capital expenditures for purchasing, upgrading and maintaining equipment used in developing and mining our reserves, as well as complying
88
Table of Contents
with applicable environmental and mine safety laws and regulations. Our principal liquidity requirements are to finance current operations, fund capital expenditures, including acquisitions from time to time, and service our debt. Our sources of liquidity include cash generated by our operations, borrowings under our credit agreement and further issuances of equity and debt securities.
The principal indicators of our liquidity are our cash on hand and availability under our credit agreement. As of December 31, 2011, our available liquidity was $137.1 million, including cash on hand of $0.4 million and $136.7 million available under our credit agreement.
Please read "—Capital Expenditures" for a further discussion of the impact on liquidity.
Net cash provided by operating activities was $66.9 million for the year ended December 31, 2011 as compared to $55.0 million for the year ended December 31, 2010. This increase in cash provided by operating activities was primarily the result of an increase in net income, excluding the non-cash gain from the Castle Valley acquisition, due to favorable sales prices of our steam coal.
Net cash used in investing activities was $188.0 million for the year ended December 31, 2011 as compared to $37.6 million for the year ended December 31, 2010. The increase in cash used in investing activities was primarily due to the acquisition of Elk Horn for approximately $119.6 million, net of cash acquired, along with increased amounts expended for the purchase of mining equipment and other asset acquisitions, including approximately $28.0 million for oil and gas mineral rights acquisitions in the Cana Woodford region and the Utica Shale region.
Net cash provided by financing activities for the year ended December 31, 2011 was $121.5 million, which was primarily attributable to net borrowings under our credit agreement to fund the Elk Horn acquisition that was also partially funded with the net proceeds of approximately $66.9 million from the public offering of common units in July 2011. Net cash used for financing activities for the year ended December 31, 2010 was $18.0 million, which was primarily attributable to the use of the net proceeds from our IPO along with a contribution from our general partner to repay a portion of the outstanding indebtedness under our credit facility and to pay offering costs.
Our mining operations require investments to expand, upgrade or enhance existing operations and to meet environmental and safety regulations. Maintenance capital expenditures are those capital expenditures required to maintain our long-term operating capacity. For example, maintenance capital expenditures include expenditures associated with the replacement of equipment and coal reserves, whether through the expansion of an existing mine or the acquisition or development of new reserves, to the extent such expenditures are made to maintain our long-term operating capacity. Expansion capital expenditures are those capital expenditures that we expect will increase our operating capacity over the long term. Examples of expansion capital expenditures include the acquisition of reserves, acquisition of equipment for a new mine or the expansion of an existing mine to the extent such expenditures are expected to expand our long-term operating capacity.
Actual maintenance capital expenditures for the year ended December 31, 2011 were approximately $21.4 million. These amounts were primarily used to rebuild, repair or replace older mining equipment. Expansion capital expenditures for the year ended December 31, 2011 was approximately $80.4 million. As discussed earlier, we completed the acquisition of certain oil and gas mineral rights in the Cana Woodford region of western Oklahoma and in the Utica Shale region of eastern Ohio for a total purchase price of approximately $28.0 million during the year ended December 31, 2011. These acquisitions were classified as an expansion capital expenditure. Additionally, we acquired approximately 32,600 acres and associated surface rights in Randolph and
89
Table of Contents
Upshur Counties, West Virginia for approximately $7.5 million that were also classified as expansion capital expenditures. The remaining amounts were primarily spent for our internal development projects, including the ongoing construction of our new preparation plant in our Tug River complex, the purchase of a new high-wall miner for use in our Tug River complex and the costs to ramp up production at our Castle Valley complex in Utah. For the year ending December 31, 2012, we have budgeted $16.0 million to $19.0 million for maintenance capital expenditures.
We believe that we have sufficient liquid assets, cash flows from operations and borrowing capacity under our credit agreement to meet our financial commitments, debt service obligations, contingencies and anticipated capital expenditures for the next twelve months. However, we are subject to business and operational risks that could adversely affect our cash flow. A material decrease in our cash flows would likely produce a corollary adverse effect on our borrowing capacity. From time to time, we may issue debt and equity securities.
The original maximum availability under our credit facility with PNC Bank, N.A. as administrative agent, was $200.0 million. On June 8, 2011, with the consent of the lenders, we exercised the option to increase the amount available to borrow under the credit agreement by $50.0 million to $250.0 million as part of the Elk Horn acquisition.
On July 29, 2011, we executed an amended and restated senior secured credit facility with PNC Bank, N.A., as administrative agent, and a group of participating lenders. The maximum availability under the amended and restated credit facility is $300.0 million, with a one-time option to increase the availability by an amount not to exceed $50.0 million. Of the $300.0 million, $75.0 million is available for letters of credit.
Loans under the credit agreement bear interest at either (i) a base rate equaling the highest of (a) the Federal Funds Open Rate plus 0.50%; (b) the prime rate; or (c) daily LIBOR plus 1.00%, plus an applicable margin in each case or (ii) LIBOR plus an applicable margin, at our option. The applicable margin for the base rate option is 1.50% to 2.25%, and the applicable margin for the LIBOR option is 2.50% to 3.25%, each of which depends on our and our subsidiaries' consolidated leverage ratio ("Consolidated Leverage Ratio"). The credit agreement also contains letter of credit fees equal to an applicable margin of 2.50% to 3.25% depending on the Consolidated Leverage Ratio, multiplied by the aggregate amount available to be drawn on the letters of credit, and a 0.15% fronting fee payable to the administrative agent. In addition, we incur a commitment fee on the unused portion of the credit agreement at a rate of 0.375% to 0.50% per annum, depending on the Consolidated Leverage Ratio. Borrowings on the line of credit are collateralized by all of our unsecured assets.
Our credit agreement requires us to maintain certain minimum financial ratios and contains certain restrictive provisions, including among others, restrictions on making loans, investments and advances, incurring additional indebtedness, guaranteeing indebtedness, creating liens, and selling or assigning stock. As of and for the year ended December 31, 2011, we are in compliance with respect to all covenants contained in the credit agreement. The credit agreement expires in July 2016.
At December 31, 2011, we had borrowed $137.0 million at a variable interest rate of LIBOR plus 2.75% (3.03% at December 31, 2011). In addition, we had outstanding letters of credit of approximately $26.3 million at a fixed interest rate of 2.75% at December 31, 2011. We had not used $136.7 million of the borrowing availability at December 31, 2011. During the three month period ending December 31, 2011, we had average borrowings outstanding of approximately $126.9 million in relation to this credit agreement.
90
Table of Contents
Off-Balance Sheet Arrangements
In the normal course of business, we are a party to off-balance sheet arrangements that include guarantees and financial instruments with off-balance sheet risk, such as bank letters of credit and surety bonds. No liabilities related to these arrangements are reflected in our consolidated balance sheet, and we do not expect any material adverse effects on our financial condition, results of operations or cash flows to result from these off-balance sheet arrangements.
Federal and state laws require us to secure certain long-term obligations related to mine closure and reclamation costs. We typically secure these obligations by using surety bonds, an off-balance sheet instrument. The use of surety bonds is less expensive for us than the alternative of posting a 100% cash bond or a bank letter of credit, either of which would require a greater use of our credit agreement. We then use bank letters of credit to secure our surety bonding obligations as a lower cost alternative than securing those bonds with a committed bonding facility pursuant to which we are required to provide bank letters of credit in an amount of up to 25% of the aggregate bond liability. To the extent that surety bonds become unavailable, we would seek to secure our reclamation obligations with letters of credit, cash deposits or other suitable forms of collateral.
As of December 31, 2011, we had $26.3 million in letters of credit outstanding, of which $21.3 million served as collateral for surety bonds.
Contractual Obligations
The following table summarizes by period the payments due for our estimated contractual obligations as of December 31, 2011:
| | | | | | | | | | | | | | | | |
| | Payments Due by Period | |
|---|
| | Total | | Less than
1 Year | | 1 - 3 Years | | 4 - 5 Years | | More than
5 Years | |
|---|
| |
| |
| | (in thousands)
| |
| |
| |
|---|
Long-term debt obligations (including interest)(1) | | | 143,098 | | $ | 1,265 | | $ | 2,059 | | $ | 137,503 | | $ | 2,271 | |
Asset retirement obligations | | | 34,113 | | | 3,192 | | | 8,168 | | | 2,220 | | | 20,533 | |
Operating lease obligations(2) | | | 2,196 | | | 1,167 | | | 984 | | | 45 | | | — | |
Capital expenditure obligations | | | 12,181 | | | 12,181 | | | — | | | — | | | — | |
Diesel fuel obligations | | | 13,958 | | | 13,958 | | | — | | | — | | | — | |
Ammonia nitrate obligations | | | 4,302 | | | 4,302 | | | — | | | — | | | — | |
Advance royalties(3) | | | 4,601 | | | 436 | | | 917 | | | 928 | | | 2,320 | |
Retiree medical obligations | | | 5,621 | | | 157 | | | 537 | | | 916 | | | 4,011 | |
| | | | | | | | | | | | |
Total | | $ | 220,070 | | $ | 36,658 | | $ | 12,665 | | $ | 141,612 | | $ | 29,135 | |
| | | | | | | | | | | | |
- (1)
- Assumes a current LIBOR of 0.28% plus the applicable margin for all periods.
- (2)
- Some of our surface mining equipment and a coal handling and loading facility are categorized as operating leases. These leases have maturity dates ranging from one month to five years.
- (3)
- We have obligations on various coal and land leases to prepay certain amounts which are recoupable in future years when mining occurs
Critical Accounting Policies and Estimates
Our financial statements are prepared in accordance with accounting principles that are generally accepted in the United States. The preparation of these financial statements requires management to make estimates and judgments that affect the reported amount of assets, liabilities, revenues and
91
Table of Contents
expenses as well as the disclosure of contingent assets and liabilities. Management evaluates its estimates and judgments on an on-going basis. Management bases its estimates and judgments on historical experience and other factors that are believed to be reasonable under the circumstances. Nevertheless, actual results may differ from the estimates used and judgments made. Note 2 to the audited consolidated financial statements included elsewhere in this report provides a summary of all significant accounting policies and refer to Note 12 for information on our postretirement plan. We believe that of these significant accounting policies, the following may involve a higher degree of judgment or complexity.
Operating Environment and Risk Factors
We, in the course of our business activities, are exposed to a number of risks, including: fluctuating market conditions of coal, truck and rail transportation, fuel costs, changing government regulations, unexpected maintenance and equipment failure, employee benefits cost control, changes in estimates of proven and probable coal reserves, as well as the ability of us to maintain adequate financing, necessary mining permits and control of sufficient recoverable coal properties. In addition, adverse weather and geological conditions may increase mining costs, sometimes substantially.
Investment in Joint Venture
Investments in other entities are accounted for using the consolidation, equity method or cost basis depending upon the level of ownership, our ability to exercise significant influence over the operating and financial policies of the investee and whether we are determined to be the primary beneficiary of a variable interest in an entity. Equity investments are recorded at original cost and adjusted periodically to recognize our proportionate share of the investees' net income or losses after the date of investment. Any losses from our equity method investment are absorbed by us based upon our proportionate ownership percentage. If losses are incurred that exceed our investment in the equity method entity, then we must continue to record our proportionate share of losses in excess of our investment. Investments are written down only when there is clear evidence that a decline in value that is other than temporary has occurred.
In May 2008, we entered into a joint venture, Rhino Eastern, with an affiliate of Patriot to acquire the Rhino Eastern mining complex. To initially capitalize the joint venture, we contributed approximately $16.1 million for a 51% ownership interest in the joint venture, and we account for the investment in the joint venture and its results of operations under the equity method. We consider the operations of this entity to comprise a reporting segment ("Eastern Met") and have provided supplemental detail related to this operation in Note 20 to the audited consolidated financial statements that are included elsewhere in this report.
In determining that we were not the primary beneficiary of the variable interest entity for the years ended December 31, 2011, 2010 and 2009, we performed a qualitative and quantitative based on the controlling economic interests of the joint venture. This included an analysis of the expected economic contributions of the joint venture. We concluded that we are not the primary beneficiary of the joint venture primarily because of certain contractual arrangements by the joint venture with Patriot. Mandatory pro rata additional contributions not to exceed $10 million in the aggregate could be required of the joint venture partners, which we would be obligated to fund based upon our 51% ownership interest.
As of December 31, 2011 and 2010, we have recorded our equity method investment of $18.7 as a long-term asset. We had not provided any additional contractually required support as of December 31, 2011; however, as disclosed in Note 18 to the audited consolidated financial statements that are included elsewhere in this report, we had provided a loan to the joint venture based upon our ownership share in the amount of $0.4 million as of December 31, 2009 that was fully repaid as of
92
Table of Contents
December 31, 2010. Additionally, we provided loans to the joint venture based upon our ownership share during 2011 that totaled approximately $5.8 million that were fully repaid as of December 31, 2011.
Concentrations of Credit Risk
We do not require collateral or other security on accounts receivable. Credit risk is controlled through credit approvals and monitoring procedures. Please read Note 16 to the audited consolidated financial statements included elsewhere in this report for a discussion of major customers.
Property, Plant and Equipment
Property, plant, and equipment, including coal properties, mine development costs and construction costs, are recorded at cost, which includes construction overhead and interest, where applicable. Expenditures for major renewals and betterments are capitalized, while expenditures for maintenance and repairs are expensed as incurred. Mining and other equipment and related facilities are depreciated using the straight-line method based upon the shorter of estimated useful lives of the assets or the estimated life of each mine. Coal properties are depleted using the units-of-production method, based on estimated proven and probable reserves. Mine development costs are amortized using the units-of-production method, based on estimated proven and probable reserves. Gains or losses arising from sales or retirements are included in current operations.
On March 30, 2005, the Financial Accounting Standards Board (FASB) ratified the consensus reached by the Emerging Issues Task Force, or EITF, on accounting for stripping costs in the mining industry. This accounting guidance applies to stripping costs incurred in the production phase of a mine for the removal of overburden or waste materials for the purpose of obtaining access to coal that will be extracted. Under the guidance, stripping costs incurred during the production phase of the mine are variable production costs that are included in the cost of inventory produced and extracted during the period the stripping costs are incurred. We have recorded stripping costs for all of our surface mines incurred during the production phase as variable production costs that are included in the cost of inventory produced. We define a surface mine as a location where we utilize operating assets necessary to extract coal, with the geographic boundary determined by property control, permit boundaries, and/or economic threshold limits. Multiple pits that share common infrastructure and processing equipment may be located within a single surface mine boundary, which can cover separate coal seams that typically are recovered incrementally as the overburden depth increases. In accordance with the accounting guidance for extractive mining activities, we define a mine in production as one from which saleable minerals have begun to be extracted (produced) from an ore body, regardless of the level of production; however, the production phase does not commence with the removal of de minimis saleable mineral material that occurs in conjunction with the removal of overburden or waste material for the purpose of obtaining access to an ore body. We capitalize only the development cost of the first pit at a mine site that may include multiple pits.
Asset Impairments
We follow the accounting guidance on the impairment or disposal of property, plant and equipment, which requires that projected future cash flows from use and disposition of assets be compared with the carrying amounts of those assets when potential impairment is indicated. When the sum of projected undiscounted cash flows is less than the carrying amount, impairment losses are recognized. In determining such impairment losses, we must determine the fair value for the assets in question in accordance with the applicable fair value accounting guidance. Once the fair value is determined, the appropriate impairment loss must be recorded as the difference between the carrying amount of the assets and their respective fair values. Also, in certain situations, expected mine lives are shortened because of changes to planned operations. When that occurs and it is determined that the
93
Table of Contents
mine's underlying costs are not recoverable in the future, reclamation and mine closing obligations are accelerated and the mine closing accrual is increased accordingly. To the extent it is determined that asset carrying values will not be recoverable during a shorter mine life, a provision for such impairment is recognized. We recorded an impairment loss of $0.7 million in 2010 related to certain assets that are to be disposed of by sale. Please read Note 6 to the audited consolidated financial statements included elsewhere in this report for a discussion of this asset impairment loss recorded in 2010. There were no impairment losses recorded during the years ended December 31, 2011 and 2009.
Asset Retirement Obligations
The accounting guidance for asset retirement obligations addresses asset retirement obligations that result from the acquisition, construction, or normal operation of long-lived assets. This guidance requires companies to recognize asset retirement obligations at fair value when the liability is incurred or acquired. Upon initial recognition of a liability, an amount equal to the liability is capitalized as part of the related long-lived asset and allocated to expense over the useful life of the asset. We have recorded the asset retirement costs in coal properties.
We estimate our future cost requirements for reclamation of land where we have conducted surface and underground mining operations, based on our interpretation of the technical standards of regulations enacted by the U.S. Office of Surface Mining, as well as state regulations. These costs relate to reclaiming the pit and support acreage at surface mines and sealing portals at underground mines. Other reclamation costs are related to refuse and slurry ponds, as well as holding and related termination or exit costs.
We expense contemporaneous reclamation which is performed prior to final mine closure. The establishment of the end of mine reclamation and closure liability is based upon permit requirements and requires significant estimates and assumptions, principally associated with regulatory requirements, costs and recoverable coal reserves. Annually, we review our end of mine reclamation and closure liability and make necessary adjustments, including mine plan and permit changes and revisions to cost and production levels to optimize mining and reclamation efficiency. When a mine life is shortened due to a change in the mine plan, mine closing obligations are accelerated, the related accrual is increased and the related asset is reviewed for impairment, accordingly.
The adjustments to the liability from annual recosting reflect changes in expected timing, cash flow, and the discount rate used in the present value calculation of the liability. Changes in the asset retirement obligations for the year ended December 31, 2011 were calculated with discount rates that ranged from 4.2% to 7.0% depending upon the timing of the cash flows of the specific obligations. The discount rates changed from previous years due to changes in applicable market indicators that are used to arrive at an appropriate discount rate. Changes in the asset retirement obligations for the years ended December 31, 2010 and 2009 were calculated with a discount rate of 7.5% and 10%, respectively. Other recosting adjustments to the liability are made annually based on inflationary cost increases or decreases and changes in the expected operating periods of the mines. The related inflation rate utilized in the recosting adjustments was 2.5% for 2011 and 3.0% for 2010 and 2009.
Workers' Compensation Benefits
Certain of our subsidiaries are liable under federal and state laws to pay workers' compensation and coal workers' pneumoconiosis ("black lung") benefits to eligible employees, former employees and their dependents. We currently utilize an insurance program and state workers' compensation fund participation to secure our on-going obligations depending on the location of the operation. Premium expense for workers' compensation benefits is recognized in the period in which the related insurance coverage is provided.
94
Table of Contents
Revenue Recognition
Most of our revenues are generated under supply contracts with electric utilities, industrial companies or other coal-related organizations, primarily in the eastern United States. Revenue is recognized and recorded when shipment or delivery to the customer has occurred, prices are fixed or determinable and the title or risk of loss has passed in accordance with the terms of the supply contract. Under the typical terms of these contracts, risk of loss transfers to the customers at the mine or port, when the coal is loaded on the rail, barge, truck or other transportation source that delivers coal to its destination. Advance payments are deferred and recognized in revenue as coal is shipped and title has passed.
Coal revenues also result from the sale of brokered coal produced by others. The revenues related to brokered coal sales are included in coal revenues on a gross basis and the corresponding cost of the coal from the supplier is recorded in cost of coal sales in accordance with the revenue recognition accounting guidance on principal agent considerations.
Freight and handling costs paid directly to third-party carriers and invoiced to coal customers are recorded as freight and handling costs and freight and handling revenues, respectively.
Other revenues generally consist of coal royalty revenues, limestone sales, coal handling and processing, rebates and rental income. Coal royalty revenues are recognized on the basis of tons of coal sold by our lessees and the corresponding gross revenues from those sales. The leases are based on (1) minimum monthly or annual payments, (2) a minimum dollar royalty per ton and/or a percentage of the gross sales price, or (3) a combination of both. Coal royalty revenues are recorded from royalty reports submitted by the lessee, which are reconciled and subject to audit by us. Most of our lessees are required to make minimum monthly or annual royalty payments that are recoupable over certain time periods, generally two years. If tonnage royalty revenues do not meet the required minimum amount, the difference is paid as a deficiency. These deficiency payments received are recognized as an unearned revenue liability because they are generally recoupable over certain time periods. When a lessee recoups a deficiency payment through production, the recouped amount is deducted from the unearned revenue liability and added to revenue attributable to the coal royalty revenue in the current period. If a lessee does not recoup a deficiency paid during the allocated time period, the recoupment right lost becomes revenue in the current period and is deducted from the liability.
With respect to other revenues recognized in situations unrelated to the shipment of coal, we carefully review the facts and circumstances of each transaction and do not recognize revenue until the following criteria are met: persuasive evidence of an arrangement exists, delivery has occurred or services have been rendered, the seller's price to the buyer is fixed or determinable and collectibility is reasonably assured. Advance payments received are deferred and recognized in revenue when earned.
Derivative Financial Instruments
We use diesel fuel forward contracts to manage the risk of fluctuations in the cost of diesel fuel. Our diesel fuel forward contracts qualify for the normal purchase normal sale, or NPNS, exception prescribed by the accounting guidance on derivatives and hedging, based on the terms of the contracts and management's intent and ability to take physical delivery of the diesel fuel.
Income Taxes
We are considered a partnership for income tax purposes. Accordingly, the partners report our taxable income or loss on their individual tax returns.
Recent Accounting Pronouncements
In December 2010, the FASB published ASU No. 2010-29, "Disclosure of Supplementary Pro Forma Information for Business Combinations". The accounting guidance on business combinations
95
Table of Contents
requires a public entity to disclose pro forma information for business combinations that occurred in the current reporting period. The disclosures include pro forma revenue and earnings of the combined entity for the current reporting period as though the acquisition date for all business combinations that occurred during the year had been as of the beginning of the annual reporting period. If comparative financial statements are presented, the pro forma revenue and earnings of the combined entity for the comparable prior reporting period should be reported as though the acquisition date for all business combinations that occurred during the current year had been as of the beginning of the comparable prior annual reporting period. ASU No. 2010-29 specifies that if a public entity presents comparative financial statements, the entity should disclose revenue and earnings of the combined entity as though the business combination(s) that occurred during the current year had occurred as of the beginning of the comparable prior annual reporting period only. The amendments in ASU No. 2010-29 also expand the supplemental pro forma disclosures under business combination accounting to include a description of the nature and amount of material, nonrecurring pro forma adjustments directly attributable to the business combination included in the reported pro forma revenue and earnings. ASU No. 2010-29 is effective prospectively for business combinations for which the acquisition date is on or after the beginning of the first annual reporting period beginning on or after December 15, 2010. We have adopted the provisions of ASU No. 2010-29 effective January 1, 2011.
In September 2011, the FASB published ASU No. 2011-08, "Intangibles—Goodwill and Other (Topic 350) Testing Goodwill for Impairment". Under the amendments in this ASU, an entity has the option to first assess qualitative factors to determine whether the existence of events or circumstances leads to a determination that it is more likely than not that the fair value of a reporting unit is less than its carrying amount. If, after assessing the totality of events or circumstances, an entity determines it is not more likely than not that the fair value of a reporting unit is less than its carrying amount, then performing the two-step goodwill impairment test is unnecessary. However, if an entity concludes otherwise, then it is required to perform the first step of the two-step goodwill impairment test by calculating the fair value of the reporting unit and comparing the fair value with the carrying amount of the reporting unit. If the carrying amount of a reporting unit exceeds its fair value, then the entity is required to perform the second step of the goodwill impairment test to measure the amount of the impairment loss, if any. Under the amendments in this ASU, an entity has the option to bypass the qualitative assessment for any reporting unit in any period and proceed directly to performing the first step of the two-step goodwill impairment test. An entity may resume performing the qualitative assessment in any subsequent period. The ASU is effective for annual and interim goodwill impairment tests performed for fiscal years beginning after December 15, 2011 and early adoption is permitted. We are evaluating the provisions of the ASU, but we do not believe this new accounting guidance will have a material effect on our financial results.
In June 2011, the FASB published ASU No. 2011-05, "Comprehensive Income (Topic 220): Presentation of Comprehensive Income". Under the amendments in this ASU, an entity has the option to present the total of comprehensive income, the components of net income, and the components of other comprehensive income either in a single continuous statement of comprehensive income or in two separate but consecutive statements. In both choices, an entity is required to present each component of net income along with total net income, each component of other comprehensive income along with a total for other comprehensive income, and a total amount for comprehensive income. In a single continuous statement, the entity is required to present the components of net income and total net income, the components of other comprehensive income and a total for other comprehensive income, along with the total of comprehensive income in that statement. In the two-statement approach, an entity is required to present components of net income and total net income in the statement of net income. The statement of other comprehensive income should immediately follow the statement of net income and include the components of other comprehensive income and a total for other comprehensive income, along with a total for comprehensive income. Regardless of whether an entity chooses to present comprehensive income in a single continuous statement or in two separate but
96
Table of Contents
consecutive statements, the entity is required to present on the face of the financial statements reclassification adjustments for items that are reclassified from other comprehensive income to net income in the statement(s) where the components of net income and the components of other comprehensive income are presented. The amendments in this ASU do not change the items that must be reported in other comprehensive income or when an item of other comprehensive income must be reclassified to net income. The amendments do not change the option for an entity to present components of other comprehensive income either net of related tax effects or before related tax effects, with one amount shown for the aggregate income tax expense or benefit related to the total of other comprehensive income items. In both cases, the tax effect for each component must be disclosed in the notes to the financial statements or presented in the statement in which other comprehensive income is presented. The amendments do not affect how earnings per share is calculated or presented. For public entities, the amendments of this ASU are effective for fiscal years, and interim periods within those years, beginning after December 15, 2011.
Subsequently, in December 2011, the FASB issued ASU No. 2011-12, "Comprehensive Income (Topic 220): Deferral of the Effective Date for Amendments to the Presentation of Reclassifications of Items Out of Accumulated Other Comprehensive Income in Accounting Standards Update No. 2011-05". In order to defer only those changes in Update 2011-05 that relate to the presentation of reclassification adjustments, the paragraphs in this ASU supersede certain pending paragraphs in ASU 2011-05. The amendments are being made to allow the FASB time to re-deliberate whether to present on the face of the financial statements the effects of reclassifications out of accumulated other comprehensive income on the components of net income and other comprehensive income for all periods presented. While the FASB is considering the operational concerns about the presentation requirements for reclassification adjustments and the needs of financial statement users for additional information about reclassification adjustments, entities should continue to report reclassifications out of accumulated other comprehensive income consistent with the presentation requirements in effect before ASU 2011-05. All other requirements in ASU 2011-05 are not affected by this ASU 2011-12, including the requirement to report comprehensive income either in a single continuous financial statement or in two separate but consecutive financial statements. Public entities should apply these requirements for fiscal years, and interim periods within those years, beginning after December 15, 2011. We have consistently presented comprehensive income in a single continuous statement with net income, so the provisions of ASU 2011-05 and the related deferral included in ASU 2011-12 are not expected to have a material effect on us.
Item 7A. Quantitative and Qualitative Disclosures About Market Risk
Market risk is the risk of loss arising from adverse changes in market rates and prices. The principal market risks to which we are exposed are commodity risk and interest rate risk.
Commodity Price Risk
We manage our commodity price risk for coal sales through the use of supply contracts and the use of forward contracts.
Some of the products used in our mining activities, such as diesel fuel, explosives and steel products for roof support used in our underground mining, are subject to price volatility. Through our suppliers, we utilize forward purchases to manage the exposure related to this volatility. A hypothetical increase of $0.10 per gallon for diesel fuel would have reduced net income by $0.7 million for the year ended December 31, 2011. A hypothetical increase of 10% in steel prices would have reduced net income by $1.5 million for the year ended December 31, 2011. A hypothetical increase of 10% in explosives prices would have reduced net income by $0.6 million for the year ended December 31, 2011.
97
Table of Contents
Interest Rate Risk
We have exposure to changes in interest rates on our indebtedness associated with our credit agreement. A hypothetical increase or decrease in interest rates by 1% would have changed our interest expense by $0.9 million for the year ended December 31, 2011.
Item 8. Financial Statements and Supplementary Data.
The Report of Independent Registered Public Accounting Firm, Consolidated Financial Statements and supplementary financial data required for this Item are set forth on pages F-1 through F-31 of this report and are incorporated herein by reference.
Item 9. Changes in and Disagreements with Accountants on Accounting and Financial Disclosure.
None.
Item 9A. Controls and Procedures.
- (a)
- Disclosure Controls and Procedures.
Our principal executive officer (CEO) and principal financial officer (CFO) undertook an evaluation of our disclosure controls and procedures as of the end of the period covered by this report. The CEO and CFO have concluded that our controls and procedures were effective as of December 31, 2011. For purposes of this section, the term "disclosure controls and procedures" means controls and other procedures of an issuer that are designed to ensure that information required to be disclosed by the issuer in the reports that it files or submits under the Exchange Act is recorded, processed, summarized and reported, within the time periods specified in SEC's rules and forms. Disclosure controls and procedures include, without limitation, controls and procedures designed to ensure that information required to be disclosed by an issuer in the reports that it files or submits under the Exchange Act is accumulated and communicated to the issuer's management, including its principal executive and principal financial officers, or persons performing similar functions, as appropriate to allow timely decisions regarding required disclosure.
- (b)
- Management's Report on Internal Control over Financial Reporting.
Our management is responsible for establishing and maintaining adequate internal control over financial reporting, as such term is defined in Exchange Act Rule 13a-15(f). Under the supervision and with the participation of our management, including the CEO and CFO, we conducted an evaluation of the effectiveness of our internal control over financial reporting based upon the framework in Internal Control-Integrated Framework issued by the Committee of Sponsoring Organizations of the Treadway Commission. Based on our evaluation under this framework, our management concluded that our internal control over financial reporting was effective as of December 31, 2011. The effectiveness of our internal control over financial reporting as of December 31, 2011 has been audited by Deloitte & Touche LLP, an independent registered public accounting firm, as stated in their report appearing on page F-2.
In June 2011, we completed our acquisition of Elk Horn. While management does not expect significant changes to our financial reporting processes and related internal controls as a result of the Elk Horn acquisition, it will take time for us to fully complete the integration of Elk Horn's information systems and personnel with ours. Integration efforts are continuing as of December 31, 2011. We have excluded Elk Horn's internal controls over financial reporting for fiscal year 2011 from our assessment of and conclusion on the effectiveness of our internal controls over financial reporting. Elk Horn constituted 38% and 23% of net and total assets, respectively, 4% of revenues, and 20% of net income of our consolidated financial statement amounts as of and for the year ended December 31, 2011.
98
Table of Contents
- (c)
- Changes in Internal Control Over Financial Reporting.
There have been no changes in our internal control over financial reporting (as defined in Rule 13a-15(f) under the Exchange Act) that occurred during our last fiscal quarter that have materially affected or are reasonably likely to materially affect our internal control over financial reporting.
REPORT OF INDEPENDENT REGISTERED PUBLIC ACCOUNTING FIRM
To the Board of Directors of
The Managing General Partner
And the Partners of
Rhino Resource Partners LP
Lexington, Kentucky
We have audited the internal control over financial reporting of Rhino Resource Partners LP and subsidiaries (the "Partnership") as of December 31, 2011, based on criteria established inInternal Control—Integrated Framework issued by the Committee of Sponsoring Organizations of the Treadway Commission. As described in Management's Report on Internal Control over Financial Reporting, management excluded from its assessment the internal control over financial reporting at The Elk Horn Coal Company ("Elk Horn"), which was acquired on June 10, 2011 and whose financial statements constitute 38% and 23% of net and total assets, respectively, 4% of revenues, and 20% of net income of the consolidated financial statement amounts as of and for the year ended December 31, 2011. Accordingly, our audit did not include the internal control over financial reporting at Elk Horn. The Partnership's management is responsible for maintaining effective internal control over financial reporting and for its assessment of the effectiveness of internal control over financial reporting, included in the accompanying Management's Report on Internal Control over Financial Reporting. Our responsibility is to express an opinion on the Company's internal control over financial reporting based on our audit.
We conducted our audit in accordance with the standards of the Public Company Accounting Oversight Board (United States). Those standards require that we plan and perform the audit to obtain reasonable assurance about whether effective internal control over financial reporting was maintained in all material respects. Our audit included obtaining an understanding of internal control over financial reporting, assessing the risk that a material weakness exists, testing and evaluating the design and operating effectiveness of internal control based on the assessed risk, and performing such other procedures as we considered necessary in the circumstances. We believe that our audit provides a reasonable basis for our opinion.
A company's internal control over financial reporting is a process designed by, or under the supervision of, the company's principal executive and principal financial officers, or persons performing similar functions, and effected by the company's board of directors, management, and other personnel to provide reasonable assurance regarding the reliability of financial reporting and the preparation of financial statements for external purposes in accordance with generally accepted accounting principles. A company's internal control over financial reporting includes those policies and procedures that (1) pertain to the maintenance of records that, in reasonable detail, accurately and fairly reflect the transactions and dispositions of the assets of the company; (2) provide reasonable assurance that transactions are recorded as necessary to permit preparation of financial statements in accordance with generally accepted accounting principles, and that receipts and expenditures of the company are being made only in accordance with authorizations of management and directors of the company; and (3) provide reasonable assurance regarding prevention or timely detection of unauthorized acquisition, use, or disposition of the company's assets that could have a material effect on the financial statements.
Because of the inherent limitations of internal control over financial reporting, including the possibility of collusion or improper management override of controls, material misstatements due to
99
Table of Contents
error or fraud may not be prevented or detected on a timely basis. Also, projections of any evaluation of the effectiveness of the internal control over financial reporting to future periods are subject to the risk that the controls may become inadequate because of changes in conditions, or that the degree of compliance with the policies or procedures may deteriorate.
In our opinion, the Partnership maintained, in all material respects, effective internal control over financial reporting as of December 31, 2011, based on the criteria established inInternal Control—Integrated Framework issued by the Committee of Sponsoring Organizations of the Treadway Commission.
We have also audited, in accordance with the standards of the Public Company Accounting Oversight Board (United States), the consolidated financial statements as of and for the year ended December 31, 2011 of the Partnership and our report dated March 15, 2012 expressed an unqualified opinion on those financial statements.
/s/DELOITTE & TOUCHE LLP
Cincinnati, Ohio
March 15, 2012
Item 9B. Other Information.
None.
PART III
Item 10. Directors, Executive Officers and Corporate Governance.
Management of Rhino Resource Partners LP
We are managed and operated by the board of directors and executive officers of our general partner, Rhino GP LLC. Employees of our general partner devote substantially all of their time and effort to our business. As a result of owning our general partner, Wexford has the right to appoint all members of the board of directors of our general partner, including the independent directors. Our unitholders are not entitled to elect our general partner or its directors or otherwise directly participate in our management or operation. Our general partner owes certain fiduciary duties to our unitholders as well as a fiduciary duty to its owners. Our general partner will be liable, as general partner, for all of our debts (to the extent not paid from our assets), except for indebtedness or other obligations that are made specifically nonrecourse to it. Our general partner, therefore, may cause us to incur indebtedness or other obligations that are nonrecourse.
Our general partner has nine directors, three of whom, Messrs. Plaumann, Lambert and Tompkins are independent as defined under the independence standards established by the NYSE and the Exchange Act. The NYSE does not require a publicly traded limited partnership, like us, to have a majority of independent directors on the board of directors of our general partner or to establish a compensation committee or a nominating/corporate governance committee. We are, however, required to have an audit committee of at least three members, and all of its members are required to be independent as defined by the NYSE and the Exchange Act.
When evaluating a candidate's suitability for a position on the board, Wexford assesses whether such candidate possesses the integrity, judgment, knowledge, experience, skill and expertise that are likely to enhance the board's ability to manage and direct our affairs and business, including, when applicable, to enhance the ability of committees of the board to fulfill their duties.
100
Table of Contents
Executive Officers and Directors
The following table shows information for the executive officers and directors of our general partner as of December 31, 2011:
| | | | | |
Name | | Age
(as of 12/31/2011) | | Position With Our General Partner |
|---|
Mark D. Zand* | | | 58 | | Chairman of the Board of Directors |
David G. Zatezalo | | | 56 | | President, Chief Executive Officer and Director |
Richard A. Boone | | | 57 | | Senior Vice President and Chief Financial Officer |
Christopher N. Moravec** | | | 55 | | Executive Vice President |
Andrew W. Cox | | | 55 | | Vice President of Sales |
Reford C. Hunt | | | 38 | | Vice President of Technical Services |
Joseph R. Miller | | | 36 | | Vice President, Secretary and General Counsel |
Jay L. Maymudes* | | | 50 | | Director |
Arthur H. Amron* | | | 55 | | Director |
Kenneth A. Rubin* | | | 57 | | Director |
Joseph M. Jacobs* | | | 58 | | Director |
Mark L. Plaumann*** | | | 56 | | Director |
Douglas Lambert*** | | | 54 | | Director |
James F. Tompkins*** | | | 63 | | Director |
- *
- Principal of Wexford Capital.
- **
- Mr. Moravec's last day of employment with the general partner was March 2, 2012 .
- ***
- Independent director.
Mark D. Zand. Mr. Zand has served as the Chairman of our general partner's board of directors since January 2010 and serves as a member of our general partner's compensation committee. He is a partner of Wexford Capital. Mr. Zand joined Wexford Capital in 1996 and became a partner in 2001. He is involved in fixed income and distressed securities research and trading, and in public and private equity investing. Mr. Zand has been actively involved with Wexford Capital's coal investments since its inception. Mr. Zand was selected to serve as a director due to his in-depth knowledge of our business, including our strategies, operations, finances and markets, as well as his significant knowledge of the coal industry. Since our inception, Mr. Zand has been an integral part of our growth and expansion and we believe he will continue to provide valuable guidance to the board of directors of our general partner. In addition, he has served on the boards and creditors' committees of a number of private companies.
David G. Zatezalo. Mr. Zatezalo has served as President and Chief Executive Officer of our general partner since May 2010, as well as a director of our general partner since July 2010. He has served as President and Chief Executive Officer of Rhino Energy LLC since September 2009. From March 2007 to September 2009, Mr. Zatezalo served as Chief Operating Officer of Rhino Energy LLC. Prior to March 2007, Mr. Zatezalo served as President of our subsidiary Hopedale Mining LLC. Prior to joining Rhino Energy LLC, Mr. Zatezalo served as President of AEP's various Appalachian Mining Operations and as General Manager of Windsor Coal Company from 1998 to May 2004. He previously served as General Manager of the Cliff Collieries and Manager of Underground Development in the Bowen Basin of Queensland for BHP Australia Coal. Additionally, Mr. Zatezalo has served as Chairman of the Ohio Coal Association and is currently a member of the executive committee of the Kentucky Coal Association. In total, Mr. Zatezalo has approximately 38 years of experience in the coal
101
Table of Contents
industry. Mr. Zatezalo was selected to be a director of our general partner due to his extensive background and familiarity with the coal industry and his leadership position as President and Chief Executive Officer.
Richard A. Boone. Mr. Boone has served as Senior Vice President and Chief Financial Officer of our general partner since May 2010, and as Senior Vice President and Chief Financial Officer of Rhino Energy LLC since February 2005. Prior to joining Rhino Energy LLC, he served as Vice President and Corporate Controller of PinnOak Resources, LLC, a coal producer serving the steel making industry, since 2003. Prior to joining PinnOak Resources, LLC, he served as Vice President, Treasurer and Corporate Controller of Horizon Natural Resources Company, a producer of steam and metallurgical coal, since 1998. In total, Mr. Boone has approximately 31 years of experience in the coal industry.
Christopher N. Moravec. Mr. Moravec has served as Executive Vice President of our general partner since May 2010 and as Executive Vice President of Rhino Energy LLC since April 2010, prior to which he served as Senior Vice President of Business Development of Rhino Energy LLC beginning in March 2007 and President of Kentucky Operations beginning in September 2009. Mr. Moravec also oversaw our sales efforts and was a board member of our Rhino Eastern joint venture. Prior to joining Rhino Energy LLC, he was employed by PNC Bank for more than 22 years, most recently serving as Senior Vice President and Managing Director, where he was responsible for providing investment and commercial banking services primarily to the domestic coal industry. In total, Mr. Moravec has approximately 36 years of experience in the coal industry. Mr. Moravec tendered his resignation of employment with the general partner on February 15, 2012. Mr. Moravec tendered his resignation to pursue other opportunities and this decision was not the result of any disagreement with us. Mr. Moravec entered into a consulting arrangement with the general partner that commenced immediately upon his final day of employment, which was March 2, 2012.
Andrew W. Cox. Mr. Cox has served as our general partner's and Rhino Energy LLC's Vice President of Sales since May 2010 and January 2007, respectively. Prior to joining Rhino Energy LLC, he was Sales Director for Coal Marketing Company (USA) Inc., a wholly owned subsidiary of CMC Ltd., a Dublin, Ireland based coal sales company which sells and markets coal from Colombia, South America. Prior to joining CMC Ltd. in September 2004, he was a Vice President with AMVEST Coal Sales Company and also held various sales and marketing positions with Cumberland River Energies Inc., Mingo Logan Coal Company, Old Ben Coal Company and NERCO Coal Sales LLC. In total, Mr. Cox has approximately 30 years of experience in the coal industry.
Reford C. Hunt. Mr. Hunt has served as our general partner's Vice President of Technical Services since May 2010. Since April 2005 Mr. Hunt has served in various capacities with Rhino Energy LLC and its subsidiaries, including as Chief Engineer and Director of Operations. Mr. Hunt currently serves as Vice President of Technical Services of Rhino Energy LLC, a position he has held since August 2008, as President of Rhino Energy WV LLC and McClane Canyon Mining LLC since September 2009 and as President of Castle Valley Mining LLC since August 2010. Prior to joining Rhino Energy LLC, Mr. Hunt was employed by Sidney Coal Company, a subsidiary of Massey Energy Company, from 1997 to 2005. During his time at Sidney Coal Company as a Mining Engineer, he oversaw planning, engineering, and construction for various mining and preparation operations. In total, Mr. Hunt has approximately 15 years of experience in the coal industry.
Joseph R. Miller. Mr. Miller has served as our general partner's Vice President, Secretary and General Counsel since May 2010. From January 2007 until March 2009 he served as Rhino Energy LLC's Vice President and was also named Secretary and General Counsel in March 2009. Prior to joining Rhino Energy LLC, Mr. Miller practiced law with Frost Brown Todd in Lexington, Kentucky, from 2002 to 2007, with a substantial portion of his practice devoted to coal industry matters. Mr. Miller is a member of the Kentucky Bar Association.
102
Table of Contents
Joseph M. Jacobs. Mr. Jacobs has served as a director of our general partner since July 2010. Mr. Jacobs is the President of Wexford Capital, which he co-founded in 1994. From 1982 to 1994, Mr. Jacobs was employed by Bear Stearns & Co., Inc., where he attained the position of Senior Managing Director. From 1979 to 1982, he was employed as a commercial lending officer at Citibank, N.A. Mr. Jacobs served as a director for ICx Technologies, Inc. until August 2010, Republic Airways Holding Company until June 2008 and Azul S.A. until January 2010, and has served on the boards and creditors' committees of a number of public and private companies in which Wexford Capital has held investments. Mr. Jacobs holds an M.B.A. from Harvard Business School and a B.S. in Economics from the Wharton School of the University of Pennsylvania. Mr. Jacobs was selected to serve as a director due to his significant service on the boards of other public and private companies, which provides a thorough understanding of board roles and responsibilities and widespread knowledge of various industries, businesses, operations, opportunities and risks. Mr. Jacobs' current position as President of Wexford Capital also provides a comprehensive knowledge of management strategy and policy.
Jay L. Maymudes. Mr. Maymudes has served as a director of our general partner since January 2010 and serves as a member of our general partner's compensation committee. He joined Wexford Capital in 1994 and became a partner in 1997 and serves as Wexford Capital's Chief Financial Officer. Mr. Maymudes is responsible for the financial, tax and reporting requirements of Wexford Capital and all of its private investment partnerships and its trading activities. Mr. Maymudes is a Certified Public Accountant. Mr. Maymudes was selected to serve as a director due to his credentials and qualifications in the area of public and financial accounting. Mr. Maymudes has particular skills in corporate finance, corporate governance, compliance, disclosure and compensation matters and has extensive experience in capital market transactions, which we believe provides valuable expertise and insight to the board of directors of our general partner. In addition, Mr. Maymudes has sat on the boards of a number of public and private companies.
Arthur H. Amron. Mr. Amron has served as a director of our general partner since January 2010. He joined Wexford Capital as General Counsel in 1994 and became a partner in 1999. Mr. Amron is responsible for legal and securities compliance and actively participates in various private equity transactions, particularly in the bankruptcy and restructuring areas. Mr. Amron was selected to serve as a director due to his experience with us, his background as a corporate and transactional lawyer and his familiarity with mergers and acquisitions transactions, public offerings, financings, and other capital markets and financial transactions, which we believe provides valuable expertise and insight to the board of directors of our general partner. In his capacity as Wexford Capital's General Counsel, Mr. Amron has been involved with us since our formation and is familiar with many of the transactions we have undertaken. In addition, Mr. Amron has served on the boards of other public and private companies in which Wexford Capital has invested.
Kenneth A. Rubin. Mr. Rubin has served as a director of our general partner since January 2010. He joined Wexford Capital in 1996 and became a partner in 2001 and serves as the portfolio manager of the Wexford Global Strategies Fund. Mr. Rubin focuses on investment grade and government fixed income investments. Mr. Rubin was selected to serve as a director due to his long-term experience in the capital and investment markets. Mr. Rubin brings to the board of directors of our general partner an understanding of our business, history and organization. Mr. Rubin has been on the boards of public and private companies.
Mark L. Plaumann. Mr. Plaumann has served as a director of our general partner, as the chair of our general partner's audit committee and as a member of our general partner's conflicts committee since October 2010. He is currently a Managing Member of Greyhawke Capital Advisors LLC, or Greyhawke, which he co-founded in 1998. Prior to founding Greyhawke, Mr. Plaumann was a Senior Vice President of Wexford Capital. Mr. Plaumann was formerly a Managing Director of Alvarez & Marsal, Inc. and the President of American Healthcare Management, Inc. He also earned the position of Senior Manager at Ernst & Young LLP. Mr. Plaumann holds an M.B.A. and a B.A. in Business from
103
Table of Contents
the University of Central Florida. Mr. Plaumann served as a director and audit committee chairman for ICx Technologies, Inc. until October 2010 and currently serves as a director and audit committee chairman of Republic Airways Holdings, Inc., and a director of one private company. Mr. Plaumann was selected to serve as a director of our general partner due to his significant financial and audit expertise. Mr. Plaumann's service on the boards of other public companies, including previous experience as chairman of audit committees, gives him a clear understanding of his role and responsibilities on our general partner's board of directors.
Douglas Lambert. Mr. Lambert has served as a director of our general partner and as a member of our general partner's audit committee and conflicts committee since October 2010. He is presently a Managing Director in the North American Restructuring Practice Group of Alvarez & Marsal Inc., a position he has held since November 2006, and has served as Chief Executive Officer of Legacy Asset Management Company, a wholly-owned subsidiary of Lehman Brothers Holdings, Inc. since May 2010. Mr. Lambert has been a director of Republic Airways Holdings, Inc., an airline holding company, since 2001. From 1994 to 2003, Mr. Lambert was a Senior Vice President of Wexford Capital. From 1983 to 1994, Mr. Lambert held various financial positions with Integrated Resources, Inc.'s Equipment Leasing Group, including Treasurer and Chief Financial Officer. Mr. Lambert is a member of the American Institute of Certified Public Accountants and the New York State Society of Certified Public Accountants. Mr. Lambert was chosen to serve as a director due to his strong and diverse financial and operational background in a variety of different businesses and industries.
James F. Tompkins. Mr. Tompkins has served as a director of our general partner and as a member of our general partner's audit committee and conflicts committee since October 2010. He is currently the President of JFT Consultants, LLC, a firm that provides consulting services to the coal and associated industries and which Mr. Tompkins founded in 1997. Prior to founding JFT Consultants, Mr. Tompkins served as a Vice President of the Southern Ohio Coal Company. Mr. Tompkins also worked in the mining industry in West Virginia, Nova Scotia, and Manitoba. Mr. Tompkins earned a Bachelor of Mining Engineering degree from Dalhousie University (DalTech) in 1971 and an M.A. in Interpersonal Communication from Ohio University in 1997. He is a member of the Ohio Chapter of the Society of Mining Engineers and a member of the Mining Society of Nova Scotia. Mr. Tompkins has served on several non-profit boards in southern Ohio. Mr. Tompkins was selected to serve as a director of our general partner due to his extensive operational and engineering expertise in the coal industry, as well as his financial experience.
Director Independence
The board of directors of our general partners has determined that each of Messrs. Plaumann, Lambert and Tompkins are independent as defined under the independence standards established by the NYSE and the Exchange Act. In evaluating director independence with respect to Mr. Plaumann and Mr. Lambert, the board of directors of our general partner considered the various relationships each of them has with Wexford Capital and its affiliates. Certain affiliated investment funds of Wexford Capital were the majority owners of ICx Technologies, Inc. until October 2010. As described above, Mr. Plaumann served as an independent director and audit committee chairman of ICx Technologies, Inc. until October 2010. In addition, as described below, both Mr. Plaumann and Mr. Lambert were former employees of Wexford Capital and continue to hold small interests in Wexford Capital private equity funds in connection with investments that were made at the time each of them was employed by Wexford Capital. Certain of these funds hold an interest in Rhino Energy Holdings LLC, which as of March 9, 2012, beneficially owns an aggregate 67% of our outstanding units. Mr. Plaumann's and Mr. Lambert's indirect beneficial interest in Rhino Energy Holdings LLC through these funds is immaterial. The board of directors of our general partner considered these relationships in light of the attributes it believes need to be possessed by independent-minded directors, including personal financial substance and a lack of economic dependence on us. The board of
104
Table of Contents
directors of our general partner concluded that each of Mr. Plaumann's and Mr. Lambert's relationships, rather than interfering with their ability to be independent from management, are consistent with the business and financial substance that make them qualified, independent directors.
Meetings; Committees of the Board of Directors
The board of directors of our general partner held quarterly meetings during the year ended December 31, 2011. All of the directors attended each meeting. The board of directors of our general partner has an audit committee, a conflicts committee and, although not required by the NYSE, a compensation committee.
The audit committee of our general partner has been established in accordance with Section 3(a)(58)(A) of the Exchange Act, and consists of Messrs. Plaumann, Lambert and Tompkins, all of whom are independent. The board of directors of our general partner has determined Mr. Plaumann is an "audit committee financial expert" within the meaning of the SEC rules. Our audit committee operates pursuant to a written charter, an electronic copy of which is available on our website at http://www.rhinolp.com. This committee oversees, reviews, acts on and reports to our board of directors of our general partner on various auditing and accounting matters, including: the selection of our independent accountants, the scope of our annual audits, fees to be paid to the independent accountants, the performance of our independent accountants and our accounting practices. In addition, the audit committee oversees our compliance programs relating to legal and regulatory requirements.
The compensation committee of our general partner consists of Messrs. Zand and Maymudes, and operates pursuant to a written charter. This committee establishes salaries, incentives and other forms of compensation for officers and other employees. The compensation committee also administers our incentive compensation and benefit plans.
Messrs. Plaumann, Lambert and Tompkins serve on the conflicts committee to review specific matters that the board believes may involve conflicts of interest and determine to submit to the conflicts committee for review. The conflicts committee will determine if the resolution of the conflict of interest is fair and reasonable to us. The members of the conflicts committee may not be directors, officers or employees of our general partner or any person controlling our general partner, including Wexford Capital, and must meet the independence standards established by the NYSE and the Exchange Act to serve on an audit committee of a board of directors, along with other requirements in our partnership agreement. Any matters approved by the conflicts committee will be conclusively deemed to be fair and reasonable to us, approved by all of our partners and not a breach by our general partner of any duties it may owe us or our unitholders.
Executive Sessions of Non-Management Directors; Procedure for Contacting the Board of Directors
The board of directors of our general partner has held regular executive sessions in which the three independent directors meet without any members of management present. The purpose of these executive sessions is to promote open and candid discussion among the independent directors. The rules of the NYSE require that one of the independent directors must preside over each executive session, and the role of presiding director is rotated among each of the independent directors.
105
Table of Contents
A means for interested parties to contact the Board of Directors (including the independent directors as a group) directly has been established in the general partner's Corporate Governance Guidelines, published on our website atwww.rhinolp.com. Information may be submitted confidentially and anonymously, although we may be obligated by law to disclose the information or identity of the person providing the information in connection with government or private legal actions and in certain other circumstances.
Code of Ethics
We have adopted a Code of Business Conduct and Ethics that applies to all of our officers, directors and employees. An electronic copy of the code is available on our website at http://www.rhinolp.com. For a discussion on what other corporate governance materials are posted on our website, see Part I, Item 1. "Business—Available Information."
Section 16(a) Beneficial Ownership Reporting Compliance
Section 16(a) of the Exchange Act requires directors, executive officer and persons who beneficially own more than 10% of a registered class of our equity securities to file with the SEC initial reports of ownership and reports or changes in ownership of such equity securities. Such persons are also required to furnish us with copies of all Section 16(a) forms that they file. Based upon a review of the copies of the forms furnished to us and written representations from certain reporting persons, we believe that, during the year ended December 31, 2011, except as described in the following, none of our executive officers, directors or beneficial owners of more than 10% of any class of registered equity security failed to file on a timely basis any such report, except as follows. The reports filed for the 2011 annual grant of restricted units to each of the non-employee directors of our general partner were filed after the due date. The units were awarded to Douglas Lambert, Mark L. Plaumann, James F. Tompkins and Wexford Capital (on behalf of the services of Joseph M. Jacobs, Mark D. Zand, Jay L. Maymudes, Arthur H. Amron and Kenneth A. Rubin, as directors). Mr. Tompkins also filed a report for open market purchases of common units made on a single trading day after the due date.
Item 11. Executive Compensation
Compensation Discussion and Analysis
Introduction
Our general partner has the sole responsibility for conducting our business and for managing our operations, and its board of directors and officers make decisions on our behalf. The compensation committee of the board of directors of our general partner determines the compensation of the directors and officers of our general partner, including its named executive officers. The compensation payable to the officers of our general partner is paid by our general partner and reimbursed by us on a dollar-for-dollar basis.
In 2011, the named executive officers of our general partner were:
- •
- David G. Zatezalo—President and Chief Executive Officer;
- •
- Richard A. Boone—Senior Vice President and Chief Financial Officer;
- •
- Christopher N. Moravec—Executive Vice President;
- •
- Andrew W. Cox—Vice President of Sales; and
- •
- Reford C. Hunt—Vice President of Technical Services and President of a number of our operating subsidiaries.
106
Table of Contents
With respect to the compensation disclosures in this Compensation Discussion and Analysis and the tables that follow, these individuals are referred to as the "named executive officers." Mr. Moravec tendered his resignation of employment with the general partner on February 15, 2012 and his last day of employment with the general partner was March 2, 2012.
Compensation Philosophy and Objectives
We employ a compensation philosophy that emphasizes pay for performance and reflects what the current market dictates. The executive compensation program applicable to the named executive officers is designed to provide a total compensation package that allows us to attract, retain and motivate the executives necessary to manage our business. Our general philosophy and program is guided by several key principles:
- •
- designing competitive total compensation programs to enhance our ability to attract and retain knowledgeable and experienced senior management level employees;
- •
- motivating employees to deliver outstanding financial performance and meet or exceed general and specific business, operational, and individual objectives; and
- •
- setting compensation and incentive levels relevant to the market in which the employee provides service.
Our executive compensation program is also designed to ensure that a portion of the total compensation made available to the named executive officers is determined by increases in equity value, thereby assuring an alignment of interests between our senior management level employees and our unitholders.
By accomplishing these objectives, we hope to optimize long-term unitholder value.
Compensation Setting Process
Our compensation committee seeks to provide a total compensation package designed to drive performance and reward contributions in support of our business strategies and to attract, motivate and retain high quality talent with the skills and competencies that we require. In the future, the compensation committee may examine the compensation practices of our peer companies and may also review compensation data from the coal industry generally to the extent the competition for executive talent is broader than a group of selected peer companies. To date, the compensation committee has not made any decisions regarding possible benchmarking. In addition, the compensation committee may review and, in certain cases, participate in, various relevant compensation surveys and consult with compensation consultants with respect to determining compensation for the named executive officers. For instance, we participated in a compensation survey prepared by Lockton Companies, LLC covering 26 public and private companies in the coal industry, effective as of August 1, 2010 and published January 1, 2011. We anticipate that our compensation committee may consider this or other relevant surveys in determining appropriate pay levels in the future. We expect that our general partner's President and Chief Executive Officer, Mr. Zatezalo, will provide periodic recommendations to the compensation committee regarding the compensation of the other named executive officers. The compensation committee reviews the compensation structure for the named executive officers of our general partner on an annual basis. During 2011, the compensation committee modified the compensation for certain of our named executive officers, as described under "—Elements of Compensation—Employment Agreements" below.
107
Table of Contents
Elements of Compensation
The principal elements of compensation for our named executive officers are:
- •
- base salary;
- •
- bonus awards;
- •
- long-term equity based incentive awards; and
- •
- nondiscriminatory welfare and retirement benefits.
We believe that a material amount of executive compensation should be tied to our performance, and that a significant portion of the total prospective compensation of each named executive officer should be tied to measurable financial and operational objectives. These objectives may include absolute performance or performance relative to a peer group. During periods when performance meets or exceeds established objectives, the named executive officers should be paid at or above targeted levels, respectively. When our performance does not meet key objectives, incentive award payments, if any, should be less than such targeted levels.
The compensation committee seeks to balance awards based on short-term annual results with awards intended to compensate our executives based on our long-term viability and success. Consequently, we made long-term equity-based awards to each of our named executive officers in connection with the completion of the IPO and intend to grant additional awards of phantom units from time to time, as determined in the discretion of the compensation committee. In the first quarter of 2012, we granted additional phantom unit awards to Messrs. Boone, Cox and Hunt to provide long-term incentives to further align the interests of these named executive officers with those of our unitholders. Our general partner believes that awards under its long-term incentive plan (the "LTIP") further incentivize the named executive officers to perform their duties in a way that will enhance our long-term success. The compensation committee elected not grant any phantom unit awards to Messrs. Zatezalo or Moravec during the first quarter of 2012.
Our compensation committee determines the mix of compensation, comprised of both among short-term and long-term compensation and cash and non-cash compensation, included in the compensation packages for each of the named executive officers. We believe that the mix of base salary, bonus awards, awards under the LTIP and the other benefits that are available to our named executive officers effectively accomplish our overall compensation objectives. We believe the elements of compensation provided create competitive compensation opportunities to align and drive employee performance in support of our business strategies and to attract, motivate and retain high quality talent with the skills and competencies required by us.
Employment Agreements
We have entered into employment agreements with each of the named executive officers. Our employment agreements typically provide for a three year term, which may be terminated earlier in accordance with the terms of the applicable agreement or extended by mutual agreement of the parties. The terms of these employment agreements are described in greater detail below in the section entitled "—Narrative Discussion of Summary Compensation Table and Grants of Plan-Based Awards Table—Employment Agreements."
We entered into amended and restated employment agreements with Messrs. Zatezalo and Moravec effective January 1, 2010 and March 31, 2010, respectively. The amended and restated employment agreements are substantially similar to their prior agreements. Mr. Zatezalo's agreement will expire on December 31, 2012, and Mr. Moravec's agreement will expire on March 31, 2013. The agreements specify the annual base salaries and annual bonus opportunities for Messrs. Zatezalo and Moravec. Mr. Zatezalo's agreement also provides for automatic salary increases in calendar years 2011
108
Table of Contents
and 2012. Messrs. Zatezalo and Moravec are entitled to participate in the employee benefit arrangements offered to similarly situated employees and are eligible to receive grants pursuant to the LTIP as determined in our general partner's discretion.
Effective January 14, 2011, we entered into an amended and restated employment agreement with Mr. Cox which is substantially similar to his prior agreement. The new agreement with Mr. Cox extends his employment term to December 31, 2013 and increases his annual base salary rate to $220,000 per year, but otherwise does not alter the material terms of his agreement. Effective May 31, 2011, we entered into an amended and restated employment agreement with Mr. Boone which is substantially similar to his prior agreement. The new agreement with Mr. Boone extends his employment term to May 31, 2014, increases his annual base salary rate to $275,000 per year and increases his annual performance-based discretionary bonus up to 75% of his base salary, but otherwise does not materially alter the terms of his agreement. Effective September 8, 2011, we entered into an amended and restated employment agreement with Mr. Hunt which is substantially similar to his prior agreement. The new agreement with Mr. Hunt extends his employment term to August 31, 2014, increases his annual base salary rate to $225,000 per year and entitles him to receive certain severance benefits upon an involuntary termination without cause or a voluntary termination for "good reason", but otherwise does not alter the material terms of his agreement.
The severance benefits provided by the employment agreements with the named executive officers are described below in the section titled "—Potential Payments Upon Termination or Change in Control—Employment Agreements." The employment agreements also contain certain confidentiality, noncompetition, and other restrictive covenants, which are also described in the section titled "—Potential Payments Upon Termination or Change in Control—Employment Agreements."
Base Salary. The base salaries set forth in the employment agreements were established based on various factors, including the amounts we considered necessary to attract and retain the highest quality executives, the responsibilities of the named executive officers and the historic compensation of our executives. Our compensation committee reviews the base salaries of our named executive officers on an annual basis and may adjust base salaries consistent with the employment agreements. As part of its review, the compensation committee may review the compensation of executives in similar positions with similar responsibility in any peer companies identified by the compensation committee or in companies in the coal industry with which we generally compete for executives. While our compensation committee will consider all of the foregoing factors in determining the appropriate amount of base salary for each named executive officer, ultimately the minimum base salary for each individual officer was established through negotiations with the individual. In accordance with his employment agreement, Mr. Zatezalo's base salary increased to $500,000 effective for fiscal year 2011. In addition, the compensation committee increased the base salaries of Mr. Cox, Mr. Boone and Mr. Hunt for fiscal year 2011 as described above.
Bonus Awards. We generally provide discretionary annual bonuses to each of our named executive officers. We review annual cash bonus awards for the named executive officers and other executives annually to determine award payments for the last completed fiscal year, as well as to establish award opportunities for the current fiscal year. At the beginning of each year, we meet with our executives to discuss company goals for the year and what each executive is expected to contribute in order to help us achieve those goals. Our bonuses for 2011 were determined by the compensation committee at year-end following a review of the individual performance of the executive officer in question, the past compensation paid to the executive officer, and our overall performance, including our performance with respect to various safety measures and our profitability for the year. However, no specific pre-established performance objectives are set and, ultimately, the amount of the annual bonuses is determined in the discretion of the compensation committee. Although there were no specified financial, operational or individual performance objectives for the 2011 annual bonuses, approximately one-half of the annual discretionary bonus amount payable to each named executive
109
Table of Contents
officer was determined based on the bonus amounts actually received by the employees supervised by the named executive officer and the other one-half of the annual bonus amount was purely discretionary.
Consistent with our historical practice, we have retained a maximum bonus threshold of 40% for most of our named executive officers. Our employment agreements with each of the named executive officers provide that the annual bonus actually awarded to a named executive officer for a given fiscal year may be up to 40% of his annual salary (up to 150% of annual base salary in the case of Mr. Zatezalo and up to 75% of annual base salary in the case of Mr. Boone). In order to incentivize Mr. Zatezalo to improve our performance, we have structured a large portion of his cash compensation to be a discretionary, performance-based bonus of up to 150% of his annual base salary.
In addition, Mr. Moravec's employment agreement also provides that he is entitled to a guaranteed annual bonus of $200,000 for each year of the three year term of his agreement, payable in bi-weekly installments in accordance with our general payroll practices.
The following table sets forth the annual rate of base salary payable for fiscal 2011 and potential bonus amounts for the named executive officers pursuant to their employment agreements:
| | | | | |
Name and Principal Position | | Base Salary | | Bonus |
|---|
David G. Zatezalo | | $ | 500,000 | | 0% to 150% of base salary |
President and Chief Executive Officer | | | | | |
Richard A. Boone | | $ | 275,000 | | 0% to 75% of base salary |
Senior Vice President and Chief Financial Officer | | | | | |
Christopher N. Moravec | | $ | 400,000 | | 0% to 40% of base salary |
Executive Vice President | | | | | |
Andrew W. Cox | | $ | 220,000 | | 0% to 40% of base salary |
Vice President of Sales | | | | | |
Reford C. Hunt | | $ | 225,000 | | 0% to 40% of base salary |
Vice President of Technical Services | | | | | |
Severance and Change in Control Benefits. The employment agreements with the named executive officers provide such individuals with certain severance benefits upon an involuntary termination, including, in some cases, upon a termination due to death. We believe it is appropriate to provide these severance benefits in recognition of the fact that it may be difficult for the named executive officers to find comparable employment within a short period of time if they are involuntarily terminated. The severance and benefits provided under the employment agreements are described in greater detail below. Please read "—Potential Payments Upon Termination or Change in Control—Employment Agreements."
The board of directors of our general partner has adopted the LTIP for our employees, consultants and directors and those of our affiliates who perform services for us. Each of the named executive officers is eligible to participate in the LTIP. The LTIP provides for the grant of restricted units, unit options, unit appreciation rights, phantom units, unit payments, other equity-based awards and performance awards.
In connection with our IPO, the named executive officers each received a grant of phantom units under the LTIP in the following amounts: Mr. Zatezalo (73,171 phantom units), Mr. Boone (24,390 phantom units), Mr. Moravec (7,317 phantom units), Mr. Cox (1,220 phantom units) and Mr. Hunt (1,220 phantom units). The approximate dollar values of these phantom unit awards were determined as follows: (1) Mr. Zatezalo's award is equal to approximately three times his base salary at the time of the award; (ii) awards to Messrs. Boone and Moravec were targeted at approximately two times their
110
Table of Contents
respective base salaries at the time of the awards (except the value of Mr. Moravec's award was reduced by the $600,000 of guaranteed bonuses provided under his amended and restated employment agreement); and (iii) awards to Messrs. Cox and Hunt were not tied to their salary levels, but were consistent with the awards granted to other officers in connection with the offering. These multiples of base salary were established at the discretion of our President and Chief Executive Officer and Wexford Capital and through negotiations with our executive officers.
The phantom units vest in equal one-sixth increments over a 36-month period, subject to earlier vesting upon a change of control or the executive's termination due to death or disability. Please read "—Potential Payments Upon Termination or Change in Control—LTIP Phantom Unit Awards." In addition, upon a termination of the executive by us without cause or by the executive for good reason, the vesting of any phantom units scheduled to vest within the 12-month period following termination will be accelerated to the termination date. Distributions of dividend equivalent rights, or DERs, credited with respect to unvested phantom units are paid upon vesting of the associated phantom units (and are forfeited at the same time the associated phantom units are forfeited).
In the first quarter of 2012, the compensation committee approved a discretionary grant of phantom unit awards under the LTIP to certain named executive officers. The discretionary award of phantom units were based upon a maximum value of one-half of the executive's annual pre-tax cash bonus award and the phantom units vest in equal one-third installments over a 36-month period. These discretionary annual awards provide a long-term incentive to our executives to further align the interests of the named executive officers with those of our unitholders.
With respect to future equity compensation awards, we intend to continue to primarily utilize phantom units with associated DERs to provide long-term incentives to our named executive officers. DERs enable the recipients of phantom unit awards to receive cash distributions on our phantom units to the same extent generally as unitholders receive cash distributions on our common units. These awards are intended to align the interests of key employees (including the named executive officers) with those of our unitholders.
401(k) Plan
Rhino Energy LLC and a majority of its subsidiaries are participating employers in the Rhino Energy LLC 401(k) Plan, except that Rhino Energy LLC's subsidiary Hopedale Mining LLC sponsors its own plan (collectively, the "401(k) Plans"). The companies use the 401(k) Plans to assist their eligible employees in saving for retirement on a tax-deferred basis. The 401(k) Plans permit all eligible employees, including the named executive officers, to make voluntary pre-tax contributions to the applicable plan, subject to applicable tax limitations. A discretionary employer matching contribution may also be made to the 401(k) Plans for those eligible employees who meet certain conditions and subject to certain limitations under federal law. The employer matching contribution percentage, if any, is determined each year. Employee contributions are subject to annual dollar limitations, which are periodically adjusted by the cost of living index. Each 401(k) Plan is intended to be tax-qualified under Section 401(a) of the Internal Revenue Code so that contributions to the plan, and income earned on plan contributions, are not taxable to employees until withdrawn from the plan, and so that contributions, if any, will be deductible when made.
Other Benefits
The employment agreements for each of the named executive officers provide, in general, that the named executive officer is eligible to participate in our employee benefit plans provided to salaried employees generally. Additional benefits and perquisites for the named executive officers may include payment of premiums for supplemental life insurance, long-term disability insurance and automobile
111
Table of Contents
fringe benefits. In 2011, the only perquisite provided to the named executive officers was the use of a company owned automobile.
Tax Deductibility of Compensation
With respect to the deduction limitations under Section 162(m) of the Internal Revenue Code, we are a limited partnership and do not meet the definition of a "corporation" under Section 162(m). Hence, we are not subject to the deduction limitations imposed by Section 162(m).
Compensation Committee Report
The compensation committee of our general partner has reviewed and discussed this Compensation Discussion and Analysis required by Item 402(b) of Regulation S-K with management and, based on such review and discussion, the compensation committee recommended to the board of directors of our general partner that this Compensation Discussion and Analysis be included in this Form 10-K for the fiscal year ended December 31, 2011.
Members of the compensation committee:
Summary Compensation Table
The following table sets forth the cash and other compensation earned by each of our named executive officers for the years ended December 31, 2011, 2010 and 2009.
| | | | | | | | | | | | | | | | | | | |
Name and Principal Position | | Year | | Salary ($) | | Bonus ($)(1) | | Stock Awards
($)(2) | | All Other
Compensation
($)(3) | | Total ($) | |
|---|
David G. Zatezalo | | | 2011 | | $ | 499,616 | | $ | 357,200 | | $ | — | | $ | 21,264 | | $ | 878,080 | |
President and Chief | | | 2010 | | | 480,000 | | | 602,100 | | | 1,500,006 | | | 22,364 | | | 2,604,470 | |
Executive Officer | | | 2009 | | | 325,000 | | | 195,000 | | | — | | | 22,280 | | | 542,280 | |
Richard A. Boone | | | 2011 | | | 264,231 | | | 116,300 | | | — | | | 12,639 | | | 393,170 | |
Senior Vice President and | | | 2010 | | | 242,495 | | | 215,600 | | | 499,995 | | | 10,919 | | | 969,009 | |
Chief Financial Officer | | | 2009 | | | 228,318 | | | 66,000 | | | — | | | 11,944 | | | 306,262 | |
Christopher N. Moravec | | | 2011 | | | 400,000 | | | 200,000 | | | — | | | 13,218 | | | 613,218 | |
Executive Vice President | | | 2010 | | | 365,846 | | | 469,508 | | | 149,999 | | | 10,107 | | | 995,460 | |
| | | 2009 | | | 240,000 | | | 407,000 | | | — | | | 16,035 | | | 663,035 | |
Andrew W. Cox | | | 2011 | | | 219,614 | | | 53,100 | | | — | | | 9,172 | | | 281,886 | |
Vice President of Sales | | | 2010 | | | 209,999 | | | 55,100 | | | 25,010 | | | 11,048 | | | 301,157 | |
| | | 2009 | | | 210,000 | | | 65,000 | | | — | | | 11,169 | | | 286,169 | |
Reford C. Hunt | | | 2011 | | | 190,769 | | | 55,800 | | | — | | | 12,147 | | | 258,716 | |
Vice President of Technical | | | 2010 | | | 175,001 | | | 160,900 | | | 25,010 | | | 12,895 | | | 373,806 | |
Services | | | 2009 | | | 181,732 | | | 57,000 | | | — | | | 10,054 | | | 248,786 | |
- (1)
- For 2011, the bonus amount reflects the annual cash bonus awarded to each named executive per the terms or their employment agreement.
For 2010, bonus amounts include the one-time cash bonuses received by certain of our named executive officers in connection with the consummation of our IPO in the following amounts: (a) Mr. Zatezalo—$250,000; (b) Mr. Boone—$150,000; (c) Mr. Moravec—$150,000; and (d) Mr. Hunt—$100,000. Also includes the annual discretionary bonuses earned by the named executive officers for fiscal 2010. Further, a portion of the bonus amount reported for
112
Table of Contents
Mr. Moravec for fiscal 2010 represents (i) the guaranteed annual bonus of $200,000 provided pursuant to his amended and restated employment agreement effective March 31, 2010, and (ii) the guaranteed annual term bonus that was paid in monthly installments during 2010 pursuant to Mr. Moravec's prior employment agreement at a rate of $29,166.67 through March 2010 (at an annual rate of $350,000 in effect during 2010).
- (2)
- The amounts reported in the "Stock Awards" column reflect the aggregate grant date fair value of phantom unit awards granted under the LTIP, computed in accordance with FASB ASC Topic 718. See Note 2 to our consolidated financial statements for additional detail regarding assumptions underlying the value of these equity awards.
- (3)
- Amounts reflect, as applicable with respect to the named executive officers and as provided in the supplemental table below, the use of a company provided automobile and employer contributions to the CAM Mining LLC 401(k) Plan and the Hopedale Mining LLC 401(k) Plan. The value of automobile use is calculated as the monthly lease payment paid by us on behalf of the executive multiplied by the monthly percentage of personal use of the automobile by the executive.
| | | | | | | | | | |
Name | | Automobile
Use | | Employer
Contribution
to Our
401(k) Plan | | Employer
Contribution
to the Hopedale
401(k) Plan | |
|---|
David G. Zatezalo | | $ | 533 | | $ | — | | $ | 20,731 | |
Richard A. Boone | | | 1,350 | | | 11,289 | | | — | |
Christopher N. Moravec | | | 442 | | | 12,776 | | | — | |
Andrew W. Cox | | | 874 | | | 8,298 | | | — | |
Reford C. Hunt | | | 2,080 | | | 10,067 | | | — | |
Grants of Plan-Based Awards
Although there were no grants of plan-based awards during fiscal year 2011, certain named executive officers received discretionary annual awards of phantom units that were granted in early 2012. The dollar amount of the awards granted were calculated based upon a percentage of the annual pre-tax cash bonus award the employees received in connection with their fiscal year 2011 performance.
Narrative Discussion of Summary Compensation Table and Grants of Plan-Based Awards Table
Employment Agreements
During 2011, we had employment agreements in effect with each of the named executive officers included in our Summary Compensation Table. The employment agreements with Messrs. Zatezalo, Boone, Moravec, Cox and Hunt set forth the annual base salary payable to each named executive officer, which may be reviewed each year for possible increases for Mr. Moravec and Mr. Cox. Mr. Zatezalo's employment agreement provides for an automatic base salary increase for 2012 and the agreements for Mr. Boone and Mr. Hunt provide for automatic annual salary increases during the terms of their agreements. The foregoing named executive officers were each entitled in 2011 under their respective employment agreements to receive an annual discretionary bonus of up to 40% of annual base salary (150% of base salary in the case of Mr. Zatezalo and 75% of base salary in the case of Mr. Boone). In addition to a discretionary annual bonus, Mr. Moravec has received additional annual term bonuses, paid in monthly installments for having remained employed by us through March 31, 2010 (at an annual rate of $350,000). The named executive officers are also entitled to participate in our employee benefit programs, to the extent eligible. Pursuant to their respective employment agreements, we provide Messrs. Zatezalo, Moravec, Boone, Cox and Hunt with automobiles suitable for their duties and responsibilities to us.
113
Table of Contents
We entered into amended and restated employment agreements with Messrs. Zatezalo and Moravec, effective January 1, 2010 and March 31, 2010, respectively. We have also entered into amended and restated employment agreements with Mr. Cox, effective January 14, 2011, Mr. Boone, effective May 31, 2011, and Mr. Hunt, effective September 13, 2011. The amended and restated employment agreements are substantially similar to the agreements previously in effect, except as previously described in the section of our Compensation Discussion and Analysis titled "—Elements of Compensation—Employment Agreements." The severance and change in control benefits provided by the employment agreements with the named executive officers are described below in the section titled "—Potential Payments Upon Termination or Change in Control—Employment Agreements."
Phantom Unit Awards
On September 30, 2010, the compensation committee approved a grant of phantom units under the LTIP to each of the named executive officers in connection with our IPO. All phantom units vest in equal one-sixth increments over a 36-month period (i.e., approximately 16.6% vest at each six month anniversary of the date of grant, so that the phantom units are 100% vested on October 5, 2013), provided the named executive officer remains an employee continuously from the date of grant through the applicable vesting date. The phantom units will become fully vested upon a change in control or if the named executive officer's employment is terminated due to disability or death. In addition, if the named executive officer's employment is terminated by us without cause or by the executive for good reason, the vesting of those phantom units scheduled to vest in the 12 month period following such termination will be accelerated to the officer's termination date. While a named executive officer holds unvested phantom units, he is entitled to receive DER distributions that will be paid upon vesting of the associated phantom units (and will be forfeited at the same time the associated phantom units are forfeited).
The named executive officers did not receive any grants of phantom units during 2011. However, certain named executives received discretionary awards of phantom units in early 2012 in respect of fiscal 2011 performance. These phantom unit awards vest in equal annual installments over a 36-month period (i.e., approximately 33.3% vest at each annual anniversary of the date of grant, so that the phantom units are 100% vested in early 2015), provided the named executive officer remains an employee continuously from the date of grant through the applicable vesting date. The remaining characteristics of these phantom awards are similar to the phantom units awarded in connection with our IPO.
Outstanding Equity Awards at Fiscal Year End
The following table sets forth information concerning outstanding equity awards held by each of our named executive officers as of December 31, 2011.
| | | | | | | |
| | Stock Awards | |
|---|
Name | | Number of Shares or
Units of Stock
That Have Not
Vested (#)(1) | | Market Value of
Shares or Units of
Stock That Have Not
Vested ($)(2) | |
|---|
David G. Zatezalo | | | 48,781 | | $ | 941,473 | |
Richard A. Boone | | | 16,260 | | $ | 313,818 | |
Christopher N. Moravec | | | 4,877 | | $ | 94,126 | |
Andrew W. Cox | | | 814 | | $ | 15,710 | |
Reford C. Hunt | | | 814 | | $ | 15,710 | |
- (1)
- The vesting schedule applicable to these outstanding phantom units is described above under "Narrative Discussion of Summary Compensation Table and Grants of Plan-Based
114
Table of Contents
Awards Table." Approximately one-quarter of the phantom units will vest on each of April 5, 2012, October 5, 2012, April 5, 2013 and October 5, 2013, provided that the named executive officer remains continuously employed through each such date.
- (2)
- This column represents the closing price of our common units on December 30, 2011 (the last trading day in 2011), which is $19.30, multiplied by the number of phantom units outstanding.
Option Exercises and Units Vested
The following table sets forth information concerning equity awards for the named executive officers that vested during the year ended December 31, 2011.
| | | | | | | |
| | Stock Awards | |
|---|
Name | | Number of Shares or
Units of Stock
Acquired Upon
Vesting (#) | | Value of Shares or
Units of Stock
Realized Upon
Vesting ($)(1) | |
|---|
David G. Zatezalo | | | 24,390 | | $ | 505,727 | |
Richard A. Boone | | | 8,130 | | $ | 168,576 | |
Christopher N. Moravec | | | 2,440 | | $ | 50,593 | |
Andrew W. Cox | | | 406 | | $ | 8,418 | |
Reford C. Hunt | | | 406 | | $ | 8,418 | |
- (1)
- This column represents the closing price of our common units on the last trading day preceding the applicable vesting date, multiplied by the number of phantom units vesting (calculated before withholding for any applicable taxes).
Pension Benefits
Currently, we do not, and we do not intend to, provide pension benefits to our employees including the named executive officers. Our general partner may change this policy in the future.
Nonqualified Deferred Compensation Table
Currently, we do not, and we do not intend to, sponsor or adopt a nonqualified deferred compensation plan. Our general partner may change this policy in the future.
Potential Payments Upon Termination or Change in Control
We have employment agreements with each of the named executive officers that contain provisions regarding payments to be made to such individuals upon an involuntary termination of their employment by us, other than for cause. The employment agreements are described in greater detail below and in the section above titled "—Compensation Discussion and Analysis—Elements of Compensation—Employment Agreements."
Employment Agreements
Under the employment agreements with Messrs. Zatezalo, Boone and Moravec, if the employment of the executive is terminated by us for "cause," by the executive voluntarily without "good reason," or due to the executive's "disability," then the executive, as applicable, will be entitled to receive his earned but unpaid base salary, payment with respect to accrued but unpaid vacation days, all benefits accrued and vested under any of our benefit plans, and reimbursement for any properly incurred business expenses (collectively, the "accrued obligations"). In addition to the foregoing, in the event the employment of Mr. Zatezalo, Mr. Boone or Mr. Moravec is terminated by us without "cause" or by the
115
Table of Contents
executive for "good reason," the executive shall receive a lump sum cash payment equal to twelve months' worth of his base salary (six months in the case of Mr. Moravec), subject to his timely execution and delivery (and nonrevocation) of a release agreement for our benefit. In the event of the death of Mr. Zatezalo, Mr. Boone or Mr. Moravec, his estate will be entitled to receive the accrued obligations and a pro-rated annual discretionary bonus. Messrs. Zatezalo, Boone and Moravec are subject to certain confidentiality, noncompete and nonsolicitation provisions contained in their respective employment agreements. The confidentiality covenants are perpetual, while the noncompete and nonsolicitation covenants apply during the term of the employment agreement and for one year (six months in the case of Mr. Moravec) following the executive's termination for any reason (two years following the executive's termination for any reason in the case of the nonsolicitation covenant).
For purposes of the agreements with Messrs. Zatezalo, Boone and Moravec, the terms listed below have been defined as follows:
- •
- "cause" means (a) failure of the executive to perform substantially his duties (other than a failure due to a "disability") within ten days after written notice from us, (b) executive's conviction of, or plea of guilty or no contest to a misdemeanor involving dishonesty or any felony, (c) executive engaging in any illegal conduct, gross misconduct, or other material breach of the employment agreement that is materially and demonstratively injurious to us or (d) executive engaging in any act of dishonesty or fraud involving us or any of our affiliates.
- •
- "disability" means the inability of executive to perform his normal duties as a result of a physical or mental injury or ailment for any consecutive 45 day period or for 90 days (whether or not consecutive) during any 365 day period.
- •
- "good reason" means, without the executive's express written consent, (a) the assignment to the executive of duties inconsistent in any material respect with those of the executive's position (including status, office, title, and reporting requirements), or any other diminution in any material respect in such position, authority, duties or responsibilities, (b) a reduction in base salary, (c) a reduction in the executive's welfare, qualified retirement plan or paid time off benefits, other than a reduction as a result of a general change in any such plan, (d) any purported termination of the executive's employment under the employment agreement other than for "cause," death or "disability" or (e) in the case of Messrs. Zatezalo and Moravec (but not Mr. Boone), a sale of our assets or ownership interests to an entity other than any of our subsidiaries or affiliates, Wexford Capital or any investment fund managed thereby. The executive must give notice of the event alleged to constitute "good reason" within six months of its occurrence and we have 30 days upon receipt of the notice to cure the alleged "good reason" event.
Under the employment agreements with Mr. Cox and Mr. Hunt, if their employment is terminated by us without "cause," Mr. Cox is entitled to receive a lump sum payment equal to six months' worth of his base salary and continued family health insurance, at no premium cost, until the earlier of six months or the date he becomes covered under a new employer's plan while Mr. Hunt is entitled to receive a lump sum payment equal to twelve months' worth of his base salary and continued family health insurance, at the same premium cost as was in effect on the date of termination, until the earlier of twelve months or the date he becomes covered under a new employer's plan. Mr. Cox and Mr. Hunt are subject to certain confidentiality, noncompete and nonsolicitation provisions contained in their employment agreements. The confidentiality covenants are perpetual, while the noncompete covenants apply during the terms of the employment agreements and for one year following termination of employment (except that the noncompete covenant applies for only 90 days following Mr. Cox's termination by us without "cause"). The nonsolicitation period runs until the end of the six month period following the end of the applicable noncompete period.
116
Table of Contents
For purposes of the agreements with Mr. Cox and Mr. Hunt, "cause" means (1) the commission by executive of an act of dishonesty or fraud against us, (2) a breach of the executive's obligations under the employment agreement and failure to cure such breach within five days after written notice from us, (3) executive is indicted for or convicted of a crime involving moral turpitude or (4) executive materially fails or neglects to diligently perform his duties.
LTIP Phantom Unit Awards
Messrs. Zatezalo, Boone, Moravec, Cox and Hunt hold outstanding awards of phantom units under the LTIP as previously described in the section above titled "—Compensation Discussion and Analysis—Long-Term Incentive Compensation." The vesting of the phantom units will accelerate in full upon a "change of control" or the named executive officer's termination due to death or "disability." In addition, upon a termination of the executive by us without cause or by the executive for a good reason, the vesting of those phantom units scheduled to vest in the 12-month period following such termination will be accelerated to such termination date. "Good reason" will generally have the meaning set forth above and "cause" will have the meaning set forth in the respective employment agreement of the named executive officer as described above. "Cause" with respect to Mr. Hunt will have the meaning set forth in the employment agreements of Messrs. Zatezalo, Boone and Moravec. A "change of control" will be deemed to have occurred if: (i) any person or group, other than Wexford Capital, our general partner or an affiliate of either, becomes the owner of more than 50% of the voting power of the voting securities of either us or our general partner; or (ii) upon the sale or other disposition by either us or our general partner of all or substantially all of its assets, whether in a single or series of related transactions, to one or more parties (other than Wexford Capital, our general partner or an affiliate of either). A "disability" is any illness or injury for which the named executive officer will be entitled to benefits under the long-term disability plan of our general partner.
Quantification of Payments
The table below discloses the amount of compensation and/or benefits due to Messrs. Zatezalo, Boone, Moravec, Cox and Hunt in the event of their termination of employment under certain specified circumstances and/or upon the occurrence of a change in control. The amounts disclosed assume (i) such termination or change in control was effective on December 31, 2011, taking into account the arrangements described above and the salary and bonus rates in effect for the named executive officers for fiscal 2011, and (ii) that the price per common unit was $19.30, which was the closing price of our common units on December 30, 2011 (the last trading day in 2011). The table excludes amounts accrued through fiscal 2011 year-end that would be paid in the normal course of continued employment, such as accrued but unpaid salary, and benefits generally available to all our salaried employees. The amounts below constitute estimates of the amounts that would be paid to the named executive officers upon their respective terminations and/or upon a change in control under such arrangements. The actual amounts to be paid out are dependent on various factors, which may or
117
Table of Contents
may not exist at the time a named executive officer is actually terminated or a change in control actually occurs. Therefore, such amounts should be considered "forward-looking statements".
| | | | | | | | | | | | | |
Name | | Change in
Control | | Termination
without Cause | | Death | | Resignation with
Good Reason | |
|---|
David Zatezalo | | | | | | | | | | | | | |
Cash Payment | | $ | — | | $ | 500,000 | | $ | 750,000 | | $ | 500,000 | |
Accelerated Equity Vesting | | $ | 941,473 | | $ | 470,737 | | $ | 941,473 | | $ | 313,824 | |
| | | | | | | | | | |
Total | | $ | 941,473 | | $ | 970,737 | | $ | 1,691,473 | | $ | 813,824 | |
Richard Boone | | | | | | | | | | | | | |
Cash Payment | | $ | — | | $ | 275,000 | | $ | 206,250 | | $ | 275,000 | |
Accelerated Equity Vesting | | $ | 313,818 | | $ | 156,909 | | $ | 313,818 | | $ | 104,606 | |
| | | | | | | | | | |
Total | | $ | 313,818 | | $ | 431,909 | | $ | 520,068 | | $ | 379,606 | |
Christopher Moravec | | | | | | | | | | | | | |
Cash Payment | | $ | — | | $ | 200,000 | | $ | 160,000 | | $ | 200,000 | |
Accelerated Equity Vesting | | $ | 94,126 | | $ | 47,063 | | $ | 94,126 | | $ | 31,375 | |
| | | | | | | | | | |
Total | | $ | 94,126 | | $ | 247,063 | | $ | 254,126 | | $ | 231,375 | |
Andrew Cox | | | | | | | | | | | | | |
Cash Payment | | $ | — | | $ | 110,416 | (2) | $ | — | | $ | — | |
Accelerated Equity Vesting | | $ | 15,710 | | $ | 7,855 | | $ | 15,710 | | $ | 5,237 | |
| | | | | | | | | | |
Total | | $ | 15,710 | | $ | 118,271 | | $ | 15,710 | | $ | 5,237 | |
Reford Hunt | | | | | | | | | | | | | |
Cash Payment | | $ | — | | $ | 225,000 | | $ | — | | $ | 225,000 | |
Accelerated Equity Vesting | | $ | 15,710 | | $ | 7,855 | | $ | 15,710 | | $ | 5,237 | |
| | | | | | | | | | |
Total | | $ | 15,710 | | $ | 232,855 | | $ | 15,710 | | $ | 230,237 | |
- (1)
- The accelerated vesting of phantom units is based upon the closing price of our common units on December 30, 2011 (the last trading day in 2011), which is $19.30, multiplied by the number of phantom units that would vest upon the occurrence of the event indicated.
- (2)
- Includes six months' worth of family medical premiums equal to $416 for Mr. Cox.
Director Compensation
We provide compensation to the non-employee directors (including the directors who are principals of Wexford Capital) of the board of directors of our general partner, including a $20,000 annual base director fee and a grant of that number of common units having a grant date value of $25,000 (based on the preceding 10-day average price per unit), 25% of which vest on the grant date and 75% of which are restricted units that vest one-third on the first day of each of the first three calendar quarters that begin following the grant date (with vesting to be accelerated upon the director's death or disability, if a non-Wexford director, and for all of the directors, on a change of control (as defined in the LTIP)). Distributions made on a restricted unit are held by our general partner (without interest) and vest or are forfeited when the restricted unit vests or is forfeited, as applicable. In addition, the chairs of the audit committee and conflicts committee receive a $15,000 fee, the chair of any other committee (including the compensation committee) receives a $10,000 fee, audit committee and conflicts committee members receive a $10,000 fee and the other committee members receive a $5,000 fee, for their service in such roles each year. Our employees who also serve as directors do not receive additional compensation. Each non-employee director is reimbursed for out-of-pocket expenses in connection with attending meetings of the board of directors or committees, and each director is fully indemnified by us for actions associated with being a director to the extent permitted under Delaware law. Wexford Capital does not receive compensation from us for conducting our business or managing our operations.
118
Table of Contents
The following table provides information concerning the compensation of our non-employee directors for the fiscal year ended December 31, 2011.
| | | | | | | | | | | | | |
Name | | Fees Earned or
Paid in
Cash ($)(1) | | Stock Awards
($)(2) | | All Other
Compensation ($) | | Total ($) | |
|---|
Mark D. Zand(3) | | $ | 30,000 | | $ | 25,010 | | $ | — | | $ | 55,010 | |
Arthur H. Amron(3) | | $ | 20,000 | | $ | 25,010 | | $ | — | | $ | 45,010 | |
Joseph M. Jacobs(3) | | $ | 20,000 | | $ | 25,010 | | $ | — | | $ | 45,010 | |
Douglas Lambert | | $ | 40,000 | | $ | 25,010 | | $ | — | | $ | 65,010 | |
Jay L. Maymudes(3) | | $ | 25,000 | | $ | 25,010 | | $ | — | | $ | 50,010 | |
Mark L. Plaumann | | $ | 50,000 | | $ | 25,010 | | $ | — | | $ | 75,010 | |
Kenneth A. Rubin(3) | | $ | 20,000 | | $ | 25,010 | | $ | — | | $ | 45,010 | |
James F. Tompkins | | $ | 40,000 | | $ | 25,010 | | $ | — | | $ | 65,010 | |
- (1)
- Includes annual base director fee, committee membership fees, and committee chair fees for each non-employee director as more fully explained in the preceding paragraphs.
- (2)
- The amounts reported in the "Stock Awards" column reflect the aggregate grant date fair value of the awards granted under the LTIP in fiscal 2011, computed in accordance with FASB ASC Topic 718. See Note 2 to our consolidated financial statements for fiscal 2011 for additional detail regarding assumptions underlying the value of these equity awards. As of December 31, 2011, each non-employee director held 919 outstanding restricted units.
- (3)
- Director compensation is paid or granted, as applicable, to these individuals in their capacities as agents for Wexford Capital. Restricted units granted to these individuals under the LTIP are treated for all purposes as grants to Wexford Capital or its assignee, as Wexford Capital may direct or provide, and not to the individual serving as a member of the board on behalf of Wexford Capital or its assignee.
Compensation Practices as They Related to Risk Management
We believe our compensation programs do not encourage excessive and unnecessary risk taking by executive officers (or other employees). Short-term annual incentives are generally paid pursuant to discretionary bonuses, which enable the compensation committee of our general partner to assess the actual behavior of our employees as it relates to risk taking in awarding bonus amounts. Further, our use of equity based long-term compensation serves our compensation program's goal of aligning the interests of executives and unitholders, thereby reducing the incentives to unnecessary risk taking.
Item 12. Security Ownership of Certain Beneficial Owners and Management and Related Unitholder Matters.
The following table sets forth the beneficial ownership of common units and subordinated units as of March 9, 2012 of Rhino Resource Partners LP for:
- •
- beneficial owners of more than 5% of our common units;
- •
- each director, director nominee and named executive officer; and
- •
- all of our directors and executive officers as a group.
119
Table of Contents
The following table does not include any phantom unit awards granted under the long-term incentive plan. Please see "Part III, Item 11. Executive Compensation—Compensation Discussion and Analysis—Elements of Compensation—Long-Term Incentive Compensation."
| | | | | | | | | | | | | | | | |
Name of Beneficial Owner | | Common
Units
Beneficially
Owned | | Percentage of
Common
Units
Beneficially
Owned | | Subordinated
Units
Beneficially
Owned | | Percentage of
Subordinated
Units
Beneficially
Owned | | Percentage of
Common
and
Subordinated
Units
Beneficially
Owned | |
|---|
Rhino Energy Holdings LLC(1)(3)(4) | | | 7,620,882 | | | 49.8 | % | | 10,901,421 | | | 87.9 | % | | 66.8 | % |
Charles E. Davidson(1)(2)(3)(4)(5) | | | 8,205,343 | | | 53.6 | % | | 11,719,975 | | | 94.5 | % | | 71.9 | % |
Joseph M. Jacobs(1)(2)(3)(4) | | | 8,049,181 | | | 52.5 | % | | 11,496,599 | | | 92.7 | % | | 70.5 | % |
Wexford Capital LP(1)(2)(3)(4) | | | 7,999,627 | | | 52.2 | % | | 11,425,714 | | | 92.2 | % | | 70.1 | % |
Wexford GP LLC(1)(2)(3)(4) | | | 7,999,627 | | | 52.2 | % | | 11,425,714 | | | 92.2 | % | | 70.1 | % |
Mark D. Zand | | | 5,460 | | | * | | | 7,809 | | | * | | | * | |
David G. Zatezalo | | | 17,006 | | | * | | | — | | | — | | | * | |
Richard A. Boone | | | 8,002 | | | * | | | — | | | — | | | * | |
Christopher N. Moravec | | | 856 | | | * | | | — | | | — | | | * | |
Andrew W. Cox | | | 279 | | | * | | | — | | | — | | | * | |
Reford C. Hunt | | | 284 | | | * | | | — | | | — | | | * | |
Jay L. Maymudes | | | 4,126 | | | * | | | 5,904 | | | * | | | * | |
Arthur H. Amron | | | 2,721 | | | * | | | 3,892 | | | * | | | * | |
Kenneth A. Rubin | | | 2,401 | | | * | | | 3,436 | | | * | | | * | |
Mark L. Plaumann(6) | | | 2,446 | | | * | | | — | | | — | | | * | |
Douglas Lambert(6) | | | 2,446 | | | * | | | — | | | — | | | * | |
James F. Tompkins(6) | | | 3,446 | | | * | | | — | | | — | | | * | |
All executive officers and directors as a group (14 persons) | | | 8,098,654 | | | 52.9 | % | | 11,517,640 | | | 92.9 | % | | 70.8 | % |
- *
- represents less than 1% of the total.
- (1)
- 7,620,882 common units and 10,901,421 of the subordinated units shown as beneficially owned by each of Charles E. Davidson, Joseph M. Jacobs, Wexford GP LLC and Wexford Capital, reflect common units and subordinated units owned of record by Rhino Energy Holdings LLC ("REH"). Wexford Capital serves as manager for REH and as such may be deemed to share beneficial ownership of the units beneficially owned by REH, but disclaims such beneficial ownership to the extent such beneficial ownership exceeds its pecuniary interests. Wexford GP LLC ("Wexford GP"), as the general partner of Wexford Capital, may be deemed to share beneficial ownership of the units beneficially owned by REH, but disclaims such beneficial ownership to the extent such beneficial ownership exceeds its pecuniary interests. Messrs. Davidson and Jacobs, as the controlling persons of Wexford GP, may be deemed to share beneficial ownership of any units beneficially owned by REH for which Wexford Capital serves as manager, but disclaim such beneficial ownership to the extent such beneficial ownership exceeds their respective pecuniary interests.
- (2)
- 366,515 common units and 524,293 of the subordinated units shown as beneficially owned by each of Charles E. Davidson, Joseph M. Jacobs, Wexford GP LLC and Wexford Capital, reflect common units and subordinated units owned of record by Rhino Resource Holdings LLC ("RRH"). Wexford Capital serves as manager for RRH and as such may be deemed to share beneficial ownership of the units beneficially owned by RRH, but disclaims such beneficial ownership to the extent such beneficial ownership exceeds its pecuniary interest. Wexford GP, as the general partner of Wexford, may be deemed to share beneficial ownership of the units
120
Table of Contents
beneficially owned by RRH, but disclaims such beneficial ownership to the extent such beneficial ownership exceeds its pecuniary interest. Messrs. Davidson and Jacobs, as the controlling persons of Wexford GP, may be deemed to share beneficial ownership of any units beneficially owned by RRH for which Wexford serves as manager, but disclaim such beneficial ownership to the extent such beneficial ownership exceeds its pecuniary interest.
- (3)
- The compensation we pay our non-executive directors includes an annual grant of common units having a grant date value of $25,000, which are subject to the terms and conditions set forth in our LTIP. See "Item 11. Executive Compensation—Director Compensation." The annual grant on November 3, 2011 included a total of 6,130 common units granted to five Wexford Capital affiliated directors of our general partner on behalf of Wexford Capital. These units vest as follows: 1,535 units vested on the grant date, 1,535 units vested on January 1, 2012, 1,530 units will vest on April 1, 2012 and 1,530 units will vest on July 1, 2012. The units are reflected in the table above as beneficially owned by Wexford Capital, Wexford GP, as general partner of Wexford Capital, and Messrs. Davidson and Jacobs, as the controlling persons of Wexford GP. Wexford Capital, Wexford GP and Messrs. Davidson and Jacobs each disclaim beneficial ownership of these units to the extent such beneficial ownership exceeds their respective pecuniary interests.
- (4)
- The address for this person or entity is 411 West Putnam Avenue, Greenwich, Connecticut 06830.
- (5)
- Includes 188,554 common and 269,714 subordinated units held by CD Holding Company, LLC, for which Mr. Davidson is the sole managing member, and the common and subordinated units owned of record by Mr. Davidson's Roth IRA.
- (6)
- Each of these three non-executive directors received an annual grant of 1,226 units on November 3, 2011 pursuant to the LTIP. These units vest as follows: 25% of the units vested upon the grant, 25% vested on January 1, 2012, and the remaining 50% vest ratably on April 1, 2012 and July 1, 2012.
Equity Compensation Plan Information
| | | | | | | | | |
Plan Category | | Number of units to be
issued upon
exercise/vesting of
outstanding options,
warrants and rights as of
December 31, 2011 | | Weighted-average
exercise price of
outstanding options,
warrants and rights | | Number of units
remaining available for
future issuance under
equity compensation
plans as of December 31,
2011 | |
|---|
Equity compensation plans not approved by unitholders(1): | | | | | | | | | |
Long-Term Incentive Plan | | | 84,233 | | n/a | | | 2,340,586 | |
- (1)
- Adopted by the board of directors of our general partner in connection with our IPO.
Item 13. Certain Relationships and Related Transactions, and Director Independence.
As of March 9, 2012, Wexford owned 8,263,475 common units and 11,811,901 subordinated units representing approximately 72.4% of our units, owns and controls our general partner, and has appointed all of the directors of our general partner, which maintains its 2.0% general partner interest as well as the incentive distribution rights representing a limited partner interest in us.
Principals of Wexford Capital, including Mark D. Zand, Joseph M. Jacobs, Jay L. Maymudes, Arthur H. Amron and Kenneth A. Rubin, own membership interests in our general partner.
The terms of the transactions and agreements disclosed in this section were determined by and among affiliated entities and, consequently, are not the result of arm's length negotiations. Such terms
121
Table of Contents
are not necessarily at least as favorable to the parties to these transactions and agreements as the terms which could have been obtained from unaffiliated third parties.
Distributions and Payments to Our General Partner and Its Affiliates
In connection with the closing of our IPO, the following occurred:
- •
- Wexford contributed all of their membership interests in Rhino Energy LLC to us;
- •
- we issued to Rhino Energy Holdings LLC an aggregate of 8,666,400 common units and 12,397,000 subordinated units and reimbursed Rhino Energy Holdings LLC for approximately $9.3 million of capital expenditures it incurred with respect to the assets contributed to us;
- •
- our general partner made a capital contribution of approximately $10.4 million and maintained its 2.0% general partner interest in us; and
- •
- we issued our general partner the incentive distribution rights, which entitle the holder to increase percentages, up to a maximum of 48.0%, of the cash we distribute in excess of $0.51175 per unit per quarter.
During 2011, Wexford received distributions of approximately $1.0 million on the 2.0% general partner interest and approximately $37.6 million on its common units and subordinated units.
On February 14, 2012, Wexford received a distribution for the fourth quarter of 2011 of approximately $0.3 million on the 2.0% general partner interest and approximately $9.7 million on its common units and subordinate units.
From time to time, employees from Wexford perform legal, consulting, and advisory services for us and we incur expenses related to these services. In addition, Wexford fully and unconditionally guarantees certain of our obligations under our surety bonds with third parties to secure reclamation and other performance commitments. As of December 31, 2011, Wexford guaranteed less than 1% of our total obligations under our outstanding surety bonds.
Agreements with Affiliates
In connection with our IPO, we entered into certain agreements with Wexford, as described in more detail below.
On September 29, 2010, we entered into a contribution agreement that effected the transactions, including the transfer of the ownership interests in Rhino Energy LLC, and the use of the net proceeds, of our IPO. This agreement was not the result of arm's-length negotiations, and it, or any of the transactions that it provides for, may have not been effected on terms at least as favorable to the parties to this agreement as could have been obtained from unaffiliated third parties. All of the transaction expenses incurred in connection with these transactions were paid from the proceeds of our IPO.
Under our partnership agreement, as amended and restated, we have agreed to register for resale under the Securities Act and applicable state securities laws any common units, subordinated units or other limited partner interests proposed to be sold by our general partner or any of its affiliates or their assignees if an exemption from the registration requirements is not otherwise available. These registration rights continue for two years following any withdrawal or removal of our general partner. We are obligated to pay all expenses incidental to the registration, excluding underwriting discounts.
122
Table of Contents
In addition, in connection with our IPO, on October 5, 2010 we entered into a registration rights agreement with Rhino Energy Holdings LLC. Pursuant to the registration rights agreement, we will be required to file a registration statement to register the common units and subordinated units issued to Rhino Energy Holdings LLC and the common units issuable upon the conversion of the subordinated units upon request of Rhino Energy Holdings LLC. In addition, the registration rights agreement gives Rhino Energy Holdings LLC piggyback registration rights under certain circumstances. The registration rights agreement also includes provisions dealing with holdback agreements, indemnification and contribution and allocation of expenses. These registration rights are transferable to affiliates of Rhino Energy Holdings LLC and, in certain circumstances, to third parties.
Policies Relating to Conflicts of Interest
Conflicts of interest exist and may arise in the future as a result of the relationships between our general partner and its affiliates, including Wexford Capital, on the one hand, and our partnership and our limited partners, on the other hand. The directors and officers of our general partner have fiduciary duties to manage our general partner in a manner beneficial to its owners. At the same time, our general partner has a contractual duty to manage our partnership in a manner beneficial to us and our unitholders.
Whenever a conflict arises between our general partner or its affiliates, on the one hand, and us and our limited partners, on the other hand, our general partner will resolve that conflict. Our partnership agreement contains provisions that replace default fiduciary duties under applicable Delaware law with contractual corporate governance standards. Our partnership agreement also delimits the remedies available to our unitholders for actions taken by our general partner that, without those limitations, might constitute breaches of its default fiduciary duty under applicable Delaware law.
Our general partner will not be in breach of its obligations under our partnership agreement or its duties or obligations to us or our unitholders if the resolution of the conflict is:
- •
- approved by the conflicts committee of our general partner, although our general partner is not obligated to seek such approval;
- •
- approved by the vote of a majority of the outstanding common units, excluding any common units owned by our general partner or any of its affiliates;
- •
- on terms no less favorable to us than those generally being provided to or available from unrelated third parties; or
- •
- fair and reasonable to us, taking into account the totality of the relationships among the parties involved, including other transactions that may be particularly favorable or advantageous to us.
Our general partner may, but is not required to, seek the approval of such resolution from the conflicts committee of its board of directors. In connection with a situation involving a conflict of interest, any determination by our general partner involving the resolution of the conflict of interest must be made in good faith, provided that, if our general partner does not seek approval from the conflicts committee and its board of directors determines that the resolution or course of action taken with respect to the conflict of interest satisfies either of the standards set forth in the third and fourth bullet points above, then it will be presumed that, in making its decision, the board of directors acted in good faith, and in any proceeding brought by or on behalf of any limited partner or the partnership, the person bringing or prosecuting such proceeding will have the burden of overcoming such presumption. Unless the resolution of a conflict is specifically provided for in our partnership agreement, our general partner or the conflicts committee may consider any factors that it determines in good faith to be appropriate when resolving a conflict. When our partnership agreement provides that someone act in good faith, it requires that person to reasonably believe he is acting in the best interests of the partnership.
123
Table of Contents
Director Independence
See "Part III, Item 10. Directors, Executive Officers and Corporate Governance" for information regarding the directors of our general partner and the independence requirements applicable to the board of directors of our general partner and its committees.
Item 14. Principal Accounting Fees and Services.
The following table presents fees for professional services rendered by Deloitte & Touche LLP for 2011 and 2010:
| | | | | | | |
| | 2011 | | 2010 | |
|---|
| | (in thousands)
| |
|---|
Audit Fees(1) | | $ | 960 | | $ | 1,080 | |
Tax Fees(2) | | | 10 | | | 107 | |
| | | | | | |
Total | | $ | 970 | | $ | 1,187 | |
| | | | | | |
- (1)
- Expenditures classified as "Audit fees" above include those related to Deloitte and Touche LLP's audit of our consolidated financial statements and work performed in connection with our follow-on offering in 2011 and our IPO in 2010.
- (2)
- "Tax fees" are related to general tax advisory services.
Our audit committee has adopted an audit committee charter, which is available on our website, which requires the audit committee to pre-approve all audit and non-audit services to be provided by our independent registered public accounting firm. The audit committee does not delegate its pre-approval responsibilities to management or to an individual member of the audit committee.
124
Table of Contents
PART IV
Item 15. Exhibits, Financial Statement Schedules.
(a)(1) Financial Statements
See "Index to the Consolidated Financial Statements" set forth on Page F-1.
(2) Financial Statement Schedules
All schedules are omitted because they are not applicable or the required information is presented in the financial statements or notes thereto.
125
Table of Contents
(3) Exhibits
EXHIBIT LIST
| | | |
| Exhibit Number | | Description |
|---|
| | 2.1 | | Agreement of Merger among Rhino Resource Partners LP, Rhino Energy LLC, The Elk Horn Acquisition Co. LLC, and The Elk Horn Coal Company, LLC, and Peter Sisitsky, dated as of June 10, 2011, incorporated by reference to Exhibit 2.1 to the Current Report on Form 8-K (File No. 001-34892) filed on June 16, 2011 |
| | | | |
| | 2.2 | | Asset Purchase Agreement, dated August 15, 2011, by and among CAM Mining LLC, CAM-Kentucky Real Estate LLC, and Revelation Energy, LLC, incorporated by reference to Exhibit 2.1 of the Current Report on Form 8-K (File No. 001-034892) filed on August 19, 2011 |
| | | | |
| | 2.3 | | Assignment and Assumption Agreement dated May 6, 2011, by and between Rhino Exploration LLC, Gulfport Energy Corporation and Windsor Ohio LLC, incorporated by reference to Exhibit 10.24 of the Registration Statement on Form S-1 (File No. 333-175138), filed on June 24, 2011 |
| | | | |
| | 3.1 | | Certificate of Limited Partnership of Rhino Resource Partners LP, incorporated by reference to Exhibit 3.1 to the Registration Statement on Form S-1 (File No. 333-166550) filed on May 5, 2010 |
| | | | |
| | 3.2 | | Second Amended and Restated Agreement of Limited Partnership of Rhino Resource Partners LP, dated as of October 26, 2010, incorporated by reference to Exhibit 3.1 to the Current Report on Form 8-K (File No. 001-34892) filed on November 1, 2010 |
| | | | |
| | 4.1 | | Registration Rights Agreement, dated as of October 5, 2010, by and between Rhino Resource Partners LP and Rhino Energy Holdings LLC, incorporated by reference to Exhibit 4.1 to the Current Report on Form 8-K (File No. 001-34892) filed on October 8, 2010 |
| | | | |
| | 10.1 | | Contribution, Assignment and Assumption Agreement, dated as of September 29, 2010, by and among Rhino GP LLC, Rhino Resource Partners LP, Rhino Energy LLC, Rhino Energy Holdings LLC, Artis Investors LLC, Solitair LLC, Valentis Investors LLC, Taurus Investors LLC, Callidus Investors LLC, Wexford Spectrum Fund, L.P., Wexford Spectrum Fund Liquidating LLC, Wexford Offshore CAM Preferred Corp., Wexford Offshore CAM Common Corp., Wexford Partners Investment Co. LLC, Peter Savitz and Wexford Capital LP, incorporated by reference to Exhibit 10.1 to the Current Report on Form 8-K (File No. 001-34892) filed on October 1, 2010 |
| | | | |
| | 10.2 | | Equity Commitment Agreement, dated September 29, 2010, by and among Rhino GP LLC, CD Holding Company, LLC, Jacobs Holdings LLC, Robert H. Holtz, Mark D. Zand, Jay L. Maymudes, Arthur H. Amron, Kenneth A. Rubin, Frederick B. Simon, Kitty Capital LLC, John V. Doyle and John C. Sites, Jr., incorporated by reference to Exhibit 10.2 to the Current Report on Form 8-K (File No. 001-34892) filed on October 1, 2010 |
| | | | |
| | 10.3 | † | Rhino Long-Term Incentive Plan incorporated by reference to Exhibit 10.1 to the Current Report on Form 8-K (File No. 001-34892) filed on October 1, 2010 |
| | | | |
| | 10.4 | † | Form of Long-Term Incentive Plan Grant Agreement—Phantom Units with DERs, incorporated by reference to Exhibit 10.12 of Amendment No. 3 to the Registration Statement on Form S-1 (File No. 333-166550) filed on July 23, 2010 |
126
Table of Contents
| | | |
| Exhibit Number | | Description |
|---|
| | | | |
| | 10.5 | † | Form of Long-Term Incentive Plan Grant Agreement—Unit Awards and Restricted Units (Directors who are not Principals of Wexford), incorporated by reference to Exhibit 10.22 of Amendment No. 3 to the Registration Statement on Form S-1 (File No. 333-166550) filed on July 23, 2010 |
| | | | |
| | 10.6 | † | Form of Long-Term Incentive Plan Grant Agreement—Unit Awards and Restricted Units (Directors who are Principals of Wexford), incorporated by reference to Exhibit 10.23 of Amendment No. 3 to the Registration Statement on Form S-1 (File No. 333-166550) filed on July 23, 2010 |
| | | | |
| | 10.7 | | Credit Agreement by and among CAM Holdings LLC, the Guarantors Party Thereto, the Lenders Party Thereto, PNC Bank, National Association, as Administrative Agent, PNC National Markets LLC and National City Bank as Joint Lead Arrangers, and Wachovia Bank, National Association, Royal Bank of Canada and Raymond James Bank, FSB, as Co-Documentations Agents dated as of August 30, 2006, incorporated by reference to Exhibit 10.1 of the initial filing of the Registration Statement on Form S-1 (File No. 333-166550) filed on May 5, 2010 |
| | | | |
| | 10.8 | | First Amendment to the Credit Agreement dated December 28, 2006 by and among CAM Holdings LLC, each of the Guarantors (as defined therein), the Lenders Party Thereto, and PNC Bank, National Association, as administrative agent for the Lenders, incorporated by reference to Exhibit 10.2 of the initial filing of the Registration Statement on Form S-1 (File No. 333-166550) filed on May 5, 2010 |
| | | | |
| | 10.9 | | Second Amendment to the Credit Agreement and Consent dated March 8, 2007 by and among Rhino Energy LLC, a Delaware limited liability company formerly known as CAM Holdings LLC, each of the Guarantors (as defined therein), the Lenders Party Thereto, and PNC Bank, National Association, as administrative agent for the Lenders, incorporated by reference to Exhibit 10.3 of the initial filing of the Registration Statement on Form S-1 (File No. 333-166550) filed on May 5, 2010 |
| | | | |
| | 10.10 | | Third Amendment to the Credit Agreement dated February 29, 2008 by and among Rhino Energy LLC, a Delaware limited liability company formerly known as CAM Holdings LLC, each of the Guarantors (as defined therein), the Lenders Party Thereto, and PNC Bank, National Association, as administrative agent for the Lenders, incorporated by reference to Exhibit 10.4 of the initial filing of the Registration Statement on Form S-1 (File No. 333-166550) filed on May 5, 2010 |
| | | | |
| | 10.11 | | Fourth Amendment to the Credit Agreement dated May 15, 2008 by and among Rhino Energy LLC, a Delaware limited liability company formerly known as CAM Holdings LLC, each of the Guarantors (as defined therein), the Lenders Party Thereto, and PNC Bank, National Association, as administrative agent for the Lenders incorporated by reference to Exhibit 10.5 of the initial filing of the Registration Statement on Form S-1 (File No. 333-166550) filed on May 5, 2010 |
| | | | |
| | 10.12 | | Fifth Amendment to the Credit Agreement dated June 1, 2008 by and among Rhino Energy LLC, a Delaware limited liability company formerly known as CAM Holdings LLC, each of the Guarantors (as defined therein), the Lenders Party Thereto, and PNC Bank, National Association, as administrative agent for the Lenders, incorporated by reference to Exhibit 10.6 of the initial filing of the Registration Statement on Form S-1 (File No. 333-166550) filed on May 5, 2010 |
| |
| | |
127
Table of Contents
| | | |
| Exhibit Number | | Description |
|---|
| | 10.13 | | Sixth Amendment to the Credit Agreement dated November 4, 2008 by and among Rhino Energy LLC, a Delaware limited liability company formerly known as CAM Holdings LLC, each of the Guarantors (as defined therein), the Lenders Party Thereto, and PNC Bank, National Association, as administrative agent for the Lenders, incorporated by reference to Exhibit 10.7 of the initial filing of the Registration Statement on Form S-1 (File No. 333-166550) filed on May 5, 2010 |
| | | | |
| | 10.14 | | Seventh Amendment to the Credit Agreement dated March 31, 2009 by and among Rhino Energy LLC, a Delaware limited liability company formerly known as CAM Holdings LLC, each of the Guarantors (as defined therein), the Lenders Party Thereto, and PNC Bank, National Association, as administrative agent for the Lenders, incorporated by reference to Exhibit 10.8 of the initial filing of the Registration Statement on Form S-1 (File No. 333-166550) filed on May 5, 2010 |
| | | | |
| | 10.15 | | Eighth Amendment to the Credit Agreement dated June 30, 2010 by and among Rhino Energy LLC, a Delaware limited liability company formerly known as CAM Holdings LLC, each of the Guarantors (as defined therein), the Lenders Party Thereto, and PNC Bank, National Association, as administrative agent for the Lenders, incorporated by reference to Exhibit 10.8 of Amendment No. 2 to the Registration Statement on Form S-1 (File No. 333-166550) filed on July 19, 2010 |
| | | | |
| | 10.16 | | Amended and Restated Credit Agreement, dated July 29, 2011 by and among Rhino Energy LLC, PNC Bank, National Association, as Administrative Agent, PNC Capital Markets and Union Bank, N.A., as Joint Lead Arrangers and Joint Bookrunners, Union Bank N.A., as Syndication agent, Raymond James Bank, FSB, Wells Fargo Bank, national Association and the Huntington National Bank, as Co-Documentation Agents and the guarantors and lenders party thereto, incorporated by reference to Exhibit 10.1 of the Current report on Form 8-K (File No. 001-34892), filed on August 4, 2011 |
| | | | |
| | 10.17 | † | Employment Agreement of David G. Zatezalo dated March 31, 2010, incorporated by reference to Exhibit 10.13 of Amendment No. 1 to the Registration Statement on Form S-1 (File No. 333-166550) filed on June 21, 2010 |
| | | | |
| | 10.18 | † | Amended and Restated Employment Agreement of Andrew W. Cox dated January 14, 2011, incorporated by reference to Exhibit 10.25 to the Annual Report on Form 10-K (File No. 001-34892) filed on March 18, 2011 |
| | | | |
| | 10.19 | † | Amended and Restated Employment Agreement of Richard A. Boone dated May 31, 2011, incorporated by reference to Exhibit 10.17 of the Registration Statement on Form S-1 (File No. 333-175138), filed on June 24, 2011 |
| | | | |
| | 10.20 | † | Amended and Restated Employment Agreement of R. Chad Hunt dated September 8, 2011, incorporated by reference to Exhibit 10.1 of the Current Report on Form 8-K (File No. 001-34892) filed on September 13, 2011 |
| | | | |
| | 10.21 | † | Employment Agreement of Christopher N. Moravec dated March 31, 2010, incorporated by reference to Exhibit 10.15 of Amendment No. 1 to the Registration Statement on Form S-1 (File No. 333-166550) filed on June 21, 2010 |
| | | | |
| | 21.1 | * | List of Subsidiaries of Rhino Resource Partners LP |
| | | | |
| | 23.1 | * | Consent of Deloitte & Touche LLP |
| | | | |
| | 23.2 | * | Consent of Marshall Miller & Associates, Inc. |
| |
| | |
128
Table of Contents
| | | |
| Exhibit Number | | Description |
|---|
| | 23.3 | * | Consent of Norwest Corporation |
| | | | |
| | 31.1 | * | Certification of Chief Executive Officer Pursuant to Section 302 of the Sarbanes-Oxley Act of 2002 (18 U.S.C. Section 7241) |
| | | | |
| | 31.2 | * | Certification of Chief Financial Officer Pursuant to Section 302 of the Sarbanes-Oxley Act of 2002 (18 U.S.C. Section 7241) |
| | | | |
| | 32.1 | * | Certification of Chief Executive Officer Pursuant to Section 906 of the Sarbanes-Oxley Act of 2002 (18 U.S.C. Section 1350) |
| | | | |
| | 32.2 | * | Certification of Chief Financial Officer Pursuant to Section 906 of the Sarbanes-Oxley Act of 2002 (18 U.S.C. Section 1350) |
| | | | |
| | 95.1 | * | Mine Health and Safety Disclosure pursuant to §1503(a) of the Dodd-Frank Wall Street Reform and Consumer Protection Act for the year ended December 31, 2011 and the three months ended December 31, 2011 |
|
101.INS§ |
|
XBRL Instance Document |
|
101.SCH§ |
|
XBRL Taxonomy Extension Schema Document |
|
101.CAL§ |
|
XBRL Taxonomy Extension Calculation Linkbase Document |
|
101.DEF§ |
|
XBRL Taxonomy Definition Linkbase Document |
|
101.LAB§ |
|
XBRL Taxonomy Extension Label Linkbase Document |
|
101.PRE§ |
|
XBRL Taxonomy Extension Presentation Linkbase Document |
- *
- Filed herewith.
- †
- Management contract or compensatory plan or arrangement required to be filed as an exhibit to this 10-K pursuant to Item 15(b).
- §
- Furnished with this Form 10-K. In accordance with Rule 406T of Regulation S-T, the information in these exhibits shall not be deemed to be "filed" for purposes of Section 18 of the Securities Exchange Act of 1934, as amended, or otherwise subject to liability under that section, and shall not be incorporated by reference into any registration statement or other document filed under the Securities Act of 1933, as amended, except as expressly set forth by specific reference in such filing.
129
Table of Contents
SIGNATURES
Pursuant to the requirements of Section 13 or 15(d) of the Securities Exchange Act of 1934, the registrant has duly caused this report to be signed on its behalf by the undersigned, thereunto duly authorized.
| | | | |
| | | RHINO RESOURCE PARTNERS LP |
|
|
By: |
|
Rhino GP LLC, its general partner |
|
|
By: |
|
/s/ DAVID G. ZATEZALO
David G. Zatezalo
President, Chief Executive Officer and Director |
Date: March 15, 2012
Pursuant to the requirements of the Securities Exchange Act of 1934, this report has been signed below by the following persons on behalf of the registrant and in the capacities and on the dates indicated.
| | | | |
Signature | | Title | | Date |
|---|
|
|
|
|
|
/s/ DAVID G. ZATEZALO
David G. Zatezalo | | President, Chief Executive Officer and Director (Principal Executive Officer) | | March 15, 2012 |
/s/ RICHARD A. BOONE
Richard A. Boone |
|
Senior Vice President and Chief Financial Officer (Principal Financial and Accounting Officer) |
|
March 15, 2012 |
/s/ MARK D. ZAND
Mark D. Zand |
|
Director |
|
March 15, 2012 |
/s/ ARTHUR H. AMRON
Arthur H. Amron |
|
Director |
|
March 15, 2012 |
/s/ JAY L. MAYMUDES
Jay L. Maymudes |
|
Director |
|
March 15, 2012 |
/s/ KENNETH A. RUBIN
Kenneth A. Rubin |
|
Director |
|
March 15, 2012 |
/s/ JOSEPH M. JACOBS
Joseph M. Jacobs |
|
Director |
|
March 15, 2012 |
Table of Contents
| | | | |
Signature | | Title | | Date |
|---|
|
|
|
|
|
/s/ MARK L. PLAUMANN
Mark L. Plaumann | | Director | | March 15, 2012 |
/s/ DOUGLAS LAMBERT
Douglas Lambert |
|
Director |
|
March 15, 2012 |
/s/ JAMES F. TOMPKINS
James F. Tompkins |
|
Director |
|
March 15, 2012 |
Table of Contents
INDEX TO FINANCIAL STATEMENTS
| | |
RHINO RESOURCE PARTNERS LP | | |
Report of Independent Registered Public Accounting Firm | | F-2 |
Consolidated Statements of Financial Position as of December 31, 2011 and 2010 | | F-3 |
Consolidated Statements of Operations and Comprehensive Income for the Years Ended December 31, 2011, 2010, and 2009 | | F-4 |
Consolidated Statements of Members' Equity/Partners' Capital for the Years Ended December 31, 2011, 2010 and 2009 | | F-5 |
Consolidated Statements of Cash Flows for the Years Ended December 31, 2011, 2010 and 2009 | | F-6 |
Notes to Consolidated Financial Statements | | F-7 |
F-1
Table of Contents
REPORT OF INDEPENDENT REGISTERED PUBLIC ACCOUNTING FIRM
To the Board of Directors of
the Managing General Partner
and the Partners of
Rhino Resource Partners LP
Lexington, Kentucky
We have audited the accompanying consolidated statements of financial position of Rhino Resource Partners LP and subsidiaries (the "Partnership") as of December 31, 2011 and 2010, and the related consolidated statements of operations and comprehensive income, members' equity/partners' capital, and cash flows for each of the three years in the period ended December 31, 2011. These financial statements are the responsibility of the Partnership's management. Our responsibility is to express an opinion on the financial statements based on our audits.
We conducted our audits in accordance with the standards of the Public Company Accounting Oversight Board (United States). Those standards require that we plan and perform the audit to obtain reasonable assurance about whether the financial statements are free of material misstatement. An audit includes examining, on a test basis, evidence supporting the amounts and disclosures in the financial statements. An audit also includes assessing the accounting principles used and significant estimates made by management, as well as evaluating the overall financial statement presentation. We believe that our audits provide a reasonable basis for our opinion.
In our opinion, such consolidated financial statements present fairly, in all material respects, the financial position of Rhino Resource Partners LP and subsidiaries as of December 31, 2011 and 2010, and the results of their operations and their cash flows for each of the three years in the period ended December 31, 2011, in conformity with accounting principles generally accepted in the United States of America.
We have also audited, in accordance with the standards of the Public Company Accounting Oversight Board (United States), the Partnership's internal control over financial reporting as of December 31, 2011, based on the criteria established inInternal Control—Integrated Framework issued by the Committee of Sponsoring Organizations of the Treadway Commission and our report dated March 15, 2012 expressed an unqualified opinion on the Partnership's internal control over financial reporting.
/s/DELOITTE & TOUCHE LLP
Cincinnati, Ohio
March 15, 2012
F-2
Table of Contents
RHINO RESOURCE PARTNERS LP
CONSOLIDATED STATEMENTS OF FINANCIAL POSITION
AS OF DECEMBER 31, 2011 AND 2010
(In thousands)
| | | | | | | |
| | As of December 31, | |
|---|
| | 2011 | | 2010 | |
|---|
ASSETS | | | | | | | |
CURRENT ASSETS: | | | | | | | |
Cash and cash equivalents | | $ | 449 | | $ | 76 | |
Accounts receivable, net of allowance for doubtful accounts ($0 as of December 31, 2011 and $19 as of December 31, 2010) | | | 37,242 | | | 27,351 | |
Inventories | | | 15,629 | | | 15,635 | |
Advance royalties, current portion | | | 1,428 | | | 1,918 | |
Prepaid expenses and other | | | 4,327 | | | 5,376 | |
| | | | | | |
Total current assets | | | 59,075 | | | 50,356 | |
| | | | | | |
PROPERTY, PLANT AND EQUIPMENT: | | | | | | | |
At cost, including coal properties, mine development and construction costs | | | 637,563 | | | 442,112 | |
Less accumulated depreciation, depletion and amortization | | | (187,447 | ) | | (159,535 | ) |
| | | | | | |
Net property, plant and equipment | | | 450,116 | | | 282,577 | |
Advance royalties, net of current portion | | | 1,924 | | | 2,935 | |
Investment in unconsolidated affiliate | | | 18,736 | | | 18,749 | |
Goodwill | | | 202 | | | 202 | |
Intangible assets, net | | | 1,308 | | | 719 | |
Other non-current assets | | | 7,433 | | | 3,107 | |
| | | | | | |
TOTAL | | $ | 538,794 | | $ | 358,645 | |
| | | | | | |
LIABILITIES AND EQUITY | | | | | | | |
CURRENT LIABILITIES: | | | | | | | |
Accounts payable | | $ | 23,145 | | $ | 15,493 | |
Accrued expenses and other | | | 19,691 | | | 12,969 | |
Current portion of long-term debt | | | 1,334 | | | 2,908 | |
Current portion of asset retirement obligations | | | 3,192 | | | 4,350 | |
Current portion of postretirement benefits | | | 157 | | | 160 | |
| | | | | | |
Total current liabilities | | | 47,519 | | | 35,880 | |
| | | | | | |
NON-CURRENT LIABILITIES: | | | | | | | |
Long-term debt | | | 141,764 | | | 33,620 | |
Asset retirement obligations | | | 30,921 | | | 31,341 | |
Other non-current liabilities | | | 6,000 | | | 3,706 | |
Postretirement benefits | | | 5,492 | | | 6,481 | |
| | | | | | |
Total non-current liabilities | | | 184,177 | | | 75,148 | |
| | | | | | |
Total liabilities | | | 231,696 | | | 111,028 | |
| | | | | | |
COMMITMENTS AND CONTINGENCIES (NOTE 14) | | | | | | | |
PARTNERS' CAPITAL: | | | | | | | |
Limited partners | | | 293,100 | | | 236,582 | |
General partner | | | 11,650 | | | 10,410 | |
Accumulated other comprehensive income | | | 2,348 | | | 625 | |
| | | | | | |
Total partners' capital | | | 307,098 | | | 247,617 | |
| | | | | | |
TOTAL | | $ | 538,794 | | $ | 358,645 | |
| | | | | | |
See notes to consolidated financial statements.
F-3
Table of Contents
RHINO RESOURCE PARTNERS LP
CONSOLIDATED STATEMENTS OF OPERATIONS AND COMPREHENSIVE INCOME
FOR THE YEARS ENDED DECEMBER 31, 2011, 2010 AND 2009
(In thousands, except per unit data)
| | | | | | | | | | |
| | Year Ended December 31, | |
|---|
| | 2011 | | 2010 | | 2009 | |
|---|
REVENUES: | | | | | | | | | | |
Coal sales | | $ | 333,876 | | $ | 289,885 | | $ | 401,752 | |
Freight and handling revenues | | | 5,750 | | | 4,174 | | | 5,050 | |
Other revenues | | | 27,595 | | | 11,588 | | | 12,988 | |
| | | | | | | | |
Total revenues | | | 367,221 | | | 305,647 | | | 419,790 | |
COSTS AND EXPENSES: | | | | | | | | | | |
Cost of operations (exclusive of depreciation, depletion and amortization shown separately below) | | | 267,180 | | | 220,756 | | | 336,335 | |
Freight and handling costs | | | 4,329 | | | 2,634 | | | 3,991 | |
Depreciation, depletion and amortization | | | 36,325 | | | 34,108 | | | 36,279 | |
Selling, general and administrative (exclusive of depreciation, depletion and amortization shown separately above) | | | 21,815 | | | 16,449 | | | 16,754 | |
Asset impairment loss | | | — | | | 652 | | | — | |
(Gain) loss on sale/acquisition of assets, net | | | (3,172 | ) | | (10,716 | ) | | 1,710 | |
| | | | | | | | |
Total costs and expenses | | | 326,477 | | | 263,883 | | | 395,069 | |
| | | | | | | | |
INCOME FROM OPERATIONS | | | 40,744 | | | 41,764 | | | 24,721 | |
| | | | | | | | |
INTEREST AND OTHER INCOME (EXPENSE): | | | | | | | | | | |
Interest expense and other | | | (6,062 | ) | | (5,338 | ) | | (6,222 | ) |
Interest income and other | | | 51 | | | 24 | | | 70 | |
Equity in net income of unconsolidated affiliate | | | 3,338 | | | 4,699 | | | 893 | |
| | | | | | | | |
Total interest and other (expense) | | | (2,673 | ) | | (615 | ) | | (5,259 | ) |
| | | | | | | | |
INCOME BEFORE INCOME TAXES | | | 38,071 | | | 41,149 | | | 19,462 | |
INCOME TAXES | | | — | | | — | | | — | |
| | | | | | | | |
NET INCOME | | | 38,071 | | | 41,149 | | | 19,462 | |
| | | | | | | | |
Other comprehensive income— | | | | | | | | | | |
Change in actuarial gain under ASC Topic 815 | | | 1,723 | | | (853 | ) | | 543 | |
| | | | | | | | |
COMPREHENSIVE INCOME | | $ | 39,794 | | $ | 40,296 | | $ | 20,005 | |
| | | | | | | | |
Net income attributable to Predecessor—Jan 1 to Oct 5, 2010 | | | n/a | | $ | 35,703 | | | n/a | |
Net income attributable to Partnership—Oct 6 to Dec 31, 2010 | | | n/a | | $ | 5,446 | | | n/a | |
General partner's interest in net income | |
$ |
762 | |
$ |
109 | | |
n/a | |
Common unitholders' interest in net income | | $ | 19,603 | | $ | 2,668 | | | n/a | |
Subordinated unitholders' interest in net income | | $ | 17,706 | | $ | 2,669 | | | n/a | |
Net income per limited partner unit, basic: | | | | | | | | | | |
Common units | | $ | 1.43 | | $ | 0.22 | | | n/a | |
Subordinated units | | $ | 1.43 | | $ | 0.22 | | | n/a | |
Net income per limited partner unit, diluted: | | | | | | | | | | |
Common units | | $ | 1.43 | | $ | 0.22 | | | n/a | |
Subordinated units | | $ | 1.43 | | $ | 0.22 | | | n/a | |
Distributions paid per limited partner unit | | $ | 1.8108 | | | n/a | | | n/a | |
Weighted average number of limited partner units outstanding, basic: | | | | | | | | | | |
Common units | | | 13,725 | | | 12,400 | | | n/a | |
Subordinated units | | | 12,397 | | | 12,397 | | | n/a | |
Weighted average number of limited partner units outstanding, diluted: | | | | | | | | | | |
Common units | | | 13,744 | | | 12,413 | | | n/a | |
Subordinated units | | | 12,397 | | | 12,397 | | | n/a | |
See notes to consolidated financial statements.
F-4
Table of Contents
RHINO RESOURCE PARTNERS LP
CONSOLIDATED STATEMENTS OF MEMBERS' EQUITY/PARTNERS' CAPITAL
FOR THE YEARS ENDED DECEMBER 31, 2011, 2010 AND 2009
(In thousands)
| | | | | | | | | | | | | |
| | Members'
Investment | | Retained
Earnings | | Accumulated
Other
Comprehensive
Income/(Loss) | | Total Members'
Equity | |
|---|
BALANCE—January 1, 2009 | | $ | 22,822 | | $ | 94,554 | | $ | 935 | | $ | 118,311 | |
Members contribution | | | 85 | | | — | | | — | | | 85 | |
Net income | | | — | | | 19,462 | | | — | | | 19,462 | |
Change in actuarial gain under ASC Topic 815 | | | — | | | — | | | 543 | | | 543 | |
| | | | | | | | | | |
BALANCE—December 31, 2009 | | $ | 22,907 | | $ | 114,016 | | $ | 1,478 | | $ | 138,401 | |
Net income prior to initial public offering | | | — | | | 35,703 | | | — | | | 35,703 | |
Change in actuarial gain under ASC Topic 815 | | | — | | | — | | | (113 | ) | | (113 | ) |
Contribution to successor | | | (22,907 | ) | | (149,719 | ) | | (1,365 | ) | | (173,991 | ) |
| | | | | | | | | | |
BALANCE—October 5, 2010 | | $ | — | | $ | — | | $ | — | | $ | — | |
| | | | | | | | | | |
| | | | | | | | | | | | | | | | | | | | | | |
| | Limited Partner | |
| |
| |
| |
|---|
| | Common | | Subordinated | |
| | Accumulated
Other
Comprehensive
Income/(Loss) | |
| |
|---|
| | General
Partner
Capital | | Total
Partners'
Capital | |
|---|
| | Units | | Capital | | Units | | Capital | |
|---|
BALANCE—October 5, 2010 | | | — | | $ | — | | | — | | $ | — | | $ | — | | $ | — | | $ | — | |
Contribution from predecessor | | | 9,153 | | | 73,320 | | | 12,397 | | | 99,306 | | | — | | | 1,365 | | | 173,991 | |
Initial public offering | | | 3,244 | | | 62,012 | | | — | | | — | | | — | | | — | | | 62,012 | |
Initial general partner contribution | | | — | | | — | | | — | | | — | | | 10,373 | | | — | | | 10,373 | |
Offering costs | | | — | | | (1,842 | ) | | — | | | (1,842 | ) | | (76 | ) | | — | | | (3,760 | ) |
Net income after initial public offering | | | — | | | 2,668 | | | — | | | 2,669 | | | 109 | | | — | | | 5,446 | |
General partner's contributions | | | — | | | — | | | — | | | — | | | 4 | | | — | | | 4 | |
Equity-based compensation | | | — | | | 241 | | | — | | | — | | | — | | | — | | | 241 | |
Issuance of units under LTIP | | | 3 | | | 50 | | | — | | | — | | | — | | | — | | | 50 | |
Change in actuarial gain under ASC Topic 815 | | | — | | | — | | | — | | | — | | | — | | | (740 | ) | | (740 | ) |
| | | | | | | | | | | | | | | | |
BALANCE—December 31, 2010 | | | 12,400 | | $ | 136,449 | | | 12,397 | | $ | 100,133 | | $ | 10,410 | | $ | 625 | | $ | 247,617 | |
Net income | | | — | | | 19,603 | | | — | | | 17,706 | | | 762 | | | — | | | 38,071 | |
Distributions to unitholders and general partner | | | — | | | (25,215 | ) | | — | | | (22,449 | ) | | (972 | ) | | — | | | (48,636 | ) |
General partner's contributions | | | — | | | — | | | — | | | — | | | 1,450 | | | — | | | 1,450 | |
Offering of common units | | | 2,875 | | | 66,916 | | | — | | | — | | | — | | | — | | | 66,916 | |
Offering costs | | | — | | | (560 | ) | | — | | | (9 | ) | | — | | | — | | | (569 | ) |
Equity-based compensation | | | — | | | (241 | ) | | — | | | — | | | — | | | — | | | (241 | ) |
Issuance of units under LTIP | | | 36 | | | 767 | | | — | | | — | | | — | | | — | | | 767 | |
Change in actuarial gain under ASC Topic 815 | | | — | | | — | | | — | | | — | | | — | | | 1,723 | | | 1,723 | |
| | | | | | | | | | | | | | | | |
BALANCE—December 31, 2011 | | | 15,311 | | $ | 197,719 | | | 12,397 | | $ | 95,381 | | $ | 11,650 | | $ | 2,348 | | $ | 307,098 | |
| | | | | | | | | | | | | | | | |
See notes to consolidated financial statements.
F-5
Table of Contents
RHINO RESOURCE PARTNERS LP
CONSOLIDATED STATEMENTS OF CASH FLOWS
FOR THE YEARS ENDED DECEMBER 31, 2011, 2010 AND 2009
(In thousands)
| | | | | | | | | | |
| | Year Ended December 31, | |
|---|
| | 2011 | | 2010 | | 2009 | |
|---|
CASH FLOWS FROM OPERATING ACTIVITIES: | | | | | | | | | | |
Net income | | $ | 38,071 | | $ | 41,149 | | $ | 19,462 | |
Adjustments to reconcile net income to net cash provided by operating activities: | | | | | | | | | | |
Depreciation, depletion and amortization | | | 36,325 | | | 34,108 | | | 36,279 | |
Accretion on asset retirement obligations | | | 1,956 | | | 2,165 | | | 2,753 | |
Accretion on interest-free debt | | | 210 | | | 206 | | | 200 | |
Amortization of deferred revenue | | | (532 | ) | | — | | | — | |
Amortization of advance royalties | | | 1,104 | | | 865 | | | 215 | |
Amortization of debt issuance costs | | | 1,043 | | | 844 | | | — | |
Provision for doubtful accounts | | | (19 | ) | | — | | | 19 | |
Equity in net (income) loss of unconsolidated affiliate | | | (3,338 | ) | | (4,699 | ) | | (893 | ) |
Distributions from unconsolidated affiliate | | | 3,351 | | | — | | | — | |
(Gain) loss on retirement of advance royalties | | | 79 | | | 396 | | | 712 | |
(Gain) loss on sale of assets—net | | | (3,172 | ) | | 73 | | | 1,710 | |
Loss on impairment of assets | | | — | | | 652 | | | — | |
(Gain) on acquisition of assets | | | — | | | (10,789 | ) | | — | |
Equity-based compensation | | | 727 | | | 291 | | | — | |
Settlement of litigation | | | — | | | — | | | (1,773 | ) |
Changes in assets and liabilities: | | | | | | | | | | |
Accounts receivable | | | (7,253 | ) | | (2,968 | ) | | 3,295 | |
Inventories | | | 6 | | | (1,463 | ) | | (3,459 | ) |
Advance royalties | | | (905 | ) | | (1,541 | ) | | (1,027 | ) |
Prepaid expenses and other assets | | | 571 | | | (1,624 | ) | | 924 | |
Accounts payable | | | 4,435 | | | 1,416 | | | (5,272 | ) |
Accrued expenses and other liabilities | | | (1,752 | ) | | 1,391 | | | (963 | ) |
Asset retirement obligations | | | (4,722 | ) | | (6,049 | ) | | (11,373 | ) |
Postretirement benefits | | | 731 | | | 578 | | | 686 | |
| | | | | | | | |
Net cash provided by operating activities | | | 66,916 | | | 55,001 | | | 41,495 | |
| | | | | | | | |
CASH FLOWS FROM INVESTING ACTIVITIES: | | | | | | | | | | |
Additions to property, plant, and equipment | | | (91,856 | ) | | (26,248 | ) | | (27,836 | ) |
Proceeds from sales of property, plant, and equipment | | | 3,415 | | | 95 | | | 905 | |
Proceeds from sale of coal properties and related assets and liabilities | | | 20,000 | | | — | | | — | |
Principal payments received on notes receivable | | | 5,780 | | | 1,142 | | | 3,448 | |
Cash paid from issuance of notes receivable | | | (5,780 | ) | | (765 | ) | | (2,040 | ) |
Changes in restricted cash | | | 34 | | | (3 | ) | | — | |
Return of capital from unconsolidated affiliate | | | — | | | 3,137 | | | — | |
Acquisitions of coal companies and other properties | | | (119,617 | ) | | (15,002 | ) | | — | |
Acquisition of roof bolt manufacturing company | | | — | | | — | | | (1,821 | ) |
| | | | | | | | |
Net cash used in investing activities | | | (188,024 | ) | | (37,644 | ) | | (27,344 | ) |
| | | | | | | | |
CASH FLOWS FROM FINANCING ACTIVITIES: | | | | | | | | | | |
Borrowings on line of credit | | | 338,200 | | | 116,070 | | | 166,450 | |
Repayments on line of credit | | | (229,670 | ) | | (201,600 | ) | | (175,450 | ) |
Proceeds from issuance of long-term debt | | | 1,379 | | | 2,170 | | | 4,576 | |
Repayments on long-term debt | | | (3,550 | ) | | (2,455 | ) | | (4,943 | ) |
Payments on debt issuance costs | | | (3,758 | ) | | (782 | ) | | (1,169 | ) |
Proceeds from issuance of debt from related party | | | — | | | — | | | 50 | |
Repayments on loan payable to related party | | | — | | | — | | | (5,000 | ) |
Proceeds from issuance of common units | | | 66,916 | | | 62,012 | | | — | |
Payment of offering costs | | | (569 | ) | | (3,760 | ) | | — | |
Net settlement of withholding taxes on employee unit awards vesting | | | (281 | ) | | — | | | — | |
General partner's contributions | | | 1,450 | | | 10,377 | | | — | |
Distributions to unitholders | | | (48,636 | ) | | — | | | — | |
Contributions from members | | | — | | | — | | | 85 | |
| | | | | | | | |
Net cash (used in) provided by financing activities | | | 121,481 | | | (17,968 | ) | | (15,401 | ) |
| | | | | | | | |
NET INCREASE (DECREASE) IN CASH AND CASH EQUIVALENTS | | | 373 | | | (611 | ) | | (1,250 | ) |
CASH AND CASH EQUIVALENTS—Beginning of period | | | 76 | | | 687 | | | 1,937 | |
| | | | | | | | |
CASH AND CASH EQUIVALENTS—End of period | | $ | 449 | | $ | 76 | | $ | 687 | |
| | | | | | | | |
See notes to consolidated financial statements.
F-6
Table of Contents
RHINO RESOURCE PARTNERS LP
NOTES TO CONSOLIDATED FINANCIAL STATEMENTS
FOR THE YEARS ENDED DECEMBER 31, 2011, 2010 AND 2009
1. ORGANIZATION AND BASIS OF PRESENTATION
Organization—Rhino Resource Partners LP and subsidiaries (the "Partnership") is a Delaware limited partnership formed on April 19, 2010 to acquire Rhino Energy LLC (the "Predecessor" or the "Operating Company"), an entity engaged primarily in the mining and sale of coal. The Operating Company was formed in April 2003 and has been built via acquisitions. The Partnership had no operations during the period from April 19, 2010 (date of inception) to October 5, 2010 (the consummation of the initial public offering ("IPO") date of the Partnership). The Operating Company and its wholly owned subsidiaries produce and market coal from surface and underground mines in Kentucky, Ohio, West Virginia and Utah. The Partnership also has one underground mine located in Colorado that has been temporarily idled since year-end 2010. The majority of the Partnership's sales are made to domestic utilities and other coal-related organizations in the United States. In addition to operating coal properties, the Partnership manages and leases coal properties and collects royalties from such management and leasing activities. In addition to the Partnership's coal operations, the Partnership has invested in oil and gas mineral rights that the Partnership expects will generate royalty revenues in future periods.
Initial Public Offering
On October 5, 2010, Rhino Resource Partners LP completed its IPO of 3,244,000 common units, representing limited partner interests in the Partnership, at a price of $20.50 per common unit. Net proceeds from the offering were approximately $58.3 million, after deducting underwriting discounts and offering expenses of $8.2 million. The Partnership used the net proceeds from this offering, and a related capital contribution by Rhino GP LLC, the Partnership's general partner (the "General Partner") of approximately $10.4 million, to repay approximately $69.4 million of outstanding indebtedness under the Operating Company's credit facility. These net proceeds do not include $9.3 million that was used to reimburse affiliates of the Partnership's sponsor, Wexford Capital LP ("Wexford Capital"), for capital expenditures incurred with respect to the assets contributed to the Partnership in connection with the offering. In connection with the closing of the IPO, the owners of the Operating Company contributed their membership interests in the Operating Company to the Partnership, and the Partnership issued 12,397,000 subordinated units representing limited partner interests in the Partnership and 9,153,000 common units to Rhino Energy Holdings LLC, an affiliate of Wexford Capital, and issued incentive distribution rights to the General Partner. Upon the closing of the IPO, and as required by the Operating Company's credit agreement by and among the Operating Company, as borrower, and its subsidiaries as guarantors, and PNC Bank, National Association, as agent, and the other lenders thereto (as amended from time to time, the "Credit Agreement"), the Partnership pledged 100% of the membership interests in the Operating Company to the agent on behalf of itself and the other lenders to secure the Operating Company's obligations under the Credit Agreement.
Follow-on Offering
On July 18, 2011, the Partnership completed a public offering of 2,875,000 common units, representing limited partner interests in the Partnership, at a price of $24.50 per common unit. Of the common units issued, 375,000 units were issued in connection with the exercise of the underwriters' option to purchase additional units. Net proceeds from the offering were approximately $66.4 million, after deducting underwriting discounts and offering expenses of approximately $4.1 million. The
F-7
Table of Contents
RHINO RESOURCE PARTNERS LP
NOTES TO CONSOLIDATED FINANCIAL STATEMENTS (Continued)
FOR THE YEARS ENDED DECEMBER 31, 2011, 2010 AND 2009
1. ORGANIZATION AND BASIS OF PRESENTATION (Continued)
Partnership used the net proceeds from this offering, and a related capital contribution by the General Partner of approximately $1.4 million, to repay approximately $67.8 million of outstanding indebtedness under the Partnership's credit facility.
Basis of Presentation and Principles of Consolidation—The accompanying consolidated financial statements include the accounts of Rhino Resource Partners LP and its subsidiaries. Intercompany transactions and balances have been eliminated in consolidation.
For full year 2010 income, expense and cash flow items, the Partnership has disclosed consolidated figures of the Partnership and Predecessor as if the Partnership had operated the entire year. The closing of the IPO and the contribution of the membership interests in the Operating Company to the Partnership did not result in any basis change of the assets of the Predecessor as the Partnership and Predecessor were entities under common control and the Predecessor was contributed to the Partnership and continued operations in consistently the same manner after being contributed to the Partnership. For these reasons as well as year-to-year comparability of financial results, the 2010 full year income, expense and cash flow results are presented as one total figure. Note that the earnings per unit figures on the Consolidated Statements of Operations and Comprehensive Income and in Note 15 are based on the applicable income of the Partnership after the closing of the IPO and the contribution of the membership interests in the Operating Company to the Partnership (October 6, 2010) until year end December 31, 2010 since this is the amount of income that is attributable to the limited partner units after the closing of the IPO and the contribution of the membership interests in the Operating Company to the Partnership. For full year 2009 income, expense and cash flow items, the Partnership has disclosed consolidated figures that represent the results of the Predecessor.
2. SUMMARY OF SIGNIFICANT ACCOUNTING POLICIES AND GENERAL
Company Environment and Risk Factors. The Partnership, in the course of its business activities, is exposed to a number of risks including: fluctuating market conditions of coal, truck and rail transportation, fuel costs, changing government regulations, unexpected maintenance and equipment failure, employee benefits cost control, changes in estimates of proven and probable coal reserves, as well as the ability of the Partnership to maintain adequate financing, necessary mining permits and control of sufficient recoverable coal properties. In addition, adverse weather and geological conditions may increase mining costs, sometimes substantially.
Concentrations of Credit Risk. See Note 16 for discussion of major customers. The Partnership does not require collateral or other security on accounts receivable. The credit risk is controlled through credit approvals and monitoring procedures.
Cash and Cash Equivalents. The Partnership considers all highly liquid investments purchased with original maturities of three months or less to be cash equivalents.
Inventories. Inventories are stated at the lower of cost, based on a three month rolling average, or market. Inventories primarily consist of coal contained in stockpiles.
Advance Royalties. The Partnership is required, under certain royalty lease agreements, to make minimum royalty payments whether or not mining activity is being performed on the leased property.
F-8
Table of Contents
RHINO RESOURCE PARTNERS LP
NOTES TO CONSOLIDATED FINANCIAL STATEMENTS (Continued)
FOR THE YEARS ENDED DECEMBER 31, 2011, 2010 AND 2009
2. SUMMARY OF SIGNIFICANT ACCOUNTING POLICIES AND GENERAL (Continued)
These minimum payments may be recoupable once mining begins on the leased property. The Partnership capitalizes the recoupable minimum royalty payments and amortizes the deferred costs once mining activities begin on the units of production method or expenses the deferred costs when the Partnership has ceased mining or has made a decision not to mine on such property.
Note Receivable. At various times during 2011, the Partnership loaned to Rhino Eastern LLC ("Rhino Eastern"), a joint venture with an affiliate of Patriot Coal Corporation ("Patriot"), approximately $5.8 million that was recorded as notes receivable, which bear interest at a fixed rate of 10%. The $5.8 million reflects our proportionate share that was loaned to Rhino Eastern. The notes were fully repaid as of December 31, 2011.
Property, Plant and Equipment. Property, plant, and equipment, including coal properties, mine development costs and construction costs, are recorded at cost, which includes construction overhead and interest, where applicable. Expenditures for major renewals and betterments are capitalized, while expenditures for maintenance and repairs are expensed as incurred. Mining and other equipment and related facilities are depreciated using the straight-line method based upon the shorter of estimated useful lives of the assets or the estimated life of each mine. Coal properties are depleted using the units-of-production method, based on estimated proven and probable reserves. Mine development costs are amortized using the units-of-production method, based on estimated proven and probable reserves. The Partnership assumes zero salvage values for its property, plant and equipment when depreciation and amortization are calculated. Gains or losses arising from sales or retirements are included in current operations.
Stripping costs incurred in the production phase of a mine for the removal of overburden or waste materials for the purpose of obtaining access to coal that will be extracted are variable production costs that are included in the cost of inventory produced and extracted during the period the stripping costs are incurred. The Partnership defines a surface mine as a location where the Partnership utilizes operating assets necessary to extract coal, with the geographic boundary determined by property control, permit boundaries, and/or economic threshold limits. Multiple pits that share common infrastructure and processing equipment may be located within a single surface mine boundary, which can cover separate coal seams that typically are recovered incrementally as the overburden depth increases. In accordance with the accounting guidance for extractive mining activities, the Partnership defines a mine in production as one from which saleable minerals have begun to be extracted (produced) from an ore body, regardless of the level of production; however, the production phase does not commence with the removal of de minimis saleable mineral material that occurs in conjunction with the removal of overburden or waste material for the purpose of obtaining access to an ore body. The Partnership capitalizes only the development cost of the first pit at a mine site that may include multiple pits.
Asset Impairments. The Partnership follows the accounting guidance on the impairment or disposal of property, plant and equipment which requires that projected future cash flows from use and disposition of assets be compared with the carrying amounts of those assets when potential impairment is indicated. When the sum of projected undiscounted cash flows is less than the carrying amount, impairment losses are recognized. In determining such impairment losses, the Partnership must determine the fair value for the assets in question in accordance with the applicable fair value
F-9
Table of Contents
RHINO RESOURCE PARTNERS LP
NOTES TO CONSOLIDATED FINANCIAL STATEMENTS (Continued)
FOR THE YEARS ENDED DECEMBER 31, 2011, 2010 AND 2009
2. SUMMARY OF SIGNIFICANT ACCOUNTING POLICIES AND GENERAL (Continued)
accounting guidance. Once the fair value is determined, the appropriate impairment loss must be recorded as the difference between the carrying amount of the assets and their respective fair values. Also, in certain situations, expected mine lives are shortened because of changes to planned operations or changes in reserve estimates. When that occurs and it is determined that the mine's underlying costs are not recoverable in the future, reclamation and mine closing obligations are accelerated and the mine closing accrual is increased accordingly. To the extent it is determined that asset carrying values will not be recoverable during a shorter mine life, a provision for such impairment is recognized. The Partnership recorded an impairment loss of $0.7 million in 2010 related to certain assets that are to be disposed of by sale. Please read Note 6 for a discussion of this asset impairment loss recorded in 2010. There were no impairment losses recorded during the years ended December 31, 2011 and 2009.
Debt Issuance Costs. Debt issuance costs reflect fees incurred to obtain financing and are amortized (included in interest expense) using the effective interest method over the life of the related debt. Debt issuance costs are included in other non-current assets.
Asset Retirement Obligations. The accounting guidance for asset retirement obligations addresses asset retirement obligations that result from the acquisition, construction or normal operation of long-lived assets. This guidance requires companies to recognize asset retirement obligations at fair value when the liability is incurred or acquired. Upon initial recognition of a liability, an amount equal to the liability is capitalized as part of the related long-lived asset and allocated to expense over the useful life of the asset. The Partnership has recorded the asset retirement costs in coal properties.
The Partnership estimates its future cost requirements for reclamation of land where it has conducted surface and underground mining operations, based on its interpretation of the technical standards of regulations enacted by the U.S. Office of Surface Mining, as well as state regulations. These costs relate to reclaiming the pit and support acreage at surface mines and sealing portals at underground mines. Other reclamation costs are related to refuse and slurry ponds, as well as holding and related termination/exit costs.
The Partnership expenses contemporaneous reclamation which is performed prior to final mine closure. The establishment of the end of mine reclamation and closure liability is based upon permit requirements and requires significant estimates and assumptions, principally associated with regulatory requirements, costs and recoverable coal reserves. Annually, the Partnership reviews its end of mine reclamation and closure liability and makes necessary adjustments, including mine plan and permit changes and revisions to cost and production levels to optimize mining and reclamation efficiency. When a mine life is shortened due to a change in the mine plan, mine closing obligations are accelerated, the related accrual is increased and the related asset is reviewed for impairment, accordingly.
The adjustments to the liability from annual recosting reflect changes in expected timing, cash flow and the discount rate used in the present value calculation of the liability. Changes in the asset retirement obligations for the year ended December 31, 2011 were calculated with discount rates that ranged from 4.2% to 7.0% depending upon the timing of the cash flows of the specific obligations. The discount rates changed from previous years due to changes in applicable market indicators that are used to arrive at an appropriate discount rate. Changes in the asset retirement obligations for the years ended December 31, 2010 and 2009 were calculated with a discount rate of 7.5% and 10%,
F-10
Table of Contents
RHINO RESOURCE PARTNERS LP
NOTES TO CONSOLIDATED FINANCIAL STATEMENTS (Continued)
FOR THE YEARS ENDED DECEMBER 31, 2011, 2010 AND 2009
2. SUMMARY OF SIGNIFICANT ACCOUNTING POLICIES AND GENERAL (Continued)
respectively. Other recosting adjustments to the liability are made annually based on inflationary cost increases or decreases and changes in the expected operating periods of the mines. The related inflation rate utilized in the recosting adjustments was 2.5% for 2011 and 3.0% for 2010 and 2009.
Workers' Compensation Benefits. Certain of the Partnership's subsidiaries are liable under federal and state laws to pay workers' compensation and coal workers' pneumoconiosis ("black lung") benefits to eligible employees, former employees and their dependents. The Partnership currently utilizes an insurance program and state workers' compensation fund participation to secure its on-going obligations depending on the location of the operation. Premium expense for workers' compensation benefits is recognized in the period in which the related insurance coverage is provided. As of December 31, 2011 and 2010, the workers' compensation benefits liability balance included approximately $6.0 million and $3.7 million, respectively, in the non-current liabilities section of the Partnership's Consolidated Statements of Financial Position.
Revenue Recognition. Most of the Partnership's revenues are generated under long-term coal sales contracts with electric utilities, industrial companies or other coal-related organizations, primarily in the eastern United States. Revenue is recognized and recorded when shipment or delivery to the customer has occurred, prices are fixed or determinable and the title or risk of loss has passed in accordance with the terms of the sales agreement. Under the typical terms of these agreements, risk of loss transfers to the customers at the mine or port, when the coal is loaded on the rail, barge, truck or other transportation source that delivers coal to its destination. Advance payments received are deferred and recognized in revenue as coal is shipped and title has passed.
Coal sales revenues also result from the sale of brokered coal produced by others. The revenues related to brokered coal sales are included in coal sales revenues on a gross basis and the corresponding cost of the coal from the supplier is recorded in cost of coal sales in accordance with the revenue recognition accounting guidance on principal agent considerations.
Freight and handling costs paid directly to third-party carriers and invoiced to coal customers are recorded as freight and handling costs and freight and handling revenues, respectively.
Other revenues generally consist of coal royalty revenues, limestone sales, roof bolt sales, coal handling and processing, rebates and rental income. Coal royalty revenues are recognized on the basis of tons of coal sold by the Partnership's lessees and the corresponding gross revenues from those sales. The leases are based on (1) minimum monthly or annual payments, (2) a minimum dollar royalty per ton and/or a percentage of the gross sales price, or (3) a combination of both. Coal royalty revenues are recorded from royalty reports submitted by the lessee, which are reconciled and subject to audit by the Partnership. Most of the Partnership's lessees are required to make minimum monthly or annual royalty payments that are recoupable over certain time periods, generally two years. If tonnage royalty revenues do not meet the required minimum amount, the difference is paid as a deficiency. These deficiency payments received are recognized as an unearned revenue liability because they are generally recoupable over certain time periods. When a lessee recoups a deficiency payment through production, the recouped amount is deducted from the unearned revenue liability and added to revenue attributable to the coal royalty revenue in the current period. If a lessee does not recoup a deficiency paid during the allocated time period, the recoupment right lost becomes revenue in the current period and is deducted from the liability.
F-11
Table of Contents
RHINO RESOURCE PARTNERS LP
NOTES TO CONSOLIDATED FINANCIAL STATEMENTS (Continued)
FOR THE YEARS ENDED DECEMBER 31, 2011, 2010 AND 2009
2. SUMMARY OF SIGNIFICANT ACCOUNTING POLICIES AND GENERAL (Continued)
With respect to other revenues recognized in situations unrelated to the shipment of coal or coal royalties, the Partnership carefully reviews the facts and circumstances of each transaction and does not recognize revenue until the following criteria are met: persuasive evidence of an arrangement exists, delivery has occurred or services have been rendered, the seller's price to the buyer is fixed or determinable and collectibility is reasonably assured. Advance payments received are deferred and recognized in revenue when earned.
Equity-Based Compensation. The Partnership applies the provisions of ASC 718 to account for any unit awards granted to employees or directors. This guidance requires that all share-based payments to employees, including grants of stock options, be recognized in the financial statements based on their fair value. The General Partner has currently granted restricted units and phantom units to directors and certain employees of the General Partner and Partnership that contain only a service condition. The fair value of each restricted unit and phantom unit award was calculated using the closing price of the Partnership's common units on the date of grant.
With the vesting of the first portion of the employees' awards in early April 2011, the Compensation Committee of the board of directors of the General Partner elected to pay some of the awards in cash or a combination of cash and common units. This election was a change in policy from December 31, 2010 since management had previously planned to settle all employee awards with units upon vesting as per the grant agreements. This policy change resulted in a modification of all employee awards from equity to liability classification as of March 31, 2011. Thus, the employee awards are required to be marked-to-market each reporting period until they are vested. Unit awards granted to directors of the General Partner are considered nonemployee equity-based awards since the directors are not elected by unitholders. Thus, these director awards are also required to be marked-to-market each reporting period until they are vested. Expense related to unit awards is recorded in the selling, general and administrative line of the Partnership's consolidated statements of operations and comprehensive income.
Derivative Financial Instruments. The Partnership uses diesel fuel forward contracts to manage the risk of fluctuations in the cost of diesel fuel. The Partnership's diesel fuel forward contracts qualify for the normal purchase normal sale ("NPNS") exception prescribed by the accounting guidance on derivatives and hedging, based on management's intent and ability to take physical delivery of the diesel fuel.
Investment in Joint Venture. Investments in other entities are accounted for using the consolidation, equity method or cost basis depending upon the level of ownership, the Partnership's ability to exercise significant influence over the operating and financial policies of the investee and whether the Partnership is determined to be the primary beneficiary of a variable interest entity. Equity investments are recorded at original cost and adjusted periodically to recognize the Partnership's proportionate share of the investees' net income or losses after the date of investment. Any losses from the Partnership's equity method investment are absorbed by the Partnership based upon its proportionate ownership percentage. If losses are incurred that exceed the Partnership's investment in the equity method entity, then the Partnership must continue to record its proportionate share of losses in excess of its investment. Investments are written down only when there is clear evidence that a decline in value that is other than temporary has occurred.
F-12
Table of Contents
RHINO RESOURCE PARTNERS LP
NOTES TO CONSOLIDATED FINANCIAL STATEMENTS (Continued)
FOR THE YEARS ENDED DECEMBER 31, 2011, 2010 AND 2009
2. SUMMARY OF SIGNIFICANT ACCOUNTING POLICIES AND GENERAL (Continued)
In May 2008, the Operating Company entered into a joint venture, Rhino Eastern, with an affiliate of Patriot to acquire the Eagle mining complex. To initially capitalize the joint venture, the Operating Company contributed approximately $16.1 million for a 51% ownership interest in the joint venture and accounts for the investment in the joint venture and its results of operations under the equity method. The Partnership considers the operations of this entity to comprise a reporting segment ("Eastern Met") and has provided additional detail related to this operation in Note 20, "Segment Information."
In determining that the Partnership was not the primary beneficiary of the variable interest entity for the years ended December 31, 2011, 2010 and 2009, the Partnership performed a qualitative and quantitative analysis based on the controlling economic interests of the joint venture. This included an analysis of the expected economic contributions of the joint venture. The Partnership concluded that it is not the primary beneficiary of the joint venture primarily because of certain contractual arrangements by the joint venture with Patriot. Mandatory pro rata additional contributions not to exceed $10 million in the aggregate could be required of the joint venture partners which the Partnership would be obligated to fund based upon its 51% ownership interest.
As of December 31, 2011 and 2010, the Partnership has recorded its equity method investment of $18.7 million as a long-term asset. The Partnership has not provided any additional contractually required support as of December 31, 2011. As disclosed in Note 18 "Related Party and Affiliate Transactions", the Partnership provided a loan based upon its ownership share to the joint venture in the amount of $0.4 million as of December 31, 2009 that was fully repaid as of December 31, 2010 and during 2011, the Partnership provided loans based upon its ownership share to the joint venture totaling approximately $5.8 million that were fully repaid as of December 31, 2011.
Income Taxes. The Partnership is considered a partnership for income tax purposes. Accordingly, the partners report the Partnership's taxable income or loss on their individual tax returns.
Loss Contingencies. In accordance with the guidance on accounting for contingencies, the Partnership records loss contingencies at such time that an unfavorable outcome becomes probable and the amount can be reasonably estimated. When the reasonable estimate is a range, the recorded loss is the best estimate within the range. If no amount in the range is a better estimate than any other amount, the minimum amount of the range is recorded. The Partnership discloses information concerning loss contingencies for which an unfavorable outcome is probable. See Note 14, "Commitments and Contingencies," for a discussion of such matters.
Management's Use of Estimates. The preparation of consolidated financial statements in conformity with accounting principles generally accepted in the United States of America requires management to make estimates and assumptions that affect the reported amounts of assets, liabilities and disclosure of contingent assets and liabilities at the date of the consolidated financial statements as well as the reported amounts of revenues and expenses during the reporting period. Actual results could differ from those estimates.
Recently Issued Accounting Standards. In December 2010, the FASB published ASU No. 2010-29, "Disclosure of Supplementary Pro Forma Information for Business Combinations". The accounting guidance on business combinations requires a public entity to disclose pro forma information for
F-13
Table of Contents
RHINO RESOURCE PARTNERS LP
NOTES TO CONSOLIDATED FINANCIAL STATEMENTS (Continued)
FOR THE YEARS ENDED DECEMBER 31, 2011, 2010 AND 2009
2. SUMMARY OF SIGNIFICANT ACCOUNTING POLICIES AND GENERAL (Continued)
business combinations that occurred in the current reporting period. The disclosures include pro forma revenue and earnings of the combined entity for the current reporting period as though the acquisition date for all business combinations that occurred during the year had been as of the beginning of the annual reporting period. If comparative financial statements are presented, the pro forma revenue and earnings of the combined entity for the comparable prior reporting period should be reported as though the acquisition date for all business combinations that occurred during the current year had been as of the beginning of the comparable prior annual reporting period. ASU No. 2010-29 specifies that if a public entity presents comparative financial statements, the entity should disclose revenue and earnings of the combined entity as though the business combination(s) that occurred during the current year had occurred as of the beginning of the comparable prior annual reporting period only. The amendments in ASU No. 2010-29 also expand the supplemental pro forma disclosures under business combination accounting to include a description of the nature and amount of material, nonrecurring pro forma adjustments directly attributable to the business combination included in the reported pro forma revenue and earnings. ASU No. 2010-29 is effective prospectively for business combinations for which the acquisition date is on or after the beginning of the first annual reporting period beginning on or after December 15, 2010. The Partnership adopted the provisions of ASU No. 2010-29 effective January 1, 2011 and applied the provisions of this ASU in the disclosure of the business combination that is included in Note 3. Since this ASU only modifies disclosure requirements for business combinations, this ASU did not have a material effect on the Partnership's consolidated financial statements.
In September 2011, the FASB published ASU No. 2011-08, "Intangibles—Goodwill and Other (Topic 350) Testing Goodwill for Impairment". Under the amendments in this ASU, an entity has the option to first assess qualitative factors to determine whether the existence of events or circumstances leads to a determination that it is more likely than not that the fair value of a reporting unit is less than its carrying amount. If, after assessing the totality of events or circumstances, an entity determines it is not more likely than not that the fair value of a reporting unit is less than its carrying amount, then performing the two-step goodwill impairment test is unnecessary. However, if an entity concludes otherwise, then it is required to perform the first step of the two-step goodwill impairment test by calculating the fair value of the reporting unit and comparing the fair value with the carrying amount of the reporting unit. If the carrying amount of a reporting unit exceeds its fair value, then the entity is required to perform the second step of the goodwill impairment test to measure the amount of the impairment loss, if any. Under the amendments in this ASU, an entity has the option to bypass the qualitative assessment for any reporting unit in any period and proceed directly to performing the first step of the two-step goodwill impairment test. An entity may resume performing the qualitative assessment in any subsequent period. The ASU is effective for annual and interim goodwill impairment tests performed for fiscal years beginning after December 15, 2011 and early adoption is permitted. The Partnership is evaluating the provisions of the ASU, but the Partnership does not believe this new accounting guidance will have a material effect on the Partnership's consolidated financial statements.
In June 2011, the FASB published ASU No. 2011-05, "Comprehensive Income (Topic 220): Presentation of Comprehensive Income". Under the amendments in this ASU, an entity has the option to present the total of comprehensive income, the components of net income, and the components of other comprehensive income either in a single continuous statement of comprehensive income or in two separate but consecutive statements. In both choices, an entity is required to present each
F-14
Table of Contents
RHINO RESOURCE PARTNERS LP
NOTES TO CONSOLIDATED FINANCIAL STATEMENTS (Continued)
FOR THE YEARS ENDED DECEMBER 31, 2011, 2010 AND 2009
2. SUMMARY OF SIGNIFICANT ACCOUNTING POLICIES AND GENERAL (Continued)
component of net income along with total net income, each component of other comprehensive income along with a total for other comprehensive income, and a total amount for comprehensive income. In a single continuous statement, the entity is required to present the components of net income and total net income, the components of other comprehensive income and a total for other comprehensive income, along with the total of comprehensive income in that statement. In the two-statement approach, an entity is required to present components of net income and total net income in the statement of net income. The statement of other comprehensive income should immediately follow the statement of net income and include the components of other comprehensive income and a total for other comprehensive income, along with a total for comprehensive income. Regardless of whether an entity chooses to present comprehensive income in a single continuous statement or in two separate but consecutive statements, the entity is required to present on the face of the financial statements reclassification adjustments for items that are reclassified from other comprehensive income to net income in the statement(s) where the components of net income and the components of other comprehensive income are presented. The amendments in this ASU do not change the items that must be reported in other comprehensive income or when an item of other comprehensive income must be reclassified to net income. The amendments do not change the option for an entity to present components of other comprehensive income either net of related tax effects or before related tax effects, with one amount shown for the aggregate income tax expense or benefit related to the total of other comprehensive income items. In both cases, the tax effect for each component must be disclosed in the notes to the financial statements or presented in the statement in which other comprehensive income is presented. The amendments do not affect how earnings per share is calculated or presented. For public entities, the amendments of this ASU are effective for fiscal years, and interim periods within those years, beginning after December 15, 2011.
Subsequently, in December 2011, the FASB issued ASU No. 2011-12, "Comprehensive Income (Topic 220): Deferral of the Effective Date for Amendments to the Presentation of Reclassifications of Items Out of Accumulated Other Comprehensive Income in Accounting Standards Update No. 2011-05". In order to defer only those changes in Update 2011-05 that relate to the presentation of reclassification adjustments, the paragraphs in this ASU supersede certain pending paragraphs in ASU 2011-05. The amendments are being made to allow the FASB time to re-deliberate whether to present on the face of the financial statements the effects of reclassifications out of accumulated other comprehensive income on the components of net income and other comprehensive income for all periods presented. While the FASB is considering the operational concerns about the presentation requirements for reclassification adjustments and the needs of financial statement users for additional information about reclassification adjustments, entities should continue to report reclassifications out of accumulated other comprehensive income consistent with the presentation requirements in effect before ASU 2011-05. All other requirements in ASU 2011-05 are not affected by this ASU 2011-12, including the requirement to report comprehensive income either in a single continuous financial statement or in two separate but consecutive financial statements. Public entities should apply these requirements for fiscal years, and interim periods within those years, beginning after December 15, 2011. The Partnership has consistently presented comprehensive income in a single continuous statement with net income, so the provisions of ASU 2011-05 and the related deferral included in ASU 2011-12 are not expected to have a material effect on the Partnership's consolidated financial statements.
F-15
Table of Contents
RHINO RESOURCE PARTNERS LP
NOTES TO CONSOLIDATED FINANCIAL STATEMENTS (Continued)
FOR THE YEARS ENDED DECEMBER 31, 2011, 2010 AND 2009
3. SUBSEQUENT EVENTS
On January 23, 2012, the Partnership announced a cash distribution of $0.48 per common unit and subordinated unit, or $1.92 per unit on an annualized basis. This distribution was paid on February 14, 2012 to all unitholders of record as of the close of business on February 2, 2012.
On February 29, 2012, the Partnership completed an agreement to sell certain non-core mining assets located in Pike County Kentucky to a third party for approximately $0.6 million. The transaction also extinguished certain liabilities related to the assets sold.
On March 6, 2012, the Partnership completed a lease agreement with a third party for an estimated 1,500 acres the Partnership owns in the Utica Shale region in Harrison County Ohio. The lease agreement is for an initial five year term with an optional three year renewal period and conveys rights to the third party to perform drilling and operating activities for producing oil, natural gas or other hydrocarbons. As part of the lease agreement, the third party agreed to pay the Partnership the sum of $6,000 per acre as a lease bonus, of which $500,000 was paid at the signing of the lease agreement. The remainder of the lease bonus payment shall be paid by the third party to the Partnership within 90 days from the date the lease agreement was signed. In addition, the lease agreement stipulates that the third party shall pay the Partnership a 20% royalty based upon the gross proceeds received from the sale of oil and/or natural gas recovered from the leased property.
4. BUSINESS COMBINATIONS AND OTHER ACQUISITIONS
Acquisition of The Elk Horn Coal Company, LLC
In June 2011, the Partnership completed the acquisition of 100% of the ownership interests in The Elk Horn Coal Company, LLC ("Elk Horn") for approximately $119.7 million in cash consideration, or approximately $119.6 million net of cash acquired (referred to as the "Elk Horn Acquisition"). Elk Horn is primarily a coal leasing company that owns or controls coal reserves and non-reserve coal deposits and surface acreage in eastern Kentucky. The Elk Horn acquisition was initially funded with borrowings under the Partnership's credit facility. The Partnership completed a public offering of the Partnership's common units in July 2011 that provided proceeds the Partnership used to repay existing
F-16
Table of Contents
RHINO RESOURCE PARTNERS LP
NOTES TO CONSOLIDATED FINANCIAL STATEMENTS (Continued)
FOR THE YEARS ENDED DECEMBER 31, 2011, 2010 AND 2009
4. BUSINESS COMBINATIONS AND OTHER ACQUISITIONS (Continued)
indebtedness on its credit facility that was incurred from the Elk Horn acquisition. The following table summarizes the assets acquired and liabilities assumed as of the acquisition date:
| | | | |
| | (in thousands) | |
|---|
Cash | | $ | 58 | |
Accounts receivable | | | 2,619 | |
Prepaid expenses and other | | | 94 | |
Property, plant and equipment | | | 7,466 | |
Mine development costs | | | 3,000 | |
Coal properties | | | 111,647 | |
Intangible assets | | | 654 | |
Other non-current assets | | | 1,112 | |
Accounts payable | | | (79 | ) |
Deferred revenues | | | (2,499 | ) |
Accrued expenses and other | | | (1,691 | ) |
Asset retirement obligations | | | (2,707 | ) |
| | | | |
Net assets acquired | | | 119,674 | |
| | | | |
Total consideration | | $ | 119,674 | |
| | | | |
Although the responsibility of valuation remains with the Partnership's management, the determination of the fair values of the various assets and liabilities acquired were based in part upon studies conducted by third-party professionals with experience in the appropriate subject matter. The studies related to the value of the property, plant and equipment, coal properties, intangible assets acquired and asset retirement obligations. The table above reflects the allocation of the purchase price to the fair value of the assets acquired and liabilities assumed in the Elk Horn acquisition, which resulted in no recognition of goodwill or gain on the acquisition.
At year-end 2011, the Partnership finalized the review of various third-party studies for the valuation of certain assets acquired and liabilities assumed in the Elk Horn acquisition. The values for property, plant and equipment, coal properties, intangible assets and asset retirement obligations were adjusted from management's previous estimates that were disclosed in interim periods in 2011 to the appropriate opening balances listed above based upon management's review and verification of the applicable third party reports for these items. In addition, the balances for other asset and liability accounts, including cash, accounts receivable, accounts payable and accrued expenses and other, were adjusted from previous amounts disclosed in interim periods in 2011 based upon detailed account reviews conducted since the acquisition.
The fair value of accounts receivable approximated its carrying value of $2.6 million. The gross amount due from customers was $3.5 million, of which $0.9 million was estimated to be uncollectible due to the bankruptcy of one customer in late 2010.
The $0.7 million of intangible assets recognized in the Elk Horn acquisition consisted of values related to the Elk Horn trade name as well as the existing customer list. See Note 7 for more information on these intangible assets.
F-17
Table of Contents
RHINO RESOURCE PARTNERS LP
NOTES TO CONSOLIDATED FINANCIAL STATEMENTS (Continued)
FOR THE YEARS ENDED DECEMBER 31, 2011, 2010 AND 2009
4. BUSINESS COMBINATIONS AND OTHER ACQUISITIONS (Continued)
The $2.5 million of deferred revenue assumed in the Elk Horn transaction consisted of advance royalty payments received from customers. Accrued expenses and other liabilities of $1.7 million assumed in the Elk Horn transaction consisted mostly of accrued tax liabilities and also included approximately $0.7 million related to a worker's compensation claim related to a time period before the acquisition date when Elk Horn provided insurance for its contractors through a self-insurance program. The Partnership believes an adequate amount has been accrued for this liability assumed in the Elk Horn acquisition for potential claims under this previous self-insurance program based on the Partnership's assessment that it is both probable that a liability has been incurred and the amount of loss can be reasonably estimated. The Partnership believes the remaining liabilities assumed at the acquisition date did not consist of any contingent liabilities that would result in future adjustments to the purchase price allocation.
The acquisition of Elk Horn is included in Acquisition of coal companies and other properties in the investing section of the condensed consolidated statements of cash flows. Of the total purchase price, approximately $6.1 million was placed in escrow for a period of 12 months from the closing date to secure indemnification obligations of Elk Horn and its former ownership members relating to the accuracy of representations and warranties, as well as potential adjustments related to working capital. The acquisition consideration held in escrow does not meet the definition of contingent consideration as provided under the accounting guidance for business combinations. The amount held in escrow was included in the acquisition accounting as part of the consideration transferred by the Partnership as representations and warranties were expected to be valid as of the acquisition date.
Acquisition-related costs incurred for the Elk Horn acquisition were immaterial.
The Partnership's consolidated statements of operations and comprehensive income do not include revenue, costs or net income from Elk Horn prior to June 10, 2011, the effective date of the acquisition. The post-acquisition revenue of Elk Horn that is included in the Partnership's results was approximately $13.0 million for the year ended December 31, 2011. The post-acquisition net income of Elk Horn that is included in the Partnership's results was approximately $7.7 million for the year ended December 31, 2011.
The following table presents selected unaudited pro forma financial information for the years ended December 31, 2011 and 2010, as if the acquisition had occurred on January 1, 2010. The pro forma information was prepared using Elk Horn's historical financial data and also reflects adjustments based upon assumptions by the Partnership's management to give effect for certain pro forma items that are directly attributable to the acquisition. These pro forma adjustment items include increased depletion expense related to the step-up in basis for the mineral assets acquired and increased interest expense from borrowings incurred to fund the acquisition. The pro forma adjustments for interest expense and earnings per unit reflect the net amount of the additional borrowings incurred by the Partnership in June 2011 to initially fund the acquisition that were partially offset by proceeds from
F-18
Table of Contents
RHINO RESOURCE PARTNERS LP
NOTES TO CONSOLIDATED FINANCIAL STATEMENTS (Continued)
FOR THE YEARS ENDED DECEMBER 31, 2011, 2010 AND 2009
4. BUSINESS COMBINATIONS AND OTHER ACQUISITIONS (Continued)
common units issued in a public offering completed in July 2011. Supplemental pro forma revenue, net earnings and earnings per unit disclosures are as follows.
| | | | | | | |
| | Year ended
December 31, | |
|---|
| | 2011 | | 2010 | |
|---|
| | (in thousands)
| |
|---|
Revenues: | | | | | | | |
As reported | | $ | 367,221 | | $ | 305,647 | |
Pro forma adjustments | | | 9,477 | | | 11,057 | |
| | | | | | |
Pro forma revenues | | $ | 376,698 | | $ | 316,704 | |
| | | | | | |
Net Income: | | | | | | | |
As reported | | $ | 38,071 | | $ | 41,149 | |
Pro forma adjustments | | | 3,129 | | | 2,195 | |
| | | | | | |
Pro forma net income | | $ | 41,200 | | $ | 43,344 | |
| | | | | | |
Net income per limited partner unit, diluted: | | | | | | | |
As reported | | $ | 1.43 | | $ | 0.22 | |
Pro forma adjustments | | $ | 0.03 | | $ | 0.02 | |
| | | | | | |
Pro forma net income per limited partner unit | | $ | 1.46 | | $ | 0.24 | |
| | | | | | |
Acquisition of Oil and Gas Mineral Rights
During the year ended December 31, 2011, the Partnership completed the acquisition of certain oil and gas mineral rights in the Cana Woodford region of western Oklahoma for a total purchase price of approximately $8.1 million. The Partnership expects royalty revenues to be generated from these mineral rights in future periods.
The Partnership and an affiliate of Wexford Capital have participated with Gulfport Energy, a publicly traded company, to acquire an interest in a portfolio of oil and gas leases in the Utica Shale. An affiliate of Wexford Capital owns approximately 13.3% of the common stock of Gulfport Energy as of February 20, 2012. During the year ended December 31, 2011, the Partnership completed the acquisitions of interests in a portfolio of leases in the Utica Shale region of eastern Ohio for a total purchase price of approximately $19.9 million. The Partnership is evaluating future alternatives for its Utica Shale investment.
Acquisition of Coal Property
In August 2011, the Partnership purchased non-reserve coal deposits at its Sands Hill operation for approximately $2.5 million, which is estimated to include approximately 2.5 million tons of coal resources.
In June 2011, the Partnership acquired approximately 32,600 acres and associated surface rights in Randolph and Upshur Counties, West Virginia for approximately $7.5 million. These development stage properties are unpermitted and contain no infrastructure. The Partnership plans to fully explore these
F-19
Table of Contents
RHINO RESOURCE PARTNERS LP
NOTES TO CONSOLIDATED FINANCIAL STATEMENTS (Continued)
FOR THE YEARS ENDED DECEMBER 31, 2011, 2010 AND 2009
4. BUSINESS COMBINATIONS AND OTHER ACQUISITIONS (Continued)
properties and intends to confirm additional mineable underground metallurgical coal reserves and eventually commence production.
Acquisition of the C.W. Mining Company
In August 2010, the Predecessor acquired certain assets for cash consideration of approximately $15.0 million from the Trustee of the Federal Bankruptcy Court charged with the sale of the C. W. Mining Company assets. These assets are located in Emery and Carbon Counties, Utah. Prior to the purchase of the assets, the Operating Company formed a new wholly owned subsidiary, Castle Valley Mining LLC ("Castle Valley"). Castle Valley in turn acquired the following assets and liabilities (of the former C.W. Mining Company) from the Operating Company:
- •
- the Coal Operating Agreement whereby Castle Valley became a sub-lessee of certain federal coal leases owned by the Bureau of Land Management;
- •
- buildings, mining equipment, conveyor belts and belt structure, a truck loading facility and other mining assets; and
- •
- reclamation or "end of mine" liabilities.
The Partnership staffed the location and rehabilitated the mine and equipment and began production from these assets at one underground mine in the first quarter of 2011. The coal produced and sold from these mining assets is being sold as steam coal.
The Partnership allocated the purchase price of $15.0 million to the assets and liabilities acquired based upon their respective fair values in accordance with Accounting Standards Codification ("ASC") Topic 805. The fair value of the assets acquired and liabilities assumed in this transaction are as follows:
| | | | |
| | (in thousands) | |
|---|
Mining and other equipment & related facilities | | $ | 8,689 | |
Asset retirement costs | | | 933 | |
Coal properties | | | 17,100 | |
Asset retirement obligation liability assumed | | | (933 | ) |
| | | | |
Net assets acquired | | | 25,789 | |
Gain on bargain purchase | | | (10,789 | ) |
| | | | |
Total consideration | | $ | 15,000 | |
| | | | |
Although the responsibility of valuation remains with the Partnership's management, the determination of the fair values of the various assets and liabilities acquired was based in part upon studies conducted by third-party professionals with experience in the appropriate subject matter. Because the fair value of the assets acquired exceeded the purchase price, the Partnership recorded a gain of $10.8 million in the third quarter of 2010. A gain resulted from this acquisition since the assets were purchased in a distressed sale out of bankruptcy.
F-20
Table of Contents
RHINO RESOURCE PARTNERS LP
NOTES TO CONSOLIDATED FINANCIAL STATEMENTS (Continued)
FOR THE YEARS ENDED DECEMBER 31, 2011, 2010 AND 2009
5. PREPAID EXPENSES AND OTHER CURRENT ASSETS
Prepaid expenses and other current assets as of December 31, 2011 and 2010 consisted of the following:
| | | | | | | |
| | December 31, | |
|---|
| | 2011 | | 2010 | |
|---|
| | (in thousands)
| |
|---|
Other prepaid expenses | | $ | 577 | | $ | 929 | |
Prepaid insurance | | | 1,526 | | | 3,239 | |
Prepaid leases | | | 103 | | | 82 | |
Supply inventory | | | 1,951 | | | 956 | |
Deposits | | | 170 | | | 170 | |
| | | | | | |
Total | | $ | 4,327 | | $ | 5,376 | |
| | | | | | |
6. PROPERTY, PLANT AND EQUIPMENT
Property, plant and equipment, including coal properties and mine development and construction costs, as of December 31, 2011 and 2010 are summarized by major classification as follows:
| | | | | | | | | |
| |
| | December 31, | |
|---|
| | Useful Lives | | 2011 | | 2010 | |
|---|
| |
| | (in thousands)
| |
|---|
Land and land improvements | | | | $ | 33,298 | | $ | 25,748 | |
Mining and other equipment and related facilities | | 2 - 20 Years | | | 244,819 | | | 218,886 | |
Mine development costs | | 1 - 15 Years | | | 65,824 | | | 56,857 | |
Coal properties | | 1 - 15 Years | | | 266,319 | | | 132,431 | |
Construction work in process | | | | | 27,303 | | | 8,190 | |
| | | | | | | | |
Total | | | | | 637,563 | | | 442,112 | |
Less accumulated depreciation, depletion and amortization | | | | | (187,447 | ) | | (159,535 | ) |
| | | | | | | | |
Net | | | | $ | 450,116 | | $ | 282,577 | |
| | | | | | | | |
Depreciation expense for mining and other equipment and related facilities, depletion expense for coal properties, amortization expense for mine development costs, amortization expense for intangible
F-21
Table of Contents
RHINO RESOURCE PARTNERS LP
NOTES TO CONSOLIDATED FINANCIAL STATEMENTS (Continued)
FOR THE YEARS ENDED DECEMBER 31, 2011, 2010 AND 2009
6. PROPERTY, PLANT AND EQUIPMENT (Continued)
assets and amortization expense for asset retirement costs for the years ended December 31, 2011, 2010 and 2009 was as follows:
| | | | | | | | | | |
| | Year Ended December 31, | |
|---|
| | 2011 | | 2010 | | 2009 | |
|---|
| | (in thousands)
| |
|---|
Depreciation expense-mining and other equipment and related facilities | | $ | 26,467 | | $ | 26,791 | | $ | 29,247 | |
Depletion expense for coal properties | | | 5,140 | | | 1,807 | | | 2,315 | |
Amortization expense for mine development costs | | | 3,322 | | | 2,138 | | | 2,875 | |
Amortization expense for intangible assets | | | 65 | | | 87 | | | — | |
Amortization expense for asset retirement costs | | | 1,331 | | | 3,285 | | | 1,842 | |
| | | | | | | | |
Total | | $ | 36,325 | | $ | 34,108 | | $ | 36,279 | |
| | | | | | | | |
During the fourth quarter of 2010, the management of the Partnership made a strategic decision to dispose of certain assets of two of its ancillary businesses. As of December 31, 2010, the management of the Partnership tested the assets related to these ancillary businesses for recoverability by comparing expected undiscounted future cash flows to their carrying values. This analysis indicated a potential impairment existed for these specific assets. Since the potential for impairment existed for these assets, the Partnership measured an impairment loss by determining the amount by which the carrying amount of the assets exceeded their fair value. Additionally, the Partnership determined the specific assets of these ancillary businesses should be classified as held for sale since they were being actively marketed to third-party buyers as of December 31, 2010 and the remaining requirements of the accounting literature on asset impairments had been met to qualify as being held for sale. The Partnership concluded the market approach would be the best indicator of fair value as market participants would place bids for the specific assets that would reflect the assets highest and best use in the marketplace. The assets were written down to their fair value, less costs to sell, at December 31, 2010 which resulted in a $0.7 million charge that is reflected on theAsset impairment loss line of the Consolidated Statements of Operations and Comprehensive Income. This charge was reflected in the Other category for 2010 segment reporting purposes. The carrying value of these assets at December 31, 2011 and 2010 was $0.8 million and $1.1 million, respectively, and they are included inProperty, plant and equipment on the Consolidated Statements of Financial Position due to their immaterial amount. Based on the fair value determination that was developed from unobservable data and reflected the Partnership's assumptions, these assets were determined to be a Level 3 fair value measurement. These assets are the only Level 3 fair value measurements for the Partnership for any periods presented in this report.
In August 2011, the Partnership closed on an agreement to sell and assign certain non-core mining assets and related liabilities located in the Phelps, Kentucky area of the Partnership's Tug River mining complex for $20 million. The mining assets included leasehold interests and permits to surface and mineral interests that included steam coal reserves and non-reserve coal deposits. Additionally, the
F-22
Table of Contents
RHINO RESOURCE PARTNERS LP
NOTES TO CONSOLIDATED FINANCIAL STATEMENTS (Continued)
FOR THE YEARS ENDED DECEMBER 31, 2011, 2010 AND 2009
6. PROPERTY, PLANT AND EQUIPMENT (Continued)
sales agreement includes the potential for additional payments of approximately $8.75 million dependent upon the future issuance of certain permits and the commencement of mining activities by the purchaser. These contingent payments are being accounted for as gain contingencies and will be recognized in the future when and if the contingencies are resolved. The transaction also transfers certain liabilities related to the assets sold. In relation to the sale of these assets and transfer of liabilities, the Partnership recorded a gain of approximately $2.4 million, which is included on the(Gain) loss on sale/acquisition of assets—net line of the Partnership's Consolidated Statements of Operations and Comprehensive Income.
7. GOODWILL AND INTANGIBLE ASSETS
ASC Topic 350 addresses financial accounting and reporting for goodwill and other intangible assets subsequent to their acquisition. Under the provisions of ASC Topic 350, goodwill and other intangible assets with indefinite useful lives are not amortized but instead tested for impairment at least annually. The Partnership performs its impairment analysis as of August 31.
Goodwill as of December 31, 2011 and 2010 consisted of the following:
| | | | | |
| December 31, | |
|---|
| 2011 | | 2010 | |
|---|
(in thousands)
| |
|---|
| $ | 202 | | $ | 202 | |
| | | | |
Intangible assets of the Partnership as of December 31, 2011 consisted of the following:
| | | | | | | | | | |
Intangible Asset | | Gross
Carrying
Amount | | Accumulated
Amortization | | Net
Carrying
Amount | |
|---|
| | (in thousands)
| |
|---|
Patent | | $ | 728 | | $ | 121 | | $ | 607 | |
Developed Technology | | | 78 | | | 13 | | | 65 | |
Trade Name | | | 184 | | | 5 | | | 179 | |
Customer List | | | 470 | | | 13 | | | 457 | |
| | | | | | | | |
Total | | $ | 1,460 | | $ | 152 | | $ | 1,308 | |
| | | | | | | | |
Intangible assets of the Partnership as of December 31, 2010 consisted of the following:
| | | | | | | | | | |
Intangible Asset | | Gross
Carrying
Amount | | Accumulated
Amortization | | Net
Carrying
Amount | |
|---|
| | (in thousands)
| |
|---|
Patent | | $ | 728 | | $ | 79 | | $ | 649 | |
Developed Technology | | | 78 | | | 8 | | | 70 | |
| | | | | | | | |
Total | | $ | 806 | | $ | 87 | | $ | 719 | |
| | | | | | | | |
F-23
Table of Contents
RHINO RESOURCE PARTNERS LP
NOTES TO CONSOLIDATED FINANCIAL STATEMENTS (Continued)
FOR THE YEARS ENDED DECEMBER 31, 2011, 2010 AND 2009
7. GOODWILL AND INTANGIBLE ASSETS (Continued)
The Partnership considers the patent and developed technology intangible assets to have a useful life of seventeen years.
In connection with the Elk Horn acquisition, the Partnership recognized an intangible asset for the trade name valued at $184,000 and a customer list intangible asset valued at $470,000 during 2011. The trade name and customer list intangible assets recognized in the Elk Horn acquisition do not have any residual value and do not have any renewal or extension terms. The Partnership considers the trade name and customer list intangible assets to have a useful life of twenty years. All of the intangible assets are amortized over their useful life on a straight line basis. Amortization expense was approximately $0.1 million for each of the years ended December 31, 2011 and 2010 and was zero for the year ended December 31, 2009.
The future total amortization expense for each of the five succeeding years related to intangible assets that are currently recorded in the Consolidated Statement of Financial Position is estimated to be as follows at December 31, 2011:
| | | | | | | | | | | | | | | | |
| | Patent | | Developed
Technology | | Trade
Name | | Customer
List | | Total | |
|---|
| | (in thousands)
| |
|---|
2012 | | $ | 43 | | $ | 5 | | $ | 9 | | $ | 23 | | $ | 80 | |
2013 | | | 43 | | | 5 | | | 9 | | | 23 | | | 80 | |
2014 | | | 43 | | | 5 | | | 9 | | | 23 | | | 80 | |
2015 | | | 43 | | | 5 | | | 9 | | | 23 | | | 80 | |
2016 | | | 43 | | | 5 | | | 9 | | | 23 | | | 80 | |
8. OTHER NON-CURRENT ASSETS
Other non-current assets as of December 31, 2011 and 2010 consisted of the following:
| | | | | | | |
| | December 31, | |
|---|
| | 2011 | | 2010 | |
|---|
| | (in thousands)
| |
|---|
Deposits and other | | $ | 2,481 | | $ | 840 | |
Debt issuance costs—net | | | 4,925 | | | 2,211 | |
Deferred expenses | | | 27 | | | 56 | |
| | | | | | |
Total | | $ | 7,433 | | $ | 3,107 | |
| | | | | | |
Debt issuance costs were $8.0 million and $4.3 million as of December 31, 2011 and 2010, respectively. Accumulated amortization of debt issuance costs were $3.1 million and $2.1 million as of December 31, 2011 and 2010, respectively.
F-24
Table of Contents
RHINO RESOURCE PARTNERS LP
NOTES TO CONSOLIDATED FINANCIAL STATEMENTS (Continued)
FOR THE YEARS ENDED DECEMBER 31, 2011, 2010 AND 2009
9. ACCRUED EXPENSES AND OTHER CURRENT LIABILITIES
Accrued expenses and other current liabilities as of December 31, 2011 and 2010 consisted of the following:
| | | | | | | |
| | December 31, | |
|---|
| | 2011 | | 2010 | |
|---|
| | (in thousands)
| |
|---|
Payroll, bonus and vacation expense | | $ | 4,128 | | $ | 3,570 | |
Non income taxes | | | 3,950 | | | 3,020 | |
Royalty expenses | | | 2,489 | | | 2,184 | |
Accrued interest | | | 797 | | | 460 | |
Health claims | | | 1,386 | | | 2,046 | |
Workers' compensation & pneumoconiosis | | | 1,690 | | | 1,400 | |
Deferred revenues | | | 1,967 | | | — | |
Other | | | 3,284 | | | 289 | |
| | | | | | |
Total | | $ | 19,691 | | $ | 12,969 | |
| | | | | | |
10. DEBT
Debt as of December 31, 2011 and 2010 consisted of the following:
| | | | | | | |
| | December 31, | |
|---|
| | 2011 | | 2010 | |
|---|
| | (in thousands)
| |
|---|
Senior secured credit facility with PNC Bank, N.A. | | $ | 137,000 | | $ | 28,470 | |
Note payable to H&L Construction Co., Inc. | | | 2,284 | | | 2,973 | |
Other notes payable | | | 3,814 | | | 5,085 | |
| | | | | | |
Total | | | 143,098 | | | 36,528 | |
Less current portion | | | (1,334 | ) | | (2,908 | ) |
| | | | | | |
Long-term debt | | $ | 141,764 | | $ | 33,620 | |
| | | | | | |
Senior Secured Credit Facility with PNC Bank, N.A.—The original maximum availability under the credit facility by and among the Operating Company, the guarantors (including the Partnership) and lenders which are parties thereto, and PNC Bank, N.A. as administrative agent was $200.0 million. On June 8, 2011, with the consent of the lenders, the Operating Company exercised the option to increase the amount available to borrow under the credit agreement by $50.0 million to $250.0 million as part of the Elk Horn acquisition discussed earlier. As part of exercising this option to increase the available amount under the credit agreement, the Operating Company paid a fee of $1.0 million to the lenders, which was recorded in Debt issuance costs in Other non-current assets on the Partnership's consolidated statements of financial position and in Cash flows from financing activities in the Partnership's consolidated statements of cash flows.
On July 29, 2011, the Operating Company and the Partnership, as a guarantor, executed an amended and restated senior secured credit facility with PNC Bank, N.A., as administrative agent, and a group of lenders, which are parties thereto. The maximum availability under the amended and
F-25
Table of Contents
RHINO RESOURCE PARTNERS LP
NOTES TO CONSOLIDATED FINANCIAL STATEMENTS (Continued)
FOR THE YEARS ENDED DECEMBER 31, 2011, 2010 AND 2009
10. DEBT (Continued)
restated credit facility is $300.0 million, with a one-time option to increase the availability by an amount not to exceed $50.0 million. Of the $300.0 million, $75.0 million is available for letters of credit. Borrowings under the facility bear interest, which varies depending upon the levels of certain financial ratios. As part of the agreement, the Operating Company is required to pay a commitment fee on the unused portion of the borrowing availability that also varies depending upon the levels of certain financial ratios. Borrowings on the amended and restated senior secured credit facility are collateralized by all the unsecured assets of the Partnership. The amended and restated senior secured credit facility requires the Partnership to maintain certain minimum financial ratios and contains certain restrictive provisions, including among others, restrictions on making loans, investments and advances, incurring additional indebtedness, guaranteeing indebtedness, creating liens, and selling or assigning stock. The Partnership was in compliance with all covenants contained in the amended and restated senior secured credit facility as of and for the period ended December 31, 2011. The amended and restated senior secured credit facility expires in July 2016.
As part of executing the amended and restated senior secured credit facility, the Operating Company paid a fee of approximately $2.8 million to the lenders, which was recorded in Debt issuance costs in Other non-current assets on the Partnership's consolidated statements of financial position and in Cash flows from financing activities in the Partnership's consolidated statements of cash flows. The Partnership evaluated the accounting guidance in ASC 470,Debt, Derecognition, Line-of-Credit or Revolving-Debt Arrangements, and determined that the balance of the previous deferred financing costs met the requirements to be included with the fees paid for the amended and restated credit facility, with the combined balance of financing costs being deferred and amortized over the five year term of the amended and restated credit facility.
At December 31, 2011, the Operating Company had borrowed $137.0 million at a variable interest rate of LIBOR plus 2.75% (3.03% at December 31, 2011). In addition, the Operating Company had outstanding letters of credit of $26.3 million at a fixed interest rate of 2.75% at December 31, 2011. At December 31, 2011, the Operating Company had not used $136.7 million of the borrowing availability.
Note payable to H&L Construction Co., Inc.—The note payable to H&L Construction Co., Inc. was originally a non-interest bearing note and the Partnership has recorded a discount for imputed interest at a rate of 5.0% on this note that is being amortized over the life of the note using the effective interest method. In 2009, the note was renegotiated and became an interest bearing note. The note payable matures in January 2015. The note is secured by mineral rights purchased by the Partnership from H&L Construction Co., Inc. with a carrying amount of $11.6 million and $11.8 million at December 31, 2011 and 2010, respectively.
F-26
Table of Contents
RHINO RESOURCE PARTNERS LP
NOTES TO CONSOLIDATED FINANCIAL STATEMENTS (Continued)
FOR THE YEARS ENDED DECEMBER 31, 2011, 2010 AND 2009
10. DEBT (Continued)
Principal payments on long-term debt due subsequent to December 31, 2011 are as follows:
| | | | |
| | in thousands | |
|---|
2012 | | $ | 1,366 | |
2013 | | | 1,127 | |
2014 | | | 1,021 | |
2015 | | | 279 | |
2016 | | | 137,225 | |
Thereafter | | | 2,271 | |
| | | | |
Total principal payments | | | 143,289 | |
Less imputed interest on interest free notes payable | | | (191 | ) |
| | | | |
Total debt | | $ | 143,098 | |
| | | | |
11. ASSET RETIREMENT OBLIGATIONS
The changes in asset retirement obligations for the years ended December 31, 2011, 2010 and 2009 are as follows:
| | | | | | | | | | |
| | Year Ended December 31, | |
|---|
| | 2011 | | 2010 | | 2009 | |
|---|
| | (in thousands)
| |
|---|
Balance at beginning of period (including current portion) | | $ | 35,691 | | $ | 45,101 | | $ | 55,760 | |
Accretion expense | | | 1,956 | | | 2,165 | | | 2,753 | |
Adjustment resulting from addition of property | | | 2,707 | | | 933 | | | — | |
Adjustment resulting from disposal of property | | | (3,588 | ) | | — | | | (2,039 | ) |
Adjustments to the liability from annual recosting and other | | | (617 | ) | | (10,202 | ) | | (6,596 | ) |
Liabilities settled | | | (2,036 | ) | | (2,306 | ) | | (4,777 | ) |
| | | | | | | | |
Balance at end of period | | | 34,113 | | | 35,691 | | | 45,101 | |
Current portion of asset retirement obligation | | | 3,192 | | | 4,350 | | | 5,427 | |
| | | | | | | | |
Long-term portion of asset retirement obligation | | $ | 30,921 | | $ | 31,341 | | $ | 39,674 | |
| | | | | | | | |
12. EMPLOYEE BENEFITS
Postretirement Plan—In conjunction with the acquisition of the coal operations of American Electric Power on April 16, 2004, the Operating Company acquired a postretirement benefit plan providing healthcare to eligible employees. The Partnership has no other postretirement plans.
F-27
Table of Contents
RHINO RESOURCE PARTNERS LP
NOTES TO CONSOLIDATED FINANCIAL STATEMENTS (Continued)
FOR THE YEARS ENDED DECEMBER 31, 2011, 2010 AND 2009
12. EMPLOYEE BENEFITS (Continued)
Summaries of the changes in benefit obligations and funded status of the plan as of the measurement dates of December 31, 2011, 2010 and 2009 are as follows:
| | | | | | | | | | |
| | Year Ended December 31, | |
|---|
| | 2011 | | 2010 | | 2009 | |
|---|
| | (in thousands)
| |
|---|
Benefit obligation at beginning of period | | $ | 6,641 | | $ | 5,210 | | $ | 5,067 | |
Changes in benefit obligations: | | | | | | | | | | |
Service costs | | | 491 | | | 455 | | | 442 | |
Interest cost | | | 312 | | | 289 | | | 325 | |
Benefits paid | | | (72 | ) | | (15 | ) | | (15 | ) |
Actuarial loss/(gain) | | | (1,723 | ) | | 702 | | | (609 | ) |
| | | | | | | | |
Benefit obligation at end of period | | $ | 5,649 | | $ | 6,641 | | $ | 5,210 | |
| | | | | | | | |
Fair value of plan assets at end of period | | $ | — | | $ | — | | $ | — | |
Funded status | | $ | (5,649 | ) | $ | (6,641 | ) | $ | (5,210 | ) |
| | | | | | | | |
The classification of net amounts recognized for postretirement benefits as of December 31, 2011 and 2010 are as follows:
| | | | | | | |
| | December 31, | |
|---|
| | 2011 | | 2010 | |
|---|
| | (in thousands)
| |
|---|
Current liability—postretirement benefits | | $ | (157 | ) | $ | (160 | ) |
Non-current liability—postretirement benefits | | | (5,492 | ) | | (6,481 | ) |
| | | | | | |
Net amount recognized | | $ | (5,649 | ) | $ | (6,641 | ) |
| | | | | | |
The amounts recognized in accumulated other comprehensive income for the years ended December 31, 2011, 2010 and 2009 are as follows:
| | | | | | | | | | |
| | Year Ended December 31, | |
|---|
| | 2011 | | 2010 | | 2009 | |
|---|
| | (in thousands)
| |
|---|
Balance at beginning of year | | $ | 625 | | $ | 1,478 | | $ | 935 | |
Actuarial gain (loss) | | | 1,723 | | | (702 | ) | | 609 | |
Amortization of net actuarial (gain) | | | — | | | (151 | ) | | (66 | ) |
| | | | | | | | |
Net actuarial gain | | $ | 2,348 | | $ | 625 | | $ | 1,478 | |
| | | | | | | | |
| | | | | | | |
| | December 31,
2011 | | December 31,
2010 | |
|---|
Weighted Average assumptions used to determine benefit obligations | | | | | | | |
Discount rate | | | 4.15 | % | | 4.75 | % |
Expected return on plan assets | | | n/a | | | n/a | |
F-28
Table of Contents
RHINO RESOURCE PARTNERS LP
NOTES TO CONSOLIDATED FINANCIAL STATEMENTS (Continued)
FOR THE YEARS ENDED DECEMBER 31, 2011, 2010 AND 2009
12. EMPLOYEE BENEFITS (Continued)
| | | | | | | | | | |
| | Year Ended
December 31,
2011 | | Year Ended
December 31,
2010 | | Year Ended
December 31,
2009 | |
|---|
Weighted Average assumptions used to determine periodic benefit cost | | | | | | | | | | |
Discount rate | | | 4.75 | % | | 5.60 | % | | 6.50 | % |
Expected return on plan assets | | | n/a | | | n/a | | | n/a | |
Rate of compensation increase | | | n/a | | | n/a | | | n/a | |
The components of net periodic benefit cost for the years ended December 31, 2011, 2010 and 2009 are as follows:
| | | | | | | | | | |
| | Year Ended
December 31, | |
|---|
| | 2011 | | 2010 | | 2009 | |
|---|
| | (in thousands)
| |
|---|
Service costs | | $ | 491 | | $ | 455 | | $ | 442 | |
Interest cost | | | 312 | | | 289 | | | 325 | |
Amortization of (gain) | | | — | | | (151 | ) | | (66 | ) |
| | | | | | | | |
Benefit cost | | $ | 803 | | $ | 593 | | $ | 701 | |
| | | | | | | | |
Amounts expected to be amortized from accumulated other comprehensive income into net periodic benefit cost during the year ending December 31, 2012, are as follows:
| | | | |
| | (in thousands) | |
|---|
Net actuarial gain | | $ | 481 | |
Expected future benefit payments are as follows:
| | | | |
Period | | (in thousands) | |
|---|
2012 | | $ | 157 | |
2013 | | | 228 | |
2014 | | | 309 | |
2015 | | | 373 | |
2016 | | | 543 | |
2017 - 2021 | | $ | 4,011 | |
For measurement purposes, a 7.80% annual rate of increase in the per capita cost of covered health care benefits was assumed, gradually decreasing to 4.50% in 2027 and remaining level thereafter.
Net periodic benefit cost is determined using the assumptions as of the beginning of the year, and the funded status is determined using the assumptions as of the end of the year. Effective June 1, 2007, employees hired by the Partnership are not eligible for benefits under the plan.
F-29
Table of Contents
RHINO RESOURCE PARTNERS LP
NOTES TO CONSOLIDATED FINANCIAL STATEMENTS (Continued)
FOR THE YEARS ENDED DECEMBER 31, 2011, 2010 AND 2009
12. EMPLOYEE BENEFITS (Continued)
The expense and liability estimates can fluctuate by significant amounts based upon the assumptions used by the Partnership. As of December 31, 2011, a one-percentage-point change in assumed health care cost trend rates would have the following effects:
| | | | | | | |
| | One-Percentage
Point Increase | | One-Percentage
Point Decrease | |
|---|
| | (in thousands)
| |
|---|
Effect on total service and interest cost components | | $ | 72 | | $ | (66 | ) |
Effect on postretirement benefit obligation | | $ | 529 | | $ | (482 | ) |
401(k) Plans—The Partnership and certain subsidiaries sponsor defined contribution savings plans for all employees. Under one defined contribution savings plan, the Partnership matches voluntary contributions of participants up to a maximum contribution based upon a percentage of a participant's salary with an additional matching contribution possible at the Partnership's discretion. The expense under these plans for the years ended December 31, 2011, 2010 and 2009 was as follows:
| | | | | | | | | | |
| | Year Ended December 31, | |
|---|
| | 2011 | | 2010 | | 2009 | |
|---|
| | (in thousands)
| |
|---|
401(k) plan expense | | $ | 2,245 | | $ | 1,798 | | $ | 2,326 | |
13. EQUITY-BASED COMPENSATION
In October 2010, the General Partner established the Rhino Long-Term Incentive Plan (the "Plan" or "LTIP"). The Plan is intended to promote the interests of the Partnership by providing to employees, consultants and directors of the General Partner, the Partnership or affiliates of either incentive compensation awards to encourage superior performance. The LTIP provides for grants of restricted units, unit options, unit appreciation rights, phantom units, unit awards, and other unit-based awards. The aggregate number of units reserved for issuance under the LTIP is 2,479,400.
As of December 31, 2011, the General Partner had granted phantom units to certain of the Partnership's employees and restricted units and unit awards to its directors. These grants were made in connection with the IPO completed during October 2010 and discussed above in Note 1, as well as annual restricted unit awards to directors. Certain of these awards are subject to service-based vesting
F-30
Table of Contents
RHINO RESOURCE PARTNERS LP
NOTES TO CONSOLIDATED FINANCIAL STATEMENTS (Continued)
FOR THE YEARS ENDED DECEMBER 31, 2011, 2010 AND 2009
13. EQUITY-BASED COMPENSATION (Continued)
conditions and a summary of non-vested LTIP awards as of and for the year ended December 31, 2011 is as follows:
| | | | | | | |
| | Common Units | | Weighted Average
Grant Date
Fair Value
(per unit) | |
|---|
| | (in thousands)
| |
|---|
Non-vested awards at December 31, 2010 | | | 135 | | $ | 20.50 | |
Granted | | | 10 | | $ | 19.90 | |
Vested | | | (52 | ) | $ | 20.47 | |
Forfeited | | | (1 | ) | $ | 20.50 | |
| | | | | | |
Non-vested awards at December 31, 2011 | | | 92 | | $ | 20.45 | |
| | | | | | |
With the vesting of the first portion of the employees' awards in early April 2011, the Compensation Committee of the board of directors of the General Partner elected to pay some of the awards in cash or a combination of cash and common units. This election was a change in policy from December 31, 2010 since management had previously planned to settle all employee awards with units upon vesting as per the grant agreements. This policy change resulted in a modification of all employee awards from equity to liability classification as of March 31, 2011. The Partnership incurred incremental compensation expense for the year ended December 31, 2011 of approximately $0.1 million due to the modification of these awards. The equity balance of approximately $0.2 million accrued as of December 31, 2010 for the non-vested awards was also reclassified from the Limited partners' capital account to Accrued expenses and other in the current liability portion in the consolidated statement of financial position as of December 31, 2011.
For the years ended December 31, 2011 and 2010, the Partnership recorded expense of approximately $1.1 million and approximately $0.3 million, respectively, for the LTIP awards. All of the non-vested LTIP awards granted during 2010 and 2011 included, with respect to the phantom unit awards, distribution equivalent rights (or DERs) or unit distribution rights, with respect to restricted unit awards, each of which are rights to accrue quarterly cash distributions in an amount equal to the cash distribution the Partnership makes to unitholders during the vesting period. However, any accrued distributions will be forfeited if the related awards fail to vest according to the relevant vesting conditions of the award.
For the year ended December 31, 2011, the total fair value of the awards that vested was $1.1 million. As of December 31, 2011, the total unrecognized compensation expense related to the non-vested LTIP awards that are expected to vest was $1.5 million. The expense is expected to be recognized over a weighted-average period of 1.7 years. As of December 31, 2011, the intrinsic value of the non-vested LTIP awards was $1.8 million.
During the first quarter of 2012, certain employees received grants of phantom unit awards with tandem DERs under the LTIP program. These awards were granted in connection with fiscal year 2011 performance and vest in equal annual installments over a three year period from the date of grant. The total value of the awards granted was approximately $0.4 million and the expense related to these awards will be recognized ratably over the three year vesting period, plus any mark-to-market expense.
F-31
Table of Contents
RHINO RESOURCE PARTNERS LP
NOTES TO CONSOLIDATED FINANCIAL STATEMENTS (Continued)
FOR THE YEARS ENDED DECEMBER 31, 2011, 2010 AND 2009
14. COMMITMENTS AND CONTINGENCIES
Coal Sales Contracts and Contingencies—As of December 31, 2011, the Partnership had commitments under sales contracts to deliver annually scheduled base quantities of 4.5 million, 3.4 million, 2.0 million and 0.3 million tons of coal to 13 customers in 2012, 7 customers in 2013, 5 customer in 2014 and 2 customers in 2015, respectively. Some of the contracts have sales price adjustment provisions, subject to certain limitations and adjustments, based on a variety of factors and indices.
Purchase Commitments—As of December 31, 2011, the Partnership had 4.0 million gallons remaining on a commitment to purchase diesel fuel at fixed prices through December 2012 for $14.0 million.
As of December 31, 2011, the Partnership had capital expenditure commitments of approximately $12.2 million related to completing the construction of a preparation plant in its Central Appalachia segment.
Purchased Coal Expenses—The Partnership incurs purchased coal expense from time to time related to coal purchase contracts. In addition, the Partnership incurs expense from time to time related to coal purchased on the over-the-counter market ("OTC"). Purchase coal expense from coal purchase contracts and expense from OTC purchases for the years ended December 31, 2011, 2010 and 2009 was as follows:
| | | | | | | | | | |
| | Year Ended December 31, | |
|---|
| | 2011 | | 2010 | | 2009 | |
|---|
| | (in thousands)
| |
|---|
Purchased coal expense | | $ | 14,283 | | $ | 5,373 | | $ | 10,525 | |
OTC expense | | $ | 14 | | $ | 8,354 | | $ | 98,575 | |
As of December 31, 2011, the Partnership had an outstanding commitment to purchase approximately 0.3 million tons of coal from a third party during 2012 for approximately $23.1 million.
Leases—The Partnership leases various mining, transportation and other equipment under operating leases. The Partnership also leases coal reserves under agreements that call for royalties to be paid as the coal is mined. Lease and royalty expense for the years ended December 31, 2011, 2010 and 2009 was as follows:
| | | | | | | | | | |
| | Year Ended December 31, | |
|---|
| | 2011 | | 2010 | | 2009 | |
|---|
| | (in thousands)
| |
|---|
Lease expense | | $ | 2,630 | | $ | 5,212 | | $ | 8,151 | |
Royalty expense | | $ | 16,175 | | $ | 11,656 | | $ | 12,866 | |
F-32
Table of Contents
RHINO RESOURCE PARTNERS LP
NOTES TO CONSOLIDATED FINANCIAL STATEMENTS (Continued)
FOR THE YEARS ENDED DECEMBER 31, 2011, 2010 AND 2009
14. COMMITMENTS AND CONTINGENCIES (Continued)
Approximate future minimum lease and royalty payments (not including advance royalties already paid and recorded as assets in the accompanying statements of financial position) are as follows:
| | | | | | | |
Years Ended December 31, | | Royalties | | Leases | |
|---|
| | (in thousands)
| |
|---|
2012 | | $ | 436 | | $ | 1,167 | |
2013 | | | 436 | | | 895 | |
2014 | | | 481 | | | 89 | |
2015 | | | 464 | | | 45 | |
2016 | | | 464 | | | — | |
Thereafter | | | 2,320 | | | — | |
| | | | | | |
Total minimum royalty and lease payments | | $ | 4,601 | | $ | 2,196 | |
| | | | | | |
Environmental Matters—Based upon current knowledge, the Partnership believes that it is in compliance with environmental laws and regulations as currently promulgated. However, the exact nature of environmental control problems, if any, which the Partnership may encounter in the future cannot be predicted, primarily because of the increasing number, complexity and changing character of environmental requirements that may be enacted by federal and state authorities.
Legal Matters—The Partnership is involved in various legal proceedings arising in the ordinary course of business due to claims from various third parties, including the worker's compensation claim for approximately $0.7 million related to the Elk Horn acquisition that is discussed in Note 4, as well as potential citations and fines from the Mine Safety and Health Administration, potential claims from land or lease owners and potential property damage claims from third parties. The Partnership is not party to any other pending litigation that is probable to have a material adverse effect on the financial condition, results of operations or cash flows of the Partnership. Management of the Partnership is also not aware of any significant legal, regulatory or governmental proceedings against or contemplated to be brought against the Partnership.
Guarantees/Indemnifications and Financial Instruments with Off-Balance Sheet Risk —In the normal course of business, the Partnership is a party to certain guarantees and financial instruments with off-balance sheet risk, such as bank letters of credit and performance or surety bonds. No liabilities related to these arrangements are reflected in the Consolidated Statements of Financial Position. The amount of bank letters of credit outstanding with PNC Bank, N.A., as the letter of credit issuer under the Partnership's credit facility, was $26.3 million as of December 31, 2011. The bank letters of credit outstanding reduce the borrowing capacity under the credit facility. In addition, the Partnership has outstanding surety bonds with third parties of $69.9 million as of December 31, 2011 to secure reclamation and other performance commitments.
The credit facility is fully and unconditionally, jointly and severally guaranteed by the Partnership and substantially all of its wholly owned subsidiaries. Borrowings under the credit facility are collateralized by the unsecured assets of the Partnership and substantially all of its wholly owned subsidiaries. See Note 10 for a more complete discussion of the Partnership's debt obligations.
F-33
Table of Contents
RHINO RESOURCE PARTNERS LP
NOTES TO CONSOLIDATED FINANCIAL STATEMENTS (Continued)
FOR THE YEARS ENDED DECEMBER 31, 2011, 2010 AND 2009
14. COMMITMENTS AND CONTINGENCIES (Continued)
As of December 31, 2011, Wexford Capital fully and unconditionally guarantees less than 1% of the Partnership's obligations under its outstanding surety bonds with third parties to secure reclamation and other performance commitments.
Joint Venture—Pursuant to the joint venture agreement with Patriot, the Partnership is required to contribute additional capital to assist in funding the development and operations of the joint venture. During the year ended December 31, 2011, the Partnership did not make any capital contributions. The Partnership may be required to contribute additional capital or make loans to the joint venture commensurate with its ownership percentage in subsequent periods.
15. EARNINGS PER UNIT ("EPU")
The following table presents a reconciliation of the numerators and denominators of the basic and diluted EPU calculations for the periods ended December 31, 2011 and 2010:
| | | | | | | | | | |
Year ended December 31, 2011 | | General
Partner | | Common
Unitholders | | Subordinated
Unitholders | |
|---|
| | (in thousands, except per unit data)
| |
|---|
Numerator: | | | | | | | | | | |
Interest in net income | | $ | 762 | | $ | 19,603 | | $ | 17,706 | |
Denominator: | | | | | | | | | | |
Weighted average units used to compute basic EPU | | | n/a | | | 13,725 | | | 12,397 | |
Effect of dilutive securities—LTIP awards | | | n/a | | | 19 | | | — | |
| | | | | | | | |
Weighted average units used to compute diluted EPU | | | n/a | | | 13,744 | | | 12,397 | |
Net income per limited partner unit, basic | | |
n/a | |
$ |
1.43 | |
$ |
1.43 | |
Net income per limited partner unit, diluted | | | n/a | | $ | 1.43 | | $ | 1.43 | |
| | | | | | | | | | |
Partnership—Period from October 6 to December 31, 2010 | | General
Partner | | Common
Unitholders | | Subordinated
Unitholders | |
|---|
| | (in thousands, except per unit data)
| |
|---|
Numerator: | | | | | | | | | | |
Interest in net income | | $ | 109 | | $ | 2,668 | | $ | 2,669 | |
Denominator: | | | | | | | | | | |
Weighted average units used to compute basic EPU | | | n/a | | | 12,400 | | | 12,397 | |
Effect of dilutive securities—LTIP awards | | | n/a | | | 13 | | | — | |
| | | | | | | | |
Weighted average units used to compute diluted EPU | | | n/a | | | 12,413 | | | 12,397 | |
Net income per limited partner unit, basic | | |
n/a | |
$ |
0.22 | |
$ |
0.22 | |
Net income per limited partner unit, diluted | | | n/a | | $ | 0.22 | | $ | 0.22 | |
For the year ended December 31, 2009, the Partnership does not have EPU figures to disclose since the Partnership did not have any operations during that time period.
F-34
Table of Contents
RHINO RESOURCE PARTNERS LP
NOTES TO CONSOLIDATED FINANCIAL STATEMENTS (Continued)
FOR THE YEARS ENDED DECEMBER 31, 2011, 2010 AND 2009
16. MAJOR CUSTOMERS
The Partnership had revenues or receivables from the following major customers that in each period equaled or exceeded 10% of revenues or receivables:
| | | | | | | | | | | | | | | | | | | |
| | December 31,
2011
Receivable
Balance | | Year Ended
December 31,
2011
Sales | | December 31,
2010
Receivable
Balance | | Year Ended
December 31,
2010
Sales | | December 31,
2009
Receivable
Balance | | Year Ended
December 31,
2009
Sales | |
|---|
| | (in thousands)
| |
|---|
Indiana Harbor Coke Company, L.P | | $ | 4,259 | | $ | 39,767 | | $ | 1,539 | | $ | 51,277 | | $ | 2,260 | | $ | 47,478 | |
American Electric Power Company, Inc. | | | 3,556 | | | 43,840 | | | 1,584 | | | 36,003 | | | 6,563 | | | 97,006 | |
GenOn Energy, Inc. (fka Mirant Corporation) | | | 3,254 | | | 56,000 | | | 1,440 | | | 37,420 | | | n/a | | | n/a | |
Blackstone Resources, Inc. | | | 3,553 | | | 23,104 | | | n/a | | | n/a | | | n/a | | | n/a | |
Constellation Energy Group, Inc. | | | n/a | | | n/a | | | n/a | | | n/a | | $ | 1,702 | | $ | 67,167 | |
PPL Corporation | | | 3,038 | | | 46,672 | | | n/a | | | n/a | | | n/a | | | n/a | |
17. FAIR VALUE OF FINANCIAL INSTRUMENTS
The book values of cash and cash equivalents, accounts receivable and accounts payable are considered to be representative of their respective fair values because of the immediate short-term maturity of these financial instruments. The carrying value of the Partnership's debt instruments approximate fair value since effective rates for these instruments are comparable to market at year-end.
Effective January 1, 2008, the Predecessor adopted ASC Topic 820 which clarifies the definition of fair value, establishes a framework for measuring fair value and expands the disclosures on fair value measurements. ASC Topic 820 applies whenever other statements require or permit assets or liabilities to be measured at fair value. ASC Topic 820 requirements for certain non-financial assets and liabilities were permitted to be deferred until the first quarter of 2009. The Predecessor adopted the ASC Topic 820 requirements for certain non-financial assets and liabilities on January 1, 2009 and at the time of the adoption, there were no nonfinancial assets or nonfinancial liabilities that were measured at fair value on a nonrecurring basis.
Other than the assets described in Note 6, the Partnership does not have any nonfinancial assets or nonfinancial liabilities measured at fair value.
F-35
Table of Contents
RHINO RESOURCE PARTNERS LP
NOTES TO CONSOLIDATED FINANCIAL STATEMENTS (Continued)
FOR THE YEARS ENDED DECEMBER 31, 2011, 2010 AND 2009
18. RELATED PARTY AND AFFILIATE TRANSACTIONS
| | | | | | | | | | | | |
Related Party | | Description | | 2011 | | 2010 | | 2009 | |
|---|
| |
| | (in thousands)
| |
|---|
Wexford Capital LP | | Expenses for legal, consulting, and advisory services | | $ | 263 | | $ | 278 | | $ | 61 | |
Wexford Capital LP | | Distributions | | | 38,602 | | | — | | | — | |
Wexford Capital LP | | Partner's contribution | | | 1,450 | | | — | | | 85 | |
Rhino Eastern LLC | | Equity in net income (loss) of unconsolidated affiliate | | | 3,338 | | | 4,699 | | | 893 | |
Rhino Eastern LLC | | Distributions from unconsolidated affiliate | | | 3,351 | | | — | | | — | |
Rhino Eastern LLC | | Return of capital from unconsolidated affiliate | | | — | | | 3,137 | | | — | |
Rhino Eastern LLC | | Notes receivable | | | — | | | — | | | 377 | |
Rhino Eastern LLC | | Expenses for legal, health claims, workers' compensation and other expenses | | | 4,662 | | | 2,179 | | | 997 | |
Rhino Eastern LLC | | Receivables for legal, health claims and workers' compensation and other expenses | | | 1,140 | | | 686 | | | 161 | |
Rhino Eastern LLC | | Interest receivable | | | — | | | — | | | 1 | |
Rhino Eastern LLC | | Investment in unconsolidated affiliate | | | 18,736 | | | 18,749 | | | 17,186 | |
From time to time, employees from Wexford Capital perform legal, consulting, and advisory services to the Partnership. The Partnership incurred expenses of $0.3 million, $0.3 million and $0.1 million for the years ended December 31, 2011, 2010 and 2009, respectively, for legal, consulting, and advisory services performed by Wexford Capital.
During 2011, the Partnership provided loans based upon its ownership share to Rhino Eastern, a joint venture between the Partnership and Patriot, totaling approximately $5.8 million that were fully repaid as of December 31, 2011. As of December 31, 2009, the Predecessor had a note receivable outstanding of $0.4 million to Rhino Eastern. The note had a fixed interest rate of 10%. The note was fully repaid as of December 31, 2010.
From time to time, the Partnership and Predecessor have allocated and paid expenses on behalf of the joint venture. During the years ended December 31, 2011, 2010 and 2009, the Partnership and Predecessor paid expenses for legal, health claims and workers' compensation of $4.7 million, $2.2 million and $1.0 million, respectively, on behalf of the joint venture that were subsequently billed and paid by the joint venture to the Partnership and Predecessor, as appropriate.
19. SUPPLEMENTAL DISCLOSURES OF CASH FLOW INFORMATION
Cash payments for interest were $4.3 million, $4.1 million and $5.4 million for the years ended December 31, 2011, 2010 and 2009, respectively.
The Consolidated Statements of Cash Flows for the year ended December 31, 2011 is exclusive of approximately $3.2 million of property, plant and equipment additions which are recorded in accounts payable, approximately $5.2 million of property, plant and equipment additions which are included in accrued expenses and other liabilities, approximately $0.7 million of non-cash expense recognized for LTIP unit awards granted by the general partner to certain of its employees and to its directors and approximately $0.8 million related to the value of LTIP units that were issued to certain employees and directors of the general partner.
F-36
Table of Contents
RHINO RESOURCE PARTNERS LP
NOTES TO CONSOLIDATED FINANCIAL STATEMENTS (Continued)
FOR THE YEARS ENDED DECEMBER 31, 2011, 2010 AND 2009
19. SUPPLEMENTAL DISCLOSURES OF CASH FLOW INFORMATION (Continued)
In August 2010, the Partnership acquired certain assets of C.W. Mining Company for cash consideration of approximately $15.0 million. Because the fair value of the assets acquired was $25.8 million and exceeded the purchase price, the Partnership recorded a gain of $10.8 million and the Consolidated Statement of Cash Flows for the year ended December 31, 2010 is exclusive of $10.8 million of non-cash additions to property, plant and equipment. Additionally, the Consolidated Statement of Cash Flows for the year ended December 31, 2010 is exclusive of $0.9 million of non-cash additions to asset retirement obligations and mineral rights related to the C.W. Mining Company acquisition.
On October 5, 2010, in connection with the closing of the IPO, the owners of the Operating Company contributed their membership interests in the Operating Company to the Partnership, and the Partnership issued 12,397,000 subordinated units representing limited partner interests in the Partnership and 9,153,000 common units to Rhino Energy Holdings LLC, an affiliate of Wexford Capital, and issued incentive distribution rights to the General Partner. The Consolidated Statement of Cash Flows for the year ended December 31, 2010 is exclusive of the non-cash contribution of the membership interests in the Operating Company to the Partnership of $174.0 million and is also exclusive of the Partnership's issuance of the subordinated and common units to Rhino Energy Holdings LLC and the Partnership's issuance of incentive distribution rights to the General Partner.
In September 2009 the Predecessor reached a settlement on the outstanding debt balance with H&L Construction Co., Inc. resulting in a non-cash debt reduction of $1.8 million.
20. SEGMENT INFORMATION
The Partnership primarily produces and markets coal from surface and underground mines in Kentucky, West Virginia, Ohio, Colorado and Utah. The Partnership sells primarily to electric utilities in the United States. In addition, with the acquisition of Elk Horn mentioned earlier, the Partnership also leases coal reserves to third parties in exchange for royalty revenues. For the year ended December 31, 2011, the Partnership has four reportable business segments: Central Appalachia (comprised of both surface and underground mines located in Eastern Kentucky and Southern West Virginia, along with the Elk Horn operations), Northern Appalachia (comprised of both surface and underground mines located in Ohio), Rhino Western (comprised of underground mines in Colorado and Utah) and Eastern Met (comprised solely of the joint venture with Patriot). Additionally, the Partnership has an Other category that is comprised of the Partnership's ancillary businesses. The Partnership has not provided disclosure of total expenditures by segment for long-lived assets, as the Partnership does not maintain discrete financial information concerning total segment expenditures for long lived assets, and accordingly such information is not provided to the Partnership's chief operating decision maker.
In periods prior to the year ended December 31, 2010, the Partnership had included its Colorado mine in the Other category since this operation did not meet the quantitative thresholds requiring separate disclosure as a reportable segment. With the acquisition of the Utah mining complex in August 2010, the Partnership began to report a separate Rhino Western segment that includes the Colorado mine and Utah mining complex as one reportable segment since the Partnership's chief operating decision maker reviews the results of these operations on a combined basis. For periods prior
F-37
Table of Contents
RHINO RESOURCE PARTNERS LP
NOTES TO CONSOLIDATED FINANCIAL STATEMENTS (Continued)
FOR THE YEARS ENDED DECEMBER 31, 2011, 2010 AND 2009
20. SEGMENT INFORMATION (Continued)
to the year ended December 31, 2010, the segment data has been reclassified to present the results of the Colorado mine in the Rhino Western segment instead of the Other category.
The Partnership has historically accounted for the joint venture (formed in the year ended December 31, 2008) under the equity method. Under the equity method of accounting, the Partnership has historically only presented limited information (net income). The Partnership considers this operation to comprise a separate operating segment and has presented additional operating detail (with corresponding eliminations and adjustments to reflect its percentage of ownership) below. Since this equity method investment met the significance test of ten percent of net income in 2010, the Partnership has presented additional summarized financial information for this equity method investment below.
Reportable segment results of operations and financial position for the year ended December 31, 2011 are as follows (Note: "DD&A" refers to depreciation, depletion and amortization):
| | | | | | | | | | | | | | | | | | | | | | | | | |
| |
| |
| |
| | Eastern Met | |
| |
| |
|---|
| | Central
Appalachia | | Northern
Appalachia | | Rhino
Western | | Complete
Basis | | Equity
Method
Eliminations | | Equity
Method
Presentation | | Other | | Total
Consolidated | |
|---|
| | (in thousands)
| |
|---|
Total assets | | $ | 324,911 | | $ | 57,137 | | $ | 72,986 | | $ | 45,182 | | $ | (45,182 | ) | $ | — | | $ | 83,760 | | $ | 538,794 | |
Total revenues | | | 219,274 | | | 119,966 | | | 21,688 | | | 50,073 | | | (50,073 | ) | | — | | | 6,293 | | | 367,221 | |
DD&A | | | 22,115 | | | 8,160 | | | 3,057 | | | 2,959 | | | (2,959 | ) | | — | | | 2,993 | | | 36,325 | |
Interest expense | | | 2,329 | | | 2,020 | | | 581 | | | 52 | | | (52 | ) | | — | | | 1,132 | | | 6,062 | |
Net Income (loss) | | $ | 19,194 | | $ | 22,980 | | $ | (2,813 | ) | $ | 6,545 | | $ | (3,207 | ) | $ | 3,338 | | $ | (4,628 | ) | $ | 38,071 | |
Reportable segment results of operations and financial position for the year ended December 31, 2010 are as follows:
| | | | | | | | | | | | | | | | | | | | | | | | | |
| |
| |
| |
| | Eastern Met | |
| |
| |
|---|
| | Central
Appalachia | | Northern
Appalachia | | Rhino
Western | | Complete
Basis | | Equity
Method
Eliminations | | Equity
Method
Presentation | | Other | | Total
Consolidated | |
|---|
| | (in thousands)
| |
|---|
Total assets | | $ | 195,619 | | $ | 53,244 | | $ | 60,975 | | $ | 42,645 | | $ | (42,645 | ) | $ | — | | $ | 48,807 | | $ | 358,645 | |
Total revenues | | | 195,584 | | | 95,431 | | | 8,839 | | | 40,094 | | | (40,094 | ) | | — | | | 5,793 | | | 305,647 | |
DD&A | | | 20,083 | | | 9,348 | | | 594 | | | 3,196 | | | (3,196 | ) | | — | | | 4,083 | | | 34,108 | |
Interest expense | | | 2,292 | | | 1,948 | | | 195 | | | 72 | | | (72 | ) | | — | | | 903 | | | 5,338 | |
Net Income (loss) | | $ | 20,611 | | $ | 10,098 | | $ | 11,214 | | $ | 8,946 | | $ | (4,247 | ) | $ | 4,699 | | $ | (5,473 | ) | $ | 41,149 | |
F-38
Table of Contents
RHINO RESOURCE PARTNERS LP
NOTES TO CONSOLIDATED FINANCIAL STATEMENTS (Continued)
FOR THE YEARS ENDED DECEMBER 31, 2011, 2010 AND 2009
20. SEGMENT INFORMATION (Continued)
Reportable segment results of operations and financial position for the year ended December 31, 2009 are as follows:
| | | | | | | | | | | | | | | | | | | | | | | | | |
| |
| |
| |
| | Eastern Met | |
| |
| |
|---|
| | Central
Appalachia | | Northern
Appalachia | | Rhino
Western | | Complete
Basis | | Equity
Method
Eliminations | | Equity
Method
Presentation | | Other | | Total
Consolidated | |
|---|
| | (in thousands)
| |
|---|
Total assets | | $ | 207,870 | | $ | 55,565 | | $ | 24,755 | | $ | 42,428 | | $ | (42,428 | ) | $ | — | | $ | 51,794 | | $ | 339,984 | |
Total revenues | | | 297,724 | | | 106,741 | | | 11,209 | | | 28,820 | | | (28,820 | ) | | — | | | 4,116 | | | 419,790 | |
DD&A | | | 23,877 | | | 7,862 | | | 725 | | | 2,863 | | | (2,863 | ) | | — | | | 3,815 | | | 36,279 | |
Interest expense | | | 3,531 | | | 1,776 | | | 189 | | | 429 | | | (429 | ) | | — | | | 726 | | | 6,222 | |
Net Income (loss) | | $ | 561 | | $ | 17,638 | | $ | 3,306 | | $ | 1,751 | | $ | (858 | ) | $ | 893 | | $ | (2,936 | ) | $ | 19,462 | |
Additional summarized financial information for the equity method investment as of and for the periods ended December 31, 2011, 2010 and 2009 is as follows:
| | | | | | | | | | |
| | 2011 | | 2010 | | 2009 | |
|---|
| | (in thousands)
| |
|---|
Current assets | | $ | 7,880 | | $ | 7,413 | | $ | 5,947 | |
Noncurrent assets | | | 37,302 | | | 35,232 | | | 36,481 | |
Current liabilities | | | 5,388 | | | 3,308 | | | 3,372 | |
Noncurrent liabilities | | | 3,056 | | | 2,574 | | | 5,481 | |
Total costs and expenses | | | 43,477 | | | 31,103 | | | 25,981 | |
Income (loss) from operations | | | 6,596 | | | 8,991 | | | 2,839 | |
Additional information on the Partnership's revenue by product category for the periods ended December 31, 2011, 2010 and 2009 is as follows:
| | | | | | | | | | |
| | 2011 | | 2010 | | 2009 | |
|---|
| | (in thousands)
| |
|---|
Met coal revenue | | $ | 79,227 | | $ | 88,570 | | $ | 57,505 | |
Steam coal revenue | | | 254,649 | | | 201,315 | | | 344,247 | |
Other revenue | | | 33,345 | | | 15,762 | | | 18,038 | |
| | | | | | | | |
Total revenue | | $ | 367,221 | | $ | 305,647 | | $ | 419,790 | |
| | | | | | | | |
F-39
Table of Contents
RHINO RESOURCE PARTNERS LP
NOTES TO CONSOLIDATED FINANCIAL STATEMENTS (Continued)
FOR THE YEARS ENDED DECEMBER 31, 2011, 2010 AND 2009
21. QUARTERLY FINANCIAL DATA (UNAUDITED)
| | | | | | | | | | | | | |
(in thousands, except per unit data) | | First
Quarter | | Second
Quarter | | Third
Quarter | | Fourth
Quarter | |
|---|
2011: | | | | | | | | | | | | | |
Revenues | | $ | 82,755 | | $ | 89,877 | | $ | 93,564 | | $ | 101,026 | |
Income from operations | | | 6,494 | | | 9,506 | | | 10,424 | | | 14,319 | |
Net income | | $ | 6,136 | | $ | 9,377 | | $ | 9,846 | | $ | 12,712 | |
Basic and diluted net income per limited partner unit: | | | | | | | | | | | | | |
Common units | | $ | 0.24 | | $ | 0.37 | | $ | 0.36 | | $ | 0.45 | |
Subordinated units | | $ | 0.24 | | $ | 0.37 | | $ | 0.36 | | $ | 0.45 | |
Weighted average number of limited partner units outstanding, basic: | | | | | | | | | | | | | |
Common units | | | 12,402 | | | 12,416 | | | 14,732 | | | 15,309 | |
Subordinated units | | | 12,397 | | | 12,397 | | | 12,397 | | | 12,397 | |
Weighted average number of limited partner units outstanding, diluted: | | | | | | | | | | | | | |
Common units | | | 12,431 | | | 12,434 | | | 14,747 | | | 15,320 | |
Subordinated units | | | 12,397 | | | 12,397 | | | 12,397 | | | 12,397 | |
| | | | | | | | | | | | | |
| | First
Quarter | | Second
Quarter | | Third
Quarter | | Fourth
Quarter | |
|---|
2010: | | | | | | | | | | | | | |
Revenues | | $ | 66,603 | | $ | 78,428 | | $ | 85,229 | | $ | 75,387 | |
Income from operations | | | 8,136 | | | 7,898 | | | 21,674 | | | 4,055 | |
Net income | | $ | 6,544 | | $ | 7,142 | | $ | 21,808 | | $ | 5,656 | |
Basic and diluted net income per limited partner unit: | | | | | | | | | | | | | |
Common units | | | n/a | | | n/a | | | n/a | | $ | 0.22 | |
Subordinated units | | | n/a | | | n/a | | | n/a | | $ | 0.22 | |
Weighted average number of limited partner units outstanding, basic: | | | | | | | | | | | | | |
Common units | | | n/a | | | n/a | | | n/a | | | 12,400 | |
Subordinated units | | | n/a | | | n/a | | | n/a | | | 12,397 | |
Weighted average number of limited partner units outstanding, diluted: | | | | | | | | | | | | | |
Common units | | | n/a | | | n/a | | | n/a | | | 12,413 | |
Subordinated units | | | n/a | | | n/a | | | n/a | | | 12,397 | |
F-40