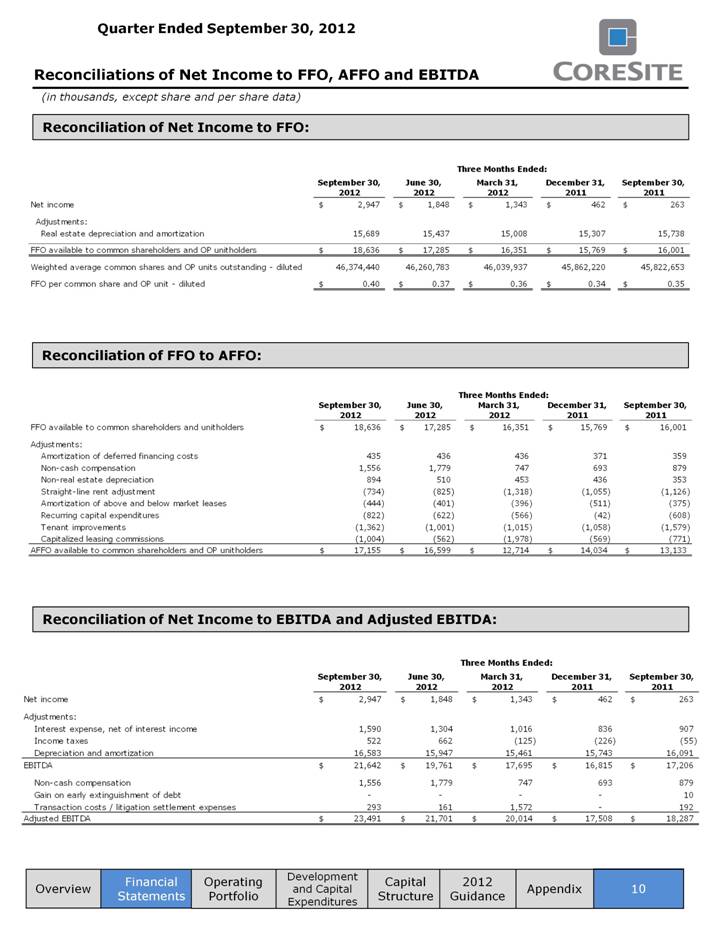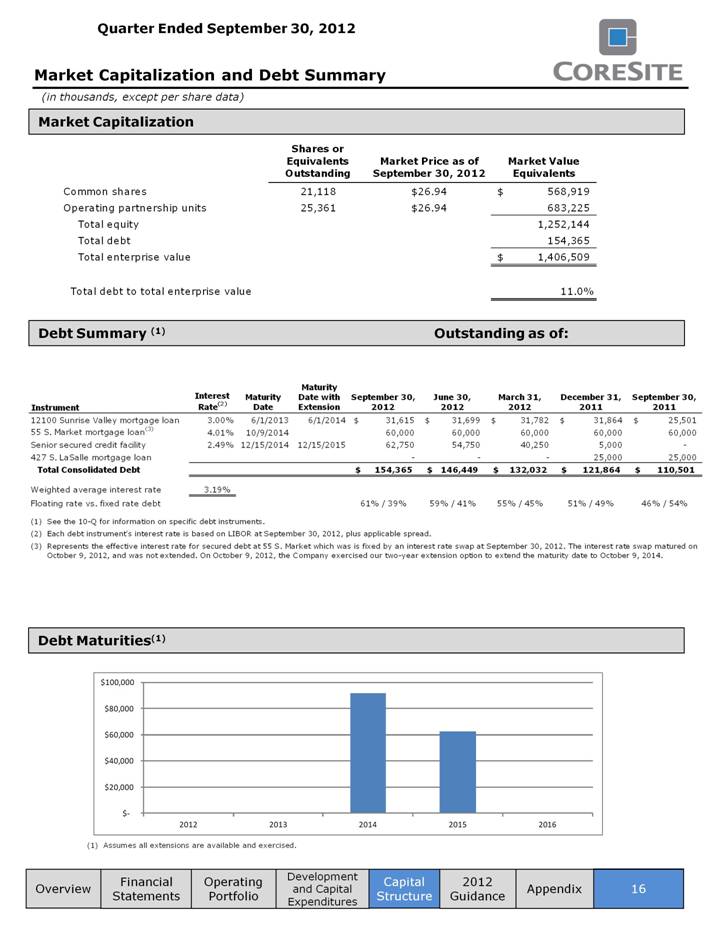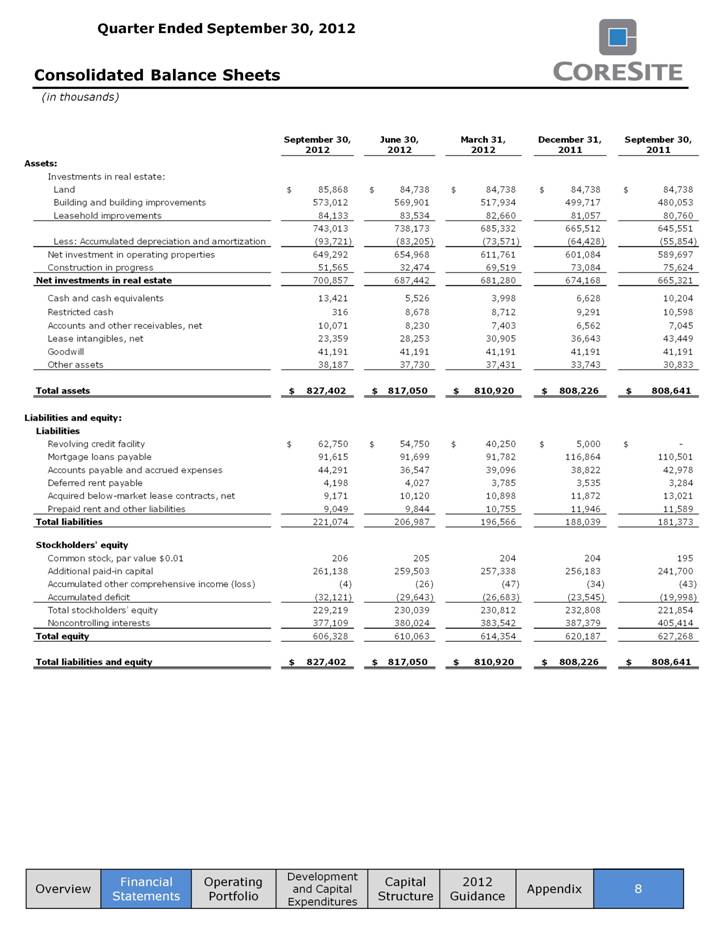
| Consolidated Balance Sheets (in thousands) Financial Statements Operating Portfolio Development and Capital Expenditures Capital Structure 8 Appendix Overview 2012 Guidance September 30, June 30, March 31, December 31, September 30, 2012 2012 2012 2011 2011 Assets: Investments in real estate: Land $ 85,868 $ 84,738 $ 84,738 $ 84,738 $ 84,738 Building and building improvements 573,012 569,901 517,934 499,717 480,053 Leasehold improvements 84,133 83,534 82,660 81,057 80,760 743,013 738,173 685,332 665,512 645,551 Less: Accumulated depreciation and amortization (93,721) (83,205) (73,571) (64,428) (55,854) Net investment in operating properties 649,292 654,968 611,761 601,084 589,697 Construction in progress 51,565 32,474 69,519 73,084 75,624 Net investments in real estate 700,857 687,442 681,280 674,168 665,321 Cash and cash equivalents 13,421 5,526 3,998 6,628 10,204 Restricted cash 316 8,678 8,712 9,291 10,598 Accounts and other receivables, net 10,071 8,230 7,403 6,562 7,045 Lease intangibles, net 23,359 28,253 30,905 36,643 43,449 Goodwill 41,191 41,191 41,191 41,191 41,191 Other assets 38,187 37,730 37,431 33,743 30,833 Total assets $ 827,402 $ 817,050 $ 810,920 $ 808,226 $ 808,641 Liabilities and equity: Liabilities Revolving credit facility $ 62,750 $ 54,750 $ 40,250 $ 5,000 $ - Mortgage loans payable 91,615 91,699 91,782 116,864 110,501 Accounts payable and accrued expenses 44,291 36,547 39,096 38,822 42,978 Deferred rent payable 4,198 4,027 3,785 3,535 3,284 Acquired below-market lease contracts, net 9,171 10,120 10,898 11,872 13,021 Prepaid rent and other liabilities 9,049 9,844 10,755 11,946 11,589 Total liabilities 221,074 206,987 196,566 188,039 181,373 Stockholders' equity Common stock, par value $0.01 206 205 204 204 195 Additional paid-in capital 261,138 259,503 257,338 256,183 241,700 Accumulated other comprehensive income (loss) (4) (26) (47) (34) (43) Accumulated deficit (32,121) (29,643) (26,683) (23,545) (19,998) Total stockholders' equity 229,219 230,039 230,812 232,808 221,854 Noncontrolling interests 377,109 380,024 383,542 387,379 405,414 Total equity 606,328 610,063 614,354 620,187 627,268 Total liabilities and equity $ 827,402 $ 817,050 $ 810,920 $ 808,226 $ 808,641 |
