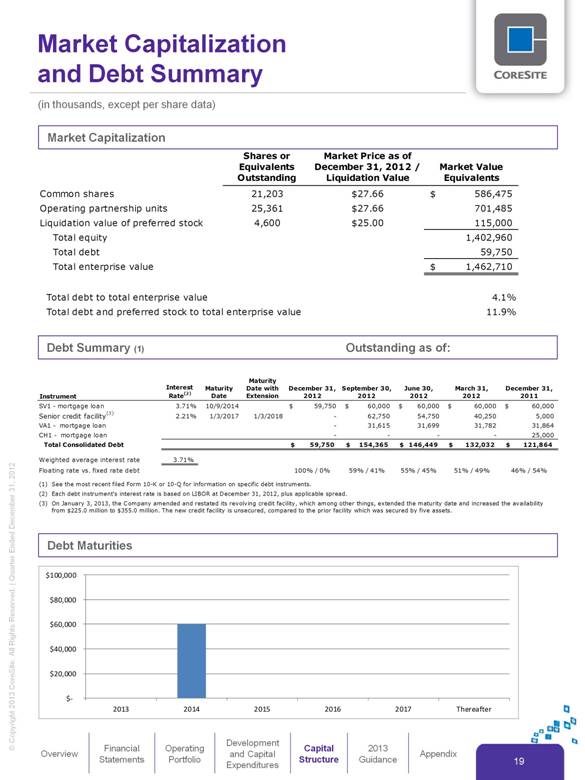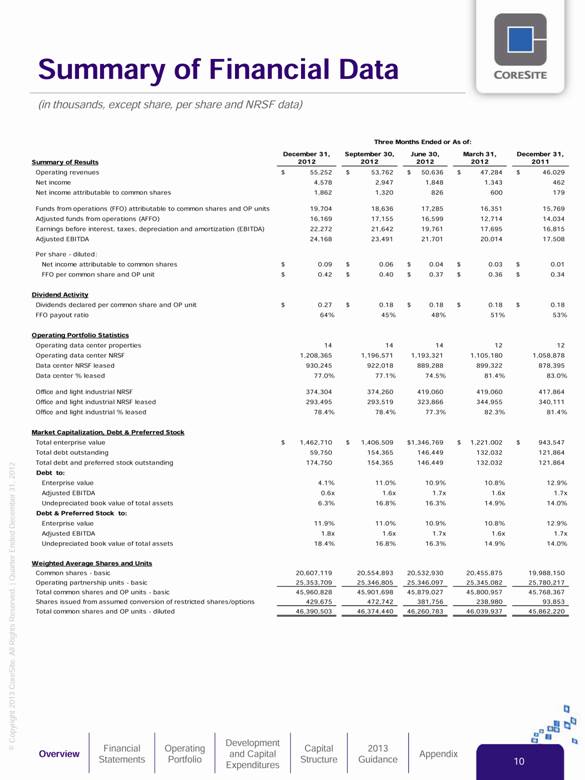
| Summary of Financial Data Overview Financial Statements Operating Portfolio Development and Capital Expenditures Capital Structure 2013 Guidance Appendix (in thousands, except share, per share and NRSF data) 10 Three Months Ended or As of: December 31, September 30, June 30, March 31, December 31, Summary of Results 2012 2012 2012 2012 2011 Operating revenues $ 55,252 $ 53,762 $ 50,636 $ 47,284 $ 46,029 Net income 4,578 2,947 1,848 1,343 462 Net income attributable to common shares 1,862 1,320 826 600 179 Funds from operations (FFO) attributable to common shares and OP units 19,704 18,636 17,285 16,351 15,769 Adjusted funds from operations (AFFO) 16,169 17,155 16,599 12,714 14,034 Earnings before interest, taxes, depreciation and amortization (EBITDA) 22,272 21,642 19,761 17,695 16,815 Adjusted EBITDA 24,168 23,491 21,701 20,014 17,508 Per share - diluted: Net income attributable to common shares $ 0.09 $0.06 $0.04 $0.03 $0.01 FFO per common share and OP unit $ 0.42 $0.40 $0.37 $0.36 $0.34 Dividend Activity Dividends declared per common share and OP unit $ 0.27 $0.18 $0.18 $0.18 $0.18 FFO payout ratio 64% 45% 48% 51% 53% Operating Portfolio Statistics Operating data center properties 14 14 14 12 12 Operating data center NRSF 1,208,365 1,196,571 1,193,321 1,105,180 1,058,878 Data center NRSF leased 930,245 922,018 889,288 899,322 878,395 Data center % leased 77.0% 77.1% 74.5% 81.4% 83.0% Office and light industrial NRSF 374,304 374,260 419,060 419,060 417,864 Office and light industrial NRSF leased 293,495 293,519 323,866 344,955 340,111 Office and light industrial % leased 78.4% 78.4% 77.3% 82.3% 81.4% Market Capitalization, Debt & Preferred Stock Total enterprise value $ 1,462,710 $ 1,406,509 $ 1,346,769 $ 1,221,002 $ 943,547 Total debt outstanding 59,750 154,365 146,449 132,032 121,864 Total debt and preferred stock outstanding 174,750 154,365 146,449 132,032 121,864 Debt to: Enterprise value 4.1% 11.0% 10.9% 10.8% 12.9% Adjusted EBITDA 0.6x 1.6x 1.7x 1.6x 1.7x Undepreciated book value of total assets 6.3% 16.8% 16.3% 14.9% 14.0% Debt & Preferred Stock to: Enterprise value 11.9% 11.0% 10.9% 10.8% 12.9% Adjusted EBITDA 1.8x 1.6x 1.7x 1.6x 1.7x Undepreciated book value of total assets 18.4% 16.8% 16.3% 14.9% 14.0% Weighted Average Shares and Units Common shares - basic 20,607,119 20,554,893 20,532,930 20,455,875 19,988,150 Operating partnership units - basic 25,353,709 25,346,805 25,346,097 25,345,082 25,780,217 Total common shares and OP units - basic 45,960,828 45,901,698 45,879,027 45,800,957 45,768,367 Shares issued from assumed conversion of restricted shares/options 429,675 472,742 381,756 238,980 93,853 Total common shares and OP units - diluted 46,390,503 46,374,440 46,260,783 46,039,937 45,862,220 |