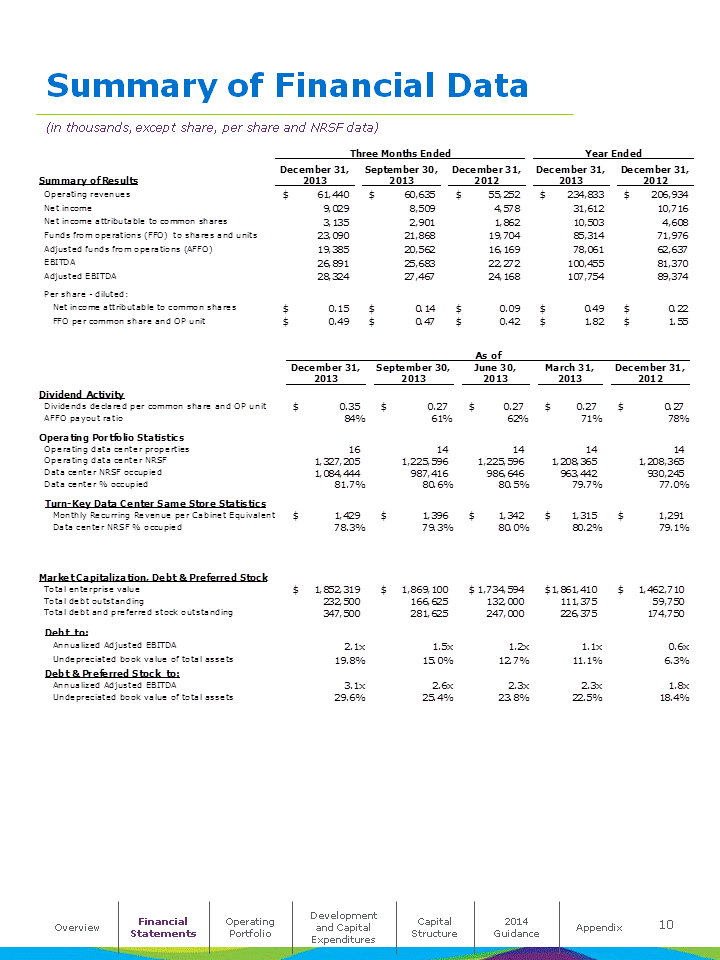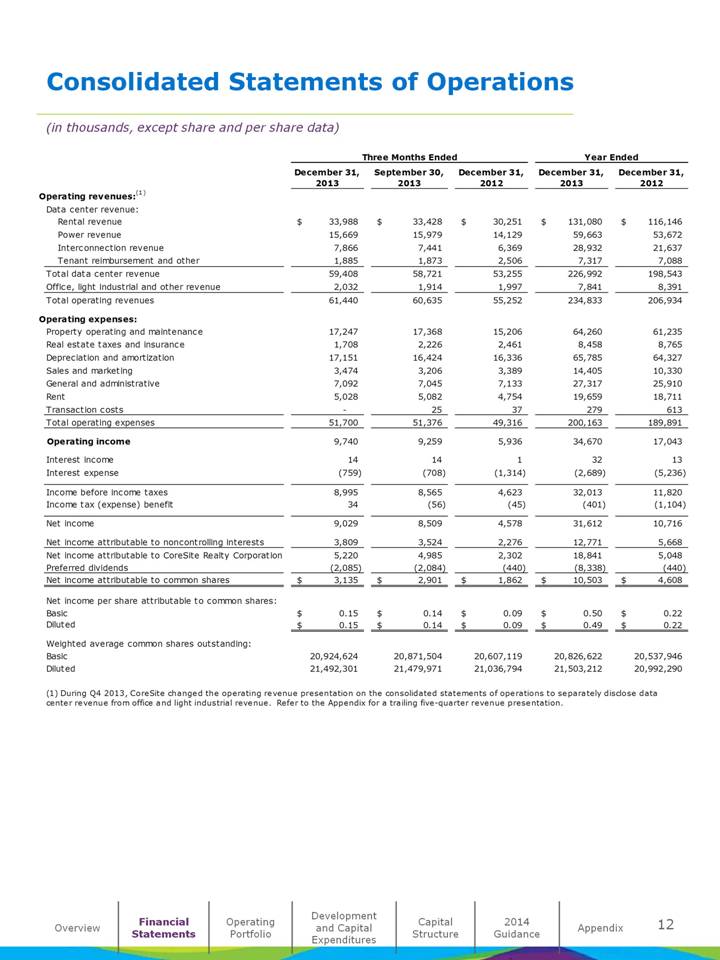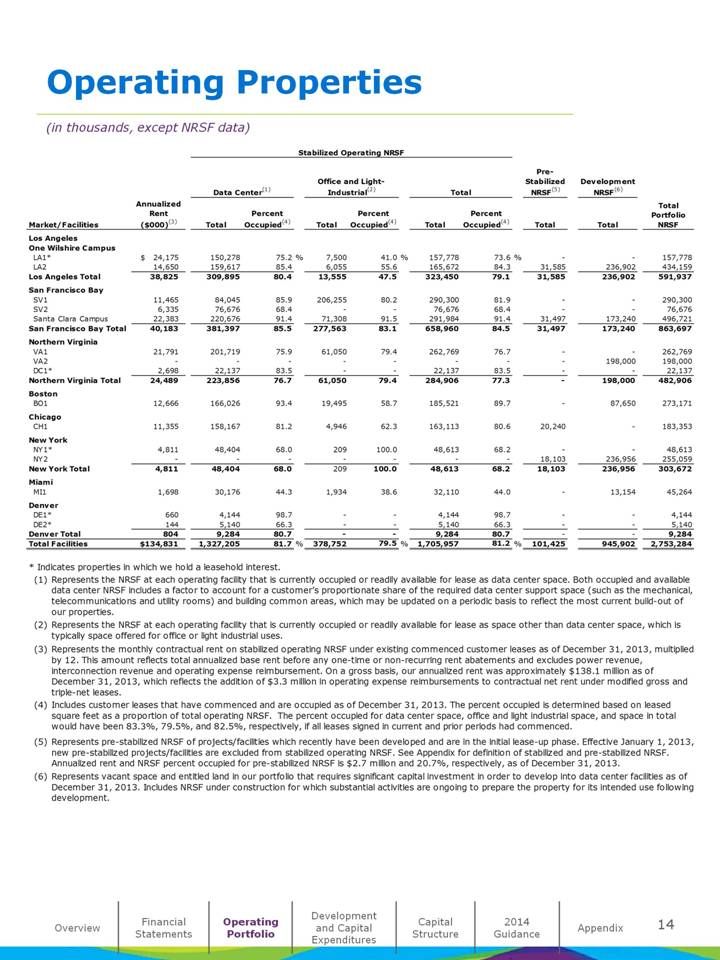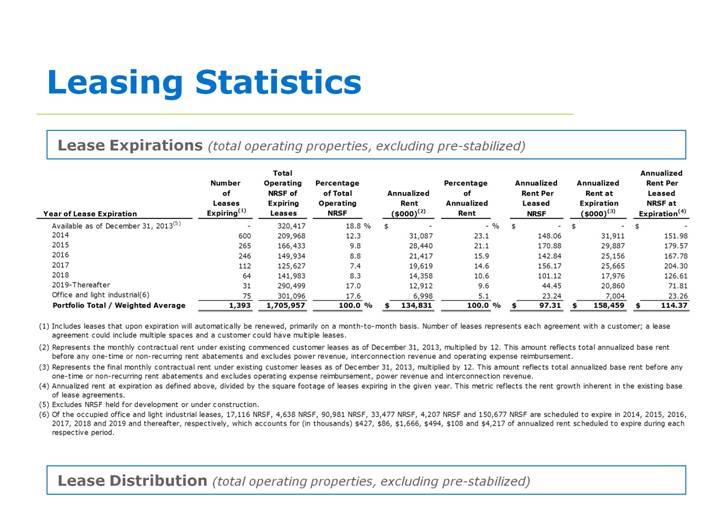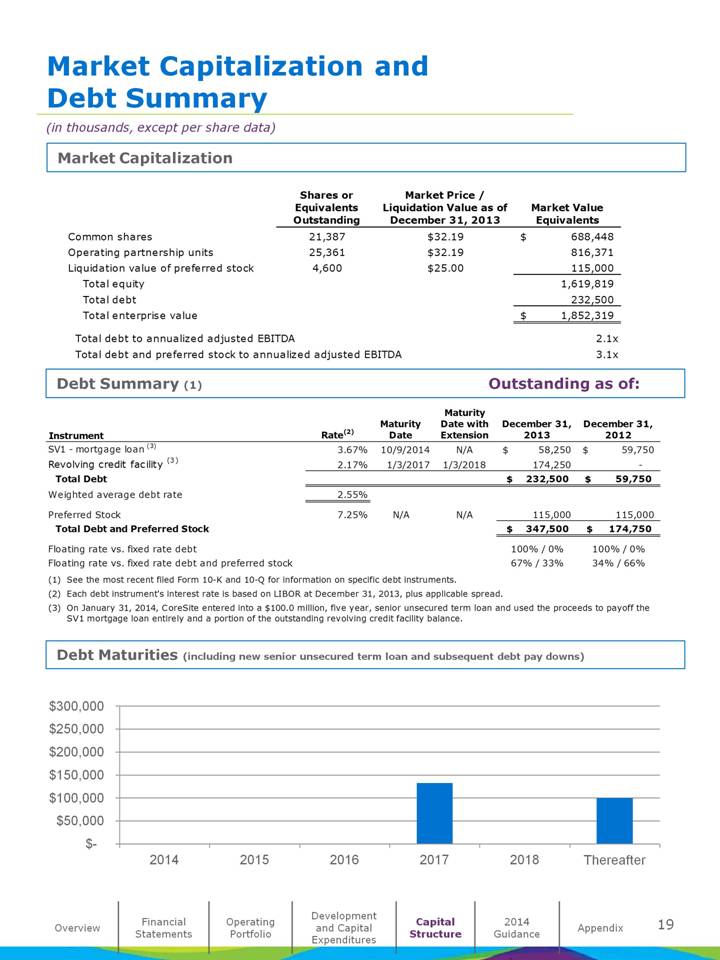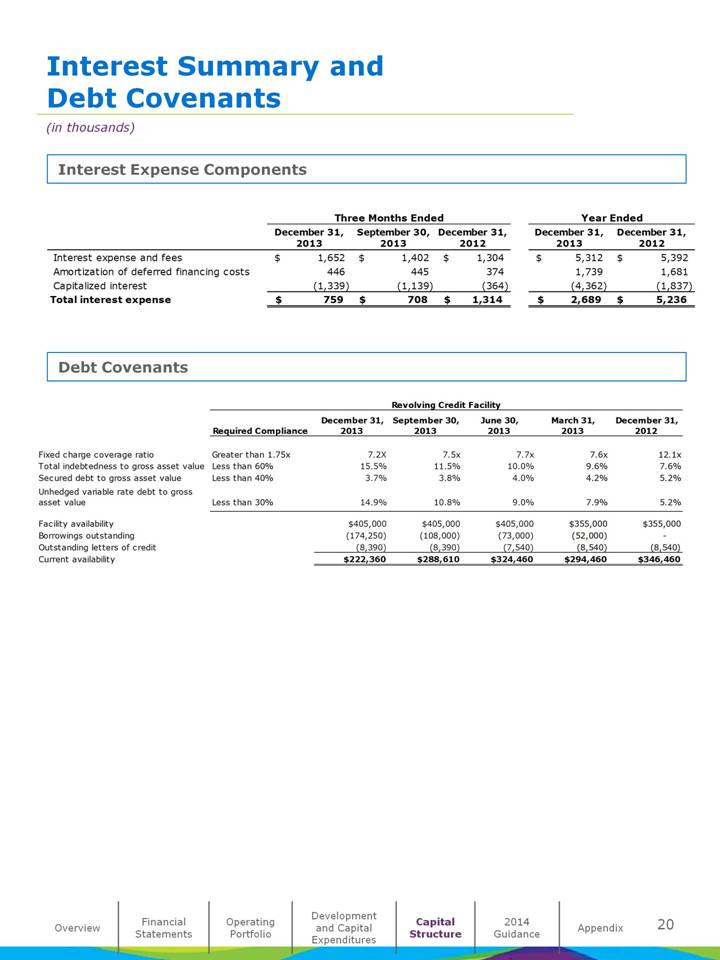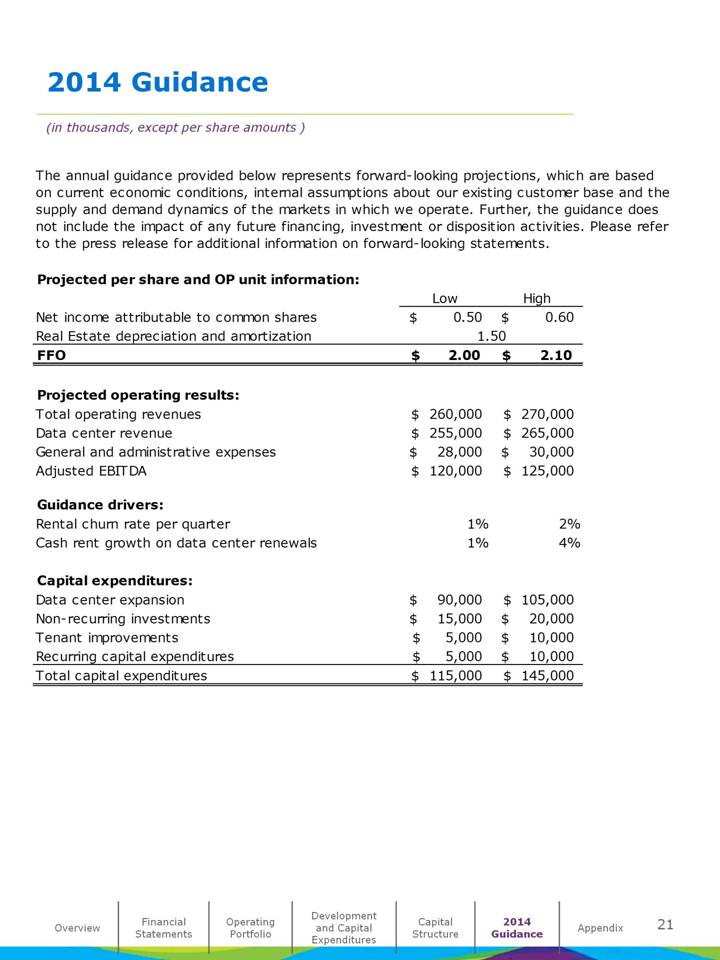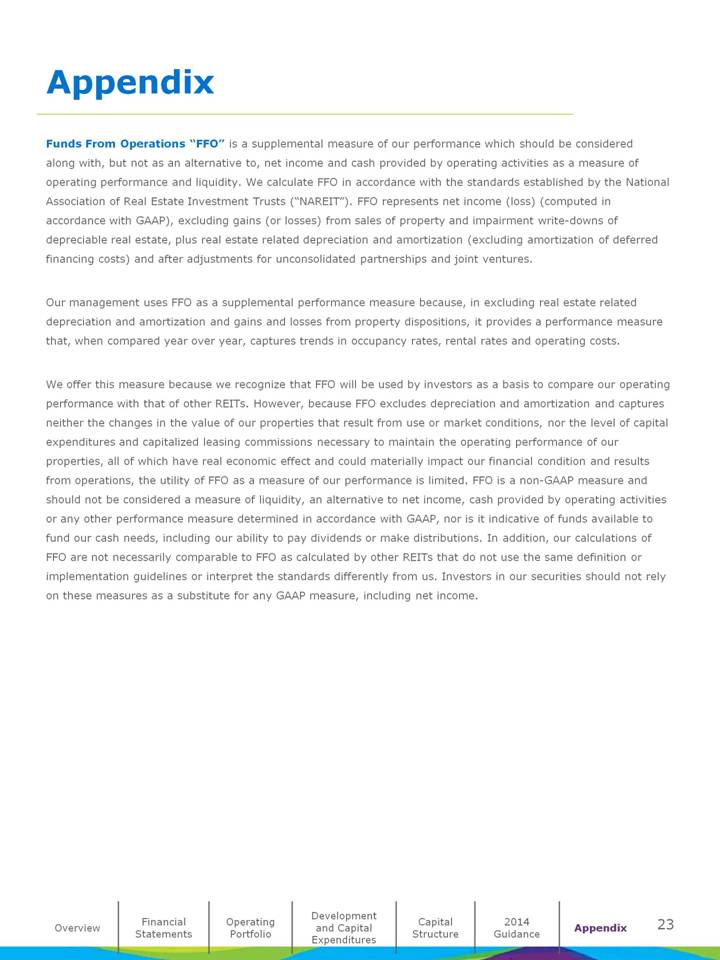
| Reconciliations of Net Income to FFO, AFFO and EBITDA (in thousands, except share and per share data) Reconciliation of Net Income to FFO Reconciliation of FFO to AFFO Reconciliation of Net Income to EBITDA and Adjusted EBITDA Overview Financial Statements Operating Portfolio Development and Capital Expenditures Capital Structure 2014 Guidance Appendix Reconciliations of Net Income to FFO, AFFO and EBITDA (in thousands, except per share data) Reconciliation of net income attributable to controlling interests to funds from operations (FFO): Three Months Ended Year Ended December 31, 2013 September 30, 2013 December 31, 2012 December 31, 2013 December 31, 2012 Net income $ 9,029 $ 8,509 $ 4,578 $ 31,612 $ 10,716 Real estate depreciation and amortization 16,146 15,443 15,566 62,040 61,700 FFO $ 25,175 $ 23,952 $ 20,144 $ 93,652 $ 72,416 Preferred stock dividends (2,085) (2,084) (440) (8,338) (440) FFO available to common shareholders and OP unit holders $ 23,090 $ 21,868 $ 19,704 $ 85,314 $ 71,976 Weighted average common shares outstanding - diluted 21,492,301 21,479,971 21,036,794 21,503,212 20,992,290 Weighted average OP units outstanding - diluted 25,360,848 25,353,942 25,353,709 25,355,567 25,347,936 Total weighted average shares and units outstanding - diluted 46,853,149 46,833,913 46,390,503 46,858,779 46,340,226 FFO per common share and OP unit - diluted $ 0.49 $ 0.47 $ 0.42 $ 1.82 $ 1.55 Reconciliation of FFO to adjusted funds from operations (AFFO): Three Months Ended Year Ended December 31, 2013 September 30, 2013 December 31, 2012 December 31, 2013 December 31, 2012 FFO available to common shareholders and unit holders $ 23,090 $ 21,868 $ 19,704 $ 85,314 $ 71,976 Adjustments: Amortization of deferred financing costs 446 445 374 1,739 1,681 Non-cash compensation 1,433 1,759 1,568 6,770 5,650 Non-real estate depreciation 1,005 981 770 3,745 2,627 Straight-line rent adjustment (304) (539) (720) (1,274) (3,597) Amortization of above and below market leases (152) (241) (264) (823) (1,505) Recurring capital expenditures (1,612) (1,174) (2,064) (5,420) (4,074) Tenant improvements (2,074) (1,578) (278) (6,292) (3,656) Capitalized leasing commissions (2,447) (959) (2,921) (5,698) (6,465) AFFO available to common shareholders and OP unit holders $ 19,385 $ 20,562 $ 16,169 $ 78,061 $ 62,637 Reconciliation of earnings before interest, taxes, depreciation and amortization (EBITDA): Three Months Ended Year Ended December 31, 2013 September 30, 2013 December 31, 2012 December 31, 2013 December 31, 2012 Net income $ 9,029 $ 8,509 $ 4,578 $ 31,612 $ 10,716 Adjustments: Interest expense, net of interest income 745 694 1,313 2,657 5,223 Income taxes (34) 56 45 401 1,104 Depreciation and amortization 17,151 16,424 16,336 65,785 64,327 EBITDA $ 26,891 $ 25,683 $ 22,272 $ 100,455 $ 81,370 Non-cash compensation 1,433 1,759 1,568 6,770 5,650 Transaction costs / litigation — 25 328 529 2,354 Adjusted EBITDA $ 28,324 $ 27,467 $ 24,168 $ 107,754 $ 89,374 |

