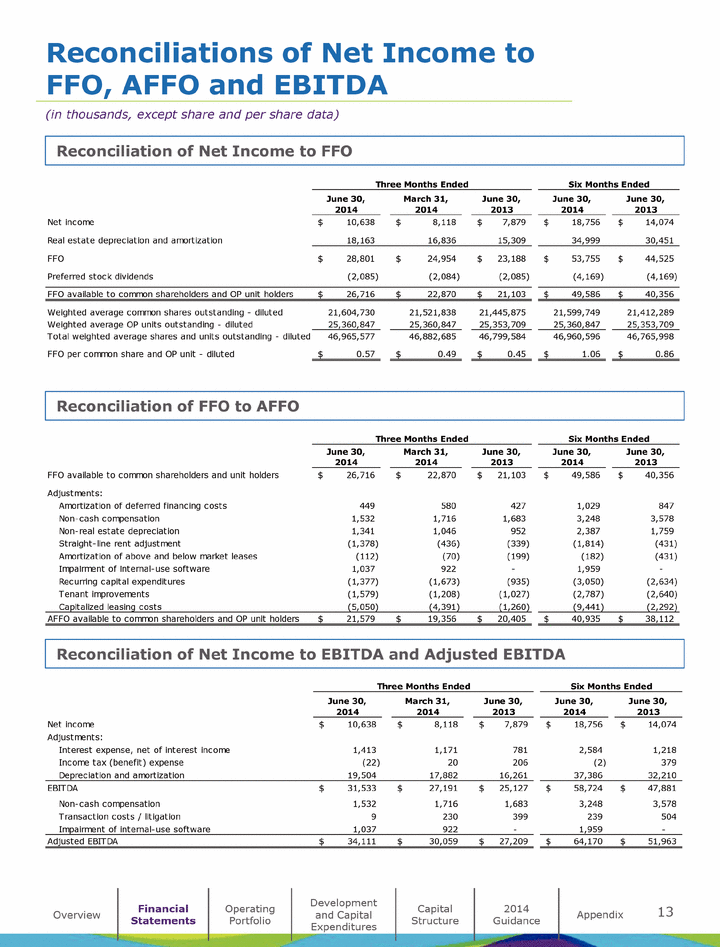
| 13 Reconciliations of Net Income to FFO, AFFO and EBITDA (in thousands, except share and per share data) Reconciliation of Net Income to FFO Reconciliation of FFO to AFFO Reconciliation of Net Income to EBITDA and Adjusted EBITDA Overview Financial Statements Operating Portfolio Development and Capital Expenditures Capital Structure 2014 Guidance Appendix June 30, 2014 March 31, 2014 June 30, 2013 June 30, 2014 June 30, 2013 FFO available to common shareholders and unit holders 26,716 $ 22,870 $ 21,103 $ 49,586 $ 40,356 $ Adjustments: Amortization of deferred financing costs 449 580 427 1,029 847 Non-cash compensation 1,532 1,716 1,683 3,248 3,578 Non-real estate depreciation 1,341 1,046 952 2,387 1,759 Straight-line rent adjustment (1,378) (436) (339) (1,814) (431) Amortization of above and below market leases (112) (70) (199) (182) (431) Impairment of internal-use software 1,037 922 - 1,959 - Recurring capital expenditures (1,377) (1,673) (935) (3,050) (2,634) Tenant improvements (1,579) (1,208) (1,027) (2,787) (2,640) Capitalized leasing costs (5,050) (4,391) (1,260) (9,441) (2,292) AFFO available to common shareholders and OP unit holders 21,579 $ 19,356 $ 20,405 $ 40,935 $ 38,112 $ Three Months Ended Six Months Ended June 30, 2014 March 31, 2014 June 30, 2013 June 30, 2014 June 30, 2013 Net income 10,638 $ 8,118 $ 7,879 $ 18,756 $ 14,074 $ Adjustments: Interest expense, net of interest income 1,413 1,171 781 2,584 1,218 Income tax (benefit) expense (22) 20 206 (2) 379 Depreciation and amortization 19,504 17,882 16,261 37,386 32,210 EBITDA 31,533 $ 27,191 $ 25,127 $ 58,724 $ 47,881 $ Non-cash compensation 1,532 1,716 1,683 3,248 3,578 Transaction costs / litigation 9 230 399 239 504 Impairment of internal-use software 1,037 922 - 1,959 - Adjusted EBITDA 34,111 $ 30,059 $ 27,209 $ 64,170 $ 51,963 $ Three Months Ended Six Months Ended June 30, 2014 March 31, 2014 June 30, 2013 June 30, 2014 June 30, 2013 Net income 10,638 $ 8,118 $ 7,879 $ 18,756 $ 14,074 $ Real estate depreciation and amortization 18,163 16,836 15,309 34,999 30,451 FFO 28,801 $ 24,954 $ 23,188 $ 53,755 $ 44,525 $ Preferred stock dividends (2,085) (2,084) (2,085) (4,169) (4,169) FFO available to common shareholders and OP unit holders 26,716 $ 22,870 $ 21,103 $ 49,586 $ 40,356 $ Weighted average common shares outstanding - diluted 21,604,730 21,521,838 21,445,875 21,599,749 21,412,289 Weighted average OP units outstanding - diluted 25,360,847 25,360,847 25,353,709 25,360,847 25,353,709 Total weighted average shares and units outstanding - diluted 46,965,577 46,882,685 46,799,584 46,960,596 46,765,998 FFO per common share and OP unit - diluted 0.57 $ 0.49 $ 0.45 $ 1.06 $ 0.86 $ Three Months Ended Six Months Ended |
