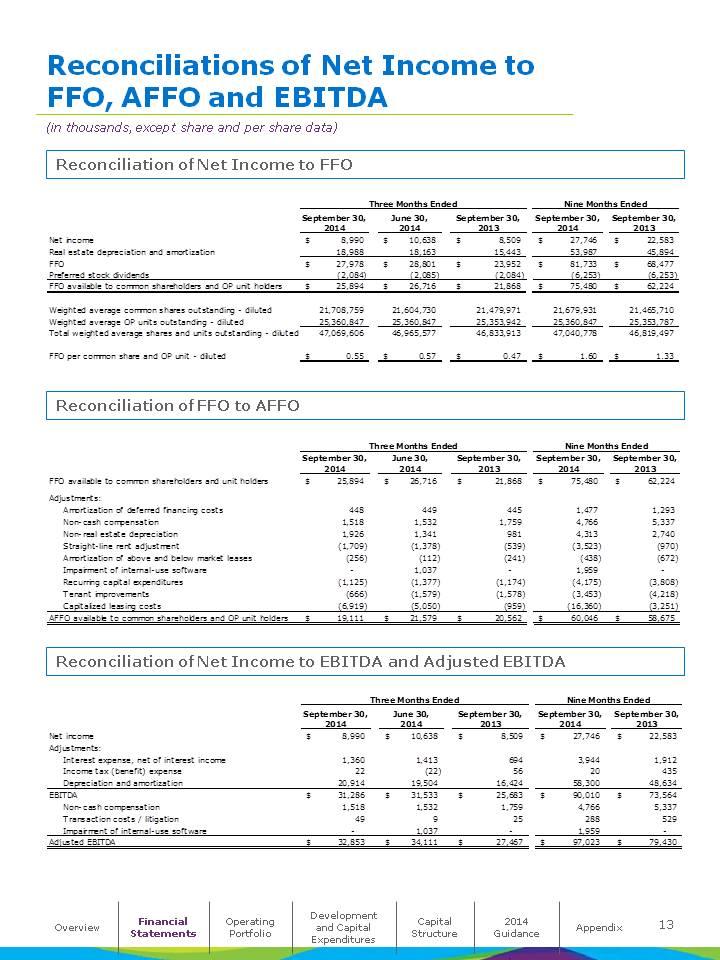
| Reconciliations of Net Income to FFO, AFFO and EBITDA (in thousands, except share and per share data) Reconciliation of Net Income to FFO Three Months Ended Nine Months Ended September 30, June 30, September 30, September 30, September 30, 2014 2014 2013 2014 2013 Net income $ 8,990 $ 10,638 $ 8,509 $ 27,746 $ 22,583 Real estate depreciation and amortization 18,988 18,163 15,443 53,987 45,894 FFO $ 27,978 $ 28,801 $ 23,952 $ 81,733 $ 68,477 Preferred stock dividends (2,084) (2,085) (2,084) (6,253) (6,253) FFO available to common shareholders and OP unit holders $ 25,894 $ 26,716 $ 21,868 $ 75,480 $ 62,224 Weighted average common shares outstanding - diluted 21,708,759 21,604,730 21,479,971 21,679,931 21,465,710 Weighted average OP units outstanding - diluted 25,360,847 25,360,847 25,353,942 25,360,847 25,353,787 Total weighted average shares and units outstanding - diluted 47,069,606 46,965,577 46,833,913 47,040,778 46,819,497 FFO per common share and OP unit - diluted $ 0.55 $ 0.57 $ 0.47 $ 1.60 $ 1.33 Reconciliation of FFO to AFFO Three Months Ended Nine Months Ended September 30, June 30, September 30, September 30, September 30, 2014 2014 2013 2014 2013 FFO available to common shareholders and unit holders $ 25,894 $ 26,716 $ 21,868 $ 75,480 $ 62,224 Adjustments: Amortization of deferred financing costs 448 449 445 1,477 1,293 Non-cash compensation 1,518 1,532 1,759 4,766 5,337 Non-real estate depreciation 1,926 1,341 981 4,313 2,740 Straight-line rent adjustment (1,709) (1,378) (539) (3,523) (970) Amortization of above and below market leases (256) (112) (241) (438) (672) Impairment of internal-use software - 1,037 - 1,959 -Recurring capital expenditures (1,125) (1,377) (1,174) (4,175) (3,808) Tenant improvements (666) (1,579) (1,578) (3,453) (4,218) Capitalized leasing costs (6,919) (5,050) (959) (16,360) (3,251) AFFO available to common shareholders and OP unit holders $ 19,111 $ 21,579 $ 20,562 $ 60,046 $ 58,675 Reconciliation of Net Income to EBITDA and Adjusted EBITDA Three Months Ended Nine Months Ended September 30, June 30, September 30, September 30, September 30, 2014 2014 2013 2014 2013 Net income $ 8,990 $ 10,638 $ 8,509 $ 27,746 $ 22,583 Adjustments: Interest expense, net of interest income 1,360 1,413 694 3,944 1,912 Income tax (benefit) expense 22 (22) 56 20 435 Depreciation and amortization 20,914 19,504 16,424 58,300 48,634 EBITDA $ 31,286 $ 31,533 $ 25,683 $ 90,010 $ 73,564 Non-cash compensation 1,518 1,532 1,759 4,766 5,337 Transaction costs / litigation 49 9 25 288 529 Impairment of internal-use software - 1,037 - 1,959 -Adjusted EBITDA $ 32,853 $ 34,111 $ 27,467 $ 97,023 $ 79,430 Development Financial Operating Capital 2014 13 Overview and Capital Appendix Statements Portfolio Structure Guidance Expenditures |