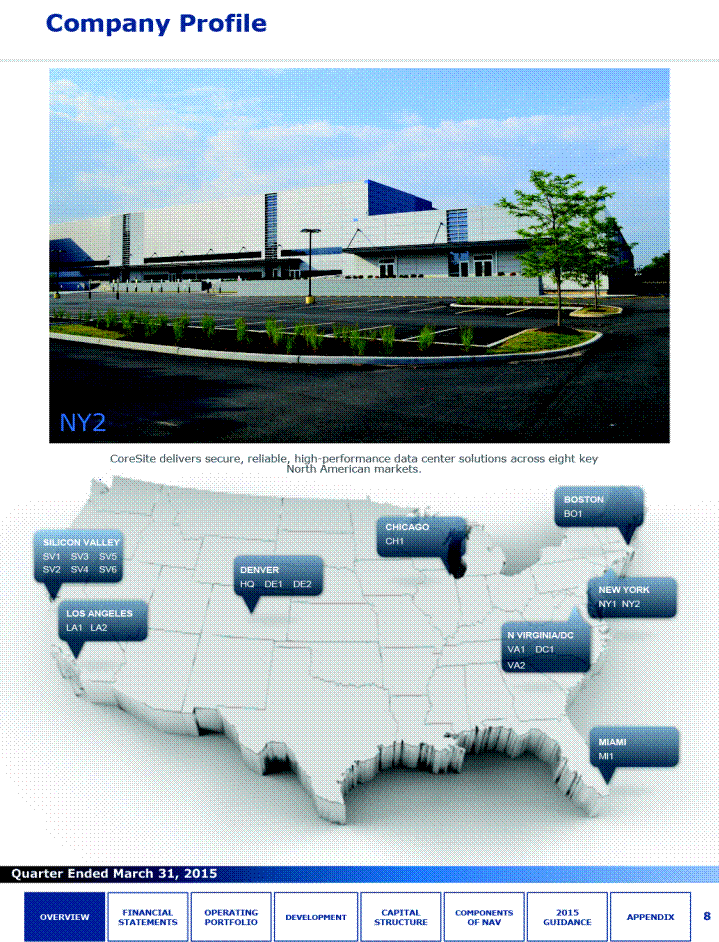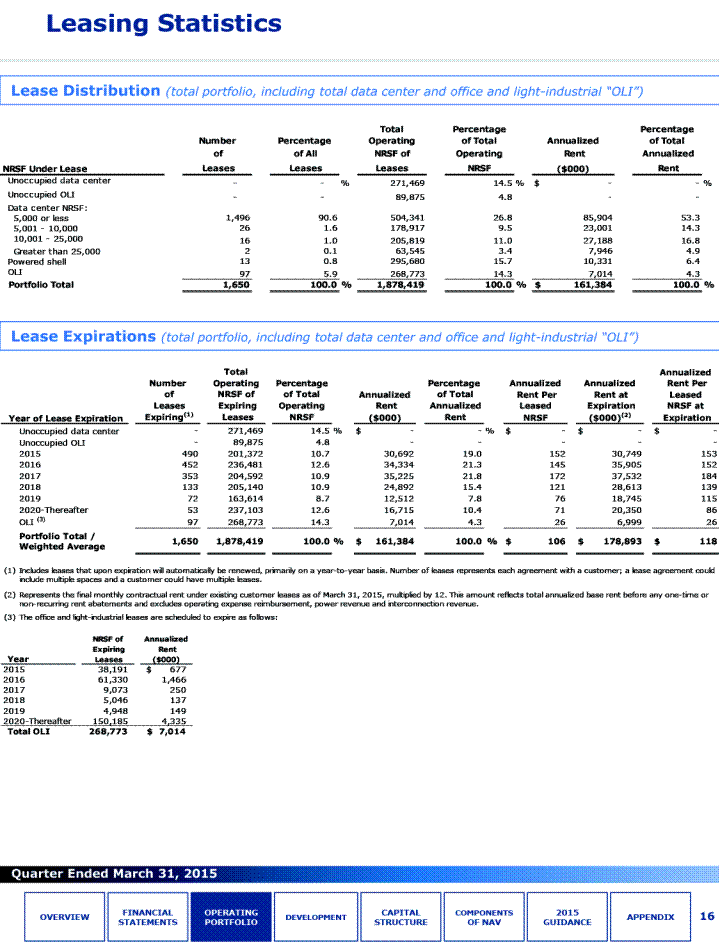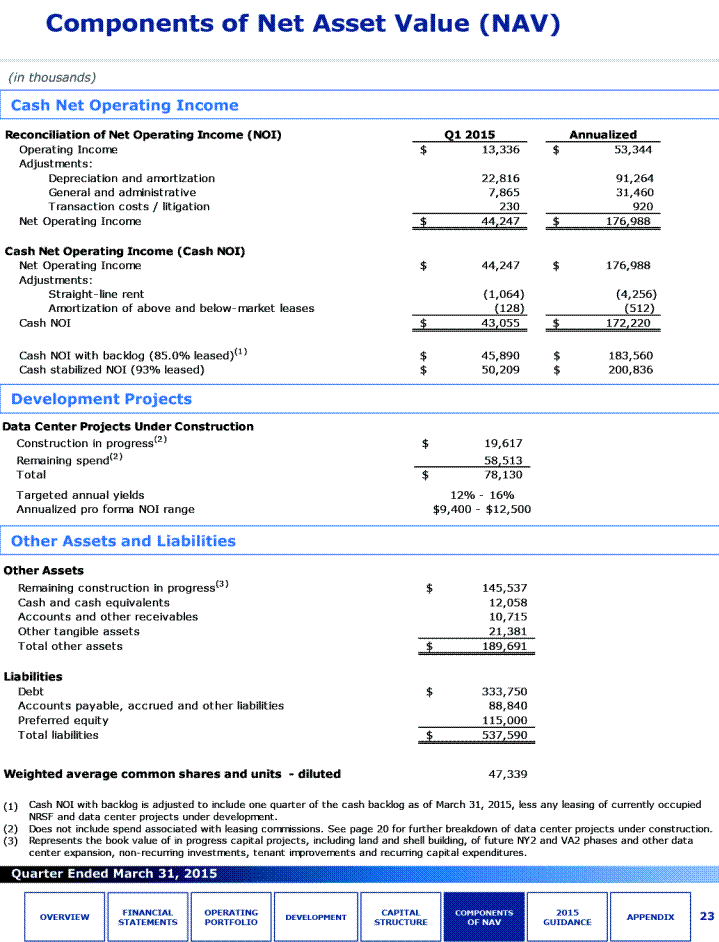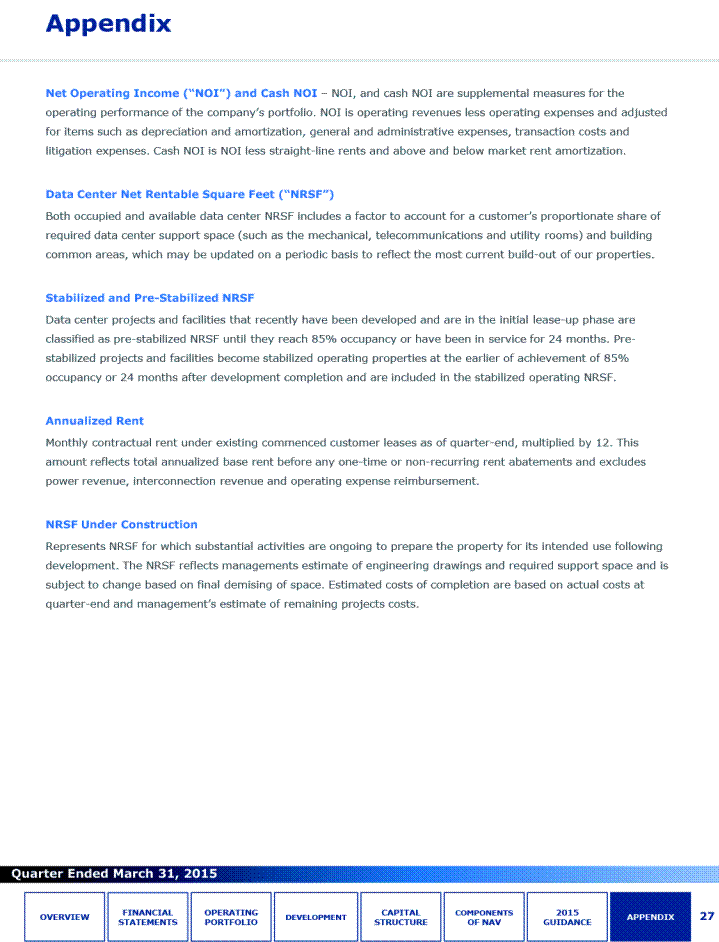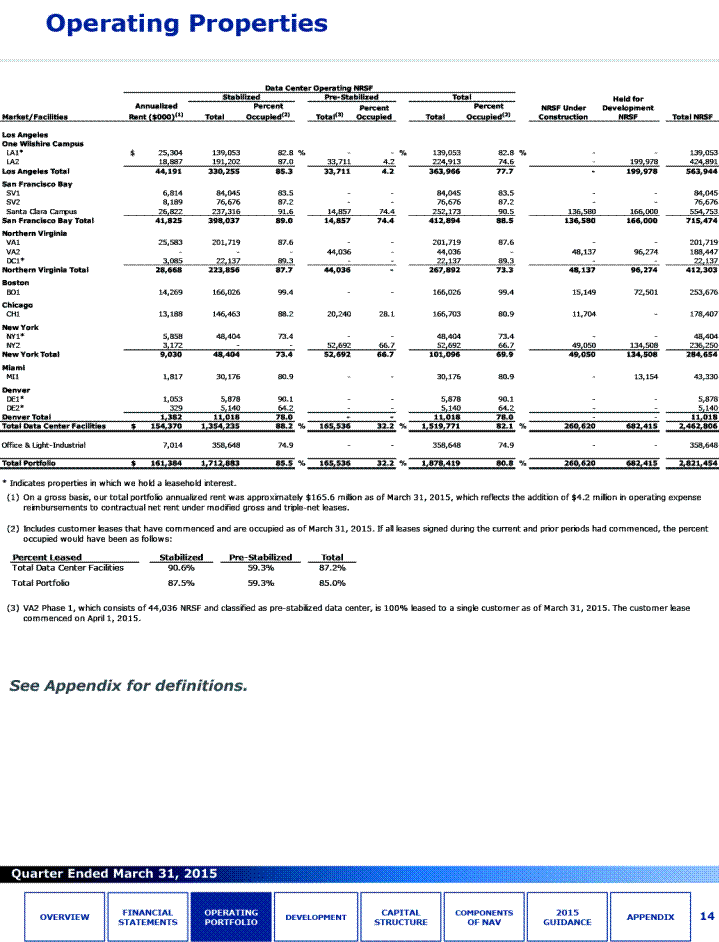
| Operating Properties Data Center Operating NRSF Stabilized Pre-Stabilized Total NRSF Under Construction Held for Development NRSF Market/Facilities Annualized Rent ($000)(1) Total Percent Occupied(2) Total(3) Percent Occupied Total Percent Occupied(2) Total NRSF Los Angeles One Wilshire Campus LA1* $ 25,304 139,053 82.8 % - - % 139,053 82.8 % - - 139,053 LA2 18,887 191,202 87.0 33,711 4.2 224,913 74.6 - 199,978 424,891 Los Angeles Total 44,191 330,255 85.3 33,711 4.2 363,966 77.7 - 199,978 563,944 San Francisco Bay SV1 6,814 84,045 83.5 - - 84,045 83.5 - - 84,045 SV2 8,189 76,676 87.2 - - 76,676 87.2 - - 76,676 Santa Clara Campus 26,822 237,316 91.6 14,857 74.4 252,173 90.5 136,580 166,000 554,753 San Francisco Bay Total 41,825 398,037 89.0 14,857 74.4 412,894 88.5 136,580 166,000 715,474 Northern Virginia VA1 25,583 201,719 87.6 - - 201,719 87.6 - - 201,719 VA2 - - - 44,036 - 44,036 - 48,137 96,274 188,447 DC1* 3,085 22,137 89.3 - - 22,137 89.3 - - 22,137 Northern Virginia Total 28,668 223,856 87.7 44,036 - 267,892 73.3 48,137 96,274 412,303 Boston BO1 14,269 166,026 99.4 - - 166,026 99.4 15,149 72,501 253,676 Chicago CH1 13,188 146,463 88.2 20,240 28.1 166,703 80.9 11,704 - 178,407 New York NY1* 5,858 48,404 73.4 - - 48,404 73.4 - - 48,404 NY2 3,172 - - 52,692 66.7 52,692 66.7 49,050 134,508 236,250 New York Total 9,030 48,404 73.4 52,692 66.7 101,096 69.9 49,050 134,508 284,654 Miami MI1 1,817 30,176 80.9 - - 30,176 80.9 - 13,154 43,330 Denver DE1* 1,053 5,878 90.1 - - 5,878 90.1 - - 5,878 DE2* 329 5,140 64.2 - - 5,140 64.2 - - 5,140 Denver Total 1,382 11,018 78.0 - - 11,018 78.0 - - 11,018 Total Data Center Facilities $ 154,370 1,354,235 88.2 % 165,536 32.2 % 1,519,771 82.1 % 260,620 682,415 2,462,806 Office & Light-Industrial 7,014 358,648 74.9 - - 358,648 74.9 - - 358,648 Total Portfolio $ 161,384 1,712,883 85.5 % 165,536 32.2 % 1,878,419 80.8 % 260,620 682,415 2,821,454 * Indicates properties in which we hold a leasehold interest. (1) On a gross basis, our total portfolio annualized rent was approximately $165.6 million as of March 31, 2015, which reflects the addition of $4.2 million in operating expense reimbursements to contractual net rent under modified gross and triple-net leases. (2) Includes customer leases that have commenced and are occupied as of March 31, 2015. If all leases signed during the current and prior periods had commenced, the percent occupied would have been as follows: Percent Leased Stabilized Pre-Stabilized Total Total Data Center Facilities 90.6% 59.3% 87.2% Total Portfolio 87.5% 59.3% 85.0% (3) VA2 Phase 1, which consists of 44,036 NRSF and classified as pre-stabilized data center, is 100% leased to a single customer as of March 31, 2015. The customer lease commenced on April 1, 2015. 14 OVERVIEW FINANCIAL STATEMENTS OPERATING PORTFOLIO DEVELOPMENT CAPITAL STRUCTURE Components of NAV 2015 GUIDANCE APPENDIX See Appendix for definitions. |
