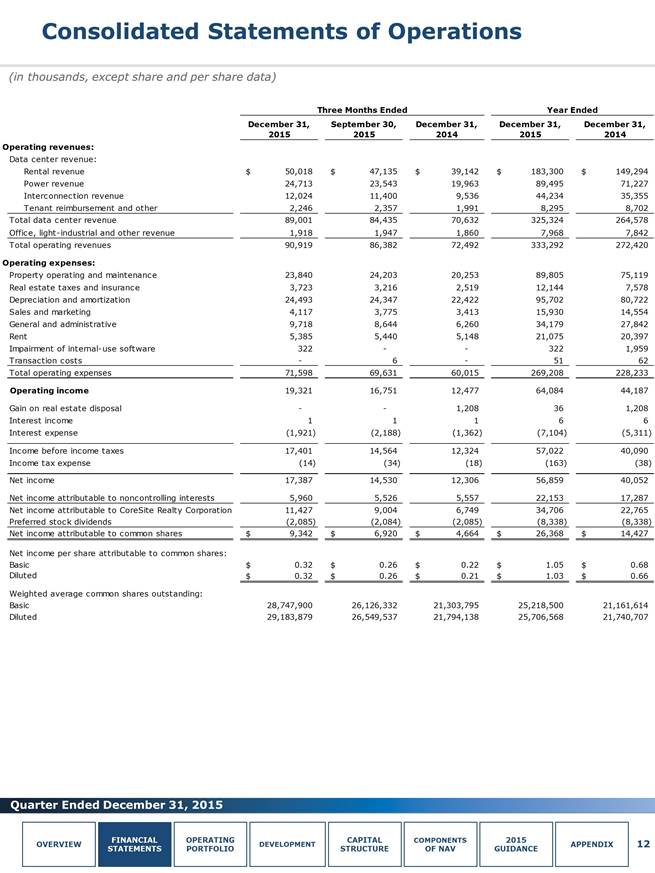
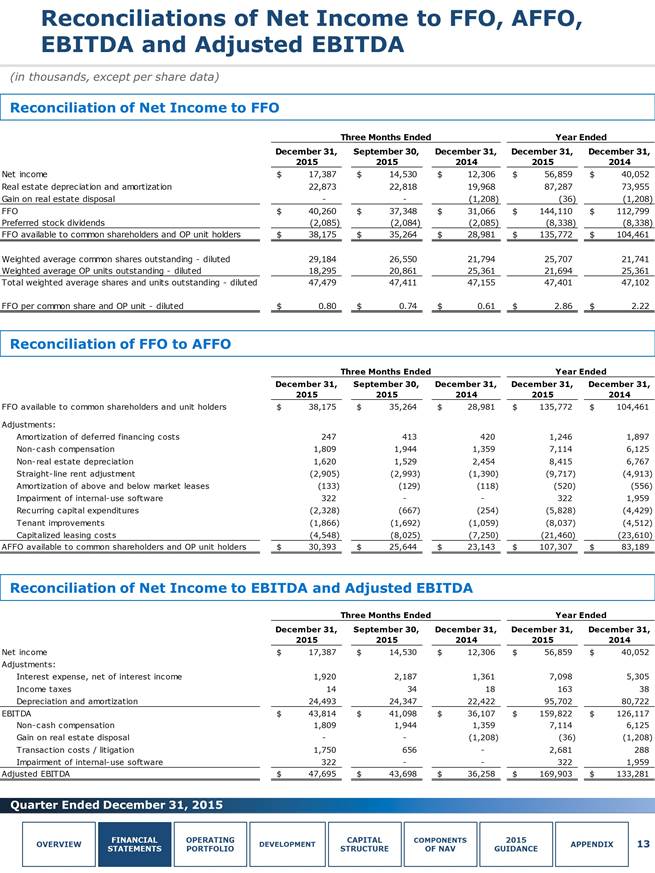
Consolidated Statements of Operations (in thousands, except share and per share data) Three Months Ended Year Ended December 31, 2015 September 30, 2015 December 31, 2014 December 31, 2015 December 31, 2014 Operating revenues: Data c enter revenue: Rental revenue Power revenue Interc onnec tion revenue Tenant reimbursement and other $ 50,018 24,713 12,024 2,246 $ 47,135 23,543 11,400 2,357 $ 39,142 19,963 9,536 1,991 $ 183,300 89,495 44,234 8,295 $ 149,294 71,227 35,355 8,702 Total data c enter revenue Offic e, light-industrial and other revenue 89,001 1,918 84,435 1,947 70,632 1,860 325,324 7,968 264,578 7,842 Total operating revenues 90,919 86,382 72,492 333,292 272,420 Operating expenses: Property operating and maintenanc e Real estate taxes and insuranc e Deprec iation and amortization Sales and marketing General and administrative Rent Impairment of internal-use software Transaction costs 23,840 3,723 24,493 4,117 9,718 5,385 322 - 24,203 3,216 24,347 3,775 8,644 5,440 - 6 20,253 2,519 22,422 3,413 6,260 5,148 - - 89,805 12,144 95,702 15,930 34,179 21,075 322 51 75,119 7,578 80,722 14,554 27,842 20,397 1,959 62 Total operating expenses 71,598 69,631 60,015 269,208 228,233 Operating income 19,321 16,751 12,477 64,084 44,187 Gain on real estate disposal Interest inc ome Interest expense - - 1,208 1 (1,362) 36 6 (7,104) 1,208 6 (5,311) 1 (1,921) 1 (2,188) Inc ome before inc ome taxes Inc ome tax expense 17,401 (14) 14,564 (34) 12,324 (18) 57,022 (163) 40,090 (38) Net inc ome 17,387 14,530 12,306 56,859 40,052 Net inc ome attributable to nonc ontrolling interests 5,870 5,526 5,557 22,063 17,287 Net inc ome attributable to CoreSite Realty Corporation Preferred stoc k dividends 11,517 (2,085) 9,004 (2,084) 6,749 (2,085) 34,796 (8,338) 22,765 (8,338) Net inc ome attributable to c ommon shares $ 9,432 $ 6,920 $ 4,664 $ 26,458 $ 14,427 Net inc ome per share attributable to c ommon shares: Basic Diluted $ $ 0.33 0.32 $ $ 0.26 0.26 $ $ 0.22 0.21 $ $ 1.05 1.03 $ $ 0.68 0.66 Weighted average c ommon shares outstanding: Basic Diluted 28,747,900 29,183,879 26,126,332 26,549,537 21,303,795 21,794,138 25,218,500 25,706,568 21,161,614 21,740,707 Quarter Ended December 31, 2015 12 OVERVIEW FINANCIAL STATEMENTS OPERATING PORTFOLIO DEVELOPMENT CAPITAL STRUCTURE COMPONENTS OF NAV 2015 GUIDANCE APPENDIX 5,960 11,427 9,342 $0.32 22,153 34,706 26,368