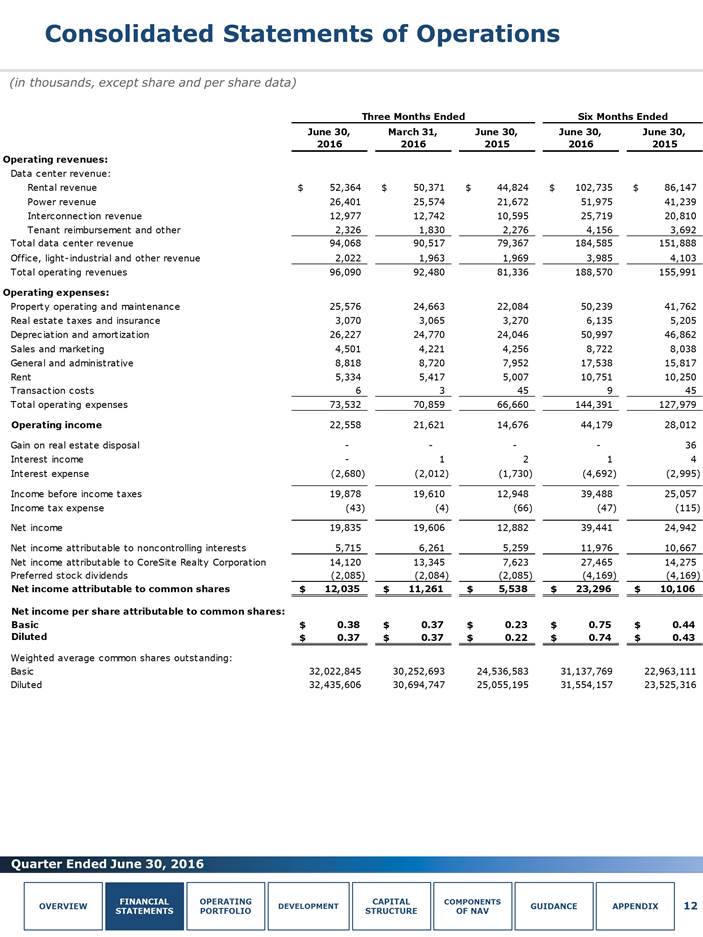
Consolidated Statements of Operations (in thousands, except share and per share data) 12 OVERVIEW FINANCIAL STATEMENTS OPERATING PORTFOLIO DEVELOPMENT CAPITAL STRUCTURE Components of NAV GUIDANCE APPENDIX Three Months Ended Six Months Ended June 30, 2016 March 31, 2016 December 31, 2015 September 30, 2015 June 30, 2015 June 30, 2016 June 30, 2015 Operating revenues: Data center revenue: Rental revenue $ 52,364 $ 50,371 $ 50,018 $ 47,135 $ 44,824 $ 102,735 $ 86,147 Power revenue 26,401 25,574 24,713 23,543 21,672 51,975 41,239 Interconnection revenue 12,977 12,742 12,024 11,400 10,595 25,719 20,810 Tenant reimbursement and other 2,326 1,830 2,246 2,357 2,276 4,156 3,692 Total data center revenue 94,068 90,517 89,001 84,435 79,367 184,585 151,888 Office, light-industrial and other revenue 2,022 1,963 1,918 1,947 1,969 3,985 4,103 Total operating revenues 96,090 92,480 90,919 86,382 81,336 188,570 155,991 Operating expenses: Property operating and maintenance 25,576 24,663 23,840 24,203 22,084 50,239 41,762 Real estate taxes and insurance 3,070 3,065 3,723 3,216 3,270 6,135 5,205 Depreciation and amortization 26,227 24,770 24,493 24,347 24,046 50,997 46,862 Sales and marketing 4,501 4,221 4,117 3,775 4,256 8,722 8,038 General and administrative 8,818 8,720 9,718 8,644 7,952 17,538 15,817 Rent 5,334 5,417 5,385 5,440 5,007 10,751 10,250 Transaction costs 6 3 - 6 45 9 45 Total operating expenses 73,532 70,859 71,598 69,631 66,660 144,391 127,979 Operating income 22,558 21,621 19,321 16,751 14,676 44,179 28,012 Gain on real estate disposal - - - - - - 36 Interest income - 1 1 1 2 1 4 Interest expense (2,680) (2,012) (1,921) (2,188) (1,730) (4,692) (2,995) Income before income taxes 19,878 19,610 17,401 14,564 12,948 39,488 25,057 Income tax expense (43) (4) (14) (34) (66) (47) (115) Net income 19,835 19,606 17,387 14,530 12,882 39,441 24,942 Net income attributable to noncontrolling interests 5,715 6,261 5,960 5,526 5,259 11,976 10,667 Net income attributable to CoreSite Realty Corporation 14,120 13,345 11,427 9,004 7,623 27,465 14,275 Preferred stock dividends (2,085) (2,084) (2,085) (2,084) (2,085) (4,169) (4,169) Net income attributable to common shares $ 12,035 $ 11,261 $ 9,342 $ 6,920 $ 5,538 $ 23,296 $ 10,106 Net income per share attributable to common shares: Basic $ 0.38 $ 0.37 $ 0.32 $ 0.26 $ 0.23 $ 0.75 $ 0.44 Diluted $ 0.37 $ 0.37 $ 0.32 $ 0.26 $ 0.22 $ 0.74 $ 0.43 Weighted average common shares outstanding: Basic 32,022,845 30,252,693 28,747,900 26,126,332 24,536,583 31,137,769 22,963,111 Diluted 32,435,606 30,694,747 29,183,879 26,549,537 25,055,195 31,554,157 23,525,316