Exhibit 99.2
EARNINGS RELEASE AND SUPPLEMENTAL INFORMATION Quarter Ended March 31, 2012 Investor Relations | Download our IR package and join the CoreSite email list at www.CoreSite.com or email lnvestorRelations@CoreSite.com. Corporate Contact | 1050 17th Street, Suite 800—Denver, CO 80265 USA | +1 866.777.2673 (T) | +1 877.231.0746 (eFax) | lnfo@CoreSite.com This Supplemental Operating and Financial Data package is not an offer to sell or solicitation to buy securities of CoreSite Realty Corporation. Any offers to sell or solicitation to buy securities of CoreSite Realty Corporation shall be made only by means of a prospectus for that purpose.
Quarter Ended March 31, 2012 Table of Contents Overview: Earnings Release 1 Company Profile 6 Summary of Financial Data 7 Financial Statements: Consolidated Balance Sheets 8 Consolidated Statements of Operations 9 Reconciliations of Net Income (Loss) to FFO, AFFO and EBITDA 10 Operating Portfolio: Operating Properties 11 Geographic Diversification and 10 Largest Customers 14 Development Summary and Capital Expenditures 15 Capital Structure: Market Capitalization and Debt Summary 16 Interest Summary and Debt Covenants 17 Appendix 18
Quarter Ended March 31, 2012 CORESITE REPORTS FIRST QUARTER 2012 RESULTS DENVER, CO—April 26, 2012—CoreSite Realty Corporation (NYSE: COR), a national provider of powerful, network-rich data centers, today announced financial results for the first quarter 2012. Quarterly Highlights • Reported first-quarter FFO of $0.36 per diluted share and unit, representing a 5.9% increase over the prior quarter and a 44.0% increase over the prior-year quarter • Reported first-quarter revenue of $47.3 million, representing a 2.7% increase over the prior quarter and a 18.3% increase over the prior-year quarter • Executed new and expansion data center leases representing $7.1 million of annualized GAAP rent with a weighted-average GAAP rental rate of $188 per net rentable square foot Achieved an 85.8% retention ratio with 3.3% rent growth on signed renewals on a cash basis and 12.5% on a GAAP basis Commenced 30,698 net rentable square feet (“NRSF”) of new and expansion leasing, with GAAP annualized rent of $241 per square foot Tom Ray, CoreSite’s Chief Executive Officer, commented, “During the first quarter of 2012, we continued to successfully execute on our strategy to expand our position as a network-centric provider in key domestic markets. Sales remained well-distributed across verticals and geographies, with particular strength in the cloud and carrier verticals. We delivered new capacity in Northern Virginia and Santa Clara and booked new sales in our 2972 Stender development to bring that site to 19,567 NRSF under executed licenses at March 31, 2012, representing 59% of the 33,129 NRSF delivered as of that date.” Mr. Ray continued, “We continue to make investments to position CoreSite for ongoing growth. With the recent acquisition of Comfluent we are entering the Denver market, acquiring the leader in interconnection in Denver and the Rocky Mountain region. We’re also pleased to add to our management team with the hiring of Jarrett Appleby in the newly created position of Chief Operating Officer. Jarrett brings strong domain expertise in network-centric data centers and we look forward to his planned start date of May 7, 2012. We remain focused on expanding our national platform and continuously enhancing our customer experience as we work toward our goal of becoming the network-centric provider of choice in the markets in which we compete.” Financial Results CoreSite reported funds from operations (“FFO”) of $16.4 million, or $0.36 per diluted share and unit, for the three months ended March 31, 2012, compared to $11.3 million, or $0.25 per diluted share and unit, for the three months ended March 31, 2011. Total operating revenue for the three months ended March 31, 2012, was $47.3 million, a 2.7% increase on a sequential quarter basis and an 18.3% increase over the same quarter of the prior year. The company reported net income for the three months ended March 31, 2012, of $1.3 million and net income attributable to common shares of $600,000, or $0.03 per diluted share. Overview Financial Statements Operating Portfolio Development and Capital Expenditures Capital Structure Appendix 1
Quarter Ended March 31, 2012 Leasing Activity The company executed new and expansion data center leases representing $7.1 million of annualized GAAP rent during the quarter, comprised of 37,563 NRSF at a weighted average GAAP rate of $188 per NRSF and a weighted average lease term of 4.4 years. During the first quarter, data center lease commencements totaled 30,698 NRSF at a weighted average GAAP rental rate of $241 per NRSF, which represents $7.4 million of annualized GAAP rent. Renewal leases totaling 15,433 NRSF commenced in the first quarter at a weighted average GAAP rate of $170 per NRSF, reflecting a 3.3% increase in rent on a cash basis and a 12.5% increase on a GAAP basis. The company’s rent retention ratio for the first quarter was 85.8%. Development and Redevelopment Activity During the first quarter, CoreSite completed construction on 46,303 NRSF of space in Northern Virginia and the San Francisco Bay Area for a total cost of $21.9 million, or approximately $473 per NRSF. At March 31, 2012, the company had 78,856 NRSF of data center space under construction. Of the estimated $77.8 million required to complete these projects, the company had incurred costs of $55.4 million through March 31, 2012. Including the space currently under construction or in preconstruction at March 31, 2012, as well as currently operating space targeted for future redevelopment, CoreSite owns land and buildings sufficient to develop or redevelop 888,892 feet of data center space, comprised of (1) 78,856 NRSF of data center space currently under construction, (2) 464,786 NRSF of office and industrial space currently available for redevelopment, and (3) 345,250 NRSF of new data center space available for development on land that the company currently owns at its Coronado-Stender business park. Balance Sheet and Liquidity As of March 31, 2012, the company had $132.0 million of total long-term debt equal to 10.8% of total enterprise value and equal to 1.6x annualized adjusted EBITDA for the quarter ended March 31, 2012. The company has no debt maturities until 2014, assuming all extensions are available and exercised. At quarter end, the company had $4.0 million of cash available on its balance sheet and $153.6 million of available capacity under its revolving credit facility. Overview Financial Statements Operating Portfolio Development and Capital Expenditures Capital Structure Appendix 2
Quarter Ended March 31, 2012 Denver Market Acquisition In April 2012 the company entered the Denver market with the acquisition of Comfluent, a carrier-neutral, network-centric colocation provider, located in Denver, Colorado for a purchase price of approximately $3.0 million along with the provision for earn-out payments over the next three years if certain operating hurdles are met. Comfluent plays a vital role in the interconnection community in the western U.S., serving more than 75 customers and managing the Rocky Mountain Internet exchange (RMIX), the region’s largest Internet exchange, which will be integrated into CoreSite’s national Any2 Internet Exchange platform as part of the integration plan for Comfluent. Comfluent currently leases two sites that total approximately 9,300 NRSF. Dividend On March 14, 2012, the company’s board of directors declared a dividend of $0.18 per share of common stock and common stock equivalents for the first quarter of 2012. The dividend was paid on April 16, 2012 to shareholders of record on March 30, 2012. Upcoming Conferences and Events The company will participate in NAREIT’s REITWeek conference from June 12th through June 14th at the Hilton in New York City. Conference Call Details The company will host a conference call April 26th at 12:00 p.m. (Eastern Time) to discuss its financial results, current business trends and market conditions. The call can be accessed live over the phone by dialing 877-407-3982 for domestic callers and 201-493-6780 for international callers. A replay will be available shortly after the call and can be accessed by dialing 877-870-5176 for domestic callers, or for international callers, 858-384-5517. The passcode for the replay is 392009. The replay will be available until May 3, 2012. Interested parties may also listen to a simultaneous webcast of the conference call by logging on to the company’s website at www.CoreSite.com and clicking on the “Investors” tab. The on-line replay will be available for a limited time beginning immediately following the call. Overview Financial Statements Operating Portfolio Development and Capital Expenditures Capital Structure Appendix 3
Quarter Ended March 31, 2012 About CoreSite CoreSite Realty Corporation (NYSE: COR) is a national provider of data center products and interconnection services. More than 700 customers such as Global 1000 enterprises, communications providers, cloud and content companies, financial firms, media and entertainment, healthcare, and government agencies choose CoreSite for the confidence that comes with customer-focused data center products, service and support systems, and scalability. CoreSite data centers are business catalysts, featuring the Any2 Internet exchange and network ecosystems, which include access to 200+ carriers and service providers and a growing mesh of more than 15,000 interconnections. The company features a diverse colocation offering from individual cabinets to custom cages and private suites, with 12 data center locations in seven major U.S. markets. For more information, visit www.CoreSite.com. CoreSite Investor Relations Contact + 1 303.222.7276 InvestorRelations@CoreSite.com CoreSite Media Contact Jeannie Zaemes | CoreSite Marketing Senior Director + 1 720.446.2006 | +1 866.777.CORE Jeannie.Zaemes@CoreSite.com Overview Financial Statements Operating Portfolio Development and Capital Expenditures Capital Structure Appendix 4
Quarter Ended March 31, 2012 Forward Looking Statements This earnings release and accompanying supplemental information may contain forward-looking statements within the meaning of the federal securities laws. Forward-looking statements relate to expectations, beliefs, projections, future plans and strategies, anticipated events or trends and similar expressions concerning matters that are not historical facts. In some cases, you can identify forward-looking statements by the use of forward-looking terminology such as “believes,” “expects,” “may,” “will,” “should,” “seeks,” “approximately,” “intends,” “plans,” “pro forma,” “estimates”or “anticipates” or the negative of these words and phrases or similar words or phrases that are predictions of or indicate future events or trends and that do not relate solely to historical matters. Forward-looking statements involve known and unknown risks, uncertainties, assumptions and contingencies, many of which are beyond the company’s control, that may cause actual results to differ significantly from those expressed in any forward-looking statement. These risks include, without limitation: the geographic concentration of the company’s data centers in certain markets and any adverse developments in local economic conditions or the demand for data center space in these markets; fluctuations in interest rates and increased operating costs; difficulties in identifying properties to acquire and completing acquisitions; significant industry competition; the company’s failure to obtain necessary outside financing; the company’s failure to qualify or maintain our status as a REIT; financial market fluctuations; changes in real estate and zoning laws and increases in real property tax rates; and other factors affecting the real estate industry generally. All forward-looking statements reflect the company’s good faith beliefs, assumptions and expectations, but they are not guarantees of future performance. Furthermore, the company disclaims any obligation to publicly update or revise any forward-looking statement to reflect changes in underlying assumptions or factors, of new information, data or methods, future events or other changes. For a further discussion of these and other factors that could cause the company’s future results to differ materially from any forward-looking statements, see the section entitled “Risk Factors” in the company’s most recent annual report on Form 10-K, and other risks described in documents subsequently filed by the company from time to time with the Securities and Exchange Commission. Overview Financial Statements Operating Portfolio Development and Capital Expenditures Capital Structure Appendix 5
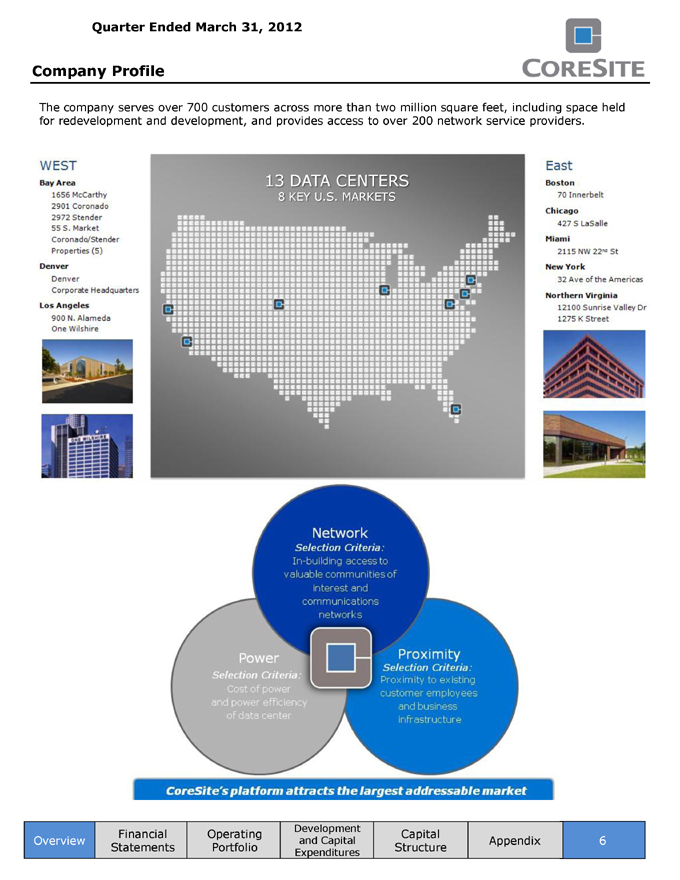
Quarter Ended March 31, 2012 The company serves over 700 customers across more than two million square feet, including space held for redevelopment and development, and provides access to over 200 network service providers. Overview Financial Statements Operating Portfolio Development and Capital Expenditures Capital Structure Appendix 6
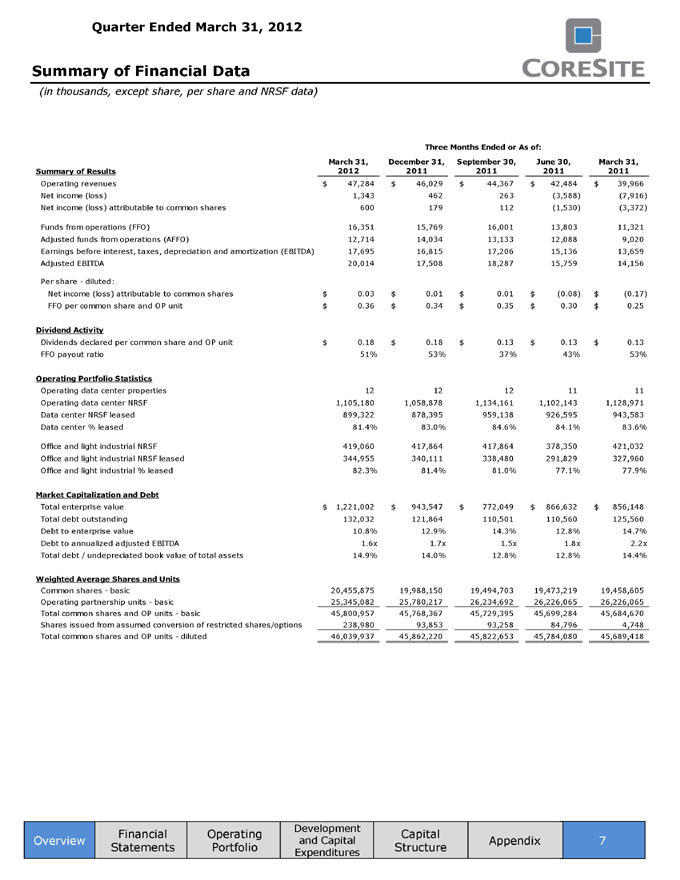
Quarter Ended March 31, 2012 Summary of Financial Data (in thousands, except share, per share and NRSF data) Three Months Ended or As of: March 31, December 31, September 30, June 30, March 31, Summary of Results 2012 2011 2011 2011 2011 Operating revenues $ 47,284 $ 46,029 $ 44,367 $ 42,484 $ 39,966 Net income (loss) 1,343 462 263 (3,588) (7,916) Net income (loss) attributable to common shares 600 179 112 (1,530) (3,372) Funds from operations (FFO) 16,351 15,769 16,001 13,803 11,321 Adjusted funds from operations (AFFO) 12,714 14,034 13,133 12,088 9,020 Earnings before interest, taxes, depreciation and amortization (EBITDA) 17,695 16,815 17,206 15,136 13,659 Adjusted EBITDA 20,014 17,508 18,287 15,759 14,156 Per share -diluted: Net income (loss) attributable to common shares $ 0.03 $ 0.01 $ 0.01 $ (0.08) $ (0.17) FFO per common share and OP unit $ 0.36 $ 0.34 $ 0.35 $ 0.30 $ 0.25 Dividend Activity Dividends declared per common share and OP unit $ 0.18 $ 0.18 $ 0.13 $ 0.13 $ 0.13 FFO payout ratio 51% 53% 37% 43% 53% Operating Portfolio Statistics Operating data center properties 12 12 12 11 11 Operating data center NRSF 1,105,180 1,058,878 1,134,161 1,102,143 1,128,971 Data center NRSF leased 899,322 878,395 959,138 926,595 943,583 Data center % leased 81.4% 83.0% 84.6% 84.1% 83.6% Office and light industrial NRSF 419,060 417,864 417,864 378,350 421,032 Office and light industrial NRSF leased 344,955 340,111 338,480 291,829 327,960 Office and light industrial % leased 82.3% 81.4% 81.0% 77.1% 77.9% Market Capitalization and Debt Total enterprise value $ 1,221,002 $ 943,547 $ 772,049 $ 866,632 $ 856,148 Total debt outstanding 132,032 121,864 110,501 110,560 125,560 Debt to enterprise value 10.8% 12.9% 14.3% 12.8% 14.7% Debt to annualized adjusted EBITDA 1.6x 1.7x 1.5x 1.8x 2.2x Total debt/undepreciated book value of total assets 14.9% 14.0% 12.8% 12.8% 14.4% Weighted Average Shares and Units Common shares—basic 20,455,875 19,988,150 19,494,703 19,473,219 19,458,605 Operating partnership units—basic 25,345,082 25,780,217 26,234,692 26,226,065 26,226,065 Total common shares and OP units—basic 45,800,957 45,768,367 45,729,395 45,699,284 45,684,670 Shares issued from assumed conversion of restricted shares/options 238,980 93,853 93,258 84,796 4,748 Total common shares and OP units-diluted 46,039,937 45,862,220 45,822,653 45,784,080 45,689,418 Overview Financial Statements Operating Portfolio Development and Capital Expenditures Capital Structure Appendix 7
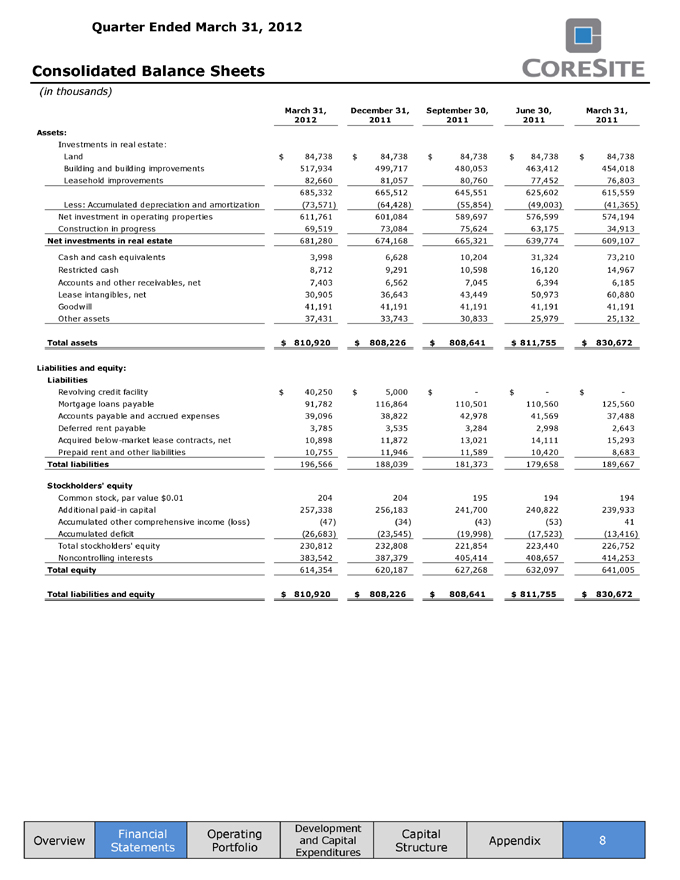
Quarter Ended March 31, 2012 Consolidated Balance Sheets (in thousands) March 31, December 31, September 30, June 30, March 31, 2012 2011 2011 2011 2011 Assets: Investments in real estate: Land $ 84,738 $ 84,738 $ 84,738 $ 84,738 $ 84,738 Building and building improvements 517,934 499,717 480,053 463,412 454,018 Leasehold improvements 82,660 81,057 80,760 77,452 76,803 685,332 665,512 645,551 625,602 615,559 Less: Accumulated depreciation and amortization (73,571) (64,428) (55,854) (49,003) (41,365) Net investment in operating properties 611,761 601,084 589,697 576,599 574,194 Construction in progress 69,519 73,084 75,624 63,175 34,913 Net investments in real estate 681,280 674,168 665,321 639,774 609,107 Cash and cash equivalents 3,998 6,628 10,204 31,324 73,210 Restricted cash 8,712 9,291 10,598 16,120 14,967 Accounts and other receivables, net 7,403 6,562 7,045 6,394 6,185 Lease intangibles, net 30,905 36,643 43,449 50,973 60,880 Goodwill 41,191 41,191 41,191 41,191 41,191 Other assets 37,431 33,743 30,833 25,979 25,132 Total assets $ 810,920 $ 808,226 $ 808,641 $ 811,755 $ 830,672 Liabilities and equity: Liabilities Revolving credit facility $ 40,250 $ 5,000 $—$—$—Mortgage loans payable 91,782 116,864 110,501 110,560 125,560 Accounts payable and accrued expenses 39,096 38,822 42,978 41,569 37,488 Deferred rent payable 3,785 3,535 3,284 2,998 2,643 Acquired below-market lease contracts, net 10,898 11,872 13,021 14,111 15,293 Prepaid rent and other liabilities 10,755 11,946 11,589 10,420 8,683 Total liabilities 196,566 188,039 181,373 179,658 189,667 Stockholders’ equity Common stock, par value $0.01 204 204 195 194 194 Additional paid-in capital 257,338 256,183 241,700 240,822 239,933 Accumulated other comprehensive income (loss) (47) (34) (43) (53) 41 Accumulated deficit (26,683) (23,545) (19,998) (17,523) (13,416) Total stockholders’ equity 230,812 232,808 221,854 223,440 226,752 Noncontrolling interests 383,542 387,379 405,414 408,657 414,253 Total equity 614,354 620,187 627,268 632,097 641,005 Total liabilities and equity $ 810,920 $ 808,226 $ 808,641 $ 811,755 $ 830,672 Overview Financial Statements Operating Portfolio Development and Capital Expenditures Capital Structure Appendix 8
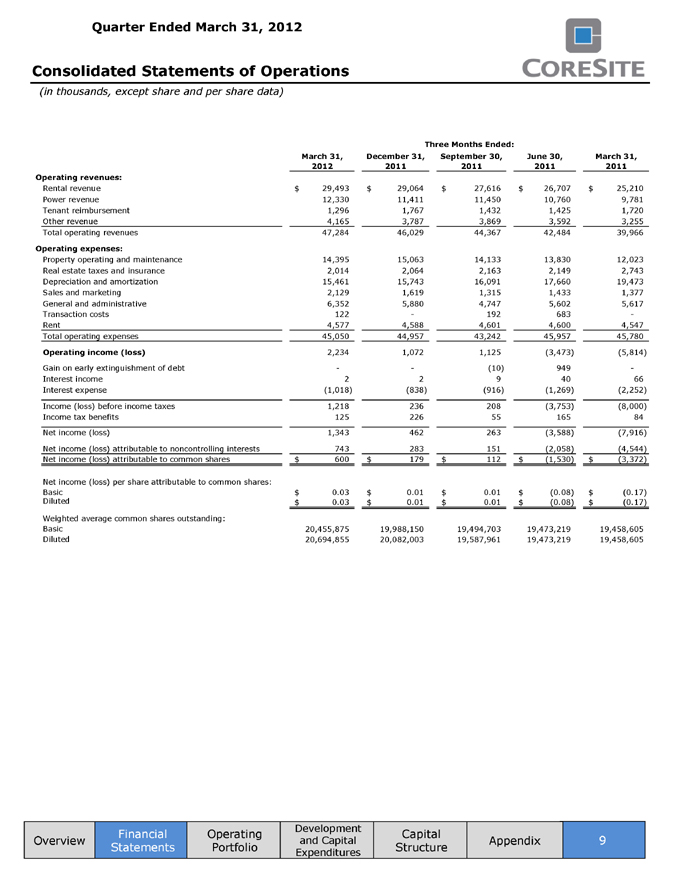
Quarter Ended March 31, 2012 Consolidated Statements of Operations (in thousands, except share and per share data) Three Months Ended: March 31, December 31, September 30, June 30, March 31, 2012 2011 2011 2011 2011 Operating revenues: Rental revenue $ 29,493 $ 29,064 $ 27,616 $ 26,707 $ 25,210 Power revenue 12,330 11,411 11,450 10,760 9,781 Tenant reimbursement 1,296 1,767 1,432 1,425 1,720 Other revenue 4,165 3,787 3,869 3,592 3,255 Total operating revenues 47,284 46,029 44,367 42,484 39,966 Operating expenses: Property operating and maintenance 14,395 15,063 14,133 13,830 12,023 Real estate taxes and insurance 2,014 2,064 2,163 2,149 2,743 Depreciation and amortization 15,461 15,743 16,091 17,660 19,473 Sales and marketing 2,129 1,619 1,315 1,433 1,377 General and administrative 6,352 5,880 4,747 5,602 5,617 Transaction costs 122—192 683 Rent 4,577 4,588 4,601 4,600 4,547 Total operating expenses 45,050 44,957 43,242 45,957 45,780 Operating income (loss) 2,234 1,072 1,125 (3,473) (5,814) Gain on early extinguishment of debt—- (10) 949 Interest income 2 2 9 40 66 Interest expense (1,018) (838) (916) (1,269) (2,252) Income (loss) before income taxes 1,218 236 208 (3,753) (8,000) Income tax benefits 125 226 55 165 84 Net income (loss) 1,343 462 263 (3,588) (7,916) Net income (loss) attributable to noncontrolling interests 743 283 151 (2,058) (4,544) Net income (loss) attributable to common shares $ 600 $ 179 $ 112 $ (1,530) $ (3,372) Net income (loss) per share attributable to common shares: Basic $ 0.03 $ 0.01 $ 0.01 $ (0.08) $ (0.17) Diluted $ 0.03 $ 0.01 $ 0.01 $ (0.08) $ (0.17) Weighted average common shares outstanding: Basic 20,455,875 19,988,150 19,494,703 19,473,219 19,458,605 Diluted 20,694,855 20,082,003 19,587,961 19,473,219 19,458,605 Overview Financial Statements Operating Portfolio Development and Capital Expenditures Capital Structure Appendix 9
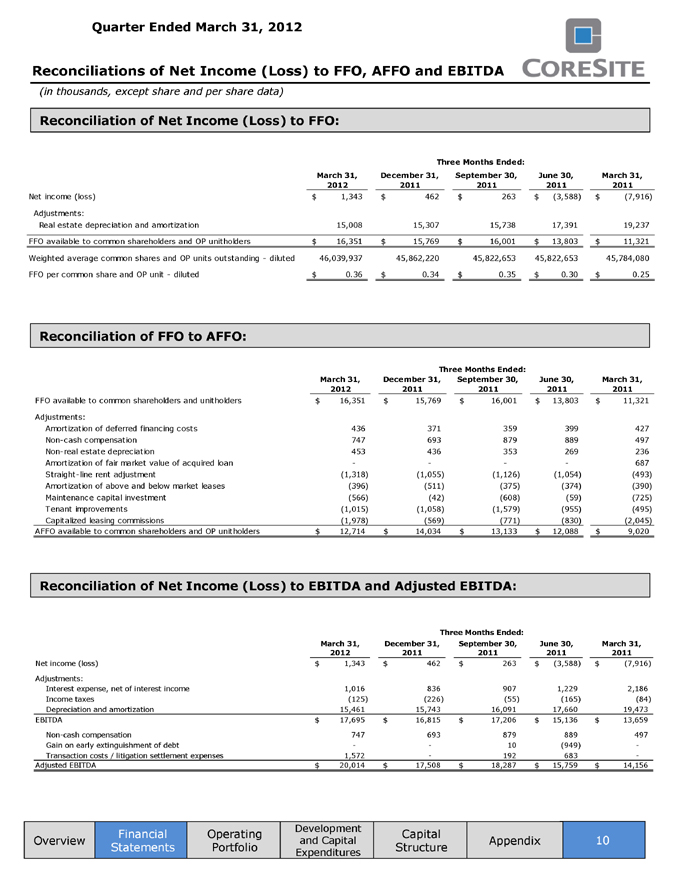
Quarter Ended March 31, 2012 US Reconciliations of Net Income (Loss) to FFO, AFFO and EBITDA (in thousands, except share and per share data) Reconciliation of Net Income (Loss) to FFO: Three Months Ended: March 31, December 31, September 30, June 30, March 31, 2012 2011 2011 2011 2011 Net income (loss) $ 1,343 $ 462 $ 263 $ (3,588) $ (7,916) Adjustments: Real estate depreciation and amortization 15,008 15,307 15,738 17,391 19,237 FFO available to common shareholders and OP unitholders $ 16,351 $ 15,769 $ 16,001 $ 13,803 $ 11,321 Weighted average common shares and OP units outstanding—diluted 46,039,937 45,862,220 45,822,653 45,822,653 45,784,080 FFO per common share and OP unit—diluted $ 0.36 $ 0.34 $ 0.35 $ 0.30 $ 0.25 Reconciliation of FFO to AFFO: Three Months Ended: March 31, December 31, September 30, June 30, March 31, 2012 2011 2011 2011 2011 FFO available to common shareholders and unitholders $ 16,351 $ 15,769 $ 16,001 $ 13,803 $ 11,321 Adjustments: Amortization of deferred financing costs 436 371 359 399 427 Non-cash compensation 747 693 879 889 497 Non-real estate depreciation 453 436 353 269 236 Amortization of fair market value of acquired loan———687 Straight-line rent adjustment (1,318) (1,055) (1,126) (1,054) (493) Amortization of above and below market leases (396) (511) (375) (374) (390) Maintenance capital investment (566) (42) (608) (59) (725) Tenant improvements (1,015) (1,058) (1,579) (955) (495) Capitalized leasing commissions (1,978) (569) (771) (830) (2,045) AFFO available to common shareholders and OP unitholders $ 12,714 $ 14,034 $ 13,133 $ 12,088 $ 9,020 Reconciliation of Net Income (Loss) to EBITDA and Adjusted EBITDA: Three Months Ended: March 31, December 31, September 30, June 30, March 31, 2012 2011 2011 2011 2011 Net income (loss) $ 1,343 $ 462 $ 263 $ (3,588) $ (7,916) Adjustments: Interest expense, net of interest income 1,016 836 907 1,229 2,186 Income taxes (125) (226) (55) (165) (84) Depreciation and amortization 15,461 15,743 16,091 17,660 19,473 EBITDA $ 17,695 $ 16,815 $ 17,206 $ 15,136 $ 13,659 Non-cash compensation 747 693 879 889 497 Gain on early extinguishment of debt—- 10 (949) Transaction costs / litigation settlement expenses 1,572 : 192 683—Adjusted EBITDA $ 20,014 $ 17,508 $ 18,287 $ 15,759 $ 14,156 Overview Financial Statements Operating Portfolio Development and Capital Expenditures Capital Structure Appendix 10
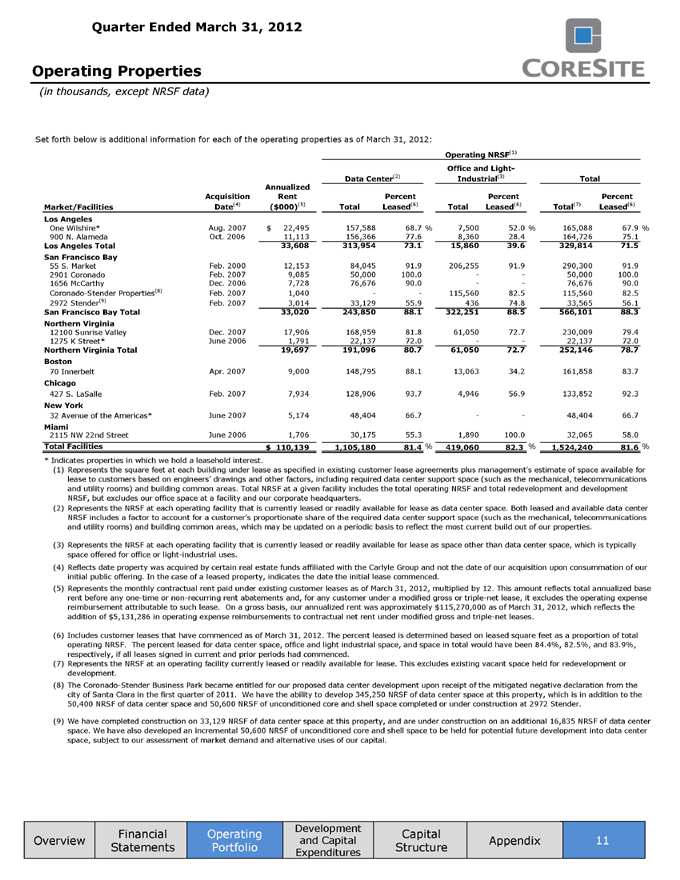
Quarter Ended March 31, 2012 Operating Properties (in thousands, except NRSF data) Set forth below is additional information for each of the operating properties as of March 31, 2012: Operating NRSF(1) Office and Light- Data Center(2) Industrial(13) Total Annualized Acquisition Rent Percent Percent Percent Market/Facilities Date(4) ($000)(5) Total Leased(16) Total Leased16) Total(17) Leased(16) Los Angeles One Wilshire* Aug. 2007 $ 22,495 157,588 68.7 % 7,500 52.0 % 165,088 67.9 % 900 N. Alameda Oct. 2006 11,113 156,366 77.6 8,360 28.4 164,726 75.1 Los Angeles Total 33,608 313,954 73.1 15,860 39.6 329,814 71.5 San Francisco Bay 55 S. Market Feb. 2000 12,153 84,045 91.9 206,255 91.9 290,300 91.9 2901 Coronado Feb. 2007 9,085 50,000 100.0—- 50,000 100.0 1656 McCarthy Dec. 2006 7,728 76,676 90.0—- 76,676 90.0 Coronado-Stender Properties™ Feb. 2007 1,040—- 115,560 82.5 115,560 82.5 2972 Stender(9) Feb. 2007 3,014 33,129 55.9 436 74.8 33,565 56.1 San Francisco Bay Total 33,020 243,850 88.1 322,251 88.5 566,101 88.3 Northern Virginia 12100 Sunrise Valley Dec. 2007 17,906 168,959 81.8 61,050 72.7 230,009 79.4 1275 K Street* June 2006 1,791 22,137 72.0 ; -_ 22,137 72.0 Northern Virginia Total 19,697 191,096 80.7 61,050 72.7 252,146 78.7 Boston 70 Innerbelt Apr. 2007 9,000 148,795 88.1 13,063 34.2 161,858 83.7 Chicago 427 S. LaSalle Feb. 2007 7,934 128,906 93.7 4,946 56.9 133,852 92.3 New York 32 Avenue of the Americas* June 2007 5,174 48,404 66.7—- 48,404 66.7 Miami 2115 NW 22nd Street June 2006 1,706 30,175 55.3 1,890 100.0 32,065 58.0 Total Facilities $ 110.139 ~ 1.105.180 81.4 % 419.060 82.3 % 1.524.240 81^6% * Indicates properties in which we hold a leasehold interest. Represents the square feet at each building under lease as specified in existing customer lease agreements plus management’s estimate of space available for lease to customers based on engineers’ drawings and other factors, including required data center support space (such as the mechanical, telecommunications and utility rooms) and building common areas. Total NRSF at a given facility includes the total operating NRSF and total redevelopment and development NRSF, but excludes our office space at a facility and our corporate headquarters. Represents the NRSF at each operating facility that is currently leased or readily available for lease as data center space. Both leased and available data center NRSF includes a factor to account for a customer’s proportionate share of the required data center support space (such as the mechanical, telecommunications and utility rooms) and building common areas, which may be updated on a periodic basis to reflect the most current build out of our properties. Represents the NRSF at each operating facility that is currently leased or readily available for lease as space other than data center space, which is typically space offered for office or light-industrial uses. (4) Reflects date property was acquired by certain real estate funds affiliated with the Carlyle Group and not the date of our acquisition upon consummation of our initial public offering. In the case of a leased property, indicates the date the initial lease commenced. Represents the monthly contractual rent paid under existing customer leases as of March 31, 2012, multiplied by 12. This amount reflects total annualized base rent before any one-time or non-recurring rent abatements and, for any customer under a modified gross or triple-net lease, it excludes the operating expense reimbursement attributable to such lease. On a gross basis, our annualized rent was approximately $115,270,000 as of March 31, 2012, which reflects the addition of $5,131,286 in operating expense reimbursements to contractual net rent under modified gross and triple-net leases. Includes customer leases that have commenced as of March 31, 2012. The percent leased is determined based on leased square feet as a proportion of total operating NRSF. The percent leased for data center space, office and light industrial space, and space in total would have been 84.4%, 82.5%, and 83.9%, respectively, if all leases signed in current and prior periods had commenced. Represents the NRSF at an operating facility currently leased or readily available for lease. This excludes existing vacant space held for redevelopment or development. The Coronado-Stender Business Park became entitled for our proposed data center development upon receipt of the mitigated negative declaration from the city of Santa Clara in the first quarter of 2011. We have the ability to develop 345,250 NRSF of data center space at this property, which is in addition to the 50,400 NRSF of data center space and 50,600 NRSF of unconditioned core and shell space completed or under construction at 2972 Stender. We have completed construction on 33,129 NRSF of data center space at this property, and are under construction on an additional 16,835 NRSF of data center space. We have also developed an incremental 50,600 NRSF of unconditioned core and shell space to be held for potential future development into data center space, subject to our assessment of market demand and alternative uses of our capital. Overview Financial Statements Operating Portfolio Development and Capital Expenditures Capital Structure Appendix 11
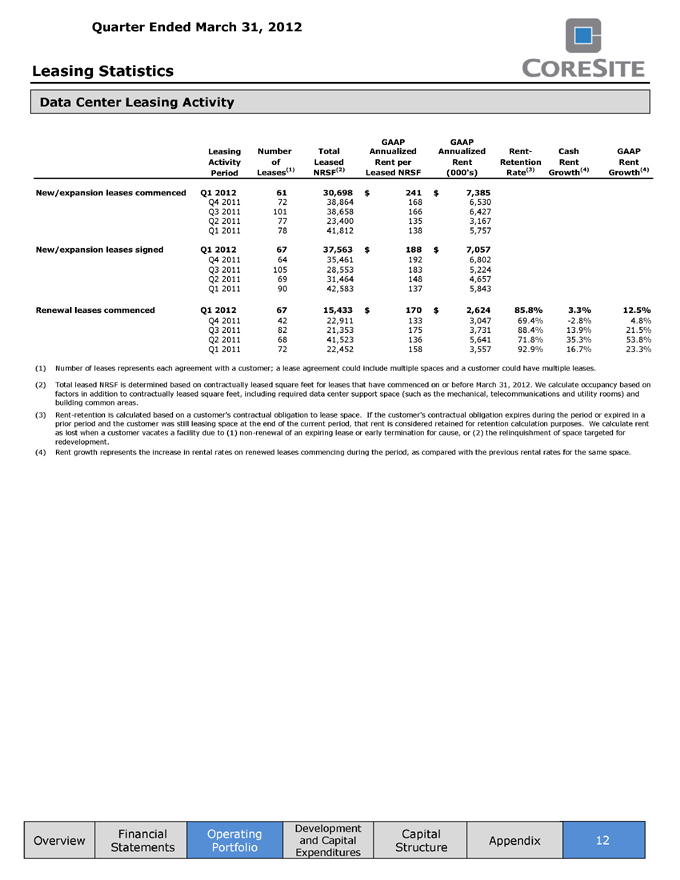
Quarter Ended March 31, 2012 Leasing Statistics Data Center Leasing Activity GAAP GAAP Leasing Number Total Annualized Annualized Rent- Cash GAAP Activity of Leased Rent per Rent Retention Rent Rent Period Leases’1’ NRSF(2) Leased NRSF (OOP’s) Rate(3) Growth(4) Growth(4) New/expansion leases commenced Ql 2012 61 30,698 $ 241 $ 7,385 Q4 2011 72 38,864 168 6,530 Q3 2011 101 38,658 166 6,427 Q2 2011 77 23,400 135 3,167 Ql 2011 78 41,812 138 5,757 New/expansion leases signed Ql 2012 67 37,563 $ 188 $ 7,057 Q4 2011 64 35,461 192 6,802 Q3 2011 105 28,553 183 5,224 Q2 2011 69 31,464 148 4,657 Ql 2011 90 42,583 137 5,843 Renewal leases commenced Ql 2012 67 15,433 $ 170 $ 2,624 85.8% 3.3% 12.5% Q4 2011 42 22,911 133 3,047 69.4% -2.8% 4.8% Q3 2011 82 21,353 175 3,731 88.4% 13.9% 21.5% Q2 2011 68 41,523 136 5,641 71.8% 35.3% 53.8% Ql 2011 72 22,452 158 3,557 92.9% 16.7% 23.3% Number of leases represents each agreement with a customer; a lease agreement could include multiple spaces and a customer could have multiple leases. Total leased NRSF is determined based on contractually leased square feet for leases that have commenced on or before March 31, 2012. We calculate occupancy based on factors in addition to contractually leased square feet, including required data center support space (such as the mechanical, telecommunications and utility rooms) and building common areas. Rent-retention is calculated based on a customer’s contractual obligation to lease space. If the customer’s contractual obligation expires during the period or expired in a prior period and the customer was still leasing space at the end of the current period, that rent is considered retained for retention calculation purposes. We calculate rent as lost when a customer vacates a facility due to (1) non-renewal of an expiring lease or early termination for cause, or (2) the relinquishment of space targeted for redevelopment. Rent growth represents the increase in rental rates on renewed leases commencing during the period, as compared with the previous rental rates for the same space. Overview Financial Statements Operating Portfolio Development and Capital Expenditures Capital Structure Appendix 12

Quarter Ended March 31, 2012 Leasing Statistics Lease Expirations (total operating properties) The following table sets forth a summary schedule of the expirations for leases In place as of March 31, 2012, plus available space for the remainder of 2012 and for each of the ten full calendar years beginning January 1, 2013 at the properties in our portfolio. Unless otherwise stated in the footnotes, the information set forth in the table assumes that customers exercise no renewal options and all early termination rights. Total Annualized Number Operating Percentage Percentage Annualized Annualized Rent Per of NRSFof of Total Annualized of Rent Per Rental Leased Leases Expiring Operating Rent Annualized Leased Expiration NRSF at Year of Lease Expiration Expiring’1’ Leases NRSF ($000)’2’ Rent NRSF’3’ ($000)’”‘ Expiration’5’ Available as of March 31,2012<6’—279,963 18.4 % $—- % $—$—$ Remainder of 2012 414 260,399 17.1 27,812 25.3 106.80 27,862 107.00 2013 264 181,376 11.9 18,806 17.1 103.69 19,521 107.63 2014(7) 230 250,205 16.4 20,180 18.2 80.65 22,845 91.31 2015 73 101,204 6.6 7,299 6.6 72.12 11,284 111.50 2016(8) 88 163,375 10.7 11,861 10.8 72.60 14,035 85.90 2017 37 66,110 4.3 10,548 9.6 159.55 12,596 190.52 8 79,341 5.2 8,131 7.4 102.48 10,147 127.89 2 80,466 5.3 1,567 1.4 19.48 1,730 21.51 3 2,746 0.2 75 0.1 27.14 78 28.51 9 18,155 1.2 1,872 1.7 103.13 3,883 213.91 2022-Thereafter 8_ 40,900 2.7 1,988 1.8 48.61 2,626 64.22 Portfolio Total / Weighted Average 1,136 1,524,240 100.0 % $ 110,139 100.0 % $ 88.52 $ 126,607 $ 101.75 (1) Includes leases that upon expiration will be automatically renewed, primarily on a month-to-month basis. Number of leases represents each agreement with a customer; a lease agreement could include multiple spaces and a customer could have multiple leases. Represents the monthly contractual rent paid under existing customer leases as of March 31, 2012, multiplied by 12. This amount reflects total annualized base rent before any one time or non-recurring rent abatements and, for any customer under a modified gross or triple-net lease, it excludes the operating expense reimbursement attributable to those leases. Annualized rent as defined above, divided by the square footage of leases expiring in the given year. Represents the final monthly contractual rent under existing customer leases as of March 31, 2012, multiplied by 12. This amount reflects total annualized base rent before any one time or non-recurring rent abatements and, for any customer under a modified gross or triple-net lease, it excludes the operating expense reimbursement attributable to those leases. Annualized rent at expiration as defined above, divided by the square footage of leases expiring in the given year. This metric reflects the rent growth inherent in the existing base of lease agreements. Excludes approximately 557,282 vacant NRSF held for redevelopment or under construction at March 31, 2012. Includes an office lease with General Services Administration—IRS, which is an interim lease in place that expires on May 31, 2014. Upon the expiration of the interim lease and the substantial completion of tenant improvements by us, a new lease that has already been executed by both parties will commence. The new lease includes 119,729 NRSF with a ten- year term and a termination option at the end of year eight. Total operating NRSF of expiring leases in 2016 reflects the expiration of half of a 50,000 NRSF lease, the other half of which expires in 2017. Lease Distribution The following table sets forth information relating to the distribution of leases in the properties in our portfolio, based on NRSF (excluding space held for redevelopment) under lease as of March 31, 2012. Total Percentage Percentage Number Percentage Operating of Total Annualized of of of All NRSFof Operating Rent Annualized Square Feet Under Lease(1) Leases(2) Leases Leases(3) NRSF ($000)(4) Rent Available(5)—% 279,963 18.4 % $—% 1.000 or less 972 85.6 165,749 10.9 29,705 27.0 1,001-2,000 55 4.8 78,269 5.1 8,849 8.0 2.001—5,000 66 5.8 198,067 13.0 20,243 18.4 5,001—10,000 20 1.8 141,452 9.3 14,271 13.0 10,001—25,000 17 1.5 309,873 20.3 26,063 23.6 Greater than 25,000 6_ 0.5 350,867 23.0 11,008 10.0 Portfolio Total 1,136 100.0 °/o 1,524,240 1OO.O °/o $ 110,139 1OO.O % Represents all leases in our portfolio, including data center and office and light-industrial leases. Includes leases that upon expiration will be automatically renewed, primarily on a month-to-month basis. Number of leases represents each agreement with a customer; a lease agreement could include multiple spaces and a customer could have multiple leases. (3) Represents the square feet at a building under lease as specified in the lease agreements plus management’s estimate of space available for lease to third parties based on engineer’s drawings and other factors, including required data center support space (such as the mechanical, telecommunications and utility rooms) and building common areas. Represents the monthly contractual rent paid under existing customer leases as of March 31, 2012, multiplied by 12. This amount reflects total annualized base rent before any one-time or non-recurring rent abatements and, for any customer under a modified gross or triple-net lease, it excludes the operating expense reimbursement attributable to those leases. Excludes approximately 557,282 vacant NRSF held for redevelopment or under construction at March 31, 2012. Overview Financial Statements Operating Portfolio Development and Capital Expenditures Capital Structure Appendix 13
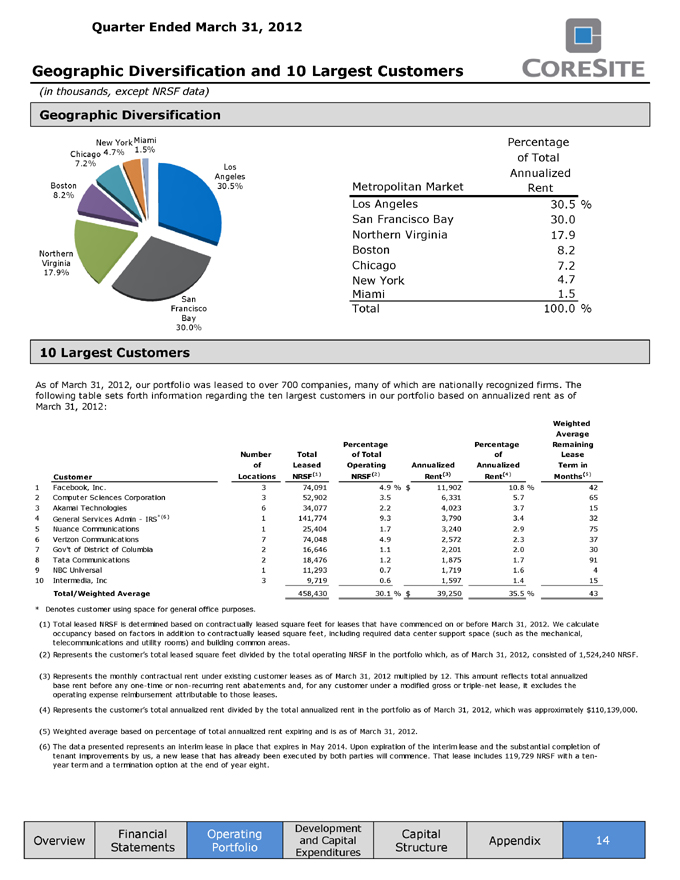
Quarter Ended March 31, 2012 Geographic Diversification and 10 Largest Customers (in thousands, except NRSF data) Geographic Diversification NewYorkMiami Percentage Chicago 4.7% 1-5% \ Angeles Annualized Boston gS. 30.5% Metropolitan Market Rent 8.2% Los Angeles 30.5% San Francisco Bay 30.0 Francisco Total 100.0 % Bay 30.0% 10 Largest Customers As of March 31, 2012, our portfolio was leased to over 700 companies, many of which are nationally recognized firms. The following table sets forth information regarding the ten largest customers in our portfolio based on annualized rent as of March 31, 2012: Weighted Average Percentage Percentage Remaining Number Total of Total of Lease of Leased Operating Annualized Annualized Term in Customer Locations NRSF(1) NRSF(2) Rent(3) Rent(4) Months(5) 1 Facebook, Inc. 3 74,091 4.9 % $ 11,902 10.8 % 42 Computer Sciences Corporation 3 52,902 3.5 6,331 5.7 65 Akamai Technologies 6 34,077 2.2 4,023 3.7 15 4 General Services Admin—IRS*(6) 1 141,774 9.3 3,790 3.4 32 5 Nuance Communications 1 25,404 1.7 3,240 2.9 75 Verizon Communications 7 74,048 4.9 2,572 2.3 37 Gov’t of District of Columbia 2 16,646 1.1 2,201 2.0 30 Tata Communications 2 18,476 1.2 1,875 1.7 91 NBC Universal 1 11,293 0.7 1,719 1.6 4 10 Intermedia, Inc 3 9,719 0.6_ 1,597 1.4_ 15 Total/Weighted Average 458,430 30.1% $ 39,250 35.5 % 43_ * Denotes customer using space for general office purposes. Total leased NRSF is determined based on contractually leased square feet for leases that have commenced on or before March 31, 2012. We calculate occupancy based on factors in addition to contractually leased square feet, including required data center support space (such as the mechanical, telecommunications and utility rooms) and building common areas. Represents the customer’s total leased square feet divided by the total operating NRSF in the portfolio which, as of March 31, 2012, consisted of 1,524,240 NRSF. Represents the monthly contractual rent under existing customer leases as of March 31, 2012 multiplied by 12. This amount reflects total annualized base rent before any one-time or non-recurring rent abatements and, for any customer under a modified gross or triple-net lease, it excludes the operating expense reimbursement attributable to those leases. Represents the customer’s total annualized rent divided by the total annualized rent in the portfolio as of March 31, 2012, which was approximately $110,139,000. Weighted average based on percentage of total annualized rent expiring and is as of March 31, 2012. (6) The data presented represents an interim lease in place that expires in May 2014. Upon expiration of the interim lease and the substantial completion of tenant improvements by us, a new lease that has already been executed by both parties will commence. That lease includes 119,729 NRSF with a ten- year term and a termination option at the end of year eight. Overview Financial Statements Operating Portfolio Development and Capital Expenditures Capital Structure Appendix 14
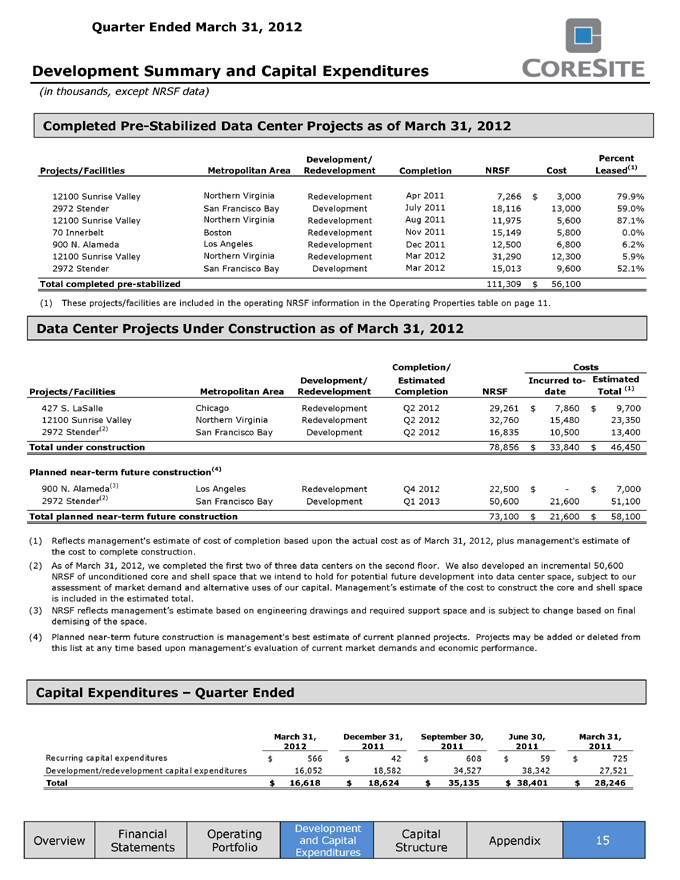
Quarter Ended March 31, 2012 Development Summary and Capital Expenditures (in thousands, except NRSF data) Completed Pre-Stabilized Data Center Projects as of March 31, 2012 Development/ Percent Projects/Facilities Metropolitan Area Redevelopment Completion NRSF Cost Leased*1} 12100 Sunrise Valley Northern Virginia Redevelopment Apr 2011 7,266 $ 3,000 79.9% 2972 Stender San Francisco Bay Development July 2011 18,116 13,000 59.0% 12100 Sunrise Valley Northern Virginia Redevelopment Aug 2011 11,975 5,600 87.1% 70 Innerbelt Boston Redevelopment Nov2011 15,149 5,800 0.0% 900 N. Alameda Los Angeles Redevelopment Dec 2011 12,500 6,800 6.2% 12100 Sunrise Valley Northern Virginia Redevelopment Mar 2012 31,290 12,300 5.9% 2972 Stender San Francisco Bay Development Mar 2012 15,013 9,600 52.1% Total completed pre-stabilized 111,309 $ 56,100 (1) These projects/facilities are included in the operating NRSF information in the Operating Properties table on page 11. Data Center Projects Under Construction as of March 31, 2012 Completion/ Costs Development/ Estimated Incurred to- Estimated Projects/Facilities Metropolitan Area Redevelopment Completion NRSF date Total(1) 427 S. LaSalle Chicago Redevelopment Q2 2012 29,261 $ 7,860 $ 9,700 12100 Sunrise Valley Northern Virginia Redevelopment Q2 2012 32,760 15,480 23,350 2972 Stender(2) San Francisco Bay Development Q2 2012 16,835 10,500 13,400 Total under construction 78,856 $ 33,840 $ 46,450 Planned near-term future construction’41 900 N. Alameda(3) Los Angeles Redevelopment Q4 2012 22,500 $—$ 7,000 2972 Stender(2) San Francisco Bay Development Ql 2013 50,600 21,600 51,100 Total planned near-term future construction 73,100 $ 21,600 $ 58,100 Reflects management’s estimate of cost of completion based upon the actual cost as of March 31, 2012, plus management’s estimate of the cost to complete construction. As of March 31, 2012, we completed the first two of three data centers on the second floor. We also developed an incremental 50,600 NRSF of unconditioned core and shell space that we intend to hold for potential future development into data center space, subject to our assessment of market demand and alternative uses of our capital. Management’s estimate of the cost to construct the core and shell space is included in the estimated total. NRSF reflects management’s estimate based on engineering drawings and required support space and is subject to change based on final demising of the space. Planned near-term future construction is management’s best estimate of current planned projects. Projects may be added or deleted from this list at any time based upon management’s evaluation of current market demands and economic performance. Capital Expenditures—Quarter Ended March 31, December 31, September 30, June 30, March 31, 2012 2011 2011 2011 2011 Recurring capital expenditures $ 566 $ 42 $ 608 $ 59 $ 725 Development/redevelopment capital expenditures 16,052 18,582 34,527 38,342 27,521 Total $ 16,618 $ 18,624 $ 35,135 $ 38,401 $ 28,246 Overview Financial Statements Operating Portfolio Development and Capital Expenditures Capital Structure
Appendix 15
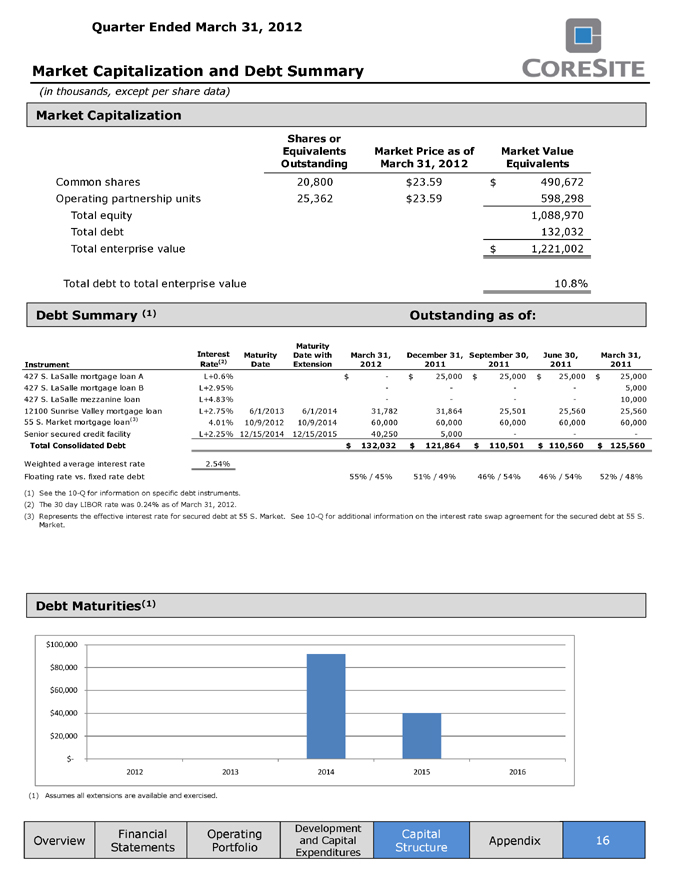
Quarter Ended March 31, 2012 Market Capitalization and Debt Summary (in thousands, except per share data) Market Capitalization Shares or Equivalents Market Price as of Market Value Outstanding March 31,2012 Equivalents Common shares 20,800 $23.59 $ 490,672 Operating partnership units 25,362 $23.59 598,298 Total equity 1,088,970 Total debt 132,032 Total enterprise value _$ 1,221,002 Total debt to total enterprise value 10.8% Debt Summary (*) Outstanding as of: Maturity Interest Maturity Date with March 31, December 31, September 30, June 30, March 31, Instrument Rate’2’ Date Extension 2012 2011 2011 2011 2011 427 S. LaSalle mortgage loan A L+0.6% $—$ 25,000 $ 25,000 $ 25,000 $ 25,000 427 S. LaSalle mortgage loan B L+2.95%—5,000 427 S. LaSalle mezzanine loan L+4.83%—10,000 12100 Sunrise Valley mortgage loan L+2.75% 6/1/2013 6/1/2014 31,782 31,864 25,501 25,560 25,560 55 S. Market mortgage loan(3) 4.01% 10/9/2012 10/9/2014 60,000 60,000 60,000 60,000 60,000 Senior secured credit facility L+2.25% 12/15/2014 12/15/2015 40,250 5,000 : Total Consolidated Debt $ 132,032 $ 121,864 $ 110,501 $ 110,560 $ 125,560 Weighted average interest rate 2.54% Floating rate vs. fixed rate debt 55%/45% 51%/49% 46% / 54% 46%/54% 52%/48% See the 10-Q for information on specific debt instruments. The 30 day LIBOR rate was 0.24% as of March 31, 2012. Represents the effective interest rate for secured debt at 55 S. Market. See 10-Q for additional information on the interest rate swap agreement for the secured debt at 55 S. Market. Debt Maturities(1) $100,000 2012 2013 2014 2015 2016 (1) Assumes all extensions are available and exercised.
Overview Financial Statements Operating Portfolio Development and Capital Expenditures Capital Structure Appendix 16
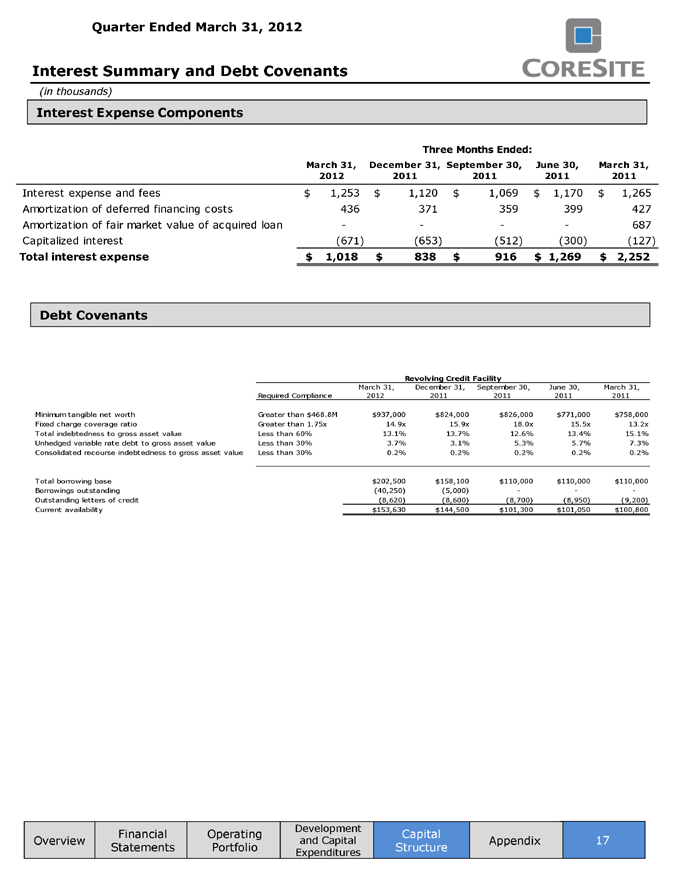
Quarter Ended March 31, 2012 Interest Summary and Debt Covenants (in thousands) Interest Expense Components Three Months Ended: March 31, December 31, September 30, June 30, March 31, 2012 2011 2011 2011 2011 Interest expense and fees $ 1,253 $ 1,120 $ 1,069 $ 1,170 $ 1,265 Amortization of deferred financing costs 436 371 359 399 427 Amortization of fair market value of acquired loan———687 Capitalized interest (671) (653) (512) (300) (127) Total interest expense $ 1,018 $ 838 $ 916 $ 1,269 $ 2,252 Debt Covenants Revolving Credit Facility March 31, December 31, September 30, June 30, March 31, Required Compliance 2012 2011 2011 2011 2011 Minimum tangible net worth Greater than $468.8M $937,000 $824,000 $826,000 $771,000 $758,000 Fixed charge coverage ratio Greater than 1.75x 14.9x 15.9x 18.0x 15.5x 13.2x Total indebtedness to gross asset value Less than 60% 13.1% 13.7% 12.6% 13.4% 15.1% Unhedged variable rate debt to gross asset value Less than 30% 3.7% 3.1% 5.3% 5.7% 7.3% Consolidated recourse indebtedness to gross asset value Less than 30% 0.2% 0.2% 0.2% 0.2% 0.2% Total borrowing base $202,500 $158,100 $110,000 $110,000 $110,000 Borrowings outstanding (40,250) (5,000) . Outstanding letters of credit (8,620) (8,600) (8,700) (8,950) (9,200) Current availability $153,630 $144,500 $101,300 $101,050 $100,800 Overview Financial Statements Operating Portfolio Development and Capital Expenditures Capital Structure Appendix 17
Quarter Ended March 31, 2012 Appendix This document includes certain non-GAAP financial measures that management believes are helpful in understanding our business, as further described below. Our definition and calculation of non-GAAP financial measures may differ from those of other REITs, and therefore, may not be comparable. The non-GAAP measures should not be considered an alternative to net income as an indicator of our performance and should be considered only a supplement to net income, cash flows from operating, investing or financing activities as a measure of profitability and/or liquidity, computed in accordance with GAAP. Definitions Funds From Operations “FFO”—is a supplemental measure of our performance which should be considered along with, but not as an alternative to, net income and cash provided by operating activities as a measure of operating performance and liquidity. We calculate FFO in accordance with the standards established by the National Association of Real Estate Investment Trusts (“NAREIT”). FFO represents net income (loss) (computed in accordance with GAAP), excluding gains (or losses) from sales of property and impairment write-downs of depreciable real estate, plus real estate related depreciation and amortization (excluding amortization of deferred financing costs) and after adjustments for unconsolidated partnerships and joint ventures. Our management uses FFO as a supplemental performance measure because, in excluding real estate related depreciation and amortization and gains and losses from property dispositions, it provides a performance measure that, when compared year over year, captures trends in occupancy rates, rental rates and operating costs. We offer this measure because we recognize that FFO will be used by investors as a basis to compare our operating performance with that of other REITs. However, because FFO excludes depreciation and amortization and captures neither the changes in the value of our properties that result from use or market conditions, nor the level of capital expenditures and capitalized leasing commissions necessary to maintain the operating performance of our properties, all of which have real economic effect and could materially impact our financial condition and results from operations, the utility of FFO as a measure of our performance is limited. FFO is a non-GAAP measure and should not be considered a measure of liquidity, an alternative to net income, cash provided by operating activities or any other performance measure determined in accordance with GAAP, nor is it indicative of funds available to fund our cash needs, including our ability to pay dividends or make distributions. In addition, our calculations of FFO are not necessarily comparable to FFO as calculated by other REITs that do not use the same definition or implementation guidelines or interpret the standards differently from us. Investors in our securities should not rely on these measures as a substitute for any GAAP measure, including net income. Adjusted Funds From Operations “AFFO”—is a non-GAAP measure that is used as a supplemental operating measure specifically for comparing year over year ability to fund dividend distribution from operating activities. AFFO is used by us as a basis to address our ability to fund our dividend payments. We calculate adjusted funds from operations by adding to or subtracting from FFO: Plus: Amortization of deferred financing costs Plus: Non-cash compensation Plus: Non-real estate depreciation Plus: Below market debt amortization Less: Straight line rents adjustments Less: Above and below market leases Less: Maintenance capital investment Less: Tenant improvement capital investment Less: Capitalized leasing commissions Overview Financial Statements Operating Portfolio Development and Capital Expenditures Capital Structure Appendix 18
Quarter Ended March 31, 2012 Appendix AFFO is not intended to represent cash flow from operations for the period, and is only intended to provide an additional measure of performance by adjusting the effect of certain items noted above included in FFO. AFFO is a widely reported measure by other REITs, however, other REITs may use different methodologies for calculating AFFO and, accordingly, our AFFO may not be comparable to other REITs. Earnings before Interest, Taxes, Depreciation and Amortization (EBITDA) and Adjusted EBITDA—EBITDA is defined as earnings before interest, taxes, depreciation and amortization. We calculate adjusted EBITDA by adding our non-cash compensation expense, transaction costs and litigation settlement expense to EBITDA as well as adjusting for the impact of gains or losses on early extinguishment of debt. Management uses EBITDA and adjusted EBITDA as indicators of our ability to incur and service debt. In addition, we consider EBITDA and adjusted EBITDA to be appropriate supplemental measures of our performance because they eliminate depreciation and interest, which permits investors to view income from operations without the impact of non-cash depreciation or the cost of debt. However, because EBITDA and adjusted EBITDA are calculated before recurring cash charges including interest expense and taxes, and are not adjusted for capital expenditures or other recurring cash requirements of our business, their utilization as a cash flow measurement is limited. Overview Financial Statements Operating Portfolio Development and Capital Expenditures Capital Structure Appendix 19