Earnings Release and Supplemental Information
| |

| SECURE, RELIABLE, HIGH-PERFORMANCE DATA CENTER SOLUTIONS |
| ®2016 CoreSite Realty Corporation, All Rights Reserved |
|
Quarter Ended September 30, 2016 |
2
CoreSite Reports Third-Quarter Financial Results Reflecting Revenue Growth of 17% Year over Year
DENVER, CO – October 27, 2016
CoreSite Realty Corporation (NYSE:COR), a premier provider of secure, reliable, high-performance data center and interconnection solutions across the U.S., today announced financial results for the third quarter ended September 30, 2016.
Quarterly and Subsequent Highlights
| · | | Reported third-quarter total operating revenues of $101.3 million, representing a 17.2% increase year over year |
| · | | Reported third-quarter net income per diluted share of $0.36, representing 38.5% growth year over year |
| · | | Reported third-quarter funds from operations (“FFO”) of $0.90 per diluted share and unit, representing 21.6% growth year over year |
| · | | Executed 162 new and expansion data center leases comprising 59,991 net rentable square feet (NRSF), representing $11.2 million of annualized GAAP rent at an average rate of $187 per square foot |
| · | | Commenced 50,455 net rentable square feet of new and expansion leases representing $7.5 million of annualized GAAP rent at an average rate of $148 per square foot |
| · | | Realized rent growth on signed renewals of 4.0% on a cash basis and 6.8% on a GAAP basis and recorded rental churn of 2.2% |
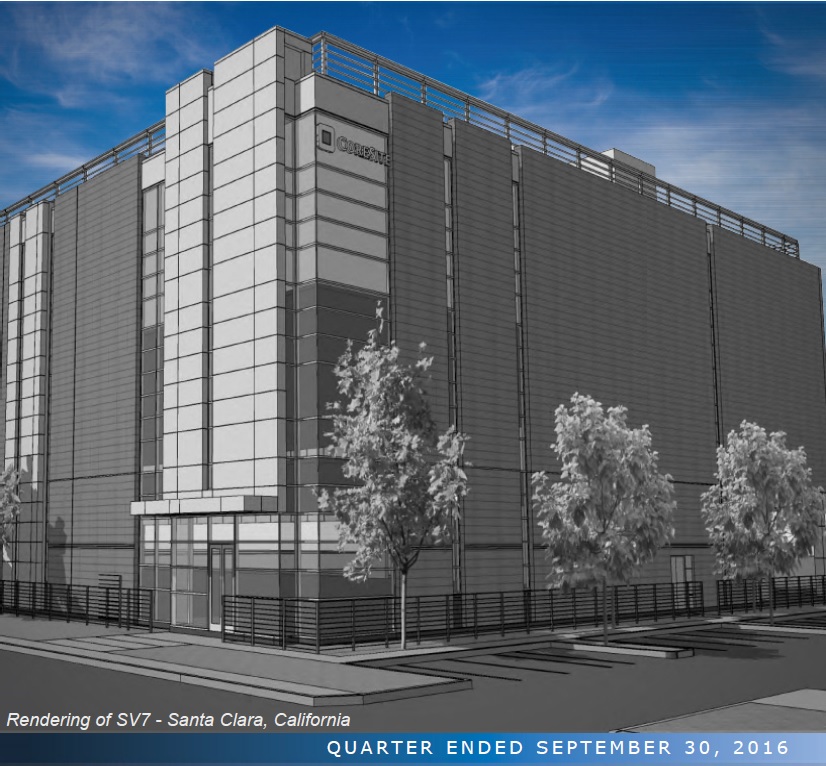
| · | | On October 12, 2016, CoreSite announced the opening of SV7 on its Santa Clara campus, with 62% of the 230,000 NRSF of turn-key data center capacity leased |
Paul Szurek, CoreSite’s Chief Executive Officer, commented, “We delivered another quarter of solid financial and operational performance in the third quarter, highlighted by strong earnings growth and leasing momentum. Our third quarter volume of new and expansion leasing for deployments of 5,000 net rentable square feet or less set a company record, as the demand for performance-sensitive retail colocation solutions remains robust.” Mr. Szurek continued, “Subsequent to the end of the third quarter, we opened SV7, our 230,000 net rentable square foot turn-key data center building in Santa Clara, which was 62% leased upon opening of the facility, another record for CoreSite. As an organization, we continue to successfully execute on our business plan in terms of leasing effectiveness, development, and increasing the value of our network dense, cloud-enabled platform of assets by enhancing and diversifying our customer base.”
Financial Results
CoreSite reported net income attributable to common shares of $12.2 million, or $0.36 per diluted share, for the three months ended September 30, 2016, compared to $6.9 million, or $0.26 per diluted share, for the three months ended September 30, 2015, an increase of 38.5% on a per share basis. On a sequential-quarter basis, net income attributable to common shares decreased 2.7%.
CoreSite reported FFO per diluted share and unit of $0.90 for the three months ended September 30, 2016, an increase of 21.6% compared to $0.74 per diluted share and unit for the three months ended September 30, 2015. On a sequential-quarter basis, FFO per diluted share and unit increased 1.1%.
Total operating revenues for the three months ended September 30, 2016, were $101.3 million, a 17.2% increase year over year and an increase of 5.4% on a sequential-quarter basis.
|
Quarter Ended September 30, 2016 |
| |

| 3 |
Sales Activity
CoreSite executed 162 new and expansion data center leases representing $11.2 million of annualized GAAP rent during the third quarter, comprised of 59,991 NRSF at a weighted-average GAAP rental rate of $187 per NRSF.
CoreSite’s third-quarter data center lease commencements totaled 50,455 NRSF at a weighted average GAAP rental rate of $148 per NRSF, which represents $7.5 million of annualized GAAP rent.
CoreSite’s renewal leases signed in the third quarter totaled $10.9 million in annualized GAAP rent, comprised of 76,735 NRSF at a weighted-average GAAP rental rate of $142 per NRSF, reflecting a 4.0% increase in rent on a cash basis and a 6.8% increase on a GAAP basis. The third-quarter rental churn rate was 2.2%, which included 160 basis points of churn related to a customer move-out at CoreSite’s VA1 data center.
Development Activity
Santa Clara – During the third quarter, CoreSite had 230,000 square feet of turn-key data center capacity under construction at SV7. As of September 30, 2016, CoreSite had incurred $208.2 million of the estimated $211.0 million required to complete this development. On October 12, 2016, CoreSite announced the opening of SV7, with 62% of the 230,000 net rentable square feet of turn-key data center capacity leased.
Denver – During the third quarter, CoreSite had 8,276 square feet of turn-key data center capacity under construction at DE1. As of September 30, 2016, CoreSite had incurred $2.0 million of the estimated $12.5 million required to complete this expansion and expects to substantially complete construction in the second quarter of 2017.
Los Angeles – During the third quarter, CoreSite had 4,726 square feet of turn-key data center capacity under construction at LA2, which is 100% pre-leased. As of September 30, 2016, CoreSite had incurred $0.4 million of the estimated $2.0 million required to complete this expansion and expects to substantially construction in the fourth quarter of 2016.
Balance Sheet and Liquidity
As of September 30, 2016, CoreSite had net principal debt of $588.5 million, correlating to 2.8 times third-quarter annualized adjusted EBITDA, and net principal debt and preferred stock outstanding of $703.5 million, correlating to 3.4 times third-quarter annualized adjusted EBITDA.
At quarter end, CoreSite had $6.3 million of cash available on its balance sheet and $250.8 million of borrowing capacity available under its revolving credit facility.
|
Quarter Ended September 30, 2016 |
| |
| 4 |
Dividend
On September 2, 2016, CoreSite announced a dividend of $0.53 per share of common stock and common stock equivalents for the third quarter of 2016. The dividend was paid on October 17, 2016, to shareholders of record on September 30, 2016.
CoreSite also announced on September 2, 2016, a dividend of $0.4531 per share of Series A preferred stock for the period July 15, 2016, to October 16, 2016. The preferred dividend was paid on October 17, 2016, to shareholders of record on September 30, 2016.
2016 Guidance
CoreSite is increasing its 2016 guidance for net income attributable to common shares to a range of $1.46 to $1.50 from the previous range of $1.41 to $1.49. In addition, CoreSite is increasing its 2016 guidance for FFO per diluted share and unit to a range of $3.61 to $3.65 from the previous range of $3.56 to $3.64, with the difference between FFO and net income being real estate depreciation and amortization.
This outlook is predicated on current economic conditions, internal assumptions about CoreSite’s customer base, and the supply and demand dynamics of the markets in which CoreSite operates. The guidance does not include the impact of any future financing, investment or disposition activities, beyond what has already been disclosed.
Upcoming Conferences and Events
CoreSite will participate in the RBC Technology, Internet, Media & Telecommunications Conference on November 9-10 at the Westin Times Square in New York City and NAREIT’s REITWorld conference on November 15-17 at the JW Marriott Phoenix Desert Ridge Resort & Spa in Phoenix, Arizona.
Conference Call Details
CoreSite will host a conference call on October 27, 2016, at 12:00 p.m., Eastern Time (10:00 a.m., Mountain Time), to discuss its financial results, current business trends and market conditions.
The call can be accessed live over the phone by dialing 877-407-3982 for domestic callers or 201-493-6780 for international callers. A replay will be available shortly after the call and can be accessed by dialing 844-512-2921 for domestic callers or 412-317-6671 for international callers. The passcode for the replay is 13646351. The replay will be available until November 10, 2016.
Interested parties may also listen to a simultaneous webcast of the conference call by logging on to CoreSite’s website at www.CoreSite.com and clicking on the “Investors” link. The on-line replay will be available for a limited time beginning immediately following the call.
|
Quarter Ended September 30, 2016 |
| |
| 5 |
About CoreSite
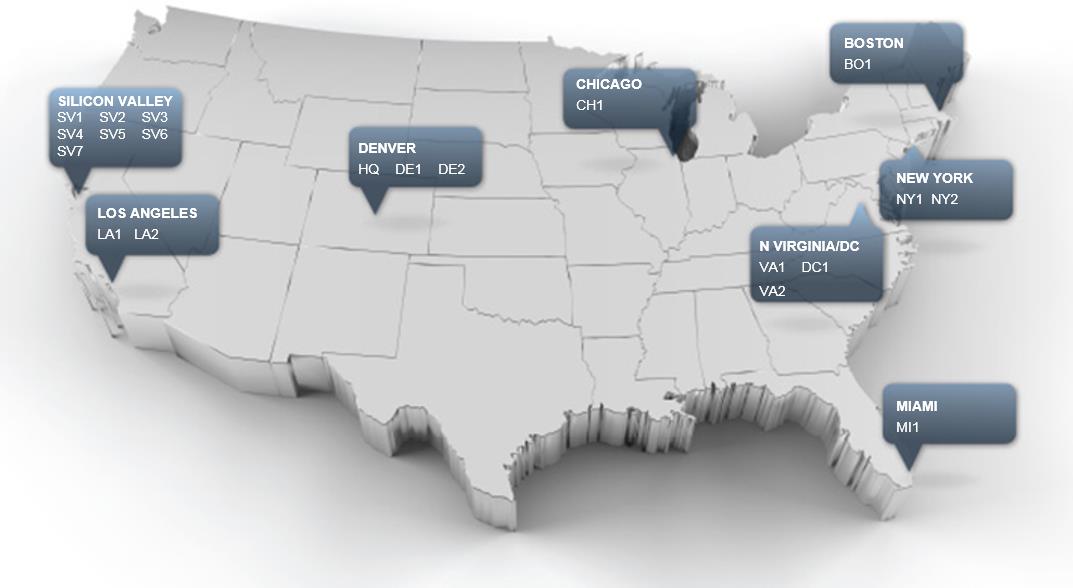
CoreSite Realty Corporation (NYSE:COR) delivers secure, reliable, high-performance data center and interconnection solutions to a growing customer ecosystem across eight key North American markets. More than 1,000 of the world’s leading enterprises, network operators, cloud providers, and supporting service providers choose CoreSite to connect, protect and optimize their performance-sensitive data, applications and computing workloads. Our scalable, flexible solutions and 400+ dedicated employees consistently deliver unmatched data center options — all of which leads to a best-in-class customer experience and lasting relationships. For more information, visit www.CoreSite.com.
CoreSite Contact
Greer Aviv
Vice President of Investor Relations and Media/Public Relations
+1 303.405.1012
+1 303.222.7276
Greer.Aviv@CoreSite.com
|
Quarter Ended September 30, 2016 |
| |
| 6 |
Forward Looking Statements
This earnings release and accompanying supplemental information may contain forward-looking statements within the meaning of the federal securities laws. Forward-looking statements relate to expectations, beliefs, projections, future plans and strategies, anticipated events or trends and similar expressions concerning matters that are not historical facts. In some cases, you can identify forward-looking statements by the use of forward-looking terminology such as “believes,” “expects,” “may,” “will,” “should,” “seeks,” “approximately,” “intends,” “plans,” “pro forma,” “estimates” or “anticipates” or the negative of these words and phrases or similar words or phrases that are predictions of or indicate future events or trends and that do not relate solely to historical matters. Forward-looking statements involve known and unknown risks, uncertainties, assumptions and contingencies, many of which are beyond CoreSite’s control, that may cause actual results to differ significantly from those expressed in any forward-looking statement. These risks include, without limitation: the geographic concentration of the company’s data centers in certain markets and any adverse developments in local economic conditions or the demand for data center space in these markets; fluctuations in interest rates and increased operating costs; difficulties in identifying properties to acquire and completing acquisitions; significant industry competition; the company’s failure to obtain necessary outside financing; the company’s failure to qualify or maintain its status as a REIT; financial market fluctuations; changes in real estate and zoning laws and increases in real property tax rates; and other factors affecting the real estate industry generally. All forward-looking statements reflect the company’s good faith beliefs, assumptions and expectations, but they are not guarantees of future performance. Furthermore, the company disclaims any obligation to publicly update or revise any forward-looking statement to reflect changes in underlying assumptions or factors, of new information, data or methods, future events or other changes. For a further discussion of these and other factors that could cause the company’s future results to differ materially from any forward-looking statements, see the section entitled “Risk Factors” in the company’s most recent annual report on Form 10-K, and other risks described in documents subsequently filed by the company from time to time with the Securities and Exchange Commission.
|
Quarter Ended September 30, 2016 |
| |
| 7 |
Company Profile
CoreSite delivers secure, reliable, high-performance data center and interconnection solutions
to a growing customer ecosystem across eight key North American markets.
|
Quarter Ended September 30, 2016 |
| |
| 8 |
Company Profile
| | | | | |
Secure, Reliable and Compliant | | High-Performance |
• | Six 9s historical portfolio uptime for calendar years 2010-2015 | | • | Cloud-enabled, network-rich data center campuses |
• | Physical security standards and rigorous internal security training enable regulatory compliance requirements | | • | Over 375 network service providers supported by robust IX services to key public clouds |
• | Operational excellence in security and environmental controls | | • | 20,000+ interconnections |
• | Consistent compliance across all properties | | • | Enabling enterprise with support ecosystems |
| • | SOC 1 & SOC 2 Type 2 reviews | | | |
| • | ISO 27001 certified | | | |
| • | Payment Card Industry Data Security Standard compliant | | | |
| • | HIPAA validation | | | |
Scalable | | Best-in-Class Customer Experience |
• | Serving customer requirements from half cabinet to full buildings | | • | 400+ professionals with dedicated industry expertise supporting over 1,000 customers |
• | 19 operating data centers in eight of the largest commercial and data center markets in the US | | • | Experienced and committed operations, facilities and security personnel |
• | Delivered approximately 230,000 NRSF at SV7 in October 2016, over 60% leased | | • | Dedicated implementation resources to ensure a seamless onboarding process |
• | Ability to increase occupied data center footprint on land and buildings currently owned and under contract, including current space unoccupied, under construction and held for development by approximately 75% | | • | 24/7 customer support and remote hands |
|
Quarter Ended September 30, 2016 |
| |
| 9 |
Summary of Financial Data
(in thousands, except per share, NRSF and MRR data)
| | | | | | | | | | | | | | | | |
| | Three Months Ended | | Nine Months Ended | |
Summary of Results | | September 30, 2016 | | June 30,
2016 | | September 30, 2015 | | September 30, 2016 | | September 30, 2015 | |
Operating revenues | | $ | 101,274 | | $ | 96,090 | | $ | 86,382 | | $ | 289,844 | | $ | 242,373 | |
Net income | | | 19,319 | | | 19,835 | | | 14,530 | | | 58,760 | | | 39,472 | |
Net income attributable to common shares | | | 12,180 | | | 12,035 | | | 6,920 | | | 35,476 | | | 17,026 | |
Funds from operations (FFO) to shares and units | | | 42,768 | | | 42,614 | | | 35,264 | | | 126,289 | | | 97,597 | |
Adjusted funds from operations (AFFO) | | | 40,227 | | | 40,299 | | | 25,644 | | | 116,107 | | | 76,914 | |
EBITDA | | | 49,486 | | | 48,785 | | | 41,098 | | | 144,662 | | | 116,008 | |
Adjusted EBITDA | | | 52,114 | | | 51,122 | | | 43,698 | | | 151,723 | | | 122,208 | |
Per share - diluted: | | | | | | | | | | | | | | | | |
Net income attributable to common shares | | $ | 0.36 | | $ | 0.37 | | $ | 0.26 | | $ | 1.10 | | $ | 0.69 | |
FFO per common share and OP unit | | $ | 0.90 | | $ | 0.89 | | $ | 0.74 | | $ | 2.65 | | $ | 2.06 | |
| | | | | | | | | | | | | | | | |
| | As of | |
| | September 30, 2016 | | June 30,
2016 | | March 31,
2016 | | December 31, 2015 | | September 30, 2015 | |
| | | | | | | | | | | | | | | | |
Dividend Activity | | | | | | | | | | | | | | | | |
Dividends declared per share and OP unit | | $ | 0.53 | | $ | 0.53 | | $ | 0.53 | | $ | 0.53 | | $ | 0.42 | |
AFFO payout ratio | | | 63.0 | % | | 62.8 | % | | 71.1 | % | | 82.8 | % | | 77.6 | % |
| | | | | | | | | | | | | | | | |
Operating Portfolio Statistics | | | | | | | | | | | | | | | | |
Operating data center properties | | | 18 | | | 18 | | | 17 | | | 17 | | | 17 | |
Stabilized data center NRSF | | | 1,786,638 | | | 1,775,007 | | | 1,597,764 | | | 1,524,406 | | | 1,474,472 | |
Stabilized data center NRSF occupied | | | 1,674,157 | | | 1,633,450 | | | 1,447,764 | | | 1,409,332 | | | 1,337,015 | |
Stabilized data center % occupied | | | 93.7 | % | | 92.0 | % | | 90.6 | % | | 92.5 | % | | 90.7 | % |
| | | | | | | | | | | | | | | | |
Turn-Key Data Center ("TKD") Same Store Statistics | | | | | | | | | | | | | | | | |
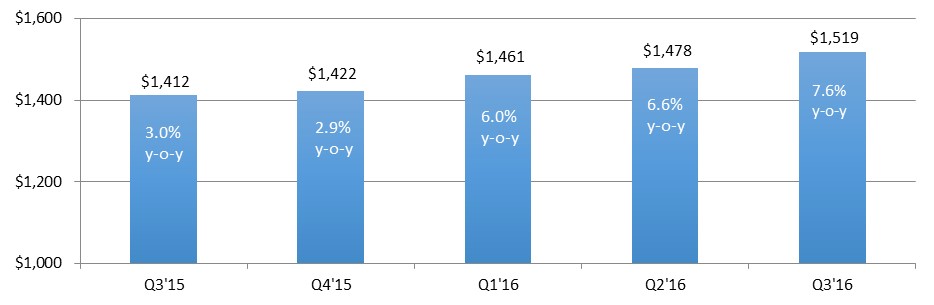
MRR per Cabinet Equivalent | | $ | 1,519 | | $ | 1,478 | | $ | 1,461 | | $ | 1,422 | | $ | 1,412 | |
TKD NRSF % occupied | | | 89.6 | % | | 88.9 | % | | 87.2 | % | | 88.6 | % | | 83.1 | % |
| | | | | | | | | | | | | | | | |
Market Capitalization, Principal Debt & Preferred Stock | | | | | | | | | | | | | | | | |
Total enterprise value | | $ | 4,244,766 | | $ | 4,852,439 | | $ | 3,920,378 | | $ | 3,201,961 | | $ | 2,918,547 | |
Total principal debt outstanding | | | 594,750 | | | 500,000 | | | 461,000 | | | 392,250 | | | 360,250 | |
Total principal debt and preferred stock outstanding | | | 709,750 | | | 615,000 | | | 576,000 | | | 507,250 | | | 475,250 | |
| | | | | | | | | | | | | | | | |
Net Principal Debt to: | | | | | | | | | | | | | | | | |
Annualized Adjusted EBITDA | | | 2.8 | x | | 2.4 | x | | 2.4 | x | | 2.0 | x | | 2.0 | x |
Enterprise Value | | | 13.9 | % | | 10.3 | % | | 11.7 | % | | 12.0 | % | | 12.0 | % |
| | | | | | | | | | | | | | | | |
Net Principal Debt & Preferred Stock to: | | | | | | | | | | | | | | | | |
Annualized Adjusted EBITDA | | | 3.4 | x | | 3.0 | x | | 3.0 | x | | 2.6 | x | | 2.7 | x |
Enterprise Value | | | 16.6 | % | | 12.6 | % | | 14.6 | % | | 15.6 | % | | 16.0 | % |
|
Quarter Ended September 30, 2016 |
| |
| 10 |
Consolidated Balance Sheets
(in thousands)
| | | | | | | |
| | September 30, 2016 | | December 31, 2015 | |
Assets: | | | | | | | |
Investments in real estate: | | | | | | | |
Land | | $ | 82,463 | | $ | 74,819 | |
Buildings and improvements | | | 1,186,712 | | | 1,037,127 | |
| | | 1,269,175 | | | 1,111,946 | |
Less: Accumulated depreciation and amortization | | | (345,224) | | | (284,219) | |
Net investment in operating properties | | | 923,951 | | | 827,727 | |
Construction in progress | | | 272,928 | | | 183,189 | |
Net investments in real estate | | | 1,196,879 | | | 1,010,916 | |
Cash and cash equivalents | | | 6,296 | | | 6,854 | |
Accounts and other receivables, net | | | 16,103 | | | 12,235 | |
Lease intangibles, net | | | 3,249 | | | 4,714 | |
Goodwill | | | 41,191 | | | 41,191 | |
Other assets, net | | | 96,274 | | | 86,633 | |
| | | | | | | |
Total assets | | $ | 1,359,992 | | $ | 1,162,543 | |
| | | | | | | |
Liabilities and equity: | | | | | | | |
Liabilities | | | | | | | |
Debt, net | | $ | 590,992 | | $ | 391,007 | |
Accounts payable and accrued expenses | | | 86,129 | | | 75,783 | |
Accrued dividends and distributions | | | 28,630 | | | 28,104 | |
Deferred rent payable | | | 7,577 | | | 7,934 | |
Acquired below-market lease contracts, net | | | 4,059 | | | 4,693 | |
Unearned revenue, prepaid rent and other liabilities | | | 33,444 | | | 28,717 | |
Total liabilities | | | 750,831 | | | 536,238 | |
| | | | | | | |
Stockholders' equity | | | | | | | |
Series A cumulative preferred stock | | | 115,000 | | | 115,000 | |
Common stock, par value $0.01 | | | 334 | | | 301 | |
Additional paid-in capital | | | 436,311 | | | 390,200 | |
Accumulated other comprehensive loss | | | (2,141) | | | (493) | |
Distributions in excess of net income | | | (105,756) | | | (88,891) | |
Total stockholders' equity | | | 443,748 | | | 416,117 | |
Noncontrolling interests | | | 165,413 | | | 210,188 | |
Total equity | | | 609,161 | | | 626,305 | |
| | | | | | | |
Total liabilities and equity | | $ | 1,359,992 | | $ | 1,162,543 | |
|
Quarter Ended September 30, 2016 |
| |

| 11 |
Consolidated Statements of Operations
(in thousands, except share and per share data)
| | | | | | | | | | | | | | | | |
| | Three Months Ended | | Nine Months Ended | |
| | September 30, 2016 | | June 30,
2016 | | September 30, 2015 | | September 30, 2016 | | September 30, 2015 | |
Operating revenues: | | | | | | | | | | | | | | | | |
Data center revenue: | | | | | | | | | | | | | | | | |
Rental revenue | | $ | 54,219 | | $ | 52,364 | | $ | 47,135 | | $ | 156,954 | | $ | 133,282 | |
Power revenue | | | 28,844 | | | 26,401 | | | 23,543 | | | 80,819 | | | 64,782 | |
Interconnection revenue | | | 13,374 | | | 12,977 | | | 11,400 | | | 39,093 | | | 32,210 | |
Tenant reimbursement and other | | | 2,826 | | | 2,326 | | | 2,357 | | | 6,982 | | | 6,049 | |
Total data center revenue | | | 99,263 | | | 94,068 | | | 84,435 | | | 283,848 | | | 236,323 | |
Office, light-industrial and other revenue | | | 2,011 | | | 2,022 | | | 1,947 | | | 5,996 | | | 6,050 | |
Total operating revenues | | | 101,274 | | | 96,090 | | | 86,382 | | | 289,844 | | | 242,373 | |
| | | | | | | | | | | | | | | | |
Operating expenses: | | | | | | | | | | | | | | | | |
Property operating and maintenance | | | 28,283 | | | 25,576 | | | 24,203 | | | 78,522 | | | 65,965 | |
Real estate taxes and insurance | | | 3,524 | | | 3,070 | | | 3,216 | | | 9,659 | | | 8,421 | |
Depreciation and amortization | | | 26,981 | | | 26,227 | | | 24,347 | | | 77,978 | | | 71,209 | |
Sales and marketing | | | 4,465 | | | 4,501 | | | 3,775 | | | 13,187 | | | 11,813 | |
General and administrative | | | 9,432 | | | 8,818 | | | 8,644 | | | 26,970 | | | 24,461 | |
Rent | | | 5,967 | | | 5,334 | | | 5,440 | | | 16,718 | | | 15,690 | |
Transaction costs | | | 117 | | | 6 | | | 6 | | | 126 | | | 51 | |
Total operating expenses | | | 78,769 | | | 73,532 | | | 69,631 | | | 223,160 | | | 197,610 | |
Operating income | | | 22,505 | | | 22,558 | | | 16,751 | | | 66,684 | | | 44,763 | |
Gain on real estate disposal | | | — | | | — | | | — | | | — | | | 36 | |
Interest income | | | 34 | | | — | | | 1 | | | 35 | | | 5 | |
Interest expense | | | (3,222) | | | (2,680) | | | (2,188) | | | (7,914) | | | (5,183) | |
Income before income taxes | | | 19,317 | | | 19,878 | | | 14,564 | | | 58,805 | | | 39,621 | |
Income tax benefit (expense) | | | 2 | | | (43) | | | (34) | | | (45) | | | (149) | |
Net income | | | 19,319 | | | 19,835 | | | 14,530 | | | 58,760 | | | 39,472 | |
Net income attributable to noncontrolling interests | | | 5,055 | | | 5,715 | | | 5,526 | | | 17,031 | | | 16,193 | |
Net income attributable to CoreSite Realty Corporation | | | 14,264 | | | 14,120 | | | 9,004 | | | 41,729 | | | 23,279 | |
Preferred stock dividends | | | (2,084) | | | (2,085) | | | (2,084) | | | (6,253) | | | (6,253) | |
Net income attributable to common shares | | $ | 12,180 | | $ | 12,035 | | $ | 6,920 | | $ | 35,476 | | $ | 17,026 | |
| | | | | | | | | | | | | | | | |
Net income per share attributable to common shares: | | | | | | | | | | | | | | | | |
Basic | | $ | 0.36 | | $ | 0.38 | | $ | 0.26 | | $ | 1.11 | | $ | 0.71 | |
Diluted | | $ | 0.36 | | $ | 0.37 | | $ | 0.26 | | $ | 1.10 | | $ | 0.69 | |
| | | | | | | | | | | | | | | | |
Weighted average common shares outstanding: | | | | | | | | | | | | | | | | |
Basic | | | 33,425,762 | | | 32,022,845 | | | 26,126,332 | | | 31,906,000 | | | 24,029,106 | |
Diluted | | | 33,912,155 | | | 32,435,606 | | | 26,549,537 | | | 32,361,367 | | | 24,544,612 | |
|
Quarter Ended September 30, 2016 |
| |
| 12 |
Reconciliations of Net Income to FFO, AFFO, EBITDA and Adjusted EBITDA
(in thousands, except per share data)
|
Reconciliation of Net Income to FFO |
| | | | | | | | | | | | | | | | |
| | Three Months Ended | Nine Months Ended | |
| | September 30, 2016 | | June 30,
2016 | | September 30, 2015 | | September 30, 2016 | | September 30, 2015 | |
Net income | | $ | 19,319 | | $ | 19,835 | | $ | 14,530 | | $ | 58,760 | | $ | 39,472 | |
Real estate depreciation and amortization | | | 25,533 | | | 24,864 | | | 22,818 | | | 73,782 | | | 64,414 | |
Gain on real estate disposal | | | — | | | — | | | — | | | — | | | (36) | |
FFO | | $ | 44,852 | | $ | 44,699 | | $ | 37,348 | | $ | 132,542 | | $ | 103,850 | |
Preferred stock dividends | | | (2,084) | | | (2,085) | | | (2,084) | | | (6,253) | | | (6,253) | |
FFO available to common shareholders and OP unit holders | | $ | 42,768 | | $ | 42,614 | | $ | 35,264 | | $ | 126,289 | | $ | 97,597 | |
| | | | | | | | | | | | | | | | |
Weighted average common shares outstanding - diluted | | | 33,912 | | | 32,436 | | | 26,550 | | | 32,361 | | | 24,545 | |
Weighted average OP units outstanding - diluted | | | 13,851 | | | 15,239 | | | 20,861 | | | 15,310 | | | 22,839 | |
Total weighted average shares and units outstanding - diluted | | | 47,763 | | | 47,675 | | | 47,411 | | | 47,671 | | | 47,384 | |
| | | | | | | | | | | | | | | | |
FFO per common share and OP unit - diluted | | $ | 0.90 | | $ | 0.89 | | $ | 0.74 | | $ | 2.65 | | $ | 2.06 | |
|
Reconciliation of FFO to AFFO |
| | | | | | | | | | | | | | | | |
| | Three Months Ended | Nine Months Ended | |
| | September 30, 2016 | | June 30,
2016 | | September 30, 2015 | | September 30, 2016 | | September 30, 2015 | |
FFO available to common shareholders and unit holders | | $ | 42,768 | | $ | 42,614 | | $ | 35,264 | | $ | 126,289 | | $ | 97,597 | |
| | | | | | | | | | | | | | | | |
Adjustments: | | | | | | | | | | | | | | | | |
Amortization of deferred financing costs | | | 370 | | | 311 | | | 413 | | | 964 | | | 999 | |
Non-cash compensation | | | 2,470 | | | 2,311 | | | 1,944 | | | 6,874 | | | 5,305 | |
Non-real estate depreciation | | | 1,448 | | | 1,363 | | | 1,529 | | | 4,196 | | | 6,795 | |
Straight-line rent adjustment | | | (433) | | | (1,002) | | | (2,993) | | | (3,029) | | | (6,812) | |
Amortization of above and below market leases | | | (141) | | | (143) | | | (129) | | | (417) | | | (387) | |
Recurring capital expenditures | | | (1,101) | | | (1,217) | | | (667) | | | (4,018) | | | (3,500) | |
Tenant improvements | | | (2,361) | | | (901) | | | (1,692) | | | (4,551) | | | (6,171) | |
Capitalized leasing costs | | | (2,793) | | | (3,037) | | | (8,025) | | | (10,201) | | | (16,912) | |
AFFO available to common shareholders and OP unit holders | | $ | 40,227 | | $ | 40,299 | | $ | 25,644 | | $ | 116,107 | | $ | 76,914 | |
|
Reconciliation of Net Income to EBITDA and Adjusted EBITDA |
| | | | | | | | | | | | | | | | |
| | Three Months Ended | | Nine Months Ended | |
| | September 30, 2016 | | June 30,
2016 | | September 30, 2015 | | September 30, 2016 | | September 30, 2015 | |
Net income | | $ | 19,319 | | $ | 19,835 | | $ | 14,530 | | $ | 58,760 | | $ | 39,472 | |
Adjustments: | | | | | | | | | | | | | | | | |
Interest expense, net of interest income | | | 3,188 | | | 2,680 | | | 2,187 | | | 7,879 | | | 5,178 | |
Income taxes | | | (2) | | | 43 | | | 34 | | | 45 | | | 149 | |
Depreciation and amortization | | | 26,981 | | | 26,227 | | | 24,347 | | | 77,978 | | | 71,209 | |
EBITDA | | $ | 49,486 | | $ | 48,785 | | $ | 41,098 | | $ | 144,662 | | $ | 116,008 | |
Non-cash compensation | | | 2,470 | | | 2,311 | | | 1,944 | | | 6,874 | | | 5,305 | |
Gain on real estate disposal | | | — | | | — | | | — | | | — | | | (36) | |
Transaction costs / litigation | | | 158 | | | 26 | | | 656 | | | 187 | | | 931 | |
Adjusted EBITDA | | $ | 52,114 | | $ | 51,122 | | $ | 43,698 | | $ | 151,723 | | $ | 122,208 | |
|
Quarter Ended September 30, 2016 |
| |
| 13 |
Operating Properties
| | | | | | | | | | | | | | | | | | | | | | |
| | Data Center Operating NRSF | | | | | | | |
| | Annualized | | Stabilized | | Pre-Stabilized | | Total | | | | Held for | | | |
| | Rent | | | | Percent | | | | Percent | | | | Percent | | NRSF Under | | Development | | | |
Market/Facilities | | ($000)(1) | | Total | | Occupied(2) | | Total | | Occupied(2) | | Total | | Occupied(2) | | Construction | | NRSF | | Total NRSF | |
| | | | | | | | | | | | | | | | | | | | | | |
Los Angeles | | | | | | | | | | | | | | | | | | | | | | |
One Wilshire campus | | | | | | | | | | | | | | | | | | | | | | |
LA1* | | $ | 28,310 | | 139,053 | | 91.5 | % | — | | — | % | 139,053 | | 91.5 | % | — | | 10,352 | | 149,405 | |
LA2 | | | 29,405 | | 254,343 | | 89.4 | | 43,345 | | 15.6 | | 297,688 | | 78.6 | | 4,726 | | 122,476 | | 424,890 | |
Los Angeles Total | | | 57,715 | | 393,396 | | 90.1 | | 43,345 | | 15.6 | | 436,741 | | 82.7 | | 4,726 | | 132,828 | | 574,295 | |
| | | | | | | | | | | | | | | | | | | | | | |
San Francisco Bay | | | | | | | | | | | | | | | | | | | | | | |
SV1 | | | 6,572 | | 85,932 | | 83.9 | | — | | — | | 85,932 | | 83.9 | | — | | — | | 85,932 | |
SV2 | | | 8,349 | | 76,676 | | 93.7 | | — | | — | | 76,676 | | 93.7 | | — | | — | | 76,676 | |
Santa Clara campus(3) | | | 37,168 | | 388,589 | | 98.6 | | — | | — | | 388,589 | | 98.6 | | 230,000 | | — | | 618,589 | |
San Francisco Bay Total | | | 52,089 | | 551,197 | | 95.6 | | — | | — | | 551,197 | | 95.6 | | 230,000 | | — | | 781,197 | |
| | | | | | | | | | | | | | | | | | | | | | |
Northern Virginia | | | | | | | | | | | | | | | | | | | | | | |
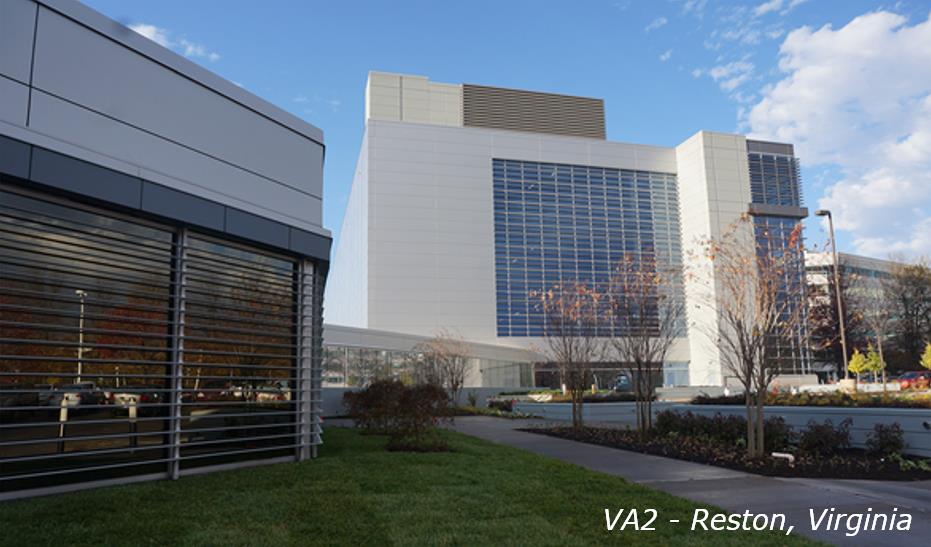
VA1 | | | 27,502 | | 201,719 | | 95.0 | | — | | — | | 201,719 | | 95.0 | | — | | — | | 201,719 | |
VA2 | | | 12,050 | | 115,336 | | 100.0 | | 73,111 | | 8.0 | | 188,447 | | 64.3 | | — | | — | | 188,447 | |
DC1* | | | 3,276 | | 22,137 | | 87.0 | | — | | — | | 22,137 | | 87.0 | | — | | — | | 22,137 | |
Northern Virginia Total | | | 42,828 | | 339,192 | | 96.2 | | 73,111 | | 8.0 | | 412,303 | | 80.5 | | — | | — | | 412,303 | |
| | | | | | | | | | | | | | | | | | | | | | |
Chicago | | | | | | | | | | | | | | | | | | | | | | |
CH1 | | | 18,633 | | 178,407 | | 93.4 | | — | | — | | 178,407 | | 93.4 | | — | | — | | 178,407 | |
| | | | | | | | | | | | | | | | | | | | | | |
Boston | | | | | | | | | | | | | | | | | | | | | | |
BO1 | | | 17,121 | | 166,026 | | 98.7 | | 14,031 | | 54.6 | | 180,057 | | 95.2 | | — | | 73,619 | | 253,676 | |
| | | | | | | | | | | | | | | | | | | | | | |
New York | | | | | | | | | | | | | | | | | | | | | | |
NY1* | | | 5,015 | | 48,404 | | 71.5 | | — | | — | | 48,404 | | 71.5 | | — | | — | | 48,404 | |
NY2 | | | 9,367 | | 68,822 | | 94.9 | | 32,920 | | 44.4 | | 101,742 | | 78.5 | | — | | 134,508 | | 236,250 | |
New York Total | | | 14,382 | | 117,226 | | 85.2 | | 32,920 | | 44.4 | | 150,146 | | 76.3 | | — | | 134,508 | | 284,654 | |
| | | | | | | | | | | | | | | | | | | | | | |
Miami | | | | | | | | | | | | | | | | | | | | | | |
MI1 | | | 1,937 | | 30,176 | | 82.9 | | — | | — | | 30,176 | | 82.9 | | — | | 13,154 | | 43,330 | |
| | | | | | | | | | | | | | | | | | | | | | |
Denver | | | | | | | | | | | | | | | | | | | | | | |
DE1* | | | 1,349 | | 5,878 | | 100.0 | | — | | — | | 5,878 | | 100.0 | | 8,276 | | 15,630 | | 29,784 | |
DE2* | | | 438 | | 5,140 | | 98.3 | | — | | — | | 5,140 | | 98.3 | | — | | — | | 5,140 | |
Denver Total | | | 1,787 | | 11,018 | | 99.2 | | — | | — | | 11,018 | | 99.2 | | 8,276 | | 15,630 | | 34,924 | |
Total Data Center Facilities | | $ | 206,492 | | 1,786,638 | | 93.7 | % | 163,407 | | 21.4 | % | 1,950,045 | | 87.6 | % | 243,002 | | 369,739 | | 2,562,786 | |
| | | | | | | | | | | | | | | | | | | | | | |
Office & Light-Industrial | | | 7,622 | | 354,721 | | 76.8 | | — | | — | | 354,721 | | 76.8 | | — | | — | | 354,721 | |
Total Portfolio | | $ | 214,114 | | 2,141,359 | | 90.9 | % | 163,407 | | 21.4 | % | 2,304,766 | | 86.0 | % | 243,002 | | 369,739 | | 2,917,507 | |
* Indicates properties in which we hold a leasehold interest.
| (1) | | On a gross basis, our total portfolio annualized rent was approximately $220.0 million as of September 30, 2016, which reflects the addition of $5.9 million in operating expense reimbursements to contractual net rent under modified gross and triple-net leases. |
| (2) | | Includes customer leases that have commenced and are occupied as of September 30, 2016. If all leases signed during the current and prior periods had commenced, the percent occupied would have been as follows: |
| | | | | | | |
Percent Leased | | Stabilized | | Pre-Stabilized | | Total | |
Total Data Center Facilities | | 94.3 | % | 29.4 | % | 88.9 | % |
Total Portfolio | | 91.4 | % | 29.4 | % | 87.0 | % |
| (3) | | The annualized rent for the Santa Clara campus includes $4.2 million associated with a restructured lease agreement involving a customer that has vacated its leased space and is paying discounted rent payments that may be applied to new lease arrangements elsewhere in our portfolio on a dollar-for-dollar basis until the original lease term expires in Q2 2017. |
See Appendix for definitions.
|
Quarter Ended September 30, 2016 |
| |

| 14 |
Leasing Statistics
|
Data Center Leasing Activity |
| | | | | | | | | | | | | | | | | | | |
| | | | | | GAAP | | | | GAAP | | | | | | | |
| | Leasing | | Number | | Annualized | | Total | | Annualized | | Rental | | Cash | | GAAP | |
| | Activity | | of | | Rent | | Leased | | Rent per | | Churn | | Rent | | Rent | |
| | Period | | Leases(1) | | ($000) | | NRSF | | Leased NRSF | | Rate | | Growth | | Growth | |
| | | | | | | | | | | | | | | | | | | |
New/expansion leases commenced | | YTD 2016 | | 463 | | $ | 23,741 | | 254,062 | | $ | 93 | (2) | | | | | | |
| | Q3 2016 | | 178 | | | 7,493 | | 50,455 | | | 148 | | | | | | | |
| | Q2 2016 | | 152 | | | 8,699 | | 157,642 | | | 55 | (2) | | | | | | |
| | Q1 2016 | | 133 | | | 7,549 | | 45,965 | | | 164 | | | | | | | |
| | Q4 2015 | | 142 | | | 9,335 | | 54,329 | | | 172 | | | | | | | |
| | Q3 2015 | | 150 | | | 9,250 | | 66,330 | | | 139 | | | | | | | |
| | | | | | | | | | | | | | | | | | | |
New/expansion leases signed | | YTD 2016 | | 452 | | $ | 41,348 | | 210,816 | | $ | 196 | | | | | | | |
| | Q3 2016 | | 162 | | | 11,214 | | 59,991 | | | 187 | | | | | | | |
| | Q2 2016 | | 171 | | | 7,656 | | 48,147 | | | 159 | | | | | | | |
| | Q1 2016 | | 119 | | | 22,478 | | 102,678 | | | 219 | | | | | | | |
| | Q4 2015 | | 155 | | | 8,901 | | 42,089 | | | 211 | | | | | | | |
| | Q3 2015 | | 149 | | | 8,825 | | 64,087 | | | 138 | | | | | | | |
| | | | | | | | | | | | | | | | | | | |
Renewal leases signed | | YTD 2016 | | 501 | | $ | 29,116 | | 203,096 | | $ | 143 | | 6.0 | % | 4.2 | % | 8.4 | % |
| | Q3 2016 | | 157 | | | 10,872 | | 76,735 | | | 142 | | 2.2 | | 4.0 | | 6.8 | |
| | Q2 2016 | | 173 | | | 8,512 | | 70,028 | | | 122 | | 2.1 | | 5.2 | | 9.4 | |
| | Q1 2016 | | 171 | | | 9,732 | | 56,333 | | | 173 | | 1.6 | | 3.7 | | 9.2 | |
| | Q4 2015 | | 211 | | | 10,089 | | 49,561 | | | 204 | | 2.3 | | 3.8 | | 6.7 | |
| | Q3 2015 | | 165 | | | 10,460 | | 72,031 | | | 145 | | 1.4 | | 4.2 | | 9.7 | |
| (1) | | Number of leases represents each agreement with a customer; a lease agreement could include multiple spaces and a customer could have multiple leases. |
| (2) | | During Q2 2015, we signed a 136,580 NRSF build-to-suit powered shell lease at our SV6 facility which was completed and commenced during Q2 2016. |
|
New/Expansion Leases Signed by Deployment Size by Period |
| | | | | | | | | | | | | | | | |
| | Q3 2016 | | Q2 2016 | | Q1 2016 | | Q4 2015 | | Q3 2015 | |
GAAP Annualized Rent ($000) | | | | | | | | | | | | | | | | |
Leases < 1,000 NRSF | | $ | 4,047 | | $ | 2,957 | | $ | 2,635 | | $ | 2,771 | | $ | 2,809 | |
Leases 1,000-5,000 NRSF | | | 5,093 | | | 3,090 | | | 1,534 | | | 4,817 | | | 2,241 | |
Leases <= 5,000 NRSF | | $ | 9,140 | | $ | 6,047 | | $ | 4,169 | | $ | 7,588 | | $ | 5,050 | |
Leases > 5,000 NRSF | | | 2,074 | | | 1,609 | | | 18,309 | | | 1,313 | | | 3,775 | |
Total GAAP Annualized Rent | | $ | 11,214 | | $ | 7,656 | | $ | 22,478 | | $ | 8,901 | | $ | 8,825 | |
|
MRR per Cabinet Equivalent (TKD Same Store) |
|
Quarter Ended September 30, 2016 |
| |
| 15 |
Leasing Statistics
|
Lease Distribution (total portfolio, including total data center and office and light-industrial “OLI”) |
| | | | | | | | | | | | | | |
| | | | | | Total | | Percentage | | | | | Percentage | |
| | Number | | Percentage | | Operating | | of Total | | Annualized | | of Total | |
| | of | | of All | | NRSF of | | Operating | | Rent | | Annualized | |
NRSF Under Lease | | Leases | | Leases | | Leases | | NRSF | | ($000) | | Rent | |
Unoccupied data center | | — | | — | % | 240,990 | | 10.5 | % | $ | — | | — | % |
Unoccupied OLI | | — | | — | | 82,270 | | 3.6 | | | — | | — | |
Data center NRSF: | | | | | | | | | | | | | | |
5,000 or less | | 1,839 | | 91.2 | | 658,099 | | 28.5 | | | 106,854 | | 49.9 | |
5,001 - 10,000 | | 33 | | 1.7 | | 214,813 | | 9.3 | | | 29,376 | | 13.7 | |
10,001 - 25,000 | | 19 | | 0.9 | | 296,351 | | 12.9 | | | 38,024 | | 17.7 | |
Greater than 25,000 | | 3 | | 0.1 | | 105,532 | | 4.6 | | | 12,798 | | 6.0 | |
Powered shell and other(1) | | 16 | | 0.8 | | 434,260 | | 18.8 | | | 19,440 | | 9.1 | |
OLI | | 107 | | 5.3 | | 272,451 | | 11.8 | | | 7,622 | | 3.6 | |
Portfolio Total | | 2,017 | | 100.0 | % | 2,304,766 | | 100.0 | % | $ | 214,114 | | 100.0 | % |
| (1) | | The annualized rent for powered shell and other includes $4.2 million associated with a restructured lease agreement involving a customer at the Santa Clara campus that has vacated its leased space and is paying discounted rent payments that may be applied to new lease arrangements elsewhere in our portfolio on a dollar-for-dollar basis until the original lease term expires in Q2 2017. |
|
Lease Expirations (total portfolio, including total data center and office and light-industrial “OLI”) |
| | | | | | | | | | | | | | | | | | | | | |
| | | | Total | | | | | | | | | | | | | Annualized | |
| | Number | | Operating | | Percentage | | | | | Percentage | | Annualized | | Annualized | | Rent Per | |
| | of | | NRSF of | | of Total | | Annualized | | of Total | | Rent Per | | Rent at | | Leased | |
| | Leases | | Expiring | | Operating | | Rent | | Annualized | | Leased | | Expiration | | NRSF at | |
Year of Lease Expiration | | Expiring(1) | | Leases | | NRSF | | ($000) | | Rent | | NRSF(2) | | ($000)(3) | | Expiration(2) | |
Unoccupied data center | | — | | 240,990 | | 10.5 | % | $ | — | | — | % | $ | — | | $ | — | | $ | — | |
Unoccupied OLI | | — | | 82,270 | | 3.6 | | | — | | — | | | — | | | — | | | — | |
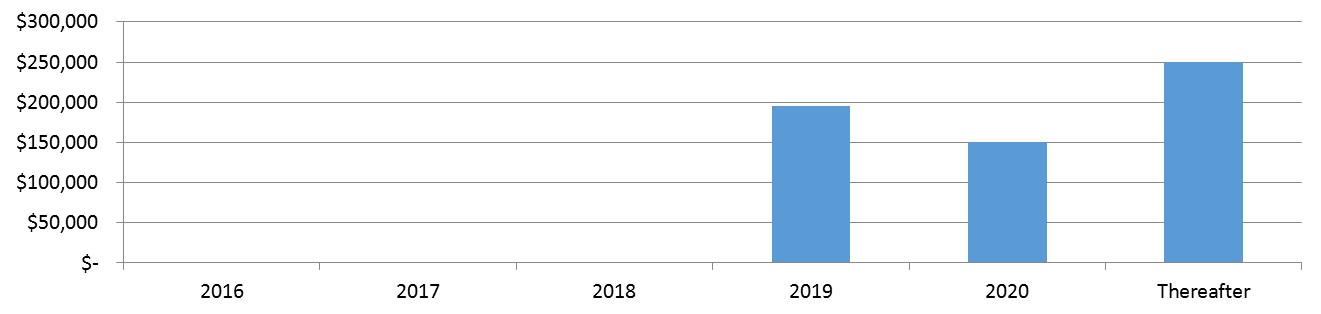
2016 | | 197 | | 96,825 | | 4.2 | | | 16,208 | | 7.5 | | | 167 | | | 16,259 | | | 168 | |
2017 | | 918 | | 381,443 | | 16.6 | | | 62,022 | | 28.9 | | | 151 | | | 62,811 | | | 154 | |
2018 | | 432 | | 336,330 | | 14.5 | | | 50,494 | | 23.6 | | | 150 | | | 52,773 | | | 157 | |
2019 | | 244 | | 281,115 | | 12.2 | | | 30,531 | | 14.3 | | | 109 | | | 33,541 | | | 119 | |
2020 | | 41 | | 102,362 | | 4.4 | | | 10,246 | | 4.8 | | | 100 | | | 13,429 | | | 131 | |
2021-Thereafter | | 78 | | 510,980 | | 22.2 | | | 36,991 | | 17.3 | | | 72 | | | 45,969 | | | 90 | |
OLI (4) | | 107 | | 272,451 | | 11.8 | | | 7,622 | | 3.6 | | | 28 | | | 9,410 | | | 35 | |
Portfolio Total / Weighted Average | | 2,017 | | 2,304,766 | | 100.0 | % | $ | 214,114 | | 100.0 | % | $ | 106 | | $ | 234,192 | | $ | 116 | |
| (1) | | Includes leases that upon expiration will automatically be renewed, primarily on a year-to-year basis. Number of leases represents each agreement with a customer; a lease agreement could include multiple spaces and a customer could have multiple leases. |
| (2) | | The annualized rent per leased NRSF and per leased NRSF at expiration does not include annualized rent of $4.2 million associated with a restructured lease agreement involving a customer at the Santa Clara campus that has vacated its leased space and is paying discounted rent payments that may be applied to new lease arrangements elsewhere in our portfolio on a dollar-for-dollar basis until the original lease term expires in Q2 2017. |
| (3) | | Represents the final monthly contractual rent under existing customer leases as of September 30, 2016, multiplied by 12. This amount reflects total annualized base rent before any one-time or non-recurring rent abatements and excludes operating expense reimbursement, power revenue and interconnection revenue. |
| (4) | | The office and light-industrial leases are scheduled to expire as follows: |
| | | | | | |
| | NRSF of | | Annualized | |
| | Expiring | | Rent | |
Year | | Leases | | ($000) | |
2016 | | 24,833 | | $ | 599 | |
2017 | | 22,663 | | | 582 | |
2018 | | 19,387 | | | 560 | |
2019 | | 33,267 | | | 845 | |
2020 | | 7,437 | | | 226 | |
2021-Thereafter | | 164,864 | | | 4,810 | |
Total OLI | | 272,451 | | $ | 7,622 | |
|
Quarter Ended September 30, 2016 |
| |
| 16 |
Geographic and Vertical Diversification
|
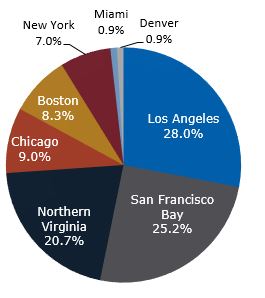
Geographical Diversification |
| | | | | |
| | | | Percentage of Total Data |
| Metropolitan Market | | Center Annualized Rent |
| Los Angeles | | 28.0 | % |
| San Francisco Bay | | 25.2 | |
| Northern Virginia | | 20.7 | |
| Chicago | | 9.0 | |
| Boston | | 8.3 | |
| New York | | 7.0 | |
| Miami | | 0.9 | |
| Denver | | 0.9 | |
| Total | | 100.0 | % |
| | | | |
| | | | | |
| | | | Percentage of Total Data |
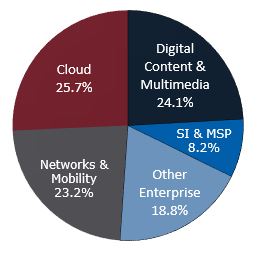
| Vertical | | Center Annualized Rent |
| Enterprise: | | | |
| Digital Content & Multimedia | | 24.1 | % |
| SI & MSP | | 8.2 | |
| Other Enterprise | | 18.8 | |
| Total Enterprise | | 51.1 | |
| Networks & Mobility | | 23.2 | |
| Cloud | | 25.7 | |
| Total | | 100.0 | % |
| | | | |
|
Quarter Ended September 30, 2016 |
| |
| 17 |
10 Largest Customers
|
10 Largest Customers (total portfolio, including data center and office and light-industrial) |
| | | | | | | | | | | | | | | | | |
| | | | | | | | | | | | | | | | Weighted | |
| | | | | | | | | Percentage | | | | Percentage | | Average | |
| | | | | Number | | Total | | of Total | | Annualized | | of Total | | Remaining | |
| | | | | of | | Occupied | | Operating | | Rent | | Annualized | | Lease Term in | |
Customer Industry | | CoreSite Vertical | | Locations | | NRSF | | NRSF(1) | | ($000) | | Rent(2) | | Months(3) | |
1 | Technology | | Cloud | | 10 | | 282,853 | | 12.3 | % | $ | 14,369 | | 6.7 | % | 73 | |
2 | Technology | | Cloud | | 2 | | 95,225 | | 4.1 | | | 8,984 | | 4.2 | | 74 | |
3 | Technology | | Enterprise - SI & MSP | | 3 | | 63,859 | | 2.8 | | | 8,597 | | 4.0 | | 29 | |
4 | Technology(4) | | Enterprise – Digital Content | | 10 | | 68,350 | | 3.0 | | | 6,482 | | 3.0 | | 10 | |
5 | Technology | | Enterprise – Digital Content | | 2 | | 31,848 | | 1.4 | | | 5,669 | | 2.7 | | 19 | |
6 | Technology | | Enterprise - Other | | 3 | | 15,055 | | 0.6 | | | 5,147 | | 2.4 | | 26 | |
7 | Technology | | Network | | 5 | | 27,916 | | 1.2 | | | 4,848 | | 2.3 | | 31 | |
8 | Technology | | Enterprise - Other | | 2 | | 26,081 | | 1.1 | | | 4,670 | | 2.2 | | 9 | |
9 | Technology | | Cloud | | 1 | | 31,283 | | 1.4 | | | 4,230 | | 2.0 | | 25 | |
10 | Government* | | Enterprise - Other | | 1 | | 136,420 | | 5.9 | | | 3,942 | | 1.8 | | 75 | |
| Total/Weighted Average(5) | | | | | | 778,890 | | 33.8 | % | $ | 66,938 | | 31.3 | % | 43 | |
* Denotes customer using space for general office purposes.
| (1) | | Represents the customer’s total occupied square feet divided by the total operating NRSF in the portfolio as of September 30, 2016. |
| (2) | | Represents the customer’s total annualized rent divided by the total annualized rent in the portfolio as of September 30, 2016. |
| (3) | | Weighted average based on percentage of total annualized rent expiring calculated as of September 30, 2016. |
| (4) | | During the second quarter of 2016 we successfully renewed and extended portions of this customer's deployments. We are currently negotiating renewal leases for the remaining locations. We anticipate that the lease negotiations will be finalized at some of the locations during Q4 2016 and that other locations will be vacated. |
| (5) | | In addition to the ten largest customers, total annualized rent includes $4.2 million associated with a restructured lease agreement involving a customer at the Santa Clara campus that has vacated its leased space and is paying discounted rent payments that may be applied to new lease arrangements elsewhere in our portfolio on a dollar-for-dollar basis until the original lease term expires in Q2 2017. |
|
Quarter Ended September 30, 2016 |
| |
| 18 |
Capital Expenditures and Completed
Pre-Stabilized Projects
(in thousands, except NRSF and cost per NRSF data)
|
Capital Expenditures and Repairs and Maintenance |
| | | | | | | | | | | | | | | | |
| | Three Months Ended | |
| | September 30, | | June 30, | | March 31, | | December 31, | | September 30, | |
| | 2016 | | 2016 | | 2016 | | 2015 | | 2015 | |
Data center expansion(1) | | $ | 71,415 | | $ | 100,990 | | $ | 64,088 | | $ | 64,816 | | $ | 25,762 | |
Non-recurring investments(2) | | | 1,430 | | | 3,091 | | | 3,765 | | | 1,968 | | | 1,263 | |
Tenant improvements | | | 2,361 | | | 901 | | | 1,289 | | | 1,866 | | | 1,692 | |
Recurring capital expenditures(3) | | | 1,101 | | | 1,217 | | | 1,700 | | | 2,328 | | | 667 | |
Total capital expenditures | | $ | 76,307 | | $ | 106,199 | | $ | 70,842 | | $ | 70,978 | | $ | 29,384 | |
| | | | | | | | | | | | | | | | |
Repairs and maintenance expense(4) | | $ | 3,709 | | $ | 3,042 | | $ | 3,073 | | $ | 2,715 | | $ | 3,011 | |
| (1) | | Data center expansion capital expenditures include new data center construction, development projects adding capacity to existing data centers and other revenue generating investments. Data center expansion also includes investment of Deferred Expansion Capital, as defined in the Appendix. |
| (2) | | Non-recurring investments include upgrades to existing data center or office space and company-wide improvements that are ancillary to revenue generation such as internal system development and system-wide security upgrades, which have a future economic benefit. |
| (3) | | Recurring capital expenditures include required equipment upgrades within our operating portfolio, which have a future economic benefit. |
| (4) | | Repairs and maintenance expense is classified within property operating and maintenance expense in the consolidated statement of operations. These expenditures represent recurring maintenance contracts and repairs to operating equipment necessary to maintain current operations. |
|
Completed Pre-Stabilized Projects |
| | | | | | | | | | | | | | | | | |
| | Metropolitan | | | | | | | | | Cost Per | | Percent | | Percent | |
Projects/Facilities | | Market | | Completion | | NRSF | | Cost(1) | | NRSF | | Leased(2) | | Occupied | |
NY2 Phase 2 | | New York | | Q2 2015 | | 32,920 | | $ | 29,476 | | $ | 895 | | 46.5 | % | 44.4 | % |
BO1 | | Boston | | Q1 2016 | | 14,031 | | | 11,446 | | | 816 | | 55.0 | | 54.6 | |
VA2 Phase 3(3) | | Northern Virginia | | Q1 2016 | | 24,974 | | | 12,286 | | | 492 | | 59.1 | | 23.5 | |
LA2 | | Los Angeles | | Q2 2016 | | 43,345 | | | 15,434 | | | 356 | | 23.5 | | 15.6 | |
VA2 Phase 4 | | Northern Virginia | | Q2 2016 | | 48,137 | | | 26,995 | | | 561 | | — | | — | |
Total completed pre-stabilized | | | | | | 163,407 | | $ | 95,637 | | $ | 585 | | 29.4 | % | 21.4 | % |
| (1) | | Cost includes capital expenditures related to the specific project / phase and, for NY2 and VA2, also includes allocations of capital expenditures related to land and building shell that were incurred during the first phase of each overall project. |
| (2) | | Includes customer leases that have been signed as of September 30, 2016, but have not commenced. The percent leased is determined based on leased square feet as a proportion of total pre-stabilized NRSF. |
| (3) | | During Q1 2016, we completed development of VA2 Phase 3, which is comprised of two computer rooms totaling 48,137 NRSF. One of the two computer rooms is 100% leased and occupied and is included in our stabilized operating NRSF in the Operating Properties table and the other computer room is pre-stabilized as of September 30, 2016. |
|
Quarter Ended September 30, 2016 |
| |

| 19 |
Development Summary
(in thousands, except NRSF and cost per NRSF data)
|
Data Center Projects Under Construction |
| | | | | | | | | | | | | | | | | | |
| | | | | | | | Costs | | | |
| | Metropolitan | | Estimated | | | | Incurred to- | | Estimated | | | | | Percent | |
Projects/Facilities | | Market | | Completion | | NRSF | | Date | | Total | | Per NRSF | | Leased | |
| | | | | | | | | | | | | | | | | | |
TKD(1) | | | | | | | | | | | | | | | | | | |
SV7(2) | | San Francisco Bay | | Q4 2016 | | 230,000 | | $ | 208,172 | | $ | 211,000 | | $ | 917 | | 61.7 | % |
LA2 | | Los Angeles | | Q4 2016 | | 4,726 | | | 392 | | | 2,000 | | | 423 | | 100.0 | |
DE1(3) | | Denver | | Q2 2017 | | 8,276 | | | 1,980 | | | 12,500 | | | 1,510 | | — | |
Total TKD | | | | | | 243,002 | | $ | 210,544 | | $ | 225,500 | | | | | 60.3 | % |
| | | | | | | | | | | | | | | | | | |
Deferred Expansion Capital(4) | | | | | | | | | | | | | | | | | | |
NY2 | | New York | | Q4 2016 | | — | | $ | 4,581 | | $ | 6,100 | | | | | | |
CH1 | | Chicago | | Q1 2017 | | — | | | 1,914 | | | 10,000 | | | | | | |
VA2 | | Northern Virginia | | Q1 2017 | | — | | | 3,913 | | | 10,400 | | | | | | |
Total Deferred Expansion Capital | | | | | | — | | $ | 10,408 | | $ | 26,500 | | | | | | |
| | | | | | | | | | | | | | | | | | |
Total | | | | | | 243,002 | | $ | 220,952 | | $ | 252,000 | | | | | | |
| (1) | | TKD estimated development costs include two components: 1) general construction to ready the NRSF as data center space and 2) power, cooling and other infrastructure to provide the designed amount of power capacity for the project. Following development completion, incremental capital, referred to as Deferred Expansion Capital, may be invested to support existing or anticipated future customer utilization of NRSF within our operating data centers. |
| (2) | | On October 12, 2016, we completed construction of SV7 and commenced operating activities at the building. |
| (3) | | Includes a portion of the cost of infrastructure to support later phases of the development. |
| (4) | | See Appendix for Deferred Expansion Capital definition. |
|
Quarter Ended September 30, 2016 |
| |
| 20 |
Development Summary
(in thousands, except NRSF and cost per NRSF data)
| | | | | | | | | | | | | |
| | | | | | Estimated | | Estimated | | Estimated | |
| | Metropolitan | | Estimated | | Incremental | | Sellable Power | | Incremental | |
Project / Building | | Market | | NRSF | | Costs | | (Megawatts) | | Cost per MW | |
| | | | | | | | | | | | | |
Incremental capacity in existing core and shell buildings(1) | | | | | | | | | | | | | |
LA1 | | Los Angeles | | 10,352 | | $ | 1,250 | | 0.5 | | $ | 2,500 | |
LA2 | | Los Angeles | | 122,476 | | | 53,000 | | 8.0 | | | 6,625 | |
BO1 | | Boston | | 73,619 | | | 40,000 | | 6.0 | | | 6,667 | |
NY2 Phases 3-4 | | New York | | 87,297 | | | 57,000 | | 8.5 | | | 6,706 | |
NY2 Phase 5 | | New York | | 47,211 | | | 35,000 | | 5.0 | | | 7,000 | |
MI1 | | Miami | | 13,154 | | | 7,500 | | 1.0 | | | 7,500 | |
DE1 | | Denver | | 15,630 | | | 8,000 | | 1.5 | | | 5,333 | |
Total incremental capacity | | | | 369,739 | | $ | 201,750 | | 30.5 | | $ | 6,615 | |
| | | | | | | | | | | | | |
Deferred expansion capital(2) | | | | �� | | | 25,000 | | | | | | |
| | | | | | | | | | | | | |
Total held for development(3) | | | | 369,739 | | $ | 226,750 | | | | | | |
| | | | | | | | | | | | | |
Reston campus expansion(4) | | Northern Virginia | | 660,000 | | $ | 500,000 - 600,000 | | 60.0 - 70.0 | | $ | 8,333 - 8,571 | |
| | | | | | | | | | | | | |
Total | | | | 1,029,739 | | $ | 726,750 - 826,750 | | 90.5 - 100.5 | | $ | 8,030 - 8,226 | |
| (1) | | Represents incremental data center capacity that may be constructed within existing facilities when the core and shell building have been developed and a portion of the existing space is not yet built out into data center space. |
| (2) | | As we construct data center capacity, we work to optimize both the amount of the capital we deploy on power and cooling infrastructure and the timing of that capital deployment; as such, we generally construct our power and cooling infrastructure supporting our data center NRSF based on our estimate of customer utilization. This practice can result in our investment at a later time in Deferred Expansion Capital. We define Deferred Expansion Capital as our estimate of the incremental capital we may invest in the future to add power or cooling infrastructure to support existing or anticipated future customer utilization of NRSF within our operating data centers. From time to time, we may revise our estimate of Deferred Expansion Capital, as well as the potential time period during which we may invest it. We currently estimate a range of $20 - $30 million of future Deferred Expansion Capital investment. |
| (3) | | In addition to new construction and incremental capacity in existing core and shell buildings, we have available acreage of entitled and unentitled land we own adjacent to our existing buildings, in the form of existing parking lots. By utilizing existing parking lots, we believe we can build approximately 100,000 NRSF and 200,000 NRSF buildings on our available acreage at NY2 and LA2, respectively. |
| (4) | | During Q3 2016, we entered a binding agreement to expand our position in the Northern Virginia market with the purchase of Sunrise Technology Park, a 21.75-acre light-industrial / flex office park consisting of four buildings totaling 315,000 NRSF. Pursuant to the purchase agreement and subject to customary closing conditions, we are obligated to purchase the property. Based upon our expectations regarding entitlements for the campus, we estimate that we can build approximately 660,000 NRSF of new data center capacity across multiple phases. These estimates are subject to change based on current economic conditions and the supply and demand dynamics of the market. We anticipate closing on the acquisition during Q4 2016. |
|
Quarter Ended September 30, 2016 |
| |
| 21 |
Market Capitalization and Debt Summary
(in thousands, except per share data)
| | | | | | | | | |
| | Shares or | | Market Price / | | | | |
| | Equivalents | | Liquidation Value as of | | Market Value | |
| | Outstanding | | September 30, 2016 | | Equivalents | |
Common shares | | 33,893 | | $ | 74.04 | | $ | 2,509,462 | |
Operating partnership units | | 13,851 | | | 74.04 | | | 1,025,554 | |
Liquidation value of preferred stock | | 4,600 | | | 25.00 | | | 115,000 | |
Total equity | | | | | | | | 3,650,016 | |
Total principal debt outstanding | | | | | | | | 594,750 | |
Total enterprise value | | | | | | | $ | 4,244,766 | |
| | | | | | | | | |
Net principal debt to enterprise value | | | | | | | | 13.9 | % |
Net principal debt and preferred stock to enterprise value | | | | | | | | 16.6 | % |
| | | | | | | | | | | | | |
| | | | | | Maturity | | Outstanding as of: | |
| | | | Maturity | | Date with | | September 30, | | December 31, | |
Instrument | | Rate | | Date | | Extension | | 2016 | | 2015 | |
Revolving credit facility (2) | | 2.08 | % | 6/24/2019 | | 6/24/2020 | | $ | 94,750 | | $ | 142,250 | |
2019 Senior unsecured term loan (3) | | 3.23 | | 1/31/2019 | | 1/31/2019 | | | 100,000 | | | 100,000 | |
2020 Senior unsecured term loan (4) | | 2.48 | | 6/24/2020 | | 6/24/2020 | | | 150,000 | | | 150,000 | |
2021 Senior unsecured term loan (2) | | 2.03 | | 2/2/2021 | | 2/2/2021 | | | 100,000 | | | — | |
2023 Senior unsecured notes | | 4.19 | | 6/15/2023 | | 6/15/2023 | | | 150,000 | | | — | |
Total principal debt outstanding | | | | | | | | | 594,750 | | | 392,250 | |
Unamortized deferred financing costs | | | | | | | | | (3,758) | | | (1,243) | |
Total debt | | | | | | | | $ | 590,992 | | $ | 391,007 | |
Weighted average interest rate | | 2.90 | % | | | | | | | | | | |
| | | | | | | | | | | | | |
Preferred stock | | 7.25 | % | N/A | | N/A | | $ | 115,000 | | $ | 115,000 | |
Total debt and preferred stock | | | | | | | | $ | 705,992 | | $ | 506,007 | |
| | | | | | | | | | | | | |
Floating rate vs. fixed rate debt | | | | | | | | | 45% / 55% | | | 55% / 45% | |
Floating rate vs. fixed rate debt and preferred stock | | | | | | | | | 38% / 62% | | | 43% / 57% | |
| (1) | | See the most recently filed Form 10-K and 10-Q for information on specific debt instruments. |
| (2) | | The revolving credit facility and 2021 senior unsecured term loan interest rates are based on 1-month LIBOR at September 30, 2016, plus applicable spread. |
| (3) | | Represents the effective interest rate as a result of the interest rate swap associated with $100 million in 1-month LIBOR variable rate debt. |
| (4) | | Represents the effective interest rate as a result of the interest rate swap associated with $75 million in 1-month LIBOR variable rate debt and $75 million unhedged debt based on 1-month LIBOR plus applicable spread. |
|
Quarter Ended September 30, 2016 |
| |

| 22 |
Interest Summary and Debt Covenants
(in thousands)
|
Interest Expense Components |
| | | | | | | | | | | | | | | | |
| | Three Months Ended | Nine Months Ended | |
| | September 30, 2016 | | June 30,
2016 | | September 30, 2015 | | September 30, 2016 | | September 30, 2015 | |
Interest expense and fees | | $ | 4,432 | | $ | 3,245 | | $ | 2,392 | | $ | 10,491 | | $ | 7,083 | |
Amortization of deferred financing costs | | | 370 | | | 311 | | | 413 | | | 964 | | | 999 | |
Capitalized interest | | | (1,580) | | | (876) | | | (617) | | | (3,541) | | | (2,899) | |
Total interest expense | | $ | 3,222 | | $ | 2,680 | | $ | 2,188 | | $ | 7,914 | | $ | 5,183 | |
| | | | | | | | | | | | | | | | |
Percent capitalized | | | 32.9 | % | | 24.6 | % | | 22.0 | % | | 30.9 | % | | 35.9 | % |
| | | | | | | | | | | | | | | | | | |
| | Revolving Credit Facility and Senior Unsecured Term Loans | |
| | Required Compliance | | September 30,
2016 | | June 30,
2016 | | March 31,
2016 | | December 31,
2015 | | September 30,
2015 | |
| | | | | | | | | | | | | | | | | | |
Fixed charge coverage ratio | | Greater than 1.70x | | | 8.1 | x | | 9.7 | x | | 9.8 | x | | 10.1 | x | | 9.3 | x |
Total indebtedness to gross asset value | | Less than 60% | | | 20.7 | % | | 18.2 | % | | 20.3 | % | | 16.7 | % | | 17.5 | % |
Secured debt to gross asset value | | Less than 40% | | | — | % | | — | % | | — | % | | — | % | | — | % |
Unhedged variable rate debt to gross asset value | | Less than 30% | | | 9.3 | % | | 6.3 | % | | 11.1 | % | | 8.9 | % | | 8.4 | % |
| | | | | | | | | | | | | | | | | | |
Revolving credit facility availability | | | | $ | 350,000 | | $ | 350,000 | | $ | 350,000 | | $ | 350,000 | | $ | 350,000 | |
Borrowings outstanding | | | | | (94,750) | | | — | | | (111,000) | | | (142,250) | | | (110,250) | |
Outstanding letters of credit | | | | | (4,480) | | | (4,480) | | | (5,480) | | | (6,330) | | | (6,330) | |
Current availability | | | | $ | 250,770 | | $ | 345,520 | | $ | 233,520 | | $ | 201,420 | | $ | 233,420 | |
|
Quarter Ended September 30, 2016 |
| |
| 23 |
Components of Net Asset Value (NAV)
(in thousands)
|
Cash Net Operating Income |
| | | | | | |
Reconciliation of Net Operating Income (NOI) | | Q3 2016 | | Annualized |
Operating Income | | $ | 22,505 | | $ | 90,020 |
Adjustments: | | | | | | |
Depreciation and amortization | | | 26,981 | | | 107,924 |
General and administrative (includes litigation expenses) | | | 9,432 | | | 37,728 |
Transaction costs | | | 117 | | | 468 |
Net Operating Income | | $ | 59,035 | | $ | 236,140 |
| | | | | | |
Cash Net Operating Income (Cash NOI) | | | | | | |
Net Operating Income | | $ | 59,035 | | $ | 236,140 |
Adjustments: | | | | | | |
Straight-line rent | | | (433) | | | (1,732) |
Amortization of above and below-market leases | | | (141) | | | (564) |
Cash NOI | | $ | 58,461 | | $ | 233,844 |
| | | | | | |
Cash NOI with backlog (87.0% leased)(1) | | $ | 60,906 | | $ | 243,624 |
Cash stabilized NOI (93% leased) | | $ | 65,106 | | $ | 260,424 |
| | | | | | |
Data Center Projects Under Construction | | | | | | |
TKD construction in progress(2) | | $ | 210,544 | | | |
Remaining spend(2) | | | 14,956 | | | |
Total | | $ | 225,500 | | | |
| | | | | | |
Targeted annual yields | | | 12 - 16 | % | | |
Annualized pro forma NOI range | | $ | 27,000 - 36,000 | | | |
| | | | | | |
Deferred Expansion Capital in progress | | $ | 10,408 | | | |
Remaining spend(3) | | | 16,092 | | | |
Total | | $ | 26,500 | | | |
|
Other Assets and Liabilities |
| | | | | | |
Other Assets | | | | | | |
Remaining construction in progress(4) | | $ | 51,976 | | | |
Cash and cash equivalents | | | 6,296 | | | |
Accounts and other receivables | | | 16,103 | | | |
Other tangible assets | | | 25,237 | | | |
Total other assets | | $ | 99,612 | | | |
| | | | | | |
Liabilities | | | | | | |
Principal debt | | $ | 594,750 | | | |
Accounts payable, accrued and other liabilities | | | 119,573 | | | |
Accrued dividends and distributions | | | 28,630 | | | |
Preferred equity | | | 115,000 | | | |
Total liabilities | | $ | 857,953 | | | |
| | | | | | |
Weighted average common shares and units - diluted | | | 47,763 | | | |
| (1) | | Cash NOI with backlog is adjusted to include one quarter of the cash backlog as of September 30, 2016, less any leasing of currently occupied NRSF and data center projects under development. |
| (2) | | Does not include spend associated with leasing commissions. See page 20 for further breakdown of data center projects under construction. |
| (3) | | Does not include spend associated with future Deferred Expansion Capital. |
| (4) | | Represents the book value of in progress capital projects, including land and shell building, of future data center expansion, non-recurring investments, tenant improvements and recurring capital expenditures. |
|
Quarter Ended September 30, 2016 |
| |

| 24 |
2016 Guidance
(in thousands, except per share amounts)
The annual guidance provided below represents forward-looking projections, which are based on current economic conditions, internal assumptions about our existing customer base and the supply and demand dynamics of the markets in which we operate. Please refer to the press release for additional information on forward-looking statements.
| | | | | | | | | | | | | | | | |
Projected per share and OP unit information: | | | | | 2016 | | | | | | | | | Implied | |
| | Low | | High | | Mid | | | 2015 | | Growth(1) | |
Net income attributable to common shares | | $ | 1.46 | | $ | 1.50 | | $ | 1.48 | | | $ | 1.03 | | 43.7 | % |
Real estate depreciation and amortization | | | 2.15 | | | 2.15 | | | 2.15 | | | | 1.83 | | | |
FFO | | $ | 3.61 | | $ | 3.65 | | $ | 3.63 | | | $ | 2.86 | | 26.9 | % |
| | | | | | | | | | | | | | | | |
Projected operating results: | | | | | | | | | | | | | | | | |
Total operating revenues | | $ | 396,000 | | $ | 400,000 | | $ | 398,000 | | | $ | 333,292 | | 19.4 | % |
General and administrative expenses | | | 35,000 | | | 37,000 | | | 36,000 | | | | 34,179 | | 5.3 | % |
Adjusted EBITDA | | | 208,000 | | | 212,000 | | | 210,000 | | | | 169,903 | | 23.6 | % |
| | | | | | | | | | | | | | | | |
Guidance drivers: | | | | | | | | | | | | | | | | |
Annual rental churn rate | | | 6.5 | % | | 8.5 | % | | 7.5 | % | | | 7.5 | % | | |
Cash rent growth on data center renewals | | | 3.0 | % | | 5.0 | % | | 4.0 | % | | | 4.6 | % | | |
| | | | | | | | | | | | | | | | |
Capital expenditures: | | | | | | | | | | | | | | | | |
Data center expansion | | $ | 302,500 | | $ | 332,500 | | $ | 317,500 | | | $ | 132,786 | | | |
Non-recurring investments | | | 10,000 | | | 15,000 | | | 12,500 | | | | 9,971 | | | |
Tenant improvements | | | 5,000 | | | 10,000 | | | 7,500 | | | | 8,037 | | | |
Recurring capital expenditures | | | 5,000 | | | 10,000 | | | 7,500 | | | | 5,828 | | | |
Total capital expenditures | | $ | 322,500 | | $ | 367,500 | | $ | 345,000 | | | $ | 156,622 | | | |
| (1) | | Implied growth is based on the midpoint of 2016 guidance. |
|
Quarter Ended September 30, 2016 |
| |

| 25 |
Appendix
Definitions
This document includes certain non-GAAP financial measures that management believes are helpful in understanding our business, as further described below. Our definition and calculation of non-GAAP financial measures may differ from those of other Real Estate Investment Trusts (“REITs”) and therefore may not be comparable. The non-GAAP measures should not be considered an alternative to net income as an indicator of our performance and should be considered only a supplement to net income, cash flows from operating, investing or financing activities as measures of profitability and/or liquidity, computed in accordance with GAAP.
Adjusted Funds From Operations “AFFO” is a non-GAAP measure that is used as a supplemental
operating measure specifically for comparing year over year ability to fund dividend distribution from operating activities. We use AFFO as a basis to address our ability to fund our dividend payments. AFFO is calculated by adding to or subtracting from FFO:
| 1. | | Plus: Amortization of deferred financing costs |
| 2. | | Plus: Non-cash compensation |
| 3. | | Plus: Non-real estate depreciation |
| 4. | | Plus: Impairment charges |
| 5. | | Plus: Below market debt amortization |
| 6. | | Less: Straight line rents adjustment |
| 7. | | Less: Amortization of above and below market leases |
| 8. | | Less: Recurring capital expenditures |
| 9. | | Less: Tenant improvements |
| 10. | | Less: Capitalized leasing costs |
Capitalized leasing costs consist of commissions payable to third parties, including brokers, leasing agents, referral agents, and internal sales commissions payable to employees. Capitalized leasing costs are accrued and deducted from AFFO generally in the period the lease is executed. Leasing costs are generally paid a) to third party brokers and internal sales employees 50% at customer lease signing and 50% at lease commencement and b) to referral and leasing agents monthly over the lease term as and to the extent we receive payment from the end customer.
AFFO is not intended to represent cash flow from operations for the period, and is only intended to provide an additional measure of performance by adjusting for the effect of certain items noted above included in FFO. Other REITs widely report AFFO, however, other REITs may use different methodologies for calculating AFFO and, accordingly, our AFFO may not be comparable to other REITs.
Annualized Rent
Monthly contractual rent under existing commenced customer leases as of quarter-end, multiplied by 12. This amount reflects total annualized base rent before any one-time or non-recurring rent abatements and excludes power revenue, interconnection revenue and operating expense reimbursement.
|
Quarter Ended September 30, 2016 |
| |

| 26 |
Appendix
Data Center Leasing Metrics
| · | | Rental Churn Rate – represents data center leases which are not renewed or are terminated during the period. Rental churn is calculated based on the annualized rent of data center expired leases terminated in the period, compared with total portfolio annualized rent at the beginning of the period. |
| · | | Cash and GAAP Rent Growth – represents the increase in rental rates on renewed data center leases signed during the period, as compared with the previous rental rates for the same space. Cash and GAAP rent growth are calculated based on annualized rent from the renewed data center lease compared to annualized rent from the expired data center lease. |
Data Center Net Rentable Square Feet (“NRSF”)
Both occupied and available data center NRSF includes a factor based on management’s estimate of space to account for a customer’s proportionate share of required data center support space (such as the mechanical, telecommunications and utility rooms) and building common areas, which may be updated on a periodic basis to reflect the most current build-out of our properties.
Deferred Expansion Capital
As we construct data center capacity, we work to optimize both the amount of the capital we deploy on power and cooling infrastructure and the timing of that capital deployment; as such, we generally construct our power and cooling infrastructure supporting our data center NRSF based on our estimate of customer utilization. This practice can result in our investment at a later time in Deferred Expansion Capital. We define Deferred Expansion Capital as our estimate of the incremental capital we may invest in the future to add power or cooling infrastructure to support existing or anticipated future customer utilization of NRSF within our operating data centers. From time to time, we may revise our estimate of Deferred Expansion Capital as well as the potential time period during which we may invest it. See the Data Center Projects Under Construction and Held for Development tables on pages 20 and 21, respectively, for more detail.
Earnings before Interest, Taxes, Depreciation and Amortization (EBITDA) and Adjusted EBITDA ���
EBITDA is defined as earnings before interest, taxes, depreciation and amortization. We calculate adjusted EBITDA by adding our non-cash compensation expense, transaction costs and litigation expense to EBITDA as well as adjusting for the impact of impairment charges, gains or losses from sales of property and undepreciated land and gains or losses on early extinguishment of debt. Management uses EBITDA and adjusted EBITDA as indicators of our ability to incur and service debt. In addition, we consider EBITDA and adjusted EBITDA to be appropriate supplemental measures of our performance because they eliminate depreciation and interest, which permits investors to view income from operations without the impact of non-cash depreciation or the cost of debt. However, because EBITDA and adjusted EBITDA are calculated before recurring cash charges including interest expense and taxes, and are not adjusted for capital expenditures or other recurring cash requirements of our business, their utilization as a cash flow measurement is limited.
|
Quarter Ended September 30, 2016 |
| |
| 27 |
Appendix
Funds From Operations (“FFO”) is a supplemental measure of our performance which should be considered
along with, but not as an alternative to, net income and cash provided by operating activities as a measure of operating performance and liquidity. We calculate FFO in accordance with the standards established by the National Association of Real Estate Investment Trusts (“NAREIT”). FFO represents net income (loss) (computed in accordance with GAAP), excluding gains (or losses) from sales of property and undepreciated land and impairment write-downs of depreciable real estate, plus real estate related depreciation and amortization (excluding amortization of deferred financing costs) and after adjustments for unconsolidated partnerships and joint ventures. FFO attributable to common shares and units represents FFO less preferred stock dividends declared during the period.
Our management uses FFO as a supplemental performance measure because, by excluding real estate related depreciation and amortization and gains and losses from property dispositions, it provides a performance measure that, when compared year over year, captures trends in occupancy rates, rental rates and operating costs.
We offer this measure because we recognize that investors use FFO as a basis to compare our operating performance with that of other REITs. However, the utility of FFO as a measure of our performance is limited because FFO excludes depreciation and amortization and captures neither the changes in the value of our properties that result from use or market conditions, nor the level of capital expenditures and capitalized leasing commissions necessary to maintain the operating performance of our properties, all of which have real economic effect and could materially impact our financial condition and results from operations. FFO is a non-GAAP measure and should not be considered a measure of liquidity, an alternative to net income, cash provided by operating activities or any other performance measure determined in accordance with GAAP, nor is it indicative of funds available to fund our cash needs, including our ability to pay dividends or make distributions. In addition, our calculations of FFO are not necessarily comparable to FFO as calculated by other REITs that do not use the same definition or implementation guidelines or interpret the standards differently from us. Investors in our securities should not rely on these measures as a substitute for any GAAP measure, including net income.
Monthly Recurring Revenue per Cabinet Equivalent
Represents the turn-key monthly recurring colocation revenue (“MRR”) per cabinet equivalent billed. We define MRR as recurring contractual revenue under existing commenced customer leases. MRR per cabinet equivalent is calculated as (current quarter MRR/3) divided by ((quarter-end cabinet equivalents billed plus prior quarter-end cabinet equivalents billed)/2). Cabinet equivalents are calculated as cage-usable square feet (turn-key leased NRSF/NRSF factor) divided by 25.
|
Quarter Ended September 30, 2016 |
| |
| 28 |
Appendix
Net Operating Income (“NOI”) and Cash NOI – NOI, and cash NOI are supplemental measures for the operating performance of the company’s portfolio. NOI is operating revenues less operating expenses adjusted for items such as depreciation and amortization, general and administrative expenses, transaction costs and litigation expenses. Cash NOI is NOI less straight-line rents and above and below market rent amortization.
NRSF Held for Development
Represents incremental data center capacity that may be constructed in existing facilities that requires significant capital investment in order to develop new data center facilities. The data represents management's best estimate of incremental costs based on estimated NRSF and power design and are subject to market conditions and build-out specifications and may vary.
NRSF Under Construction
Represents NRSF for which substantial activities are ongoing to prepare the property for its intended use following development. The NRSF reflects managements estimate of engineering drawings and required support space and is subject to change based on final demising of space. Estimated costs of completion are based on actual costs at quarter-end and management’s estimate of remaining projects costs.
Turn-Key Same Store
Includes turn-key data center space that was leased or available to be leased to our colocation customers as of December 31, 2014, at each of our properties, and excludes powered shell data center space, SV3 data center space, office and light-industrial space and space for which development was completed and became available to be leased after December 31, 2014. The turn-key same store space as of December 31, 2014, is 1,149,119 NRSF. We track same store on a computer room basis within each data center facility.
Stabilized and Pre-Stabilized NRSF
Data center projects and facilities that recently have been developed and are in the initial lease-up phase are classified as pre-stabilized NRSF until they reach 85% occupancy or have been in service for 24 months. Pre-stabilized projects and facilities become stabilized operating properties at the earlier of achievement of 85% occupancy or 24 months after development completion and are included in the stabilized operating NRSF.
|
Quarter Ended September 30, 2016 |
| |
| 29 |