
| |

| ONE DATA CENTER PROVIDER. EVERYTHING YOU NEED. |
| ©2019 CoreSite Realty Corporation, All Rights Reserved |
|
Quarter Ended June 30, 2019 |
Company Profile
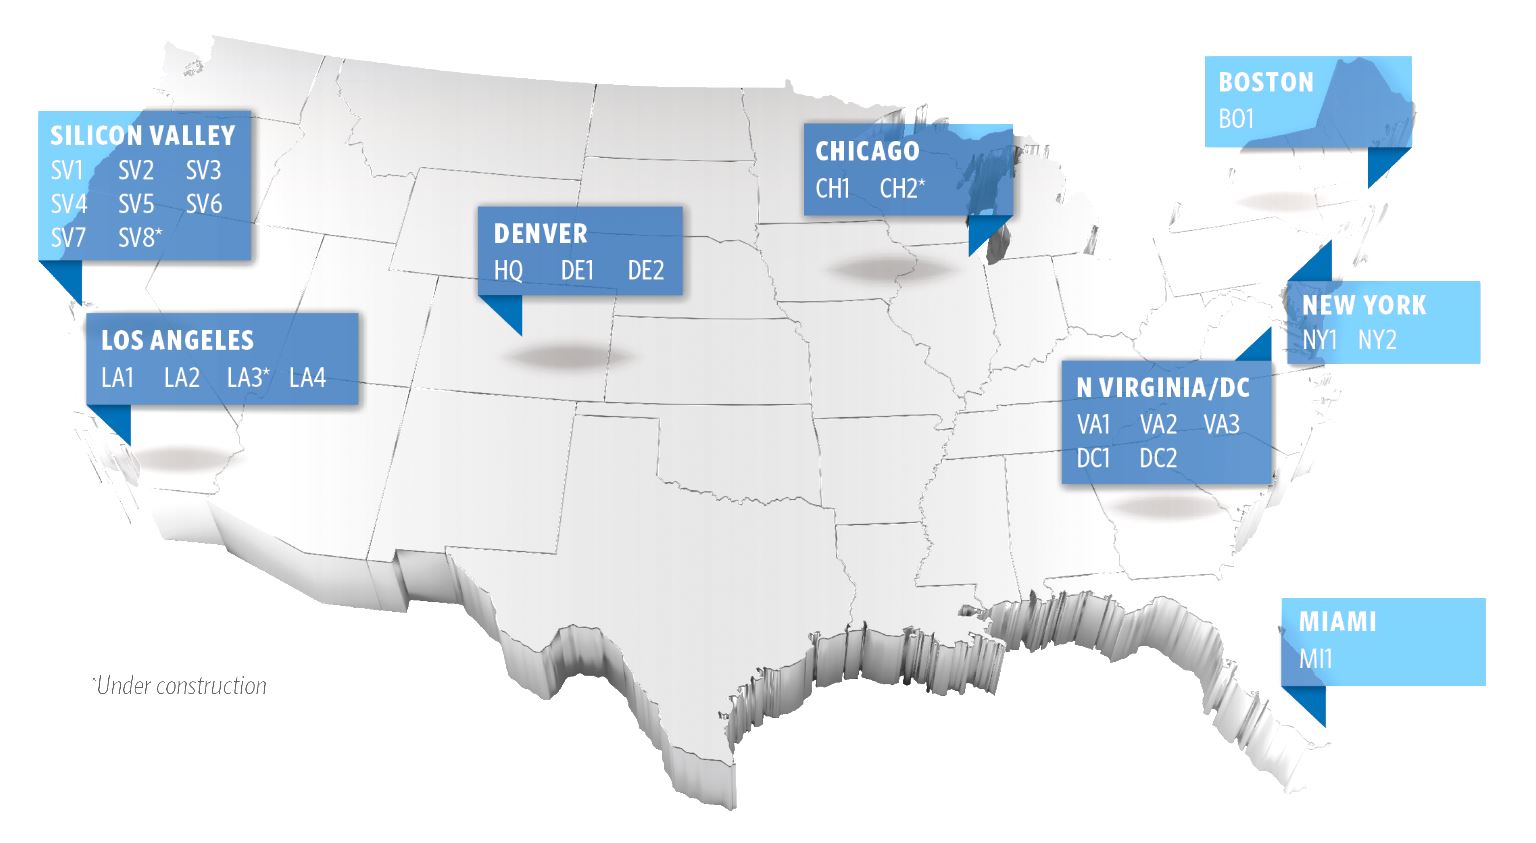
Low-latency, secure and reliable on-premises access to Amazon, Microsoft, Google, Alibaba Cloud, Oracle and IBM from all eight key North American Markets via inter-site connectivity and a robust set of network service providers.
| | | | | |
ONE DATA CENTER PROVIDER. EVERYTHING YOU NEED. |
|
CONNECTIVITY TO NETWORKS AND CLOUDS | | LOW LATENCY, EDGE MARKETS, GLOBAL REACH |
| | |
Connecting to cloud and network providers within the same data center can save thousands of dollars a month in networking and data egress fees while reducing latency. • Optionality to connect to 775+ cloud, IT and network service providers as business needs evolve • 27,000+ interconnections • Peering and cloud exchanges • Direct connections to Amazon, Alibaba, Microsoft, Google, Oracle and IBM cloud services • The CoreSite Interconnect GatewaySM allows customers to rapidly optimize application performance with a 100% managed solution | | The closer a business is to end users, the easier it is to provide a better experience. • 22 operating data centers in eight major metros that provide access to 75% of US businesses within 5 milliseconds • National footprint with international cloud and data center partnerships for multi-market requirements • Subsea cables for international reach |
HIGH GROWTH, HIGH-DENSITY SOLUTIONS | | THE BEST CUSTOMER EXPERIENCE |
| | |
Cloud connectivity is important, and so is the ability for a data center campus to grow as business evolves • The ability to cost-effectively scale from a single cabinet to a large-scale deployment • Data center campuses that connect our buildings via short-run dark fiber to a network/cloud dense campus ecosystem • Flexible and high-density solutions in many markets | | 450+ team dedicated to ensuring optimal data center performance and that the needs of our 1,350+ customers are met, no matter the time of day • Consistent customer satisfaction demonstrated by customer expansion and retention • Dedicated move-in and service representatives, and in-house 24/7 data center operations personnel • 100% uptime Service Level Agreement with six-nines portfolio uptime |
Quarter Ended June 30, 2019 |
Overview | Financial
Statements | Operating
Portfolio | Development | Capital
Structure | Components
of NAV | Guidance | Appendix | 3 |
Summary of Financial Data
(in thousands, except per share, NRSF and MRR data)
| | | | | | | | | | | | | | | | | | | | | |
| | Three Months Ended | | | | | Six Months Ended | | | |
| | June 30, | | March 31, | | June 30, | | Growth % | | June 30, | | June 30, | | Growth % |
Summary of Results | | 2019 | | 2019 | | 2018 | | Y/Y | | 2019 | | 2018 | | Y/Y |
GAAP Financial Measures | | | | | | | | | | | | | | | | | | | | | |
Operating revenues | | $ | 142,906 | | $ | 138,895 | | $ | 136,447 | | 4.7 | % | | $ | 281,801 | | $ | 266,066 | | 5.9 | % |
Net income | | | 25,743 | | | 25,905 | | | 27,279 | | (5.6) | | | | 51,648 | | | 55,845 | | (7.5) | |
Net income attributable to common shares | | | 19,535 | | | 19,661 | | | 19,389 | | 0.8 | | | | 39,196 | | | 39,691 | | (1.2) | |
Net income attributable to common shares per share - diluted | | $ | 0.53 | | $ | 0.54 | | $ | 0.57 | | (7.0) | | | $ | 1.07 | | $ | 1.16 | | (7.8) | |
| | | | | | | | | | | | | | | | | | | | | |
REIT Financial Measures(1) | | | | | | | | | | | | | | | | | | | | | |
Funds from operations (FFO) to shares and units | | $ | 61,316 | | $ | 60,092 | | $ | 61,524 | | (0.3) | % | | $ | 121,408 | | $ | 122,522 | | (0.9) | % |
Adjusted funds from operations (AFFO) | | | 63,303 | | | 60,651 | | | 56,777 | | 11.5 | | | | 123,954 | | | 113,822 | | 8.9 | |
EBITDAre | | | 73,052 | | | 71,079 | | | 71,661 | | 1.9 | | | | 144,131 | | | 141,774 | | 1.7 | |
Adjusted EBITDA | | | 76,669 | | | 74,511 | | | 74,873 | | 2.4 | | | | 151,180 | | | 147,751 | | 2.3 | |
FFO per common share and OP unit - diluted | | $ | 1.27 | | $ | 1.25 | | $ | 1.28 | | (0.8) | | | $ | 2.52 | | $ | 2.55 | | (1.2) | |
| | | | | | | | | | | | | | | | |
| | As of |
| | June 30, | | March 31, | | December 31, | | September 30, | | June 30, | |
| | 2019 | | 2019 | | 2018 | | 2018 | | 2018 | |
| | | | | | | | | | | | | | | | |
Dividend Activity | | | | | | | | | | | | | | | | |
Dividends declared per share and OP unit | | $ | 1.22 | | $ | 1.10 | | $ | 1.10 | | $ | 1.03 | | $ | 1.03 | |
TTM FFO payout ratio | | | 88.8 | % | | 84.9 | % | | 82.1 | % | | 82.6 | % | | 82.3 | % |
TTM AFFO payout ratio | | | 88.6 | % | | 87.1 | % | | 85.8 | % | | 90.0 | % | | 91.0 | % |
| | | | | | | | | | | | | | | | |
Operating Portfolio Statistics | | | | | | | | | | | | | | | | |
Operating data center properties | | | 22 | | | 22 | | | 22 | | | 21 | | | 21 | |
Stabilized data center NRSF | | | 2,277,668 | | | 2,320,538 | | | 2,318,220 | | | 2,318,220 | | | 2,241,335 | |
Stabilized data center NRSF occupied | | | 2,078,752 | | | 2,128,820 | | | 2,151,747 | | | 2,141,455 | | | 2,084,852 | |
Stabilized data center % occupied | | | 91.3 | % | | 91.7 | % | | 92.8 | % | | 92.4 | % | | 93.0 | % |
| | | | | | | | | | | | | | | | |
Turn-Key Data Center ("TKD") Same-Store Statistics | | | | | | | | | | | | | | | | |
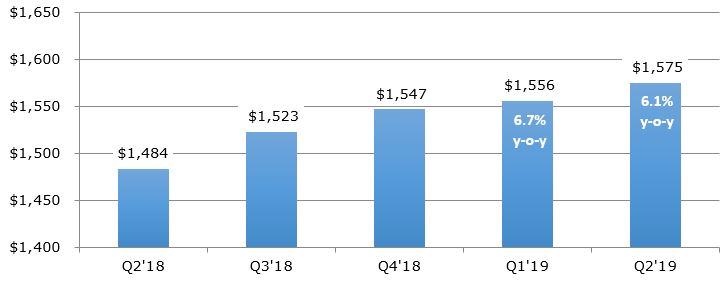
MRR per cabinet equivalent | | $ | 1,575 | | $ | 1,556 | | $ | 1,547 | | $ | 1,523 | | $ | 1,484 | |
TKD NRSF % occupied | | | 88.9 | % | | 89.2 | % | | 90.3 | % | | 89.4 | % | | 89.5 | % |
| | | | | | | | | | | | | | | | |
Market Capitalization & Net Principal Debt | | | | | | | | | | | | | | | | |
Total enterprise value | | $ | 6,895,883 | | $ | 6,401,725 | | $ | 5,345,711 | | $ | 6,445,083 | | $ | 6,388,352 | |
Total net principal debt outstanding | | $ | 1,314,414 | | $ | 1,213,706 | | $ | 1,133,901 | | $ | 1,074,194 | | $ | 1,034,130 | |
| | | | | | | | | | | | | | | | |
Net Principal Debt to: | | | | | | | | | | | | | | | | |
Annualized adjusted EBITDA | | | 4.3 | x | | 4.1 | x | | 3.8 | x | | 3.6 | x | | 3.5 | x |
Enterprise value | | | 19.1 | % | | 19.0 | % | | 21.2 | % | | 16.7 | % | | 16.2 | % |
| | | | | | | | | | | | | | | | |
| (1) | | See reconciliations of non-GAAP measures on page 12 and a discussion of the non-GAAP disclosures in the Appendix. |
Quarter Ended June 30, 2019 |
Overview | Financial
Statements | Operating
Portfolio | Development | Capital
Structure | Components
of NAV | Guidance | Appendix | 4 |
CoreSite Reports Second Quarter 2019 Financial Results
-- Delivered a Record $27.3 Million of New and Expansion Sales for the Quarter --
-- Completed Expansions at LA1, LA2, and VA3 Phase 1B and Began Construction at LA3 --
-- Placed Nearly 100,000 Square Feet into Service --
-- Arranged $400 Million Financing --
DENVER, CO – July 24, 2019 – CoreSite Realty Corporation (NYSE:COR) (“the Company”), a premier provider of secure, reliable, high-performance data center and interconnection solutions across the U.S., today announced financial results for the second quarter ended June 30, 2019.
Q2 Quarterly Highlights
| o | | Grew operating revenues to $142.9 million, an increase of 4.7% year over year and 2.9% sequentially |
| o | | Delivered net income of $0.53 per common diluted share, a decrease of $0.04 year over year and $0.01 sequentially |
| o | | Generated FFO of $1.27 per diluted share and unit, a decrease of $0.01 year over year, and an increase of $0.02 sequentially |
| o | | Commenced 140 new and expansion leases for 65,193 net rentable square feet (“NRSF”), representing $10.2 million of annualized GAAP rent, for an average rate of $176 per square foot |
| o | | Signed 135 new and expansion leases for 142,824 NRSF and $27.3 million of annualized GAAP rent, for an average rate of $191 per square foot |
| o | | Renewed 328 leases for 121,809 NRSF and $24.1 million of annualized GAAP rent, for an average rate of $198 per square foot, reflecting 2.6% cash rent growth, 7.4% GAAP rent growth and 2.4% churn |
Q2 2019 Notable Events
| · | | Finalized Santa Clara Property Purchase and Began Pre-Construction – |
| o | | On April 12th, closed SV9 land purchase, suitable for a data center facility of at least 200,000 NRSF |
| o | | As of June 30th, began pre-construction, including environmental permitting and other processes |
| · | | Executed a Pre-Lease at new Santa Clara Data Center and Advanced Construction – |
| o | | On April 15th, a pre-lease was executed for Phases 1 and 2 at SV8, for approximately 108,000 NRSF |
| o | | Construction of SV8 is on track to deliver Phase 1 late in Q3 and Phase 2 late in Q4 |
| · | | Arranged Financing and Funding – |
| o | | On April 17th, arranged a $400 million financing and received proceeds of $325 million |
| o | | On July 17th, received the remaining proceeds of $75 million |
“We continued to execute on our 2019 imperatives to accelerate growth in 2020 and beyond,” said Paul Szurek, CoreSite’s President and Chief Executive Officer. “We completed projects in our property development pipeline, delivering nearly 100,000 square feet of data center capacity, and began construction for our new ground-up purpose-built data center in Los Angeles. We also achieved a strong and well rounded sales quarter, with solid core retail colocation sales, strong new logo expansion, supplemented by a large pre-lease at our new SV8 data center and other scale leasing. We believe these accomplishments significantly advance us toward our goal of sustainably accelerating revenue growth in 2020 and beyond.”
|
Quarter Ended June 30, 2019 |
Overview | Financial
Statements | Operating
Portfolio | Development | Capital
Structure | Components
of NAV | Guidance | Appendix | 5 |
Sales Activity
CoreSite achieved new and expansion sales of $27.3 million of annualized GAAP rent for the quarter. This included $5.3 million of core retail colocation sales and $22.0 million of scale leasing, including a hyper scale pre-lease of SV8 Phases 1 and 2. Pricing across all sales categories was solid, with continued expansion with strategic customers and strength in new logo acquisitions.
“Our sales team achieved solid results in our core retail colocation activity across our portfolio as well as winning new scale leasing,” said Maile Kaiser, Senior Vice President of Sales at CoreSite. “We are well positioned to continue to compete for retail colocation and new logos due to our connected campuses, rich ecosystems, industry-leading uptime and data center operations, and our ability to serve the network edge for new and future applications. Along with our ongoing property development and additional capacity coming online this year and next, we also expect to compete for larger scale opportunities for those customers who value and enrich our ecosystem.”
Development Activity
CoreSite continues to execute on its property development pipeline. After entering 2019 with leasable capacity at a lower level than historical norms, the Company plans to exit 2019 with leasable capacity and quickly developable incremental capacity at the higher levels experienced in previous years.
CoreSite’s ongoing data center development and operational position includes –
| o | | the ability to increase its occupied footprint of land and buildings, both owned or leased, by about 2.2 million NRSF, or about 102.1%, including space unoccupied, under construction, pre-construction or held for development, and |
| o | | owning (versus leasing) 92.4% of its current and developable 4.3 million data center NRSF, supporting operational control, expansion and long-term expense management |
Completed Construction
During the second quarter, CoreSite completed construction of its data center expansions at LA1 and LA2 of approximately 17,000 and 28,000 NRSF, respectively. CoreSite also completed construction of about 51,000 NRSF for VA3, Phase 1B, a purpose-built data center on its Reston campus in Northern Virginia.
Under Construction
CoreSite began construction on LA3 Phase 1 in early July, for 51,000 NRSF of a new, ground-up purpose-built data center, planned for a total of 160,000 NRSF. LA3 is adjacent to CoreSite’s existing LA2 building in downtown Los Angeles.
During the second quarter, construction advanced significantly in Santa Clara at SV8, a new ground-up purpose-built data center, after a new pre-lease was signed in April for Phases 1 and 2 of the building. CoreSite expects to complete Phase 1 in late Q3 2019 and Phase 2 in late Q4 2019.
Other Progress
The Company also has begun the environmental permitting and other processes for a new SV9 ground-up purpose-built data center at its Santa Clara campus.
arch |
Quarter Ended June 30, 2019 |
Overview | Financial
Statements | Operating
Portfolio | Development | Capital
Structure | Components
of NAV | Guidance | Appendix | 6 |
As of June 30, 2019, CoreSite had a total of approximately 323,000 NRSF of turn-key data center capacity under construction, with $191 million incurred to date of the $528 million of total estimated costs, as detailed below.
| | | | | | | | | | | | | | | | | | | |
| | | | | | | | | | | | | | | | | | | |
| | | | | | | | | | Costs Incurred | | Estimated | | | | | |
| | | | | | | Estimated | | To-Date | | Total Costs | | | Percent | | |
| Market | | Building | | NRSF | | Completion | | (in millions) | | (in millions) | | | Leased | | |
| | | | | | | | | | | | | | | | | | | |
| Under Construction: | | | | | | | | | | | | | | | | |
| | | | | | | | | | | | | | | | | | | |
| Data center expansion | | | | | | | | | | | | | | | | | | |
| Boston | | BO1 | | 19,961 | | | Q4 2019 | | $ | 1.2 | | $ | 9.0 | | | — | % | |
| New York | | NY2, Phase 3 | | 34,589 | | | 1H 2020 | | | 0.4 | | | 46.0 | | | — | | |
| Total data center expansion | | | | 54,550 | | | | | $ | 1.6 | | $ | 55.0 | | | — | % | |
| | | | | | | | | | | | | | | | | | | |
| New development | | | | | | | | | | | | | | | | | | |
| Chicago | | CH2, Phase 1 | | 56,000 | | | 1H 2020 | | $ | 38.6 | | $ | 120.0 | | | — | % | |
| Los Angeles | | LA3, Phase 1 | | 51,000 | | | 2H 2020 | | | 32.2 | | | 134.0 | | | — | | |
| San Francisco Bay | | SV8, Phase 1 | | 53,953 | | | Q3 2019 | | | 112.4 | | | 133.0 | | | 100.0 | | |
| San Francisco Bay | | SV8, Phase 2 | | 53,728 | | | Q4 2019 | | | 5.9 | | | 44.0 | | | 100.0 | | |
| San Francisco Bay | | SV8, Phase 3 | | 54,056 | | | 1H 2020 | | | — | | | 42.0 | | | — | | |
| Total new development | | | | 268,737 | | | | | $ | 189.1 | | $ | 473.0 | | | 40.1 | % | |
| | | | | | | | | | | | | | | | | | | |
| Total under construction | | | | 323,287 | | | | | $ | 190.7 | | $ | 528.0 | | | 33.3 | % | |
| | | | | | | | | | | | | | | | | | | |
Other Financial Results
CoreSite’s $142.9 million of operating revenues for the second quarter included $121.1 million of rental, power and related revenue, $18.8 million of interconnection revenue and $3.0 million of office, light-industrial and other revenue. Net income was $25.7 million for the second quarter, or $0.53 attributable to each common diluted share.
Balance Sheet, Financing and Liquidity
On April 17, the Company’s Operating Partnership entered into a note purchase agreement to issue and sell an aggregate principal amount of $200 million of 4.11% Series A Senior Notes due April 17, 2026, and $200 million of 4.31% Series B Senior Notes due April 17, 2029. Initial proceeds of $325 million were received on April 17, with the remaining $75 million proceeds received on July 17.
The Operating Partnership used the proceeds to pay down outstanding amounts on the revolving portion of its senior unsecured credit facility.
CoreSite expects to use its liquidity of $456 million, which includes credit available under the revolving credit facility, senior notes and cash as of quarter end, primarily to fund the estimated $337 million of remaining current development pipeline costs.
Financial Guidance
The Company’s outlook is based on current economic conditions, internal assumptions about its customer base, and the supply and demand dynamics of the markets in which it operates. The guidance does not include the impact of any future financing, investment or disposition activities, beyond what has already been disclosed.
arch |
Quarter Ended June 30, 2019 |
Overview | Financial
Statements | Operating
Portfolio | Development | Capital
Structure | Components
of NAV | Guidance | Appendix | 7 |
“We reported record sales in the second quarter, kept our property development and construction on track, and closed a successful financing,” said Jeff Finnin, CoreSite’s Chief Financial Officer. “Offsetting these positive accomplishments, whose momentum we expect to continue in the second half of the year, are the timing of our commencements, recent elevated churn in three markets, the previously identified current market softness in Northern Virginia for scale and hyperscale leasing, and elevated levels of legal costs, that will mute our results for the full year. Despite these headwinds, our business fundamentals are strong, and we will continue to focus on our goal to accelerate growth in 2020 and beyond.”
The Company also experienced elevated legal costs in the second quarter. The impact on a diluted basis per common share and OP unit, was $0.04 for the quarter, and the Company expects $0.09 for the full year.
The Company is revising its 2019 guidance to the following:
(Dollars in thousands, except for per share data)
| · | | Total operating revenues $570,000 to $580,000 |
| · | | Net Income $98,000 to $103,000 |
| · | | Adjusted EBITDA $306,000 to $311,000 |
| · | | Net income per common share, diluted$2.04 to $2.10 |
| · | | FFO per common share and OP unit, diluted$5.07 to $5.13 |
| · | | Annual rental churn rate9% to 11% |
For additional details on the Company’s 2019 guidance, please see page 23 of CoreSite’s Supplemental Information and listen to the scheduled earnings call.
Conference Call Details
CoreSite will host its second quarter 2019 earnings call on Thursday, July 25, 2019, at 12:00 p.m. (Eastern Time). The call will be accessible by dialing 1-877-407-3982 (domestic) or 1-201-493-6780 (international). A replay will be available until August 9, 2019, and can be accessed shortly after the call by dialing 1-844-512-2921 (domestic) or 1-412-317-6671 (international). The passcode for the replay is 13691787. The quarterly conference call also will be offered as a simultaneous webcast, accessible by visiting CoreSite.com and clicking on the “Investors” link. An on-line replay will be available for a limited time immediately following the call.
Concurrently with issuing its financial results, the Company will post its second quarter 2019 Supplemental Information on its website at CoreSite.com, under the “Investors” link.
About CoreSite
CoreSite Realty Corporation (NYSE:COR) delivers secure, reliable, high-performance data center and interconnection solutions to a growing customer ecosystem across eight key North American markets. More than 1,350 of the world’s leading enterprises, network operators, cloud providers, and supporting service providers choose CoreSite to connect, protect and optimize their performance-sensitive data, applications and computing workloads. Our scalable, flexible solutions and 450+ dedicated employees consistently deliver unmatched data center options — all of which leads to a best-in-class customer experience and lasting relationships. For more information, visit www.CoreSite.com.
CoreSite Contact
Carole Jorgensen
Vice President Investor Relations and Corporate Communications
303-405-1012
InvestorRelations@CoreSite.com
arch |
Quarter Ended June 30, 2019 |
Overview | Financial
Statements | Operating
Portfolio | Development | Capital
Structure | Components
of NAV | Guidance | Appendix | 8 |
Forward Looking Statements
This earnings release and accompanying supplemental information may contain forward-looking statements within the meaning of the federal securities laws. Forward-looking statements relate to expectations, beliefs, projections, future plans and strategies, anticipated events or trends and similar expressions concerning matters that are not historical facts. In some cases, you can identify forward-looking statements by the use of forward-looking terminology such as “believes,” “expects,” “may,” “will,” “should,” “seeks,” “approximately,” “intends,” “plans,” “pro forma,” “estimates” or “anticipates” or the negative of these words and phrases or similar words or phrases that are predictions of or indicate future events or trends and that do not relate solely to historical matters. Forward-looking statements involve known and unknown risks, uncertainties, assumptions and contingencies, many of which are beyond CoreSite’s control that may cause actual results to differ significantly from those expressed in any forward-looking statement. These risks include, without limitation: the geographic concentration of the Company’s data centers in certain markets and any adverse developments in local economic conditions or the amount of supply of or demand for data center space in these markets; fluctuations in interest rates and increased operating costs; difficulties in identifying properties to acquire and completing acquisitions; significant industry competition, including indirect competition from cloud service providers; failure to obtain necessary outside financing; the ability to service existing debt; the failure to qualify or maintain its status as a REIT; financial market fluctuations; changes in real estate and zoning laws and increases in real property tax rates; and other factors affecting the real estate industry generally. All forward-looking statements reflect the Company’s good faith beliefs, assumptions and expectations, but they are not guarantees of future performance. Furthermore, the Company disclaims any obligation to publicly update or revise any forward-looking statement to reflect changes in underlying assumptions or factors, of new information, data or methods, future events or other changes. For a further discussion of these and other factors that could cause the Company’s future results to differ materially from any forward-looking statements, see the section entitled “Risk Factors” in its most recent annual report on Form 10-K, and other risks described in documents subsequently filed by the Company from time to time with the Securities and Exchange Commission.
arch |
Quarter Ended June 30, 2019 |
Overview | Financial
Statements | Operating
Portfolio | Development | Capital
Structure | Components
of NAV | Guidance | Appendix | 9 |
Consolidated Balance Sheets
(in thousands, except per share data)
| | | | | | | |
| | June 30, | | December 31, | |
| | 2019 | | 2018 | |
Assets: | | | | | | | |
Investments in real estate: | | | | | | | |
Land | | $ | 87,765 | | $ | 86,955 | |
Buildings and improvements | | | 1,822,252 | | | 1,730,329 | |
| | | 1,910,017 | | | 1,817,284 | |
Less: Accumulated depreciation and amortization | | | (653,177) | | | (590,784) | |
Net investment in operating properties | | | 1,256,840 | | | 1,226,500 | |
Construction in progress | | | 386,226 | | | 265,921 | |
Net investments in real estate | | | 1,643,066 | | | 1,492,421 | |
Operating lease right-of-use assets, net | | | 181,270 | | | 190,304 | |
Cash and cash equivalents | | | 2,836 | | | 2,599 | |
Accounts and other receivables, net | | | 29,758 | | | 18,464 | |
Lease intangibles, net | | | 5,694 | | | 6,943 | |
Goodwill | | | 40,646 | | | 40,646 | |
Other assets, net | | | 98,174 | | | 102,290 | |
Total assets | | $ | 2,001,444 | | $ | 1,853,667 | |
| | | | | | | |
Liabilities and equity: | | | | | | | |
Liabilities | | | | | | | |
Debt, net | | $ | 1,310,114 | | $ | 1,130,823 | |
Operating lease liabilities | | | 194,893 | | | 202,699 | |
Accounts payable and accrued expenses | | | 122,251 | | | 89,315 | |
Accrued dividends and distributions | | | 61,332 | | | 55,679 | |
Acquired below-market lease contracts, net | | | 2,629 | | | 2,846 | |
Unearned revenue, prepaid rent and other liabilities | | | 34,102 | | | 37,672 | |
Total liabilities | | | 1,725,321 | | | 1,519,034 | |
| | | | | | | |
Stockholders' equity | | | | | | | |
Common stock, par value $0.01 | | | 364 | | | 363 | |
Additional paid-in capital | | | 498,828 | | | 491,314 | |
Accumulated other comprehensive loss | | | (6,235) | | | (2,193) | |
Distributions in excess of net income | | | (293,209) | | | (246,929) | |
Total stockholders' equity | | | 199,748 | | | 242,555 | |
Noncontrolling interests | | | 76,375 | | | 92,078 | |
Total equity | | | 276,123 | | | 334,633 | |
Total liabilities and equity | | $ | 2,001,444 | | $ | 1,853,667 | |
Quarter Ended June 30, 2019 |
Overview | Financial
Statements | Operating
Portfolio | Development | Capital
Structure | Components
of NAV | Guidance | Appendix | 10 |
Consolidated Statements of Operations
(in thousands, except per share data)
| | | | | | | | | | | | | | | | |
| | Three Months Ended | | | Six Months Ended |
| | June 30, | | March 31, | | June 30, | | | June 30, | | June 30, |
| | 2019 | | 2019 | | 2018 | | | 2019 | | 2018 |
Operating revenues: | | | | | | | | | | | | | | | | |
Data center revenue:(1) | | | | | | | | | | | | | | | | |
Rental, power, and related revenue | | $ | 121,083 | | $ | 117,853 | | $ | 116,147 | | | $ | 238,936 | | $ | 226,155 |
Interconnection revenue | | | 18,776 | | | 18,416 | | | 17,422 | | | | 37,192 | | | 33,982 |
Total data center revenue | | | 139,859 | | | 136,269 | | | 133,569 | | | | 276,128 | | | 260,137 |
Office, light-industrial and other revenue | | | 3,047 | | | 2,626 | | | 2,878 | | | | 5,673 | | | 5,929 |
Total operating revenues | | | 142,906 | | | 138,895 | | | 136,447 | | | | 281,801 | | | 266,066 |
| | | | | | | | | | | | | | | | |
Operating expenses: | | | | | | | | | | | | | | | | |
Property operating and maintenance | | | 38,067 | | | 38,110 | | | 37,861 | | | | 76,177 | | | 71,709 |
Real estate taxes and insurance | | | 5,988 | | | 6,196 | | | 4,693 | | | | 12,184 | | | 9,630 |
Depreciation and amortization | | | 36,996 | | | 35,646 | | | 35,558 | | | | 72,642 | | | 69,334 |
Sales and marketing | | | 5,784 | | | 5,652 | | | 5,369 | | | | 11,436 | | | 10,449 |
General and administrative | | | 12,282 | | | 10,170 | | | 10,297 | | | | 22,452 | | | 19,482 |
Rent | | | 7,733 | | | 7,688 | | | 6,547 | | | | 15,421 | | | 12,947 |
Transaction costs | | | — | | | — | | | 19 | | | | — | | | 75 |
Total operating expenses | | | 106,850 | | | 103,462 | | | 100,344 | | | | 210,312 | | | 193,626 |
Operating income | | | 36,056 | | | 35,433 | | | 36,103 | | | | 71,489 | | | 72,440 |
Interest expense | | | (10,311) | | | (9,498) | | | (8,907) | | | | (19,809) | | | (16,645) |
Income before income taxes | | | 25,745 | | | 25,935 | | | 27,196 | | | | 51,680 | | | 55,795 |
Income tax (expense) benefit | | | (2) | | | (30) | | | 83 | | | | (32) | | | 50 |
Net income | | | 25,743 | | | 25,905 | | | 27,279 | | | | 51,648 | | | 55,845 |
Net income attributable to noncontrolling interests | | | 6,208 | | | 6,244 | | | 7,890 | | | | 12,452 | | | 16,154 |
Net income attributable to common shares | | $ | 19,535 | | $ | 19,661 | | $ | 19,389 | | | $ | 39,196 | | $ | 39,691 |
| | | | | | | | | | | | | | | | |
Net income per share attributable to common shares: | | | | | | | | | | | | | | | | |
Basic | | $ | 0.54 | | $ | 0.54 | | $ | 0.57 | | | $ | 1.08 | | $ | 1.17 |
Diluted | | $ | 0.53 | | $ | 0.54 | | $ | 0.57 | | | $ | 1.07 | | $ | 1.16 |
| | | | | | | | | | | | | | | | |
Weighted average common shares outstanding: | | | | | | | | | | | | | | | | |
Basic | | | 36,463 | | | 36,348 | | | 34,049 | | | | 36,406 | | | 33,993 |
Diluted | | | 36,619 | | | 36,547 | | | 34,220 | | | | 36,581 | | | 34,183 |
| (1) | | During 2018, the Financial Accounting Standards Board (“FASB”) issued updates to the new lease accounting standard. As a result of the updates we have combined contractual data center rental, power, and tenant reimbursements and other revenue into a single line item as shown below: |
| | | | | | | | | | | | | | | | |
| | Three Months Ended | | | Six Months Ended |
| | June 30, | | March 31, | | June 30, | | | June 30, | | June 30, |
| | 2019 | | 2019 | | 2018 | | | 2019 | | 2018 |
Rental revenue | | $ | 76,529 | | $ | 74,930 | | $ | 74,143 | | | $ | 151,460 | | $ | 145,176 |
Power revenue | | | 41,316 | | | 40,503 | | | 38,986 | | | | 81,818 | | | 75,389 |
Tenant reimbursement and other | | | 3,238 | | | 2,420 | | | 3,018 | | | | 5,658 | | | 5,590 |
Rental, power, and related revenue | | $ | 121,083 | | $ | 117,853 | | $ | 116,147 | | | $ | 238,936 | | $ | 226,155 |
Quarter Ended June 30, 2019 |
Overview | Financial
Statements | Operating
Portfolio | Development | Capital
Structure | Components
of NAV | Guidance | Appendix | 11 |
Reconciliations of Net Income to FFO, AFFO, EBITDAre and Adjusted EBITDA
(in thousands, except per share data)
|
Reconciliation of Net Income to FFO |
| | | | | | | | | | | | | | | | | |
| | Three Months Ended | | | Six Months Ended | |
| | June 30, | | March 31, | | June 30, | | | June 30, | | June 30, | |
| | 2019 | | 2019 | | 2018 | | | 2019 | | 2018 | |
Net income | | $ | 25,743 | | $ | 25,905 | | $ | 27,279 | | | $ | 51,648 | | $ | 55,845 | |
Real estate depreciation and amortization | | | 35,573 | | | 34,187 | | | 34,245 | | | | 69,760 | | | 66,677 | |
FFO available to common shareholders and OP unit holders | | $ | 61,316 | | $ | 60,092 | | $ | 61,524 | | | $ | 121,408 | | $ | 122,522 | |
| | | | | | | | | | | | | | | | | |
Weighted average common shares outstanding - diluted | | | 36,619 | | | 36,547 | | | 34,220 | | | | 36,581 | | | 34,183 | |
Weighted average OP units outstanding - diluted | | | 11,599 | | | 11,600 | | | 13,829 | | | | 11,600 | | | 13,832 | |
Total weighted average shares and units outstanding - diluted | | | 48,218 | | | 48,147 | | | 48,049 | | | | 48,181 | | | 48,015 | |
| | | | | | | | | | | | | | | | | |
FFO per common share and OP unit - diluted | | $ | 1.27 | | $ | 1.25 | | $ | 1.28 | | | $ | 2.52 | | $ | 2.55 | |
|
Reconciliation of FFO to AFFO |
| | | | | | | | | | | | | | | | | |
| | Three Months Ended | | | Six Months Ended | |
| | June 30, | | March 31, | | June 30, | | | June 30, | | June 30, | |
| | 2019 | | 2019 | | 2018 | | | 2019 | | 2018 | |
FFO available to common shareholders and unit holders | | $ | 61,316 | | $ | 60,092 | | $ | 61,524 | | | $ | 121,408 | | $ | 122,522 | |
| | | | | | | | | | | | | | | | | |
Adjustments: | | | | | | | | | | | | | | | | | |
Amortization of deferred financing costs and hedge amortization | | | 856 | | | 611 | | | 553 | | | | 1,467 | | | 1,119 | |
Non-cash compensation | | | 3,617 | | | 3,432 | | | 3,186 | | | | 7,049 | | | 5,812 | |
Non-real estate depreciation | | | 1,423 | | | 1,459 | | | 1,313 | | | | 2,882 | | | 2,657 | |
Straight-line rent adjustment | | | 1,710 | | | 1,250 | | | (1,614) | | | | 2,960 | | | (3,064) | |
Amortization of above and below market leases | | | (86) | | | (86) | | | (164) | | | | (172) | | | (339) | |
Recurring capital expenditures(1) | | | 672 | | | (2,243) | | | (3,651) | | | | (1,571) | | | (6,823) | |
Tenant improvements | | | (997) | | | (1,096) | | | (1,456) | | | | (2,093) | | | (2,893) | |
Capitalized leasing costs | | | (5,208) | | | (2,768) | | | (2,914) | | | | (7,976) | | | (5,169) | |
AFFO available to common shareholders and OP unit holders | | $ | 63,303 | | $ | 60,651 | | $ | 56,777 | | | $ | 123,954 | | $ | 113,822 | |
| (1) | | Recurring capital expenditures for the three and six months ended June 30, 2019, included and, therefore, is reduced due to a $1.7 million energy efficiency rebate received from the power utility related to the replacement of our chiller plant at LA2. |
|
Reconciliation of Net Income to EBITDAre and Adjusted EBITDA |
| | | | | | | | | | | | | | | | | |
| | Three Months Ended | | | Six Months Ended | |
| | June 30, | | March 31, | | June 30, | | | June 30, | | June 30, | |
| | 2019 | | 2019 | | 2018 | | | 2019 | | 2018 | |
Net income | | $ | 25,743 | | $ | 25,905 | | $ | 27,279 | | | $ | 51,648 | | $ | 55,845 | |
Adjustments: | | | | | | | | | | | | | | | | | |
Interest expense | | | 10,311 | | | 9,498 | | | 8,907 | | | | 19,809 | | | 16,645 | |
Income taxes | | | 2 | | | 30 | | | (83) | | | | 32 | | | (50) | |
Depreciation and amortization | | | 36,996 | | | 35,646 | | | 35,558 | | | | 72,642 | | | 69,334 | |
EBITDAre | | $ | 73,052 | | $ | 71,079 | | $ | 71,661 | | | $ | 144,131 | | $ | 141,774 | |
Non-cash compensation | | | 3,617 | | | 3,432 | | | 3,186 | | | | 7,049 | | | 5,812 | |
Transaction costs / litigation | | | — | | | — | | | 26 | | | | — | | | 165 | |
Adjusted EBITDA | | $ | 76,669 | | $ | 74,511 | | $ | 74,873 | | | $ | 151,180 | | $ | 147,751 | |
For additional discussion of these non-GAAP measures, see the Appendix starting on page 24.
Quarter Ended June 30, 2019 |
Overview | Financial
Statements | Operating
Portfolio | Development | Capital
Structure | Components
of NAV | Guidance | Appendix | 12 |
Operating Properties
| | | | | | | | | | | | | | | | | | | | | | |
| | Data Center Operating NRSF | | | | | | | |
| | Annualized | | Stabilized | | Pre-Stabilized | | Total | | | | Held for | | | |
| | Rent | | | | Percent | | | | Percent | | | | Percent | | NRSF Under | | Development | | | |
Market / Facilities | | ($000)(1) | | Total | | Occupied(2) | | Total | | Occupied(2) | | Total | | Occupied(2) | | Construction | | NRSF | | Total NRSF | |
| | | | | | | | | | | | | | | | | | | | | | |
San Francisco Bay | | | | | | | | | | | | | | | | | | | | | | |
SV1 | | $ | 6,600 | | 88,251 | | 77.9 | % | — | | — | % | 88,251 | | 77.9 | % | — | | — | | 88,251 | |
SV2 | | | 7,549 | | 76,676 | | 88.0 | | — | | — | | 76,676 | | 88.0 | | — | | — | | 76,676 | |
Santa Clara campus(3) (SV3 – SV9) | | | 74,588 | | 615,500 | | 95.3 | | — | | — | | 615,500 | | 95.3 | | 161,737 | | 200,000 | | 977,237 | |
San Francisco Bay Total | | | 88,737 | | 780,427 | | 92.6 | | — | | — | | 780,427 | | 92.6 | | 161,737 | | 200,000 | | 1,142,164 | |
| | | | | | | | | | | | | | | | | | | | | | |
Los Angeles | | | | | | | | | | | | | | | | | | | | | | |
One Wilshire campus | | | | | | | | | | | | | | | | | | | | | | |
LA1* | | | 30,843 | | 145,776 | | 97.1 | | 17,238 | | — | | 163,014 | | 86.8 | | — | | 10,352 | | 173,366 | |
LA2 | | | 53,555 | | 384,965 | | 92.5 | | 39,925 | | 23.6 | | 424,890 | | 86.1 | | — | | — | | 424,890 | |
LA3 | | | — | | — | | — | | — | | — | | — | | — | | 51,000 | | 109,000 | | 160,000 | |
LA4* | | | 1,302 | | 21,850 | | 82.7 | | — | | — | | 21,850 | | 82.7 | | — | | — | | 21,850 | |
Los Angeles Total | | | 85,700 | | 552,591 | | 93.4 | | 57,163 | | 16.5 | | 609,754 | | 86.1 | | 51,000 | | 119,352 | | 780,106 | |
| | | | | | | | | | | | | | | | | | | | | | |
Northern Virginia | | | | | | | | | | | | | | | | | | | | | | |
VA1 | | | 25,621 | | 198,632 | | 80.9 | | 3,087 | | — | | 201,719 | | 79.7 | | — | | — | | 201,719 | |
VA2 | | | 22,359 | | 188,446 | | 99.4 | | — | | — | | 188,446 | | 99.4 | | — | | — | | 188,446 | |
VA3 | | | 2,077 | | 52,758 | | 100.0 | | 77,646 | | 4.7 | | 130,404 | | 43.3 | | — | | — | | 130,404 | |
DC1* | | | 3,231 | | 22,137 | | 75.0 | | — | | — | | 22,137 | | 75.0 | | — | | — | | 22,137 | |
DC2* | | | 24 | | — | | — | | 24,563 | | 0.7 | | 24,563 | | 0.7 | | — | | — | | 24,563 | |
Reston Campus Expansion(4) | | | — | | — | | — | | — | | — | | — | | — | | — | | 809,742 | | 809,742 | |
Northern Virginia Total | | | 53,312 | | 461,973 | | 90.3 | | 105,296 | | 3.7 | | 567,269 | | 74.2 | | — | | 809,742 | | 1,377,011 | |
| | | | | | | | | | | | | | | | | | | | | | |
New York | | | | | | | | | | | | | | | | | | | | | | |
NY1* | | | 6,117 | | 48,404 | | 90.9 | | — | | — | | 48,404 | | 90.9 | | — | | — | | 48,404 | |
NY2 | | | 15,608 | | 101,742 | | 90.8 | | 18,121 | | 14.1 | | 119,863 | | 79.2 | | 34,589 | | 81,799 | | 236,251 | |
New York Total | | | 21,725 | | 150,146 | | 90.8 | | 18,121 | | 14.1 | | 168,267 | | 82.5 | | 34,589 | | 81,799 | | 284,655 | |
| | | | | | | | | | | | | | | | | | | | | | |
Boston | | | | | | | | | | | | | | | | | | | | | | |
BO1 | | | 19,262 | | 108,995 | | 95.6 | | 13,735 | | 62.7 | | 122,730 | | 91.9 | | 19,961 | | 110,985 | | 253,676 | |
| | | | | | | | | | | | | | | | | | | | | | |
Chicago | | | | | | | | | | | | | | | | | | | | | | |
CH1 | | | 16,515 | | 178,407 | | 83.6 | | — | | — | | 178,407 | | 83.6 | | — | | — | | 178,407 | |
CH2 | | | — | | — | | — | | — | | — | | — | | — | | 56,000 | | 113,000 | | 169,000 | |
Chicago Total | | | 16,515 | | 178,407 | | 83.6 | | — | | — | | 178,407 | | 83.6 | | 56,000 | | 113,000 | | 347,407 | |
| | | | | | | | | | | | | | | | | | | | | | |
Denver | | | | | | | | | | | | | | | | | | | | | | |
DE1* | | | 4,029 | | 9,813 | | 91.4 | | 19,971 | | 32.9 | | 29,784 | | 52.2 | | — | | — | | 29,784 | |
DE2* | | | 471 | | 5,140 | | 92.7 | | — | | — | | 5,140 | | 92.7 | | — | | — | | 5,140 | |
Denver Total | | | 4,500 | | 14,953 | | 91.8 | | 19,971 | | 32.9 | | 34,924 | | 58.2 | | — | | — | | 34,924 | |
| | | | | | | | | | | | | | | | | | | | | | |
Miami | | | | | | | | | | | | | | | | | | | | | | |
MI1 | | | 1,551 | | 30,176 | | 63.2 | | — | | — | | 30,176 | | 63.2 | | — | | 13,154 | | 43,330 | |
Total Data Center Facilities | | $ | 291,303 | | 2,277,668 | | 91.3 | % | 214,286 | | 14.5 | % | 2,491,954 | | 84.7 | % | 323,287 | | 1,448,032 | | 4,263,273 | |
| | | | | | | | | | | | | | | | | | | | | | |
Office & Light-Industrial | | | 8,390 | | 364,941 | | 78.2 | | — | | — | | 364,941 | | 78.2 | | — | | — | | 364,941 | |
Reston Office & Light-Industrial(4) | | | 1,848 | | 126,700 | | 100.0 | | — | | — | | 126,700 | | 100.0 | | — | | (126,700) | | — | |
| | | | | | | | | | | | | | | | | | | | | | |
Total Portfolio | | $ | 301,541 | | 2,769,309 | | 89.9 | % | 214,286 | | 14.5 | % | 2,983,595 | | 84.5 | % | 323,287 | | 1,321,332 | | 4,628,214 | |
* Indicates properties in which we hold a leasehold interest.
| (1) | | On a gross basis, our total portfolio annualized rent was approximately $308.1 million as of June 30, 2019, which includes $6.6 million in operating expense reimbursements under modified gross and triple-net leases. |
| (2) | | Includes customer leases that have commenced as of June 30, 2019. If all leases signed during the current and prior periods had commenced, the percent occupied would have been as follows: |
| | | | | | | |
Percent Leased | | Stabilized | | Pre-Stabilized | | Total | |
Total Data Center Facilities | | 92.0 | % | 19.4 | % | 85.7 | % |
Total Portfolio | | 90.7 | % | 19.4 | % | 85.6 | % |
| (3) | | On April 12, 2019, we acquired a 3.8-acre land parcel with a single-story office building located adjacent to our Santa Clara campus, for a purchase price of $26 million. We expect to develop approximately 200,000 NRSF turn-key data center building on the acquired land parcel, which we refer to as SV9, as the existing office tenants vacate upon expiration of their leases and upon the receipt of necessary entitlements. |
| (4) | | Included within our Reston Campus Expansion held for development space is 126,700 NRSF which is currently operating as office and light-industrial space. |
See Appendix for definitions.
|
Quarter Ended June 30, 2019 |
| | | | | | | | |
Overview | Financial
Statements | Operating
Portfolio | Development | Capital
Structure | Components
of NAV | Guidance | Appendix | 13 |
Leasing Statistics
|
Data Center Leasing Activity |
| | | | | | | | | | | | | | | | | | | | |
| | | | | | GAAP | | | | | GAAP | | | | | | | |
| | Leasing | | Number | | Annualized | | Total | | | Annualized | | Rental | | Cash | | GAAP | |
| | Activity | | of | | Rent | | Leased | | | Rent per | | Churn | | Rent | | Rent | |
| | Period | | Leases(1) | | ($000) | | NRSF | | | Leased NRSF | | Rate | | Growth | | Growth | |
| | | | | | | | | | | | | | | | | | | | |
New / expansion leases commenced | | YTD 2019 | | 259 | | $ | 16,074 | (2) | 89,233 | | | $ | 194 | (2) | | | | | | |
| | Q2 2019 | | 140 | | | 10,248 | (2) | 65,193 | | | | 176 | (2) | | | | | | |
| | Q1 2019 | | 119 | | | 5,826 | | 24,040 | | | | 242 | | | | | | | |
| | Q4 2018 | | 116 | | | 4,356 | | 22,684 | | | | 192 | | | | | | | |
| | Q3 2018 | | 127 | | | 5,869 | | 36,576 | | | | 160 | | | | | | | |
| | Q2 2018 | | 145 | | | 6,531 | | 33,938 | | | | 192 | | | | | | | |
| | | | | | | | | | | | | | | | | | | | |
New / expansion leases signed | | YTD 2019 | | 256 | | $ | 33,913 | | 174,799 | | | $ | 201 | | | | | | | |
| | Q2 2019 | | 135 | | | 27,291 | | 142,824 | | | | 191 | | | | | | | |
| | Q1 2019 | | 121 | | | 6,622 | | 31,975 | | | | 207 | | | | | | | |
| | Q4 2018 | | 115 | | | 4,177 | | 16,125 | | | | 259 | | | | | | | |
| | Q3 2018 | | 120 | | | 6,057 | | 31,330 | | | | 193 | | | | | | | |
| | Q2 2018 | | 143 | | | 10,352 | (2) | 65,037 | | | | 178 | (2) | | | | | | |
| | | | | | | | | | | | | | | | | | | | |
Renewal leases signed | | YTD 2019 | | 592 | | $ | 35,975 | | 190,414 | | | $ | 189 | | 5.1 | % | 2.8 | % | 6.9 | % |
| | Q2 2019 | | 328 | | | 24,102 | | 121,809 | | | | 198 | | 2.4 | | 2.6 | | 7.4 | |
| | Q1 2019 | | 264 | | | 11,873 | | 68,605 | | | | 173 | | 2.7 | | 3.2 | | 5.9 | |
| | Q4 2018 | | 303 | | | 22,464 | | 125,078 | | | | 180 | | 1.9 | | 3.0 | | 7.0 | |
| | Q3 2018 | | 300 | | | 16,192 | | 97,682 | | | | 166 | | 2.5 | | 3.2 | | 5.8 | |
| | Q2 2018 | | 288 | | | 17,643 | | 128,386 | | | | 137 | | 1.3 | | 2.6 | | 5.4 | |
| (1) | | Number of leases represents each agreement with a customer; a lease agreement could include multiple spaces and a customer could have multiple leases. |
| (2) | | During Q2 2017, we signed a customer lease that commenced in Q1 2018, which included contractual payments to reserve dedicated expansion space. The contractual reservation payments were included within GAAP annualized rent, but were excluded in calculating the GAAP annualized rent per leased NRSF rate. During Q2 2018, the customer exercised its option to expand into the reserved expansion space. The Q2 2018 GAAP annualized rent signed includes only the incremental contractual payments; however, the rent per leased NRSF rate includes the entire GAAP annualized rent amount. During Q2 2019, the customer’s lease for the reserved expansion space commenced. The Q2 2019 GAAP annualized rent commenced only includes the incremental contractual payments; however, the rent per lease NRSF rate includes the entire GAAP annualized rent amount. |
|
New / Expansion Leases Signed by Deployment Size by Period |
| | | | | | | | | | | | | | | | | |
| | Q2 2019 | | Q1 2019 | | Q4 2018 | | Q3 2018 | | Q2 2018 | | |
GAAP Annualized Rent ($000) | | | | | | | | | | | | | | | | | |
Core Retail Colocation | | | | | | | | | | | | | | | | | |
< 1,000 NRSF | | $ | 2,943 | | $ | 3,921 | | $ | 2,665 | | $ | 2,971 | | $ | 3,912 | | |
1,000 - 5,000 NRSF | | | 2,376 | | | 2,701 | | | 1,512 | | | 2,117 | | | 1,825 | | |
Total Core Retail Colocation | | $ | 5,319 | | $ | 6,622 | | $ | 4,177 | | $ | 5,088 | | $ | 5,737 | | |
Scale Colocation | | | | | | | | | | | | | | | | | |
> 5,000 NRSF | | | 21,972 | | | — | | | — | | | 969 | | | 4,615 | | |
Total GAAP Annualized Rent | | $ | 27,291 | | $ | 6,622 | | $ | 4,177 | | $ | 6,057 | | $ | 10,352 | | |
| |
MRR per Cabinet Equivalent Billed (TKD Occupied Same-Store) |
|
Quarter Ended June 30, 2019 |
| | | | | | | | |
Overview | Financial
Statements | Operating
Portfolio | Development | Capital
Structure | Components
of NAV | Guidance | Appendix | 14 |
Leasing Statistics
|
Lease Distribution (total portfolio, including total data center and office and light-industrial “OLI”) |
| | | | | | | | | | | | | | |
| | | | | | Total | | Percentage | | | | | Percentage | |
| | Number | | Percentage | | Operating | | of Total | | Annualized | | of Total | |
| | of | | of All | | NRSF of | | Operating | | Rent | | Annualized | |
NRSF Under Lease | | Leases | | Leases | | Leases | | NRSF | | ($000) | | Rent | |
Unoccupied data center | | — | | — | % | 382,189 | | 12.8 | % | $ | — | | — | % |
Unoccupied OLI | | — | | — | | 79,625 | | 2.7 | | | — | | | |
Data center NRSF: | | | | | | | | | | | | | | |
5,000 or less | | 2,290 | | 90.9 | | 808,945 | | 27.1 | | | 137,222 | | 45.5 | |
5,001 - 10,000 | | 43 | | 1.7 | | 289,876 | | 9.7 | | | 45,532 | | 15.1 | |
10,001 - 25,000 | | 22 | | 0.9 | | 344,670 | | 11.5 | | | 51,915 | | 17.2 | |
Greater than 25,000 | | 6 | | 0.2 | | 249,996 | | 8.4 | | | 40,275 | | 13.4 | |
Powered shell | | 17 | | 0.7 | | 416,278 | | 14.0 | | | 16,359 | | 5.4 | |
OLI | | 142 | | 5.6 | | 412,016 | | 13.8 | | | 10,238 | | 3.4 | |
Portfolio Total | | 2,520 | | 100.0 | % | 2,983,595 | | 100.0 | % | $ | 301,541 | | 100.0 | % |
|
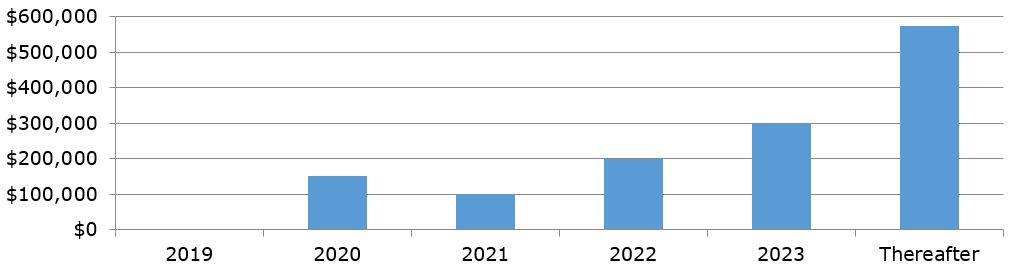
Lease Expirations (total portfolio, including total data center and office and light-industrial “OLI”) |
| | | | | | | | | | | | | | | | | | | | | |
| | | | Total | | | | | | | | | | | | | Annualized | |
| | Number | | Operating | | Percentage | | | | | Percentage | | Annualized | | Annualized | | Rent Per | |
| | of | | NRSF of | | of Total | | Annualized | | of Total | | Rent Per | | Rent at | | Leased | |
| | Leases | | Expiring | | Operating | | Rent | | Annualized | | Leased | | Expiration | | NRSF at | |
Year of Lease Expiration | | Expiring(1) | | Leases | | NRSF | | ($000) | | Rent | | NRSF | | ($000)(2) | | Expiration | |
Unoccupied data center | | — | | 382,189 | | 12.8 | % | $ | — | | — | % | $ | — | | $ | — | | $ | — | |
Unoccupied OLI | | — | | 79,625 | | 2.7 | | | — | | — | | | — | | | — | | | — | |
2019 | | 665 | | 353,267 | | 11.8 | | | 57,367 | | 19.0 | | | 162 | | | 57,457 | | | 163 | |
2020 | | 1,035 | | 478,781 | | 16.0 | | | 79,000 | | 26.2 | | | 165 | | | 80,913 | | | 169 | |
2021 | | 360 | | 279,058 | | 9.4 | | | 44,056 | | 14.6 | | | 158 | | | 46,844 | | | 168 | |
2022 | | 189 | | 278,103 | | 9.3 | | | 37,863 | | 12.6 | | | 136 | | | 40,285 | | | 145 | |
2023 | | 62 | | 186,822 | | 6.3 | | | 21,970 | | 7.3 | | | 118 | | | 25,356 | | | 136 | |
2024-Thereafter | | 67 | | 533,734 | | 17.9 | | | 51,047 | | 16.9 | | | 96 | | | 61,732 | | | 116 | |
OLI (3) | | 142 | | 412,016 | | 13.8 | | | 10,238 | | 3.4 | | | 25 | | | 10,849 | | | 26 | |
Portfolio Total / Weighted Average | | 2,520 | | 2,983,595 | | 100.0 | % | $ | 301,541 | | 100.0 | % | $ | 120 | | $ | 323,436 | | $ | 128 | |
| (1) | | Includes leases that upon expiration will automatically be renewed, primarily on a year-to-year basis. Number of leases represents each agreement with a customer; a lease agreement could include multiple spaces and a customer could have multiple leases. |
| (2) | | Represents the final monthly contractual rent under existing customer leases as of June 30, 2019, multiplied by 12. This amount reflects total annualized base rent before any one-time or non-recurring rent abatements and excludes power revenue, interconnection revenue and operating expense reimbursement. Leases expiring during 2019 include annualized rent of $11.4 million associated with lease terms currently on a month-to-month basis. |
| (3) | | The office and light-industrial leases are scheduled to expire as follows: |
| | | | | | |
| | NRSF of | | Annualized | |
| | Expiring | | Rent | |
Year | | Leases | | ($000) | |
2019 | | 20,560 | | $ | 307 | |
2020 | | 78,292 | | | 1,848 | |
2021 | | 42,117 | | | 1,377 | |
2022 | | 72,684 | | | 1,402 | |
2023 | | 140,404 | | | 3,904 | |
2024 - Thereafter | | 57,959 | | | 1,400 | |
Total OLI | | 412,016 | | $ | 10,238 | |
|
Quarter Ended June 30, 2019 |
| | | | | | | | |
Overview | Financial
Statements | Operating
Portfolio | Development | Capital
Structure | Components
of NAV | Guidance | Appendix | 15 |
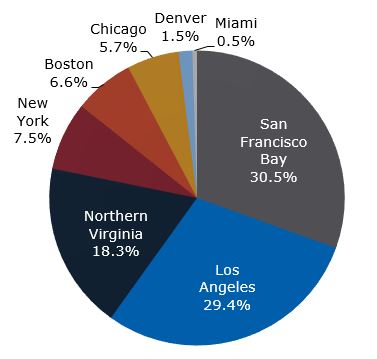
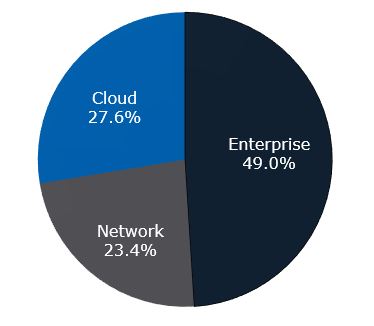
Geographic and Vertical Diversification
|
Geographical Diversification |
| | | | | |
| | | | Percentage of Total Data |
| Metropolitan Market | | Center Annualized Rent |
| San Francisco Bay | | 30.5 | % |
| Los Angeles | | 29.4 | |
| Northern Virginia | | 18.3 | |
| New York | | 7.5 | |
| Boston | | 6.6 | |
| Chicago | | 5.7 | |
| Denver | | 1.5 | |
| Miami | | 0.5 | |
| Total | | 100.0 | % |
| | | | |
| | | | |
| | | | |
| | | | |
| | | | | |
| | | | |
| | | |
| | | | |
| | | Percentage of Total Data |
| Vertical | | Center Annualized Rent |
| Enterprise | | 49.0 | % |
| Cloud | | 27.6 | |
| Network | | 23.4 | |
| Total | | 100.0 | % |
| | | | |
| | | | |
| | | | |
| | | | |
| | | | |
| | | | |
| | | | |
|
Quarter Ended June 30, 2019 |
| | | | | | | | |
Overview | Financial
Statements | Operating
Portfolio | Development | Capital
Structure | Components
of NAV | Guidance | Appendix | 16 |
10 Largest Customers
|
10 Largest Customers (total portfolio, including data center and office and light-industrial “OLI”) |
| | | | | | | | | | | | | | | | |
| | | | | | | | | | | | | | | Weighted | |
| | | | | | | | Percentage | | | | | Percentage | | Average | |
| | | | Number | | Total | | of Total | | Annualized | | of Total | | Remaining | |
| | | | of | | Occupied | | Operating | | Rent | | Annualized | | Lease Term in | |
| CoreSite Vertical | Customer Industry | | Locations | | NRSF | | NRSF(1) | | ($000) | | Rent(2) | | Months(3) | |
1 | Cloud | Public Cloud | | 7 | | 96,423 | | 3.2 | % | $ | 19,875 | | 6.6 | % | 77 | |
2 | Cloud | Public Cloud | | 11 | | 305,452 | | 10.2 | | | 18,209 | | 6.0 | | 64 | |
3 | Enterprise | Digital Content | | 6 | | 118,583 | | 4.0 | | | 16,446 | | 5.5 | | 42 | |
4 | Enterprise | Travel / Hospitality | | 3 | | 73,052 | | 2.4 | | | 14,840 | | 4.9 | | 21 | |
5 | Cloud | Public Cloud | | 3 | | 118,615 | | 4.0 | | | 13,270 | | 4.4 | | 47 | |
6 | Enterprise | SI & MSP | | 3 | | 62,602 | | 2.1 | | | 9,190 | | 3.0 | | 10 | |
7 | Network | Global Service Provider | | 8 | | 31,984 | | 1.1 | | | 6,196 | | 2.0 | | 35 | |
8 | Network | US National Service Provider | | 16 | | 42,157 | | 1.4 | | | 5,176 | | 1.7 | | 48 | |
9 | Enterprise | SI & MSP | | 1 | | 18,124 | | 0.6 | | | 4,708 | | 1.6 | | 8 | |
10 | Enterprise | Colocation / Reseller | | 4 | | 34,548 | | 1.2 | | | 4,706 | | 1.6 | | 7 | |
| Total / Weighted Average | | | | | 901,540 | | 30.2 | % | $ | 112,616 | | 37.3 | % | 44 | |
| (1) | | Represents the customer’s total occupied square feet divided by the total operating NRSF in the portfolio as of June 30, 2019. |
| (2) | | Represents the customer’s total annualized rent divided by the total annualized rent in the portfolio as of June 30, 2019. |
| (3) | | Weighted average based on percentage of total annualized rent expiring calculated as of June 30, 2019. |
|
Quarter Ended June 30, 2019 |
| | | | | | | | |
Overview | Financial
Statements | Operating
Portfolio | Development | Capital
Structure | Components
of NAV | Guidance | Appendix | 17 |
Capital Expenditures and Completed
Pre-Stabilized Projects
(in thousands, except NRSF and cost per NRSF data)
|
Capital Expenditures and Repairs and Maintenance |
| | | | | | | | | | | | | | | | | |
| | Three Months Ended | | |
| | June 30, | | March 30, | | December 31, | | September 30, | | June 30, | | |
| | 2019 | | 2019 | | 2018 | | 2018 | | 2018 | | |
Data center expansion(1) | | $ | 106,253 | | $ | 102,363 | | $ | 81,749 | | $ | 60,276 | | $ | 59,726 | | |
Non-recurring investments(2) | | | 1,248 | | | 1,374 | | | 862 | | | 1,737 | | | 1,710 | | |
Tenant improvements | | | 997 | | | 1,096 | | | 1,155 | | | 1,422 | | | 1,456 | | |
Recurring capital expenditures(3) | | | (672) | | | 2,243 | | | 1,149 | | | 3,332 | | | 3,651 | | |
Total capital expenditures | | $ | 107,826 | | $ | 107,076 | | $ | 84,915 | | $ | 66,767 | | $ | 66,543 | | |
| | | | | | | | | | | | | | | | | |
Repairs and maintenance expense(4) | | $ | 3,196 | | $ | 3,532 | | $ | 3,915 | | $ | 3,853 | | $ | 4,037 | | |
| (1) | | Data center expansion capital expenditures include new data center construction, development projects adding capacity to existing data centers and other revenue generating investments. Data center expansion also includes investment of Deferred Expansion Capital. During the quarter ended June 30, 2018, we incurred $6.3 million, net of previously accrued legal expense, to acquire U.S. Colo, a carrier neutral, network-dense colocation provider, located in Los Angeles, CA. During the quarter ended June 30, 2019, we incurred $26 million to acquire SV9. |
| (2) | | Non-recurring investments include upgrades to existing data center or office space and company-wide improvements that are ancillary to revenue generation such as internal system development and system-wide security upgrades, which have a future economic benefit. |
| (3) | | Recurring capital expenditures include required equipment upgrades within our operating portfolio, which have a future economic benefit. The three months ended June 30, 2019, included and, therefore, is reduced due to a $1.7 million energy efficiency rebate received from the power utility related to the replacement of our chiller plant at LA2. |
| (4) | | Repairs and maintenance expense is classified within property operating and maintenance expense in the consolidated statements of operations. These expenditures represent recurring maintenance contracts and repairs to operating equipment necessary to maintain current operations. |
|
Completed Stabilized Projects During the Year(1) |
| | | | | | | | | | | | | | | | |
| | Metropolitan | | | | | | | | | | Cost Per | | Percent | |
Projects / Facilities | | Market | | Completion | | | NRSF | | Cost | | NRSF | | Occupied | |
LA2 | | Los Angeles | | Q2 2019 | | | 28,191 | | $ | 18,135 | | $ | 643 | | 100.0 | % |
| (1) | | Projects that are over 85% occupied upon completion meet our definition of stabilized and are included within the operating properties table on page 13. |
|
Completed Pre-Stabilized Projects |
| | | | | | | | | | | | | | | | | |
| | Metropolitan | | | | | | | | | Cost Per | | Percent | | Percent | |
Projects / Facilities | | Market | | Completion | | NRSF | | Cost(1) | | NRSF | | Leased(2) | | Occupied | |
DE1 | | Denver | | Q3 2017 | | 4,341 | | $ | 6,206 | | $ | 1,430 | | 73.2 | % | 72.9 | % |
BO1 | | Boston | | Q4 2017 | | 13,735 | | | 7,000 | | | 510 | | 62.7 | | 62.7 | |
VA1 | | Northern Virginia | | Q4 2017 | | 3,087 | | | 1,263 | | | 409 | | — | | — | |
LA2 | | Los Angeles | | Q1 2018 | | 39,925 | | | 12,122 | | | 304 | | 23.6 | | 23.6 | |
VA3 Phase 1A | | Northern Virginia | | Q1 2018 | | 26,413 | | | 24,289 | | | 920 | | 31.9 | | 13.9 | |
DE1 | | Denver | | Q2 2018 | | 15,630 | | | 7,581 | | | 485 | | 22.7 | | 21.8 | |
NY2 | | New York | | Q2 2018 | | 18,121 | | | 13,407 | | | 740 | | 14.1 | | 14.1 | |
DC2 | | Northern Virginia | | Q4 2018 | | 24,563 | | | 21,512 | | | 876 | | 3.3 | | 0.7 | |
LA1 | | Los Angeles | | Q2 2019 | | 17,238 | | | 11,635 | | | 675 | | 29.4 | | — | |
VA3 Phase 1B | | Northern Virginia | | Q2 2019 | | 51,233 | | | 53,393 | | | 1,042 | | — | | — | |
Total completed pre-stabilized | | | | | | 214,286 | | $ | 158,408 | | $ | 739 | | 19.4 | % | 14.5 | % |
| (1) | | Cost includes capital expenditures related to the specific project / phase and, for NY2 and VA3 Phase 1A and 1B projects, also includes allocations of capital expenditures related to land, building shell, and infrastructure that were incurred at the beginning of the overall project. |
| (2) | | Includes customer leases that have been signed as of June 30, 2019, but have not commenced. The percent leased is determined based on leased NRSF as a proportion of total pre-stabilized NRSF. |
|
Quarter Ended June 30, 2019 |
Overview | Financial
Statements | Operating
Portfolio | Development | Capital
Structure | Components
of NAV | Guidance | Appendix | 18 |
Development Summary
|
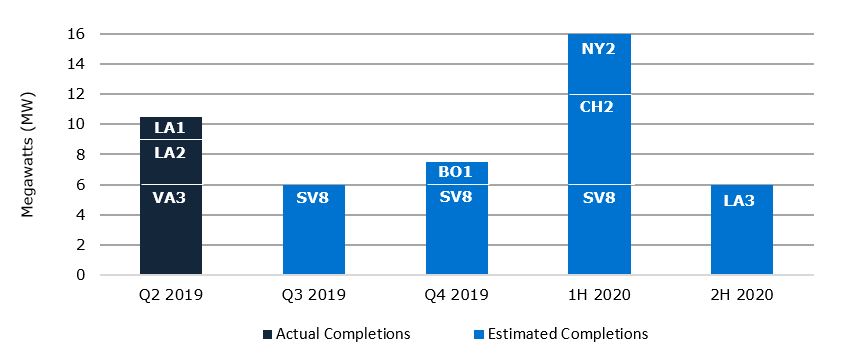
Development Completion Timeline |
The following chart sets forth the estimated development timeline of megawatts planned to be completed and placed into service in 2019 and 2020 and the actual megawatts placed into service during Q2 2019:
(in thousands, except NRSF and power data)
| | | | | | | | | | | | | | | | | | | | | | | | | | |
| | Under Construction | | Held for Development | | Total |
| | | | | | Costs | | | | | | Estimated | | Estimated |
| | Estimated | | | | Incurred | | Estimated | | Percent | | Power | | | | | | Power | | | | | |
Projects/Facilities | | Completion | | NRSF | | To- Date | | Total | | Leased | | (MW) | | NRSF | | Total Cost | | (MW) | | NRSF | | | Cost |
| | | | | | | | | | | | | | | | | | | | | | | | | | |
Data center expansion | | | | | | | | | | | | | | | | | | | | | | | | |
BO1 | | Q4 2019 | | 19,961 | | $ | 1,176 | | $ | 9,000 | | — | % | 1.5 | | 110,985 | | $ | 71,200 | | 9.0 | | 130,946 | | $ | 80,200 |
LA1 | | — | | — | | | — | | | — | | — | | — | | 10,352 | | | 1,250 | | 0.5 | | 10,352 | | | 1,250 |
MI1 | | — | | — | | | — | | | — | | — | | — | | 13,154 | | | 7,500 | | 1.0 | | 13,154 | | | 7,500 |
NY2 | | | | | | | | | | | | | | | | | | | | | | | | | | |
Phase 3 | | 1H 2020 | | 34,589 | | | 457 | | | 46,000 | | — | | 4.0 | | — | | | — | | — | | 34,589 | | | 46,000 |
Phase 4 | | — | | — | | | — | | | — | | — | | — | | 46,699 | | | 14,000 | | 5.0 | | 46,699 | | | 14,000 |
Phase 5 | | — | | — | | | — | | | — | | — | | — | | 35,100 | | | 28,000 | | 4.0 | | 35,100 | | | 28,000 |
Total data center expansion | | 54,550 | | $ | 1,633 | | $ | 55,000 | | — | % | 5.5 | | 216,290 | | $ | 121,950 | | 19.5 | | 270,840 | | $ | 176,950 |
| | | | | | | | | | | | | | | | | | | | | | | | | | |
New development | | | | | | | | | | | | | | | | | | | | | | | | |
Ground-up construction | | | | | | | | | | | | | | | | | | | | | | | | | | |
CH2 Phase 1 | | 1H 2020 | | 56,000 | | $ | 38,562 | | $ | 120,000 | | — | % | 6.0 | | 113,000 | | $ | 80,000 | | 12.0 | | 169,000 | | $ | 200,000 |
LA3 Phase 1 | | 2H 2020 | | 51,000 | | | 32,233 | | | 134,000 | | — | | 6.0 | | 109,000 | | | 72,000 | | 12.0 | | 160,000 | | | 206,000 |
SV8 | | | | | | | | | | | | | | | | | | | | | | | | | | |
Phase 1 | | Q3 2019 | | 53,953 | | | 112,418 | | | 133,000 | | 100.0 | | 6.0 | | — | | | — | | — | | 53,953 | | | 133,000 |
Phase 2 | | Q4 2019 | | 53,728 | | | 5,861 | | | 44,000 | | 100.0 | | 6.0 | | — | | | — | | — | | 53,728 | | | 44,000 |
Phase 3 | | 1H 2020 | | 54,056 | | | — | | | 42,000 | | — | | 6.0 | | — | | | — | | — | | 54,056 | | | 42,000 |
VA3 | | | | | | | | | | | | | | | | | | | | | | | | | | |
Phase 1C | | — | | — | | | — | | | — | | — | | — | | 49,316 | | | 30,000 | | 6.0 | | 49,316 | | | 30,000 |
Future Phases | | — | | — | | | — | | | — | | — | | — | | 760,426 | | | 810,000 | | 98.0 | | 760,426 | | | 810,000 |
Pre-construction | | | | | | | | | | | | | | | | | | | | | | | | | | |
SV9(1) | | — | | — | | | — | | | — | | — | | — | | 200,000 | | | 300,000 | | 24.0 | | 200,000 | | | 300,000 |
Total new development | | 268,737 | | $ | 189,074 | | $ | 473,000 | | 40.1 | % | 30.0 | | 1,231,742 | | $ | 1,292,000 | | 152.0 | | 1,500,479 | | $ | 1,765,000 |
| | | | | | | | | | | | | | | | | | | | | | | | | | |
Total development(2)(3) | | 323,287 | | $ | 190,707 | | $ | 528,000 | | 33.3 | % | 35.5 | | 1,448,032 | | $ | 1,413,950 | | 171.5 | | 1,771,319 | | $ | 1,941,950 |
| (1) | | On April 12, 2019, we acquired a 3.8-acre land parcel with a single-story office building located adjacent to our Santa Clara campus. We expect to develop an approximately 200,000 NRSF turn-key data center building on the acquired land parcel, which we refer to as SV9. We began pre-construction, including environmental permitting and other processes, and will commence development as the existing office tenants vacate upon expiration of their leases and upon receipt of the necessary entitlements. |
| (2) | | In addition to new development and incremental capacity in existing core and shell buildings, we have land adjacent to our NY2 facility, in the form of an existing parking lot. By utilizing this land, we believe we can build approximately 100,000 NRSF of data center capacity in Secaucus, New Jersey, upon receipt of necessary entitlements. |
| (3) | | We have an estimated $14.6 million in deferred expansion capital under construction at multiple properties as of June 30, 2019, of which $8.2 million has been incurred to-date. We estimate approximately $35 million of additional deferred expansion capital may be required in the future to support existing or anticipated future customer utilization. |
|
Quarter Ended June 30, 2019 |
Overview | Financial
Statements | Operating
Portfolio | Development | Capital
Structure | Components
of NAV | Guidance | Appendix | 19 |
Market Capitalization and Debt Summary
(in thousands, except per share data)
| | | | | | | | | |
| | Shares or | | | | | | |
| | Equivalents | | Market Price as of | | Market Value | |
| | Outstanding | | June 30, 2019 | | Equivalents | |
Common shares | | 36,890 | | $ | 115.17 | | $ | 4,248,664 | |
Operating partnership units | | 11,572 | | | 115.17 | | | 1,332,805 | |
Total equity | | | | | | | | 5,581,469 | |
Total net principal debt outstanding(1) | | | | | | | | 1,314,414 | |
Total enterprise value | | | | | | | $ | 6,895,883 | |
| | | | | | | | | |
Net principal debt to enterprise value | | | | | | | | 19.1 | % |
| (1) | | Net principal debt outstanding includes total principal debt outstanding net of $2.8 million of cash and cash equivalents. |
| | | | | | | | | | | |
| | | | | | Outstanding as of: | |
| | | | Maturity | | June 30, | | December 31, | |
Instrument | | Rate(3) | | Date(4) | | 2019 | | 2018 | |
Revolving credit facility | | 3.85 | % | 4/19/2022 | | $ | 67,250 | | $ | 211,500 | |
2020 Senior unsecured term loan | | 3.31 | | 6/24/2020 | | | 150,000 | | | 150,000 | |
2021 Senior unsecured term loan | | 3.80 | | 2/2/2021 | | | 100,000 | | | 100,000 | |
2022 Senior unsecured term loan | | 3.80 | | 4/19/2022 | | | 200,000 | | | 200,000 | |
2023 Senior unsecured term loan | | 3.96 | | 4/19/2023 | | | 150,000 | | | 150,000 | |
2023 Senior unsecured notes | | 4.19 | | 6/15/2023 | | | 150,000 | | | 150,000 | |
2024 Senior unsecured notes | | 3.91 | | 4/20/2024 | | | 175,000 | | | 175,000 | |
2026 Senior unsecured notes | | 4.52 | | 4/17/2026 | | | 200,000 | | | — | |
2029 Senior unsecured notes | | 4.31 | | 4/17/2029 | | | 125,000 | | | — | |
Total principal debt outstanding | | | | | | | 1,317,250 | | | 1,136,500 | |
Unamortized deferred financing costs | | | | | | | (7,136) | | | (5,677) | |
Total debt | | | | | | $ | 1,310,114 | | $ | 1,130,823 | |
Weighted average interest rate | | 3.98 | % | | | | | | | | |
| | | | | | | | | | | |
Floating rate vs. fixed rate debt | | | | | | | 39% / 61% | | | 54% / 46% | |
| (1) | | See the filed Form 10-K and 10-Q for information on specific debt instruments. |
| (2) | | On April 17, 2019, we entered into a note purchase agreement to issue and sell an aggregate principal amount of $200 million of 4.11% Series A Senior Notes, with an effective interest rate of 4.52%, and $200 million of 4.31% Series B Senior Notes (together, the “Notes”). We issued $200 million of the Series A Notes and $125 million of the Series B Notes on April 17, 2019. On July 17, 2019, we issued the remaining $75 million of the Series B Notes governed by the April 17, 2019, note purchase agreement. The proceeds from the Notes were used to pay down outstanding amounts on the revolving credit facility. As a result of the subsequent $75 million debt issuance and repayment of the revolving credit facility, the floating rate to fixed rate debt ratio was 34 / 66%. |
| (3) | | The interest rates above reflect the impacts of interest rate swap agreements. |
| (4) | | The revolving credit facility contains a one-time extension option, which, if exercised, would extend the maturity date to April 2023. |
| (1) | | The proceeds from the $75 million Series B Notes issued on July 17, 2019, were used to pay down outstanding amounts on the revolving portion of our senior unsecured credit facilities. The debt maturities include the subsequent repayment of the revolving credit facility. |
|
Quarter Ended June 30, 2019 |
Overview | Financial
Statements | Operating
Portfolio | Development | Capital
Structure | Components
of NAV | Guidance | Appendix | 20 |
Interest Summary and Debt Covenants
(in thousands)
|
Interest Expense Components |
| | | | | | | | | | | | | | | | | |
| | Three Months Ended | | | Six Months Ended | |
| | June 30, | | March 31, | | June 30, | | | June 30, | | June 30, | |
| | 2019 | | 2019 | | 2018 | | | 2019 | | 2018 | |
Interest expense and fees | | $ | 13,056 | | $ | 11,516 | | $ | 9,439 | | | $ | 24,572 | | $ | 17,714 | |
Amortization of deferred financing costs and hedge amortization | | | 856 | | | 611 | | | 553 | | | | 1,467 | | | 1,119 | |
Capitalized interest | | | (3,601) | | | (2,629) | | | (1,085) | | | | (6,230) | | | (2,188) | |
Total interest expense | | $ | 10,311 | | $ | 9,498 | | $ | 8,907 | | | $ | 19,809 | | $ | 16,645 | |
| | | | | | | | | | | | | | | | | |
Percent capitalized | | | 25.9 | % | | 21.7 | % | | 10.9 | % | | | 23.9 | % | | 11.6 | % |
| | | | | | | | | | | | | | | | | | |
| | Revolving Credit Facility and Senior Unsecured Term Loans and Notes | |
| | | | June 30, | | March 31, | | December 31, | | September 30, | | June 30, | |
| | Required Compliance | | 2019 | | 2019 | | 2018 | | 2018 | | 2018 | |
| | | | | | | | | | | | | | | | | | |
Fixed charge coverage ratio | | Greater than 1.50x | | | 6.1 | x | | 6.6 | x | | 7.0 | x | | 7.4 | x | | 7.9 | x |
Total indebtedness to gross asset value | | Less than 60% | | | 27.4 | % | | 26.3 | % | | 25.3 | % | | 24.8 | % | | 24.3 | % |
Secured debt to gross asset value | | Less than 40% | | | — | % | | — | % | | — | % | | — | % | | — | % |
| | | | | | | | | | | | | | | | | | |
| | | | Pro Forma(1) | | | | | | | | | | |
Revolving credit facility availability | | | | $ | 450,000 | | $ | 450,000 | | $ | 450,000 | | $ | 450,000 | | $ | 450,000 | |
Borrowings outstanding | | | | | — | | | — | | | (211,500) | | | (154,500) | | | (111,964) | |
Outstanding letters of credit | | | | | (4,879) | | | (4,879) | | | (4,879) | | | (4,879) | | | (4,879) | |
Current availability | | | | $ | 445,121 | | $ | 445,121 | | $ | 233,621 | | $ | 290,621 | | $ | 333,157 | |
| (1) | | During April 2019, we entered into a note purchase agreement to issue and sell an aggregate principal amount of $200 million of 4.11% Series A Senior Notes and $200 million of 4.31% Series B Senior Notes (together, the “Notes”). An aggregate principal amount of $200 million of the Series A Senior Notes and $125 million of the Series B Senior Notes were issued on April 17, 2019. The remaining $75 million of the Series B Senior Notes was issued on July 17, 2019. The proceeds from the Notes were used to pay down outstanding amounts on the revolving portion of our senior unsecured credit facilities. The revolving credit facility availability, borrowings outstanding, and current availability as of March 31, 2019, and June 30, 2019, have been adjusted to reflect these subsequent debt financing transactions. |
|
Quarter Ended June 30, 2019 |
Overview | Financial
Statements | Operating
Portfolio | Development | Capital
Structure | Components
of NAV | Guidance | Appendix | 21 |
Components of Net Asset Value (NAV)
(in thousands)
|
Cash Net Operating Income |
| | | | | | |
Reconciliation of Net Operating Income (NOI) | | Q2 2019 | | Annualized |
Operating Income | | $ | 36,056 | | $ | 144,224 |
Adjustments: | | | | | | |
Depreciation and amortization | | | 36,996 | | | 147,984 |
General and administrative | | | 12,282 | | | 49,128 |
Net Operating Income | | $ | 85,334 | | $ | 341,336 |
| | | | | | |
Cash Net Operating Income (Cash NOI) | | | | | | |
Net Operating Income | | $ | 85,334 | | $ | 341,336 |
Adjustments: | | | | | | |
Straight-line rent | | | 1,710 | | | 6,840 |
Amortization of above and below-market leases | | | (86) | | | (344) |
Cash NOI | | $ | 86,958 | | $ | 347,832 |
| | | | | | |
Cash NOI with backlog (85.6% leased)(1) | | $ | 89,487 | | $ | 357,948 |
Cash stabilized NOI (93% leased) | | $ | 97,223 | | $ | 388,892 |
| | | | | | |
Data Center Projects Under Construction | | | | | | |
TKD construction in progress(2) | | $ | 190,707 | | | |
Remaining spend(2) | | | 337,293 | | | |
Total | | $ | 528,000 | | | |
| | | | | | |
Targeted stabilized annual yields | | | 12 - 16 | % | | |
Annualized pro forma NOI range | | $ | 63,300 - 84,500 | | | |
| | | | | | |
|
Other Assets and Liabilities |
| | | | | | |
Other Assets | | | | | | |
Remaining construction in progress(3) | | $ | 195,519 | | | |
Cash and cash equivalents | | | 2,836 | | | |
Accounts and other receivables | | | 29,758 | | | |
Other tangible assets | | | 28,875 | | | |
Total other assets | | $ | 256,988 | | | |
| | | | | | |
Liabilities | | | | | | |
Principal debt | | $ | 1,317,250 | | | |
Accounts payable, accrued expenses and other liabilities | | | 156,353 | | | |
Accrued dividends and distributions | | | 61,332 | | | |
Total liabilities | | $ | 1,534,935 | | | |
| | | | | | |
Weighted average common shares and units - diluted | | | 48,218 | | | |
| (1) | | Cash NOI with backlog includes cash backlog as of June 30, 2019, less any leasing of currently occupied NRSF and data center projects under development. |
| (2) | | Does not include spend associated with leasing commissions. See page 19 for further breakdown of data center projects under construction. |
| (3) | | Represents the book value of in-progress capital projects, including land and shell building, of future data center expansion, non-recurring investments, tenant improvements and recurring capital expenditures. |
|
Quarter Ended June 30, 2019 |
Overview | Financial
Statements | Operating
Portfolio | Development | Capital
Structure | Components
of NAV | Guidance | Appendix | 22 |
2019 Guidance
(in thousands, except per share data)
The annual guidance provided below represents forward-looking projections, which are based on current economic conditions, internal assumptions about our existing customer base and the supply and demand dynamics of the markets in which we operate. Please refer to the press release for additional information on forward-looking statements.
| | | | | | | | | | | | | | | | |
| | | | | 2019 | | | | | | | | | Implied | |
| | Low | | High | | Mid | | | 2018 | | Growth(1) | |
Net income attributable to common shares | | $ | 2.04 | | $ | 2.10 | | $ | 2.07 | | | $ | 2.22 | | (6.8) | % |
Real estate depreciation and amortization | | | 3.03 | | | 3.03 | | | 3.03 | | | | 2.84 | | | |
FFO per common share and OP unit - diluted | | $ | 5.07 | | $ | 5.13 | | $ | 5.10 | | | $ | 5.06 | | 0.8 | % |
| | | | | | | | | | | | | | | | |
Projected operating results: | | | | | | | | | | | | | | | | |
Total operating revenues | | $ | 570,000 | | $ | 580,000 | | $ | 575,000 | | | $ | 544,392 | | 5.6 | % |
Interconnection revenues | | | 74,000 | | | 77,000 | | | 75,500 | | | | 69,709 | | 8.3 | |
General and administrative expenses | | | 44,000 | | | 46,000 | | | 45,000 | | | | 40,090 | | 12.2 | |
| | | | | | | | | | | | | | | | |
Net Income | | $ | 98,000 | | $ | 103,000 | | $ | 100,500 | | | $ | 106,763 | | (5.9) | % |
Depreciation and amortization | | | 151,500 | | | 151,500 | | | 151,500 | | | | 141,633 | | 7.0 | |
Other adjustments(2) | | | 56,500 | | | 56,500 | | | 56,500 | | | | 47,722 | | 18.4 | |
Adjusted EBITDA | | $ | 306,000 | | $ | 311,000 | | $ | 308,500 | | | $ | 296,118 | | 4.2 | % |
| | | | | | | | | | | | | | | | |
Guidance drivers: | | | | | | | | | | | | | | | | |
Annual rental churn rate | | | 9.0 | % | | 11.0 | % | | 10.0 | % | | | 7.7 | % | | |
Cash rent growth on data center renewals | | | 2.0 | % | | 4.0 | % | | 3.0 | % | | | 3.6 | % | | |
Capitalized interest | | | 24.0 | % | | 28.0 | % | | 26.0 | % | | | 17.9 | % | | |
Sales and marketing expense as a percentage of revenue | | | 3.9 | % | | 4.1 | % | | 4.0 | % | | | 3.9 | % | | |
| | | | | | | | | | | | | | | | |
Capital expenditures: | | | | | | | | | | | | | | | | |
Data center expansion | | $ | 405,000 | | $ | 465,000 | | $ | 435,000 | | | $ | 246,728 | | | |
Non-recurring investments | | | 5,000 | | | 10,000 | | | 7,500 | | | | 5,886 | | | |
Tenant improvements | | | 5,000 | | | 10,000 | | | 7,500 | | | | 5,470 | | | |
Recurring capital expenditures | | | 10,000 | | | 15,000 | | | 12,500 | | | | 11,304 | | | |
Total capital expenditures | | $ | 425,000 | | $ | 500,000 | | $ | 462,500 | | | $ | 269,388 | | | |
| (1) | | Implied growth is based on the midpoint of 2019 guidance. |
| (2) | | Refer to the appendix for the adjustments made to net income to calculate adjusted EBITDA. |
|
Quarter Ended June 30, 2019 |
Overview | Financial
Statements | Operating
Portfolio | Development | Capital
Structure | Components
of NAV | Guidance | Appendix | 23 |
Appendix
Definitions
This document includes certain non-GAAP financial measures that management believes are helpful in understanding our business, as further described below. Our definition and calculation of non-GAAP financial measures may differ from those of other Real Estate Investment Trusts (“REITs”) and therefore may not be comparable. The non-GAAP measures should not be considered an alternative to net income as an indicator of our performance and should be considered only a supplement to net income, cash flows from operating, investing or financing activities as measures of profitability and/or liquidity, computed in accordance with GAAP.
Adjusted Funds From Operations “AFFO” is a non-GAAP measure that is used as a supplemental
operating measure specifically for comparing year over year ability to fund dividend distribution from operating activities. We use AFFO as a basis to address our ability to fund our dividend payments. AFFO is calculated by adding to or subtracting from FFO:
| 1. | | Plus: Amortization of deferred financing costs and hedge amortization |
| 2. | | Plus: Non-cash compensation |
| 3. | | Plus: Non-real estate depreciation |
| 4. | | Plus: Impairment charges |
| 5. | | Plus: Below market debt amortization |
| 6. | | Plus: Original issuance costs associated with redeemed preferred stock |
| 7. | | Plus / Less: Net straight line rent adjustments (lessor revenue and lessee expense) |
| 8. | | Plus / Less: Net amortization of above and below market leases |
| 9. | | Less: Recurring capital expenditures |
| 10. | | Less: Tenant improvements |
| 11. | | Less: Capitalized leasing costs |
Capitalized leasing costs consist of commissions payable to third parties, including brokers, leasing agents, referral agents, and internal sales commissions payable to employees. Capitalized leasing costs are accrued and deducted from AFFO generally in the period the lease is executed. Leasing costs are generally paid a) to third party brokers and internal sales employees 50% at customer lease signing and 50% at lease commencement and b) to referral and leasing agents monthly over the lease term as and to the extent we receive payment from the end customer.
AFFO is not intended to represent cash flow from operations for the period, and is only intended to provide an additional measure of performance by adjusting for the effect of certain items noted above included in FFO. Other REITs widely report AFFO, however, other REITs may use different methodologies for calculating AFFO and, accordingly, our AFFO may not be comparable to other REITs.
Annualized Rent
Monthly contractual rent under existing commenced customer leases as of quarter-end, multiplied by 12. This amount reflects total annualized base rent before any one-time or non-recurring rent abatements and excludes power revenue, interconnection revenue and operating expense reimbursement.
|
Quarter Ended June 30, 2019 |
Overview | Financial
Statements | Operating
Portfolio | Development | Capital
Structure | Components
of NAV | Guidance | Appendix | 24 |
Appendix
Data Center Leasing Metrics
| · | | Rental Churn Rate – represents data center leases which are not renewed or are terminated during the period. Rental churn is calculated based on the annualized cash rent of data center expired leases terminated in the period, compared with total data center annualized rent at the beginning of the period. |
| · | | Cash and GAAP Rent Growth – represents the increase in rental rates on renewed data center leases signed during the period, as compared with the previous rental rates for the same space. Cash and GAAP rent growth are calculated based on annualized rent from the renewed data center lease compared to annualized rent from the expired data center lease. |
Data Center Net Rentable Square Feet (“NRSF”)
Both occupied and available data center NRSF includes a factor based on management’s estimate of space to account for a customer’s proportionate share of required data center support space (such as the mechanical, telecommunications and utility rooms) and building common areas, which may be updated on a periodic basis to reflect the most current build-out of our properties.
Deferred Expansion Capital
As we construct data center capacity, we work to optimize both the amount of the capital we deploy on power and cooling infrastructure and the timing of that capital deployment; as such, we generally construct our power and cooling infrastructure supporting our data center NRSF based on our estimate of customer utilization. This practice can result in our investment at a later time in Deferred Expansion Capital. We define Deferred Expansion Capital as our estimate of the incremental capital we may invest in the future to add power or cooling infrastructure to support existing or anticipated future customer utilization of NRSF within our operating data centers. From time to time, we may revise our estimate of Deferred Expansion Capital as well as the potential time period during which we may invest it. See the Development Summary for more detail.
Earnings before Interest, Taxes, Depreciation and Amortization for Real Estate (EBITDAre) and Adjusted EBITDA
EBITDAre is calculated in accordance with the standards established by the National Association of Real Estate Investment Trusts (“Nareit”). EBITDAre is defined as earnings before interest, taxes, depreciation and amortization, gains or losses from the sale of depreciated property, and impairment of depreciated property. We calculate adjusted EBITDA by adding our non-cash compensation expense, transaction costs from unsuccessful deals and business combinations and litigation expense to EBITDAre as well as adjusting for the impact of other impairment charges, gains or losses from sales of undepreciated land and gains or losses on early extinguishment of debt. Management uses EBITDAre and adjusted EBITDA as indicators of our ability to incur and service debt. In addition, we consider EBITDAre and adjusted EBITDA to be appropriate supplemental measures of our performance because they eliminate depreciation and interest, which permits investors to view income from operations without the impact of non-cash depreciation or the cost of debt. However, because EBITDAre and adjusted EBITDA are calculated before recurring cash charges including interest expense and taxes, and are not adjusted for capital expenditures or other recurring cash requirements of our business, their utilization as a cash flow measurement is limited.
|
Quarter Ended June 30, 2019 |
Overview | Financial
Statements | Operating
Portfolio | Development | Capital
Structure | Components
of NAV | Guidance | Appendix | 25 |
Appendix
Funds From Operations (“FFO”) is a supplemental measure of our performance which should be considered
along with, but not as an alternative to, net income and cash provided by operating activities as a measure of operating performance. We calculate FFO in accordance with the standards established by Nareit. FFO represents net income (loss) (computed in accordance with GAAP), excluding gains (or losses) from sales of property and undepreciated land and impairment write-downs of depreciable real estate, plus real estate related depreciation and amortization (excluding amortization of deferred financing costs) and after adjustments for unconsolidated partnerships and joint ventures.
Our management uses FFO as a supplemental performance measure because, by excluding real estate related depreciation and amortization and gains and losses from property dispositions, it provides a performance measure that, when compared year over year, captures trends in occupancy rates, rental rates and operating costs.
We offer this measure because we recognize that investors use FFO as a basis to compare our operating performance with that of other REITs. However, the utility of FFO as a measure of our performance is limited because FFO excludes depreciation and amortization and captures neither the changes in the value of our properties that result from use or market conditions, nor the level of capital expenditures and capitalized leasing commissions necessary to maintain the operating performance of our properties, all of which have real economic effect and could materially impact our financial condition and results from operations. FFO is a non-GAAP measure and should not be considered a measure of liquidity, an alternative to net income, cash provided by operating activities or any other performance measure determined in accordance with GAAP, nor is it indicative of funds available to fund our cash needs, including our ability to pay dividends or make distributions. In addition, our calculations of FFO are not necessarily comparable to FFO as calculated by other REITs that do not use the same definition or implementation guidelines or interpret the standards differently from us. Investors in our securities should not rely on these measures as a substitute for any GAAP measure, including net income.
GAAP Annualized Rent
Represents the monthly average contractual rent as stated on customer contracts, multiplied by 12. This amount is inclusive of any one-time or non-recurring rent abatements and excludes power revenue, interconnection revenue and operating expense reimbursement.
Monthly Recurring Revenue per Cabinet Equivalent Billed
Represents the turn-key monthly recurring colocation revenue (“MRR”) per cabinet equivalent billed. We define MRR as recurring contractual revenue, including rental, power, and interconnection revenue and operating expense reimbursement, under existing commenced customer leases. MRR per cabinet equivalent is calculated as (current quarter MRR/3) divided by ((quarter-end cabinet equivalents billed plus prior quarter-end cabinet equivalents billed)/2). Cabinet equivalents are calculated as cage-usable square feet (turn-key leased NRSF/NRSF factor) divided by 25.
|
Quarter Ended June 30, 2019 |
Overview | Financial
Statements | Operating
Portfolio | Development | Capital
Structure | Components
of NAV | Guidance | Appendix | 26 |
Appendix
Net Operating Income (“NOI”) and Cash NOI – NOI, and cash NOI are supplemental measures for the operating performance of the Company’s portfolio. NOI is operating revenues less operating expenses adjusted for items such as depreciation and amortization, general and administrative expenses, transaction costs from unsuccessful deals and business combinations and litigation expenses. Cash NOI is NOI less straight-line rents and above and below market rent amortization.
NRSF Held for Development
Represents incremental data center capacity that may be constructed in existing facilities that requires significant capital investment in order to develop new data center facilities. The estimates are based on current construction plans and expectations regarding entitlements, and they are subject to change based on current economic conditions, final zoning approvals, and the supply and demand of the market. The estimated NRSF for new development projects is based on the entire building size. NRSF placed into service may change depending on the final construction and utilization of the built space.
NRSF Under Construction
Represents NRSF for which substantial activities are ongoing to prepare the property for its intended use following development. The NRSF reflects management’s estimate of engineering drawings and required support space and is subject to change based on final demising of space. TKD estimated development costs include two components: 1) general construction to ready the NRSF as data center space and 2) power, cooling and other infrastructure to provide the designed amount of power capacity for the project. Following development completion, incremental capital, referred to as Deferred Expansion Capital, may be invested to support existing or anticipated future customer utilization of NRSF within our operating data centers.
NRSF Pre-Construction
Represents NRSF for which the projects are in the design and permitting stage. Construction will commence upon receipt of the applicable permits. The estimated completion dates are subject to change based on the timing of final design and permitting approvals.
Turn-Key Same-Store
Includes turn-key data center space that was leased or available to be leased to our colocation customers as of December 31, 2017, at each of our properties, and excludes powered shell data center space, office and light-industrial space and space for which development was completed and became available to be leased after December 31, 2017. The turn-key same-store space as of December 31, 2017, is 1,771,880 NRSF. We track same-store on a computer room basis within each data center facility.
Stabilized and Pre-Stabilized NRSF
Data center projects and facilities that recently have been developed and are in the initial lease-up phase are classified as pre-stabilized NRSF until they reach 85% occupancy or have been in service for 24 months. Pre-stabilized projects and facilities become stabilized operating properties at the earlier of achievement of 85% occupancy or 24 months after development completion and are included in the stabilized operating NRSF.
|
Quarter Ended June 30, 2019 |
Overview | Financial
Statements | Operating
Portfolio | Development | Capital
Structure | Components
of NAV | Guidance | Appendix | 27 |