SELECTED CONSOLIDATED FINANCIAL DATA
The summary information presented below under "Selected Balance Sheet Data" and "Selected Operations Data" for, and as of the end of, each of the years ended September 30 is derived from our audited consolidated financial statements. The following information is only a summary and you should read it in conjunction with our consolidated financial statements and notes beginning on page 44.
| | | September 30, | |
| | | 2010 | | | 2009 | | | 2008 | | | 2007 | | | 2006 | |
| | | (Dollars in thousands, except per share amounts) | |
| Selected Balance Sheet Data: | | | | | | | | | | | | | | | |
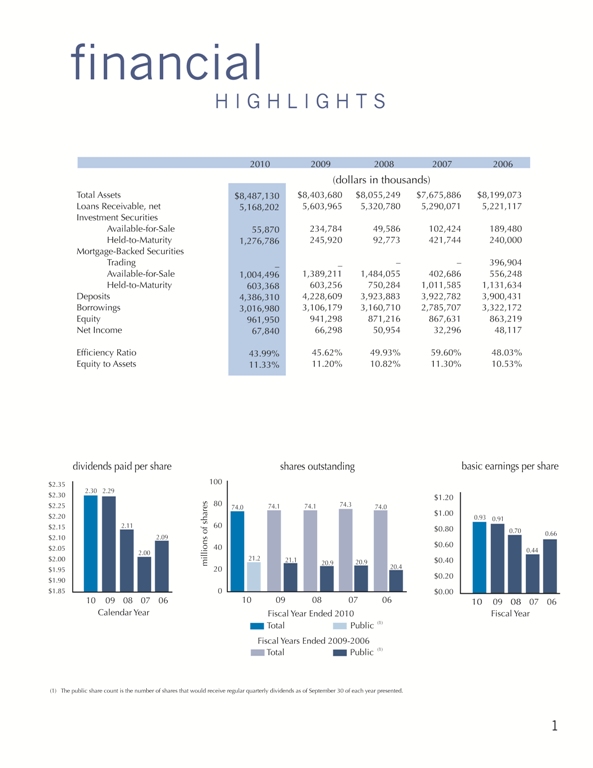
| Total assets | | $ | 8,487,130 | | | $ | 8,403,680 | | | $ | 8,055,249 | | | $ | 7,675,886 | | | $ | 8,199,073 | |
| Loans receivable, net | | | 5,168,202 | | | | 5,603,965 | | | | 5,320,780 | | | | 5,290,071 | | | | 5,221,117 | |
| Investment securities: | | | | | | | | | | | | | | | | | | | | |
| Available-for-sale (“AFS”) | | | 55,870 | | | | 234,784 | | | | 49,586 | | | | 102,424 | | | | 189,480 | |
| Held-to-maturity (“HTM”) | | | 1,276,786 | | | | 245,920 | | | | 92,773 | | | | 421,744 | | | | 240,000 | |
| Mortgage-backed securities (“MBS”): | | | | | | | | | | | | | | | | | | | | |
| Trading | | | -- | | | | -- | | | | -- | | | | -- | | | | 396,904 | |
| AFS | | | 1,004,496 | | | | 1,389,211 | | | | 1,484,055 | | | | 402,686 | | | | 556,248 | |
| HTM | | | 603,368 | | | | 603,256 | | | | 750,284 | | | | 1,011,585 | | | | 1,131,634 | |
| Capital stock of Federal Home Loan Bank (“FHLB”) | | | 120,866 | | | | 133,064 | | | | 124,406 | | | | 139,661 | | | | 165,130 | |
| Deposits | | | 4,386,310 | | | | 4,228,609 | | | | 3,923,883 | | | | 3,922,782 | | | | 3,900,431 | |
| Advances from FHLB | | | 2,348,371 | | | | 2,392,570 | | | | 2,447,129 | | | | 2,732,183 | | | | 3,268,705 | |
| Other borrowings | | | 668,609 | | | | 713,609 | | | | 713,581 | | | | 53,524 | | | | 53,467 | |
| Stockholders’ equity | | | 961,950 | | | | 941,298 | | | | 871,216 | | | | 867,631 | | | | 863,219 | |
| Book value per share | | | 13.11 | | | | 12.85 | | | | 11.93 | | | | 11.88 | | | | 11.89 | |
| | | | | | | | | | | | | | | | | | | | | |
| | | | | | | | | | | | | | | | | | | | | |
| | | Year Ended September 30, | |
| | | | 2010 | | | | 2009 | | | | 2008 | | | | 2007 | | | | 2006 | |
| | | (Dollars and counts in thousands, except per share amounts) | |
| Selected Operations Data: | | | | | | | | | | | | | | | | | | | | |
| Total interest and dividend income | | $ | 374,051 | | | $ | 412,786 | | | $ | 410,806 | | | $ | 411,550 | | | $ | 410,928 | |
| Total interest expense | | | 204,486 | | | | 236,144 | | | | 276,638 | | | | 305,110 | | | | 283,905 | |
| Net interest income | | | 169,565 | | | | 176,642 | | | | 134,168 | | | | 106,440 | | | | 127,023 | |
| Provision (recovery) for loan losses | | | 8,881 | | | | 6,391 | | | | 2,051 | | | | (225 | ) | | | 247 | |
| Net interest income after provision | | | | | | | | | | | | | | | | | | | | |
| (recovery) for loan losses | | | 160,684 | | | | 170,251 | | | | 132,117 | | | | 106,665 | | | | 126,776 | |
| Retail fees and charges | | | 17,789 | | | | 18,023 | | | | 17,805 | | | | 16,120 | | | | 17,007 | |
| Other income | | | 16,622 | | | | 10,571 | | | | 12,222 | | | | 7,846 | | | | 7,788 | |
| Total other income | | | 34,411 | | | | 28,594 | | | | 30,027 | | | | 23,966 | | | | 24,795 | |
| Total other expenses | | | 89,730 | | | | 93,621 | | | | 81,989 | | | | 77,725 | | | | 72,868 | |
| Income before income tax expense | | | 105,365 | | | | 105,224 | | | | 80,155 | | | | 52,906 | | | | 78,703 | |
| Income tax expense | | | 37,525 | | | | 38,926 | | | | 29,201 | | | | 20,610 | | | | 30,586 | |
| Net income | | | 67,840 | | | | 66,298 | | | | 50,954 | | | | 32,296 | | | | 48,117 | |
| | | | | | | | | | | | | | | | | | | | | |
| Basic earnings per share | | $ | 0.93 | | | $ | 0.91 | | | $ | 0.70 | | | $ | 0.44 | | | $ | 0.66 | |
| Average shares outstanding | | | 73,270 | | | | 73,144 | | | | 72,939 | | | | 72,849 | | | | 72,595 | |
| Diluted earnings per share | | $ | 0.93 | | | $ | 0.91 | | | $ | 0.70 | | | $ | 0.44 | | | $ | 0.66 | |
| Average diluted shares outstanding | | | 73,287 | | | | 73,208 | | | | 73,013 | | | | 72,970 | | | | 72,854 | |
| | | 2010 | | | 2009 | | | 2008 | | | 2007 | | | 2006 | |
| Selected Performance and Financial Ratios | | | | | | | | | | | | | | | |
| and Other Data: | | | | | | | | | | | | | | | |
| Performance Ratios: | | | | | | | | | | | | | | | |
| Return on average assets | | | 0.80 | % | | | 0.81 | % | | | 0.65 | % | | | 0.41 | % | | | 0.58 | % |
| Return on average equity | | | 7.09 | | | | 7.27 | | | | 5.86 | | | | 3.72 | | | | 5.58 | |
Dividends paid per public share (1) | | $ | 2.29 | | | $ | 2.11 | | | $ | 2.00 | | | $ | 2.09 | | | $ | 2.30 | |
| Dividend payout ratio | | | 71.34 | % | | | 66.47 | % | | | 81.30 | % | | | 133.14 | % | | | 97.41 | % |
| Ratio of operating expense to | | | | | | | | | | | | | | | | | | | | |
| average total assets | | | 1.06 | | | | 1.14 | | | | 1.04 | | | | 0.98 | | | | 0.88 | |
| Efficiency ratio | | | 43.99 | | | | 45.62 | | | | 49.93 | | | | 59.60 | | | | 48.03 | |
| Ratio of average interest-earning assets | | | | | | | | | | | | | | | | | | | | |
| to average interest-bearing liabilities | | | 1.11 | x | | | 1.12 | x | | | 1.12 | x | | | 1.12 | x | | | 1.11 | x |
| Interest rate spread information: | | | | | | | | | | | | | | | | | | | | |
| Average during period | | | 1.78 | % | | | 1.86 | % | | | 1.35 | % | | | 0.93 | % | | | 1.19 | % |
| End of period | | | 1.76 | | | | 1.89 | | | | 1.70 | | | | 0.89 | | | | 1.07 | |
| Net interest margin | | | 2.06 | | | | 2.20 | | | | 1.75 | | | | 1.36 | | | | 1.57 | |
| Asset Quality Ratios: | | | | | | | | | | | | | | | | | | | | |
| Non-performing assets to total assets | | | 0.49 | | | | 0.46 | | | | 0.23 | | | | 0.12 | | | | 0.10 | |
| Non-performing loans to total loans | | | 0.62 | | | | 0.55 | | | | 0.26 | | | | 0.14 | | | | 0.11 | |
| Allowance for loan losses to | | | | | | | | | | | | | | | | | | | | |
| non-performing loans | | | 46.60 | | | | 32.83 | | | | 42.37 | | | | 56.87 | | | | 79.03 | |
| Allowance for loan losses to | | | | | | | | | | | | | | | | | | | | |
| loans receivable, net | | | 0.29 | | | | 0.18 | | | | 0.11 | | | | 0.08 | | | | 0.08 | |
| Capital Ratios: | | | | | | | | | | | | | | | | | | | | |
| Equity to total assets at end of period | | | 11.33 | | | | 11.20 | | | | 10.82 | | | | 11.30 | | | | 10.53 | |
| Average equity to average assets | | | 11.30 | | | | 11.08 | | | | 11.05 | | | | 10.91 | | | | 10.47 | |
| | | | | | | | | | | | | | | | | | | | | |
| Regulatory Capital Ratios of Bank: | | | | | | | | | | | | | | | | | | | | |
| Tangible equity | | | 9.8 | | | | 10.0 | | | | 10.0 | | | | 10.3 | | | | 9.5 | |
| Tier 1 (core) capital | | | 9.8 | | | | 10.0 | | | | 10.0 | | | | 10.3 | | | | 9.5 | |
| Tier I risk-based capital | | | 23.5 | | | | 23.2 | | | | 23.1 | | | | 22.9 | | | | 22.6 | |
| Total risk-based capital | | | 23.8 | | | | 23.3 | | | | 23.0 | | | | 22.8 | | | | 22.5 | |
| | | | | | | | | | | | | | | | | | | | | |
| Other Data: | | | | | | | | | | | | | | | | | | | | |
| Number of traditional offices | | | 35 | | | | 33 | | | | 30 | | | | 29 | | | | 29 | |
| Number of in-store offices | | | 11 | | | | 9 | | | | 9 | | | | 9 | | | | 9 | |
(1) For all years shown, Capitol Federal Savings Bank MHC, which owns a majority of the outstanding shares of Capitol Federal Financial common stock, waived its right to receive dividends paid on the common stock with the exception of the $0.50 per share dividend paid on 500,000 shares in February 2010. Public shares exclude shares held by Capitol Federal Savings Bank MHC, as well as unallocated shares held in the Capitol Federal Financial Employee Stock Ownership Plan (“ESOP”). See page 27 for additional information.
MANAGEMENT'S DISCUSSION AND ANALYSIS OF
FINANCIAL CONDITION AND RESULTS OF OPERATIONS
General Overview
Capitol Federal Financial (the “Company”) is the mid-tier holding company and the sole shareholder of Capitol Federal Savings Bank (the “Bank”). Capitol Federal Savings Bank MHC (“MHC”), a federally chartered mutual holding company, is the majority owner of the Company. MHC owns 52,192,817 shares of the 73,992,678 voting shares outstanding on September 30, 2010. The Company’s common stock is traded on the NASDAQ Global Select Market under the symbol “CFFN.” The Bank comprises almost all of the consolidated assets and liabilities of the Company and the Company is dependent primarily upon the performance of the Bank for the results of its operations. Because of this relationship, references to management actions, strategies and resu lts of actions apply to both the Bank and the Company.
Private Securities Litigation Reform Act—Safe Harbor Statement
We may from time to time make written or oral "forward-looking statements", including statements contained in our filings with the Securities and Exchange Commission (“SEC”). These forward-looking statements may be included in this annual report to stockholders and in other communications by the Company, which are made in good faith by us pursuant to the "safe harbor" provisions of the Private Securities Litigation Reform Act of 1995.
These forward-looking statements include statements about our beliefs, plans, objectives, goals, expectations, anticipations, estimates and intentions that are subject to significant risks and uncertainties, and are subject to change based on various factors, some of which are beyond our control. The words "may", "could", "should", "would", "believe", "anticipate", "estimate", "expect", "intend", "plan" and similar expressions are intended to identify forward-looking statements. The following factors, among others, could cause our future results to differ materially from the plans, objectives, goals, expectations, anticipations, estimates and intentions expressed in the forward-looking statements:
| · | our ability to continue to maintain overhead costs at reasonable levels; |
| · | our ability to continue to originate a significant volume of one- to four-family mortgage loans in our market areas; |
| · | our ability to acquire funds from or invest funds in wholesale or secondary markets; |
| · | the future earnings and capital levels of the Bank, which could affect the ability of the Company to pay dividends in accordance with its dividend policies; |
| · | fluctuations in deposit flows, loan demand, and/or real estate values, which may adversely affect our business; |
| · | the credit risks of lending and investing activities, including changes in the level and direction of loan delinquencies and write-offs and changes in estimates of the adequacy of the allowance for loan losses (“ALLL”); |
| · | results of examinations of the Bank by its primary regulator, the Office of Thrift Supervision (the “OTS”), including the possibility that the OTS may, among other things, require the Bank to increase its ALLL; |
| · | the strength of the U.S. economy in general and the strength of the local economies in which we conduct operations; |
| · | the effects of, and changes in, trade, monetary and fiscal policies and laws, including interest rate policies of the Board of Governors of the Federal Reserve System; |
| · | the effects of, and changes in, foreign and military policies of the United States government; |
| · | inflation, interest rate, market and monetary fluctuations; |
| · | our ability to access cost-effective funding; |
| · | the timely development and acceptance of our new products and services and the perceived overall value of these products and services by users, including the features, pricing and quality compared to competitors’ products and services; |
| · | the willingness of users to substitute competitors’ products and services for our products and services; |
| · | our success in gaining regulatory approval of our products and services and branching locations, when required; |
| · | the impact of changes in financial services laws and regulations, including laws concerning taxes, banking securities and insurance and the impact of other governmental initiatives affecting the financial services industry; |
| · | implementing business initiatives may be more difficult or expensive than anticipated; |
| · | acquisitions and dispositions; |
| · | changes in consumer spending and saving habits; and |
| · | our success at managing the risks involved in our business. |
This list of important factors is not exclusive. We do not undertake to update any forward-looking statement, whether written or oral, that may be made from time to time by or on behalf of the Company or the Bank.
The following discussion is intended to assist in understanding the financial condition and results of operations of the Company. The discussion includes comments relating to the Bank, since the Bank is wholly owned by the Company and comprises the majority of assets and is the principal source of income for the Company.
Executive Summary
The following summary should be read in conjunction with our Management’s Discussion and Analysis of Financial Condition and Results of Operations in its entirety.
The Boards of Directors of MHC, the Company and the Bank adopted a Plan of Conversion and Reorganization (“the Plan”) on May 5, 2010. Pursuant to the Plan, MHC intends to convert from the mutual holding company form of organization to a stock form of organization. MHC will be merged into the Company, and MHC will no longer exist. As part of the conversion, MHC’s ownership interest of the Company is being offered for sale in a public offering. The existing publicly held shares of the Company, which represent the remaining ownership interest in the Company, will be exchanged for new shares of common stock of Capitol Federal Financial, Inc., a new Maryland corporation. When the conversion and public offering are completed, all of the outstanding capital stock of the Bank will be owned by Capitol Federal Financial, Inc. and all of the outstanding capital stock of Capitol Federal Financial, Inc. will be owned by the public.
Our principal business consists of attracting deposits from the general public and investing those funds primarily in permanent loans secured by first mortgages on owner-occupied, one- to four-family residences. To a much lesser extent, we also originate home equity and other consumer loans, loans secured by first mortgages on non-owner-occupied one- to four-family residences and commercial properties, construction loans secured by one- to four-family residences, commercial real estate loans, and multi-family real estate loans. While our primary business is the origination of one- to four-family loans funded through retail deposits, we also purchase whole loans and invest in certain investment securities and MBS and use FHLB advances, repurchase agreements and other borrowings as additional funding sources.
The Company is significantly affected by prevailing economic conditions including federal monetary and fiscal policies and federal regulation of financial institutions. Deposit balances are influenced by a number of factors including interest rates paid on competing personal investment products, the level of personal income, and the personal rate of savings within our market areas. Lending activities are influenced by the demand for housing and other loans, changing loan underwriting guidelines, as well as interest rate pricing competition from other lending institutions. The primary sources of funds for lending activities include deposits, loan repayments, investment income, borrowings, and funds provided from operations.
The Company’s results of operations are primarily dependent on net interest income, which is the difference between the interest earned on loans, MBS, investment securities and cash, and the interest paid on deposits and borrowings. On a weekly basis, management reviews deposit flows, loan demand, cash levels, and changes in several market rates to assess all pricing strategies. We generally price our loan and deposit products based upon an analysis of our competition and changes in market rates. The Bank generally prices its first mortgage loan products based on secondary market and competitor pricing. Generally, deposit pricing is based upon a survey of competitors in the Bank’s market areas, and the need to attract funding and retain maturing deposits. The majority of our loans are fixed-rate products with maturities up to 30 years, while the majority of our deposits have maturity or repricing dates of less than two years.
During fiscal year 2010, the economy began to show signs of recovery, as evidenced by increases in consumer spending and the stabilization of the labor market, the housing sector, and financial markets. However, unemployment levels remained elevated and unemployment periods prolonged, housing prices remained depressed and demand for housing was weak, due to distressed sales and tightened lending standards. In an effort to support mortgage lending and housing market recovery, and to help improve credit conditions overall, the Federal Open Market Committee of the Federal Reserve has maintained the overnight lending rate between zero and 25 basis points since December 2008. At the November 2010 Federal Open Market Committee meeting, the Committee announced a second round of quantitative easing. Un der this new program, the Federal Reserve is committed to purchasing $600 billion, or approximately $75 billion per month, of Treasury securities over the next eight months. By doing this, the Federal Reserve will effectively increase the amount of excess reserves in the banking system and reduce long-term interest rates in an effort to help stimulate the economy.
The historically low interest rate environment during the past two fiscal years spurred an increased demand for our loan modification program and mortgage refinances. Our loan modification program allows existing loan customers, whose loans have not been sold to third parties and who have been current on their contractual loan payments for the previous 12 months, the opportunity to modify, for a fee, their original loan terms to current loan terms being offered. During fiscal years 2010 and 2009, the Bank modified $545.1 million and $1.14 billion of
originated loans, respectively, with a weighted average rate decrease of 87 basis points for both periods. Additionally, the Bank refinanced $153.6 million and $267.4 million of its loans during fiscal years 2010 and 2009, respectively. In an effort to mitigate the net interest income impact from the repricing of our loan portfolio to lower rates, the Bank refinanced $200.0 million and $875.0 million of FHLB advances during fiscal years 2010 and 2009, respectively. Additionally, our deposit portfolio repriced down 59 basis points from September 30, 2009 to a weighted average rate of 1.61% at September 30, 2010.
Total assets increased $83.5 million, from $8.40 billion at September 30, 2009 to $8.49 billion at September 30, 2010, due primarily to growth in the deposit portfolio, which was used primarily to fund investment security purchases and repay maturing debt. During the first quarter of fiscal year 2010, $194.8 million of originated fixed-rate mortgage loans were swapped for MBS (“loan swap transaction”). The MBS were sold and the proceeds were primarily reinvested into investment securities with terms shorter than that of the loans swapped. The transaction was executed as a means of reducing future interest rate risk sensitivity as measured at that time.
The loans receivable portfolio decreased $435.8 million from $5.60 billion at September 30, 2009 to $5.17 billion at September 30, 2010. During fiscal year 2010, principal repayments on loans have exceeded originations, refinances, and purchases by $225.6 million. Mortgage origination volume, in general, has decreased from the prior year as the market demand for lending has decreased. The balance of loans 30 to 89 days delinquent decreased $2.1 million from $26.8 million at September 30, 2009 to $24.7 million at September 30, 2010. Non-performing loans increased $1.1 million from $30.9 million at September 30, 2009 to $32.0 million at September 30, 2010. The balance of non-performing loans continues to remain at historically high levels due to the continued high level of unemployment coupled with th e decline in real estate values, particularly in some of the states in which we have purchased loans. Despite the current economic operating environment and some deterioration in our loan portfolio we believe that our overall credit quality continued to compare favorably to the industry and our peers.
The balance of MBS decreased $384.6 million from $1.99 billion at September 30, 2009 to $1.61 billion at September 30, 2010. The decrease in the balance was a result of the majority of the cash flows from the MBS portfolio being reinvested into the investment securities portfolio. Investment securities increased $852.0 million, from $480.7 million at September 30, 2009 to $1.33 billion at September 30, 2010. The investment security portfolio balance increased as a result of purchases funded with proceeds from the loan swap transaction, MBS and loan principal repayments and, to a lesser extent, from an increase in retail deposits. The investment securities purchased had a weighted average life (“WAL”) of less than 2 years at the time of purchase. If market rates were to ri se, the short-term nature of these securities may allow management the opportunity to reinvest the maturing funds at a higher rate.
Total liabilities increased $62.8 million from $7.46 billion at September 30, 2009 to $7.53 billion at September 30, 2010, due primarily to an increase in deposits of $157.7 million. The increase in deposits was primarily in money market and checking accounts. Also during fiscal year 2010, $200.0 million of FHLB advances were refinanced, $100.0 million of maturing FHLB advances were replaced in their entirety, and $50.0 million of maturing FHLB advances and $45.0 million of maturing repurchase agreements were not replaced.
The Company recognized net income of $67.8 million for the fiscal year ended September 30, 2010, compared to net income of $66.3 million for the fiscal year ended September 30, 2009. The $1.5 million increase in net income was primarily a result of a $5.8 million increase in other income, a $3.9 million decrease in other expenses and a $1.4 million decrease in income tax expense, partially offset by a $7.1 million decrease in net interest income and a $2.5 million increase in provision for loan losses. The $5.8 million increase in other income was due primarily to the $6.5 million gain on the sale of trading MBS received in conjunction with the loan swap transaction. The $3.9 million decrease in other expenses was due primarily to an impairment and valuation allowance taken on the mortgage-servicing right s asset in the prior year period, compared to a net recovery in the current period. The $1.4 million decrease in income tax expense was a result of a decrease in the effective tax rate to 35.6% in the current fiscal year compared to 37.0% in the prior fiscal year. The net interest margin for fiscal year 2010 was 2.06% compared to 2.20% for fiscal year 2009. The 14 basis point decrease in the net interest margin was primarily a result of an increase in the average balance of interest-earning assets at lower yields compared to the prior year. The $8.9 million provision for loan losses recorded during fiscal year 2010 is composed of $5.0 million related to increases in certain loss factors in our general valuation allowance model and $3.9 million related to establishing or increasing specific valuation allowances.
The Bank has opened three new branches in our Kansas City market area and a new branch in the Wichita market area since the beginning of fiscal year 2010. The Bank continues to consider expansion opportunities in all of its market areas.
Critical Accounting Policies
Our most critical accounting policies are the methodologies used to determine the ALLL, other-than-temporary declines in the value of securities and fair value measurements. These policies are important to the presentation of our financial condition and results of operations, involve a high degree of complexity, and require management to make difficult and subjective judgments that may require assumptions or estimates about highly uncertain matters. The use of different judgments, assumptions, and estimates could cause reported results to differ materially. These critical accounting policies and their application are reviewed at least annually by our audit committee. The following is a description of our critical accounting policies and an explanation of the methods and assumptions underlying t heir application.
Allowance for Loan Losses. Management maintains an ALLL to absorb known and inherent losses in the loan portfolio based upon ongoing quarterly assessments of the loan portfolio. Our methodology for assessing the appropriateness of the ALLL consists of a formula analysis for general valuation allowances and specific valuation allowances for identified problem and impaired loans. The ALLL is maintained through provisions for loan losses which are charged to income. The methodology for determining the ALLL is considered a critical accounting policy by management because of the high degree of judgment involved, the subjectivity of the assumptions used, and the potential for changes in the economic environment that could result in changes to th e amount of the recorded ALLL.
Our primary lending emphasis is the origination and purchase of one- to four-family mortgage loans on residential properties, and, to a lesser extent, home equity and second mortgages on one- to four-family residential properties, resulting in a loan concentration in residential first mortgage loans. As a result of our lending practices, we also have a concentration of loans secured by real property located in Kansas and Missouri. At September 30, 2010, approximately 75% and 15% of the Bank’s loans were secured by real property located in Kansas and Missouri, respectively. Based on the composition of our loan portfolio, we believe the primary risks inherent in our portfolio are the continued weakened economic conditions, continued high levels of unemployment or underemployment, and a continuing decl ine in real estate values. Any one or a combination of these events may adversely affect borrowers’ ability to repay their loans, resulting in increased delinquencies, non-performing assets, loan losses, and future levels of loan loss provisions. Although management believes that the Bank has established and maintained the ALLL at appropriate levels, additions may be necessary if economic and other conditions continue or worsen substantially from the current operating environment.
Management considers quantitative and qualitative factors when determining the appropriateness of the ALLL. Such factors include the trend and composition of delinquent and non-performing loans, results of foreclosed property and short sale transactions (historical losses and net charge-offs), the current status and trends of local and national economies, particularly levels of unemployment, trends and current conditions in the real estate and housing markets, and loan portfolio growth and concentrations. Since our loan portfolio is primarily concentrated in one- to four-family real estate, we monitor one- to four-family real estate market value trends in our local market areas and geographic sections of the U.S. by reference to various industry and market reports, economic releases and surveys, and our general and specific kn owledge of the real estate markets in which we lend, in order to determine what impact, if any, such trends may have on the level of our ALLL. We also use ratio analyses as a supplemental tool for evaluating the overall reasonableness of the ALLL. We consider the observed trends in the ratios, taking into consideration the composition of our loan portfolio compared to our peers, in combination with our historical loss experience. In addition, the OTS reviews the adequacy of the Company’s ALLL during its examination process. We consider any comments from the OTS when assessing the appropriateness of our ALLL. Reviewing these quantitative and qualitative factors assists management in evaluating the overall reasonableness of the ALLL and whether changes need to be made to our assumptions. We seek to apply ALLL methodology in a consistent manner; however, the methodology can be modified in response to changing conditions.
Our loan portfolio is segregated into categories in the formula analysis based on certain risk characteristics such as loan type (one- to four-family, multi-family, etc.), interest payments (fixed-rate, adjustable-rate), loan source (originated or purchased), loan-to-value (“LTV”) ratios, borrower’s credit score and payment status (i.e. current or number of days delinquent). Consumer loans, such as second mortgages and home equity lines of credit, with the same underlying collateral as a one- to four-family loan are combined with the one- to four-family loan in the formula analysis to calculate a combined LTV ratio. All loans that are not impaired are included in a formula analysis. Impaired loans are defined as non-accrual loans, loans classified as substandard, loans with specific valu ation allowances and troubled debt restructurings that have not yet performed under the restructured terms for 12 consecutive months. Quantitative loss factors are applied to each loan category in the formula analysis based on the historical net loss experience and current specific valuation allowances, adjusted for such factors as loan delinquency trends, for each respective loan category. Additionally, qualitative loss factors that management believes impact the collectability of the loan portfolio as of the evaluation date are applied to certain loan categories. Such qualitative factors include changes in collateral values, unemployment rates, credit scores and delinquent loan trends. Loss factors increase as loans become classified or delinquent.
The qualitative and quantitative factors applied in the formula analysis are reviewed quarterly by management to assess whether the factors adequately cover probable and estimable losses inherent in the loan portfolio. Our ALLL methodology permits modifications to the formula analysis in the event that, in management’s judgment, significant
factors which affect the collectability of the portfolio or any category of the loan portfolio, as of the evaluation date, are not reflected in the current formula analysis. Management’s evaluation of the qualitative factors with respect to these conditions is subject to a higher degree of uncertainty because they are not identified with a specific problem loan or portfolio segments. During fiscal year 2010, management adjusted certain loss factors in the formula analysis to account for lingering negative economic conditions and the relatively recent loss experience on our purchased loan portfolio. If our future loss experience requires additional increases in our loss factors, this may result in increased levels of loan loss provisions.
Specific valuation allowances are established in connection with individual loan reviews of specifically identified problem and impaired loans. Since the majority of our loan portfolio is composed of one- to four-family real estate, determining the estimated fair value of the underlying collateral is important in evaluating the amount of specific valuation allowances required for problem and impaired loans. Generally, once a purchased loan is 90 days delinquent new collateral values are obtained through automated valuation models or broker price opinions. An updated automated valuation model or broker price opinion is then requested every 6 months while the loan is greater than 90 days delinquent. Due to the relatively stable home values in Kan sas and Missouri, we do not obtain new collateral values on originated loans until they enter foreclosure. If the estimated fair value of the collateral, less estimated costs to sell, is less than the current loan balance, a specific valuation allowance is established for the difference.
Loans with an outstanding balance of $1.5 million or more are individually reviewed annually if secured by property in one of the following categories: multi-family (five or more units) property, unimproved land, other improved commercial property, acquisition and development of land projects, developed building lots, office building, single-use building, or retail building. Specific valuation allowances are established if the individual loan review determines a quantifiable impairment.
Securities Impairment. Management monitors the securities portfolio for other-than-temporary impairments on an ongoing basis and performs a formal review quarterly. The process involves monitoring market events and other items that could impact the issuers’ ability to perform. The evaluation includes, but is not limited to such factors as: the nature of the investment, the length of time the security has had a fair value less than the amortized cost basis, the cause(s) and severity of the loss, expectation of an anticipated recovery period, recent events specific to the issuer or industry including the issuer’s financial condition and the current ability to make future payments in a timely manner, external credit ratings and re cent downgrades in such ratings, the Company’s intent to sell and whether it is more likely than not the Company would be required to sell a security prior to recovery for debt securities.
Management determines whether other-than-temporary impairment losses should be recognized for impaired securities by assessing all known facts and circumstances surrounding the securities. If the Company intends to sell an impaired security or if it is more likely than not that the Company will be required to sell an impaired security before recovery of its amortized cost basis, an other-than-temporary impairment will be recognized and the difference between amortized cost and fair value will be recognized as a loss in earnings. At September 30, 2010, no securities had been identified as other-than-temporarily impaired.
Fair Value Measurements. The Company uses fair value measurements to record fair value adjustments to certain assets and to determine fair value disclosures, per the provisions of Accounting Standards Codification (“ASC”) 820, Fair Value Measurements and Disclosures. In accordance with ASC 820, the Company groups its assets at fair value in three levels, based on the markets in which the assets are traded and the reliability of the underlying assumptions used to determine fair value, with Level 1 (quoted prices for identical assets in an active market) being considered the most reliable, and Level 3 having the most unobservable inputs and therefore being considered the least reliable. � 60;The Company bases its fair values on the price that would be received to sell an asset in an orderly transaction between market participants at the measurement date. As required by ASC 820, the Company maximizes the use of observable inputs and minimizes the use of unobservable inputs when measuring fair value. The Company did not have any liabilities that were measured at fair value at September 30, 2010.
The Company’s AFS securities are our most significant assets measured at fair value on a recurring basis. Changes in the fair value of AFS securities are recorded, net of tax, in accumulated other comprehensive income, which is a component of stockholders’ equity. As part of determining fair value, the Company obtains fair values for all AFS securities from independent nationally recognized pricing services. Various modeling techniques are used to determine pricing for the Company’s securities, including option pricing and discounted cash flow models. The inputs to these models may include benchmark yields, reported trades, broker/dealer quotes, issuer spreads, benchmark securities, bids, offers and reference data. There are some AFS securities in the AFS portfolio that have significant unobservable inputs requiring the independent pricing services to use some judgment in pricing the related securities. These AFS securities are classified as Level 3. All other AFS securities are classified as Level 2.
Loans receivable and real estate owned (“REO”) are the Company’s significant assets measured at fair value on a non-recurring basis. These non-recurring fair value adjustments involve the application of lower-of-cost-or-fair value accounting or write-downs of individual assets. Fair value for these assets is estimated using current appraisals, automated valuation models, broker price opinions, or listing prices. Fair values may be adjusted by management to reflect current economic and market conditions and, as such, are classified as Level 3.
Recent Accounting Pronouncements. For a discussion of Recent Accounting Pronouncements, see “Notes to Financial Statements - Note 1 - Summary of Significant Accounting Policies.”
Management Strategy
We are a retail-oriented financial institution dedicated to serving the needs of customers in our market areas. Our commitment is to provide qualified borrowers the broadest possible access to home ownership through our mortgage lending programs and to offer a complete set of personal banking products and services to our customers. We strive to enhance stockholder value while maintaining a strong capital position. To achieve these goals, we focus on the following strategies:
| · | Residential Portfolio Lending. We are one of the largest originators of one- to four-family loans in the state of Kansas. We have originated these loans primarily for our own portfolio, rather than for sale, and generally we service the loans we originate. We provide retail customers with alternatives for their borrowing needs by offering both fixed- and adjustable-rate products with various terms to maturity and pricing alternatives. We offer special programs to individuals who may be first time home buyers, have low or moderate incomes or may have certain credit risk concerns in order to maximize our ability to deliver home ownership opportunities. Through our marketing efforts that reflect our reputation and pricing, and strong relationshi ps with real estate agents, we attract mortgage loan business from walk-in customers, customers that apply online, and existing customers. We also purchase from correspondent lenders one- to four-family loans secured by property primarily located within our market areas and select market areas in Missouri, as well as one- to four-family loans from nationwide lenders. |
| · | Retail Financial Services. We offer a wide array of deposit products and retail services for our customers. These products include checking, savings, money market, certificates of deposit and retirement accounts. These products and services are provided through a branch network of 46 locations, including traditional branch and retail store locations, our call center which operates on extended hours, telephone bill payment services and Internet-based transaction services. |
| · | Cost Control. We generally are very effective at controlling our costs of operations. By using technology, we are able to centralize our lending and deposit support functions for efficient processing. We have located our branches to serve a broad range of customers through relatively few branch locations. Our average deposit base per traditional branch at September 30, 2010 was approximately $114.2 million. This large average deposit base per branch helps to control costs. The average deposit base per traditional branch decreased the past two years due to the opening of new traditional branches; however, the deposit base at our existing traditional branches increased during the same time period which helped to offset the impact of the new branches. Our one- to four-family lending strategy and our effective management of credit risk allows us to service a large portfolio of loans at efficient levels because it costs less to service a portfolio of performing loans. For the year ended September 30, 2010, our efficiency ratio was 43.99%. |
| · | Asset Quality. We utilize underwriting standards for our lending products that are designed to limit our exposure to credit risk. We require complete documentation for both originated and purchased loans, and make credit decisions based on our assessment of the borrower’s ability to repay the loan in accordance with its terms. See additional discussion of asset quality in Part I, Item 1 of the Annual Report on Form 10-K. |
| · | Capital Position. Our policy has always been to protect the safety and soundness of the Bank through conservative credit and operational risk management, balance sheet strength, and sound operations. The end result of these activities is a capital ratio in excess of the well-capitalized standards set by the OTS. We believe that maintaining a strong capital position safeguards the long-term interests of the Bank, the Company and our stockholders. |
| · | Stockholder Value. We strive to enhance stockholder value while maintaining a strong capital position. One way that we continue to provide returns to stockholders is through our dividend payments. Total dividends declared and paid during fiscal year 2010 were $2.29 per public share, which consisted of the regular quarterly dividends of $0.50 per public share and a special year-end dividend of $0.29 per public share. In October 2010, the Board of Directors declared a $0.50 per share quarterly dividend and $0.30 per share special year-end dividend which were paid on November 5, 2010 to holders of record on October 29, 2010. Due to MHC's waiver of dividends, the dividends were paid only on public shares. The Company’s cash dividend p ayout policy is reviewed quarterly by management and the Board of Directors, and the ability to pay dividends under the policy depends upon a number of factors, including the Company’s financial condition and results of operations, the Bank’s regulatory capital requirements, regulatory limitations on the Bank’s ability to make capital distributions to the Company, the amount of cash at the holding company and the continued waiver of dividends by MHC. It is management’s and the Board of Directors’ intentions to continue to pay regular quarterly dividends for the foreseeable future and a special dividend each year, to the extent justified by earnings. |
| · | Interest Rate Risk Management. Changes in interest rates are our primary market risk as our balance sheet is almost entirely comprised of interest-earning assets and interest-bearing liabilities. As such, fluctuations in interest rates have a significant impact not only upon our net income but also upon the cash flows related to those assets and liabilities and the market value of our assets and liabilities. In order to maintain acceptable levels of net interest income in varying interest rate environments, we take on a moderate amount of interest rate risk consistent with board policies. |
Quantitative and Qualitative Disclosure about Market Risk
Asset and Liability Management and Market Risk
The rates of interest the Bank earns on assets and pays on liabilities generally are established contractually for a period of time. Fluctuations in interest rates have a significant impact not only upon our net income, but also upon the cash flows of those assets and liabilities and the market value of our assets and liabilities. Our results of operations, like those of other financial institutions, are impacted by these changes in interest rates and the interest rate sensitivity of our interest-earning assets and interest-bearing liabilities. The risk associated with changes in interest rates on the earnings of the Bank and the market value of its financial assets and liabilities is known as interest rate risk. Interest rate risk is our most significant market risk and our ability to adapt to changes in interest rates is known as interest rate risk management.
The general objective of our interest rate risk management is to determine and manage an appropriate level of interest rate risk while maximizing net interest income, in a manner consistent with our policy to reduce, to the extent possible, the exposure of our net interest income to changes in market interest rates. The Asset and Liability Committee (“ALCO”) regularly reviews the interest rate risk exposure of the Bank by forecasting the impact of hypothetical, alternative interest rate environments on net interest income and market value of portfolio equity (“MVPE”) at various dates. The MVPE is defined as the net of the present value of the cash flows of an institution’s existing assets, liabilities and off-balance sheet instruments. The present values are determined based upon market conditions as of the date of the analysis as well as in alternative interest rate environments providing potential changes in MVPE under those alternative interest rate environments. Net interest income is projected in the same alternative interest rate environments as well, both with a static balance sheet and with management strategies considered. MVPE and net interest income analysis is also conducted that estimates sensitivity to rates for future time horizons based upon market conditions as of the date of the analysis. The Bank’s analysis of its net interest income and MVPE at September 30, 2010 indicated a general decrease in its risk exposure compared to September 30, 2009, primarily due to lower market interest rates at September 30, 2010.
Based upon management’s recommendations, the Board of Directors sets the asset and liability management policies of the Bank. These policies are implemented by ALCO. The purpose of ALCO is to communicate, coordinate and control asset and liability management consistent with board-approved policies. ALCO’s objectives are to manage assets and funding sources to produce the highest profitability balanced against liquidity, capital adequacy and risk management objectives. At each monthly meeting, ALCO recommends appropriate strategy changes. The Chief Financial Officer, or his designee, is responsible for executing, reviewing and reporting on the results of the policy recommendations and strategies to the Board of Directors, generally on a monthly basis.
The ability to maximize net interest income is dependent largely upon the achievement of a positive interest rate spread that can be sustained despite fluctuations in prevailing interest rates. The asset and liability repricing gap is a measure of the difference between the amount of interest-earning assets and interest-bearing liabilities which either reprice or mature within a given period of time. The difference provides an indication of the extent to which an institution's interest rate spread will be affected by changes in interest rates. A gap is considered positive when the amount of interest-earning assets exceeds the amount of interest-bearing liabilities, maturing or repricing during the same period. A gap is considered negative when the amount of interest-bearing liabilities exceeds the amount of interest-earning assets maturing or repricing during the same period. Generally, during a period of rising interest rates, a negative gap within shorter repricing periods adversely affects net interest income, while a positive gap within shorter repricing periods results in an increase in net interest income. During a period of falling interest rates, the opposite would generally be true. As of September 30, 2010, the ratio of our one-year gap to total assets was a positive 21.06%.
Management recognizes that dramatic changes in interest rates within a short period of time can cause an increase in our interest rate risk relative to the balance sheet. At times, ALCO may recommend increasing our interest rate risk exposure in an effort to increase our net interest margin, while maintaining compliance with established board limits for interest rate risk sensitivity. Management believes that maintaining and improving earnings is the best way to preserve a strong capital position. Management recognizes the need, in certain interest rate environments, to limit the Bank's exposure to changing interest rates and may implement strategies to reduce our interest rate risk which could, as a result, reduce earnings in the short-term. To minimize the potential for adverse effects of mat erial and prolonged changes in interest rates on our results of operations, we have adopted asset and liability management policies to better balance the maturities and repricing terms of our interest-earning assets and interest-bearing liabilities based on existing local and national interest rates.
During periods of economic uncertainty, rising interest rates or extreme competition for loans, the Bank’s ability to originate or purchase loans may be adversely affected. In such situations, the Bank alternatively may invest its funds into investment securities or MBS. These investments may have rates of interest lower than rates we could receive on loans, if we were able to originate or purchase them, potentially reducing the Bank’s interest income.
Qualitative Disclosure about Market Risk
Percentage Change in Net Interest Income. For each period end presented in the following table, the estimated percentage change in the Bank’s net interest income based on the indicated instantaneous, parallel and permanent change in interest rates is presented. The percentage change in each interest rate environment represents the difference between estimated net interest income in the 0 basis point interest rate environment (“base case”, assumes the forward market and product interest rates implied by the yield curve are realized) and estimated net interest income in each alternative interest rate environment (assumes market and product interest rates have a parallel shift in rates across all maturities by the indicated change in rates). ; Estimations of net interest income used in preparing the table below are based upon the assumptions that the total composition of interest-earning assets and interest-bearing liabilities does not change materially and that any repricing of assets or liabilities occurs at anticipated product and market rates for the alternative rate environments as of the dates presented. The estimation of net interest income does not include any projected gain or loss related to the sale of loans or securities, or income derived from non-interest income sources, but does include the use of different prepayment assumptions in the alternative interest rate environments. It is important to consider that the estimated changes in net interest income are for a cumulative four-quarter period. These do not reflect the earnings expectations of management.
| Change | | | Percentage Change in Net Interest Income | |
| (in Basis Points) | | | At September 30, | |
in Interest Rates (1) | | | 2010 | | | 2009 | |
| | -100 | bp | | | N/A | | | | N/A | |
| | 000 | bp | | | -- | | | | -- | |
| | +100 | bp | | | 6.44 | % | | | 0.84 | % |
| | +200 | bp | | | 4.56 | % | | | -0.54 | % |
| | +300 | bp | | | 0.93 | % | | | -2.41 | % |
| (1) | Assumes an instantaneous, permanent and parallel change in interest rates at all maturities. |
At September 30, 2010, the percentage change in the net interest income projections increased from September 30, 2009 in all the interest rate shock scenarios. The primary reason for the projected increase in net interest income projections over this time period was due to a significant decrease in interest rates from September 30, 2009 to September 30, 2010. The decrease in interest rates caused the WAL of mortgage-related assets and callable agency debentures to shorten significantly as borrowers have an economic incentive to refinance their mortgages into lower interest rate loans and agency debt issuers have an economic incentive to exercise their call options and issue lower costing debt. The cash flows from mortgage-related assets and callable agency debentures are reinvested into higher yielding in terest-earning assets as interest rates rise resulting in the yield on interest-earning assets increasing faster than the anticipated cost of interest-bearing liabilities. However, as interest rates rise, the financial incentive to refinance mortgages or call agency debentures is diminished resulting in reduced cash flows that could be reinvested at higher market rates.
Percentage Change in MVPE. The following table sets forth the estimated percentage change in the MVPE at each period end presented based on the indicated instantaneous, parallel and permanent change in interest rates. The percentage change in each interest rate environment represents the difference between MVPE in the base case and MVPE in each alternative interest rate environment. The estimations of MVPE used in preparing the table below are based upon the assumptions that the total composition of interest-earning assets and interest-bearing liabilities does not change, that any repricing of assets or liabilities occurs at current product or market rates for the alternative rate environments as of the dates presented, and that different prepayment rates are used in each alternative interest rate environment. The estimated MVPE results from the valuation of cash flows from financial assets and liabilities over the anticipated lives of each for each interest rate environment. The table presents the effects of the change in interest rates on our assets and liabilities as they mature, repay or reprice, as shown by the change in the MVPE in changing interest rate environments.
| Change | | | Percentage Change in MVPE | |
| (in Basis Points) | | | At September 30, | |
in Interest Rates (1) | | | 2010 | | | 2009 | |
| | -100 | bp | | | N/A | | | | N/A | |
| | 000 | bp | | | -- | | | | -- | |
| | +100 | bp | | | 0.10 | % | | | -4.92 | % |
| | +200 | bp | | | -8.76 | % | | | -18.11 | % |
| | +300 | bp | | | -22.42 | % | | | -34.32 | % |
| (1) | Assumes an instantaneous, permanent and parallel change in interest rates at all maturities. |
Changes in the estimated market values of our financial assets and liabilities drive changes in estimates of MVPE. The market value of shorter term-to-maturity financial instruments are less sensitive to changes in interest rates than the market value of longer term-to-maturity financial instruments. Because of this, our certificates of deposit (which have relatively short average lives) tend to display less sensitivity to changes in interest rates than do our mortgage-related assets (which have relatively long average lives). The average life expected on our mortgage-related assets varies under different interest rate environments because borrowers have the ability to prepay their mortgage loans.
The Bank’s MVPE declines in the +200 and +300 interest rate environments. As rates increase to these levels, the estimated fair values of the liabilities with short average lives do not respond to rates in the same manner as the longer maturity assets, such as our fixed-rate loans, which have longer average lives. The prepayment assumptions on the fixed-rate loans in particular, and all mortgage-related assets in general, are expected to slow down significantly as interest rate rise such that projected prepayments would likely only be realized through normal changes in borrowers lives, such as divorce, death, job-related relocations, and other life changing events. The lower prepayment assumptions extend the expected average lives on these assets, relative to assumptions in the base case, thereby increasing their sensitivity to changes in interest rates. The net effect of these characteristics of short-lived liabilities and long-lived assets is to increase the sensitivity of the Bank to changes in interest rates the more interest rates increase.
The sensitivity of the MVPE decreased from September 30, 2009 to September 30, 2010. This was due to the decrease in interest rates from September 30, 2009 to September 30, 2010. The decrease in interest rates resulted in a significant decrease in the WAL of all mortgage-related assets as borrowers have an increased economic incentive to refinance their mortgages into lower interest rate loans and agency debt issuers have an economic incentive to exercise their call options and issue lower costing debt. This caused a decrease in the price sensitivity of all mortgage-related assets and callable agency debentures, and as a result, in interest-earning assets as a whole. Since the price sensitivity of assets is reduced in the base case, the adverse impact to rising interest rates is thus reduced in all scenarios presented.
General assumptions used by management to evaluate the sensitivity of our financial performance to changes in interest rates presented in the tables above are utilized in, and set forth under, the gap table and related notes beginning on page 17. Although management finds these assumptions reasonable given the constraints described above, the interest rate sensitivity of our assets and liabilities and the estimated effects of changes in interest rates on our net interest income and MVPE indicated in the above tables could vary substantially if different assumptions were used or actual experience differs from these assumptions.
Gap Table. The gap table summarizes the anticipated maturities or repricing of our interest-earning assets and interest-bearing liabilities as of September 30, 2010, based on the information and assumptions set forth in the notes below.
| | | Within | | | Three to | | | More Than | | | More Than | | | | | | | |
| | | Three | | | Twelve | | | One Year to | | | Three Years | | | Over | | | | |
| | | Months | | | Months | | | Three Years | | | to Five Years | | | Five Years | | | Total | |
| Interest-earning assets: | | (Dollars in thousands) | |
Loans receivable: (1) | | | | | | | | | | | | | | | | | | |
| Mortgage loans: | | | | | | | | | | | | | | | | | | |
| Fixed | | $ | 374,893 | | | $ | 1,095,187 | | | $ | 1,236,438 | | | $ | 472,149 | | | $ | 907,068 | | | $ | 4,085,735 | |
| Adjustable | | | 91,365 | | | | 563,604 | | | | 186,734 | | | | 39,865 | | | | 6,002 | | | | 887,570 | |
| Other loans | | | 136,829 | | | | 16,334 | | | | 19,364 | | | | 11,848 | | | | 8,947 | | | | 193,322 | |
Investment securities (2) | | | 257,703 | | | | 667,652 | | | | 152,418 | | | | 245,296 | | | | 10,238 | | | | 1,333,307 | |
MBS (3) | | | 251,456 | | | | 658,831 | | | | 351,527 | | | | 125,597 | | | | 168,578 | | | | 1,555,989 | |
| Other interest-earning assets | | | 45,094 | | | | -- | | | | -- | | | | -- | | | | -- | | | | 45,094 | |
| Total interest-earning assets | | | 1,157,340 | | | | 3,001,608 | | | | 1,946,481 | | | | 894,755 | | | | 1,100,833 | | | | 8,101,017 | |
| | | | | | | | | | | | | | | | | | | | | | | | | |
| Interest-bearing liabilities: | | | | | | | | | | | | | | | | | | | | | | | | |
| Deposits: | | | | | | | | | | | | | | | | | | | | | | | | |
Checking (4) | | | 11,132 | | | | 44,767 | | | | 119,670 | | | | 63,008 | | | | 243,851 | | | | 482,428 | |
Savings (4) | | | 93,670 | | | | 9,370 | | | | 21,606 | | | | 16,758 | | | | 92,881 | | | | 234,285 | |
Money market (4) | | | 41,568 | | | | 114,712 | | | | 276,455 | | | | 143,079 | | | | 366,614 | | | | 942,428 | |
| Certificates | | | 362,265 | | | | 1,164,310 | | | | 876,117 | | | | 322,313 | | | | 2,164 | | | | 2,727,169 | |
Borrowings (5) | | | 353,609 | | | | 176,000 | | | | 1,170,000 | | | | 770,000 | | | | 575,000 | | | | 3,044,609 | |
| Total interest-bearing liabilities | | | 862,244 | | | | 1,509,159 | | | | 2,463,848 | | | | 1,315,158 | | | | 1,280,510 | | | | 7,430,919 | |
| | | | | | | | | | | | | | | | | | | | | | | | | |
| Excess (deficiency) of interest-earning assets over | | | | | | | | | | | | | | | | | | | | | | | | |
| interest-bearing liabilities | | $ | 295,096 | | | $ | 1,492,449 | | | $ | (517,367 | ) | | $ | (420,403 | ) | | $ | (179,677 | ) | | $ | 670,098 | |
| | | | | | | | | | | | | | | | | | | | | | | | | |
| Cumulative excess (deficiency) of interest-earning | | | | | | | | | | | | | | | | | | | | | | | | |
| assets over interest-bearing liabilities | | $ | 295,096 | | | $ | 1,787,545 | | | $ | 1,270,178 | | | $ | 849,775 | | | $ | 670,098 | | | | | |
| | | | | | | | | | | | | | | | | | | | | | | | | |
| Cumulative excess (deficiency) of interest-earning | | | | | | | | | | | | | | | | | | | | | | | | |
| assets over interest-bearing liabilities as a | | | | | | | | | | | | | | | | | | | | | | | | |
| percent of total assets at September 30, 2010 | | | 3.48 | % | | | 21.06 | % | | | 14.97 | % | | | 10.01 | % | | | 7.90 | % | | | | |
| | | | | | | | | | | | | | | | | | | | | | | | | |
| Cumulative one-year gap at September 30, 2009 | | | | | | | 6.78 | % | | | | | | | | | | | | | | | | |
| | | | | | | | | | | | | | | | | | | | | | | | | |
| Cumulative one-year gap at September 30, 2008 | | | | | | | 1.90 | % | | | | | | | | | | | | | | | | |
(1) Adjustable-rate mortgage (“ARM”) loans are included in the period in which the rate is next scheduled to adjust or in the period in which repayments are expected to occur, or prepayments are expected to be received, prior to their next rate adjustment, rather than in the period in which the loans are due. Fixed-rate loans are included in the periods in which they are scheduled to be repaid, based on scheduled amortization and prepayment assumptions. Balances have been reduced for non-performing loans, which totaled $32.0 million at September 30, 2010.
(2) Based on contractual maturities, terms to call date or pre-refunding dates as of September 30, 2010, and excludes the unrealized loss adjustment of $651 thousand on AFS investment securities.
(3) Reflects estimated prepayments of MBS in our portfolio, and excludes the unrealized gain adjustment of $51.9 million on AFS MBS.
(4) Although our checking, savings and money market accounts are subject to immediate withdrawal, management considers a substantial amount of such accounts to be core deposits having significantly longer effective maturities. The decay rates (the assumed rate at which the balance of existing accounts would decline) used on these accounts are based on assumptions developed from our actual experience with these accounts. If all of our checking, savings and money market accounts had been assumed to be subject to repricing within one year, interest-earning assets which were estimated to mature or reprice within one year would have exceeded interest-bearing liabilities with comparable characteristics by $443.6 millio n, for a cumulative one-year gap of 5.23% of total assets.
(5) Borrowings exclude $28.3 million of deferred prepayment penalty costs and $632 thousand of deferred gain on the terminated interest rate swap agreements.
The change in the one-year gap to 21.06% at September 30, 2010 from 6.78% at September 30, 2009 was a result of a significant decrease in interest rates between year ends. The decrease in interest rates resulted in an increase in projected cash flows from mortgage-related assets and callable agency debentures which resulted in shorter WALs and quicker repricing of interest-earning assets at September 30, 2010 compared to September 30, 2009.
The gap table summarizes the anticipated maturities or repricing of our interest-earning assets and interest-bearing liabilities as of September 30, 2010, based on the information and assumptions set forth in the notes above. Cash flow projections for mortgage loans and MBS are calculated based on current interest rates. Prepayment projections are subjective in nature, involve uncertainties and assumptions and, therefore, cannot be determined with a high degree of accuracy. Although certain assets and liabilities may have similar maturities or periods to repricing, they may react differently to changes in market interest rates. Assumptions may not reflect how actual yields and costs respond to market changes. The interest rates on certain types of assets and liabilities may fluctuate in advance of changes in market interest rates, while interest rates on other types of assets and liabilities may lag behind changes in market interest rates. Certain assets, such as ARM loans, have features that restrict changes in interest rates on a short-term basis and over the life of the asset. In the event of a change in interest rates, prepayment and early withdrawal levels would likely deviate significantly from those assumed in calculating the gap table. For additional information regarding the impact of changes in interest rates, see the Percentage Change in Net Interest Income and Percentage Change in MVPE tables above.
Financial Condition
Total assets increased $83.5 million from $8.40 billion at September 30, 2009 to $8.49 billion at September 30, 2010, due primarily to growth in the deposit portfolio, which was used primarily to fund investment security purchases and repay maturing debt.
Total liabilities increased $62.8 million from $7.46 billion at September 30, 2009 to $7.53 billion at September 30, 2010, due primarily to an increase in deposits of $157.7 million. The increase in deposits was primarily in money market and checking accounts. During fiscal year 2010, $200.0 million of FHLB advances with a weighted average contractual rate of 4.63% were refinanced and replaced with $200.0 million of fixed-rate FHLB advances with a weighted average contractual interest rate of 3.17%. Also during fiscal year 2010, $100.0 million of maturing FHLB advances with a rate of 3.94% were replaced with $100.0 million of FHLB advances with a rate of 3.23% and $50.0 million of maturing FHLB advances and $45.0 million of maturing repurchase agreements were not replaced.
Stockholders’ equity increased $20.7 million, from $941.3 million at September 30, 2009 to $962.0 million at September 30, 2010. The increase was due primarily to net income of $67.8 million, partially offset by dividend payments of $48.4 million during the current fiscal year.
Loans Receivable. The loans receivable portfolio decreased $435.8 million from $5.60 billion at September 30, 2009 to $5.17 billion at September 30, 2010. During fiscal year 2010, principal repayments on loans have exceeded originations, refinances, and purchases by $225.6 million. Mortgage origination volume, in general, has decreased from the prior year as the market demand for lending has decreased. Additionally, the Bank has been purchasing fewer loans under the Bank’s nationwide purchase loan program during fiscal year 2010 due to the lack of loans meeting our underwriting criteria from our existing relationships. The Bank is working to expand the number of relationships with third parties from whom it may buy loans i n the future. The decrease in the loan portfolio was also due the $194.8 million loan swap transaction during the first quarter of the current fiscal year.
The weighted average rate of the loan portfolio decreased 22 basis points from 5.29% at September 30, 2009 to 5.07% at September 30, 2010. The decrease in the weighted average portfolio rate was due to loan modifications and refinances, originations and purchases at market rates lower than the existing portfolio, and repayments of loans with rates higher than the portfolio.
During fiscal year 2010, $44.1 million of one- to four-family loans were purchased from nationwide lenders. One- to four-family loans purchased from nationwide lenders during the current fiscal year had a weighted average credit score of 723 at origination and a weighted average LTV ratio of 47%, based upon the loan balance at the time of purchase and the lower of the purchase price or appraisal at origination. Loans purchased from nationwide lenders represented approximately 10% of the loan portfolio at September 30, 2010 compared to 12% at September 30, 2009, and were secured by properties located in 47 of the continental states. At September 30, 2010, purchased loans from nationwide lenders in the following states comprised 5% or greater of total purchased loans: Illinois 11%; Texas 8%, Florida and New York 7%. As of September 30, 2010, the average balance of a nationwide purchased one- to four-family loan was approximately $340 thousand, the average balance of an originated one- to four-family loan was approximately $125 thousand, and the average balance of correspondent purchased one- to four-family loans was approximately $275 thousand.
Included in the loan portfolio at September 30, 2010 were $198.0 million of ARM loans that were originated as interest-only. Of these interest-only loans, $154.3 million were purchased from nationwide lenders, primarily during fiscal year 2005. Interest-only ARM loans do not typically require principal payments during their initial term, and have initial interest-only terms of either five or ten years. The $154.3 million of purchased interest-only ARM loans had a weighted average credit score of 736 at origination and a weighted average LTV ratio of 74%, based upon the loan balance at the time of purchase and the lower of purchase price or appraisal at origination. The Bank has not purchased any interest-only ARM loans since 2006 and discontinued offering the product in its local markets during 2008 to reduce future credit risk. At September 30, 2010, $121.6 million, or 61%, of interest-only loans were still in their interest-only payment term. As of September 30, 2010, $27.7 million will begin to amortize principal within two years, $62.3 million will begin to amortize principal within two-to-five years, $27.2 million will begin to amortize principal within five-to-seven years and the remaining $4.4 million will begin amortizing in seven-to-ten years. At September 30, 2010, $13.2 million, or 41% of non-performing loans, were interest-only ARMs and $3.2 million was reserved in the ALLL for these loans. Of the $13.2 million non-performing interest-only ARM loans, $6.5 million, or 49%, were still in the interest-only payment term. Non-performing interest-only ARM loans represented approximately 7% of the total interest-only ARM loan portfolio at September 30, 2010. See discussion regarding the ALLL in “Critical Accounting Policies – Allowance for Loan Losses.”
Historically, the Bank’s underwriting guidelines have provided the Bank with loans of high quality and low delinquencies, and low levels of non-performing assets compared to national levels. Of particular importance is the complete documentation required for each loan the Bank originates and purchases. This allows the Bank to make an informed credit decision based upon a thorough assessment of the borrower’s ability to repay the loan, compared to underwriting methodologies that do not require full documentation. Non-performing loans increased $1.1 million from $30.9 million at September 30, 2009 to $32.0 million at September 30, 2010. Our ratio of non-performing loans to total loans increased from 0.55% at September 30, 2009 to 0.62% at September 30, 2010. At September 30, 2010 , our ALLL was $14.9 million or 0.29% of the total loan portfolio and 47% of total non-performing loans. This compares with an ALLL of $10.2 million or 0.18% of the total loan portfolio and 33% of total non-performing loans as of September 30, 2009. See additional discussion of asset quality in Part I, Item 1 of the Annual Report on Form 10-K.
The Bank generally prices its one- to four-family loan products based upon prices available in the secondary market and competitor pricing. During fiscal year 2010, the average daily spread between the Bank’s 30-year fixed-rate one- to four-family loan offer rate, with no points paid by the borrower, and the 10-year Treasury rate was approximately 160 basis points, while the average daily spread between the Bank’s 15-year fixed-rate one- to four-family loan offer rate and the 10-year Treasury rate was approximately 100 basis points.
Conventional one- to four-family loans may be sold on a bulk basis for portfolio restructuring or on a flow basis as loans are originated to reduce interest rate risk and/or maintain a certain liquidity position. The Bank generally retains the servicing on these sold loans. ALCO determines which conventional one- to four-family loans are to be originated as held for sale or held for investment. Conventional loans originated as held for sale are to be sold in accordance with policies set forth by ALCO. Conventional loans originated as held for investment are generally not eligible for sale unless a specific segment of the portfolio qualifies for asset restructuring purposes.
The following table summarizes the activity in the loan portfolio for the periods indicated, excluding changes in loans in process, deferred fees, and ALLL. Loans that were paid-off as a result of refinances are included in repayments. Purchased loans include purchases from correspondent and nationwide lenders. Loan modification activity is not included in the activity in the following table because a new loan is not generated at the time of modification. During fiscal year 2010 and 2009, the Bank modified $545.1 million and $1.14 billion loans, respectively, with a weighted average decrease in rate of 87 basis points for both years. The modified balance and rate are included in the ending loan portfolio balance and rate. The weighted average contractual life of our mortga ge loan portfolio was 23 years at both September 30, 2010 and 2009.
| | | For the Three Months Ended | |
| | | September 30, 2010 | | | June 30, 2010 | | | March 31, 2010 | | | December 31, 2009 | |
| | | Amount | | | Rate | | | Amount | | | Rate | | | Amount | | | Rate | | | Amount | | | Rate | |
| | | (Dollars in thousands) | |
| Beginning balance | | $ | 5,361,472 | | | | 5.14 | % | | $ | 5,425,458 | | | | 5.19 | % | | $ | 5,463,744 | | | | 5.23 | % | | $ | 5,646,950 | | | | 5.29 | % |
| Originations and refinances: | | | | | | | | | | | | | | | | | | | | | | | | | | | | | | | | |
| Fixed | | | 94,048 | | | | 4.64 | | | | 137,012 | | | | 4.96 | | | | 107,694 | | | | 4.93 | | | | 156,507 | | | | 4.95 | |
| Adjustable | | | 39,170 | | | | 4.33 | | | | 34,033 | | | | 4.62 | | | | 38,779 | | | | 4.44 | | | | 37,885 | | | | 4.57 | |
| Purchases: | | | | | | | | | | | | | | | | | | | | | | | | | | | | | | | | |
| Fixed | | | 6,850 | | | | 5.05 | | | | 8,590 | | | | 5.15 | | | | 12,417 | | | | 5.03 | | | | 20,149 | | | | 5.09 | |
| Adjustable | | | 1,417 | | | | 4.40 | | | | 10,737 | | | | 5.58 | | | | 14,011 | | | | 4.03 | | | | 44,930 | | | | 3.69 | |
| Repayments | | | (288,626 | ) | | | | | | | (250,098 | ) | | | | | | | (208,015 | ) | | | | | | | (243,087 | ) | | | | |
| Transfer of loans to | | | | | | | | | | | | | | | | | | | | | | | | | | | | | | | | |
loans held-for-sale (“LHFS”), net (1) | | | -- | | | | | | | | -- | | | | | | | | -- | | | | | | | | (194,759 | ) | | | | |
Other (2) | | | (5,018 | ) | | | | | | | (4,260 | ) | | | | | | | (3,172 | ) | | | | | | | (4,831 | ) | | | | |
| Ending balance | | $ | 5,209,313 | | | | 5.07 | % | | $ | 5,361,472 | | | | 5.14 | % | | $ | 5,425,458 | | | | 5.19 | % | | $ | 5,463,744 | | | | 5.23 | % |
| | | | | | | | | | | | | | | | | | | | | | | | | | | | | | | | | |
| | | For the Year Ended | |
| | | 2010 | | | 2009 | |
| | | Amount | | | Rate | | | Amount | | | Rate | |
| | | (Dollars in thousands) | |
| Beginning balance | | $ | 5,646,950 | | | | 5.29 | % | | $ | 5,379,845 | | | | 5.66 | % |
| Originations and refinances: | | | | | | | | | | | | | | | | |
| Fixed | | | 495,261 | | | | 4.89 | | | | 988,375 | | | | 5.12 | |
| Adjustable | | | 149,867 | | | | 4.48 | | | | 131,306 | | | | 4.91 | |
| Purchases: | | | | | | | | | | | | | | | | |
| Fixed | | | 48,006 | | | | 5.08 | | | | 109,813 | | | | 5.21 | |
| Adjustable | | | 71,095 | | | | 4.05 | | | | 223,619 | | | | 5.01 | |
| Repayments | | | (989,826 | ) | | | | | | | (1,079,777 | ) | | | | |
Transfer of loans to LHFS, net (1) | | | (194,759 | ) | | | | | | | (94,672 | ) | | | | |
Other (2) | | | (17,281 | ) | | | | | | | (11,559 | ) | | | | |
| Ending balance | | $ | 5,209,313 | | | | 5.07 | % | | $ | 5,646,950 | | | | 5.29 | % |
| (1) | Transfer of loans to LHFS in the December 31, 2009 quarter includes loans with a principal balance of $194.8 million related to the loan swap transaction. |
| (2) | Other consists of transfers to REO, modification fees advanced and reductions in commitments. |
The following table presents our fixed-rate one- to four-family loan portfolio, including our fixed-rate one- to four-family construction loans, and the annualized prepayment speeds for the quarter ending September 30, 2010 by interest rate tier. Loan modifications and refinances are considered a prepayment and are included in the prepayment speeds presented below. During the quarter ended September 30, 2010, $236.7 million of fixed-rate loans were modified and $74.3 million of fixed-rate loans were refinanced.
| | | | Original Term | |
| | | | 15 years or less | | | More than 15 years | |
| | | | | | | Prepayment | | | | | | Prepayment | |
| | | | Principal | | | Speed | | | Principal | | | Speed | |
| Rate Range | | | Balance | | | (annualized) | | | Balance | | | (annualized) | |
| | | | (Dollars in thousands) | |
| | | | | | | | | | | | | | |
| < =4.50% | | | $ | 221,872 | | | | 14.46 | % | | $ | 162,804 | | | | 7.14 | % |
| | 4.51 - 4.99 | % | | | 357,383 | | | | 37.97 | | | | 185,251 | | | | 31.36 | |
| | 5.00 - 5.50 | % | | | 311,286 | | | | 50.01 | | | | 1,838,750 | | | | 29.69 | |
| | 5.51 - 5.99 | % | | | 68,084 | | | | 54.79 | | | | 438,103 | | | | 66.56 | |
| | 6.00 - 6.50 | % | | | 30,108 | | | | 27.07 | | | | 332,462 | | | | 60.16 | |
| | 6.51 - 6.99 | % | | | 8,779 | | | | 12.05 | | | | 50,736 | | | | 40.10 | |
| >=7.00 | % | | | 4,776 | | | | 9.19 | | | | 36,903 | | | | 26.35 | |
| Total | | | $ | 1,002,288 | | | | 38.41 | % | | $ | 3,045,009 | | | | 38.61 | % |
Approximately 46% of our fixed-rate one- to four-family loans are over 100 basis points higher than our fixed-rate one- to four-family loan offered rates at September 30, 2010, which ranged from 3.75% to 4.375% depending on the fixed-rate loan product type. This indicates that a significant portion of our fixed-rate one- to four-family loan portfolio could prepay or reprice downward if our offered rates remain at, or decline from, the rates offered at September 30, 2010. We attempt to mitigate the repricing risk of our fixed-rate one- to four-family loan portfolio by the interest rates we offer and through the terms of our modification program. Management closely monitors competitors’ rates and also considers interest rate risk and net interest inco me when setting offered rates. Through our modification program a borrower can modify the rate and/or term of their loan in less time than it takes to process a refinance, and for a cost that is less than a refinance, if they have been current on their payments for the previous 12 months and the loan has not been sold to a third party. At September 30, 2010, the fixed rates offered through our modification program were at least 12 basis points higher than a similar new origination or refinance. This allows the Bank to retain the modified loan and achieve a current above-market interest rate. The borrower also has the option of paying a higher modification fee to obtain a lower interest rate.
We manage the reinvestment risk of loan prepayments through our interest rate risk and asset management strategies. Principal repayments exceeded originations, refinances, and purchases by $225.6 million for fiscal year 2010, compared to originations, refinances, and purchases exceeding principal repayments by $369.4 million in fiscal year 2009. In recent periods, principal repayments in excess of loan originations and purchases have been reinvested in shorter-term investment securities at lower market rates than our loan portfolio which reduces our interest rate spread. If, however, market rates were to rise, the short-term nature of the investment securities may allow management the opportunity to reinvest the maturing funds at a higher rate.
Mortgage-Backed Securities. The balance of MBS, which primarily consists of securities of U.S. government-sponsored enterprises (“GSEs”), decreased $384.6 million from $1.99 billion at September 30, 2009 to $1.61 billion at September 30, 2010. The decrease was a result of some cash flows from the MBS portfolio being reinvested into investment securities. At September 30, 2010, the MBS held within our portfolio were issued by Federal Home Loan Mortgage Corporation (“FHLMC”), Federal National Mortgage Association (“FNMA”) and Government National Mortgage Association (“GNMA”), with the exception of $2.9 million, which were issued by a private issuer. Unlike MBS issued by GSEs, the principal and interest payments of privately issued MBS are not guaranteed, although we generally receive a higher interest rate as compensation for the relative increase in credit risk. Should the underlying mortgages in a privately issued MBS security default on their mortgage payment above the level of credit enhancement, losses could be realized.
During the first quarter of fiscal year 2010, MBS with an amortized cost of $192.7 million were received in conjunction with the loan swap transaction. As previously discussed, the related MBS were sold for a $6.5 million gain. The proceeds from the sale were primarily used to purchase investment securities with terms shorter than those of the mortgage loans that were swapped. The loan swap transaction was primarily undertaken for interest rate risk management purposes.
The following table provides a summary of the activity in our portfolio of MBS for the periods presented. The yields and WAL for purchases are presented as recorded at the time of purchase. The yields for the beginning and ending balances are as of the period presented and are generally derived from recent prepayment activity on the MBS in the portfolio as of the dates presented. The weighted average yield of the MBS portfolio decreased from September 30, 2009 to September 30, 2010 due primarily to the maturity and repayment of securities with higher yields than the overall portfolio, adjustable-rate MBS resetting to lower coupons due to a decline in related indices and purchases at yields lower than the overall portfolio yield. The beginning and ending WAL is the estimated remaining maturity a fter projected prepayment speeds have been applied. The decrease in the WAL at September 30, 2010 compared to September 30, 2009 was due primarily to faster estimated principal prepayments as a result of lower interest rates.
| | | For the Three Months Ended | |
| | | September 30, 2010 | | | June 30, 2010 | | | March 31, 2010 | | | December 31, 2009 | |
| | | Amount | | | Yield | | | WAL | | | Amount | | | Yield | | | WAL | | | Amount | | | Yield | | | WAL | | | Amount | | | Yield | | | WAL | |
| | | (Dollars in thousands) | |
| Beginning balance – carrying value | | $ | 1,620,623 | | | | 4.15 | % | | | 3.99 | | | $ | 1,757,310 | | | | 4.21 | % | | | 4.07 | | | $ | 1,877,969 | | | | 4.34 | % | | | 5.09 | | | $ | 1,992,467 | | | | 4.42 | % | | | 4.67 | |
| Maturities and repayments | | | (131,861 | ) | | | | | | | | | | | (145,432 | ) | | | | | | | | | | | (121,635 | ) | | | | | | | | | | | (112,380 | ) | | | | | | | | |
| Sale of securities, net of gains | | | -- | | | | | | | | | | | | -- | | | | | | | | | | | | -- | | | | | | | | | | | | (192,690 | ) | | | | | | | | |
| Net amortization of premiums/(discounts) | | | (457 | ) | | | | | | | | | | | (393 | ) | | | | | | | | | | | (499 | ) | | | | | | | | | | | (392 | ) | | | | | | | | |
| Purchases: | | | | | | | | | | | | | | | | | | | | | | | | | | | | | | | | | | | | | | | | | | | | | | | | |
| Fixed | | | 126,394 | | | | 2.54 | | | | 3.71 | | | | -- | | | | -- | | | | -- | | | | 2,042 | | | | 4.18 | | | | 7.08 | | | | 2,990 | | | | 4.10 | | | | 7.48 | |
| Adjustable | | | -- | | | | -- | | | | -- | | | | -- | | | | -- | | | | -- | | | | -- | | | | -- | | | | -- | | | | -- | | | | -- | | | | -- | |
| Amortized cost of securities | | | | | | | | | | | | | | | | | | | | | | | | | | | | | | | | | | | | | | | | | | | | | | | | |
| received in loan swap transaction | | | -- | | | | | | | | | | | | -- | | | | | | | | | | | | -- | | | | | | | | | | | | 192,690 | | | | | | | | | |
Change in valuation on AFS securities | | | (6,835 | ) | | | | | | | | | | | 9,138 | | | | | | | | | | | | (567 | ) | | | | | | | | | | | (4,716 | ) | | | | | | | | |
| Ending balance – carrying value | | $ | 1,607,864 | | | | 4.00 | % | | | 3.58 | | | $ | 1,620,623 | | | | 4.15 | % | | | 3.99 | | | $ | 1,757,310 | | | | 4.21 | % | | | 4.07 | | | $ | 1,877,969 | | | | 4.34 | % | | | 5.09 | |
| | | For the Year Ended | |
| | | 2010 | | | 2009 | |
| | | Amount | | | Yield | | | WAL | | | Amount | | | Yield | | | WAL | |
| | | (Dollars in thousands) | |
| Beginning balance – carrying value | | $ | 1,992,467 | | | | 4.42 | % | | | 4.67 | | | $ | 2,234,339 | | | | 4.82 | % | | | 5.05 | |
| Maturities and repayments | | | (511,308 | ) | | | | | | | | | | | (494,932 | ) | | | | | | | | |
| Sale of securities, net of gains | | | (192,690 | ) | | | | | | | | | | | -- | | | | | | | | | |
| Net amortization of premiums/(discounts) | | | (1,741 | ) | | | | | | | | | | | (482 | ) | | | | | | | | |
| Purchases: | | | | | | | | | | | | | | | | | | | | | | | | |
| Fixed | | | 131,426 | | | | 2.60 | | | | 3.85 | | | | 21,756 | | | | 3.03 | | | | 3.84 | |
| Adjustable | | | -- | | | | -- | | | | -- | | | | 169,452 | | | | 2.72 | | | | 2.41 | |
| Amortized cost of securities | | | | | | | | | | | | | | | | | | | | | | | | |
| received in loan swap transaction | | | 192,690 | | | | | | | | | | | | -- | | | | | | | | | |
| Change in valuation on AFS securities | | | (2,980 | ) | | | | | | | | | | | 62,334 | | | | | | | | | |
| Ending balance – carrying value | | $ | 1,607,864 | | | | 4.00 | % | | | 3.58 | | | $ | 1,992,467 | | | | 4.42 | % | | | 4.67 | |
The following table presents our fixed-rate MBS portfolio, at amortized cost, based on the underlying weighted average loan rate, the annualized prepayment speeds for the quarter ending September 30, 2010 which represents prepayments during July, August and September 2010, and the net premium/discount by interest rate tier. Our fixed-rate MBS portfolio is somewhat less sensitive than our fixed-rate one- to four-family loan portfolio to repricing risk due to external refinancing barriers such as unemployment, income changes, and decreases in property values, causing barriers to refinancing to be generally more pronounced outside of our local market areas. However, we are unable to control the interest rates and/or governmental programs that could impact the loans in our fixed-rate MBS portfolio, and are therefore more likely to experience reinvestment risk due to principal prepayments. Additionally, prepayments impact the amortization/accretion of premiums/discounts on our MBS portfolio. As prepayments increase, the related premiums/discounts are amortized/accreted at a faster rate. The amortization of premiums decreases interest income while the accretion of discounts increases interest income. As noted in the table below, the fixed-rate MBS portfolio had a net premium of $3.8 million as of September 30, 2010. Given that the weighted average coupon on the underlying loans in this portfolio are above current market rates, the Bank could experience an increase in the premium amortization should prepayment speeds increase significantly, potentially reducing future interest income.
| | | | Original Term | | | | | | | |
| | | | 15 years or less | | | More than 15 years | | | | | | | |
| | | | | | | Prepayment | | | | | | Prepayment | | | | | | Net | |
| | | | Amortized | | | Speed | | | Amortized | | | Speed | | | | | | Premium/ | |
| Rate Range | | | Cost | | | (annualized) | | | Cost | | | (annualized) | | | Total | | | (Discount) | |
| | | | (Dollars in thousands) | | | | |
| | | | | | | | | | | | | | | | | | | | |
| < =4.99% | | | $ | 426,640 | | | | 12.18 | % | | $ | 3,886 | | | | 0.34 | % | | $ | 430,526 | | | $ | 3,588 | |
| | 5.00 - 5.50 | % | | | 172,934 | | | | 0.21 | | | | 12,244 | | | | 19.85 | | | | 185,178 | | | | (132 | ) |
| | 5.51 - 5.99 | % | | | 108,689 | | | | 21.43 | | | | 68,940 | | | | 32.90 | | | | 177,629 | | | | 112 | |
| | 6.00 - 6.50 | % | | | 19,702 | | | | 35.10 | | | | 25,315 | | | | 22.91 | | | | 45,017 | | | | 85 | |
| | 6.51 - 6.99 | % | | | 3,535 | | | | 14.61 | | | | 13,105 | | | | 18.00 | | | | 16,640 | | | | 162 | |
| >=7.00 | % | | | -- | | | | -- | | | | 5,808 | | | | 14.65 | | | | 5,808 | | | | 11 | |
| Total | | | $ | 731,500 | | | | 11.35 | % | | $ | 129,298 | | | | 26.40 | % | | $ | 860,798 | | | $ | 3,826 | |
| | | | | | | | | | | | | | | | | | | | | | | | | | | |
| Average Rate | | | | 4.99 | % | | | | | | | 5.91 | % | | | | | | | 5.13 | % | | | | |
| Average remaining | | | | | | | | | | | | | | | | | | | | | | | | | |
| term (months) | | | | 115 | | | | | | | | 210 | | | | | | | | 130 | | | | | |
Investment Securities. Investment securities, which consist primarily of debentures issued by GSEs (primarily issued by FNMA, FHLMC, or FHLB) and municipal investments, increased $852.0 million from $480.7 million at September 30, 2009 to $1.33 billion at September 30, 2010. The increase in the balance was primarily a result of purchases of $1.53 billion in shorter-term securities, partially offset by maturities and calls of $674.2 million. If market rates were to rise, the short-term nature of these securities may allow management the opportunity to reinvest the maturing funds at a higher yield. All of the investment securities purchased during the current fiscal year were classified as HTM. Management is no longer classifying securities as AFS due to the potential fluctuations in stockholders’ equity caused by market yield changes. See additional discussion regarding unrealized gain and losses on AFS securities and the impact to stockholders’ equity in “Stockholders’ Equity.” Management has focused on purchasing investment securities over the past year as a way to reduce the Bank’s exposure to higher future interest rates. Given the current balance of investment securities, as a percentage of the overall investment portfolio, management intends to keep the portfolio composition relatively unchanged for the foreseeable future.
The following tables provide a summary of the activity of investment securities for the periods presented. The yields for the beginning and ending balances are as of the first and last days of the periods presented. The decrease in the yield at September 30, 2010 compared to September 30, 2009 was a result of higher yielding investment securities being called and purchases of new securities with yields lower than the overall portfolio yield. The beginning and ending WAL represent the estimated remaining maturity of the securities after call dates have been considered, based upon market rates at each date presented. The WAL at September 30, 2010 decreased from September 30, 2009 due to the purchase of securities with WALs shorter than the existing portfolio and increased call projections of high er coupon securities due to lower interest rates.
| | | For the Three Months Ended | |
| | | September 30, 2010 | | | June 30, 2010 | | | March 31, 2010 | | | December 31, 2009 | |
| | | Amount | | | Yield | | | WAL | | | Amount | | | Yield | | | WAL | | | Amount | | | Yield | | | WAL | | | Amount | | | Yield | | | WAL | |
| | | (Dollars in thousands) | |
| Beginning balance – carrying value | | $ | 1,203,064 | | | | 1.67 | % | | | 0.82 | | | $ | 970,431 | | | | 1.76 | % | | | 1.29 | | | $ | 651,943 | | | | 2.05 | % | | | 1.65 | | | $ | 480,704 | | | | 1.93 | % | | | 1.53 | |
| Maturities and calls | | | (343,999 | ) | | | | | | | | | | | (210,048 | ) | | | | | | | | | | | (119,103 | ) | | | | | | | | | | | (1,033 | ) | | | | | | | | |
Net amortization of premiums/ (discounts) | | | (1,034 | ) | | | | | | | | | | | (1,051 | ) | | | | | | | | | | | (1,053 | ) | | | | | | | | | | | (1,061 | ) | | | | | | | | |
| Purchases: | | | | | | | | | | | | | | | | | | | | | | | | | | | | | | | | | | | | | | | | | | | | | | | | |
| Fixed | | | 475,141 | | | | 1.08 | | | | 1.19 | | | | 443,757 | | | | 1.38 | | | | 1.11 | | | | 438,254 | | | | 1.36 | | | | 1.02 | | | | 173,431 | | | | 2.39 | | | | 1.25 | |
| Adjustable | | | -- | | | | -- | | | | -- | | | | -- | | | | -- | | | | -- | | | | -- | | | | -- | | | | -- | | | | -- | | | | -- | | | | -- | |
Change in valuation on AFS securities | | | (516 | ) | | | | | | | | | | | (25 | ) | | | | | | | | | | | 390 | | | | | | | | | | | | (98 | ) | | | | | | | | |
| Ending balance – carrying value | | $ | 1,332,656 | | | | 1.47 | % | | | 0.84 | | | $ | 1,203,064 | | | | 1.67 | % | | | 0.82 | | | $ | 970,431 | | | | 1.76 | % | | | 1.29 | | | $ | 651,943 | | | | 2.05 | % | | | 1.65 | |
| | | | | | | | | | | | | | | | | | | | | | | | | | | | | | | | | | | | | | | | | | | | | | | | | |
| | | For the Year Ended | |
| | | 2010 | | | 2009 | |
| | | Amount | | | Yield | | | WAL | | | Amount | | | Yield | | | WAL | |
| | | (Dollars in thousands) | |
| Beginning balance – carrying value | | $ | 480,704 | | | | 1.93 | % | | | 1.53 | | | $ | 142,359 | | | | 3.94 | % | | | 6.06 | |
| Maturities and calls | | | (674,183 | ) | | | | | | | | | | | (109,760 | ) | | | | | | | | |
| Net amortization of premiums/(discounts) | | | (4,199 | ) | | | | | | | | | | | (2,162 | ) | | | | | | | | |
| Purchases: | | | | | | | | | | | | | | | | | | | | | | | | |
| Fixed | | | 1,530,583 | | | | 1.39 | | | | 1.13 | | | | 448,553 | | | | 1.70 | | | | 1.53 | |
| Adjustable | | | -- | | | | -- | | | | -- | | | | -- | | | | -- | | | | -- | |
| Change in valuation on AFS securities | | | (249 | ) | | | | | | | | | | | 1,714 | | | | | | | | | |
| Ending balance – carrying value | | $ | 1,332,656 | | | | 1.47 | % | | | 0.84 | | | $ | 480,704 | | | | 1.93 | % | | | 1.53 | |
Liabilities. Liabilities increased from $7.46 billion at September 30, 2009 to $7.53 billion at September 30, 2010. The $62.8 million increase in liabilities was due primarily to an increase in deposits of $157.7 million. The increase in deposits was primarily in the money market and checking portfolios. The $94.3 million increase in the money market portfolio from September 30, 2009 to September 30, 2010 was due to customers reinvesting funds from maturing shorter term certificates into the money market portfolio and some customers maintaining higher cash balances due to the current economic uncertainty and in anticipation of market rates increasing, which would allow them to reinvest at higher rates. The $42.4 million increase in o ur checking portfolio from September 30, 2009 to September 30, 2010 was also due to customers keeping more cash readily available, as reflected by a 9% increase in the average customer checking account balance between year ends.
Our certificate of deposit portfolio increased $13.1 million from $2.71 billion at September 30, 2009 to $2.73 billion at September 30, 2010. The $13.1 million increase consisted of a $30.7 million increase in wholesale certificates, partially offset by a $17.6 million decrease in retail certificates. The $17.6 million decrease in retail certificates was primarily in our shorter term certificates, partially offset by an increase in our longer term certificates. Management competitively priced our longer term certificates in order to lengthen the weighted average maturity of the retail certificate of deposit portfolio. The following table presents the amount, average rate and percentage of total deposits for checking, savings, money market and certificates at September 30, 2010 and 2009.
| | | At September 30, |
| | | 2010 | | 2009 |
| | | | | | Average | | % of | | | | | Average | | % of |
| | | Amount | | | Rate | | Total | | Amount | | | Rate | | Total |
| | | (Dollars in thousands) |
| | | | | | | | | | | | | | | | | | | |
| Checking | | $ | 482,428 | | | | 0.13 | % | | | 11.0 | % | | $ | 439,975 | | | | 0.17 | % | | | 10.4 | % |
| Savings | | | 234,285 | | | | 0.54 | | | | 5.3 | | | | 226,396 | | | | 0.66 | | | | 5.4 | |
| Money market | | | 942,428 | | | | 0.65 | | | | 21.5 | | | | 848,157 | | | | 0.82 | | | | 20.1 | |
| Certificates | | | 2,727,169 | | | | 2.29 | | | | 62.2 | | | | 2,714,081 | | | | 3.09 | | | | 64.1 | |
| | | $ | 4,386,310 | | | | 1.61 | % | | | 100.0 | % | | $ | 4,228,609 | | | | 2.20 | % | | | 100.0 | % |
During fiscal year 2010, the Bank prepaid $200.0 million of fixed-rate FHLB advances with a weighted average contractual rate of 4.63% and replaced them with $200.0 million of fixed-rate FHLB advances with a weighted average contractual interest rate of 3.17% for a term of 84 months. The Bank paid an $875 thousand prepayment penalty to the FHLB. The prepayment penalty is being deferred as an adjustment to the carrying value of the new advances and will be recognized as expense over the life of the new advances, which effectively increased the interest rate on the new advances 7 basis points to 3.24%. Also during fiscal year 2010, $100.0 million of maturing FHLB advances with a rate of 3.94% were replaced with $100.0 million of FHLB advances with a rate of 3.23% and $50.0 million of maturing FHLB advances with a rate of 5.02% and $45.0 million of maturing repurchase agreements with a weighted average rate of 3.05% were not replaced. See additional discussion of the transaction in “Notes to Financial Statements - Note 7 - Borrowed Funds.”
The Board of Directors has authorized management to utilize brokered deposits and public unit deposits (deposits from governmental and other public entities) as sources of funds. The rates paid on brokered deposits, plus fees, are generally equivalent to the rates offered by the FHLB on advances and favorable to some rates paid on retail deposits. In order to qualify to obtain public unit deposits, the Bank must have a branch in each county in which it collects public unit deposits, and by law, must pledge securities as collateral for all balances in excess of the Federal Deposit Insurance Corporation (“FDIC”) insurance limits. The rates paid on public unit deposits are based on bid rates and not the rate available to retail customers. Depending on market conditions, management util izes these two sources to fund asset growth. Since the pricing of public unit funds are set by us and we can select posted broker rates for brokered deposits, they are useful funding tools. Because the Bank chooses to take longer term maturities for brokered deposits, these assist in managing our interest rate risk. The primary risk of using these sources of funds is the volatility of retention at maturity, primarily due to competition in the market. Due to this volatility, the Bank’s policies limit the amount of brokered deposits to 10% of total deposits and public unit deposits to 5% of total deposits.
At September 30, 2010, $83.7 million in certificates were brokered deposits, compared to $71.5 million in brokered deposits at September 30, 2009. The $83.7 million of brokered deposits at September 30, 2010 had a weighted average rate of 2.58% and a remaining term to maturity of 3.9 years. The Bank regularly considers brokered deposits as a source of funding, provided that investment opportunities are balanced with the funding cost. As of September 30, 2010, $109.9 million in certificates were public unit deposits, compared to $91.5 million in public unit deposits at September 30, 2009. The $109.9 million of public unit deposits at September 30, 2010 had a weighted average rate of 0.41% and a remaining term to maturity of 6 months. Management will continue to monitor the wholesale deposit mark et for attractive opportunities relative to the yield received from investing the proceeds.
Stockholders’ Equity. Stockholders’ equity increased $20.7 million, from $941.3 million at September 30, 2009 to $962.0 million at September 30, 2010. The increase was due primarily to net income of $67.8 million, partially offset by dividend payments of $48.4 million during the current fiscal year.
Unrealized gains and losses on AFS securities result from changes in the fair value of the securities, due to fluctuations in market yields. Fluctuations in market yields result in changes in stockholders’ equity through accumulated other comprehensive income, but they do not impact results of operations unless the securities are sold and proceeds are reinvested at market rates. During fiscal year 2010, accumulated other comprehensive income decreased $2.0 million. The decrease was due to a decrease in the balance of AFS securities as a result of repayments, partially offset by a decrease in market interest rates between September 30, 2009 and September 30, 2010 which increased the unrealized gain on AFS securities. Management is no longer classifying purchased securities as AFS due to the potentia l fluctuations in stockholders’ equity caused by market yield changes. Management will continue to monitor the size of the AFS securities portfolio and will begin classifying purchased securities as AFS when appropriate. If future market yields were to remain at the same level as September 30, 2010, then the net unrealized gain in stockholders’ equity would decrease over time due to the decline in the AFS security portfolio balance as a result of repayments.
The Board of Directors approved a new stock purchase plan on January 26, 2010. Under the new plan, the Company intends to repurchase up to 250,000 shares from time to time, depending on market conditions, at prevailing market prices in open-market and other transactions. The shares would be held as treasury stock for general corporate use. The plan has no expiration date. We currently are not repurchasing shares because of the pending stock offering.
Dividends from the Company are the only source of funds for MHC. It is expected that MHC will waive future dividends except to the extent they are needed to fund its continuing operations. The following table shows the number of shares eligible to receive dividends (“public shares”) because of the waiver of dividends by MHC at September 30, 2010. The unvested shares in the ESOP receive cash equal to the dividends paid on the public shares. The cash received is applied to the annual debt obligation on the loan taken out by the ESOP from the Company at the time of the mutual-to-stock conversion of the Bank to purchase shares for the ESOP. These shares are held in trust for a future employee benefit, and are therefore excluded from the calculation of public shares.
| Total voting shares outstanding at September 30, 2009 | | | 74,099,355 | |
| Treasury stock acquisitions | | | (130,368 | ) |
| Recognition and Retention Plan grants | | | 5,000 | |
| Options exercised | | | 18,691 | |
| Total voting shares outstanding at September 30, 2010 | | | 73,992,678 | |
| Unvested shares in ESOP | | | (604,918 | ) |
| Shares held by MHC | | | (52,192,817 | ) |
| Total public shares at September 30, 2010 | | | 21,194,943 | |
Weighted Average Yields and Rates. The following table presents the weighted average yields earned on loans, securities and other interest-earning assets, the weighted average rates paid on deposits and borrowings and the resultant interest rate spreads at the dates indicated. Yields on tax-exempt securities are not calculated on a tax-equivalent basis.
| | | At September 30, | |
| | | 2010 | | | 2009 | | | 2008 | |
| | | | | | | | | | |
| Weighted average yield on: | | | | | | | | | |
| Loans receivable | | | 5.23 | % | | | 5.38 | % | | | 5.69 | % |
| MBS | | | 4.00 | | | | 4.42 | | | | 4.82 | |
| Investment securities | | | 1.47 | | | | 1.93 | | | | 3.94 | |
| Capital stock of FHLB | | | 2.98 | | | | 2.98 | | | | 4.73 | |
| Cash and cash equivalents | | | 0.22 | | | | 0.21 | | | | 2.95 | |
| Combined weighted average yield on | | | | | | | | | | | | |
| interest-earning assets | | | 4.33 | | | | 4.89 | | | | 5.37 | |
| | | | | | | | | | | | | |
| Weighted average rate paid on: | | | | | | | | | | | | |
| Checking deposits | | | 0.13 | | | | 0.17 | | | | 0.21 | |
| Savings deposits | | | 0.54 | | | | 0.66 | | | | 1.51 | |
| Money market deposits | | | 0.65 | | | | 0.82 | | | | 1.48 | |
| Certificate of deposit | | | 2.29 | | | | 3.09 | | | | 3.91 | |
FHLB advances (1) | | | 3.96 | | | | 4.13 | | | | 4.75 | |
| Other borrowings | | | 3.97 | | | | 3.91 | | | | 4.09 | |
| Combined weighted average rate paid on | | | | | | | | | | | | |
| interest-bearing liabilities | | | 2.57 | | | | 3.00 | | | | 3.67 | |
| | | | | | | | | | | | | |
| Net interest rate spread | | | 1.76 | % | | | 1.89 | % | | | 1.70 | % |
(1) The September 30, 2010 and 2009 rate includes the net impact of the deferred prepayment penalties related to the prepayment of certain FHLB advances and deferred gain associated with the interest rate swap termination during fiscal year 2008. The September 30, 2008 rate includes the impact of the deferred gain associated with the interest rate swap termination during fiscal year 2008.
Average Balance Sheet. The following table presents the average balances of our assets, liabilities and stockholders’ equity and the related annualized yields and rates on our interest-earning assets and interest-bearing liabilities for the periods indicated. Average yields are derived by dividing annualized income by the average balance of the related assets and average rates are derived by dividing annualized expense by the average balance of the related liabilities, for the periods shown. Average outstanding balances are derived from average daily balances, except for other noninterest-earning assets, other noninterest-earning liabilities and stockholders’ equity which were calculated based on month-end balances. The yields a nd rates include amortization of fees, costs, premiums and discounts which are considered adjustments to yields/rates. Yields on tax-exempt securities were not calculated on a tax-equivalent basis.
| | Year Ended September 30, | |
| | 2010 | | 2009 | | 2008 | |
| | Average | | Interest | | | | Average | | Interest | | | | Average | | Interest | | | |
| | Outstanding | | Earned/ | | Yield/ | | Outstanding | | Earned/ | | Yield/ | | Outstanding | | Earned/ | | Yield/ | |
| | Balance | | Paid | | Rate | | Balance | | Paid | | Rate | | Balance | | Paid | | Rate | |
| Assets | | | | | | | (Dollars in thousands) | | | | | | | |
| Interest-earning assets: | | | | | | | | | | | | | | | | | | |
Mortgage loans (1) | $ 5,198,175 | | $271,154 | | 5.22 | % | $ 5,296,297 | | $293,685 | | 5.55 | % | $ 5,099,147 | | $286,383 | | 5.62 | % |
| Other loans | 199,244 | | 11,153 | | 5.60 | | 208,252 | | 12,097 | | 5.81 | | 216,404 | | 15,637 | | 7.21 | |
| Total loans receivable | 5,397,419 | | 282,307 | | 5.23 | | 5,504,549 | | 305,782 | | 5.56 | | 5,315,551 | | 302,020 | | 5.68 | |
MBS (2) | 1,710,074 | | 71,859 | | 4.20 | | 2,110,701 | | 97,926 | | 4.64 | | 1,888,186 | | 88,395 | | 4.68 | |
Investment securities (2)(3) | 887,955 | | 15,682 | | 1.77 | | 229,766 | | 5,533 | | 2.41 | | 242,426 | | 9,917 | | 4.09 | |
| Capital stock of FHLB | 133,817 | | 3,966 | | 2.96 | | 129,716 | | 3,344 | | 2.58 | | 129,216 | | 6,921 | | 5.36 | |
| Cash equivalents | 100,411 | | 237 | | 0.24 | | 72,184 | | 201 | | 0.28 | | 112,522 | | 3,553 | | 3.11 | |
Total interest-earning assets (1)(2) | 8,229,676 | | 374,051 | | 4.55 | | 8,046,916 | | 412,786 | | 5.13 | | 7,687,901 | | 410,806 | | 5.34 | |
| Other noninterest-earning assets | 235,324 | | | | | | 181,829 | | | | | | 186,312 | | | | | |
| Total assets | $ 8,465,000 | | | | | | $ 8,228,745 | | | | | | $ 7,874,213 | | | | | |
| | | | | | | | | | | | | | | | | | | |
| Liabilities and stockholders' equity | | | | | | | | | | | | | | | | | | |
| Interest-bearing liabilities: | | | | | | | | | | | | | | | | | | |
| Checking | $ 471,397 | | $ 622 | | 0.13 | % | $ 426,976 | | $ 879 | | 0.21 | % | $ 398,430 | | $ 819 | | 0.20 | % |
| Savings | 232,651 | | 1,323 | | 0.57 | | 228,879 | | 1,873 | | 0.82 | | 230,818 | | 4,105 | | 1.77 | |
| Money market | 914,382 | | 6,522 | | 0.71 | | 814,898 | | 8,512 | | 1.04 | | 804,612 | | 16,771 | | 2.08 | |
| Certificates | 2,672,364 | | 70,749 | | 2.65 | | 2,585,560 | | 89,207 | | 3.45 | | 2,507,036 | | 111,740 | | 4.44 | |
| Total deposits | 4,290,794 | | 79,216 | | 1.85 | | 4,056,313 | | 100,471 | | 2.48 | | 3,940,896 | | 133,435 | | 3.37 | |
FHLB advances (4) | 2,389,597 | | 97,212 | | 4.07 | | 2,437,978 | | 106,551 | | 4.36 | | 2,552,883 | | 125,748 | | 4.89 | |
| Repurchase agreements | 654,987 | | 26,378 | | 3.97 | | 660,000 | | 26,549 | | 3.97 | | 337,459 | | 13,831 | | 4.03 | |
| Other borrowings | 53,609 | | 1,680 | | 3.09 | | 53,601 | | 2,573 | | 4.74 | | 53,550 | | 3,624 | | 6.66 | |
| Total borrowings | 3,098,193 | | 125,270 | | 4.03 | | 3,151,579 | | 135,673 | | 4.29 | | 2,943,892 | | 143,203 | | 4.82 | |
| Total interest-bearing liabilities | 7,388,987 | | 204,486 | | 2.77 | | 7,207,892 | | 236,144 | | 3.27 | | 6,884,788 | | 276,638 | | 3.99 | |
| Other noninterest-bearing liabilities | 119,441 | | | | | | 108,940 | | | | | | 119,353 | | | | | |
| Stockholders' equity | 956,572 | | | | | | 911,913 | | | | | | 870,072 | | | | | |
| Total liabilities and stockholders' equity | $ 8,465,000 | | | | | | $ 8,228,745 | | | | | | $ 7,874,213 | | | | | |
| | | | | | | | | | | | | | | | | | | |
Net interest income (7) | | | $169,565 | | | | | | $176,642 | | | | | | $134,168 | | | |
Net interest rate spread (5) | | | | | 1.78 | % | | | | | 1.86 | % | | | | | 1.35 | % |
| Net earning assets | $ 840,689 | | | | | | $ 839,024 | | | | | | $ 803,113 | | | | | |
Net interest margin (6) | | | | | 2.06 | % | | | | | 2.20 | % | | | | | 1.75 | % |
| Ratio of interest-earning assets to | | | | | | | | | | | | | | | | | | |
| interest-bearing liabilities | | | | | 1.11 | x | | | | | 1.12 | x | | | | | 1.12 | x |
| (1) | Calculated net of unearned loan fees, deferred costs, and undisbursed loan funds. Non-accrual loans are included in the loans receivable average balance with a yield of zero percent. Balances include LHFS. |
(2) MBS and investment securities classified as AFS are stated at amortized cost, adjusted for unamortized purchase premiums or discounts.
| (3) | The average balance of investment securities includes an average balance of nontaxable securities of $72.0 million, $61.0 million, and $45.9 million for the years ended September 30, 2010, 2009, and 2008, respectively. |
(4) FHLB advances are stated net of deferred gains and deferred prepayment penalties.
(5) Net interest rate spread represents the difference between the average yield on interest-earning assets and the average cost of interest-bearing liabilities.
(6) Net interest margin represents net interest income as a percentage of average interest-earning assets.
| (7) | Net interest income represents the difference between interest income earned on interest-earning assets, such as mortgage loans, investment securities, and MBS, and interest paid on interest-bearing liabilities, such as deposits, FHLB advances, and other borrowings. Net interest income depends on the balance of interest-earning assets and interest-bearing liabilities, and the interest rates earned or paid on them. |
Rate/Volume Analysis. The table below presents the dollar amount of changes in interest income and interest expense for major components of interest-earning assets and interest-bearing liabilities, comparing fiscal years 2010 to 2009 and fiscal years 2009 to 2008. For each category of interest-earning assets and interest-bearing liabilities, information is provided on changes attributable to (1) changes in volume, which are changes in the average balance multiplied by the previous year’s average rate and (2) changes in rate, which are changes in the average rate multiplied by the average balance from the previous year. The net changes attributable to the combined impact of both rate and volume have been allocated proportionately to the changes d ue to volume and the changes due to rate.
| | Year Ended September 30, |
| | 2010 vs. 2009 | | 2009 vs. 2008 |
| | Increase (Decrease) Due to | | Increase (Decrease) Due to |
| | Volume | | Rate | | Total | | Volume | | Rate | | Total |
| | (Dollars in thousands) |
| Interest-earning assets: | | | | | | | | | | | |
| Loans receivable | $ (5,867) | | $ (17,608) | | $ (23,475) | | $ 10,443 | | $ (6,681) | | $ 3,762 |
| MBS | (17,383) | | (8,684) | | (26,067) | | 10,295 | | (764) | | 9,531 |
| Investment securities | 11,980 | | (1,831) | | 10,149 | | (494) | | (3,890) | | (4,384) |
| Capital stock of FHLB | 110 | | 512 | | 622 | | 27 | | (3,604) | | (3,577) |
| Cash and cash equivalents | 69 | | (33) | | 36 | | (947) | | (2,405) | | (3,352) |
| Total interest-earning assets | (11,091) | | (27,644) | | (38,735) | | 19,324 | | (17,344) | | 1,980 |
| | | | | | | | | | | | |
| Interest-bearing liabilities: | | | | | | | | | | | |
| Checking | 86 | | (370) | | (284) | | 60 | | 42 | | 102 |
| Savings | 30 | | (583) | | (553) | | (35) | | (2,218) | | (2,253) |
| Money market | 942 | | (2,930) | | (1,988) | | 208 | | (8,589) | | (8,381) |
| Certificates | 2,901 | | (21,331) | | (18,430) | | 3,351 | | (25,783) | | (22,432) |
| FHLB advances | (1,407) | | (7,932) | | (9,339) | | (4,606) | | (14,591) | | (19,197) |
| Other borrowings | (199) | | (865) | | (1,064) | | 12,920 | | (1,253) | | 11,667 |
| Total interest-bearing liabilities | 2,353 | | (34,011) | | (31,658) | | 11,898 | | (52,392) | | (40,494) |
| | | | | | | | | | | | |
| Net change in net interest income | $ (13,444) | | $ 6,367 | | $ (7,077) | | $ 7,426 | | $ 35,048 | | $ 42,474 |
Comparison of Results of Operations for the Years Ended September 30, 2010 and 2009
For fiscal year 2010, the Company recognized net income of $67.8 million compared to net income of $66.3 million in fiscal year 2009. The $1.5 million increase in net income was primarily a result of a $5.8 million increase in other income, a $3.9 million decrease in other expenses and a $1.4 million decrease in income tax expense, partially offset by a $7.1 million decrease in net interest income and a $2.5 million increase in provision for loan losses.
The net interest margin for fiscal year 2010 was 2.06% compared to 2.20% for fiscal year 2009. The 14 basis point decrease in the net interest margin was primarily a result of a decrease in the average yield of interest-earning assets compared to the prior year. The average yield on the loan portfolio decreased 33 basis points between periods due to loan modifications and refinances, originations and purchases at market rates which were lower than the existing portfolio and repayments of loans with rates higher than the portfolio. Additionally, the Bank has been purchasing investment securities with weighted average lives of approximately three years or less and at yields lower than MBS as part of our overall interest rate risk management strategy. The decrease in the weighted average yield on interest-earning assets was partially offset by a decrease in the weighted average rate paid on interest-bearing liabilities, specifically the certificate of deposit portfolio and FHLB advances.
Interest and Dividend Income
Total interest and dividend income for the current fiscal year was $374.1 million compared to $412.8 million for the prior fiscal year. The $38.7 million decrease was a result of a $26.0 million decrease in interest income on MBS and a $23.5 million decrease in interest income on loans receivable, partially offset by a $10.2 million increase in interest income on investment securities.
Interest income on loans receivable in the current fiscal year was $282.3 million compared to $305.8 million in the prior fiscal year. The $23.5 million decrease was a result of a 33 basis point decrease in the weighted average yield of the portfolio to 5.23% for the current fiscal year, as well as a $107.1 million decrease in the average balance of the loan portfolio between the two periods. The decrease in the weighted average yield was due to loan modifications and refinances, originations and purchases at market rates lower than the existing portfolio, and repayments of loans with rates higher than the portfolios. The decrease in the average balance was due to the loan swap transaction and principal repayments outpacing originations and purchases during the fiscal year.
Interest income on MBS in the current fiscal year was $71.9 million compared to $97.9 million in the prior fiscal year. The $26.0 million decrease was due primarily to a decrease of $400.6 million in the average balance, as well as a 44 basis point decrease in the weighted average portfolio yield to 4.20% for the current fiscal year. The decrease in the average balance of the portfolio was due to principal repayments which were not replaced in their entirety; rather, the proceeds were reinvested into the investment securities portfolio. The weighted average yield decreased between the two periods due to an increase of prepayments on MBS with yields higher than the existing portfolio, repricing of adjustable-rate securities to lower market rates, and, to a lesser extent, purchases of MBS at lower yie lds than the existing portfolio between the two periods.
Interest income on investment securities in the current fiscal year was $15.7 million compared to $5.5 million in the prior fiscal year. The $10.2 million increase was primarily a result of an increase of $658.2 million in the average balance of the portfolio, partially offset by a 64 basis point decrease in the weighted average portfolio yield to 1.77% for the current fiscal year. The average portfolio balance increased as a result of purchases funded with proceeds from the loan swap transaction, MBS and loan principal repayments and, to a lesser extent, from an increase in retail deposits. The decrease in the weighted average yield of the portfolio was attributed to maturities and calls of securities with yields greater than the remaining portfolio, and to investments made at lower market yields than th e overall portfolio yield.
Interest Expense
Total interest expense for the current fiscal year was $204.5 million, compared to $236.1 million in the prior fiscal year. The $31.6 million decrease was primarily due to a decrease in interest expense on deposits of $21.3 million and a decrease in interest expense on FHLB advances of $9.4 million.
Interest expense on deposits in the current fiscal year was $79.2 million compared to $100.5 million in the prior fiscal year. The $21.3 million decrease was primarily a result of a decrease in the rates on the entire deposit portfolio, primarily the certificate of deposit and money market portfolios, as these portfolios repriced to lower market rates. The average rate paid on the deposit portfolio decreased 63 basis points to 1.85% for the current fiscal year. The decrease in interest expense was partially offset by a $234.5 million increase in the average balance of the deposit portfolio, particularly the certificate of deposit and money market portfolios.
Interest expense on FHLB advances in the current fiscal year was $97.2 million compared to $106.6 million in the prior fiscal year. The $9.4 million decrease in interest expense was a result of the refinancing of $875.0 million of advances during the second and third quarters of fiscal year 2009, and the refinancing of $200.0 million of advances and the renewal of $100.0 million of advances during the third quarter of fiscal year 2010 at rates lower than the existing portfolio.
Provision for Loan Losses
During fiscal year 2010, the Company recorded a provision for loan losses of $8.9 million compared to a provision of $6.4 million in the prior fiscal year. The $8.9 million provision for loan losses is composed of $5.0 million related to increases in certain loss factors in our general valuation allowance model and $3.9 million related to establishing or increasing specific valuation allowances. The increase in certain loss factors in our general valuation allowance model reflects the risks inherent in our loan portfolio due to decreases in real estate values in certain geographic regions where the Bank has purchased loans, the continued elevated level of unemployment, and the increase in non-performing loans and loan charge-offs. The increase in specific valuation allowances was primarily related to our purchased loan portfolio. These factors, when combined, contributed to the increase in the provision for loan losses in fiscal year 2010 and resulted in an increase in our ALLL from $10.2 million at September 30, 2009 to $14.9 million at September 30, 2010.
Other Income and Expense
Total other income for the current fiscal year was $34.4 million compared to $28.6 million in the prior fiscal year. The $5.8 million increase was due primarily to the $6.5 million gain on the sale of trading MBS in conjunction with the loan swap transaction during the first quarter of fiscal year 2010.
In response to the amendments to Regulation E by the Federal Reserve Board, the Bank made changes to its overdraft fee schedule and informed eligible accountholders of their options for handling these overdrafts. As a result of the new fee schedule and the number of customers who elected to opt-in or opt-out, the Bank is estimating that its overdraft fee income will be reduced by approximately $3.3 million annually. Management is analyzing the Bank’s deposit account fee structure and plans to make adjustments to the structure during fiscal year 2011 to mitigate the reduction in fee income.
Total other expenses for the current fiscal year were $89.7 million compared to $93.6 million for the prior fiscal year. The $3.9 million decrease was due primarily to an impairment and valuation allowance taken on the mortgage-servicing rights asset in the prior year period, compared to a net recovery in the current period.
During the fourth quarter of fiscal year 2010, management decided to discontinue the debit card rewards program effective October 31, 2010. It is estimated to result in a $1.5 million decrease in advertising and promotional expense compared to fiscal year 2010.
Income Tax Expense
Income tax expense for the current fiscal year was $37.5 million compared to $38.9 million for the prior fiscal year. The effective tax rate was 35.6% for the current fiscal year, compared to 37.0% for the prior fiscal year. The difference in the effective tax rate between periods was primarily a result of a net decrease in nondeductible amounts associated with the ESOP in the current fiscal year, a reduction of unrecognized tax benefits due to the lapse of the statute of limitations during the first quarter of fiscal year 2010 and an increase in tax credits related to our low income housing partnerships.
Comparison of Results of Operations for the Years Ended September 30, 2009 and 2008
For fiscal year 2009, the Company recognized net income of $66.3 million compared to net income of $51.0 million in fiscal year 2008. The $15.3 million increase in net income was primarily a result of a $40.5 million decrease in interest expense, partially offset by an $11.6 million increase in other expenses, a $9.7 million increase in income tax expense, and a $4.3 million increase in provision for loan loss. The net interest margin for fiscal year 2009 was 2.20% compared to 1.75% for fiscal year 2008. The 45 basis point increase in the net interest margin was primarily a result of a decrease in the weighted average rate on interest-bearing liabilities.
Interest and Dividend Income
Total interest and dividend income for fiscal year 2009 was $412.8 million compared to $410.8 million for fiscal year 2008. The $2.0 million increase was a result of a $9.5 million increase in interest income on MBS and a $3.8 million increase in interest income on loans receivable, partially offset by a $4.4 million decrease in interest income on investment securities, a $3.6 million decrease in dividends on FHLB stock, and a $3.4 million decrease in interest income on cash and cash equivalents.
Interest income on loans receivable in fiscal year 2009 was $305.8 million compared to $302.0 million in fiscal year 2008. The $3.8 million increase in loan interest income was a result of a $189.0 million increase in the average balance of the loan portfolio between the two periods, partially offset by a decrease of 12 basis points in the weighted average yield of the portfolio to 5.56% for fiscal year 2009. The increase in the average balance was due to originations and loan purchases during fiscal year 2009. The decrease in the weighted average yield was due to purchases and originations at market rates which were lower than the existing portfolio, loan modifications and refinances during fiscal year 2009, and the home equity loan portfolio repricing to lower market interest rates, partially offs et by an increase in deferred fee amortization as a result of prepayments, modifications, and refinances.
Interest income on MBS in fiscal year 2009 was $97.9 million compared to $88.4 million in fiscal year 2008. The $9.5 million increase in interest income was primarily due to an increase of $222.5 million in the average balance, slightly offset by a four basis point decrease in the weighted average portfolio yield to 4.64% for fiscal year 2009. The increase in the average portfolio balance was a result of purchases. The funds for the purchases came from maturities and calls of investment securities and from new borrowings in fiscal year 2008.
Interest income on investment securities in fiscal year 2009 was $5.5 million compared to $9.9 million in fiscal year 2008. The $4.4 million decrease in interest income was a result of a 168 basis point decrease in the weighted average portfolio yield to 2.41% for fiscal year 2009 and, to a lesser extent, a decrease of $12.7 million in the average balance of the portfolio. The decrease in the weighted average yield of the portfolio was attributed to maturities and calls of securities with weighted average yields greater than the remaining portfolio, and also due to reinvestments made at lower market yields than the overall portfolio yield. The decrease in the average balance was a result of the timing of calls, maturities, and security purchases during fiscal year 2009.
Dividends on FHLB stock in fiscal year 2009 were $3.3 million compared to $6.9 million in fiscal year 2008. The $3.6 million decrease in dividend income was due primarily to a 278 basis point decrease in the average yield to 2.58% for fiscal year 2009. The dividend rate on FHLB stock correlates to the federal funds rate, which decreased during fiscal year 2009.
Interest income on cash and cash equivalents in fiscal year 2009 was $201 thousand compared to $3.6 million in fiscal year 2008. The $3.4 million decrease was due to a 283 basis point decrease in the weighted average yield due to a decrease in short-term interest rates between the two periods, and a decrease in the average balance of $40.3 million. The decrease in the average balance was a result of cash being utilized to purchase MBS and investment securities.
Interest Expense
Total interest expense for fiscal year 2009 was $236.1 million, compared to $276.6 million in fiscal year 2008. The $40.5 million decrease in interest expense was due to a decrease in interest expense on deposits of $32.9 million and a decrease in interest expense on FHLB advances of $19.2 million, partially offset by an increase in interest expense on other borrowings of $11.6 million.
Interest expense on deposits in fiscal year 2009 was $100.5 million compared to $133.4 million in fiscal year 2008. The $32.9 million decrease in interest expense was primarily a result of a decrease in the average rate paid on the certificate of deposit, money market and savings portfolios due to the portfolios repricing to lower market rates. The average rate paid on the deposit portfolio decreased 89 basis points to 2.48% for fiscal year 2009.
Interest expense on FHLB advances in fiscal year 2009 was $106.5 million compared to $125.7 million in fiscal year 2008. The $19.2 million decrease in interest expense was a result of the termination and maturity of the interest rate swap agreements during fiscal year 2008, a decrease in the average balance of FHLB advances, and a decrease in the interest rate due to the refinancing of $875.0 million of advances during the second and third quarters of fiscal year 2009. The decrease in the average balance was a result of maturing advances that were replaced with repurchase agreements during fiscal year 2008.
Interest expense on other borrowings was $29.1 million for fiscal year 2009 compared to $17.5 million in fiscal year 2008. The $11.6 million increase was due to an increase in the average balance as a result of the Bank entering into $660.0 million of repurchase agreements during fiscal year 2008. The proceeds from the repurchase agreements were used to purchase MBS and to repay maturing FHLB advances.
Provision for Loan Losses
During fiscal year 2009, the Bank experienced an increase in delinquencies, non-performing loans, net loan charge-offs, and losses on foreclosed property transactions, primarily on purchased loans, as a result of the decline in housing and real estate markets, as well as the ongoing economic recession. As a result of these conditions, the Bank recorded a provision for loan losses of $6.4 million in fiscal year 2009 compared to a provision of $2.1 million in fiscal year 2008. The $4.3 million increase in the provision primarily reflects an increase in the specific valuation allowances on purchased loans, an increase in the balance of non-performing purchased loans, an increase in the general valuation allowances primarily related to purchased loans 30 to 89 days delinquent, and an increase in charge-offs, also primar ily related to purchased loans.
Other Income and Expense
Total other income for fiscal year 2009 was $28.6 million compared to $30.0 million in fiscal year 2008. The $1.4 million decrease in other income was primarily a result of a $1.2 million decrease in income from bank-owned life insurance (“BOLI”) as a result of a decrease in the net crediting rate due to a decrease in market interest rates.
Total other expenses for fiscal year 2009 was $93.6 million compared to $82.0 million for fiscal year 2008. The $11.6 million increase was due to a $6.8 million increase in federal insurance premiums, a $2.0 million increase in advertising expense, and a $2.0 million increase in mortgage servicing activity, net. The increase in federal insurance premiums was a result of the FDIC special assessment and increases in the regular quarterly deposit insurance premiums. The increase in advertising expense was due to expense associated with the Bank’s new debit card rewards program and to advertising campaigns undertaken to inform customers of the Bank’s safety and soundness in response to current economic conditions. The increase in mortgage servicing activity, net was due to mortgage serv icing asset impairments and valuation allowances due to an increase in prepayment speeds.
Income Tax Expense
Income tax expense for fiscal year 2009 was $38.9 million compared to $29.2 million for fiscal year 2008. The increase in income tax expense was primarily due to an increase in earnings compared to the prior year period. The effective tax rate was 37.0% for fiscal year 2009, compared to 36.4% for fiscal year 2008. The difference in the effective tax rate between the two fiscal years was primarily a result of a decrease in nontaxable income from BOLI and an increase in pre-tax income which reduced the effective tax rate benefit of nontaxable income.
Liquidity and Capital Resources
Liquidity refers to our ability to generate sufficient cash to fund ongoing operations, to pay maturing certificates of deposit and other deposit withdrawals, and to fund loan commitments. Liquidity management is both a daily and long-term function of our business management. The Bank’s most available liquid assets are represented by cash and cash equivalents, AFS MBS and investment securities, and short-term investment securities. The Bank’s primary sources of funds are deposits, FHLB advances, other borrowings, repayments and maturities of outstanding loans and MBS, other short-term investments, and funds provided by operations. The Bank’s borrowings primarily have been used to invest in U.S. GSE debenture and MBS securities in an effort to improve the earnings of the Bank, without taking undo credit and interest-rate risk, while maintaining capital ratios in excess of regulatory standards for well-capitalized financial institutions. In addition, the Bank’s focus on managing risk has provided additional liquidity capacity by remaining below FHLB borrowing limits and by increasing the balance of MBS and investment securities available as collateral for borrowings.
We generally intend to maintain cash reserves sufficient to meet short-term liquidity needs, which are routinely forecasted for 10, 30, and 365 days. Additionally, on a monthly basis, we perform a liquidity stress test in accordance with the Interagency Policy Statement on Funding and Liquidity Risk Management. The liquidity stress test incorporates both a short-term and long-term liquidity scenario in order to quantify liquidity risk. In the event short-term liquidity needs exceed available cash, the Bank has access to lines of credit at the FHLB and the Federal Reserve Bank. The FHLB line of credit, when combined with FHLB advances, may not exceed 40% of total assets. Our unused borrowing capacity at the FHLB as of September 30, 2010 was $1.20 billion. The Federal Reserve Bank line of credit is ba sed upon the fair values of the securities pledged as collateral and certain other characteristics of those securities, and is used only when other sources of short-term liquidity are unavailable. At September 30, 2010, the Bank had $1.64 billion of securities that were eligible but unused as collateral for borrowing or other liquidity needs. Borrowings on the lines of credit are outstanding until replaced by cash flows from long-term sources of liquidity, and are generally outstanding no longer than 30 days.
If management observes a trend in the amount and frequency of lines of credit utilization, the Bank will likely utilize long-term wholesale borrowing sources, such as FHLB advances and/or repurchase agreements, to provide permanent fixed-rate funding. The maturity of these borrowings is generally structured in such a way as to stagger maturities in order to reduce the risk of a highly negative cash flow position at maturity. Additionally, the Bank could utilize the repayment and maturity of outstanding loans, MBS and other investments for liquidity needs rather than reinvesting such funds into the related portfolios.
While scheduled payments from the amortization of loans and MBS and payments on short-term investments are relatively predictable sources of funds, deposit flows, prepayments on loans and MBS, and calls of investment securities are greatly influenced by general interest rates, economic conditions and competition, and are less predictable sources of funds. To the extent possible, the Bank manages the cash flows of its loan and deposit portfolios by the rates it offers customers.
At September 30, 2010, cash and cash equivalents totaled $65.2 million, an increase of $24.1 million from September 30, 2009. The increase was primarily due to cash flows from the prepayment of the loan and securities portfolios not being immediately reinvested at September 30, 2010.
During fiscal year 2010, loan originations and purchases, net of principal repayments and other related loan activities provided a net cash inflow of $220.3 million, compared to a cash outflow of $396.9 million in the prior year. Mortgage origination volume, in general, has decreased from the prior year as the market demand for lending has declined. Additionally, the Bank has been purchasing fewer loans under the Bank’s nationwide purchase loan program during fiscal year 2010 due to the lack of loans meeting our underwriting criteria from our existing relationships. The Bank is working to expand the number of relationships from which it may buy loans in the future.
During fiscal year 2010, the Bank received principal payments on MBS of $511.3 million and proceeds from the sale of trading MBS received in the loan swap transaction of $199.1 million. These cash inflows were largely reinvested in investment securities. The investment securities purchased during fiscal year 2010 had a WAL of approximately two years or less at the time of purchase. If market rates were to rise, the short-term nature of these securities may allow management the opportunity to reinvest the maturing funds at a yield higher than current yields.
The Bank utilizes FHLB advances to provide funds for lending and investment activities. FHLB lending guidelines set borrowing limits as part of their underwriting standards. At September 30, 2010, the Bank’s ratio of the face amount of advances to total assets, as reported to the OTS, was 28%. Our advances are secured by a blanket pledge of our loan portfolio, as collateral, supported by quarterly reporting to FHLB. Advances in excess of 40% of total assets, but not exceeding 55% of total assets, may be approved by the president of FHLB based upon a review of documentation supporting the use of the advances. Currently, the blanket pledge is sufficient collateral for the FHLB advances. It is possible that increases in our borrowings or decreases in our loan portfolio could require the Bank to pledge securities as collateral on the FHLB advances. The Bank’s policy allows borrowing from FHLB of up to 55% of total assets. The Bank relies on FHLB advances as a primary source of borrowings. There was no increase in FHLB advances during fiscal year 2010; however, a maturing $100.0 million FHLB advance was replaced, $200.0 million of FHLB advances were refinanced and a $50 million maturing FHLB advance was not replaced. A prepayment fee of $875 thousand was paid on the $200.0 million of advances that were refinanced. See additional
discussion regarding the FHLB advance refinance in “Notes to Financial Statements - Note 7 – Borrowed Funds”.
The Bank has access to and utilizes other sources for liquidity, such as secondary market repurchase agreements, brokered deposits, and public unit deposits. There were no repurchase agreements entered into during fiscal year 2010; however a maturing $45.0 million repurchase agreement was not replaced during fiscal year 2010. The Bank may enter into additional repurchase agreements as management deems appropriate. Management continuously monitors the wholesale deposit market for opportunities to obtain brokered and public unit deposits at attractive rates. As of September 30, 2010, the Bank’s policy allows for repurchase agreements of up to 15% of total assets, brokered deposits up to 10% of total deposits, and public unit deposits up to 5% of total deposits. At September 30, 2010, the Bank had repurchase agreements of $615.0 million, or approximately 7% of total assets, public unit deposits of $109.9 million, or approximately 3% of total deposits, and brokered deposits of $83.7 million, or approximately 2% of total deposits. See additional discussion regarding the repurchase agreements in “Notes to Financial Statements - Note 7 – Borrowed Funds”.
The Bank has pledged securities with an estimated fair value of $709.9 million as collateral for repurchase agreements and $128.6 million as collateral for public unit deposits. The securities pledged for the repurchase agreements will be delivered back to the Bank when the repurchase agreements mature. The securities pledged as collateral for public unit deposits are held under joint custody receipt by the FHLB and generally will be released upon deposit maturity. At September 30, 2010, the Bank had securities with a fair value of $1.64 billion eligible, but unused, for collateral. This collateral amount is comprised of AFS and HTM securities with individual fair values greater than $10.0 million, which is then reduced by a collateralization ratio of 10% to account for potential market value fluctuations.
At September 30, 2010, $1.52 billion of the $2.73 billion in certificates of deposit were scheduled to mature within one year. Included in the $1.52 billion were $96.9 million in brokered and public unit deposits. Based on our deposit retention experience and our current pricing strategy, we anticipate the majority of the maturing retail certificates of deposit will renew or transfer to other deposit products at the prevailing rate, although no assurance can be given in this regard.
In 2004, the Company issued $53.6 million in Junior Subordinated Deferrable Interest Debentures (“Debentures”) in connection with a trust preferred securities offering. The Company received, net, $52.0 million from the issuance of the Debentures and an investment of $1.6 million in Capitol Federal Financial Trust I (the “Trust”). The Company did not down-stream the proceeds to be used by the Bank for Tier 1 capital because the Bank already exceeded all regulatory requirements to be a well-capitalized institution. Instead, the Company deposited the proceeds into certificate accounts at the Bank to be used to further the Company’s general corporate and capital management strategies which could include the payment of dividends.
During fiscal year 2010, the Company paid cash dividends of $48.4 million, or $2.29 per share. The $2.29 per share consisted of four quarterly dividends of $0.50 per share and a $0.29 special dividend per share related to fiscal year 2009 earnings per the Company’s dividend policy. Dividend payments depend upon a number of factors including the Company's financial condition and results of operations, the Bank’s regulatory capital requirements, regulatory limitations on the Bank's ability to make capital distributions to the Company, the amount of cash at the holding company, and the continued waiver of dividends by MHC. At September 30, 2010, Capitol Federal Financial, at the holding company level, had $143.1 million in cash and certificates of deposit at the Bank to be used to further the Com pany's general corporate and capital management strategies, which could include the payment of dividends. See additional discussion regarding limitations and potential limitations on dividends in the section entitled “Regulation” in Part I, Item 1 of the Company’s Annual Report on Form 10-K for the fiscal year ended September 30, 2010 and “Item 1A. Risk Factors - The Company’s ability to pay dividends is subject to the ability of the Bank to make capital distributions to the Company and the waiver of dividends by MHC.”
The long-term ability of the Company to pay dividends to its stockholders is based primarily upon the ability of the Bank to make capital distributions to the Company. So long as the Bank continues to remain “well capitalized” after each capital distribution, operate in a safe and sound manner, provide the OTS with updated capital levels, and non-performing asset balances and ALLL information as requested, and comply with the interest rate risk management guidelines of the OTS, it is management’s belief that the OTS will continue to allow the Bank to distribute its net income to the Company, although no assurance can be given in this regard.
Due to recent bank failures, in an effort to replenish the Deposit Insurance Fund, the Board of Directors of the FDIC adopted a rule that required insured institutions to prepay their estimated quarterly risk-based assessments for the fourth quarter of calendar year 2009 and for all of calendar year 2010, 2011 and 2012 during the quarter ended December 31, 2009. The Bank paid FDIC premiums of $27.5 million in December 2009, which included $25.7 million of prepayments for calendar years 2010, 2011 and 2012. During the year ended September 30, 2010, the Bank expensed $5.3 million of the $25.7 million prepaid amount.
Off-Balance Sheet Arrangements, Commitments and Contractual Obligations
The Company, in the normal course of business, makes commitments to buy or sell assets or to incur or fund liabilities. Commitments may include, but are not limited to:
| · | the origination, purchase, or sale of loans; |
| · | the purchase or sale of investments and MBS; |
| · | extensions of credit on home equity loans and construction loans; |
| · | terms and conditions of operating leases; and |
| · | funding withdrawals of certificate of deposits at maturity. |
In addition to its commitments of the types described above, at September 30, 2010 the Company’s off-balance sheet arrangements included its $1.6 million interest in the Trust, which in 2004 issued $52.0 million of variable rate cumulative trust preferred securities. In connection therewith, the Company issued $53.6 million of Debentures to the Trust.
The following table summarizes our contractual obligations and other material commitments as of September 30, 2010. The Debentures are callable at any time, in whole or in part.
| | | Maturity Range | |
| | | | | | Less than | | | | 1 - 3 | | | | 3 - 5 | | | More than | |
| | | Total | | | 1 year | | | years | | | years | | | 5 years | |
| | | (Dollars in thousands) | |
| | | | | | | | | | | | | | | | | | |
| Operating leases | | $ | 12,245 | | | $ | 1,124 | | | $ | 1,837 | | | $ | 1,551 | | | $ | 7,733 | |
| | | | | | | | | | | | | | | | | | | | | |
| Certificates of Deposit | | $ | 2,727,169 | | | $ | 1,516,681 | | | $ | 885,232 | | | $ | 323,033 | | | $ | 2,223 | |
| Weighted average rate | | | 2.29 | % | | | 1.97 | % | | | 2.67 | % | | | 2.77 | % | | | 3.02 | % |
| | | | | | | | | | | | | | | | | | | | | |
| FHLB Advances | | $ | 2,376,000 | | | $ | 276,000 | | | $ | 875,000 | | | $ | 650,000 | | | $ | 575,000 | |
| Weighted average rate | | | 3.61 | % | | | 4.87 | % | | | 3.57 | % | | | 3.22 | % | | | 3.51 | % |
| | | | | | | | | | | | | | | | | | | | | |
| Repurchase Agreements | | $ | 615,000 | | | $ | 200,000 | | | $ | 295,000 | | | $ | 120,000 | | | $ | -- | |
| Weighted average rate | | | 4.03 | % | | | 3.79 | % | | | 4.12 | % | | | 4.24 | % | | | -- | % |
| | | | | | | | | | | | | | | | | | | | | |
| Debentures | | $ | 53,609 | | | $ | -- | | | $ | -- | | | $ | -- | | | $ | 53,609 | |
| Weighted average rate | | | 3.28 | % | | | -- | % | | | -- | % | | | -- | % | | | 3.28 | % |
| | | | | | | | | | | | | | | | | | | | | |
| Commitments to originate and | | | | | | | | | | | | | | | | | | | | |
| purchase mortgage loans | | $ | 107,022 | | | $ | 107,022 | | | $ | -- | | | $ | -- | | | $ | -- | |
| Weighted average rate | | | 4.29 | % | | | 4.29 | % | | | -- | % | | | -- | % | | | -- | % |
| | | | | | | | | | | | | | | | | | | | | |
| Commitments to fund unused | | | | | | | | | | | | | | | | | | | | |
| home equity lines of credit | | $ | 265,367 | | | $ | 265,367 | | | $ | -- | | | $ | -- | | | $ | -- | |
| Weighted average rate | | | 4.49 | % | | | 4.49 | % | | | -- | % | | | -- | % | | | -- | % |
| | | | | | | | | | | | | | | | | | | | | |
| Unadvanced portion of | | | | | | | | | | | | | | | | | | | | |
| construction loans | | $ | 15,489 | | | $ | 15,489 | | | $ | -- | | | $ | -- | | | $ | -- | |
| Weighted average rate | | | 4.77 | % | | | 4.77 | % | | | -- | % | | | -- | % | | | -- | % |
Excluded from the table above are income tax liabilities of $114 thousand related to uncertain income tax positions. The amounts are excluded as management is unable to estimate the period of cash settlement as it is contingent on the statute of limitations expiring without examination by the respective taxing authority.
A percentage of commitments to originate mortgage loans are expected to expire unfunded, so the amounts reflected in the table above are not necessarily indicative of future liquidity requirements. Additionally, the Bank is not obligated to honor commitments to fund unused home equity lines of credit if a customer is delinquent or otherwise in violation of the loan agreement.
We anticipate we will continue to have sufficient funds, through repayments and maturities of loans and securities, deposits and borrowings, to meet our current commitments.
Contingencies
In the normal course of business, the Company and its subsidiaries are named defendants in various lawsuits and counter claims. In the opinion of management, after consultation with legal counsel, none of the currently pending suits are expected to have a materially adverse effect on the Company’s consolidated financial statements for the year ended September 30, 2010 or future periods.
Regulatory Capital
Consistent with management’s goals to operate a sound and profitable financial organization, we actively seek to maintain a “well capitalized” status in accordance with regulatory standards. Total equity under accounting principles generally accepted in the United States of America (“GAAP”) for the Bank was $857.1 million at September 30, 2010, or 10.1% of total Bank assets on that date. As of September 30, 2010, the Bank exceeded all capital requirements of the OTS. The following table presents the Bank’s regulatory capital ratios at September 30, 2010 based upon regulatory guidelines.
| | | | | | Regulatory | |
| | | | | | Requirement | |
| | | Bank | | | For “Well- | |
| | | Ratios | | | Capitalized” Status | |
| Tangible equity | | | 9.8 | % | | | N/A | |
| Tier 1 (core) capital | | | 9.8 | % | | | 5.0 | % |
| Tier 1 (core) risk-based capital | | | 23.5 | % | | | 6.0 | % |
| Total risk-based capital | | | 23.8 | % | | | 10.0 | % |
Stockholder Return Performance Presentation
The line graph below compares the cumulative total stockholder return on the Company’s common stock to the cumulative total return of a broad index of the Nasdaq Stock Market and a Hemscott Group savings and loan industry index (“S&L Index Hemscott #419”) for the period September 30, 2005 through September 30, 2010. The information presented below assumes $100 invested on September 30, 2005 in the Company’s common stock and in each of the indices, and assumes the reinvestment of all dividends. Historical stock price performance is not necessarily indicative of future stock price performance.
| | 2005 | 2006 | 2007 | 2008 | 2009 | 2010 |
| Capitol Federal Financial | 100.00 | 111.25 | 113.24 | 155.27 | 121.30 | 96.02 |
| NASDAQ Composite | 100.00 | 106.39 | 127.37 | 96.70 | 100.00 | 112.86 |
| S&L Index Hemscott #419 | 100.00 | 113.42 | 109.39 | 102.26 | 78.63 | 79.08 |
MANAGEMENT’S REPORT ON INTERNAL CONTROL OVER FINANCIAL REPORTING
Management of the Company is responsible for establishing and maintaining adequate internal control over financial reporting (as defined in Rule 13a-15(e) and 15(d)-15(e) under the Securities Exchange Act of 1934, as amended, the “Act”). The Company’s internal control system is a process designed to provide reasonable assurance to the Company’s management and Board of Directors regarding the preparation and fair presentation of published financial statements.
The Company’s internal control over financial reporting includes policies and procedures that pertain to the maintenance of records that, in reasonable detail, accurately and fairly reflect transactions and dispositions of assets; provide reasonable assurances that transactions are recorded as necessary to permit preparation of financial statements in accordance with accounting principles generally accepted in the United States of America, and that receipts and expenditures are being made only in accordance with authorizations of management and the directors of the Company; and provide reasonable assurance regarding prevention or untimely detection of unauthorized acquisition, use or disposition of the Company’s assets that could have a material effect on the Company’s financial statements.
All internal control systems, no matter how well designed, have inherent limitations. Therefore, even those systems determined to be effective can provide only reasonable assurance with respect to financial reporting. Further, because of changes in conditions, the effectiveness of any system of internal control may vary over time. The design of any internal control system also factors in resource constraints and consideration for the benefit of the control relative to the cost of implementing the control. Because of these inherent limitations in any system of internal control, management cannot provide absolute assurance that all control issues and instances of fraud within the Company have been detected.
Management assessed the effectiveness of the Company’s internal control over financial reporting as of September 30, 2010. In making this assessment, management used the criteria set forth by the Committee of Sponsoring Organizations of the Treadway Commission in Internal Control - Integrated Framework. Management has concluded that the Company maintained an effective system of internal control over financial reporting based on these criteria as of September 30, 2010.
The Company’s independent registered public accounting firm, Deloitte & Touche LLP, who audited the consolidated financial statements included in the Company’s annual report, has issued an audit report on the Company’s internal control over financial reporting as of September 30, 2010 and it is included herein.
| |
 |
| John B. Dicus, Chairman, President |
| and Chief Executive Officer |
| |
| |
 |
| Kent G. Townsend, Executive Vice President |
| and Chief Financial Officer |
| |
REPORT OF INDEPENDENT REGISTERED PUBLIC ACCOUNTING FIRM
To the Board of Directors and Stockholders of
Capitol Federal Financial and subsidiaries
Topeka, Kansas
We have audited the internal control over financial reporting of Capitol Federal Financial and subsidiaries (the "Company") as of September 30, 2010, based on criteria established in Internal Control - Integrated Framework issued by the Committee of Sponsoring Organizations of the Treadway Commission. Because management’s assessment and our audit were conducted to meet the reporting requirements of Section 112 of the Federal Deposit Insurance Corporation Improvement Act (FDICIA), management’s assessment and our audit of the Company’s internal control over financial reporting included controls over the preparation of the schedules equivalent to the basic financial statements in accordance with the instructions for the Consolidated Financial Statements fo r Bank Holding Companies (Form FR Y-9C). The Company's management is responsible for maintaining effective internal control over financial reporting and for its assessment of the effectiveness of internal control over financial reporting, included in the accompanying Management’s Report on Internal Control over Financial Reporting. Our responsibility is to express an opinion on the Company's internal control over financial reporting based on our audit.
We conducted our audit in accordance with the standards of the Public Company Accounting Oversight Board (United States). Those standards require that we plan and perform the audit to obtain reasonable assurance about whether effective internal control over financial reporting was maintained in all material respects. Our audit included obtaining an understanding of internal control over financial reporting, assessing the risk that a material weakness exists, testing and evaluating the design and operating effectiveness of internal control based on the assessed risk, and performing such other procedures as we considered necessary in the circumstances. We believe that our audit provides a reasonable basis for our opinion.
A company's internal control over financial reporting is a process designed by, or under the supervision of, the company's principal executive and principal financial officers, or persons performing similar functions, and effected by the company's Board of Directors, management, and other personnel to provide reasonable assurance regarding the reliability of financial reporting and the preparation of financial statements for external purposes in accordance with generally accepted accounting principles. A company's internal control over financial reporting includes those policies and procedures that (1) pertain to the maintenance of records that, in reasonable detail, accurately and fairly reflect the transactions and dispositions of the assets of the company; (2) provide reasonable assurance that transactions are recorded as necess ary to permit preparation of financial statements in accordance with generally accepted accounting principles, and that receipts and expenditures of the company are being made only in accordance with authorizations of management and directors of the company; and (3) provide reasonable assurance regarding prevention or timely detection of unauthorized acquisition, use, or disposition of the company's assets that could have a material effect on the financial statements.
Because of the inherent limitations of internal control over financial reporting, including the possibility of collusion or improper management override of controls, material misstatements due to error or fraud may not be prevented or detected on a timely basis. Also, projections of any evaluation of the effectiveness of the internal control over financial reporting to future periods are subject to the risk that the controls may become inadequate because of changes in conditions, or that the degree of compliance with the policies or procedures may deteriorate.
REPORT OF INDEPENDENT REGISTERED PUBLIC ACCOUNTING FIRM
In our opinion, the Company maintained, in all material respects, effective internal control over financial reporting as of September 30, 2010, based on the criteria established in Internal Control - Integrated Framework issued by the Committee of Sponsoring Organizations of the Treadway Commission.
We have also audited, in accordance with the standards of the Public Company Accounting Oversight Board (United States), the consolidated financial statements as of and for the year ended September 30, 2010 of the Company and our report dated November 29, 2010 expressed an unqualified opinion on those financial statements.
Kansas City, Missouri
November 29, 2010