SELECTED CONSOLIDATED FINANCIAL DATA
The summary information presented below under “Selected Balance Sheet Data” and “Selected Operations Data” for, and as of the end of, each of the years ended September 30 is derived from our audited consolidated financial statements. The following information is only a summary and you should read it in conjunction with our consolidated financial statements and notes beginning on page 52. All share information prior to the corporate reorganization in December 2010 has been revised to reflect the 2.2637 exchange ratio.
| | | September 30, | |
| | | 2011 | | | 2010 | | | 2009 | | | 2008 | | | 2007 | |
| | | (Dollars in thousands, except per share amounts) | |
| Selected Balance Sheet Data: | | | | | | | | | | | | | | | |
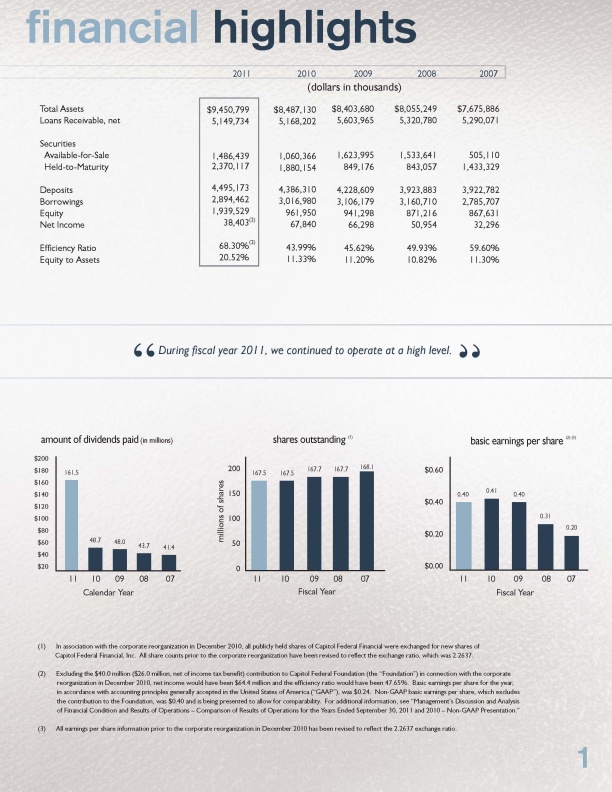
| Total assets | | $ | 9,450,799 | | | $ | 8,487,130 | | | $ | 8,403,680 | | | $ | 8,055,249 | | | $ | 7,675,886 | |
| Loans receivable, net | | | 5,149,734 | | | | 5,168,202 | | | | 5,603,965 | | | | 5,320,780 | | | | 5,290,071 | |
| Securities: | | | | | | | | | | | | | | | | | | | | |
| Available-for-sale (“AFS”) | | | 1,486,439 | | | | 1,060,366 | | | | 1,623,995 | | | | 1,533,641 | | | | 505,110 | |
| Held-to-maturity (“HTM”) | | | 2,370,117 | | | | 1,880,154 | | | | 849,176 | | | | 843,057 | | | | 1,433,329 | |
| Capital stock of Federal Home Loan Bank (“FHLB”) | | | 126,877 | | | | 120,866 | | | | 133,064 | | | | 124,406 | | | | 139,661 | |
| Deposits | | | 4,495,173 | | | | 4,386,310 | | | | 4,228,609 | | | | 3,923,883 | | | | 3,922,782 | |
| Advances from FHLB | | | 2,379,462 | | | | 2,348,371 | | | | 2,392,570 | | | | 2,447,129 | | | | 2,732,183 | |
| Other borrowings | | | 515,000 | | | | 668,609 | | | | 713,609 | | | | 713,581 | | | | 53,524 | |
| Stockholders’ equity | | | 1,939,529 | | | | 961,950 | | | | 941,298 | | | | 871,216 | | | | 867,631 | |
| | | | | | | | | | | | | | | | | | | | | |
| | | | | | | | | | | | | | | | | | | | | |
| | | Year Ended September 30, | |
| | | | 2011 | | | | 2010 | | | | 2009 | | | | 2008 | | | | 2007 | |
| | | (Dollars and counts in thousands, except per share amounts) | |
| Selected Operations Data: | | | | | | | | | | | | | | | | | | | | |
| Total interest and dividend income | | $ | 346,865 | | | $ | 374,051 | | | $ | 412,786 | | | $ | 410,806 | | | $ | 411,550 | |
| Total interest expense | | | 178,131 | | | | 204,486 | | | | 236,144 | | | | 276,638 | | | | 305,110 | |
| Net interest and dividend income | | | 168,734 | | | | 169,565 | | | | 176,642 | | | | 134,168 | | | | 106,440 | |
| Provision (recovery) for credit losses | | | 4,060 | | | | 8,881 | | | | 6,391 | | | | 2,051 | | | | (225 | ) |
| Net interest and dividend income after provision | | | | | | | | | | | | | | | | | | | | |
| for credit losses | | | 164,674 | | | | 160,684 | | | | 170,251 | | | | 132,117 | | | | 106,665 | |
| Retail fees and charges | | | 15,509 | | | | 17,789 | | | | 18,023 | | | | 17,805 | | | | 16,120 | |
| Other income | | | 9,486 | | | | 16,622 | | | | 10,571 | | | | 12,222 | | | | 7,846 | |
| Total other income | | | 24,995 | | | | 34,411 | | | | 28,594 | | | | 30,027 | | | | 23,966 | |
| Total other expenses | | | 132,317 | | | | 89,730 | | | | 93,621 | | | | 81,989 | | | | 77,725 | |
| Income before income tax expense | | | 57,352 | | | | 105,365 | | | | 105,224 | | | | 80,155 | | | | 52,906 | |
| Income tax expense | | | 18,949 | | | | 37,525 | | | | 38,926 | | | | 29,201 | | | | 20,610 | |
| Net income | | | 38,403 | | | | 67,840 | | | | 66,298 | | | | 50,954 | | | | 32,296 | |
| | | | | | | | | | | | | | | | | | | | | |
| Basic earnings per share | | $ | 0.24 | (1) | | $ | 0.41 | | | $ | 0.40 | | | $ | 0.31 | | | $ | 0.20 | |
| Average shares outstanding | | | 162,625 | | | | 165,862 | | | | 165,576 | | | | 165,112 | | | | 164,908 | |
| Diluted earnings per share | | $ | 0.24 | (1) | | $ | 0.41 | | | $ | 0.40 | | | $ | 0.31 | | | $ | 0.20 | |
| Average diluted shares outstanding | | | 162,633 | | | | 165,899 | | | | 165,721 | | | | 165,279 | | | | 165,183 | |
| | | 2011 | | | 2010 | | | 2009 | | | 2008 | | | 2007 | |
| Selected Performance and Financial Ratios | | | | | | | | | | | | | | | |
| and Other Data: | | | | | | | | | | | | | | | |
| Performance Ratios: | | | | | | | | | | | | | | | |
| Return on average assets | | | 0.41 | % | | | 0.80 | % | | | 0.81 | % | | | 0.65 | % | | | 0.41 | % |
| Return on average equity | | | 2.20 | (1) | | | 7.09 | | | | 7.27 | | | | 5.86 | | | | 3.72 | |
Dividends paid per public share (2) | | $ | 1.63 | | | $ | 2.29 | | | $ | 2.11 | | | $ | 2.00 | | | $ | 2.09 | |
| Dividend payout ratio | | | 390.88 | % | | | 71.34 | % | | | 66.47 | % | | | 81.30 | % | | | 133.14 | % |
| Ratio of operating expense to | | | | | | | | | | | | | | | | | | | | |
| average total assets | | | 1.40 | (1) | | | 1.06 | | | | 1.14 | | | | 1.04 | | | | 0.98 | |
| Efficiency ratio | | | 68.30 | (1) | | | 43.99 | | | | 45.62 | | | | 49.93 | | | | 59.60 | |
| Ratio of average interest-earning assets | | | | | | | | | | | | | | | | | | | | |
| to average interest-bearing liabilities | | | 1.22 | x | | | 1.11 | x | | | 1.12 | x | | | 1.12 | x | | | 1.12 | x |
| Interest rate spread information: | | | | | | | | | | | | | | | | | | | | |
| Average during period | | | 1.42 | % | | | 1.78 | % | | | 1.86 | % | | | 1.35 | % | | | 0.93 | % |
| End of period | | | 1.60 | | | | 1.76 | | | | 1.89 | | | | 1.70 | | | | 0.89 | |
| Net interest margin | | | 1.84 | | | | 2.06 | | | | 2.20 | | | | 1.75 | | | | 1.36 | |
| Asset Quality Ratios: | | | | | | | | | | | | | | | | | | | | |
| Non-performing assets to total assets | | | 0.40 | | | | 0.49 | | | | 0.46 | | | | 0.23 | | | | 0.12 | |
| Non-performing loans to total loans | | | 0.51 | | | | 0.62 | | | | 0.55 | | | | 0.26 | | | | 0.14 | |
| Allowance for credit losses (“ACL”) to | | | | | | | | | | | | | | | | | | | | |
| non-performing loans | | | 58.34 | | | | 46.60 | | | | 32.83 | | | | 42.37 | | | | 56.87 | |
| ACL to loans receivable, net | | | 0.30 | | | | 0.29 | | | | 0.18 | | | | 0.11 | | | | 0.08 | |
| Capital Ratios: | | | | | | | | | | | | | | | | | | | | |
| Equity to total assets at end of period | | | 20.52 | | | | 11.33 | | | | 11.20 | | | | 10.82 | | | | 11.30 | |
| Average equity to average assets | | | 18.50 | | | | 11.30 | | | | 11.08 | | | | 11.05 | | | | 10.91 | |
| | | | | | | | | | | | | | | | | | | | | |
| Regulatory Capital Ratios of Capitol | | | | | | | | | | | | | | | | | | | | |
| Federal Savings Bank (the “Bank”) | | | | | | | | | | | | | | | | | | | | |
| Tangible equity | | | 15.1 | | | | 9.8 | | | | 10.0 | | | | 10.0 | | | | 10.3 | |
| Tier 1 (core) capital | | | 15.1 | | | | 9.8 | | | | 10.0 | | | | 10.0 | | | | 10.3 | |
| Tier 1 (core) risk-based capital | | | 37.9 | | | | 23.5 | | | | 23.2 | | | | 23.1 | | | | 22.9 | |
| Total risk-based capital | | | 38.3 | | | | 23.8 | | | | 23.3 | | | | 23.0 | | | | 22.8 | |
| | | | | | | | | | | | | | | | | | | | | |
| Other Data: | | | | | | | | | | | | | | | | | | | | |
| Number of traditional offices | | | 35 | | | | 35 | | | | 33 | | | | 30 | | | | 29 | |
| Number of in-store offices | | | 10 | | | | 11 | | | | 9 | | | | 9 | | | | 9 | |
| | | | | | | | | | | | | | | | | | | | | |
| (1) | Excluding the $40.0 million ($26.0 million, net of income tax benefit) contribution to the Capitol Federal Foundation in connection with the corporate reorganization in December 2010, basic and diluted earnings per share would have been $0.40, return on average assets would have been 0.68%, return on average equity would have been 3.69%, ratio of operating expense to average total assets would have been 0.98%, and the efficiency ratio would have been 47.65%. This adjusted financial data is not presented in accordance with accounting principles generally accepted in the United States of America (“GAAP”). See “Management’s Discussion and Analysis of Financial Condition and Results of Operations – Comparison of Results of Operations for the Years Ended September 30, 2011 and 2010 – Non-GAAP Presentation.” |
| (2) | For fiscal years 2007 through 2010, Capitol Federal Savings Bank MHC (“MHC”) owned a majority of the outstanding shares of Capitol Federal Financial common stock and waived its right to receive dividends paid on the common stock with the exception of the $0.50 per share dividend paid on 500,000 shares in February 2010. Public shares exclude shares held by MHC, as well as unallocated shares held in the Capitol Federal Financial Employee Stock Ownership Plan (“ESOP”). In December 2010, Capitol Federal Financial completed its conversion from a mutual holding company form of organization to a stock form of organization and all shares owned by MHC were sold in a public offering. See “Management’s Discussion and Analysis of Financial Condition and Results of Operations – Executive Summary” for additional information. |
MANAGEMENT'S DISCUSSION AND ANALYSIS OF
FINANCIAL CONDITION AND RESULTS OF OPERATIONS
General Overview
Capitol Federal Financial, Inc. (the “Company”) is the holding company and the sole shareholder of Capitol Federal Savings Bank (the “Bank”). The Company’s common stock is traded on the NASDAQ Global Select Market under the symbol “CFFN.” The Bank comprises almost all of the consolidated assets and liabilities of the Company and the Company is dependent primarily upon the performance of the Bank for the results of its operations. Because of this relationship, references to management actions, strategies and results of actions apply to both the Bank and the Company.
Private Securities Litigation Reform Act—Safe Harbor Statement
We may from time to time make written or oral “forward-looking statements”, including statements contained in our filings with the Securities and Exchange Commission (“SEC”). These forward-looking statements may be included in this annual report to stockholders and in other communications by the Company, which are made in good faith by us pursuant to the “safe harbor” provisions of the Private Securities Litigation Reform Act of 1995.
These forward-looking statements include statements about our beliefs, plans, objectives, goals, expectations, anticipations, estimates and intentions that are subject to significant risks and uncertainties, and are subject to change based on various factors, some of which are beyond our control. The words “may”, “could”, “should”, “would”, “believe”, “anticipate”, “estimate”, “expect”, “intend”, “plan” and similar expressions are intended to identify forward-looking statements. The following factors, among others, could cause our future results to differ materially from the plans, objectives, goals, expectations, anticipations, estimates and intentions expressed in the forward-looking statements:
| · | our ability to continue to maintain overhead costs at reasonable levels; |
| · | our ability to continue to originate a significant volume of one- to four-family mortgage loans in our market areas or to purchase loans through correspondents; |
| · | our ability to acquire funds from or invest funds in wholesale or secondary markets; |
| · | the future earnings and capital levels of the Bank and the continued non-objection by our primary federal banking regulators, to the extent required, to distribute capital from the Bank to the Company, which could affect the ability of the Company to pay dividends in accordance with its dividend policies; |
| · | fluctuations in deposit flows, loan demand, and/or real estate values, as well as unemployment levels, which may adversely affect our business; |
| · | the credit risks of lending and investing activities, including changes in the level and direction of loan delinquencies and write-offs, changes in property values, and changes in estimates of the adequacy of the ACL; |
| · | results of examinations of the Bank and the Company by their respective primary federal banking regulators, including the possibility that the regulators may, among other things, require us to increase our ACL; |
| · | the strength of the U.S. economy in general and the strength of the local economies in which we conduct operations; |
| · | the effects of, and changes in, trade, monetary and fiscal policies and laws, including interest rate policies of the Board of Governors of the Federal Reserve System (“FRB”); |
| · | the effects of, and changes in, foreign and military policies of the United States government; |
| · | inflation, interest rate, market and monetary fluctuations; |
| · | our ability to access cost-effective funding; |
| · | the timely development and acceptance of our new products and services and the perceived overall value of these products and services by users, including the features, pricing and quality compared to competitors’ products and services; |
| · | the willingness of users to substitute competitors’ products and services for our products and services; |
| · | our success in gaining regulatory approval of our products and services and branching locations, when required; |
| · | the impact of changes in financial services laws and regulations, including laws concerning taxes, banking, securities and insurance and the impact of other governmental initiatives affecting the financial services industry; |
| · | implementing business initiatives may be more difficult or expensive than anticipated; |
| · | acquisitions and dispositions; |
| · | changes in consumer spending and saving habits; and |
| · | our success at managing the risks involved in our business. |
This list of important factors is not exclusive. We do not undertake to update any forward-looking statement, whether written or oral, that may be made from time to time by or on behalf of the Company or the Bank.
The following discussion is intended to assist in understanding the financial condition and results of operations of the Company. The discussion includes comments relating to the Bank, since the Bank is wholly owned by the Company and comprises the majority of assets and is the principal source of income for the Company.
Executive Summary
The following summary should be read in conjunction with our Management’s Discussion and Analysis of Financial Condition and Results of Operations in its entirety.
In December 2010, Capitol Federal Financial completed its conversion from a mutual holding company form of organization to a stock form of organization (the “corporate reorganization”). Capitol Federal Financial, which owned 100% of the Bank, was succeeded by Capitol Federal Financial, Inc, a new Maryland corporation. As part of the corporate reorganization, MHC’s ownership interest of Capitol Federal Financial was sold in a public stock offering. Capitol Federal Financial, Inc. sold 118,150,000 shares of common stock at $10.00 per share in the stock offering. The publicly held shares of Capitol Federal Financial were exchanged for new shares of common stock of Capitol Federal Financial, Inc. The exchange ratio was 2.2637 and ensured that immediately after the corporate reorganization the public stockholders of Capitol Federal Financial owned the same aggregate percentage of Capitol Federal Financial, Inc. common stock that they owned of Capitol Federal Financial common stock immediately prior to that time. In lieu of fractional shares, Capitol Federal Financial stockholders were paid in cash. Gross proceeds from the offering were $1.18 billion and related offering expenses were $46.7 million. The net proceeds from the stock offering were $1.13 billion, of which 50%, or $567.4 million, was contributed to the Bank as a capital contribution, as required by Office of the Comptroller of the Currency (the “OCC”) regulations. The other 50%, or $567.4 million, remained at Capitol Federal Financial, Inc., of which $40.0 million was contributed to the Bank’s charitable foundation, Capitol Federal Foundation (the “Foundation”), and $47.3 million was loaned to the ESOP for its purchase of Capitol Federal Financial, Inc. shares in the stock offering. In April 2011, the Company redeemed the outstanding Junior Subordinated Deferrable Interest Debentures (the “Debentures”) of $53.6 million using a portion of the offering proceeds from the corporate reorganization.
On July 21, 2010, the Dodd-Frank Wall Street Reform and Consumer Protection Act (the “Dodd-Frank Act”) was signed into law. The Dodd-Frank Act, among other things, required the Office of Thrift Supervision (the “OTS”) to be merged into the OCC. On July 21, 2011, the OCC assumed all functions and authority from the OTS relating to federally charted savings banks, and the FRB assumed all functions and authority from the OTS relating to savings and loan holding companies. Accordingly, effective July 21, 2011, the Bank became regulated by the OCC and the Company was regulated by the FRB. Prior to that date, the Bank and Company were regulated by the OTS. All references to the OTS in this filing on or after that date will refer to the successor regulator (i.e., the OCC for the Bank and the FRB for the Company), as appropriate.
We have been, and intend to continue to be, a community-oriented financial institution offering a variety of financial services to meet the needs of the communities we serve. We generally attract retail deposits from the general public and invest those funds primarily in permanent loans secured by first mortgages on owner-occupied, one- to four-family residences. To a much lesser extent, we also originate consumer loans, loans secured by first mortgages on non-owner-occupied one- to four-family residences, multi-family and commercial real estate loans, and construction loans. While our primary business is the origination of one- to four-family mortgage loans funded through retail deposits, we also purchase whole one- to four-family mortgage loans from correspondent and nationwide lenders, and invest in certain investment securities and mortgage-backed securities (“MBS”) funded through retail deposits, advances from FHLB, and repurchase agreements. The Company is significantly affected by prevailing economic conditions including federal monetary and fiscal policies and federal regulation of financial institutions. Retail deposit balances are influenced by a number of factors including interest rates paid on competing personal investment products, the level of personal income, and the personal rate of savings within our market areas. Lending activities are influenced by the demand for housing and other loans, changing loan underwriting guidelines, as well as interest rate pricing competition from other lending institutions. The primary sources of funds for lending activities include deposits, loan repayments, investment income, borrowings, and funds provided from operations.
The Company’s results of operations are primarily dependent on net interest income, which is the difference between the interest earned on loans, MBS, investment securities and cash, and the interest paid on deposits and borrowings. On a weekly basis, management reviews deposit flows, loan demand, cash levels, and changes in several market rates to assess all pricing strategies. The Bank generally prices its first mortgage loan products based on secondary market and competitor pricing. Generally, deposit pricing is based upon a survey of competitors in the Bank’s market areas, and the need to attract funding and retain maturing deposits. The majority of our loans are fixed-rate products with maturities up to 30 years, while the majority of our deposits have maturity or repricing dates of less than two years.
The Federal Open Market Committee of the Federal Reserve (the “FOMC”) noted in their November 2011 meeting minutes that the economic recovery was continuing at a moderate pace, but was hampered by a weak job market, a high unemployment rate, and persistent depression in the housing sector. The FOMC continued to maintain the target range for federal funds rate at zero to 25 basis points, which has been the range since December
2008. Additionally, the FOMC committed to maintain its existing policy of reinvesting principal payments from securities holdings, and intends to extend the average maturity of its securities holdings. These actions are intended to lower long-term rates and increase economic activity. These actions, along with previous FOMC actions, have effectively increased the amount of excess reserves in the banking system, which is intended to reduce long-term interest rates and increase liquidity in an effort to stimulate borrowing and investment. The FOMC has also indicated that other methods of quantitative easing are a possibility, while simultaneously revealing a potential exit strategy from the accommodative monetary policies should the economic outlook and financial developments warrant it.
The historically low interest rate environment during fiscal year 2011 and the past two fiscal years has spurred an increased demand for our loan endorsement program and mortgage refinances. Our loan endorsement program allows existing loan customers, whose loans have not been sold to third parties and who have not been delinquent on their contractual loan payments for the previous 12 months, the opportunity to modify, for a fee, their original loan terms to current loan terms being offered. During fiscal year 2011, the Bank endorsed $965.1 million loans, with a weighted average rate decrease of 101 basis points, compared to $545.1 million during fiscal year 2010, with a weighted average rate decrease of 87 basis points. Additionally, the Bank refinanced $292.8 million of its customers’ loans during fiscal year 2011, compared to $153.6 million during fiscal year 2010.
Total assets increased $963.7 million, from $8.49 billion at September 30, 2010 to $9.45 billion at September 30, 2011, due primarily to the stock offering proceeds from the corporate reorganization in December 2010, which were primarily used to purchase securities. Capitol Federal Financial, Inc., the holding company, used the net stock offering proceeds to purchase laddered short-term securities in order to provide cash flows that can be used to pay dividends, repurchase stock when permitted by federal banking regulations, reinvest into higher yielding assets if interest rates rise, or pursue other corporate strategies, as deemed appropriate. The yields on these securities are less than the yields on the Bank’s current investment portfolio due to the short-term nature of the securities. The net stock offering proceeds received by the Bank were primarily used to purchase securities according to the Bank’s current investment strategy. The intent of the Bank’s investment portfolio is to create a stream of cash flows that can be redeployed into other assets as the Bank grows the loan portfolio, or reinvested into higher yielding assets should interest rates rise. These securities have a lower interest rate risk profile than the Bank’s long-term fixed-rate mortgage portfolio and were purchased to help shorten the overall duration of the Bank’s total assets.
The one- to four-family loan portfolio remained relatively flat, at $4.92 billion for both September 30, 2011 and 2010. During fiscal year 2011, the Bank expanded its network of correspondent lenders and also purchased $89.2 million from a nationwide lender; however, those activities were offset by an increase in refinancing activity due to low market rates, strong competition for high quality loans, as well as weak loan demand due to the slow economic recovery.
The principal balance of loans 30 to 89 days delinquent increased $2.1 million, from $24.7 million at September 30, 2010 to $26.8 million at September 30, 2011. Non-performing loans decreased $5.5 million, from $32.0 million at September 30, 2010 to $26.5 million at September 30, 2011. The balance of loans 30 to 89 days delinquent and non-performing loans continue to remain at historically high levels for the Bank due to persistently elevated levels of unemployment coupled with declines in real estate activity and property values, particularly in some of the states in which we have purchased loans. Our ratio of non-performing loans to total loans decreased from 0.62% at September 30, 2010 to 0.51% at September 30, 2011. Our ratio of non-performing assets to total assets decreased from 0.49% at September 30, 2010 to 0.40% at September 30, 2011.
Total liabilities decreased $13.9 million, from $7.53 billion at September 30, 2010 to $7.51 billion at September 30, 2011, due primarily to a decrease of $153.6 million in other borrowings, partially offset by an increase in deposits of $108.9 million and an increase in FHLB advances of $31.1 million. The decrease in other borrowings was due to the repayment of the Debentures of $53.6 million and the maturity of $100.0 million of repurchase agreements that were not replaced. The increase in deposits was primarily in the money market and checking portfolios.
Stockholders’ equity increased $977.6 million, from $962.0 million at September 30, 2010 to $1.94 billion at September 30, 2011. The increase was due primarily to the net stock offering proceeds of $1.13 billion from the corporate reorganization in December 2010 and net income during the fiscal year, partially offset by dividends paid of $150.1 million.
Net income for fiscal year 2011 was $38.4 million, compared to $67.8 million for fiscal year 2010. The $29.4 million, or 43.4%, decrease for the current year was due primarily to the $40.0 million ($26.0 million, net of income tax benefit) contribution to the Foundation in connection with the corporate reorganization. Additionally, other income decreased $9.4 million, or 27.4%, from $34.4 million for the prior year to $25.0 million for the current year. These reductions to income were partially offset by a $4.8 million decrease in the provision for credit losses between fiscal years. Interest income for fiscal year 2011 decreased by $27.2 million, or 7.3%, compared to fiscal year 2010, but was almost entirely offset by a decrease in interest expense of $26.4 million, or 12.9%, between fiscal years. The net interest margin decreased 22 basis points, from 2.06% for fiscal year 2010 to 1.84% for fiscal year 2011, largely due to the decrease in interest income on loans receivable.
The Bank has two branches scheduled to open in fiscal year 2012 in our Kansas City market area. An in-store branch in the Kansas City market area closed in late fiscal year 2011 due to the opening of a traditional branch nearby. Management continues to consider expansion opportunities in all of our market areas.
Critical Accounting Policies
Our most critical accounting policies are the methodologies used to determine the ACL and fair value measurements. These policies are important to the presentation of our financial condition and results of operations, involve a high degree of complexity, and require management to make difficult and subjective judgments that may require assumptions or estimates about highly uncertain matters. The use of different judgments, assumptions, and estimates could cause reported results to differ materially. These critical accounting policies and their application are reviewed at least annually by our audit committee. The following is a description of our critical accounting policies and an explanation of the methods and assumptions underlying their application.
Allowance for Credit Losses. Management maintains an ACL to absorb known and inherent losses in the loan portfolio based upon ongoing quarterly assessments of the loan portfolio. Our methodology for assessing the appropriateness of the ACL consists of a formula analysis for general valuation allowances and specific valuation allowances (“SVAs”) for identified problem and impaired loans. The ACL is maintained through provisions for credit losses which are charged to income.
The methodology for determining the ACL is considered a critical accounting policy by management because of the high degree of judgment involved, the subjectivity of the assumptions used, and the potential for changes in the economic environment that could result in changes to the amount of the recorded ACL. Additionally, bank regulators have the ability to require the Bank, as they can require all banks, to increase the ACL or recognize additional charge-offs based upon their judgments, which may differ from management’s judgments. Although management believes that the Bank has established and maintained the ACL at appropriate levels, additions may be necessary if economic and other conditions continue or worsen substantially from the current operating environment, and/or if bank regulators require the Bank to increase the ACL and/or recognize additional charge-offs.
Our primary lending emphasis is the origination and purchase of one- to four-family mortgage loans on residential properties, and, to a lesser extent, home equity and second mortgages on one- to four-family residential properties, resulting in a loan concentration in residential first mortgage loans. As a result of our lending practices, we also have a concentration of loans secured by real property located in Kansas and Missouri. At September 30, 2011, approximately 75% and 15% of the Bank’s loans were secured by real property located in Kansas and Missouri, respectively. We believe the primary risks inherent in our one- to four-family and consumer portfolios are the continued weakened economic conditions, continued high levels of unemployment or underemployment, and a continuing decline in real estate values. Any one or a combination of these events may adversely affect borrowers’ ability or desire to repay their loans, resulting in increased delinquencies, non-performing assets, loan losses, and future levels of loan loss provisions. Although the multi-family and commercial loan portfolio also shares the risk of continued weakened economic conditions, the primary risks for the portfolio include the ability of the borrower to sustain sufficient cash flows from leases and to control expenses to satisfy their contractual debt payments, or the ability to utilize personal and/or business resources to pay their contractual debt payments if the cash flows are not sufficient.
Management considers quantitative and qualitative factors when determining the appropriateness of the ACL. Such factors include the trend and composition of delinquent and non-performing loans, results of foreclosed property and short sale transactions (historical losses and net charge-offs), increases in and establishment of SVAs, the current status and trends of local and national economies, particularly levels of unemployment, trends and current conditions in the real estate and housing markets, and loan portfolio growth and concentrations. Since our loan portfolio is primarily concentrated in one- to four-family real estate, we monitor one- to four-family real estate market value trends in our local market areas and geographic sections of the U.S. by reference to various industry and market reports, economic releases and surveys, and our general and specific knowledge of the real estate markets in which we lend, in order to determine what impact, if any, such trends may have on the level of our ACL. In addition, the adequacy of the Company’s ACL is reviewed during bank regulatory examinations. We consider any comments from our regulator when assessing the appropriateness of our ACL. Reviewing these quantitative and qualitative factors assists management in evaluating the overall reasonableness of the ACL and whether changes need to be made to our assumptions. We seek to apply ACL methodology in a consistent manner; however, the methodology can be modified in response to changing conditions.
Our loan portfolio is segregated into categories in the formula analysis based on certain risk characteristics such as loan type (one- to four-family, multi-family, etc.), interest payments (fixed-rate, adjustable-rate), loan source (originated or purchased), loan-to-value (“LTV”) ratios, borrower’s credit score and payment status (i.e. current or number of days delinquent). Consumer loans, such as second mortgages and home equity lines of credit, with the same underlying collateral as a one- to four-family loan are combined with the one- to four-family loan in the formula analysis to calculate a combined LTV ratio. All loans that are not impaired are included in a formula analysis. Impaired loans are defined as non-accrual loans, loans classified as substandard, loans with SVAs, and troubled debt restructurings (“TDRs”) that have not yet performed under the restructured terms for 12 consecutive months or are required by the accounting literature to be classified as a TDR for the life of the loan due to a reduction in the stated interest rate to a rate lower than the current market rate for new debt with similar risk. Quantitative loss factors are applied to each loan category in the formula analysis based on the historical net loss experience and current SVAs, adjusted for such factors as loan delinquency trends, for each respective loan category. Additionally, qualitative loss factors that management believes impact the collectability of the loan portfolio as of the evaluation date are applied to certain loan categories. Such qualitative factors include changes in collateral values, unemployment rates, credit scores and delinquent loan trends. Loss factors increase as loans become classified or delinquent.
The qualitative and quantitative factors applied in the formula analysis are reviewed quarterly by management to assess whether the factors adequately cover probable and estimable losses inherent in the loan portfolio. Our ACL methodology permits modifications to the formula analysis in the event that, in management’s judgment, significant factors which affect the collectability of the portfolio or any category of the loan portfolio, as of the evaluation date, are not reflected in the current formula analysis. Management’s evaluation of the qualitative factors with respect to these conditions is subject to a higher degree of uncertainty because they are not identified with a specific problem loan or portfolio segments. There were no significant modifications to the general valuation allowance model during fiscal year 2011.
SVAs are established in connection with individual loan reviews of specifically identified problem and impaired loans. Since the majority of our loan portfolio is composed of one- to four-family real estate, determining the estimated fair value of the underlying collateral is important in evaluating the amount of SVAs required for problem and impaired loans. If the estimated fair value of the collateral, less estimated costs to sell, is less than the current loan balance, an SVA is established for the difference. Generally, once a purchased loan is 90 days delinquent new collateral values are obtained through automated valuation models (“AVMs”) or broker price opinions (“BPOs”). An updated AVM or BPO is requested every 6 months while the loan is greater than 90 days delinquent. Due to the relatively stable home values in Kansas and Missouri, we do not obtain new collateral values on originated loans until they enter foreclosure. For originated one- to four-family loans and home equity loans that are impaired and the most recent appraisal is more than one year old, management estimates the fair value of the collateral using the most recently published Federal Housing Finance Agency (“FHFA”) index. For those loans where the FHFA fair value estimate results in a value less than the outstanding loan balance, an updated appraisal is obtained and is used to establish the SVA. If the Bank holds the first and second mortgage, both loans are combined when evaluating the need for an SVA.
Loans with an outstanding balance of $1.5 million or more are individually reviewed annually if secured by property in one of the following categories: multi-family (five or more units) property, unimproved land, other improved commercial property, acquisition and development of land projects, developed building lots, office building, single-use building, or retail building. SVAs are established if the individual loan review determines a quantifiable impairment.
Fair Value Measurements. The Company uses fair value measurements to record fair value adjustments to certain assets and to determine fair value disclosures, per the provisions of Accounting Standards Codification (“ASC”) 820, Fair Value Measurements and Disclosures. In accordance with ASC 820, the Company groups its assets at fair value in three levels, based on the markets in which the assets are traded and the reliability of the underlying assumptions used to determine fair value, with Level 1 (quoted prices for identical assets in an active market) being considered the most reliable, and Level 3 having the most unobservable inputs and therefore being considered the least reliable. The Company bases its fair values on the price that would be received to sell an asset in an orderly transaction between market participants at the measurement date. As required by ASC 820, the Company maximizes the use of observable inputs and minimizes the use of unobservable inputs when measuring fair value. The Company did not have any liabilities that were measured at fair value at September 30, 2011.
The Company’s AFS securities are our most significant assets measured at fair value on a recurring basis. Changes in the fair value of AFS securities are recorded, net of tax, in accumulated other comprehensive income, which is a component of stockholders’ equity. As part of determining fair value, the Company obtains fair values for all AFS securities from independent nationally recognized pricing services. Various modeling techniques are used to determine pricing for the Company’s securities, including option pricing and discounted cash flow models. The inputs to these models may include benchmark yields, reported trades, broker/dealer quotes, issuer spreads, benchmark securities, bids, offers and reference data. There are some securities in the AFS portfolio that have significant unobservable inputs requiring the independent pricing services to use some judgment in pricing the related securities. These AFS securities are classified as Level 3. All other AFS securities are classified as Level 2.
Loans receivable and real estate owned (“REO”) are the Company’s significant assets measured at fair value on a non-recurring basis. These non-recurring fair value adjustments involve the application of lower-of-cost-or-fair value accounting or write-downs of individual assets. Fair value for these assets is estimated using current appraisals, AVMs, BPOs, or listing prices. Fair values may be adjusted by management to reflect current economic and market conditions and, as such, are classified as Level 3.
Recent Accounting Pronouncements. For a discussion of Recent Accounting Pronouncements, see “Notes to Financial Statements - Note 1 - Summary of Significant Accounting Policies.”
Management Strategy
We are a retail-oriented financial institution dedicated to serving the needs of customers in our market areas. Our commitment is to provide qualified borrowers the broadest possible access to home ownership through our mortgage lending programs and to offer a complete set of personal banking products and services to our customers. We strive to enhance stockholder value while maintaining a strong capital position. To achieve these goals, we focus on the following strategies:
| · | Residential Portfolio Lending. We are one of the leading originators of one- to four-family loans in the state of Kansas. We originate these loans primarily for our own portfolio, and we service the loans we originate. We originate a small amount of loans held-for-sale (“LHFS”). We also purchase one- to four-family loans from correspondent and nationwide lenders. We have increased the number of correspondent lenders during fiscal year 2011 to provide an infrastructure to support growth in the residential loan portfolio. We offer both fixed- and adjustable-rate products with various terms to maturity and pricing options. We also offer government-sponsored programs directed towards first time home buyers, low or moderate income borrowers, or borrowers with certain credit risk concerns. We maintain strong relationships with local real estate agents to attract mortgage loan business. We rely on our marketing efforts and reputation to attract mortgage business from walk-in customers, customers that apply online, and existing customers. |
| · | Retail Financial Services. We offer a wide array of deposit products and retail services for our customers. These products include checking, savings, money market, certificates of deposit, and retirement accounts. These products and services are provided through a branch network of 45 locations, including traditional branches and retail in-store locations, our call center which operates on extended hours, mobile banking, telephone banking and bill payment services, and online banking and bill payment services. |
| · | Cost Control. We generally are very effective at controlling our costs of operations. By using technology, we are able to centralize our lending and deposit support functions for efficient processing. We have located our branches to serve a broad range of customers through relatively few branch locations. Our average deposit base per traditional branch at September 30, 2011 was approximately $117.1 million. This large average deposit base per branch helps to control costs. Our one- to four-family lending strategy and our effective management of credit risk allows us to service a large portfolio of loans at efficient levels because it costs less to service a portfolio of performing loans. |
| · | Asset Quality. We utilize underwriting standards for our lending products that are designed to limit our exposure to credit risk. We require complete documentation for both originated and purchased loans, and make credit decisions based on our assessment of the borrower’s ability to repay the loan in accordance with its terms. See additional discussion of asset quality in Part I, Item 1 of the Annual Report on Form 10-K. |
| · | Capital Position. Our policy has always been to protect the safety and soundness of the Bank through conservative credit and operational risk management, balance sheet strength, and sound operations. The end result of these activities is a capital ratio in excess of the well-capitalized standards set by the OCC. We believe that maintaining a strong capital position safeguards the long-term interests of the Bank, the Company and our stockholders. |
| · | Stockholder Value. We strive to enhance stockholder value while maintaining a strong capital position. One way that we continue to provide returns to stockholders is through our dividend payments. Total dividends declared and paid during fiscal year 2011 were $150.1 million. The $150.1 million consisted of cash dividends of $17.0 million paid prior to the corporate reorganization, and $133.1 million paid since the corporate reorganization. The Company’s cash dividend payout policy is reviewed quarterly by management and the Board of Directors, and the ability to pay dividends under the policy depends upon a number of factors, including the Company’s financial condition and results of operations, the Bank’s regulatory capital requirements, regulatory limitations on the Bank’s ability to make capital distributions to the Company, and the amount of cash at the holding company. It is the Board of Directors’ intentions to continue to pay regular quarterly and special cash dividends each year. For the first two fiscal years after our corporate reorganization we intend to pay 100% of our net income (exclusive of our contribution to the Foundation) in a combination of quarterly and special year-end dividends. |
| · | Interest Rate Risk Management. Changes in interest rates are our primary market risk as our balance sheet is almost entirely comprised of interest-earning assets and interest-bearing liabilities. As such, fluctuations in interest rates have a significant impact not only upon our net income but also upon the cash flows related to those assets and liabilities and the market value of our assets and liabilities. In order to maintain acceptable levels of net interest income in varying interest rate environments, we actively manage our interest rate risk and assume a moderate amount of interest rate risk consistent with board policies. |
Quantitative and Qualitative Disclosure about Market Risk
Asset and Liability Management and Market Risk
The risk associated with changes in interest rates on the earnings of the Bank and the market value of its financial assets and liabilities is known as interest rate risk. Interest rate risk is our most significant market risk and our ability to adapt to changes in interest rates is known as interest rate risk management. The rates of interest the Bank earns on assets and pays on liabilities generally are established contractually for a period of time. Fluctuations in interest rates have a significant impact not only upon our net income, but also upon the cash flows of those assets and liabilities and the market value of our assets and liabilities. Our results of operations, like those of other financial institutions, are impacted by these changes in interest rates and the interest rate sensitivity of our interest-earning assets and interest-bearing liabilities. The analysis presented in the tables below reflects the level of market risk at the Bank and does not include the assets of the Company. Assets of the Company are not managed in accordance with the interest rate risk objectives of the Bank. A general discussion of the impact of the Company assets is included for each table.
The general objective of our interest rate risk management program is to determine and manage an appropriate level of interest rate risk while maximizing net interest income, in a manner consistent with our policy to reduce, to the extent possible, the exposure of our net interest income to changes in market interest rates. The Asset and Liability Committee (“ALCO”) regularly reviews the interest rate risk exposure of the Bank by forecasting the impact of hypothetical, alternative interest rate environments on net interest income and market value of portfolio equity (“MVPE”) at various dates. The MVPE is defined as the net of the present value of the cash flows of existing assets, liabilities and off-balance sheet instruments. The present values are determined based upon market conditions as of the date of the analysis as well as in alternative interest rate environments providing potential changes in MVPE under those alternative interest rate environments. Net interest income is projected in the same alternative interest rate environments as well, both with a static balance sheet and with management strategies considered. MVPE and net interest income analyses are also conducted to estimate our sensitivity to rates for future time horizons based upon market conditions as of the date of the analysis. In addition to the interest rate environments presented below, management also reviews the impact of non-parallel rate shock scenarios on a quarterly basis. These scenarios consist of flattening and steepening the yield curve by changing short-term and long-term interest rates independent of each other, and simulating cash flows and valuations as a result of the simulated changes in rates. This analysis helps management quantify the Bank’s exposure to changes in the shape of the yield curve.
Based upon management’s recommendations, the Board of Directors sets the asset and liability management policies of the Bank. These policies are implemented by ALCO. The purpose of ALCO is to communicate, coordinate and control asset and liability management consistent with board-approved policies. ALCO’s objectives are to manage assets and funding sources to produce the highest profitability balanced against liquidity, capital adequacy and risk management objectives. At each monthly meeting, ALCO recommends appropriate strategy changes. The Chief Financial Officer, or his designee, is responsible for executing, reviewing and reporting on the results of the policy recommendations and strategies to the Board of Directors, generally on a monthly basis.
The ability to maximize net interest income is dependent largely upon the achievement of a positive interest rate spread that can be sustained despite fluctuations in prevailing interest rates. The asset and liability repricing gap is a measure of the difference between the amount of interest-earning assets and interest-bearing liabilities which either reprice or mature within a given period of time. The difference provides an indication of the extent to which an institution's interest rate spread will be affected by changes in interest rates. A gap is considered positive when the amount of interest-earning assets exceeds the amount of interest-bearing liabilities maturing or repricing during the same period. A gap is considered negative when the amount of interest-bearing liabilities exceeds the amount of interest-earning assets maturing or repricing during the same period. Generally, during a period of rising interest rates, a negative gap within shorter repricing periods adversely affects net interest income, while a positive gap within shorter repricing periods results in an increase in net interest income. During a period of falling interest rates, the opposite would generally be true.
Management recognizes that dramatic changes in interest rates within a short period of time can cause an increase in our interest rate risk relative to the balance sheet. At times, ALCO may recommend increasing our interest rate risk exposure in an effort to increase our net interest margin, while maintaining compliance with established board limits for interest rate risk sensitivity. Management believes that maintaining and improving earnings is the best way to preserve a strong capital position. Management recognizes the need, in certain interest rate environments, to limit the Bank's exposure to changing interest rates and may implement strategies to reduce our interest rate risk which could, as a result, reduce earnings in the short-term. To minimize the potential for adverse effects of material and prolonged changes in interest rates on our results of operations, we have adopted asset and liability management policies to better balance the maturities and repricing terms of our interest-earning assets and interest-bearing liabilities based on existing local and national interest rates.
During periods of economic uncertainty, rising interest rates, or extreme competition for loans, the Bank’s ability to originate or purchase loans may be adversely affected. In such situations, the Bank alternatively may invest its funds into investment securities or MBS. These investments may have rates of interest lower than rates we could receive on loans, if we were able to originate or purchase them, potentially reducing the Bank’s interest income.
At September 30, 2011, the Bank’s one-year gap between interest-earning assets and interest-bearing liabilities was $1.69 billion, or 18.60% of total assets. Interest-earning assets repricing to lower rates at a faster pace than interest-bearing liabilities will generally result in net interest margin compression. Should interest rates rise, the amount of interest-earning assets that are expected to reprice will likely decrease as borrowers and agency debt issuers will have less economic incentive to lower their cost. The amount of interest-bearing liabilities expected to reprice in a given period, however, is not usually impacted by changes in market interest rates because the maturities within the Bank’s borrowings and certificate of deposit portfolios are contractual and generally cannot be terminated early. If rates were to increase 200 basis points, the Bank’s one-year gap would be $(127.3) million, or (1.40)% of total assets. The majority of interest-earning assets anticipated to reprice in fiscal year 2012 are mortgages and MBS, both of which may prepay and/or be refinanced or endorsed. As interest rates decrease, borrowers have an economic incentive to refinance or endorse loans to lower market interest rates. This significantly increases the amount of cash flows anticipated to reprice to lower market interest rates during fiscal year 2012, as evidenced by the volume of mortgages that were endorsed and refinanced during fiscal year 2011 as a result of the decrease in market interest rates. In addition, cash flows from the Bank’s callable investment securities are anticipated to increase during fiscal year 2012 as the issuers of these securities will likely exercise their option to call the securities in order to issue new debt securities at lower market rates. The decrease in the net interest margin due to interest-earning assets repricing will likely be partially offset by a decrease in our cost of funds.
The shape of the yield curve also has an impact on net interest income and, therefore, the Bank’s net interest margin. Historically, the Bank has benefited from a steeper yield curve, as the Bank’s mortgage loans are typically priced from long-term rates while deposits are priced from short-term rates. A steeper yield curve--one with a greater difference between short-term rates and long-term rates--allows the Bank to receive a higher rate of interest on our mortgage-related assets than the rate paid for the funding of those assets, which generally results in a higher net interest margin. As the yield curve flattens, the spread between rates received on assets and paid on liabilities becomes compressed, which generally leads to a decrease in net interest margin.
We attempt to mitigate the repricing risk of our fixed-rate one- to four-family loan portfolio by the interest rates we offer and through the terms of our endorsement program. Management closely monitors competitors’ rates and also considers interest rate risk and net interest income when setting offered rates. Through our endorsement program a borrower can modify the rate and/or term of their loan to terms currently offered for fixed-rate products with an equal or reduced period to maturity than the current remaining period of their existing loan, if they have not been delinquent on their payments for the previous 12 months and the loan has not been sold to a third party. At September 30, 2011, the fixed rates offered through our endorsement program were at least 12 basis points higher than a similar new origination or refinance. This allows the Bank to retain the endorsed loan and achieve a rate slightly above current market rate.
We manage the reinvestment risk of loan prepayments through our interest rate risk and asset management strategies. In recent periods, principal repayments in excess of loan originations and purchases have been reinvested in shorter-term MBS and investment securities at lower market rates than our loan portfolio, which reduces our interest rate spread. If, however, market rates were to rise, the short-term nature of the securities provides management with the opportunity to reinvest the maturing funds at a higher rate.
General assumptions used by management to evaluate the sensitivity of our financial performance to changes in interest rates presented in the tables below are utilized in, and set forth under, the gap table and related notes. Although management finds these assumptions reasonable given the constraints described above, the interest rate sensitivity of our assets and liabilities and the estimated effects of changes in interest rates on our net interest income and MVPE indicated in the below tables could vary substantially if different assumptions were used or actual experience differs from these assumptions. To illustrate this point, the projected cumulative excess (deficiency) of interest-earning assets over interest-bearing liabilities within the three to 12 months category as a percent of total assets (“one-year gap”) is also provided for an up 200 basis point scenario, as of September 30, 2011.
Qualitative Disclosure about Market Risk
Percentage Change in Net Interest Income. For each period end presented in the following table, the estimated percentage change in the Bank’s net interest income based on the indicated instantaneous, parallel and permanent change in interest rates is presented. The percentage change in each interest rate environment represents the difference between estimated net interest income in the 0 basis point interest rate environment (“base case”, assumes the forward market and product interest rates implied by the yield curve are realized) and estimated net interest income in each alternative interest rate environment (assumes market and product interest rates have a parallel shift in rates across all maturities by the indicated change in rates). Estimations of net interest income used in preparing the table below are based upon the assumptions that the total composition of interest-earning assets and interest-bearing liabilities does not change materially and that any repricing of assets or liabilities occurs at anticipated product and market rates for the alternative rate environments as of the dates presented. The estimation of net interest income does not include any projected gain or loss related to the sale of loans or securities, or income derived from non-interest income sources, but does include the use of different prepayment assumptions in the alternative interest rate environments. It is important to consider that the estimated changes in net interest income are for a cumulative four-quarter period. These do not reflect the earnings expectations of management.
| Change | | Percentage Change in Net Interest Income | |
| (in Basis Points) | | At September 30, | |
in Interest Rates (1) | | 2011 | | 2010 | |
| -100 bp | | N/A | | N/A | |
| 000 bp | | -- | | -- | |
| +100 bp | | 4.46 | % | 6.44 | % |
| +200 bp | | 3.75 | % | 4.56 | % |
| +300 bp | | -0.33 | % | 0.93 | % |
| (1) | Assumes an instantaneous, permanent and parallel change in interest rates at all maturities. |
At September 30, 2011, the percentage change in the net interest income projections decreased from September 30, 2010 in all interest rate shock scenarios. For both periods, interest rates levels were historically low. The low interest rate environments caused the weighted average life (“WAL”) of mortgage-related assets and callable agency debentures to shorten significantly as borrowers have an economic incentive to refinance their mortgages into lower interest rate loans, and agency debt issuers have an economic incentive to exercise their call options and issue lower costing debt. In the rising interest rate scenarios, the cash flows from mortgage-related assets and callable agency debentures decrease, resulting in those assets remaining on the balance sheet until maturity at their current yields. In addition, the cash flows that are received are reinvested into higher yielding assets than what was anticipated in the base case scenario, resulting in the yield on interest-earning assets increasing faster than the anticipated increase in the cost of interest-bearing liabilities. However, as interest rates rise substantially, the financial incentive to refinance mortgages or call agency debentures is diminished, resulting in fewer cash flows to be reinvested at the higher market rates. At September 30, 2011, these cash flows are diminished to such a level that the benefit of reinvesting cash flows at higher yields is more than offset by the amount of liabilities repricing to higher levels in the +300 basis point scenario.
The percentage change in the net interest income projections was lower at September 30, 2011, despite lower interest rates than the previous period. This was primarily caused by fewer cash flows from callable agency debentures and mortgage loans expected to reprice in fiscal year 2012 due to the lengthening of the expected life of the Bank’s callable agency debentures and a reduction in the amount of adjustable-rate mortgages expected to reprice as compared to fiscal year 2011. The change was also due to maturities and calls of investment securities during fiscal year 2011, the cash flows from which were reinvested at lower rates than during fiscal year 2010.
The securities held at the holding company are short-term bullet agency debentures and are not a component of the Bank’s interest rate risk management program. The inclusion of these assets in the net interest income projection would have resulted in a more positive impact to the rising interest rate shock scenarios due to the short-term nature of the securities. In addition, the cash flows from these assets do not change as interest rates rise. As a result, these assets would provide cash flows that could be reinvested at higher interest rates.
Percentage Change in MVPE. The following table sets forth the estimated percentage change in the MVPE at each period end presented based on the indicated instantaneous, parallel and permanent change in interest rates. The percentage change in each interest rate environment represents the difference between MVPE in the base case and MVPE in each alternative interest rate environment. The estimations of MVPE used in preparing the table below are based upon the assumptions that the total composition of interest-earning assets and interest-bearing liabilities does not change, that any repricing of assets or liabilities occurs at current product or market rates for the alternative rate environments as of the dates presented, and that different prepayment rates are used in each alternative interest rate environment. The estimated MVPE results from the valuation of cash flows from financial assets and liabilities over the anticipated lives of each for each interest rate environment. The table presents the effects of the change in interest rates on our assets and liabilities as they mature, repay or reprice, as shown by the change in the MVPE in changing interest rate environments.
| Change | | Percentage Change in MVPE | |
| (in Basis Points) | | At September 30, | |
in Interest Rates (1) | | 2011 | | 2010 | |
| -100 bp | | N/A | | N/A | |
| 000 bp | | -- | | -- | |
| +100 bp | | 0.61 | % | 0.10 | % |
| +200 bp | | -5.69 | % | -8.76 | % |
| +300 bp | | -14.91 | % | -22.42 | % |
| (1) | Assumes an instantaneous, permanent and parallel change in interest rates at all maturities. |
Changes in the estimated market values of our financial assets and liabilities drive changes in estimates of MVPE. The market value of shorter term-to-maturity financial instruments are less sensitive to changes in interest rates than the market value of longer term-to-maturity financial instruments. Because of this, our certificates of deposit (which have relatively short average lives) tend to display less sensitivity to changes in interest rates than do our mortgage-related assets (which have relatively long average lives). The average life expected on our mortgage-related assets varies under different interest rate environments because borrowers have the ability to prepay their mortgage loans.
The Bank’s MVPE declines in the +200 and +300 interest rate environments. As interest rates increase to these levels, the estimated fair values of the liabilities with shorter average lives do not respond to interest rates in the same manner as the longer maturity assets, such as our fixed-rate loans, which have longer average lives. The Prepayments on fixed-rate loans in particular, and all mortgage-related assets in general, are expected to decrease significantly as interest rate rise such that projected prepayments would likely only be realized through normal changes in borrowers lives, such as divorce, death, job-related relocations, and other life changing events. The lower prepayment expectations extend the expected average lives on these assets, relative to the assumptions in the base case, thereby increasing their sensitivity to changes in interest rates. As the average lives of assets lengthen, the Bank’s sensitivity to rising interest rates increases.
The sensitivity of the MVPE decreased from September 30, 2010 to September 30, 2011. This was due to the decrease in interest rates between periods, as well as the increase in the relative duration of the liability portfolio. The decrease in interest rates resulted in a decrease in the WAL of all mortgage-related assets, as borrowers have an increased economic incentive to refinance their mortgages into lower interest rate loans, and agency debt issuers have an economic incentive to exercise their call options and issue lower costing debt. This caused a decrease in the price sensitivity of all mortgage-related assets and callable agency debentures, and as a result, of interest-earning assets as a whole. Since the price sensitivity of all assets is reduced in the base case, the adverse impact to rising interest rates is thereby reduced in all interest rate scenarios presented.
In an effort to mitigate the impact of rising interest rates, the Bank renewed $400.0 million of borrowings during fiscal year 2011 into new fixed-rate borrowings with terms of approximately seven years. Additionally, the Bank structured certificate of deposit interest rates in an effort to increase the average term of the portfolio, as customers extended the term of their certificates in order to earn a higher rate of return. Both of these actions were taken in an effort to reduce the Bank’s overall exposure to rising interest rates at September 30, 2011 as compared to September 30, 2010.
The inclusion of the holding company securities in the MVPE analysis would result in a lower level of sensitivity to the rising interest rate scenarios due to their short-term nature, which would reduce the overall WAL of assets. This would cause the market value of total assets to be less sensitive to changes in interest rates, thereby reducing the sensitivity of the MVPE.
Gap Table. The gap table summarizes the anticipated maturities or repricing of the Bank’s interest-earning assets and interest-bearing liabilities as of September 30, 2011, based on the information and assumptions set forth in the notes below.
| | | Within | | | Three to | | | More Than | | | More Than | | | | | | | |
| | | Three | | | Twelve | | | One Year to | | | Three Years | | | Over | | | | |
| | | Months | | | Months | | | Three Years | | | to Five Years | | | Five Years | | | Total | |
| Interest-earning assets: | | (Dollars in thousands) | |
Loans receivable: (1) | | | | | | | | | | | | | | | | | | |
| Mortgage loans: | | | | | | | | | | | | | | | | | | |
| Fixed-rate | | $ | 309,635 | | | $ | 1,175,138 | | | $ | 1,405,269 | | | $ | 494,202 | | | $ | 799,746 | | | $ | 4,183,990 | |
| Adjustable-rate | | | 50,864 | | | | 501,504 | | | | 200,145 | | | | 43,504 | | | | 9,833 | | | | 805,850 | |
| Other loans | | | 128,523 | | | | 17,138 | | | | 15,523 | | | | 4,982 | | | | 5,217 | | | | 171,383 | |
Investment securities (2) | | | 170,841 | | | | 457,126 | | | | 151,700 | | | | 297,930 | | | | 3,463 | | | | 1,081,060 | |
MBS (3) | | | 282,436 | | | | 809,255 | | | | 732,209 | | | | 282,962 | | | | 263,453 | | | | 2,370,315 | |
| Other interest-earning assets | | | 99,773 | | | | -- | | | | -- | | | | -- | | | | -- | | | | 99,773 | |
| Total interest-earning assets | | | 1,042,072 | | | | 2,960,161 | | | | 2,504,846 | | | | 1,123,580 | | | | 1,081,712 | | | | 8,712,371 | |
| | | | | | | | | | | | | | | | | | | | | | | | | |
| Interest-bearing liabilities: | | | | | | | | | | | | | | | | | | | | | | | | |
| Deposits: | | | | | | | | | | | | | | | | | | | | | | | | |
Checking (4) | | | 75,799 | | | | 39,192 | | | | 90,084 | | | | 70,661 | | | | 275,896 | | | | 551,632 | |
Savings (4) | | | 89,789 | | | | 10,889 | | | | 25,106 | | | | 19,473 | | | | 107,927 | | | | 253,184 | |
Money market (4) | | | 51,792 | | | | 143,022 | | | | 347,323 | | | | 170,297 | | | | 466,731 | | | | 1,179,165 | |
| Certificates | | | 498,217 | | | | 903,642 | | | | 854,747 | | | | 365,475 | | | | 2,211 | | | | 2,624,292 | |
Borrowings (5) | | | 250,000 | | | | 250,000 | | | | 1,225,499 | | | | 495,000 | | | | 747,260 | | | | 2,967,759 | |
| Total interest-bearing liabilities | | | 965,597 | | | | 1,346,745 | | | | 2,542,759 | | | | 1,120,906 | | | | 1,600,025 | | | | 7,576,032 | |
| | | | | | | | | | | | | | | | | | | | | | | | | |
| Excess (deficiency) of interest-earning assets over | | | | | | | | | | | | | | | | | | | | | | | | |
| interest-bearing liabilities | | $ | 76,475 | | | $ | 1,613,416 | | | $ | (37,913 | ) | | $ | 2,674 | | | $ | (518,313 | ) | | $ | 1,136,339 | |
| | | | | | | | | | | | | | | | | | | | | | | | | |
| Cumulative excess of interest-earning | | | | | | | | | | | | | | | | | | | | | | | | |
| assets over interest-bearing liabilities | | $ | 76,475 | | | $ | 1,689,891 | | | $ | 1,651,978 | | | $ | 1,654,652 | | | $ | 1,136,339 | | | | | |
| | | | | | | | | | | | | | | | | | | | | | | | | |
| Cumulative excess of interest-earning | | | | | | | | | | | | | | | | | | | | | | | | |
| assets over interest-bearing liabilities as a | | | | | | | | | | | | | | | | | | | | | | | | |
| percent of total assets at September 30, 2011 | | | 0.84 | % | | | 18.60 | % | | | 18.18 | % | | | 18.21 | % | | | 12.51 | % | | | | |
| | | | | | | | | | | | | | | | | | | | | | | | | |
| Cumulative one-year gap - interest rates +200 bp | | | | | | | | | | | | | | | | | | | | | | | | |
| at September 30, 2011 | | | | | | | (1.40 | )% | | | | | | | | | | | | | | | | |
| Cumulative one-year gap at September 30, 2010 | | | | | | | 20.69 | % | | | | | | | | | | | | | | | | |
| Cumulative one-year gap at September 30, 2009 | | | | | | | 7.42 | % | | | | | | | | | | | | | | | | |
| (1) | Adjustable-rate mortgage (“ARM”) loans are included in the period in which the rate is next scheduled to adjust or in the period in which repayments are expected to occur, or prepayments are expected to be received, prior to their next rate adjustment, rather than in the period in which the loans are due. Fixed-rate loans are included in the periods in which they are scheduled to be repaid, based on scheduled amortization and prepayment assumptions. Balances have been reduced for non-performing loans, which totaled $26.5 million at September 30, 2011. |
| (2) | Based on contractual maturities, terms to call date or pre-refunding dates as of September 30, 2011, and excludes the unrealized gain adjustment of $545 thousand on AFS investment securities. |
| (3) | Reflects estimated prepayments of MBS in our portfolio, and excludes the unrealized gain adjustment of $41.8 million on AFS MBS. |
| (4) | Although the Bank’s checking, savings and money market accounts are subject to immediate withdrawal, management considers a substantial amount of these accounts to be core deposits having significantly longer effective maturities. The decay rates (the assumed rate at which the balance of existing accounts would decline) used on these accounts are based on assumptions developed from our actual experience with these accounts. If all of the Bank’s checking, savings and money market accounts had been assumed to be subject to repricing within one year, interest-earning assets which were estimated to mature or reprice within one year would have exceeded interest-bearing liabilities with comparable characteristics by $116.4 million, for a cumulative one-year gap of 1.3% of total assets. |
| (5) | Borrowings exclude $21.0 million of deferred prepayment penalty costs and $457 thousand of deferred gain on the terminated interest rate swap agreements. |
The gap table summarizes the anticipated maturities or repricing of the Bank’s interest-earning assets and interest-bearing liabilities as of September 30, 2011, based on the information and assumptions set forth in the notes above. Cash flow projections for mortgage loans and MBS are calculated based on current interest rates. Prepayment projections are subjective in nature, involve uncertainties and assumptions and, therefore, cannot be determined with a high degree of accuracy. Although certain assets and liabilities may have similar maturities or periods to repricing, they may react differently to changes in market interest rates. Assumptions may not reflect how actual yields and costs respond to market changes. The interest rates on certain types of assets and liabilities may fluctuate in advance of changes in market interest rates, while interest rates on other types of assets and liabilities may lag behind changes in market interest rates. Certain assets, such as ARM loans, have features that restrict changes in interest rates on a short-term basis and over the life of the asset. In the event of a change in interest rates, prepayment and early withdrawal levels would likely deviate significantly from those assumed in calculating the gap table. For additional information regarding the impact of changes in interest rates, see the Percentage Change in Net Interest Income and Percentage Change in MVPE discussion and tables within this section.
The decrease in the one-year gap to 18.60% at September 30, 2011 from 20.69% at September 30, 2010 was primarily due to a decrease in the amount of assets expected to reprice in fiscal year 2012. In fiscal year 2011, the Bank experienced a high volume of calls on the Bank’s callable agency debentures, especially later in the fiscal year as interest rates decreased and agency debt issuers exercised their option to call existing debentures and issued new debt at lower interest rates. The Bank reinvested the cash flows from the called agency debentures into new callable agency debentures with longer expected average lives, thereby reducing the amount of cash flows expected from this portfolio in fiscal year 2012. In addition, the amount of assets expected to reprice in fiscal year 2012, as of September 30, 2011, was lower as a result of fewer ARM mortgages expected to reprice in fiscal year 2012 than that expected to reprice in fiscal year 2011, as of September 30, 2010.
As noted above, changes in interest rates have a material impact on the amount of cash flows expected to reprice in a given period, primarily on the asset side of the balance sheet. In the +200 basis point interest rate shock scenario, the cash flows from mortgage-related assets and callable agency debentures decrease significantly as borrowers and issuers no longer have a financial incentive to refinance their mortgages or debentures. In this scenario, the Bank’s liabilities would reprice at a faster pace than the assets.
The inclusion of the holding company securities in the gap analysis would have resulted in an increase in the one-year gap at September 30, 2011, as a majority of these assets mature in one year or less.
Financial Condition
Total assets increased $963.7 million, from $8.49 billion at September 30, 2010 to $9.45 billion at September 30, 2011, due primarily to the stock offering proceeds from the corporate reorganization, which were primarily used to purchase securities.
Total liabilities decreased $13.9 million, from $7.53 billion at September 30, 2010 to $7.51 billion at September 30, 2011, due primarily to a decrease of $153.6 million in other borrowings, partially offset by an increase in deposits of $108.9 million and an increase in FHLB advances of $31.1 million. The decrease in other borrowings was due to the repayment of the Debentures of $53.6 million and the maturity of $100.0 million of repurchase agreements that were not replaced. The increase in deposits was primarily in the money market and checking portfolios.
Stockholders’ equity increased $977.6 million, from $962.0 million at September 30, 2010 to $1.94 billion at September 30, 2011. The increase was due primarily to the net stock offering proceeds of $1.13 billion from the corporate reorganization and net income during the fiscal year, partially offset by dividends paid of $150.1 million.
Loans Receivable. The loans receivable portfolio decreased $18.5 million, or 0.36%, from $5.17 billion at September 30, 2010 to $5.15 billion at September 30, 2011. The decrease in the portfolio was largely in the home equity loan portfolio, which decreased $21.8 million from $186.3 million at September 30, 2010 to $164.5 million at September 30, 2011. The decrease in the home equity loan portfolio was due to some borrowers consolidating their home equity loans into their first mortgage loan when refinancing. Additionally, borrowers are reducing overall debt levels and borrowing less than in previous years, in light of economic uncertainty, as evidenced by the increased level of prepayment activity and the decrease in lending volume in the consumer loan portfolio.
Included in the loan portfolio at September 30, 2011 were $163.7 million of ARM loans that were originated as interest-only. Of these interest-only loans, $131.4 million were purchased from nationwide lenders, primarily during fiscal year 2005. Interest-only ARM loans do not typically require principal payments during their initial term, and have initial interest-only terms of either five or ten years. The $131.4 million of purchased interest-only ARM loans had a weighted average credit score of 721 and a weighted average LTV ratio of 75% at September 30, 2011. The credit scores were updated in September 2011. The LTV ratios are based on the current loan balance and either the lesser of the purchase price or original appraisal, or the most recent bank appraisal, BPO, or AVM, generally if the loan is or has been nonaccrual. In order to reduce future credit risk, the Bank has not purchased any interest-only ARM loans since 2006 and discontinued offering the product in its local markets during 2008. At September 30, 2011, $85.7 million, or 52%, of interest-only loans were still in their interest-only payment term. At September 30, 2011, $8.7 million, or 33% of non-performing loans, were interest-only ARMs and $2.1 million was reserved in the ACL for these loans. Of the $8.7 million non-performing interest-only ARM loans, $5.2 million, or 59%, were still in the interest-only payment term. Non-performing interest-only ARM loans represented approximately 5% and 10% of the total interest-only ARM loan portfolio and non-amortizing interest-only ARM loans, respectively, at September 30, 2011.
The Bank generally prices its one- to four-family loan products based upon prices available in the secondary market and competitor pricing. During fiscal year 2011, the average daily spread between the Bank’s 30-year fixed-rate one- to four-family loan offer rate, with no points paid by the borrower, and the 10-year Treasury rate was approximately 160 basis points, while the average daily spread between the Bank’s 15-year fixed-rate one- to four-family loan offer rate and the 10-year Treasury rate was approximately 90 basis points.
The following table presents information concerning the composition of our loan portfolio as of September 30, 2011 and 2010. The one- to four-family loan portfolio remained relatively flat between periods, at $4.92 billion. During fiscal year 2011, the Bank expanded its network of correspondent lenders and also purchased $89.2 million from a nationwide lender; however, those activities were offset by an increase in refinancing activity due to low market rates, strong competition for high quality loans, as well as weak loan demand due to the slow economic recovery. Within the one- to four-family loan portfolio at September 30, 2011, 75% of the loans had a balance at origination of less than $417 thousand. The weighted average rate of the loan portfolio decreased 38 basis points from 5.07% at September 30, 2010 to 4.69% at September 30, 2011. The decrease in the weighted average portfolio rate was due to loan endorsements, loan originations at current market rates below that of the existing portfolio, refinances, and ARMs repricing down to lower market rates.
| | September 30, 2011 | | | September 30, 2010 | |
| | | | | | Average | | | | | | Average | |
| | | Amount | | | Rate | | | Amount | | | Rate | |
| | | (Dollars in thousands) | |
| Real Estate Loans: | | | | | | | | | | | | |
| One-to four-family: | | | | | | | | | | | | |
| Originated | | $ | 3,986,957 | | | | 4.82 | % | | $ | 3,952,392 | | | | 5.23 | % |
| Correspondent purchased | | | 396,063 | | | | 4.75 | | | | 396,956 | | | | 5.20 | |
| Nationwide purchased | | | 535,758 | | | | 3.37 | | | | 566,303 | | | | 3.54 | |
| Multi-family and commercial | | | 57,965 | | | | 6.13 | | | | 66,476 | | | | 6.24 | |
| Construction | | | 47,368 | | | | 4.27 | | | | 33,168 | | | | 4.90 | |
| Total real estate loans | | | 5,024,111 | | | | 4.66 | | | | 5,015,295 | | | | 5.05 | |
| | | | | | | | | | | | | | | | | |
| Consumer Loans: | | | | | | | | | | | | | | | | |
| Home equity | | | 164,541 | | | | 5.48 | | | | 186,347 | | | | 5.55 | |
| Other | | | 7,224 | | | | 5.10 | | | | 7,671 | | | | 5.66 | |
| Total consumer loans | | | 171,765 | | | | 5.46 | | | | 194,018 | | | | 5.55 | |
| | | | | | | | | | | | | | | | | |
| Total loans receivable | | | 5,195,876 | | | | 4.69 | % | | | 5,209,313 | | | | 5.07 | % |
| | | | | | | | | | | | | | | | | |
| Less: | | | | | | | | | | | | | | | | |
| Undisbursed loan funds | | | 22,531 | | | | | | | | 15,489 | | | | | |
| ACL | | | 15,465 | | | | | | | | 14,892 | | | | | |
| Discounts/unearned loan fees | | | 19,093 | | | | | | | | 22,267 | | | | | |
| Premiums/deferred costs | | | (10,947 | ) | | | | | | | (11,537 | ) | | | | |
| Total loans receivable, net | | $ | 5,149,734 | | | | | | | $ | 5,168,202 | | | | | |
The following table presents the weighted average credit score and LTV ratio and the average loan balance for our one- to four-family loan portfolio as of September 30, 2011. Credit scores were most recently updated in September 2011 and were obtained from a nationally recognized consumer rating agency. The LTV ratios were based on the current loan balance and either the lesser of the purchase price or original appraisal, or the most recent bank appraisal, BPO or AVM, generally if the loan is or has been nonaccrual. In most cases, the most recent appraisal was obtained at the time of origination.
| | | Credit Score | | | LTV | | | Average Balance | |
| | | (Dollars in thousands) | |
| Originated | | | 763 | | | | 66 | % | | $ | 123 | |
| Correspondent | | | 759 | | | | 64 | | | | 290 | |
| Nationwide | | | 740 | | | | 60 | | | | 252 | |
| | | | 760 | | | | 65 | % | | $ | 137 | |
The following table presents the WAL, which reflects prepayment assumptions, of our one- to four-family loan portfolio, excluding construction loans and non-performing loans, as of September 30, 2011.
| | | Principal | | | Average | |
| Original Term | | Balance | | | WAL (years) | |
| | | (Dollars in thousands) | |
| Fixed-Rate: | | | | | | |
| <= 15 years | | $ | 1,017,207 | | | | 2.52 | |
| > 15 years | | | 3,086,188 | | | | 4.04 | |
| Adjustable-Rate: | | | | | | | | |
| <= 36 months | | | 125,334 | | | | 3.27 | |
| > 36 months | | | 663,925 | | | | 3.16 | |
| | | $ | 4,892,654 | | | | 3.59 | |
| | | | | | | | | |
| Weighted average rate | | | 4.65 | % | | | | |
| Average remaining contractual term (in years) | | | 21 | | | | | |
The following table presents our fixed-rate one- to four-family loan portfolio, including construction loans and non-performing loans, and the annualized prepayment speeds for the quarter ended September 30, 2011 by interest rate tier. Loan endorsements and refinances are considered a prepayment and are included in the prepayment speeds presented below.
| | | | Original Term | |
| | | | 15 years or less | | | More than 15 years | |
| | | | | | | Prepayment Speed (annualized) | | | | | | Prepayment Speed (annualized) | |
| Rate | | | Principal | | | Including | | | Excluding | | | Principal | | | Including | | | Excluding | |
| Range | | | Balance | | | Endorsements | | | Endorsements | | | Balance | | | Endorsements | | | Endorsements | |
| | | | (Dollars in thousands) | |
| < =4.50 | % | | $ | 527,235 | | | | 29.30 | % | | | 8.31 | % | | $ | 922,221 | | | | 19.10 | % | | | 4.10 | % |
| | 4.51 - 4.99 | % | | | 218,703 | | | | 50.28 | | | | 20.68 | | | | 417,100 | | | | 37.44 | | | | 10.48 | |
| | 5.00 - 5.50 | % | | | 193,663 | | | | 32.01 | | | | 18.40 | | | | 1,206,849 | | | | 55.19 | | | | 15.28 | |
| | 5.51 - 5.99 | % | | | 44,530 | | | | 35.20 | | | | 19.85 | | | | 289,581 | | | | 42.67 | | | | 17.98 | |
| | 6.00 - 6.50 | % | | | 21,833 | | | | 19.47 | | | | 15.21 | | | | 229,681 | | | | 43.53 | | | | 16.19 | |
| | 6.51 - 6.99 | % | | | 6,083 | | | | 12.42 | | | | 10.88 | | | | 38,381 | | | | 26.40 | | | | 11.87 | |
| >=7.00 | % | | | 3,179 | | | | 10.76 | | | | 10.76 | | | | 29,663 | | | | 23.04 | | | | 12.03 | |
| | | | | $ | 1,015,226 | | | | 34.79 | % | | | 14.10 | % | | $ | 3,133,476 | | | | 41.00 | % | | | 12.12 | % |
The following table summarizes the activity in the loan portfolio for the periods indicated, excluding changes in loans in process, deferred fees, and ACL. Loans that were paid-off as a result of refinances are included in repayments. Purchased loans include purchases from correspondent and nationwide lenders. Loan endorsement activity is not included in the activity in the following table because a new loan is not generated at the time of endorsement. During fiscal year 2011 and 2010, the Bank endorsed $965.1 million and $545.1 million of loans, respectively, with a weighted average decrease in rate of 101 basis points and 87 basis points, respectively. The endorsed balance and rate are included in the ending loan portfolio balance and rate.
| | | For the Three Months Ended | |
| | | September 30, 2011 | | | June 30, 2011 | | | March 31, 2011 | | | December 31, 2010 | |
| | | Amount | | | Rate | | | Amount | | | Rate | | | Amount | | | Rate | | | Amount | | | Rate | |
| | | (Dollars in thousands) | |
| Beginning balance | | $ | 5,211,991 | | | | 4.79 | % | | $ | 5,144,050 | | | | 4.81 | % | | $ | 5,163,319 | | | | 4.87 | % | | $ | 5,209,313 | | | | 5.07 | % |
| Originations and refinances: | | | | | | | | | | | | | | | | | | | | | | | | | | | | | | | | |
| Fixed | | | 141,123 | | | | 4.11 | | | | 118,438 | | | | 4.55 | | | | 153,272 | | | | 4.33 | | | | 245,251 | | | | 4.08 | |
| Adjustable | | | 47,009 | | | | 3.77 | | | | 37,721 | | | | 4.12 | | | | 43,434 | | | | 3.91 | | | | 50,997 | | | | 3.93 | |
| Purchases: | | | | | | | | | | | | | | | | | | | | | | | | | | | | | | | | |
| Fixed | | | 29,585 | | | | 4.47 | | | | 102,030 | | | | 5.49 | | | | 16,468 | | | | 4.47 | | | | 4,977 | | | | 4.38 | |
| Adjustable | | | 13,864 | | | | 3.49 | | | | 5,114 | | | | 3.65 | | | | 5,979 | | | | 3.57 | | | | 3,954 | | | | 3.96 | |
| Repayments | | | (244,607 | ) | | | | | | | (192,682 | ) | | | | | | | (233,473 | ) | | | | | | | (348,545 | ) | | | | |
Other (1) | | | (3,089 | ) | | | | | | | (2,680 | ) | | | | | | | (4,949 | ) | | | | | | | (2,628 | ) | | | | |
| Ending balance | | $ | 5,195,876 | | | | 4.69 | % | | $ | 5,211,991 | | | | 4.79 | % | | $ | 5,144,050 | | | | 4.81 | % | | $ | 5,163,319 | | | | 4.87 | % |
| | | | | | | | | | | | | | | | | | | | | | | | | | | | | | | | | |
| | | For the Year Ended September 30, | |
| | | 2011 | | | 2010 | |
| | | Amount | | | Rate | | | Amount | | | Rate | |
| | | (Dollars in thousands) | |
| Beginning balance | | $ | 5,209,313 | | | | 5.07 | % | | $ | 5,646,950 | | | | 5.29 | % |
| Originations and refinances: | | | | | | | | | | | | | | | | |
| Fixed | | | 658,084 | | | | 4.23 | | | | 495,261 | | | | 4.89 | |
| Adjustable | | | 179,161 | | | | 3.92 | | | | 149,867 | | | | 4.48 | |
| Purchases: | | | | | | | | | | | | | | | | |
| Fixed | | | 153,060 | | | | 5.15 | | | | 48,006 | | | | 5.08 | |
| Adjustable | | | 28,911 | | | | 3.60 | | | | 71,095 | | | | 4.05 | |
| Repayments | | | (1,019,307 | ) | | | | | | | (989,826 | ) | | | | |
| Transfer of loans to LHFS, net | | | -- | | | | | | | | (194,759 | ) | | | | |
Other (1) | | | (13,346 | ) | | | | | | | (17,281 | ) | | | | |
| Ending balance | | $ | 5,195,876 | | | | 4.69 | % | | $ | 5,209,313 | | | | 5.07 | % |
| (1) | Other consists of transfers to REO, endorsement fees advanced and reductions in commitments. |
The following table presents the activity in our one- to four-family loan portfolio for the fiscal year ended September 30, 2011, excluding endorsement activity, and the LTV and credit score at origination. Of the $759.7 million of one- to four-family loan originations and refinances in the table for fiscal year 2011, 80% had loan values of $417 thousand or less. Of the $182.0 million of correspondent and nationwide loan purchases, 59% had loan values of $417 thousand or less.
| | | | | | | | | Credit | |
| | | Amount | | | LTV | | | Score | |
| | | (Dollars in thousands) | |
| Originations | | $ | 466,845 | | | | 74 | % | | | 770 | |
| Refinances by Bank customers | | | 292,819 | | | | 67 | | | | 768 | |
| Correspondent purchases | | | 92,781 | | | | 65 | | | | 767 | |
| Nationwide purchases | | | 89,190 | | | | 69 | | | | 740 | |
| | | $ | 941,635 | | | | 70 | % | | | 766 | |
During fiscal year 2011, the Bank entered into correspondent lending relationships with 11 new correspondent lenders in our local market areas and also in states generally located throughout the central United States. At September 30, 2011, the Bank had 18 correspondent lending relationships. Additionally, during fiscal year 2011, the Bank entered into an agreement with a mortgage sub-servicer to provide loan servicing for loans originated by the Bank’s correspondent lenders in certain states. Management continues its efforts to expand our network of lending relationships related to our nationwide bulk purchase program that would provide mortgage loans in selected geographic locations that adhere to the Bank’s underwriting standards.
Historically, the Bank’s underwriting guidelines have generally provided the Bank with loans of high quality and low delinquencies, and low levels of non-performing assets compared to national levels. Of particular importance is the complete documentation required for each loan the Bank originates, refinances, and purchases. This allows the Bank to make an informed credit decision based upon a thorough assessment of the borrower’s ability to repay the loan, compared to underwriting methodologies that do not require full documentation. Non-performing loans decreased $5.5 million, from $32.0 million at September 30, 2010 to $26.5 million at September 30, 2011. Our ratio of non-performing loans to total loans decreased from 0.62% at September 30, 2010 to 0.51% at September 30, 2011. At September 30, 2011, our ACL was $15.5 million or 0.30% of the total loan portfolio and 58% of total non-performing loans. This compares with an ACL of $14.9 million or 0.29% of the total loan portfolio and 47% of total non-performing loans as of September 30, 2010. See additional discussion of asset quality in Part I, Item 1 of the Annual Report on Form 10-K.
Securities. The following table presents the distribution of our MBS and investment securities portfolios, at amortized cost, at the dates indicated. Overall, fixed-rate securities comprised 76% of these portfolios at September 30, 2011. The WAL is the estimated remaining maturity after projected prepayment speeds and projected call option assumptions have been applied. The increase in the WAL between September 30, 2010 and September 30, 2011 was due primarily to purchases of investment securities and MBS. The decrease in the yield between September 30, 2010 and September 30, 2011 was primarily a result of the purchase of securities with yields lower than that of the existing portfolios, repayments of MBS with yields higher than that of the existing portfolio, and adjustable-rate MBS resetting to lower coupons due to a decline in related indices. Yields on tax-exempt securities are not calculated on a taxable equivalent basis. The WAL amounts represent average lives in terms of years.
| | | September 30, 2011 | | | September 30, 2010 | |
| | | Balance | | | Yield | | | WAL | | | Balance | | | Yield | | | WAL | |
| Fixed-rate securities: | | (Dollars in thousands) | |
| U.S. government-sponsored enterprises (“GSE”) debentures | | $ | 1,380,028 | | | | 1.09 | % | | | 0.86 | | | $ | 1,258,980 | | | | 1.39 | % | | | 0.64 | |
| Municipal bonds | | | 59,622 | | | | 3.02 | | | | 2.29 | | | | 70,605 | | | | 2.95 | | | | 2.76 | |
| MBS | | | 1,476,660 | | | | 3.51 | | | | 4.23 | | | | 860,798 | | | | 4.47 | | | | 3.02 | |
| Total fixed-rate securities | | | 2,916,310 | | | | 2.36 | | | | 2.59 | | | | 2,190,383 | | | | 2.64 | | | | 1.64 | |
| Adjustable-rate securities: | | | | | | | | | | | | | | | | | | | | | | | | |
| Trust preferred securities | | | 3,681 | | | | 1.60 | | | | 25.73 | | | | 3,721 | | | | 1.96 | | | | 26.73 | |
| MBS | | | 893,655 | | | | 2.85 | | | | 7.07 | | | | 695,192 | | | | 3.43 | | | | 4.26 | |
| Total adjustable-rate securities | | | 897,336 | | | | 2.85 | | | | 7.17 | | | | 698,913 | | | | 3.42 | | | | 4.41 | |
| Total investment portfolio, at amortized cost | | $ | 3,813,646 | | | | 2.47 | % | | | 3.67 | | | $ | 2,889,296 | | | | 2.83 | % | | | 2.31 | |
Mortgage-Backed Securities. The balance of MBS, which primarily consists of securities of U.S. GSEs, increased $804.2 million from $1.61 billion at September 30, 2010 to $2.41 billion at September 30, 2011. The increase was a result of purchasing MBS primarily with proceeds downstreamed from the Company as a result of the corporate reorganization and cash flows from called and matured investment securities. The following table provides a summary of the activity in our portfolio of MBS for the periods presented. The yields and WAL for purchases are presented as recorded at the time of purchase. The yields for the beginning and ending balances are as of the period presented and are generally derived from recent prepayment activity on the MBS in the portfolio as of the dates presented. The weighted average yield of the MBS portfolio decreased from September 30, 2010 to September 30, 2011 due primarily to purchases at yields lower than the overall portfolio yield, the maturity and repayment of securities with higher yields than the overall portfolio, and adjustable-rate MBS resetting to lower coupons due to a decline in related indices. The beginning and ending WAL is the estimated remaining maturity (in years) after projected prepayment speeds have been applied. The increase in the WAL at September 30, 2011 compared to September 30, 2010 was due primarily to purchases of new securities issued closer to current market rates with longer average lives.
| | | For the Three Months Ended | |
| | | September 30, 2011 | | | June 30, 2011 | | | March 31, 2011 | | | December 31, 2010 | |
| | | Amount | | | Yield | | | WAL | | | Amount | | | Yield | | | WAL | | | Amount | | | Yield | | | WAL | | | Amount | | | Yield | | | WAL | |
| | | (Dollars in thousands) | |
| Beginning balance - carrying value | | $ | 2,342,545 | | | | 3.41 | % | | | 5.09 | | | $ | 2,355,899 | | | | 3.44 | % | | | 4.45 | | | $ | 1,695,294 | | | | 3.73 | % | | | 4.21 | | | $ | 1,607,864 | | | | 4.00 | % | | | 3.58 | |
| Maturities and repayments | | | (130,137 | ) | | | | | | | | | | | (105,142 | ) | | | | | | | | | | | (121,283 | ) | | | | | | | | | | | (123,577 | ) | | | | | | | | |
Net amortization of premiums/ (discounts) | | | (1,168 | ) | | | | | | | | | | | (781 | ) | | | | | | | | | | | (689 | ) | | | | | | | | | | | (632 | ) | | | | | | | | |
| Purchases: | | | | | | | | | | | | | | | | | | | | | | | | | | | | | | | | | | | | | | | | | | | | | | | | |
| Fixed | | | 157,720 | | | | 2.65 | | | | 4.05 | | | | 92,010 | | | | 2.88 | | | | 4.39 | | | | 501,748 | | | | 3.17 | | | | 4.64 | | | | 168,300 | | | | 2.16 | | | | 3.74 | |
| Adjustable | | | 45,564 | | | | 2.12 | | | | 6.24 | | | | -- | | | | -- | | | | -- | | | | 282,957 | | | | 2.59 | | | | 4.98 | | | | 49,436 | | | | 2.24 | | | | 5.08 | |
Change in valuation on AFS securities | | | (2,448 | ) | | | | | | | | | | | 559 | | | | | | | | | | | | (2,128 | ) | | | | | | | | | | | (6,097 | ) | | | | | | | | |
| Ending balance - carrying value | | $ | 2,412,076 | | | | 3.26 | % | | | 5.31 | | | $ | 2,342,545 | | | | 3.41 | % | | | 5.09 | | | $ | 2,355,899 | | | | 3.44 | % | | | 4.45 | | | $ | 1,695,294 | | | | 3.73 | % | | | 4.21 | |
| | | | | | | | | | | | | | | | | | | | | | | | | | | | | | | | | | | | | | | | | | | | | | | | | |
| | | For the Year Ended September 30, | |
| | | 2011 | | | 2010 | |
| | | Amount | | | Yield | | | WAL | | | Amount | | | Yield | | | WAL | |
| | | (Dollars in thousands) | |
| Beginning balance - carrying value | | $ | 1,607,864 | | | | 4.00 | % | | | 3.58 | | | $ | 1,992,467 | | | | 4.42 | % | | | 4.67 | |
| Maturities and repayments | | | (480,139 | ) | | | | | | | | | | | (511,308 | ) | | | | | | | | |
| Sale of securities, net of gains | | | -- | | | | | | | | | | | | (192,690 | ) | | | | | | | | |
Net amortization of premiums/ (discounts) | | | (3,270 | ) | | | | | | | | | | | (1,741 | ) | | | | | | | | |
| Purchases: | | | | | | | | | | | | | | | | | | | | | | | | |
| Fixed | | | 919,778 | | | | 2.87 | | | | 4.35 | | | | 131,426 | | | | 2.60 | | | | 3.85 | |
| Adjustable | | | 377,957 | | | | 2.49 | | | | 5.14 | | | | -- | | | | -- | | | | -- | |
Fair value of securities received in loan swap transaction | | | -- | | | | | | | | | | | | 192,690 | | | | | | | | | |
Change in valuation on AFS securities | | | (10,114 | ) | | | | | | | | | | | (2,980 | ) | | | | | | | | |
| Ending balance - carrying value | | $ | 2,412,076 | | | | 3.26 | % | | | 5.31 | | | $ | 1,607,864 | | | | 4.00 | % | | | 3.58 | |
The following table presents our fixed-rate MBS portfolio, at amortized cost, based on the underlying weighted average loan rate, the annualized prepayment speeds for the quarter ended September 30, 2011, and the net premium/discount by interest rate tier. Our fixed-rate MBS portfolio is somewhat less sensitive than our fixed-rate one- to four-family loan portfolio to repricing risk due to external refinancing barriers such as unemployment, income changes, and decreases in property values, which are generally more pronounced outside of our local market areas. However, we are unable to control the interest rates and/or governmental programs that could impact the loans in our fixed-rate MBS portfolio, and are therefore more likely to experience reinvestment risk due to principal prepayments. Additionally, prepayments impact the amortization/accretion of premiums/discounts on our MBS portfolio. As prepayments increase, the related premiums/discounts are amortized/accreted at a faster rate. The amortization of premiums decreases interest income while the accretion of discounts increases interest income. As noted in the table below, the fixed-rate MBS portfolio had a net premium of $11.1 million as of September 30, 2011. Given that the weighted average coupon on the underlying loans in this portfolio are above current market rates, the Bank could experience an increase in the premium amortization should prepayment speeds increase significantly, potentially reducing future interest income.
| | | | Original Term | | | | | | | |
| | | | 15 years or less | | | More than 15 years | | | | | | | |
| | | | | | | Prepayment | | | | | | Prepayment | | | | | | Net | |
| | | | Amortized | | | Speed | | | Amortized | | | Speed | | | | | | Premium/ | |
| Rate Range | | | Cost | | | (annualized) | | | Cost | | | (annualized) | | | Total | | | (Discount) | |
| | | | (Dollars in thousands) | | | | |
| < =3.99 | % | | $ | 747,002 | | | | 5.89 | % | | $ | 27,426 | | | | 2.52 | % | | $ | 774,428 | | | $ | 6,689 | |
| | 4.00 - 4.50 | % | | | 166,585 | | | | 16.09 | | | | 25,563 | | | | 2.97 | | | | 192,148 | | | | 4,779 | |
| | 4.51 - 4.99 | % | | | 207,877 | | | | 20.17 | | | | 5,921 | | | | 13.80 | | | | 213,798 | | | | (539 | ) |
| | 5.00 - 5.50 | % | | | 115,995 | | | | 21.37 | | | | 8,707 | | | | 16.45 | | | | 124,702 | | | | (55 | ) |
| | 5.51 - 5.99 | % | | | 75,843 | | | | 20.34 | | | | 47,102 | | | | 24.15 | | | | 122,945 | | | | 50 | |
| | 6.00 - 6.50 | % | | | 13,008 | | | | 18.16 | | | | 18,909 | | | | 15.65 | | | | 31,917 | | | | 63 | |
| | 6.51 - 6.99 | % | | | 2,438 | | | | 18.55 | | | | 9,662 | | | | 16.00 | | | | 12,100 | | | | 112 | |
| >=7.00 | % | | | -- | | | | -- | | | | 4,622 | | | | 16.89 | | | | 4,622 | | | | 8 | |
| | | | | $ | 1,328,748 | | | | 11.72 | % | | $ | 147,912 | | | | 13.77 | % | | $ | 1,476,660 | | | $ | 11,107 | |
| | | | | | | | | | | | | | | | | | | | | | | | | | | |
| Average rate | | | | 4.20 | % | | | | | 5.29 | % | | | | | 4.31 | % | | | | |
| Average remaining contractual | | | | | | | | | | | | | | | | | | | | | | |
| term (months) | | | | 131 | | | | | | | | 217 | | | | | | | | 140 | | | | | |
Investment Securities. Investment securities, which consist primarily of debentures issued by GSEs and municipal investments, increased $111.8 million from $1.33 billion at September 30, 2010 to $1.44 billion at September 30, 2011. The following table provides a summary of the activity of investment securities for the periods presented. The beginning and ending WALs represent the estimated remaining maturity (in years) of the securities after projected call dates have been considered, based upon market rates at each date presented. The yields for the beginning and ending balances are as of the first and last days of the periods presented. The WAL at September 30, 2011 increased slightly from September 30, 2010 due to maturities and calls of securities during the year that were replaced with securities with a longer WAL. The decrease in the yield at September 30, 2011 compared to September 30, 2010 was a result of maturities and calls of securities during the year that were replaced with securities at a lower yield.
| | | For the Three Months Ended | |
| | | September 30, 2011 | | | June 30, 2011 | | | March 31, 2011 | | | December 31, 2010 | |
| | | Amount | | | Yield | | | WAL | | | Amount | | | Yield | | | WAL | | | Amount | | | Yield | | | WAL | | | Amount | | | Yield | | | WAL | |
| | | (Dollars in thousands) | |
| Beginning balance - carrying value | | $ | 1,621,161 | | | | 1.16 | % | | | 1.05 | | | $ | 1,847,915 | | | | 1.17 | % | | | 1.55 | | | $ | 1,347,657 | | | | 1.32 | % | | | 1.61 | | | $ | 1,332,656 | | | | 1.47 | % | | | 0.84 | |
| Maturities and calls | | | (486,853 | ) | | | | | | | | | | | (326,009 | ) | | | | | | | | | | | (291,693 | ) | | | | | | | | | | | (252,728 | ) | | | | | | | | |
| Net amortization of premiums/(discounts) | | | (1,385 | ) | | | | | | | | | | | (1,391 | ) | | | | | | | | | | | (1,255 | ) | | | | | | | | | | | (799 | ) | | | | | | | | |
| Purchases - Fixed | | | 310,338 | | | | 1.21 | | | | 1.73 | | | | 99,974 | | | | 1.51 | | | | 2.62 | | | | 793,136 | | | | 0.99 | | | | 1.20 | | | | 268,689 | | | | 1.21 | | | | 1.89 | |
| Change in valuation on AFS securities | | | 1,219 | | | | | | | | | | | | 672 | | | | | | | | | | | | 70 | | | | | | | | | | | | (161 | ) | | | | | | | | |
| Ending balance - carrying value | | $ | 1,444,480 | | | | 1.17 | % | | | 1.00 | | | $ | 1,621,161 | | | | 1.16 | % | | | 1.05 | | | $ | 1,847,915 | | | | 1.17 | % | | | 1.55 | | | $ | 1,347,657 | | | | 1.32 | % | | | 1.61 | |
| | | | | | | | | | | | | | | | | | | | | | | | | | | | | | | | | | | | | | | | | | | | | | | | | |
| | | For the Year Ended | | | | | | | | | | | | | | | | | | | | | | | | | |
| | | 2011 | | | 2010 | |
| | | Amount | | | Yield | | | WAL | | | Amount | | | Yield | | | WAL | | | | | | | | | | | | | | | | | | | | | | | | | |
| | | (Dollars in thousands) | | | | | | | | | | | | | | | | | | | | | | | | | |
| Beginning balance - carrying value | | $ | 1,332,656 | | | | 1.47 | % | | | 0.84 | | | $ | 480,704 | | | | 1.93 | % | | | 1.53 | | | | | | | | | | | | | | | | | | | | | | | | | |
| Maturities and calls | | | (1,357,283 | ) | | | | | | | | | | | (674,183 | ) | | | | | | | | | | | | | | | | | | | | | | | | | | | | | | | | |
| Net amortization of premiums/(discounts) | | | (4,830 | ) | | | | | | | | | | | (4,199 | ) | | | | | | | | | | | | | | | | | | | | | | | | | | | | | | | | |
| Purchases - Fixed | | | 1,472,137 | | | | 1.11 | | | | 1.53 | | | | 1,530,583 | | | | 1.39 | | | | 1.13 | | | | | | | | | | | | | | | | | | | | | | | | | |
| Change in valuation on AFS securities | | | 1,800 | | | | | | | | | | | | (249 | ) | | | | | | | | | | | | | | | | | | | | | | | | | | | | | | | | |
| Ending balance - carrying value | | $ | 1,444,480 | | | | 1.17 | % | | | 1.00 | | | $ | 1,332,656 | | | | 1.47 | % | | | 0.84 | | | | | | | | | | | | | | | | | | | | | | | | | |
During fiscal year 2011, Capitol Federal Financial, Inc., at the holding company level, purchased $405.8 million of investment securities with a WAL of 1.13 years and a yield of 0.42% at the time of purchase. All of the securities were classified as AFS. The securities have laddered maturities in order to provide cash flows that can be used to pay dividends, repurchase stock when permitted by federal banking regulations, reinvest into higher yielding assets if interest rates rise, or pursue other corporate strategies, as deemed appropriate. The yields on these securities are less than the yields on the Bank’s current investment portfolio due to the short-term nature of the securities. At September 30, 2011, the holding company had $362.9 million in investment securities with a WAL of 0.58 years.
Liabilities. Total liabilities decreased $13.9 million, from $7.53 billion at September 30, 2010 to $7.51 billion at September 30, 2011, due primarily to a decrease of $153.6 million in other borrowings, partially offset by an increase in deposits of $108.9 million and an increase in FHLB advances of $31.1 million. The decrease in other borrowings was due to the repayment of the Debentures of $53.6 million and the maturity of $100.0 million of repurchase agreements that were not replaced. The increase in deposits was primarily in the money market and checking portfolios.
Deposits. Our money market portfolio increased $123.6 million from $942.4 million at September 30, 2010 to $1.07 billion at September 30, 2011. Of the $123.6 million increase, $39.0 million relates to the contribution to the Foundation as a result of the corporate reorganization. It is not anticipated that the Foundation will keep the funds in the money market account for an extended period of time. The remaining increase in the money market portfolio was due to customers reinvesting funds from maturing certificates of deposit into the money market portfolio and some customers maintaining higher cash balances due to the current economic uncertainty and in anticipation of market rates increasing, which would allow them to reinvest at higher rates. The checking portfolio increased $69.2 million from $482.4 million at September 30, 2010 to $551.6 million at September 30, 2011. The increase in our checking portfolio was also due to customers keeping more cash readily available, as reflected by a 15% increase in the average customer checking account balance between period ends. If interest rates were to rise, it is possible our money market and checking account customers may move those funds to higher-yielding deposit products inside of the Bank or withdraw their funds to invest in higher yielding investments outside of the Bank.
Our certificate of deposit portfolio decreased $102.9 million from $2.73 billion at September 30, 2010 to $2.62 billion at September 30, 2011. The $102.9 million decrease consisted primarily of medium- and short-term certificates, partially offset by an increase in our longer term certificates. Management competitively priced our longer term certificates in order to lengthen the weighted average maturity of the retail certificate of deposit portfolio. The following table presents the amount, average rate and percentage of total deposits for checking, savings, money market and certificates at September 30, 2011 and 2010.
| | | At September 30, |
| | | 2011 | | 2010 |
| | | | | | Average | | % of | | | | | Average | | % of |
| | | Amount | | | Rate | | Total | | Amount | | | Rate | | Total |
| | | (Dollars in thousands) |
| Checking | | $ | 551,632 | | | | 0.08 | % | | | 12.3 | % | | $ | 482,428 | | | | 0.13 | % | | | 11.0 | % |
| Savings | | | 253,184 | | | | 0.41 | | | | 5.6 | | | | 234,285 | | | | 0.54 | | | | 5.3 | |
| Money market | | | 1,066,065 | | | | 0.35 | | | | 23.7 | | | | 942,428 | | | | 0.65 | | | | 21.5 | |
| Certificates | | | 2,624,292 | | | | 1.87 | | | | 58.4 | | | | 2,727,169 | | | | 2.29 | | | | 62.2 | |
| | | $ | 4,495,173 | | | | 1.21 | % | | | 100.0 | % | | $ | 4,386,310 | | | | 1.61 | % | | | 100.0 | % |
At September 30, 2011, $83.7 million in certificates were brokered deposits, unchanged from September 30, 2010. The $83.7 million of brokered deposits at September 30, 2011 had a weighted average rate of 2.58% and a remaining term to maturity of 2.9 years. The Bank regularly considers brokered deposits as a source of funding, provided that investment opportunities are balanced with the funding cost. As of September 30, 2011, $106.4 million in certificates were public unit deposits, compared to $109.9 million in public unit deposits at September 30, 2010. The $106.4 million of public unit deposits at September 30, 2011 had a weighted average rate of 0.31% and a remaining term to maturity of six months. Management will continue to monitor the wholesale deposit market for attractive opportunities relative to the yield received from investing the proceeds.
Borrowings. The following table presents FHLB advance and repurchase agreement activity for the periods presented. The rate presented is the contractual rate, and the weighted average maturity (“WAM”) is the remaining weighted average contractual term in months.
| | | For the Three Months Ended | |
| | | September 30, 2011 | | | June 30, 2011 | | | March 31, 2011 | | | December 31, 2010 | |
| | | Amount | | | Rate | | | | WAM | | | Amount | | | Rate | | | WAM | | | Amount | | | Rate | | | WAM | | | Amount | | | Rate | | | WAM | |
| | | (Dollars in thousands) | |
| Beginning principal balance | | $ | 3,041,000 | | | | 3.53 | % | | | | 37.48 | | | $ | 2,966,000 | | | | 3.55 | % | | | 38.60 | | | $ | 2,991,000 | | | | 3.54 | % | | | 41.23 | | | $ | 2,991,000 | | | | 3.70 | % | | | 35.94 | |
| Maturities and prepayments | | | (126,000 | ) | | | 4.72 | | | | | | | | | (25,000 | ) | | | 2.79 | | | | | | | | (25,000 | ) | | | 2.94 | | | | | | | | (300,000 | ) | | | 4.55 | | | | | |
| New borrowings | | | -- | | | | -- | | | | | -- | | | | 100,000 | | | | 2.82 | | | | 84.00 | | | | -- | | | | -- | | | | -- | | | | 300,000 | | | | 3.00 | | | | 83.33 | |
| Ending principal balance | | $ | 2,915,000 | | | | 3.48 | % | | | | 36.02 | | | $ | 3,041,000 | | | | 3.53 | % | | | 37.48 | | | $ | 2,966,000 | | | | 3.55 | % | | | 38.60 | | | $ | 2,991,000 | | | | 3.54 | % | | | 41.23 | |
| | | | | | | | | | | | | | | | | | | | | | | | | | | | | | | | | | | | | | | | | | | | | | | | | | |
| | | For the Year Ended September 30, | | | | | | | | | | | | | | | | | | | | | | | | | |
| | | 2011 | | 2010 | |
| | | Amount | | | Rate | | | | WAM | | | Amount | | | Rate | | | WAM | | | | | | | | | | | | | | | | | | | | | | | | | |
| | | (Dollars in thousands) | | | | | | | | | | | | | | | | | | | | | | | | | |
| Beginning principal balance | | $ | 2,991,000 | | | | 3.70 | % | | | | 35.94 | | | $ | 3,086,000 | | | | 3.83 | % | | | 38.68 | | | | | | | | | | | | | | | | | | | | | | | | | |
| Maturities and prepayments | | | (476,000 | ) | | | 4.42 | | | | | | | | | (395,000 | ) | | | 4.32 | | | | | | | | | | | | | | | | | | | | | | | | | | | | | |
| New borrowings | | | 400,000 | | | | 2.96 | | | | | 83.50 | | | | 300,000 | | | | 3.19 | | | | 84.00 | | | | | | | | | | | | | | | | | | | | | | | | | |
| Ending principal balance | | $ | 2,915,000 | | | | 3.48 | % | | | | 36.02 | | | $ | 2,991,000 | | | | 3.70 | % | | | 35.94 | | | | | | | | | | | | | | | | | | | | | | | | | |
In April 2011, the Company redeemed the outstanding Debentures of $53.6 million using a portion of the offering proceeds from the corporate reorganization. See additional discussion of borrowings in “Notes to Financial Statements - Note 7 - Borrowed Funds.”
Stockholders’ Equity. Stockholders’ equity increased $977.6 million, from $962.0 million at September 30, 2010 to $1.94 billion at September 30, 2011. The increase was due primarily to the net stock offering proceeds of $1.13 billion from the corporate reorganization in December 2010 and net income during the fiscal year, partially offset by dividends paid of $150.1 million. The $150.1 million consisted of cash dividends of $17.0 million paid prior to the corporate reorganization, and cash dividends of $133.1 million paid since the corporate reorganization. The $17.0 million consisted of a quarterly dividend of $10.6 million and a special dividend of $6.4 million related to fiscal year 2010 earnings, per the Company’s prior dividend policy. The $133.1 million consisted of three quarterly dividends totaling $36.3 million and the one-time special cash dividend (welcome dividend) of $96.8 million.
On October 20, 2011, the Company declared a quarterly cash dividend of $0.075 per share, which will equate to approximately $12.1 million, payable on November 18, 2011, and a special year-end dividend of $0.10 per share, which will equate to approximately $16.2 million, payable on December 2, 2011. The special year-end dividend is the result of the Board of Directors’ commitment to distribute to stockholders 100% of the annual earnings of Capitol Federal Financial, Inc. for the first two fiscal years following the second-step stock conversion. The $0.10 per share special year-end dividend was determined by taking the difference between earnings per share for fiscal year 2011 (after adding back the contribution to the Foundation) of $0.40, and regular quarterly dividends declared for fiscal year 2011 of $0.30 per share.
There were no stock repurchases during fiscal year 2011. Under current regulatory restrictions, we may not repurchase our stock during the first year following the corporate reorganization except under very limited circumstances. This one-year moratorium expires in December 2011. The stock repurchase plan that was in effect at the time of the corporate reorganization ceased to exist once the reorganization was complete. There is no repurchase plan currently in place.
Weighted Average Yields and Rates. The following table presents the weighted average yields earned on loans, securities and other interest-earning assets, the weighted average rates paid on deposits and borrowings and the resultant interest rate spreads at the dates indicated. Yields on tax-exempt securities are not calculated on a tax-equivalent basis.
| | | At September 30, | |
| | | 2011 | | | 2010 | | | 2009 | |
| | | | | | | | | | |
| Weighted average yield on: | | | | | | | | | |
| Loans receivable | | | 4.87 | % | | | 5.23 | % | | | 5.38 | % |
| MBS | | | 3.26 | | | | 4.00 | | | | 4.42 | |
| Investment securities | | | 1.17 | | | | 1.47 | | | | 1.93 | |
| Capital stock of FHLB | | | 3.39 | | | | 2.98 | | | | 2.98 | |
| Cash and cash equivalents | | | 0.24 | | | | 0.22 | | | | 0.21 | |
| Combined weighted average yield on | | | | | | | | | | | | |
| interest-earning assets | | | 3.81 | | | | 4.33 | | | | 4.89 | |
| | | | | | | | | | | | | |
| Weighted average rate paid on: | | | | | | | | | | | | |
| Checking deposits | | | 0.08 | | | | 0.13 | | | | 0.17 | |
| Savings deposits | | | 0.41 | | | | 0.54 | | | | 0.66 | |
| Money market deposits | | | 0.35 | | | | 0.65 | | | | 0.82 | |
| Certificate of deposit | | | 1.87 | | | | 2.29 | | | | 3.09 | |
FHLB advances (1) | | | 3.71 | | | | 3.96 | | | | 4.13 | |
| Other borrowings | | | 4.00 | | | | 3.97 | | | | 3.91 | |
| Combined weighted average rate paid on | | | | | | | | | | | | |
| interest-bearing liabilities | | | 2.21 | | | | 2.57 | | | | 3.00 | |
| | | | | | | | | | | | | |
| Net interest rate spread | | | 1.60 | % | | | 1.76 | % | | | 1.89 | % |
| (1) | Rates include the net impact of the deferred prepayment penalties related to the prepayment of certain FHLB advances and deferred gains associated with the interest rate swap terminations in prior years. |
Average Balance Sheet. The following table presents the average balances of our assets, liabilities and stockholders’ equity and the related annualized yields and rates on our interest-earning assets and interest-bearing liabilities for the periods indicated. Average yields are derived by dividing annualized income by the average balance of the related assets and average rates are derived by dividing annualized expense by the average balance of the related liabilities, for the periods shown. Average outstanding balances are derived from average daily balances, except for other noninterest-earning assets, other noninterest-earning liabilities and stockholders’ equity which were calculated based on month-end balances. The yields and rates include amortization of fees, costs, premiums and discounts which are considered adjustments to yields/rates. Yields on tax-exempt securities were not calculated on a tax-equivalent basis.
| | | Year Ended September 30, | |
| | | 2011 | | | 2010 | | | 2009 | |
| | | Average | | | Interest | | | | | | Average | | | Interest | | | | | | Average | | | Interest | | | | |
| | | Outstanding | | | Earned/ | | | Yield/ | | | Outstanding | | | Earned/ | | | Yield/ | | | Outstanding | | | Earned/ | | | Yield/ | |
| | | Balance | | | Paid | | | Rate | | | Balance | | | Paid | | | Rate | | | Balance | | | Paid | | | Rate | |
| Assets | | | | | | | | | | | (Dollars in thousands) | | | | | | | | | | |
| Interest-earning assets: | | | | | | | | | | | | | | | | | | | | | | | | | | | |
Mortgage loans (1) | | $ | 4,966,905 | | | $ | 242,057 | | | | 4.87 | % | | $ | 5,198,175 | | | $ | 271,154 | | | | 5.22 | % | | $ | 5,296,297 | | | $ | 293,685 | | | | 5.55 | % |
| Other loans | | | 179,048 | | | | 9,852 | | | | 5.50 | | | | 199,244 | | | | 11,153 | | | | 5.60 | | | | 208,252 | | | | 12,097 | | | | 5.81 | |
| Total loans receivable | | | 5,145,953 | | | | 251,909 | | | | 4.90 | | | | 5,397,419 | | | | 282,307 | | | | 5.23 | | | | 5,504,549 | | | | 305,782 | | | | 5.56 | |
MBS (2) | | | 2,044,897 | | | | 71,332 | | | | 3.49 | | | | 1,710,074 | | | | 71,859 | | | | 4.20 | | | | 2,110,701 | | | | 97,926 | | | | 4.64 | |
Investment securities (2)(3) | | | 1,566,937 | | | | 19,077 | | | | 1.22 | | | | 887,955 | | | | 15,682 | | | | 1.77 | | | | 229,766 | | | | 5,533 | | | | 2.41 | |
| Capital stock of FHLB | | | 123,817 | | | | 3,791 | | | | 3.06 | | | | 133,817 | | | | 3,966 | | | | 2.96 | | | | 129,716 | | | | 3,344 | | | | 2.58 | |
| Cash and cash equivalents | | | 306,958 | | | | 756 | | | | 0.25 | | | | 100,411 | | | | 237 | | | | 0.24 | | | | 72,184 | | | | 201 | | | | 0.28 | |
| Total interest-earning assets | | | 9,188,562 | | | | 346,865 | | | | 3.77 | | | | 8,229,676 | | | | 374,051 | | | | 4.55 | | | | 8,046,916 | | | | 412,786 | | | | 5.13 | |
| Other noninterest-earning assets | | | 234,315 | | | | | | | | | | | | 235,324 | | | | | | | | | | | | 181,829 | | | | | | | | | |
| Total assets | | $ | 9,422,877 | | | | | | | | | | | $ | 8,465,000 | | | | | | | | | | | $ | 8,228,745 | | | | | | | | | |
| | | | | | | | | | | | | | | | | | | | | | | | | | | | | | | | | | | | | |
| Liabilities and stockholders' equity | | | | | | | | | | | | | | | | | | | | | | | | | | | | | | | | | | | | |
| Interest-bearing liabilities: | | | | | | | | | | | | | | | | | | | | | | | | | | | | | | | | | | | | |
| Checking | | $ | 518,526 | | | $ | 441 | | | | 0.09 | % | | $ | 471,397 | | | $ | 622 | | | | 0.13 | % | | $ | 426,976 | | | $ | 879 | | | | 0.21 | % |
| Savings | | | 245,994 | | | | 1,225 | | | | 0.49 | | | | 232,651 | | | | 1,323 | | | | 0.57 | | | | 228,879 | | | | 1,873 | | | | 0.82 | |
| Money market | | | 1,024,523 | | | | 5,307 | | | | 0.52 | | | | 914,382 | | | | 6,522 | | | | 0.71 | | | | 814,898 | | | | 8,512 | | | | 1.04 | |
| Certificates | | | 2,776,293 | | | | 56,595 | | | | 2.04 | | | | 2,672,364 | | | | 70,749 | | | | 2.65 | | | | 2,585,560 | | | | 89,207 | | | | 3.45 | |
| Total deposits | | | 4,565,336 | | | | 63,568 | | | | 1.39 | | | | 4,290,794 | | | | 79,216 | | | | 1.85 | | | | 4,056,313 | | | | 100,471 | | | | 2.48 | |
FHLB advances (4) | | | 2,386,380 | | | | 90,298 | | | | 3.79 | | | | 2,389,597 | | | | 97,212 | | | | 4.07 | | | | 2,437,978 | | | | 106,551 | | | | 4.36 | |
| Repurchase agreements | | | 581,507 | | | | 23,410 | | | | 3.97 | | | | 654,987 | | | | 26,378 | | | | 3.97 | | | | 660,000 | | | | 26,549 | | | | 3.97 | |
| Other borrowings | | | 27,612 | | | | 855 | | | | 3.05 | | | | 53,609 | | | | 1,680 | | | | 3.09 | | | | 53,601 | | | | 2,573 | | | | 4.74 | |
| Total borrowings | | | 2,995,499 | | | | 114,563 | | | | 3.82 | | | | 3,098,193 | | | | 125,270 | | | | 4.03 | | | | 3,151,579 | | | | 135,673 | | | | 4.29 | |
| Total interest-bearing liabilities | | | 7,560,835 | | | | 178,131 | | | | 2.35 | | | | 7,388,987 | | | | 204,486 | | | | 2.77 | | | | 7,207,892 | | | | 236,144 | | | | 3.27 | |
| Other noninterest-bearing liabilities | | | 118,603 | | | | | | | | | | | | 119,441 | | | | | | | | | | | | 108,940 | | | | | | | | | |
| Stockholders' equity | | | 1,743,439 | | | | | | | | | | | | 956,572 | | | | | | | | | | | | 911,913 | | | | | | | | | |
Total liabilities and stockholders' equity | | $ | 9,422,877 | | | | | | | | | | | $ | 8,465,000 | | | | | | | | | | | $ | 8,228,745 | | | | | | | | | |
| | | | | | | | | | | | | | | | | | | | | | | | | | | | | | | | | | | | | |
Net interest income (5) | | | | | | $ | 168,734 | | | | | | | | | | | $ | 169,565 | | | | | | | | | | | $ | 176,642 | | | | | |
Net interest rate spread (6) | | | | | | | | | | | 1.42 | % | | | | | | | | | | | 1.78 | % | | | | | | | | | | | 1.86 | % |
| Net earning assets | | $ | 1,627,727 | | | | | | | | | | | $ | 840,689 | | | | | | | | | | | $ | 839,024 | | | | | | | | | |
Net interest margin (7) | | | | | | | | | | | 1.84 | % | | | | | | | | | | | 2.06 | % | | | | | | | | | | | 2.20 | % |
| Ratio of interest-earning assets to | | | | | | | | | | | | | | | | | | | | | | | | | | | | | | | | | | | | |
| interest-bearing liabilities | | | | | | | | | | | 1.22 | x | | | | | | | | | | | 1.11 | x | | | | | | | | | | | 1.12 | x |
| (1) | Calculated net of unearned loan fees, deferred costs, and undisbursed loan funds. Non-accrual loans are included in the loans receivable average balance with a yield of zero percent. Balances include LHFS. |
(2) MBS and investment securities classified as AFS are stated at amortized cost, adjusted for unamortized purchase premiums or discounts.
| (3) | The average balance of investment securities includes an average balance of nontaxable securities of $63.9 million, $72.0 million, and $61.0 million for the years ended September 30, 2011, 2010, and 2009, respectively. |
(4) The balance and rate of FHLB advances are stated net of deferred gains and deferred prepayment penalties.
| (5) | Net interest income represents the difference between interest income earned on interest-earning assets, such as mortgage loans, investment securities, and MBS, and interest paid on interest-bearing liabilities, such as deposits, FHLB advances, and other borrowings. Net interest income depends on the balance of interest-earning assets and interest-bearing liabilities, and the interest rates earned or paid on them. |
(6) Net interest rate spread represents the difference between the average yield on interest-earning assets and the average cost of interest-bearing liabilities.
(7) Net interest margin represents net interest income as a percentage of average interest-earning assets.
Rate/Volume Analysis. The table below presents the dollar amount of changes in interest income and interest expense for major components of interest-earning assets and interest-bearing liabilities, comparing fiscal years 2011 to 2010 and fiscal years 2010 to 2009. For each category of interest-earning assets and interest-bearing liabilities, information is provided on changes attributable to (1) changes in volume, which are changes in the average balance multiplied by the previous year’s average rate and (2) changes in rate, which are changes in the average rate multiplied by the average balance from the previous year. The net changes attributable to the combined impact of both rate and volume have been allocated proportionately to the changes due to volume and the changes due to rate.
| | | Year Ended September 30, | |
| | | 2011 vs. 2010 | | | 2010 vs. 2009 | |
| | | Increase (Decrease) Due to | | | Increase (Decrease) Due to | |
| | | Volume | | | Rate | | | Total | | | Volume | | | Rate | | | Total | |
| | | (Dollars in thousands) | |
| Interest-earning assets: | | | | | | | | | | | | | | | | | | |
| Loans receivable | | $ | (12,703 | ) | | $ | (17,695 | ) | | $ | (30,398 | ) | | $ | (5,867 | ) | | $ | (17,608 | ) | | $ | (23,475 | ) |
| MBS | | | 12,749 | | | | (13,276 | ) | | | (527 | ) | | | (17,383 | ) | | | (8,684 | ) | | | (26,067 | ) |
| Investment securities | | | 9,359 | | | | (5,964 | ) | | | 3,395 | | | | 11,980 | | | | (1,831 | ) | | | 10,149 | |
| Capital stock of FHLB | | | (305 | ) | | | 130 | | | | (175 | ) | | | 110 | | | | 512 | | | | 622 | |
| Cash and cash equivalents | | | 509 | | | | 10 | | | | 519 | | | | 69 | | | | (33 | ) | | | 36 | |
| Total interest-earning assets | | | 9,609 | | | | (36,795 | ) | | | (27,186 | ) | | | (11,091 | ) | | | (27,644 | ) | | | (38,735 | ) |
| | | | | | | | | | | | | | | | | | | | | | | | | |
| Interest-bearing liabilities: | | | | | | | | | | | | | | | | | | | | | | | | |
| Checking | | | 56 | | | | (203 | ) | | | (147 | ) | | | 86 | | | | (370 | ) | | | (284 | ) |
| Savings | | | 73 | | | | (194 | ) | | | (121 | ) | | | 30 | | | | (583 | ) | | | (553 | ) |
| Money market | | | 716 | | | | (1,883 | ) | | | (1,167 | ) | | | 942 | | | | (2,930 | ) | | | (1,988 | ) |
| Certificates | | | 2,658 | | | | (16,871 | ) | | | (14,213 | ) | | | 2,901 | | | | (21,331 | ) | | | (18,430 | ) |
| FHLB advances | | | (686 | ) | | | (6,228 | ) | | | (6,914 | ) | | | (1,407 | ) | | | (7,932 | ) | | | (9,339 | ) |
| Other borrowings | | | (3,772 | ) | | | (21 | ) | | | (3,793 | ) | | | (199 | ) | | | (865 | ) | | | (1,064 | ) |
| Total interest-bearing liabilities | | | (955 | ) | | | (25,400 | ) | | | (26,355 | ) | | | 2,353 | | | | (34,011 | ) | | | (31,658 | ) |
| | | | | | | | | | | | | | | | | | | | | | | | | |
| Net change in net interest and dividend income | | $ | 10,564 | | | $ | (11,395 | ) | | $ | (831 | ) | | $ | (13,444 | ) | | $ | 6,367 | | | $ | (7,077 | ) |
Comparison of Results of Operations for the Years Ended September 30, 2011 and 2010
Net income for fiscal year 2011 was $38.4 million, compared to $67.8 million for fiscal year 2010. The $29.4 million, or 43.4%, decrease for the current year was due primarily to the $40.0 million ($26.0 million, net of income tax benefit) contribution to the Foundation in connection with the corporate reorganization. Additionally, other income decreased $9.4 million, or 27.4%, from $34.4 million for the prior year to $25.0 million for the current year. These reductions to income were partially offset by a $4.8 million decrease in the provision for credit losses between fiscal years. Interest income for fiscal year 2011 decreased by $27.2 million, or 7.3%, compared to fiscal year 2010, but was almost entirely offset by a decrease in interest expense of $26.4 million, or 12.9%, between fiscal years. The net interest margin decreased 22 basis points, from 2.06% for fiscal year 2010 to 1.84% for fiscal year 2011, largely due to the decrease in interest income on loans receivable.
Interest and Dividend Income
Total interest and dividend income for fiscal year 2011 was $346.9 million, compared to $374.1 million for fiscal year 2010. The $27.2 million decrease was primarily a result of a decrease in interest income on loans receivable of $30.4 million, partially offset by an increase in interest income on investment securities of $3.4 million. The average yield on total interest-earning assets decreased 78 basis points year over year, from 4.55% for fiscal year 2010 to 3.77% for fiscal year 2011, primarily as a result of a decrease in the yield on the loans receivable portfolio, but also partially due to decreases in the yields on the MBS and investment securities portfolios.
Interest income on loans receivable in the current fiscal year was $251.9 million compared to $282.3 million in the prior fiscal year. The $30.4 million decrease in interest income on loans receivable was the result of a decrease of 33 basis points in the weighted average yield to 4.90% for fiscal year 2011 and a decrease of $251.5 million in the average balance of the portfolio. The decrease in the weighted average yield was due to loan endorsements, loan originations at current market rates below that of the existing portfolio, refinances, and ARMs repricing down to lower market rates. The decrease in the average balance of the loan portfolio was due to principal repayments exceeding originations and purchases, especially during the first half of fiscal year 2011.
Interest income on MBS in the current fiscal year was $71.3 million compared to $71.9 million in the prior fiscal year. The $527 thousand decrease in interest income on MBS was due to a decrease of 71 basis points in the weighted average yield to 3.49% for fiscal year 2011, partially offset by an increase of $334.8 million in the average balance of the portfolio. The decrease in the weighted average yield was due to purchases of MBS at a lower average yield than the existing portfolio between the two periods, repayments on MBS with yields higher than the existing portfolio, and adjustable-rate securities repricing to lower market rates. The increase in the average balance of the portfolio was due to purchases of MBS securities, primarily with proceeds from the corporate reorganization.
Interest income on investment securities in the current fiscal year was $19.1 million compared to $15.7 million in the prior fiscal year. The $3.4 million increase in interest income on investment securities was due to a $679.0 million increase in the average balance, partially offset by a decrease of 55 basis points in the weighted average yield to 1.22% for fiscal year 2011. The increase in the average balance was primarily a result of purchases funded with stock offering proceeds from the corporate reorganization. The average yield decreased due to purchases at yields lower than the overall portfolio yield, and to calls and maturities of higher yielding securities.
Interest Expense
Interest expense decreased $26.4 million to $178.1 million for fiscal year 2011 from $204.5 million for fiscal year 2010. The decrease was due primarily to a decrease in interest expense on deposits of $15.6 million, and partially to a decrease in FHLB advances of $6.9 million and other borrowings of $3.8 million. The average rate paid on interest-bearing liabilities decreased 42 basis points between years, from 2.77% for fiscal year 2010 to 2.35% for fiscal year 2011, primarily as a result of repricing in the certificate of deposit portfolio.
Interest expense on deposits for the current fiscal year was $63.6 million compared to $79.2 million in the prior fiscal year. The $15.6 million decrease was due primarily to a decrease in interest expense on certificates, as the weighted average rate paid on the certificate of deposit portfolio decreased 61 basis points between the two years, from 2.65% for fiscal year 2010 to 2.04% fiscal year 2011. The decrease in the rate was a result of the portfolio continuing to reprice to lower market rates.
Interest expense on FHLB advances for the current fiscal year was $90.3 million compared to $97.2 million in the prior fiscal year. The $6.9 million decrease was due primarily due to a 28 basis point decrease in the weighted average rate of the portfolio to 3.79% for fiscal year 2011. The decrease in the weighted average rate was a result of the renewal of maturing FHLB advances at lower rates, maturing advances that were not renewed, and the refinance of $200.0 million of advances in the third quarter of fiscal year 2010.
Interest expense on other borrowings for the current fiscal year was $24.3 million compared to $28.1 million in the prior fiscal year. The $3.8 million decrease was due primarily to a $99.5 million decrease in the average balance primarily as a result of not replacing all maturing repurchase agreements.
Net Interest Margin
The net interest margin, which is calculated as the difference between interest income and interest expense divided by average interest-earning assets, was 1.84% for fiscal year 2011 compared to 2.06% for fiscal year 2010. The 22 basis point decrease was due primarily to a decrease in net interest income between fiscal years. The average balance of interest-earning assets increased $958.9 million, or 11.7%, between years, while net interest income decreased $831 thousand, or 0.5%, between years. The primary reason for the decrease in net interest income between years was a decrease in interest income on loans receivable due to loan endorsements, loans originated at market rates below that of the existing portfolio, refinances, and ARMs repricing down to lower market rates.
The recent decrease in market interest rates, as reflected by the shape of the yield curve, is anticipated to have a negative impact to the Company’s net interest margin during fiscal year 2012, especially if market rates remain at current levels for a sustained period of time. Mortgage endorsements and refinances are expected to continue over the course of the upcoming year, which could result in margin compression. Interest rates have decreased significantly during the past year and the yield curve has flattened as a result of continuously weak economic data, uncertainty about the resolution of the European debt crisis, uncertainty about fiscal actions by the U.S. Congress and additional monetary policy announcements by the FOMC. In the fourth quarter of fiscal year 2011, the two-year Treasury yield decreased approximately 20 basis points while the 10-year Treasury yield decreased approximately 125 basis points. Historically, the Bank has benefited from a steeper yield curve as the Bank’s mortgages are typically priced from long-term rates while deposits are priced from short-term rates. A steeper yield curve, one with a greater difference between short-term rates and long-term rates, allows the Bank to receive a higher rate of interest on our mortgage-related assets than the rate paid for the funding for those assets, which generally results in a higher net interest margin. As the yield curve flattens, the spread between rates received on assets and paid on liabilities becomes compressed, which generally leads to a decrease in net interest margin.
Provision for Credit Losses
The Bank recorded a provision for credit losses of $4.1 million during fiscal year 2011, compared to a provision of $8.9 million for fiscal year 2010. The provision recorded in fiscal year 2011 was primarily a result of the increase in and establishment of SVAs, primarily on purchased loans, and partially due to an increase in the general valuation allowance due to an increase in historical losses, a decline in the current FHFA home price index, primarily in Kansas and Missouri, and an increase in the recent unemployment rate trends compared to historical trends, also primarily in Kansas and Missouri.
Other Income and Expense
Total other income was $25.0 million for fiscal year 2011 compared to $34.4 million for fiscal year 2010. The $9.4 million, or 27.4%, decrease was due primarily to no gains on the sale of securities in the current fiscal year, compared to a $6.5 million gain in the prior fiscal year. Additionally, retail fees decreased $2.3 million between fiscal years as a result of the amendments to Regulation E that prohibit automatic enrollment in overdraft protection programs without the customer’s consent, and other income, net decreased by $1.8 million due primarily to a decrease in net gains on loan sales. Management is analyzing the Bank’s deposit account fee structure and plans to make adjustments to its fee structure to ensure that fees accurately reflect the costs of the Bank to provide services to customers. It is unlikely, however, that all of the revenue lost as a result of changes to Regulation E will be recovered.
Total other expenses for fiscal year 2011 were $132.3 million, compared to $89.7 million in fiscal year 2010. The $42.6 million, or 47.5%, increase was due primarily to a $40.0 million cash contribution to the Foundation in connection with the corporate reorganization. Additionally, salaries and employee benefits and other expenses, net, both increased $2.2 million and mortgage servicing activity, net, increased $1.8 million from fiscal year 2010. The increase in salaries and employee benefits was due to $2.7 million of compensation expense related to the welcome dividend paid on unallocated ESOP shares, which is not expected to reoccur in fiscal year 2012. The increase in other expenses, net, was primarily related to REO operations, which increased $1.7 million compared to fiscal year 2010. The increase in mortgage servicing activity, net, was due to impairment and valuation allowances during the current fiscal year as a result of an increase in prepayment speeds. The increases in the expenses noted above, were partially offset by decreases of $2.3 million in advertising and promotional expense and $2.2 million in federal insurance premium expense.
Effective October 31, 2010, the Bank discontinued its debit card rewards program. The discontinuation of the program resulted in a $1.5 million decrease in advertising and promotional expense for fiscal year 2011 compared to fiscal year 2010. The remaining decrease in advertising and promotional expense was due to an overall decrease in advertising in fiscal year 2011 as compared to fiscal year 2010. Advertising expense is expected to increase approximately $1.0 million in fiscal year 2012 as compared to fiscal year 2011.
In February 2011, the Federal Deposit Insurance Corporation adopted a new assessment structure for insured institutions effective April 2011. One of the significant changes includes using average total Bank consolidated assets minus average tangible equity for the assessment base instead of average deposits and secured liabilities for the period. As a result of the change, the deposit insurance assessment decreased by $2.2 million in fiscal year 2011 compared to fiscal year 2010, and is anticipated to decrease by approximately $700 thousand in fiscal year 2012.
A provision of the Dodd-Frank Act, commonly referred to as the “Durbin Amendment,” directed the FRB to analyze the debit card payments system and fix the interchange rates based upon their measure of actual costs for institutions with assets greater than $10 billion. Currently this has no direct impact on the Company because total Bank assets are less than $10 billion. Based upon the FRB’s new interchange rate for issuers exceeding $10 billion in total assets and the Bank’s debit card transaction volume, it is estimated that the related fee income could decrease by $3.1 million annually from current levels if the Bank exceeds $10 billion in assets. Although the Bank is currently exempt from the provisions of the rule on the basis of asset size, there is still some uncertainty about the potential impact on the interchange rates for issuers below that level.
Income Tax Expense
Income tax expense for fiscal year 2011 was $18.9 million compared to $37.5 million for fiscal year 2010. The decrease in income tax expense between years was primarily a result of the $40.0 million contribution to the Foundation, which resulted in $14.0 million of income tax benefit. The effective income tax rate for fiscal year 2011 was 33.0% compared to 35.6% for fiscal year 2010. The decrease in the effective tax rate between periods was due primarily to a $686 thousand adjustment related to income tax expense recognized in the prior years. Excluding that adjustment, the effective income tax rate would have been 34.2% for fiscal year 2011. The remaining difference between the effective income tax rates was due primarily to an increase in low income housing credits in the current fiscal year and in deductible expenses associated with the ESOP in the current fiscal year as a result of the $0.60 per share welcome dividend. Due to pre-tax income being lower than the prior year, all of the items impacting the income tax rate had a larger impact to the overall effective tax rate than in the prior year. Management anticipates the effective tax rate for fiscal year 2012 to be approximately 36%.
Non-GAAP Presentation
The following table presents the Company’s selected financial results and performance ratios for fiscal year 2011. Because of the magnitude and non-recurring nature of the $40.0 million contribution to the Foundation in connection with the corporate reorganization, management believes it is important for comparability purposes to present selected financial results and performance ratios excluding the contribution to the Foundation. The adjusted financial results and ratios are not presented in accordance with GAAP.
| | | For the Fiscal Year Ended | |
| | | September 30, 2011 | |
| | | Actual | | | Contribution | | | Adjusted (1) | |
| | | (GAAP) | | | to Foundation | | | (Non-GAAP) | |
| | | (Dollars in thousands, except per share data) | |
| | | | | | | | | | |
Net income (2) | | $ | 38,403 | | | $ | (26,000 | ) | | $ | 64,403 | |
| Operating expenses | | | 132,317 | | | | 40,000 | | | | 92,317 | |
| Basic earnings per share | | | 0.24 | | | | (0.16 | ) | | | 0.40 | |
| Diluted earnings per share | | | 0.24 | | | | (0.16 | ) | | | 0.40 | |
| | | | | | | | | | | | | |
| Return on average assets (annualized) | | | 0.41 | % | | | (0.27 | ) % | | | 0.68 | % |
| Return on average equity (annualized) | | | 2.20 | | | | (1.49 | ) | | | 3.69 | |
| Operating expense ratio | | | 1.40 | | | | 0.42 | | | | 0.98 | |
| Efficiency ratio | | | 68.30 | % | | | 20.65 | % | | | 47.65 | % |
| (1) | The adjusted financial results and ratios are not presented in accordance with GAAP as the amounts and ratios exclude the effect of the contribution to the Foundation, net of income tax benefit. |
| (2) | The net adjustment for the contribution to the Foundation of $26.0 million reflects the $14.0 million income tax benefit associated with the $40.0 million contribution. |
Comparison of Results of Operations for the Years Ended September 30, 2010 and 2009
For fiscal year 2010, the Company recognized net income of $67.8 million compared to net income of $66.3 million in fiscal year 2009. The $1.5 million increase in net income was primarily a result of a $5.8 million increase in other income, a $3.9 million decrease in other expenses and a $1.4 million decrease in income tax expense, partially offset by a $7.1 million decrease in net interest income and a $2.5 million increase in provision for credit losses.
Interest and Dividend Income
Total interest and dividend income for fiscal year 2010 was $374.1 million compared to $412.8 million for the fiscal year 2009. The $38.7 million decrease was a result of a $26.0 million decrease in interest income on MBS and a $23.5 million decrease in interest income on loans receivable, partially offset by a $10.2 million increase in interest income on investment securities.
Interest income on loans receivable in fiscal year 2010 was $282.3 million compared to $305.8 million in fiscal year 2009. The $23.5 million decrease was a result of a 33 basis point decrease in the weighted average yield of the portfolio to 5.23% for fiscal year 2010, as well as a $107.1 million decrease in the average balance of the loan portfolio between the two periods. The decrease in the weighted average yield was due to loan endorsements and refinances, originations and purchases at market rates lower than the existing portfolio, and repayments of loans with rates higher than the portfolios. The decrease in the average balance was due to the loan swap transaction, where $194.8 million of originated fixed-rate mortgage loans were swapped for MBS, and principal repayments outpacing originations and purchases during the fiscal year 2010.
Interest income on MBS in fiscal year 2010 was $71.9 million compared to $97.9 million in fiscal year 2009. The $26.0 million decrease was due primarily to a decrease of $400.6 million in the average balance, as well as a 44 basis point decrease in the weighted average portfolio yield to 4.20% for fiscal year 2010. The decrease in the average balance of the portfolio was due to principal repayments which were not replaced in their entirety; rather, the proceeds were reinvested into the investment securities portfolio. The weighted average yield decreased between the two periods due to an increase of prepayments on MBS with yields higher than the existing portfolio, repricing of adjustable-rate securities to lower market rates, and, to a lesser extent, purchases of MBS at lower yields than the existing portfolio between the two periods.
Interest income on investment securities in fiscal year 2010 was $15.7 million compared to $5.5 million in fiscal year 2009. The $10.2 million increase was primarily a result of an increase of $658.2 million in the average balance of the portfolio, partially offset by a 64 basis point decrease in the weighted average portfolio yield to 1.77% for fiscal year 2010. The average portfolio balance increased as a result of purchases funded with proceeds from the loan swap transaction, MBS and loan principal repayments and, to a lesser extent, from an increase in retail deposits. The decrease in the weighted average yield of the portfolio was attributed to maturities and calls of securities with yields greater than the remaining portfolio, and to investments made at lower market yields than the overall portfolio yield.
Interest Expense
Total interest expense for fiscal year 2010 was $204.5 million, compared to $236.1 million in fiscal year 2009. The $31.6 million decrease was primarily due to a decrease in interest expense on deposits of $21.3 million and a decrease in interest expense on FHLB advances of $9.4 million.
Interest expense on deposits in fiscal year 2010 was $79.2 million compared to $100.5 million in the fiscal year 2009. The $21.3 million decrease was primarily a result of a decrease in the rates on the entire deposit portfolio, primarily the certificate of deposit and money market portfolios, as these portfolios repriced to lower market rates. The average rate paid on the deposit portfolio decreased 63 basis points to 1.85% for the current fiscal year. The decrease in interest expense was partially offset by a $234.5 million increase in the average balance of the deposit portfolio, particularly the certificate of deposit and money market portfolios.
Interest expense on FHLB advances in fiscal year 2010 was $97.2 million compared to $106.6 million in the fiscal year 2009. The $9.4 million decrease in interest expense was a result of the refinancing of $875.0 million of advances during the second and third quarters of fiscal year 2009, and the refinancing of $200.0 million of advances and the renewal of $100.0 million of advances during the third quarter of fiscal year 2010 at rates lower than the existing portfolio.
Net Interest Margin
The net interest margin for fiscal year 2010 was 2.06% compared to 2.20% for fiscal year 2009. The 14 basis point decrease in the net interest margin was primarily a result of a decrease in the average yield of interest-earning assets compared to fiscal year 2009. The average yield on the loan portfolio decreased 33 basis points between periods due to loan endorsements and refinances, originations and purchases at market rates which were lower than the existing portfolio and repayments of loans with rates higher than the portfolio. Additionally, the Bank purchased investment securities with weighted average lives of approximately three years or less and at yields lower than MBS as part of our overall interest rate risk management strategy. The decrease in the weighted average yield on interest-earning assets was partially offset by a decrease in the weighted average rate paid on interest-bearing liabilities, specifically the certificate of deposit portfolio and FHLB advances.
Provision for Credit Losses
During fiscal year 2010, the Company recorded a provision for credit losses of $8.9 million compared to a provision of $6.4 million in the fiscal year 2009. The $8.9 million provision for credit losses was composed of $5.0 million related to increases in certain loss factors in our general valuation allowance model and $3.9 million related to establishing or increasing SVAs. The increase in certain loss factors in our general valuation allowance model reflects the risks inherent in our loan portfolio due to decreases in real estate values in certain geographic regions where the Bank has purchased loans, the continued elevated level of unemployment, and the increase in non-performing loans and loan charge-offs. The increase in SVAs was primarily related to our purchased loan portfolio.
Other Income and Expense
Total other income for fiscal year 2010 was $34.4 million compared to $28.6 million in the fiscal year 2009. The $5.8 million increase was due primarily to the $6.5 million gain on the sale of trading MBS in conjunction with the loan swap transaction during the first quarter of fiscal year 2010.
Total other expenses for fiscal year 2010 were $89.7 million compared to $93.6 million for the fiscal year 2009. The $3.9 million decrease was due primarily to an impairment and valuation allowance taken on the mortgage-servicing rights asset in the fiscal year 2009, compared to a net recovery in the fiscal year 2010.
Income Tax Expense
Income tax expense for fiscal year 2010 was $37.5 million compared to $38.9 million for the fiscal year 2009. The effective tax rate was 35.6% for fiscal year 2010, compared to 37.0% for the fiscal year 2009. The difference in the effective tax rate between periods was primarily a result of a net decrease in nondeductible amounts associated with the ESOP in fiscal year 2010, a reduction of unrecognized tax benefits due to the lapse of the statute of limitations during the first quarter of fiscal year 2010 and an increase in tax credits related to our low income housing partnerships.
Liquidity and Capital Resources
Liquidity refers to our ability to generate sufficient cash to fund ongoing operations, to pay maturing certificates of deposit and other deposit withdrawals, to repay maturing borrowings, and to fund loan commitments. Liquidity management is both a daily and long-term function of our business management. The Company’s most available liquid assets are represented by cash and cash equivalents, AFS MBS and investment securities, and short-term investment securities. The Bank’s primary sources of funds are deposits, FHLB advances, other borrowings, repayments and maturities of outstanding loans and MBS and other short-term investments, and funds provided by operations. The Bank’s borrowings primarily have been used to invest in U.S. GSE debentures and MBS securities in an effort to manage the Bank’s interest rate risk with the intent to improve the earnings of the Bank while maintaining capital ratios in excess of regulatory standards for well-capitalized financial institutions. In addition, the Bank’s focus on managing risk has provided additional liquidity capacity by remaining below FHLB borrowing limits and by increasing the balance of MBS and investment securities available as collateral for borrowings.
We generally intend to maintain cash reserves sufficient to meet short-term liquidity needs, which are routinely forecasted for 10, 30, and 365 days. Additionally, on a monthly basis, we perform a liquidity stress test in accordance with the Interagency Policy Statement on Funding and Liquidity Risk Management. The liquidity stress test incorporates both short-term and long-term liquidity scenarios in order to quantify liquidity risk. In the event short-term liquidity needs exceed available cash, the Bank has access to lines of credit at the FHLB and the Federal Reserve Bank. The FHLB line of credit, when combined with FHLB advances, may generally not exceed 40% of total assets. Our excess capacity at the FHLB as of September 30, 2011 was $1.26 billion. The Federal Reserve Bank line of credit is based upon the fair values of the securities pledged as collateral and certain other characteristics of those securities, and is used only when other sources of short-term liquidity are unavailable. At September 30, 2011, the Bank had $1.98 billion of securities that were eligible but unused as collateral for borrowing or other liquidity needs. This collateral amount is comprised of AFS and HTM securities with individual fair values greater than $10.0 million, which is then reduced by a collateralization ratio of 10% to account for potential market value fluctuations.
Borrowings on the lines of credit are outstanding until replaced by cash flows from long-term sources of liquidity, and are generally outstanding no longer than 30 days. If management observes a trend in the amount and frequency of lines of credit utilization, the Bank will likely utilize long-term wholesale borrowing sources, such as FHLB advances and/or repurchase agreements, to provide permanent fixed-rate funding. The maturity of these borrowings is generally structured in such a way as to stagger maturities in order to reduce the risk of a highly negative cash flow position at maturity. Additionally, the Bank could utilize the repayment and maturity of outstanding loans, MBS and other investments for liquidity needs rather than reinvesting such funds into the related portfolios.
While scheduled payments from the amortization of loans and MBS and payments on short-term investments are relatively predictable sources of funds, deposit flows, prepayments on loans and MBS, and calls of investment securities are greatly influenced by general interest rates, economic conditions and competition, and are less predictable sources of funds. To the extent possible, the Bank manages the cash flows of its loan and deposit portfolios by the rates it offers customers.
At September 30, 2011, cash and cash equivalents totaled $121.1 million, an increase of $55.9 million from September 30, 2010. The increase was due to cash flows received late in the month that were not reinvested by the end of the month.
During fiscal year 2011, loan originations and purchases were almost completely offset by principal repayments and related loan activity, compared to a cash inflow of $219.6 million in the same period in the prior year, as principal repayments exceeded loan originations and purchases in fiscal year 2010. See additional discussion regarding loan activity in “Financial Condition – Loans Receivable.”
During fiscal year 2011, the Company received principal payments on MBS of $480.1 million and proceeds from called or matured investment securities of $1.36 billion. These funds were largely reinvested into investment securities and MBS portfolios, along with the majority of the proceeds from the stock offering in conjunction with the corporate reorganization. During fiscal year 2011, the Company purchased $1.47 billion of investment securities and $1.30 billion of MBS.
The following table presents the contractual maturity of our loan, MBS, and investment securities portfolios at September 30, 2011. Loans and securities which have adjustable interest rates are shown as maturing in the period during which the contract is due. The table does not reflect the effects of possible prepayments or enforcement of due on sale clauses.
| | | Loans (1) | | | MBS | | | Investment Securities | | | Total | |
| | | | | | Weighted | | | | | | Weighted | | | | | | Weighted | | | | | | Weighted | |
| | | | | | Average | | | | | | Average | | | | | | Average | | | | | | Average | |
| | | Amount | | | Rate | | | Amount | | | Rate | | | Amount | | | Rate | | | Amount | | | Rate | |
| | | (Dollars in thousands) | |
| Amounts due: | | | | | | | | | | | | | | | | | | | | | | | | |
| Within one year | | $ | 34,830 | | | | 4.71 | % | | $ | -- | | | | -- | % | | $ | 304,058 | | | | 1.84 | % | | $ | 338,888 | | | | 2.14 | % |
| | | | | | | | | | | | | | | | | | | | | | | | | | | | | | | | | |
| After one year: | | | | | | | | | | | | | | | | | | | | | | | | | | | | | | | | |
| Over one to two years | | | 35,672 | | | | 4.74 | | | | -- | | | | -- | | | | 91,293 | | | | 1.33 | | | | 126,965 | | | | 2.29 | |
| Over two to three years | | | 9,137 | | | | 5.41 | | | | -- | | | | -- | | | | 295,267 | | | | 1.33 | | | | 304,404 | | | | 1.46 | |
| Over three to five years | | | 39,813 | | | | 5.45 | | | | 2,659 | | | | 6.00 | | | | 723,888 | | | | 1.36 | | | | 766,360 | | | | 1.59 | |
| Over five to ten years | | | 394,403 | | | | 5.02 | | | | 644,929 | | | | 3.85 | | | | 19,544 | | | | 4.17 | | | | 1,058,876 | | | | 4.29 | |
| Over 10 to 15 years | | | 1,214,895 | | | | 4.39 | | | | 727,708 | | | | 3.53 | | | | 3,304 | | | | 5.24 | | | | 1,945,907 | | | | 4.07 | |
| After 15 years | | | 3,467,126 | | | | 4.75 | | | | 1,036,780 | | | | 3.18 | | | | 7,126 | | | | 3.20 | | | | 4,511,032 | | | | 4.39 | |
| Total due after one year | | | 5,161,046 | | | | 4.69 | | | | 2,412,076 | | | | 3.47 | | | | 1,140,422 | | | | 1.42 | | | | 8,713,544 | | | | 3.93 | |
| | | | | | | | | | | | | | | | | | | | | | | | | | | | | | | | | |
| | | $ | 5,195,876 | | | | 4.69 | % | | $ | 2,412,076 | | | | 3.47 | % | | $ | 1,444,480 | | | | 1.51 | % | | $ | 9,052,432 | | | | 3.86 | % |
| (1) | Demand loans, loans having no stated maturity, and overdraft loans are included in the amounts due within one year. Construction loans are reported based on the term to complete construction. The maturity date for home equity loans assumes the customer always makes the required minimum payment. |
The Bank utilizes FHLB advances to provide funds for lending and investment activities. The Bank’s policies allow advances up to 40% of total Bank assets. At September 30, 2011, the Bank’s ratio of the face amount of advances to total assets, as reported to the Bank’s regulators, was 26%. The advances are secured by a blanket pledge of our loan portfolio, as collateral, supported by quarterly reporting to the FHLB. Currently, the blanket pledge is sufficient collateral for the FHLB advances. It is possible that increases in our borrowings or decreases in our loan portfolio could require the Bank to pledge securities as collateral on the FHLB advances. The Bank relies on FHLB advances as a primary source of borrowings. The par value of FHLB advances was $2.40 billion at September 30, 2011, of which $350.0 million is scheduled to mature in fiscal year 2012. $100.0 million is due in the first quarter of fiscal year 2012, $150.0 million is due in the second quarter of fiscal year 2012, and $100.0 million is due in the fourth quarter of fiscal year 2012. Maturing advances during fiscal year 2012 will likely be replaced with borrowings with terms between 36 and 60 months.
In April 2011, the Company redeemed the outstanding Debentures of $53.6 million, using a portion of the offering proceeds from the corporate reorganization.
The Bank has access to and utilizes other sources for liquidity, such as secondary market repurchase agreements, brokered deposits, and public unit deposits. The Bank’s policy limits total borrowings to 55% of total assets. At September 30, 2011, the Bank had repurchase agreements of $515.0 million, of which $150.0 million are scheduled to mature in the first quarter of 2012 and will likely be replaced with borrowings with terms between 36 and 60 months. The Bank may enter into additional repurchase agreements as management deems appropriate, not to exceed 15% of total assets. The Bank has pledged securities with an estimated fair value of $597.3 million as collateral for repurchase agreements at September 30, 2011. The securities pledged for the repurchase agreements will be delivered back to the Bank when the repurchase agreements mature.
As of September 30, 2011, the Bank’s policy allows for brokered deposits up to 10% of total deposits and public unit deposits up to 5% of total deposits. At September 30, 2011, the Bank had brokered deposits of $83.7 million, or approximately 2% of total deposits and public unit deposits of $106.4 million, or approximately 2.5% of total deposits. Management continuously monitors the wholesale deposit market for opportunities to obtain brokered and public unit deposits at attractive rates. The Bank has pledged securities with an estimated fair value of $124.8 million as collateral for public unit deposits. The securities pledged as collateral for public unit deposits are held under joint custody receipt by the FHLB and generally will be released upon deposit maturity.
At September 30, 2011, $1.39 billion of the $2.62 billion in certificates of deposit were scheduled to mature within one year. Included in the $1.39 billion are $85.9 million in public unit deposits. Based on our deposit retention experience and our current pricing strategy, we anticipate the majority of the maturing retail certificates of deposit will renew or transfer to other deposit products at the prevailing rate, although no assurance can be given in this regard.
As of September 30, 2011, the Bank had entered into $8.8 million of agreements, of which $1.7 million are outstanding, in connection with the remodeling of the Bank’s home office. The existing home office building was constructed in 1961 and has been fully depreciated since 1997. The project scope includes replacement of all mechanical and electrical systems, interior finishes, and exterior building components. The completed project will result in a more energy efficient building which is expected to lower our utility and maintenance expenses. There will be additional agreements and expenses related to the project through fiscal year 2013, which is when the project is expected to be completed. Costs related to the project will be capitalized and depreciated according to the estimated useful life of the assets as they are placed in service.
Limitations on Dividends and Other Capital Distributions
Although savings and loan holding companies are not currently subject to regulatory capital requirements or specific restrictions on the payment of dividends or other capital distributions, the OCC does prescribe such restrictions on subsidiary savings associations. The OCC regulations impose restrictions on savings institutions with respect to their ability to make distributions of capital, which include dividends, stock redemptions or repurchases, cash-out mergers and other transactions charged to the capital account. In addition, the financial impact of a holding company on its subsidiary institution is a matter that is evaluated by the OCC and the agency has authority to order cessation of activities or divestiture of subsidiaries deemed to pose a threat to the safety and soundness of the institution.
Generally under OCC and FRB regulations, savings institutions, such as the Bank, may make capital distributions during any calendar year equal to earnings of the previous two calendar years and current year-to-date earnings. It is generally required under OCC and FRB regulations that the Bank remain well-capitalized before and after the proposed distribution. However, an institution deemed to be in need of more than normal supervision by the OCC and FRB may have its dividend authority restricted by the OCC and FRB. Savings institutions proposing to make any capital distribution within these limits need only submit written notice to the OCC and FRB 30 days prior to such distribution. The OCC and FRB may object to the distribution during that 30-day period based on safety and soundness concerns. Savings institutions that desire to make a larger capital distribution, or are under special restrictions, or are not, or would not be, well-capitalized following a proposed capital distribution, however, must obtain OCC and FRB approval prior to making such distribution.
The long-term ability of the Company to pay dividends to its stockholders is based primarily upon the ability of the Bank to make capital distributions to the Company. So long as the Bank continues to remain “well-capitalized” after each capital distribution, operate in a safe and sound manner, provide the OCC and FRB with updated capital levels, non-performing asset balances and ACL information as requested, and comply with the interest rate risk management guidelines of the OCC and FRB, it is management’s belief that the OCC and FRB will continue to allow the Bank to distribute its net income to the Company, although no assurance can be given in this regard.
In connection with the corporate reorganization, a “liquidation account” was established for the benefit of certain depositors of the Bank in an amount equal to MHC’s ownership interest in the retained earnings of Capitol Federal Financial as of June 30, 2010. Under applicable federal banking regulations, neither the Company nor the Bank is permitted to pay dividends of its capital stock to its stockholders if stockholders’ equity would be reduced below the amount of the liquidation account at that time.
During fiscal year 2011, the Company paid $150.1 million in cash dividends, which consisted of cash dividends of $17.0 million paid prior to the corporate reorganization, and $133.1 million paid since the corporate reorganization. Dividend payments depend upon a number of factors including the Company's financial condition and results of operations, the Bank’s regulatory capital requirements, regulatory limitations on the Bank's ability to make capital distributions to the Company, and the amount of cash at the holding company.
At September 30, 2011, Capitol Federal Financial, Inc., at the holding company level, had $113.1 million on deposit with the Bank and $362.9 million in investment securities. As of September 30, 2011, $90.3 million of these securities will mature within 90 days. Under current regulatory restrictions, we may not repurchase our stock during the first year following our corporate reorganization except under very limited circumstances. The Company intends to begin repurchasing shares at the end of this one-year moratorium, which expires in December 2011, subject to market conditions and other factors.
Contingencies
In the normal course of business, the Company and its subsidiary are named defendants in various lawsuits and counter claims. In the opinion of management, after consultation with legal counsel, none of the currently pending suits are expected to have a materially adverse effect on the Company’s consolidated financial statements for the year ended September 30, 2011 or future periods.
Regulatory Capital
Consistent with management’s goals to operate a sound and profitable financial organization, we actively seek to maintain a “well capitalized” status in accordance with regulatory standards. Total equity under GAAP for the Bank was $1.40 billion at September 30, 2011, or 15.4% of total Bank assets on that date. As of September 30, 2011, the Bank exceeded all capital requirements of the OCC. The Company currently does not have any regulatory capital requirements, but under the Dodd-Frank Act will become subject to regulatory capital requirements beginning July 21, 2015. The following table presents the Bank’s regulatory capital ratios at September 30, 2011 based upon regulatory guidelines.
| | | | | | Regulatory | |
| | | | | | Requirement | |
| | | Bank | | | For “Well- | |
| | | Ratios | | | Capitalized” Status | |
| Tangible equity | | | 15.1 | % | | | N/A | |
| Tier 1 (core) capital | | | 15.1 | | | | 5.0 | % |
| Tier 1 (core) risk-based capital | | | 37.9 | | | | 6.0 | |
| Total risk-based capital | | | 38.3 | | | | 10.0 | |
Off-Balance Sheet Arrangements, Commitments and Contractual Obligations
The Company, in the normal course of business, makes commitments to buy or sell assets or to incur or fund liabilities. Commitments may include, but are not limited to:
| · | the origination, purchase, or sale of loans; |
| · | the purchase or sale of investment securities and MBS; |
| · | extensions of credit on home equity loans, construction loans, and commercial loans; |
| · | terms and conditions of operating leases; and |
| · | funding withdrawals of certificate of deposits at maturity. |
The following table summarizes our contractual obligations and other material commitments as of September 30, 2011.
| | | Maturity Range | |
| | | | | | | | | One to | | | Three to | | | | |
| | | | | | Less than | | | three | | | five | | | More than | |
| | | Total | | | one year | | | years | | | years | | | five years | |
| | | (Dollars in thousands) | |
| | | | | | | | | | | | | | | | |
| Operating leases | | $ | 11,801 | | | $ | 1,279 | | | $ | 2,051 | | | $ | 1,547 | | | $ | 6,924 | |
| | | | | | | | | | | | | | | | | | | | | |
| Certificates of Deposit | | $ | 2,624,292 | | | $ | 1,390,231 | | | $ | 864,058 | | | $ | 366,488 | | | $ | 3,515 | |
| Weighted average rate | | | 1.87 | % | | | 1.65 | % | | | 2.00 | % | | | 2.40 | % | | | 2.46 | % |
| | | | | | | | | | | | | | | | | | | | | |
| FHLB Advances | | $ | 2,400,000 | | | $ | 350,000 | | | $ | 975,000 | | | $ | 475,000 | | | $ | 600,000 | |
| Weighted average rate | | | 3.37 | % | | | 3.35 | % | | | 3.45 | % | | | 3.67 | % | | | 3.01 | % |
| | | | | | | | | | | | | | | | | | | | | |
| Repurchase Agreements | | $ | 515,000 | | | $ | 150,000 | | | $ | 245,000 | | | $ | 20,000 | | | $ | 100,000 | |
| Weighted average rate | | | 4.00 | % | | | 4.41 | % | | | 3.97 | % | | | 4.45 | % | | | 3.35 | % |
| | | | | | | | | | | | | | | | | | | | | |
| Commitments to originate and | | | | | | | | | | | | | | | | | | | | |
| purchase loans | | $ | 170,312 | | | $ | 170,312 | | | $ | -- | | | $ | -- | | | $ | -- | |
| Weighted average rate | | | 3.76 | % | | | 3.76 | % | | | -- | % | | | -- | % | | | -- | % |
| | | | | | | | | | | | | | | | | | | | | |
| Commitments to fund unused | | | | | | | | | | | | | | | | | | | | |
| home equity lines of credit | | | | | | | | | | | | | | | | | | | | |
| and commercial commitments | | $ | 265,531 | | | $ | 265,531 | | | $ | -- | | | $ | -- | | | $ | -- | |
| Weighted average rate | | | 4.53 | % | | | 4.53 | % | | | -- | % | | | -- | % | | | -- | % |
| | | | | | | | | | | | | | | | | | | | | |
| Unadvanced portion of | | | | | | | | | | | | | | | | | | | | |
| construction loans | | $ | 22,531 | | | $ | 22,531 | | | $ | -- | | | $ | -- | | | $ | -- | |
| Weighted average rate | | | 4.22 | % | | | 4.22 | % | | | -- | % | | | -- | % | | | -- | % |
Excluded from the table above are income tax liabilities of $68 thousand related to uncertain income tax positions. The amounts are excluded as management is unable to estimate the period of cash settlement as it is contingent on the statute of limitations expiring without examination by the respective taxing authority.
A percentage of commitments to originate mortgage loans are expected to expire unfunded, so the amounts reflected in the table above are not necessarily indicative of future liquidity requirements. Additionally, the Bank is not obligated to honor commitments to fund unused home equity lines of credit if a customer is delinquent or otherwise in violation of the loan agreement.
We anticipate we will continue to have sufficient funds, through repayments and maturities of loans and securities, deposits and borrowings, to meet our current commitments.
Stockholder Return Performance Presentation
The line graph below compares the cumulative total stockholder return on the Company’s common stock to the cumulative total return of a broad index of the Nasdaq Stock Market, the Hemscott Savings and Loan index, and the SNL Midcap Bank and Thrift industry index for the period September 30, 2006 through September 30, 2011. The information presented below assumes $100 invested on September 30, 2006 in the Company’s common stock and in each of the indices, and assumes the reinvestment of all dividends. Historical stock price performance is not necessarily indicative of future stock price performance. The SNL Midcap Bank and Thrift index will replace the Hemscott Savings and Loan index going forward, as the Hemscott Savings and Loan index was discontinued in May 2011.
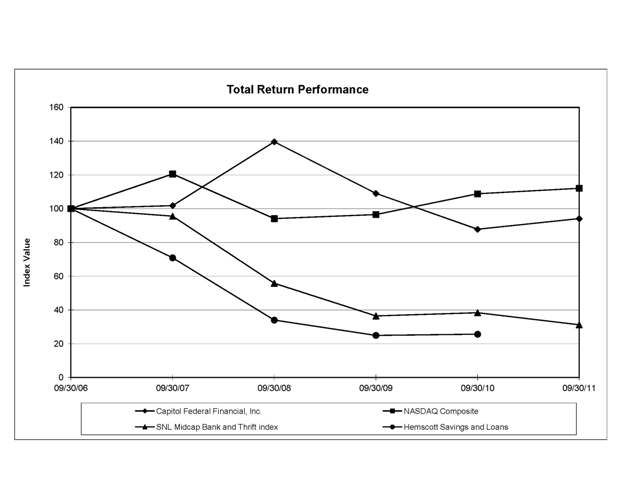
| Index | 2006 | 2007 | 2008 | 2009 | 2010 | 2011 |
| Capitol Federal Financial, Inc. | 100.00 | 101.79 | 139.57 | 109.03 | 87.77 | 94.06 |
| NASDAQ Composite | 100.00 | 120.52 | 94.10 | 96.49 | 108.79 | 112.05 |
| SNL Midcap Bank and Thrift index | 100.00 | 95.54 | 55.77 | 36.42 | 38.32 | 31.20 |
| Hemscott Savings and Loans | 100.00 | 70.86 | 33.99 | 24.94 | 25.62 | -- |
| | | | | | | |
MANAGEMENT’S REPORT ON INTERNAL CONTROL OVER FINANCIAL REPORTING
Management of the Company is responsible for establishing and maintaining adequate internal control over financial reporting (as defined in Rule 13a-15(e) and 15(d)-15(e) under the Securities Exchange Act of 1934, as amended, the “Act”). The Company’s internal control system is a process designed to provide reasonable assurance to the Company’s management and Board of Directors regarding the preparation and fair presentation of published financial statements.
The Company’s internal control over financial reporting includes policies and procedures that pertain to the maintenance of records that, in reasonable detail, accurately and fairly reflect transactions and dispositions of assets; provide reasonable assurances that transactions are recorded as necessary to permit preparation of financial statements in accordance with accounting principles generally accepted in the United States of America, and that receipts and expenditures are being made only in accordance with authorizations of management and the directors of the Company; and provide reasonable assurance regarding prevention or untimely detection of unauthorized acquisition, use or disposition of the Company’s assets that could have a material effect on the Company’s financial statements.
All internal control systems, no matter how well designed, have inherent limitations. Therefore, even those systems determined to be effective can provide only reasonable assurance with respect to financial reporting. Further, because of changes in conditions, the effectiveness of any system of internal control may vary over time. The design of any internal control system also factors in resource constraints and consideration for the benefit of the control relative to the cost of implementing the control. Because of these inherent limitations in any system of internal control, management cannot provide absolute assurance that all control issues and instances of fraud within the Company have been detected.
Management assessed the effectiveness of the Company’s internal control over financial reporting as of September 30, 2011. In making this assessment, management used the criteria set forth by the Committee of Sponsoring Organizations of the Treadway Commission in Internal Control - Integrated Framework. Management has concluded that the Company maintained an effective system of internal control over financial reporting based on these criteria as of September 30, 2011.
The Company’s independent registered public accounting firm, Deloitte & Touche LLP, who audited the consolidated financial statements included in the Company’s annual report, has issued an audit report on the Company’s internal control over financial reporting as of September 30, 2011 and it is included herein.
| |
| |
 |
| |
| John B. Dicus, Chairman, President |
| and Chief Executive Officer |
| |
| |
 |
| |
| Kent G. Townsend, Executive Vice President, |
| Chief Financial Officer and Treasurer |
| |
REPORT OF INDEPENDENT REGISTERED PUBLIC ACCOUNTING FIRM
To the Board of Directors and Stockholders of
Capitol Federal Financial, Inc. and subsidiary
Topeka, Kansas
We have audited the internal control over financial reporting of Capitol Federal Financial, Inc. and subsidiary (the “Company”) as of September 30, 2011, based on criteria established in Internal Control - Integrated Framework issued by the Committee of Sponsoring Organizations of the Treadway Commission. Because management’s assessment and our audit were conducted to meet the reporting requirements of Section 112 of the Federal Deposit Insurance Corporation Improvement Act (FDICIA), management’s assessment and our audit of the Company’s internal control over financial reporting included controls over the preparation of the schedules equivalent to the basic financial statements in accordance with the instructions for the Consolidated Financial Statements for Bank Holding Companies (Form FR Y-9C). The Company's management is responsible for maintaining effective internal control over financial reporting and for its assessment of the effectiveness of internal control over financial reporting, included in the accompanying Management’s Report on Internal Control over Financial Reporting. Our responsibility is to express an opinion on the Company's internal control over financial reporting based on our audit.
We conducted our audit in accordance with the standards of the Public Company Accounting Oversight Board (United States). Those standards require that we plan and perform the audit to obtain reasonable assurance about whether effective internal control over financial reporting was maintained in all material respects. Our audit included obtaining an understanding of internal control over financial reporting, assessing the risk that a material weakness exists, testing and evaluating the design and operating effectiveness of internal control based on the assessed risk, and performing such other procedures as we considered necessary in the circumstances. We believe that our audit provides a reasonable basis for our opinion.
A company's internal control over financial reporting is a process designed by, or under the supervision of, the company's principal executive and principal financial officers, or persons performing similar functions, and effected by the company's Board of Directors, management, and other personnel to provide reasonable assurance regarding the reliability of financial reporting and the preparation of financial statements for external purposes in accordance with generally accepted accounting principles. A company's internal control over financial reporting includes those policies and procedures that (1) pertain to the maintenance of records that, in reasonable detail, accurately and fairly reflect the transactions and dispositions of the assets of the company; (2) provide reasonable assurance that transactions are recorded as necessary to permit preparation of financial statements in accordance with generally accepted accounting principles, and that receipts and expenditures of the company are being made only in accordance with authorizations of management and directors of the company; and (3) provide reasonable assurance regarding prevention or timely detection of unauthorized acquisition, use, or disposition of the company's assets that could have a material effect on the financial statements.
Because of the inherent limitations of internal control over financial reporting, including the possibility of collusion or improper management override of controls, material misstatements due to error or fraud may not be prevented or detected on a timely basis. Also, projections of any evaluation of the effectiveness of the internal control over financial reporting to future periods are subject to the risk that the controls may become inadequate because of changes in conditions, or that the degree of compliance with the policies or procedures may deteriorate.
REPORT OF INDEPENDENT REGISTERED PUBLIC ACCOUNTING FIRM
In our opinion, the Company maintained, in all material respects, effective internal control over financial reporting as of September 30, 2011, based on the criteria established in Internal Control - Integrated Framework issued by the Committee of Sponsoring Organizations of the Treadway Commission.
We have also audited, in accordance with the standards of the Public Company Accounting Oversight Board (United States), the consolidated financial statements as of and for the year ended September 30, 2011 of the Company and our report dated November 29, 2011 expressed an unqualified opinion on those financial statements.
Kansas City, Missouri
November 29, 2011
REPORT OF INDEPENDENT REGISTERED PUBLIC ACCOUNTING FIRM
To the Board of Directors and Stockholders of
Capitol Federal Financial, Inc. and subsidiary
Topeka, Kansas
We have audited the accompanying consolidated balance sheets of Capitol Federal Financial, Inc. and subsidiary (the “Company”) as of September 30, 2011 and 2010, and the related consolidated statements of income, stockholders’ equity, and cash flows for each of the three years in the period ended September 30, 2011. These financial statements are the responsibility of the Company's management. Our responsibility is to express an opinion on these financial statements based on our audits.
We conducted our audits in accordance with the standards of the Public Company Accounting Oversight Board (United States). Those standards require that we plan and perform the audit to obtain reasonable assurance about whether the financial statements are free of material misstatement. An audit includes examining, on a test basis, evidence supporting the amounts and disclosures in the financial statements. An audit also includes assessing the accounting principles used and significant estimates made by management, as well as evaluating the overall financial statement presentation. We believe that our audits provide a reasonable basis for our opinion.
In our opinion, such consolidated financial statements present fairly, in all material respects, the financial position of Capitol Federal Financial, Inc. and subsidiary as of September 30, 2011 and 2010, and the results of its operations and its cash flows for each of the three years in the period ended September 30, 2011, in conformity with accounting principles generally accepted in the United States of America.
We have also audited, in accordance with the standards of the Public Company Accounting Oversight Board (United States), the Company's internal control over financial reporting as of September 30, 2011, based on the criteria established in Internal Control - Integrated Framework issued by the Committee of Sponsoring Organizations of the Treadway Commission, and our report dated November 29, 2011 expressed an unqualified opinion on the Company's internal control over financial reporting.
Kansas City, Missouri
November 29, 2011
| CAPITOL FEDERAL FINANCIAL, INC. AND SUBSIDIARY | | | | | | |
| | | | | | | |
| CONSOLIDATED BALANCE SHEETS | | | | | | |
| SEPTEMBER 30, 2011 and 2010 (Dollars in thousands) | |
| | | | | | | |
ASSETS | | 2011 | | | 2010 | |
| | | | | | | |
| CASH AND CASH EQUIVALENTS (includes interest-earning deposits of | | | | | | |
| $105,292 and $50,771) | | $ | 121,070 | | | $ | 65,217 | |
| | | | | | | | | |
| SECURITIES: | | | | | | | | |
| Available-for-sale (“AFS”), at fair value (amortized cost of $1,443,529 and $1,009,142) | | | 1,486,439 | | | | 1,060,366 | |
| Held-to-maturity (“HTM”), at cost (fair value of $2,434,392 and $1,913,454) | | | 2,370,117 | | | | 1,880,154 | |
| | | | | | | | | |
| LOANS RECEIVABLE, net (less allowance for credit losses “ACL” of | | | | | | | | |
| $15,465 and $14,892 ) | | | 5,149,734 | | | | 5,168,202 | |
| | | | | | | | | |
| BANK-OWNED LIFE INSURANCE (“BOLI”) | | | 56,534 | | | | 54,710 | |
| | | | | | | | | |
| CAPITAL STOCK OF FEDERAL HOME LOAN BANK (“FHLB”), at cost | | | 126,877 | | | | 120,866 | |
| | | | | | | | | |
| ACCRUED INTEREST RECEIVABLE | | | 29,316 | | | | 30,220 | |
| | | | | | | | | |
| PREMISES AND EQUIPMENT, net | | | 48,423 | | | | 41,260 | |
| | | | | | | | | |
| REAL ESTATE OWNED (“REO”), net | | | 11,321 | | | | 9,920 | |
| | | | | | | | | |
| INCOME TAXES RECEIVABLE, net | | | -- | | | | 716 | |
| | | | | | | | | |
| OTHER ASSETS | | | 50,968 | | | | 55,499 | |
| | | | | | | | | |
| TOTAL ASSETS | | $ | 9,450,799 | | | $ | 8,487,130 | |
| | | | | | | | | |
| | | | | | | (Continued) | |
| CAPITOL FEDERAL FINANCIAL, INC. AND SUBSIDIARY | | | | |
| | | | | | | |
| CONSOLIDATED BALANCE SHEETS | | | | | | |
| SEPTEMBER 30, 2011 and 2010 (Dollars in thousands) | |
| | | | | | | |
LIABILITIES AND STOCKHOLDERS’ EQUITY | | 2011 | | | 2010 | |
| | | | | | | |
| LIABILITIES: | | | | | | |
| Deposits | | $ | 4,495,173 | | | $ | 4,386,310 | |
| Advances from FHLB | | | 2,379,462 | | | | 2,348,371 | |
| Other borrowings | | | 515,000 | | | | 668,609 | |
| Advance payments by borrowers for taxes and insurance | | | 55,138 | | | | 55,036 | |
| Income taxes payable | | | 2,289 | | | | -- | |
| Deferred income tax liabilities, net | | | 20,447 | | | | 33,244 | |
| Accounts payable and accrued expenses | | | 43,761 | | | | 33,610 | |
| | | | | | | | | |
| Total liabilities | | | 7,511,270 | | | | 7,525,180 | |
| | | | | | | | | |
| COMMITMENTS AND CONTINGENCIES (NOTE 12) | | | | | | | | |
| | | | | | | | | |
| STOCKHOLDERS’ EQUITY: | | | | | | | | |
| Preferred stock, $.01 par value; 100,000,000 shares authorized, | | | | | | | | |
| no shares issued or outstanding | | | -- | | | | -- | |
| Common stock, $.01 par value; 1,400,000,000 shares authorized, | | | | | | | | |
| 167,498,133 shares issued; 167,498,133 and 73,992,678 shares | | | | | | | | |
| outstanding as of September 30, 2011 and 2010, respectively | | | 1,675 | | | | 915 | |
| Additional paid-in capital | | | 1,392,691 | | | | 457,795 | |
| Unearned compensation, Employee Stock Ownership Plan (“ESOP”) | | | (50,547 | ) | | | (6,050 | ) |
| Unearned compensation, Recognition and Retention Plan (“RRP”) | | | (124 | ) | | | (255 | ) |
| Retained earnings | | | 569,127 | | | | 801,044 | |
| Accumulated other comprehensive income (“AOCI”), net of tax | | | 26,707 | | | | 31,862 | |
| | | | | | | | | |
| | | | 1,939,529 | | | | 1,285,311 | |
| | | | | | | | | |
| Treasury stock, at cost, 0 and 17,519,609 shares as of | | | | | | | | |
| September 30, 2011 and 2010, respectively, at cost | | | -- | | | | (323,361 | ) |
| | | | | | | | | |
| Total stockholders’ equity | | | 1,939,529 | | | | 961,950 | |
| | | | | | | | | |
| TOTAL LIABILITIES AND STOCKHOLDERS’ EQUITY | | $ | 9,450,799 | | | $ | 8,487,130 | |
See notes to consolidated financial statements (Concluded)
| CAPITOL FEDERAL FINANCIAL, INC. AND SUBSIDIARY | | | | | | | | | |
| | | | | | | | | | |
| CONSOLIDATED STATEMENTS OF INCOME | | | | | | | | | |
| YEARS ENDED SEPTEMBER 30, 2011, 2010, and 2009 (Dollars in thousands, except per share data) | |
| | | | | | | | | | |
| | | 2011 | | | 2010 | | | 2009 | |
| INTEREST AND DIVIDEND INCOME: | | | | | | | | | |
| Loans receivable | | $ | 251,909 | | | $ | 282,307 | | | $ | 305,782 | |
| Mortgage-backed securities (“MBS”) | | | 71,332 | | | | 71,859 | | | | 97,926 | |
| Investment securities | | | 19,077 | | | | 15,682 | | | | 5,533 | |
| Capital stock of FHLB | | | 3,791 | | | | 3,966 | | | | 3,344 | |
| Cash and cash equivalents | | | 756 | | | | 237 | | | | 201 | |
| Total interest and dividend income | | | 346,865 | | | | 374,051 | | | | 412,786 | |
| | | | | | | | | | | | | |
| INTEREST EXPENSE: | | | | | | | | | | | | |
| FHLB advances | | | 90,298 | | | | 97,212 | | | | 106,551 | |
| Deposits | | | 63,568 | | | | 79,216 | | | | 100,471 | |
| Other borrowings | | | 24,265 | | | | 28,058 | | | | 29,122 | |
| Total interest expense | | | 178,131 | | | | 204,486 | | | | 236,144 | |
| | | | | | | | | | | | | |
| NET INTEREST INCOME | | | 168,734 | | | | 169,565 | | | | 176,642 | |
| | | | | | | | | | | | | |
| PROVISION FOR CREDIT LOSSES | | | 4,060 | | | | 8,881 | | | | 6,391 | |
| | | | | | | | | | | | | |
| NET INTEREST INCOME AFTER PROVISION | | | | | | | | | | | | |
| FOR CREDIT LOSSES | | | 164,674 | | | | 160,684 | | | | 170,251 | |
| | | | | | | | | | | | | |
| OTHER INCOME: | | | | | | | | | | | | |
| Retail fees and charges | | | 15,509 | | | | 17,789 | | | | 18,023 | |
| Insurance commissions | | | 3,071 | | | | 2,476 | | | | 2,440 | |
| Loan fees | | | 2,449 | | | | 2,592 | | | | 2,327 | |
Income from BOLI | | | 1,824 | | | | 1,202 | | | | 1,158 | |
| Gains on securities, net | | | -- | | | | 6,454 | | | | -- | |
| Other income, net | | | 2,142 | | | | 3,898 | | | | 4,646 | |
| Total other income | | | 24,995 | | | | 34,411 | | | | 28,594 | |
| | | | | | | | | | | (Continued) | |
| CAPITOL FEDERAL FINANCIAL, INC. AND SUBSIDIARY | | | |
| | | | | |
| CONSOLIDATED STATEMENTS OF INCOME | | | | |
| YEARS ENDED SEPTEMBER 30, 2011, 2010, and 2009 (Dollars in thousands, except per share data) |
| | | 2011 | | | 2010 | | | 2009 | |
| OTHER EXPENSES: | | | | | | | | | |
| Salaries and employee benefits | | | 44,913 | | | | 42,666 | | | | 43,318 | |
| Communications, information technology, and occupancy | | | 16,051 | | | | 15,554 | | | | 15,226 | |
| Regulatory and outside services | | | 5,224 | | | | 4,769 | | | | 4,318 | |
| Federal insurance premium | | | 5,222 | | | | 7,452 | | | | 7,558 | |
| Deposit and loan transaction costs | | | 5,157 | | | | 5,300 | | | | 5,434 | |
| Advertising and promotional | | | 3,723 | | | | 6,027 | | | | 6,918 | |
| Mortgage servicing activity, net | | | 2,434 | | | | 600 | | | | 3,148 | |
| Contribution to Capitol Federal Foundation (“Foundation”) | | | 40,000 | | | | -- | | | | -- | |
| Other expenses, net | | | 9,593 | | | | 7,362 | | | | 7,701 | |
| Total other expenses | | | 132,317 | | | | 89,730 | | | | 93,621 | |
| | | | | | | | | | | | | |
| INCOME BEFORE INCOME TAX EXPENSE | | | 57,352 | | | | 105,365 | | | | 105,224 | |
| | | | | | | | | | | | | |
| INCOME TAX EXPENSE | | | 18,949 | | | | 37,525 | | | | 38,926 | |
| | | | | | | | | | | | | |
| NET INCOME | | $ | 38,403 | | | $ | 67,840 | | | $ | 66,298 | |
| | | | | | | | | | | | | |
| | | | | | | | | | | | | |
| Basic earnings per share (“EPS”) | | $ | 0.24 | | | $ | 0.41 | | | $ | 0.40 | |
| Diluted EPS | | $ | 0.24 | | | $ | 0.41 | | | $ | 0.40 | |
| Dividends declared per public share | | $ | 1.63 | | | $ | 2.29 | | | $ | 2.11 | |
| | | | | | | | | | | | | |
| Basic weighted average common shares | | | 162,625,274 | | | | 165,862,176 | | | | 165,576,334 | |
| Diluted weighted average common shares | | | 162,632,665 | | | | 165,899,445 | | | | 165,721,176 | |
(Concluded)
See notes to consolidated financial statements
CAPITOL FEDERAL FINANCIAL, INC. AND SUBSIDIARY
CONSOLIDATED STATEMENTS OF STOCKHOLDERS’ EQUITY
YEARS ENDED SEPTEMBER 30, 2011, 2010, and 2009 (Dollars in thousands, except per share data)
| | | | | | Additional | | | Unearned | | | | | | | | | | | | Total | |
| | | Common | | | Paid-In | | | Compensation - | | | Retained | | | AOCI | | | Treasury | | | Stockholders’ | |
| | | Stock | | | Capital | | | ESOP | | | RRP | | | Earnings | | | (Loss) | | | Stock | | | Equity | |
| Balance at October 1, 2008 | | $ | 915 | | | $ | 445,391 | | | $ | (10,082 | ) | | $ | (553 | ) | | $ | 759,375 | | | $ | (5,968 | ) | | $ | (317,862 | ) | | $ | 871,216 | |
| | | | | | | | | | | | | | | | | | | | | | | | | | | | | | | | | |
| Comprehensive Income: | | | | | | | | | | | | | | | | | | | | | | | | | | | | | | | | |
| Net income, fiscal year 2009 | | | | | | | | | | | | | | | | | | | 66,298 | | | | | | | | | | | | 66,298 | |
| Changes in unrealized gain/losses on | | | | | | | | | | | | | | | | | | | | | | | | | | | | | | | | |
| securities AFS, net of deferred | | | | | | | | | | | | | | | | | | | | | | | | | | | | | | | | |
| income tax $24,210 | | | | | | | | | | | | | | | | | | | | | | | 39,838 | | | | | | | | 39,838 | |
| Total comprehensive income | | | | | | | | | | | | | | | | | | | | | | | | | | | | | | | 106,136 | |
| | | | | | | | | | | | | | | | | | | | | | | | | | | | | | | | | |
| ESOP activity, net | | | | | | | 5,913 | | | | 2,016 | | | | | | | | | | | | | | | | | | | | 7,929 | |
| RRP activity, net | | | | | | | 131 | | | | | | | | (100 | ) | | | | | | | | | | | 24 | | | | 55 | |
| Stock based compensation | | | | | | | | | | | | | | | | | | | | | | | | | | | | | | | | |
| - stock options and RRP | | | | | | | 281 | | | | | | | | 323 | | | | | | | | | | | | | | | | 604 | |
| Acquisition of treasury stock | | | | | | | | | | | | | | | | | | | | | | | | | | | (2,426 | ) | | | (2,426 | ) |
| Stock options exercised | | | | | | | 1,156 | | | | | | | | | | | | | | | | | | | | 697 | | | | 1,853 | |
| Dividends on common stock to | | | | | | | | | | | | | | | | | | | | | | | | | | | | | | | | |
| stockholders ($2.11 per public share) | | | | | | | | | | | | | | | | | | | (44,069 | ) | | | | | | | | | | | (44,069 | ) |
| Balance at September 30, 2009 | | | 915 | | | | 452,872 | | | | (8,066 | ) | | | (330 | ) | | | 781,604 | | | | 33,870 | | | | (319,567 | ) | | | 941,298 | |
| | | | | | | | | | | | | | | | | | | | | | | | | | | | | | | | | |
| Comprehensive Income: | | | | | | | | | | | | | | | | | | | | | | | | | | | | | | | | |
| Net income, fiscal year 2010 | | | | | | | | | | | | | | | | | | | 67,840 | | | | | | | | | | | | 67,840 | |
| Changes in unrealized gain/losses on | | | | | | | | | | | | | | | | | | | | | | | | | | | | | | | | |
| securities AFS, net of deferred | | | | | | | | | | | | | | | | | | | | | | | | | | | | | | | | |
| income tax $1,221 | | | | | | | | | | | | | | | | | | | | | | | (2,008 | ) | | | | | | | (2,008 | ) |
| Total comprehensive income | | | | | | | | | | | | | | | | | | | | | | | | | | | | | | | 65,832 | |
| | | | | | | | | | | | | | | | | | | | | | | | | | | | | | | | | |
| ESOP activity, net | | | | | | | 4,465 | | | | 2,016 | | | | | | | | | | | | | | | | | | | | 6,481 | |
| RRP activity, net | | | | | | | 123 | | | | | | | | (163 | ) | | | | | | | | | | | 47 | | | | 7 | |
| Stock based compensation | | | | | | | | | | | | | | | | | | | | | | | | | | | | | | | | |
| - stock options and RRP | | | | | | | 214 | | | | | | | | 238 | | | | | | | | | | | | | | | | 452 | |
| Acquisition of treasury stock | | | | | | | | | | | | | | | | | | | | | | | | | | | (4,019 | ) | | | (4,019 | ) |
| Stock options exercised | | | | | | | 121 | | | | | | | | | | | | | | | | | | | | 178 | | | | 299 | |
| Dividends on common stock to | | | | | | | | | | | | | | | | | | | | | | | | | | | | | | | | |
| stockholders ($2.29 per public share) | | | | | | | | | | | | | | | | | | | (48,400 | ) | | | | | | | | | | | (48,400 | ) |
| Balance at September 30, 2010 | | | 915 | | | | 457,795 | | | | (6,050 | ) | | | (255 | ) | | | 801,044 | | | | 31,862 | | | | (323,361 | ) | | | 961,950 | |
| | | | | | | | | | | | | | | | | | | | | | | | | | | | | | | | | |
| | | | | | | | | | | | | | | | | | | | | | | | | | | | | | | (Continued) | |
CAPITOL FEDERAL FINANCIAL, INC. AND SUBSIDIARY
CONSOLIDATED STATEMENTS OF STOCKHOLDERS’ EQUITY
YEARS ENDED SEPTEMBER 30, 2011, 2010, and 2009 (Dollars in thousands, except per share data)
| | | | | | Additional | | | Unearned | | | | | | | | | | | | Total | |
| | | Common | | | Paid-In | | | Compensation - | | | Retained | | | AOCI | | | Treasury | | | Stockholders’ | |
| | | Stock | | | Capital | | | ESOP | | | RRP | | | Earnings | | | (Loss) | | | Stock | | | Equity | |
| Comprehensive Income: | | | | | | | | | | | | | | | | | | | | | | | | |
| Net income, fiscal year 2011 | | | | | | | | | | | | | | | 38,403 | | | | | | | | | | 38,403 | |
| Changes in unrealized gain/losses on | | | | | | | | | | | | | | | | | | | | | | | | | | |
| securities AFS, net of deferred | | | | | | | | | | | | | | | | | | | | | | | | | | |
| income tax $3,159 | | | | | | | | | | | | | | | | | | | (5,155 | ) | | | | | | (5,155 | ) |
| Total comprehensive income | | | | | | | | | | | | | | | | | | | | | | | | | | 33,248 | |
| | | | | | | | | | | | | | | | | | | | | | | | | | | | |
| ESOP activity, net | | | | | | 3,259 | | | | 2,763 | | | | | | | | | | | | | | | | | | 6,022 | |
| RRP activity, net | | | | | | (4 | ) | | | | | | | | | | | | | | | | | | | | | (4 | ) |
| Stock based compensation | | | | | | | | | | | | | | | | | | | | | | | | | | | | | |
| - stock options and RRP | | | | | | 131 | | | | | | | | 131 | | | | | | | | | | | | | | | 262 | |
| Acquisition of treasury stock | | | | | | | | | | | | | | | | | | | | | | | | | | | | | -- | |
| Stock options exercised | | | | | | 42 | | | | | | | | | | | | | | | | | | | | | | | 42 | |
| Dividends on common stock to | | | | | | | | | | | | | | | | | | | | | | | | | | | | | | |
| stockholders ($1.63 per public share) | | | | | | | | | | | | | | | | | | (150,110 | ) | | | | | | | | | | (150,110 | ) |
| | | | | | | | | | | | | | | | | | | | | | | | | | | | | | | |
| Corporate reorganization: | | | | | | | | | | | | | | | | | | | | | | | | | | | | | | |
| Merger of Capitol Federal | | | | | | | | | | | | | | | | | | | | | | | | | | | | | | |
| Savings Bank MHC | | | (522 | ) | | | 1,997 | | | | | | | | | | | | (1,223 | ) | | | | | | | | | | 252 | |
| Retirement of treasury stock | | | (175 | ) | | | (204,199 | ) | | | | | | | | | | | (118,987 | ) | | | | | | | 323,361 | | | | -- | |
| Exchange of common stock | | | 276 | | | | (323 | ) | | | | | | | | | | | | | | | | | | | | | | | (47 | ) |
| Proceeds from stock offering, | | | | | | | | | | | | | | | | | | | | | | | | | | | | | | | | |
| net of offering expenses | | | 1,181 | | | | 1,133,993 | | | | | | | | | | | | | | | | | | | | | | | | 1,135,174 | |
| | | | | | | | | | | | | | | | | | | | | | | | | | | | | | | | | |
| Purchase of common stock by ESOP | | | | | | | | | | | (47,260 | ) | | | | | | | | | | | | | | | | | | | (47,260 | ) |
| Balance at September 30, 2011 | | $ | 1,675 | | | $ | 1,392,691 | | | $ | (50,547 | ) | | $ | (124 | ) | | $ | 569,127 | | | $ | 26,707 | | | $ | -- | | | $ | 1,939,529 | |
See notes to consolidated financial statements (Concluded)
| CAPITOL FEDERAL FINANCIAL, INC. AND SUBSIDIARY | |
| | |
| CONSOLIDATED STATEMENTS OF CASH FLOWS | |
| YEARS ENDED SEPTEMBER 30, 2011, 2010, AND 2009 (Dollars in thousands) | |
| | | 2011 | | | 2010 | | | 2009 | |
| CASH FLOWS FROM OPERATING ACTIVITIES: | | | | | | | | | |
| Net income | | $ | 38,403 | | | $ | 67,840 | | | $ | 66,298 | |
| Adjustments to reconcile net income to net cash provided by | | | | | | | | | | | | |
| operating activities: | | | | | | | | | | | | |
| FHLB stock dividends | | | (3,791 | ) | | | (3,966 | ) | | | (3,344 | ) |
| Provision for credit losses | | | 4,060 | | | | 8,881 | | | | 6,391 | |
| Originations of loans receivable held-for-sale (“LHFS”) | | | (11,715 | ) | | | (47,488 | ) | | | (851 | ) |
| Proceeds from sales of LHFS | | | 13,483 | | | | 46,140 | | | | 97,838 | |
| Amortization and accretion of premiums and discounts on securities | | | 8,100 | | | | 5,940 | | | | 2,644 | |
| Depreciation and amortization of premises and equipment | | | 4,397 | | | | 4,584 | | | | 5,132 | |
| Amortization of deferred amounts related to FHLB advances, net | | | 7,091 | | | | 6,676 | | | | 3,829 | |
| Common stock committed to be released for allocation - ESOP | | | 6,022 | | | | 6,481 | | | | 7,929 | |
| Stock based compensation - stock options and RRP | | | 262 | | | | 452 | | | | 604 | |
| Provision for deferred income taxes | | | (9,647 | ) | | | 3,466 | | | | 3,548 | |
| Gain on the sale of trading securities received in the loan swap transaction | | | -- | | | | (6,454 | ) | | | -- | |
| Changes in: | | | | | | | | | | | | |
| Prepaid federal insurance premium, net | | | 4,718 | | | | (20,447 | ) | | | -- | |
| Accrued interest receivable | | | 904 | | | | 2,420 | | | | 1,064 | |
| Other assets, net | | | 637 | | | | (7,035 | ) | | | 837 | |
| Income taxes payable/receivable | | | 3,004 | | | | (6,697 | ) | | | 8 | |
| Accounts payable and accrued expenses | | | (143 | ) | | | (1,631 | ) | | | (1,209 | ) |
| Net cash provided by operating activities | | | 65,785 | | | | 59,162 | | | | 190,718 | |
| | | | | | | | | | | | | |
| CASH FLOWS FROM INVESTING ACTIVITIES: | | | | | | | | | | | | |
| Proceeds from sale of trading securities received in the loan swap transaction | | | -- | | | | 199,144 | | | | -- | |
| Purchase of AFS securities | | | (790,083 | ) | | | -- | | | | (424,498 | ) |
| Purchase of HTM securities | | | (1,979,789 | ) | | | (1,662,009 | ) | | | (215,263 | ) |
| Proceeds from calls, maturities and principal reductions of AFS securities | | | 351,636 | | | | 557,141 | | | | 396,101 | |
| Proceeds from calls, maturities and principal reductions of HTM securities | | | 1,485,786 | | | | 628,350 | | | | 208,591 | |
| Proceeds from the redemption of capital stock of FHLB | | | 4,942 | | | | 16,185 | | | | 3,688 | |
| Purchases of capital stock of FHLB | | | (7,162 | ) | | | (21 | ) | | | (9,002 | ) |
| Loan originations and purchases, net of principal collected | | | | | | | | | | | | |
| and deferred loan fees | | | (105 | ) | | | 219,628 | | | | (394,785 | ) |
| Purchases of premises and equipment | | | (12,751 | ) | | | (8,183 | ) | | | (13,053 | ) |
| Proceeds from sales of REO | | | 14,205 | | | | 11,273 | | | | 7,669 | |
| Net cash used in investing activities | | | (933,321 | ) | | | (38,492 | ) | | | (440,552 | ) |
| | | | | | | | | | | | | |
| | | | | | | | | | | (Continued) | |
| CAPITOL FEDERAL FINANCIAL, INC. AND SUBSIDIARY | |
| | |
| CONSOLIDATED STATEMENTS OF CASH FLOWS | |
| YEARS ENDED SEPTEMBER 30, 2011, 2010, AND 2009 (Dollars in thousands) | |
| | | | | | | | | | |
| | | 2011 | | | 2010 | | | 2009 | |
| CASH FLOWS FROM FINANCING ACTIVITIES: | | | | | | | | | |
| Dividends paid | | | (150,110 | ) | | | (48,400 | ) | | | (44,069 | ) |
| Deposits, net of withdrawals | | | 126,553 | | | | 157,701 | | | | 304,726 | |
| Proceeds from borrowings | | | 644,162 | | | | 300,000 | | | | 1,561,612 | |
| Repayments on borrowings | | | (773,771 | ) | | | (395,000 | ) | | | (1,581,612 | ) |
| Deferred FHLB prepayment penalty | | | -- | | | | (875 | ) | | | (38,388 | ) |
| Change in advance payments by borrowers for taxes and insurance | | | 102 | | | | (331 | ) | | | 2,154 | |
| Net proceeds from common stock offering (deferred offering costs) | | | 1,076,411 | | | | (5,982 | ) | | | -- | |
| Acquisitions of treasury stock | | | -- | | | | (4,019 | ) | | | (2,426 | ) |
| Stock options exercised | | | 35 | | | | 210 | | | | 1,337 | |
| Excess tax benefits from stock options | | | 7 | | | | 89 | | | | 516 | |
| Net cash provided by financing activities | | | 923,389 | | | | 3,393 | | | | 203,850 | |
| | | | | | | | | | | | | |
| NET INCREASE (DECREASE) IN CASH AND CASH EQUIVALENTS | | | 55,853 | | | | 24,063 | | | | (45,984 | ) |
| | | | | | | | | | | | | |
| CASH AND CASH EQUIVALENTS: | | | | | | | | | | | | |
| Beginning of Period | | | 65,217 | | | | 41,154 | | | | 87,138 | |
| | | | | | | | | | | | | |
| End of Period | | $ | 121,070 | | | $ | 65,217 | | | $ | 41,154 | |
| | | | | | | | | | | | | |
| SUPPLEMENTAL DISCLOSURES OF CASH FLOW INFORMATION: | | | | | | | | | | | | |
| Income tax payments | | $ | 25,517 | | | $ | 40,664 | | | $ | 35,334 | |
| | | | | | | | | | | | | |
| Interest payments | | $ | 172,332 | | | $ | 199,433 | | | $ | 236,137 | |
| | | | | | | | | | | | | |
| SUPPLEMENTAL DISCLOSURE OF NONCASH INVESTING | | | | | | | | | | | | |
| AND FINANCING ACTIVITIES: | | | | | | | | | | | | |
| Note received from ESOP in exchange for common stock | | $ | 47,260 | | | $ | -- | | | $ | -- | |
| | | | | | | | | | | | | |
| Customer deposit holds related to common stock offering | | $ | 17,690 | | | $ | -- | | | $ | -- | |
| | | | | | | | | | | | | |
| Commitment to fund low-income housing partnerships | | $ | 9,618 | | | $ | -- | | | $ | -- | |
| | | | | | | | | | | | | |
| Loans transferred to REO | | $ | 15,048 | | | $ | 13,717 | | | $ | 10,730 | |
| | | | | | | | | | | | | |
| Transfer of loans receivable to LHFS, net | | $ | -- | | | $ | -- | | | $ | 94,672 | |
| | | | | | | | | | | | | |
| Swap of loans for trading securities | | $ | -- | | | $ | 193,889 | | | $ | -- | |
| | | | | | | | | | | | | |
| See notes to consolidated financial statements. | | | | | | | | | | (Concluded) | |
CAPITOL FEDERAL FINANCIAL, INC. AND SUBSIDIARY
NOTES TO CONSOLIDATED FINANCIAL STATEMENTS
YEARS ENDED SEPTEMBER 30, 2011, 2010, and 2009
| 1. | SUMMARY OF SIGNIFICANT ACCOUNTING POLICIES |
Description of Business - Capitol Federal Financial, Inc. (the “Company”) provides a full range of retail banking services through its wholly-owned subsidiary, Capitol Federal Savings Bank (the “Bank”) which has 35 traditional and 10 in-store banking offices serving primarily the metropolitan areas of Topeka, Wichita, Lawrence, Manhattan, Emporia and Salina, Kansas and portions of the metropolitan area of greater Kansas City. The Bank emphasizes mortgage lending, primarily originating and purchasing one- to four-family mortgage loans and providing personal retail financial services. The Bank is subject to competition from other financial institutions and other companies that provide financial services.
On July 21, 2010, the Dodd-Frank Wall Street Reform and Consumer Protection Act (the “Dodd-Frank Act”) was signed into law. The Dodd-Frank Act, among other things, required the Office of Thrift Supervision (the “OTS”) to be merged into the Office of the Comptroller of the Currency (the “OCC”). On July 21, 2011, the OCC assumed all functions and authority from the OTS relating to federally chartered savings banks, and the Board of Governors of the Federal Reserve System (“FRB”) assumed all functions and authority from the OTS relating to savings and loan holding companies. Effective July 21, 2011, the Bank is regulated by the OCC and the Company is regulated by the FRB. Prior to that date, the Bank and Company were regulated by the OTS. The Bank is also regulated by the Federal Deposit Insurance Corporation (the “FDIC”). The Bank and Company are subject to periodic examinations by the above noted regulatory authorities.
The Bank has an expense sharing agreement with the Company that covers the reimbursement of certain expenses that are allocable to the Company. These expenses include compensation, rent for leased office space, and general overhead expenses.
The Company and its subsidiary have a tax allocation agreement. The Bank is the paying agent to the taxing authorities for the group for all periods presented. Each company is liable for taxes as if separate tax returns were filed and reimburses the Bank for its related tax liability. If any entity has a tax benefit due to a taxable loss, the Bank reimburses the entity for the related tax benefit.
The Company’s ability to pay dividends is dependent, in part, upon its ability to obtain capital distributions from the Bank. The future dividend policy of the Company is subject to the discretion of the Board of Directors and will depend upon a number of factors, including the Company’s financial condition and results of operations, the Bank’s regulatory capital requirements, regulatory limitations on the Bank’s ability to make capital distributions to the Company, and the amount of cash at the holding company. Holders of common stock will be entitled to receive dividends as of and when declared by the Board of Directors of the Company out of funds legally available for that purpose.
Basis of Presentation - In December 2010, Capitol Federal Financial completed its conversion from a mutual holding company form of organization to a stock form of organization (“corporate reorganization”). Capitol Federal Financial, which owned 100% of the Bank, was succeeded by the Company, a new Maryland corporation. As part of the corporate reorganization, Capitol Federal Savings Bank MHC’s (“MHC”) ownership interest in Capitol Federal Financial was sold in a public offering. Gross proceeds from the offering were $1.18 billion and related offering expenses were $46.7 million, of which $6.0 million were incurred and deferred in fiscal year 2010. The publicly held shares of Capitol Federal Financial were exchanged for new shares of common stock of the Company. The exchange ratio was 2.2637 and ensured that immediately after the corporate reorganization the public stockholders of Capitol Federal Financial owned the same aggregate percentage of the Company’s common stock that they owned of Capitol Federal Financial’s common stock immediately prior to the reorganization. All share information used to calculate EPS in the consolidated financial statements prior to the corporate reorganization has been revised to reflect the 2.2637 exchange ratio. In conjunction with the corporate reorganization, the Company contributed $40.0 million of cash to the Bank’s charitable foundation, Capitol Federal Foundation. Additionally, a “liquidation account” has been established for the benefit of certain depositors of the Bank in an amount equal to MHC’s ownership interest in the retained earnings of Capitol Federal Financial as of June 30, 2010. As of September 30, 2011, the balance of the liquidation account was $405.4 million. Under OCC regulations, neither the Company nor the Bank is permitted to pay dividends on its capital stock to its stockholders if stockholders’ equity would be reduced below the current amount of the liquidation account at that time.
The consolidated financial statements after the corporate reorganization in December 2010 include the accounts of the Company and its wholly owned subsidiary, the Bank. The consolidated financial statements prior to the corporate reorganization include the accounts of Capitol Federal Financial and its wholly owned subsidiary, the Bank. The Bank has a wholly owned subsidiary, Capitol Funds, Inc. Capitol Funds, Inc. has a wholly owned subsidiary, Capitol Federal Mortgage Reinsurance Company. All intercompany accounts and transactions have been eliminated.
These consolidated financial statements have been prepared in conformity with accounting principles generally accepted in the United States of America (“GAAP”), and require management to make estimates and assumptions that affect the reported amounts of assets and liabilities and disclosure of contingent assets and liabilities at the date of the financial statements and the reported amounts of revenues and expenses during the reporting periods. The ACL is a significant estimate that involves a high degree of complexity and requires management to make difficult and subjective judgments and assumptions about highly uncertain matters. The use of different judgments and assumptions could cause reported results to differ significantly. In addition, bank regulators periodically review the Bank’s ACL. The bank regulators have the ability to require the Bank, as they can require all banks, to increase the ACL or recognize additional charge-offs based upon their judgments, which may differ from management’s judgments. Any increases in the ACL or recognition of additional charge-offs required by bank regulators could adversely affect the Company’s financial condition and results of operations.
Cash and Cash Equivalents - Cash and cash equivalents include cash on hand and amounts due from banks. The Bank has acknowledged informal agreements with other banks where it maintains deposits. Under these agreements, service fees charged to the Bank are waived provided certain average compensating balances are maintained throughout each month. FRB regulations require federally chartered savings banks to maintain cash reserves against their transaction accounts. Required reserves must be maintained in the form of vault cash, an account at a Federal Reserve Bank, or a pass-through account as defined by the FRB. The Bank is in compliance with the FRB requirements. For the years ended September 30, 2011 and 2010, the average daily balance of required reserves at the Federal Reserve Bank was $9.3 million and $9.7 million, respectively.
Securities - Securities include mortgage-backed and agency securities issued primarily by United States Government-Sponsored Enterprises (“GSE”), including Federal National Mortgage Association (“FNMA”), Federal Home Loan Mortgage Corporation (“FHLMC”) and FHLB, United States Government agencies, including Government National Mortgage Association (“GNMA”), and municipal bonds. Securities are classified as HTM, AFS, or trading based on management’s intention on the date of purchase. Generally, classifications are made in response to liquidity needs, asset/liability management strategies, and the market interest rate environment at the time of purchase.
Securities that management has the intent and ability to hold to maturity are classified as HTM and reported at amortized cost. Such securities are adjusted for the amortization of premiums and discounts which are recognized as adjustments to interest income over the life of the securities using the level-yield method.
Securities that management may sell if necessary for liquidity or asset management purposes are classified as AFS and reported at fair value, with unrealized gains and losses reported as a component of accumulated other comprehensive income (loss) within stockholders’ equity, net of deferred income taxes. The amortization of premiums and discounts are recognized as adjustments to interest income over the life of the securities using the level-yield method. Gains or losses on the disposition of AFS securities are recognized using the specific identification method. Estimated fair values of AFS securities are based on one of three methods: 1) quoted market prices where available, 2) quoted market prices for similar instruments if quoted market prices are not available, and 3) unobservable data that represents the Bank’s assumptions about items that market participants would consider in determining fair value where no market data is available. See additional discussion of fair value of AFS securities in Note 14.
Securities that are purchased and held principally for resale in the near future are classified as trading securities and are reported at fair value, with unrealized gains and losses included in other income in the consolidated statements of income. During fiscal year 2010, the Bank held trading securities for a limited time. The securities were received in conjunction with the swap of originated fixed-rate mortgage loans with FHLMC for MBS. During the fiscal year ended September 30, 2011, neither the Company nor the Bank maintained a trading securities portfolio.
Management monitors the securities portfolio for impairment on an ongoing basis and performs a formal review quarterly. The process involves monitoring market events and other items that could impact issuers. The evaluation includes, but is not limited to, such factors as: the nature of the investment, the length of time the security has had a fair value less than the amortized cost basis, the cause(s) and severity of the loss, expectation of an anticipated recovery period, recent events specific to the issuer or industry including the issuer’s financial condition and current ability to make future payments in a timely manner, external credit ratings and recent downgrades in such ratings, management’s intent to sell and whether it is more likely than not management would be required to sell prior to recovery for debt securities. Management determines whether other-than-temporary losses should be recognized for impaired securities by assessing all known facts and circumstances surrounding the securities. If management intends to sell an impaired security or if it is more likely than not that management will be required to sell an impaired security before recovery of its amortized cost basis, an other-than-temporary impairment has occurred and the difference between amortized cost and fair value will be recognized as a loss in earnings and the security will be written down to fair value. Such losses would be included in other income in the consolidated statements of income.
Loans Receivable - Loans receivable that management has the intent and ability to hold for the foreseeable future are carried at the amount of unpaid principal, net of ACL, undisbursed loan funds, unamortized premiums and discounts, and deferred loan origination fees and costs. Net loan origination fees and costs and premiums and discounts are amortized as yield adjustments to interest income using the level-yield method, adjusted for the estimated prepayment speeds of the related loans when applicable. Interest on loans is credited to income as earned and accrued only if deemed collectible.
A loan is considered delinquent when payment has not been received within 30 days of its contractual due date. The accrual of income on loans is discontinued when interest or principal payments are 90 days in arrears. Loans on which the accrual of income has been discontinued are designated as non-accrual loans and outstanding interest previously credited beyond 90 days delinquent is reversed. A non-accrual loan is returned to accrual status once the contractual payments have been made to bring the loan less than 90 days past due.
Existing loan customers, whose loans have not been sold to third parties and who have not been delinquent on their contractual loan payments during the previous 12 months have the opportunity, for a fee, to endorse their original loan terms to current loan terms being offered. The fee assessed for endorsing the mortgage loan is deferred and amortized over the remaining life of the endorsed loan using the level-yield method and is reflected as an adjustment to interest income. Each endorsement is examined on a loan-by-loan basis and if the new loan terms represent more than a minor change to the loan, then the unamortized balance of the pre-endorsement deferred fees and/or costs associated with the mortgage loan are recognized in interest income at the time of the endorsement. If the endorsement of terms does not represent more than a minor change to the loan, then the unamortized balance of the pre-endorsement deferred fees or costs continue to be deferred.
For borrowers experiencing financial difficulties, the Bank may grant a concession to the borrower. Generally, the Bank grants a short-term payment accommodation to borrowers that are experiencing a temporary cash flow problem. The most frequently used accommodation is to reduce the monthly payment amount for a period of six to 12 months, often by requiring payments of only interest and escrow during this period. These restructurings result in an extension of the maturity date of the loan. For more severe situations requiring long-term solutions, the Bank also offers interest rate reductions to currently-offered rates and more lengthy extensions of the maturity date. All such concessions are considered a troubled debt restructuring (“TDR”). The Bank does not forgive principal or interest nor does it commit to lend additional funds to debtors whose terms have been modified in TDRs.
The Company adopted Accounting Standards Update (“ASU”) No. 2011-02, Receivables (Topic 310): A Creditor's Determination of Whether a Restructuring Is a Troubled Debt Restructuring, (ASU 2011-02) on July 1, 2011. ASU No. 2011-02 provides additional guidance to creditors for evaluating whether a restructuring of a loan is a TDR. In evaluating whether a loan restructuring constitutes a TDR, a creditor must separately conclude that the restructuring constitutes a concession to the borrower and the borrower is experiencing financial difficulties.
As a result of adopting the ASU, management reassessed all restructurings that occurred on or after October 1, 2010, for identification as TDRs. Management identified certain endorsed loans that are now required to be reported as TDRs due to decreases in soft credit scores and/or estimated loan-to-value (“LTV”) ratios since the time the loan was originated. Because of these decreases, the borrower could be experiencing financial difficulties even though they have not been delinquent in the previous 12 months on their existing loan payments. These loans had been measured under the general valuation allowance methodology, prior to the adoption of ASU 2011-02. Upon adoption, management classified the loans as impaired and began measuring the loans under the specific valuation allowance (“SVA”) methodology. Management will continue to apply the SVA methodology to these loans as long as they are classified as impaired.
Additionally, management identified certain loan restructurings that occurred on or after October 1, 2010, where the loan restructurings resulted in an insignificant delay in the timing of the loan principal payments. The deferral period for these restructured loans was six months or less and any reduction in the principal value of cash flows as a result of the restructuring was due to the insignificant delay in the timing of principal payments. The Bank did not forgive any interest or principal in association with these restructurings. Upon adoption, management began measuring these loans under the general valuation allowance methodology.
A loan is considered impaired when, based on current information and events, it is probable that the Bank will be unable to collect all amounts due, including principal and interest, according to the contractual terms of the loan agreement. Interest income on impaired loans is recognized in the period collected unless the ultimate collection of principal is considered doubtful. Management considers the following loans to be impaired loans: all non-accrual loans, loans classified as substandard, loans with SVAs, and TDRs that have not been performing under the new terms for 12 consecutive months or are required by the accounting literature to be classified as a TDR for the life of the loan due to a reduction in the stated interest rate to a rate lower than the current market rate for new debt with similar risk.
Allowance for Credit Losses - The ACL represents management’s best estimate of the amount of known and inherent losses in the loan portfolio as of the balance sheet date. Management’s methodology for assessing the appropriateness of the ACL consists of a formula analysis for general valuation allowances and the establishment of SVAs for identified problem loans. Management maintains the ACL through provisions for credit losses that are charged to income.
For one- to four-family loans, losses are charged-off when a loan is transferred to REO or if there is a short-sale of the collateral. For consumer home equity loans where the Bank holds the first mortgage, if the loan balance is in excess of the fair value and the loan is in foreclosure, the difference between the loan balances and the fair value is charged-off. Estimated selling costs and private mortgage insurance (“PMI”) proceeds are also taken into consideration when calculating the amount to charge-off for home equity loans. For consumer home equity loans where the Bank does not hold the first mortgage, foreclosure is pursued or the loan balance is charged-off. Other consumer loans that are unsecured are entirely charged-off once the loan is 120 days past due. For multi-family and commercial loans, the Bank records an SVA when it is determined that the collection of all or a portion of a loan may not be collected and the amount of that loss is reasonably estimated.
The Bank’s primary lending emphasis is the origination and purchase of one- to four-family first mortgage loans on residential properties and, to a lesser extent, second mortgage loans on one- to four-family residential properties, resulting in a loan concentration in residential mortgage loans. The Bank has a concentration of loans secured by residential property located in Kansas and Missouri. Based on the composition of the Bank’s loan portfolio, the primary risks inherent in the one- to four-family and consumer loan portfolios are the continued weakened economic conditions, continued high levels of unemployment or underemployment, and a continuing decline in residential real estate values. Any one or a combination of these events may adversely affect borrowers’ ability to repay their loans, resulting in increased delinquencies, non-performing assets, loan losses, and future loan loss provisions. Although the multi-family and commercial loan portfolio also shares the risk of continued weakened economic conditions, the primary risks for this portfolio include the ability of the borrower to sustain sufficient cash flows from leases and to control expenses to satisfy their contractual debt payments, or the ability to utilize personal and/or business resources to pay their contractual debt payments if the cash flows are not sufficient. Additionally, if the Bank were to repossess the secured collateral of a multi-family or commercial loan, the pool of potential buyers is limited more than that for a residential property; therefore, the Bank could hold the property for an extended period of time and potentially be forced to sell at a discounted price, resulting in additional losses.
Management considers several quantitative and qualitative factors quarterly while monitoring the credit quality of the loan portfolio and evaluating the adequacy of the ACL. Such factors include: the trend and composition of delinquent and non-performing loans, the results of foreclosed property and short-sale transactions (historical losses and net charge-offs), increase in and establishment of SVAs, the current status and trends of local and national economies, the trends and current conditions in the residential real estate markets, and loan portfolio growth and concentrations.
Since the Bank’s loan portfolio is primarily concentrated in one- to four-family real estate, management monitors residential real estate market value trends in the Bank’s local market areas and geographic sections of the U.S. by reference to various industry and market reports, economic releases and surveys, and management’s general and specific knowledge of the real estate markets in which the Bank lends, in order to determine what impact, if any, such trends may have on the level of ACL. Reviewing these quantitative and qualitative factors assists management in evaluating the overall credit quality of the loan portfolio and the reasonableness of the ACL on an ongoing basis, and whether changes need to be made to the Bank’s allowance for credit loss methodology. Management seeks to apply the ACL methodology in a consistent manner; however, the methodology can be modified in response to changing conditions. There were no significant modifications to the formula analysis methodology during the year ended September 30, 2011.
The formula analysis for general valuation allowances is updated each quarter. Within the formula analysis, the loan portfolio is segregated into the following categories: one- to four-family loans, multi-family and commercial loans, consumer home equity loans, and other consumer loans. Home equity loans with the same underlying collateral as a one- to four-family loan are combined with the one- to four-family loan in the formula analysis to calculate a combined LTV ratio. Impaired loans are excluded from the formula analysis as they are individually evaluated for SVAs. The one- to four-family loan portfolio and related home equity loans are segregated into additional categories based on the following risk characteristics: originated or purchased from a nationwide lender, interest payments (fixed-rate, adjustable-rate, and interest-only), LTV ratios, borrower’s credit scores, and geographic location. The categories were derived by management based on reviewing the historical performance of the one- to four-family loan portfolio and taking into consideration current economic conditions, such as trends in residential real estate values in certain areas of the U.S. and unemployment rates. The geographic location category pertains primarily to certain states in which the Bank has experienced measurable losses on REO and short-sales.
Quantitative loss factors are applied to each loan category in the formula analysis based on the historical loss experience and current SVAs, adjusted for loan delinquency trends, for each respective loan category. Each quarter, management reviews the historical loss time periods and utilizes the historical loss time periods believed to be the most reflective of the current economic conditions and recent charge-off experience for each respective loan category.
Qualitative loss factors are applied to each loan category in the formula analysis. The qualitative factors for the one- to four-family and consumer loan portfolios are: unemployment rate trends, collateral value trends, credit score trends, and delinquent loan trends. The qualitative factors for the multi-family and commercial loan portfolio are: unemployment rate trends, collateral value trends, and delinquent loan trends. As loans are classified as special mention or become 30 to 89 days delinquent, the qualitative loss factors increase based upon delinquent loan trends. The qualitative factors were derived by management based on a review of the historical performance of the respective loan portfolios and consideration of current economic conditions and their likely impact to the loan portfolio.
SVAs are established in connection with individual loan reviews of impaired loans. Since the majority of the Bank’s loan portfolio is composed of residential real estate, determining the estimated fair value of the underlying collateral is important in evaluating the amount of SVAs required for impaired one- to four-family loans. If the estimated fair value of the collateral, less estimated costs to sell and anticipated PMI proceeds, is less than the current loan balance, an SVA is established for the difference. Once a purchased one- to four-family loan is 90 days delinquent, new collateral values are obtained through automated valuation models (“AVMs”) or broker price opinions (“BPOs”). An updated AVM or BPO is then requested approximately every six months while the loan is greater than 90 days delinquent. Due to the relatively stable home values in Kansas and Missouri, new appraisals on originated one- to four- family loans are not obtained until a loan enters foreclosure. For originated one- to four-family loans and home equity loans that are impaired and the most recent appraisal is more than one year old, management estimates the fair value of the collateral using the most recently published Federal Housing Finance Agency (“FHFA”) index. For those loans where the FHFA fair value estimate results in a value less than the outstanding loan balance, an updated appraisal is obtained and is used to establish the SVA. If the Bank holds the first and second mortgage, both loans are combined when evaluating the need for an SVA.
Loans with an outstanding balance of $1.5 million or more are reviewed annually if secured by property in one of the following categories: multi-family (five or more units) property, unimproved land, other improved commercial property, acquisition and development of land projects, developed building lots, office building, single-use building, or retail building. SVAs are established if necessary, or management may charge-off such losses if deemed appropriate.
Assessing the adequacy of the ACL is inherently subjective. Actual results could differ from estimates as a result of changes in economic or market conditions. Changes in estimates could result in a material change in the ACL. In the opinion of management, the ACL, when taken as a whole, is adequate to absorb estimated losses inherent in the loan portfolio. However, future adjustments may be necessary if loan portfolio performance or economic or market conditions differ substantially from the conditions that existed at the time of the initial determinations.
Bank-Owned Life Insurance - BOLI is an insurance investment designed to help offset costs associated with the Bank’s compensation and benefit programs. In the event of the death of an insured individual, the Bank would receive a death benefit. If the insured individual is employed by the Bank at the time of death, a death benefit will be paid to the insured individual’s designated beneficiary equal to the insured individual’s base compensation at the time BOLI was approved by the Bank’s Board of Directors. If the individual is not employed by the Bank at the time of death, no death benefits will be paid to the insured individual’s designated beneficiary.
The cash surrender value of the policies is reported in BOLI in the consolidated balance sheets. Changes in the cash surrender value are recorded in Income from BOLI in the consolidated statements of income.
Capital Stock of Federal Home Loan Bank - As a member of FHLB Topeka, the Bank is required to acquire and hold shares of FHLB stock. The Bank’s holding requirement varies based on the Bank’s activities, primarily the Bank’s outstanding advances, with FHLB. FHLB stock is carried at cost. Management conducts a periodic review and evaluation of the Bank’s investment in FHLB stock to determine if any impairment exists. Dividends received on FHLB stock are reflected as interest and dividend income in the consolidated statements of income.
Premises and Equipment - Land is carried at cost. Buildings, leasehold improvements and furniture, fixtures and equipment are carried at cost less accumulated depreciation and leasehold amortization. Buildings, furniture, fixtures and equipment are depreciated over their estimated useful lives using the straight-line method. Buildings have an estimated useful life of 39 years. Furniture, fixtures and equipment have an estimated useful life of three to seven years. Leasehold improvements are amortized over the shorter of their estimated useful lives or the term of the respective leases, which is generally three to 15 years. The costs for major improvements and renovations are capitalized, while maintenance, repairs and minor improvements are charged to operating expenses as incurred. Gains and losses on dispositions are recorded as other income or other expense as incurred.
Real Estate Owned - REO primarily represents foreclosed assets held for sale. REO is reported at the lower of cost or estimated fair value less estimated selling costs (“realizable value.”) At acquisition, write downs to realizable value are charged to the ACL. After acquisition, any additional write downs are charged to operations in the period they are identified and are recorded in other expenses on the consolidated statements of income. Costs and expenses related to major additions and improvements are capitalized while maintenance and repairs which do not improve or extend the lives of the respective assets are expensed. Gains and losses on the sale of REO are recognized upon disposition of the property and are recorded in other expenses in the consolidated statements of income.
Income Taxes - The Company utilizes the asset and liability method of accounting for income taxes. Under this method, deferred income tax assets and liabilities are recognized for the tax consequences of temporary differences between the financial statement carrying amounts and the tax bases of existing assets and liabilities. The provision for deferred income taxes represents the change in deferred income tax assets and liabilities excluding the tax effects of the change in net unrealized gain (loss) on AFS securities and changes in the market value of vested RRP shares.
Deferred tax assets and liabilities are measured using enacted tax rates expected to apply to taxable income in the years in which those temporary differences are expected to be recovered or settled. The effect on deferred tax assets and liabilities of a change in tax rates is recognized in income in the period that includes the enactment date. Certain tax benefits attributable to stock options and RRP shares are credited to additional paid-in capital. The Company will record a valuation allowance to reduce its deferred income tax assets when there is uncertainty regarding the ability to realize their benefit.
Certain accounting literature prescribes a recognition threshold and measurement attribute for the financial statement recognition and measurement of a tax position taken, or expected to be taken, in a tax return. Accruals of interest and penalties related to unrecognized tax benefits are recognized in income tax expense.
Employee Stock Ownership Plan - The funds borrowed by the ESOP from the Company to purchase the Company’s common stock are being repaid from the Bank’s contributions and dividends paid on unallocated ESOP shares. The shares pledged as collateral are reported as a reduction of stockholders’ equity at cost. As ESOP shares are committed to be released from collateral each quarter, the Company records compensation expense based on the average market price of the Company’s stock during the quarter. Additionally, the shares become outstanding for EPS computations once they are committed to be released.
Stock-based Compensation - The Company has a Stock Option and Incentive Plan (the “Option Plan”) and an RRP which are considered share-based payment awards. Compensation expense is recognized over the service period of each share-based payment award. The Company applies a fair-value-based measurement method in accounting for share-based payment transactions with employees, except for equity instruments held by the ESOP. The Company applies the modified prospective method in which compensation cost is recognized over the service period for all awards granted.
Borrowed Funds - The Bank enters into sales of securities under agreements to repurchase with selected brokers (“repurchase agreements”). These agreements are recorded as financing transactions as the Bank maintains effective control over the transferred securities. The dollar amount of the securities underlying the agreements continues to be carried in the Bank’s securities portfolio. The obligations to repurchase the securities are reported as a liability in the consolidated balance sheet. The securities underlying the agreements are delivered to the party with whom each transaction is executed. They agree to resell to the Bank the same securities at the maturity of the agreement. The Bank retains the right to substitute similar or like securities throughout the terms of the agreements. The collateral is subject to valuation at current market levels and the Bank may ask for the return of excess collateral or be required to post additional collateral due to market value changes.
The Bank has obtained advances from FHLB. FHLB advances are secured by certain qualifying mortgage loans pursuant to a blanket collateral agreement with FHLB and all of the capital stock of FHLB owned by the Bank. Per the FHLB lending guidelines, total FHLB borrowings cannot exceed 40% of total Bank assets, as reported on the Bank’s Thrift Financial Report to the OCC, without pre-approval from the FHLB president.
Capitol Federal Financial Trust I (the “Trust”) is a Delaware statutory trust established by Capitol Federal Financial. The Trust was formed for the purpose of issuing Company obligated mandatorily redeemable preferred securities (“Trust Preferred Securities”). The Trust issued $53.6 million of Trust Preferred Securities. When the Trust Preferred Securities were issued, the Trust used the proceeds to purchase a like amount of Junior Subordinated Deferrable Interest Debentures (the “Debentures”) of the Company. The Company guaranteed the obligations of the Trust. The Debentures were redeemed in April 2011. The Debentures were the sole assets of the Trust, and were reported in Other Borrowings in the September 30, 2010 consolidated balance sheet. The Trust was not included in the consolidated financial statements.
The Bank is authorized to borrow from the Federal Reserve Bank’s “discount window.” The Bank had no outstanding Federal Reserve Bank borrowings at September 30, 2011 or 2010.
Comprehensive Income - Comprehensive income is comprised of net income and other comprehensive income. Other comprehensive income includes changes in unrealized gains and losses on securities AFS, net of tax. Comprehensive income is presented in the consolidated statements of changes in stockholders’ equity.
Segment Information - As a community-oriented financial institution, substantially all of the Bank’s operations involve the delivery of loan and deposit products to customers. Management makes operating decisions and assesses performance based on an ongoing review of these community banking operations, which constitute the Company’s only operating segment for financial reporting purposes.
Earnings Per Share - Basic EPS is computed by dividing income available to common stockholders by the weighted average number of shares outstanding for the period. Diluted EPS reflects the potential dilution that could occur if securities or other contracts to issue common stock (such as stock options) were exercised or resulted in the issuance of common stock. These potentially dilutive shares would then be included in the weighted average number of shares outstanding for the period using the treasury stock method. Shares issued and shares reacquired during any period are weighted for the portion of the period that they were outstanding.
In computing both basic and diluted EPS, the weighted average number of common shares outstanding includes the ESOP shares previously allocated to participants and shares committed to be released for allocation to participants and the RRP shares which have vested or have been allocated to participants. ESOP and RRP shares that have not been committed to be released or have not vested are excluded from the computation of basic and diluted EPS. Unvested awards that contain nonforfeitable rights to dividends should be treated as participating securities in the computation of EPS pursuant to the two-class method; however, the Company has determined the impact of doing so is inconsequential.
Recent Accounting Pronouncements - Effective October 1, 2010, the Company adopted new authoritative accounting guidance under Accounting Standards Codification (“ASC”) 860, Transfers of Servicing Assets. The objective of this standard is to improve the relevance, representational faithfulness, and comparability of the information provided in the financial statements related to the transfer of financial assets; the effects of a transfer on the Company’s financial position, financial performance, and cash flows; and a transferor’s continuing involvement in transferred financial assets. The adoption of this standard did not have an impact on the Company’s financial condition or results of operations.
Effective October 1, 2010, the Company also adopted new authoritative accounting guidance under ASC 810, Consolidation. The new guidance did not change many of the key principles for determining whether an entity is a variable interest entity consistent with the ASC on “Consolidation”, but does amend many important provisions of the existing guidance on “Consolidation.” The adoption of this standard did not have an impact on the Company’s financial condition, results of operations, or financial statement disclosures.
In July 2010, the Financial Accounting Standards Board (“FASB”) issued ASU 2010-20, Disclosures about Credit Quality of Financing Receivables and the Allowance for Credit Losses, which amends ASC 310, Receivables, by requiring more robust and disaggregated disclosures about the credit quality of an entity’s financing receivables and its ACL. The objective of enhancing these disclosures is to improve financial statement users’ understanding of (1) the nature of an entity’s credit risk associated with its financing receivables and (2) the entity’s assessment of that risk in estimating its ACL as well as changes in the allowance and the reasons for those changes. The new and amended disclosures that relate to information as of the end of a reporting period were effective for the Company at March 31, 2011. The disclosures that include information for activity that occurs during a reporting period were effective beginning January 1, 2011 for the Company. Since the provisions of ASU 2010-20 are disclosure-related, the Company’s adoption of this guidance did not have an impact to its financial condition or results of operations.
In January 2011, the FASB issued ASU 2011-01, Deferral of the Effective Date of Disclosures About Troubled Debt Restructurings in Update No. 2010-20, which temporarily deferred the effective date in ASU 2010-20 for disclosures about TDRs by creditors until the FASB finalized its project on determining what constitutes a TDR for a creditor. In April 2011, the FASB issued ASU 2011-02, Receivables (Topic 310): A Creditor's Determination of Whether a Restructuring Is a Troubled Debt Restructuring, which amends the content in ASC 310 related to identifying TDRs and effectively nullifies ASU 2011-01. ASU 2011-02 removes the deferral of the TDR disclosure requirements of ASU 2010-20 for public entities and thus establishes the effective date for those disclosures. ASU 2011-02 is effective for the first interim or annual period beginning on or after June 15, 2011, which was July 1, 2011 for the Company. 2011-02 is to be applied retrospectively to modifications occurring on or after the beginning of the fiscal year of adoption, which was October 1, 2010 for the Company. The adoption of ASU 2011-02 did not have a significant impact on the Company’s financial condition or results of operations.
In April 2011, the FASB issued ASU 2011-03, Reconsideration of Effective Control for Repurchase Agreements. The primary objective of this ASU is to improve the accounting for repurchase agreements and other agreements that both entitle and obligate a transferor to repurchase or redeem financial assets before their maturity. This ASU eliminates the requirement for entities to consider whether a transferor has the ability to repurchase the financial assets in a repurchase agreement, which may result in more repurchase agreements to be accounted for as secured borrowings rather than as a sale. ASU 2011-03 is effective for the first interim or annual period beginning on or after December 15, 2011, which is January 1, 2012 for the Company, and should be applied prospectively. The Company accounts for its repurchase agreements as secured borrowings; therefore, the adoption of ASU 2011-03 is not expected to have a material impact on its financial condition or results of operations.
In May 2011, the FASB issued ASU 2011-04, Amendments to Achieve Common Fair Value Measurements and Disclosure Requirements in U.S. GAAP and IFRSs. This ASU is a result of joint efforts by the FASB and the International Accounting Standards Board (“IASB”) to develop a single, converged fair value framework for measuring fair value and for disclosing information about fair value measurements in accordance with GAAP and International Financial Reporting Standards (“IFRSs”). This ASU is largely consistent with existing fair value measurement principles in U.S. GAAP; however, some of the components of this ASU could change how fair value measurement guidance in ASC 820, Fair Value Measurements and Disclosures, is applied. This ASU does not require additional fair value measurements and is not intended to establish valuation standards or affect valuation practices outside of financial reporting. ASU 2011-04 is effective during interim and annual periods beginning after December 15, 2011, which is January 1, 2012 for the Company, and should be applied retrospectively. The provisions of ASU 2011-04 applicable to the Company are disclosure related. The Company is currently disclosing its fair value measurements in compliance with the converged guidance; therefore, the adoption of ASU 2011-04 will not have an impact to the Company’s financial statement disclosures.
In June 2011, the FASB issued ASU 2011-05, Presentation of Comprehensive Income, which revises how entities present comprehensive income in their financial statements. The ASU requires entities to report components of comprehensive income in either (1) a continuous statement of comprehensive income or (2) two separate but consecutive statements. In a continuous statement of comprehensive income, an entity would be required to present the components of the income statement as presented today, along with the components of other comprehensive income. In the two-statement approach, an entity would be required to present a statement that is consistent with the income statement format used today, along with a second statement, which would immediately follow the income statement, that would include the components of other comprehensive income. The ASU does not change the items that an entity must report in other comprehensive income. ASU 2011-05 is effective for fiscal years, and interim periods within those years, beginning after December 15, 2011, which is October 1, 2012 for the Company, and should be applied retrospectively for all periods presented in the financial statements. The Company has not yet decided which statement format it will adopt.
The Company accounts for the shares acquired by its ESOP and the shares awarded pursuant to its RRP in accordance with ASC 260, which requires that unvested RRP awards that contain nonforfeitable rights to dividends be treated as participating securities in the computation of EPS pursuant to the two-class method. The two-class method is an earnings allocation that determines EPS for each class of common stock and participating security. Shares acquired by the ESOP are not considered in the basic average shares outstanding until the shares are committed for allocation or vested to an employee’s individual account. All share information prior to the corporate reorganization has been revised to reflect the 2.2637 exchange ratio.
| | | 2011 | | | 2010 | | | 2009 | |
| | | (Dollars in thousands, except per share data) | |
Net income (1) | | $ | 38,403 | | | $ | 67,840 | | | $ | 66,298 | |
| | | | | | | | | | | | | |
| Average common shares outstanding | | | 162,432,315 | | | | 165,689,601 | | | | 165,403,759 | |
| Average committed ESOP shares outstanding | | | 192,959 | | | | 172,575 | | | | 172,575 | |
| Total basic average common shares outstanding | | | 162,625,274 | | | | 165,862,176 | | | | 165,576,334 | |
| | | | | | | | | | | | | |
| Effect of dilutive RRP shares | | | 2,747 | | | | 6,492 | | | | 12,174 | |
| Effect of dilutive stock options | | | 4,644 | | | | 30,777 | | | | 132,668 | |
| | | | | | | | | | | | | |
| Total diluted average common shares outstanding | | | 162,632,665 | | | | 165,899,445 | | | | 165,721,176 | |
| | | | | | | | | | | | | |
| Net EPS | | | | | | | | | | | | |
| Basic | | $ | 0.24 | | | $ | 0.41 | | | $ | 0.40 | |
| Diluted | | $ | 0.24 | | | $ | 0.41 | | | $ | 0.40 | |
| | | | | | | | | | | | | |
| Antidilutive stock options and RRP, excluded | | | | | | | | | | | | |
| from the diluted average common shares | | | | | | | | | | | | |
| outstanding calculation | | | 898,415 | | | | 642,777 | | | | 167,626 | |
| (1) | Net income available to participating securities (unvested RRP shares) was inconsequential for fiscal years 2011, 2010, and 2009. |
The following tables reflect the amortized cost, estimated fair value, and gross unrealized gains and losses of AFS and HTM securities at September 30, 2011 and 2010. The majority of the MBS and investment securities portfolios are composed of securities issued by GSEs.
| | | September 30, 2011 | |
| | | | | | Gross | | | Gross | | | Estimated | |
| | | Amortized | | | Unrealized | | | Unrealized | | | Fair | |
| | | Cost | | | Gains | | | Losses | | | Value | |
| | | (Dollars in thousands) | |
| AFS: | | | | | | | | | | | | |
| GSE debentures | | $ | 746,545 | | | $ | 1,996 | | | $ | 233 | | | $ | 748,308 | |
| Municipal bonds | | | 2,628 | | | | 126 | | | | -- | | | | 2,754 | |
| Trust preferred securities | | | 3,681 | | | | -- | | | | 740 | | | | 2,941 | |
| MBS | | | 690,675 | | | | 41,764 | | | | 3 | | | | 732,436 | |
| | | | 1,443,529 | | | | 43,886 | | | | 976 | | | | 1,486,439 | |
| | | | | | | | | | | | | | | | | |
| HTM: | | | | | | | | | | | | | | | | |
| GSE debentures | | | 633,483 | | | | 3,171 | | | | -- | | | | 636,654 | |
| Municipal bonds | | | 56,994 | | | | 2,190 | | | | 4 | | | | 59,180 | |
| MBS | | | 1,679,640 | | | | 59,071 | | | | 153 | | | | 1,738,558 | |
| | | | 2,370,117 | | | | 64,432 | | | | 157 | | | | 2,434,392 | |
| | | $ | 3,813,646 | | | $ | 108,318 | | | $ | 1,133 | | | $ | 3,920,831 | |
| | | | | | | | | | | | | | | | | |
| | | September 30, 2010 | |
| | | | | | | Gross | | | Gross | | | Estimated | |
| | | Amortized | | | Unrealized | | | Unrealized | | | Fair | |
| | | Cost | | | Gains | | | Losses | | | Value | |
| | | (Dollars in thousands) | |
| AFS: | | | | | | | | | | | | | | | | |
| GSE debentures | | $ | 50,151 | | | $ | 104 | | | $ | -- | | | $ | 50,255 | |
| Municipal bonds | | | 2,649 | | | | 170 | | | | -- | | | | 2,819 | |
| Trust preferred securities | | | 3,721 | | | | -- | | | | 925 | | | | 2,796 | |
| MBS | | | 952,621 | | | | 51,881 | | | | 6 | | | | 1,004,496 | |
| | | | 1,009,142 | | | | 52,155 | | | | 931 | | | | 1,060,366 | |
| | | | | | | | | | | | | | | | | |
| HTM: | | | | | | | | | | | | | | | | |
| GSE debentures | | | 1,208,829 | | | | 4,441 | | | | -- | | | | 1,213,270 | |
| Municipal bonds | | | 67,957 | | | | 2,654 | | | | 1 | | | | 70,610 | |
| MBS | | | 603,368 | | | | 26,209 | | | | 3 | | | | 629,574 | |
| | | | 1,880,154 | | | | 33,304 | | | | 4 | | | | 1,913,454 | |
| | | $ | 2,889,296 | | | $ | 85,459 | | | $ | 935 | | | $ | 2,973,820 | |
The following tables summarize the estimated fair value and gross unrealized losses of those securities on which an unrealized loss at September 30, 2011 and 2010 was reported and the continuous unrealized loss position for at least 12 months or less than 12 months as of September 30, 2011 and 2010.
| | | September 30, 2011 | |
| | | Less Than | | | Equal to or Greater | |
| | | 12 Months | | | Than 12 Months | |
| | | | | | Estimated | | | | | | | | | Estimated | | | | |
| | | | | | Fair | | | Unrealized | | | | | | Fair | | | Unrealized | |
| | | Count | | | Value | | | Losses | | | Count | | | Value | | | Losses | |
| | | (Dollars in thousands) | |
| AFS: | | | | | | | | | | | | | | | | | | |
| GSE debentures | | | 7 | | | $ | 230,848 | | | $ | 233 | | | | -- | | | $ | -- | | | $ | -- | |
| Trust preferred securities | | | -- | | | | -- | | | | -- | | | | 1 | | | | 2,941 | | | | 740 | |
| MBS | | | 5 | | | | 1,189 | | | | 3 | | | | -- | | | | -- | | | | -- | |
| | | | 12 | | | $ | 232,037 | | | $ | 236 | | | | 1 | | | $ | 2,941 | | | $ | 740 | |
| | | | | | | | | | | | | | | | | | | | | | | | | |
| HTM: | | | | | | | | | | | | | | | | | | | | | | | | |
| GSE debentures | | | -- | | | $ | -- | | | $ | -- | | | | -- | | | $ | -- | | | $ | -- | |
| Municipal bonds | | | 2 | | | | 615 | | | | 4 | | | | -- | | | | -- | | | | -- | |
| MBS | | | 1 | | | | 25,142 | | | | 153 | | | | -- | | | | -- | | | | -- | |
| | | | 3 | | | $ | 25,757 | | | $ | 157 | | | | -- | | | $ | -- | | | $ | -- | |
| | | | | | | | | | | | | | | | | | | | | | | | | |
| | | | | | | | | | | | | | | | | | | | | | | | | |
| | | September 30, 2010 | |
| | | Less Than | | | Equal to or Greater | |
| | | 12 Months | | | Than 12 Months | |
| | | | | | | Estimated | | | | | | | | | | | Estimated | | | | | |
| | | | | | | Fair | | | Unrealized | | | | | | | Fair | | | Unrealized | |
| | | Count | | | Value | | | Losses | | | Count | | | Value | | | Losses | |
| | | (Dollars in thousands) | |
| AFS: | | | | | | | | | | | | | | | | | | | | | | | | |
| GSE debentures | | | -- | | | $ | -- | | | $ | -- | | | | -- | | | $ | -- | | | $ | -- | |
| Trust preferred securities | | | -- | | | | -- | | | | -- | | | | 1 | | | | 2,796 | | | | 925 | |
| MBS | | | 4 | | | | 1,678 | | | | 5 | | | | 3 | | | | 359 | | | | 1 | |
| | | | 4 | | | $ | 1,678 | | | $ | 5 | | | | 4 | | | $ | 3,155 | | | $ | 926 | |
| | | | | | | | | | | | | | | | | | | | | | | | | |
| HTM: | | | | | | | | | | | | | | | | | | | | | | | | |
| GSE debentures | | | -- | | | $ | -- | | | $ | -- | | | | -- | | | $ | -- | | | $ | -- | |
| Municipal bonds | | | -- | | | | -- | | | | -- | | | | 1 | | | | 878 | | | | 1 | |
| MBS | | | 1 | | | | 48,392 | | | | 3 | | | | -- | | | | -- | | | | -- | |
| | | | 1 | | | $ | 48,392 | | | $ | 3 | | | | 1 | | | $ | 878 | | | $ | 1 | |
On a quarterly basis, management conducts a formal review of securities for the presence of an other-than-temporary impairment. Management assesses whether an other-than-temporary impairment is present when the fair value of a security is less than its amortized cost basis at the balance sheet date. For such securities, other-than-temporary impairment is considered to have occurred if the Company intends to sell the security, if it is more likely than not the Company will be required to sell the security before recovery of its amortized cost basis, or if the present value of expected cash flows is not sufficient to recover the entire amortized cost.
The unrealized losses at September 30, 2011 and 2010 are primarily a result of increases in market yields from the time of purchase. In general, as market yields rise, the fair value of securities will decrease; as market yields fall, the fair value of securities will increase. Management generally views changes in fair value caused by changes in interest rates as temporary; therefore, these securities have not been classified as other-than-temporarily impaired. Additionally, the impairment is also considered temporary because scheduled coupon payments have been made, it is anticipated that the entire principal balance will be collected as scheduled, and management neither intends to sell the securities, nor is it more likely than not that the Company will be required to sell the securities before the recovery of the remaining amortized cost amount, which could be at maturity.
The amortized cost and estimated fair value of securities by remaining contractual maturity without consideration for call features or pre-refunding dates as of September 30, 2011 are shown below. Actual maturities of MBS may differ from contractual maturities because borrowers have the right to call or prepay obligations, generally without penalties. As of September 30, 2011, the amortized cost of the securities in our portfolio which are callable or have pre-refunding dates within one year totaled $869.2 million. Maturities of MBS depend on the repayment characteristics and experience of the underlying financial instruments. Issuers of certain investment securities have the right to call and prepay obligations with or without prepayment penalties.
| | | AFS | | | HTM | | | Total | |
| | | | | | Estimated | | | | | | Estimated | | | | | | Estimated | |
| | | Amortized | | | Fair | | | Amortized | | | Fair | | | Amortized | | | Fair | |
| | | Cost | | | Value | | | Cost | | | Value | | | Cost | | | Value | |
| | | (Dollars in thousands) | |
| One year or less | | $ | 301,992 | | | $ | 302,329 | | | $ | 1,729 | | | $ | 1,745 | | | $ | 303,721 | | | $ | 304,074 | |
| One year through five years | | | 447,564 | | | | 449,236 | | | | 663,871 | | | | 668,228 | | | | 1,111,435 | | | | 1,117,464 | |
| Five years through ten years | | | 159,505 | | | | 172,066 | | | | 492,407 | | | | 513,849 | | | | 651,912 | | | | 685,915 | |
| Ten years and thereafter | | | 534,468 | | | | 562,808 | | | | 1,212,110 | | | | 1,250,570 | | | | 1,746,578 | | | | 1,813,378 | |
| | | $ | 1,443,529 | | | $ | 1,486,439 | | | $ | 2,370,117 | | | $ | 2,434,392 | | | $ | 3,813,646 | | | $ | 3,920,831 | |
The following table presents the carrying value of the MBS in our portfolio by issuer as of the dates indicated.
| | | At September 30, | |
| | | 2011 | | | 2010 | |
| | | (Dollars in thousands) | |
| FNMA | | $ | 1,384,396 | | | $ | 890,216 | |
| FHLMC | | | 823,728 | | | | 712,253 | |
| GNMA | | | 202,340 | | | | 2,452 | |
| Private Issuer | | | 1,612 | | | | 2,943 | |
| | | $ | 2,412,076 | | | $ | 1,607,864 | |
The following table presents the taxable and non-taxable components of interest income on investment securities for the fiscal years ended September 30, 2011, 2010, and 2009.
| | | For the Year Ended | |
| | | September 30, | |
| | | 2011 | | | 2010 | | | 2009 | |
| | | (Dollars in thousands) | |
| Taxable | | $ | 17,180 | | | $ | 13,547 | | | $ | 3,526 | |
| Non-taxable | | | 1,897 | | | | 2,135 | | | | 2,007 | |
| | | $ | 19,077 | | | $ | 15,682 | | | $ | 5,533 | |
The following table summarizes the amortized cost and estimated fair value of securities pledged as collateral as of the dates indicated.
| | | September 30, | |
| | | 2011 | | | 2010 | |
| | | | | | Estimated | | | | | | Estimated | |
| | | Amortized | | | Fair | | | Amortized | | | Fair | |
| | | Cost | | | Value | | | Cost | | | Value | |
| | | (Dollars in thousands) | |
| Repurchase agreements | | $ | 571,016 | | | $ | 597,286 | | | $ | 671,852 | | | $ | 709,919 | |
| Retail deposits | | | 44,429 | | | | 44,991 | | | | -- | | | | -- | |
| Public unit deposits | | | 116,472 | | | | 124,785 | | | | 120,241 | | | | 128,621 | |
| Federal Reserve Bank | | | 26,666 | | | | 27,939 | | | | 34,720 | | | | 36,363 | |
| | | $ | 758,583 | | | $ | 795,001 | | | $ | 826,813 | | | $ | 874,903 | |
During fiscal year 2010, the Bank swapped originated fixed-rate mortgage loans with the FHLMC for MBS (“loan swap transaction”). The $192.7 million of MBS received, at amortized cost, in the loan swap transaction were classified as trading securities prior to their subsequent sale by the Bank. Proceeds from the sale of these securities were $199.1 million, resulting in a gross realized gain of $6.5 million. The gain is included in gain on securities, net in the consolidated statements of income for the year ended September 30, 2010. All other dispositions of securities during 2011, 2010, and 2009 were the result of principal repayments or maturities.
| 4. | LOANS RECEIVABLE and ALLOWANCE FOR CREDIT LOSSES |
Loans receivable, net at September 30, 2011 and 2010 is summarized as follows:
| | | 2011 | | | 2010 | |
| | | (Dollars in thousands) | |
| Real Estate Loans: | | | | | | |
| One- to four-family | | $ | 4,918,778 | | | $ | 4,915,651 | |
| Multi-family and commercial | | | 57,965 | | | | 66,476 | |
| Construction | | | 47,368 | | | | 33,168 | |
| Total real estate loans | | | 5,024,111 | | | | 5,015,295 | |
| | | | | | | | | |
| Consumer Loans: | | | | | | | | |
| Home equity | | | 164,541 | | | | 186,347 | |
| Other | | | 7,224 | | | | 7,671 | |
| Total consumer loans | | | 171,765 | | | | 194,018 | |
| | | | | | | | | |
| Total loans receivable | | | 5,195,876 | | | | 5,209,313 | |
| Less: | | | | | | | | |
| Undisbursed loan funds | | | 22,531 | | | | 15,489 | |
| ACL | | | 15,465 | | | | 14,892 | |
| Discounts/unearned loan fees | | | 19,093 | | | | 22,267 | |
| Premiums/deferred costs | | | (10,947 | ) | | | (11,537 | ) |
| | | $ | 5,149,734 | | | $ | 5,168,202 | |
Lending Practices and Underwriting Standards - Originating and purchasing loans secured by one- to four-family residential properties is the Bank’s primary business, resulting in a loan concentration in residential first mortgage loans. The Bank purchases one- to four-family loans from a select group of correspondent lenders located throughout the central United States. As a result of originating loans in our branches, along with the correspondent lenders in our local markets, the Bank has a concentration of loans secured by real property located in Kansas and Missouri. Additionally, the Bank purchases whole one- to four-family loans in bulk packages from nationwide lenders. The Bank also makes consumer loans, construction loans secured by residential or commercial properties, and real estate loans secured by multi-family dwellings.
One- to four-family loans - One- to four-family loans are underwritten manually or by an automated underwriting system developed by a third party. The system’s components closely resemble the Bank’s manual underwriting standards which are generally in accordance with FHLMC and FNMA manual underwriting guidelines. The automated underwriting system analyzes the applicant’s data, with emphasis on credit history, employment and income history, qualifying ratios reflecting the applicant’s ability to repay, asset reserves, and LTV ratio. Full documentation to support the applicant’s credit, income, and sufficient funds to cover all applicable fees and reserves at closing is required on all loans. Loans that do not meet the automated underwriting standards are referred to a staff underwriter for manual underwriting. Properties securing one- to four-family loans are appraised by either staff appraisers or fee appraisers, both of which are independent of the loan origination function.
The underwriting standards for loans purchased from correspondent and nationwide lenders are generally similar to the Bank’s internal underwriting standards. The underwriting of loans purchased from correspondent lenders is generally performed by the Bank’s underwriters. Before committing to purchase a pool of loans from a nationwide lender, the Bank’s Chief Lending Officer or Secondary Marketing Manager reviews specific criteria such as loan amount, credit scores, LTV ratios, geographic location, and debt ratios of each loan in the pool. If the specific criteria do not meet the Bank’s underwriting standards and compensating factors are not sufficient, then a loan will be removed from the pool. Before the pool is funded, an internal Bank underwriter or a third party reviews at least 25% of the loan files to confirm loan terms, credit scores, debt service ratios, property appraisals, and other underwriting related documentation. The Bank does not service the loans purchased from nationwide lenders. For the tables within this footnote, loans purchased from correspondent lenders are included with originated loans, and loans purchased in bulk from nationwide lenders are reported as purchased loans.
The Bank also originates construction-to-permanent loans secured by one- to four-family residential real estate. The majority of the one- to four-family construction loans are secured by property located within the Bank’s Kansas City market area. Construction loans are obtained by homeowners who will occupy the property when construction is complete. Construction loans to builders for speculative purposes are not permitted. The application process includes submission of complete plans, specifications, and costs of the project to be constructed. All construction loans are manually underwritten using the Bank’s internal underwriting standards. Construction draw requests and the supporting documentation are reviewed and approved by management. The Bank also performs regular documented inspections of the construction project to ensure the funds are being used for the intended purpose and the project is being completed according to the plans and specifications provided.
Multi-family and commercial loans - The Bank’s multi-family and commercial real estate loans are secured primarily by multi-family dwellings and small commercial buildings generally located in the Bank’s market areas. These loans are granted based on the income producing potential of the property and the financial strength of the borrower. At the time of origination, LTV ratios on multi-family and commercial real estate loans cannot exceed 80% of the appraised value of the property securing the loans. The net operating income, which is the income derived from the operation of the property less all operating expenses, must be sufficient to cover the payments related to the outstanding debt at the time of origination. The Bank generally requires personal guarantees of the borrowers covering a portion of the debt in addition to the security property as collateral for these loans. Appraisals on properties securing these loans are performed by independent state certified fee appraisers. Bank policy permits a limited amount of construction-to-permanent loans secured by multi-family dwellings and commercial real estate. Currently there are no construction-to-permanent loans in the multi-family and commercial portfolio.
Consumer loans - The Bank offers a variety of secured consumer loans, including home equity loans and lines of credit, home improvement loans, auto loans, and loans secured by savings deposits. The Bank also originates a very limited amount of unsecured loans. The Bank does not originate any consumer loans on an indirect basis, such as contracts purchased from retailers of goods or services which have extended credit to their customers. The majority of the consumer loan portfolio is comprised of home equity lines of credit.
The underwriting standards for consumer loans include a determination of the applicant’s payment history on other debts and an assessment of their ability to meet existing obligations and payments on the proposed loan. Although creditworthiness of the applicant is a primary consideration, the underwriting process also includes a comparison of the value of the security in relation to the proposed loan amount.
Credit Quality Indicators - Based on the Bank’s lending emphasis and underwriting standards, management has divided the loan portfolio into three segments: one- to four-family loans, consumer loans, and multi-family and commercial loans. The one- to four-family and consumer loan segments are further grouped into classes for purposes of providing disaggregated information about the credit quality of the loan portfolio. The classes are: one- to four-family loans - originated, one- to four-family loans - purchased, consumer loans - home equity, and consumer loans - other. The Bank’s primary credit quality indicators for the one- to four-family loan and consumer - home equity loan portfolios are delinquency status, asset classifications in accordance with applicable regulations, LTV ratios and borrower credit scores. The Bank’s primary credit quality indicators for the multi-family and commercial loan and consumer - other loan portfolios are delinquency status and asset classifications in accordance with applicable regulations.
The following table presents the recorded investment of loans, defined as the unpaid loan principal balance (net of unadvanced funds related to loans in process) inclusive of unearned loan fees and deferred costs, of the Company's 30 to 89 day delinquent loans, 90 or more day delinquent loans, total delinquent loans, total current loans, and the total loans receivable balance at September 30, 2011 by class. In the general valuation allowance model, loans in the 30 to 89 day delinquent category are assigned a higher loss factor than corresponding performing loans. Loans 90 or more days delinquent are considered impaired loans and are individually evaluated for impairment. At September 30, 2011, all loans in the 90 or more days delinquent category were on nonaccrual status and represented the entire balance of nonaccrual loans. At September 30, 2011, there were no loans 90 or more days delinquent that were still accruing interest.
| | | | | | | | | Total | | | | | | Total | |
| | | 30 to 89 Days | | | 90 or More Days | | | Delinquent | | | Current | | | Recorded | |
| | | Delinquent | | | Delinquent | | | Loans | | | Loans | | | Investment | |
| | | (Dollars in thousands) | |
| One- to four-family loans - originated | | $ | 19,682 | | | $ | 12,363 | | | $ | 32,045 | | | $ | 4,362,498 | | | $ | 4,394,543 | |
| One- to four-family loans - purchased | | | 6,243 | | | | 13,836 | | | | 20,079 | | | | 520,876 | | | | 540,955 | |
| Multi-family and commercial loans | | | -- | | | | -- | | | | -- | | | | 57,936 | | | | 57,936 | |
| Consumer - home equity | | | 759 | | | | 380 | | | | 1,139 | | | | 163,402 | | | | 164,541 | |
| Consumer - other | | | 92 | | | | 3 | | | | 95 | | | | 7,129 | | | | 7,224 | |
| | | $ | 26,776 | | | $ | 26,582 | | | $ | 53,358 | | | $ | 5,111,841 | | | $ | 5,165,199 | |
As of September 30, 2011, 2010, and 2009, loans with unpaid principal amounts totaling approximately $26.5 million, $32.0 million, and $30.9 million, respectively, were on nonaccrual status. Gross interest income would have increased by $643 thousand, $766 thousand, and $603 thousand for the years ended September 30, 2011, 2010, and 2009, respectively, if these nonaccrual status loans were not classified as such.
In accordance with the Bank’s asset classification policy, management regularly reviews the problem loans in the Bank's portfolio to determine whether any assets require classification in accordance with applicable regulations. Loan classifications, other than pass loans, are defined as follows:
| · | Special mention - These loans are performing loans on which known information about the collateral pledged or the possible credit problems of the borrowers have caused management to have doubts as to the ability of the borrowers to comply with present loan repayment terms and which may result in the future inclusion of such loans in the non-performing loan categories. |
| · | Substandard - A loan is considered substandard if it is inadequately protected by the current net worth and paying capacity of the obligor or of the collateral pledged, if any. Substandard loans include those characterized by the distinct possibility the Bank will sustain some loss if the deficiencies are not corrected. |
| · | Doubtful - Loans classified as doubtful have all the weaknesses inherent as those classified as substandard, with the added characteristic that the weaknesses present make collection or liquidation in full on the basis of currently existing facts and conditions and values highly questionable and improbable. |
| · | Loss - Loans classified as loss are considered uncollectible and of such little value that their continuance as loans without the establishment of specific loss allowance is not warranted. |
Special mention loans are included with loans 30 to 89 days delinquent in the general valuation allowance model, if the loan is not considered impaired. Loans classified as substandard, doubtful, or loss are considered impaired loans and are individually evaluated for impairment.
The following table sets forth the recorded investment in loans, less SVAs, classified at September 30, 2011 by class. At September 30, 2011, there were no loans classified as doubtful or loss that were not fully reserved. In addition to the classified loans below, at September 30, 2011, the Bank had other assets totaling $10.3 million, comprised of municipal bonds and a trust preferred security, also classified per its asset classification policy and applicable regulations.
| | | Special Mention | | | Substandard | |
| | | (Dollars in thousands) | |
| One- to four-family - originated | | $ | 32,673 | | | $ | 18,419 | |
| One- to four-family - purchased | | | 447 | | | | 15,987 | |
| Multi-family and commercial | | | 7,683 | | | | -- | |
| Consumer - home equity | | | 50 | | | | 592 | |
| Consumer - other | | | -- | | | | 5 | |
| | | $ | 40,853 | | | $ | 35,003 | |
The following table shows the weighted average LTV and credit score information for originated and purchased one- to four-family loans and originated consumer home equity loans at September 30, 2011. Borrower credit scores are intended to provide an indication as to the likelihood that a borrower will repay their debts. Credit scores were most recently updated in September 2011 and were obtained from a nationally recognized consumer rating agency. The LTV ratios provide an estimate of the extent to which the Bank may incur a loss on any given loan that may go into foreclosure. The LTV ratios were based on the current loan balance and either the lesser of the purchase price or original appraisal, or the most recent bank appraisal, BPO or AVM, if available. In most cases, the most recent appraisal was obtained at the time of origination.
| | | Weighted Average | | | Weighted Average | |
| | | Credit Score | | | LTV | |
| One- to four-family - originated | | | 762 | | | | 66 | % |
| One- to four-family - purchased | | | 740 | | | | 60 | |
| Consumer - home equity | | | 742 | | | | 20 | |
| | | | 759 | | | | 64 | % |
Troubled Debt Restructurings - The total recorded investment of loans classified as TDRs at September 30, 2011 was $50.3 million, of which $30.7 million represent restructurings granted to borrowers experiencing financial difficulties and $19.6 million represent restructurings to market interest rates through the Bank’s loan endorsement program, which are classified as TDRs as a result of the Company adopting ASU No. 2011-02 on July 1, 2011.
Substantially all of the TDRs at September 30, 2011, are secured by residential real estate. The recorded investment of TDRs classified as impaired totaled $46.1 million at September 30, 2011. Impaired loans are individually evaluated for SVAs. ��TDRs not classified as impaired, which totaled $4.2 million at September 30, 2011, are included in the general valuation allowance model in their appropriate loan category. At September 30, 2011, $960 thousand was recorded in the ACL related to TDRs. The TDRs classified as a result of adopting ASU No. 2011-02 were individually evaluated for impairment. No SVA was recorded on these loans at September 30, 2011, as the estimated current values of the collateral were in excess of the recorded loan balances.
The following table presents the recorded investment of TDRs at September 30, 2011, including restructurings granted to borrowers that were experiencing financial difficulties and restructurings of loans to market interest rates through the Bank’s loan endorsement program.
| | | Restructurings | | | | | | | |
| | | Due to | | | Loan | | | | |
| | | Financial | | | Endorsement | | | | |
| | | Difficulties | | | Program | | | Total | |
| | | (Dollars in thousands) | |
| One- to four-family loans - originated | | $ | 23,534 | | | $ | 19,624 | | | $ | 43,158 | |
| One- to four-family loans - purchased | | | 6,155 | | | | -- | | | | 6,155 | |
| Multi-family and commercial loans | | | 563 | | | | -- | | | | 563 | |
| Consumer - home equity | | | 413 | | | | -- | | | | 413 | |
| Consumer - other | | | 2 | | | | -- | | | | 2 | |
| | | $ | 30,667 | | | $ | 19,624 | | | $ | 50,291 | |
The following table presents the recorded investment prior to restructuring and immediately after restructuring for all loans restructured during the year ended September 30, 2011. This table does not reflect the recorded investment at September 30, 2011.
| | | Number | | | Pre- | | | Post- | |
| | | of | | | Restructured | | | Restructured | |
| | | Contracts | | | Outstanding | | | Outstanding | |
| | | | | | (Dollars in thousands) | |
| One- to four-family loans - originated | | | 158 | | | $ | 27,250 | | | $ | 26,936 | |
| One- to four-family loans - purchased | | | 4 | | | | 1,563 | | | | 1,555 | |
| Multi-family and commercial loans | | | -- | | | | -- | | | | -- | |
| Consumer - home equity | | | 5 | | | | 224 | | | | 227 | |
| Consumer - other | | | -- | | | | -- | | | | -- | |
| | | | 167 | | | $ | 29,037 | | | $ | 28,718 | |
As of September 30, 2011, the recorded investment of TDRs 30-89 days delinquent and over 90 days delinquent was $2.6 million and $2.9 million, respectively. The following table provides information on TDRs restructured within the last 12 months that subsequently defaulted during the year ended September 30, 2011. Of the 13 loans in the table that defaulted during the year, seven loans, with a recorded investment of $812 thousand as of September 30, 2011, had returned to current status as of September 30, 2011.
| | | Number | | | | |
| | | of | | | Recorded | |
| | | Contracts | | | Investment | |
| | | | | | (Dollars in thousands) | |
| One- to four-family loans - originated | | | 13 | | | $ | 1,353 | |
| One- to four-family loans - purchased | | | -- | | | | -- | |
| Multi-family and commercial loans | | | -- | | | | -- | |
| Consumer - home equity | | | -- | | | | -- | |
| Consumer - other | | | -- | | | | -- | |
| | | | 13 | | | $ | 1,353 | |
Impaired loans - Impaired loans are defined as non-accrual loans, loans classified as substandard, loans with SVAs, and TDRs that have not yet performed under the restructured terms for 12 consecutive months or are required by the accounting literature to be classified as a TDR for the life of the loan due to a reduction in the stated interest rate to a rate lower than the current market rate for new debt with similar risk. Substantially all of the impaired loans at September 30, 2011 were secured by residential real estate. Impaired loans related to residential real estate are individually evaluated to ensure that the carrying value of the loan is not in excess of the fair value of the collateral, less estimated selling costs. Fair values of residential real estate are estimated through such methods as current appraisals, AVMs, BPOs, or listing prices. Fair values may be adjusted by management to reflect current economic and market conditions. If the outstanding loan balance is in excess of the estimated fair value determined by management, less estimated costs to sell, then a SVA is recorded for the difference.
The following is a summary of information pertaining to impaired loans by class at September 30, 2011.
| | | | | | | | | | | | | Fiscal | | | Fiscal | |
| | | | | | | | | | | | | Year-to-Date | | | Year-to-Date | |
| | | | | | | Unpaid | | | | | | Average | | | Interest | |
| | | | Recorded | | | Principal | | | Related | | | Recorded | | | Income | |
| | | | Investment | | | Balance | | | ACL | | | Investment | | | Recognized | |
| | | | (Dollars in thousands) | |
| With no related allowance recorded | | | | | | | | | | | | | | | |
| | One- to four-family - originated | | $ | 47,710 | | | $ | 47,845 | | | $ | -- | | | $ | 41,401 | | | $ | 1,467 | |
| | One- to four-family - purchased | | | 6,075 | | | | 6,056 | | | | -- | | | | 7,381 | | | | 58 | |
| | Multi-family and commercial | | | 563 | | | | 565 | | | | -- | | | | 578 | | | | 36 | |
| | Consumer - home equity | | | 468 | | | | 468 | | | | -- | | | | 672 | | | | 14 | |
| | Consumer - other | | | 5 | | | | 5 | | | | -- | | | | 46 | | | | -- | |
| | | | | 54,821 | | | | 54,939 | | | | -- | | | | 50,078 | | | | 1,575 | |
| | | | | | | | | | | | | | | | | | | | | | |
| With an allowance recorded | | | | | | | | | | | | | | | | | | | | |
| | One- to four-family - originated | | | 3,297 | | | | 3,299 | | | | 335 | | | | 2,419 | | | | 102 | |
| | One- to four-family - purchased | | | 13,640 | | | | 13,546 | | | | 3,280 | | | | 14,576 | | | | 156 | |
| | Multi-family and commercial | | | -- | | | | -- | | | | -- | | | | -- | | | | -- | |
| | Consumer - home equity | | | 264 | | | | 264 | | | | 140 | | | | 80 | | | | 3 | |
| | Consumer - other | | | -- | | | | -- | | | | -- | | | | -- | | | | -- | |
| | | | | 17,201 | | | | 17,109 | | | | 3,755 | | | | 17,075 | | | | 261 | |
| | | | | | | | | | | | | | | | | | | | | | |
| Total | | | | | | | | | | | | | | | | | | | | | |
| | One- to four-family - originated | | | 51,007 | | | | 51,144 | | | | 335 | | | | 43,820 | | | | 1,569 | |
| | One- to four-family - purchased | | | 19,715 | | | | 19,602 | | | | 3,280 | | | | 21,957 | | | | 214 | |
| | Multi-family and commercial | | | 563 | | | | 565 | | | | -- | | | | 578 | | | | 36 | |
| | Consumer - home equity | | | 732 | | | | 732 | | | | 140 | | | | 752 | | | | 17 | |
| | Consumer - other | | | 5 | | | | 5 | | | | -- | | | | 46 | | | | -- | |
| | | | $ | 72,022 | | | $ | 72,048 | | | $ | 3,755 | | | $ | 67,153 | | | $ | 1,836 | |
Allowance for Credit Losses - The following is a summary of the activity in the ACL by segment for the year ended September 30, 2011 and the ending balance of the ACL at September 30, 2011, based on the Company’s impairment methodology.
| | | One- to Four- | | | One- to Four- | | | One- to Four- | | | Multi-family | | | | | | | |
| | | Family | | | Family | | | Family | | | and | | | | | | | |
| | | Originated | | | Purchased | | | Total | | | Commercial | | | Consumer | | | Total | |
| | | (Dollars in thousands) | |
| Beginning balance | | $ | 3,813 | | | $ | 10,425 | | | $ | 14,238 | | | $ | 275 | | | $ | 379 | | | $ | 14,892 | |
| Charge-offs | | | (414 | ) | | | (2,928 | ) | | | (3,342 | ) | | | -- | | | | (145 | ) | | | (3,487 | ) |
| Recoveries | | | -- | | | | -- | | | | -- | | | | -- | | | | -- | | | | -- | |
| Provision for credit losses | | | 1,516 | | | | 2,404 | | | | 3,920 | | | | (21 | ) | | | 161 | | | | 4,060 | |
| Ending balance | | $ | 4,915 | | | $ | 9,901 | | | $ | 14,816 | | | $ | 254 | | | $ | 395 | | | $ | 15,465 | |
| | | | | | | | | | | | | | | | | | | | | | | | | |
| Ratio of net charge-offs to average loans | | | | | | | | | | | | | | | | | | | | | | | | |
| outstanding year-to-date | | | | | | | | | | | | | | | | | | | | | | | 0.07 | % |
| Ratio of net charge-offs year-to-date | | | | | | | | | | | | | | | | | | | | | | | | |
| to average non-performing assets | | | | | | | | | | | | | | | | | | | | | | | 8.75 | % |
| | | | | | | | | | | | | | | | | | | | | | | | | |
| ACL for loans collectively | | | | | | | | | | | | | | | | | | | | | | | | |
| evaluated for impairment | | $ | 4,580 | | | $ | 6,621 | | | $ | 11,201 | | | $ | 254 | | | $ | 255 | | | $ | 11,710 | |
| ACL for loans individually | | | | | | | | | | | | | | | | | | | | | | | | |
| evaluated for impairment | | $ | 335 | | | $ | 3,280 | | | $ | 3,615 | | | $ | -- | | | $ | 140 | | | $ | 3,755 | |
| | | | | | | | | | | | | | | | | | | | | | | | | |
The following is a summary of the loan portfolio at September 30, 2011 by loan portfolio segment disaggregated by the Company’s impairment method.
| | | One- to Four- | | | One- to Four- | | | One- to Four- | | | Multi-family | | | | | | | |
| | | Family | | | Family | | | Family | | | and | | | | | | | |
| | | Originated | | | Purchased | | | Total | | | Commercial | | | Consumer | | | Total | |
| | | (Dollars in thousands) | | | | |
| Recorded investment of loans | | | | | | | | | | | | | | | | | | |
| collectively evaluated for impairment | | $ | 4,343,536 | | | $ | 521,240 | | | $ | 4,864,776 | | | $ | 57,373 | | | $ | 171,028 | | | $ | 5,093,177 | |
| | | | | | | | | | | | | | | | | | | | | | | | | |
| Recorded investment of loans | | | | | | | | | | | | | | | | | | | | | | | | |
| individually evaluated for impairment | | | 51,007 | | | | 19,715 | | | | 70,722 | | | | 563 | | | | 737 | | | | 72,022 | |
| | | $ | 4,394,543 | | | $ | 540,955 | | | $ | 4,935,498 | | | $ | 57,936 | | | $ | 171,765 | | | $ | 5,165,199 | |
As noted above, the Bank has a loan concentration in residential first mortgage loans. Continued declines in residential real estate values could adversely impact the property used as collateral for the Bank’s loans. Adverse changes in the economic conditions and increasing unemployment rates may have a negative effect on the ability of the Bank’s borrowers to make timely loan payments, which would likely increase delinquencies and have an adverse impact on the Bank’s earnings. Further increases in delinquencies will decrease interest income on loans receivable and will likely adversely impact the Bank’s loan loss experience, resulting in an increase in the Bank’s ACL and provision for credit losses. Although management believes the ACL was at an adequate level to absorb known and inherent losses in the loan portfolio at September 30, 2011, the level of the ACL remains an estimate that is subject to significant judgment and short-term changes. Additions to the ACL may be necessary if future economic and other conditions differ substantially from the current environment.
The Bank originated and refinanced $892 thousand, $13.1 million, and $15.3 million of commercial real estate and business loans during the years ended September 30, 2011, 2010, and 2009, respectively.
The Bank is subject to numerous lending-related regulations. Under the Financial Institutions Reform, Recovery, and Enforcement Act, the limit of aggregate loans to one borrower is 15% of the Bank’s unimpaired capital and surplus, but not less than $500 thousand. As of September 30, 2011, the Bank was in compliance with this limitation.
Aggregate loans to executive officers, directors and their associates did not exceed 5% of stockholders’ equity as of September 30, 2011 and 2010. Such loans were made under terms and conditions substantially the same as loans made to parties not affiliated with the Bank.
The Bank recognized net gains of $298 thousand, $1.8 million, and $2.2 million during fiscal years 2011, 2010, and 2009, respectively, as a result of selling LHFS. The net gains are included in other income, net in the consolidated statements of income.
As of September 30, 2011 and 2010, the Bank serviced loans for others aggregating approximately $526.3 million and $681.1 million, respectively. Such loans are not included in the accompanying consolidated balance sheets. Servicing loans for others generally consists of collecting mortgage payments, maintaining escrow accounts, disbursing payments to investors and foreclosure processing. Loan servicing income includes servicing fees withheld from investors and certain charges collected from borrowers, such as late payment fees. The Bank held borrowers’ escrow balances on loans serviced for others of $7.5 million and $9.0 million as of September 30, 2011 and 2010, respectively.
| 5. | PREMISES AND EQUIPMENT, Net |
A summary of the net carrying value of banking premises and equipment at September 30, 2011 and 2010 is as follows:
| | | 2011 | | | 2010 | |
| | | (Dollars in thousands) | |
| Land | | $ | 8,684 | | | $ | 7,877 | |
| Building and improvements | | | 53,822 | | | | 45,295 | |
| Furniture, fixtures and equipment | | | 38,069 | | | | 37,289 | |
| | | | 100,575 | | | | 90,461 | |
| | | | | | | | | |
| Less accumulated depreciation | | | 52,152 | | | | 49,201 | |
| | | | | | | | | |
| | | $ | 48,423 | | | $ | 41,260 | |
Depreciation and amortization expense for the years ended September 30, 2011, 2010, and 2009 was $4.4 million, $4.6 million, and $5.1 million, respectively.
The Bank has entered into non-cancelable operating lease agreements with respect to banking premises and equipment. It is expected that many agreements will be renewed at expiration in the normal course of business. Rental expense was $1.3 million for the year ended September 30, 2011 and $1.2 million for each of the years ended September 30, 2010 and 2009. Future minimum rental commitments, rounded to the nearest thousand, required under operating leases that have initial or remaining non-cancelable lease terms in excess of one year are as follows (dollars in thousands):
| 2012 | | $ | 1,279 | |
| 2013 | | | 1,112 | |
| 2014 | | | 939 | |
| 2015 | | | 817 | |
| 2016 | | | 730 | |
| Thereafter | | | 6,924 | |
| | | $ | 11,801 | |
Deposits at September 30, 2011 and 2010 are summarized as follows:
| | | | 2011 | | | 2010 | |
| | | | | | | Weighted | | | | | | | | | Weighted | | | | |
| | | | | | | Average | | | % of | | | | | | Average | | | % of | |
| | Amount | | | Rate | | | Total | | | Amount | | | Rate | | | Total | |
| | | | (Dollars in thousands) | |
| Non-certificates: | | | | | | | | | | | | | | | | | | | |
| Checking | | | $ | 551,632 | | | | 0.08 | % | | | 12.3 | % | | $ | 482,428 | | | | 0.13 | % | | | 11.0 | % |
| Savings | | | | 253,184 | | | | 0.41 | | | | 5.6 | | | | 234,285 | | | | 0.54 | | | | 5.3 | |
| Money market | | | | 1,066,065 | | | | 0.35 | | | | 23.7 | | | | 942,428 | | | | 0.65 | | | | 21.5 | |
| Total non-certificates | | | | 1,870,881 | | | | 0.28 | | | | 41.6 | | | | 1,659,141 | | | | 0.48 | | | | 37.8 | |
| | | | | | | | | | | | | | | | | | | | | | | | | | |
| Certificates of deposit: | | | | | | | | | | | | | | | | | | | | | | | | | |
| | 0.00 – 0.99 | % | | | 339,803 | | | | 0.50 | | | | 7.6 | | | | 193,959 | | | | 0.53 | | | | 4.4 | |
| | 1.00 – 1.99 | % | | | 1,106,957 | | | | 1.27 | | | | 24.6 | | | | 1,013,538 | | | | 1.44 | | | | 23.1 | |
| | 2.00 – 2.99 | % | | | 775,235 | | | | 2.49 | | | | 17.2 | | | | 777,687 | | | | 2.53 | | | | 17.7 | |
| | 3.00 – 3.99 | % | | | 371,682 | | | | 3.42 | | | | 8.3 | | | | 576,595 | | | | 3.50 | | | | 13.2 | |
| | 4.00 – 4.99 | % | | | 30,615 | | | | 4.40 | | | | 0.7 | | | | 164,763 | | | | 4.32 | | | | 3.8 | |
| | 5.00 – 5.99 | % | | | -- | | | | -- | | | | -- | | | | 627 | | | | 5.29 | | | | -- | |
| Total certificates of deposit | | | | 2,624,292 | | | | 1.87 | | | | 58.4 | | | | 2,727,169 | | | | 2.29 | | | | 62.2 | |
| | | | | $ | 4,495,173 | | | | 1.21 | % | | | 100.0 | % | | $ | 4,386,310 | | | | 1.61 | % | | | 100.0 | % |
As of September 30, 2011, certificates of deposit mature as follows:
| | | | | | Weighted | |
| | | | | | Average | |
| | | Amount | | | Rate | |
| | | (Dollars in thousands) | |
| 2012 | | $ | 1,390,231 | | | | 1.65 | % |
| 2013 | | | 555,043 | | | | 1.86 | |
| 2014 | | | 309,015 | | | | 2.27 | |
| 2015 | | | 317,065 | | | | 2.43 | |
| 2016 | | | 49,423 | | | | 2.22 | |
| Thereafter | | | 3,515 | | | | 2.46 | |
| | | $ | 2,624,292 | | | | 1.87 | % |
Interest expense on deposits for the periods presented is as follows:
| | | Year Ended September 30, | |
| | | 2011 | | | 2010 | | | 2009 | |
| | | (Dollars in thousands) | |
| Checking | | $ | 441 | | | $ | 622 | | | $ | 879 | |
| Savings | | | 1,225 | | | | 1,323 | | | | 1,873 | |
| Money market | | | 5,307 | | | | 6,522 | | | | 8,512 | |
| Certificates | | | 56,595 | | | | 70,749 | | | | 89,207 | |
| | | $ | 63,568 | | | $ | 79,216 | | | $ | 100,471 | |
The amount of noninterest-bearing deposits was $97.6 million and $76.4 million as of September 30, 2011 and 2010, respectively. Certificates of deposit with a minimum denomination of $100 thousand were $882.8 million and $885.6 million as of September 30, 2011 and 2010, respectively. Deposits in excess of $250 thousand may not be fully insured by the FDIC. The aggregate amount of deposits that were reclassified as loans receivable due to customer overdrafts was $124 thousand and $175 thousand as of September 30, 2011 and 2010, respectively.
At September 30, 2011 the Company’s borrowed funds consisted of FHLB advances and repurchase agreements. At September 30, 2010, the Company’s borrowed funds consisted of FHLB advances, repurchase agreements, and the Debentures. The Debentures were repaid in April 2011.
FHLB Advances – FHLB advances at September 30, 2011 and 2010 were comprised of the following:
| | | 2011 | | | 2010 | |
| | | (Dollars in thousands) | |
| Fixed-rate FHLB advances | | $ | 2,400,000 | | | $ | 2,376,000 | |
| Deferred prepayment penalty | | | (20,995 | ) | | | (28,261 | ) |
| Deferred gain on terminated interest rate swaps | | | 457 | | | | 632 | |
| | | $ | 2,379,462 | | | $ | 2,348,371 | |
| | | | | | | | | |
| Weighted average contractual interest rate on FHLB advances | | | 3.37 | % | | | 3.61 | % |
Weighted average effective interest rate on FHLB advances (1) | | | 3.71 | % | | | 3.96 | % |
| (1) | The effective rate includes the net impact of the amortization of deferred prepayment penalties related to the prepayment of certain FHLB advances and deferred gains related to the termination of interest rate swaps. |
During fiscal year 2010, the Bank prepaid $200.0 million of fixed-rate FHLB advances with a weighted average interest rate of 4.63% and a weighted average remaining term to maturity of approximately one month. The prepaid FHLB advances were replaced with $200.0 million of fixed-rate FHLB advances with a weighted average contractual interest rate of 3.17% and an average term of 84 months. The Bank paid an $875 thousand prepayment penalty to the FHLB as a result of prepaying the FHLB advances. The present value of the cash flows under the terms of the new FHLB advance was not more than 10% different from the present value of the cash flows under the terms of the prepaid FHLB advances (including the prepayment penalty) and there were no embedded conversion options in the prepaid advances or in the new FHLB advances. The prepayment penalty effectively increased the interest rate on the new advances seven basis points at the time of the transaction. The deferred prepayment penalty is being recognized in interest expense over the life of the new FHLB advances. The benefit of prepaying the advances in fiscal year 2010 was an immediate decrease in interest expense, and a decrease in interest rate sensitivity, as the maturity of the refinanced advances were extended at a lower rate.
The FHLB advances are secured by certain qualifying mortgage loans pursuant to a blanket collateral agreement with the FHLB and all of the capital stock of FHLB owned by the Bank. Per the FHLB’s lending guidelines, total FHLB borrowings cannot exceed 40% of total Bank assets without the pre-approval of the FHLB president. At September 30, 2011, the Bank’s ratio of FHLB advances to total assets, as reported to the Bank’s regulators, was 26%.
At September 30, 2011, the Bank had access to a line of credit with the FHLB set to expire on November 25, 2011, at which time the line of credit is expected to be renewed automatically by the FHLB for a one year period. At September 30, 2011, there were no borrowings on the FHLB line of credit. Any borrowings on the line of credit would be included in total FHLB borrowings in calculating the ratio of FHLB borrowings to total Bank assets, which generally could not exceed 40% of total Bank assets at September 30, 2011.
Other Borrowings – The following summarizes the components of other borrowings as of September 30, 2011 and 2010. The Debentures were redeemed in April 2011.
| | | 2011 | | | 2010 | |
| | | | | | Weighted | | | | | | Weighted | |
| | | | | | Average | | | | | | Average | |
| | | | | | Contractual | | | | | | Contractual | |
| | | Amount | | | Rate | | | Amount | | | Rate | |
| | | (Dollars in thousands) | |
| Repurchase agreements | | $ | 515,000 | | | | 4.00 | % | | $ | 615,000 | | | | 4.03 | % |
| Debentures | | | -- | | | | -- | | | | 53,609 | | | | 3.28 | |
| | | $ | 515,000 | | | | 4.00 | % | | $ | 668,609 | | | | 3.97 | % |
The Bank has pledged MBS with an estimated fair value of $597.3 million at September 30, 2011 as collateral for the repurchase agreements.
Maturity of Borrowed Funds – At September 30, 2011, the maturities of FHLB advances and repurchase agreements were as follows:
| | | | | | | | | | | | Weighted | | | Weighted | |
| | | FHLB | | | Repurchase | | | Total | | | Average | | | Average | |
| | | Advances | | | Agreements | | | Borrowings | | | Contractual | | | Effective | |
| | | Amount | | | Amount | | | Amount | | | Rate | | | Rate | |
| | | (Dollars in thousands) | | | | |
| 2012 | | $ | 350,000 | | | $ | 150,000 | | | $ | 500,000 | | | | 3.67 | % | | | 3.67 | % |
| 2013 | | | 525,000 | | | | 145,000 | | | | 670,000 | | | | 3.74 | | | | 4.00 | |
| 2014 | | | 450,000 | | | | 100,000 | | | | 550,000 | | | | 3.33 | | | | 3.96 | |
| 2015 | | | 200,000 | | | | 20,000 | | | | 220,000 | | | | 3.50 | | | | 4.16 | |
| 2016 | | | 275,000 | | | | -- | | | | 275,000 | | | | 3.86 | | | | 4.39 | |
| Thereafter | | | 600,000 | | | | 100,000 | | | | 700,000 | | | | 3.06 | | | | 3.08 | |
| | | $ | 2,400,000 | | | $ | 515,000 | | | $ | 2,915,000 | | | | 3.48 | % | | | 3.76 | % |
Of the $350.0 million FHLB advances maturing in fiscal year 2012, $100.0 million is due in the first quarter of fiscal year 2012, $150.0 million is due in the second quarter of fiscal year 2012, and $100.0 million is due in the fourth quarter of fiscal year 2012. All of the $150.0 million of repurchase agreements maturing in fiscal year 2012 is due in the first quarter.
Income tax expense (benefit) for the years ended September 30, 2011, 2010, and 2009 consisted of the following:
| | | 2011 | | | 2010 | | | 2009 | |
| Current | | (Dollars in thousands) | |
| Federal | | $ | 25,889 | | | $ | 31,252 | | | $ | 32,590 | |
| State | | | 2,707 | | | | 2,807 | | | | 2,788 | |
| | | | 28,596 | | | | 34,059 | | | | 35,378 | |
| Deferred | | | | | | | | | | | | |
| Federal | | | (8,933 | ) | | | 3,209 | | | | 3,285 | |
| State | | | (714 | ) | | | 257 | | | | 263 | |
| | | | (9,647 | ) | | | 3,466 | | | | 3,548 | |
| | | $ | 18,949 | | | $ | 37,525 | | | $ | 38,926 | |
The Company’s effective tax rates were 33.0%, 35.6%, and 37.0% for the years ended September 30, 2011, 2010, and 2009, respectively. The differences between such effective rates and the statutory Federal income tax rate computed on income before income tax expense result from the following:
| | | 2011 | | | 2010 | | | 2009 | |
| | | Amount | | | % | | | Amount | | | % | | | Amount | | | % | |
| | | (Dollars in thousands) | |
| Federal income tax expense | | | | | | | | | | | | | | | | | | |
| computed at statutory Federal rate | | $ | 20,073 | | | | 35.0 | % | | $ | 36,878 | | | | 35.0 | % | | $ | 36,828 | | | | 35.0 | % |
| Increases (Decreases) in taxes resulting from: | | | | | | | | | | | | | | | | | | | | | | | | |
| State taxes, net of Federal tax effect | | | 1,993 | | | | 3.4 | | | | 3,064 | | | | 2.9 | | | | 3,051 | | | | 2.9 | |
| Net tax-exempt interest income | | | (577 | ) | | | (1.0 | ) | | | (624 | ) | | | (0.6 | ) | | | (579 | ) | | | (0.6 | ) |
| Change in cash surrender value of BOLI | | | (638 | ) | | | (1.1 | ) | | | (421 | ) | | | (0.4 | ) | | | (406 | ) | | | (0.4 | ) |
| Low income housing tax credits | | | (1,397 | ) | | | (2.4 | ) | | | (1,209 | ) | | | (1.1 | ) | | | (1,013 | ) | | | (1.0 | ) |
| Other | | | (505 | ) | | | (0.9 | ) | | | (163 | ) | | | (0.2 | ) | | | 1,045 | | | | 1.1 | |
| | | $ | 18,949 | | | | 33.0 | % | | $ | 37,525 | | | | 35.6 | % | | $ | 38,926 | | | | 37.0 | % |
Deferred income tax (benefit) expense results from temporary differences in the recognition of revenue and expenses for tax and financial statement purposes. The sources of these differences and the tax effect of each as of September 30, 2011, 2010, and 2009 were as follows:
| | | 2011 | | | 2010 | | | 2009 | |
| | | (Dollars in thousands) | |
| Foundation contribution | | $ | (12,824 | ) | | $ | -- | | | $ | -- | |
| Mortgage servicing rights | | | (885 | ) | | | 774 | | | | (874 | ) |
| ACL | | | (197 | ) | | | (1,771 | ) | | | (1,628 | ) |
| FHLB prepayment penalty | | | -- | | | | 1,283 | | | | 4,601 | |
| FHLB stock dividends | | | 1,432 | | | | 2,206 | | | | 694 | |
| Other, net | | | 2,827 | | | | 974 | | | | 755 | |
| | | $ | (9,647 | ) | | $ | 3,466 | | | $ | 3,548 | |
The components of the net deferred income tax (liabilities) assets as of September 30, 2011 and 2010 are as follows:
| | | 2011 | | | 2010 | |
| | | (Dollars in thousands) | |
| Deferred income tax assets: | | | | | | |
| Foundation contribution | | $ | 12,824 | | | $ | -- | |
| ACL | | | 3,863 | | | | 3,666 | |
| Salaries and employee benefits | | | 1,219 | | | | 1,230 | |
| ESOP compensation | | | 836 | | | | 747 | |
| Other | | | 2,630 | | | | 2,307 | |
| Gross deferred income tax assets | | | 21,372 | | | | 7,950 | |
| | | | | | | | | |
| Valuation allowance | | | (2,060 | ) | | | (280 | ) |
| Gross deferred income tax asset, net of valuation allowance | | | 19,312 | | | | 7,670 | |
| | | | | | | | | |
| Deferred income tax liabilities: | | | | | | | | |
| FHLB stock dividends | | | 18,828 | | | | 17,396 | |
| Unrealized gain on AFS securities | | | 16,203 | | | | 19,362 | |
| Other | | | 4,728 | | | | 4,156 | |
| Gross deferred income tax liabilities | | | 39,759 | | | | 40,914 | |
| | | | | | | | | |
| Net deferred tax liabilities | | $ | (20,447 | ) | | $ | (33,244 | ) |
The Company assesses the available positive and negative evidence surrounding the recoverability of its deferred tax assets and applies its judgment in estimating the amount of valuation allowance necessary under the circumstances. As of September 30, 2011, the Company had a valuation allowance of $2.1 million related to the Kansas state tax portion of the Foundation contribution and the net operating losses generated by the Company's consolidated Kansas corporate income tax return. As of September 30, 2010, the Company had a valuation allowance of $280 thousand related to the net operating losses generated by the Company's consolidated Kansas corporate income tax return. The Company's consolidated Kansas corporate income tax return at September 30, 2011 and 2010 does not include the Bank, as the Bank files a Kansas privilege tax return. Based on the nature of the operations of the companies included in the consolidated Kansas corporate return, management believes there will not be sufficient taxable income to fully utilize the deferred tax assets noted above; therefore a valuation allowance was established for the related amounts at September 30, 2011 and 2010.
ASC 740 Income Taxes prescribes a process by which the likelihood of a tax position is gauged based upon the technical merits of the position, and then a subsequent measurement relates the maximum benefit and the degree of likelihood to determine the amount of benefit to recognize in the financial statements. A reconciliation of the beginning and ending amounts of unrecognized tax benefits for the years ended September 30, 2011, 2010, and 2009 is as follows. The amounts have not been reduced by the federal deferred tax effects of unrecognized tax benefits.
| | | 2011 | | | 2010 | | | 2009 | |
| | | (Dollars in thousands) | |
| Balance at beginning of year | | $ | 114 | | | $ | 2,848 | | | $ | 2,409 | |
| Additions for tax positions related to the current year | | | -- | | | | -- | | | | 109 | |
| Additions for tax positions of prior years | | | 3 | | | | 28 | | | | 888 | |
| Reductions for tax positions of prior years | | | (49 | ) | | | (195 | ) | | | -- | |
| Reductions relating to settlement with taxing authorities | | | -- | | | | -- | | | | (97 | ) |
| Lapse of statute of limitations | | | -- | | | | (2,567 | ) | | | (461 | ) |
| Balance at end of year | | $ | 68 | | | $ | 114 | | | $ | 2,848 | |
If realized, the unrecognized tax benefits at September 30, 2011 would impact the effective tax rate. After the related deferred tax effects, realization of those benefits would reduce income tax expense by $20 thousand. Included in the unrecognized tax benefits in the table above were accrued penalties and interest of $20 thousand, $17 thousand, and $763 thousand for the years ended September 30, 2011, 2010, and 2009, respectively. Estimated penalties and interest for the years ended September 30, 2011 and 2009 was $2 thousand and $87 thousand. The net reversal of penalties and interest expense due to the lapse of statute of limitations for the years ended September 30, 2010 was $463 thousand. Estimated penalties and interest are included in income tax expense in the consolidated statements of income. It is reasonably possible that decreases in gross unrecognized tax benefits totaling less than $10 thousand may occur in fiscal year 2012 as a result of a lapse in the applicable statute of limitations.
The Company files income tax returns in the U.S. federal jurisdiction and the state of Kansas, as well as other states where it has nexus. In many cases, uncertain tax positions are related to tax years that remain subject to examination by the relevant taxing authorities. With few exceptions, the Company is no longer subject to U.S. federal and state examinations by tax authorities for fiscal years before 2008.
| 9. | EMPLOYEE BENEFIT PLANS |
The Company has a profit sharing plan (“PIT”) and an ESOP. The plans cover all employees with a minimum of one year of service, at least age 21, and at least 1,000 hours of employment in each plan year.
Profit Sharing Plan – The PIT provides for two types of discretionary contributions. The first type is an optional Bank contribution and may be 0% or any percentage above that, as determined by the Board of Directors, of an eligible employee’s eligible compensation during the fiscal year. The second contribution may be 0% or any percentage above that, as determined by the Board of Directors, of an eligible employee’s eligible compensation during the fiscal year if the employee matches 50.0% (on an after-tax basis) of the Bank’s second contribution. The PIT qualifies as a thrift and profit sharing plan for purposes of Internal Revenue Codes 401(a), 402, 412, and 417. Total Bank contributions to the PIT amounted to $105 thousand, $101 thousand, and $102 thousand for the years ended September 30, 2011, 2010, and 2009, respectively.
ESOP – The ESOP Trust acquired 3,024,574 shares (6,846,728 shares post corporate reorganization) of common stock in the Company’s initial public offering and 4,726,000 shares of common stock in the Company’s corporate reorganization in December of 2010. Both acquisitions of common stock were made with proceeds from loans from the Company. The loans are secured by shares of the Company stock purchased in each offering. The Bank has agreed to make cash contributions to the ESOP on an annual basis sufficient to enable the ESOP to make the required annual loan payments to the Company on September 30 of each year. Share information presented below relating to the shares in the ESOP trust acquired prior to the corporate reorganization has been revised to reflect the 2.2637 exchange ratio.
The loan for the shares acquired in the initial public offering bears interest at a fixed-rate of 5.80%, with future principal and interest payable annually in two remaining fixed installments of $3.0 million, as of September 30, 2011. Payments of $3.0 million consisting of principal of $2.5 million, $2.4 million, and $2.3 million and interest of $465 thousand, $604 thousand, and $735 thousand were made on September 30, 2011, 2010, and 2009, respectively. The loan matures on September 30, 2013.
The loan for the shares acquired in the corporate reorganization bears interest at a fixed-rate of 3.25% and has a 30 year term. The loan requires interest-only payments the first three years. The first interest payment of $1.2 million was paid on September 30, 2011 and the next two interest payments of $1.5 million each are payable on September 30, 2012 and 2013. Beginning in fiscal year 2014, principal and interest payments of $2.7 million will be payable annually. The loan matures on September 30, 2040.
As the annual loan payments are made, shares will be released from collateral at September 30 and allocated to qualified employees based on the proportion of their qualifying compensation to total qualifying compensation. On September 30, 2011, 531,025 shares were released from collateral, and on September 30, 2012 and September 30, 2013, 551,988 shares will be released from collateral. As ESOP shares are committed to be released from collateral, the Company records compensation expense. Dividends on unallocated ESOP shares are only applied to the debt service payments of the loan secured by the unallocated shares. Dividends on unallocated ESOP shares in excess of the debt service payment are recorded as compensation expense and distributed to participants or participants' ESOP accounts. During the years ended September 30, 2011, 2010, and 2009, the Bank paid $1.4 million, $1.1 million, and $863 thousand, respectively, of the ESOP debt payment because dividends on unallocated shares were insufficient to pay the scheduled debt payment, specifically on the loan for the shares acquired in the initial public offering. Compensation expense related to the ESOP was $8.7 million for the year ended September 30, 2011, $6.5 million for the year ended September 30, 2010, and $7.9 million for the year ended September 30, 2009. The amount included in compensation expense for dividends on unallocated ESOP shares in excess of the debt service payments was $2.7 million for the year ended September 30, 2011, which was related to the loan for the shares acquired in the corporate reorganization. There were no such amounts for the years ended September 30, 2010 and 2009.
Participants have the option to receive the dividends on allocated shares and unallocated shares in excess of debt service payments, in cash or leave the dividend in the ESOP. Dividends are reinvested in Company stock for those participants who choose to leave their dividends in the ESOP or who do not make an election. The purchase of Company stock for reinvestment of dividends is made in the open market on or about the date of the cash disbursement to the participants who opt to take dividends in cash.
Shares may be withdrawn from the ESOP Trust due to retirement, termination or death of the participant. Additionally, a participant may begin to diversify at least 25% of their ESOP shares at age 50. Following is a summary of shares held in the ESOP Trust as of September 30, 2011 and 2010:
| | | 2011 | | | 2010 | |
| | | (Dollars in thousands) | |
| Allocated ESOP shares | | | 4,393,908 | | | | 4,028,784 | |
| Unreleased ESOP shares | | | 5,564,328 | | | | 1,369,353 | |
| Total ESOP shares | | | 9,958,236 | | | | 5,398,137 | |
| | | | | | | | | |
| Fair value of unreleased ESOP shares | | $ | 58,759 | | | $ | 14,941 | |
| 10. | STOCK-BASED COMPENSATION |
The Company has an Option Plan and an RRP which are considered share-based plans. Compensation expense is recognized over the service period of the share-based payment award. The Company utilizes a fair-value-based measurement method in accounting for the share-based payment transactions with employees, except for equity instruments held by the ESOP. All share information presented below relating to stock options and RRP shares issued prior to the corporate reorganization has been revised to reflect the 2.2637 exchange ratio.
Stock Option Plan – The purpose of the Option Plan is to provide additional incentive to certain officers, directors and key employees by facilitating their purchase of a stock interest in the Company. Pursuant to the Option Plan, subject to adjustment as described below, 8,558,411 shares of common stock were reserved for issuance by the Company upon exercise of stock options granted to officers, directors and employees of the Company and the Bank from time to time under the Option Plan. The Company may issue both incentive and nonqualified stock options under the Option Plan. The Company may also award stock appreciation rights under the Option Plan, although to date no stock appreciation rights have been awarded under the Option Plan. The incentive stock options expire no later than ten years and the nonqualified stock options expire no later than fifteen years from the date of grant. The date on which the options are first exercisable is determined by the Stock Benefits Committee (“sub-committee”), a sub-committee of the Compensation Committee (“committee”) of the Board of Directors. The vesting period of the options generally ranges from three to five years. The option price is equal to the market value at the date of the grant as defined by the Option Plan.
Under the Option Plan, incentive stock options may not be granted after April 2010 and nonqualified stock options may not be granted after April 2015. At September 30, 2011, the Company had 2,856,549 shares available for future grants under the Option Plan. This includes 2,380,866 shares added back to the Option Plan through the reload feature of the plan, which provides that the maximum number of shares with respect to which awards may be made under the plan shall be increased by (i) the number of shares of common stock repurchased by the Company with an aggregate price no greater than the cash proceeds received by the Company from the exercise of options under the Option Plan; and (ii) the number of shares surrendered to the Company in payment of the exercise price of options granted under the Option Plan.
The Option Plan is administered by the sub-committee, which selects the employees and non-employee directors to whom options are to be granted and the number of shares to be granted. The exercise price may be paid in cash, shares of the common stock, or a combination of both. The option price may not be less than 100% of the fair market value of the shares on the date of the grant. In the case of any employee who is granted an incentive stock option who owns more than 10% of the outstanding common stock at the time the option is granted, the option price may not be less than 110% of the fair market value of the shares on the date of the grant, and the option shall not be exercisable after the expiration of five years from the grant date. Historically, the Company has issued shares held in treasury upon the exercise of stock options, except for the exercise of stock options after the corporate reorganization. Shares were issued by the Company for those stock options exercised after the corporate reorganization.
The fair value of stock option grants are estimated on the date of grant using the Black-Scholes option pricing model. The weighted average grant-date fair value of stock options granted during the fiscal years ended September 30, 2011, 2010, and 2009 was $0.78, $1.52, and $2.22 per share, respectively. Compensation expense attributable to stock options awards during the year ended September 30, 2011, 2010, and 2009 totaled $131 thousand ($122 thousand, net of tax), $214 thousand ($189 thousand, net of tax), and $281 thousand ($240 thousand, net of tax), respectively. The following weighted average assumptions were used for valuing stock option grants for the years noted:
| | | 2011 | | | 2010 | | | 2009 | |
| | | | | | | | | | |
| Risk-free interest rate | | | 1.3 | % | | | 2.1 | % | | | 2.1 | % |
| Expected life (years) | | | 5 | | | | 4 | | | | 4 | |
| Expected volatility | | | 25 | % | | | 25 | % | | | 24 | % |
| Dividend yield | | | 8.1 | % | | | 6.2 | % | | | 4.8 | % |
| Estimated forfeitures | | | 12.9 | % | | | 3.3 | % | | | 10.5 | % |
The risk-free interest rate was determined using the yield available on the option grant date for a zero-coupon U.S. Treasury security with a term equivalent to the expected life of the option. The expected life for options granted was based upon historical experience. The expected volatility was determined using historical volatilities based on historical stock prices. The dividend yield was determined based upon historical quarterly dividends and the Company’s stock price on the option grant date. Estimated forfeitures were determined based upon voluntary termination behavior and actual option forfeitures.
A summary of option activity for the years ended September 30, 2011, 2010, and 2009 follows:
| | | 2011 | | | 2010 | | | 2009 | |
| | | | | | Weighted | | | | | | Weighted | | | | | | Weighted | |
| | | | | | Average | | | | | | Average | | | | | | Average | |
| | | Number | | | Exercise | | | Number | | | Exercise | | | Number | | | Exercise | |
| | | of Options | | | Price | | | of Options | | | Price | | | of Options | | | Price | |
| | | | | | | | | | | | | | | | | | | |
| Options outstanding | | | | | | | | | | | | | | | | | | |
| at beginning of year | | | 919,639 | | | $ | 15.08 | | | | 841,991 | | | $ | 14. 69 | | | | 912,879 | | | $ | 13.10 | |
| Granted | | | 2,030 | | | | 10.86 | | | | 119,945 | | | | 14.25 | | | | 94,460 | | | | 18.57 | |
| Forfeited | | | (10,180 | ) | | | 16.59 | | | | -- | | | | -- | | | | -- | | | | -- | |
| Exercised | | | (4,525 | ) | | | 8.23 | | | | (42,297 | ) | | | 4.96 | | | | (165,348 | ) | | | 8.08 | |
| Options outstanding | | | | | | | | | | | | | | | | | | | | | | | | |
| at end of year | | | 906,964 | | | $ | 15.09 | | | | 919,639 | | | $ | 15.08 | | | | 841,991 | | | $ | 14.69 | |
During the years ended September 30, 2011, 2010, and 2009, the total pretax intrinsic value of stock options exercised was $19 thousand, $361 thousand, and $1.7 million, respectively, and the tax benefits realized from the exercise of stock options were $7 thousand, $89 thousand, and $515 thousand, respectively. The fair value of stock options vested during the year ended September 30, 2011, 2010, and 2009 was $150 thousand, $264 thousand, and $297 thousand, respectively.
The following summarizes information about the stock options outstanding and exercisable as of September 30, 2011:
| | | | Options Outstanding | |
| | | | | | | Weighted | | | Weighted | | | | |
| | | | | | | Average | | | Average | | | | |
| | | | Number | | | Remaining | | | Exercise | | | Aggregate | |
| Exercise | | | of Options | | | Contractual | | | Price per | | | Intrinsic | |
| Price | | | Outstanding | | | Life (in years) | | | Share | | | Value | |
| | | | (Dollars in thousands, except per share amounts) | |
| $ | 4.07 | | | | 8,783 | | | | 3.55 | | | $ | 4.07 | | | $ | 57 | |
| | 6.19 - 8.69 | | | | -- | | | | -- | | | | -- | | | | -- | |
| | 10.86 - 12.71 | | | | 6,550 | | | | 4.95 | | | | 11.42 | | | | -- | |
| | 13.33 - 17.59 | | | | 839,601 | | | | 7.52 | | | | 14.98 | | | | -- | |
| | 19.19 | | | | 52,030 | | | | 7.08 | | | | 19.19 | | | | -- | |
| | | | | | 906,964 | | | | 7.44 | | | $ | 15.09 | | | $ | 57 | |
| | | | | | | | | | | | | | | | | | | |
| | | | | | | | | | | | | | | | | | | |
| | | | | Options Exercisable | |
| | | | | | | | | Weighted | | | Weighted | | | | | |
| | | | | | | | | Average | | | Average | | | | | |
| | | | | Number | | | Remaining | | | Exercise | | | Aggregate | |
| Exercise | | | of Options | | | Contractual | | | Price per | | | Intrinsic | |
| Price | | | Exercisable | | | Life (in years) | | | Share | | | Value | |
| | | | | (Dollars in thousands, except per share amounts) | |
| $ | 4.07 | | | | 8,783 | | | | 3.55 | | | $ | 4.07 | | | $ | 57 | |
| | 6.19 - 8.69 | | | | -- | | | | -- | | | | -- | | | | -- | |
| | 10.86 - 12.71 | | | | 4,926 | | | | 1.93 | | | | 11.61 | | | | -- | |
| | 13.33 - 17.59 | | | | 727,349 | | | | 7.23 | | | | 15.03 | | | | -- | |
| | 19.19 | | | | 31,218 | | | | 7.08 | | | | 19.19 | | | | -- | |
| | | | | | 772,276 | | | | 7.14 | | | $ | 15.05 | | | $ | 57 | |
The aggregate intrinsic value in the preceding table represents the total pre-tax intrinsic value, based on the Company’s closing stock price of $10.56 as of September 30, 2011, which would have been received by the option holders had all option holders exercised their options as of that date. The total number of in-the-money options exercisable as of September 30, 2011 was 8,783.
As of September 30, 2011, the total future compensation cost related to non-vested stock options not yet recognized in the consolidated statements of income was $148 thousand and the weighted average period over which these awards are expected to be recognized was 1.84 years.
Recognition and Retention Plan – The objective of the RRP is to enable the Company and the Bank to retain personnel of experience and ability in key positions of responsibility. Employees and directors of the Bank are eligible to receive benefits under the RRP at the sole discretion of the sub-committee. The total number of shares originally eligible to be granted under the RRP was 3,423,364. At September 30, 2011, the Company had 358,767 shares available for future grants under the RRP. The RRP expires in April 2015. No additional grants may be made after expiration, but outstanding grants continue until they are individually vested, forfeited, or expire.
Compensation expense in the amount of the fair market value of the common stock at the date of the grant, as defined by the RRP, to the employee is recognized over the period during which the shares vest. Compensation expense attributable to RRP awards during the years ended September 30, 2011, 2010, and 2009 totaled $131 thousand ($88 thousand, net of tax), $238 thousand ($153 thousand, net of tax), and $323 thousand ($204 thousand, net of tax), respectively. A recipient of such restricted stock will be entitled to all voting and other stockholder rights (including the right to receive dividends on vested and non-vested shares), except that the shares, while restricted, may not be sold, pledged or otherwise disposed of and are required to be held in escrow by the Company. If a holder of such restricted stock terminates employment for reasons other than death or disability, the employee forfeits all rights to the non-vested shares under restriction. If the participant’s service terminates as a result of death, disability, or if a change in control of the Bank occurs, all restrictions expire and all non-vested shares become unrestricted.
A summary of RRP share activity for the years ended September 30, 2011, 2010, and 2009 follows:
| | | 2011 | | | 2010 | | | 2009 | |
| | | | | | Weighted | | | | | | Weighted | | | | | | Weighted | |
| | | | | | Average | | | | | | Average | | | | | | Average | |
| | | Number | | | Grant Date | | | Number | | | Grant Date | | | Number | | | Grant Date | |
| | | of Shares | | | Fair Value | | | of Shares | | | Fair Value | | | of Shares | | | Fair Value | |
| Unvested RRP shares | | | | | | | | | | | | | | | | | | |
| at beginning of year: | | | 23,762 | | | $ | 15.07 | | | | 34,177 | | | $ | 15.17 | | | | 52,509 | | | $ | 14.87 | |
| Granted | | | -- | | | | -- | | | | 11,317 | | | | 14.42 | | | | 5,657 | | | | 17.64 | |
| Vested | | | (10,180 | ) | | | 15.30 | | | | (21,732 | ) | | | 14.88 | | | | (23,989 | ) | | | 15.10 | |
| Forfeited | | | -- | | | | -- | | | | -- | | | | -- | | | | -- | | | | -- | |
| Unvested RRP shares | | | | | | | | | | | | | | | | | | | | | | | | |
| at end of year | | | 13,582 | | | $ | 14.90 | | | | 23,762 | | | $ | 15.07 | | | | 34,177 | | | $ | 15.17 | |
The estimated forfeiture rate for the RRP shares granted during the year ended September 30, 2011, 2010, and 2009 was 0% based upon voluntary termination behavior and actual forfeitures. The fair value of RRP shares that vested during the years ended September 30, 2011, 2010, and 2009 totaled $120 thousand, $324 thousand, and $363 thousand, respectively. As of September 30, 2011, there was $124 thousand of unrecognized compensation cost related to non-vested RRP shares to be recognized over a weighted average period of 1.9 years.
| 11. | PERFORMANCE BASED COMPENSATION |
The Company and the Bank have a short-term performance plan for all officers and a deferred incentive bonus plan for senior and executive officers. The short-term performance plan has a component tied to Company performance and a component tied to individual participant performance. Individual performance criteria are established by executive management for eligible non-executive employees of the Bank; individual performance of executive officers is reviewed by the committee. Company performance criteria are approved by the committee. Short-term performance plan awards are granted based upon a performance review by the committee. The committee may exercise its discretion and reduce or not grant awards. The deferred incentive bonus plan is intended to operate in conjunction with the short-term performance plan. A participant in the deferred incentive bonus plan can elect to defer into an account between $2 thousand and up to 50% (executive officers can defer up to 50%, while senior officers can elect to defer up to 35%) of the short-term performance plan award up to but not exceeding $100 thousand. The amount deferred receives an employer match of up to 50% that is accrued over a three year mandatory deferral period. The amount deferred, plus up to a 50% match, is deemed to have been invested in Company stock on the last business day of the calendar year preceding the receipt of the short-term performance plan award, in the form of phantom stock. The number of shares deemed purchased in phantom stock receives dividend equivalents as if the stock were owned by the officer. At the end of the mandatory deferral period, the deferred incentive bonus plan award is paid out in cash and is comprised of the initial amount deferred, the match amount, dividend equivalents on the phantom shares over the deferral period and the increase in the market value of the Company’s stock over the deferral period, if any, on the phantom shares. There is no provision for the reduction of the deferred incentive bonus plan award if the market value of the Company’s stock at the time is lower than the market value at the time of the deemed investment. The total amount of short-term performance plan awards provided for the years ended September 30, 2011, 2010, and 2009 amounted to $1.8 million, $1.7 million, and $1.1 million, respectively, of which $345 thousand, $332 thousand, and $137 thousand, respectively, was deferred under the deferred incentive bonus plan. The deferrals, any earnings on those deferrals and increases in the market value of the phantom shares, if any, will be paid in 2013, 2014, and 2015. During fiscal years 2011, 2010, and 2009, the amount expensed in conjunction with the deferred amounts was $153 thousand, $86 thousand, and $51 thousand, respectively.
| 12. | COMMITMENTS AND CONTINGENCIES |
The Bank had commitments outstanding to originate and purchase loans as of September 30, 2011 and 2010 as follows:
| | | 2011 | | | 2010 | |
| | | (Dollars in thousands) | |
| Originate fixed-rate | | $ | 89,059 | | | $ | 75,001 | |
| Originate adjustable-rate | | | 24,047 | | | | 20,144 | |
| Purchase/participate fixed-rate | | | 30,650 | | | | 3,526 | |
| Purchase/participate adjustable-rate | | | 26,556 | | | | 8,395 | |
| | | $ | 170,312 | | | $ | 107,066 | |
As of September 30, 2011 and 2010, the Bank had approved but unadvanced home equity lines of credit and outstanding commitments on commercial loans of $265.5 million and $266.5 million, respectively. Approval of lines of credit is based upon underwriting standards that do not allow total borrowings, including existing mortgages and lines of credit, to exceed 90% of the estimated market value of the customer’s home. Prior to June 2010, the limit was 95% of the estimated market value of the customer’s home.
Commitments to originate mortgage and non-mortgage loans are agreements to lend to a customer as long as there is no violation of any condition established in the contract. Commitments generally have fixed expiration dates or other termination clauses and may require the payment of a rate lock fee. Some of the commitments are expected to expire without being fully drawn upon; therefore the amount of total commitments disclosed above does not necessarily represent future cash requirements. The Bank evaluates each customer’s creditworthiness on a case-by-case basis. The amount of collateral obtained, if considered necessary by the Bank, upon extension of credit is based on management’s credit evaluation of the customer. As of September 30, 2011 and 2010, there were no significant loan-related commitments that met the definition of derivatives or commitments to sell mortgage loans.
As of September 30, 2011, the Bank had $1.7 million of agreements outstanding in connection with the remodeling of the Bank’s home office.
| 13. | REGULATORY CAPITAL REQUIREMENTS |
The Bank is subject to various regulatory capital requirements administered by the federal banking agencies. Failure to meet minimum capital requirements can initiate certain mandatory, and possibly additional discretionary, actions by regulators that, if undertaken, could have a material adverse effect on the Company’s financial statements. Under capital adequacy guidelines and the regulatory framework for prompt corrective action, the Bank must meet specific capital guidelines that involve quantitative measures of the Bank’s assets, liabilities, and certain off-balance-sheet items as calculated under regulatory accounting practices. The Bank’s capital amounts and classifications are also subject to qualitative judgments by regulators about components, risk weightings, and other factors.
The Bank’s primary regulatory agency requires that the Bank maintain minimum ratios of tangible equity of 1.5%, Tier 1 (core) capital of 4%, and total risk-based capital of 8%. As of September 30, 2011 and 2010, the most recent regulatory guidelines categorized the Bank as “well capitalized” under the regulatory framework for prompt corrective action. To be categorized as “well capitalized,” the Bank must maintain minimum Tier 1 (core) capital, Tier 1 risked based capital and total risk-based capital ratios as set forth in the table below. Management believes, as of September 30, 2011, that the Bank meets all capital adequacy requirements to which it is subject and there were no conditions or events subsequent to September 30, 2011 that would change the Bank’s category. There are currently no regulatory capital requirements at the Company, but under the Dodd-Frank Act, the Company will become subject to regulatory capital requirements beginning July 21, 2015.
| | | | | | | | | | | | | | | To Be Well | |
| | | | | | | | | | | | | | | Capitalized | |
| | | | | | | | | | | | | | | Under Prompt | |
| | | | | | | | | For Capital | | | Corrective Action | |
| | | Actual | | | Adequacy Purposes | | | Provisions | |
| | | Amount | | | Ratio | | | Amount | | | Ratio | | | Amount | | | Ratio | |
| | | (Dollars in thousands) | |
| As of September 30, 2011: | | | | | | | | | | | | | | | | | | |
| Tangible equity | | $ | 1,369,143 | | | | 15.1 | % | | $ | 135,926 | | | | 1.5 | % | | | N/A | | | | N/A | |
| Tier 1 (core) capital | | | 1,369,143 | | | | 15.1 | | | | 362,469 | | | | 4.0 | | | $ | 453,086 | | | | 5.0 | % |
| Tier 1 (core) risk-based capital | | | 1,369,143 | | | | 37.9 | | | | N/A | | | | N/A | | | | 216,551 | | | | 6.0 | |
| Total risk-based capital | | | 1,380,853 | | | | 38.3 | | | | 288,734 | | | | 8.0 | | | | 360,918 | | | | 10.0 | |
| | | | | | | | | | | | | | | | | | | | | | | | | |
| As of September 30, 2010: | | | | | | | | | | | | | | | | | | | | | | | | |
| Tangible equity | | $ | 824,768 | | | | 9.8 | % | | $ | 126,666 | | | | 1.5 | % | | | N/A | | | | N/A | |
| Tier 1 (core) capital | | | 824,768 | | | | 9.8 | | | | 337,776 | | | | 4.0 | | | $ | 422,220 | | | | 5.0 | % |
| Tier 1 (core) risk-based capital | | | 824,768 | | | | 23.5 | | | | N/A | | | | N/A | | | | 210,597 | | | | 6.0 | |
| Total risk-based capital | | | 835,324 | | | | 23.8 | | | | 280,796 | | | | 8.0 | | | | 350,995 | | | | 10.0 | |
| | A reconciliation of the Bank’s equity under GAAP to regulatory capital amounts as of September 30, 2011 and 2010 is as follows: |
| | | 2011 | | | 2010 | |
| | | (Dollars in thousands) | |
| Total Bank equity as reported under GAAP | | $ | 1,395,708 | | | $ | 857,114 | |
| Unrealized gains on AFS securities | | | (26,314 | ) | | | (31,862 | ) |
| Other | | | (251 | ) | | | (484 | ) |
| Total tangible and core capital | | | 1,369,143 | | | | 824,768 | |
ACL(1) | | | 11,710 | | | | 10,556 | |
| Total risk based capital | | $ | 1,380,853 | | | $ | 835,324 | |
| (1) | This amount represents the general valuation allowances calculated using the formula analysis. SVA are netted against the related loan balance on the Thrift Financial Report and are therefore not included in this amount. |
Under OCC and FRB regulations, there are limitations on the amount of capital the Bank may distribute to the Company. Generally, this is limited to the earnings of the previous two calendar years and current year-to-date earnings. Under OCC and FRB safe harbor regulations, the Bank may distribute to the Company capital not exceeding net income for the current calendar year and the prior two calendar years. At September 30, 2011, the Bank was in compliance with the OCC and FRB safe harbor regulations. So long as the Bank continues to remain “well capitalized” after each capital distribution, operate in a safe and sound manner, provide the OCC and FRB with updated capital levels, and non-performing asset balances and allowance for credit loss information as requested, and comply with OCC interest rate risk management guidelines, it is management’s belief that the OCC and FRB will continue to allow the Bank to distribute its net income to the Company, although no assurance can be given in this regard.
| 14. | FAIR VALUE OF FINANCIAL INSTRUMENTS |
Fair Value Measurements - ASC 820, Fair Value Measurements and Disclosures, defines fair value, establishes a framework for measuring fair value and expands disclosures about fair value measurements. ASC 820 applies only to fair value measurements already required or permitted by other accounting standards and does not impose requirements for additional fair value measures. ASC 820 was issued to increase consistency and comparability in reporting fair values.
The Company uses fair value measurements to record fair value adjustments to certain assets and to determine fair value disclosures. The Company did not have any liabilities that were measured at fair value at September 30, 2011 and 2010. The Company’s AFS securities are recorded at fair value on a recurring basis. Additionally, from time to time, the Company may be required to record at fair value other assets or liabilities on a non-recurring basis, such as REO, LHFS, and impaired loans. These non-recurring fair value adjustments involve the application of lower-of-cost-or-fair value accounting or write-downs of individual assets.
In accordance with ASC 820, the Company groups its assets at fair value in three levels, based on the markets in which the assets are traded and the reliability of the assumptions used to determine fair value. These levels are:
| • | | Level 1 — Valuation is based upon quoted prices for identical instruments traded in active markets. |
| | | |
| • | | Level 2 — Valuation is based upon quoted prices for similar instruments in active markets, quoted prices for identical or similar instruments in markets that are not active, and model-based valuation techniques for which all significant assumptions are observable in the market. |
| | | |
| • | | Level 3 — Valuation is generated from model-based techniques that use significant assumptions not observable in the market. These unobservable assumptions reflect the Company’s own estimates of assumptions that market participants would use in pricing the asset or liability. Valuation techniques include the use of option pricing models, discounted cash flow models, and similar techniques. The results cannot be determined with precision and may not be realized in an actual sale or immediate settlement of the asset or liability. |
The Company bases its fair values on the price that would be received to sell an asset in an orderly transaction between market participants at the measurement date. As required by ASC 820, the Company maximizes the use of observable inputs and minimizes the use of unobservable inputs when measuring fair value.
The following is a description of valuation methodologies used for assets measured at fair value on a recurring basis.
AFS Securities - The Company’s AFS securities portfolio is carried at estimated fair value, with any unrealized gains and losses, net of taxes, reported as AOCI in stockholders' equity. The Company’s major security types based on the nature and risks of the securities are included in the table below. The majority of the securities within the AFS portfolio are issued by U.S. GSEs. The fair values for all AFS securities are based on quoted prices for similar securities. Various modeling techniques are used to determine pricing for the Company’s securities, including option pricing and discounted cash flow models. The inputs to these models may include benchmark yields, reported trades, broker/dealer quotes, issuer spreads, benchmark securities, bids, offers and reference data. There is an AFS security in the AFS portfolio that has significant unobservable inputs requiring the independent pricing services to use some judgment in determining its fair value. This AFS security is classified as Level 3. All other AFS securities are classified as Level 2.
The following tables provide the level of valuation assumption used to determine the carrying value of the Company’s AFS securities measured at fair value on a recurring basis at September 30, 2011 and 2010.
| | | September 30, 2011 | |
| | | | | | Quoted Prices | | | Significant | | | Significant | |
| | | | | | in Active Markets | | | Other Observable | | | Unobservable | |
| | | Carrying | | | for Identical Assets | | | Inputs | | | Inputs | |
| | | Value | | | (Level 1) | | | (Level 2) | | | (Level 3)(1) | |
| | | (Dollars in thousands) | |
| AFS securities | | | | | | | | | | | | |
| GSE debentures | | $ | 748,308 | | | $ | -- | | | $ | 748,308 | | | $ | -- | |
| Municipal bonds | | | 2,754 | | | | -- | | | | 2,754 | | | | -- | |
| Trust preferred securities | | | 2,941 | | | | -- | | | | -- | | | | 2,941 | |
| MBS | | | 732,436 | | | | -- | | | | 732,436 | | | | -- | |
| | | $ | 1,486,439 | | | $ | -- | | | $ | 1,483,498 | | | $ | 2,941 | |
| | | | | | | | | | | | | | | | | |
| | | September 30, 2010 | |
| | | | | | | Quoted Prices | | | Significant | | | Significant | |
| | | | | | | in Active Markets | | | Other Observable | | | Unobservable | |
| | | Carrying | | | for Identical Assets | | | Inputs | | | Inputs | |
| | | Value | | | (Level 1) | | | (Level 2) | | | (Level 3)(2) | |
| | | (Dollars in thousands) | |
| AFS securities | | | | | | | | | | | | | | | | |
| GSE debentures | | $ | 50,255 | | | $ | -- | | | $ | 50,255 | | | $ | -- | |
| Municipal bonds | | | 2,819 | | | | -- | | | | 2,819 | | | | -- | |
| Trust preferred securities | | | 2,796 | | | | -- | | | | -- | | | | 2,796 | |
| MBS | | | 1,004,496 | | | | -- | | | | 1,004,496 | | | | -- | |
| | | $ | 1,060,366 | | | $ | -- | | | $ | 1,057,570 | | | $ | 2,796 | |
| (1) | The Company’s Level 3 AFS securities have had no activity from September 30, 2010 to September 30, 2011, except for principal repayments of $87 thousand and reductions in net unrealized losses recognized in other comprehensive income. Reductions of net unrealized losses included in other comprehensive income for the year ended September 30, 2011 were $115 thousand. |
| (2) | The Company’s Level 3 AFS securities have had no activity from September 30, 2009 to September 30, 2010, except for principal repayments of $93 thousand and reductions in net unrealized losses recognized in other comprehensive income. Reductions of net unrealized losses included in other comprehensive income for the year ended September 30, 2010 were $460 thousand. |
The following is a description of valuation methodologies used for significant assets measured at fair value on a non-recurring basis.
Loans Receivable - Loans which meet certain criteria are evaluated individually for impairment. A loan is considered impaired when, based upon current information and events, it is probable the Bank will be unable to collect all amounts due, including principal and interest, according to the contractual terms of the loan agreement. The unpaid principal balance of impaired loans at September 30, 2011 and 2010 was $72.0 million and $57.1 million, respectively. Substantially all of the Bank’s impaired loans at September 30, 2011 and 2010 were secured by residential real estate. These impaired loans are individually assessed to ensure that the carrying value of the loan is not in excess of the fair value of the collateral, less estimated selling costs. Fair value is estimated through current appraisals, AVMs, BPOs, or listing prices in the event of a possible short sale. Fair values may be adjusted by management to reflect current economic and market conditions and, as such, are classified as Level 3. Based on this evaluation, the Company maintained an ACL of $3.8 million and $4.3 million at September 30, 2011 and 2010, respectively, for such impaired loans.
REO, net - REO primarily represents residential real estate acquired as a result of foreclosure or by deed in lieu of foreclosure and is carried at lower-of-cost or fair value. Fair value is estimated through current appraisals, AVMs, BPOs, or listing prices. As these properties are actively marketed, estimated fair values may be adjusted by management to reflect current economic and market conditions and, as such, are classified as Level 3. The fair value of REO at September 30, 2011 and 2010 was $11.3 million and $9.9 million, respectively.
The following tables provide the level of valuation assumption used to determine the carrying value of the Company’s assets measured at fair value on a non-recurring basis at September 30, 2011 and 2010.
| | | September 30, 2011 | |
| | | | | | Quoted Prices | | | Significant | | | Significant | |
| | | | | | in Active Markets | | | Other Observable | | | Unobservable | |
| | | Carrying | | | for Identical Assets | | | Inputs | | | Inputs | |
| | | Value | | | (Level 1) | | | (Level 2) | | | (Level 3) | |
| | | (Dollars in thousands) | |
| Impaired loans | | $ | 72,048 | | | $ | -- | | | $ | -- | | | $ | 72,048 | |
| REO, net | | | 11,321 | | | | -- | | | | -- | | | | 11,321 | |
| | | $ | 83,369 | | | $ | -- | | | $ | -- | | | $ | 83,369 | |
| | | | | | | | | | | | | | | | | |
| | | September 30, 2010 | |
| | | | | | | Quoted Prices | | | Significant | | | Significant | |
| | | | | | | in Active Markets | | | Other Observable | | | Unobservable | |
| | | Carrying | | | for Identical Assets | | | Inputs | | | Inputs | |
| | | Value | | | (Level 1) | | | (Level 2) | | | (Level 3) | |
| | | (Dollars in thousands) | |
| Impaired loans | | $ | 57,118 | | | $ | -- | | | $ | -- | | | $ | 57,118 | |
| REO, net | | | 9,920 | | | | -- | | | | -- | | | | 9,920 | |
| | | $ | 67,038 | | | $ | -- | | | $ | -- | | | $ | 67,038 | |
Fair Value Disclosures - The Company determined estimated fair value amounts using available market information and a selection from a variety of valuation methodologies. However, considerable judgment is required to interpret market data to develop the estimates of fair value. Accordingly, the estimates presented are not necessarily indicative of the amount the Company could realize in a current market exchange. The use of different market assumptions and estimation methodologies may have a material impact on the estimated fair value amounts. The fair value estimates presented herein are based on pertinent information available to management as of September 30, 2011 and 2010. Although management is not aware of any factors that would significantly affect the estimated fair value amounts, such amounts have not been comprehensively revalued for purposes of these financial statements since those dates. The carrying amounts and estimated fair values of the Company’s financial instruments as of September 30, 2011 and 2010 were as follows:
| | | 2011 | | | 2010 | |
| | | | | | Estimated | | | | | | Estimated | |
| | | Carrying | | | Fair | | | Carrying | | | Fair | |
| | | Amount | | | Value | | | Amount | | | Value | |
| | | (Dollars in thousands) | |
| Assets: | | | | | | | | | | | | |
| Cash and cash equivalents | | $ | 121,070 | | | $ | 121,070 | | | $ | 65,217 | | | $ | 65,217 | |
| AFS securities | | | 1,486,439 | | | | 1,486,439 | | | | 1,060,366 | | | | 1,060,366 | |
| HTM securities | | | 2,370,117 | | | | 2,434,392 | | | | 1,880,154 | | | | 1,913,454 | |
| Loans receivable | | | 5,149,734 | | | | 5,475,150 | | | | 5,168,202 | | | | 5,392,550 | |
| BOLI | | | 56,534 | | | | 56,534 | | | | 54,710 | | | | 54,710 | |
| Capital stock of FHLB | | | 126,877 | | | | 126,877 | | | | 120,866 | | | | 120,866 | |
Liabilities: | | | | | | | | | | | | | | | | |
| Deposits | | | 4,495,173 | | | | 4,553,516 | | | | 4,386,310 | | | | 4,459,052 | |
| FHLB Advances | | | 2,379,462 | | | | 2,569,958 | | | | 2,348,371 | | | | 2,557,064 | |
| Other borrowings | | | 515,000 | | | | 545,096 | | | | 668,609 | | | | 701,099 | |
The following methods and assumptions were used to estimate the fair value of the financial instruments:
Cash and Cash Equivalents - The carrying amounts of cash and cash equivalents are considered to approximate their fair value due to the nature of the financial asset.
AFS and HTM Securities - Estimated fair values of securities are based on one of three methods: 1) quoted market prices where available, 2) quoted market prices for similar instruments if quoted market prices are not available, 3) unobservable data that represents the Bank’s assumptions about items that market participants would consider in determining fair value where no market data is available. AFS securities are carried at estimated fair value. HTM securities are carried at amortized cost.
Loans Receivable - Fair values are estimated for portfolios with similar financial characteristics. Loans are segregated by type, such as one- to four-family residential mortgages, multi-family residential mortgages, nonresidential, and installment loans. Each loan category is further segmented into fixed- and adjustable interest rate categories. Market pricing sources are used to approximate the estimated fair value of fixed- and adjustable-rate one- to four-family residential mortgages. For all other loan categories, future cash flows are discounted using the LIBOR curve plus a margin at which similar loans would be made to borrowers with similar credit ratings and for the same remaining maturity.
BOLI - The carrying value of BOLI is considered to approximate its fair value due to the nature of the financial asset.
Capital Stock of FHLB - The carrying value of FHLB stock equals cost. The fair value is based on redemption at par value.
Deposits - The estimated fair value of demand deposits, savings, and money market accounts is the amount payable on demand at the reporting date. The estimated fair value of fixed-maturity certificates of deposit is estimated by discounting the future cash flows using a margin to the LIBOR curve.
Advances from FHLB - The estimated fair value of advances from FHLB is determined by discounting the future cash flows of each advance using a margin to the LIBOR curve.
Other Borrowings - The estimated fair value of the repurchase agreements is determined by discounting the future cash flows of each agreement using a margin to the LIBOR curve. The Debentures had a variable rate structure, with the ability to redeem at par; therefore, the carrying value of the Debentures approximated their estimated fair value at September 30, 2010. The Debentures were redeemed in April 2011.
In preparing these financial statements, management has evaluated events occurring subsequent to September 30, 2011, for potential recognition and disclosure. There have been no material events or transactions which would require adjustments to the consolidated financial statements at September 30, 2011.
| 16. | SELECTED QUARTERLY FINANCIAL DATA (UNAUDITED) |
The following tables present summarized quarterly data for each of the years indicated for the Company. In December 2010, Capitol Federal Financial completed its corporate reorganization. All share information used to calculate EPS in the consolidated financial statements prior to the corporate reorganization has been revised to reflect the 2.2637 exchange ratio and is reflected in the following tables.
| | | | | | | | | | |
| | | First | | | Second | | | Third | | | Fourth | | | | |
| | | Quarter | | | Quarter | | | Quarter | | | Quarter | | | Total | |
| | | (Dollars and counts in thousands, except per share amounts) | |
| 2011 | | | | | | | | | | | | | | | |
| Total interest and dividend income | | $ | 87,247 | | | $ | 84,941 | | | $ | 88,083 | | | $ | 86,594 | | | $ | 346,865 | |
| Net interest and dividend income | | | 40,005 | | | | 40,556 | | | | 44,308 | | | | 43,865 | | | | 168,734 | |
| Provision for credit losses | | | 650 | | | | 520 | | | | 1,240 | | | | 1,650 | | | | 4,060 | |
| Net income (loss) | | | (11,258 | ) | | | 15,636 | | | | 17,259 | | | | 16,766 | | | | 38,403 | |
| Basic earnings (loss) per share | | | (0.07 | ) | | | 0.10 | | | | 0.10 | | | | 0.10 | | | | 0.24 | |
| Diluted earnings (loss) per share | | | (0.07 | ) | | | 0.10 | | | | 0.10 | | | | 0.10 | | | | 0.24 | |
| Dividends paid per public share | | | 0.800 | | | | 0.675 | | | | 0.075 | | | | 0.075 | | | | 1.625 | |
| Average number of shares outstanding | | | 165,541 | | | | 161,500 | | | | 161,642 | | | | 161,784 | | | | 162,625 | |
| | | | | | | | | | | | | | | | | | | | | |
| 2010 | | | | | | | | | | | | | | | | | | | | |
| Total interest and dividend income | | $ | 98,887 | | | $ | 93,707 | | | $ | 91,485 | | | $ | 89,972 | | | $ | 374,051 | |
| Net interest and dividend income | | | 44,854 | | | | 42,683 | | | | 40,887 | | | | 41,141 | | | | 169,565 | |
| Provision for credit losses | | | 3,115 | | | | 3,200 | | | | 1,816 | | | | 750 | | | | 8,881 | |
| Net income | | | 20,980 | | | | 14,655 | | | | 16,758 | | | | 15,447 | | | | 67,840 | |
| Basic EPS | | | 0.13 | | | | 0.09 | | | | 0.10 | | | | 0.09 | | | | 0.41 | |
| Diluted EPS | | | 0.13 | | | | 0.09 | | | | 0.10 | | | | 0.09 | | | | 0.41 | |
| Dividends paid per public share | | | 0.790 | | | | 0.500 | | | | 0.500 | | | | 0.500 | | | | 2.290 | |
| Average number of shares outstanding | | | 165,854 | | | | 165,734 | | | | 165,869 | | | | 165,989 | | | | 165,862 | |
| 17. | PARENT COMPANY FINANCIAL INFORMATION (PARENT COMPANY ONLY) |
The Company serves as the holding company for the Bank (see Note 1). The Company’s (parent company only) balance sheets as of September 30, 2011 and 2010, and the related statements of income and cash flows for each of the three years in the period ended September 30, 2011 are as follows:
| BALANCE SHEETS | | | | | | |
| SEPTEMBER 30, 2011 and 2010 | | | | | | |
| (Dollars in thousands, except share amounts) | | | | | | |
| | | | | | | |
| | | 2011 | | | 2010 | |
| ASSETS | | | | | | |
| Cash and cash equivalents | | $ | 113,101 | | | $ | 88,098 | |
| Investment in the Bank | | | 1,395,708 | | | | 857,115 | |
| AFS securities, at fair value (amortized cost of $362,271 and $0) | | | 362,875 | | | | -- | |
| Investment in certificates of deposit at the Bank | | | -- | | | | 55,000 | |
| Note receivable - ESOP | | | 52,759 | | | | 8,024 | |
| Other assets | | | 75 | | | | 7,604 | |
| Accrued interest receivable | | | 1,812 | | | | -- | |
| Income taxes receivable | | | 2,855 | | | | 138 | |
| Deferred income tax assets | | | 10,409 | | | | -- | |
| TOTAL ASSETS | | $ | 1,939,594 | | | $ | 1,015,979 | |
| | | | | | | | | |
| LIABILITIES AND STOCKHOLDERS’ EQUITY | | | | | | | | |
| | | | | | | | | |
| LIABILITIES: | | | | | | | | |
| Accounts payable and accrued expenses | | $ | 65 | | | $ | 420 | |
| Other borrowings | | | -- | | | | 53,609 | |
| Total liabilities | | | 65 | | | | 54,029 | |
| | | | | | | | | |
| STOCKHOLDERS’ EQUITY: | | | | | | | | |
| Preferred stock, $.01 par value; 100,000,000 shares authorized, | | | | | | | | |
| no shares issued or outstanding | | | -- | | | | -- | |
| Common stock, $.01 par value; 1,400,000,000 shares authorized, | | | | | | | | |
| 167,498,133 shares issued; 167,498,133 and 73,992,678 shares | | | 1,675 | | | | 915 | |
| outstanding as of September 30, 2011 and 2010, respectively | | | | | | | | |
| Additional paid-in capital | | | 1,392,691 | | | | 457,795 | |
| Unearned compensation - ESOP | | | (50,547 | ) | | | (6,050 | ) |
| Unearned compensation - RRP | | | (124 | ) | | | (255 | ) |
| Retained earnings | | | 569,127 | | | | 801,044 | |
| AOCI, net of tax | | | 26,707 | | | | 31,862 | |
| | | | 1,939,529 | | | | 1,285,311 | |
| Treasury stock, at cost, 0 and 17,519,609 shares as of | | | | | | | | |
| September 30, 2011 and 2010, respectively | | | -- | | | | (323,361 | ) |
| | | | | | | | | |
| Total stockholders’ equity | | | 1,939,529 | | | | 961,950 | |
| | | | | | | | | |
| TOTAL LIABILITIES AND STOCKHOLDERS’ EQUITY | | $ | 1,939,594 | | | $ | 1,015,979 | |
| STATEMENTS OF INCOME | | | | | | | | | |
| YEARS ENDED SEPTEMBER 30, 2011, 2010, and 2009 | | | | | | | | | |
| (Dollars in thousands) | | | | | | | | | |
| | | | | | | | | | |
| | | 2011 | | | 2010 | | | 2009 | |
| | | | | | | | | | |
| INTEREST AND DIVIDEND INCOME: | | | | | | | | | |
| Dividend income from the Bank | | $ | 45,643 | | | $ | 84,869 | | | $ | 50,056 | |
| Interest income from other investments | | | 3,221 | | | | 2,927 | | | | 3,612 | |
| Interest income from securities | | | 1,093 | | | | -- | | | | -- | |
| Total interest and dividend income | | | 49,957 | | | | 87,796 | | | | 53,668 | |
| | | | | | | | | | | | | |
| INTEREST EXPENSE | | | 855 | | | | 1,680 | | | | 2,573 | |
| | | | | | | | | | | | | |
| NET INTEREST AND DIVIDEND INCOME | | | 49,102 | | | | 86,116 | | | | 51,095 | |
| | | | | | | | | | | | | |
| OTHER INCOME | | | 26 | | | | 50 | | | | 76 | |
| | | | | | | | | | | | | |
| OTHER EXPENSES: | | | | | | | | | | | | |
| Contribution to Foundation | | | 40,000 | | | | -- | | | | -- | |
| Salaries and employee benefits | | | 856 | | | | 929 | | | | 1,108 | |
| Regulatory and outside services | | | 337 | | | | 493 | | | | 228 | |
| Other, net | | | 650 | | | | 270 | | | | 243 | |
| Total other expenses | | | 41,843 | | | | 1,692 | | | | 1,579 | |
| | | | | | | | | | | | | |
| | | | | | | | | | | | | |
| INCOME BEFORE INCOME TAX BENEFIT AND EQUITY | | | | | | | | | | | | |
| IN UNDISTRIBUTED EARNINGS OF SUBSIDIARY | | | 7,285 | | | | 84,474 | | | | 49,592 | |
| | | | | | | | | | | | | |
| INCOME TAX BENEFIT | | | (13,425 | ) | | | (138 | ) | | | (162 | ) |
| | | | | | | | | | | | | |
| INCOME BEFORE EQUITY IN UNDISTRIBUTED | | | | | | | | | | | | |
| EARNINGS OF SUBSIDIARY | | | 20,710 | | | | 84,612 | | | | 49,754 | |
| | | | | | | | | | | | | |
| EQUITY IN UNDISTRIBUTED EARNINGS OF SUBSIDIARY | | | | | | | | | | | | |
| (EXCESS OF DISTRIBUTION OVER) | | | 17,693 | | | | (16,772 | ) | | | 16,544 | |
| | | | | | | | | | | | | |
| NET INCOME | | $ | 38,403 | | | $ | 67,840 | | | $ | 66,298 | |
| STATEMENTS OF CASH FLOWS | | | | | | | | | |
| YEARS ENDED SEPTEMBER 30, 2011, 2010, and 2009 | | | | | | | | | |
| (Dollars in thousands) | | | | | | | | | |
| | | | | | | | | | |
| | | 2011 | | | 2010 | | | 2009 | |
| CASH FLOWS FROM OPERATING ACTIVITIES: | | | | | | | | | |
| Net income | | $ | 38,403 | | | $ | 67,840 | | | $ | 66,298 | |
| Adjustments to reconcile net income to net cash provided by | | | | | | | | | | | | |
| operating activities: | | | | | | | | | | | | |
| Equity in excess of distribution over/(undistributed) | | | | | | | | | | | | |
| earnings of subsidiary | | | (17,693 | ) | | | 16,772 | | | | (16,544 | ) |
| Amortization/accretion of premiums/discounts | | | 3,529 | | | | -- | | | | -- | |
| Amortization of deferred debt issuance costs | | | -- | | | | -- | | | | 28 | |
| Other, net | | | (1,812 | ) | | | 1 | | | | 14 | |
| Provision for deferred income taxes | | | (10,409 | ) | | | -- | | | | -- | |
| Changes in: | | | | | | | | | | | | |
| Other assets | | | 1,547 | | | | -- | | | | 2,999 | |
| Income taxes receivable/payable | | | (2,927 | ) | | | 24 | | | | (95 | ) |
| Accounts payable and accrued expenses | | | (355 | ) | | | 3 | | | | (292 | ) |
| Net cash flows provided by operating activities | | | 10,283 | | | | 84,640 | | | | 52,408 | |
| | | | | | | | | | | | | |
| CASH FLOWS FROM INVESTING ACTIVITIES: | | | | | | | | | | | | |
| Offering proceeds downstreamed to Bank | | | (567,422 | ) | | | -- | | | | -- | |
| Purchase of AFS investment securities | | | (405,800 | ) | | | -- | | | | -- | |
| Proceeds from maturities of AFS securities | | | 40,000 | | | | -- | | | | -- | |
| Proceeds from maturities of Bank certificates | | | 55,000 | | | | 5,000 | | | | -- | |
| Purchase of Capitol Federal Financial, Inc. stock | | | -- | | | | (1 | ) | | | -- | |
| Principal collected on notes receivable from ESOP | | | 2,525 | | | | 2,387 | | | | 2,256 | |
| Net cash flows (used in)/provided by investing activities | | | (875,697 | ) | | | 7,386 | | | | 2,256 | |
| | | | | | | | | | | | | |
| CASH FLOWS FROM FINANCING ACTIVITIES: | | | | | | | | | | | | |
| Net proceeds from stock offering (Deferred offering costs) | | | 1,094,101 | | | | (5,982 | ) | | | -- | |
| Payment from subsidiary for sale of treasury stock related to | | | | | | | | | | | | |
| RRP shares | | | -- | | | | 162 | | | | 87 | |
| Dividends paid | | | (150,110 | ) | | | (48,400 | ) | | | (44,069 | ) |
| Repayment of other borrowings | | | (53,609 | ) | | | -- | | | | -- | |
| Acquisition of treasury stock | | | -- | | | | (4,019 | ) | | | (2,426 | ) |
| Stock options exercised | | | 35 | | | | 210 | | | | 1,337 | |
| Net cash flows provided by/(used in) financing activities | | | 890,417 | | | | (58,029 | ) | | | (45,071 | ) |
| | | | | | | | | | | | | |
| NET INCREASE IN CASH AND CASH EQUIVALENTS | | | 25,003 | | | | 33,997 | | | | 9,593 | |
| | | | | | | | | | | | | |
| CASH AND CASH EQUIVALENTS: | | | | | | | | | | | | |
| Beginning of year | | | 88,098 | | | | 54,101 | | | | 44,508 | |
| | | | | | | | | | | | | |
| End of year | | $ | 113,101 | | | $ | 88,098 | | | $ | 54,101 | |
| | | | | | | | | | | | | |
| SUPPLEMENTAL DISCLOSURES OF CASH FLOW INFORMATION: | | | | | | | | | | | | |
| Interest payments | | $ | 1,274 | | | $ | 1,678 | | | $ | 2,866 | |
| | | | | | | | | | | | | |
| SUPPLEMENTAL DISCLOSURE OF NONCASH INVESTING | | | | | | | | | | | | |
| AND FINANCING ACTIVITIES: | | | | | | | | | | | | |
| Note to ESOP in exchange for common stock | | $ | 47,260 | | | $ | -- | | | $ | -- | |