John B. Dicus, Chairman, President & CEO Michel’ Philipp Cole, ABC Morris J. Huey, II Jeffrey M. Johnson Michael T. McCoy, M.D. James G. Morris Carlton A. Ricketts Jeffrey R. Thompson Board of Directors 2
Management John B. Dicus, Chairman, President & CEO Anthony S. Barry, Chief Corporate Services Officer Natalie G. Haag, General Counsel & Corporate Secretary Rick C. Jackson, Chief Lending Officer William J. Skrobacz, Jr., Chief Retail Operations Officer Kent G. Townsend, Chief Financial Officer 3
Safe Harbor Disclosure Except for the historical information contained in this presentation, the matters discussed herein may be deemed to be "forward-looking statements" within the meaning of the Private Securities Litigation Reform Act of 1995. These forward-looking statements include statements about our beliefs, plans, objectives, goals, expectations, anticipations, estimates and intentions. The words "may," "could," "should," "would," "will," "believe," "anticipate," "estimate," "expect," "intend," "plan," and similar expressions are intended to identify forward-looking statements. Forward- looking statements involve risks and uncertainties, including: changes in policies or the application or interpretation of laws and regulations by regulatory agencies and tax authorities; other governmental initiatives affecting the financial services industry; changes in accounting principles, policies or guidelines; fluctuations in interest rates and the effects of inflation or a potential recession, whether caused by Federal Reserve action or otherwise; the impact of bank failures or adverse developments at other banks and related negative press about the banking industry in general on investor or depositor sentiment; demand for loans in Capitol Federal Financial, Inc.’s market areas; the future earnings and capital levels of Capitol Federal Savings Bank and the impact of the pre-1988 bad debt recapture, which could affect the ability of Capitol Federal Financial, Inc. to pay dividends in accordance with its dividend policies; competition; and other risks detailed from time to time in documents filed or furnished by Capitol Federal Financial, Inc. with the Securities and Exchange Commission (“SEC”). Actual results may differ materially from those currently expected. These forward-looking statements represent Capitol Federal Financial, Inc.’s judgment as of the date of this presentation. Capitol Federal Financial, Inc. disclaims, however, any intent or obligation to update these forward-looking statements. 4
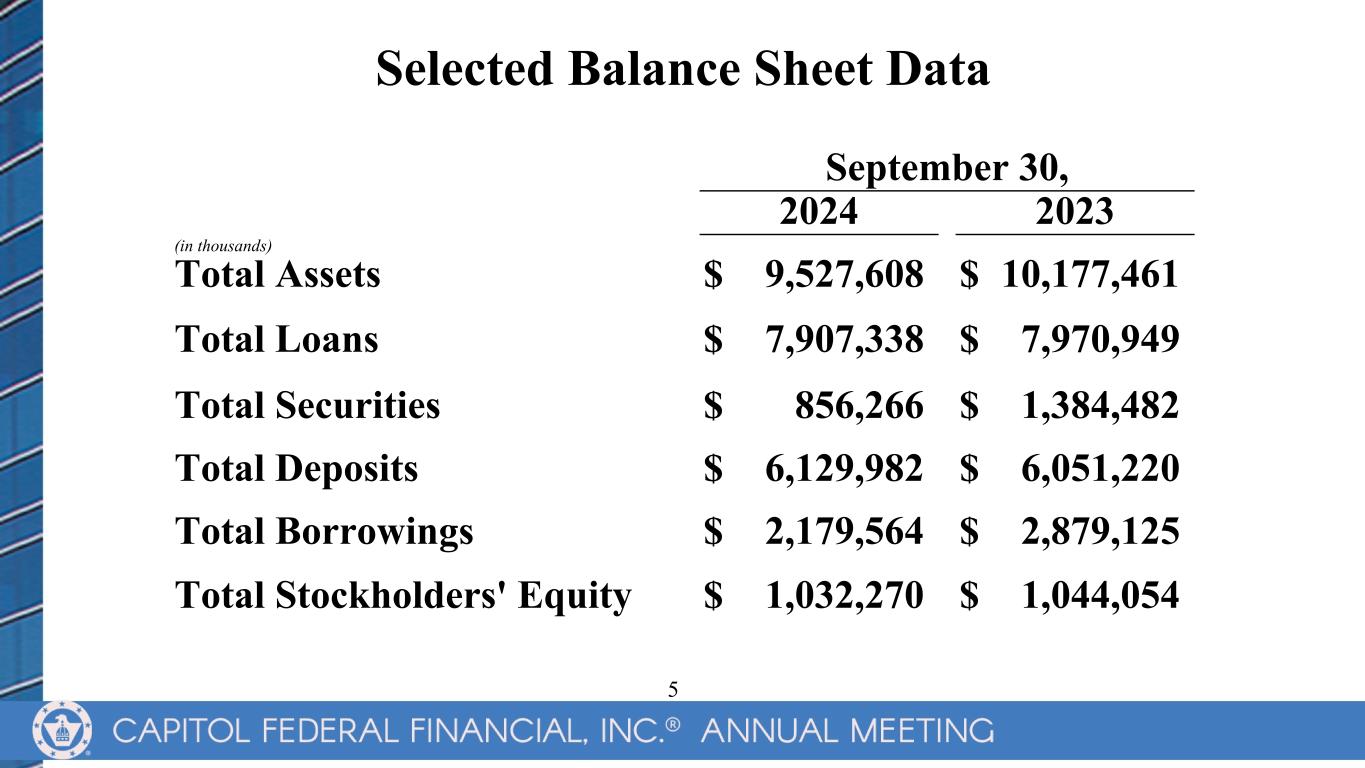
Selected Balance Sheet Data September 30, 2024 2023 (in thousands) Total Assets $ 9,527,608 $ 10,177,461 Total Loans $ 7,907,338 $ 7,970,949 Total Securities $ 856,266 $ 1,384,482 Total Deposits $ 6,129,982 $ 6,051,220 Total Borrowings $ 2,179,564 $ 2,879,125 Total Stockholders' Equity $ 1,032,270 $ 1,044,054 5
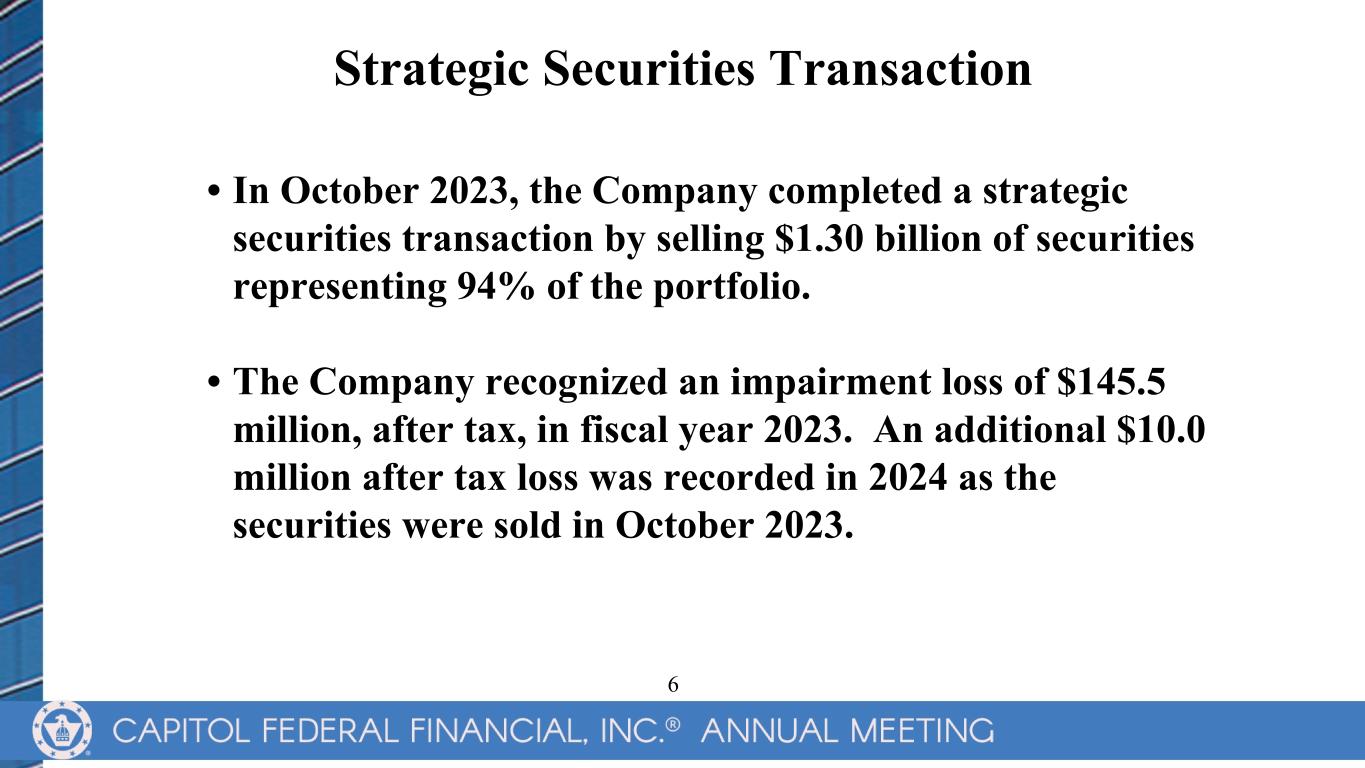
Strategic Securities Transaction • In October 2023, the Company completed a strategic securities transaction by selling $1.30 billion of securities representing 94% of the portfolio. • The Company recognized an impairment loss of $145.5 million, after tax, in fiscal year 2023. An additional $10.0 million after tax loss was recorded in 2024 as the securities were sold in October 2023. 6
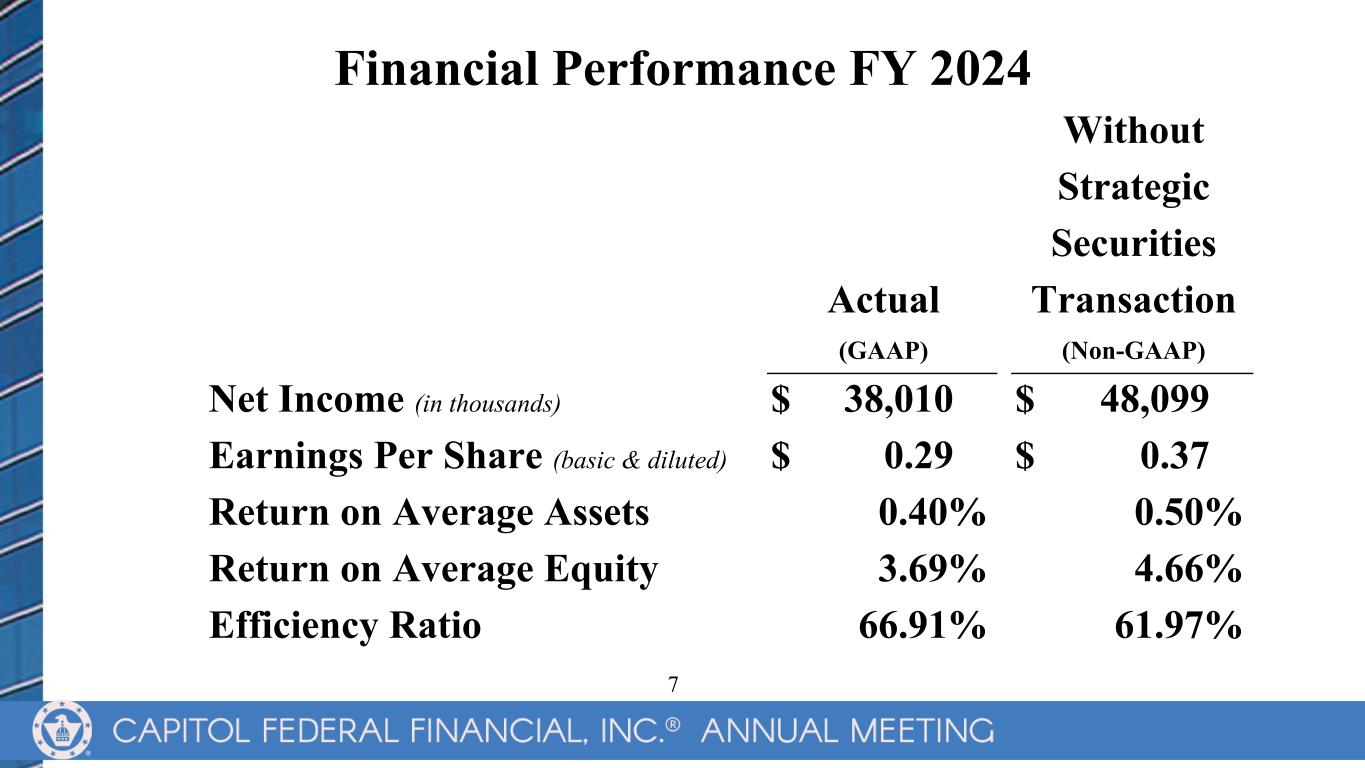
Financial Performance FY 2024 Without Strategic Securities Actual Transaction (GAAP) (Non-GAAP) Net Income (in thousands) $ 38,010 $ 48,099 Earnings Per Share (basic & diluted) $ 0.29 $ 0.37 Return on Average Assets 0.40% 0.50% Return on Average Equity 3.69% 4.66% Efficiency Ratio 66.91% 61.97% 7
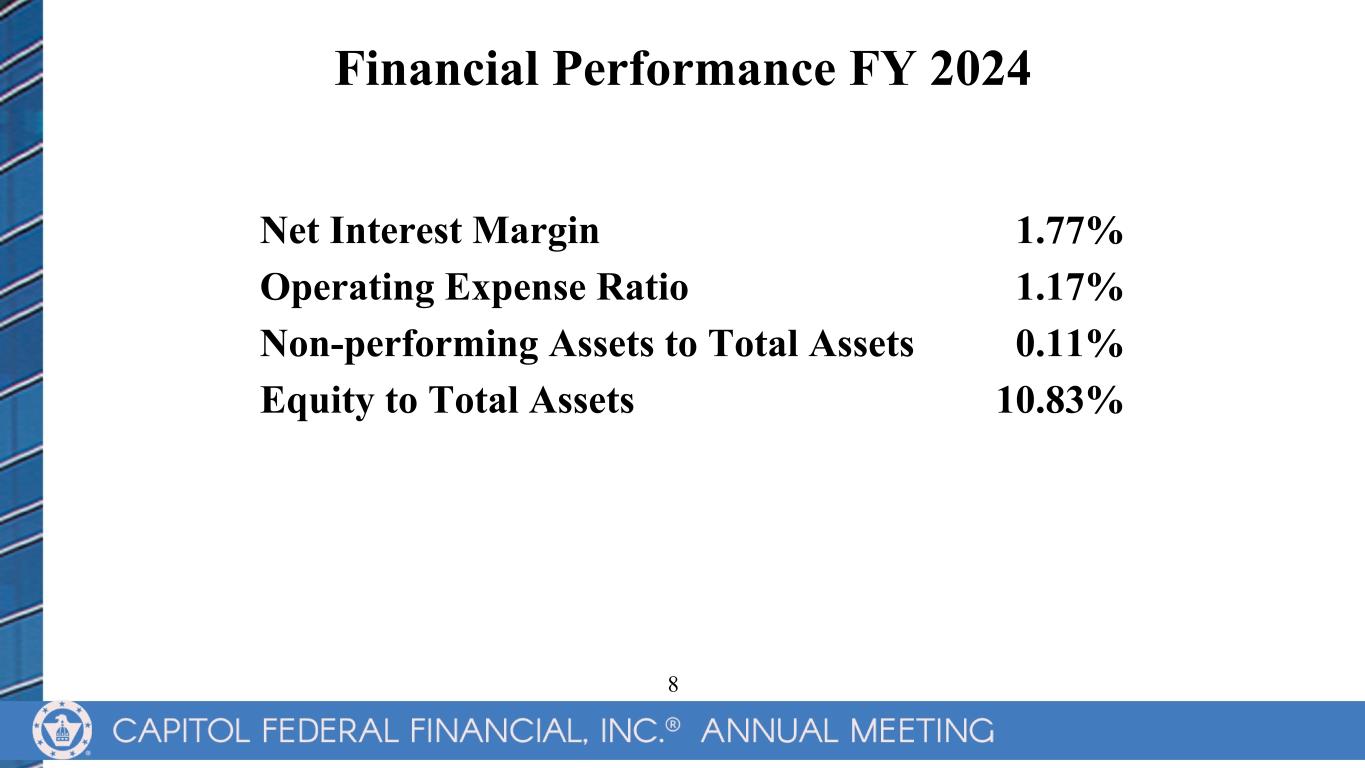
Financial Performance FY 2024 Net Interest Margin 1.77% Operating Expense Ratio 1.17% Non-performing Assets to Total Assets 0.11% Equity to Total Assets 10.83% 8
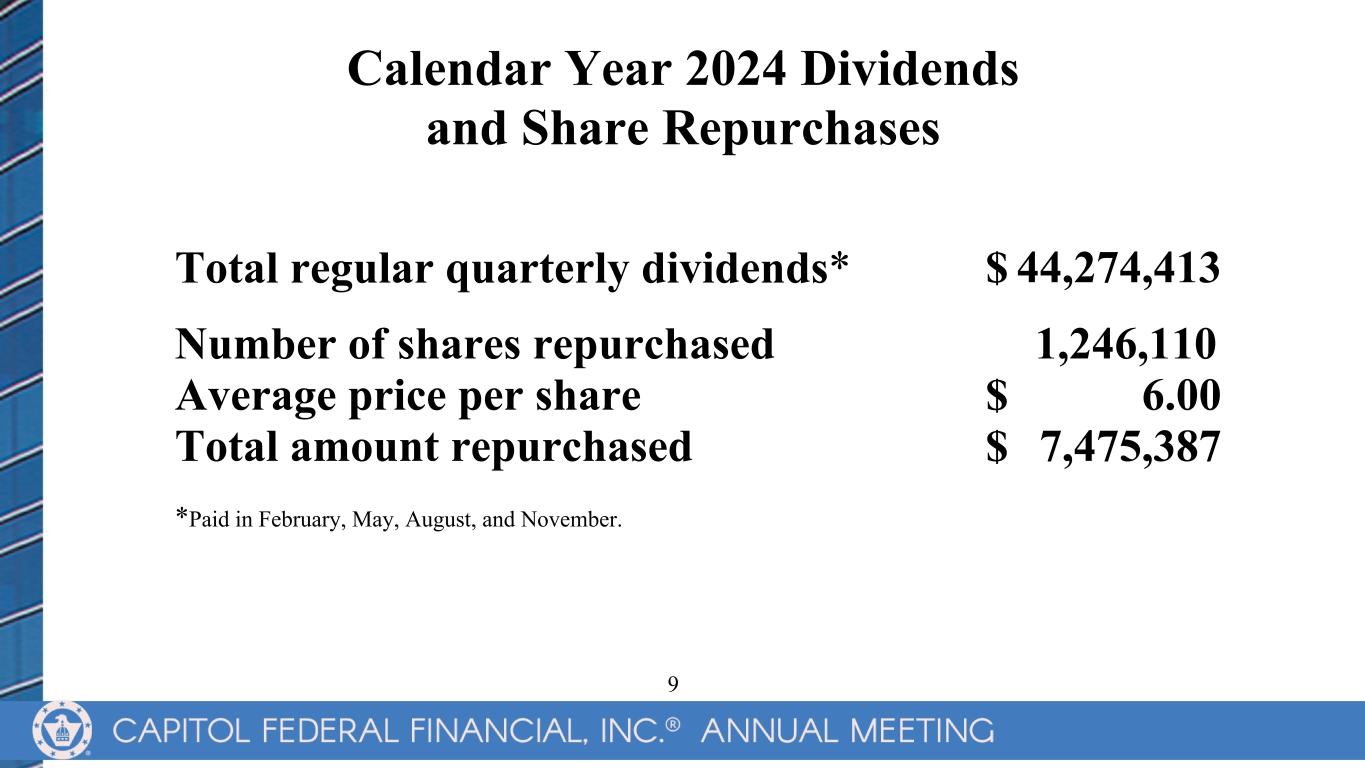
Number of shares repurchased 1,246,110 Average price per share $ 6.00 Total amount repurchased $ 7,475,387 *Paid in February, May, August, and November. Calendar Year 2024 Dividends and Share Repurchases Total regular quarterly dividends* $ 44,274,413 9
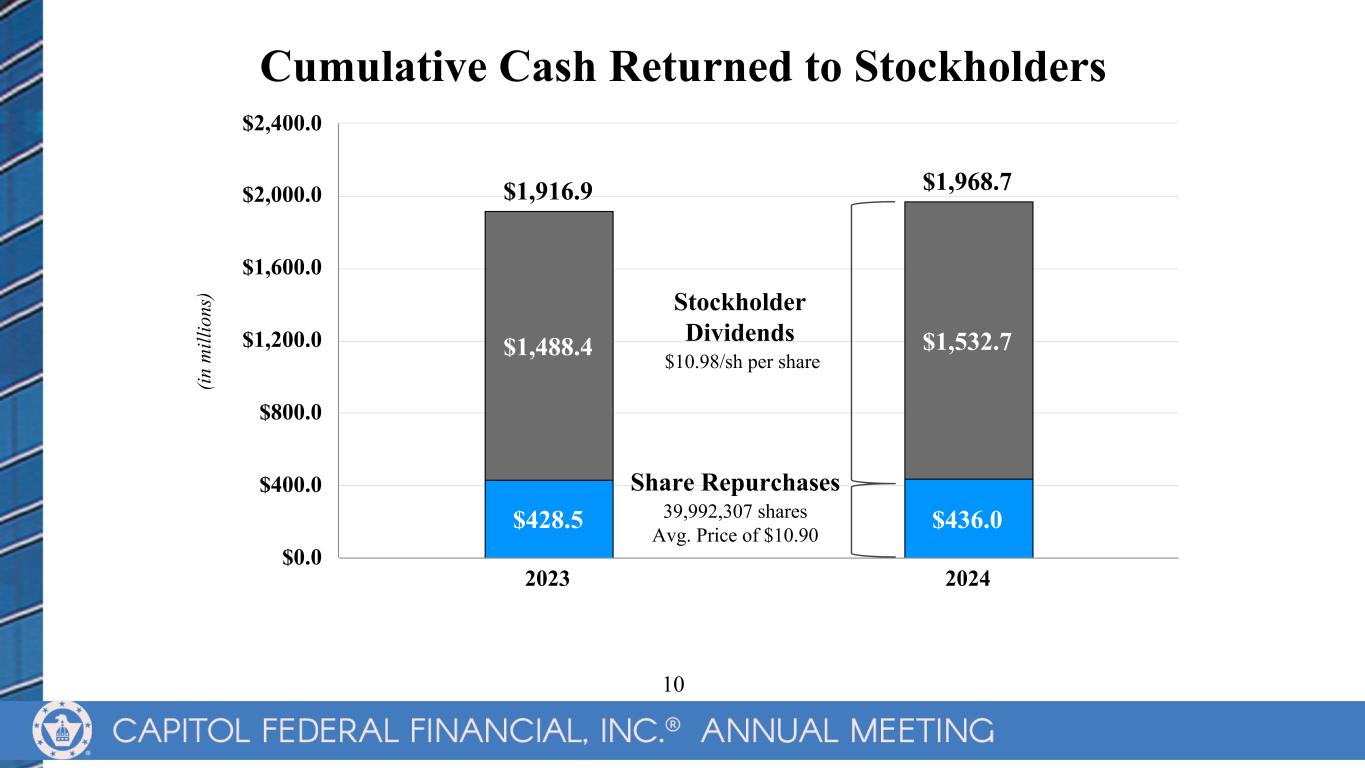
(in m ill io ns ) $1,916.9 $1,968.7 $428.5 $436.0 $1,488.4 $1,532.7 2023 2024 $0.0 $400.0 $800.0 $1,200.0 $1,600.0 $2,000.0 $2,400.0 Cumulative Cash Returned to Stockholders Stockholder Dividends $10.98/sh per share Share Repurchases 39,992,307 shares Avg. Price of $10.90 10
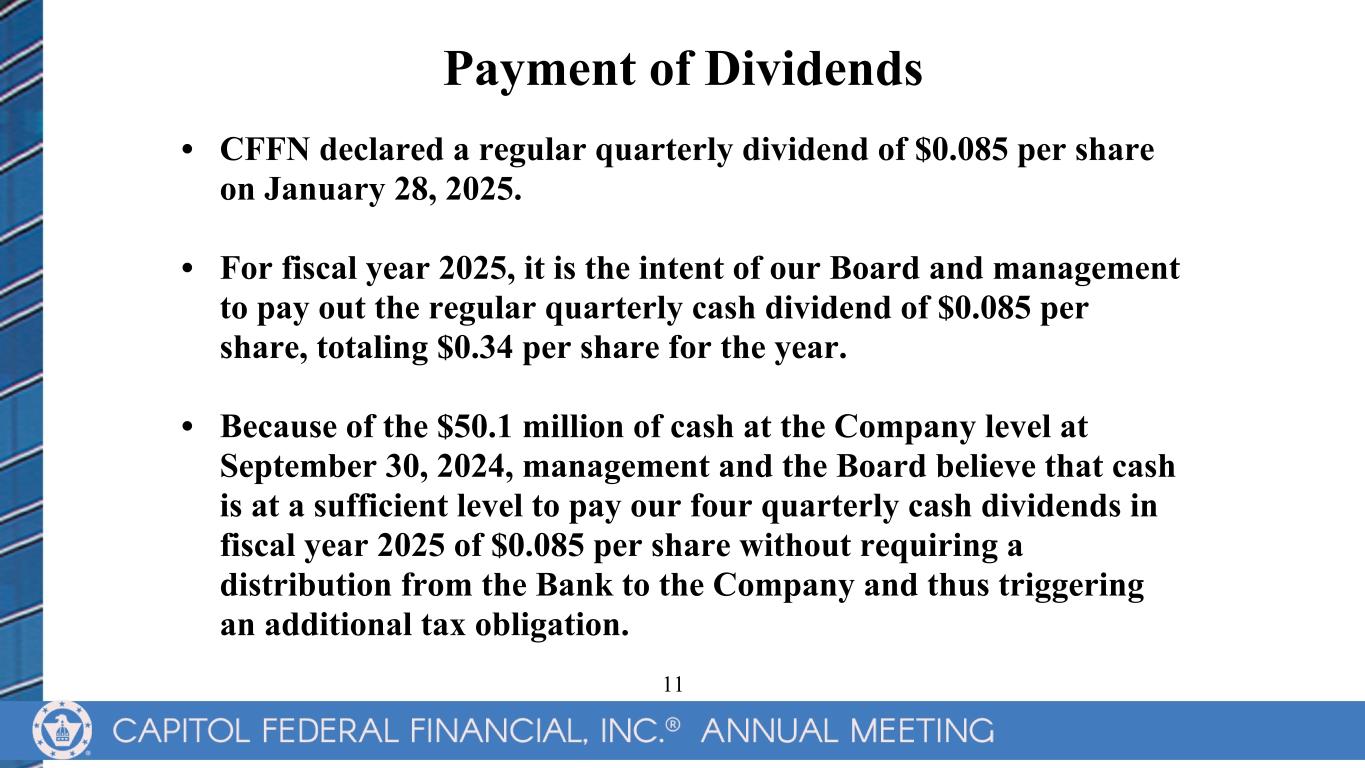
Payment of Dividends • CFFN declared a regular quarterly dividend of $0.085 per share on January 28, 2025. • For fiscal year 2025, it is the intent of our Board and management to pay out the regular quarterly cash dividend of $0.085 per share, totaling $0.34 per share for the year. • Because of the $50.1 million of cash at the Company level at September 30, 2024, management and the Board believe that cash is at a sufficient level to pay our four quarterly cash dividends in fiscal year 2025 of $0.085 per share without requiring a distribution from the Bank to the Company and thus triggering an additional tax obligation. 11
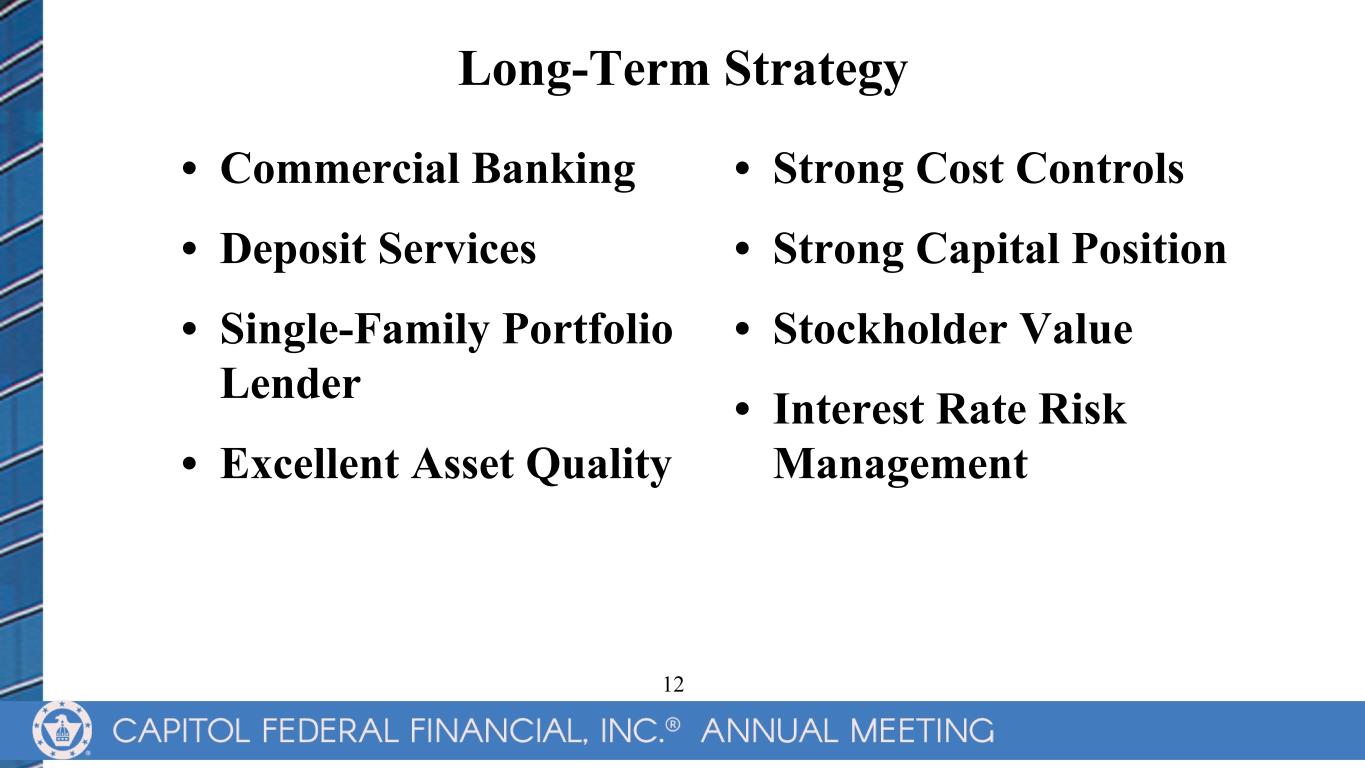
Long-Term Strategy • Commercial Banking • Deposit Services • Single-Family Portfolio Lender • Excellent Asset Quality • Strong Cost Controls • Strong Capital Position • Stockholder Value • Interest Rate Risk Management 12
Questions & Answers
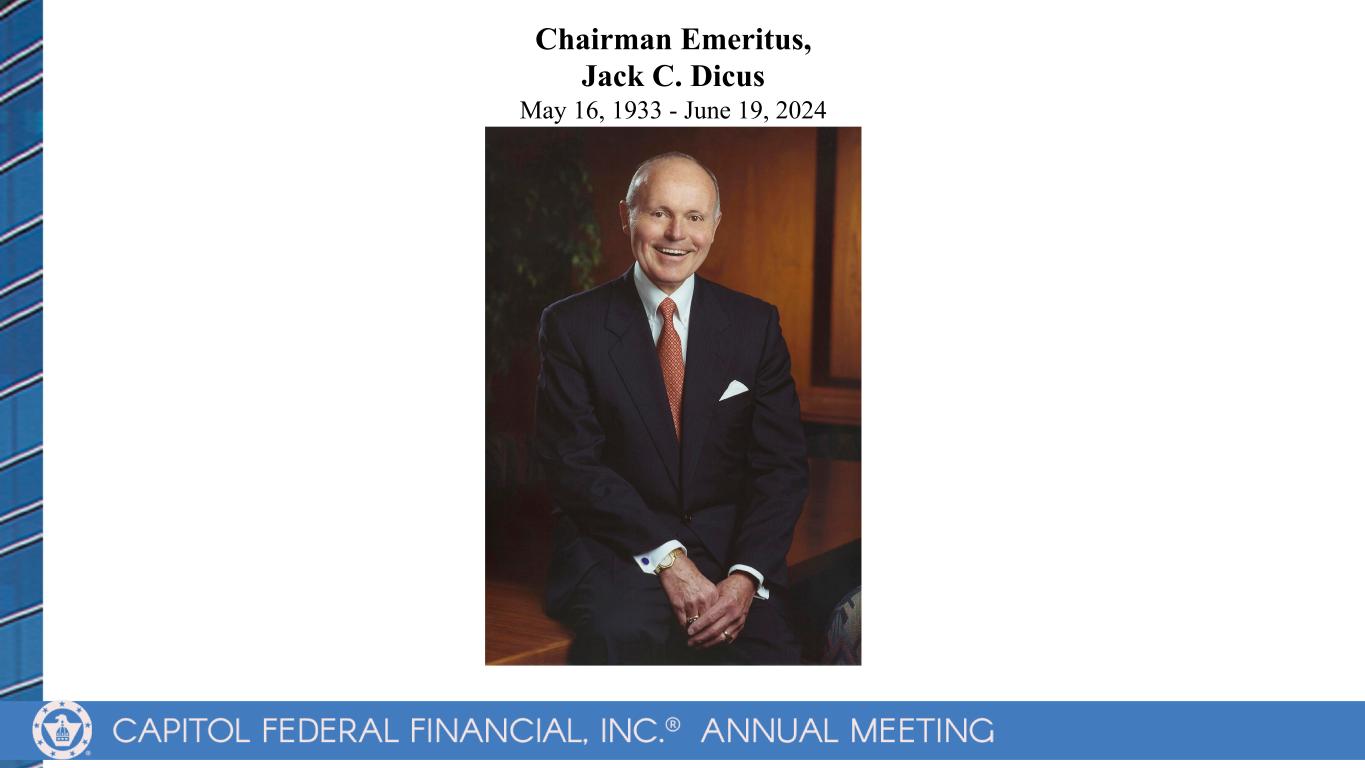
Chairman Emeritus, Jack C. Dicus May 16, 1933 - June 19, 2024

Thank you for attending
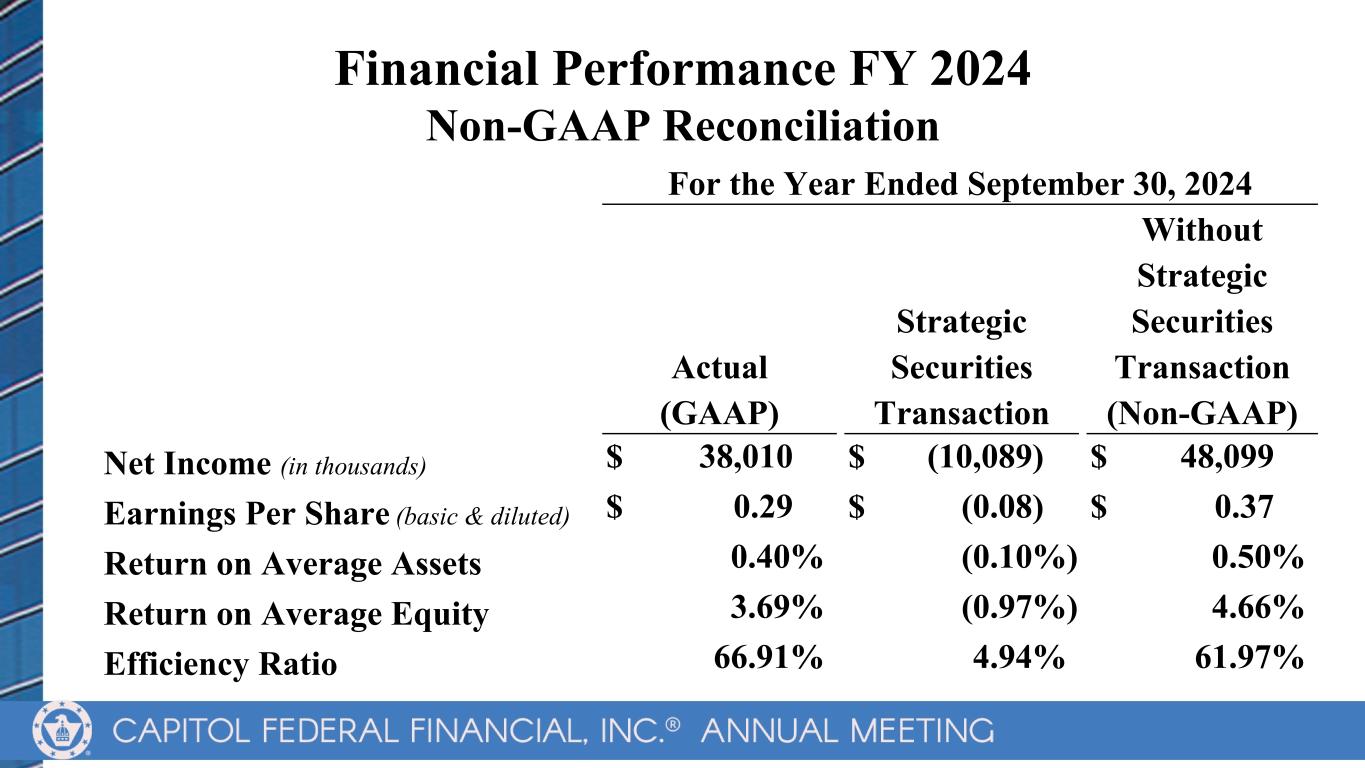
Financial Performance FY 2024 Non-GAAP Reconciliation For the Year Ended September 30, 2024 Without Strategic Strategic Securities Actual Securities Transaction (GAAP) Transaction (Non-GAAP) Net Income (in thousands) $ 38,010 $ (10,089) $ 48,099 Earnings Per Share (basic & diluted) $ 0.29 $ (0.08) $ 0.37 Return on Average Assets 0.40% (0.10%) 0.50% Return on Average Equity 3.69% (0.97%) 4.66% Efficiency Ratio 66.91% 4.94% 61.97%
