0 2013 INVESTOR DAY PRESENTATION
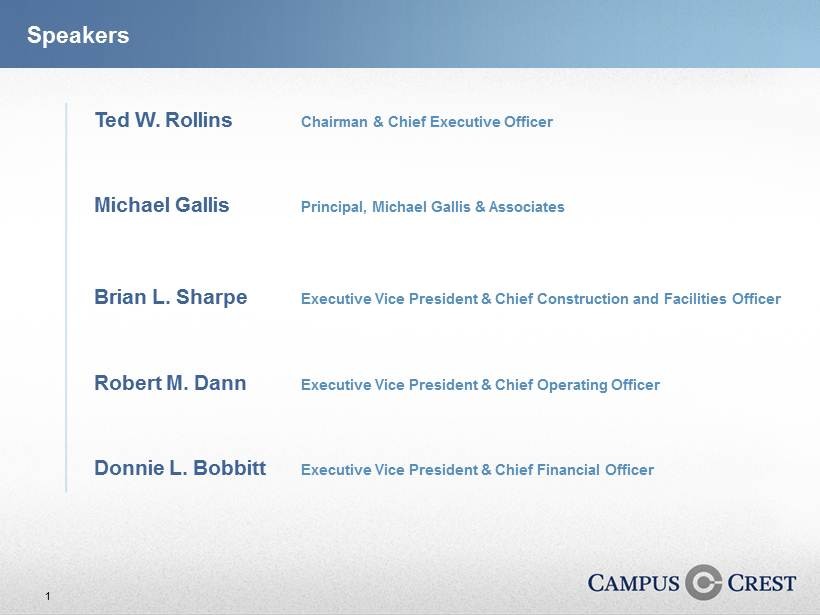
1 Speakers Ted W. Rollins Chairman & Chief Executive Officer Robert M. Dann Executive Vice President & Chief Operating Officer Donnie L. Bobbitt Executive Vice President & Chief Financial Officer Brian L. Sharpe Executive Vice President & Chief Construction and Facilities Officer Michael Gallis Principal, Michael Gallis & Associates
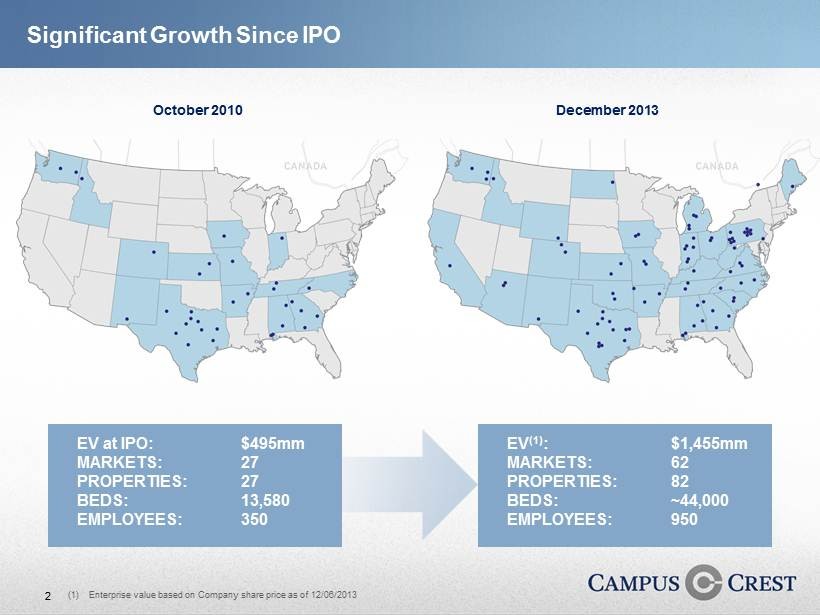
2 October 2010 December 2013 (1) Enterprise value based on Company share price as of 12/06/2013 EV at IPO: $495mm MARKETS: 27 PROPERTIES: 27 BEDS: 13,580 EMPLOYEES: 350 EV (1) : $1,455mm MARKETS: 62 PROPERTIES: 82 BEDS: ~44,000 EMPLOYEES: 950 Significant Growth Since IPO

3 Total Pro Rata NOI Attractive Internal and External Growth Profile (1) Wholly - owned NOI for 2011 and 2012 as reflected in 10 - K SEC filings (2) HSRE JV NOI reflects the Company’s share of NOI from its partnership with Harrison Street Real Estate Capital (“HSRE”) (3) Reflects actual NOI from the Company’s Copper Beech investment through 09/30/2013 plus 67% of NOI from 30 properties for Q4 2013 quarter per the amendment to the purchase and sale agreement (4) 2013E NOI for all groupings reflects the mid - point of guidance (1) ($mm) (1) (2) (3) (4)
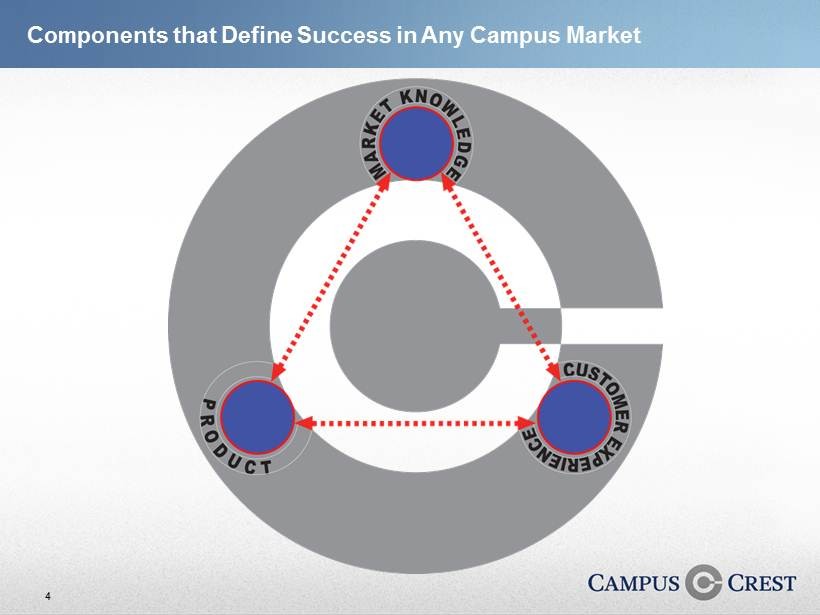
4 Components that Define Success in Any Campus Market
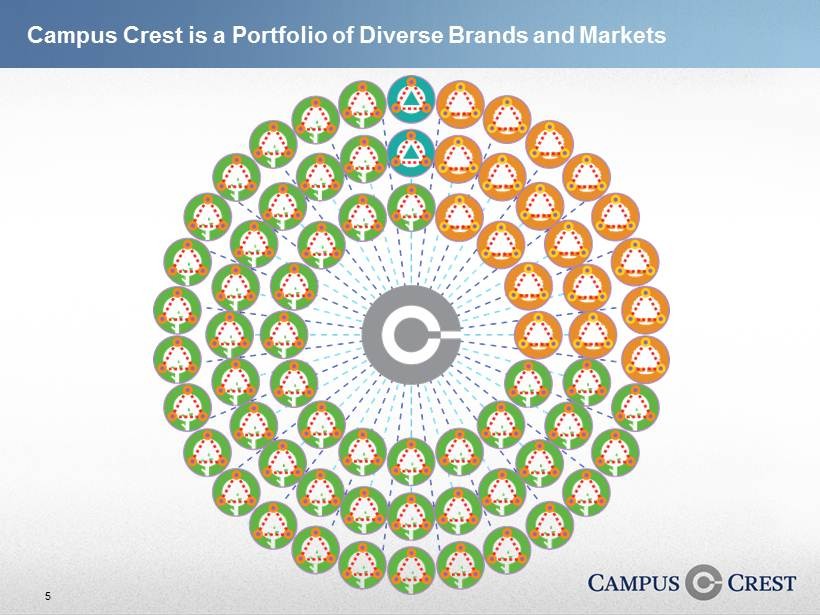
5 Campus Crest is a Portfolio of Diverse Brands and Markets
6
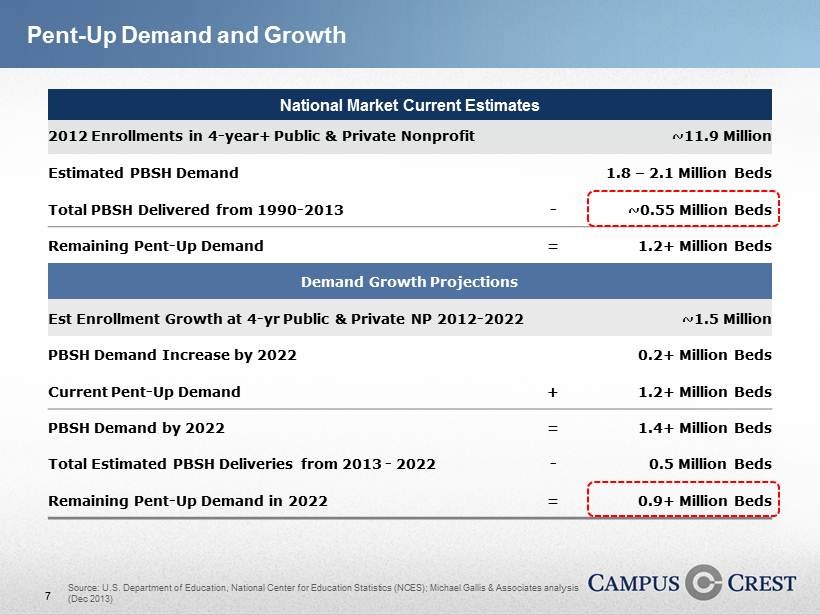
7 Pent - Up Demand and Growth 2012 Enrollments in 4 - year+ Public & Private Nonprofit ~11.9 Million Estimated PBSH Demand 1.8 – 2.1 Million Beds Total PBSH Delivered from 1990 - 2013 - ~0.55 Million Beds Remaining Pent - Up Demand = 1.2+ Million Beds Demand Growth Projections Est Enrollment Growth at 4 - yr Public & Private NP 2012 - 2022 ~1.5 Million PBSH Demand Increase by 2022 0.2+ Million Beds Current Pent - Up Demand + 1.2+ Million Beds PBSH Demand by 2022 = 1.4+ Million Beds Total Estimated PBSH Deliveries from 2013 - 2022 - 0.5 Million Beds Remaining Pent - Up Demand in 2022 = 0.9+ Million Beds National Market Current Estimates Source: U.S. Department of Education, National Center for Education Statistics (NCES); Michael Gallis & Associates analysis (Dec 2013)
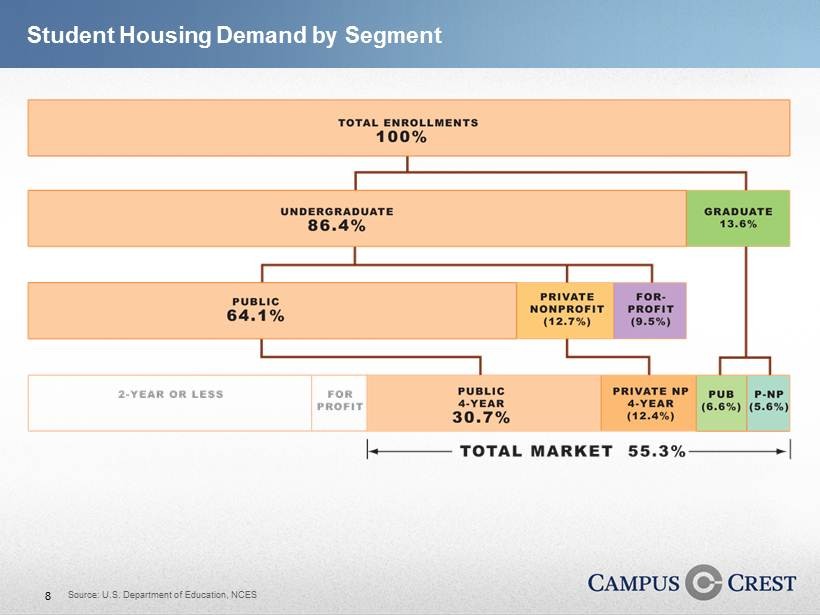
8 Student Housing Demand by Segment Source: U.S. Department of Education, NCES
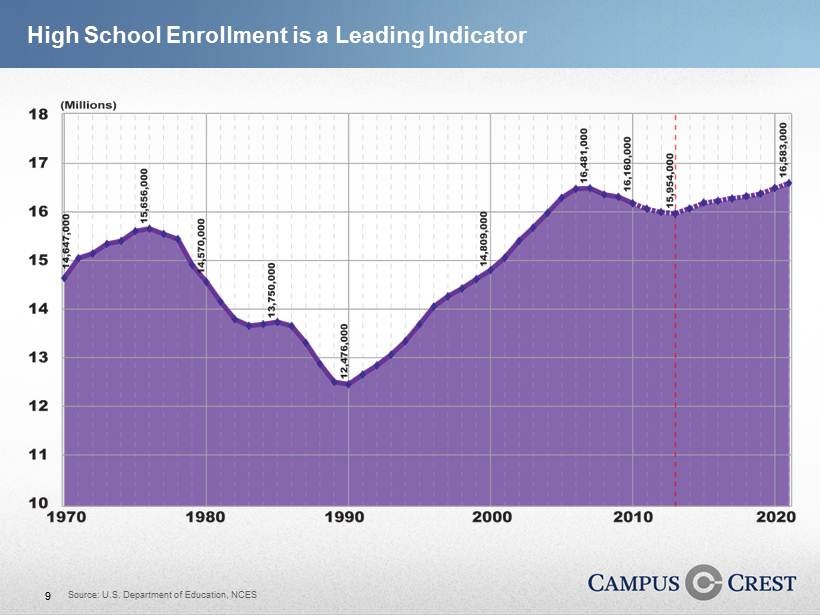
9 High School Enrollment is a Leading Indicator Source: U.S. Department of Education, NCES
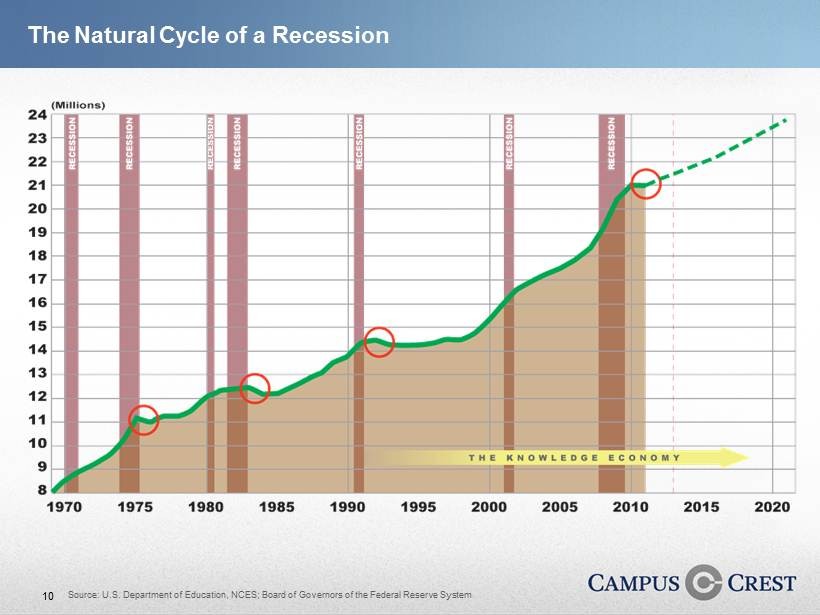
10 Source: U.S. Department of Education, NCES; Board of Governors of the Federal Reserve System The Natural Cycle of a Recession

11 Source: U.S. Department of Education, NCES, Michael Gallis & Associates (Dec 2013) Current PBSH supply and delivery rates will not fulfill pent - up demand Pent - Up Demand Drives Purpose Built Student Housing Market
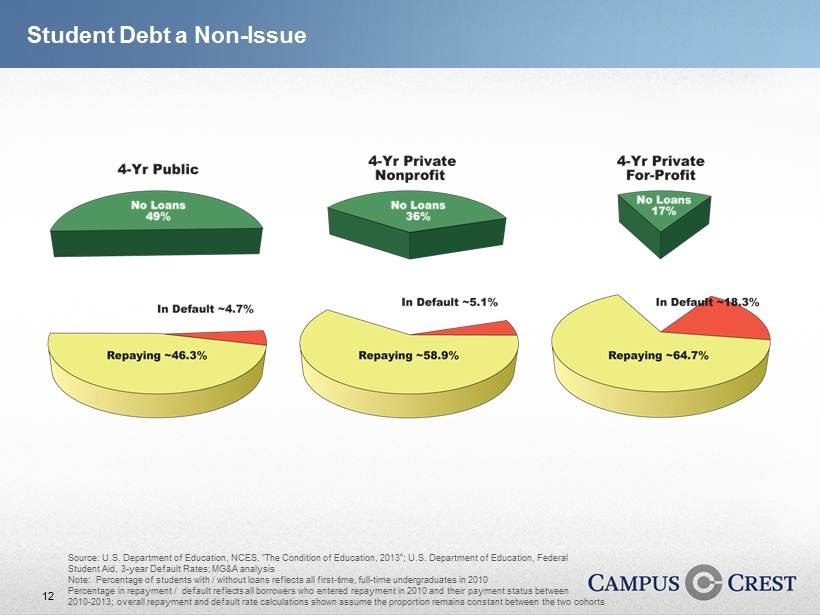
12 Source: U.S. Department of Education, NCES, “The Condition of Education, 2013”; U.S. Department of Education, Federal Student Aid, 3 - year Default Rates; MG&A analysis Note: Percentage of students with / without loans reflects all first - time, full - time undergraduates in 2010 Percentage in repayment / default reflects all borrowers who entered repayment in 2010 and their payment status between 2010 - 2013; overall repayment and default rate calculations shown assume the proportion remains constant between the two cohorts Student Debt a Non - Issue
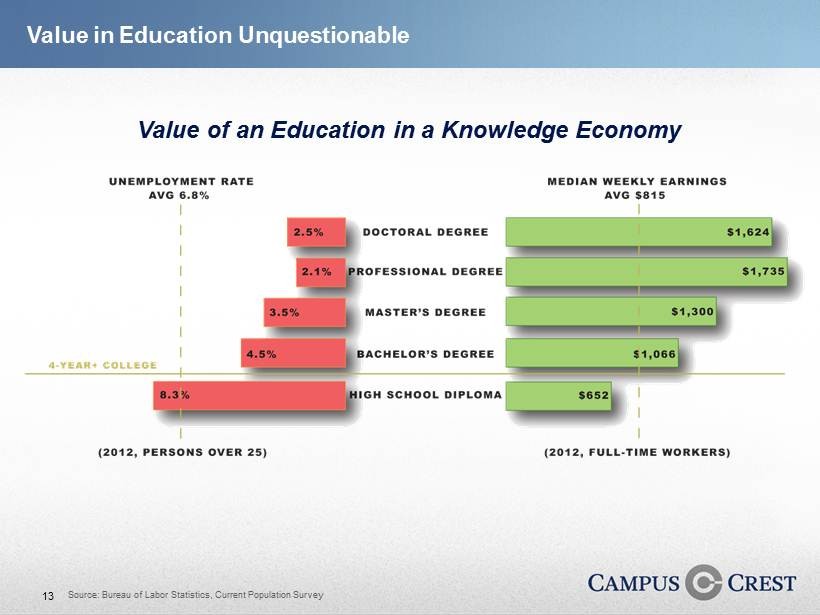
13 Source: Bureau of Labor Statistics, Current Population Survey Value of an Education in a Knowledge Economy Value in Education Unquestionable
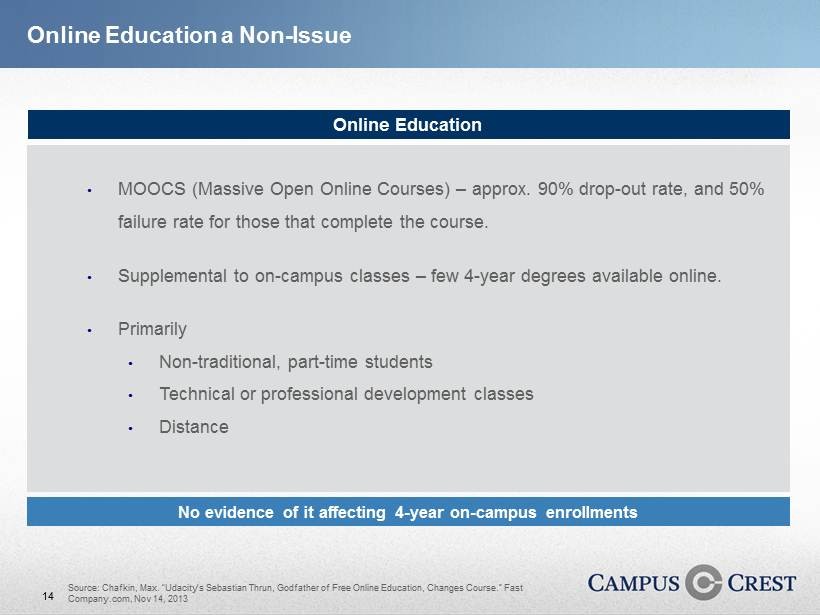
14 Online Education • MOOCS (Massive Open Online Courses) – approx. 90% drop - out rate, and 50% failure rate for those that complete the course. • Supplemental to on - campus classes – few 4 - year degrees available online. • Primarily • Non - traditional, part - time students • Technical or professional development classes • Distance Online Education a Non - Issue Source: Chafkin , Max. “ Udacity’s Sebastian Thrun , Godfather of Free Online Education, Changes Course.” Fast Company.com, Nov 14, 2013 No evidence of it affecting 4 - year on - campus enrollments
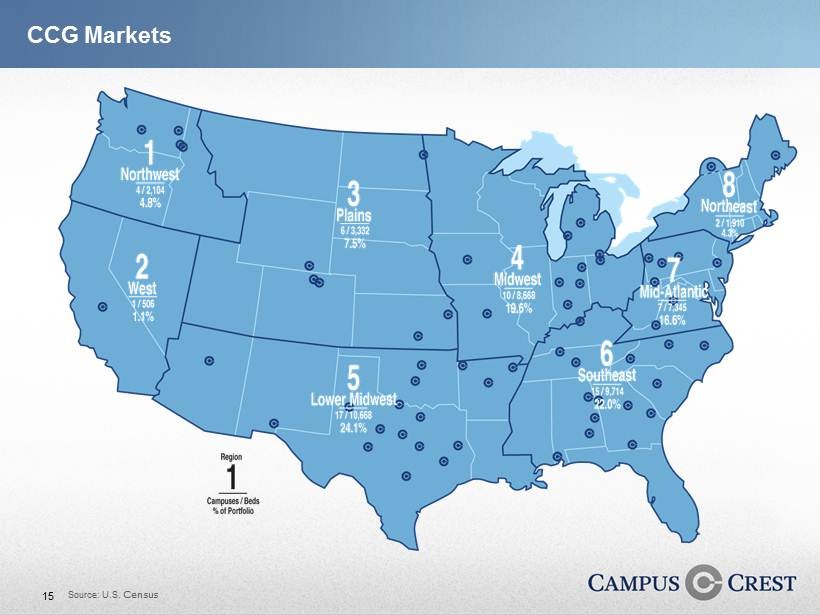
15 Source: U.S. Census CCG Markets
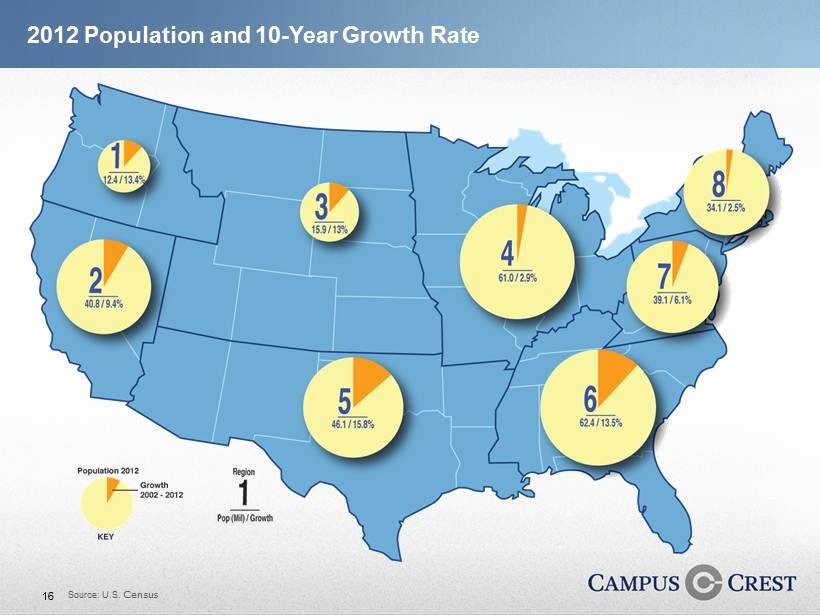
16 Source: U.S. Census 2012 Population and 10 - Year Growth Rate
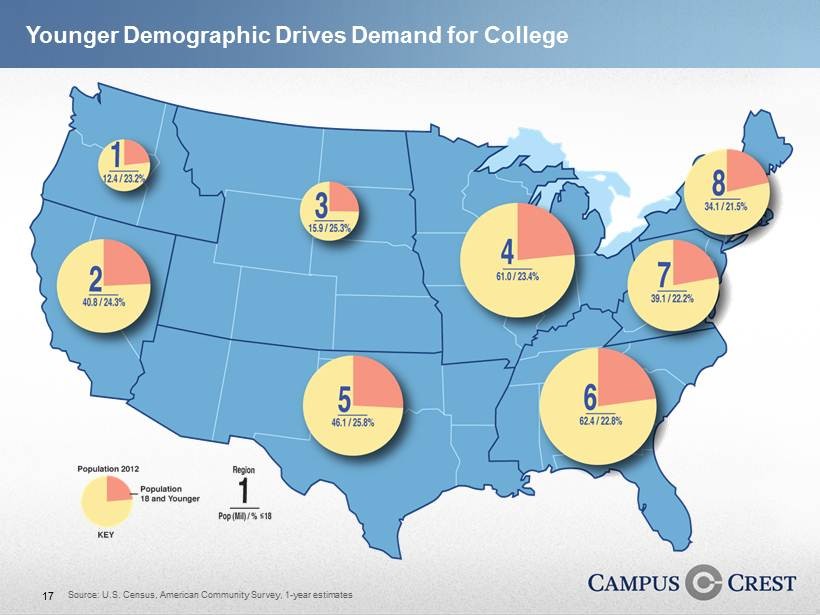
17 Source: U.S. Census, American Community Survey, 1 - year estimates Younger Demographic Drives Demand for College
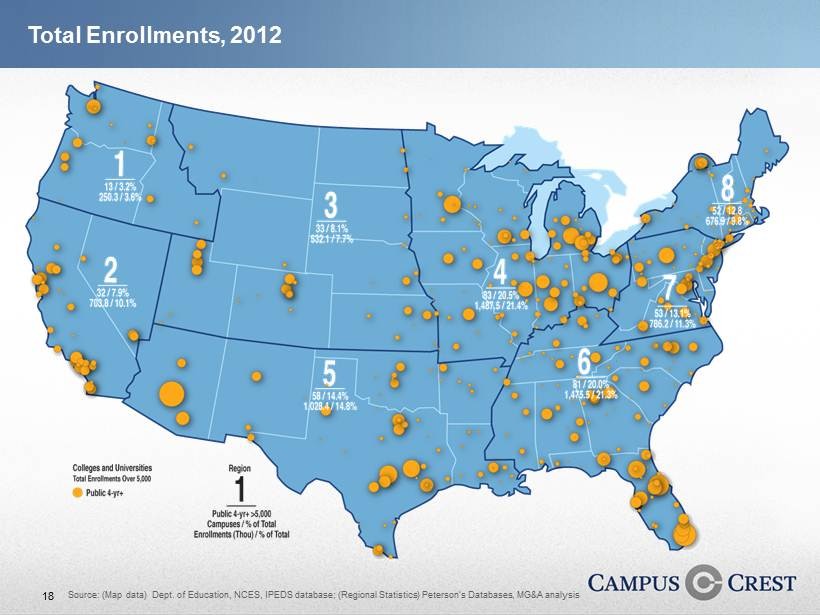
18 Source: (Map data) Dept. of Education, NCES, IPEDS database; (Regional Statistics) Peterson’s Databases, MG&A analysis Total Enrollments, 2012
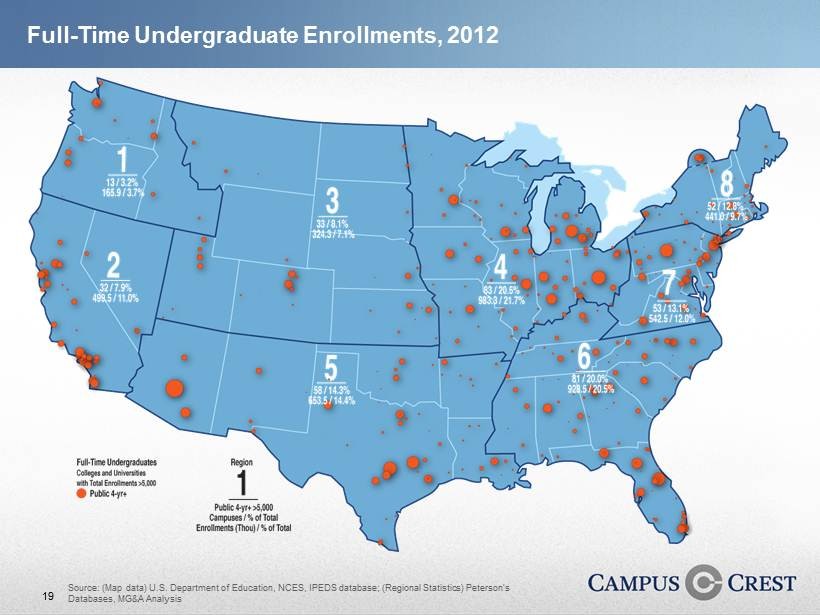
19 Source: (Map data) U.S. Department of Education, NCES, IPEDS database; (Regional Statistics) Peterson’s Databases, MG&A Analysis Full - Time Undergraduate Enrollments, 2012
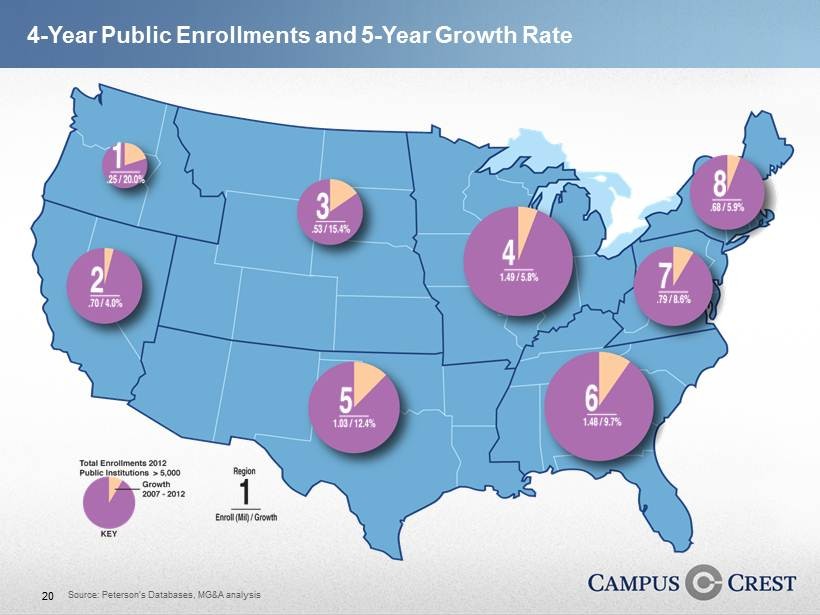
20 Source: Peterson’s Databases, MG&A analysis 4 - Year Public Enrollments and 5 - Year Growth Rate
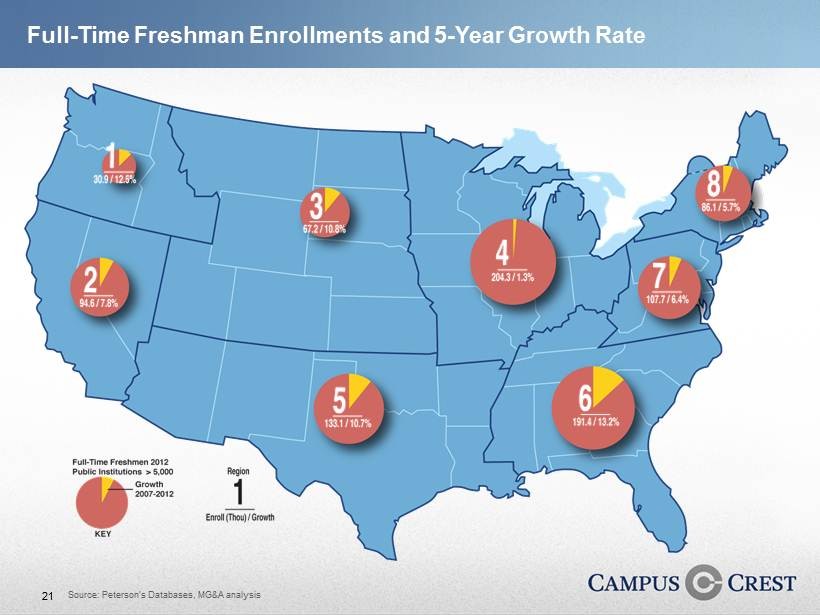
21 Source: Peterson’s Databases, MG&A analysis Full - Time Freshman Enrollments and 5 - Year Growth Rate

22 Source: Peterson’s Databases, MG&A analysis University Provided Undergrad Housing as % of Total Enrollments
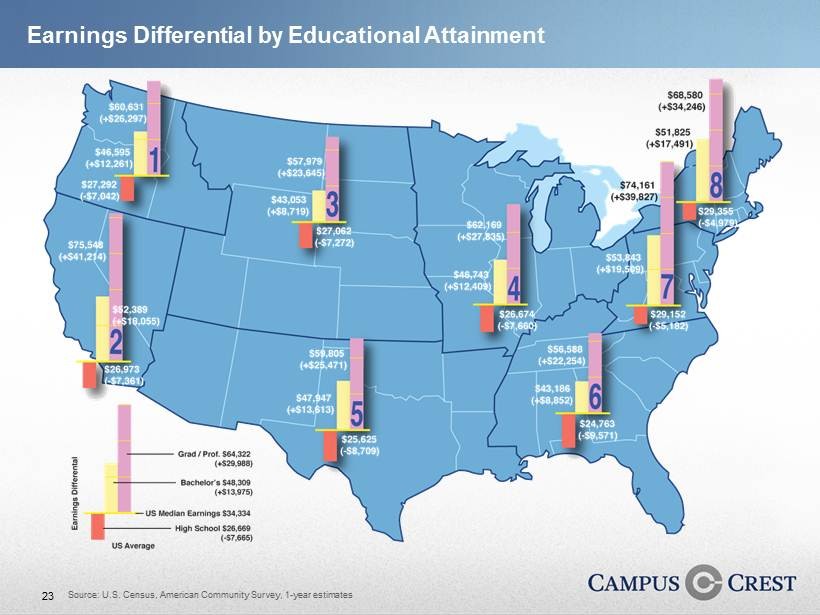
23 Source: U.S. Census, American Community Survey, 1 - year estimates Earnings Differential by Educational Attainment
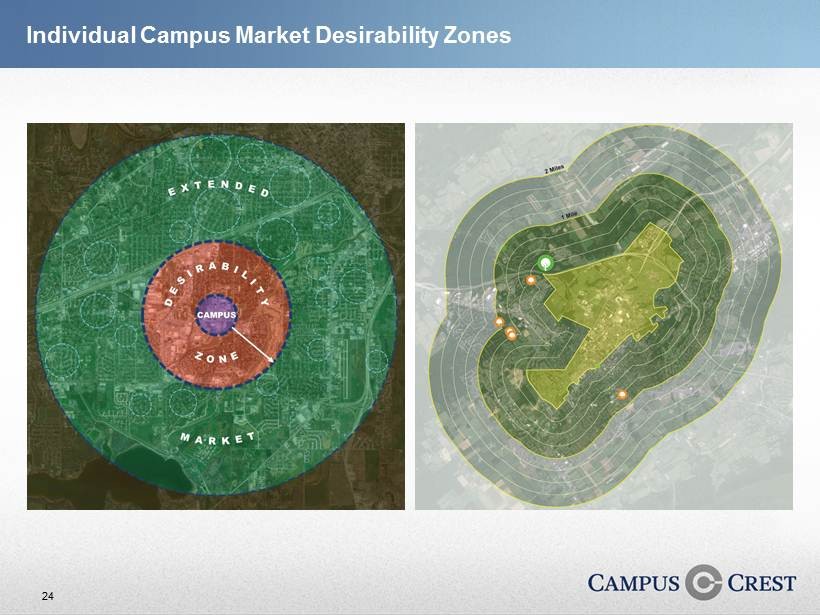
24 Individual Campus Market Desirability Zones
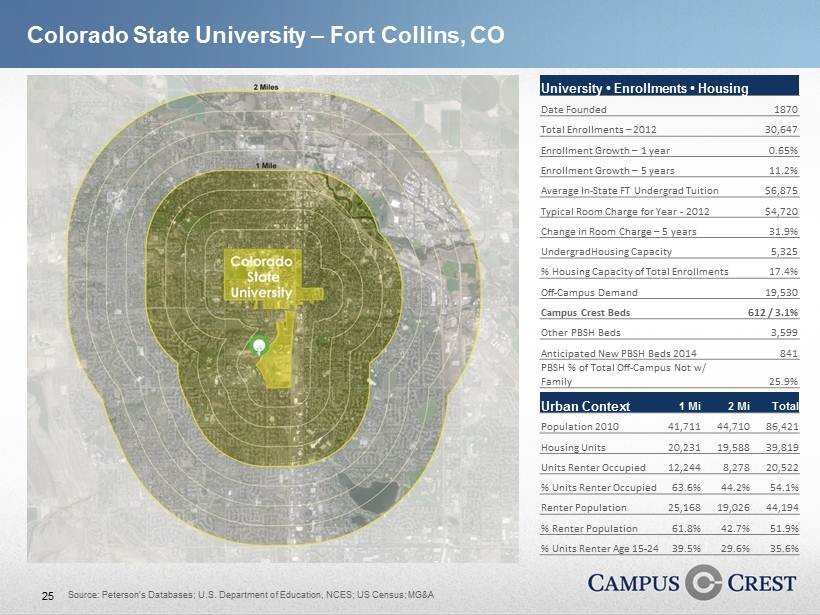
25 Urban Context 1 Mi 2 Mi Total Population 2010 41,711 44,710 86,421 Housing Units 20,231 19,588 39,819 Units Renter Occupied 12,244 8,278 20,522 % Units Renter Occupied 63.6% 44.2% 54.1% Renter Population 25,168 19,026 44,194 % Renter Population 61.8% 42.7% 51.9% % Units Renter Age 15 - 24 39.5% 29.6% 35.6% University • Enrollments • Housing Date Founded 1870 Total Enrollments – 2012 30,647 Enrollment Growth – 1 year 0.65% Enrollment Growth – 5 years 11.2% Average In - State FT Undergrad Tuition $6,875 Typical Room Charge for Year - 2012 $4,720 Change in Room Charge – 5 years 31.9% UndergradHousing Capacity 5,325 % Housing Capacity of Total Enrollments 17.4% Off - Campus Demand 19,530 Campus Crest Beds 612 / 3.1% Other PBSH Beds 3,599 Anticipated New PBSH Beds 2014 841 PBSH % of Total Off - Campus Not w / Family 25.9% Colorado State University – Fort Collins, CO Source: Peterson’s Databases; U.S. Department of Education, NCES; US Census; MG&A
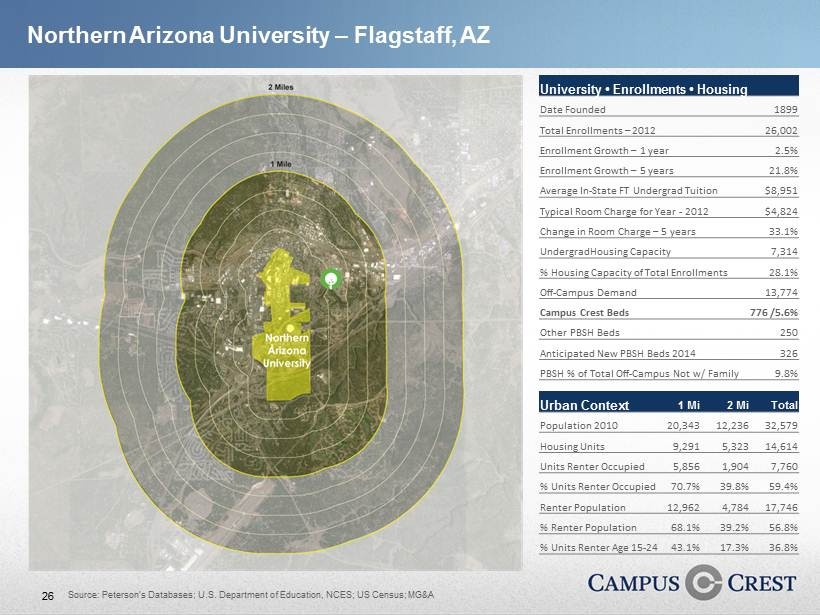
26 Urban Context 1 Mi 2 Mi Total Population 2010 20,343 12,236 32,579 Housing Units 9,291 5,323 14,614 Units Renter Occupied 5,856 1,904 7,760 % Units Renter Occupied 70.7% 39.8% 59.4% Renter Population 12,962 4,784 17,746 % Renter Population 68.1% 39.2% 56.8% % Units Renter Age 15 - 24 43.1% 17.3% 36.8% University • Enrollments • Housing Date Founded 1899 Total Enrollments – 2012 26,002 Enrollment Growth – 1 year 2.5% Enrollment Growth – 5 years 21.8% Average In - State FT Undergrad Tuition $8,951 Typ ical Room Charge for Year - 2012 $4,824 Change in Room Charge – 5 years 33.1% UndergradHousing Capacity 7,314 % Housing Capacity of Total Enrollments 28.1% Off - Campus Demand 13,774 Campus Crest Beds 776 /5.6% Other PBSH Beds 250 Anticipated New PBSH Beds 2014 326 PBSH % of Total Off - Campus Not w / Family 9.8% Source: Peterson’s Databases; U.S. Department of Education, NCES; US Census; MG&A Northern Arizona University – Flagstaff, AZ
27 • Pent - up demand continues to be the predominant factor driving this market • At current supply levels, pent - up demand will not be fulfilled within the decade • There are significant differences in the regional, and even greater variations in the market strength, demand and supply characteristics of individual campus markets The Student Housing Market Conclusion Market conditions to support industry expansion remain favorable

28
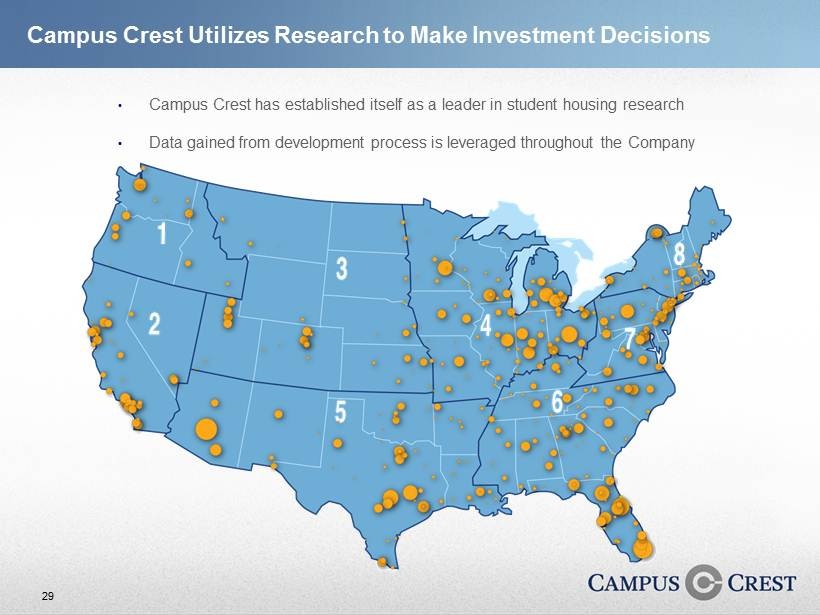
29 • Standard underwriting process • Campus Crest has established itself as a leader in student housing research • Data gained from development process is leveraged throughout the Company Campus Crest Utilizes Research to Make Investment Decisions
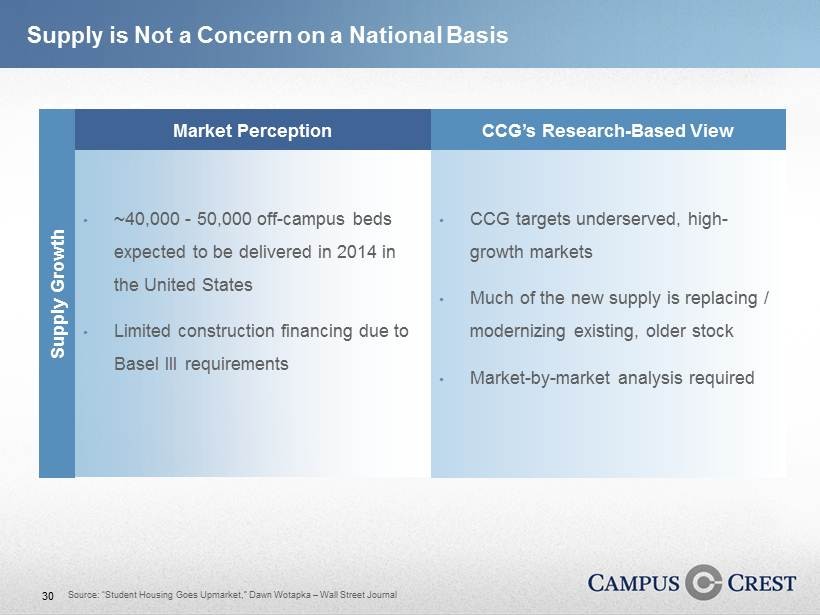
30 • CCG targets underserved, high - growth markets • Much of the new supply is replacing / modernizing existing, older stock • Market - by - market analysis required 5 Piece Puzzle – Wall • ~40,000 - 50,000 off - campus beds expected to be delivered in 2014 in the United States • Limited construction financing due to Basel III requirements Market Perception CCG’s Research - Based View Supply Growth Supply is Not a Concern on a National Basis Source: “Student Housing Goes Upmarket ,” Dawn Wotapka – Wall Street Journal
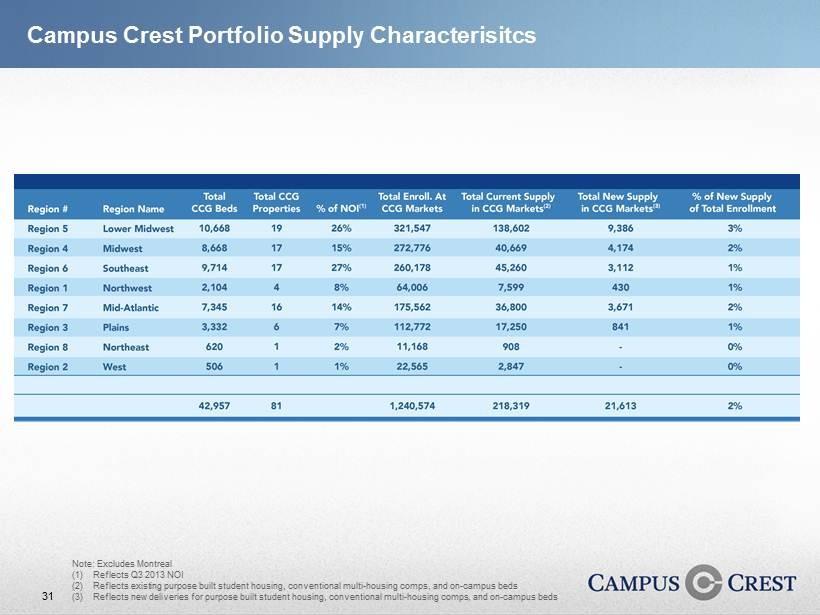
31 Campus Crest Portfolio Supply Characterisitcs Note: Excludes Montreal (1) Reflects Q3 2013 NOI (2) Reflects existing purpose built student housing, conventional multi - housing comps, and on - campus beds (3) Reflects new deliveries for purpose built student housing, conventional multi - housing comps, and on - campus beds
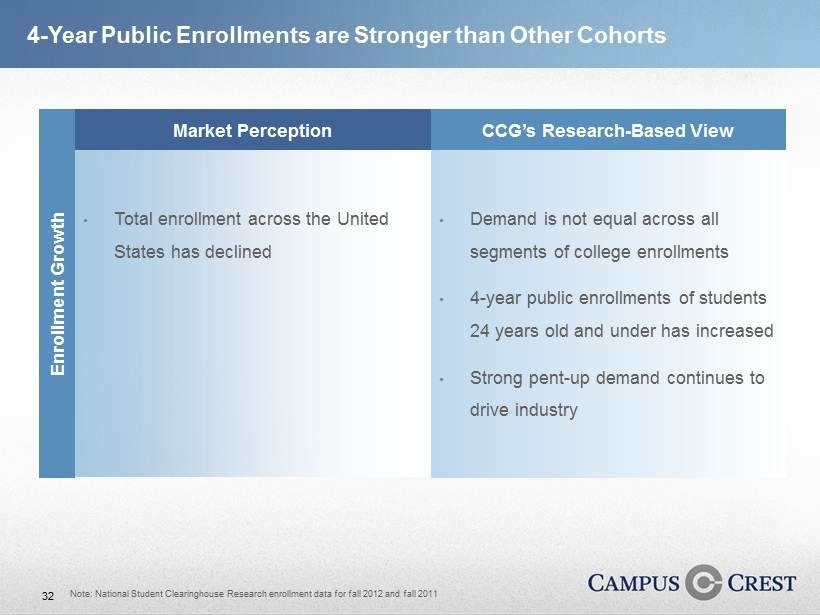
32 4 - Year Public Enrollments are Stronger than Other Cohorts • Demand is not equal across all segments of college enrollments • 4 - year public enrollments of students 24 years old and under has increased • Strong pent - up demand continues to drive industry • Total enrollment across the United States has declined Market Perception CCG’s Research - Based View Enrollment Growth Note: National Student Clearinghouse Research enrollment data for fall 2012 and fall 2011
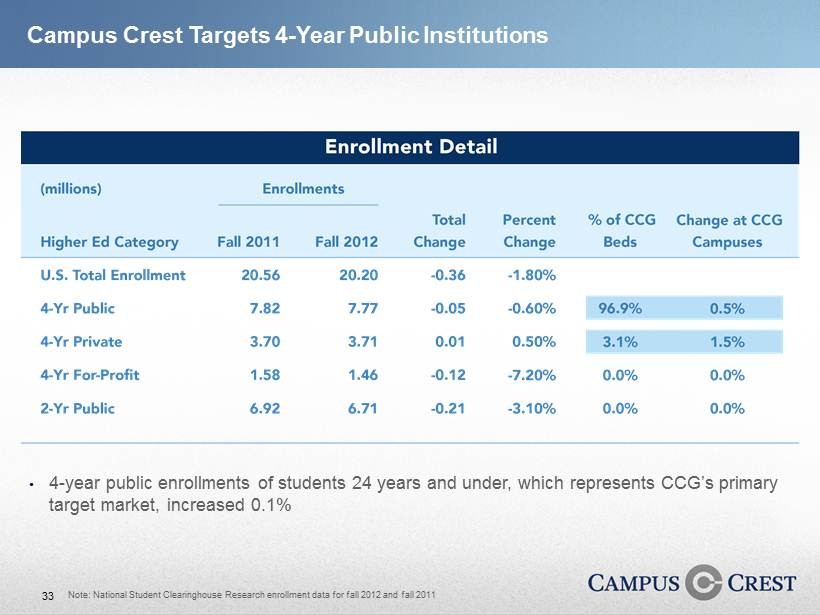
33 Note: National Student Clearinghouse Research enrollment data for fall 2012 and fall 2011 • 4 - year public enrollments of students 24 years and under, which represents CCG’s primary target market, increased 0.1% Campus Crest Targets 4 - Year Public Institutions

34 Source: U.S. Department of Education, NCES, Michael Gallis & Associates (Dec 2013) Current PBSH supply and delivery rates will not fulfill pent - up demand Pent - Up Demand Drives Purpose Built Student Housing Market
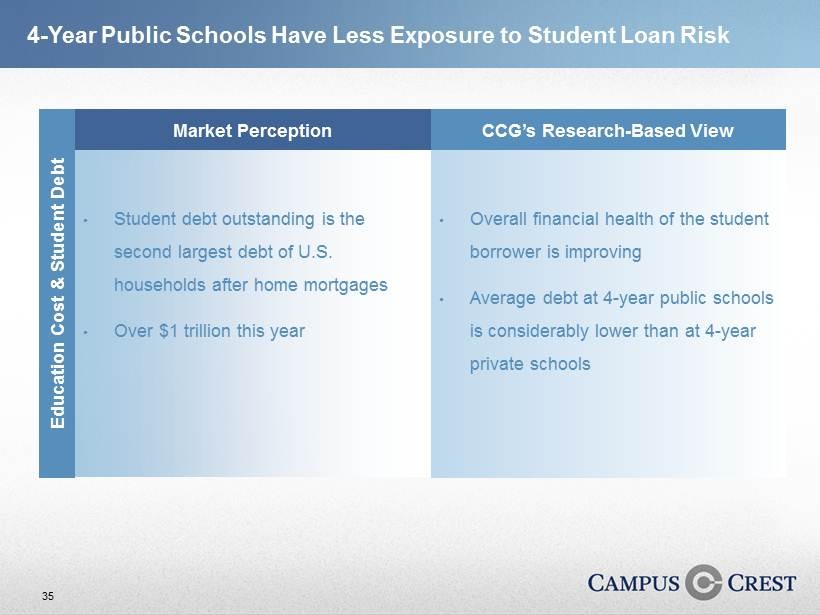
35 4 - Year Public Schools Have Less Exposure to Student Loan Risk • Overall financial health of the student borrower is improving • Average debt at 4 - year public schools is considerably lower than at 4 - year private schools • Student debt outstanding is the second largest debt of U.S. households after home mortgages • Over $1 trillion this year Market Perception CCG’s Research - Based View Education Cost & Student Debt

36 Source: U.S. Department of Education and Federal Student Aid; Department of Education reflects average debt in 2010 (after 6 years for a student who began college in 2004 and obtained a BA degree) (1) Average interest rate of ~4.0% reflected by the U.S. Department of Education, Federal Student Aid; reflects 10 - year payment schedule 4 - Year Publics Offer Education Value, Resulting in Reduced Borrowing Average monthly loan payment amount (1) : ~$130
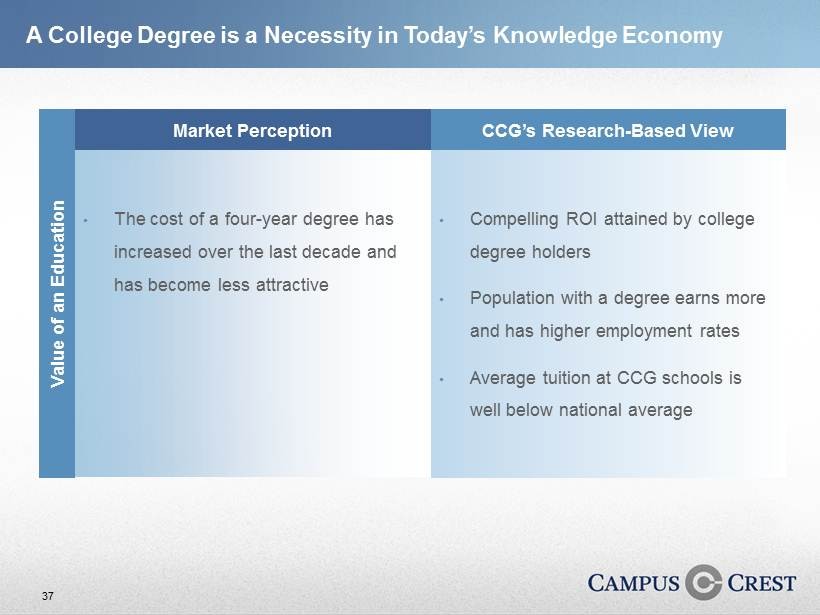
37 A College Degree is a Necessity in Today’s Knowledge Economy • Compelling ROI attained by college degree holders • Population with a degree earns more and has higher employment rates • Average tuition at CCG schools is well below national average • The cost of a four - year degree has increased over the last decade and has become less attractive Market Perception CCG’s Research - Based View Value of an Education
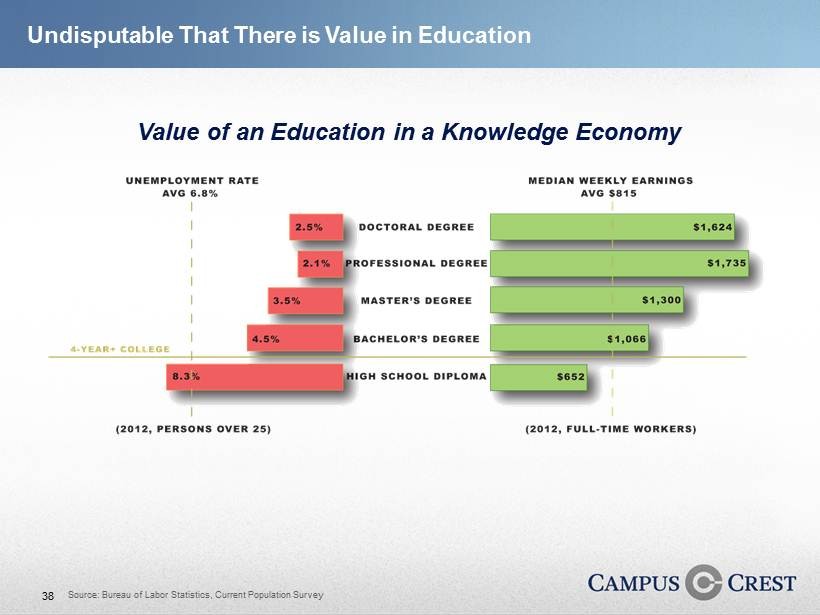
38 Source: Bureau of Labor Statistics, Current Population Survey Value of an Education in a Knowledge Economy Undisputable That There is Value in Education
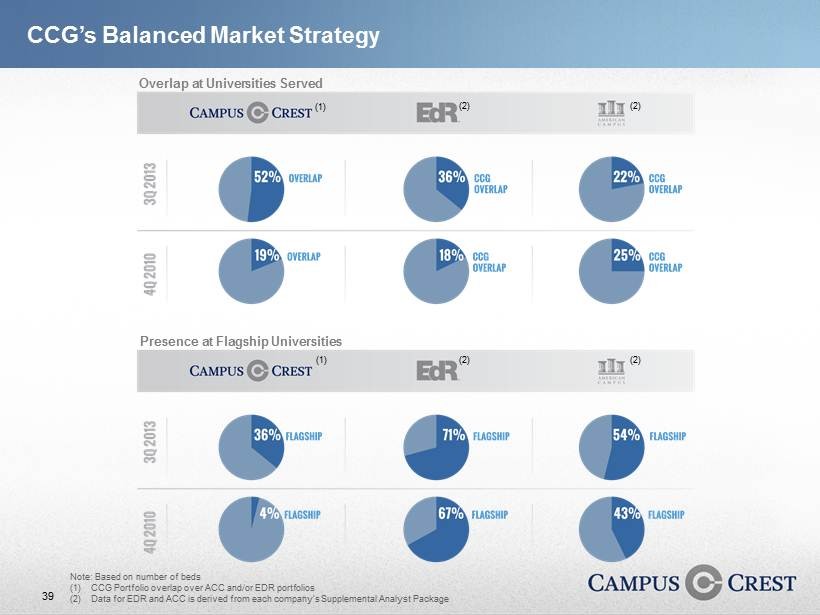
39 Overlap at Universities Served Presence at Flagship Universities Note: Based on number of beds (1) CCG Portfolio overlap over ACC and/or EDR portfolios (2) Data for EDR and ACC is derived from each company’s Supplemental Analyst Package (1) CCG’s Balanced Market Strategy (2) (2) (2) (2) (1)
40
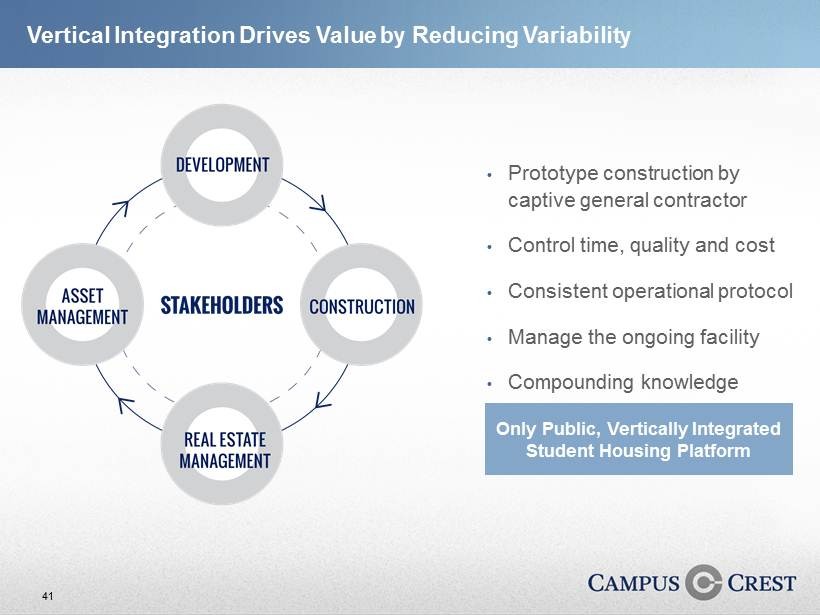
41 • Prototype construction by captive general contractor • Control time, quality and cost • Consistent operational protocol • Manage the ongoing facility • Compounding knowledge Only Public, Vertically Integrated Student Housing Platform Vertical Integration Drives Value by Reducing Variability
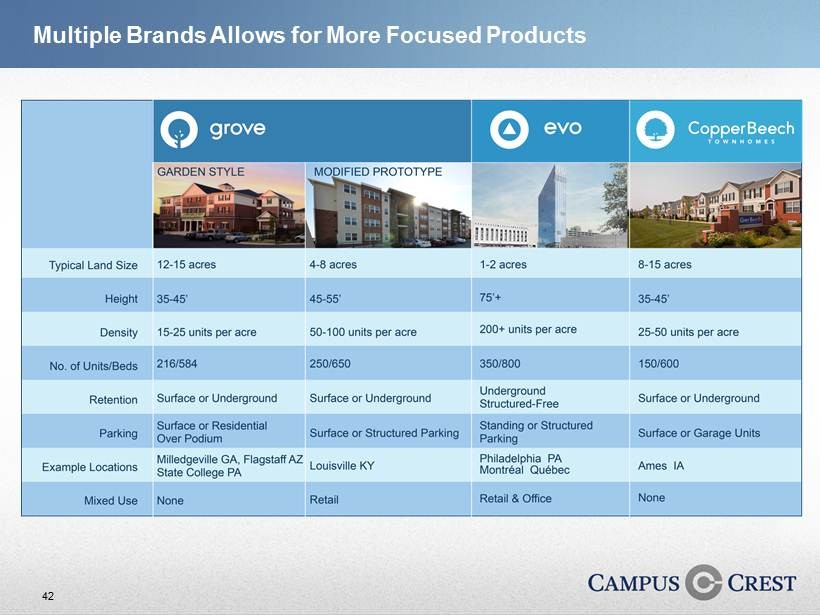
42 Multiple Brands Allows for More Focused Products • Standard underwriting process • RDPS - > Corporate Office - >Investment Committee • Network of on - the - ground, regional site acquisition specialists • Detailed underwriting protocol
43 Flyover of The Grove at Ft. Collins (Video)
44 Flyover of evo at Cira Centre South (Video)
45 Flyover of Copper Beech at Ames (Video)
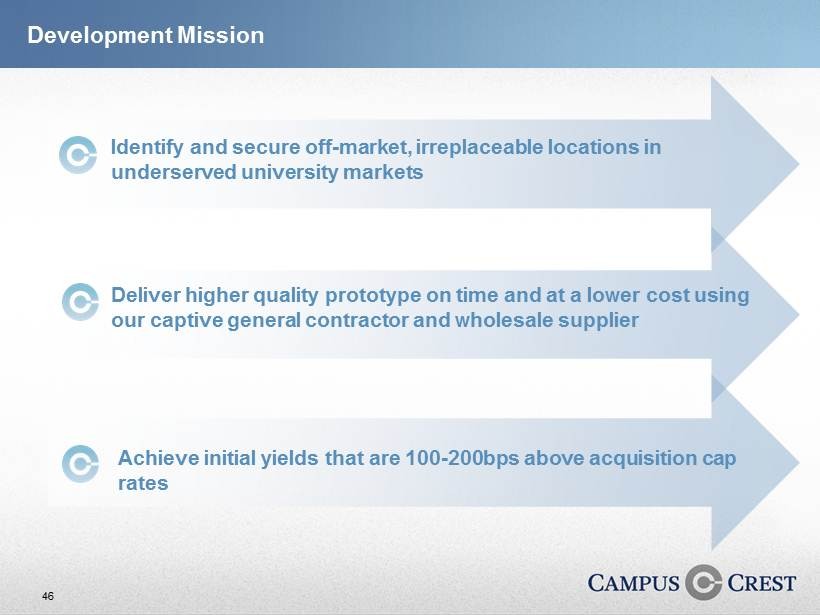
46 Development Mission Identify and secure off - market, irreplaceable locations in underserved university markets Deliver higher quality prototype on time and at a lower cost using our captive general contractor and wholesale supplier Achieve initial yields that are 100 - 200bps above acquisition cap rates
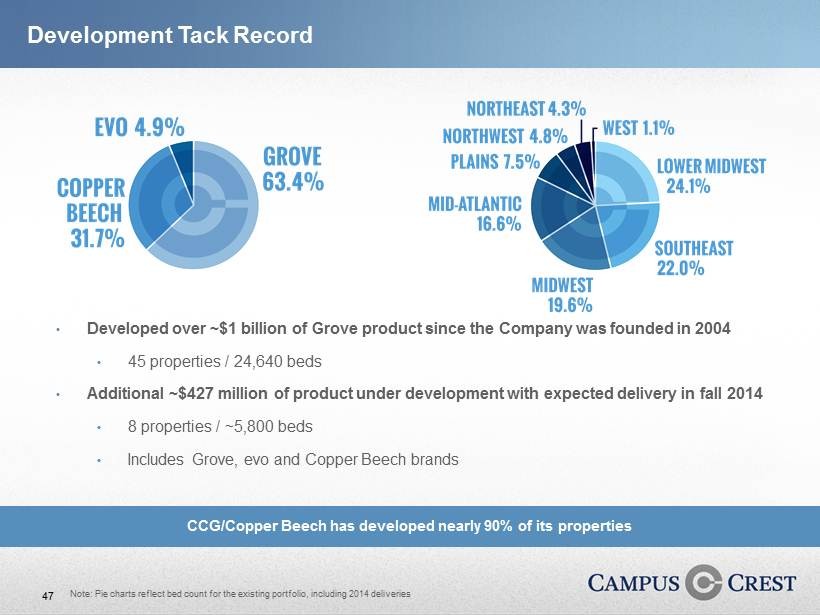
47 Development Tack Record • Developed over ~$1 billion of Grove product since the Company was founded in 2004 • 45 properties / 24,640 beds • Additional ~$427 million of product under development with expected delivery in fall 2014 • 8 properties / ~5,800 beds • Includes Grove, evo and Copper Beech brands CCG/Copper Beech has developed nearly 90% of its properties Note: Pie charts reflect bed count for the existing portfolio, including 2014 deliveries
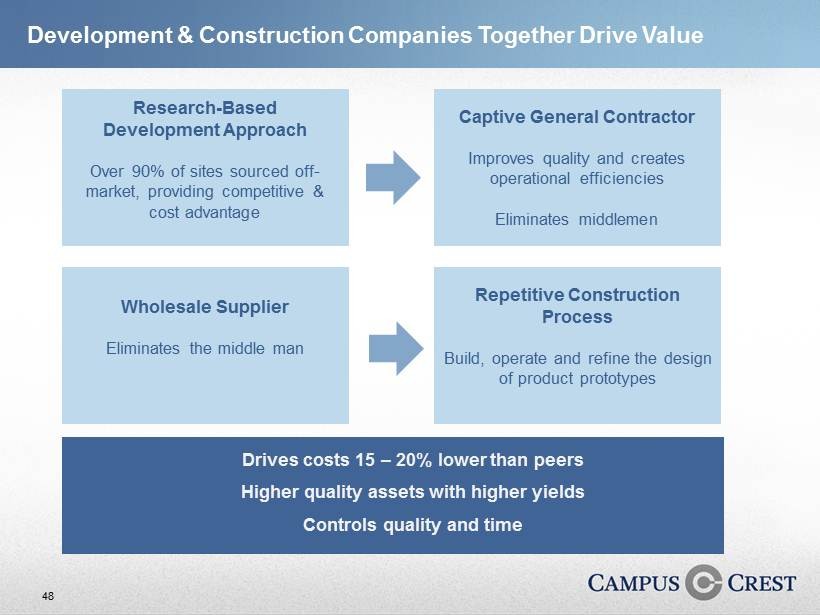
48 Development & Construction Companies Together Drive Value Research - Based Development Approach Over 90% of sites sourced off - market, providing competitive & cost advantage Drives costs 15 – 20% lower than peers Higher quality assets with higher yields Controls quality and time Captive General Contractor Improves quality and creates operational efficiencies Eliminates middlemen Wholesale Supplier Eliminates the middle man Repetitive Construction Process Build, operate and refine the design of product prototypes
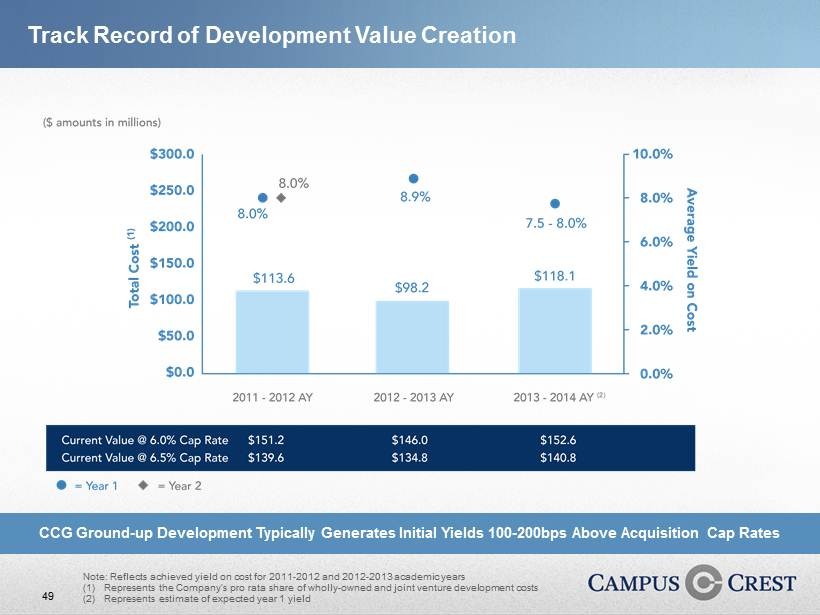
49 Track Record of Development Value Creation Note: Reflects achieved yield on cost for 2011 - 2012 and 2012 - 2013 academic years (1) Represents the Company’s pro rata share of wholly - owned and joint venture development costs (2) Represents estimate of expected year 1 yield CCG Ground - up Development Typically Generates Initial Yields 100 - 200bps Above Acquisition Cap Rates

50

51 People, Systems & Practices Drive the Customer Experience and Consistent Performance
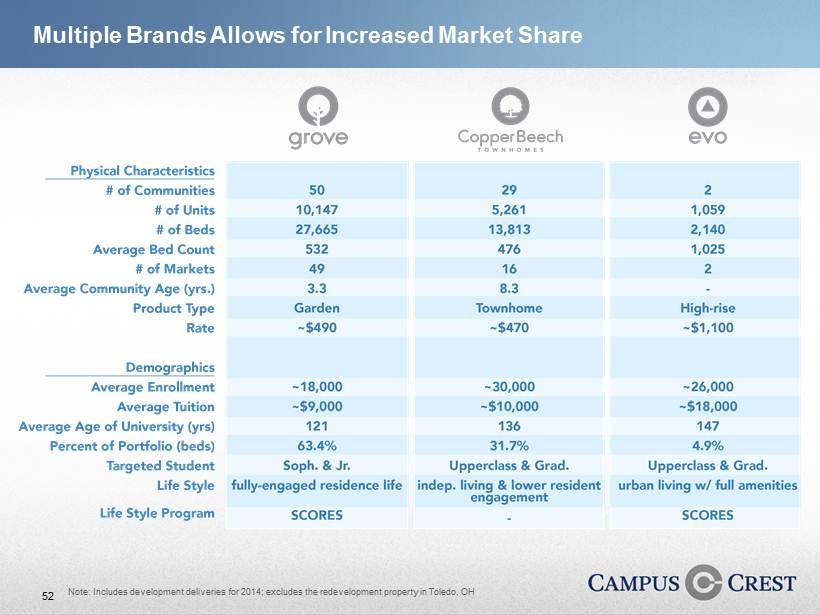
52 Multiple Brands Allows for Increased Market Share Note: Includes development deliveries for 2014; excludes the redevelopment property in Toledo, OH
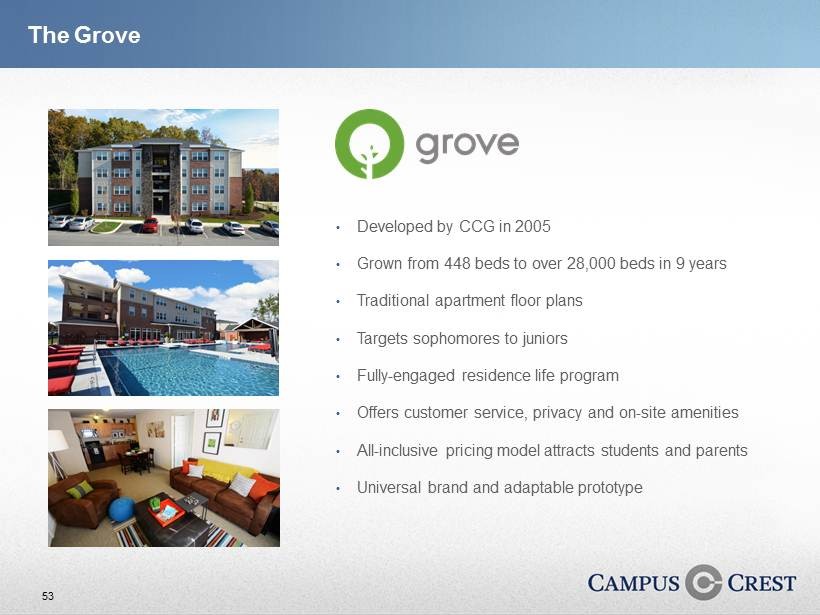
53 • Developed by CCG in 2005 • Grown from 448 beds to over 28,000 beds in 9 years • Traditional apartment floor plans • Targets sophomores to juniors • Fully - engaged residence life program • Offers customer service, privacy and on - site amenities • All - inclusive pricing model attracts students and parents • Universal brand and adaptable prototype The Grove

54 • Developed in 1991 by Dr. Jack McWhirter • High - value townhouse product • Targets upperclassmen and grad students that desire a more “residential” experience • More independent living and lower resident engagement • Large units with higher average sq. ft. per bedroom • Recognizable brand and prototype Copper Beech Townhomes
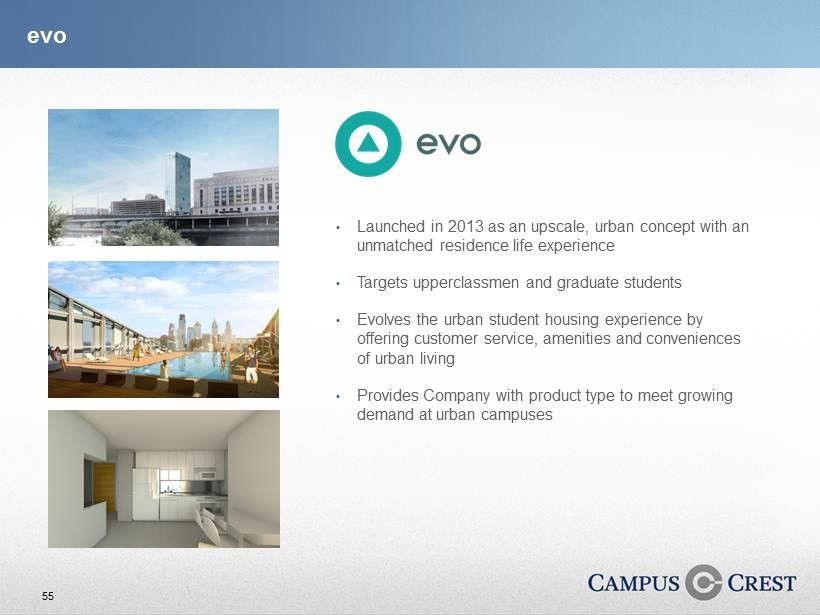
55 • Launched in 2013 as an upscale, urban concept with an unmatched residence life experience • Targets upperclassmen and graduate students • Evolves the urban student housing experience by offering customer service, amenities and conveniences of urban living • Provides Company with product type to meet growing demand at urban campuses evo

56 SOCIAL CULTURAL OUTREACH RECREATIONAL EDUCATIONAL SUSTAINABILITY RESIDENCE LIFE Lifestyle is the foundation of our student communities, influencing both how we design properties and how we operate them . We’ve developed a comprehensive residence life program, SCORES, that emphasizes community engagement in every aspect of The Grove experience . With us, residents find more than a place to live . They build strong friendships in a community of their peers, enjoy a wide variety of exciting social opportunities, and make a difference with meaningful sustainability and outreach projects . Thanks to our laser focus on lifestyle, we’ve created a college experience that students can’t find anywhere else which creates sticky residents . Industry Leading Customer Experience
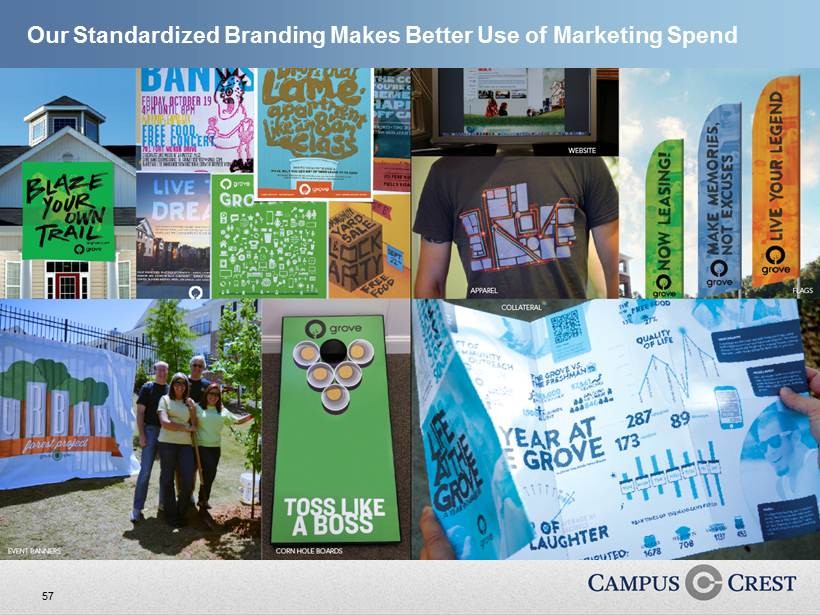
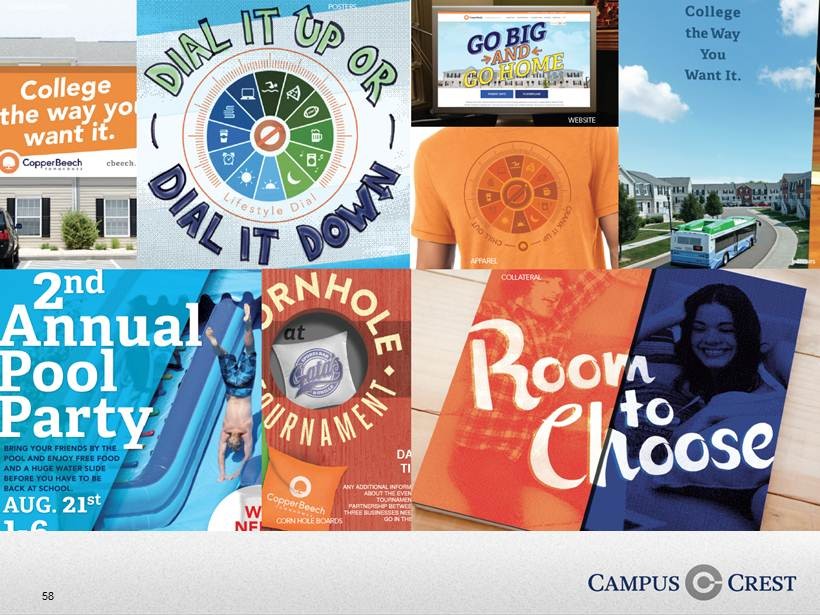
57 Our Standardized Branding Makes Better Use of Marketing Spend
58

59 Customer Experience Drives Leasing and Operating Results Note: Financials reflect wholly - owned properties as shown in Supplemental Analyst Package
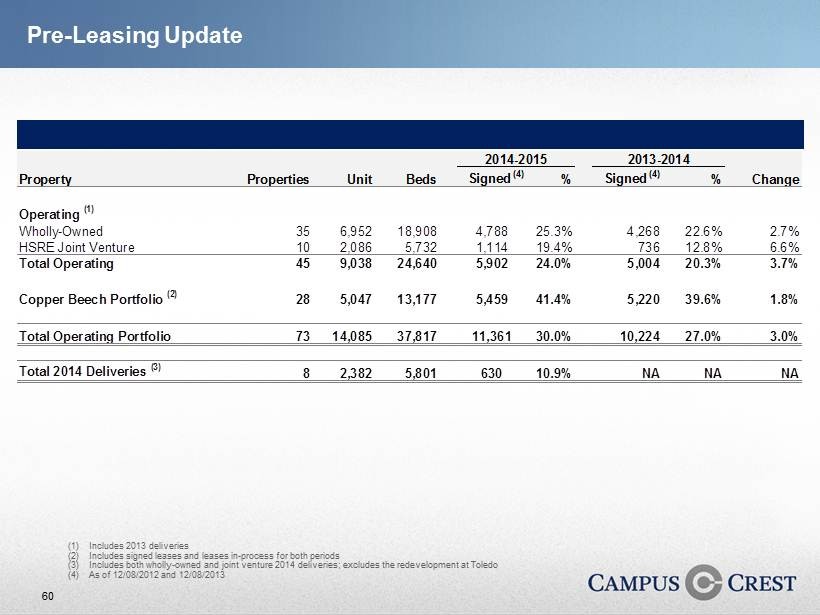
60 Pre - Leasing Update (1) Includes 2013 deliveries (2) Includes signed leases and leases in - process for both periods (3) Includes both wholly - owned and joint venture 2014 deliveries; excludes the redevelopment at Toledo (4) As of 12/08/2012 and 12/08/2013 2014-2015 2013-2014 Property Properties Unit Beds Signed (4) % Signed (4) % Change Operating (1) Wholly-Owned 35 6,952 18,908 4,788 25.3% 4,268 22.6% 2.7% HSRE Joint Venture 10 2,086 5,732 1,114 19.4% 736 12.8% 6.6% Total Operating 45 9,038 24,640 5,902 24.0% 5,004 20.3% 3.7% Copper Beech Portfolio (2) 28 5,047 13,177 5,459 41.4% 5,220 39.6% 1.8% Total Operating Portfolio 73 14,085 37,817 11,361 30.0% 10,224 27.0% 3.0% Total 2014 Deliveries (3) 8 2,382 5,801 630 10.9% NA NA NA
61
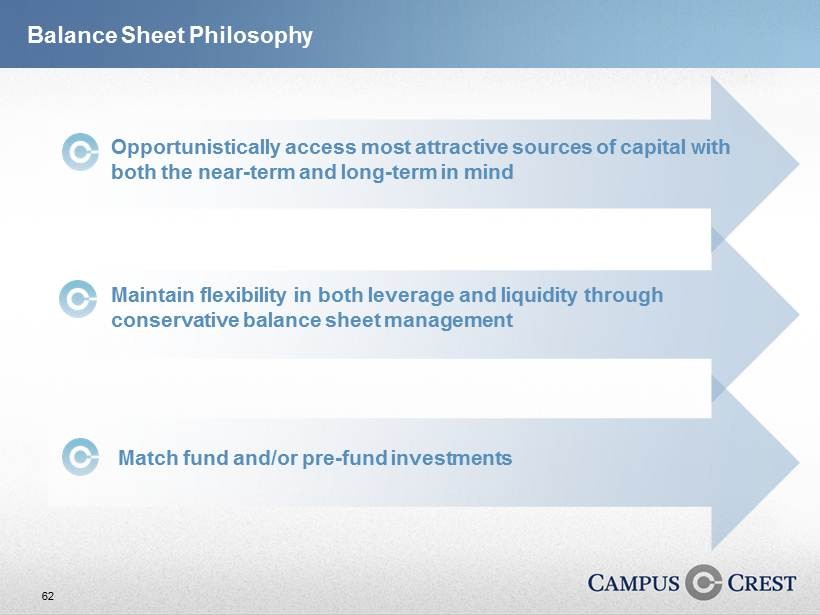
62 Balance Sheet Philosophy Opportunistically access most attractive sources of capital with both the near - term and long - term in mind Maintain flexibility in both leverage and liquidity through conservative balance sheet management Match fund and/or pre - fund investments
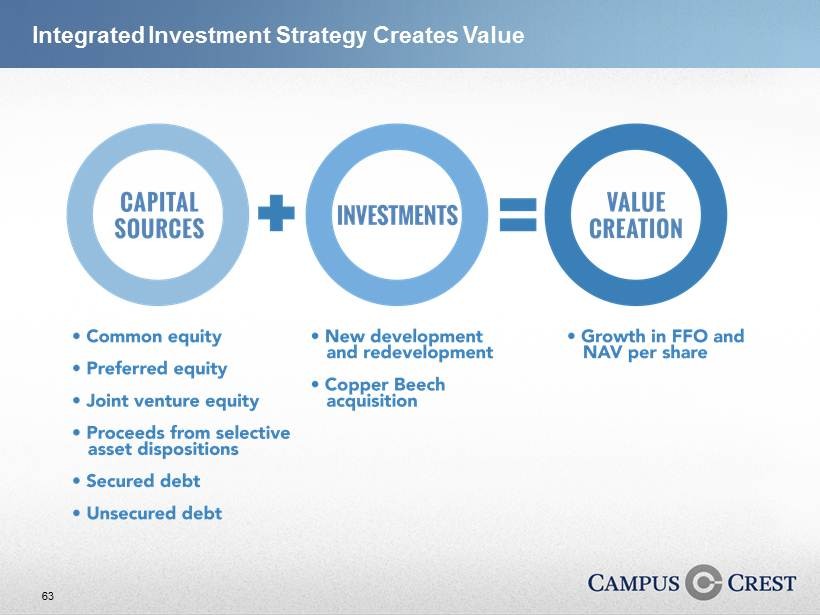
63 Integrated Investment Strategy Creates Value
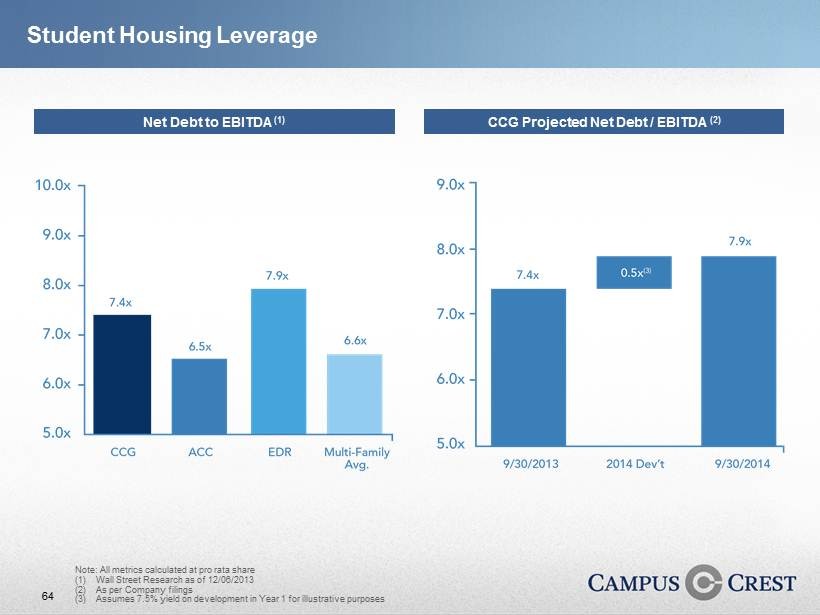
64 Student Housing Leverage Net Debt to EBITDA (1) Note: All metrics calculated at pro rata share (1) Wall Street Research as of 12/06/2013 (2) As per Company filings (3) Assumes 7.5% yield on development in Year 1 for illustrative purposes CCG Projected Net Debt / EBITDA (2) (3) Preferred [Remove for Final Version]
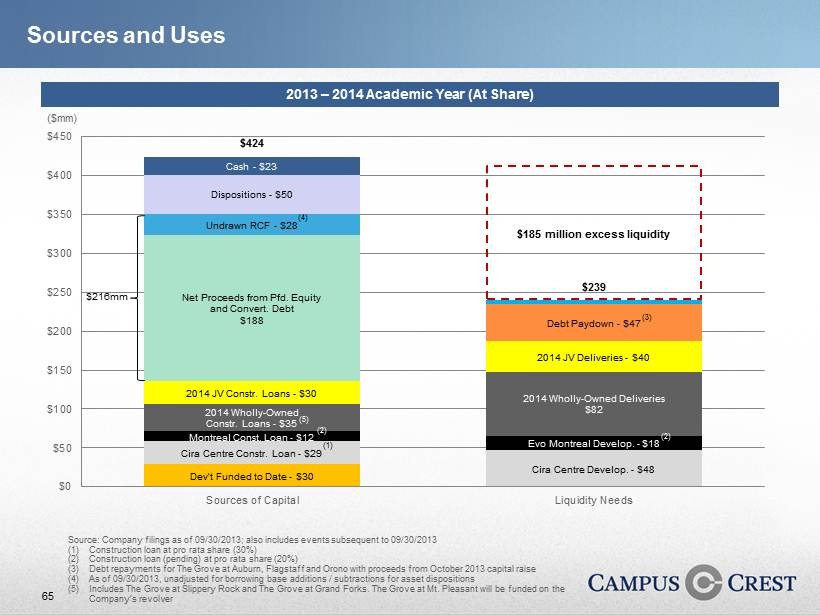
65 Sources and Uses Source: Company filings as of 09/30/2013; also includes events subsequent to 09/30/2013 (1) Construction loan at pro rata share (30%) (2) Construction loan (pending) at pro rata share (20%) (3) Debt repayments for The Grove at Auburn, Flagstaff and Orono with proceeds from October 2013 capital raise (4) As of 09/30/2013, unadjusted for borrowing base additions / subtractions for asset dispositions (5) Includes The Grove at Slippery Rock and The Grove at Grand Forks. The Grove at Mt. Pleasant will be funded on the Company’s revolver 2013 – 2014 Academic Year (At Share) Dev't Funded to Date - $30 Cira Centre Constr. Loan - $29 Cira Centre Develop. - $48 Evo Montreal Develop. - $18 2014 Wholly - Owned Constr. Loans - $35 2014 JV Constr. Loans - $30 Net Proceeds from Pfd. Equity and Convert . Debt $188 Undrawn RCF - $28 Dispositions - $50 Cash - $23 2014 Wholly - Owned Deliveries $ 82 2014 JV Deliveries - $40 Debt Paydown - $47 $424 $239 $0 $50 $100 $150 $200 $250 $300 $350 $400 $450 Sources of Capital Liquidity Needs ($mm) $185 million excess liquidity (3) (4) (1) Montreal Const. Loan - $12 (2) $216mm (5) (2)
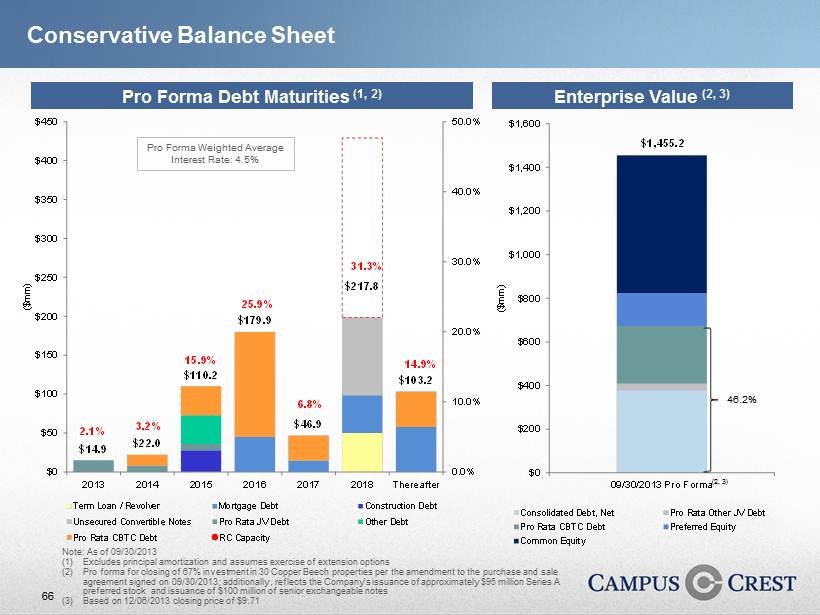
66 Note: As of 09/30/2013 (1) Excludes principal amortization and assumes exercise of extension options (2) Pro forma for closing of 67% investment in 30 Copper Beech properties per the amendment to the purchase and sale agreement signed on 09/30/2013; additionally, reflects the Company’s issuance of approximately $95 million Series A preferred stock and issuance of $100 million of senior exchangeable notes (3) Based on 12/06/2013 closing price of $9.71 Enterprise Value (2, 3) Pro Forma Debt Maturities (1, 2) Conservative Balance Sheet $1,455.2 $0 $200 $400 $600 $800 $1,000 $1,200 $1,400 $1,600 09/30/2013 Pro Forma ($mm) Consolidated Debt, Net Pro Rata Other JV Debt Pro Rata CBTC Debt Preferred Equity Common Equity 46.2% (2, 3) Pro Forma Weighted Average Interest Rate: 4.5% $14.9 $22.0 $110.2 $179.9 $46.9 $217.8 $103.2 2.1% 3.2% 15.9% 25.9% 6.8% 31.3% 14.9% 0.0% 10.0% 20.0% 30.0% 40.0% 50.0% $0 $50 $100 $150 $200 $250 $300 $350 $400 $450 2013 2014 2015 2016 2017 2018 Thereafter ($mm) Term Loan / Revolver Mortgage Debt Construction Debt Unsecured Convertible Notes Pro Rata JV Debt Other Debt Pro Rata CBTC Debt RC Capacity
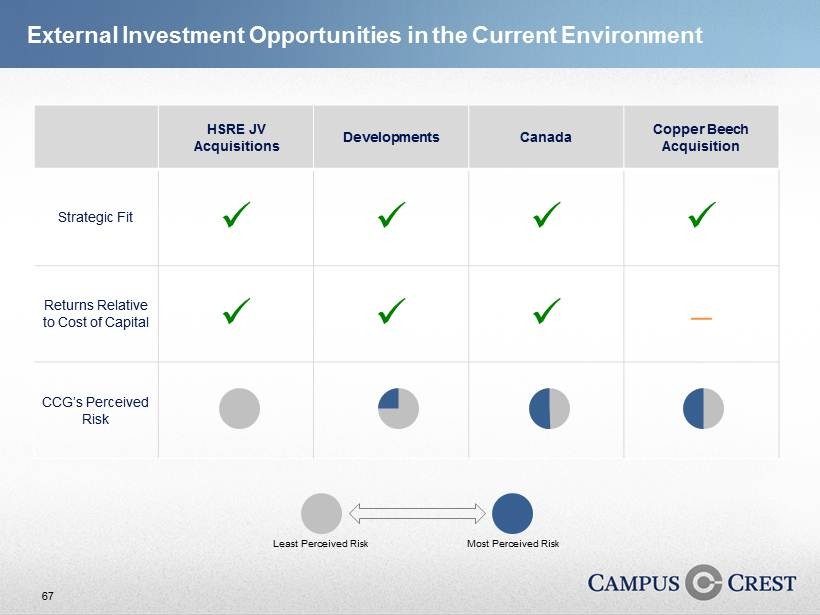
67 HSRE JV Acquisitions Developments Canada Copper Beech Acquisition Strategic Fit x x x x Returns Relative to Cost of Capital x x x CCG’s Perceived Risk Least Perceived Risk Most Perceived Risk External Investment Opportunities in the Current Environment

68 Note: Financials reflect same store wholly - owned properties as shown in each company’s Supplemental Analyst Package Same Store Growth Versus Peers
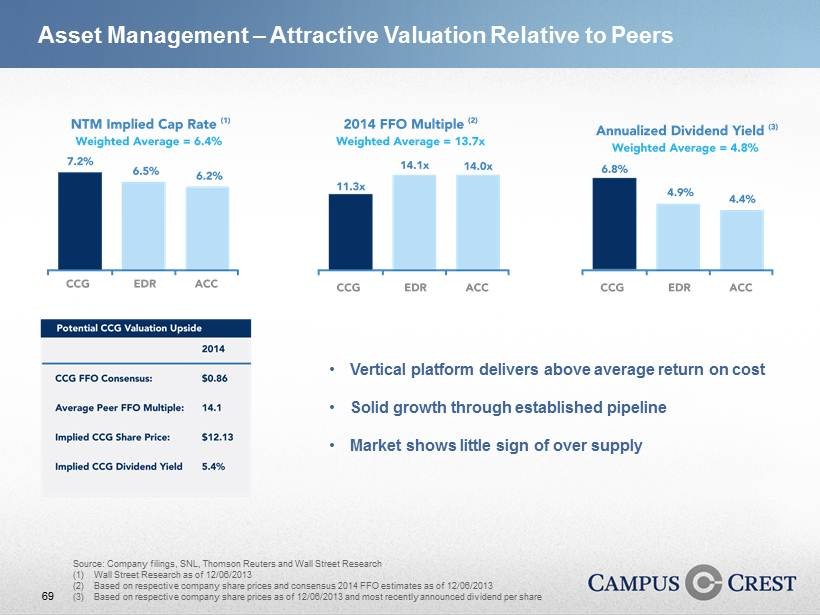
69 • CCG 2013 FFO Consensus: $0.86/share • 2013 Average Peer FFO Multiple: 15.7x • Implied CCG Share Price: $13.50 • Implied CCG Dividend Yield: 4.9% Source: Company filings, SNL, Thomson Reuters and Wall Street Research (1) Wall Street Research as of 12/06/2013 (2) Based on respective company share prices and consensus 2014 FFO estimates as of 12/06/2013 (3) Based on respective company share prices as of 12/06/2013 and most recently announced dividend per share Asset Management – Attractive Valuation Relative to Peers • Vertical platform delivers above average return on cost • Solid growth through established pipeline • Market shows little sign of over supply
70
71 This presentation contains certain forward - looking statements that are subject to risks and uncertainties . These forward - looking statements are based on certain assumptions, discuss future expectations, describe future plans and strategies, contain financial and operating projections or state other forward - looking information . The Company’s ability to predict results or the actual effect of future events, actions, plans or strategies is inherently uncertain . Although the Company believes that the expectations reflected in such forward - looking statements are based on reasonable assumptions, the Company’s actual results and performance could differ materially from those set forth in, or implied by, the forward - looking statements . You are cautioned not to place undue reliance on any of these forward - looking statements, which reflect the Company’s views on this date . Furthermore, except as required by law, the Company is under no duty to, and does not intend to, update any of our forward - looking statements after this date, whether as a result of new information, future events or otherwise . This presentation does not constitute, and may not be used in connection with, an offer or solicitation by anyone in any jurisdiction in which such offer or solicitation is not permitted by law or in which the person making the offer or solicitation is not qualified to do so or to any person to whom it is unlawful to make such offer or solicitation . Forward Looking Statements