
Jefferies Global Healthcare and Life Science REIT Conference Presentation April 2013

FORWARD LOOKING STATEMENTS 2 This presentation contains “forward-looking” statements that may be identified, without limitation, by the use of “expects,” “believes,” “intends,” “should” or comparable terms or the negative thereof. Forward-looking statements in this presentation also include all statements regarding expected future financial position, results of operations, cash flows, liquidity, financing plans, business strategy, the expected amounts and timing of dividends, projected expenses and capital expenditures, competitive position, growth opportunities and potential acquisitions, plans and objectives for future operations and compliance with and changes in governmental regulations. These statements are made as of the date hereof and are subject to known and unknown risks, uncertainties, assumptions and other factors—many of which are out of the Company’s control and difficult to forecast—that could cause actual results to differ materially from those set forth in or implied by our forward-looking statements. These risks and uncertainties include but are not limited to: our dependence on Genesis HealthCare LLC (“Genesis”), the parent company of Sun Healthcare Group, Inc. (“Sun”), until we are able to further diversify our portfolio; our dependence on the operating success of our tenants; changes in general economic conditions and volatility in financial and credit markets; the dependence of our tenants on reimbursement from governmental and other third-party payors; the significant amount of and our ability to service our indebtedness; covenants in our debt agreements that may restrict our ability to make acquisitions, incur additional indebtedness and refinance indebtedness on favorable terms; increases in market interest rates; our ability to raise capital through equity and debt financings; the relatively illiquid nature of real estate investments; competitive conditions in our industry; the loss of key management personnel or other employees; the impact of litigation and rising insurance costs on the business of our tenants; uninsured or underinsured losses affecting our properties and the possibility of environmental compliance costs and liabilities; our ability to maintain our status as a REIT; compliance with REIT requirements and certain tax matters related to our status as a REIT; and other factors discussed from time to time in our news releases, public statements and/or filings with the Securities and Exchange Commission (the “SEC”), especially the “Risk Factors” sections of our Annual and Quarterly Reports on Forms 10-K and 10-Q. The Company assumes no, and hereby disclaims any, obligation to update any of the foregoing or any other forward-looking statements as a result of new information or new or future developments, except as otherwise required by law. TENANT INFORMATION This presentation includes information regarding Genesis and Sun, a subsidiary of Genesis effective December 1, 2012. Prior to December 1, 2012, Sun was subject to the reporting requirements of the SEC and was required to file with the SEC annual reports containing audited financial information and quarterly reports containing unaudited financial information. Genesis is not subject to SEC reporting requirements. Sun’s historical filings with the SEC can be found at www.sec.gov. This presentation also includes information regarding each of our other tenants that lease properties from us. The information related to Sun and our other tenants that is provided in this presentation has been provided by the tenants or, in the case of Sun, derived from Sun’s public filings or provided by Sun. We have not independently verified this information. We have no reason to believe that such information is inaccurate in any material respect. We are providing this data for informational purposes only.

NON-GAAP FINANCIAL MEASURES 3 This presentation includes the following financial measures defined as non-GAAP financial measures by the SEC: EBITDAR, EBITDARM, funds from operations (“FFO”), adjusted FFO (“AFFO”), and Normalized AFFO. These measures may be different than non-GAAP financial measures used by other companies and the presentation of these measures is not intended to be considered in isolation or as a substitute for financial information prepared and presented in accordance with U.S. generally accepted accounting principles. EBITDAR is defined as earnings before interest, taxes, depreciation, amortization and rent for a particular facility accruing to the operator/tenant of the property (not the Company) for the period presented plus EBITDAR (excluding one-time adjustments) for the period presented for all other operations of any entities that guarantee the tenants' lease obligations to the Company (if applicable). EBITDARM is defined as EBITDAR before management fees for a particular facility accruing to the operator/tenant of the property (not the Company) for the period presented. EBITDAR(M) has limitations as an analytical tool. EBITDAR(M) does not reflect historical cash expenditures or future cash requirements for facility capital expenditures or contractual commitments. In addition, EBITDAR(M) does not represent a property's net income or cash flow from operations and should not be considered an alternative to those indicators. The Company receives EBITDAR(M) and other information from its operators/tenants and relevant guarantors and utilizes EBITDAR(M) as a supplemental measure of the ability of its tenants and the relevant guarantors to generate sufficient liquidity to meet related obligations to the Company. All facility and tenant financial performance data is derived solely from information provided by operators/tenants and guarantors without independent verification by the Company. All such data is presented one month in arrears. The Company includes EBITDAR(M) with respect to a property if the property was operated at any time during the period presented subject to a lease with the Company. EBITDAR(M) for facilities with new tenants/operators are only included in periods subsequent to our acquisition of the facilities. EBITDAR(M) excludes the impact of strategic disposition candidates. FFO is calculated in accordance with The National Association of Real Estate Investment Trusts’ definition of “funds from operations,” and is defined as net income (computed in accordance with GAAP), excluding gains or losses from real estate dispositions, plus real estate depreciation and amortization and impairment charges. AFFO is defined as FFO excluding non-cash revenues (including straight-line rental income adjustments, amortization of acquired above/below market lease intangibles and non-cash interest income adjustments), non-cash expenses (including stock- based compensation expense, amortization of deferred financing costs and amortization of debt discounts and premiums), and acquisition pursuit costs. Normalized AFFO represents AFFO adjusted for one-time start-up costs and non-recurring income and expenses. Reconciliations of these non-GAAP financial measures to the GAAP financial measures we consider most comparable are included under “Reconciliation of Net Income to Funds from Operations (FFO), Adjusted Funds from Operations (AFFO) and Normalized AFFO” in this presentation.

4 Strategic Overview
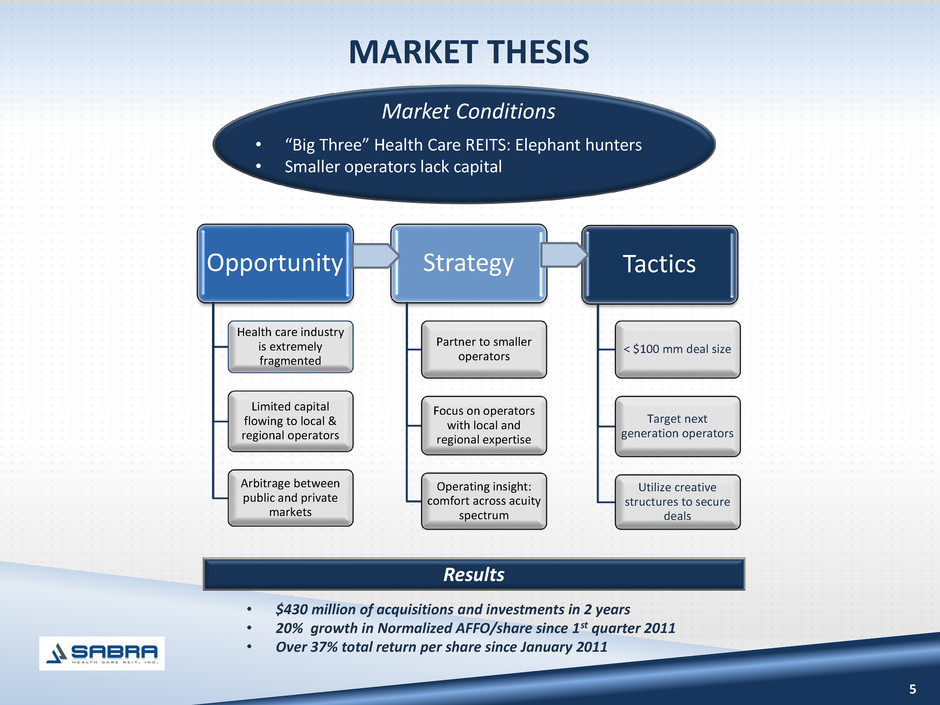
5 MARKET THESIS • “Big Three” Health Care REITS: Elephant hunters • Smaller operators lack capital Market Conditions Opportunity Health care industry is extremely fragmented Limited capital flowing to local & regional operators Arbitrage between public and private markets Strategy Partner to smaller operators Focus on operators with local and regional expertise Operating insight: comfort across acuity spectrum Tactics < $100 mm deal size Target next generation operators Utilize creative structures to secure deals Results • $430 million of acquisitions and investments in 2 years • 20% growth in Normalized AFFO/share since 1st quarter 2011 • Over 37% total return per share since January 2011
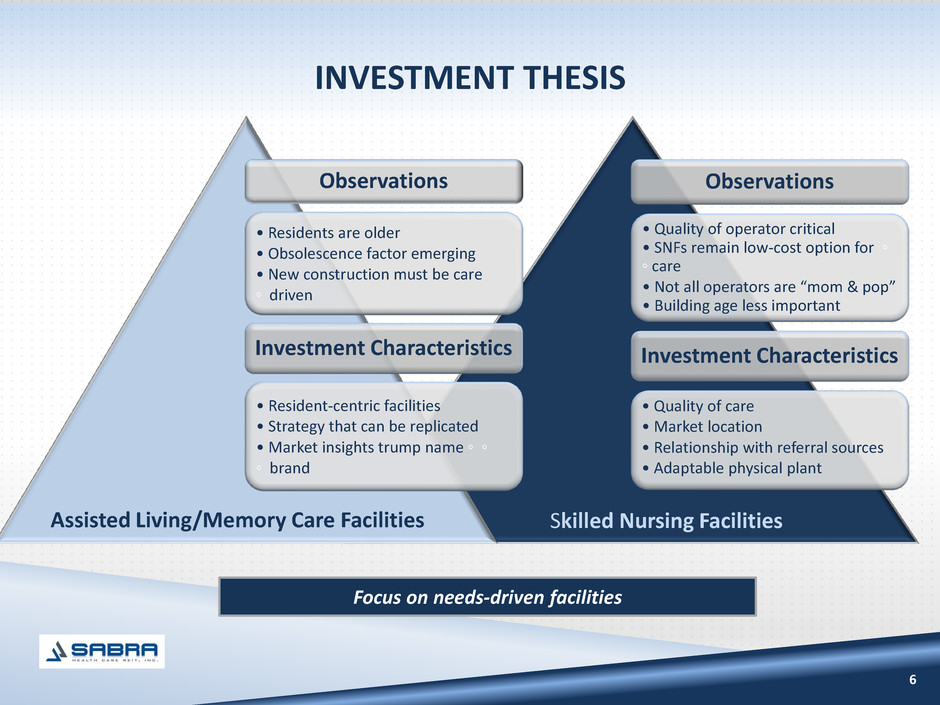
INVESTMENT THESIS 6 Focus on needs-driven facilities Observations • Quality of operator critical • SNFs remain low-cost option for ◦ ◦ care • Not all operators are “mom & pop” • Building age less important Investment Characteristics • Quality of care • Market location • Relationship with referral sources • Adaptable physical plant Observations • Residents are older • Obsolescence factor emerging • New construction must be care ◦ driven Investment Characteristics • Resident-centric facilities • Strategy that can be replicated • Market insights trump name ◦ ◦ ◦ brand Assisted Living/Memory Care Facilities Skilled Nursing Facilities
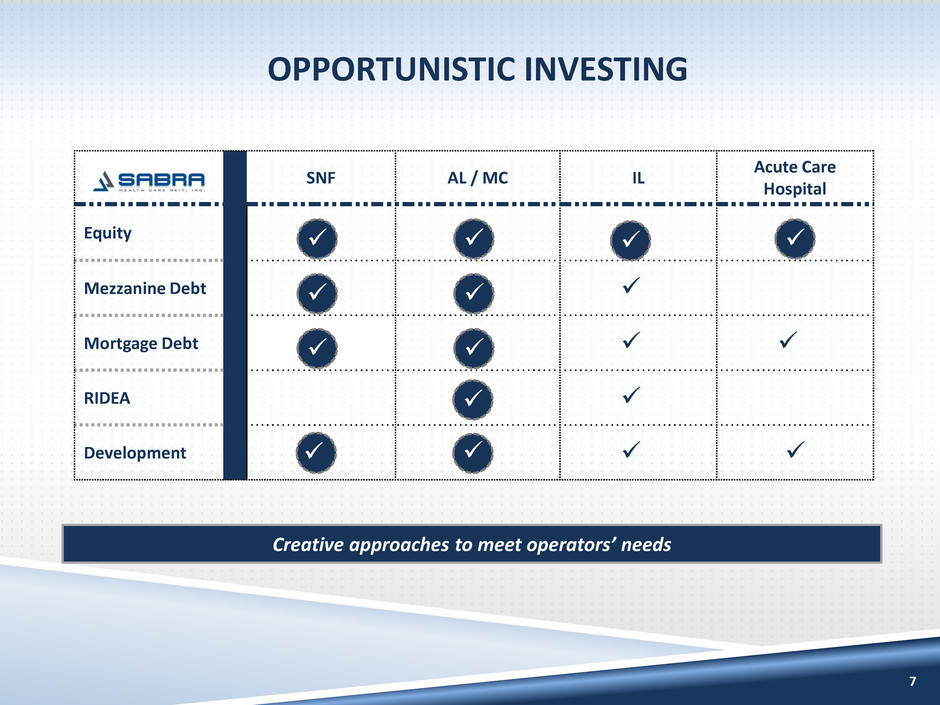
OPPORTUNISTIC INVESTING 7 SNF AL / MC IL Acute Care Hospital Equity Mezzanine Debt Mortgage Debt RIDEA Development Creative approaches to meet operators’ needs
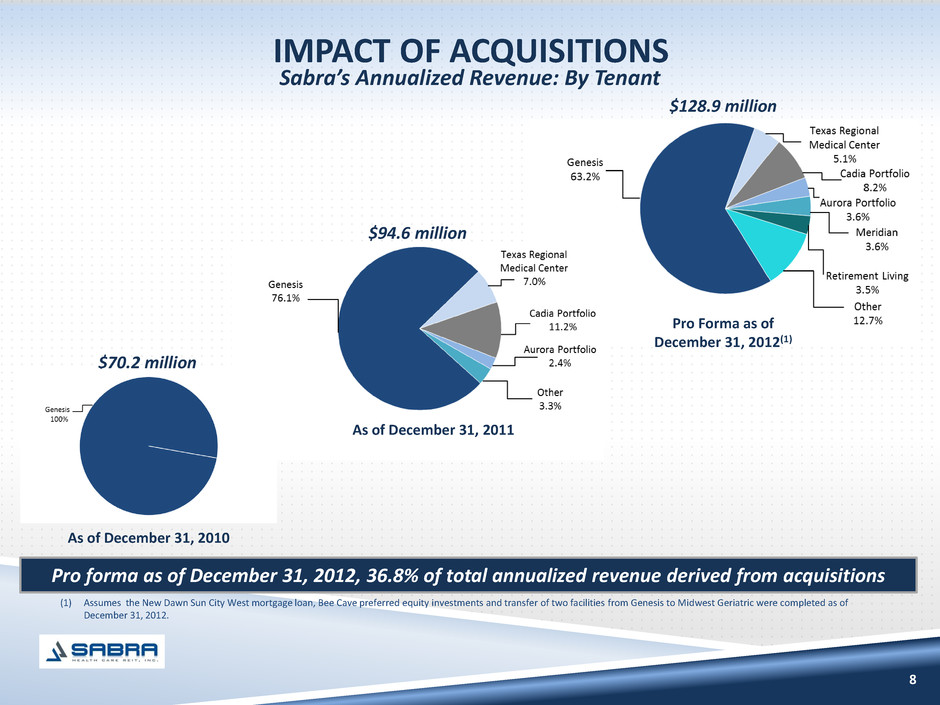
8 As of December 31, 2010 Pro forma as of December 31, 2012, 36.8% of total annualized revenue derived from acquisitions Sabra’s Annualized Revenue: By Tenant IMPACT OF ACQUISITIONS $70.2 million $94.6 million As of December 31, 2011 Pro Forma as of December 31, 2012(1) $128.9 million (1) Assumes the New Dawn Sun City West mortgage loan, Bee Cave preferred equity investments and transfer of two facilities from Genesis to Midwest Geriatric were completed as of December 31, 2012.
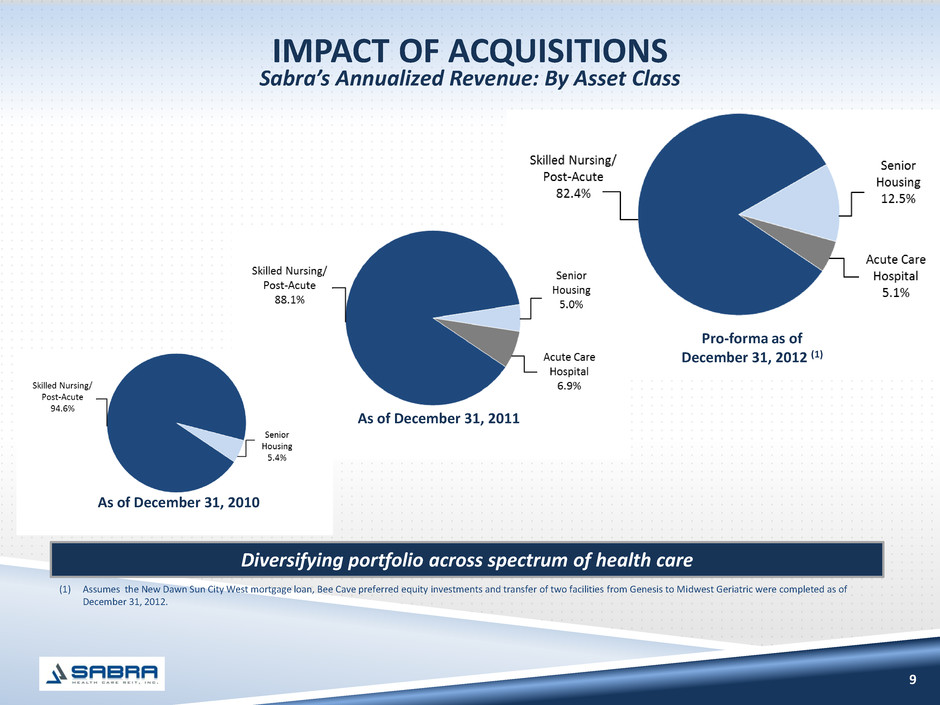
9 Diversifying portfolio across spectrum of health care Sabra’s Annualized Revenue: By Asset Class IMPACT OF ACQUISITIONS As of December 31, 2011 Pro-forma as of December 31, 2012 (1) As of December 31, 2010 (1) Assumes the New Dawn Sun City West mortgage loan, Bee Cave preferred equity investments and transfer of two facilities from Genesis to Midwest Geriatric were completed as of December 31, 2012.
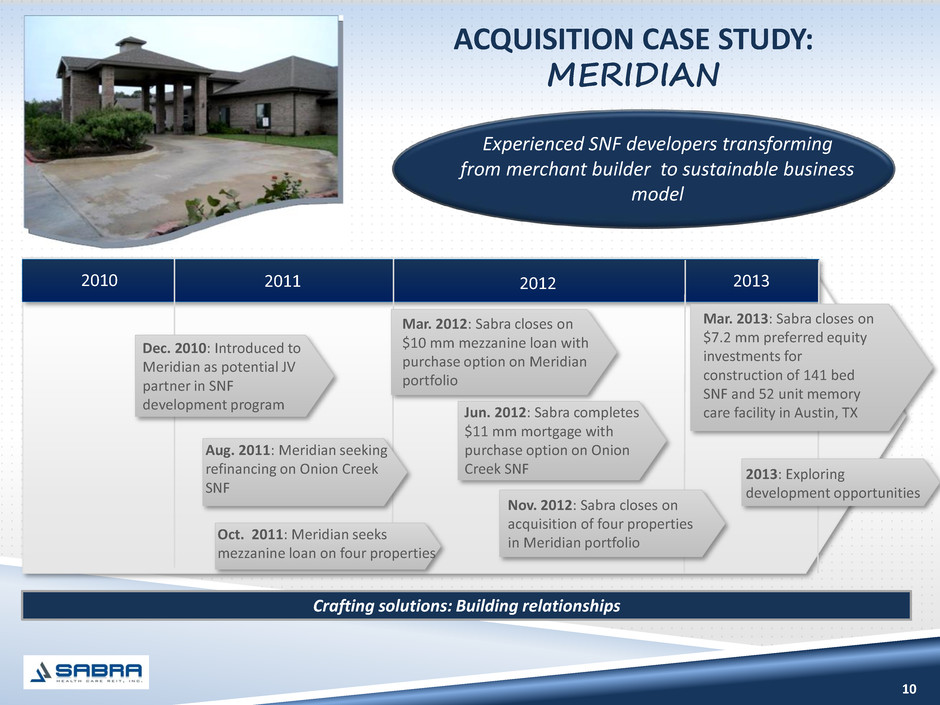
10 Crafting solutions: Building relationships * * * * * ACQUISITION CASE STUDY: MERIDIAN * * * * * Experienced SNF developers transforming from merchant builder to sustainable business model Dec. 2010: Introduced to Meridian as potential JV partner in SNF development program Mar. 2012: Sabra closes on $10 mm mezzanine loan with purchase option on Meridian portfolio 2010 2011 2012 2013 Aug. 2011: Meridian seeking refinancing on Onion Creek SNF Oct. 2011: Meridian seeks mezzanine loan on four properties Jun. 2012: Sabra completes $11 mm mortgage with purchase option on Onion Creek SNF Nov. 2012: Sabra closes on acquisition of four properties in Meridian portfolio 2013: Exploring development opportunities Mar. 2013: Sabra closes on $7.2 mm preferred equity investments for construction of 141 bed SNF and 52 unit memory care facility in Austin, TX
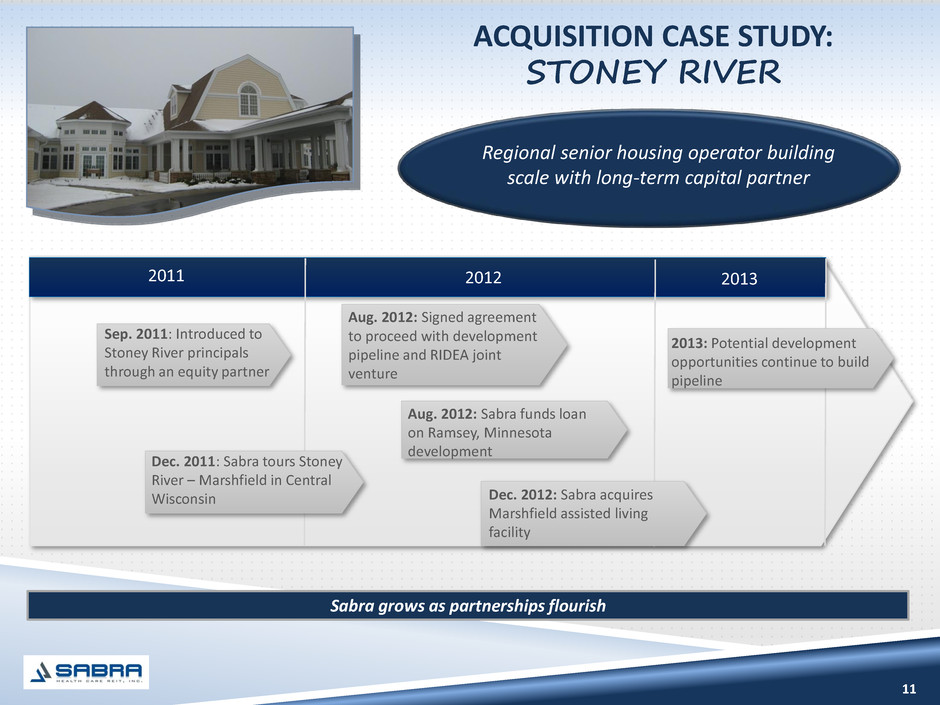
11 * Sabra grows as partnerships flourish * * * * ACQUISITION CASE STUDY: STONEY RIVER * * * * * * Sep. 2011: Introduced to Stoney River principals through an equity partner Dec. 2011: Sabra tours Stoney River – Marshfield in Central Wisconsin Aug. 2012: Signed agreement to proceed with development pipeline and RIDEA joint venture 2011 2012 2013 Aug. 2012: Sabra funds loan on Ramsey, Minnesota development Dec. 2012: Sabra acquires Marshfield assisted living facility 2013: Potential development opportunities continue to build pipeline Regional senior housing operator building scale with long-term capital partner
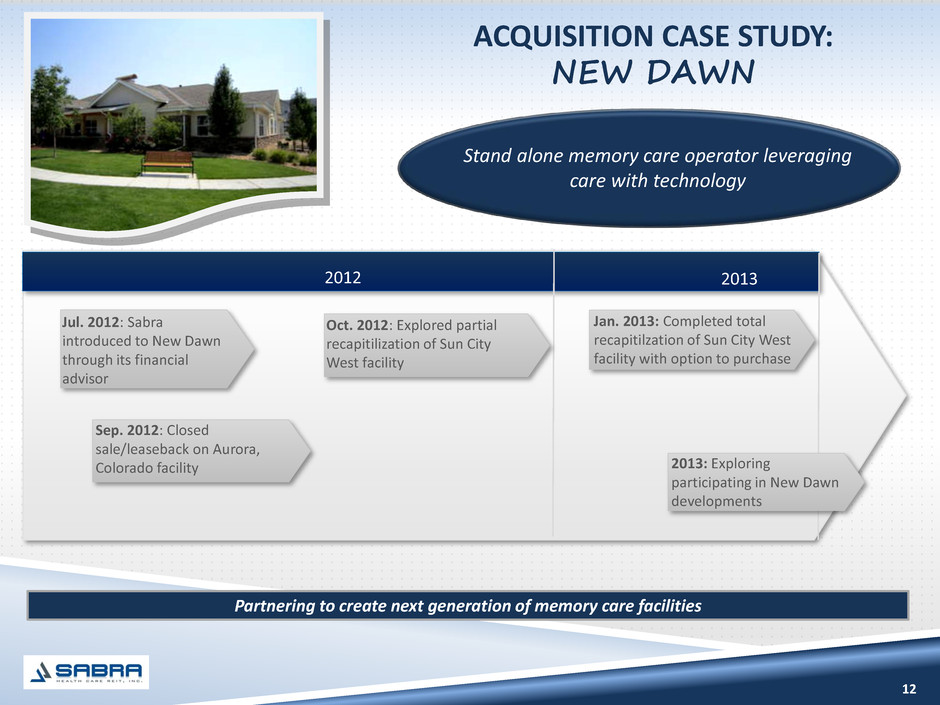
12 * Partnering to create next generation of memory care facilities * * * * ACQUISITION CASE STUDY: NEW DAWN * * * * * * Jul. 2012: Sabra introduced to New Dawn through its financial advisor Sep. 2012: Closed sale/leaseback on Aurora, Colorado facility Oct. 2012: Explored partial recapitilization of Sun City West facility 2012 2013 2013: Exploring participating in New Dawn developments Jan. 2013: Completed total recapitilzation of Sun City West facility with option to purchase Stand alone memory care operator leveraging care with technology
13 Financial Overview
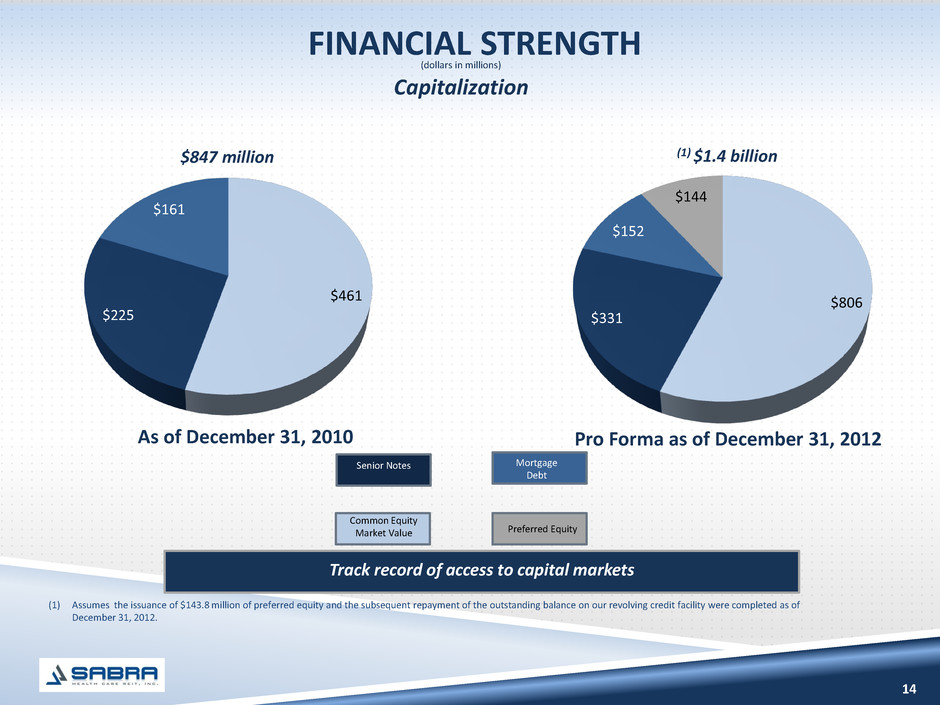
14 FINANCIAL STRENGTH (dollars in millions) $461 $225 $161 As of December 31, 2010 $806 $331 $152 $144 Pro Forma as of December 31, 2012 Common Equity Market Value Senior Notes Mortgage Debt Preferred Equity Capitalization $847 million (1) $1.4 billion Track record of access to capital markets (1) Assumes the issuance of $143.8 million of preferred equity and the subsequent repayment of the outstanding balance on our revolving credit facility were completed as of December 31, 2012.

FINANCIAL RESULTS 15 Normalized AFFO/share & FFO/share Normalized AFFO/share & dividend/share $0.36 $0.40 $0.38 $0.37 $0.38 $0.42 $0.39 $0.41 $0.41 $0.32 $0.32 $0.32 $0.33 $0.33 $0.33 $0.33 $0.33 $0.00 $0.10 $0.20 $0.30 $0.40 $0.50 Q1 2011 Q2 2011 Q3 2011 Q4 2011 Q1 2012 Q2 2012 Q3 2012 Q4 2012 PF Q4 2012 Normalized AFFO/share Dividend/share $0.36 $0.40 $0.38 $0.37 $0.38 $0.42 $0.39 $0.41 $0.41 $0.29 $0.33 $0.28 $0.39 $0.32 $0.36 $0.34 $0.38 $0.42 $0.00 $0.10 $0.20 $0.30 $0.40 $0.50 Q1 2011 Q2 2011 Q3 2011 Q4 2011 Q1 2012 Q2 2012 Q3 2012 Q4 2012 PF Q4 2012 Normalized AFFO/share FFO/share (1) Assumes that all 2012 investments, the refinance of six mortgage notes, pay off of one mortgage note, the amendment to the Sun lease agreements in connection with the acquisition of Sun by Genesis, the additional $100.0 million aggregate principal amount of senior notes issued, the origination of the New Dawn Sun City West mortgage loan, Bee Cave preferred equity investments and the issuance of $143.8 million of preferred equity were completed as of October 1, 2012. FFO on a pro forma basis is adjusted to exclude the impact of a $2.2 million consent fee received in the 4th quarter of 2012. (1) (1)

16 Historical overall occupancy(1) Historical SNF portfolio skilled mix(1) (2) STRONG PORTFOLIO PERFORMANCE (as of December 31, 2012) 41.8% 37.7% 39.9% 36.4% 20.0% 25.0% 30.0% 35.0% 40.0% 45.0% 50.0% Trailing 12 Months, Q4 2011 Trailing 12 Months, Q4 2012 Q4 2011 Q4 2012 88.5% 88.3% 88.4% 88.2% 85.0% 86.0% 87.0% 88.0% 89.0% 90.0% Trailing 12 Months, Q4 2011 Trailing 12 Months, Q4 2012 Q4 2011 Q4 2012 (1) Occupancy and skilled mix are presented for the trailing twelve months and the trailing three months (one month in arrears) and exclude the impact of strategic disposition candidates and facilities held for sale. Occupancy and skilled mix for facilities with new tenants/operators are only included in periods subsequent to our acquisition of the facilities. (2) Skilled mix is defined as the total Medicare and non-Medicaid managed care patient revenue divided by the total revenues at skilled nursing facilities for any given period.
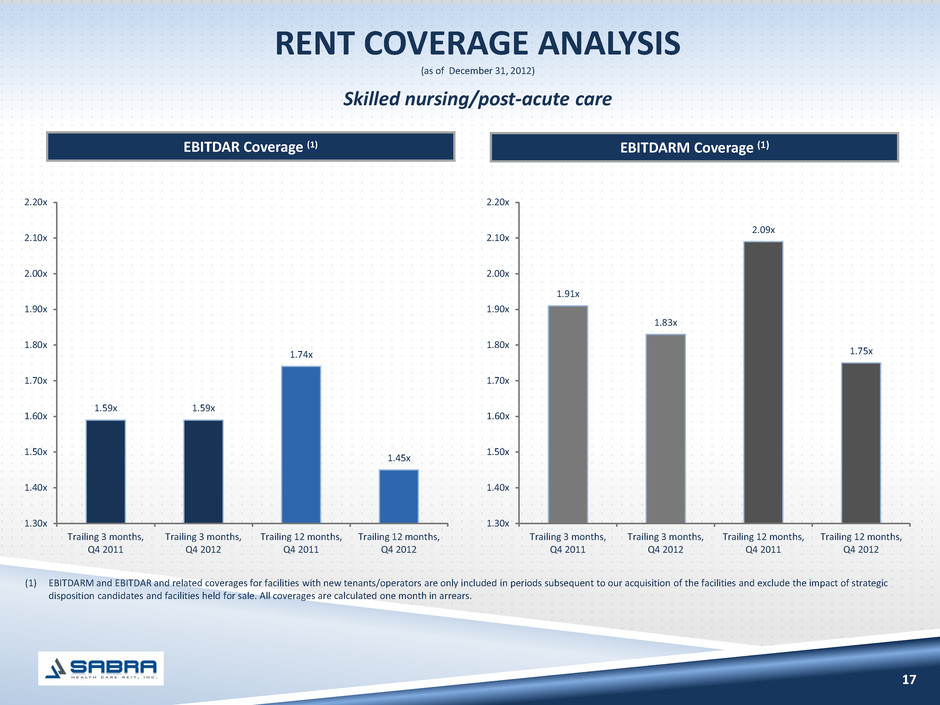
17 EBITDAR Coverage (1) EBITDARM Coverage (1) RENT COVERAGE ANALYSIS (as of December 31, 2012) 1.59x 1.59x 1.74x 1.45x 1.30x 1.40x 1.50x 1.60x 1.70x 1.80x 1.90x 2.00x 2.10x 2.20x Trailing 3 months, Q4 2011 Trailing 3 months, Q4 2012 Trailing 12 months, Q4 2011 Trailing 12 months, Q4 2012 (1) EBITDARM and EBITDAR and related coverages for facilities with new tenants/operators are only included in periods subsequent to our acquisition of the facilities and exclude the impact of strategic disposition candidates and facilities held for sale. All coverages are calculated one month in arrears. 1.91x 1.83x 2.09x 1.75x 1.30x 1.40x 1.50x 1.60x 1.70x 1.80x 1.90x 2.00x 2.10x 2.20x Trailing 3 months, Q4 2011 Trailing 3 months, Q4 2012 Trailing 12 months, Q4 2011 Trailing 12 months, Q4 2012 Skilled nursing/post-acute care
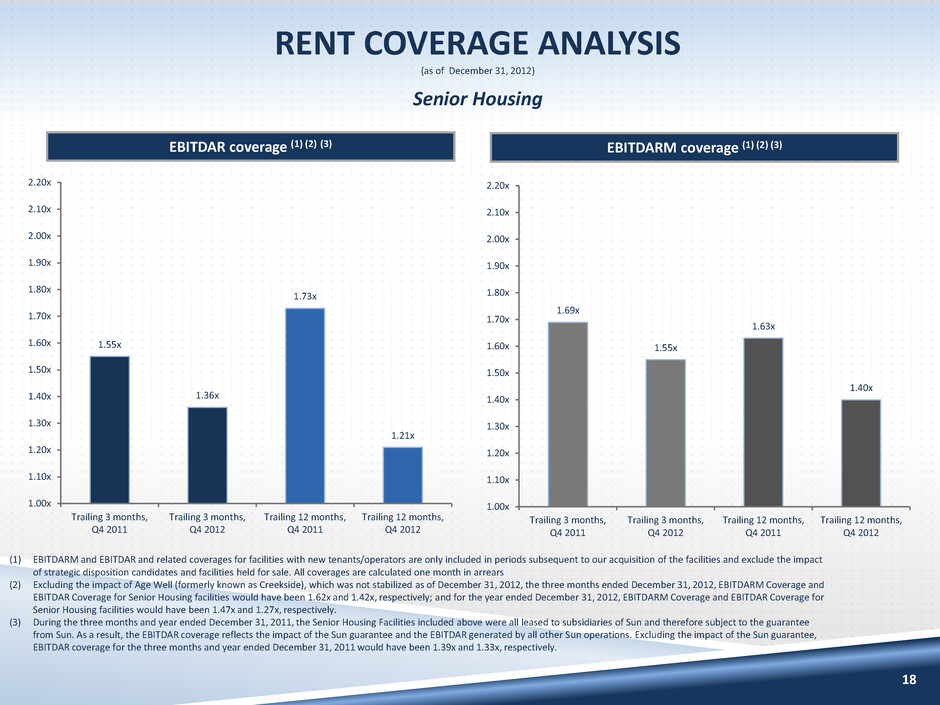
18 EBITDAR coverage (1) (2) (3) EBITDARM coverage (1) (2) (3) RENT COVERAGE ANALYSIS (as of December 31, 2012) 1.55x 1.36x 1.73x 1.21x 1.00x 1.10x 1.20x 1.30x 1.40x 1.50x 1.60x 1.70x 1.80x 1.90x 2.00x 2.10x 2.20x Trailing 3 months, Q4 2011 Trailing 3 months, Q4 2012 Trailing 12 months, Q4 2011 Trailing 12 months, Q4 2012 (1) EBITDARM and EBITDAR and related coverages for facilities with new tenants/operators are only included in periods subsequent to our acquisition of the facilities and exclude the impact of strategic disposition candidates and facilities held for sale. All coverages are calculated one month in arrears (2) Excluding the impact of Age Well (formerly known as Creekside), which was not stabilized as of December 31, 2012, the three months ended December 31, 2012, EBITDARM Coverage and EBITDAR Coverage for Senior Housing facilities would have been 1.62x and 1.42x, respectively; and for the year ended December 31, 2012, EBITDARM Coverage and EBITDAR Coverage for Senior Housing facilities would have been 1.47x and 1.27x, respectively. (3) During the three months and year ended December 31, 2011, the Senior Housing Facilities included above were all leased to subsidiaries of Sun and therefore subject to the guarantee from Sun. As a result, the EBITDAR coverage reflects the impact of the Sun guarantee and the EBITDAR generated by all other Sun operations. Excluding the impact of the Sun guarantee, EBITDAR coverage for the three months and year ended December 31, 2011 would have been 1.39x and 1.33x, respectively. 1.69x 1.55x 1.63x 1.40x 1.00x 1.10x 1.20x 1.30x 1.40x 1.50x 1.60x 1.70x 1.80x 1.90x 2.00x 2.10x 2.20x Trailing 3 months, Q4 2011 Trailing 3 months, Q4 2012 Trailing 12 months, Q4 2011 Trailing 12 months, Q4 2012 Senior Housing
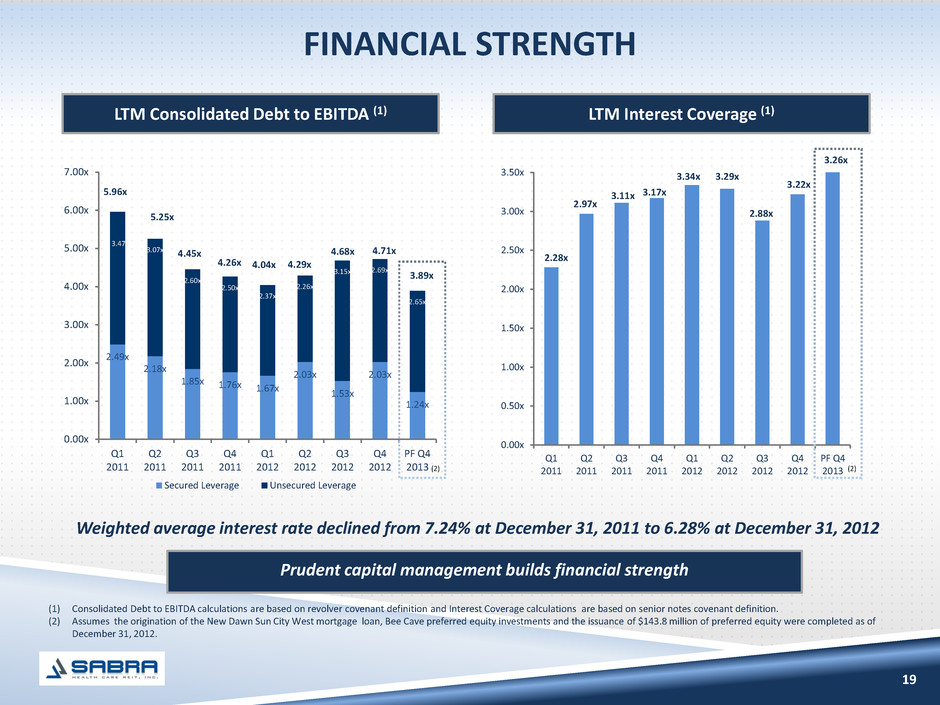
2.49x 2.18x 1.85x 1.76x 1.67x 2.03x 1.53x 2.03x 1.24x 3.47x 3.07x 2.60x 2.50x 2.37x 2.26x 3.15x 2.69x 2.65x 0.00x 1.00x 2.00x 3.00x 4.00x 5.00x 6.00x 7.00x Q1 2011 Q2 2011 Q3 2011 Q4 2011 Q1 2012 Q2 2012 Q3 2012 Q4 2012 PF Q4 2013 Secured Leverage Unsecured Leverage 4.04x FINANCIAL STRENGTH 19 LTM Consolidated Debt to EBITDA (1) LTM Interest Coverage (1) 2.28x 2.97x 3.11x 3.17x 3.34x 3.29x 2.88x 3.22x 0.00x 0.50x 1.00x 1.50x 2.00x 2.50x 3.00x 3.50x Q1 2011 Q2 2011 Q3 2011 Q4 2011 Q1 2012 Q2 2012 Q3 2012 Q4 2012 PF Q4 2013 3.26x (1) Consolidated Debt to EBITDA calculations are based on revolver covenant definition and Interest Coverage calculations are based on senior notes covenant definition. (2) Assumes the origination of the New Dawn Sun City West mortgage loan, Bee Cave preferred equity investments and the issuance of $143.8 million of preferred equity were completed as of December 31, 2012. 5.25x 5.96x 4.45x 4.26x 4.29x 4.68x 4.71x 3.89x Prudent capital management builds financial strength Weighted average interest rate declined from 7.24% at December 31, 2011 to 6.28% at December 31, 2012 (2) (2)
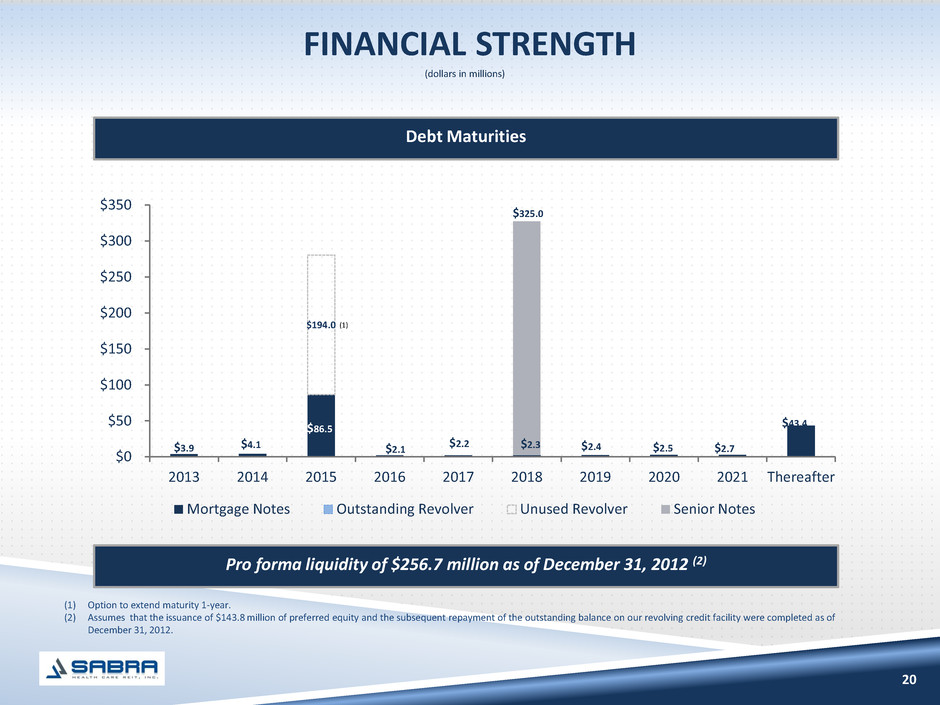
FINANCIAL STRENGTH 20 Debt Maturities (dollars in millions) $194.0 $0 $50 $100 $150 $200 $250 $300 $350 2013 2014 2015 2016 2017 2018 2019 2020 2021 Thereafter Mortgage Notes Outstanding Revolver Unused Revolver Senior Notes $325.0 $4.1 $2.3 $3.9 $2.1 $2.2 $2.4 $2.5 $2.7 $43.4 $86.5 Pro forma liquidity of $256.7 million as of December 31, 2012 (2) (1) Option to extend maturity 1-year. (2) Assumes that the issuance of $143.8 million of preferred equity and the subsequent repayment of the outstanding balance on our revolving credit facility were completed as of December 31, 2012. (1)
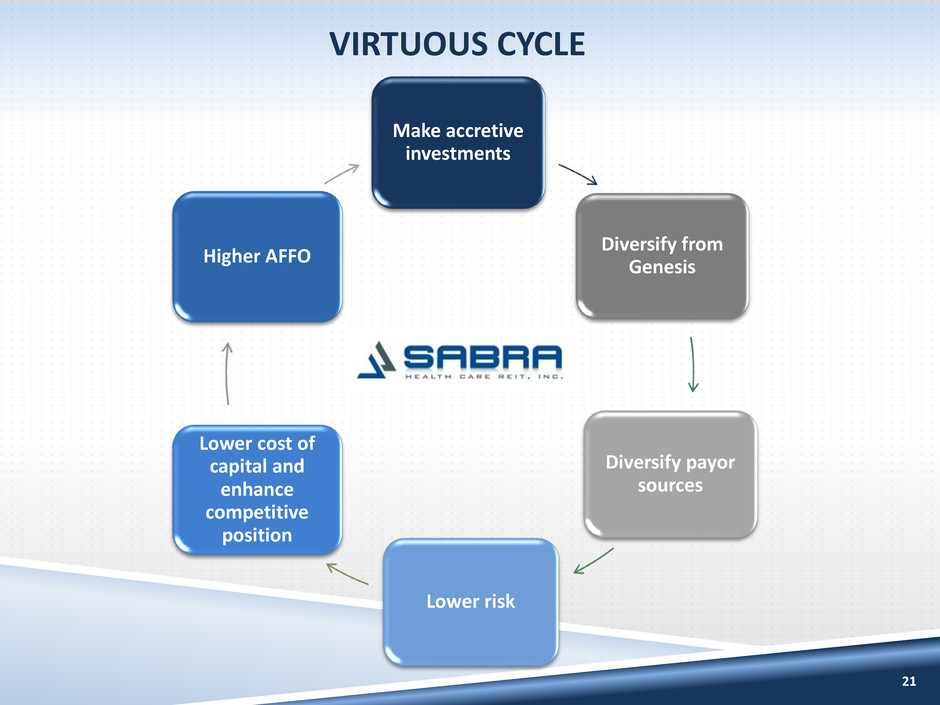
21 Make accretive investments Diversify from Genesis Diversify payor sources Lower risk Lower cost of capital and enhance competitive position Higher AFFO VIRTUOUS CYCLE
22 Appendix

DEBT COVENANTS (1) 23 (1) Based on defined terms in the senior notes indenture and amended credit agreement. (2) Assumes the origination of the New Dawn Sun City West mortgage loan, Bee Cave preferred equity investments and the issuance of $143.8 million of preferred equity were completed as of December 31, 2012. (As of December 31, 2012) Min Max Actual Pro forma (2) Incurrence: Total Debt/Asset Value 60% 48% 39% Secured Debt/Asset Value 40% 21% 12% Minimum Interest Coverage 2.00x 3.22x 3.26x Maintenance: Leverage Ratio 5.75x 4.71x 3.89x Fixed Charge Coverage Ratio 1.75x 2.92x 2.99x Tangible Net Worth (in millions) $342.0 $422.4 $560.5 Unencumbered Assets/Unsecured Debt 150% 183% 198%
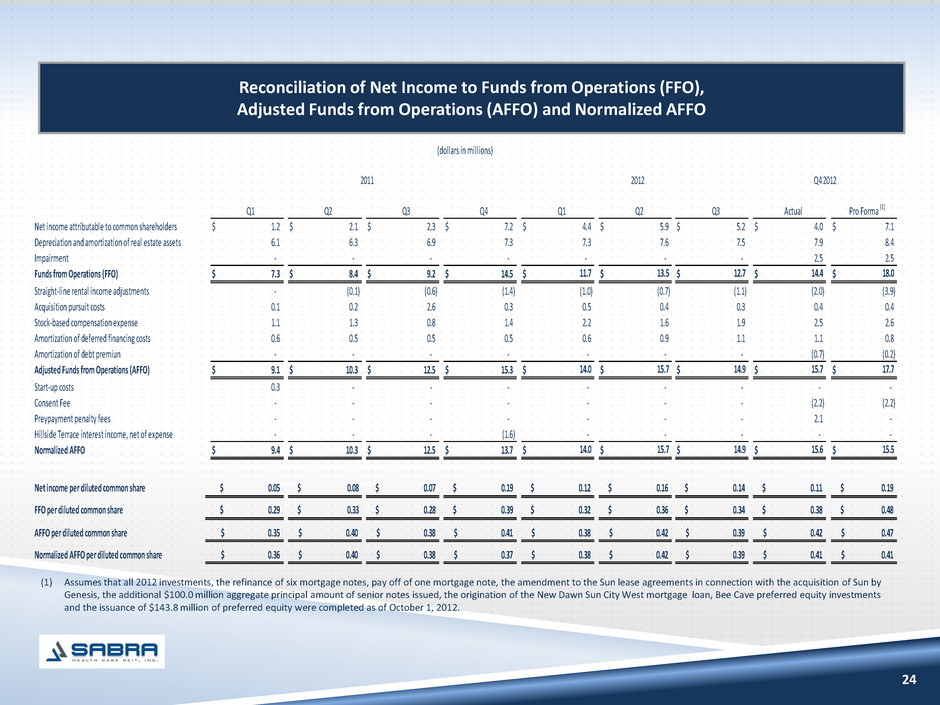
24 Reconciliation of Net Income to Funds from Operations (FFO), Adjusted Funds from Operations (AFFO) and Normalized AFFO (1) Assumes that all 2012 investments, the refinance of six mortgage notes, pay off of one mortgage note, the amendment to the Sun lease agreements in connection with the acquisition of Sun by Genesis, the additional $100.0 million aggregate principal amount of senior notes issued, the origination of the New Dawn Sun City West mortgage loan, Bee Cave preferred equity investments and the issuance of $143.8 million of preferred equity were completed as of October 1, 2012. Q1 Q2 Q3 Q4 Q1 Q2 Q3 Actual Pro Forma (1) Net income attributable to common shareholders $ 1.2 $ 2.1 $ 2.3 $ 7.2 $ 4.4 $ 5.9 $ 5.2 $ 4.0 $ 7.1 Depreciation and amortization of real estate assets 6.1 6.3 6.9 7.3 7.3 7.6 7.5 7.9 8.4 Impairment - - - - - - - 2.5 2.5 Funds from Operations (FFO) $ 7.3 $ 8.4 $ 9.2 $ 14.5 $ 11.7 $ 13.5 $ 12.7 $ 14.4 $ 18.0 Straight-line rental income adjustments - (0.1) (0.6) (1.4) (1.0) (0.7) (1.1) (2.0) (3.9) Acquisition pursuit costs 0.1 0.2 2.6 0.3 0.5 0.4 0.3 0.4 0.4 Stock-based compensation expense 1.1 1.3 0.8 1.4 2.2 1.6 1.9 2.5 2.6 Amortization of deferred financing costs 0.6 0.5 0.5 0.5 0.6 0.9 1.1 1.1 0.8 Amortization of debt premiun - - - - - - - (0.7) (0.2) Adjusted Funds from Operations (AFFO) $ 9.1 $ 10.3 $ 12.5 $ 15.3 $ 14.0 $ 15.7 $ 14.9 $ 15.7 $ 17.7 Start-up costs 0.3 - - - - - - - - Consent Fee - - - - - - - (2.2) (2.2) Preypayment penalty fees - - - - - - - 2.1 - Hillside Terrace interest income, net of expense - - - (1.6) - - - - - Normalized AFFO $ 9.4 $ 10.3 $ 12.5 $ 13.7 $ 14.0 $ 15.7 $ 14.9 $ 15.6 $ 15.5 Net income per diluted common share $ 0.05 $ 0.08 $ 0.07 $ 0.19 $ 0.12 $ 0.16 $ 0.14 $ 0.11 $ 0.19 FFO per diluted common share $ 0.29 $ 0.33 $ 0.28 $ 0.39 $ 0.32 $ 0.36 $ 0.34 $ 0.38 $ 0.48 AFFO per diluted common share 0.35$ 0.40$ 0.38$ 0.41$ 0.38$ 0.42$ 0.39$ 0.42$ 0.47$ Normalized AFFO per diluted common share 0.36$ 0.40$ 0.38$ 0.37$ 0.38$ 0.42$ 0.39$ 0.41$ 0.41$ (dollars in millions) 2011 Q4 20122012
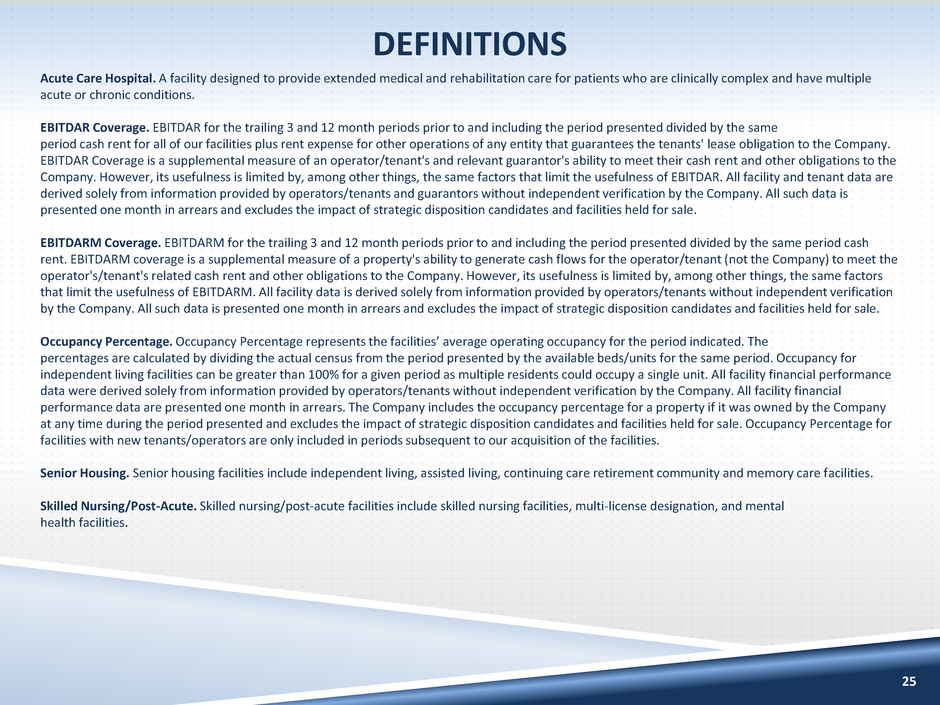
DEFINITIONS 25 Acute Care Hospital. A facility designed to provide extended medical and rehabilitation care for patients who are clinically complex and have multiple acute or chronic conditions. EBITDAR Coverage. EBITDAR for the trailing 3 and 12 month periods prior to and including the period presented divided by the same period cash rent for all of our facilities plus rent expense for other operations of any entity that guarantees the tenants' lease obligation to the Company. EBITDAR Coverage is a supplemental measure of an operator/tenant's and relevant guarantor's ability to meet their cash rent and other obligations to the Company. However, its usefulness is limited by, among other things, the same factors that limit the usefulness of EBITDAR. All facility and tenant data are derived solely from information provided by operators/tenants and guarantors without independent verification by the Company. All such data is presented one month in arrears and excludes the impact of strategic disposition candidates and facilities held for sale. EBITDARM Coverage. EBITDARM for the trailing 3 and 12 month periods prior to and including the period presented divided by the same period cash rent. EBITDARM coverage is a supplemental measure of a property's ability to generate cash flows for the operator/tenant (not the Company) to meet the operator's/tenant's related cash rent and other obligations to the Company. However, its usefulness is limited by, among other things, the same factors that limit the usefulness of EBITDARM. All facility data is derived solely from information provided by operators/tenants without independent verification by the Company. All such data is presented one month in arrears and excludes the impact of strategic disposition candidates and facilities held for sale. Occupancy Percentage. Occupancy Percentage represents the facilities’ average operating occupancy for the period indicated. The percentages are calculated by dividing the actual census from the period presented by the available beds/units for the same period. Occupancy for independent living facilities can be greater than 100% for a given period as multiple residents could occupy a single unit. All facility financial performance data were derived solely from information provided by operators/tenants without independent verification by the Company. All facility financial performance data are presented one month in arrears. The Company includes the occupancy percentage for a property if it was owned by the Company at any time during the period presented and excludes the impact of strategic disposition candidates and facilities held for sale. Occupancy Percentage for facilities with new tenants/operators are only included in periods subsequent to our acquisition of the facilities. Senior Housing. Senior housing facilities include independent living, assisted living, continuing care retirement community and memory care facilities. Skilled Nursing/Post-Acute. Skilled nursing/post-acute facilities include skilled nursing facilities, multi-license designation, and mental health facilities.


