Exhibit 99.2
Supplemental Information
December 31, 2013
(Unaudited)
Disclaimer
Certain statements in this supplement contain “forward-looking” information as that term is defined by the Private Securities Litigation Reform Act of 1995. Any statements that do not relate to historical or current facts or matters are forward-looking statements. Examples of forward-looking statements include all statements regarding our expected future financial position, results of operations, cash flows, liquidity, business strategy, growth opportunities, potential acquisitions, and plans and objectives for future operations. You can identify some of the forward-looking statements by the use of forward-looking words such as “anticipate,” “believe,” “plan,” “estimate,” “expect,” “intend,” “should,” “may” and other similar expressions, although not all forward-looking statements contain these identifying words.
Our actual results may differ materially from those projected or contemplated by our forward-looking statements as a result of various factors, including the following: our dependence on Genesis HealthCare LLC (“Genesis”), the parent company of Sun Healthcare Group, Inc. ("Sun"), until we are able to further diversify our portfolio; our dependence on the operating success of our tenants; changes in general economic conditions and volatility in financial and credit markets; the dependence of our tenants on reimbursement from governmental and other third-party payors; the significant amount of and our ability to service our indebtedness; covenants in our debt agreements that may restrict our ability to make acquisitions, incur additional indebtedness and refinance indebtedness on favorable terms; increases in market interest rates; our ability to raise capital through equity financings; the relatively illiquid nature of real estate investments; competitive conditions in our industry; the loss of key management personnel or other employees; the impact of litigation and rising insurance costs on the business of our tenants; uninsured or underinsured losses affecting our properties and the possibility of environmental compliance costs and liabilities; our ability to maintain our status as a REIT; compliance with REIT requirements and certain tax matters related to our status as a REIT; and other factors discussed from time to time in our news releases, public statements and/or filings with the Securities and Exchange Commission (the “SEC”), especially the “Risk Factors” sections of our Annual and Quarterly Reports on Forms 10-K and 10-Q. We do not intend, and we undertake no obligation, to update any forward-looking information to reflect events or circumstances after the date of this supplement or to reflect the occurrence of unanticipated events, unless required by law to do so.
Note Regarding Non-GAAP Financial Measures
This supplement includes the following financial measures defined as non-GAAP financial measures by the SEC: EBITDA, Adjusted EBITDA, funds from operations (“FFO”), Normalized FFO, Adjusted FFO (“AFFO”), Normalized AFFO, FFO per diluted common share, Normalized FFO per diluted common share, AFFO per diluted common share and Normalized AFFO per diluted common share. These measures may be different than non-GAAP financial measures used by other companies, and the presentation of these measures is not intended to be considered in isolation or as a substitute for financial information prepared and presented in accordance with U.S. generally accepted accounting principles. An explanation of these non-GAAP financial measures is included under “Reporting Definitions” in this supplement and reconciliations of these non-GAAP financial measures to the GAAP financial measures we consider most comparable are included under “Reconciliations of EBITDA, Adjusted EBITDA, Funds from Operations (FFO), Normalized FFO, Adjusted Funds from Operations (AFFO) and Normalized AFFO” in this supplement.
Tenant Information
This supplement includes information regarding each of our tenants that lease properties from us. The information related to these tenants that is provided in this supplement has been provided by the tenants. We have not independently verified this information. We have no reason to believe that such information is inaccurate in any material respect. We are providing this data for informational purposes only.
Table of Contents
|
| |
| |
| | |
| |
| | |
| |
| | |
| |
| | |
| |
| | |
| |
| | |
| |
| | |
| Reconciliations of EBITDA, Adjusted EBITDA, Funds From Operations (FFO), | |
| | |
| |
| | |
| |
| | |
| |
| | |
| |
| | |
| |
| | |
| |
| | |
| |
| | |
| |
| | |
| Portfolio Geographic Concentrations | |
| | |
| |
| | |
| |
| | |
| |
| | |
| |
| | |
| |
| | |
| |
| | |
| |
| | |
| Recent Investment Activity | |
| | |
| |
| | |
| |
| | |
| |
Company Information
Board of Directors
|
| | |
| | | |
Richard K. Matros Chairman of the Board, President and Chief Executive Officer Sabra Health Care REIT, Inc. | | Michael J. Foster Managing Director RFE Management Corp. |
| | |
Milton J. Walters President Tri-River Capital | | Robert A. Ettl Chief Operating Officer Harvard Management Company |
| | |
Craig A. Barbarosh Partner Katten Muchin Rosenman LLP | | |
Senior Management
|
| | |
| | | |
Richard K. Matros Chairman of the Board, President and Chief Executive Officer | | Harold W. Andrews, Jr. Executive Vice President, Chief Financial Officer and Secretary |
| | |
Talya Nevo-Hacohen Executive Vice President, Chief Investment Officer and Treasurer | | |
Other Information
|
| | |
| | | |
Corporate Headquarters 18500 Von Karman Avenue, Suite 550 Irvine, CA 92612 | | Transfer Agent American Stock Transfer and Trust Company 6201 15th Avenue Brooklyn, NY 11219 |
www.sabrahealth.com
The information in this supplemental information package should be read in conjunction with the Company’s Annual Report on Form 10-K, Quarterly Reports on Form 10-Q, Current Reports on Form 8-K and other information filed with the SEC. The Reporting Definitions and Reconciliations of Non-GAAP Measures are an integral part of the information presented herein.
On Sabra's website, www.sabrahealth.com, you can access, free of charge, Sabra’s Annual Report on Form 10-K, Quarterly Reports on Form 10-Q, Current Reports on Form 8-K, and amendments to those reports filed or furnished pursuant to Sections 13(a) or 15(d) of the Securities Exchange Act of 1934, as amended, as soon as reasonably practicable after such material is filed with, or furnished to, the SEC. The information contained on Sabra’s website is not incorporated by reference into, and should not be considered a part of, this supplemental information package. All material filed with the SEC can also be accessed through their website, www.sec.gov.
For more information, contact Harold W. Andrews, Jr., Executive Vice President, Chief Financial Officer and Secretary at
(949) 679-0243.
SABRA HEALTH CARE REIT, INC.
COMPANY FACT SHEET
Company Profile
Sabra Health Care REIT, Inc., a Maryland corporation (“Sabra,” the “Company” or “we”), operates as a self-administered, self-managed real estate investment trust (“REIT”) that, through its subsidiaries, owns and invests in real estate serving the healthcare industry. Sabra primarily generates revenues by leasing properties to tenants and operators throughout the United States.
As of December 31, 2013, Sabra's investment portfolio consisted of 121 real estate properties held for investment and leased to operators/tenants under triple-net lease agreements (consisting of (i) 96 skilled nursing/post-acute facilities, (ii) 23 senior housing facilities, and (iii) two acute care hospitals), 10 debt investments (consisting of (i) four mortgage loans, (ii) three construction loans, (iii) one mezzanine loan, and (iv) two pre-development loans) and two preferred equity investments. As of December 31, 2013, Sabra's real estate properties were located in 27 states and included 12,468 licensed beds.
Objectives and Strategies
Sabra expects to continue to grow its portfolio primarily through the acquisition of senior housing and memory care facilities with a secondary focus on acquiring skilled nursing facilities. We have and will continue to opportunistically acquire other types of healthcare real estate (including acute care hospitals) and originate financing secured directly or indirectly by healthcare facilities. As Sabra acquires additional properties and expands its portfolio, Sabra expects to further diversify by tenant, asset class and geography within the healthcare sector. Sabra employs a disciplined, opportunistic approach in its healthcare real estate investment strategy by investing in assets that provide attractive opportunities for dividend growth and appreciation of asset values, while maintaining balance sheet strength and liquidity, thereby creating long-term stockholder value.
|
| | | | |
| Market Facts | Portfolio Information (as of December 31, 2013) |
| Stock Information (as of December 31, 2013) | | Investments | |
| Closing Price (common stock): | $26.14 | Equity Investments | |
| 52-Week range (common stock): | $21.55 - $32.40 | Skilled Nursing/Post-Acute | 96 |
|
| Market Capitalization: | $1.0 billion | Senior Housing | 23 |
|
| Enterprise Value: | $1.8 billion | Acute Care Hospitals | 2 |
|
| Outstanding Shares (common stock): | 38.8 million | | 121 |
|
| Ticker symbols: | | Debt Investments (1) | 10 |
|
| Common Stock | SBRA | Preferred Equity Investments (2) | 2 |
|
| Preferred Stock | SBRAP | Total Investments | 133 |
|
| Stock Exchange: | NASDAQ | | |
| Credit Ratings | | Bed/Unit Count | |
| Moody's: (as of January 8, 2014) | | Skilled Nursing/Post-Acute | 10,826 |
|
| Senior Notes Rating | Ba3 (stable) | Senior Housing | 1,518 |
|
| Preferred Equity Rating | B2 | Acute Care Hospitals | 124 |
|
| S&P: | | Total Beds/Units | 12,468 |
|
| Corporate Rating | B+ (stable) | | |
| Senior Notes Rating | BB- | Total Number of States | 27 |
|
| Preferred Equity Rating | CCC+ | | |
(1) As of December 31, 2013, our Debt Investments related to investments secured directly or indirectly by 13 skilled nursing facilities with 1,814 beds/units, four memory care developments with 168 beds/units, one multi-license facility development with 85 beds/units, one acute care hospital with 84 beds, and one acute care hospital development with 54 beds.
(2) As of December 31, 2013, our Preferred Equity Investments related to investments in entities owning a skilled nursing facility and an assisted living facility with a total of 193 beds/units.
|
| | |
| See reporting definitions. | 2 |
SABRA HEALTH CARE REIT, INC.
FINANCIAL HIGHLIGHTS
(dollars in thousands, except per share amounts) |
| | | | | | | | | | | | | | | |
| | Three Months Ended December 31, | | Year Ended December 31, |
| | 2013 | | 2012 | | 2013 | | 2012 |
| Revenues | $ | 37,557 |
| | $ | 28,288 |
| | $ | 134,780 |
| | $ | 103,170 |
|
| EBITDA | $ | 32,130 |
| | $ | 21,520 |
| | $ | 107,456 |
| | $ | 84,111 |
|
| Adjusted EBITDA | $ | 32,330 |
| | $ | 23,487 |
| | $ | 118,357 |
| | $ | 86,781 |
|
| Net income attributable to common stockholders | $ | 10,439 |
| | $ | 3,959 |
| | $ | 25,749 |
| | $ | 19,513 |
|
| FFO | $ | 18,994 |
| | $ | 14,347 |
| | $ | 59,030 |
| | $ | 52,257 |
|
| Normalized FFO | $ | 18,994 |
| | $ | 16,314 |
| | $ | 69,901 |
| | $ | 54,927 |
|
| AFFO | $ | 19,478 |
| | $ | 15,759 |
| | $ | 57,942 |
| | $ | 60,287 |
|
| Normalized AFFO | $ | 19,478 |
| | $ | 15,606 |
| | $ | 67,954 |
| | $ | 60,134 |
|
| Per share data: | | | | | | | |
| Diluted EPS | $ | 0.27 |
| | $ | 0.11 |
| | $ | 0.68 |
| | $ | 0.52 |
|
| Diluted FFO | $ | 0.49 |
| | $ | 0.38 |
| | $ | 1.55 |
| | $ | 1.40 |
|
| Diluted Normalized FFO | $ | 0.49 |
| | $ | 0.43 |
| | $ | 1.84 |
| | $ | 1.47 |
|
| Diluted AFFO | $ | 0.50 |
| | $ | 0.42 |
| | $ | 1.51 |
| | $ | 1.59 |
|
| Diluted Normalized AFFO | $ | 0.50 |
| | $ | 0.41 |
| | $ | 1.77 |
| | $ | 1.59 |
|
| Weighted-average number of common shares outstanding, diluted: | | | | | | | |
| EPS, FFO & Normalized FFO | 38,680,409 |
| | 37,594,583 |
| | 38,071,926 |
| | 37,321,517 |
|
| AFFO & Normalized AFFO | 38,882,963 |
| | 37,917,964 |
| | 38,364,727 |
| | 37,829,421 |
|
| | | | | | | | |
| Net cash flow from operations | $ | 12,888 |
| | $ | 8,350 |
| | $ | 62,099 |
| | $ | 56,252 |
|
| | December 31, 2013 | | December 31, 2012 | | | | |
| Real Estate Portfolio | | | | | | | |
| Total Equity Investments (#) | 121 |
| | 119 |
| | | | |
| Total Equity Investments, gross ($) | $ | 1,066,242 |
| | $ | 956,360 |
| | | | |
| Total Licensed Beds/Units | 12,468 |
| | 12,382 |
| | | | |
| Weighted Average Remaining Lease Term (in months) | 131 |
| | 132 |
| | | | |
| Total Preferred Equity Investments (#) | 2 |
| | — |
| | | | |
| Total Preferred Equity Investments, gross ($) | $ | 7,784 |
| | $ | — |
| | | | |
| Total Debt Investments (#) | 10 |
| | 2 |
| | | | |
Total Debt Investments, gross ($) (1) | $ | 177,592 |
| | $ | 12,022 |
| | | | |
| | Three Months Ended December 31, 2013 | | Twelve Months Ended December 31, 2013 | | | | |
EBITDARM Coverage (2) | 1.73x |
| | 1.80x |
| | | | |
EBITDAR Coverage (2) | 1.33x |
| | 1.40x |
| | | | |
| | | | | | Pro Forma (3) | | |
| | December 31, 2013 | | December 31, 2012 | | December 31, 2013 | | |
| Debt | | | | | | | |
| Book Value | | | | | | | |
| Fixed Rate Debt | $ | 469,090 |
| | $ | 425,039 |
| | $ | 650,792 |
| | |
| Variable Rate Debt | 222,140 |
| | 150,449 |
| | 161,011 |
| | |
| Total Debt | $ | 691,230 |
| | $ | 575,488 |
| | $ | 811,803 |
| | |
| Weighted Average Effective Rate | | | | | | | |
| Fixed Rate Debt | 6.14 | % | | 7.01 | % | | 5.17 | % | | |
| Variable Rate Debt | 3.88 | % | | 4.21 | % | | 3.51 | % | | |
| Total Debt | 5.41 | % | | 6.28 | % | | 4.85 | % | | |
| % of Total | | | | | | | |
| Fixed Rate Debt | 67.9 | % | | 73.9 | % | | 80.2 | % | | |
| Variable Rate Debt | 32.1 | % | | 26.1 | % | | 19.8 | % | | |
| Total Debt | 100.0 | % | | 100.0 | % | | 100.0 | % | | |
| | | | | | | | |
| Availability Under Revolving Credit Facility: | $ | 135,126 |
| | $ | 109,130 |
| | $ | 139,591 |
| | |
| Available Liquidity (Unrestricted Cash and Availability Under Revolving Credit Facility) | $ | 139,434 |
| | $ | 126,231 |
| | $ | 143,899 |
| | |
(1) Total Debt Investments, gross consists of principal of $176.6 million plus capitalized origination fees of $1.0 million.
(2) EBITDARM and EBITDAR and related coverages for facilities with new tenants/operators are only included in periods subsequent to our acquisition of the facilities and exclude the impact of strategic disposition candidates and facilities held for sale. All facility financial performance data are presented one quarter in arrears.
(3)Assumes the offering of $350.0 million aggregate principal amount of 5.5% Senior Notes due 2021; the use of proceeds therefrom to purchase all outstanding 8.125% Senior Notes due 2018, acquire the Nye Portfolio and repay a portion of the outstanding borrowings under the revolving credit facility as of December 31, 2013; the refinancing of $44.8 million of mortgage notes maturing in 2015; and the repayment of a $12.0 million mortgage note were completed as of December 31, 2013.
|
| | |
| See reporting definitions. | 3 |
SABRA HEALTH CARE REIT, INC.
2014 OUTLOOK
|
| | | | | | | |
| | | Low | High |
| Net income | | $ | 0.62 |
| $ | 0.66 |
|
| Add: | | | |
| Depreciation and amortization of real estate assets | | 1.02 |
| 1.02 |
|
| | | | |
| Funds from Operations (FFO) | | $ | 1.64 |
| $ | 1.68 |
|
| | | | |
| Normalizing items | | 0.55 |
| 0.55 |
|
| | | | |
| Normalized FFO | | $ | 2.19 |
| $ | 2.23 |
|
| | | | |
| FFO | | 1.64 |
| 1.68 |
|
| Straight-line rental income adjustments | | (0.36 | ) | (0.36 | ) |
| Stock-based compensation | | 0.16 |
| 0.16 |
|
| Amortization of deferred financing costs | | 0.10 |
| 0.10 |
|
| Acquisition pursuit costs | | 0.02 |
| 0.02 |
|
| Non-cash loss on extinguishment of debt | | 0.02 |
| 0.02 |
|
| | | | |
| Adjusted Funds from Operations (AFFO) | | $ | 1.58 |
| $ | 1.62 |
|
| | | | |
Normalizing items (1) | | 0.54 |
| 0.54 |
|
| | | | |
| Normalized AFFO | | $ | 2.12 |
| $ | 2.16 |
|
The Company’s guidance excludes the impact of investments that may be made during 2014. The Company expects to make investments in 2014 totaling between $350.0 million and $400.0 million, which includes approximately $106.0 million of identified Forest Park Medical Center acute care hospital investments. The Company has identified and expects to close $170.0 million of investments during the first half of 2014 (inclusive of the acquisition of the Nye Portfolio). The Company expects to make between $180.0 million and $230.0 million of investments principally during the latter part of the second half of 2014. The expected investment amounts for 2014 are comprised of approximately 50% senior housing and memory care, 30% acute care hospitals (with Forest Park Medical Center) and 20% skilled nursing/post acute. Investments in 2014 are expected to be funded with existing cash, borrowings available under the revolving credit facility or the proceeds from additional issuances of common stock (through the At-the-Market common stock offering program or through other equity issuances), debt or other securities.
Except as otherwise noted above, the foregoing projections reflect management's view of current and future market conditions. There can be no assurance that the Company's actual results will not differ materially from the estimates set forth above. Except as otherwise required by law, the Company assumes no, and hereby disclaims any, obligation to update any of the foregoing projections as a result of new information or new or future developments.
(1) Normalizing items consist of prepayment penalties, write-off of related deferred financing costs and issuance premiums associated with the purchase of $211.5 million of our 8.125% Senior Notes due 2018 and our completed and anticipated refinancings of secured mortgage debt.
|
| | |
| See reporting definitions. | 4 |
SABRA HEALTH CARE REIT, INC.
CONSOLIDATED STATEMENTS OF INCOME
(dollars in thousands, except per share amounts)
|
| | | | | | | | | | | | | | | |
| | Three Months Ended December 31, | | Year Ended December 31, |
| | 2013 | | 2012 | | 2013 | | 2012 |
| Revenues: | | | | | | | |
| Rental income | $ | 34,296 |
| | $ | 27,838 |
| | $ | 128,988 |
| | $ | 101,742 |
|
| Interest and other income | 3,261 |
| | 450 |
| | 5,792 |
| | 1,428 |
|
| | | | | | | | |
| Total revenues | 37,557 |
| | 28,288 |
| | 134,780 |
| | 103,170 |
|
| | | | | | | | |
| | | | | | | | |
| Expenses: | | | | | | | |
| Depreciation and amortization | 8,555 |
| | 7,907 |
| | 33,281 |
| | 30,263 |
|
| Interest | 10,576 |
| | 9,654 |
| | 40,460 |
| | 34,335 |
|
| General and administrative | 5,227 |
| | 4,516 |
| | 16,423 |
| | 16,104 |
|
| Impairment | — |
| | 2,481 |
| | — |
| | 2,481 |
|
| | | | | | | | |
| Total expenses | 24,358 |
| | 24,558 |
| | 90,164 |
| | 83,183 |
|
| | | | | | | | |
| Other income (expense): | | | | | | | |
| Loss on extinguishment of debt | — |
| | (1,967 | ) | | (10,101 | ) | | (2,670 | ) |
| Other (expense) income | (200 | ) | | 2,196 |
| | (800 | ) | | 2,196 |
|
| | | | | | | | |
| Total other income (expense) | (200 | ) | | 229 |
| | (10,901 | ) | | (474 | ) |
| | | | | | | | |
| Net income | 12,999 |
| | 3,959 |
| | 33,715 |
| | 19,513 |
|
| | | | | | | | |
| Preferred stock dividends | (2,560 | ) | | — |
| | (7,966 | ) | | — |
|
| | | | | | | | |
| Net income attributable to common stockholders | $ | 10,439 |
| | $ | 3,959 |
| | $ | 25,749 |
| | $ | 19,513 |
|
| | | | | | | | |
| | | | | | | | |
| Net income attributable to common stockholders, per: | | | | | | | |
| | | | | | | | |
| Basic common share | $ | 0.27 |
| | $ | 0.11 |
| | $ | 0.69 |
| | $ | 0.53 |
|
| | | | | | | | |
| Diluted common share | $ | 0.27 |
| | $ | 0.11 |
| | $ | 0.68 |
| | $ | 0.52 |
|
| | | | | | | | |
| Weighted-average number of common shares outstanding, basic | 38,050,301 |
| | 37,106,473 |
| | 37,514,637 |
| | 37,061,111 |
|
| | | | | | | | |
| Weighted-average number of common shares outstanding, diluted | 38,680,409 |
| | 37,594,583 |
| | 38,071,926 |
| | 37,321,517 |
|
| | | | | | | | |
|
| | |
| See reporting definitions. | 5 |
SABRA HEALTH CARE REIT, INC.
CONSOLIDATED BALANCE SHEETS
(dollars in thousands, except per share amounts)
|
| | | | | | | |
| | December 31, |
| | 2013 | | 2012 |
| | | | |
| Assets | | | |
| Real estate investments, net of accumulated depreciation of $151,078 and $129,479 as of December 31, 2013 and 2012, respectively | $ | 915,418 |
| | $ | 827,135 |
|
| Loans receivable and other investments, net | 185,293 |
| | 12,017 |
|
| Cash and cash equivalents | 4,308 |
| | 17,101 |
|
| Restricted cash | 5,352 |
| | 4,589 |
|
| Deferred tax assets | 24,212 |
| | 24,212 |
|
| Assets held for sale, net | — |
| | 2,215 |
|
| Prepaid expenses, deferred financing costs and other assets | 63,252 |
| | 29,613 |
|
| Total assets | $ | 1,197,835 |
| | $ | 916,882 |
|
| Liabilities and stockholders’ equity | | | |
| Mortgage notes | $ | 141,328 |
| | $ | 152,322 |
|
| Secured revolving credit facility | 135,500 |
| | 92,500 |
|
| Senior unsecured notes | 414,402 |
| | 330,666 |
|
| Accounts payable and accrued liabilities | 22,229 |
| | 11,694 |
|
| Tax liability | 24,212 |
| | 24,212 |
|
| Total liabilities | 737,671 |
| | 611,394 |
|
| Stockholders’ equity | | | |
| Preferred stock, $.01 par value; 10,000,000 shares authorized, 5,750,000 and zero shares issued and outstanding as of December 31, 2013 and 2012, respectively | 58 |
| | — |
|
| Common stock, $.01 par value; 125,000,000 shares authorized, 38,788,745 and 37,099,209 shares issued and outstanding as of December 31, 2013 and 2012, respectively | 388 |
| | 371 |
|
| Additional paid-in capital | 534,639 |
| | 353,861 |
|
| Cumulative distributions in excess of net income | (74,921 | ) | | (48,744 | ) |
| Total stockholders’ equity | 460,164 |
| | 305,488 |
|
| Total liabilities and stockholders’ equity | $ | 1,197,835 |
| | $ | 916,882 |
|
|
| | |
| See reporting definitions. | 6 |
SABRA HEALTH CARE REIT, INC.
CONSOLIDATED STATEMENTS OF CASH FLOWS
(in thousands)
|
| | | | | | | |
| | Year Ended December 31, |
| | 2013 | | 2012 |
| Cash flows from operating activities: | | |
|
| Net income | $ | 33,715 |
| | $ | 19,513 |
|
| Adjustments to reconcile net income to net cash provided by operating activities: | | |
|
| Depreciation and amortization | 33,281 |
| | 30,263 |
|
| Non-cash interest income adjustments | 79 |
| | 24 |
|
| Amortization of deferred financing costs | 3,280 |
| | 2,685 |
|
| Stock-based compensation expense | 7,819 |
| | 8,279 |
|
| Amortization of premium | (671 | ) | | (347 | ) |
| Non-cash loss on extinguishment of debt | 859 |
| | 628 |
|
| Straight-line rental income adjustments | (14,709 | ) | | (4,893 | ) |
| Impairment charge | — |
| | 2,481 |
|
| Change in fair value of contingent consideration | 200 |
| | — |
|
| Changes in operating assets and liabilities: | | |
|
|
| Prepaid expenses and other assets | (3,459 | ) | | (82 | ) |
| Accounts payable and accrued liabilities | 5,430 |
| | 1,321 |
|
| Restricted cash | (3,725 | ) | | (3,620 | ) |
| | | |
| Net cash provided by operating activities | 62,099 |
| | 56,252 |
|
| Cash flows from investing activities: | | |
|
| Acquisitions of real estate | (125,955 | ) | | (205,424 | ) |
| Origination of loans receivable | (165,960 | ) | | (22,180 | ) |
| Preferred equity investments | (7,038 | ) | | — |
|
| Additions to real estate | (764 | ) | | (1,046 | ) |
| Repayment of note receivable | — |
| | 10,000 |
|
| Proceeds from sale of real estate | 2,208 |
| | — |
|
| | | |
| Net cash used in investing activities | (297,509 | ) | | (218,650 | ) |
| Cash flows from financing activities: | | |
|
| Proceeds from issuance of senior unsecured notes | 200,000 |
| | 106,000 |
|
| Principal payments on senior unsecured notes | (113,750 | ) | | — |
|
| Proceeds from secured revolving credit facility | 143,500 |
| | 135,000 |
|
| Payments on secured revolving credit facility | (100,500 | ) | | (42,500 | ) |
| Proceeds from mortgage notes | — |
| | 56,651 |
|
| Principal payments on mortgage notes | (10,994 | ) | | (62,226 | ) |
| Payments of deferred financing costs | (8,954 | ) | | (6,800 | ) |
| Payment of contingent consideration | (1,300 | ) | | — |
|
| Issuance of preferred stock | 138,249 |
| | — |
|
| Issuance of common stock | 34,517 |
| | 53 |
|
| Dividends paid on common and preferred stock | (58,151 | ) | | (48,929 | ) |
| | |
|
| Net cash provided by financing activities | 222,617 |
| | 137,249 |
|
| | | |
| Net decrease in cash and cash equivalents | (12,793 | ) | | (25,149 | ) |
| Cash and cash equivalents, beginning of period | 17,101 |
| | 42,250 |
|
| | | |
| Cash and cash equivalents, end of period | $ | 4,308 |
| | $ | 17,101 |
|
| Supplemental disclosure of cash flow information: | | |
|
| Interest paid | $ | 38,541 |
| | $ | 32,613 |
|
| | | |
|
| | |
| See reporting definitions. | 7 |
SABRA HEALTH CARE REIT, INC.
RECONCILIATIONS OF EBITDA, ADJUSTED EBITDA, FUNDS FROM OPERATIONS (FFO), NORMALIZED FFO, ADJUSTED FUNDS FROM OPERATIONS (AFFO) AND NORMALIZED AFFO
(dollars in thousands, except per share amounts)
|
| | | | | | | | | | | | | | | | |
| | | Three Months Ended December 31, | | Year Ended December 31, |
| | | 2013 | | 2012 | | 2013 | | 2012 |
| Net income | | $ | 12,999 |
| | $ | 3,959 |
| | $ | 33,715 |
| | $ | 19,513 |
|
| Interest expense | | 10,576 |
| | 9,654 |
| | 40,460 |
| | 34,335 |
|
| Depreciation and amortization | | 8,555 |
| | 7,907 |
| | 33,281 |
| | 30,263 |
|
| EBITDA | | $ | 32,130 |
| | $ | 21,520 |
| | $ | 107,456 |
| | $ | 84,111 |
|
| | | | | | | | | |
| Loss on extinguishment of debt | | $ | — |
| | $ | 1,967 |
| | $ | 10,101 |
| | $ | 2,670 |
|
| Change in fair value of contingent consideration | | 200 |
| | — |
| | 800 |
| | — |
|
| Adjusted EBITDA | | $ | 32,330 |
| | $ | 23,487 |
| | $ | 118,357 |
| | $ | 86,781 |
|
| | | | | | | | | |
| Net income attributable to common stockholders | | $ | 10,439 |
| | $ | 3,959 |
| | $ | 25,749 |
| | $ | 19,513 |
|
| Add: | | | | | | | | |
| Depreciation of real estate assets | | 8,555 |
| | 7,907 |
| | 33,281 |
| | 30,263 |
|
| Impairment | | — |
| | 2,481 |
| | — |
| | 2,481 |
|
| Funds from Operations (FFO) | | $ | 18,994 |
| | $ | 14,347 |
| | $ | 59,030 |
| | $ | 52,257 |
|
| | | | | | | | | |
| Loss on extinguishment of debt | | — |
| | 1,967 |
| | 10,101 |
| | 2,670 |
|
| Additional interest on 2018 Notes | | — |
| | — |
| | 770 |
| | — |
|
| Normalized FFO | | $ | 18,994 |
| | $ | 16,314 |
| | $ | 69,901 |
| | $ | 54,927 |
|
| | | | | | | | | |
| FFO | | $ | 18,994 |
| | $ | 14,347 |
| | $ | 59,030 |
| | $ | 52,257 |
|
| Acquisition pursuit costs | | 748 |
| | 415 |
| | 1,455 |
| | 1,654 |
|
| Stock-based compensation expense | | 2,610 |
| | 2,530 |
| | 7,819 |
| | 8,279 |
|
| Straight-line rental income adjustments | | (3,873 | ) | | (2,036 | ) | | (14,709 | ) | | (4,893 | ) |
| Amortization of deferred financing costs | | 885 |
| | 768 |
| | 3,280 |
| | 2,685 |
|
| Amortization of debt premium | | (136 | ) | | (196 | ) | | (671 | ) | | (347 | ) |
| Change in fair value of contingent consideration | | 200 |
| | — |
| | 800 |
| | — |
|
| Non-cash portion of loss on extinguishment of debt | | — |
| | (75 | ) | | 859 |
| | 628 |
|
| Non-cash interest income adjustments | | 50 |
| | 6 |
| | 79 |
| | 24 |
|
| Adjusted Funds from Operations (AFFO) | | $ | 19,478 |
| | $ | 15,759 |
| | $ | 57,942 |
| | $ | 60,287 |
|
| | | | | | | | | |
| Cash portion of loss on extinguishment of debt | | — |
| | 2,043 |
| | 9,242 |
| | 2,043 |
|
| Additional interest on 2018 Notes | | — |
| | — |
| | 770 |
| | — |
|
| Consent fee | | — |
| | (2,196 | ) | | — |
| | (2,196 | ) |
| Normalized AFFO | | $ | 19,478 |
| | $ | 15,606 |
| | $ | 67,954 |
| | $ | 60,134 |
|
| | | | | | | | | |
| Net income attributable to common stockholders per diluted common share | | $ | 0.27 |
| | $ | 0.11 |
| | $ | 0.68 |
| | $ | 0.52 |
|
| | | | | | | | | |
| FFO per diluted common share | | $ | 0.49 |
| | $ | 0.38 |
| | $ | 1.55 |
| | $ | 1.40 |
|
| | | | | | | | | |
| Normalized FFO per diluted common share | | $ | 0.49 |
| | $ | 0.43 |
| | $ | 1.84 |
| | $ | 1.47 |
|
| | | | | | | | | |
| AFFO per diluted common share | | $ | 0.50 |
| | $ | 0.42 |
| | $ | 1.51 |
| | $ | 1.59 |
|
| | | | | | | | | |
| Normalized AFFO per diluted common share | | $ | 0.50 |
| | $ | 0.41 |
| | $ | 1.77 |
| | $ | 1.59 |
|
| | | | | | | | | |
| Weighted average number of common shares outstanding, diluted: | | | | | | | | |
| Net income, FFO and Normalized FFO | | 38,680,409 |
| | 37,594,583 |
| | 38,071,926 |
| | 37,321,517 |
|
| AFFO and Normalized AFFO | | 38,882,963 |
| | 37,917,964 |
| | 38,364,727 |
| | 37,829,421 |
|
| | | | | | | | | |
|
| | |
| See reporting definitions. | 8 |
SABRA HEALTH CARE REIT, INC.
CAPITALIZATION
(dollars in thousands, except per share amounts) |
| | | | | | | |
| Debt | December 31, |
| | 2013 | | 2012 |
| Mortgage notes | $ | 141,328 |
| | $ | 152,322 |
|
| Senior unsecured notes | 414,402 |
| | 330,666 |
|
| Revolving credit facility | 135,500 |
| | 92,500 |
|
| | | | |
| Total debt | $ | 691,230 |
| | $ | 575,488 |
|
|
| | | | | | | |
| Revolving Credit Facility | December 31, |
| | 2013 | | 2012 |
| Credit facility availability | $ | 135,126 |
| | $ | 109,130 |
|
| Credit facility capacity | 375,000 |
| | 230,000 |
|
|
| | | | | | | | | | |
| Enterprise Value | | | | | |
| As of December 31, 2013 | Shares Outstanding | | Price | | Value |
| Common stock | 38,788,745 |
| | $ | 26.14 |
| | $ | 1,013,938 |
|
| Preferred stock | 5,750,000 |
| | 23.75 |
| | 136,563 |
|
| Total debt | | | | | 691,230 |
|
| Cash and cash equivalents | | | | | (4,308 | ) |
| | | | | | |
| Total enterprise value | | | | | $ | 1,837,423 |
|
| | | | | | |
| As of December 31, 2012 | Shares
Outstanding | | Price | | Value |
| Common stock | 37,099,209 |
| | $ | 21.72 |
| | $ | 805,795 |
|
| Total debt | | | | | 575,488 |
|
| Cash and cash equivalents | | | | | (17,101 | ) |
| | | | | | |
| Total enterprise value | | | | | $ | 1,364,182 |
|
| | | | | | |
|
| | | | | | | | | | | | | |
| At-the-Market Common Stock Offering Program | | | | | | | | |
| | | Three and Twelve Months Ended December 31, 2013 | | | | | | |
| Shares Issued | | 1,416,513 |
| | | | | | |
| Net Proceeds | | $ | 37,554 |
| | | | | | |
| Weighted Average Price Per Share | | $ | 27.01 |
| | | | | | |
| | | | | | | | | |
| Common Stock and Equivalents | | | | | | | | |
| | | Weighted Avg. Common Shares |
| | | Three Months Ended December 31, 2013 | | Year Ended December 31, 2013 |
| | | EPS, FFO & Normalized FFO | | AFFO & Normalized AFFO | | EPS, FFO & Normalized FFO | | AFFO & Normalized AFFO |
| Common stock | | 38,024,526 |
| | 38,024,526 |
| | 37,487,631 |
| | 37,487,631 |
|
| Common equivalents | | 25,775 |
| | 25,775 |
| | 27,006 |
| | 27,006 |
|
| | | | | | | | | |
| Basic common and common equivalents | | 38,050,301 |
| | 38,050,301 |
| | 37,514,637 |
| | 37,514,637 |
|
| Dilutive securities: | | | | | | | | |
| Restricted stock and units | | 610,847 |
| | 811,266 |
| | 533,574 |
| | 821,221 |
|
| Options | | 19,261 |
| | 21,396 |
| | 23,715 |
| | 28,869 |
|
| | | | | | | | | |
| Diluted common and common equivalents | | 38,680,409 |
| | 38,882,963 |
| | 38,071,926 |
| | 38,364,727 |
|
| | | | | | | | | |
|
| | |
| See reporting definitions. | 9 |
SABRA HEALTH CARE REIT, INC.
PRO FORMA CAPITALIZATION (1)
(in thousands, except share and per share amounts)
|
| | | |
| Debt (Pro Forma) | December 31, 2013 |
| | |
| Mortgage notes | $ | 130,768 |
|
| Senior unsecured notes | 550,000 |
|
| Revolving credit facility | 131,035 |
|
| | |
| Total debt | $ | 811,803 |
|
|
| | | |
| Revolving Credit Facility (Pro Forma) | December 31, 2013 |
| | |
| Credit facility availability | $ | 139,591 |
|
| Credit facility capacity | 375,000 |
|
|
| | | | | | | | | | |
| Enterprise Value | | | | | |
| As of December 31, 2013 (Pro Forma) | Shares
Outstanding | | Price | | Value |
| Common stock | 38,788,745 |
| | $ | 26.14 |
| | $ | 1,013,938 |
|
| Preferred stock | 5,750,000 |
| | 23.75 |
| | 136,563 |
|
| Total debt | | | | | 811,803 |
|
| Cash and cash equivalents | | | | | (4,308 | ) |
| | | | | | |
| Total enterprise value | | | | | $ | 1,957,996 |
|
| | | | | | |
(1) Assumes the offering of $350.0 million aggregate principal amount of 5.5% Senior Notes due 2021; the use of proceeds therefrom to purchase all outstanding 8.125% Senior Notes due 2018, acquire the Nye Portfolio and repay a portion of the outstanding borrowings under the revolving credit facility as of December 31, 2013; the refinancing of $44.8 million of mortgage notes maturing in 2015; and the repayment of a $12.0 million mortgage note were completed as of December 31, 2013.
|
| | |
| See reporting definitions. | 10 |
SABRA HEALTH CARE REIT, INC.
INDEBTEDNESS
December 31, 2013
(dollars in thousands)
|
| | | | | | | | | |
| | Principal | | Weighted Average Effective Rate (1) | | % of Total |
| Fixed rate debt | | | | | |
Secured mortgage debt | $ | 54,688 |
| | 2.62 | % | | 7.9 | % |
Unsecured senior notes (2) | 414,402 |
| | 6.60 | % | | 60.0 | % |
| | | | | | |
| Total fixed rate debt | 469,090 |
| | 6.14 | % | | 67.9 | % |
| | | | | | |
| Variable rate debt | | | | | |
Secured mortgage debt(3) | 86,640 |
| | 5.00 | % | | 12.5 | % |
Revolving credit facility (4) | 135,500 |
| | 3.17 | % | | 19.6 | % |
| | | | | | |
| Total variable rate debt | 222,140 |
| | 3.88 | % | | 32.1 | % |
| | | | | | |
| Total debt | $ | 691,230 |
| | 5.41 | % | | 100.0 | % |
| | | | | | |
| Secured debt | | | | | |
| Secured mortgage debt | $ | 141,328 |
| | 4.08 | % | | 20.4 | % |
Revolving credit facility (4) | 135,500 |
| | 3.17 | % | | 16.0 | % |
| | | | | | |
| Total secured debt | 276,828 |
| | 3.63 | % | | 40.0 | % |
| | | | | | |
| Unsecured debt | | | | | |
Unsecured senior notes (2) | 414,402 |
| | 6.60 | % | | 60.0 | % |
| | | | | | |
| Total unsecured debt | 414,402 |
| | 6.60 | % | | 60.0 | % |
| | | | | | |
| Total debt | $ | 691,230 |
| | 5.41 | % | | 100.0 | % |
(1) Weighted average effective rate includes private mortgage insurance.
(2) Unsecured senior notes includes $3.2 million of notes premium.
(3)Variable rate secured mortgage debt interest is based on 90-day LIBOR plus 4.0% (1.00% floor).
(4)Borrowings under the revolving credit facility bear interest on the outstanding principal amount at a rate equal to, at our option, LIBOR plus 2.50% to 3.50% or a Base Rate plus 1.50% to 2.50%. The actual interest rate within the applicable range is determined based on our then applicable Consolidated Leverage Ratio. |
| | | | | | | | | | | | | | | | | | | | | | | | | | | |
| | Maturities |
| | Secured Mortgage Debt | | Unsecured Senior Notes | | Revolving Credit Facility | | Total |
| | Principal | | Rate (1) | | Principal | | Rate (1) | | Principal | | Rate (1) | | Principal | | Rate |
| 2014 | $ | 3,739 |
| | 4.08 | % | | $ | — |
| | — |
| | $ | — |
| | — |
| | $ | 3,739 |
| | 4.08 | % |
| 2015 | 86,075 |
| | 3.53 | % | | — |
| | — |
| | 135,500 |
| | 3.17 | % | | 221,575 |
| | 3.31 | % |
| 2016 | 1,647 |
| | 2.47 | % | | — |
| | — |
| | — |
| | — |
| | 1,647 |
| | 2.47 | % |
| 2017 | 1,688 |
| | 2.47 | % | | — |
| | — |
| | — |
| | — |
| | 1,688 |
| | 2.47 | % |
| 2018 | 1,730 |
| | 2.47 | % | | 211,250 |
| | 8.13 | % | | — |
| | — |
| | 212,980 |
| | 8.08 | % |
| 2019 | 1,774 |
| | 2.47 | % | | — |
| | — |
| | — |
| | — |
| | 1,774 |
| | 2.47 | % |
| 2020 | 1,818 |
| | 2.47 | % | | — |
| | — |
| | — |
| | — |
| | 1,818 |
| | 2.47 | % |
| 2021 | 1,863 |
| | 2.47 | % | | — |
| | — |
| | — |
| | — |
| | 1,863 |
| | 2.47 | % |
| 2022 | 1,910 |
| | 2.46 | % | | — |
| | — |
| | — |
| | — |
| | 1,910 |
| | 2.46 | % |
| 2023 | 1,958 |
| | 2.46 | % | | 200,000 |
| | 5.38 | % | | — |
| | — |
| | 201,958 |
| | 5.35 | % |
| Thereafter | 37,126 |
| | 2.46 | % | | — |
| | — |
| | — |
| | — |
| | 37,126 |
| | 2.46 | % |
| | 141,328 |
| | | | 411,250 |
| | | | 135,500 |
| | | | 688,078 |
| | |
| Premium | — |
| | | | 3,152 |
| | | | — |
| | | | 3,152 |
| | |
| Total debt | $ | 141,328 |
| | | | $ | 414,402 |
| | | | $ | 135,500 |
| | | | $ | 691,230 |
| | |
| Weighted average maturity in years | 11.4 |
| | | | 7.1 |
| | | | 2.6 |
| | | | 7.0 |
| | |
Weighted average effective interest rate (2) | 4.08 | % | | | | 6.60 | % | | | | 3.17 | % | | | | 5.41 | % | | |
(1) Represents actual contractual interest rates excluding private mortgage insurance.
(2) Weighted average effective rate includes private mortgage insurance.
|
| | |
| See reporting definitions. | 11 |
SABRA HEALTH CARE REIT, INC.
PRO FORMA INDEBTEDNESS (1)
December 31, 2013
(dollars in thousands)
|
| | | | | | | | | |
| | Principal | | Weighted Average Effective Rate (2) | | % of Total |
| Fixed rate debt | | | | | |
Secured mortgage debt | $ | 100,792 |
| | 3.66 | % | | 12.4 | % |
| Unsecured senior notes | 550,000 |
| | 5.45 | % | | 67.8 | % |
| | | | | | |
| Total fixed rate debt | 650,792 |
| | 5.17 | % | | 80.2 | % |
| | | | | | |
| Variable rate debt | | | | | |
Secured mortgage debt (3) | 29,976 |
| | 5.00 | % | | 3.7 | % |
Revolving credit facility (4) | 131,035 |
| | 3.17 | % | | 16.1 | % |
| | | | | | |
| Total variable rate debt | 161,011 |
| | 3.51 | % | | 19.8 | % |
| | | | | | |
| Total debt | $ | 811,803 |
| | 4.85 | % | | 100.0 | % |
| | | | | | |
| Secured debt | | | | | |
| Secured mortgage debt | $ | 130,768 |
| | 3.97 | % | | 16.1 | % |
| Revolving credit facility | 131,035 |
| | 3.17 | % | | 16.1 | % |
| | | | | | |
| Total secured debt | 261,803 |
| | 3.57 | % | | 32.2 | % |
| | | | | | |
| Unsecured debt | | | | | |
| Unsecured senior notes | 550,000 |
| | 5.45 | % | | 67.8 | % |
| | | | | | |
| Total unsecured debt | 550,000 |
| | 5.45 | % | | 67.8 | % |
| | | | | | |
| Total debt | $ | 811,803 |
| | 4.85 | % | | 100.0 | % |
|
| | | | | | | | | | | | | | | | | | | | | | | | | | | |
| | Maturities (Pro Forma) |
| | Secured Mortgage Debt | | Unsecured Senior Notes | | Revolving Credit Facility | | Total |
| | Principal | | Rate (5) | | Principal | | Rate (5) | | Principal | | Rate (5) | | Principal | | Rate |
| 2014 | $ | 3,149 |
| | 3.62 | % | | $ | — |
| | — |
| | $ | — |
| | — |
| | $ | 3,149 |
| | 3.62 | % |
| 2015 | 31,640 |
| | 3.56 | % | | — |
| | — |
| | 131,035 |
| | 3.17 | % | | 162,675 |
| | 3.25 | % |
| 2016 | 2,556 |
| | 3.30 | % | | — |
| | — |
| | — |
| | — |
| | 2,556 |
| | 3.30 | % |
| 2017 | 2,637 |
| | 3.30 | % | | — |
| | — |
| | — |
| | — |
| | 2,637 |
| | 3.30 | % |
| 2018 | 2,720 |
| | 3.31 | % | | — |
| | — |
| | — |
| | — |
| | 2,720 |
| | 3.31 | % |
| 2019 | 2,807 |
| | 3.31 | % | | — |
| | — |
| | — |
| | — |
| | 2,807 |
| | 3.31 | % |
| 2020 | 2,896 |
| | 3.32 | % | | — |
| | — |
| | — |
| | — |
| | 2,896 |
| | 3.32 | % |
| 2021 | 2,988 |
| | 3.32 | % | | 350,000 |
| | 5.50 | % | | — |
| | — |
| | 352,988 |
| | 5.48 | % |
| 2022 | 3,084 |
| | 3.33 | % | | — |
| | — |
| | — |
| | — |
| | 3,084 |
| | 3.33 | % |
| 2023 | 3,182 |
| | 3.34 | % | | 200,000 |
| | 5.38 | % | | — |
| | — |
| | 203,182 |
| | 5.35 | % |
| Thereafter | 73,109 |
| | 3.39 | % | | — |
| | — |
| | — |
| | — |
| | 73,109 |
| | 3.39 | % |
| | $ | 130,768 |
| | | | $ | 550,000 |
| | | | $ | 131,035 |
| | | | $ | 811,803 |
| | |
| Weighted average maturity in years | 21.8 |
| | | | 8.3 |
| | | | 2.6 |
| | | | 9.5 |
| | |
Weighted average effective interest rate (2) | 3.97 | % | | | | 5.45 | % | | | | 3.17 | % | | | | 4.85 | % | | |
(1) Assumes the offering of $350.0 million aggregate principal amount of 5.5% Senior Notes due 2021; the use of proceeds therefrom to purchase all outstanding 8.125% Senior Notes due 2018, acquire the Nye Portfolio and repay a portion of the outstanding borrowings under the revolving credit facility as of December 31, 2013; the refinancing of $44.8 million of mortgage notes maturing in 2015; and the repayment of a $12.0 million mortgage note were completed as of December 31, 2013.
(2) Weighted average effective rate includes private mortgage insurance.
(3) Variable rate secured mortgage debt interest is based on 90-day LIBOR plus 4.0% (1.00% floor).
(4) Borrowings under the revolving credit facility bear interest on the outstanding principal amount at a rate equal to, at our option, LIBOR plus 2.50% to 3.50% or a Base Rate plus 1.50% to 2.50%. The actual interest rate within the applicable range is determined based on our then applicable Consolidated Leverage Ratio.
(5) Represents actual contractual interest rates excluding private mortgage insurance.
|
| | |
| See reporting definitions. | 12 |
SABRA HEALTH CARE REIT, INC.
DEBT COVENANTS (1)
(dollars in millions)
|
| | | | | | | | | | | | | | | | | | |
| | | | | | December 31, |
| | | | | | 2012 | | 2013 | | 2013 |
| | Minimum | | Maximum | | Actual | | Actual | | Pro Forma (2) |
| Credit Facility: | | | | | | | | | |
| Consolidated Leverage Ratio | | | 5.50x |
| | 4.26x |
| | 4.60x |
| | 5.17x |
|
| Consolidated Fixed Charge Coverage Ratio | 1.75x |
| | | | 2.87x |
| | 2.76x |
| | 2.84x |
|
| Consolidated Tangible Net Worth | $ | 452.7 |
| | | | $ | 425.9 |
| | $ | 595.6 |
| | $ | 595.6 |
|
Limitation on Secured Indebtedness (3) | | | 30 | % | | N/A |
| | 9 | % | | 8 | % |
| | | | | | | | | | |
| Unsecured Senior Notes: | | | | | | | | | |
| Total Debt/ Asset Value | | | 60 | % | | 39 | % | | 52 | % | | 52 | % |
| Secured Debt/ Asset Value | | | 40 | % | | 16 | % | | 17 | % | | 17 | % |
| Unencumbered Assets/ Unsecured Debt | 150 | % | | | | 227 | % | | 163 | % | | 163 | % |
| Minimum Interest Coverage | 2.00x |
| | | | 3.17x |
| | 3.85x |
| | 3.81x |
|
(1) All covenants are based on terms defined in the related credit agreement and unsecured senior notes indentures. Asset Value and Unencumbered Assets used for debt covenant calculation purposes include a value for the initial real estate portfolio obtained in the separation from Sun, which is calculated by dividing the total initial annual rental revenue from this portfolio by an assumed 9.75% capitalization rate. This results in an assumed total portfolio value for the initial real estate portfolio of $720 million.
(2) Assumes the offering of $350.0 million aggregate principal amount of 5.5% Senior Notes due 2021; the use of proceeds therefrom to purchase all outstanding 8.125% Senior Notes due 2018, acquire the Nye Portfolio and repay a portion of the outstanding borrowings under the revolving credit facility as of December 31, 2013; the refinancing of $44.8 million of mortgage notes maturing in 2015; and the repayment of a $12.0 million mortgage note were completed as of December 31, 2013.
(3) Excludes borrowings under the revolving credit facility.
|
| | |
| See reporting definitions. | 13 |
SABRA HEALTH CARE REIT, INC.
PORTFOLIO SUMMARY — ALL INVESTMENTS
December 31, 2013
(dollars in thousands)
|
| | | | | | | | | | | | | | | | | | | | | | | | |
| | | | | | | Rental Income (1) | | Number of Licensed Beds/Units | | Occupancy Percentage (2) |
| | | Number of Properties | | | | Three Months Ended December 31, | | | Three Months Ended December 31, |
| Real Estate Investments | | | Investment | | 2013 | | 2012 | | | 2013 | | 2012 |
| Skilled Nursing/Post-Acute | | 96 |
| | $ | 737,188 |
| | $ | 26,223 |
| | $ | 23,712 |
| | 10,826 |
| | 88.1 | % | | 89.1 | % |
| Senior Housing | | 23 |
| | 153,247 |
| | 3,847 |
| | 2,478 |
| | 1,518 |
| | 87.9 | % | | 87.4 | % |
| Acute Care Hospitals | | 2 |
| | 175,807 |
| | 4,226 |
| | 1,648 |
| | 124 |
| | N/A |
| | N/A |
|
Total (1) | | 121 |
| | $ | 1,066,242 |
| | $ | 34,296 |
| | $ | 27,838 |
| | 12,468 |
| | 88.1 | % | | 88.9 | % |
| | | | |
|
| | | | | | | | | | |
|
| | | | | | | | | | | | | | | | |
| | | EBITDAR Coverage (2) | | EBITDARM Coverage (2) |
| | | Three Months Ended December 31, | | Twelve Months Ended December 31, | | Three Months Ended December 31, | | Twelve Months Ended December 31, |
| Real Estate Investments | | 2013 | | 2012 | | 2013 | | 2012 | | 2013 | | 2012 | | 2013 | | 2012 |
| Skilled Nursing/Post-Acute | | 1.20x | | 1.29x | | 1.25x | | 1.27x | | 1.66x | | 1.77x | | 1.72x | | 1.75x |
| Senior Housing | | 1.19x | | 1.20x | | 1.16x | | 1.15x | | 1.43x | | 1.43x | | 1.40x | | 1.38x |
| Acute Care Hospitals | | 2.22x | | 2.86x | | 2.44x | | 2.78x | | 2.37x | | 2.98x | | 2.61x | | 2.88x |
| | | | | | | | | | | | | | | | | |
Total (1) | | 1.33x | | 1.49x | | 1.40x | | 1.37x | | 1.73x | | 1.90x | | 1.80x | | 1.79x |
| | | | | | | | | | | | | | | | | |
|
| | |
Fixed Charge Coverage Ratio (3) | | Three Months Ended December 31, 2013 |
| Genesis | | 1.12x |
|
| | | | | | | | | | | | |
| | | Three Months Ended December 31, | | Year Ended December 31, |
Total Revenue by Relationship (4) | | 2013 | | 2012 | | 2013 | | 2012 |
| Genesis | | 53.1 | % | | 65.7 | % | | 59.8 | % | | 70.6 | % |
| Cadia Portfolio | | 7.0 |
| | 9.3 |
| | 7.8 |
| | 10.3 |
|
| Meridian | | 4.5 |
| | 2.2 |
| | 4.7 |
| | 0.4 |
|
| Texas Regional Medical Center | | 4.4 |
| | 5.8 |
| | 4.9 |
| | 6.4 |
|
| Aurora | | 3.1 |
| | 4.1 |
| | 3.4 |
| | 3.5 |
|
| Other | | 27.9 |
| | 12.9 |
| | 19.4 |
| | 8.8 |
|
| Total | | 100.0 | % | | 100.0 | % | | 100.0 | % | | 100.0 | % |
(1) Rental income includes $3.9 million and $2.0 million of straight-line rental income adjustments for the three months ended December 31, 2013 and December 31, 2012, respectively.
(2) Occupancy percentage, EBITDARM, EBITDAR and related coverages are only included in periods subsequent to our acquisition of the facilities for facilities with new tenants/ operators and exclude the impact of strategic disposition candidates and non-stabilized properties. All facility financial performance data are presented one quarter in arrears.
(3) As of December 31, 2013, 81 of the Company's 121 properties held for investment were operated by and leased to subsidiaries of Genesis pursuant to triple-net leases that are guaranteed by Genesis. Fixed Charge Coverage Ratio is presented one quarter in arrears. See Reporting Definitions for definitions of Fixed Charge Coverage.
(4) Represents total revenues earned from all sources during the periods posted.
|
| | |
| See reporting definitions. | 14 |
SABRA HEALTH CARE REIT, INC.
PORTFOLIO SUMMARY - ALL INVESTMENTS (CONTINUED)
December 31, 2013
(dollars in thousands)
|
| | | | | | | | | | | | | | | | | | | | | | | |
| Loan Type | Number of Loans | | Facility Type | | Principal Balance as of December 31, 2013 | | Book Value as of December 31, 2013 | | Weighted Average Contractual Interest Rate | | Weighted Average Annualized Effective Interest Rate | | Interest Income Three Months Ended December 31, 2013 | Maturity Date |
| Mortgage | 4 |
| | Skilled Nursing / Senior Housing / Acute Care Hospital | | $ | 148,925 |
| | $ | 149,450 |
| | 8.2 | % | | 8.1 | % | | $ | 2,451 |
| 10/31/16 - 1/31/18 |
| Construction | 3 |
| | Acute Care Hospital / Memory Care | | 13,945 |
| | 14,283 |
| | 7.7 | % | | 7.6 | % | | 100 |
| 9/30/16 - 10/31/18 |
| Mezzanine | 1 |
| | Skilled Nursing | | 12,350 |
| | 12,410 |
| | 12.0 | % | | 11.5 | % | | 365 |
| 12/27/2014 |
| Pre-development | 2 |
| | Senior Housing | | 1,338 |
| | 1,366 |
| | 9.0 | % | | 8.4 | % | | 28 |
| 8/16/15 - 9/13/16 |
| | | | | | | | | | | | | | | |
| | 10 |
| | | | $ | 176,558 |
| | $ | 177,509 |
| | 8.4 | % | | 8.3 | % | | $ | 2,944 |
| |
| | | | | | | | | | | | | | | |
|
| | | | | | | | | | | | | | | | | | | | | | | |
| Other Investment Type | | Number of Investments | | Facility Type | | Total Funding Commitments | | Amount Funded as of December 31, 2013 | | Book Value December 31, 2013 | | Rate of Return | | Other Income Three Months Ended December 31, 2013 |
| Preferred Equity | | 2 | | Skilled Nursing/Memory Care | | $ | 7,242 |
| | $ | 6,949 |
| | $ | 7,784 |
| | 15.0 | % | | $ | 279 |
|
|
| | |
| See reporting definitions. | 15 |
SABRA HEALTH CARE REIT, INC.
PORTFOLIO SUMMARY - SAME STORE (1)
December 31, 2013
(dollars in thousands)
|
| | | | | | | | | | | | | | | | | | | | | | | |
| | | | | Three Months Ended December 31, |
| | | | | Rental Income (2) | | Occupancy Percentage (3) | | Skilled Mix (3) |
| Real Estate Investments | | Number of
Properties | | 2013 | | 2012 | | 2013 | | 2012 | | 2013 | | 2012 |
| Skilled Nursing/Post-Acute | | 89 |
| | $ | 24,859 |
| | $ | 23,257 |
| | 88.4 | % | | 89.3 | % | | 34.5 | % | | 35.7 | % |
| Senior Housing | | 12 |
| | 2,350 |
| | 2,224 |
| | 86.1 | % | | 87.3 | % | | N/A |
| | N/A |
|
| Acute Care Hospitals | | 1 |
| | 1,648 |
| | 1,648 |
| | N/A |
| | N/A |
| | N/A |
| | N/A |
|
| Total | | 102 |
| | $ | 28,857 |
| | $ | 27,129 |
| | 88.2 | % | | 89.2 | % | | 34.5 | % | | 35.7 | % |
| | | | | | | | | | | | | | | |
|
| | | | | | | | | | | | | | | | |
| | | EBITDAR Coverage (3) | | EBITDARM Coverage (3) |
| | | Three Months Ended December 31, | | Twelve Months Ended December 31, | | Three Months Ended December 31, | | Twelve Months Ended December 31, |
| Real Estate Investments | | 2013 | | 2012 | | 2013 | | 2012 | | 2013 | | 2012 | | 2013 | | 2012 |
| Skilled Nursing/Post-Acute | | 1.21x | | 1.28x | | 1.25x | | 1.27x | | 1.68x | | 1.77x | | 1.72x | | 1.75x |
Senior Housing | | 1.22x | | 1.35x | | 1.21x | | 1.28x | | 1.46x | | 1.58x | | 1.45x | | 1.51x |
| Acute Care Hospitals | | 2.47x | | 3.20x | | 2.25x | | 2.84x | | 2.54x | | 3.31x | | 2.32x | | 2.97x |
| Total | | 1.28x | | 1.40x | | 1.30x | | 1.36x | | 1.71x | | 1.84x | | 1.74x | | 1.80x |
| | | | | | | | | | | | | | | | | |
(1) Same Store statistics consist of facilities held or acquired before October 1, 2012 and exclude the impact of strategic disposition candidates and non-stabilized properties.
(2) Rental income includes $2.9 million and $1.9 million of straight-line rental income adjustments for the three months ended December 31, 2013 and December 31, 2012, respectively.
(3) Occupancy percentage, skilled mix, EBITDARM, EBITDAR and related coverages are only included in periods subsequent to our acquisition of the facilities for facilities with new tenants/operators and exclude the impact of strategic disposition candidates and non-stabilized properties. All facility financial performance data are presented one quarter in arrears.
|
| | |
| See reporting definitions. | 16 |
SABRA HEALTH CARE REIT, INC.
INVESTMENT ACTIVITY
For the Twelve Months Ended December 31, 2013
(dollars in thousands)
|
| | | | | | | | | | | | | | | | | | |
| | Investment Date | Facility Type | Number of Properties | | Beds | | Total Commitment | | Investment as of December 31, 2013 | | Rate of Return |
| Real Estate Investments | | | | | | | | | | | |
| Greenfield of Woodstock | 06/28/13 | Senior Housing | 1 |
| | 32 |
| | $ | 6,175 |
| | $ | 6,175 |
| | 7.75 | % |
| Forest Park - Frisco | 10/22/13 | Acute Care Hospital | 1 |
| | 54 |
| | 119,780 |
| | 119,780 |
| | 8.75 | % |
| Total Real Estate Investments | | | | | | | 125,955 |
| | 125,955 |
| | 8.70 | % |
Preferred Equity Investments (1) | | | | | | | | | | | |
Bee Cave - SNF (2) | 03/05/13 | Skilled Nursing | 1 |
| | 141 |
| | 4,337 |
| | 4,135 |
| | 15.00 | % |
| Bee Cave - ALZ | 03/05/13 | Memory Care | 1 |
| | 52 |
| | 2,905 |
| | 2,814 |
| | 15.00 | % |
| Total Preferred Equity Investments | | | | | | | 7,242 |
| | 6,949 |
| | 15.00 | % |
| Debt Investments | | | | | | | | | | | |
| Sun City West Mortgage Loan | 01/31/13 | Memory Care | 1 |
| | 48 |
| | 12,800 | | 12,800 |
| | 9.00 | % |
Chai Portfolio Mezzanine Loan (3) | 06/28/13 | Skilled Nursing | 12 |
| | 1,689 |
| | 12,350 | | 12,350 |
| | 12.00 | % |
| Marshfield II Pre-Development Loan | 09/13/13 | Memory Care | 1 |
| | 24 |
| | 373 | | 373 |
| | 9.00 | % |
Forest Park - Fort Worth Construction Mortgage Loan (4) | 09/30/13 | Acute Care Hospital | 1 |
| | 54 |
| | 66,800 | | 11,880 |
| | 7.25 | % |
Forest Park - Dallas Mortgage Loan (4) | 10/22/13 | Acute Care Hospital | 1 |
| | 84 |
| | 110,000 | | 110,000 |
| | 8.00 | % |
New Dawn - Williamsburg Construction Mortgage Loan (2) | 10/31/13 | Memory Care | 1 |
| | 48 |
| | 7,935 | | 896 |
| | 10.00 | % |
New Dawn - Henrico Construction Mortgage Loan (2) | 10/31/13 | Memory Care | 1 |
| | 48 |
| | 9,209 | | 1,153 |
| | 10.00 | % |
Stoney River - Weston Interim Mortgage Loan (4) | 11/07/13 | Skilled Nursing / Assisted Living | 1 |
| | 85 |
| | 14,695 | | 14,444 |
| | 9.00 | % |
| Total Debt Investments | | | | | | | 234,162 | | 163,896 |
| | 8.44 | % |
| All Investments (Total:12) | | | | | | | $ | 367,359 |
| | $ | 296,800 |
| | 8.67 | % |
(1) Investments in preferred equity of real estate development entities.
(2) Includes an option to purchase the facility.
(3) Includes an option to purchase up to $50.0 million of assets from the Chai portfolio.
(4) Includes an purchase option as well as an option for the borrower to require the Company to purchase the facility, subject to terms and conditions.
|
| | |
| See reporting definitions. | 17 |
SABRA HEALTH CARE REIT, INC.
INVESTMENT ACTIVITY (continued)
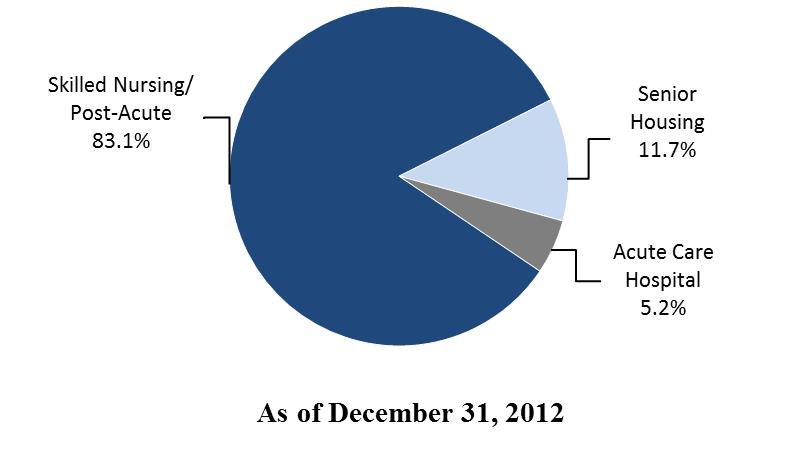
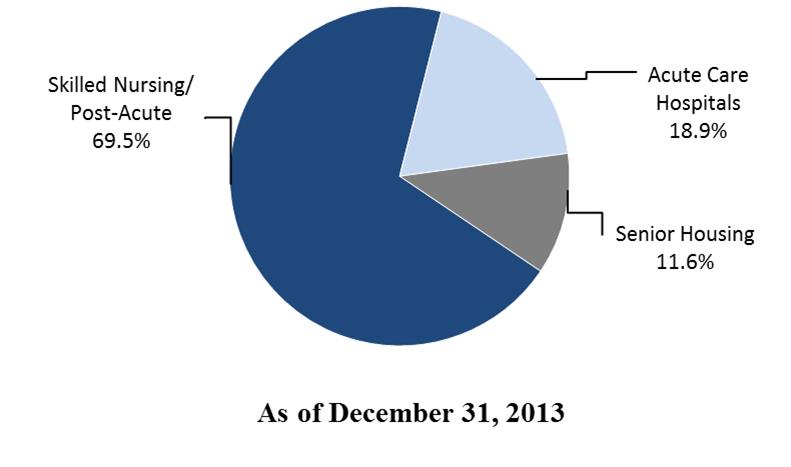
For the Twelve Months Ended December 31, 2013
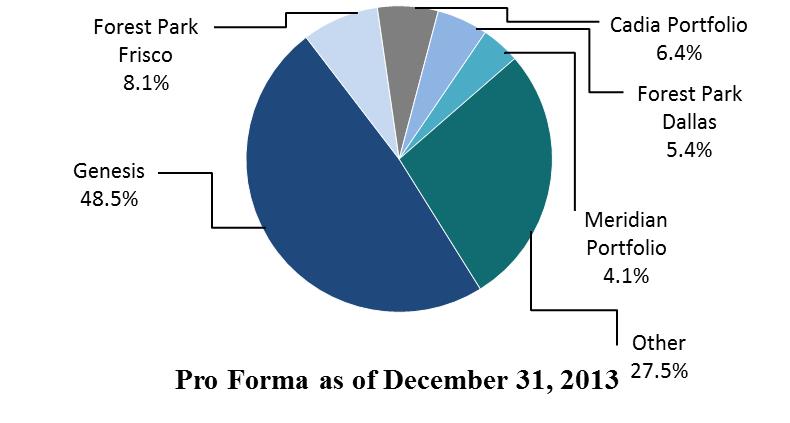
Annualized Revenue Concentration (1)
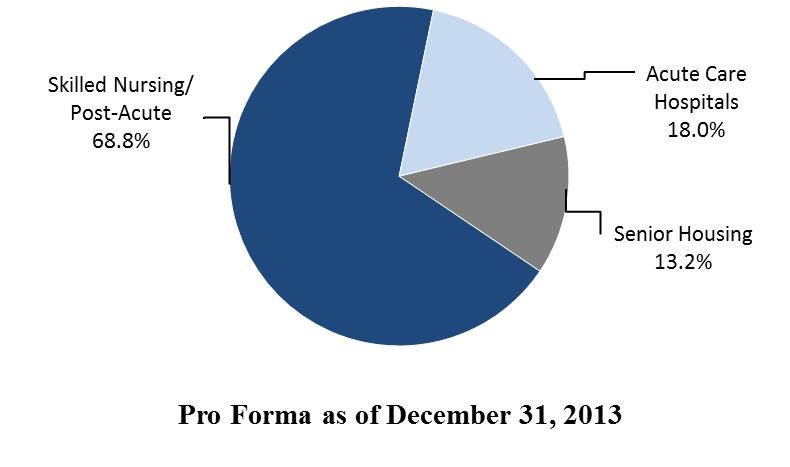
Annualized Revenue by Asset Class (1)
(1) Annualized Revenue Concentration and Annualized Revenue by Asset Class reflect only amounts invested as of December 31, 2013.
(2) Assuming all debt and joint venture investments are fully funded, the Genesis revenue concentration is 49.3% on an annualized basis.
|
| | |
| See reporting definitions. | 18 |
SABRA HEALTH CARE REIT, INC.
PORTFOLIO GEOGRAPHIC CONCENTRATIONS
December 31, 2013
Property Type
|
| | | | | | | | | | | | | | | |
| | | Skilled Nursing/Post-Acute | | Senior Housing | | Acute Care Hospitals | | Total | | % of Total |
| New Hampshire | | 14 |
| | 2 |
| | — |
| | 16 |
| | 13.2 | % |
| Kentucky | | 13 |
| | 2 |
| | — |
| | 15 |
| | 12.4 |
|
| Connecticut | | 12 |
| | 1 |
| | — |
| | 13 |
| | 10.7 |
|
| Michigan | | — |
| | 10 |
| | — |
| | 10 |
| | 8.3 |
|
| Texas | | 6 |
| | 1 |
| | 2 |
| | 9 |
| | 7.4 |
|
| Ohio | | 8 |
| | — |
| | — |
| | 8 |
| | 6.6 |
|
| Florida | | 5 |
| | — |
| | — |
| | 5 |
| | 4.1 |
|
| Oklahoma | | 3 |
| | 1 |
| | — |
| | 4 |
| | 3.3 |
|
| Delaware | | 4 |
| | — |
| | — |
| | 4 |
| | 3.3 |
|
| Montana | | 4 |
| | — |
| | — |
| | 4 |
| | 3.3 |
|
| Other (17 states) | | 27 |
| | 6 |
| | — |
| | 33 |
| | 27.4 |
|
| | | | | | | | | | | |
| Total | | 96 |
| | 23 |
| | 2 |
| | 121 |
| | 100.0 | % |
| | | | | | | | | | | |
Distribution of Licensed Beds/Units
|
| | | | | | | | | | | | | | | | | | |
| | | Total Number of Properties | | Bed/Unit Type | | | |
| | | | Skilled Nursing/Post-Acute | | Senior Housing | | Acute Care Hospitals | | Total | | % of Total |
| Connecticut | | 13 |
| | 1,770 |
| | 49 |
| | — |
| | 1,819 |
| | 14.6 | % |
| New Hampshire | | 16 |
| | 1,470 |
| | 203 |
| | — |
| | 1,673 |
| | 13.4 |
|
| Kentucky | | 15 |
| | 1,020 |
| | 128 |
| | — |
| | 1,148 |
| | 9.2 |
|
| Ohio | | 8 |
| | 897 |
| | — |
| | — |
| | 897 |
| | 7.2 |
|
| Texas | | 9 |
| | 720 |
| | 34 |
| | 124 |
| | 878 |
| | 7.0 |
|
| Florida | | 5 |
| | 660 |
| | — |
| | — |
| | 660 |
| | 5.3 |
|
| Michigan | | 10 |
| | — |
| | 571 |
| | — |
| | 571 |
| | 4.6 |
|
| Montana | | 4 |
| | 538 |
| | — |
| | — |
| | 538 |
| | 4.3 |
|
| Delaware | | 4 |
| | 500 |
| | — |
| | — |
| | 500 |
| | 4.0 |
|
| Colorado | | 3 |
| | 362 |
| | 48 |
| | — |
| | 410 |
| | 3.3 |
|
| Other (17 states) | | 34 |
| | 2,889 |
| | 485 |
| | — |
| | 3,374 |
| | 27.1 |
|
| | | | | | | | | | | | | |
| Total | | 121 |
| | 10,826 |
| | 1,518 |
| | 124 |
| | 12,468 |
| | 100.0 | % |
| | | | | | | | | | | | | |
| % of Total beds/units | | | | 86.8 | % | | 12.2 | % | | 1.0 | % | | 100.0 | % | | |
| | | | | | | | | | | | | |
|
| | |
| See reporting definitions. | 19 |
SABRA HEALTH CARE REIT, INC.
PORTFOLIO GEOGRAPHIC CONCENTRATIONS
December 31, 2013
(dollars in thousands)
Investment
|
| | | | | | | | | | | | | | | | | | | | | | |
| | | Total Number of Properties | | Skilled Nursing/Post-Acute | | Senior Housing | | Acute Care Hospitals | | Total | | % of Total |
| Texas | | 9 |
| | $ | 65,795 |
| | $ | 1,396 |
| | $ | 175,807 |
| | $ | 242,998 |
| | 22.8 | % |
| Connecticut | | 13 |
| | 140,810 |
| | 7,965 |
| | — |
| | 148,775 |
| | 14.0 |
|
| Delaware | | 4 |
| | 95,780 |
| | — |
| | — |
| | 95,780 |
| | 9.0 |
|
| New Hampshire | | 16 |
| | 76,437 |
| | 12,645 |
| | — |
| | 89,082 |
| | 8.4 |
|
| Michigan | | 10 |
| | — |
| | 73,968 |
| | — |
| | 73,968 |
| | 6.9 |
|
| Kentucky | | 15 |
| | 56,409 |
| | 9,739 |
| | — |
| | 66,148 |
| | 6.2 |
|
| Colorado | | 3 |
| | 28,594 |
| | 15,702 |
| | — |
| | 44,296 |
| | 4.2 |
|
| Montana | | 4 |
| | 42,629 |
| | — |
| | — |
| | 42,629 |
| | 4.0 |
|
| Ohio | | 8 |
| | 41,913 |
| | — |
| | — |
| | 41,913 |
| | 3.9 |
|
| Florida | | 5 |
| | 29,907 |
| | — |
| | — |
| | 29,907 |
| | 2.8 |
|
| Other (17 states) | | 34 |
| | 158,914 |
| | 31,832 |
| | — |
| | 190,746 |
| | 17.8 |
|
| | | | | | | | | | | | | |
| Total | | 121 |
| | $ | 737,188 |
| | $ | 153,247 |
| | $ | 175,807 |
| | $ | 1,066,242 |
| | 100.0 | % |
| | | | | | | | | | | | | |
| % of Total Properties | | | | 69.1 | % | | 14.4 | % | | 16.5 | % | | 100.0 | % | | |
| | | | | | | | | | | | | |
|
| | |
| See reporting definitions. | 20 |
SABRA HEALTH CARE REIT, INC.
PORTFOLIO GEOGRAPHIC CONCENTRATIONS
December 31, 2013
(dollars in thousands)
Rental Income - Three Months Ended December 31, 2013
|
| | | | | | | | | | | | | | | | | | | | | | |
| | | Total Number of Properties | | Skilled Nursing/Post-Acute | | Senior Housing | | Acute Care Hospitals | | Total | | % of Total |
| Texas | | 9 |
| | $ | 1,877 |
| | $ | 25 |
| | $ | 4,226 |
| | $ | 6,128 |
| | 17.9 | % |
| New Hampshire | | 16 |
| | 3,465 |
| | 391 |
| | — |
| | 3,856 |
| | 11.2 |
|
| Connecticut | | 13 |
| | 3,772 |
| | 83 |
| | — |
| | 3,855 |
| | 11.2 |
|
| Kentucky | | 15 |
| | 2,877 |
| | 145 |
| | — |
| | 3,022 |
| | 8.8 |
|
| Delaware | | 4 |
| | 2,645 |
| | — |
| | — |
| | 2,645 |
| | 7.7 |
|
| Florida | | 5 |
| | 2,204 |
| | — |
| | — |
| | 2,204 |
| | 6.4 |
|
| Michigan | | 10 |
| | — |
| | 1,730 |
| | — |
| | 1,730 |
| | 5.0 |
|
| Montana | | 4 |
| | 1,483 |
| | — |
| | — |
| | 1,483 |
| | 4.3 |
|
| Ohio | | 8 |
| | 1,471 |
| | — |
| | — |
| | 1,471 |
| | 4.3 |
|
| Colorado | | 3 |
| | 941 |
| | 367 |
| | — |
| | 1,308 |
| | 3.8 |
|
| Other (17 states) | | 34 |
| | 5,488 |
| | 1,106 |
| | — |
| | 6,594 |
| | 19.4 |
|
| | | | | | | | | | | | | |
| Total | | 121 |
| | $ | 26,223 |
| | $ | 3,847 |
| | $ | 4,226 |
| | $ | 34,296 |
| | 100.0 | % |
| | | | | | | | | | | | | |
| % of Total Properties | | | | 76.5 | % | | 11.2 | % | | 12.3 | % | | 100.0 | % | | |
| | | | | | | | | | | | | |
Rental Income - Twelve Months Ended December 31, 2013
|
| | | | | | | | | | | | | | | | | | | | | | |
| | | Total Number of Properties | | Skilled Nursing/Post-Acute | | Senior Housing | | Acute Care Hospitals | | Total | | % of Total |
| Texas | | 9 |
| | $ | 7,508 |
| | $ | 99 |
| | $ | 9,171 |
| | $ | 16,778 |
| | 13.0 | % |
| New Hampshire | | 16 |
| | 13,858 |
| | 1,565 |
| | — |
| | 15,423 |
| | 12.0 |
|
| Connecticut | | 13 |
| | 15,090 |
| | 332 |
| | — |
| | 15,422 |
| | 12.0 |
|
| Kentucky | | 15 |
| | 11,474 |
| | 579 |
| | — |
| | 12,053 |
| | 9.3 |
|
| Delaware | | 4 |
| | 10,578 |
| | — |
| | — |
| | 10,578 |
| | 8.2 |
|
| Florida | | 5 |
| | 8,818 |
| | — |
| | — |
| | 8,818 |
| | 6.8 |
|
| Michigan | | 10 |
| | — |
| | 6,921 |
| | — |
| | 6,921 |
| | 5.4 |
|
| Montana | | 4 |
| | 5,932 |
| | — |
| | — |
| | 5,932 |
| | 4.6 |
|
| Ohio | | 8 |
| | 5,885 |
| | — |
| | — |
| | 5,885 |
| | 4.6 |
|
| Colorado | | 3 |
| | 3,763 |
| | 1,467 |
| | — |
| | 5,230 |
| | 4.1 |
|
| Other (17 states) | | 34 |
| | 21,873 |
| | 4,075 |
| | — |
| | 25,948 |
| | 20.0 |
|
| | | | | | | | | | | | | |
| Total | | 121 |
| | $ | 104,779 |
| | $ | 15,038 |
| | $ | 9,171 |
| | $ | 128,988 |
| | 100.0 | % |
| | | | | | | | | | | | | |
| % of Total Properties | | | | 81.2 | % | | 11.7 | % | | 7.1 | % | | 100.0 | % | | |
| | | | | | | | | | | | | |
|
| | |
| See reporting definitions. | 21 |
SABRA HEALTH CARE REIT, INC.
SKILLED MIX AND OCCUPANCY PERCENTAGE
|
| | | | | | | | | | | | | | |
| | Skilled Mix Percentage (1) |
| | Three Months Ended December 31, | | Year Ended December 31, |
| | 2013 | | 2012 | | 2013 | | 2012 | | 2011 |
| Skilled Nursing | 34.9 | % | | 36.4 | % | | 36.6 | % | | 38.1 | % | | 41.4 | % |
| | | | | | | | | | |
| | Occupancy Percentage (1) |
| | Three Months Ended December 31, | | Year Ended December 31, |
| | 2013 | | 2012 | | 2013 | | 2012 | | 2011 |
| Skilled Nursing/Post-Acute | 88.1 | % | | 89.1 | % | | 88.3 | % | | 89.1 | % | | 89.3 | % |
| Senior Housing | 87.9 |
| | 87.4 |
| | 87.4 |
| | 86.3 |
| | 82.8 |
|
| | | | | | | | | | |
| Weighted Average | 88.1 | % | | 88.9 | % | | 88.2 | % | | 88.7 | % | | 88.8 | % |
| | | | | | | | | | |
(1) Skilled mix and occupancy percentage for facilities with new tenants/operators are only included in periods subsequent to our acquisition of the facilities and exclude the impact of strategic disposition candidates and facilities held for sale. All facility financial performance data are presented one quarter in arrears.
|
| | |
| See reporting definitions. | 22 |
SABRA HEALTH CARE REIT, INC.
PORTFOLIO LEASE EXPIRATIONS
December 31, 2013
|
| | | | | | | | | | | | | | | | | | | | | | | | | | | | | | | | | | | |
| | 2014 - 2019 | | 2020 | | 2021 | | 2022 | | 2023 | | 2024 | | 2025 | | Thereafter | | Total |
| Skilled Nursing/Post-Acute | | | | | | | | | | | | | | | | | |
| Properties | — |
| �� | 27 |
| | 30 |
| | 12 |
| | — |
| | 1 |
| | 4 |
| | 22 |
| | 96 |
|
| Licensed Beds/Units | — |
| | 3,025 |
| | 3,508 |
| | 869 |
| | — |
| | 360 |
| | 575 |
| | 2,489 |
| | 10,826 |
|
| Annualized Revenues | $ | — |
| | $ | 27,061 |
| | $ | 30,831 |
| | $ | 10,155 |
| | $ | — |
| | $ | 2,134 |
| | $ | 5,141 |
| | $ | 29,593 |
| | $ | 104,915 |
|
| Senior Housing | | | | | | | | | | | | | | | | | |
| Properties | — |
| | 2 |
| | 3 |
| | 14 |
| | — |
| | — |
| | 1 |
| | 3 |
| | 23 |
|
| Licensed Beds/Units | — |
| | 251 |
| | 197 |
| | 807 |
| | — |
| | — |
| | 114 |
| | 149 |
| | 1,518 |
|
| Annualized Revenues | — |
| | 1,974 |
| | 1,501 |
| | 9,901 |
| | — |
| | — |
| | 837 |
| | 1,353 |
| | 15,566 |
|
| Acute Care Hospitals | | | | | | | | | | | | | | | | | |
| Properties | — |
| | — |
| | — |
| | — |
| | — |
| | — |
| | — |
| | 2 |
| | 2 |
|
| Licensed Beds/Units | — |
| | — |
| | — |
| | — |
| | — |
| | — |
| | — |
| | 124 |
| | 124 |
|
| Annualized Revenues | — |
| | — |
| | — |
| | — |
| | — |
| | — |
| | — |
| | 19,909 |
| | 19,909 |
|
| | | | | | | | | | | | | | | | | | |
| Total Properties | — |
| | 29 |
| | 33 |
| | 26 |
| | — |
| | 1 |
| | 5 |
| | 27 |
| | 121 |
|
| | | | | | | | | | | | | | | | | | |
| Total Licensed Beds/Units | — |
| | 3,276 |
| | 3,705 |
| | 1,676 |
| | — |
| | 360 |
| | 689 |
| | 2,762 |
| | 12,468 |
|
| | | | | | | | | | | | | | | | | | |
| Total Annualized Revenues | $ | — |
| | $ | 29,035 |
| | $ | 32,332 |
| | $ | 20,056 |
| | $ | — |
| | $ | 2,134 |
| | $ | 5,978 |
| | $ | 50,855 |
| | $ | 140,390 |
|
| | | | | | | | | | | | | | | | | | |
| % of Rental Revenue | — | % | | 20.7 | % | | 23.0 | % | | 14.3 | % | | — | % | | 1.5 | % | | 4.3 | % | | 36.2 | % | | 100.0 | % |
| | | | | | | | | | | | | | | | | | |
|
| | |
| See reporting definitions. | 23 |
SABRA HEALTH CARE REIT, INC.
RECENT INVESTMENT ACTIVITY
New Dawn - Virginia Construction Mortgage Loans
|
| | |
| • Investment Date: | | October 31, 2013 |
| | | |
| • Commitment Amount: | | $17.1 million (1) |
| | | |
| • Invested Amount: | | $2.0 million (at December 31, 2013) |
| | | |
| • Investment Type: | | Construction Mortgage |
| | | �� |
| • Property Type: | | Memory Care |
| | | |
| • Location: | | Henrico and Williamsburg, Virginia |
| | | |
| • Available Beds/Units: | | Two 48-unit facilities |
| | | |
| • Rate of Return: | | 10.00% |
| | | |
| • Maturity Date: | | October 31, 2018 |
(1) Sabra has an option to acquire the facility securing each of the loans upon stabilization of that facility.
|
| | |
| See reporting definitions. | 24 |
SABRA HEALTH CARE REIT, INC.
RECENT INVESTEMENT ACTIVITY
Stoney River - Weston Interim Mortgage Loan
|
| | |
| • Investment Date: | | November 7, 2013 |
| | | |
| • Commitment Amount: | | $14.7 million (1) |
| | | |
| • Investment Amount: | | $14.4 million (at December 31, 2013) |
| | | |
| • Investment Type: | | Mortgage Loan |
| | | |
| • Property Type: | | Assisted Living Facility/Skilled Nursing Facility |
| | | |
| • Location: | | Weston, Wisconsin |
| | | |
| • Available Beds/Units: | | 50 Units (Assisted Living Facility) / 35 Beds (Skilled Nursing Facility) |
| | | |
| • Annualized GAAP Interest Income: | | $1.3 million |
| | | |
| • Rate of Return: | | 9.00% |
| | | |
| • Maturity Date: | | November 7, 2016 |
(1) Sabra has an option to acquire the Weston Facility from the borrower ("Sabra Purchase Option") and the borrower has the option to require Sabra to purchase the facility ("Borrower's Put Option"). Both the Sabra Purchase Option and the Borrower's Put Option become exercisable upon stabilization of the facility through May 6, 2015.
|
| | |
| See reporting definitions. | 25 |
SABRA HEALTH CARE REIT, INC.
RECENT INVESTMENT ACTIVITY
Nye Portfolio
|
| | |
| • Investment Date: | | February 14, 2014 |
| | | |
| • Investment Price: | | $90.0 million |
| | | |
| • Investment Type: | | Equity |
| | | |
| • Number of Properties: | | Six |
| | | |
| • Property Type: | | Multi-license |
| | | |
| • Location: | | Nebraska |
| | | |
| • Available Beds/Units: | | 673 (292 skilled nursing beds, 213 independent living units, 168 assisted living units) |
| | | |
| • Annualized GAAP Rental Income: | | $8.0 million |
| | | |
| • Initial Cash Yield: | | 7.78% |
|
| | |
| See reporting definitions. | 26 |
SABRA HEALTH CARE REIT, INC.
RECENT INVESTMENT ACTIVITY — PRO FORMA INFORMATION
(dollars in thousands, except per share amounts)
Note: The following pro forma information assumes that the investment activity during the quarter ended December 31, 2013 and subsequent to December 31, 2013 as described on pages 17 and 26 of this Supplement, the issuance of $350.0 million aggregate principal amount of 5.5% senior unsecured notes due 2021, the retirement of the outstanding 8.125% senior notes due 2018, the partial repayment of the borrowings outstanding under the revolving credit facility as of December 31, 2013, the repayment of a $12.0 million mortgage note and the refinancing of $44.8 million of mortgage notes were completed as of October 1, 2013. The following pro forma information does not include the impact of any future capital raising activity and excludes the one-time loss on extinguishment of debt of approximately $21.6 million associated with the retirement of the 8.125% senior notes due 2018. |
| | | | | | | | | | | | | | | |
| | Three Months Ended December 31, 2013 | | Adjustments | | Pro Forma Three Months Ended December 31, 2013 |
| | | Investing | | Financing | |
| Net income attributable to common stockholders | $ | 10,439 |
| | $ | 2,397 |
| | $ | (733 | ) | | $ | 12,103 |
|
| Add: | | | | | | | |
| Depreciation of real estate assets | 8,555 |
| | 1,063 |
| | — |
| | 9,618 |
|
| | |
| | | | | | |
| Funds from Operations (FFO) | $ | 18,994 |
| | $ | 3,460 |
| | $ | (733 | ) | | $ | 21,721 |
|
| | | | | | | | |
| FFO | $ | 18,994 |
| | $ | 3,460 |
| | $ | (733 | ) | | $ | 21,721 |
|
| Acquisition pursuit costs | 748 |
| | 135 |
| | — |
| | 883 |
|
| Stock-based compensation | 2,610 |
| | — |
| | — |
| | 2,610 |
|
| Straight-line rental income adjustments | (3,873 | ) | | (531 | ) | | — |
| | (4,404 | ) |
| Amortization of deferred financing costs | 885 |
| | — |
| | (205 | ) | | 680 |
|
| Amortization of debt premium | (136 | ) | | — |
| | 136 |
| | — |
|
| Change in fair value of contingent consideration | 200 |
| | — |
| | — |
| | 200 |
|
| Non-cash interest income adjustments | 50 |
| | 13 |
| | — |
| | 63 |
|
| Adjusted Funds from Operations (AFFO) | $ | 19,478 |
| | $ | 3,077 |
| | $ | (802 | ) | | $ | 21,753 |
|
| | | | | | | | |
| Net income attributable to common stockholders per diluted common share | $ | 0.27 |
| | $ | 0.06 |
| | $ | (0.02 | ) | | $ | 0.31 |
|
| | | | | | | | |
| FFO per diluted common share | $ | 0.49 |
| | $ | 0.09 |
| | $ | (0.02 | ) | | $ | 0.56 |
|
| | | | | | | | |
| AFFO per diluted common share | $ | 0.50 |
| | $ | 0.08 |
| | $ | (0.02 | ) | | $ | 0.56 |
|
| | | | | | | | |
| Weighted average number of common shares outstanding, diluted: | | | | | | | |
| Net income and FFO | 38,680,409 |
| | 38,680,409 |
| | 38,680,409 |
| | 38,680,409 |
|
| AFFO | 38,882,963 |
| | 38,882,963 |
| | 38,882,963 |
| | 38,882,963 |
|
| | | | | | | | |
Pro Forma Annualized Revenue Concentration by Tenant and Asset Type
|
| | |
| See reporting definitions. | 27 |
SABRA HEALTH CARE REIT, INC.
REPORTING DEFINITIONS
Acute Care Hospital. A facility designed to provide extended medical and rehabilitation care for patients who are clinically complex and have multiple acute or chronic conditions.
Adjusted EBITDA. The Company uses EBITDA (defined below), adjusted to exclude losses on extinguishment of debt and changes in fair value of contingent consideration ("Adjusted EBITDA"), a non-GAAP financial measure, as a measure of operating performance. By excluding interest expense and losses on extinguishment of debt, Adjusted EBITDA allows investors to measure the Company’s operating performance independent of its capital structure and indebtedness and, therefore, allows for a more meaningful comparison of its operating performance between quarters as well as annual periods and to compare its operating performance to that of other companies, both in the real estate industry and in other industries. The Company believes investors should consider Adjusted EBITDA in conjunction with net income attributable to common stockholders (the primary measure of the Company’s performance) and the other required GAAP measures of its performance, to improve their understanding of the Company’s operating results, and to make more meaningful comparisons of its performance between periods and against other companies. Adjusted EBITDA has limitations as an analytical tool and should be used in conjunction with the Company’s required GAAP presentations. Adjusted EBITDA does not reflect the Company’s historical cash expenditures or future cash requirements for capital expenditures or contractual commitments. Adjusted EBITDA does not represent net income, net income attributable to common stockholders or cash flow from operations as defined by GAAP and it should not be considered as an alternative to those indicators in evaluating operating performance or liquidity. Further, the Company’s computation of Adjusted EBITDA may not be comparable to similar measures reported by other companies.
Annualized Revenues. The annual straight-line rental revenues under leases. Annualized Revenues do not include tenant recoveries or additional rents. The Company uses Annualized Revenues for the purpose of determining tenant concentrations and lease expirations.
EBITDA. The real estate industry uses earnings before interest, taxes, depreciation and amortization (“EBITDA”), a non-GAAP financial measure, as a measure of both operating performance and liquidity. The Company uses EBITDA to measure both its operating performance and liquidity. By excluding interest expense, EBITDA allows investors to measure the Company’s operating performance independent of its capital structure and indebtedness and, therefore, allows for a more meaningful comparison of its operating performance between quarters as well as annual periods and to compare its operating performance to that of other companies, both in the real estate industry and in other industries. As a liquidity measure, the Company believes that EBITDA helps investors analyze the Company’s ability to meet its interest payments on outstanding debt. The Company believes investors should consider EBITDA in conjunction with net income attributable to common stockholders (the primary measure of the Company’s performance) and the other required GAAP measures of its performance and liquidity, to improve their understanding of the Company’s operating results and liquidity, and to make more meaningful comparisons of its performance between periods and against other companies. EBITDA has limitations as an analytical tool and should be used in conjunction with the Company’s required GAAP presentations. EBITDA does not reflect the Company’s historical cash expenditures or future cash requirements for capital expenditures or contractual commitments. While EBITDA is a relevant and widely used measure of operating performance and liquidity, it does not represent net income, net income attributable to common stockholders or cash flow from operations as defined by GAAP and it should not be considered as an alternative to those indicators in evaluating operating performance or liquidity. Further, the Company’s computation of EBITDA may not be comparable to similar measures reported by other companies.
EBITDAR. Earnings before interest, taxes, depreciation, amortization and rent (“EBITDAR”) for a particular facility accruing to the operator/tenant of the property (not the Company) for the period presented. The Company uses EBITDAR in determining EBITDAR Coverage. EBITDAR has limitations as an analytical tool. EBITDAR does not reflect historical cash expenditures or future cash requirements for facility capital expenditures or contractual commitments. In addition, EBITDAR does not represent a property's net income or cash flow from operations and should not be considered an alternative to those indicators. The Company receives EBITDAR and other information from its operators/tenants and relevant guarantors and utilizes EBITDAR as a supplemental measure of their ability to generate sufficient liquidity to meet related obligations to the Company. All facility and tenant financial performance data is derived solely from information provided by operators/tenants and relevant guarantors without independent verification by the Company and is presented one quarter in arrears. The Company includes EBITDAR with respect to a property if the property was operated at any time during the period presented subject to a lease with the Company. EBITDAR for facilities with new tenants/operators are only included in periods subsequent to the Company's acquisition of the facilities. EBITDAR excludes the impact of strategic disposition candidates and facilities held for sale.
EBITDAR Coverage. EBITDAR for the trailing 3 and 12 month periods prior to and including the period presented divided by the same period cash rent for all of our facilities. EBITDAR Coverage is a supplemental measure of an operator/tenant's ability to meet their cash rent and other obligations to the Company. However, its usefulness is limited by, among other things, the same factors that limit the usefulness of EBITDAR. All facility and tenant data are derived solely from information provided by operators/tenants and relevant guarantors without independent verification by the Company and are only included for stabilized properties. All such data is presented one quarter in arrears and excludes the impact of strategic disposition candidates and facilities held for sale.
EBITDARM. Earnings before interest, taxes, depreciation, amortization, rent and management fees (“EBITDARM”) for a particular facility accruing to the operator/tenant of the property (not the Company), for the period presented. The Company uses EBITDARM in determining EBITDARM Coverage. The usefulness of EBITDARM is limited by the same factors that limit the usefulness of EBITDAR. Together with EBITDAR, the Company utilizes EBITDARM to evaluate the core operations of the properties by eliminating management fees, which vary based on operator/tenant and its operating structure. All facility financial performance data is derived solely from information provided by operators/tenants and relevant guarantors without independent verification by the Company. All such data is presented one quarter in arrears.
SABRA HEALTH CARE REIT, INC.
REPORTING DEFINITIONS
The Company includes EBITDARM for a property if it was operated at any time during the period presented subject to a lease with the Company. EBITDARM for facilities with new tenants/operators are only included in periods subsequent to our acquisition of the facilities. EBITDARM excludes the impact of strategic disposition candidates and facilities held for sale.
EBITDARM Coverage. EBITDARM for the trailing 3 and 12 month periods prior to and including the period presented divided by the same period cash rent. EBITDARM coverage is a supplemental measure of a property's ability to generate cash flows for the operator/tenant (not the Company) to meet the operator's/tenant's related cash rent and other obligations to the Company. However, its usefulness is limited by, among other things, the same factors that limit the usefulness of EBITDARM. All facility and tenant data are derived solely from information provided by operators/tenants and relevant guarantors without independent verification by the Company and are only included for stabilized properties. All such data is presented one quarter in arrears and excludes the impact of strategic disposition candidates and facilities held for sale.
Enterprise Value. The Company believes Enterprise Value is an important measurement as it is a measure of a company’s value. We calculate Enterprise Value as market equity capitalization plus debt. Market equity capitalization is calculated as the number of shares of common stock multiplied by the closing price of our common stock on the last day of the period presented. Total Enterprise Value includes our market equity capitalization and consolidated debt, less cash and cash equivalents.
Fixed Charge Coverage. EBITDAR (including adjustments for one-time and pro forma items) for the period indicated (one quarter in arrears) for all operations of any entities that guarantee the tenants' lease obligations to the Company divided by the same period cash rent expense, interest expense and mandatory principal payments for operations of any entity that guarantees the tenants' lease obligation to the Company. Fixed Charge Coverage is a supplemental measure of a guarantor's ability to meet the operator/tenant's cash rent and other obligations to the Company should the operator/tenant be unable to do so itself. However, its usefulness is limited by, among other things, the same factors that limit the usefulness of EBITDAR. Fixed Charge Coverage is calculated by the Company as described above based on information provided by guarantors without independent verification by the Company and may differ from similar metrics calculated by the guarantors.
Funds From Operations (“FFO”) and Adjusted Funds from Operations (“AFFO”). The Company believes that net income attributable to common stockholders as defined by GAAP is the most appropriate earnings measure. The Company also believes that Funds From Operations, or FFO, as defined in accordance with the definition used by the National Association of Real Estate Investment Trusts (“NAREIT”), and Adjusted Funds from Operations, or AFFO (and related per share amounts) are important non-GAAP supplemental measures of operating performance for a real estate investment trust. Because the historical cost accounting convention used for real estate assets requires straight-line depreciation (except on land), such accounting presentation implies that the value of real estate assets diminishes predictably over time. However, since real estate values have historically risen or fallen with market and other conditions, presentations of operating results for a real estate investment trust that uses historical cost accounting for depreciation could be less informative. Thus, NAREIT created FFO as a supplemental measure of operating performance for real estate investment trusts that excludes historical cost depreciation and amortization, among other items, from net income attributable to common stockholders, as defined by GAAP. FFO is defined as net income attributable to common stockholders, computed in accordance with GAAP, excluding gains or losses from real estate dispositions, plus real estate depreciation and amortization and impairment charges. AFFO is defined as FFO excluding non-cash revenues (including, but not limited to, straight-line rental income adjustments, non-cash interest income adjustments and amortization of debt premium), non-cash expenses (including, but not limited to, stock-based compensation expense, amortization of deferred financing costs and amortization of debt discounts) and acquisition pursuit costs. The Company believes that the use of FFO and AFFO (and the related per share amounts), combined with the required GAAP presentations, improves the understanding of operating results of real estate investment trusts among investors and makes comparisons of operating results among such companies more meaningful. The Company considers FFO and AFFO to be useful measures for reviewing comparative operating and financial performance because, by excluding gains or losses from real estate dispositions, impairment charges and real estate depreciation and amortization, and, for AFFO, by excluding non-cash revenues (including, but not limited to, straight-line rental income adjustments, non-cash interest income adjustments and amortization of debt premium), non-cash expenses (including, but not limited to, stock-based compensation expense, amortization of deferred financing costs and amortization of debt discounts) and acquisition pursuit costs, FFO and AFFO can help investors compare the operating performance of the Company between periods or as compared to other companies. While FFO and AFFO are relevant and widely used measures of operating performance of real estate investment trusts, they do not represent cash flows from operations or net income attributable to common stockholders as defined by GAAP and should not be considered an alternative to those measures in evaluating the Company’s liquidity or operating performance. FFO and AFFO also do not consider the costs associated with capital expenditures related to the Company’s real estate assets nor do they purport to be indicative of cash available to fund the Company’s future cash requirements. Further, the Company’s computation of FFO and AFFO may not be comparable to FFO and AFFO reported by other real estate investment trusts that do not define FFO in accordance with the current NAREIT definition or that interpret the current NAREIT definition or define AFFO differently than the Company.
Investment. Represents the carrying amount of real estate assets after adding back accumulated depreciation and amortization.
Licensed Beds/Units. Senior housing facilities are measured in units (e.g., studio, one or two bedroom units). Skilled nursing and mental health facilities are measured in licensed bed count. All facility financial performance data were derived solely from information provided by operators/tenants without independent verification by the Company.
SABRA HEALTH CARE REIT, INC.
REPORTING DEFINITIONS
Market Capitalization. Total common shares of Sabra outstanding multiplied by the closing price per common share as of a given period.
Normalized FFO and AFFO. Normalized FFO represents FFO adjusted for certain income and expense items that the Company does not believe are indicative of its ongoing operating results. Normalized AFFO represents AFFO adjusted for one-time start-up costs and certain income and expense items that the Company does not believe are indicative of its ongoing operating results. The Company considers normalized FFO and AFFO to be a useful measure to evaluate the Company’s operating results excluding start-up costs and non-recurring income and expenses. Normalized FFO and AFFO can help investors compare the operating performance of the Company between periods or as compared to other companies. Normalized FFO and AFFO do not represent cash flows from operations or net income as defined by GAAP and should not be considered an alternative to those measures in evaluating the Company’s liquidity or operating performance. Normalized FFO and AFFO also do not consider the costs associated with capital expenditures related to the Company’s real estate assets nor does it purport to be indicative of cash available to fund the Company’s future cash requirements. Further, the Company’s computation of normalized FFO and AFFO may not be comparable to normalized FFO and AFFO reported by other REITs that do not define FFO in accordance with the current NAREIT definition or that interpret the current NAREIT definition or define FFO and AFFO or normalized FFO and normalized AFFO differently from the Company.
Occupancy Percentage. Occupancy Percentage represents the facilities’ average operating occupancy for the period indicated. The percentages are calculated by dividing the actual census from the period presented by the available beds/units for the same period. Occupancy for independent living facilities can be greater than 100% for a given period as multiple residents could occupy a single unit. All facility financial performance data were derived solely from information provided by operators/tenants without independent verification by the Company and are only included for stabilized properties. All facility financial performance data are presented one quarter in arrears. The Company includes the occupancy percentage for a property if it was owned by the Company at any time during the period presented and excludes the impact of strategic disposition candidates and facilities held for sale. Occupancy Percentage for facilities with new tenants/operators are only included in periods subsequent to our acquisition of the facilities.
Senior Housing. Senior housing facilities include independent living, assisted living, continuing care retirement community and memory care facilities.
Skilled Mix. Skilled Mix is defined as the total Medicare and non-Medicaid managed care patient revenue at skilled nursing facilities divided by the total revenues at skilled nursing facilities for any given period. All facility financial performance data were derived solely from information provided by the Company's tenants without independent verification by the Company and are only included for stabilized properties. All facility financial performance data are presented one quarter in arrears. The Company includes skilled mix for a property if it was owned by the Company at any time during the period presented and excludes the impact of strategic disposition candidates and facilities held for sale. Skilled Mix for facilities with new tenants/operators are only included in periods subsequent to our acquisition of the facilities.
Skilled Nursing/Post-Acute. Skilled nursing/post-acute facilities include skilled nursing facilities, multi-license designation, and mental health facilities.
Total Debt. The carrying amount of the Company’s secured revolving credit facility, senior unsecured notes, and mortgage indebtedness, as reported in the Company’s consolidated financial statements.
Total Secured Debt. Mortgage and other debt secured by real estate.