Disclaimer
This supplement contains “forward-looking” statements as defined in the Private Securities Litigation Reform Act of 1995. These statements may be identified, without limitation, by the use of “expects,” “believes,” “intends,” “should” or comparable terms or the negative thereof. Examples of forward-looking statements include all statements regarding our expected future financial position, results of operations, cash flows, liquidity, business strategy, growth opportunities, potential investments, and plans and objectives for future operations.
Our actual results may differ materially from those projected or contemplated by our forward-looking statements as a result of various factors, including among others, the following: our dependence on the operating success of our tenants; operational risks with respect to our Senior Housing - Managed communities (as defined below); the effect of our tenants declaring bankruptcy or becoming insolvent; our ability to find replacement tenants and the impact of unforeseen costs in acquiring new properties; the impact of litigation and rising insurance costs on the business of our tenants; the anticipated benefits of our merger with Care Capital Properties, Inc. (“CCP”) may not be realized; the anticipated and unanticipated costs, fees, expenses and liabilities related to our merger with CCP; our ability to implement the previously announced rent repositioning program for certain of our tenants who were legacy tenants of CCP on the timing or terms we have previously disclosed; our ability to dispose of facilities currently leased to Genesis Healthcare, Inc. (“Genesis”) on the timing or terms we have previously disclosed; the possibility that Sabra may not acquire the remaining majority interest in the Enlivant Joint Venture; risks associated with our investments in joint ventures; changes in healthcare regulation and political or economic conditions; the impact of required regulatory approvals of transfers of healthcare properties; competitive conditions in our industry; our concentration in the healthcare property sector, particularly in skilled nursing/transitional care facilities and senior housing communities, which makes our profitability more vulnerable to a downturn in a specific sector than if we were investing in multiple industries; the significant amount of and our ability to service our indebtedness; covenants in our debt agreements that may restrict our ability to pay dividends, make investments, incur additional indebtedness and refinance indebtedness on favorable terms; increases in market interest rates; our ability to raise capital through equity and debt financings; changes in foreign currency exchange rates; the relatively illiquid nature of real estate investments; the loss of key management personnel or other employees; uninsured or underinsured losses affecting our properties and the possibility of environmental compliance costs and liabilities; the impact of a failure or security breach of information technology in our operations; our ability to maintain our status as a real estate investment trust (“REIT”); changes in tax laws and regulations affecting REITs (including the potential effects of the Tax Cuts and Jobs Act); compliance with REIT requirements and certain tax and tax regulatory matters related to our status as a REIT; and the ownership limits and anti-takeover defenses in our governing documents and under Maryland law, which may restrict change of control or business combination opportunities.
Additional information concerning risks and uncertainties that could affect our business can be found in our filings with the Securities and Exchange Commission (the “SEC”), including Item 1A of our Annual Report on Form 10-K for the year ended December 31, 2017. We do not intend, and we undertake no obligation, to update any forward-looking information to reflect events or circumstances after the date of this supplement or to reflect the occurrence of unanticipated events, unless required by law to do so.
Note Regarding Non-GAAP Financial Measures
This supplement includes the following financial measures defined as non-GAAP financial measures by the SEC: net operating income (“NOI”), Cash NOI, funds from operations attributable to common stockholders (“FFO”), Normalized FFO, Adjusted FFO (“AFFO”), Normalized AFFO, FFO per diluted common share, Normalized FFO per diluted common share, AFFO per diluted common share, Normalized AFFO per diluted common share and Adjusted EBITDA (defined below). These measures may be different than non-GAAP financial measures used by other companies, and the presentation of these measures is not intended to be considered in isolation or as a substitute for financial information prepared and presented in accordance with U.S. generally accepted accounting principles. An explanation of these non-GAAP financial measures is included under “Reporting Definitions” in this supplement and reconciliations of these non-GAAP financial measures to the GAAP financial measures we consider most comparable are included on the Investors section of our website at http://www.sabrahealth.com/investors/financials/reports-presentations/non-gaap.
Tenant and Borrower Information
This supplement includes information regarding certain of our tenants that lease properties from us and our borrowers, most of which are not subject to SEC reporting requirements. Genesis is subject to the reporting requirements of the SEC and is required to file with the SEC annual reports containing audited financial information and quarterly reports containing unaudited financial information. The information related to our tenants and borrowers that is provided in this supplement has been provided by, or derived from information provided by, such tenants and borrowers. We have not independently verified this information. We have no reason to believe that such information is inaccurate in any material respect. We are providing this data for informational purposes only. Genesis's filings with the SEC can be found at www.sec.gov.
Table of Contents
|
| |
| |
| | |
| |
| | |
| |
| | |
| |
| | |
| |
| | |
| |
| | |
| |
| | |
| |
| | |
| |
| | |
| |
| | |
| |
| | |
| |
| | |
| |
| | |
| Real Estate Portfolio Geographic Concentrations | |
| | |
| |
| | |
| |
| | |
| |
| | |
| |
| | |
| |
| | |
| |
| | |
| |
| | |
| |
| | |
Discussion and Reconciliation of Certain Non-GAAP Financial Measures: http://www.sabrahealth.com/investors/financials/reports-presentations/non-gaap
| |
Company Information
Board of Directors
|
| | |
| | | |
Richard K. Matros Chairman of the Board, President and Chief Executive Officer Sabra Health Care REIT, Inc. | | Craig A. Barbarosh Partner Katten Muchin Rosenman LLP |
| | |
Robert A. Ettl Chief Operating Officer Harvard Management Company | | Michael J. Foster Managing Director RFE Management Corp. |
| | |
Ronald G. Geary Owner and President Ellis Park Race Course, Inc. | | Raymond J. Lewis Former Chief Executive Officer Care Capital Properties, Inc. |
| | | |
Jeffrey A. Malehorn Executive Advisor (former President & Chief Executive Officer) World Business Chicago | | Milton J. Walters President Tri-River Capital |
Senior Management
|
| | |
| | | |
Richard K. Matros Chairman of the Board, President and Chief Executive Officer | | Harold W. Andrews, Jr. Executive Vice President, Chief Financial Officer and Secretary |
| | |
Talya Nevo-Hacohen Executive Vice President, Chief Investment Officer and Treasurer | | |
Other Information
|
| | |
| | | |
Corporate Headquarters 18500 Von Karman Avenue, Suite 550 Irvine, CA 92612 | | Transfer Agent American Stock Transfer & Trust Company, LLC 6201 15th Avenue Brooklyn, NY 11219 |
www.sabrahealth.com
The information in this supplemental information package should be read in conjunction with the Company’s Annual Report on Form 10-K, Quarterly Reports on Form 10-Q, Current Reports on Form 8-K and other information filed with the SEC. The Reporting Definitions and Reconciliations of Non-GAAP Measures are an integral part of the information presented herein.
On Sabra's website, www.sabrahealth.com, you can access, free of charge, Sabra’s Annual Report on Form 10-K, Quarterly Reports on Form 10-Q, Current Reports on Form 8-K, and amendments to those reports filed or furnished pursuant to Sections 13(a) or 15(d) of the Securities Exchange Act of 1934, as amended, as soon as reasonably practicable after such material is filed with, or furnished to, the SEC. The information contained on Sabra’s website is not incorporated by reference into, and should not be considered a part of, this supplemental information package. All material filed with the SEC can also be accessed through its website, www.sec.gov.
For more information, contact Investor Relations at (888) 393-8248 or investorrelations@sabrahealth.com.
SABRA HEALTH CARE REIT, INC.
COMPANY FACT SHEET
Company Profile
Sabra Health Care REIT, Inc., a Maryland corporation (“Sabra,” the “Company” or “we”), operates as a self-administered, self-managed REIT that, through its subsidiaries, owns and invests in real estate serving the healthcare industry. Sabra primarily generates revenues by leasing properties to tenants and operators throughout the United States and Canada.
Objectives and Strategies
We expect to continue to grow our investment portfolio while diversifying our portfolio by tenant, asset class and geography within the healthcare sector. We plan to achieve these objectives primarily through making investments directly or indirectly in healthcare real estate, including the development of purpose built healthcare facilities with select developers. We also intend to achieve our objective of diversifying our portfolio by tenant and asset class through select asset sales and other arrangements with Genesis and with other tenants. We have entered into memoranda of understanding with Genesis to market for sale up to all of our remaining Genesis facilities and to restructure our lease agreements with Genesis to increase the marketability of these facilities to potential buyers. We expect to complete the sales of 46 of our remaining 54 Genesis facilities in 2018 and to retain eight facilities, although we cannot provide assurance that the sales will be completed in that timeframe, if at all.
With respect to our debt and preferred equity investments, in general, we originate loans and make preferred equity investments when an attractive investment opportunity is presented and (a) the property is in or near the development phase, (b) the development of the property is completed but the operations of the facility are not yet stabilized or (c) the loan investment will provide capital to existing relationships. A key component of our development strategy related to loan originations and preferred equity investments is having the option to purchase the underlying real estate that is owned by our borrowers (and that directly or indirectly secures our loan investments) or by the entity in which we have an investment. These options become exercisable upon the occurrence of various criteria, such as the passage of time or the achievement of certain operating goals, and the method to determine the purchase price upon exercise of the option is set in advance based on the same valuation methods we use to value our investments in healthcare real estate. This proprietary development pipeline strategy allows us to diversify our revenue streams and build relationships with operators and developers, and provides us with the option to add new properties to our existing real estate portfolio if we determine that those properties enhance our investment portfolio and stockholder value at the time the options are exercisable.
SABRA HEALTH CARE REIT, INC.
COMPANY FACT SHEET (CONTINUED)
AS OF DECEMBER 31, 2017
|
| | | | |
| Market Facts | | Credit Ratings |
| Common Stock Information: | | |
| Closing Price | $18.77 | | S&P: | |
| 52-Week Range | $18.48 - $29.10 | | Corporate Rating | BB+ (stable outlook) |
| Common Equity Market Capitalization | $3.3 billion | | Unsecured Notes | BBB- (stable outlook) |
| Outstanding Shares | 178.3 million | | Preferred Equity Rating | B+ (stable outlook) |
| Enterprise Value | $6.4 billion | | Fitch: | |
| | | Corporate Rating | BBB- (stable outlook) |
| Ticker symbols: | | | Unsecured Notes | BBB- (stable outlook) |
| Common Stock | SBRA | | Preferred Equity Rating | BB (stable outlook) |
| Preferred Stock | SBRAP | | Moody's: | |
| Stock Exchange | Nasdaq | | Corporate Rating | Ba1 (stable outlook) |
| Governance | | Unsecured Notes | Ba1 (stable outlook) |
(As of February 1, 2018)
| | Preferred Equity Rating | Ba2 (stable outlook) |
| ISS Governance QuickScore | 4 | | | |
|
| | | | | | |
| Portfolio Information |
| Investment in Real Estate Properties | | | Real Estate Property Bed/Unit Count | |
| Skilled Nursing/Transitional Care | 384 |
| | Skilled Nursing/Transitional Care | 43,223 |
|
| Senior Housing - Leased | 88 |
| | Senior Housing - Leased | 8,137 |
|
| Senior Housing - Managed | 13 |
| | Senior Housing - Managed | 1,113 |
|
| Specialty Hospitals and Other | 22 |
| | Specialty Hospitals and Other | 1,085 |
|
| Total Equity Investments | 507 |
| | Total Beds/Units | 53,558 |
|
| | | | | |
| Investment in Direct Financing Lease | 1 |
| | | |
Investments in Loans Receivable (1) | 22 |
| | | |
Preferred Equity Investments (2) | 12 |
| | Countries | 2 |
| Investment in Specialty Valuation Firm | 1 |
| | U.S. States | 43 |
|
| Total Investments | 543 |
| | Relationships | 72 |
|
| |
(1) | Three of our investments in Loans Receivable contain purchase options on three Senior Housing developments with 138 beds/units. |
| |
(2) | Our Preferred Equity Investments include investments in entities owning 11 Senior Housing developments with 1,226 beds/units and one Skilled Nursing/Transitional Care development with 120 beds/units. |
|
| | |
| See reporting definitions. | 2 |
SABRA HEALTH CARE REIT, INC.
FINANCIAL HIGHLIGHTS
(dollars in thousands, except per share data) |
| | | | | | | | | | | | | | | |
| | Three Months Ended December 31, | | Year Ended December 31, |
| | 2017 | | 2016 | | 2017 | | 2016 |
| Revenues | $ | 166,472 |
| | $ | 61,791 |
| | $ | 405,647 |
| | $ | 260,526 |
|
| Net operating income | 160,541 |
| | 60,344 |
| | 387,787 |
| | 254,823 |
|
| Net income attributable to common stockholders | 101,385 |
| | 20,615 |
| | 148,141 |
| | 60,034 |
|
| FFO attributable to common stockholders | 106,843 |
| | 40,733 |
| | 211,267 |
| | 164,439 |
|
| Normalized FFO attributable to common stockholders | 117,915 |
| | 40,612 |
| | 257,539 |
| | 156,438 |
|
| AFFO attributable to common stockholders | 106,570 |
| | 38,768 |
| | 242,278 |
| | 161,465 |
|
| Normalized AFFO attributable to common stockholders | 107,129 |
| | 35,668 |
| | 245,119 |
| | 148,859 |
|
| Per share data attributable to common stockholders: | | | | | | | |
| Diluted EPS | $ | 0.57 |
| | $ | 0.31 |
| | $ | 1.40 |
| | $ | 0.92 |
|
| Diluted FFO | 0.60 |
| | 0.62 |
| | 2.00 |
| | 2.51 |
|
| Diluted Normalized FFO | 0.66 |
| | 0.62 |
| | 2.43 |
| | 2.39 |
|
| Diluted AFFO | 0.60 |
| | 0.59 |
| | 2.28 |
| | 2.45 |
|
| Diluted Normalized AFFO | 0.60 |
| | 0.54 |
| | 2.31 |
| | 2.26 |
|
| | | | | | | | |
| Net cash flow provided by operations | $ | 83,715 |
| | $ | 42,923 |
| | $ | 133,486 |
| | $ | 176,739 |
|
| Investment Portfolio | December 31, 2017 | | December 31, 2016 | | | | |
Real Estate Properties held for investment (1) | 507 |
| | 183 |
| | | | |
| Real Estate Properties held for investment, gross ($) | $ | 6,334,262 |
| | $ | 2,292,345 |
| | | | |
| Total Beds/Units | 53,558 |
| | 18,878 |
| | | | |
| Weighted Average Remaining Lease Term (in months) | 108 |
| | 112 |
| | | | |
| Total Investment in Direct Financing Lease | 1 |
| | — |
| | | | |
| Total Investment in Direct Financing Lease, net ($) | $ | 22,980 |
| | $ | — |
| | | | |
| Total Investments in Loans Receivable | 22 |
| | 10 |
| | | | |
Total Investments in Loans Receivable, gross ($) (2) | $ | 66,342 |
| | $ | 51,432 |
| | | | |
| Total Preferred Equity Investments | 12 |
| | 12 |
| | | | |
| Total Preferred Equity Investments, gross ($) | $ | 48,482 |
| | $ | 45,190 |
| | | | |
| Debt | December 31, 2017 | | December 31, 2016 | | | | |
| Principal Balance | | | | | | | |
| Fixed Rate Debt | $ | 1,460,702 |
| | $ | 863,638 |
| | | | |
Variable Rate Debt - Swapped (3) | 944,587 |
| | 338,000 |
| | | | |
| Variable Rate Debt - Floating | 994,500 |
| | 26,000 |
| | | | |
| Total Debt | $ | 3,399,789 |
| | $ | 1,227,638 |
| | | | |
| | | | | | | | |
| Cash | (518,632 | ) | | (25,663 | ) | | | | |
| Facility Sales Proceeds Held in Restricted Cash | $ | (57,512 | ) | | $ | — |
| | | | |
Net Debt (4) | $ | 2,823,645 |
| | $ | 1,201,975 |
| | | | |
| | | | | | | | |
| Weighted Average Effective Interest Rate | | | | | | | |
| Fixed Rate Debt | 5.17 | % | | 5.16 | % | | | | |
Variable Rate Debt - Swapped (3) | 2.66 | % | | 2.99 | % | | | | |
| Variable Rate Debt - Floating | 2.92 | % | | 2.77 | % | | | | |
| Total Debt | 3.81 | % | | 4.51 | % | | | | |
| | | | | | | | |
| % of Total | | | | | | | |
| Fixed Rate Debt | 42.9 | % | | 70.3 | % | | | | |
Variable Rate Debt - Swapped (3) | 27.8 | % | | 27.5 | % | | | | |
| Variable Rate Debt - Floating | 29.3 | % | | 2.2 | % | | | | |
| | | | | | | | |
| Availability Under Revolving Credit Facility | $ | 359,000 |
| | $ | 474,000 |
| | | | |
Available Liquidity (5) | $ | 877,419 |
| | $ | 499,547 |
| | | | |
| |
(1) | Real Estate Properties held for investment include Senior Housing - Managed communities. |
| |
(2) | Total Investments in Loans Receivable consists of principal plus capitalized origination fees net of discounts and loan loss reserves. |
| |
(3) | As of December 31, 2017, variable rate debt - swapped includes $845.0 million subject to swap agreements that fix LIBOR at a weighted average rate of 1.19%, $71.7 million (CAD $90.0 million) and $27.9 million (CAD $35.0 million) subject to swap agreements that fix the Canadian Dollar Offered Rate (“CDOR”) at 1.59% and 0.93%, respectively. |
| |
(4) | Net Debt excludes deferred financing costs, net and premiums/discounts, net. |
| |
(5) | Available liquidity represents unrestricted cash, excluding cash associated with the consolidated joint venture, and availability under the revolving credit facility. |
|
| | |
| See reporting definitions. | 3 |
SABRA HEALTH CARE REIT, INC.
UPDATED 2018 OUTLOOK
|
| | | | | | | | |
|
| Low |
| High |
| Net income attributable to common stockholders |
| $ | 2.16 |
|
| $ | 2.24 |
|
| Add: |
|
|
|
|
| Depreciation and amortization |
| 0.99 |
|
| 0.99 |
|
| Gain on sale of real estate |
| (0.84 | ) |
| (0.84 | ) |
|
|
|
|
|
| FFO attributable to common stockholders |
| $ | 2.31 |
|
| $ | 2.39 |
|
|
|
|
|
|
| Write-off of capitalized preferred equity issuance costs |
| 0.03 |
|
| 0.03 |
|
| Write-off of above market lease intangibles |
| (0.05 | ) |
| (0.05 | ) |
| CCP transition costs |
| 0.01 |
|
| 0.01 |
|
| Loss on extinguishment of debt |
| 0.18 |
|
| 0.18 |
|
| Normalized FFO attributable to common stockholders |
| $ | 2.48 |
|
| $ | 2.56 |
|
|
|
|
|
|
| FFO attributable to common stockholders |
| $ | 2.31 |
|
| $ | 2.39 |
|
| Stock-based compensation expense |
| 0.05 |
|
| 0.05 |
|
| Straight-line rental income adjustments |
| (0.28 | ) |
| (0.28 | ) |
| Amortization of above/below market lease intangibles |
| (0.02 | ) |
| (0.02 | ) |
| Amortization of deferred financing costs |
| 0.05 |
|
| 0.05 |
|
| Write-off of above market lease intangibles |
| (0.05 | ) |
| (0.05 | ) |
| Write-off of capitalized preferred equity issuance costs |
| 0.03 |
|
| 0.03 |
|
| Non-cash portion of loss on extinguishment of debt |
| 0.06 |
|
| 0.06 |
|
| Provision for doubtful straight-line rental income, loan losses and other reserves |
| 0.01 |
|
| 0.01 |
|
| Non-cash interest income adjustments |
| (0.01 | ) |
| (0.01 | ) |
|
|
|
|
|
| AFFO attributable to common stockholders |
| $ | 2.15 |
|
| $ | 2.23 |
|
|
|
|
|
|
| Loss on extinguishment of debt |
| 0.12 |
|
| 0.12 |
|
| CCP transition costs |
| 0.01 |
|
| 0.01 |
|
| Normalized AFFO attributable to common stockholders |
| $ | 2.28 |
|
| $ | 2.36 |
|
The updated 2018 Outlook includes the following:
| |
| • | The investment in the Enlivant Joint Venture and the acquisitions of the Enlivant Owned Portfolio and the two additional North American Healthcare facilities that were completed in early 2018, approximately $120 million of future investments we expect to make in 2018 related to our proprietary development pipeline and additional committed investments totaling $82 million. The weighted average annual cash yield of these future investments is estimated to be 8.2%. |
| |
| • | $28.2 million of long-term rent reductions related to the CCP portfolio repositioning as though such reductions were effective January 1, 2018 and short term rent loss of $5.5 million associated with the sales of certain assets generating estimated sales proceeds of $58.8 million. The lost rents associated with these asset sales are expected to be replaced during 2018 by the future investments described above. |
| |
| • | The expected sales of the remaining 46 Genesis facilities, reducing total annual cash rents by $31.7 million and providing an estimated $367.6 million of gross proceeds. We continue to expect such sales to occur throughout the remainder of 2018 and as such our outlook continues to approximate a mid-year elimination of such rents. |
| |
| • | Additional asset sales with expected sales proceeds of $105.6 million. |
| |
| • | The retirement of our 5.8 million shares of 7.125% Series A Cumulative Redeemable Preferred Stock in the first half of 2018. |
| |
| • | The refinancing of our $500 million of 5.5% senior unsecured notes due 2021 and $200 million of 5.375% senior unsecured notes due 2023 during the second half of 2018. |
Except as otherwise noted above, the foregoing projections reflect management's view of current and future market conditions. There can be no assurance that the Company's actual results will not differ materially from the estimates set forth above. Except as otherwise required by law, the Company assumes no, and hereby disclaims any, obligation to update any of the foregoing projections as a result of new information or new or future developments.
|
| | |
| See reporting definitions. | 4 |
SABRA HEALTH CARE REIT, INC.
CONSOLIDATED STATEMENTS OF INCOME
(dollars in thousands, except per share data)
|
| | | | | | | | | | | | | | | |
| | Three Months Ended December 31, | | Year Ended December 31, |
| | 2017 | | 2016 | | 2017 | | 2016 |
| Revenues: | | | | | | | |
| Rental income | $ | 150,918 |
| | $ | 57,833 |
| | $ | 364,191 |
| | $ | 225,275 |
|
| Interest and other income | 6,964 |
| | 1,981 |
| | 15,026 |
| | 27,463 |
|
| Resident fees and services | 8,590 |
| | 1,977 |
| | 26,430 |
| | 7,788 |
|
| | | | | | | | |
| Total revenues | 166,472 |
| | 61,791 |
| | 405,647 |
| | 260,526 |
|
| | | | | | | | |
| Expenses: | | | | | | | |
| Depreciation and amortization | 51,592 |
| | 17,199 |
| | 113,882 |
| | 68,472 |
|
| Interest | 32,222 |
| | 15,734 |
| | 88,440 |
| | 64,873 |
|
| Operating expenses | 5,931 |
| | 1,447 |
| | 17,860 |
| | 5,703 |
|
| General and administrative | 8,242 |
| | 4,159 |
| | 32,401 |
| | 17,672 |
|
| Merger and acquisition costs | 505 |
| | (25 | ) | | 30,255 |
| | 1,197 |
|
| Provision for doubtful accounts and loan losses | 9,659 |
| | 2,257 |
| | 17,113 |
| | 5,543 |
|
| Impairment of real estate | 1,326 |
| | — |
| | 1,326 |
| | 29,811 |
|
| | | | | | | | |
| Total expenses | 109,477 |
| | 40,771 |
| | 301,277 |
| | 193,271 |
|
| | | | | | | | |
| Other income (expense): | | | | | | | |
| Loss on extinguishment of debt | — |
| | — |
| | (553 | ) | | (556 | ) |
| Other income | 49 |
| | 5,332 |
| | 3,170 |
| | 10,677 |
|
| Net gain (loss) on sales of real estate | 47,415 |
| | (2,919 | ) | | 52,029 |
| | (6,122 | ) |
| | | | | | | | |
| Total other income (expense) | 47,464 |
| | 2,413 |
| | 54,646 |
| | 3,999 |
|
| | | | | | | | |
| Income before income tax expense | 104,459 |
| | 23,433 |
| | 159,016 |
| | 71,254 |
|
| | | | | | | | |
| Income tax expense | (490 | ) | | (263 | ) | | (651 | ) | | (1,049 | ) |
| | | | | | | | |
| Net income | 103,969 |
| | 23,170 |
| | 158,365 |
| | 70,205 |
|
| | | | | | | | |
| Net (income) loss attributable to noncontrolling interests | (24 | ) | | 5 |
| | 18 |
| | 71 |
|
| | | | | | | | |
| Net income attributable to Sabra Health Care REIT, Inc. | 103,945 |
| | 23,175 |
| | 158,383 |
| | 70,276 |
|
| | | | | | | | |
| Preferred stock dividends | (2,560 | ) | | (2,560 | ) | | (10,242 | ) | | (10,242 | ) |
| | | | | | | | |
| Net income attributable to common stockholders | $ | 101,385 |
| | $ | 20,615 |
| | $ | 148,141 |
| | $ | 60,034 |
|
| | | | | | | | |
| Net income attributable to common stockholders, per: | | | | | | | |
| | | | | | | | |
| Basic common share | $ | 0.57 |
| | $ | 0.32 |
| | $ | 1.40 |
| | $ | 0.92 |
|
| | | | | | | | |
| Diluted common share | $ | 0.57 |
| | $ | 0.31 |
| | $ | 1.40 |
| | $ | 0.92 |
|
| | | | | | | | |
| Weighted-average number of common shares outstanding, basic | 178,234,481 |
| | 65,286,722 |
| | 105,621,242 |
| | 65,284,251 |
|
| | | | | | | | |
| Weighted-average number of common shares outstanding, diluted | 178,428,200 |
| | 65,671,345 |
| | 105,842,434 |
| | 65,520,672 |
|
| | | | | | | | |
|
| | |
| See reporting definitions. | 5 |
SABRA HEALTH CARE REIT, INC.
CONSOLIDATED BALANCE SHEETS
(dollars in thousands, except per share data)
|
| | | | | | | |
| | December 31, |
| | 2017 | | 2016 |
| Assets | | | |
| Real estate investments, net of accumulated depreciation of $340,423 and $282,812 as of December 31, 2017 and 2016, respectively | $ | 5,994,432 |
| | $ | 2,009,939 |
|
| Loans receivable and other investments, net | 114,390 |
| | 96,036 |
|
| Cash and cash equivalents | 518,632 |
| | 25,663 |
|
| Restricted cash | 68,817 |
| | 9,002 |
|
| Lease intangible assets, net | 167,119 |
| | 26,250 |
|
| Accounts receivable, prepaid expenses and other assets, net | 168,887 |
| | 99,029 |
|
| Total assets | $ | 7,032,277 |
| | $ | 2,265,919 |
|
| | | | |
| Liabilities | | | |
| Secured debt, net | $ | 256,430 |
| | $ | 160,752 |
|
| Revolving credit facility | 641,000 |
| | 26,000 |
|
| Term loans, net | 1,190,774 |
| | 335,673 |
|
| Senior unsecured notes, net | 1,306,286 |
| | 688,246 |
|
| Accounts payable and accrued liabilities | 102,523 |
| | 39,639 |
|
| Lease intangible liabilities, net | 98,015 |
| | — |
|
| Total liabilities | 3,595,028 |
| | 1,250,310 |
|
| | | | |
| Equity | | | |
| Preferred stock, $.01 par value; 10,000,000 shares authorized, 5,750,000 shares issued and outstanding as of December 31, 2017 and 2016 | 58 |
| | 58 |
|
| Common stock, $.01 par value; 250,000,000 shares authorized, 178,255,843 and 65,285,614 shares issued and outstanding as of December 31, 2017 and 2016, respectively | 1,783 |
| | 653 |
|
| Additional paid-in capital | 3,636,913 |
| | 1,208,862 |
|
| Cumulative distributions in excess of net income | (217,236 | ) | | (192,201 | ) |
| Accumulated other comprehensive income (loss) | 11,289 |
| | (1,798 | ) |
| Total Sabra Health Care REIT, Inc. stockholders’ equity | 3,432,807 |
| | 1,015,574 |
|
| Noncontrolling interests | 4,442 |
| | 35 |
|
| Total equity | 3,437,249 |
| | 1,015,609 |
|
| Total liabilities and equity | $ | 7,032,277 |
| | $ | 2,265,919 |
|
|
| | |
| See reporting definitions. | 6 |
SABRA HEALTH CARE REIT, INC.
CONSOLIDATED STATEMENTS OF CASH FLOWS
(in thousands)
|
| | | | | | | |
| | Year Ended December 31, |
| | 2017 | | 2016 |
| Cash flows from operating activities: | | | |
| Net income | $ | 158,365 |
| | $ | 70,205 |
|
| Adjustments to reconcile net income to net cash provided by operating activities: | | | |
| Depreciation and amortization | 113,882 |
| | 68,472 |
|
| Amortization of above and below market lease intangibles, net | (912 | ) | | — |
|
| Non-cash interest income adjustments | (769 | ) | | 582 |
|
| Non-cash interest expense | 7,776 |
| | 5,678 |
|
| Stock-based compensation expense | 8,359 |
| | 7,496 |
|
| Loss on extinguishment of debt | 553 |
| | 556 |
|
| Straight-line rental income adjustments | (29,440 | ) | | (21,984 | ) |
| Provision for doubtful accounts and loan losses | 17,113 |
| | 5,543 |
|
| Change in fair value of contingent consideration | (426 | ) | | (1,526 | ) |
| Net (gain) loss on sales of real estate | (52,029 | ) | | 6,122 |
|
| Impairment of real estate | 1,326 |
| | 29,811 |
|
| Changes in operating assets and liabilities: | | | |
| Accounts receivable, prepaid expenses and other assets | (16,734 | ) | | (1,981 | ) |
| Accounts payable and accrued liabilities | (67,257 | ) | | 11,462 |
|
| Restricted cash | (6,321 | ) | | (3,697 | ) |
| Net cash provided by operating activities | 133,486 |
| | 176,739 |
|
| Cash flows from investing activities: | | | |
| Acquisition of real estate | (419,905 | ) | | (153,579 | ) |
| Cash received in CCP merger | 77,859 |
| | — |
|
| Origination and fundings of loans receivable | (17,239 | ) | | (9,675 | ) |
| Origination and fundings of preferred equity investments | (2,749 | ) | | (7,348 | ) |
| Additions to real estate | (6,954 | ) | | (1,003 | ) |
| Repayment of loans receivable | 32,430 |
| | 215,962 |
|
| Repayment of preferred equity investments | 3,755 |
| | — |
|
| Net proceeds from sale of real estate | 92,731 |
| | 98,006 |
|
| Net cash (used in) provided by investing activities | (240,072 | ) | | 142,363 |
|
| Cash flows from financing activities: | | | |
| Net proceeds from (repayments of) revolving credit facility | 253,000 |
| | (229,000 | ) |
| Proceeds from term loans | 181,000 |
| | 69,360 |
|
| Principal payments on secured debt | (4,145 | ) | | (14,768 | ) |
| Payments of deferred financing costs | (15,337 | ) | | (5,937 | ) |
| Payment of contingent consideration | (382 | ) | | — |
|
| Distributions to noncontrolling interests | (30 | ) | | — |
|
| Issuance of common stock, net | 366,800 |
| | (1,289 | ) |
| Dividends paid on common and preferred stock | (182,089 | ) | | (119,264 | ) |
| Net cash provided by (used in) financing activities | 598,817 |
| | (300,898 | ) |
| Net increase in cash and cash equivalents | 492,231 |
| | 18,204 |
|
| Effect of foreign currency translation on cash and cash equivalents | 738 |
| | 25 |
|
| Cash and cash equivalents, beginning of period | 25,663 |
| | 7,434 |
|
| Cash and cash equivalents, end of period | $ | 518,632 |
| | $ | 25,663 |
|
|
| | |
| See reporting definitions. | 7 |
SABRA HEALTH CARE REIT, INC.
CONSOLIDATED STATEMENTS OF CASH FLOWS (CONTINUED)
(in thousands)
|
| | | | | | | |
| | Year Ended December 31, |
| | 2017 | | 2016 |
| Supplemental disclosure of cash flow information: | | | |
| Interest paid | $ | 69,686 |
| | $ | 59,234 |
|
| Income taxes paid | $ | 714 |
| | $ | 854 |
|
| Supplemental disclosure of non-cash investing and financing activities: | | | |
| Acquisition of business in CCP merger | $ | 3,726,092 |
| | $ | — |
|
| Assumption of indebtedness in CCP merger | $ | (1,751,373 | ) | | $ | — |
|
| Stock exchanged in CCP merger | $ | (2,052,578 | ) | | $ | — |
|
| Real estate acquired through loan receivable foreclosure | $ | 19,096 |
| | $ | 10,100 |
|
| Proceeds from sale of real estate held by exchange accommodation titleholder variable interest entities | $ | 57,512 |
| | $ | — |
|
| Decrease in loans receivable and other investments due to acquisition of real estate | $ | (6,913 | ) | | $ | — |
|
|
| | |
| See reporting definitions. | 8 |
SABRA HEALTH CARE REIT, INC.
CAPITALIZATION
(dollars in thousands, except per share amounts) |
| | | | | | | |
| | December 31, |
| Debt | 2017 | | 2016 |
| Secured debt | $ | 259,202 |
| | $ | 163,638 |
|
| Revolving credit facility | 641,000 |
| | 26,000 |
|
| Term loans | 1,199,587 |
| | 338,000 |
|
| Senior unsecured notes | 1,300,000 |
| | 700,000 |
|
| | | | |
| Total Debt | 3,399,789 |
| | 1,227,638 |
|
| Deferred financing costs and premiums/discounts, net | (5,299 | ) | | (16,967 | ) |
| Total Debt, Net | $ | 3,394,490 |
| | $ | 1,210,671 |
|
|
| | | | | | | |
| | December 31, |
| Revolving Credit Facility | 2017 | | 2016 |
| Credit facility availability | $ | 359,000 |
| | $ | 474,000 |
|
| Credit facility capacity | 1,000,000 |
| | 500,000 |
|
|
| | | | | | | | | | |
| Enterprise Value | | | | | |
| As of December 31, 2017 | Shares Outstanding | | Price | | Value |
| Common stock | 178,255,843 |
| | $ | 18.77 |
| | $ | 3,345,862 |
|
| Preferred stock | 5,750,000 |
| | 25.43 |
| | 146,223 |
|
| Total Debt | | | | | 3,399,789 |
|
| Cash and cash equivalents | | | | | (518,632 | ) |
| | | | | | |
| Total Enterprise Value | | | | | $ | 6,373,242 |
|
| | | | | | |
| As of December 31, 2016 | Shares Outstanding | | Price | | Value |
| Common stock | 65,285,614 |
| | $ | 24.42 |
| | $ | 1,594,275 |
|
| Preferred stock | 5,750,000 |
| | 25.15 |
| | 144,613 |
|
| Total Debt | | | | | 1,227,638 |
|
| Cash and cash equivalents | | | | | (25,663 | ) |
| | | | | | |
| Total Enterprise Value | | | | | $ | 2,940,863 |
|
|
| | | | | | | | | | | | |
| Common Stock and Equivalents | | | | | | | | |
| | | Weighted Average Common Shares |
| | | Three Months Ended December 31, 2017 | | Year Ended December 31, 2017 |
| | | EPS, FFO and Normalized FFO | | AFFO and
Normalized AFFO | | EPS, FFO and Normalized FFO | | AFFO and
Normalized AFFO |
| Common stock | | 178,206,383 |
| | 178,206,383 |
| | 105,595,606 |
| | 105,595,606 |
|
| Common equivalents | | 28,098 |
| | 28,098 |
| | 25,636 |
| | 25,636 |
|
| | | | | | | | | |
| Basic common and common equivalents | | 178,234,481 |
| | 178,234,481 |
| | 105,621,242 |
| | 105,621,242 |
|
| Dilutive securities: | | | | | | | | |
| Restricted stock and units | | 193,572 |
| | 412,671 |
| | 220,880 |
| | 453,312 |
|
| Options | | 147 |
| | 147 |
| | 312 |
| | 308 |
|
| | | | | | | | | |
| Diluted common and common equivalents | | 178,428,200 |
| | 178,647,299 |
| | 105,842,434 |
| | 106,074,862 |
|
|
| | |
| See reporting definitions. | 9 |
SABRA HEALTH CARE REIT, INC.
INDEBTEDNESS
December 31, 2017
(dollars in thousands)
|
| | | | | | | | | |
| | Principal | | Weighted Average Effective Rate(1) | | % of Total |
| Fixed Rate Debt | | | | | |
| Secured debt | $ | 160,702 |
| | 3.87 | % | | 4.7 | % |
| Unsecured senior notes | 1,300,000 |
| | 5.33 | % | | 38.2 | % |
| | | | | | |
| Total fixed rate debt | 1,460,702 |
| | 5.17 | % | | 42.9 | % |
Variable Rate Debt (2) | | | | | |
| Secured debt | 98,500 |
| | 3.36 | % | | 2.9 | % |
| Revolving credit facility | 641,000 |
| | 2.81 | % | | 18.9 | % |
| Term loans | 1,199,587 |
| | 2.74 | % | | 35.3 | % |
| | | | | | |
| Total variable rate debt | 1,939,087 |
| | 2.79 | % | | 57.1 | % |
| | | | | | |
| Total Debt | $ | 3,399,789 |
| | 3.81 | % | | 100.0 | % |
| | | | | | |
| Secured Debt | $ | 259,202 |
| | 3.68 | % | | 7.6 | % |
| Unsecured Debt | | | | | |
| Unsecured senior notes | 1,300,000 |
| | 5.33 | % | | 38.2 | % |
| Revolving credit facility | 641,000 |
| | 2.81 | % | | 18.9 | % |
| Term loans | 1,199,587 |
| | 2.74 | % | | 35.3 | % |
| | | | | | |
| Total unsecured debt | 3,140,587 |
| | 3.83 | % | | 92.4 | % |
| | | | | | |
| Total Debt | $ | 3,399,789 |
| | 3.81 | % | | 100.0 | % |
| |
(1) | Weighted average effective interest rate includes private mortgage insurance and impact of interest rate swap agreements. |
| |
(2) | Term loans include $845.0 million subject to swap agreements that fix LIBOR a weighted average rate of 1.19%, and $71.7 million (CAD $90.0 million) and $27.9 million (CAD $35.0 million) subject to swap agreements that fix CDOR at 1.59% and 0.93%, respectively. Excluding these amounts, variable rate debt was 29.3% of total debt as of December 31, 2017. |
|
| | | | | | | | | | | | | | | | | | | | | | | | | | | | | | | | | | |
| Maturities | Secured Debt | | Unsecured Senior Notes | | Term Loans | | Revolving Credit Facility (1) | | Total |
| | Principal | | Rate (2) | | Principal | | Rate (2) | | Principal | | Rate (2) | | Principal | | Rate (2) | | Principal | | Rate |
| 2018 | $ | 4,301 |
| | 3.43 | % | | $ | — |
| | — |
| | $ | — |
| | — |
| | $ | — |
| | — |
| | $ | 4,301 |
| | 3.43 | % |
| 2019 | 102,945 |
| | 3.41 | % | | — |
| | — |
| | — |
| | — |
| | — |
| | — |
| | 102,945 |
| | 3.41 | % |
| 2020 | 4,594 |
| | 3.46 | % | | — |
| | — |
| | 200,000 |
| | 3.01 | % | | — |
| | — |
| | 204,594 |
| | 3.02 | % |
| 2021 | 20,482 |
| | 3.46 | % | | 500,000 |
| | 5.50 | % | | — |
| | — |
| | 641,000 |
| | 2.81 | % | | 1,161,482 |
| | 3.98 | % |
| 2022 | 4,285 |
| | 3.44 | % | | — |
| | — |
| | 999,587 |
| | 2.99 | % | | — |
| | — |
| | 1,003,872 |
| | 3.00 | % |
| 2023 | 4,427 |
| | 3.45 | % | | 200,000 |
| | 5.38 | % | | — |
| | — |
| | — |
| | — |
| | 204,427 |
| | 5.33 | % |
| 2024 | 4,573 |
| | 3.45 | % | | — |
| | — |
| | — |
| | — |
| | — |
| | — |
| | 4,573 |
| | 3.45 | % |
| 2025 | 4,725 |
| | 3.46 | % | | — |
| | — |
| | — |
| | — |
| | — |
| | — |
| | 4,725 |
| | 3.46 | % |
| 2026 | 4,882 |
| | 3.47 | % | | 500,000 |
| | 5.13 | % | | — |
| | — |
| | — |
| | — |
| | 504,882 |
| | 5.11 | % |
| 2027 | 5,044 |
| | 3.48 | % | | 100,000 |
| | 5.38 | % | | — |
| | — |
| | — |
| | — |
| | 105,044 |
| | 5.29 | % |
| Thereafter | 98,944 |
| | 3.60 | % | | — |
| | — |
| | — |
| | — |
| | — |
| | — |
| | 98,944 |
| | 3.60 | % |
| Total Debt | 259,202 |
| | | | 1,300,000 |
| | | | 1,199,587 |
| | | | 641,000 |
| | | | 3,399,789 |
| | |
| Premium, net | — |
| | | | 15,915 |
| | | | — |
| | | | — |
| | | | 15,915 |
| | |
| Deferred financing costs, net | (2,772 | ) | | | | (9,629 | ) | | | | (8,813 | ) | | | | — |
| | | | (21,214 | ) | | |
| Total Debt, Net | $ | 256,430 |
| | | | $ | 1,306,286 |
| | | | $ | 1,190,774 |
| | | | $ | 641,000 |
| | | | $ | 3,394,490 |
| | |
| Wtd. avg. maturity/yrs. | 15.1 |
| | | | 6.1 |
| | | | 4.3 |
| | | | 3.6 |
| | | | 5.7 |
| | |
Wtd. avg. effective interest rate(3) | 3.68 | % | | | | 5.33 | % | | | | 2.74 | % | | | | 2.81 | % | | | | 3.81 | % | | |
(1) Revolving Credit Facility is subject to two six-month extension options.
(2) Represents actual contractual interest rates excluding private mortgage insurance and impact of interest rate swap agreements.
(3) Weighted average effective interest rate includes private mortgage insurance and impact of interest rate swap agreements.
|
| | |
| See reporting definitions. | 10 |
SABRA HEALTH CARE REIT, INC.
KEY CREDIT STATISTICS (1)
|
| | | | | | | | | |
| | | December 31, 2016 | | December 31, 2017 | | Pro Forma as of December 31, 2017 (2) |
| Net Debt to Adjusted EBITDA | | 5.22x |
| | 4.69x (3) |
| | 5.49x (4) |
|
| Net Debt to Adjusted EBITDA - Incl. Unconsolidated Joint Venture | | NA |
| | NA |
| | 5.94x (4) |
|
| Interest Coverage | | 4.00x |
| | 4.55x |
| | 4.20x |
|
| Fixed Charge Coverage Ratio | | 3.20x |
| | 4.07x |
| | 3.80x |
|
| Total Debt/Asset Value | | 43 | % | | 44 | % | | 50 | % |
| Secured Debt/Asset Value | | 6 | % | | 3 | % | | 8 | % |
| Unencumbered Assets/Unsecured Debt | | 247 | % | | 232 | % | | 220 | % |
| | | | | | | |
Cost of Permanent Debt (5) | | 4.55 | % | | 4.05 | % | | 4.04 | % |
| | | | | | | |
| Unsecured Notes Ratings (S&P, Fitch, Moody's) | | BB- / BB+ / Ba3 |
| | BBB- / BBB- / Ba1 |
| | BBB- / BBB- / Ba1 |
|
| |
(1) | Key credit statistics (except net debt to adjusted EBITDA) are calculated in accordance with the credit agreement relating to the revolving credit facility and the indentures relating to our unsecured senior notes. |
| |
(2) | Pro forma information assumes that the investment activity after the quarter ended December 31, 2017 as described on pages 25-26 of this Supplement, the remaining CCP and Genesis rent reductions and the transition of five skilled nursing/transitional care facilities to an existing Sabra operator were completed as of December 31, 2017. |
| |
(3) | Net Debt to Adjusted EBITDA as of December 31, 2017 is calculated based on Annualized Adjusted EBITDA, which is Adjusted EBITDA, as adjusted for annualizing adjustments that give effect to the acquisitions and dispositions completed during the year ended December 31, 2017 as though such acquisitions and dispositions were completed as of January 1, 2017. See "Reconciliations of Non-GAAP Financial Measures" on our website at http://www.sabrahealth.com/investors/financials/reports-presentations/non-gaap for additional information. |
(4) Pro Forma Net Debt to Adjusted EBITDA as of December 31, 2017 is calculated based on Pro Forma Annualized Adjusted EBITDA, which includes Annualized Adjusted EBITDA and assumes that the Enlivant and North American Healthcare acquisitions completed subsequent to December 31, 2017 (see pages 25-26), the previously announced rent repositioning program for certain of our tenants who were legacy tenants of CCP, the rent reductions for Genesis and the transition of five skilled nursing/transitional care facilities to an existing Sabra operator were completed as of January 1, 2017. Pro Forma Net Debt to Adjusted EBITDA - Incl. Unconsolidated Joint Venture as of December 31, 2017 is calculated based on Pro Forma Annualized Adjusted EBITDA, as adjusted, which includes Pro Forma Annualized Adjusted EBITDA and is further adjusted to include the Company's share of the unconsolidated joint venture interest expense. See "Reconciliations of Non-GAAP Financial Measures" on our website at http://www.sabrahealth.com/investors/financials/reports-presentations/non-gaap for additional information.
| |
(5) | Excludes revolving credit facility balance which had an interest rate of 2.81% and 2.77% as of December 31, 2017 and 2016, respectively. Pro Forma costs of permanent debt as of December 31, 2017 includes the Company's share of the unconsolidated joint venture debt. |
|
| | |
| See reporting definitions. | 11 |
SABRA HEALTH CARE REIT, INC.
COMPONENTS OF NET ASSET VALUE (NAV)
December 31, 2017
(dollars in thousands)
We disclose components of our business relevant to calculate NAV. We consider NAV to be a useful supplemental measure that assists both management and investors to estimate the fair value of our Company. The calculation of NAV involves significant estimates and can be calculated using various methods. Each individual investor must determine the specific methodology, assumptions and estimates to use to arrive at an estimated NAV of the Company.
The components of NAV do not consider the potential changes in revenue streams or our investment portfolio. The components include non-GAAP financial measures, such as Cash NOI. Although these measures are not presented in accordance with GAAP, investors can use these non-GAAP financial measures as supplemental information to evaluate our business.
|
| | | | | | | | |
Pro Forma Annualized Cash NOI (1) | | | | | |
| Skilled Nursing/Transitional Care | | $ | 387,728 |
| | 43,223 |
| beds |
| Senior Housing - Leased | | 83,702 |
| | 8,137 |
| units |
| Senior Housing - Managed | | 65,637 |
| | 1,113 |
| units |
| Specialty Hospitals and Other | | 46,949 |
| | 1,085 |
| beds |
| Pro forma Annualized Cash NOI (Excluding Loans Receivable and Other Investments) | | $ | 584,016 |
| | | |
| | | | | | |
| | | | | | |
| Obligations | | | | | |
Secured debt (2) | | $ | 259,202 |
| | | |
Unsecured senior notes (2) | | 1,300,000 |
| | | |
Revolving credit facility (3) | | 659,000 |
| | | |
Term loans (2) | | 1,199,587 |
| | | |
Sabra's share of unconsolidated JV debt (4) | | 387,731 |
| | | |
| Total Debt | | 3,805,520 |
| | | |
| Add (less): | | | | | |
Cash and cash equivalents and restricted cash (3) | | (71,593 | ) | | | |
| Accounts payable and accrued liabilities | | 102,523 |
| | | |
| Preferred stock | | 146,223 |
| | | |
| Net obligations | | $ | 3,982,673 |
| | | |
| | | | | | |
| Other Assets | | | | | |
| Loans receivable and other investments, net | | $ | 114,390 |
| | | |
Accounts receivable, prepaid expenses and other assets, net (5) | | 45,093 |
| | | |
| Total other assets | | $ | 159,483 |
| | | |
| | | | | | |
| Common Shares Outstanding | | 178,255,843 |
| | | |
| |
(1) | Assumes the Enlivant and North American Healthcare acquisitions completed subsequent to December 31, 2017 (see pages 25-26), the previously announced rent repositioning program for certain of our tenants who were legacy tenants of CCP, the rent reductions for Genesis and the transition of five skilled nursing/transitional care facilities to an existing Sabra operator were completed at the beginning of the period presented. |
| |
(2) | Amounts represent principal amounts due and exclude deferred financing costs, net and premiums/discounts, net. |
| |
(3) | Reflects financing of Enlivant and North American Healthcare acquisitions completed subsequent to December 31, 2017 with $515.8 million of cash and $18.0 million of proceeds from our revolving credit facility as though they were completed at the beginning of the period presented. |
| |
(4) | Represents Sabra's share of unconsolidated joint venture debt as though our investment in the Enlivant joint venture was completed at the beginning of the period presented. |
| |
(5) | Includes assets that impact cash or NOI and excludes non-cash items. |
|
| | |
| See reporting definitions. | 12 |
SABRA HEALTH CARE REIT, INC.
PORTFOLIO SUMMARY
December 31, 2017
(dollars in thousands)
|
| | | | | | | | | | | | | | | | | | |
| Total Property Portfolio | | | | | | Cash NOI | | Number of Beds/Units |
| | | Number of Properties | | | | Three Months Ended December 31, | |
| Property Type | | | Investment | | 2017 | | 2016 | |
| Skilled Nursing/Transitional Care | | 384 |
| | $ | 4,364,387 |
| | $ | 105,940 |
| | $ | 32,003 |
| | 43,223 |
|
| Senior Housing - Leased | | 88 |
| | 1,166,687 |
| | 20,551 |
| | 19,296 |
| | 8,137 |
|
| Senior Housing - Managed | | 13 |
| | 189,120 |
| | 2,659 |
| | 530 |
| | 1,113 |
|
| Specialty Hospitals and Other | | 22 |
| | 614,068 |
| | 11,699 |
| | 1,260 |
| | 1,085 |
|
Total | | 507 |
| | $ | 6,334,262 |
| | $ | 140,849 |
| | $ | 53,089 |
| | 53,558 |
|
|
| | | | | | | | | | | |
Same Store Property Portfolio (1)
| | | | Cash NOI |
| | | | | Three Months Ended December 31, |
| Property Type | | Number of
Properties | | 2017 | | 2016 |
| Skilled Nursing/Transitional Care | | 69 |
| | $ | 29,219 |
| | $ | 27,219 |
|
| Senior Housing - Leased | | 63 |
| | 16,649 |
| | 16,967 |
|
| Senior Housing - Managed | | 2 |
| | 527 |
| | 530 |
|
| Specialty Hospitals and Other | | 1 |
| | 1,291 |
| | 1,260 |
|
| Total | | 135 |
| | $ | 47,686 |
| | $ | 45,976 |
|
|
| | | | | | | | | | | | | | | | | | | | |
Operating Statistics (2)
| | Coverage | | | | | | | | |
| | | EBITDAR | | EBITDARM | | Occupancy Percentage | | Skilled Mix |
| | | Twelve Months Ended December 31, |
| Property Type | | 2017 | | 2016 | | 2017 | | 2016 | | 2017 | | 2016 | | 2017 | | 2016 |
| Skilled Nursing/Transitional Care | | 1.36x | | 1.49x | | 1.70x | | 1.82x | | 84.0 | % | | 86.5 | % | | 39.5 | % | | 40.5 | % |
| Senior Housing - Leased | | 1.12x | | 1.22x | | 1.30x | | 1.40x | | 87.8 | % | | 89.5 | % | | NA |
| | NA |
|
| Senior Housing - Managed | | NA | | NA | | NA | | NA | | 90.6 | % | | 75.5 | % | | NA |
| | NA |
|
| Specialty Hospitals and Other | | 2.87x | | 3.27x | | 3.24x | | 3.72x | | 79.2 | % | | 69.7 | % | | NA |
| | NA |
|
|
| | | | | | | | | | | | | | | | | | | | |
Same Store Operating Statistics (3)
| | Coverage | | | | | | | | |
| | | EBITDAR | | EBITDARM | | Occupancy Percentage | | Skilled Mix |
| | | Twelve Months Ended December 31, |
| Property Type | | 2017 | | 2016 | | 2017 | | 2016 | | 2017 | | 2016 | | 2017 | | 2016 |
| Skilled Nursing/Transitional Care | | 1.46x | | 1.49x | | 1.79x | | 1.83x | | 85.5 | % | | 87.4 | % | | 39.8 | % | | 42.1 | % |
| Senior Housing - Leased | | 1.23x | | 1.26x | | 1.39x | | 1.43x | | 88.3 | % | | 89.6 | % | | N/A | | N/A |
| Senior Housing - Managed | | NA | | NA | | NA | | NA | | 68.5 | % | | 65.7 | % | | NA | | NA |
| Specialty Hospitals and Other | | 2.84x | | 3.27x | | 3.29x | | 3.72x | | 70.1 | % | | 69.7 | % | | NA | | NA |
| |
(1) | Same store property portfolio includes all facilities owned for the full period in both comparison periods. |
| |
(2) | EBITDAR Coverage, EBITDARM Coverage, Occupancy Percentage and Skilled Mix (collectively, “Operating Statistics”) for each period presented include only Stabilized Facilities owned by the Company as of the end of the respective period. Operating Statistics are only included in periods subsequent to our acquisition and are presented one quarter in arrears, except for Senior Housing - Managed communities. As such, Operating Statistics exclude assets, other than Senior Housing - Managed communities, acquired after September 30, 2017. See also Pro Forma Operating Statistics on page 15. |
| |
(3) | Same store Operating Statistics are presented for Stabilized Facilities owned for the full period in both comparison periods and are presented one quarter in arrears, except for Senior Housing - Managed communities. |
|
| | |
| See reporting definitions. | 13 |
SABRA HEALTH CARE REIT, INC.
PORTFOLIO SUMMARY (CONTINUED)
December 31, 2017
(dollars in thousands)
|
| | | | | | | | | | |
Pro Forma Top 10 Relationships (1) | | | | | | | | |
| | |
| Twelve Months Ended December 31, 2017 |
| Tenant | | Primary Facility Type | | Number of Properties |
| Lease Coverage (2) |
| % of Pro Forma Annualized Cash NOI |
| Senior Care Centers | | Skilled Nursing | | 38 |
|
| 1.05x |
| 9.8 | % |
| Enlivant | | Assisted Living |
| 183 |
|
| NA |
| 9.2 | % |
Genesis Healthcare, Inc. (3) | | Skilled Nursing | | 54 |
|
| 1.25x |
| 8.6 | % |
Avamere Family of Companies (4)
| | Skilled Nursing |
| 29 |
|
| 1.27x |
| 6.7 | % |
| Signature Healthcare | | Skilled Nursing |
| 47 |
|
| 1.26x |
| 5.9 | % |
Holiday AL Holdings LP (4) (5) | | Independent Living |
| 21 |
|
| 1.11x |
| 5.7 | % |
North American Healthcare (6) | | Skilled Nursing |
| 23 |
|
| 1.42x |
| 5.6 | % |
| Signature Behavioral | | Behavioral Hospitals |
| 6 |
|
| 1.70x |
| 5.1 | % |
| Cadia Healthcare | | Skilled Nursing |
| 9 |
|
| 1.70x |
| 4.8 | % |
| The McGuire Group | | Skilled Nursing |
| 7 |
|
| 1.64x |
| 2.5 | % |
|
| | | | | | | | | | |
Pro Forma Operating Statistics (7) | | | | | | | | |
| | | Twelve Months Ended December 31, 2017 |
| | | Coverage | | | | |
| Property Type | | EBITDAR | | EBITDARM | | Occupancy Percentage | | Skilled Mix |
| Skilled Nursing/Transitional Care | | 1.38x | | 1.87x | | 81.6 | % | | 37.4 | % |
| Senior Housing - Leased | | 1.09x | | 1.26x | | 87.3 | % | | NA |
|
| Senior Housing - Managed | | NA | | NA | | 83.2 | % | | NA |
|
| Specialty Hospitals and Other | | 3.60x | | 3.91x | | 79.3 | % | | NA |
|
|
| | | | | | | | | | | | | |
Pro Forma Senior Housing - Managed Portfolio (8) | | |
| | | As of December 31, 2017 | | Three Months Ended December 31, 2017 |
| | | Number of Properties | | Number of Units | | Investment | | Occupancy Percentage |
| Wholly-Owned | | | | | | | | |
| AL | | 16 |
| | 988 |
| | $ | 182,317 |
| | 86.4 | % |
| IL | | 8 |
| | 756 |
| | 131,003 |
| | 101.9 | % |
| | | 24 |
| | 1,744 |
| | 313,320 |
| | 93.0 | % |
| Sabra's Share of Unconsolidated JV | | | | | | | | |
| AL | | 172 |
| | 7,652 |
| | 729,218 |
| | 81.3 | % |
| Total | | 196 |
| | 9,396 |
| | $ | 1,042,538 |
| | 85.1 | % |
| Operator | | | | | | | | |
| Enlivant | | 183 |
| | 8,283 |
| | $ | 853,419 |
| | 82.8 | % |
| Sienna | | 9 |
| | 865 |
| | 133,797 |
| | 101.5 | % |
| Other | | 4 |
| | 248 |
| | 55,322 |
| | 68.4 | % |
| Total | | 196 |
| | 9,396 |
| | $ | 1,042,538 |
| | 85.1 | % |
| |
(1) | Pro forma top 10 relationship assumes the Enlivant and North American Healthcare acquisitions completed subsequent to December 31, 2017 (see pages 25-26), the previously announced rent repositioning program for certain of our tenants who were legacy tenants of CCP, the rent reductions for Genesis and the transition of five Skilled Nursing/Transitional Care facilities to an existing Sabra operator were completed at the beginning of the period presented. |
| |
(2) | Lease Coverage is defined as the EBITDAR Coverage for Stabilized Facilities operated by the applicable tenant, unless there is a corporate guarantee and the guarantor level fixed charge coverage is a more meaningful indicator of the tenant’s ability to make rent payments. Lease Coverage is for the twelve months ended December 31, 2017 and is presented one quarter in arrears. Lease Coverage for legacy CCP tenants is presented as if these real estate investments were owned by Sabra during the entire period presented and reflects the previously announced rent repositioning program for certain of our tenants who were legacy tenants of CCP and rent reductions for Genesis. |
| |
(3) | Lease Coverage reflects guarantor level fixed charge coverage, pro forma for rent reductions from Sabra and other Genesis landlords and the impact of recent refinancings. |
| |
(4) | Lease Coverage reflects guarantor level fixed charge coverage for these relationships. |
| |
(5) | The Holiday AL Holdings LP portfolio consists of 21 independent living communities which the Company underwrote at a 1.10x EBITDAR Coverage. |
| |
(6) | The North American Healthcare portfolio coverage is presented at the underwritten stabilized Lease Coverage level. |
| |
(7) | Pro forma Operating Statistics include properties acquired in the CCP merger that would be considered stabilized during the period presented and the North American Healthcare portfolio as if they were acquired at the beginning of the period presented. Occupancy Percentage for Senior Housing - Managed Operating is pro forma for Enlivant. Statistics are presented one quarter in arrears, except for Senior Housing - Managed communities. |
| |
(8) | Pro forma Senior Housing - Managed Portfolio assumes the Enlivant acquisition completed subsequent to December 31, 2017 (see page 26) was completed at the beginning of the period presented. |
|
| | |
| See reporting definitions. | 14 |
SABRA HEALTH CARE REIT, INC.
PORTFOLIO SUMMARY (CONTINUED)
December 31, 2017
(dollars in thousands)
Loans Receivable and Other Investments
|
| | | | | | | | | | | | | | | | | | | | | | | | | |
| Loan Type | | Number of Loans | | Property Type | | Principal Balance as of December 31, 2017 | | Book Value
as of
December 31, 2017 | | Weighted Average Contractual Interest Rate | | Weighted Average Annualized Effective Interest Rate | | Interest Income Three Months Ended December 31, 2017 (1) | | Maturity Date |
| Mortgage | | 2 |
| | Skilled Nursing / Senior Housing | | $ | 13,366 |
| | $ | 12,351 |
| | 9.9 | % | | 11.3 | % | | $ | 360 |
| | 12/31/18- 01/31/27 |
| Construction | | 2 |
| | Senior Housing | | 2,667 |
| | 2,733 |
| | 8.0 | % | | 7.7 | % | | 52 |
| | 03/31/21- 05/31/22 |
| Mezzanine | | 2 |
| | Senior Housing | | 32,468 |
| | 10,239 |
| | 10.2 | % | | 19.2 | % | | 435 |
| | 02/28/18- 05/25/20 |
| Pre-development | | 1 |
| | Senior Housing | | 2,357 |
| | 2,357 |
| | 9.0 | % | | 8.4 | % | | 54 |
| | 04/01/20 |
| Other | | 15 |
| | Multiple | | 40,422 |
| | 38,324 |
| | 8.8 | % | | 10.1 | % | | 777 |
| | 2/28/18- 04/30/27 |
| | | | | | | | | | | | | | | | | |
| | | 22 |
| | | | 91,280 |
| | 66,004 |
| | 9.4 | % | | 11.6 | % | | $ | 1,678 |
| | |
| | | | | | | | | | | | | | | | | |
| Loan loss reserve | | | | | | — |
| | (97 | ) | | | | | | | | |
| | | | | | | $ | 91,280 |
| | $ | 65,907 |
| | | | | | | | |
|
| | | | | | | | | | | | | | | | | | | | | | | |
| Other Investment Type | | Number of Investments | | Property Type | | Total Funding Commitments | | Amount Funded as of December 31, 2017 | | Book Value as of December 31, 2017 | | Rate of Return | | Other Income Three Months Ended December 31, 2017 (1) |
| Preferred Equity | | 12 | | Skilled Nursing / Senior Housing | | $ | 38,850 |
| | $ | 38,850 |
| | $ | 48,483 |
| | 12.6 | % | | $ | 1,487 |
|
| |
(1) | Includes income related to loans receivable and other investments held as of December 31, 2017. |
|
| | |
| See reporting definitions. | 15 |
SABRA HEALTH CARE REIT, INC.
PORTFOLIO SUMMARY (CONTINUED)
December 31, 2017
(dollars in thousands)
Proprietary Development Pipeline (1)
|
| | | | | | | | | | | | | | | | | | | | | | | | | | | | | | | | | | | | |
| | | Investment Type | | Property Type | | Investment Amount (2) | | Estimated Real Estate Value Upon Completion | | Weighted Average Initial Cash Lease Yield | | Certificate of Occupancy Timing (3) |
| State | | Loan | | Preferred Equity | | Forward Commitment | | Skilled Nursing/ Transitional Care | | Senior Housing | | Skilled Nursing/ Transitional Care | | Senior Housing | | Skilled Nursing/ Transitional Care | | Senior Housing | | |
| Colorado | | 1 |
| | — |
| | — |
| | — |
| | 1 |
| | $ | — |
| | $ | 2,357 |
| | $ | — |
| | $ | 33,000 |
| | 8.0 | % | | Q4 2017 |
| Florida | | — |
| | — |
| | 1 |
| | — |
| | 1 |
| | — |
| | — |
| | — |
| | 24,365 |
| | 7.5 | % | | Q1 2018 |
| Indiana | | — |
| | 4 |
| | — |
| | — |
| | 4 |
| | — |
| | 16,026 |
| | — |
| | 116,800 |
| | 7.3 | % | | Q1 2017- Q1 2018 |
| Kentucky | | — |
| | 1 |
| | — |
| | — |
| | 1 |
| | — |
| | 3,035 |
| | — |
| | 27,000 |
| | 7.4 | % | | Q4 2015 |
| Ohio | | — |
| | 2 |
| | — |
| | — |
| | 2 |
| | — |
| | 7,961 |
| | — |
| | 59,100 |
| | 7.4 | % | | Q4 2016- Q1 2019 |
| Tennessee | | — |
| | 1 |
| | — |
| | — |
| | 1 |
| | — |
| | 4,362 |
| | — |
| | 17,800 |
| | 7.5 | % | | Q2 2017 |
| Texas | | 2 |
| | 4 |
| | — |
| | 1 |
| | 5 |
| | 4,762 |
| | 14,556 |
| | 18,100 |
| | 61,300 |
| | 8.1 | % | | Q3 2015- Q3 2018 |
| | | 3 |
| | 12 |
| | 1 |
| | 1 |
| | 15 |
| | $ | 4,762 |
| | $ | 48,297 |
| | $ | 18,100 |
| | $ | 339,365 |
| | 7.6 | % | | |
| | | | | | | | | | | | | | | | | | | | | | | |
| Assets Transitioned to Real Estate Portfolio in Q4 2017 | | | | | | | | | | | | |
| | | Investment Type | | Property Type | | Investment Amount (2) | | Real Estate Value | | Weighted Average Initial Cash Lease Yield | | |
| | | Loan | | Preferred Equity | | Forward Commitment | | Skilled Nursing/ Transitional Care | | Senior Housing | | Skilled Nursing/ Transitional Care | | Senior Housing | | Skilled Nursing/ Transitional Care | | Senior Housing | | | |
| | | 3 |
| | 1 |
| | — |
| | 1 |
| | 3 |
| | $ | 9,467 |
| | $ | 22,111 |
| | $ | 12,750 |
| | $ | 41,525 |
| | 8.1 | % | | |
| | | | | | | | | | | | | | | | | | | | | | | |
New Assets in Real Estate Portfolio (4) |
| | | | | | | | | | | | | | | | | | | |
| | | Property Type | | Beds/Units | | Gross Book Value | | % of Total Real Estate Invested |
| State | | Skilled Nursing/Transitional Care | | Senior Housing | | Skilled Nursing/Transitional Care | | Senior Housing | | |
| Arizona | | — |
| | 1 |
| | — |
| | 48 |
| | $ | 10,345 |
| | 0.2 | % |
| California | | 1 |
| | — |
| | 15 |
| | — |
| | 7,372 |
| | 0.1 | % |
| Colorado | | — |
| | 2 |
| | — |
| | 116 |
| | 31,365 |
| | 0.5 | % |
| Illinois | | — |
| | 1 |
| | — |
| | 53 |
| | 5,622 |
| | 0.1 | % |
| Indiana | | — |
| | 1 |
| | — |
| | 172 |
| | 26,587 |
| | 0.4 | % |
| Louisiana | | 1 |
| | — |
| | 144 |
| | — |
| | 26,270 |
| | 0.4 | % |
| Minnesota | | — |
| | 1 |
| | — |
| | 72 |
| | 14,050 |
| | 0.2 | % |
| Nevada | | — |
| | 1 |
| | — |
| | 68 |
| | 23,670 |
| | 0.4 | % |
| South Dakota | | — |
| | 1 |
| | — |
| | 40 |
| | 7,118 |
| | 0.1 | % |
| Texas | | 6 |
| | 5 |
| | 739 |
| | 271 |
| | 124,853 |
| | 1.9 | % |
| Virginia | | — |
| | 1 |
| | — |
| | 68 |
| | 23,000 |
| | 0.4 | % |
| Washington | | 1 |
| | — |
| | 60 |
| | — |
| | 13,146 |
| | 0.2 | % |
| Wisconsin | | — |
| | 2 |
| | — |
| | 84 |
| | 15,219 |
| | 0.2 | % |
| Canada | | — |
| | 1 |
| | — |
| | 74 |
| | 27,885 |
| | 0.4 | % |
| | | 9 |
| | 17 |
| | 958 |
| | 1,066 |
| | $ | 356,502 |
| | 5.5 | % |
| |
(1) | Includes projects invested in or committed to as of December 31, 2017. |
| |
(2) | Investment amount excludes accrued and unpaid interest receivable. |
| |
(3) | Certificate of occupancy timing represents the period in which the certificate of occupancy has been received for a development project where construction has been completed or when the certificate of occupancy is expected to be received for a development project that is currently under construction. |
| |
(4) | Includes properties built since 2010 and included in real estate investments as of December 31, 2017. |
|
| | |
| See reporting definitions. | 16 |
SABRA HEALTH CARE REIT, INC.
PORTFOLIO CONCENTRATIONS (1)
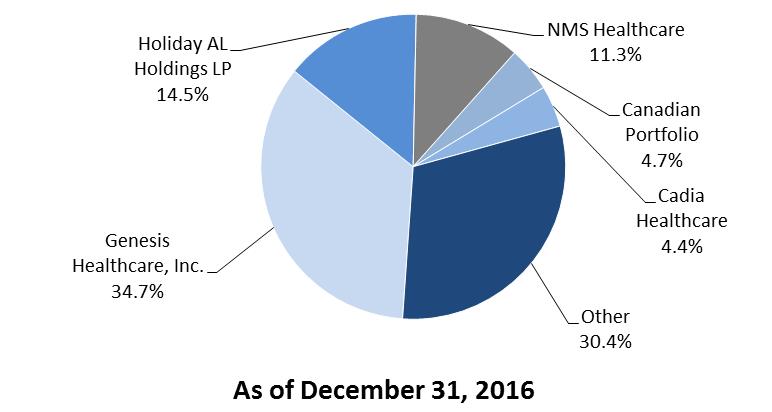
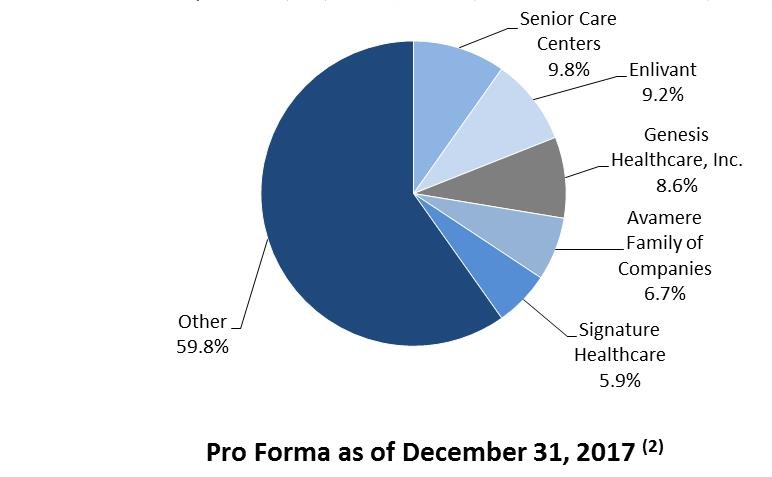
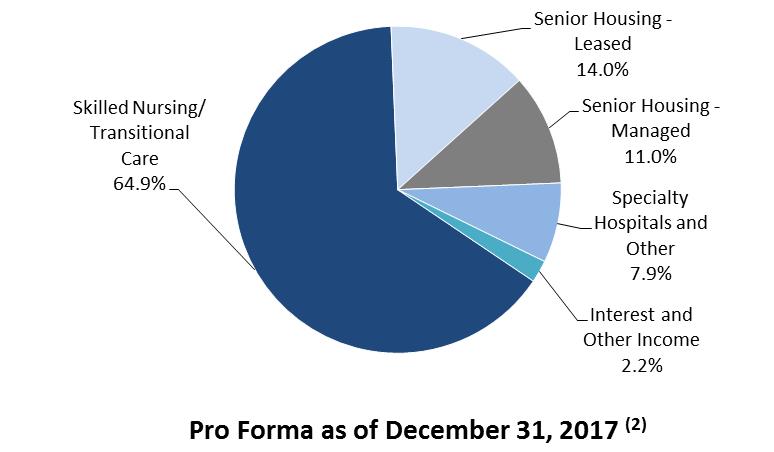
Relationship Concentration
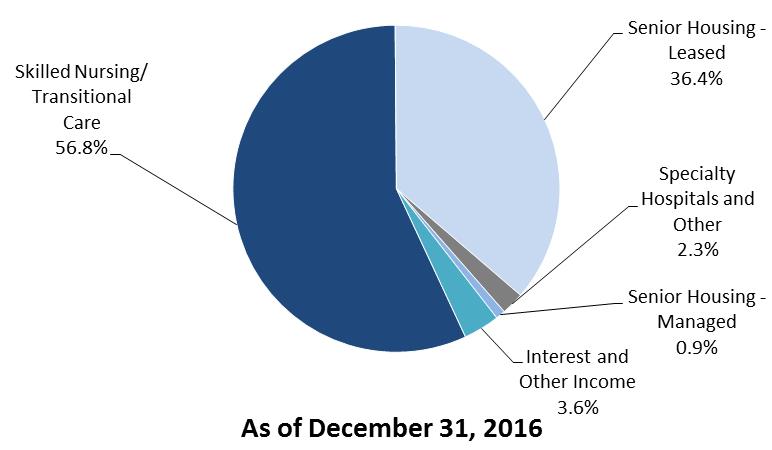
Asset Class Concentration
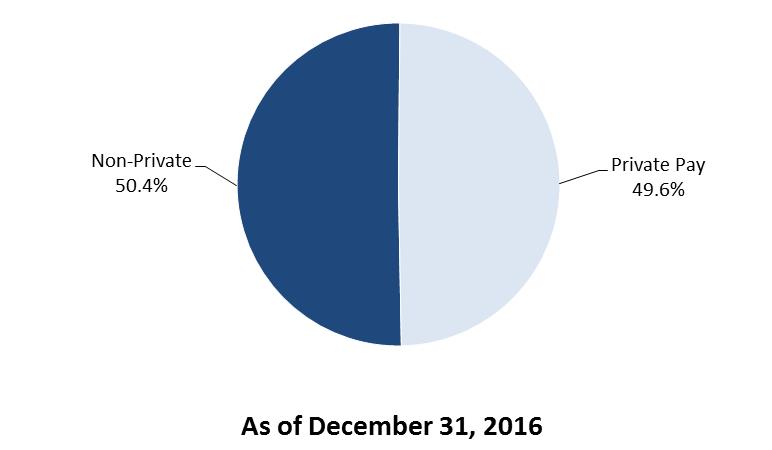
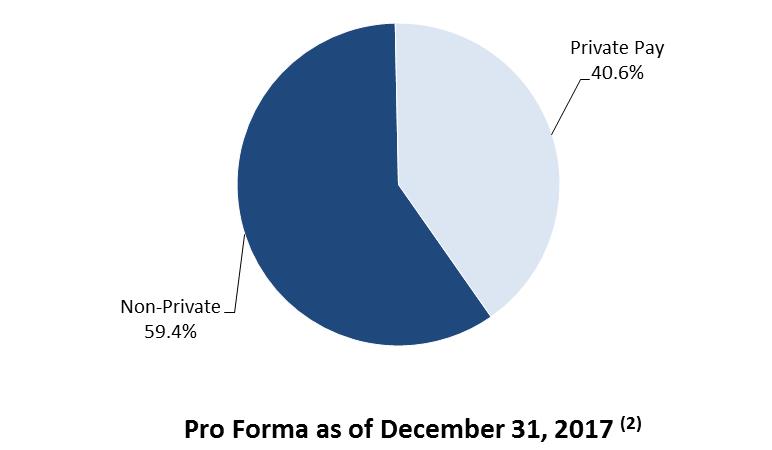
Payor Source Concentration (3)
| |
(1) | Concentrations are calculated using Annualized Cash Net Operating Income for real estate investments, investments in loans receivable and other investments. We define Annualized Cash NOI as Annualized Revenues less operating expenses and non-cash revenues. |
| |
(2) | Assumes the Enlivant and North American Healthcare acquisitions completed subsequent to December 31, 2017 (see pages 25-26) and the previously announced rent repositioning program for certain of our tenants who were legacy tenants of CCP and rent reductions for Genesis were completed at the beginning of the period presented. |
| |
(3) | Tenant and borrower revenue presented one quarter in arrears. |
|
| | |
| See reporting definitions. | 17 |
SABRA HEALTH CARE REIT, INC.
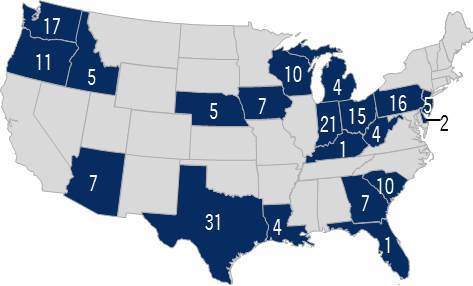
REAL ESTATE PORTFOLIO GEOGRAPHIC CONCENTRATIONS
December 31, 2017
Property Type
|
| | | | | | | | | | | | | | | | | | |
| Location | | Skilled Nursing / Transitional Care | | Senior Housing - Leased | | Senior Housing - Managed | | Specialty Hospitals and Other | | Total | | % of Total |
| Texas | | 60 |
| | 15 |
| | — |
| | 14 |
| | 89 |
| | 17.5 | % |
| California | | 26 |
| | 1 |
| | — |
| | 4 |
| | 31 |
| | 6.1 |
|
| Indiana | | 22 |
| | 6 |
| | — |
| | — |
| | 28 |
| | 5.5 |
|
| Kentucky | | 27 |
| | — |
| | — |
| | 1 |
| | 28 |
| | 5.5 |
|
| Massachusetts | | 22 |
| | — |
| | — |
| | — |
| | 22 |
| | 4.3 |
|
| Oregon | | 16 |
| | 4 |
| | — |
| | — |
| | 20 |
| | 3.9 |
|
| New Hampshire | | 11 |
| | 6 |
| | — |
| | — |
| | 17 |
| | 3.4 |
|
| Washington | | 14 |
| | 3 |
| | — |
| | — |
| | 17 |
| | 3.4 |
|
| North Carolina | | 15 |
| | 2 |
| | — |
| | — |
| | 17 |
| | 3.4 |
|
| Connecticut | | 14 |
| | 2 |
| | — |
| | — |
| | 16 |
| | 3.2 |
|
| Other (33 states & Canada) | | 157 |
| | 49 |
| | 13 |
| | 3 |
| | 222 |
| | 43.8 |
|
| | | | | | | | | | | | | |
| Total | | 384 |
| | 88 |
| | 13 |
| | 22 |
| | 507 |
| | 100.0 | % |
| | | | | | | | | | | | | |
| % of Total Properties | | 75.7 | % | | 17.4 | % | | 2.6 | % | | 4.3 | % | | 100.0 | % | | |
Distribution of Beds/Units
|
| | | | | | | | | | | | | | | | | | | | | |
| | | Total Number of Properties | | Property Type | | | |
| Location | | | Skilled Nursing / Transitional Care | | Senior Housing - Leased | | Senior Housing - Managed | | Specialty Hospitals and Other | | Total | | % of Total |
| Texas | | 89 |
| | 7,391 |
| | 1,502 |
| | — |
| | 366 |
| | 9,259 |
| | 17.3 | % |
| Kentucky | | 28 |
| | 2,819 |
| | — |
| | — |
| | 40 |
| | 2,859 |
| | 5.3 |
|
| Indiana | | 28 |
| | 2,325 |
| | 449 |
| | — |
| | — |
| | 2,774 |
| | 5.2 |
|
| California | | 31 |
| | 2,210 |
| | 102 |
| | — |
| | 340 |
| | 2,652 |
| | 5.0 |
|
| Massachusetts | | 22 |
| | 2,621 |
| | — |
| | — |
| | — |
| | 2,621 |
| | 4.9 |
|
| Oregon | | 20 |
| | 1,561 |
| | 509 |
| | — |
| | — |
| | 2,070 |
| | 3.9 |
|
| Connecticut | | 16 |
| | 1,824 |
| | 140 |
| | — |
| | — |
| | 1,964 |
| | 3.7 |
|
| North Carolina | | 17 |
| | 1,672 |
| | 237 |
| | — |
| | — |
| | 1,909 |
| | 3.6 |
|
| New Hampshire | | 17 |
| | 1,016 |
| | 838 |
| | — |
| | — |
| | 1,854 |
| | 3.5 |
|
| Washington | | 17 |
| | 1,584 |
| | 206 |
| | — |
| | — |
| | 1,790 |
| | 3.2 |
|
| Other (33 states & Canada) | | 222 |
| | 18,200 |
| | 4,154 |
| | 1,113 |
| | 339 |
| | 23,806 |
| | 44.4 |
|
| | | | | | | | | | | | | | | |
| Total | | 507 |
| | 43,223 |
| | 8,137 |
| | 1,113 |
| | 1,085 |
| | 53,558 |
| | 100.0 | % |
| | | | | | | | | | | | | | | |
| % of Total beds/units | | | | 80.7 | % | | 15.2 | % | | 2.1 | % | | 2.0 | % | | 100.0 | % | | |
| | | | | | | | | | | | | | | |
|
| | |
| See reporting definitions. | 18 |
SABRA HEALTH CARE REIT, INC.
REAL ESTATE PORTFOLIO GEOGRAPHIC CONCENTRATIONS (CONTINUED)
December 31, 2017
(dollars in thousands)
Investment (1)
|
| | | | | | | | | | | | | | | | | | | | | | | | | | |
| | | | | Property Type | | | | |
| Location | | Total Number of Properties | | Skilled Nursing/Transitional Care | | Senior Housing - Leased | | Senior Housing - Managed | | Specialty Hospitals and Other | | Total | | % of Total |
| Texas | | 89 |
| | $ | 589,110 |
| | $ | 234,838 |
| | $ | — |
| | $ | 195,929 |
| | $ | 1,019,877 |
| | 16.1 | % |
| California | | 31 |
| | 417,387 |
| | 35,901 |
| | — |
| | 217,763 |
| | 671,051 |
| | 10.6 |
|
| Oregon | | 20 |
| | 264,892 |
| | 86,250 |
| | — |
| | — |
| | 351,142 |
| | 5.5 |
|
| Maryland | | 9 |
| | 320,124 |
| | 6,566 |
| | — |
| | — |
| | 326,690 |
| | 5.2 |
|
| New York | | 10 |
| | 297,066 |
| | 19,235 |
| | — |
| | — |
| | 316,301 |
| | 5.0 |
|
| Indiana | | 28 |
| | 213,438 |
| | 59,888 |
| | — |
| | — |
| | 273,326 |
| | 4.3 |
|
| Kentucky | | 28 |
| | 239,941 |
| | — |
| | — |
| | 30,313 |
| | 270,254 |
| | 4.3 |
|
| North Carolina | | 17 |
| | 138,902 |
| | 67,272 |
| | — |
| | — |
| | 206,174 |
| | 3.3 |
|
| Washington | | 17 |
| | 168,194 |
| | 36,900 |
| | — |
| | — |
| | 205,094 |
| | 3.2 |
|
| Arizona | | 8 |
| | 31,976 |
| | 47,246 |
| | — |
| | 121,757 |
| | 200,979 |
| | 3.2 |
|
Other (33 states & Canada) (1) | | 250 |
| | 1,683,357 |
| | 572,591 |
| | 189,120 |
| | 48,306 |
| | 2,493,374 |
| | 39.3 |
|
| | | | | | | | | | | | | | | |
| Total | | 507 |
| | $ | 4,364,387 |
| | $ | 1,166,687 |
| | $ | 189,120 |
| | $ | 614,068 |
| | $ | 6,334,262 |
| | 100.0 | % |
| | | | | | | | | | | | | | | |
| % of Total Properties | | | | 68.9 | % | | 18.4 | % | | 3.0 | % | | 9.7 | % | | 100.0 | % | | |
| | | | | | | | | | | | | | | |
| |
(1) | Investment balance in Canada is based on the exchange rate as of December 31, 2017 of $0.7967 per CAD $1.00. |
|
| | |
| See reporting definitions. | 19 |
SABRA HEALTH CARE REIT, INC.
PORTFOLIO LEASE EXPIRATIONS (1)
December 31, 2017
(dollars in thousands)
|
| | | | | | | | | | | | | | | | | | | | | | | | | | | | | | | | | | | | | | | | | | | |
| | 2018 | | 2020 | | 2021 | | 2022 | | 2023 | | 2024 | | 2025 | | 2026 | | 2027 | | Thereafter | | Total |
| Skilled Nursing/Transitional Care | | | | | | | | | | | | | | | | | | | | | |
| Properties | 8 |
| | 37 |
| | 9 |
| | 23 |
| | 54 |
| | 27 |
| | 20 |
| | 20 |
| | 68 |
| | 117 |
| | 383 |
|
| Beds/Units | 884 |
| | 4,674 |
| | 1,175 |
| | 2,482 |
| | 6,675 |
| | 2,766 |
| | 2,174 |
| | 2,248 |
| | 6,825 |
| | 13,320 |
| | 43,223 |
|
| Annualized Revenues | $ | 4,658 |
| | $ | 34,632 |
| | $ | 7,956 |
| | $ | 39,228 |
| | $ | 70,258 |
| | $ | 26,088 |
| | $ | 14,458 |
| | $ | 22,990 |
| | $ | 54,831 |
| | $ | 196,912 |
| | $ | 472,011 |
|
| Senior Housing - Leased | | | | | | | | | | | | | | | | | | | | | |
| Properties | — |
| | — |
| | 2 |
| | 15 |
| | 3 |
| | 9 |
| | 13 |
| | 1 |
| | 13 |
| | 32 |
| | 88 |
|
| Beds/Units | — |
| | — |
| | 163 |
| | 1,027 |
| | 393 |
| | 667 |
| | 920 |
| | 100 |
| | 692 |
| | 4,175 |
| | 8,137 |
|
| Annualized Revenues | $ | — |
| | $ | — |
| | $ | 1,070 |
| | $ | 9,825 |
| | $ | 3,254 |
| | $ | 7,087 |
| | $ | 10,452 |
| | $ | 633 |
| | $ | 9,596 |
| | $ | 57,239 |
| | $ | 99,156 |
|
| Specialty Hospitals and Other | | | | | | | | | | | | | | | | | | | | | |
| Properties | — |
| | 12 |
| | — |
| | — |
| | — |
| | — |
| | — |
| | — |
| | 6 |
| | 4 |
| | 22 |
|
| Beds/Units | — |
| | 258 |
| | — |
| | — |
| | — |
| | — |
| | — |
| | — |
| | 652 |
| | 175 |
| | 1,085 |
|
| Annualized Revenues | $ | — |
| | $ | 4,949 |
| | $ | — |
| | $ | — |
| | $ | — |
| | $ | — |
| | $ | — |
| | $ | — |
| | $ | 32,847 |
| | $ | 12,975 |
| | $ | 50,771 |
|
| | | | | | | | | | | | | | | | | | | | | | |
| Total Properties | 8 |
| | 49 |
| | 11 |
| | 38 |
| | 57 |
| | 36 |
| | 33 |
| | 21 |
| | 87 |
| | 153 |
| | 493 |
|
| | | | | | | | | | | | | | | | | | | | | | |
| Total Beds/Units | 884 |
| | 4,932 |
| | 1,338 |
| | 3,509 |
| | 7,068 |
| | 3,433 |
| | 3,094 |
| | 2,348 |
| | 8,169 |
| | 17,670 |
| | 52,445 |
|
| | | | | | | | | | | | | | | | | | | | | | |
| Total Annualized Revenues | $ | 4,658 |
| | $ | 39,581 |
| | $ | 9,026 |
| | $ | 49,053 |
| | $ | 73,512 |
| | $ | 33,175 |
| | $ | 24,910 |
| | $ | 23,623 |
| | $ | 97,274 |
| | $ | 267,126 |
| | $ | 621,938 |
|
| | | | | | | | | | | | | | | | | | | | | | |
| % of Revenue | 0.7 | % | | 6.4 | % | | 1.5 | % | | 7.9 | % | | 11.8 | % | | 5.3 | % | | 4.0 | % | | 3.8 | % | | 15.6 | % | | 43.0 | % | | 100.0 | % |
| | | | | | | | | | | | | | | | | | | | | | |
(1) Excludes Senior Housing - Managed communities and one non-operational skilled nursing/transitional care facility. Information also excludes remaining CCP and Genesis rent reductions.
|
| | |
| See reporting definitions. | 20 |
SABRA HEALTH CARE REIT, INC.
INVESTMENT ACTIVITY (1)
For the Twelve Months Ended December 31, 2017
(dollars in thousands)
|
| | | | | | | | | | | | | | | | |
| | Initial Investment Date | | Property Type | | Number of Properties | | Beds/Units | | 2017 Amounts Invested (2) | | Rate of Return/Initial Cash Yield |
| Real Estate Investments | | | | | | | | | | | |
| Poet's Walk of Cedar Park | 06/01/17 | | Senior Housing | | 1 |
| | 68 |
| | $ | 14,457 |
| | 7.5 | % |
| North American Healthcare Portfolio | 09/19/17 | | Skilled Nursing/Transitional Care | | 21 |
| | 1,894 |
| | 378,798 |
| | 8.0 | % |
The Peaks at Old Laramie Trail (3) | 12/15/17 | | Senior Housing | | 1 |
| | 95 |
| | 15,808 |
| | 7.5 | % |
Park Manor at Bee Cave (4) | 12/15/17 | | Skilled Nursing/ Transitional Care | | 1 |
| | 140 |
| | 10,843 |
| | 9.5 | % |
| Additions to Real Estate | Various | | Senior Housing | | NA |
| | NA |
| | 6,209 |
| | 6.3 | % |
| Total Real Estate Investments | | | | | | | | | 426,115 |
| | 8.0 | % |
| Preferred Equity Investments | | | | | | | | | | | |
| Leo Brown Group - Madeira | 07/25/17 | | Senior Housing | | 1 |
| | 163 |
| | 5,759 |
| | 12.0 | % |
| Loans Receivable | | | | | | | | | | | |
| McKinney Construction Loan | 03/14/16 | | Senior Housing | | 1 |
| | 27 |
| | 1,527 |
| | 8.0 | % |
| Montecito Promissory Note | 06/23/16 | | Senior Housing | | 1 |
| | NA |
| | 325 |
| | 9.3 | % |
| Arlington Construction Loan | 06/01/17 | | Senior Housing | | 1 |
| | 27 |
| | 211 |
| | 8.0 | % |
| Total Loans Receivable | | | | | | | | | 2,063 |
| | 8.2 | % |
| All Investments | | | | | | | | | $ | 433,937 |
| | 8.0 | % |
| |
(2) | Real estate investments include capitalized acquisition costs. |
| |
(3) | Gross investment of $20.7 million; $4.9 million used to repay our preferred equity investment in this property. |
| |
(4) | Gross investment of $12.8 million; $2.0 million used to repay a portion of our related loan receivable investment. |
|
| | |
| See reporting definitions. | 21 |
SABRA HEALTH CARE REIT, INC.
RECENT INVESTMENT ACTIVITY
Park Manor Bee Cave - From Proprietary Development Pipeline
|
| | |
| • Investment Date: | | December 15, 2017 |
| | | |
| • Investment Amount: | | $10.8 million (1) |
| | | |
| • Investment Type: | | Real Estate |
| | | |
| • Number of Properties: | | 1 |
| | | |
| • Location: | | Texas |
| | | |
| • Beds/Units: | | 140 |
| | | |
| • Property Type: | | Skilled Nursing/Transitional Care |
| | | |
| • Annualized GAAP Income: | | $1.4 million |
| | | |
| • Initial Cash Yield: | | 9.5% |
| |
(1) | Gross investment of $12.8 million, including $0.1 million of capitalized acquisition costs; $2.0 million used to repay a portion of our related loan receivable investment. |
|
| | |
| See reporting definitions. | 22 |
SABRA HEALTH CARE REIT, INC.
RECENT INVESTMENT ACTIVITY
The Peaks at Old Laramie Trail - From Proprietary Development Pipeline
|
| | |
| • Investment Date: | | December 15, 2017 |
| | | |
| • Investment Amount: | | $15.8 million (1) |
| | | |
| • Investment Type: | | Real Estate |
| | | |
| • Number of Properties: | | 1 |
| | | |
| • Location: | | Colorado |
| | | |
| • Beds/Units: | | 95 |
| | | |
| • Property Type: | | Senior Housing |
| | | |
| • Annualized GAAP Income: | | $1.8 million |
| | | |
| • Initial Cash Yield: | | 7.5% |
| |
(1) | Gross investment of $20.7 million, including $0.1 million of capitalized acquisition costs; $4.9 million used to repay our preferred equity investment in this property. |
|
| | |
| See reporting definitions. | 23 |
SABRA HEALTH CARE REIT, INC.
RECENT INVESTMENT ACTIVITY
(dollars in millions)
Enlivant
|
| | | | | | | | | | | | |
| • Investment Date: | | January 2, 2018 | | | | |
| | | | | | | |
| • Investment Type: | | Joint Venture and Real Estate | | |
| | | | | | | |
| • Property Type: | | Senior Housing - Managed | | |
| | | | | | | |
| • Investment Information: | | JV Portfolio | | Owned Portfolio | | Total |
| Number of Properties | | 172 |
| | 11 |
| | 183 |
|
| Beds/Units | | 7,652 |
| | 631 |
| | 8,283 |
|
| Location | | 18 States |
| | 3 States |
| | 20 States |
|
| | | | | | | |
| TPG Equity | | $ | 367.1 |
| | NA |
| | $ | 367.1 |
|
| Sabra Equity | | 352.7 |
| | $ | 138.3 |
| | 491.0 |
|
| In-Place Secured Debt | | 791.3 |
| | NA |
| | 791.3 |
|
| Net cash | | (22.9 | ) | | (14.1 | ) | | (37.0 | ) |
| | | $ | 1,488.2 |
| | $ | 124.2 |
| | $ | 1,612.4 |
|
| | | | | | | |
| Sabra share of In-Place Secured Debt | | $ | 387.7 |
| | NA |
| | |
Weighted Average Interest Rate (1) | | 3.91 | % | | NA |
| | |
| | | | | | | |
| Projected Pre-Tax Year 1 Yields: | | | | | | |
| Unlevered Cash Yield | | 6.3% | | 6.3% | | 6.3% |
| Unlevered Cash Yield, post cap-ex | | 5.6% | | 5.7% | | 5.7% |
| |
(1) | As of December 31, 2017. Weighted average interest rate for the JV Portfolio is variable and is based on LIBOR plus 2.54%. |
|
| | |
| See reporting definitions. | 24 |
SABRA HEALTH CARE REIT, INC.
RECENT INVESTMENT ACTIVITY
North American Healthcare Portfolio II
|
| | |
| • Investment Date: | | January 2018 |
| | | |
| • Investment Amount: | | $42.8 million |
| | | |
| • Investment Type: | | Real Estate |
| | | |
| • Number of Properties: | | 2 |
| | | |
| • Location: | | California and Washington |
| | | |
| • Beds/Units: | | 263 |
| | | |
| • Property Type: | | Skilled Nursing/Transitional Care |
| | | |
| • Annualized GAAP Income: | | $3.9 million |
| | | |
| • Initial Cash Yield: | | 8.0% |
|
| | |
| See reporting definitions. | 25 |
SABRA HEALTH CARE REIT, INC.
PRO FORMA INFORMATION
(dollars in thousands, except per share amounts)
Note: The following pro forma information assumes that (i) the investment activity during and subsequent to the quarter ended December 31, 2017, as described on pages 22-26 of this Supplement, (ii) the disposition activity during and subsequent to the quarter ended December 31, 2017, (iii) the remaining planned CCP (assuming $28.2 million) and Genesis ($19.0 million) rent reductions and (iv) the transition of five skilled nursing/transitional care facilities to a new operator were completed as of the beginning of the period presented. |
| | | | | | | | | | | | | | | |
| | Three Months Ended December 31, 2017 | | Adjustments | | Pro Forma Three Months Ended December 31, 2017 |
| | | Investing | | Financing | |
| Total revenues | $ | 166,472 |
| | $ | (1,589 | ) | | $ | — |
| | $ | 164,883 |
|
| Total expenses | 109,477 |
| | (2,576 | ) | | 2,863 |
| | 109,764 |
|
| Total other income | 47,464 |
| | (47,415 | ) | | — |
| | 49 |
|
| Income from unconsolidated joint venture | — |
| | 3,848 |
| | — |
| | 3,848 |
|
| Income tax expense | (490 | ) | | (110 | ) | | — |
| | (600 | ) |
| Net income | 103,969 |
| | (42,690 | ) | | (2,863 | ) | | 58,416 |
|
| Net income attributable to noncontrolling interests | (24 | ) | | — |
| | — |
| | (24 | ) |
| Net income attributable to Sabra Health Care REIT, Inc. | 103,945 |
| | (42,690 | ) | | (2,863 | ) | | 58,392 |
|
| Preferred stock dividends | (2,560 | ) | | — |
| | — |
| | (2,560 | ) |
| Net income attributable to common stockholders | $ | 101,385 |
| | $ | (42,690 | ) | | $ | (2,863 | ) | | $ | 55,832 |
|
| Add: | | | | | | | |
| Depreciation and amortization of real estate assets | 51,592 |
| | 879 |
| | — |
| | 52,471 |
|
| Depreciation and amortization of real estate assets related to noncontrolling interests | (45 | ) | | — |
| | — |
| | (45 | ) |
| Depreciation and amortization of real estate assets related to unconsolidated joint venture | — |
| | 2,617 |
| | — |
| | 2,617 |
|
| Net gain on sales of real estate | (47,415 | ) | | 47,415 |
| | — |
| | — |
|
| Impairment of real estate | 1,326 |
| | — |
| | — |
| | 1,326 |
|
| FFO attributable to common stockholders | $ | 106,843 |
| | $ | 8,221 |
| | $ | (2,863 | ) | | $ | 112,201 |
|
| Normalizing Items | 11,072 |
| | (9,251 | ) | | — |
| | 1,821 |
|
| Normalized FFO attributable to common stockholders | $ | 117,915 |
| | $ | (1,030 | ) | | $ | (2,863 | ) | | $ | 114,022 |
|
| FFO attributable to common stockholders | $ | 106,843 |
| | $ | 8,221 |
| | $ | (2,863 | ) | | $ | 112,201 |
|
Merger and acquisition costs (1) | 505 |
| | — |
| | — |
| | 505 |
|
| Stock-based compensation expense | 29 |
| | — |
| | — |
| | 29 |
|
| Straight-line rental income adjustments | (11,180 | ) | | (347 | ) | | — |
| | (11,527 | ) |
| Amortization of above and below market lease intangibles, net | (1,549 | ) | | — |
| | — |
| | (1,549 | ) |
| Non-cash interest income adjustments | (632 | ) | | — |
| | — |
| | (632 | ) |
| Non-cash interest expense | 2,488 |
| | 266 |
| | — |
| | 2,754 |
|
| Change in fair value of contingent consolidation | 126 |
| | — |
| | — |
| | 126 |
|
| Provision for doubtful straight-line rental income, loan losses and other reserves | 10,044 |
| | (9,931 | ) | | — |
| | 113 |
|
Other non-cash adjustments (2) | (104 | ) | | — |
| | — |
| | (104 | ) |
| AFFO attributable to common stockholders | $ | 106,570 |
| | $ | (1,791 | ) | | $ | (2,863 | ) | | $ | 101,916 |
|
| Normalizing Items | 559 |
| | — |
| | — |
| | 559 |
|
| Normalized AFFO attributable to common stockholders | $ | 107,129 |
| | $ | (1,791 | ) | | $ | (2,863 | ) | | $ | 102,475 |
|
| Amounts per diluted common share attributable to common stockholders: | | | | | | | |
| Net income | $ | 0.57 |
| | | | | | $ | 0.31 |
|
| FFO | $ | 0.60 |
| | | | | | $ | 0.63 |
|
| Normalized FFO | $ | 0.66 |
| | | | | | $ | 0.64 |
|
| AFFO | $ | 0.60 |
| | | | | | $ | 0.57 |
|
| Normalized AFFO | $ | 0.60 |
| | | | | | $ | 0.57 |
|
| Weighted average number of common shares outstanding, diluted: | | | | | | | |
| Net income, FFO and Normalized FFO | 178,428,200 |
| | | | | | 178,428,200 |
|
| AFFO and Normalized AFFO | 178,647,299 |
| | | | | | 178,647,299 |
|
| |
(1) | Merger and acquisition costs incurred during the year ended December 31, 2017 primarily relate to the CCP merger. Merger and acquisition costs include $1.4 million of stock-based compensation expense related to former CCP employees. |
(2) Other non-cash adjustments include ineffectiveness gain/loss on derivative instruments and other non-cash income/loss.
|
| | |
| See reporting definitions. | 26 |
SABRA HEALTH CARE REIT, INC.
REPORTING DEFINITIONS
Adjusted EBITDA.* Adjusted EBITDA is calculated as earnings before interest, taxes, depreciation and amortization (“EBITDA”) excluding the impact of merger-related costs, stock-based compensation expense under the Company's long-term equity award program, and loan loss reserves. Adjusted EBITDA is an important non-GAAP supplemental measure of operating performance.
Ancillary Supported Tenant. A tenant, or one of its affiliates, that owns one or more ancillary businesses that depends on providing services to the residents of the properties leased by the affiliated operating company (Sabra's tenant) for a meaningful part of the ancillary business's profitability.
Annualized Revenues. The annual straight-line rental revenues under leases and interest and other income generated by the Company's loans receivable and other investments based on amounts invested and applicable terms as of the end of the period presented. Annualized Revenues do not include tenant recoveries or additional rents.
Cash Net Operating Income (“Cash NOI”).* The Company believes that net income attributable to common stockholders as defined by GAAP is the most appropriate earnings measure. We consider Cash NOI an important supplemental measure because it allows investors, analysts and our management to evaluate the operating performance of our investments. We define Cash NOI as total revenues less operating expenses and non-cash revenues. Cash NOI excludes all other financial statement amounts included in net income.
EBITDAR. Earnings before interest, taxes, depreciation, amortization and rent (“EBITDAR”) for a particular facility accruing to the operator/tenant of the property (not the Company) for the period presented. EBITDAR includes an imputed management fee of 5.0% of revenues for Skilled Nursing/Transitional Care facilities and Senior Housing - Leased communities and an imputed management fee of 2.5% of revenues for Specialty Hospitals and Other facilities. The Company uses EBITDAR in determining EBITDAR Coverage. EBITDAR has limitations as an analytical tool. EBITDAR does not reflect historical cash expenditures or future cash requirements for facility capital expenditures or contractual commitments. In addition, EBITDAR does not represent a property's net income or cash flow from operations and should not be considered an alternative to those indicators. The Company utilizes EBITDAR as a supplemental measure of the ability of the Company's operators/tenants and relevant guarantors to generate sufficient liquidity to meet related obligations to the Company.
EBITDAR Coverage. Represents the ratio of EBITDAR to recognized rent for owned facilities (excluding Senior Housing - Managed). EBITDAR Coverage is a supplemental measure of an operator/tenant’s ability to meet their cash rent and other obligations to the Company. However, its usefulness is limited by, among other things, the same factors that limit the usefulness of EBITDAR. EBITDAR Coverage includes only Stabilized Facilities and excludes significant tenants with meaningful credit enhancement through guarantees (which include Genesis, Holiday and three former CCP tenants), two Ancillary Supported Tenants and facilities for which data is not available or meaningful.
EBITDARM. Earnings before interest, taxes, depreciation, amortization, rent and management fees (“EBITDARM”) for a particular facility accruing to the operator/tenant of the property (not the Company), for the period presented. The Company uses EBITDARM in determining EBITDARM Coverage. The usefulness of EBITDARM is limited by the same factors that limit the usefulness of EBITDAR. Together with EBITDAR, the Company utilizes EBITDARM to evaluate the core operations of the properties by eliminating management fees, which vary based on operator/tenant and its operating structure.
EBITDARM Coverage. Represents the ratio of EBITDARM to recognized rent for owned facilities (excluding Senior Housing - Managed). EBITDARM Coverage is a supplemental measure of an operator/tenant’s ability to meet their cash rent and other obligations to the Company. However, its usefulness is limited by, among other things, the same factors that limit the usefulness of EBITDARM. EBITDARM Coverage includes only Stabilized Facilities and excludes significant tenants with meaningful credit enhancement through guarantees (which include Genesis, Holiday and three former CCP tenants), two Ancillary Supported Tenants and facilities for which data is not available or meaningful.
Enterprise Value. The Company believes Enterprise Value is an important measurement as it is a measure of a company’s value. We calculate Enterprise Value as market equity capitalization plus debt. Market equity capitalization is calculated as the number of shares of common stock multiplied by the closing price of our common stock on the last day of the period presented. Total Enterprise Value includes our market equity capitalization and consolidated debt, less cash and cash equivalents.
Fixed Charge Coverage Ratio. EBITDAR (including adjustments for one-time and pro forma items) for the period indicated (one quarter in arrears) for all operations of any entities that guarantee the tenants' lease obligations to the Company divided by the same period cash rent expense, interest expense and mandatory principal payments for operations of any entity that guarantees the tenants' lease obligation to the Company. Fixed Charge Coverage is a supplemental measure of a guarantor's ability to meet the operator/tenant's cash rent and other obligations to the Company should the operator/tenant be unable to do so itself. However, its usefulness is limited by, among other things, the same factors that limit the usefulness of EBITDAR. Fixed Charge Coverage is calculated by the Company as described above based on information provided by guarantors without independent verification by the Company and may differ from similar metrics calculated by the guarantors.
Funds From Operations Attributable to Common Stockholders (“FFO”) and Adjusted Funds from Operations Attributable to Common Stockholders (“AFFO”).* The Company believes that net income attributable to common stockholders as defined by GAAP is the most appropriate earnings measure. The Company also believes that Funds From Operations, or FFO, as defined in accordance with the definition used by the National Association of Real Estate Investment Trusts (“NAREIT”), and Adjusted Funds from Operations, or AFFO (and related per share amounts) are important non-GAAP supplemental measures of the Company's operating performance. Because the historical cost accounting convention used for real estate assets requires straight-line depreciation (except on land), such accounting presentation implies that the value of real estate assets diminishes predictably over time. However, since real estate values have historically risen or fallen with
SABRA HEALTH CARE REIT, INC.
REPORTING DEFINITIONS
market and other conditions, presentations of operating results for a real estate investment trust that uses historical cost accounting for depreciation could be less informative. Thus, NAREIT created FFO as a supplemental measure of operating performance for real estate investment trusts that excludes historical cost depreciation and amortization, among other items, from net income attributable to common stockholders, as defined by GAAP. FFO is defined as net income attributable to common stockholders, computed in accordance with GAAP, excluding gains or losses from real estate dispositions, plus real estate depreciation and amortization, net of amounts related to noncontrolling interests, and real estate impairment charges. AFFO is defined as FFO excluding merger and acquisition costs, stock-based compensation expense, straight-line rental income adjustments, amortization of above and below market lease intangibles, net, non-cash interest income adjustments, non-cash interest expense, as well as other non-cash revenue and expense items (including non-cash portion of loss on extinguishment of debt, change in fair value of contingent consideration, provision for doubtful straight-line rental income, loan losses and other reserves, ineffectiveness gain/loss on derivative instruments, and non-cash revenue and expense amounts related to noncontrolling interests). The Company believes that the use of FFO and AFFO (and the related per share amounts), combined with the required GAAP presentations, improves the understanding of the Company's operating results among investors and makes comparisons of operating results among real estate investment trusts more meaningful. The Company considers FFO and AFFO to be useful measures for reviewing comparative operating and financial performance because, by excluding the applicable items listed above, FFO and AFFO can help investors compare the operating performance of the Company between periods or as compared to other companies. While FFO and AFFO are relevant and widely used measures of operating performance of real estate investment trusts, they do not represent cash flows from operations or net income attributable to common stockholders as defined by GAAP and should not be considered an alternative to those measures in evaluating the Company’s liquidity or operating performance. FFO and AFFO also do not consider the costs associated with capital expenditures related to the Company’s real estate assets nor do they purport to be indicative of cash available to fund the Company’s future cash requirements. Further, the Company’s computation of FFO and AFFO may not be comparable to FFO and AFFO reported by other real estate investment trusts that do not define FFO in accordance with the current NAREIT definition or that interpret the current NAREIT definition or define AFFO differently than the Company does.
Investment. Represents the carrying amount of real estate assets after adding back accumulated depreciation and amortization and excludes net intangible assets and liabilities. Investment also includes the Company's pro rata share of the real estate assets held in the Company's unconsolidated joint venture.
Market Capitalization. Total common shares of Sabra outstanding multiplied by the closing price per common share as of a given period.
Net Operating Income (“NOI”).* The Company believes that net income attributable to common stockholders as defined by GAAP is the most appropriate earnings measure. We consider NOI an important supplemental measure because it allows investors, analysts and our management to evaluate the operating performance of our investments. We define NOI as total revenues less operating expenses. NOI excludes all other financial statement amounts included in net income.
Normalized FFO and Normalized AFFO.* Normalized FFO and Normalized AFFO represent FFO and AFFO, respectively, adjusted for certain income and expense items that the Company does not believe are indicative of its ongoing operating results. The Company considers Normalized FFO and Normalized AFFO to be useful measures to evaluate the Company’s operating results excluding these income and expense items to help investors compare the operating performance of the Company between periods or as compared to other companies. Normalized FFO and Normalized AFFO do not represent cash flows from operations or net income as defined by GAAP and should not be considered an alternative to those measures in evaluating the Company’s liquidity or operating performance. Normalized FFO and Normalized AFFO also do not consider the costs associated with capital expenditures related to the Company’s real estate assets nor do they purport to be indicative of cash available to fund the Company’s future cash requirements. Further, the Company’s computation of Normalized FFO and Normalized AFFO may not be comparable to Normalized FFO and Normalized AFFO reported by other REITs that do not define FFO in accordance with the current NAREIT definition or that interpret the current NAREIT definition or define FFO and AFFO or Normalized FFO and Normalized AFFO differently than the Company does.
Occupancy Percentage. Occupancy Percentage represents the facilities’ average operating occupancy for the period indicated. The percentages are calculated by dividing the actual census from the period presented by the available beds/units for the same period. Occupancy for independent living communities can be greater than 100% for a given period as multiple residents could occupy a single unit. Occupancy includes only Stabilized Facilities and excludes facilities for which data is not available or meaningful.
Senior Housing. Senior Housing communities include independent living, assisted living, continuing care retirement and memory care communities.
Skilled Mix. Skilled Mix is defined as the total Medicare and non-Medicaid managed care patient revenue at Skilled Nursing/Transitional Care facilities divided by the total revenues at Skilled Nursing/Transitional Care facilities for the period indicated. Skilled Mix includes only Stabilized Facilities and excludes facilities for which data is not available or meaningful.
Skilled Nursing/Transitional Care. Skilled Nursing/Transitional Care facilities include skilled nursing, transitional care, multi-license designation and mental health facilities.
Specialty Hospitals and Other. Includes acute care, long-term acute care, rehabilitation and behavioral hospitals, facilities that provide residential services, which may include assistance with activities of daily living, and other facilities not classified as Skilled Nursing/Transitional Care or Senior Housing.
Stabilized Facility. At the time of acquisition, the Company classifies each facility as either stabilized or pre-stabilized. In addition, the Company may classify a facility as pre-stabilized after acquisition. Circumstances that could result in a facility being classified as pre-
SABRA HEALTH CARE REIT, INC.
REPORTING DEFINITIONS
stabilized include newly completed developments, facilities undergoing major renovations or additions, facilities being repositioned or transitioned to new operators, and significant transitions within the tenants’ business model. Such facilities will be reclassified to stabilized upon maintaining consistent occupancy (85% for Skilled Nursing/Transitional Care Facilities and 90% for Senior Housing Communities) but in no event beyond 24 months after the date of classification as pre-stabilized. Stabilized Facilities exclude (i) Senior Housing - Managed communities, (ii) facilities held for sale, (iii) facilities being sold pursuant to the Company's CCP portfolio repositioning, (iv) facilities being transitioned from leased by the Company to being operated by the Company, and (v) facilities acquired during the three months preceding the period presented.
Total Debt. The principal balances of the Company’s revolving credit facility, term loans, senior unsecured notes, and secured indebtedness.
Total Debt, Net. The carrying amount of the Company’s revolving credit facility, term loans, senior unsecured notes, and secured indebtedness, as reported in the Company’s consolidated financial statements.
*Non-GAAP Financial Measures. Reconciliations, definitions and important discussions regarding the usefulness and limitations of the Non-GAAP Financial Measures used in this supplement can be found at http://www.sabrahealth.com/investors/financials/reports-presentations/non-gaap.