Exhibit 99.1
Exhibit 99.1
Horizon Pharma plc
34th Annual J.P. Morgan Healthcare Conference
January 13, 2016
Forward-Looking Statements
|
|
This presentation contains forward-looking statements, including, but not limited to, statements related to Horizon Pharma’s strategy, plans, objectives, expectations (financial or otherwise) and intentions, future financial results and growth potential, expected impact, timing and potential benefits from recent and future transactions, expectations regarding development programs and clinical plans, timing of regulatory events and other statements that are not historical facts. These forward-looking statements are based on Horizon Pharma’s current expectations and inherently involve significant risks and uncertainties. Actual results and the timing of events could differ materially from those anticipated in such forward-looking statements as a result of these risks and uncertainties, which include, without limitation, risks related to Horizon Pharma’s ability to complete any future acquisitions on anticipated terms; risks associated with business combination transactions, such as the risk that the businesses will not be integrated successfully, that such integration may be more difficult, time-consuming or costly than expected or that the expected benefits of any acquisition will not be realized; risks related to future opportunities and plans for Horizon Pharma, including, without limitation, uncertainty of the expected financial performance and results of Horizon Pharma following completion of any acquisition; disruption from any future acquisition, making it more difficult to conduct business as usual or maintain relationships with customers, employees or suppliers; and the possibility that if the combined company does not achieve the perceived benefits of any future acquisition as rapidly or to the extent anticipated by financial analysts or investors, the market price of
Horizon Pharma’s shares could decline, as well as other risks related to Horizon Pharma’s business, including the ability to grow sales and revenues from existing medicines and its ability to increase sales of its existing medicines; Horizon Pharma’s ability to successfully execute its commercial and acquisition strategies and achieve projected financial results for 2015, 2016 and other long-term financial metrics; the fact that past financial or operating results are not a guarantee of future results; competition, including potential generic competition; the ability to protect intellectual property and defend patents; regulatory obligations and oversight, including potential changes in healthcare laws and regulations; the availability of coverage and adequate reimbursement and pricing from government and third-party payers and risks relating to the success of Horizon’s patient support program; risks associated with clinical development and regulatory approvals, including potential delays in initiating and completing studies and filing for and obtaining regulatory approvals, whether data from clinical studies will support regulatory approval, and whether clinical results will be consistent with data from animal models; and those risks detailed from time-to-time under the caption “Risk Factors” and elsewhere in Horizon Pharma’s filings and reports with the SEC, including in the Annual Report on Form 10-K for the year ended December 31, 2014, and subsequent quarterly reports on Form 10-Q. Horizon Pharma undertakes no duty or obligation to update any forward-looking statements contained in this presentation as a result of new information, except as required by applicable law or regulation.
|
|
Note Regarding Use of Non-GAAP Financial Measures
Horizon Pharma provides certain financial measures such as EBITDA, or earnings before interest, taxes, depreciation and amortization, and adjusted EBITDA, that include adjustments to GAAP figures. These adjustments to GAAP exclude the bargain purchase gain related to the acquisition of Vidara, acquisition transaction related expenses, loss on induced debt conversion, loss on debt extinguishment, secondary offering expenses, as well as non-cash items such as stock compensation, depreciation and amortization, accretion, non-cash interest expense and other non-cash adjustments such as the increase or decrease in the fair value of the embedded derivative associated with the Company’s prior convertible senior notes. Certain other special items or substantive events may also be included in the non-GAAP adjustments periodically when their magnitude is significant within the periods incurred.
Horizon believes that these non-GAAP financial measures, when considered together with the GAAP figures, can enhance an overall understanding of Horizon’s financial performance. The non-GAAP financial measures are included with the intent of providing investors with a more complete understanding of the Company’s operational results, trends and expectations. In addition, these non-GAAP financial measures are among the indicators Horizon’s management uses for planning and forecasting purposes and measuring the Company’s performance. These non-GAAP financial measures should be considered in addition to, and not as a substitute for, or superior to, financial measures calculated in accordance with GAAP. The non-GAAP financial measures used by the Company may be calculated differently from, and therefore may not be comparable to, non-GAAP financial measures used by other companies. The Company has not provided a reconciliation of full year 2015 or 2016 adjusted EBITDA outlook to a net income (loss) outlook because certain items that are a component of net income (loss) but not part of adjusted EBITDA, such as the gain (loss) on derivative revaluation associated with the convertible senior notes, stock compensation, acquisition related expenses and certain purchase accounting items such as intangibles and step-up inventory, cannot be reasonably projected, either due to the significant impact of changes in Horizon’s stock price on derivative revaluation and stock compensation, or the variability associated with acquisition related expenses and purchase accounting items due to timing and other factors.
3
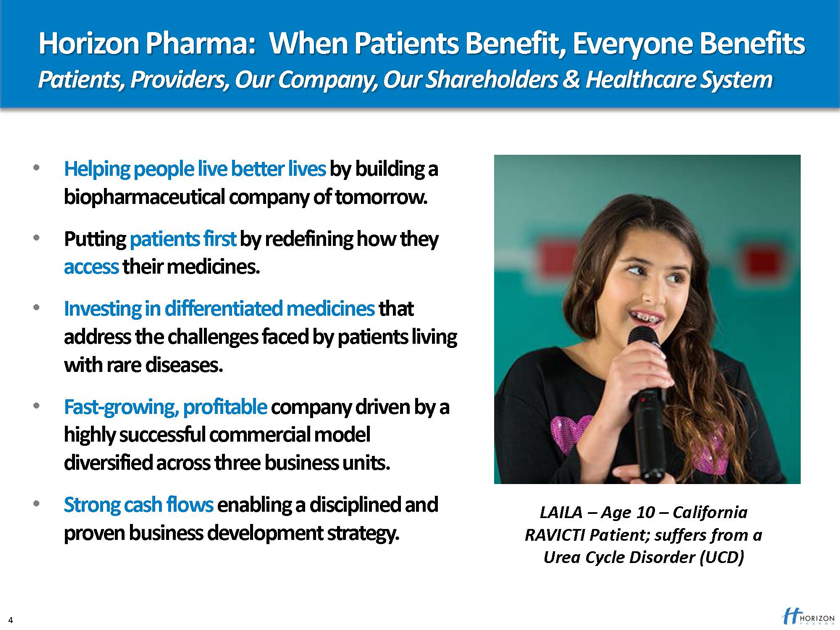
Horizon Pharma: When Patients Benefit, Everyone Benefits
Patients, Providers, Our Company, Our Shareholders & Healthcare System
Helping people live better lives by building a biopharmaceutical company of tomorrow.
Putting patients first by redefining how they access their medicines.
Investing in differentiated medicines that address the challenges faced by patients living with rare diseases.
Fast-growing, profitable company driven by a highly successful commercial model diversified across three business units.
Strong cash flows enabling a disciplined and LAILA – Age 10 – California proven business development strategy. RAVICTI Patient; suffers from a
Urea Cycle Disorder (UCD)
4
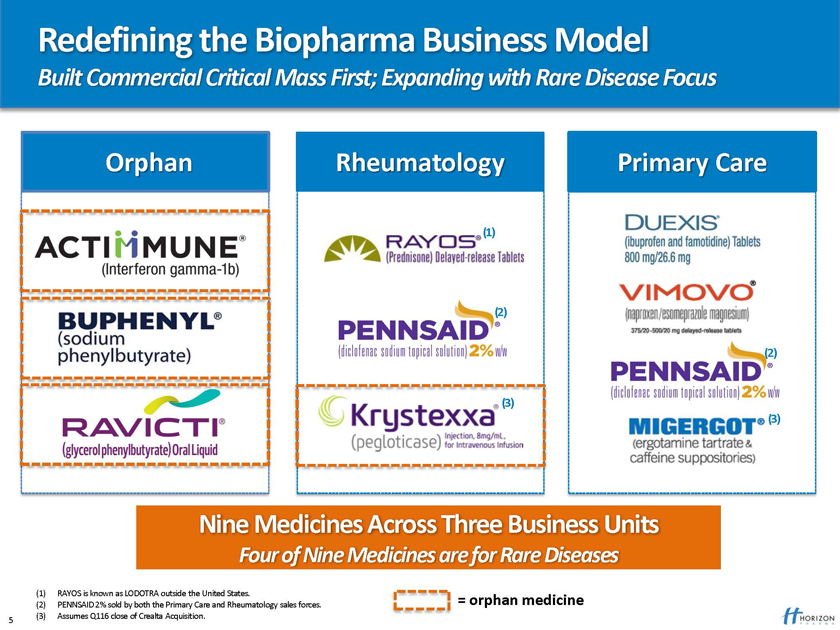
Redefining the Biopharma Business Model
Built Commercial Critical Mass First; Expanding with Rare Disease Focus
Orphan Rheumatology Primary Care
(1)
(2)
(2)
(3)
(3)
Nine Medicines Across Three Business Units
Four of Nine Medicines are for Rare Diseases
(1) RAYOS is known as LODOTRA outside the United States.
(2) PENNSAID 2% sold by both the Primary Care and Rheumatology sales forces. = orphan medicine (3) Assumes Q116 close of Crealta Acquisition.
5
2015 Was a Record Breaking Year for Horizon Pharma
Exceptional Financial Results; Achieved Clinical and M&A Milestones
Guidance of $750 to $760mm in 2015 net sales (1)
More than DOUBLE 2014 net sales
Guidance of $350 to $360mm in 2015 adjusted EBITDA (1)
More than TRIPLE 2014 adjusted EBITDA
Initiated ACTIMMUNE Phase 3 trial in Friedreich’s ataxia (FA) and Phase 1 trial in cancer
Expect FA data December 2016
$500mm to $1bn peak net sales opportunity
Received European regulatory approval for RAVICTI
Expect commercial launch in 2017
Acquired Hyperion (RAVICTI/BUPHENYL) and Announced Crealta (KRYSTEXXA) acquisition
Hyperion expected to generate $100mm in 2016 adjusted EBITDA; Crealta expected to add $45 to $50mm in adjusted EBITDA in 1st year post-close
(1) Represents financial guidance issued on Nov. 6, 2015. By this presentation Horizon is not updating or confirming the prior guidance. 6
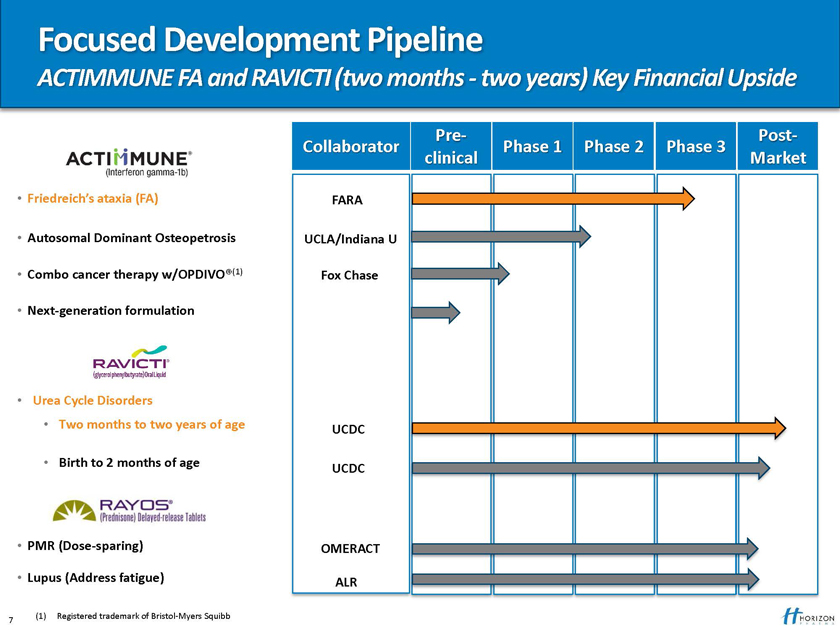
Focused Development Pipeline
ACTIMMUNE FA and RAVICTI (two months—two years) Key Financial Upside
Pre- Post-Collaborator Phase 1 Phase 2 Phase 3 clinical Market
Friedreich’s ataxia (FA) FARA
Autosomal Dominant Osteopetrosis UCLA/Indiana U
Combo cancer therapy w/OPDIVO®(1) Fox Chase
Next-generation formulation
Urea Cycle Disorders
Two months to two years of age UCDC
Birth to 2 months of age
UCDC
PMR (Dose-sparing) OMERACT
Lupus (Address fatigue) ALR
(1) Registered trademark of Bristol-Myers Squibb 7
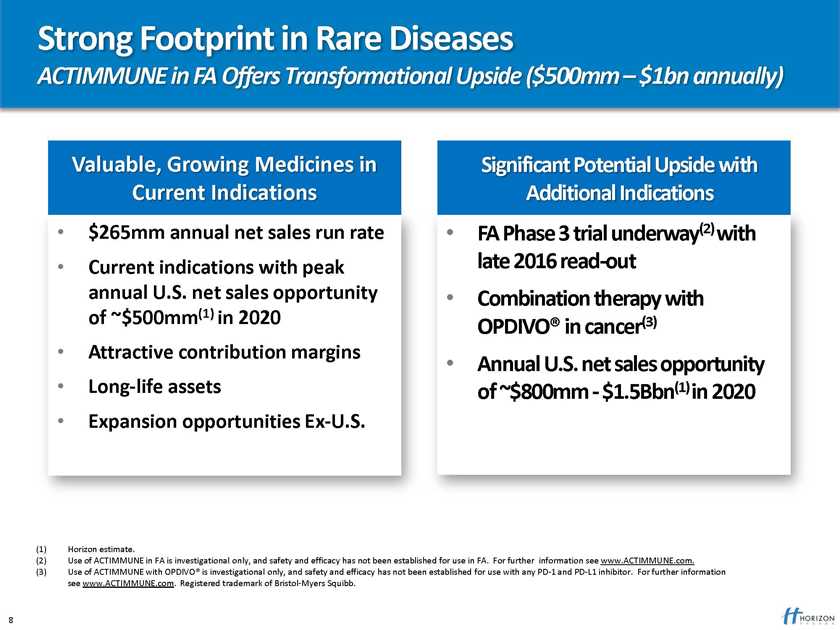
Strong Footprint in Rare Diseases
ACTIMMUNE in FA Offers Transformational Upside ($500mm – $1bn annually)
Valuable, Growing Medicines in Significant Potential Upside with Current Indications Additional Indications
$265mm annual net sales run rate FA Phase 3 trial underway(2) with
Current indications with peak late 2016 read-out annual U.S. net sales opportunity Combination therapy with of ~$500mm(1) in 2020
OPDIVO® in cancer(3)
Attractive contribution margins
Annual U.S. net sales opportunity
Long-life assets of ~$800mm—$1.5Bbn(1) in 2020
Expansion opportunities Ex-U.S.
(1) Horizon estimate.
(2) Use of ACTIMMUNE in FA is investigational only, and safety and efficacy has not been established for use in FA. For further information see www.ACTIMMUNE.com. (3) Use of ACTIMMUNE with OPDIVO® is investigational only, and safety and efficacy has not been established for use with any PD-1 and PD-L1 inhibitor. For further information see www.ACTIMMUNE.com. Registered trademark of Bristol-Myers Squibb.
8
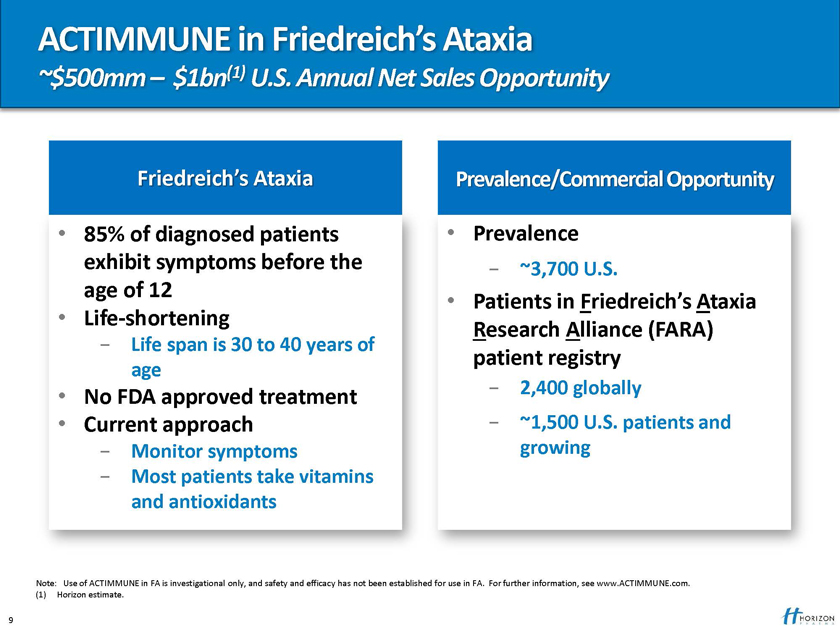
ACTIMMUNE in Friedreich’s Ataxia
~$500mm – $1bn(1) U.S. Annual Net Sales Opportunity
Friedreich’s Ataxia Prevalence/Commercial Opportunity
85% of diagnosed patients Prevalence exhibit symptoms before the—~3,700 U.S. age of 12
Patients in Friedreich’s Ataxia
Life-shortening
Research Alliance (FARA)
- Life span is 30 to 40 years of
patient registry
age
No FDA approved treatment—2,400 globally
Current approach—~1,500 U.S. patients and
- Monitor symptoms growing
- Most patients take vitamins and antioxidants
shed for use in FA. For further information, see www.ACTIMMUNE.com.
9
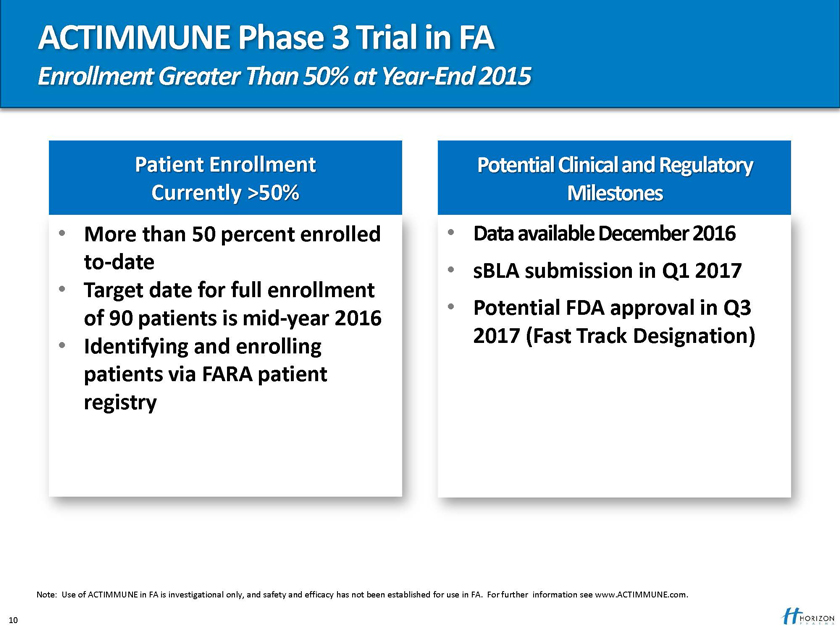
ACTIMMUNE Phase 3 Trial in FA
Enrollment Greater Than 50% at Year-End 2015
Patient Enrollment Potential Clinical and Regulatory Currently >50% Milestones
More than 50 percent enrolled Data available December 2016 to-date sBLA submission in Q1 2017
Target date for full enrollment Potential FDA approval in Q3
of 90 patients is mid-year 2016 2017 (Fast Track Designation)
Identifying and enrolling patients via FARA patient registry
Note: Use of ACTIMMUNE in FA is investigational only, and safety and efficacy has not been established for use in FA. For further information see www.ACTIMMUNE.com.
10
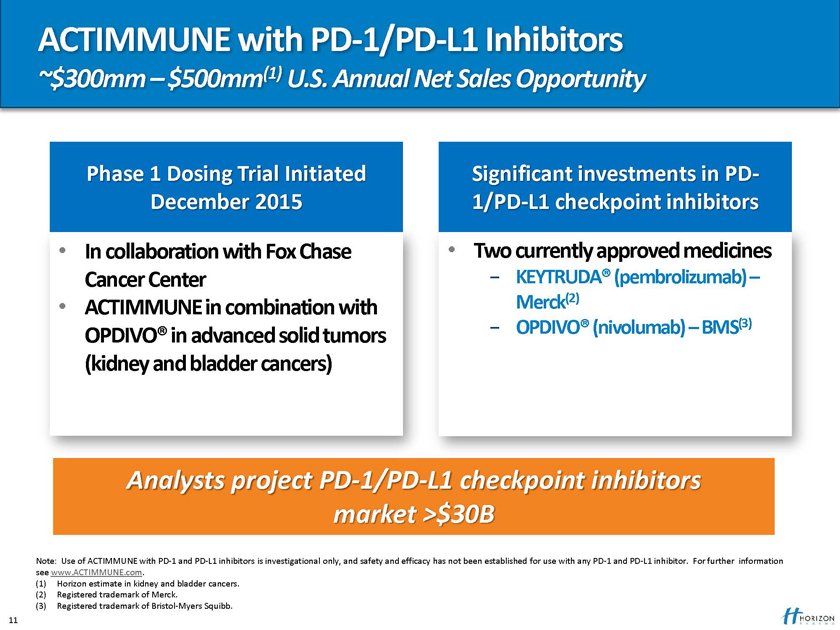
ACTIMMUNE with PD-1/PD-L1 Inhibitors
~$300mm – $500mm(1) U.S. Annual Net Sales Opportunity
Phase 1 Dosing Trial Initiated Significant investments in PD-December 2015 1/PD-L1 checkpoint inhibitors
In collaboration with Fox Chase Two currently approved medicines
Cancer Center —KEYTRUDA® (pembrolizumab) –
ACTIMMUNE in combination with Merck(2)
- OPDIVO® (nivolumab) – BMS(3)
OPDIVO® in advanced solid tumors (kidney and bladder cancers)
Analysts project PD-1/PD-L1 checkpoint inhibitors market >$30B
Note: Use of ACTIMMUNE with PD-1 and PD-L1 inhibitors is investigational only, and safety and efficacy has not been established for use with any PD-1 and PD-L1 inhibitor. For further information see www.ACTIMMUNE.com.
(1) Horizon estimate in kidney and bladder cancers. (2) Registered trademark of Merck.
(3) Registered trademark of Bristol-Myers Squibb. 11
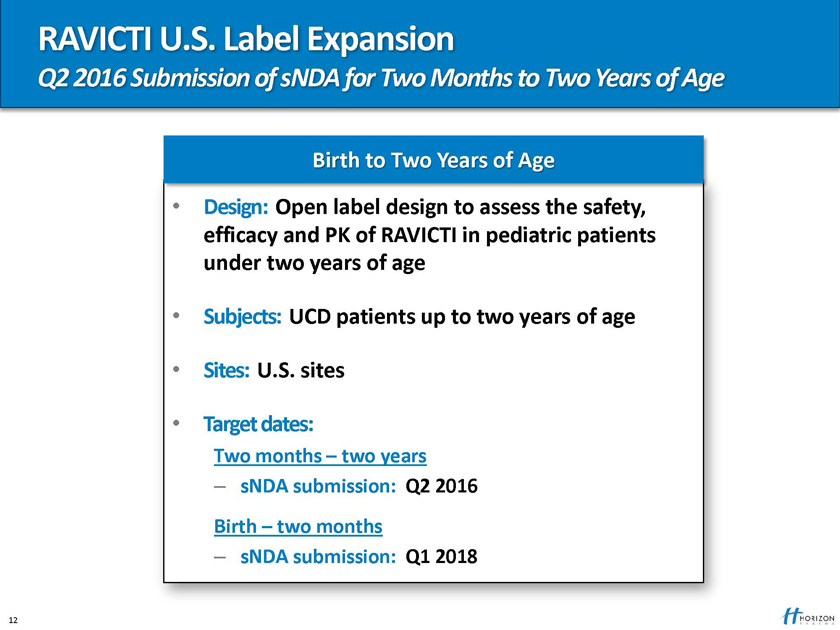
RAVICTI U.S. Label Expansion
Q2 2016 Submission of sNDA for Two Months to Two Years of Age
Birth to Two Years of Age
Design: Open label design to assess the safety, efficacy and PK of RAVICTI in pediatric patients under two years of age
Subjects: UCD patients up to two years of age
Sites: U.S. sites
Target dates:
Two months – two years
– sNDA submission: Q2 2016
Birth – two months
– sNDA submission: Q1 2018
12
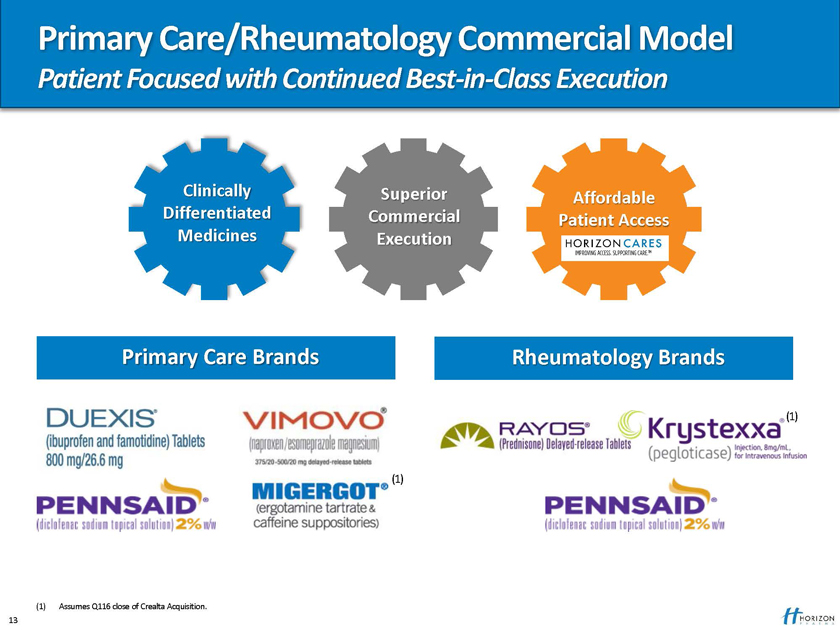
Primary Care/Rheumatology Commercial Model
Patient Focused with Continued Best-in-Class Execution
Clinically Superior Affordable Differentiated Commercial Patient Access Medicines Execution
Primary Care Brands Rheumatology Brands
(1)
(1)
(1) Assumes Q116 close of Crealta Acquisition. 13
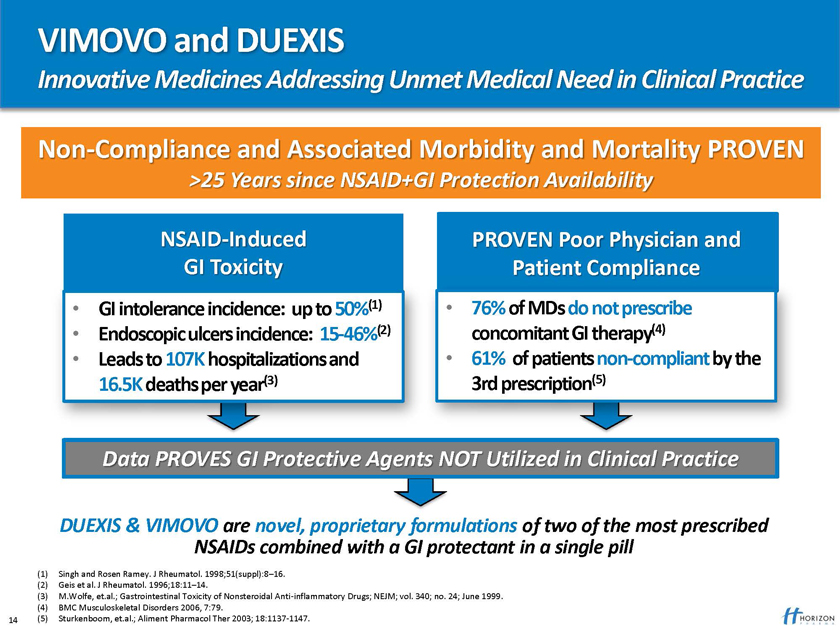
VIMOVO and DUEXIS
Innovative Medicines Addressing Unmet Medical Need in Clinical Practice
Non-Compliance and Associated Morbidity and Mortality PROVEN
>25 Years since NSAID+GI Protection Availability
NSAID-Induced PROVEN Poor Physician and GI Toxicity Patient Compliance
GI intolerance incidence: up to 50%(1) 76% of MDs do not prescribe
Endoscopic ulcers incidence: 15-46%(2) concomitant GI therapy(4)
Leads to 107K hospitalizations and 61% of patients non-compliant by the 16.5K deaths per year(3) 3rd prescription(5)
Data PROVES GI Protective Agents NOT Utilized in Clinical Practice
DUEXIS & VIMOVO are novel, proprietary formulations of two of the most prescribed
NSAIDs combined with a GI protectant in a single pill
(1) Singh and Rosen Ramey. J Rheumatol. 1998;51(suppl):8–16. (2) Geis et al. J Rheumatol. 1996;18:11–14.
(3) M.Wolfe, et.al.; Gastrointestinal Toxicity of Nonsteroidal Anti-inflammatory Drugs; NEJM; vol. 340; no. 24; June 1999. (4) BMC Musculoskeletal Disorders 2006, 7:79.
14 (5) Sturkenboom, et.al.; Aliment Pharmacol Ther 2003; 18:1137-1147.
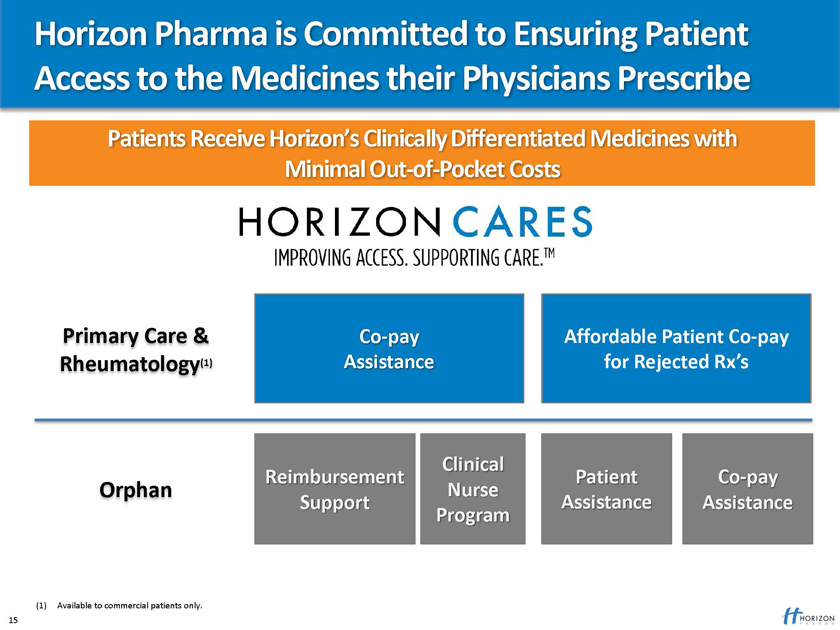
Horizon Pharma is Committed to Ensuring Patient Access to the Medicines their Physicians Prescribe
Patients Receive Horizon’s Clinically Differentiated Medicines with
Minimal Out-of-Pocket Costs
Primary Care & Co-pay Affordable Patient Co-pay
Rheumatology(1) Assistance for Rejected Rx’s
Clinical
Reimbursement Patient Co-pay
Orphan Nurse
Support Assistance Assistance Program
(1) Available to commercial patients only. 15
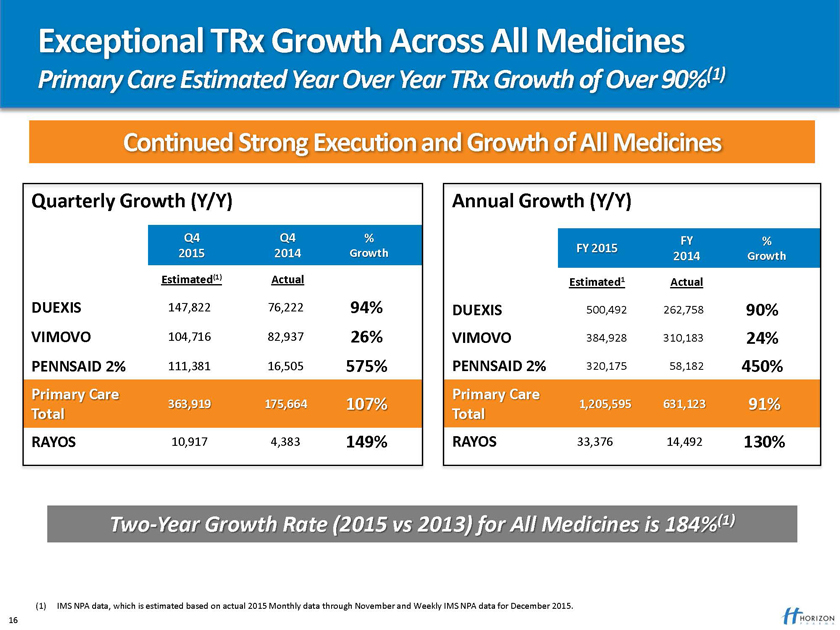
Exceptional TRx Growth Across All Medicines
Primary Care Estimated Year Over Year TRx Growth of Over 90%(1)
Continued Strong Execution and Growth of All Medicines
Quarterly Growth (Y/Y) Annual Growth (Y/Y)
Two-Year Growth Rate (2015 vs 2013) for All Medicines is 184%(1)
(1) IMS NPA data, which is estimated based on actual 2015 Monthly data through November and Weekly IMS NPA data for December 2015. 16
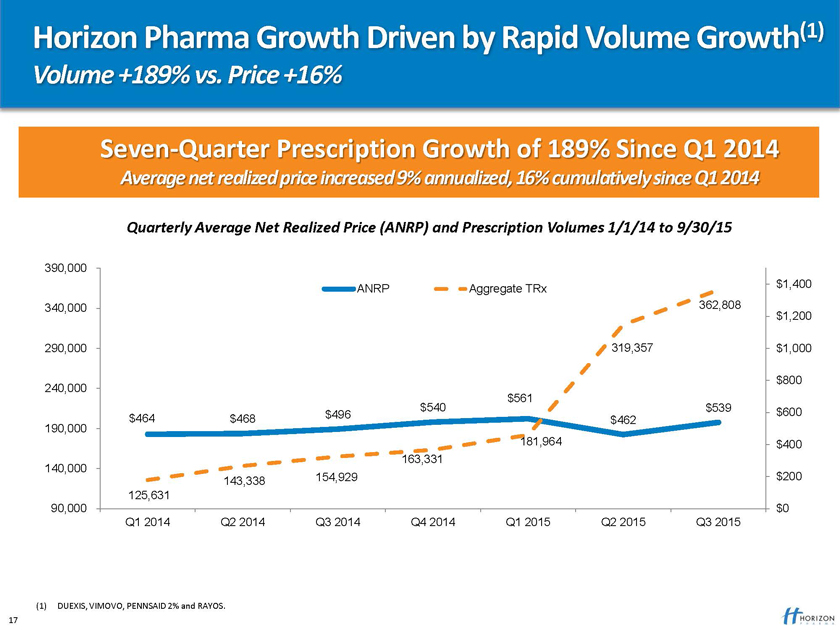
Horizon Pharma Growth Driven by Rapid Volume Growth(1)
Volume +189% vs. Price +16%
Seven-Quarter Prescription Growth of 189% Since Q1 2014
Average net realized price increased 9% annualized, 16% cumulatively since Q1 2014
Quarterly Average Net Realized Price (ANRP) Prescription Volumes 1/1/14 to 9/30/15
390,000
ANRP Aggregate TRx $1,400 340,000 362,808 $1,200
290,000 319,357 $1,000
$800 240,000 $561 $540 $539 $600 $464 $468 $496 $462 190,000 181,964 $400 163,331 140,000 143,338 154,929 $200 125,631 90,000 $0 Q1 2014 Q2 2014 Q3 2014 Q4 2014 Q1 2015 Q2 2015 Q3 2015
(1) DUEXIS, VIMOVO, PENNSAID 2% and RAYOS. 17
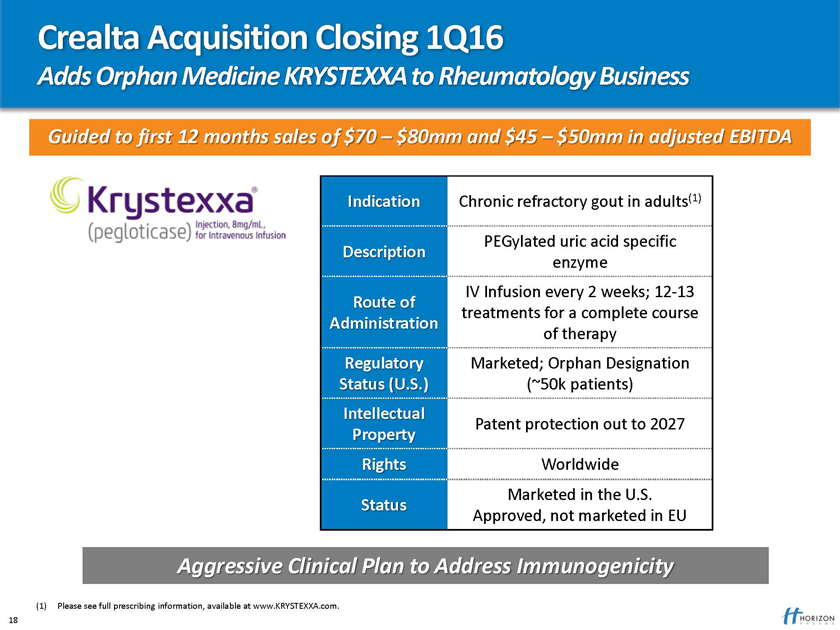
Crealta Acquisition Closing 1Q16
Adds Orphan Medicine KRYSTEXXA to Rheumatology Business
Guided to first 12 months sales of $70 – $80mm and $45 – $50mm in adjusted EBITDA
Indication Chronic refractory gout in adults(1)
PEGylated uric acid specific
Description enzyme
IV Infusion every 2 weeks; 12-13
Route of treatments for a complete course
Administration of therapy
Regulatory Marketed; Orphan Designation Status (U.S.) (~50k patients)
Intellectual
Patent protection out to 2027
Property
Rights Worldwide
Marketed in the U.S.
Status
Approved, not marketed in EU
Aggressive Clinical Plan to Address Immunogenicity
(1) Please see full prescribing information, available at www.KRYSTEXXA.com. 18
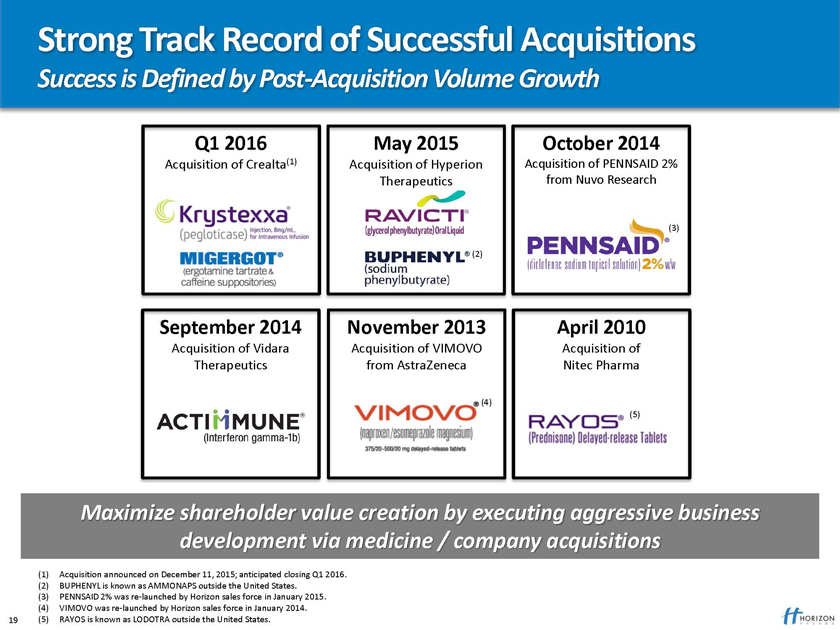
Strong Track Record of Successful Acquisitions
Success is Defined by Post-Acquisition Volume Growth
May 2015 October 2014
Acquisition of Hyperion Acquisition of PENNSAID 2% Therapeutics from Nuvo Research
(3)
(2)
November 2013 April 2010
Acquisition of VIMOVO Acquisition of from AstraZeneca Nitec Pharma
(4)
(5)
Maximize shareholder value creation by executing aggressive business development via medicine / company acquisitions
(1) Acquisition announced on December 11, 2015; anticipated closing Q1 2016. (2) BUPHENYL is known as AMMONAPS outside the United States.
(3) PENNSAID 2% was re-launched by Horizon sales force in January 2015. (4) VIMOVO was re-launched by Horizon sales force in January 2014.
19 (5) RAYOS is known as LODOTRA outside the United States.
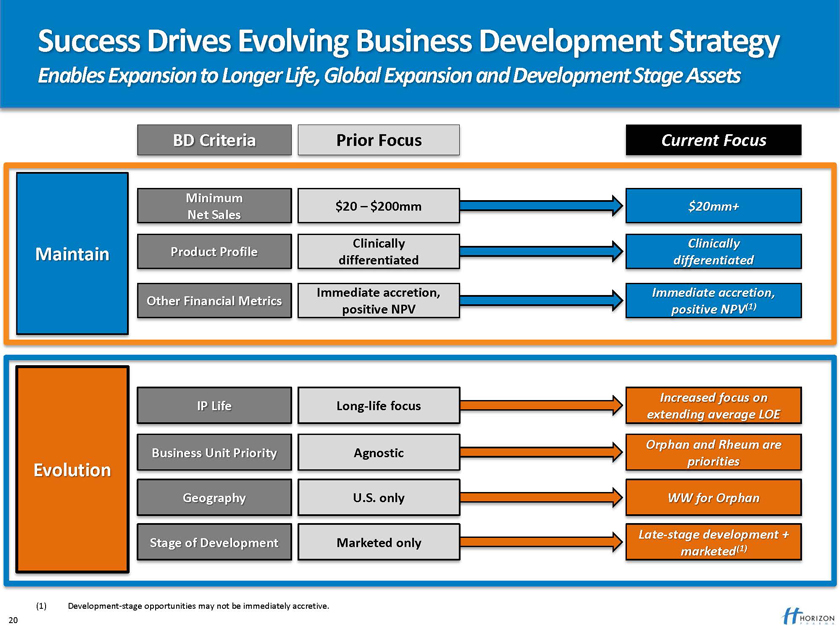
Success Drives Evolving Business Development Strategy
Enables Expansion to Longer Life, Global Expansion and Development Stage Assets
BD Criteria Prior Focus Current Focus
(1) Development-stage opportunities may not be immediately accretive. 20
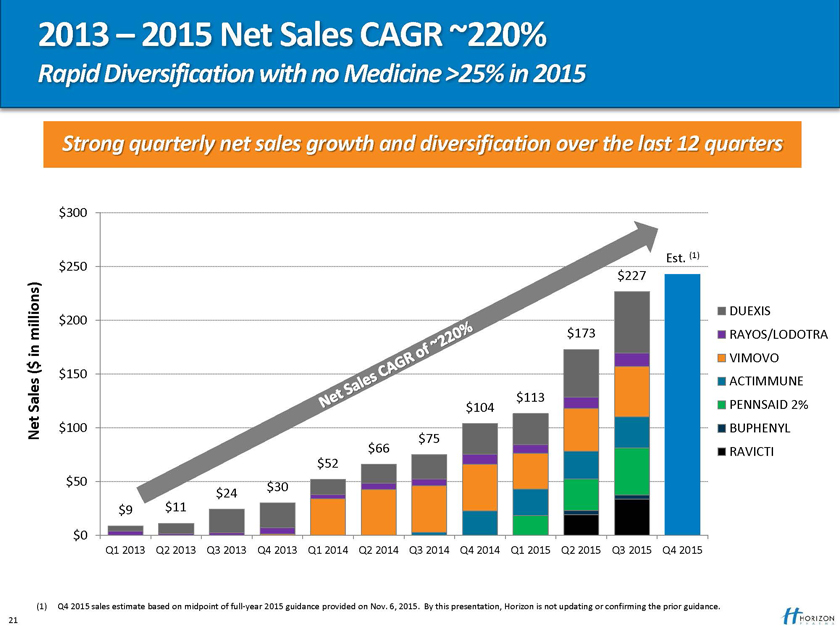
2013 – 2015 Net Sales CAGR ~220%
Rapid Diversification with no Medicine >25% in 2015
Strong quarterly net sales growth and diversification over the last 12 quarters
$300
Est. (1) $250 $227
DUEXIS $200 millions) $173 RAYOS/LODOTRA
in
$ VIMOVO
( $150
ACTIMMUNE $113 Sales PENNSAID 2% Net $100 $75 BUPHENYL
$66 RAVICTI $52 $50 $30 $24
$9 $11 $0
Q1 2013 Q2 2013 Q3 2013 Q4 2013 Q1 2014 Q2 2014 Q3 2014 Q4 2014 Q1 2015 Q2 2015 Q3 2015 Q4 2015
(1) Q4 2015 sales estimate based on midpoint of full-year 2015 guidance provided on Nov. 6, 2015. By this presentation, Horizon is not updating or confirming the prior guidance. 21
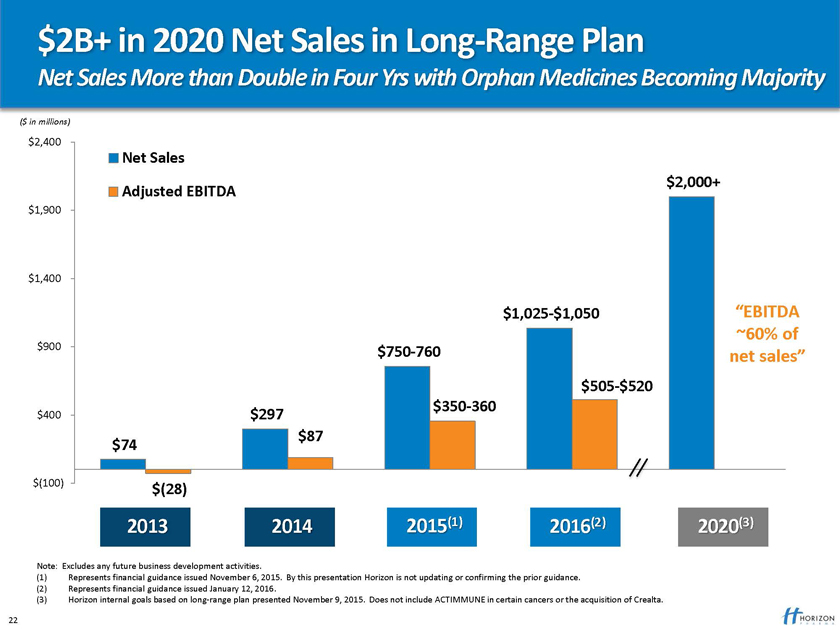
$2B+ in 2020 Net Sales in Long-Range Plan
Net Sales More than Double in Four Yrs with Orphan Medicines Becoming Majority
($ in millions)
$2,400
Net Sales $2,000+ Adjusted EBITDA
$1,900
$1,400
$1,025-$1,050 “EBITDA
~60% of $900 $750-760 net sales” $505-$520 $350-360
$400 $297
$87 $74
$(100) $(28)
2013 2014 2015(1) 2016(2) 2020(3)
Note: Excludes any future business development activities.
(1) Represents financial guidance issued November 6, 2015. By this presentation Horizon is not updating or confirming the prior guidance. (2) Represents financial guidance issued January 12, 2016.
(3) Horizon internal goals based on long-range plan presented November 9, 2015. Does not include ACTIMMUNE in certain cancers or the acquisition of Crealta.
22
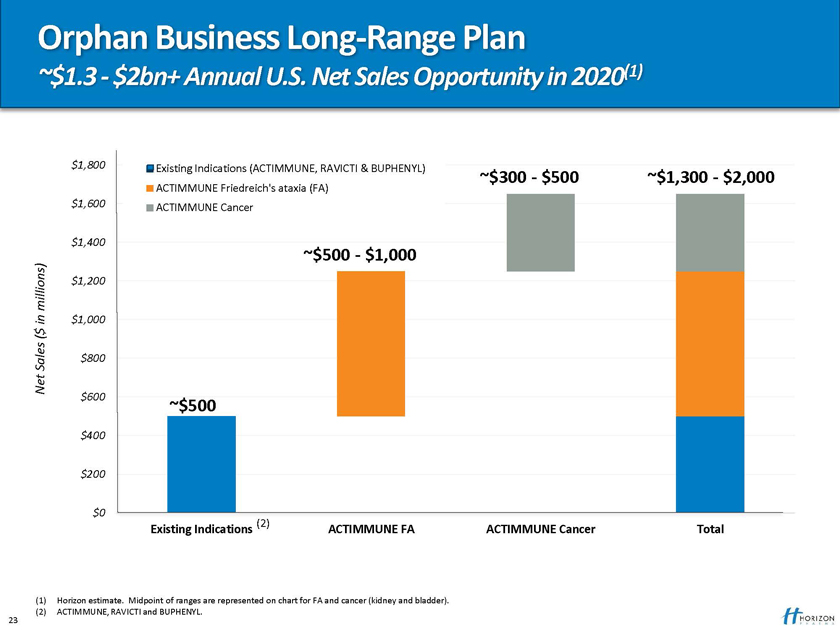
Orphan Business Long-Range Plan
~$1.3—$2bn+ Annual U.S. Net Sales Opportunity in 2020(1)
$1,800 Existing Indications (ACTIMMUNE, RAVICTI & BUPHENYL) ~$300—$500
ACTIMMUNE Friedreich’s ataxia (FA) ~$1,300—$2,000 $1,600 ACTIMMUNE Cancer
$1,400
~$500—$1,000
millions) $1,200 in $1,000 $
(
Sales $800 Net $600
~$500
$400
$200
$0
(2)
Existing Indications ACTIMMUNE FA ACTIMMUNE Cancer Total
(1) Horizon estimate. Midpoint of ranges are represented on chart for FA and cancer (kidney and bladder). (2) ACTIMMUNE, RAVICTI and BUPHENYL.
23
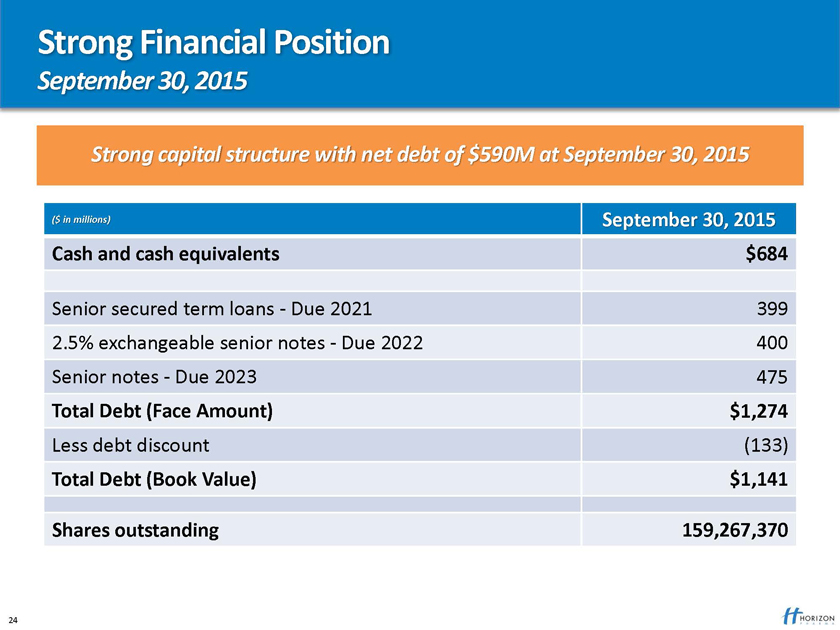
Strong Financial Position
September 30, 2015
Strong capital structure with net debt of $590M at September 30, 2015
($ in millions) September 30, 2015 Cash and cash equivalents $684
Senior secured term loans—Due 2021 399 2.5% exchangeable senior notes—Due 2022 400 Senior notes—Due 2023 475
Total Debt (Face Amount) $1,274
Less debt discount (133)
Total Debt (Book Value) $1,141
Shares outstanding 159,267,370
24
Horizon Pharma: When Patients Benefit, Everyone Benefits
Patients, Providers, Our Company, Our Shareholders & Healthcare System
Helping people live better lives by building a biopharmaceutical company of tomorrow.
Putting patients first by redefining how they access their medicines.
Investing in differentiated medicines that address the challenges faced by patients living with rare diseases.
Fast-growing, profitable company driven by a highly successful commercial model diversified across three business units.
Strong cash flows enabling a disciplined and LAILA – Age 10 – California proven business development strategy. RAVICTI Patient; suffers from a
Urea Cycle Disorder (UCD)
25
Horizon Pharma plc
34th Annual J.P. Morgan Healthcare Conference
January 13, 2016
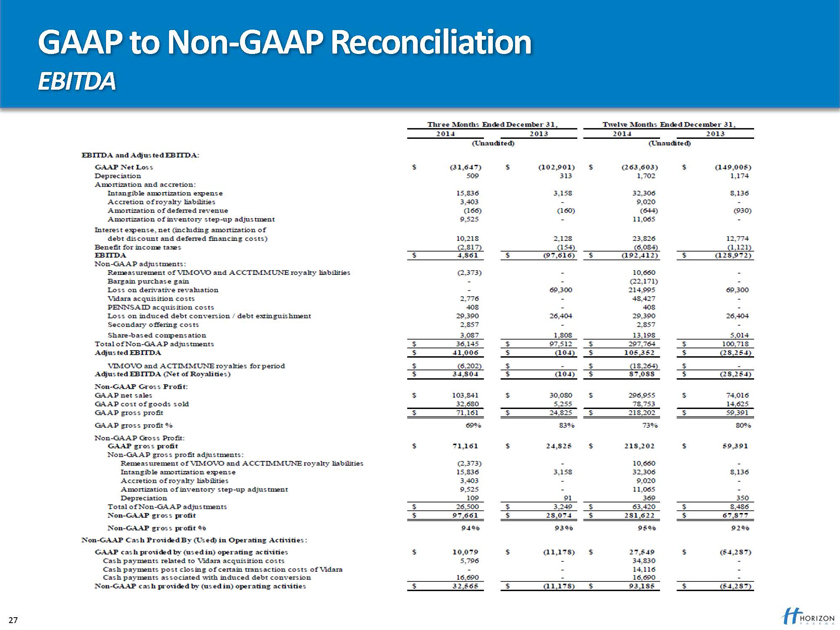
GAAP to Non – GAAP Reconciliation
EBITDA
Three Month Ended December 31, Twelve Month Ended December 31,
2014 2013 2014 2013 (Unaudited ) (Unaudited ) EBITA and Adjusted EBITA DA: GAAP Net Loss $(31647)$ (102901) $ (263603) $ (149005) Depreciation 509 313 1702 1174 Amortization and accretion Intangible amortization expense 15836 3158 32306 8136 Accretion of royalty liabilities 3403 - 9020 - Amortization of deferred revenue (166) (160) (644) (930) Amortization of inventory step-up adjustment 9525 - 11064 - interest expense, net (including amortization of dept discount and deferred financing costs) 10218 2128 23826 12774 Benefit for income taxes (2817) (154) (6084) (1121) EBITDA $ 4861 $ (97616) $ (192412) $ (128972)
EBITDA GAAP
Non GAAP adjustments remeasurement of VIMOVO and ACCTIMMUNE royalty liabilities (2,373) – 10,660 – Bargain purchase gain - - (69,300) 214,995 69,300 loss on derivative revaluation 2,776 - - 48,27 – Vidara acquisition costs 408 - - 408 - PENNSAID acquisition costs 29,390 26,404 29,390 26,404 loss on induced debt conversion/debt extinguishment 29,390 26,404 29,390 26,404 secondary offering costs 2,857 – 2,857 - share based compensation 3,087 1,808 13,198 5,014 total of non adjustments $ 36,145 $ 97,512 $ 297,764 $ 100,718 Adjusted EBITDA $ 41,006 $ (104) $ 105,352 $ (28,254) VIMOVO AND ACTIMMUNE royalties for period $(6,202) $ - $ (18,264) $ - Adjusted EBTDA(Net of Royalties) $ 34,804 $ $ (104) $ 87,088 $ (28,254) Non-GAAP Gross Profit: GAAP net sales $ 103,841 $ 30,080 $ 296,955 $ 74,016 GAAP cost of goods sold 32,680 5,255 78,753 14,625 GAAP gross profit $ 71,161 $ 24,825 $ 218,202 $ 59,391 GAAP gross profit% 69% 83% 73% 80% Non-GAAP Gross profit $ 71,161 $ 24,825 $ 218,202 $ 59,391 Non GAAP -gross profit adjustment: Remeasurement of VIMOVO and ACCTIMMUNE royalty liabilities (2,373) - 10,660 - Intangible amortization expense 15,836 3,158 32,306 8,136 Accretion of royalty liabilities 3,403 - 9,020 - Amortization of inventory step – up adjustment 9,525 – 11,065 - Depreciation 109 91 369 350 Total of non – GAAP adjustment $ 26,500 $ 3,249 $ 63, 420 $ 8,486 Non GAAP gross profit $ 97,661 $ 28,074 $ 281,622 $ 67,877 Non –GAAP gross profit 94% 93% 95% 92% Non- GAAP Cash Provided by (USED) in Operating Activities: GAAP cash Provided by (used in ) operating activities $ 10,079 $ (11,178) $ 27,549 $ (54,287) cash payments related to Vidara acquisition costs 5,796 - 34,830 - cash payments post closing of certain transaction costs of Vidara - - 14,116 - cash payments associated with induced debt conversion 16,690 - 16,690 - Non- GAPP cash provided by (used in) operating activities $32,565 $(11,178) $93,186 $(54,287)
|

|
Horizon Pharma plc
34th Annual J.P. Morgan Healthcare Conference
January 13, 2016