Table of Contents
As filed with the Securities and Exchange Commission on July 21, 2010
RegistrationNo. 333-
UNITED STATES SECURITIES AND EXCHANGE COMMISSION
Washington, D.C. 20549
Form S-1
REGISTRATION STATEMENT
UNDER
THE SECURITIES ACT OF 1933
Swift Holdings Corp.
(Exact name of Registrant as specified in its charter)
Delaware (State or other jurisdiction of incorporation or organization) | 4213 (Primary Standard Industrial Classification Code Number) | 27-2646153 (I.R.S. Employer Identification Number) |
2200 South 75th Avenue
Phoenix, Arizona 85043
(602)��269-9700
(Address, including zip code, and telephone number, including area code, of Registrant’s principal executive offices)
Phoenix, Arizona 85043
(602)��269-9700
(Address, including zip code, and telephone number, including area code, of Registrant’s principal executive offices)
James Fry
Executive Vice President, General Counsel and Corporate Secretary
Swift Holdings Corp.
2200 South 75th Avenue
Phoenix, Arizona 85043
(602) 269-9700
(Name, address, including zip code, and telephone number, including area code, of agent for service)
Executive Vice President, General Counsel and Corporate Secretary
Swift Holdings Corp.
2200 South 75th Avenue
Phoenix, Arizona 85043
(602) 269-9700
(Name, address, including zip code, and telephone number, including area code, of agent for service)
Copies to:
| Richard B. Aftanas, Esq. Stephen F. Arcano, Esq. Skadden, Arps, Slate, Meagher & Flom LLP Four Times Square New York, New York10036-6522 (212) 735-3000 | Mark A. Scudder, Esq. Earl H. Scudder, Esq. Scudder Law Firm, P.C., L.L.O. 411 South 13th Street Lincoln, Nebraska 68508 (402) 435-3223 | Andrew Keller, Esq. Lesley Peng, Esq. Simpson Thacher & Bartlett LLP 425 Lexington Avenue New York, New York 10017-3954 (212) 455-2000 |
Approximate date of commencement of proposed sale to the public: As soon as practicable after the effective date of this Registration Statement.
If any of the securities being registered on this Form are to be offered on a delayed or continuous basis pursuant to Rule 415 under the Securities Act of 1933 (the “Securities Act”) check the following box. o
If this Form is filed to register additional securities for an offering pursuant to Rule 462(b) under the Securities Act, please check the following box and list the Securities Act registration statement number of the earlier effective registration statement for the same offering. o
If this Form is a post-effective amendment filed pursuant to Rule 462(c) under the Securities Act, check the following box and list the Securities Act registration statement number of the earlier effective registration statement for the same offering. o
If this Form is a post-effective amendment filed pursuant to Rule 462(d) under the Securities Act, check the following box and list the Securities Act registration statement number of the earlier effective registration statement for the same offering. o
Indicate by check mark whether the registrant is a large accelerated filer, an accelerated filer, a non-accelerated filer, or a smaller reporting company. See the definitions of “large accelerated filer,” “accelerated filer” and “smaller reporting company” inRule 12b-2 of the Securities Exchange Act of 1934 (the “Exchange Act”). (Check one):
Large accelerated filer o | Accelerated filer o | Non-accelerated filer þ (Do not check if a smaller reporting company) | Smaller Reporting company o |
CALCULATION OF REGISTRATION FEE
| Proposed Maximum | Amount of | |||||
| Title of Each Class of | Aggregate | Registration | ||||
| Securities to be Registered | Offering Price(1)(2) | Fee | ||||
| Class A Common Stock, par value $0.001 per share | $700,000,000 | $49,910 | ||||
| (1) | Includes shares to be sold upon exercise of the underwriters’ over-allotment option. See “Underwriting.” | |
| (2) | Estimated solely for the purpose of calculating the amount of the registration fee pursuant to Rule 457(o) under the Securities Act. |
The Registrant hereby amends this Registration Statement on such date or dates as may be necessary to delay its effective date until the registrant shall file a further amendment which specifically states that this Registration Statement shall thereafter become effective in accordance with Section 8(a) of the Securities Act, or until the Registration Statement shall become effective on such date as the Commission, acting pursuant to said Section 8(a), may determine.
Table of Contents
| The information in this preliminary prospectus is not complete and may be changed. We may not sell these securities until the registration statement filed with the Securities and Exchange Commission is effective. This preliminary prospectus is not an offer to sell these securities, and we are not soliciting an offer to buy these securities in any state where the offer or sale thereof is not permitted. |
SUBJECT TO COMPLETION, DATED JULY 21, 2010
Preliminary Prospectus
shares
Swift Holdings Corp.

Class A common stock
This is an initial public offering of shares of Class A common stock by Swift Holdings Corp. Immediately prior to the consummation of this offering, Swift Corporation, a Nevada corporation, will merge with and into Swift Holdings Corp., with Swift Holdings Corp. surviving as a Delaware corporation.
We are selling shares of Class A common stock. We will have two classes of authorized common stock. The rights of holders of Class A common stock and Class B common stock are identical, except with respect to voting and conversion. Holders of our Class A common stock are entitled to one vote per share and holders of our Class B common stock are entitled to two votes per share. Each share of Class B common stock is convertible into one share of Class A common stock at any time and automatically converts into one share of Class A common stock upon the occurence of certain events. The estimated initial public offering price is between $ and $ per share.
We intend to apply to list our Class A common stock for trading on the under the symbol “SWFT”.
| Per Share | Total | |||||||
| Initial public offering price | $ | $ | ||||||
| Underwriting discounts and commissions | $ | $ | ||||||
| Proceeds to us, before expenses | $ | $ | ||||||
We have granted the underwriters an option for a period of 30 days to purchase from us up to additional shares of Class A common stock at the initial public offering price, less underwriting discounts and commissions.
Investing in our Class A common stock involves a high degree of risk. See “Risk Factors” beginning on page 16.
Neither the Securities and Exchange Commission nor any state securities commission has approved or disapproved of these securities or passed on the adequacy or accuracy of this prospectus. Any representation to the contrary is a criminal offense.
The underwriters expect to deliver the shares of Class A common stock to purchasers on or about , 2010.
| Morgan Stanley | BofA Merrill Lynch | Wells Fargo Securities |
, 2010
You should rely only on the information contained in this prospectus or in any free writing prospectus that we authorize to be delivered to you. Neither we nor the underwriters have authorized anyone to provide you with additional or different information. If anyone provides you with additional, different, or inconsistent information, you should not rely on it. We and the underwriters are not making an offer to sell these securities in any jurisdiction where an offer or sale is not permitted. You should assume that the information in this prospectus is accurate only as of the date on the front cover, regardless of the time of delivery of this prospectus or of any sale thereof of our Class A common stock. Our business, prospects, financial condition, and results of operations may have changed since that date.
No action is being taken in any jurisdiction outside the United States to permit a public offering of the Class A common stock or possession or distribution of this prospectus in that jurisdiction. Persons who come into possession of this prospectus in jurisdictions outside the United States are required to inform themselves about and to observe any restrictions as to this offering and the distribution of this prospectus applicable to that jurisdiction.
TABLE OF CONTENTS
| Page | ||||||||
| ii | ||||||||
| ii | ||||||||
| iii | ||||||||
| 1 | ||||||||
| 16 | ||||||||
| 34 | ||||||||
| 36 | ||||||||
| 37 | ||||||||
| 38 | ||||||||
| 39 | ||||||||
| 41 | ||||||||
| 43 | ||||||||
| 47 | ||||||||
| 81 | ||||||||
| 84 | ||||||||
| 102 | ||||||||
| 110 | ||||||||
| 119 | ||||||||
| 121 | ||||||||
| 125 | ||||||||
| 131 | ||||||||
| 133 | ||||||||
| 136 | ||||||||
| 137 | ||||||||
| 142 | ||||||||
| 142 | ||||||||
| 142 | ||||||||
| F-1 | ||||||||
| A-1 | ||||||||
| EX-10.3 | ||||||||
| EX-10.4 | ||||||||
| EX-10.5 | ||||||||
| EX-10.6 | ||||||||
| EX-10.7 | ||||||||
| EX-10.8 | ||||||||
| EX-10.9 | ||||||||
| EX-21.1 | ||||||||
| EX-23.1 | ||||||||
Table of Contents
About This Prospectus
Except as otherwise indicated, information in this prospectus:
| • | assumes the underwriters have not exercised their option to purchase additional shares of Class A common stock from us; and | |
| • | assumes the consummation of the merger and recapitalization, as described under “Reorganization,” and the filing of our amended and restated certificate of incorporation, all of which will occur prior to the consummation of this offering. |
In this prospectus, we refer to our Class A common stock and our Class B common stock together as our “common stock.”
In this prospectus, we refer to the following as the “2007 Transactions”: (i) Jerry and Vickie Moyes’ April 7, 2007 contribution of 1,000 shares of common stock of Interstate Equipment Leasing, Inc. (now Interstate Equipment Leasing, LLC), or IEL, constituting all issued and outstanding shares of IEL, to Swift Corporation, in exchange for 10,649,000 shares of Swift Corporation’s common stock, (ii) the May 9, 2007 contribution by Jerry Moyes and various trusts established for the benefit of his family members of 28,792,810 shares of Swift Transportation Co., Inc. common stock, representing 38.3% of the then outstanding common stock of Swift Transportation Co., Inc., in exchange for 64,495,892 shares of Swift Corporation’s common stock, and (iii) Swift Corporation’s May 10, 2007 acquisition of Swift Transportation Co., Inc. by a merger. We refer to Swift Transportation Co., Inc. as our “predecessor” prior to the 2007 Transactions, and to Swift Corporation as our “successor” following the 2007 Transactions.
Our audited results of operations include the full year presentation of Swift Corporation as of and for the year ended December 31, 2007. Swift Corporation was formed in 2006 for the purpose of acquiring Swift Transportation Co., Inc., but that acquisition was not completed until May 10, 2007 and, as such, Swift Corporation had nominal activity from January 1, 2007 through May 10, 2007. The results of Swift Transportation Co, Inc. from January 1, 2007 to May 10, 2007 and IEL from January 1, 2007 to April 7, 2007 are not reflected in the audited results of Swift Corporation for the year ended December 31, 2007.
However, our unaudited pro forma results of operations for the year ended December 31, 2007 give effect to the 2007 Transactions as if they were effective on January 1, 2007. Unless otherwise noted in this prospectus, the discussion of financial and operating data for the year ended December 31, 2007 included in the section entitled “Management’s Discussion and Analysis of Financial Condition and Results of Operations” is based on our unaudited pro forma results of operations. See “Pro Forma Condensed Consolidated Statement of Operations (Unaudited) for the Year Ended December 31, 2007” in Annex A to this prospectus.
Market and Industry Data
This prospectus contains market data related to our business and industry and forecasts that we obtained from industry publications and surveys and our internal sources. American Trucking Associations, Inc., or the ATA, and Americas Commercial Transportation Research, Co., LLC, or ACT Research, were the primary independent sources of industry and market data. We believe that the ATA and ACT Research data used in this prospectus reflect the most recently available information. Some data and other information also are based on our good faith estimates, which are derived from our review of internal surveys and independent sources.
All data provided by the ATA are publicly available, while data provided by ACT Research can be obtained by subscription. We have not paid for the compilation of any market or industry data contained in this prospectus, and such data were not specifically prepared for such use. The market and industry data contained in this prospectus have been included herein with the permission of their respective authors, as necessary.
Although we believe that all industry publications and reports cited herein are reliable, neither we nor the underwriters have independently verified the data. Our internal data and estimates are based upon information obtained from our customers, suppliers, trade and business organizations, contacts in the industry in which we operate, and management’s understanding of industry conditions. Although we believe that such information is reliable, we have not had such information verified by independent sources.
ii
Table of Contents
Glossary of Trucking Terms
“Average loaded length of haul”means the average number of miles we drive for our customers from origin to destination of a load and excludes the miles and loads from our intermodal and brokerage operations.
“Average tractors available”means the weighted average number of company and owner-operator tractors in our active service fleet that are available to be dispatched to haul customer freight during the relevant period. This includes tractors that are able to be dispatched but have not been assigned to a driver or are otherwise unstaffed.
“Brokerage”or“freight brokerage”means the customer loads for which we contract with third-party trucking companies to haul instead of hauling the load using our own equipment. Our use of freight brokerage supplements our capacity and allows us to provide service to our customers on loads that do not fit our preferred lanes.
“Class 8 truck”means trucks over 33,000 pounds in gross vehicle weight. Our tractor fleet is comprised of Class 8 trucks.
“Core carrier”means a shipper’s preferred truckload carrier. Generally, shippers utilize a core carrier or core carrier group to improve service levels, reduce the complexity involved with managing a large number of carriers, and experience efficiencies created through the level of trust, shipment density, and communication frequency associated with a core carrier.
“CSA 2010”means the Federal Motor Carrier Safety Administration’s new Comprehensive Safety Analysis 2010 program that ranks both fleets and individual drivers on seven categories of safety-related data. CSA 2010 will eventually replace the current Safety Status measurement system used by the Federal Motor Carrier Safety Administration.
“C-TPAT”means the Customs-Trade Partnership Against Terrorism, a program designed to improve cross-border security between the United States and Canada and the United States and Mexico. Carrier members of the C-TPAT are entitled to shorter border delays and other priorities over non-member carriers.
“Deadhead miles”means the miles driven without revenue-generating freight being transported.
“Deadhead miles percentage”means the percentage of total miles represented by deadhead miles.
“Dedicated contracts”means those contracts in which we have agreed to dedicate certain tractor and trailer capacity for use by a specific customer. Dedicated contracts often have predictable routes and revenue, and frequently replace all or part of a shipper’s private fleet. Dedicated contracts are generally three- to five-year contracts and are priced using a model that analyzes the cost elements, including revenue equipment, insurance, fuel, maintenance, drivers needed, and mileage.
“Drayage”means the transport of shipping containers from a dock or port to an intermediate or final destination or the transport of containers or trailers between pickup or delivery locations and a railhead. We generally utilize third parties or directly provide drayage in thepick-up and delivery associated with an intermodal movement or for thepick-up and delivery to and from an ocean shipping port and an inland destination.
“Drop yards”means those locations at which we periodically park trailers.
“Dry van”means an enclosed, non-refrigerated trailer generally used to carry goods.
“Flatbed”means an open truck bed or trailer with no sides, used to carry large objects such as heavy machinery and building materials.
“For-hire truckload carriers”means a truckload carrier available to shippers for hire.
“Intermodal”means the transport of shipping containers or trailers on railroad flat cars before or after a movement by truck from the point of origin to the railhead or from the railhead to the destination. We focus on intermodal service as an alternative to placing additional tractors and drivers in lanes that are significantly longer than our average length of haul or for which rail service otherwise provides competitive service.
iii
Table of Contents
“Less-than-truckload carrier”or“LTL carrier”means carriers that pick up and deliver multiple shipments, each typically weighing less than 10,000 pounds, for multiple customers in a single trailer.
“Linehaul”means the movement of freight on a designated route between cities and terminals.
“Loaded mile”means a mile that is driven for a customer, for which we are compensated.
“Owner-operator”means an independent contractor who is utilized through a contract with us to supply one or more tractors and drivers for our use. Our owner-operators are generally compensated on aper-mile basis and must pay their own operating expenses, such as fuel, maintenance, the truck’s physical damage insurance, and driver costs, and must meet our specified standards with respect to safety.
“Private fleet”means the tractors and trailers owned or leased by a shipper to transport its own goods.
“Private fleet outsourcing”means the decision by shippers using private trucking fleets to outsource all or a portion of their transportation and logistics requirements to for-hire truckload carriers. Some shippers that previously maintained their own private fleets outsource this function to truckload carriers, like us, to reduce operating costs and to focus their resources on their core businesses.
“Stop-off pay”means the compensation we receive from customers for interrupting a haul to pick up or unload a portion of the load.
“Temperature controlled”means an enclosed, refrigerated trailer, generally used to carry perishable goods.
“Trucking revenue”means all revenue generated from our general truckload, dedicated, cross-border, and other trucking operations, and excludes fuel surcharges, income from owner-operator financing, revenue from intermodal, brokerage, and logistics operations, revenue generated by our shop operations, and third-party premium revenue from our captive insurance companies.
“Truck tonnage”means the total weight in tons transported by the motor carrier industry for a given period.
“Truckload carrier”means a carrier that generally dedicates an entire trailer to one customer from origin to destination.
“Weekly trucking revenue per tractor”means the trucking revenue for a given period divided by the number of weeks in the period, then divided by the average tractors available for that period.
iv
Table of Contents
Prospectus Summary
This summary highlights significant aspects of our business and this offering, but it is not complete and does not contain all of the information that you should consider before making your investment decision. You should carefully read this entire prospectus, including the information presented under the section entitled “Risk Factors” and the historical and pro forma financial data and related notes, before making an investment decision. This summary contains forward-looking statements that involve risks and uncertainties. Our actual results may differ significantly from the results discussed in the forward-looking statements as a result of certain factors, including those set forth in “Risk Factors” and “Special Note Regarding Forward-Looking Statements.”
Unless we state otherwise or the context otherwise requires, references in this prospectus to “Swift,” “we,” “our,” “us,” and the “Company” for all periods subsequent to the reorganization transactions described in the section entitled “Reorganization” (which will be completed in connection with this offering) refer to Swift Holdings Corp., a newly formed Delaware corporation, and its consolidated subsidiaries after giving effect to such reorganization transactions. For all periods from May 11, 2007 until the completion of such reorganization transactions, these terms refer to Swift Corporation, a Nevada corporation, which also is referred to herein as our “successor,” and its consolidated subsidiaries. For all periods prior to May 11, 2007, these terms refer to Swift Corporation’s predecessor, Swift Transportation Co., Inc., a Nevada corporation that has been converted to a Delaware limited liability company known as Swift Transportation Co., LLC, which also is referred to herein as Swift Transportation, or our “predecessor,” and its consolidated subsidiaries.
Summary
Overview
We are a multi-faceted transportation services company and the largest truckload carrier in North America. At March 31, 2010, we operated approximately 12,500 company-owned tractors, 3,700 owner-operator tractors, 49,400 trailers, and 4,300 intermodal containers from 35 major terminals strategically positioned throughout the United States and Mexico. Our extensive suite of services makes us an attractive choice for a broad array of customers. Our asset-based transportation services include dry van, dedicated, temperature controlled, cross border, and port drayage operations. Our complementary and more rapidly growing “asset-light” services include rail intermodal, freight brokerage, and third-party logistics operations. We use sophisticated technologies and systems that contribute to asset productivity, operating efficiency, customer satisfaction, and safety. We believe our fleet capacity, terminal network, customer service, and breadth of services provide significant advantages over many of our competitors. For the twelve months ended March 31, 2010, we generated operating revenue of approximately $2.6 billion.
We principally operate inshort-to-medium-haul traffic lanes around our terminals, with an average loaded length of haul of less than 500 miles. We concentrate on this length of haul because the majority of domestic truckload freight (as measured by revenue) moves in these lanes and our extensive terminal network affords us marketing, equipment control, supply chain, customer service, and driver retention advantages in local markets. Our relatively short average length of haul also helps reduce competition from railroads and trucking companies that lack a regional presence.
Our senior management team is led by our founder and Chief Executive Officer, Jerry Moyes. Between 1991 (our first full year as a public company) and 2006 (our last full year as a public company), our annual operating revenue grew to $3.2 billion and our Adjusted EBITDA grew to $498.6 million, which represented, respectively, compounded annual growth rates of 21% and 22%. In conjunction with taking Swift private in 2007, Mr. Moyes returned as our Chief Executive Officer and elevated to senior management several long-time Swift executives as part of his plan to re-focus our priorities and establish a corporate culture centered on long-term success. The twelve members of our senior leadership team have an average of nearly 20 years of industry experience.
Our new management has implemented strategic initiatives that have concentrated on rebuilding our owner-operator program, expanding our faster growing and less asset-intensive services, re-focusing our
1
Table of Contents
customer service efforts, and implementing accountability and cost discipline throughout our operations. As a result of these initiatives, during the recent economic recession, amidst industry-wide declining tonnage and pricing levels, we maintained consistent Adjusted EBITDA between 2007 and 2009 despite a $476.3 million, or 17.2%, reduction in operating revenue (excluding fuel surcharges) and improved our Adjusted Operating Ratio by 60 basis points from fiscal year 2008 to fiscal year 2009 and by 330 basis points in the first quarter of 2010 compared with the first quarter of 2009.
We have incentivized senior management with equity awards and have tied bonuses to Adjusted EBITDA targets to maintain our focus on disciplined growth and market leadership. For an explanation of Adjusted EBITDA and a reconciliation of net income to Adjusted EBITDA, as well as an explanation and reconciliation of Adjusted Operating Ratio, see footnotes 7 and 8 to “Summary Historical Consolidated Financial and Other Data.” Going forward, we intend to emphasize profitable revenue growth, improved asset utilization, return on investment, and cost control through improving operating efficiency and maintaining fiscal discipline.
Our Business
Many of our customers are large corporations with extensive operations, geographically distributed locations, and diverse shipping needs. We offer the opportunity for “one-stop-shopping” for their truckload transportation needs through a broad spectrum of services and equipment, including the following:
| Approximate | ||||||||
| Percentage of Total | ||||||||
| Operating Revenue | ||||||||
| 2009 | 2006 | |||||||
• General truckload service, which consists of one-way movements over irregular routes throughout the United States and in Canada through dry van, temperature controlled, flatbed, or specialized trailers, as well as drayage operations, using both company tractors and owner-operator tractors | 67.2 | % | 71.3 | % | ||||
• Dedicated truckload service, in which we devote exclusive use of equipment and offer tailored solutions under long-term contracts, generally with higher operating margins and lower driver turnover | 18.7 | % | 22.7 | % | ||||
• Cross-border Mexico/U.S. truckload service, through Trans-Mex, Inc. S.A. de C.V., or Trans-Mex, our wholly-owned subsidiary that is one of the largest trucking companies in Mexico with service throughout Mexico and through every major border crossing between the United States and Mexico | 2.4 | % | 1.6 | % | ||||
• Rail intermodal service, which involves arranging for rail service for primary freight movement and related drayage service and requires lower tractor investment than general truckload service, making it one of our less asset-intensive services | 6.2 | % | 2.9 | % | ||||
• Non-asset based freight brokerage and logistics management services, in which we offer our transportation management expertise and/or arrange for other trucking companies to haul freight that does not fit our network, earning us a revenue share with little investment | 1.4 | % | 0.3 | % | ||||
• Other revenue generating services. In addition to the services referenced above, we offer services that include providing tractor leasing arrangements through IEL to owner-operators, underwriting insurance through our wholly-owned captive insurance companies, and repair services through our maintenance and repair shops to our owner-operators and third parties | 4.1 | % | 1.2 | % | ||||
Since 2006, our asset-light rail intermodal and freight brokerage and logistics services have grown rapidly, and we expanded owner-operators from 16.5% of our total fleet at year-end 2006 to 23.0% of our total fleet at March 31, 2010. Going forward, we intend to continue to expand our revenue from these operations to improve our overall returns on capital.
2
Table of Contents
Industry Opportunity
Our industry is large, fragmented, and highly competitive. The U.S. trucking industry was estimated by the ATA to have generated $544.4 billion in revenue in 2009, of which approximately $259.6 billion was attributed to private fleets operated by shippers and $246.2 billion was attributed to for-hire truckload carriers like us. According to the ATA, approximately 68% of all freight transported in the United States in 2009 was transported by truck, which the ATA expects to increase to 70.7% by 2021. We believe a significant majority of all truckload freight in the United States travels in theshort-to-medium length of haul where we focus our operations. The ten largest for-hire truckload carriers are estimated to comprise approximately 5.3% of the total for-hire truckload market in the United States, according to 2008 data published by the ATA.
During the period of economic expansion from 2002 through 2006, total tonnage transported by truck increased at a compounded rate of 1.5% per year, according to the ATA. Trucking companies invested in their fleets during this period, with new Class 8 truck manufactures averaging approximately 215,000 units annually, according to ACT Research. A combination of reduced demand for freight and excess supply of tractors led to a difficult trucking environment from 2007 through most of 2009. Total tonnage, as measured by the ATA’s seasonally adjusted for-hire index, declined 9.9% between January 2007 and June 2009. Orders of new tractors also declined as many trucking companies reduced capital expenditures to conserve cash and to respond to decreasing demand fundamentals. According to ACT Research, Class 8 truck manufactures fell to approximately 94,000 units in 2009, compared to approximately 296,000 units in 2006. As a result of the lower tractor builds and capital expenditure declines, the average age of the Class 8 truck fleet has increased to 6.5 years, a record high.
Since 2009, industry freight data began to show strong positive trends. As shown in the chart below, the ATA seasonally adjusted for-hire truck tonnage index increased 7.2%year-over-year in May 2010, its sixth consecutive monthlyyear-over-year increase. Further evidence of a rebound in the domestic freight environment can be seen in the Cass Freight Shipments index that showed a 24.9% increase in freight expenditures for the second quarter of 2010 versus the second quarter of 2009. Further, in June, freight expenditures increased on a year-over-year basis by 28.9%.
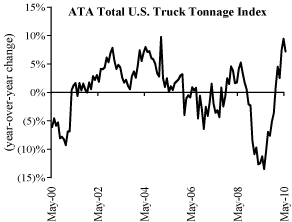 |  | |
Source: ATA | Source: ACT Research |
In addition to improving freight demand, our industry is experiencing a drop in the supply of available trucks as a result of several years of below average truck manufactures. We expect to benefit from the improving supply-demand environment as our existing asset base, relatively young fleet, and extensive terminal network position us to gain new customers, increase our overall freight volumes, and realize improved pricing.
Our Competitive Strengths
We believe the following competitive strengths provide a solid platform for pursuing our goals and strategies:
| • | North American market leader with broad terminal network and a modern fleet. The size and scope of our operations afford us significant advantages in a fragmented truckload industry. We operate North America’s |
3
Table of Contents
| largest truckload fleet, have 35 major terminals and multiple other locations strategically positioned throughout the United States and Mexico, and offer customers “one-stop-shopping” for a broad spectrum of their truckload transportation needs. Our fleet size offers wide geographic coverage while maintaining the efficiencies associated with significant traffic density within our operating regions. Our terminals are strategically located near key population centers, driver recruiting areas, and cross-border hubs, often in close proximity to our customers. This broad network offers benefits such as in-house maintenance, more frequent equipment inspections, localized driver recruiting, rapid customer response, and personalized marketing efforts. Our size allows us to achieve substantial economies of scale in purchasing items such as tractors, trailers, containers, fuel, and tires where pricing is volume sensitive. We believe our scale also offers additional benefits in brand awareness and access to capital. Additionally, our modern company tractor fleet, with an average age of 2.55 years for our approximately 9,000 linehaul sleeper units, lowers maintenance and repair expense, aids in driver recruitment, and increases asset utilization as compared with an older fleet. |
| • | High quality customer service and extensive suite of services. Our intense focus on customer satisfaction contributed to 20 “carrier of the year” or similar awards in 2009 and has helped us establish a strong platform for cross-selling our other services. Our strong and diversified customer base, ranging from Fortune 500 companies to local shippers, has a wide variety of shipping needs, including general and specialized truckload, imports and exports, regional distribution, high-service dedicated operations, rail intermodal service, and surge capacity through fleet flexibility and brokerage and logistics operations. We believe customers continue to seek fewer transportation providers that offer a broader range of services to streamline their transportation management functions. For example, ten of our top fifteen customers used at least four of our services in the three months ended March 31, 2010. Our top fifteen customers by revenue in 2009 included Coors, Costco, Dollar Tree, Georgia-Pacific, Home Depot, Kimberly-Clark, Lowes, Menlo Logistics, Procter & Gamble, Quaker Oats, Ryder Logistics, Sears, Target, and Wal-Mart. We believe the breadth of our services helps diversify our customer base and provides us with a competitive advantage, especially for customers with multiple needs and international shipments. | |
| • | Strong and growing owner-operator business. We supplement our company tractors with tractors provided by owner-operators, who operate their own tractors and are responsible for most ownership and operating expenses. We believe that owner-operators provide significant advantages that primarily arise from the entrepreneurial motivation of business ownership. Our owner-operators tend to be more experienced, have lower turnover, have fewer accidents per million miles, and produce higher weekly trucking revenue per tractor than our average company drivers. In 2009, our owner-operator tractors drove on average 34% more miles per week than our company tractors. | |
| • | Leader in driver and owner-operator development. Driver recruiting and retention historically have been significant challenges for truckload carriers. To address these challenges, we employ nationwide recruiting efforts through our terminal network, operate five driver training schools, maintain an active and successful owner-operator development program, provide drivers modern tractors, and employ numerous driver satisfaction policies. We believe our extensive recruiting and training efforts will become increasingly advantageous to us in periods of economic growth when employment alternatives are more plentiful and also when new regulatory requirements begin to affect the size or effective capacity of the industry-wide driver pool. | |
| • | Experienced management aligned with corporate success. Our management team has a proven track record of growth and cost control. The improvements we have made to our operations since going private have positioned us to benefit from the expected improvement in the freight environment. Management focuses on disciplined execution and financial performance by measuring our progress through a combination of Adjusted EBITDA growth, revenue growth, Adjusted Operating Ratio, and return on capital. We align management’s priorities with our own through equity option awards and an annual senior management incentive program linked to Adjusted EBITDA. |
4
Table of Contents
Our Goals and Strategies
Based on our expectation of meaningful improvement in truckload volumes and pricing, our goals are to grow revenue in excess of 10% annually over the next several years, increase our profitability, and generate returns on capital in excess of our cost of capital. We believe our competitive strengths and an improving supply and demand environment in the truckload industry are aligned to support the achievement of our goals through the following strategies:
| • | Profitable revenue growth. To increase freight volumes and yield, we intend to further penetrate our existing customer base, cross-sell our services, and pursue new customer opportunities. Our superior customer service and extensive suite of truckload services continue to contribute to recent new business wins from customers such as Costco, Procter & Gamble, Caterpillar, and Home Depot. In addition, we are further enhancing our sophisticated freight selection management tools to allocate our equipment to more profitable loads and complementary lanes. As freight volumes increase, we intend to prioritize the following areas for growth: |
| — | Rail intermodal and port operations. Our growing rail intermodal presence allows us to better serve customers in longer haul lanes and reduce our investment in fixed assets. Since its inception in 2005, we have grown our rail intermodal business by adding approximately 4,300 containers, and we have ordered an additional 1,000 containers for delivery between August 2010 and June 2011. We have intermodal agreements with all major U.S. railroads and recently negotiated more favorable terms with our largest intermodal provider, which has helped increase our volumes through more competitive pricing. We also expanded our presence in the short-haul drayage business at the ports of Los Angeles and Long Beach in 2008 and are evaluating additional port opportunities. | |
| — | Dedicated services and private fleet outsourcing. The size and scale of our fleet and terminal network allow us to provide the equipment availability and high service levels required for dedicated contracts. Dedicated contracts often are used for high-service and high-priority freight, sometimes to replace private fleets previously operated by customers. Dedicated operations generally produce higher margins and lower driver turnover than our general truckload operations. We believe these opportunities will increase in times of scarce capacity in the truckload industry. | |
| — | Cross-border Mexico-U.S. freight. The combination of our U.S., cross-border, customs brokerage, and Mexican operations enables us to provide efficientdoor-to-door service between the United States and Mexico. We believe our sophisticated load security measures, as well as our Department of Homeland Security, or DHS, status as a C-TPAT carrier, allow us to offer more efficient service than most competitors and afford us substantial advantages with major international shippers. | |
| — | Freight brokerage and third-party logistics. We believe we have a substantial opportunity to continue to increase our non-asset based freight brokerage and third-party logistics services. We believe many customers increasingly seek transportation companies that offer both asset-based and non-asset based services to gain additional certainty that safe, secure, and timely truckload service will be available on demand and to reward asset-based carriers for investing in fleet assets. We intend to continue growing our transportation management and freight brokerage capability to build market share with customers, earn marginal revenue on more loads, and preserve our assets for the most attractive lanes and loads. |
| • | Increase asset productivity and return on capital. We believe we have a substantial opportunity to improve the productivity and yield of our existing assets through the following measures: |
| — | increasing the percentage of our fleet provided by owner-operators, who generally produce higher weekly trucking revenue per tractor than our company drivers; | |
| — | increasing company tractor utilization through measures such as equipment pools, relays, and team drivers; |
5
Table of Contents
| — | capitalizing on a stronger freight market to increase average trucking revenue per mile by using sophisticated freight selection and network management tools to upgrade our freight mix and reduce deadhead miles; | |
| — | maintaining discipline regarding the timing and extent of company tractor fleet growth based on availability of high-quality freight; and | |
| — | rationalizing unproductive assets as necessary, thereby improving our return on capital. |
Because of our size and operating leverage, even small improvements in our asset productivity and yield can have a significant impact on our operating results. For example, by maintaining our current fleet size and revenue per mile and simply regaining the miles per tractor we achieved in 2005 (including a 14.9% improvement in utilization with respect to active trucks and assuming a reinstatement of approximately 500 idle trucks that were parked in response to reduced freight volumes), operating revenue would increase by an estimated $425.0 million.
| • | Continue to focus on efficiency and cost control. We intend to continue to implement the Lean Six Sigma, accountability, and discipline measures that helped us improve our Adjusted Operating Ratio in 2009 and in the first quarter of 2010. We presently have ongoing efforts in the following areas that we expect will yield benefits in future periods: |
| — | managing the flow of our tractor capacity through our network to balance freight flows and reduce deadhead miles; | |
| — | improving processes and resource allocation throughout our customer-facing functions to increase operational efficiencies while endeavoring to improve customer service; | |
| — | streamlining driver recruiting and training procedures to reduce attrition costs; and | |
| — | reducing waste in shop methods and procedures and in other administrative processes. |
| • | Pursue selected acquisitions. In addition to expanding our company tractor fleet through organic growth, and to take advantage of opportunities to add complementary operations, we expect to pursue selected acquisitions. We operate in a highly fragmented and consolidating industry where we believe the size and scope of our operations afford us significant competitive advantages. Acquisitions can provide us an opportunity to expand our fleet with customer revenue and drivers already in place. In our history, we have completed twelve acquisitions, most of which were immediately integrated into our existing business. Given our size in relation to most competitors, we expect most future acquisitions to be integrated quickly. As with our prior acquisitions, our goal is for any future acquisitions to be accretive to our earnings within two full calendar quarters. |
Concurrent Transactions
Reorganization
On May 20, 2010, in contemplation of our initial public offering, Swift Corporation formed Swift Holdings Corp., a Delaware corporation. Swift Holdings Corp. has not engaged in any business or other activities except in connection with its formation and this offering and holds no assets and has no subsidiaries. Immediately prior to the consummation of this offering, Swift Corporation will merge with and into Swift Holdings Corp., the registrant, with Swift Holdings Corp. surviving as a Delaware corporation. In the merger, all of the outstanding common stock of Swift Corporation will be converted into shares of Swift Holdings Corp. Class B common stock on aone-for-one basis. See “Reorganization.”
Refinancing
In connection with this offering, Swift Transportation intends to enter into a new senior secured credit facility consisting of a $ million senior secured revolving credit facility and a $ million senior secured term loan. The proceeds of the new term loan will be used to repay the portion of our existing senior secured credit facility that is not repaid with the proceeds of this offering. We expect the new senior secured credit
6
Table of Contents
facility to be completed substantially concurrently with the closing of this offering. Swift Transportation’s entry into the new senior secured credit facility is conditioned on the completion of this offering.
Summary Risk Factors
Investing in our Class A common stock is subject to numerous risks, including those that generally are associated with our industry. You should consider carefully the risks and uncertainties summarized below, the risks described under “Risk Factors,” the other information contained in this prospectus, and our consolidated financial statements and the related notes before you decide whether to purchase our Class A common stock.
| • | Our business is subject to general economic and business factors affecting the truckload industry such as fluctuations in the price or availability of fuel, increased prices for new revenue equipment, volatility in the used equipment market, increases in driver compensation, or difficulty in attracting or retaining drivers or owner-operators that are largely beyond our control, any of which could have a material adverse effect on our operating results. | |
| • | We have several major customers, the loss of one or more of which could have a material adverse effect on our business. | |
| • | We may not be able to sustain the cost savings realized as part of our recent cost reduction initiatives. | |
| • | We may not be successful in achieving our strategy of growing revenues. We also have a recent history of net losses. We can make no assurances that we will achieve profitability, or if we do, that we will be able to sustain profitability in the future. | |
| • | We operate in a highly regulated industry, and changes in existing regulations or violations of existing or future regulations could have a material adverse effect on our operations and profitability. | |
| • | We self-insure a significant portion of our claims exposure, which could significantly increase the volatility of, and decrease the amount of, our earnings. | |
| • | We engage in transactions with other businesses controlled by Mr. Moyes and the interests of Mr. Moyes could conflict with the interests of other stockholders. | |
| • | Mr. Moyes and certain of his affiliates will hold Class B shares which have greater voting rights than Class A shares and will have the power to direct and control our company as a result of their stock holdings. | |
| • | We have significant ongoing capital requirements that could harm our financial condition, results of operations, and cash flows if we are unable to generate sufficient cash from operations, or obtain financing on favorable terms. | |
| • | Our substantial leverage could adversely affect our ability to raise additional capital to fund our operations, limit our ability to react to changes in the economy or our industry, and prevent us from meeting our obligations under our new senior secured credit facility and our senior secured notes, and our debt agreements contain restrictions that limit our flexibility in operating our business. |
These risks and the other risks described under “Risk Factors” could have a material adverse effect on our business, financial condition, and results of operations.
Our Corporate Profile and Executive Offices
Swift was founded by our Chief Executive Officer, Mr. Moyes, and his family in 1966. Swift Transportation became a public company in 1990, and its stock traded on the NASDAQ stock market under the symbol “SWFT” until May 10, 2007, when a company controlled by Mr. Moyes completed the 2007 Transactions, which resulted in its becoming a private company. Our principal executive offices are located at 2200 South 75th Avenue, Phoenix, Arizona 85043, and our telephone number at that address is(602) 269-9700. Our website is located at www.swifttrans.com. The information on our website is not part of this prospectus.
7
Table of Contents
The Offering
| Class A common stock offered by us | shares | |
| Over-allotment option | shares | |
| Class B common stock to be outstanding after this offering | 75,145,892 shares | |
| Total common stock to be outstanding after this offering | shares (or shares if the underwriters’over-allotment option is exercised in full) | |
| Voting rights | Holders of our Class A common stock and our Class B common stock will vote together as a single class on all matters submitted to a vote of our stockholders except as otherwise required by Delaware law or as provided in our amended and restated certificate of incorporation. The holders of our Class A common stock are entitled to one vote per share and the holders of our Class B common stock are entitled to two votes per share. Following this offering, assuming no exercise of the underwriters’ over-allotment option, (1) holders of the Class A common stock will control approximately % of our total voting power and will own % of our total outstanding shares of common stock, and (2) holders of Class B common stock will control approximately % of our total voting power and will own % of our total outstanding shares of common stock. All of our shares of Class B common stock are beneficially owned by Jerry Moyes and by Jerry and Vickie Moyes, jointly, the Jerry and Vickie Moyes Family Trust dated 12/11/87, and various Moyes children’s trusts or, collectively, the Moyes Affiliates. Shares of our Class B common stock automatically convert to Class A common stock on aone-for-one basis at the election of the holder or upon transfer of beneficial ownership to any person other than a Permitted Holder, as defined in “Certain Relationships and Related Party Transactions.” With the exception of voting rights and conversion rights, holders of Class A and Class B common stock have identical rights. See “Description of Capital Stock” for a description of the material terms of our common stock. | |
| Dividend policy | We anticipate that we will retain all of our future earnings, if any, for use in the development and expansion of our business and for general corporate purposes. Any determination to pay dividends and other distributions in cash, stock, or property by Swift in the future will be at the discretion of our board of directors and will be dependent on then-existing conditions, including our financial condition and results of operations, contractual restrictions, including restrictive covenants contained in a new post-offering senior secured credit facility and the indentures governing our outstanding senior secured notes, capital requirements, and other factors. See “Dividend Policy.” | |
| Use of proceeds | We estimate that the net proceeds from this offering, after deducting underwriting discounts and estimated offering expenses, will be approximately $ million at an assumed initial public offering price of $ per share, which is the midpoint of the price range set forth on the cover of this prospectus. We intend to use $ million of the net proceeds to repay a portion of our existing |
8
Table of Contents
| senior secured credit facility. The balance of the existing senior secured credit facility will be refinanced by borrowings under our new senior secured credit facility, which we will enter into in connection with this offering. The remaining net proceeds will be used for general corporate purposes. See “Use of Proceeds.” | ||
| Risk factors | You should carefully consider the information set forth under “Risk Factors” together with all of the other information set forth in this prospectus before deciding to invest in shares of our Class A common stock. | |
| Proposed listing symbol | “SWFT” |
References in this prospectus to the number of shares of our common stock to be outstanding after this offering are based on 75,145,892 shares of our common stock outstanding as of July 21, 2010 and excludes 10,000,000 additional shares that are authorized for future issuance under our 2007 equity incentive plan, of which 7,757,500 shares may be issued pursuant to outstanding stock options at a weighted average exercise price of $10.99 per share.
9
Table of Contents
Summary Historical Consolidated Financial and Other Data
The table below provides historical consolidated financial and other data for the periods and as of the dates indicated. The summary historical consolidated financial and other data for the years ended December 31, 2009, 2008, and 2007 and the period from January 1, 2007 through May 10, 2007 are derived from our audited consolidated financial statements and those of our predecessor, included elsewhere in this prospectus. The summary historical consolidated financial and other data for the years ended December 31, 2006 and 2005 are derived from the historical financial statements of our predecessor not included in this prospectus. The summary historical consolidated financial and other data for the three months ended March 31, 2010 and 2009 are derived from the unaudited condensed consolidated interim financial statements included elsewhere in this prospectus and include, in the opinion of management, all adjustments that management considers necessary for the presentation of the information outlined in these financial statements. In addition, for comparative purposes, we have included a pro forma (provision) benefit for income taxes assuming we had been taxed as a subchapter C corporation in all periods when our subchapter S corporation election was in effect. The results for any interim period are not necessarily indicative of the results that may be expected for a full year. Additionally, our historical results are not necessarily indicative of the results expected for any future period.
Swift Corporation acquired our predecessor on May 10, 2007 in conjunction with the 2007 Transactions. Thus, although our results for the year ended December 31, 2007 present results for a full year period, they only include the results of our predecessor after May 10, 2007. You should read the summary historical financial and other data below together with the consolidated financial statements and related notes appearing elsewhere in this prospectus, as well as “Selected Historical Consolidated Financial and Other Data,” and “Management’s Discussion and Analysis of Financial Condition and Results of Operations.”
| Successor | Predecessor | |||||||||||||||||||||||||||||||||
| Three | January 1, | |||||||||||||||||||||||||||||||||
| Months | 2007 | |||||||||||||||||||||||||||||||||
| Ended | Year Ended | Year Ended | through | |||||||||||||||||||||||||||||||
| March 31, | December 31, | December 31, | May 10, | Year Ended December 31, | ||||||||||||||||||||||||||||||
| (Dollars in thousands, except per share data) | 2010 | 2009 | 2009 | 2008 | 2007(1) | 2007 | 2006 | 2005 | ||||||||||||||||||||||||||
| (Unaudited) | ||||||||||||||||||||||||||||||||||
Consolidated statement of operations data: | ||||||||||||||||||||||||||||||||||
| Operating revenue: | ||||||||||||||||||||||||||||||||||
| Trucking revenue | $ | 503,507 | $ | 509,320 | $ | 2,062,296 | $ | 2,443,271 | $ | 1,674,835 | $ | 876,042 | $ | 2,585,590 | $ | 2,722,648 | ||||||||||||||||||
| Fuel surcharge revenue | 88,816 | 52,986 | 275,373 | 719,617 | 344,946 | 147,507 | 462,529 | 391,942 | ||||||||||||||||||||||||||
| Other revenue | 62,507 | 52,450 | 233,684 | 236,922 | 160,512 | 51,174 | 124,671 | 82,865 | ||||||||||||||||||||||||||
| Total operating revenue | 654,830 | 614,756 | 2,571,353 | 3,399,810 | 2,180,293 | 1,074,723 | 3,172,790 | 3,197,455 | ||||||||||||||||||||||||||
| Operating expenses: | ||||||||||||||||||||||||||||||||||
| Salaries, wages, and employee benefits | 177,803 | 189,377 | 728,784 | 892,691 | 611,811 | 364,690 | 899,286 | 1,008,833 | ||||||||||||||||||||||||||
| Operating supplies and expenses | 47,830 | 56,723 | 209,945 | 271,951 | 187,873 | 119,833 | 268,658 | 286,261 | ||||||||||||||||||||||||||
| Fuel expense | 106,082 | 85,868 | 385,513 | 768,693 | 474,825 | 223,579 | 632,824 | 610,919 | ||||||||||||||||||||||||||
| Purchased transportation | 175,702 | 135,753 | 620,312 | 741,240 | 435,421 | 196,258 | 586,252 | 583,380 | ||||||||||||||||||||||||||
| Rental expense | 18,903 | 20,391 | 79,833 | 76,900 | 51,703 | 20,089 | 50,937 | 57,669 | ||||||||||||||||||||||||||
| Insurance and claims | 20,207 | 25,481 | 81,332 | 141,949 | 69,699 | 58,358 | 153,728 | 156,525 | ||||||||||||||||||||||||||
| Depreciation and amortization(2) | 65,497 | 66,956 | 253,531 | 275,832 | 187,043 | 82,949 | 222,376 | 199,777 | ||||||||||||||||||||||||||
| Impairments(3) | 1,274 | 515 | 515 | 24,529 | 256,305 | — | 27,595 | 6,377 | ||||||||||||||||||||||||||
| (Gain) loss on disposal of property and equipment | (1,448 | ) | (19 | ) | (2,244 | ) | (6,466 | ) | (397 | ) | 130 | (186 | ) | (942 | ) | |||||||||||||||||||
| Communication and utilities | 6,422 | 7,091 | 24,595 | 29,644 | 18,625 | 10,473 | 28,579 | 30,920 | ||||||||||||||||||||||||||
| Operating taxes and licenses | 13,365 | 14,381 | 57,236 | 67,911 | 42,076 | 24,021 | 59,010 | 69,676 | ||||||||||||||||||||||||||
| Total operating expenses | 631,637 | 602,517 | 2,439,352 | 3,284,874 | 2,334,984 | 1,100,380 | 2,929,059 | 3,009,395 | ||||||||||||||||||||||||||
| Operating income (loss) | 23,193 | 12,239 | 132,001 | 114,936 | (154,691 | ) | (25,657 | ) | 243,731 | 188,060 | ||||||||||||||||||||||||
| Other (income) expenses: | ||||||||||||||||||||||||||||||||||
| Interest expense(4) | 62,596 | 47,702 | 200,512 | 222,177 | 171,115 | 9,454 | 26,870 | 29,946 | ||||||||||||||||||||||||||
| Derivative interest expense (income)(5) | 23,714 | 7,549 | 55,634 | 18,699 | 13,233 | (177 | ) | (1,134 | ) | (3,314 | ) | |||||||||||||||||||||||
| Interest income | (220 | ) | (428 | ) | (1,814 | ) | (3,506 | ) | (6,602 | ) | (1,364 | ) | (2,007 | ) | (1,713 | ) | ||||||||||||||||||
| Other(4) | (371 | ) | 675 | (13,336 | ) | 12,753 | (1,933 | ) | 1,429 | (1,272 | ) | (1,209 | ) | |||||||||||||||||||||
| Total other (income) expenses | 85,719 | 55,498 | 240,996 | 250,123 | 175,813 | 9,342 | 22,457 | 23,710 | ||||||||||||||||||||||||||
| Income (loss) before income taxes | (62,526 | ) | (43,259 | ) | (108,995 | ) | (135,187 | ) | (330,504 | ) | (34,999 | ) | 221,274 | 164,350 | ||||||||||||||||||||
| Income tax (benefit) expense | (9,525 | ) | 301 | 326,650 | 11,368 | (234,316 | ) | (4,577 | ) | 80,219 | 63,223 | |||||||||||||||||||||||
10
Table of Contents
| Successor | Predecessor | |||||||||||||||||||||||||||||||||
| Three | January 1, | |||||||||||||||||||||||||||||||||
| Months | 2007 | |||||||||||||||||||||||||||||||||
| Ended | Year Ended | Year Ended | through | |||||||||||||||||||||||||||||||
| March 31, | December 31, | December 31, | May 10, | Year Ended December 31, | ||||||||||||||||||||||||||||||
| (Dollars in thousands, except per share data) | 2010 | 2009 | 2009 | 2008 | 2007(1) | 2007 | 2006 | 2005 | ||||||||||||||||||||||||||
| (Unaudited) | ||||||||||||||||||||||||||||||||||
| Net income (loss) | $ | (53,001 | ) | $ | (43,560 | ) | $ | (435,645 | ) | $ | (146,555 | ) | $ | (96,188 | ) | $ | (30,422 | ) | $ | 141,055 | $ | 101,127 | ||||||||||||
| Basic income (loss) per common share | $ | (0.71 | ) | $ | (0.58 | ) | $ | (5.80 | ) | $ | (1.95 | ) | $ | (1.94 | ) | $ | (0.40 | ) | $ | 1.89 | $ | 1.39 | ||||||||||||
| Diluted income (loss) per common share | $ | (0.71 | ) | $ | (0.58 | ) | $ | (5.80 | ) | $ | (1.95 | ) | $ | (1.94 | ) | $ | (0.40 | ) | $ | 1.86 | $ | 1.37 | ||||||||||||
| Weighted average shares used in computing basic income (loss) per common share (in thousands) | 75,146 | 75,146 | 75,146 | 75,146 | 49,521 | 75,159 | 74,584 | 72,540 | ||||||||||||||||||||||||||
| Weighted average shares used in computing diluted income (loss) per common share (in thousands) | 75,146 | 75,146 | 75,146 | 75,146 | 49,521 | 75,159 | 75,841 | 73,823 | ||||||||||||||||||||||||||
Pro forma C corporation data (unaudited):(6) | ||||||||||||||||||||||||||||||||||
| Historical loss before income taxes | N/A | $ | (43,259 | ) | $ | (108,995 | ) | $ | (135,187 | ) | $ | (330,504 | ) | N/A | N/A | N/A | ||||||||||||||||||
| Pro forma provision (benefit) for income taxes | N/A | 2,259 | 5,693 | (26,573 | ) | (19,166 | ) | N/A | N/A | N/A | ||||||||||||||||||||||||
| Pro forma net loss | N/A | $ | (45,518 | ) | $ | (114,688 | ) | $ | (108,614 | ) | $ | (311,338 | ) | N/A | N/A | N/A | ||||||||||||||||||
| Pro forma loss per share: | ||||||||||||||||||||||||||||||||||
| Basic | N/A | $ | (0.61 | ) | $ | (1.53 | ) | $ | (1.45 | ) | $ | (6.29 | ) | N/A | N/A | N/A | ||||||||||||||||||
| Diluted | N/A | $ | (0.61 | ) | $ | (1.53 | ) | $ | (1.45 | ) | $ | (6.29 | ) | N/A | N/A | N/A | ||||||||||||||||||
Consolidated balance sheet data (at end of period): | ||||||||||||||||||||||||||||||||||
| Cash and cash equivalents (excl. restricted cash) | 87,327 | 56,806 | 115,862 | 57,916 | 78,826 | 81,134 | 47,858 | 13,098 | ||||||||||||||||||||||||||
| Net property and equipment | 1,327,210 | 1,516,994 | 1,364,545 | 1,583,296 | 1,588,102 | 1,478,808 | 1,513,592 | 1,630,469 | ||||||||||||||||||||||||||
| Total assets | 2,638,739 | 2,594,965 | 2,513,874 | 2,648,507 | 2,928,632 | 2,124,293 | 2,110,648 | 2,218,530 | ||||||||||||||||||||||||||
| Debt: | ||||||||||||||||||||||||||||||||||
| Securitization of accounts receivable(4) | 150,000 | — | — | — | 200,000 | 160,000 | 180,000 | 245,000 | ||||||||||||||||||||||||||
| Long-term debt and obligations under capital leases (incl. current)(4) | 2,382,181 | 2,515,335 | 2,466,934 | 2,494,455 | 2,427,253 | 200,000 | 200,000 | 365,786 | ||||||||||||||||||||||||||
| Stockholders’ equity (deficit) | (818,354 | ) | (498,831 | ) | (865,781 | ) | (444,193 | ) | (297,547 | ) | 1,007,904 | 1,014,223 | 870,044 | |||||||||||||||||||||
Consolidated statement of cash flows data: | ||||||||||||||||||||||||||||||||||
| Net cash flows from operating activities | 15,107 | 7,376 | 115,335 | 119,740 | 128,646 | 85,149 | 365,430 | 362,548 | ||||||||||||||||||||||||||
| Net cash flows used in investing activities | (35,131 | ) | (6,661 | ) | (1,127 | ) | (118,517 | ) | (1,612,314 | ) | (43,854 | ) | (114,203 | ) | (380,007 | ) | ||||||||||||||||||
| Net cash flows from (used in) financing activities, net of the effect of exchange rate changes | (8,511 | ) | (1,825 | ) | (56,262 | ) | (22,133 | ) | 1,562,494 | (8,019 | ) | (216,467 | ) | 2,312 | ||||||||||||||||||||
Other financial data: | ||||||||||||||||||||||||||||||||||
| Adjusted EBITDA (unaudited)(7) | 90,335 | 79,035 | 405,860 | 409,598 | 291,597 | 109,687 | 498,601 | 407,820 | ||||||||||||||||||||||||||
| Adjusted Operating Ratio (unaudited)(8) | 94.4% | 97.7% | 93.9% | 94.5% | 94.4% | 97.4% | 90.4% | 92.6% | ||||||||||||||||||||||||||
| Total cash capital expenditures | 17,155 | 12,551 | 71,265 | 327,725 | 215,159 | 80,517 | 219,666 | 544,650 | ||||||||||||||||||||||||||
| Net cash capital expenditures | 12,471 | 10,170 | 1,492 | 136,574 | 175,351 | 52,676 | 139,216 | 386,780 | ||||||||||||||||||||||||||
Operating statistics (unaudited): | ||||||||||||||||||||||||||||||||||
| Weekly trucking revenue per tractor | $ | 2,711 | $ | 2,541 | $ | 2,660 | $ | 2,916 | $ | 2,903 | $ | 2,790 | $ | 3,011 | $ | 3,004 | ||||||||||||||||||
| Deadhead miles % | 12.2% | 13.6% | 13.2% | 13.6% | 13.0% | 13.2% | 12.2% | 12.1% | ||||||||||||||||||||||||||
| Average tractors available | 14,443 | 15,589 | 14,869 | 16,024 | 17,192 | 16,816 | 16,466 | 17,383 | ||||||||||||||||||||||||||
| Average loaded length of haul (miles) | 438 | 451 | 442 | 469 | 483 | 492 | 522 | 534 | ||||||||||||||||||||||||||
| Total tractors (end of period): | ||||||||||||||||||||||||||||||||||
| Company-operated | 12,489 | 13,695 | 12,440 | 13,786 | 16,017 | 14,847 | 14,977 | 14,465 | ||||||||||||||||||||||||||
| Owner-operator | 3,731 | 3,575 | 3,585 | 3,560 | 3,221 | 2,961 | 2,950 | 3,466 | ||||||||||||||||||||||||||
| Trailers (end of period) | 49,436 | 49,284 | 49,215 | 49,695 | 49,879 | 48,959 | 50,013 | 51,997 | ||||||||||||||||||||||||||
| (1) | Our audited results of operations include the full year presentation of Swift Corporation as of and for the year ended December 31, 2007. Swift Corporation was formed in 2006 for the purpose of acquiring Swift Transportation, but that acquisition was not completed until May 10, 2007 as part of the 2007 Transactions, and, as such, Swift Corporation had nominal activity from January 1, 2007 through May 10, 2007. The results of Swift Transportation from January 1, 2007 to May 10, 2007 and IEL from January 1, 2007 to |
11
Table of Contents
| April 7, 2007 are not reflected in the audited results of Swift Corporation for the year ended December 31, 2007. These financial results include the impact of the 2007 Transactions. | ||
| (2) | During the three months ended March 31, 2010, we recorded $7.4 million of incremental depreciation expense related to our revised estimates regarding salvage value and useful lives for approximately 7,000 dry van trailers that we decided to scrap during the quarter. During the three months ended March 31, 2010 and 2009, we incurred non-cash amortization expense of $5.2 million and $5.7 million, respectively, relating to a step up in basis of certain intangible assets recognized in connection with the 2007 Transactions. For the years ended December 31, 2009, 2008, and 2007, we incurred amortization expense of $22.0 million, $24.2 million, and $16.8 million, respectively, relating to a step up in basis of certain intangible assets recognized in connection with the 2007 Transactions. | |
| (3) | During the three months ended March 31, 2010, revenue equipment with a carrying amount of $3.6 million was written down to its fair value of $2.3 million, resulting in an impairment charge of $1.3 million, which was included in impairments in the consolidated statement of operations for the three months ended March 31, 2010. During the three months ended March 31, 2009, non-operating real estate properties held and used with a carrying amount of $2.1 million were written down to their fair value of $1.6 million, resulting in an impairment charge of $0.5 million. For the year ended December 31, 2008, we incurred $24.5 million in pre-tax impairment charges comprised of a $17.0 million impairment of goodwill relating to our Mexico freight transportation reporting unit, and impairment charges totaling $7.5 million on tractors, trailers, and several non-operating real estate properties and other assets. For the year ended December 31, 2007, we recorded a goodwill impairment of $238.0 million pre-tax related to our U.S. freight transportation reporting unit and trailer impairment of $18.3 million pre-tax. The results for the year ended December 31, 2006 included pre-tax charges of $9.2 million related to the impairment of certain trailers, Mexico real property and equipment, and $18.4 million for the write-off of a note receivable and other outstanding amounts related to our sale of our auto haul business in April 2005. For the year ended December 31, 2005, we incurred a pre-tax impairment charge of $6.4 million related to certain trailers. | |
| (4) | Effective January 1, 2010, we adopted ASU No. 2009-16 “Accounting For Transfers of Financial Assets,” or ASUNo. 2009-16, under which we were required to account for our accounts receivable securitization agreement, or our 2008 RSA, as a secured borrowing on our balance sheet as opposed to a sale, with our 2008 RSA program fees characterized as interest expense. From March 27, 2008 through December 31, 2009, our 2008 RSA has been accounted for as a true sale in accordance with generally accepted accounting principles, or GAAP. Therefore, as of December 31, 2009 and 2008, such accounts receivable and associated obligation are not reflected in our consolidated balance sheets. For periods prior to March 27, 2008, and again beginning January 1, 2010, accounts receivable and associated obligation are recorded on our balance sheet. Long-term debt excludes securitization amounts outstanding for each period. For the three months ended March 31, 2010, total program fees recorded as interest expense were $1.1 million. | |
| Prior to the change in GAAP, program fees were recorded under “Other income and expenses” under “Other.” For the three months ended March 31, 2009, total program fees included in “Other” were $1.1 million. For the years ended December 31, 2009 and 2008, program fees from our 2008 RSA totaling $5.0 million and $7.3 million, respectively, were recorded in “Other.” | ||
| (5) | Derivative interest expense for the three months ended March 31, 2010 and 2009 is related to our interest rate swaps with notional amounts of $1.14 billion and $1.20 billion, respectively. Derivative interest expense increased during the three months ended March 31, 2010 over the same period in 2009 as a result of the decrease in three month London Interbank Offered Rate, or LIBOR, the underlying index for the swaps. Additionally, we de-designated the remaining swaps and discontinued hedge accounting effective October 1, 2009 as a result of the second amendment to our existing senior secured credit facility, after which the entiremark-to-market adjustment was recorded in our statement of operations as opposed to being recorded in equity as a component of other comprehensive income under the prior cash flow hedge accounting treatment. Derivative interest expense for the years ended December 31, 2009, 2008, and 2007 is related to our interest rate swaps with notional amounts of $1.14 billion, $1.22 billion, and $1.34 billion, respectively. | |
| (6) | From May 11, 2007 until October 10, 2009, we had elected to be taxed under the Internal Revenue Code of 1986, as amended from time to time, or the Internal Revenue Code, as a subchapter S corporation. A subchapter S corporation passes through essentially all taxable earnings and losses to its stockholders and does not pay federal income taxes at the corporate level. Historical income taxes during this time consist mainly of state income taxes in certain states that do not recognize subchapter S corporations, and an income tax provision or benefit was recorded for certain of our subsidiaries, including our Mexican subsidiaries and our sole domestic captive insurance company at the time, which were not eligible to be treated as qualified subchapter S corporations. In October 2009, we elected to be taxed as a subchapter C corporation. For comparative purposes, we have included a pro forma (provision) benefit for income taxes assuming we had been taxed as a subchapter C corporation in all periods when our subchapter S corporation election was in effect. The pro forma effective tax rate for 2009 of 5.2% differs from the expected federal tax benefit of 35% primarily as a result of income recognized for tax purposes on the partial cancellation of the stockholder loan, which reduced the tax benefit rate by 32.6%. In 2008, the pro forma effective tax rate was reduced by 8.8% for stockholder distributions and 4.4% for non-deductible goodwill impairment charges, which resulted in a 19.7% effective tax rate. In 2007, the pro forma effective tax rate of 5.8% resulted primarily from a non-deductible goodwill impairment charge, which reduced the rate by 25.1%. | |
| (7) | We use the term “Adjusted EBITDA” throughout this prospectus. Adjusted EBITDA, as we define this term, is not presented in accordance with GAAP. We use Adjusted EBITDA as a supplement to our GAAP results in evaluating certain aspects of our business, as described below. | |
| We define Adjusted EBITDA as net income (loss) plus (i) depreciation and amortization, (ii) interest and derivative interest expense, including other fees and charges associated with indebtedness, net of interest income, (iii) income taxes, (iv) non-cash impairments, (v) non-cash equity compensation expense, (vi) other unusual non-cash items, and (vii) excludable transaction costs. | ||
| Our board of directors and executive management team focus on Adjusted EBITDA as a key measure of our performance, for business planning, and for incentive compensation purposes. Adjusted EBITDA assists us in comparing our performance over various reporting |
12
Table of Contents
| periods on a consistent basis because it removes from our operating results the impact of items that, in our opinion, do not reflect our core operating performance. Our method of computing Adjusted EBITDA is consistent with that used in our debt covenants and also is routinely reviewed by management for that purpose. For a reconciliation of our Adjusted EBITDA to our net income (loss), the most directly related GAAP measure, please see the table below. | ||
| Our Chief Executive Officer, who is our chief operating decision-maker, and our compensation committee, traditionally have used Adjusted EBITDA thresholds in setting performance goals for our employees, including senior management. Such performance goals serve to incentivize management to improve profitability and thereby increase long-term stockholder value. For more information on the use of Adjusted EBITDA by our board of directors’ compensation committee, see “Executive Compensation — Compensation Discussion and Analysis.” | ||
| As a result, the annual bonuses for certain members of our management typically are based at least in part on Adjusted EBITDA. At the same time, some or all of these executives have responsibility for monitoring our financial results generally, including the items included as adjustments in calculating Adjusted EBITDA (subject ultimately to review by our board of directors in the context of the board’s review of our quarterly financial statements). While many of the adjustments (for example, transaction costs and our existing senior secured credit facility fees) involve mathematical application of items reflected in our financial statements, others (such as determining whether a non-cash item is unusual) involve a degree of judgment and discretion. While we believe that all of these adjustments are appropriate, and although the quarterly calculations are subject to review by our board of directors in the context of the board’s review of our quarterly financial statements and certification by our Chief Financial Officer in a compliance certificate provided to the lenders under our existing senior secured credit facility, this discretion may be viewed as an additional limitation on the use of Adjusted EBITDA as an analytical tool. | ||
| We believe our presentation of Adjusted EBITDA is useful because it provides investors and securities analysts the same information that we use internally for purposes of assessing our core operating performance. | ||
| Adjusted EBITDA is not a substitute for net income (loss), income (loss) from continuing operations, cash flows from operating activities, operating margin, or any other measure prescribed by GAAP. There are limitations to using non-GAAP measures such as Adjusted EBITDA. Although we believe that Adjusted EBITDA can make an evaluation of our operating performance more consistent because it removes items that, in our opinion, do not reflect our core operations, other companies in our industry may define Adjusted EBITDA differently than we do. As a result, it may be difficult to use Adjusted EBITDA or similarly named non-GAAP measures that other companies may use to compare the performance of those companies to our performance. | ||
| Because of these limitations, Adjusted EBITDA should not be considered a measure of the income generated by our business or discretionary cash available to us to invest in the growth of our business. Our management compensates for these limitations by relying primarily on our GAAP results and using Adjusted EBITDA supplementally. |
A reconciliation of GAAP net income (loss) to Adjusted EBITDA for each of the periods indicated is as follows:
| Successor | Predecessor | ||||||||||||||||||||||||||||||||
| Three | January 1, | ||||||||||||||||||||||||||||||||
| Months | Year | 2007 | |||||||||||||||||||||||||||||||
| Ended | Ended | through | Year Ended | ||||||||||||||||||||||||||||||
| March 31, | Year Ended December 31, | December 31, | May 10, | December 31, | |||||||||||||||||||||||||||||
| (Dollars in thousands) | 2010 | 2009 | 2009 | 2008 | 2007 | 2007 | 2006 | 2005 | |||||||||||||||||||||||||
| (Unaudited) | |||||||||||||||||||||||||||||||||
| Net income (loss) | $ | (53,001 | ) | $ | (43,560 | ) | $ | (435,645 | ) | $ | (146,555 | ) | $ | (96,188 | ) | $ | (30,422 | ) | $ | 141,055 | $ | 101,127 | |||||||||||
| Adjusted for: | |||||||||||||||||||||||||||||||||
| Depreciation and amortization | 65,497 | 66,956 | 253,531 | 275,832 | 187,043 | 82,949 | 222,376 | 199,777 | |||||||||||||||||||||||||
| Interest expense | 62,596 | 47,702 | 200,512 | 222,177 | 171,115 | 9,454 | 26,870 | 29,946 | |||||||||||||||||||||||||
| Derivative interest expense (income) | 23,714 | 7,549 | 55,634 | 18,699 | 13,233 | (177 | ) | (1,134 | ) | (3,314 | ) | ||||||||||||||||||||||
| Interest income | (220 | ) | (428 | ) | (1,814 | ) | (3,506 | ) | (6,602 | ) | (1,364 | ) | (2,007 | ) | (1,713 | ) | |||||||||||||||||
| Income tax expense (benefit) | (9,525 | ) | 301 | 326,650 | 11,368 | (234,316 | ) | (4,577 | ) | 80,219 | 63,223 | ||||||||||||||||||||||
| EBITDA | $ | 89,061 | $ | 78,520 | $ | 398,868 | $ | 378,015 | $ | 34,285 | $ | 55,863 | $ | 467,379 | $ | 389,046 | |||||||||||||||||
| Non-cash impairments(a) | 1,274 | 515 | 515 | 24,529 | 256,305 | — | 27,595 | 6,377 | |||||||||||||||||||||||||
| Non-cash equity comp | — | — | — | — | — | 12,501 | 3,627 | 12,397 | |||||||||||||||||||||||||
| Other unusual non-cash items(b) | — | — | — | — | — | 2,418 | — | — | |||||||||||||||||||||||||
| Excludable transaction costs(c) | — | — | 6,477 | 7,054 | 1,007 | 38,905 | — | — | |||||||||||||||||||||||||
| Adjusted EBITDA | $ | 90,335 | $ | 79,035 | $ | 405,860 | $ | 409,598 | $ | 291,597 | $ | 109,687 | $ | 498,601 | $ | 407,820 | |||||||||||||||||
| (a) | Non-cash impairments include the items discussed in note (3) above. | |
| (b) | For the period January 1, 2007 through May 10, 2007, we incurred a $2.4 million pre-tax impairment of a note receivable recorded in non-operating other (income) expense. |
(c) Excludable transaction costs include the following:
| • | for the year ended December 31, 2009, we incurred $4.2 million of pre-tax transaction costs in the third and fourth quarters of 2009 related to an amendment to our existing senior secured credit facility and the concurrent senior secured notes amendments, and $2.3 million of pre-tax transaction costs during the third quarter of 2009 related to our cancelled bond offering; |
13
Table of Contents
| • | for the year ended December 31, 2008, we incurred $7.1 million of pre-tax expense associated with the closing of our 2008 RSA on July 30, 2008, and financial advisory fees associated with an amendment to our existing senior secured credit facility; | |
| • | for the year ended December 31, 2007, we incurred $1.0 million in pre-tax transaction costs related to our going private transaction; and | |
| • | for the period January 1, 2007 to May 10, 2007, our predecessor incurred $16.4 million related tochange-in-control payments made to former executive officers and $22.5 million for financial investment advisory, legal, and accounting fees, all of which resulted from the 2007 Transactions. |
| (8) | We use the term “Adjusted Operating Ratio” throughout this prospectus. Adjusted Operating Ratio, as we define this term, is not presented in accordance with GAAP. We use Adjusted Operating Ratio as a supplement to our GAAP results in evaluating certain aspects of our business, as described below. | |
| We define Adjusted Operating Ratio as (a) total operating expenses, less (i) fuel surcharges, (ii) non-cash impairment charges, (iii) other unusual items, and (iv) excludable transaction costs, as a percentage of (b) total revenue excluding fuel surcharge revenue. | ||
| Our board of directors and executive management team also focus on Adjusted Operating Ratio as a key indicator of our performance from period to period. We believe fuel surcharge is sometimes volatile and eliminating the impact of this source of revenue (by netting fuel surcharge revenue against fuel expense) affords a more consistent basis for comparing our results of operations. We also believe excluding impairments and other unusual items enhances the comparability of our performance from period to period. For a reconciliation of our Adjusted Operating Ratio to our operating ratio, please see the table below. | ||
| We believe our presentation of Adjusted Operating Ratio is useful because it provides investors and securities analysts the same information that we use internally for purposes of assessing our core operating performance. | ||
| Adjusted Operating Ratio is not a substitute for operating margin or any other measure derived solely from GAAP measures. There are limitations to using non-GAAP measures such as Adjusted Operating Ratio. Although we believe that Adjusted Operating Ratio can make an evaluation of our operating performance more consistent because it removes items that, in our opinion, do not reflect our core operations, other companies in our industry may define Adjusted Operating Ratio differently than we do. As a result, it may be difficult to use Adjusted Operating Ratio or similarly named non-GAAP measures that other companies may use to compare the performance of those companies to our performance. | ||
| A reconciliation of our Adjusted Operating Ratio for each of the periods indicated is as follows: |
| Successor | Predecessor | |||||||||||||||||||||||||||||||||
| Three Months | Year | January 1, 2007 | ||||||||||||||||||||||||||||||||
| Ended | Ended | through | Year Ended | |||||||||||||||||||||||||||||||
| March 31, | Year Ended December 31, | December 31, | May 10, | December 31, | ||||||||||||||||||||||||||||||
(Dollars in thousands) | 2010 | 2009 | 2009 | 2008 | 2007 | 2007 | 2006 | 2005 | ||||||||||||||||||||||||||
| Total GAAP operating revenue | $ | 654,830 | $ | 614,756 | $ | 2,571,353 | $ | 3,399,810 | $ | 2,180,293 | $ | 1,074,723 | $ | 3,172,790 | $ | 3,197,455 | ||||||||||||||||||
| Less: | ||||||||||||||||||||||||||||||||||
| Fuel surcharge revenue | (88,816 | ) | (52,986 | ) | (275,373 | ) | (719,617 | ) | (344,946 | ) | (147,507 | ) | (462,529 | ) | (391,942 | ) | ||||||||||||||||||
| Operating revenue, net of fuel surcharge revenue | 566,014 | 561,770 | 2,295,980 | 2,680,193 | 1,835,347 | 927,216 | 2,710,261 | 2,805,513 | ||||||||||||||||||||||||||
| Total GAAP operating expense | 631,637 | 602,517 | 2,439,352 | 3,284,874 | 2,334,984 | 1,100,380 | 2,929,059 | 3,009,395 | ||||||||||||||||||||||||||
| Adjusted for: | ||||||||||||||||||||||||||||||||||
| Fuel surcharge revenue | (88,816 | ) | (52,986 | ) | (275,373 | ) | (719,617 | ) | (344,946 | ) | (147,507 | ) | (462,529 | ) | (391,942 | ) | ||||||||||||||||||
| Excludable transaction costs(a) | — | — | (6,477 | ) | (7,054 | ) | (1,007 | ) | (38,905 | ) | — | — | ||||||||||||||||||||||
| Non-cash impairments(b) | (1,274 | ) | (515 | ) | (515 | ) | (24,529 | ) | (256,305 | ) | — | (27,595 | ) | (6,377 | ) | |||||||||||||||||||
| Other unusual items(c) | (7,382 | ) | — | — | — | — | — | 9,952 | — | |||||||||||||||||||||||||
| Acceleration of noncash stock options(d) | — | — | — | — | — | (11,125 | ) | — | (12,397 | ) | ||||||||||||||||||||||||
| Adjusted operating expense | $ | 534,165 | $ | 549,016 | $ | 2,156,987 | $ | 2,533,674 | $ | 1,732,726 | $ | 902,843 | $ | 2,448,887 | $ | 2,598,679 | ||||||||||||||||||
| Adjusted Operating Ratio(e) | 94.4% | 97.7% | 93.9% | 94.5% | 94.4% | 97.4% | 90.4% | 92.6% | ||||||||||||||||||||||||||
| Actual operating ratio | 96.5% | 98.0% | 94.9% | 96.6% | 107.1% | 102.4% | 92.3% | 94.1% | ||||||||||||||||||||||||||
| (a) | Excludable transaction costs include the following: |
| • | for the year ended December 31, 2009, we incurred $4.2 million of pre-tax transaction costs in the third and fourth quarters of 2009 related to an amendment to our existing senior secured credit facility and the concurrent senior secured notes amendments, and $2.3 million of pre-tax transaction costs during the third quarter of 2009 related to our cancelled bond offering; | |
| • | for the year ended December 31, 2008, we incurred $7.1 million of pre-tax expense associated with the closing of our 2008 RSA on July 30, 2008, and financial advisory fees associated with an amendment to our existing senior secured credit facility; | |
| • | for the year ended December 31, 2007, we incurred $1.0 million in pre-tax transaction costs related to our going private transaction; and | |
| • | for the period January 1, 2007 to May 10, 2007, our predecessor incurred $16.4 million related tochange-in-control payments made to former executive officers and $22.5 million for financial investment advisory, legal, and accounting fees, all of which resulted from the 2007 Transactions. |
| (b) | Non-cash impairments include items discussed in note (3) above. |
14
Table of Contents
| (c) | Other unusual items included the following: |
| • | for the year ended December 31, 2006, we recognized a $4.8 million and $5.2 million pre-tax benefit for the change in our discretionary match to our 401(k) profit sharing plan and a gain from the settlement of litigation, respectively; and | |
| • | in the first quarter of 2010, we incurred $7.4 million of incremental depreciation expense during the 2010 quarter reflecting management’s revised estimates regarding salvage value and useful lives for approximately 7,000 dry van trailers, which management decided to scrap. |
| (d) | Acceleration of non-cash stock options includes the following: |
| • | for the period January 1, 2007 to May 10, 2007, we incurred $11.1 million related to the acceleration of stock incentive awards as a result of the 2007 Transactions; and | |
| • | for the year ended December 31, 2005, we incurred a $12.4 million pre-tax expense to accelerate the vesting period of 7.3 million stock options. |
We expect a future adjustment to this line item to reflect an approximately $16.4 million one-time non-cash equity compensation charge for certain stock options that vest upon an initial public offering. Thereafter, quarterly non-cash equity compensation expense for existing grants is estimated to be approximately $1.8 million per quarter through 2012.
| (e) | We have not included adjustments to Adjusted Operating Ratio to reflect the following non-cash amortization expense we recognized for certain identified intangible assets during the following periods: |
| • | during the three months ended March 31, 2010 and 2009, we incurred amortization expense of $5.2 million and $5.7 million, respectively, relating to certain intangible assets identified in the 2007 Transactions; and | |
| • | for the years ended December 31, 2009, 2008, and 2007, we incurred amortization expense of $22.0 million, $24.2 million, and $16.8 million, respectively, relating to certain intangible assets identified in the 2007 Transactions. |
15
Table of Contents
Risk Factors
An investment in our Class A common stock involves a high degree of risk. You should carefully consider the following risks, as well as the other information contained in this prospectus, before making an investment decision. If any of the following risks, as well as other risks and uncertainties that are not yet identified or that we currently think are immaterial, actually occur, our business, results of operations, or financial condition could be materially and adversely affected. In such an event, the trading price of our Class A common stock could decline and you could lose part or all of your investment.
Risks Related to Our Business and Industry
Our business is subject to general economic and business factors affecting the truckload industry that are largely beyond our control, any of which could have a material adverse effect on our operating results.
Our business is dependent on a number of factors that may have a negative impact on our results of operations, many of which are beyond our control. We believe that some of the most significant of these factors are economic changes that affect supply and demand in transportation markets, such as:
| • | recessionary economic cycles; | |
| • | changes in customers’ inventory levels and in the availability of funding for their working capital; | |
| • | excess tractor capacity in comparison with shipping demand; and | |
| • | downturns in customers’ business cycles. |
The risks associated with these factors are heightened when the U.S. economy is weakened. Some of the principal risks during such times are as follows:
| • | we may experience low overall freight levels, which may impair our asset utilization; | |
| • | certain of our customers may face credit issues and cash flow problems, as discussed below; | |
| • | freight patterns may change as supply chains are redesigned, resulting in an imbalance between our capacity and our customers’ freight demand; | |
| • | customers may bid out freight or select competitors that offer lower rates from among existing choices in an attempt to lower their costs and we might be forced to lower our rates or lose freight; and | |
| • | we may be forced to incur more deadhead miles to obtain loads. |
Economic conditions that decrease shipping demand or increase the supply of tractors and trailers can exert downward pressure on rates and equipment utilization, thereby decreasing asset productivity. As a result of depressed freight volumes and excess truckload capacity in our industry, we have experienced lower miles per unit, freight rates, and freight volumes in recent periods, all of which have negatively impacted our results. Although the ATA’s seasonally adjusted for-hire truck tonnage index has shown improvement since the end of 2009, we cannot predict when or if the truckload market will return to a period of sustained growth. A prolonged recession or general economic instability could result in further declines in our results of operations, which declines may be material.
We also are subject to cost increases outside our control that could materially reduce our profitability if we are unable to increase our rates sufficiently. Such cost increases include, but are not limited to, increases in fuel prices, driver wages, interest rates, taxes, tolls, license and registration fees, insurance, revenue equipment, and healthcare for our employees.
In addition, events outside our control, such as strikes or other work stoppages at our facilities or at customer, port, border, or other shipping locations, or actual or threatened armed conflicts or terrorist attacks, efforts to combat terrorism, military action against a foreign state or group located in a foreign state, or heightened security requirements could lead to reduced economic demand, reduced availability of credit, or temporary closing of the shipping locations or U.S. borders. Such events or enhanced security measures in
16
Table of Contents
connection with such events could impair our operating efficiency and productivity and result in higher operating costs.
We operate in the highly competitive and fragmented truckload industry, and our business and results of operations may suffer if we are unable to adequately address downward pricing and other competitive pressures.
We compete with many truckload carriers and, to a lesser extent, withless-than-truckload carriers, railroads, and third-party logistics, brokerage, freight forwarding, and other transportation companies. Additionally, some of our customers may utilize their own private fleets rather than outsourcing loads to us. Some of our competitors may have greater access to equipment, a wider range of services, greater capital resources, less indebtedness, or other competitive advantages. Numerous competitive factors could impair our ability to maintain or improve our profitability. These factors include the following:
| • | many of our competitors periodically reduce their freight rates to gain business, especially during times of reduced growth in the economy, which may limit our ability to maintain or increase freight rates or to maintain or expand our business or may require us to reduce our freight rates; | |
| • | some of our customers also operate their own private trucking fleets and they may decide to transport more of their own freight; | |
| • | some shippers have reduced or may reduce the number of carriers they use by selecting core carriers as approved service providers and in some instances we may not be selected; | |
| • | many customers periodically solicit bids from multiple carriers for their shipping needs and this process may depress freight rates or result in a loss of business to competitors; | |
| • | the continuing trend toward consolidation in the trucking industry may result in more large carriers with greater financial resources and other competitive advantages, and we may have difficulty competing with them; | |
| • | advances in technology may require us to increase investments in order to remain competitive, and our customers may not be willing to accept higher freight rates to cover the cost of these investments; | |
| • | higher fuel prices and, in turn, higher fuel surcharges to our customers may cause some of our customers to consider freight transportation alternatives, including rail transportation; | |
| • | competition from freight logistics and brokerage companies may negatively impact our customer relationships and freight rates; and | |
| • | economies of scale that may be passed on to smaller carriers by procurement aggregation providers may improve such carriers’ ability to compete with us. |
We have several major customers, the loss of one or more of which could have a material adverse effect on our business.
A significant portion of our revenue is generated from a number of major customers, the loss of one or more of which could have a material adverse effect on our business. For the year ended December 31, 2009, our top 25 customers, based on revenue, accounted for approximately 54% of our revenue; our top 10 customers, approximately 37% of our revenue; our top 5 customers, approximately 27% of our revenue; and our largest customer, Wal-Mart and its subsidiaries, accounted for 10.2% of our revenue. A substantial portion of our freight is from customers in the retail sales industry. As such, our volumes are largely dependent on consumer spending and retail sales, and our results may be more susceptible to trends in unemployment and retail sales than carriers that do not have this concentration.
Economic conditions and capital markets may adversely affect our customers and their ability to remain solvent. Our customers’ financial difficulties can negatively impact our results of operations and financial condition and our ability to comply with the covenants in our debt agreements and accounts receivable securitization agreements, especially if they were to delay or default on payments to us. Generally, we do not
17
Table of Contents
have contractual relationships that guarantee any minimum volumes with our customers, and we cannot assure you that our customer relationships will continue as presently in effect. Our dedicated business is generally subject to longer term written contracts than our non-dedicated business; however, certain of these contracts contain cancellation clauses and there is no assurance any of our customers, including our dedicated customers, will continue to utilize our services, renew our existing contracts, or continue at the same volume levels. A reduction in or termination of our services by one or more of our major customers, including our dedicated customers, could have a material adverse effect on our business and operating results.
We may not be able to sustain the cost savings realized as part of our recent cost reduction initiatives.
Since the first quarter of 2008, we have implemented over $250 million of annualized cost savings, many of which we expect to result in ongoing savings. The cost savings entail several elements, including reducing our tractor fleet by 17.2%, improving fuel efficiency, improving our tractor to non-driver ratio, suspending bonuses and 401(k) matching, streamlining maintenance and administrative functions, improving safety and claims management, and limiting discretionary expenses. We may not be able to sustain all, or any part of, these cost savings on an annual basis in the future, particularly those related to headcount, compensation, and employee benefits, if an economic recovery increases competition for employees and expenses relating to driving more miles.
We may not be successful in achieving our strategy of growing our revenue.
Our current goals include increasing revenue in excess of 10% over the next several years, including by growing our current service offerings. While we currently believe we can achieve these stated goals through the implementation of various business strategies, there can be no assurance that we will be able to effectively and successfully implement such strategies and realize our stated goals. Our goals may be negatively affected by a failure to further penetrate our existing customer base, cross-sell our service offerings, pursue new customer opportunities, manage the operations and expenses of new or growing service offerings, or otherwise achieve growth of our service offerings. Further, we may not achieve profitability from our new service offerings. There is no assurance that successful execution of our business strategies will result in us achieving our current business goals.
We have a recent history of net losses.
For the years ended December 31, 2007, 2008, and 2009, we incurred net losses of $96.2 million (net of a tax benefit of $230.2 million to eliminate our deferred tax liabilities upon conversion to a subchapter S corporation), $146.6 million, and $435.6 million (including $324.8 million to recognize deferred income taxes upon our election to be taxed as a subchapter C corporation), respectively. Achieving profitability depends upon numerous factors, including our ability to increase our trucking revenue per tractor, expand our overall volume, and control expenses. We might not achieve profitability or, if we do, we may not be able to sustain or increase profitability in the future.
Fluctuations in the price or availability of fuel, the volume and terms of diesel fuel purchase commitments, and surcharge collection may increase our costs of operation, which could materially and adversely affect our profitability.
Fuel is one of our largest operating expenses. Diesel fuel prices fluctuate greatly due to factors beyond our control, such as political events, terrorist activities, armed conflicts, depreciation of the dollar against other currencies, and hurricanes and other natural or man-made disasters, such as the recent oil spill in the Gulf of Mexico, each of which may lead to an increase in the cost of fuel. Fuel prices also are affected by the rising demand in developing countries, including China, and could be adversely impacted by the use of crude oil and oil reserves for other purposes and diminished drilling activity. Such events may lead not only to increases in fuel prices, but also to fuel shortages and disruptions in the fuel supply chain. Because our operations are dependent upon diesel fuel, significant diesel fuel cost increases, shortages, or supply disruptions could materially and adversely affect our results of operations and financial condition.
18
Table of Contents
Fuel also is subject to regional pricing differences and often costs more on the West Coast and in the Northeast, where we have significant operations. Increases in fuel costs, to the extent not offset by rate per mile increases or fuel surcharges, have an adverse effect on our operations and profitability. We obtain some protection against fuel cost increases by maintaining a fuel-efficient fleet and a compensatory fuel surcharge program. We have fuel surcharge programs in place with a majority of our customers, which have helped us offset the majority of the negative impact of rising fuel prices associated with loaded or billed miles. However, we also incur fuel costs that cannot be recovered even with respect to customers with which we maintain fuel surcharge programs, such as those associated with empty miles, deadhead miles, or the time when our engines are idling. Because our fuel surcharge recovery lags behind changes in fuel prices, our fuel surcharge recovery may not capture the increased costs we pay for fuel, especially when prices are rising, leading to fluctuations in our levels of reimbursement; and our levels of reimbursement have fluctuated in the past. Further, during periods of low freight volumes, shippers can use their negotiating leverage to impose less compensatory fuel surcharge policies. There can be no assurance that such fuel surcharges can be maintained indefinitely or will be sufficiently effective.
We have not used derivatives to mitigate volatility in our fuel costs, but periodically evaluate their possible use. We have contracted with some of our fuel suppliers to buy fuel at a fixed price or within banded pricing for a specific period, usually not exceeding twelve months, to mitigate the impact of rising fuel costs. However, these purchase commitments only cover a small portion of our fuel consumption and, accordingly, our results of operations could be negatively impacted by fuel price fluctuations.
Increased prices for new revenue equipment, design changes of new engines, volatility in the used equipment sales market, and the failure of manufacturers to meet their sale or trade-back obligations to us could adversely affect our financial condition, results of operations, and profitability.
We have experienced higher prices for new tractors over the past few years. The resale value of the tractors and the residual values under arrangements we have with manufacturers have not increased to the same extent. In addition, the engines used in tractors manufactured in 2010 and after are subject to more stringent emissions control regulations issued by the Environmental Protection Agency, or EPA. Compliance with such regulations has increased the cost of the tractors, and resale prices or residual values may not increase to the same extent. Accordingly, our equipment costs, including depreciation expense per tractor, are expected to increase in future periods. As with any engine redesign, there is a risk that the newly designed 2010 diesel engines will have unforeseen problems. Additionally, we have not operated many of the new 2010 diesel engines, so we cannot be certain how they will operate.
Many engine manufacturers are using selective catalytic reduction, or SCR, equipment to comply with the EPA’s 2010 diesel engine emissions standards. SCR equipment requires a separate urea-based liquid known as diesel exhaust fluid, which is stored in a separate tank on the truck. If the new tractors we purchase are equipped with SCR technology and require us to use diesel exhaust fluid, we will be exposed to additional costs associated with the price and availability of diesel exhaust fluid, the weight of the diesel exhaust fluid tank and SCR system, and additional maintenance costs associated with the SCR system. Additionally, we may need to train our drivers to use the new SCR equipment. Problems relating to the new 2010 engines or increased costs associated with the new 2010 engines resulting from regulatory requirements or otherwise could adversely impact our business.
A depressed market for used equipment could require us to trade our revenue equipment at depressed values or to record losses on disposal or impairments of the carrying values of our revenue equipment that is not protected by residual value arrangements. Used equipment prices are subject to substantial fluctuations based on freight demand, supply of used trucks, availability of financing, the presence of buyers for export to countries such as Russia and Brazil, and commodity prices for scrap metal. We took impairment charges related to the value of certain tractors and trailers in 2007, 2008, and the first quarter of 2010. If there is another deterioration of resale prices, it could have a material adverse effect on our business and operating results. Trades at depressed values and decreases in proceeds under equipment disposals and impairments of the carrying values of our revenue equipment could adversely affect our results of operations and financial condition.
19
Table of Contents
We lease or finance certain revenue equipment under leases that are structured with balloon payments at the end of the lease or finance term equal to the value we have contracted to receive from the respective equipment manufacturers upon sale or trade back to the manufacturers. To the extent we do not purchase new equipment that triggers the trade back obligation, or the manufacturers of the equipment do not pay the contracted value at the end of the lease term, we could be exposed to losses for the amount by which the balloon payments owed to the respective lease or finance companies exceed the proceeds we are able to generate in open market sales of the equipment. In addition, if we purchase equipment subject to a buy-back agreement and the manufacturer refuses to honor the agreement or we are unable to replace equipment at a reasonable price, we may be forced to sell such equipment at a loss.
We operate in a highly regulated industry, and changes in existing regulations or violations of existing or future regulations could have a material adverse effect on our operations and profitability.
We operate in the United States throughout the 48 contiguous states pursuant to operating authority granted by the U.S. Department of Transportation, or DOT, in Mexico pursuant to operating authority granted by Secretarìa de Communiciones y Transportes, and in various Canadian provinces pursuant to operating authority granted by the Ministries of Transportation and Communications in such provinces. Our company drivers and owner-operators also must comply with the safety and fitness regulations of the DOT, including those relating to drug and alcohol testing andhours-of-service. Such matters as weight and equipment dimensions also are subject to government regulations. We also may become subject to new or more restrictive regulations relating to fuel emissions, drivers’hours-of-service, ergonomics, on-board reporting of operations, collective bargaining, security at ports, and other matters affecting safety or operating methods. The DOT is currently engaged in a rulemaking proceeding regarding drivers’hours-of-service, and the result could negatively impact utilization of our equipment. Other agencies, such as the EPA and the DHS, also regulate our equipment, operations, and drivers. Future laws and regulations may be more stringent, require changes in our operating practices, influence the demand for transportation services, or require us to incur significant additional costs. Higher costs incurred by us or by our suppliers who pass the costs onto us through higher prices could adversely affect our results of operations.
In the aftermath of the September 11, 2001 terrorist attacks, federal, state, and municipal authorities implemented and continue to implement various security measures, including checkpoints and travel restrictions on large trucks. The Transportation Security Administration, or TSA, has adopted regulations that require determination by the TSA that each driver who applies for or renews his license for carrying hazardous materials is not a security threat. This could reduce the pool of qualified drivers, which could require us to increase driver compensation, limit fleet growth, or let trucks sit idle. These regulations also could complicate the matching of available equipment with hazardous material shipments, thereby increasing our response time and our deadhead miles on customer orders. As a result, it is possible that we may fail to meet the needs of our customers or may incur increased expenses to do so. These security measures could negatively impact our operating results.
The new CSA 2010 initiative of the Federal Motor Carrier Safety Administration, or FMCSA, introduces a new enforcement and compliance model, which implements driver standards in addition to our current standards. Under the new regulations, the methodology for determining a carrier’s DOT safety rating will be expanded to include the on-road safety performance of the carrier’s drivers. The new regulations are scheduled to be implemented in the second half of 2010, and enforcement is scheduled to begin in 2011. These implementation and enforcement dates have already been delayed and may be subject to further change. As a result of these new regulations, including the expanded methodology for determining a carrier’s DOT safety rating, there may be an adverse effect on our DOT safety rating. We currently have a satisfactory DOT rating, which is the highest available rating. A conditional or unsatisfactory DOT safety rating could adversely affect our business because some of our customer contracts may require a satisfactory DOT safety rating, and a conditional or unsatisfactory rating could negatively impact or restrict our operations. In addition, there is a possibility that a drop to conditional status could affect our ability to self-insure for personal injury and property damage relating to the transportation of freight, which could cause our insurance costs to increase. Finally, proposed FMCSA rules and practices followed by regulators may require us to install electronic on-
20
Table of Contents
board recorders in our tractors if we receive an adverse change in our safety results or safety rating. Such installation could cause an increase in driver turnover, adverse information in litigation, cost increases, and decreased asset utilization.
In addition, our operations are subject to various environmental laws and regulations dealing with the transportation, storage, presence, use, disposal, and handling of hazardous materials, discharge of wastewater and storm water, and with waste oil and fuel storage tanks. Our truck terminals often are located in industrial areas where groundwater or other forms of environmental contamination could occur. Our operations involve the risks of fuel spillage or seepage, environmental damage, and hazardous waste disposal, among others. Certain of our facilities have waste oil or fuel storage tanks and fueling islands. A small percentage of our freight consists of low-grade hazardous substances, which subjects us to a wide array of regulations. Although we have instituted programs to monitor and control environmental risks and promote compliance with applicable environmental laws and regulations, if we are involved in a spill or other accident involving hazardous substances, if there are releases of hazardous substances we transport, if soil or groundwater contamination is found at our facilities or results from our operations, or if we are found to be in violation of applicable laws or regulations, we could be subject to cleanup costs and liabilities, including substantial fines or penalties or civil and criminal liability, any of which could have a material adverse effect on our business and operating results. Additionally, if we fail to comply with applicable environmental regulations, we could be subject to substantial fines or penalties and to civil and criminal liability.
EPA regulations limiting exhaust emissions became more restrictive in 2010. On May 21, 2010, President Obama signed an executive memorandum directing the National Highway Traffic Safety Administration, or NHTSA, and the EPA to develop new, stricter fuel efficiency standards for heavy trucks, beginning in 2014. In December 2008, California adopted new performance requirements for diesel trucks, with targets to be met between 2011 and 2023, and California also has adopted aerodynamics requirements for certain trailers. These regulations, as well as proposed regulations or legislation related to climate change that potentially impose restrictions, caps, taxes, or other controls on emissions of greenhouse gas, could adversely affect our operations and financial results. In addition, increasing efforts to control emissions of greenhouse gases are likely to have an impact on us. The EPA has announced a finding relating to greenhouse gas emissions that may result in promulgation of greenhouse gas emission limits. Federal and state lawmakers also are considering a variety of climate-change proposals. Compliance with such regulations could increase the cost of new tractors and trailers, impair equipment productivity, and increase operating expenses. These effects, combined with the uncertainty as to the operating results that will be produced by the newly designed diesel engines and the residual values of these vehicles, could increase our costs or otherwise adversely affect our business or operations.
In order to reduce exhaust emissions, some states and municipalities have begun to restrict the locations and amount of time where diesel-powered tractors, such as ours, may idle. These restrictions could force us to alter our drivers’ behavior, purchase on-board power units that do not require the engine to idle, or face a decrease in productivity.
From time to time, various federal, state, or local taxes are increased, including taxes on fuels. We cannot predict whether, or in what form, any such increase applicable to us will be enacted, but such an increase could adversely affect our profitability.
CSA 2010, increases in driver compensation, or other difficulties in attracting and retaining qualified drivers could adversely affect our profitability and ability to maintain or grow our fleet.
Under CSA 2010, drivers and fleets will be evaluated and ranked based on certain safety-related standards. As a result, certain current and potential drivers may no longer be eligible to drive for us, our fleet could be ranked poorly as compared to our peer firms, and our safety rating could be adversely impacted. We recruit and retain a substantial number of first-time drivers, and these drivers may have a higher likelihood of creating adverse safety events under CSA 2010. A reduction in eligible drivers or a poor fleet ranking may result in difficulty attracting and retaining qualified drivers, and could cause our customers to direct their
21
Table of Contents
business away from us and to carriers with higher fleet rankings, which would adversely affect our results of operations.
Additionally, like many truckload carriers, from time to time we have experienced difficulty in attracting and retaining sufficient numbers of qualified drivers, including owner-operators, and such shortages may recur in the future. Because of the intense competition for drivers, we may face difficulty maintaining or increasing our number of drivers. Due in part to the economic recession, we reduced our driver pay in 2009. The compensation we offer our drivers and owner-operators is subject to market conditions and we may find it necessary to increase driver and owner-operator compensation in future periods, which will be more likely to the extent that economic conditions improve. In addition, like most in our industry, we suffer from a high turnover rate of drivers, especially in the first 90 days of employment. Our high turnover rate requires us to continually recruit a substantial number of drivers in order to operate existing revenue equipment. If we are unable to continue to attract and retain a sufficient number of drivers, we could be required to adjust our compensation packages, or operate with fewer trucks and face difficulty meeting shipper demands, all of which could adversely affect our profitability and ability to maintain our size or grow.
We self-insure a significant portion of our claims exposure, which could significantly increase the volatility of, and decrease the amount of, our earnings.
We self-insure a significant portion of our claims exposure and related expenses related to cargo loss, employee medical expense, bodily injury, workers’ compensation, and property damage and maintain insurance with licensed insurance companies above our limits of self-insurance. Our substantial self-insured retention of $10.0 million for bodily injury and property damage per occurrence and up to $5.0 million per occurrence for workers’ compensation claims can make our insurance and claims expense higher or more volatile. Additionally, with respect to our third-party insurance, we face the risks of increasing premiums and collateral requirements and the risk of carriers or underwriters leaving the trucking sector, which may materially affect our insurance costs or make insurance in excess of our self-insured retention more difficult to find, as well as increase our collateral requirements.
We accrue the costs of the uninsured portion of pending claims based on estimates derived from our evaluation of the nature and severity of individual claims and an estimate of future claims development based upon historical claims development trends. Actual settlement of the self-insured claim liabilities could differ from our estimates due to a number of uncertainties, including evaluation of severity, legal costs, and claims that have been incurred but not reported. Due to our high self-insured amounts, we have significant exposure to fluctuations in the number and severity of claims and the risk of being required to accrue or pay additional amounts if our estimates are revised or the claims ultimately prove to be more severe than originally assessed. Although we endeavor to limit our exposure arising with respect to such claims, we also may have exposure if carrier subcontractors under our brokerage operations are inadequately insured for any accident.
Our liability coverage has a maximum aggregate limit of $150.0 million per year. If any claim were to exceed our aggregate coverage limit, we would bear the excess, in addition to our other self-insured amounts. Although we believe our aggregate insurance limits are sufficient to cover reasonably expected claims, it is possible that one or more claims could exceed those limits. Our insurance and claims expense could increase, or we could find it necessary to raise our self-insured retention or decrease our aggregate coverage limits when our policies are renewed or replaced. Our operating results and financial condition may be adversely affected if these expenses increase, we experience a claim in excess of our coverage limits, we experience a claim for which we do not have coverage, or we have to increase our reserves.
Insuring risk through our wholly-owned captive insurance companies could adversely impact our operations.
We insure a significant portion of our risk through our wholly-owned captive insurance companies, Mohave Transportation Insurance Company, or Mohave, and Red Rock Risk Retention Group, Inc., or Red Rock. In addition to insuring portions of our own risk, Mohave insures certain owner-operators in exchange for an insurance premium paid by the owner-operator to Mohave. The insurance and reinsurance markets are
22
Table of Contents
subject to market pressures. Our captive insurance companies’ abilities or needs to access the reinsurance markets may involve the retention of additional risk, which could expose us to volatility in claims expenses. Additionally, an increase in the number or severity of claims for which we insure could adversely impact our results of operations.
To comply with certain state insurance regulatory requirements, cash and cash equivalents must be paid to Red Rock and Mohave as capital investments and insurance premiums to be restricted as collateral for anticipated losses. Such restricted cash is used for payment of insured claims. In the future, we may continue to insure our automobile liability risk through our captive insurance subsidiaries, which will cause the required amount of our restricted cash, as recorded on our balance sheet, or other collateral, such as letters of credit, to rise. Significant future increases in the amount of collateral required by third-party insurance carriers and regulators would reduce our liquidity and could adversely affect our results of operations and capital resources.
Our wholly-owned captive insurance companies are subject to substantial government regulation.
State authorities regulate our insurance subsidiaries in the states in which they do business. These regulations generally provide protection to policy holders rather than stockholders. The nature and extent of these regulations typically involve items such as: approval of premium rates for insurance, standards of solvency and minimum amounts of statutory capital surplus that must be maintained, limitations on types and amounts of investments, regulation of dividend payments and other transactions between affiliates, regulation of reinsurance, regulation of underwriting and marketing practices, approval of policy forms, methods of accounting, and filing of annual and other reports with respect to financial condition and other matters. These regulations may increase our costs of regulatory compliance, limit our ability to change premiums, restrict our ability to access cash held in our captive insurance companies, and otherwise impede our ability to take actions we deem advisable.
We are subject to certain risks arising from doing business in Mexico.
We have a growing operation in Mexico, including through our wholly-owned subsidiary, Trans-Mex. As a result, we are subject to risks of doing business internationally, including fluctuations in foreign currencies, changes in the economic strength of Mexico, difficulties in enforcing contractual obligations and intellectual property rights, burdens of complying with a wide variety of international and U.S. export and import laws, and social, political, and economic instability. In addition, if we are unable to maintain our C-TPAT status, we may have significant border delays, which could cause our Mexican operations to be less efficient than those of competitor truckload carriers also operating in Mexico that obtain or continue to maintain C-TPAT status. We also face additional risks associated with our foreign operations, including restrictive trade policies and imposition of duties, taxes, or government royalties imposed by the Mexican government, to the extent not preempted by the terms of North American Free Trade Agreement. Factors that substantially affect the operations of our business in Mexico may have a material adverse effect on our overall operating results.
Our use of owner-operators to provide a portion of our tractor fleet exposes us to different risks than our competitors who employ a larger percentage of company drivers.
We provide financing to certain of our owner-operators purchasing tractors from us. If we are unable to provide such financing in the future, due to liquidity constraints or other restrictions, we may experience a decrease in the number of owner-operators available to us. Further, if owner-operators operating the tractors we finance default under or otherwise terminate the financing arrangement and we are unable to find a replacement owner-operator, we may incur losses on amounts owed to us with respect to the tractor in addition to any losses we may incur as a result of idling the tractor.
During times of increased economic activity, we face heightened competition for owner-operators from other carriers. To the extent our turnover increases, if we cannot attract sufficient owner-operators, or it becomes economically difficult for owner-operators to survive, we may not achieve our goal of increasing the percentage of our fleet provided by owner-operators.
23
Table of Contents
Pursuant to our owner-operator fuel reimbursement program, we absorb all increases in fuel costs above a certain level to protect our owner-operators from additional increases in fuel prices with respect to certain of our owner-operators. A significant increase or rapid fluctuation in fuel prices could significantly increase our purchased transportation costs due to reimbursement rates under our fuel reimbursement program becoming higher than the benefits to us under our fuel surcharge programs with our customers.
Our lease contracts with our owner-operators are governed by the federal leasing regulations, which impose specific requirements on us and our owner-operators. In the past, we have been the subject of lawsuits, alleging the violation of leasing obligations or failure to follow the contractual terms. It is possible that we could be subjected to similar lawsuits in the future, which could result in liability.
If our owner-operators are deemed by regulators or judicial process to be employees, our business and results of operations could be adversely affected.
Tax and other regulatory authorities have in the past sought to assert that owner-operators in the trucking industry are employees rather than independent contractors. Proposed federal legislation would make it easier to reclassify owner-operators as employees. Some states have put initiatives in place to increase their revenues from items such as unemployment, workers’ compensation, and income taxes, and a reclassification of owner-operators as employees would help states with this initiative. Further, class actions and other lawsuits have been filed against us and others in our industry seeking to reclassify owner-operators as employees for a variety of purposes, including workers’ compensation and health care coverage. Taxing and other regulatory authorities and courts apply a variety of standards in their determination of independent contractor status. If our owner-operators are determined to be our employees, we would incur additional exposure under federal and state tax, workers’ compensation, unemployment benefits, labor, employment, and tort laws, including for prior periods, as well as potential liability for employee benefits and tax withholdings.
We are dependent on certain personnel that are of key importance to the management of our business and operations.
Our success depends on the continuing services of our founder, current owner, and Chief Executive Officer, Mr. Moyes. We currently do not have an employment agreement with Mr. Moyes. We believe that Mr. Moyes possesses valuable knowledge about the trucking industry and that his knowledge and relationships with our key customers and vendors would be very difficult to replicate.
In addition, many of our other executive officers are of key importance to the management of our business and operations, including our President, Richard Stocking, and our Chief Financial Officer, Virginia Henkels. We currently do not have employment agreements with any of our management. Our future success depends on our ability to retain our executive officers and other capable managers. Any unplanned turnover or our failure to develop an adequate succession plan for our leadership positions could deplete our institutional knowledge base and erode our competitive advantage. Although we believe we could replace key personnel given adequate prior notice, the unexpected departure of key executive officers could cause substantial disruption to our business and operations. In addition, even if we are able to continue to retain and recruit talented personnel, we may not be able to do so without incurring substantial costs.
We engage in transactions with other businesses controlled by Mr. Moyes, our Chief Executive Officer and current owner, and the interests of Mr. Moyes could conflict with the interests of our other stockholders. In addition, Mr. Moyes may pledge or borrow against a portion of his Class B common stock, which may also cause his interests to conflict with the interests of our other stockholders.
We engage in multiple transactions with related parties, some of which will continue after this offering. These transactions include providing and receiving freight services and facility leases with entities owned by Mr. Moyes and certain members of his family, the provision of air transportation services from an entity owned by Mr. Moyes and certain members of his family, and the acquisition of approximately 100 trailers from an entity owned by Mr. Moyes and certain members of his family in 2009. Because certain entities controlled by Mr. Moyes and certain members of his family operate in the transportation industry, Mr. Moyes’
24
Table of Contents
ownership may create conflicts of interest or require judgments that are disadvantageous to you in the event we compete for the same freight or other business opportunities. As a result, Mr. Moyes may have interests that conflict with yours. We have adopted a policy relating to prior approval of related party transactions and our amended and restated certificate of incorporation contains provisions that specifically relate to prior approval for transactions with Mr. Moyes, the Moyes Affiliates, and any Moyes affiliated entities. However, we cannot assure you that the policy or these provisions will be successful in eliminating conflicts of interests. See “Certain Relationships and Related Party Transactions” and “Description of Capital Stock — Affiliate Transactions.”
Our amended and restated certificate of incorporation also provides that in the event that any of our officers or directors is also an officer or director or employee of an entity owned by or affiliated with Mr. Moyes or any of the Moyes Affiliates and acquires knowledge of a potential transaction or other corporate opportunity not involving the truck transportation industry or involving refrigerated transportation orless-than-truckload transportation, then, subject to certain exceptions, we shall not be entitled to such transaction or corporate opportunity and you should have no expectancy that such transaction or corporate opportunity will be available to us. See “Certain Relationships and Related Party Transactions” and “Description of Capital Stock — Corporate Opportunity.”
In the past, in order to fund the operations of or otherwise provide financing for some of Mr. Moyes’ other businesses, Mr. Moyes pledged substantially all of his ownership interest in our predecessor company and it is possible that the needs of these businesses in the future may cause him to sell or pledge shares of our Class B common stock. Such sales or pledges, or the perception that they may occur, may have an adverse effect on the price of our Class A common stock and may create conflicts of interests for Mr. Moyes. Although our board of directors has limited the right of employees or directors to pledge more than 20% of their family holdings to secure margin loans pursuant to our securities trading policy, we cannot assure you that the current board policy will not be changed under circumstances deemed by the board to be appropriate.
Mr. Moyes, our Chief Executive Officer, has substantial ownership interests in several other businesses, which may expose Mr. Moyes and us to significant lawsuits or liabilities.
Mr. Moyes is the principal owner of, and serves as chairman of the board of directors of Central Refrigerated Services, Inc., a temperature controlled truckload carrier, Central Freight Lines, Inc., an LTL carrier, SME Industries, Inc., a steel erection and fabrication company, Southwest Premier Properties, a real estate management company, and other business endeavors and investments in a variety of industries. Although Mr. Moyes devotes the substantial majority of his time to his role as Chief Executive Officer of Swift Corporation, the breadth of Mr. Moyes’ other interests may place competing demands on his time and attention. In addition, in one instance of litigation arising from another business owned by Mr. Moyes, Swift was named as a defendant even though Swift was not a party to the transactions that were the subject of the litigation. It is possible that litigation relating to other businesses owned by Mr. Moyes in the future may result in Swift being named as a defendant and, even if such claims are without merit, that we will be required to incur the expense of defending such matters.
We depend on third parties, particularly in our intermodal and brokerage businesses, and service instability from these providers could increase our operating costs and reduce our ability to offer intermodal and brokerage services, which could adversely affect our revenue, results of operations, and customer relationships.
Our intermodal business utilizes railroads and some third-party drayage carriers to transport freight for our customers. In most markets, rail service is limited to a few railroads or even a single railroad. Any reduction in service by the railroads with which we have or in the future may have relationships is likely to increase the cost of the rail-based services we provide and reduce the reliability, timeliness, and overall attractiveness of our rail-based services. Furthermore, railroads increase shipping rates as market conditions permit. Price increases could result in higher costs to our customers and reduce or eliminate our ability to offer intermodal services. In addition, we may not be able to negotiate additional contracts with railroads to
25
Table of Contents
expand our capacity, add additional routes, or obtain multiple providers, which could limit our ability to provide this service.
Our brokerage business is dependent upon the services of third-party capacity providers, including other truckload carriers. These third-party providers seek other freight opportunities and may require increased compensation in times of improved freight demand or tight trucking capacity. Our inability to secure the services of these third parties, or increases in the prices we must pay to secure such services, could have an adverse effect on our operations and profitability.
We are dependent on computer and communications systems, and a systems failure could cause a significant disruption to our business.
Our business depends on the efficient and uninterrupted operation of our computer and communications hardware systems and infrastructure. We currently maintain our computer system at our Phoenix, Arizona headquarters, along with computer equipment at each of our terminals. Our operations and those of our technology and communications service providers are vulnerable to interruption by fire, earthquake, power loss, telecommunications failure, terrorist attacks, Internet failures, computer viruses, and other events beyond our control. Although we attempt to reduce the risk of disruption to our business operations should a disaster occur through redundant computer systems and networks and backup systems from an alternative location in Phoenix, this alternative location is subject to some of the same interruptions as may affect our Phoenix headquarters. In the event of a significant system failure, our business could experience significant disruption, which could impact our results of operations.
Efforts by labor unions could divert management attention and have a material adverse effect on our operating results.
Although our only collective bargaining agreement exists at our Mexican subsidiary, Trans-Mex, we always face the risk that our employees could attempt to organize a union. To the extent our owner-operators were re-classified as employees, the magnitude of this risk would increase. Congress or one or more states could approve legislation significantly affecting our businesses and our relationship with our employees, such as the proposed federal legislation referred to as the Employee Free Choice Act, which would substantially liberalize the procedures for union organization. Any attempt to organize by our employees could result in increased legal and other associated costs. In addition, if we entered into a collective bargaining agreement, the terms could negatively affect our costs, efficiency, and ability to generate acceptable returns on the affected operations.
We may not be able to execute or integrate future acquisitions successfully, which could cause our business and future prospects to suffer.
Historically, a key component of our growth strategy has been to pursue acquisitions of complementary businesses. Although we currently do not have any acquisition plans, we expect to consider acquisitions from time to time in the future. If we succeed in consummating future acquisitions, our business, financial condition, and results of operations, or your investment in our Class A common stock, may be negatively affected because:
| • | some of the acquired businesses may not achieve anticipated revenue, earnings, or cash flows; | |
| • | we may assume liabilities that were not disclosed to us or otherwise exceed our estimates; | |
| • | we may be unable to integrate acquired businesses successfully and realize anticipated economic, operational, and other benefits in a timely manner, which could result in substantial costs and delays or other operational, technical, or financial problems; | |
| • | acquisitions could disrupt our ongoing business, distract our management, and divert our resources; | |
| • | we may experience difficulties operating in markets in which we have had no or only limited direct experience; | |
| • | there is a potential for loss of customers, employees, and drivers of any acquired company; |
26
Table of Contents
| • | we may incur additional indebtedness; and | |
| • | if we issue additional shares of stock in connection with any acquisitions, your ownership would be diluted. |
Seasonality and the impact of weather and other catastrophic events affect our operations and profitability.
Our tractor productivity decreases during the winter season because inclement weather impedes operations and some shippers reduce their shipments after the winter holiday season. At the same time, operating expenses increase and fuel efficiency declines because of engine idling and harsh weather creating higher accident frequency, increased claims, and higher equipment repair expenditures. We also may suffer from weather-related or other events such as tornadoes, hurricanes, blizzards, ice storms, floods, fires, earthquakes, and explosions. These events may disrupt fuel supplies, increase fuel costs, disrupt freight shipments or routes, affect regional economies, destroy our assets, or adversely affect the business or financial condition of our customers, any of which could harm our results or make our results more volatile.
Our total assets include goodwill and other indefinite-lived intangibles. If we determine that these items have become impaired in the future, net income could be materially and adversely affected.
As of March 31, 2010, we have recorded goodwill of $253.3 million and certain indefinite-lived intangible assets of $181.0 million primarily as a result of the 2007 Transactions. Goodwill represents the excess of cost over the fair market value of net assets acquired in business combinations. In accordance with Financial Accounting Standards Board Accounting Standards Codification, Topic 350,“Intangibles — Goodwill and Other,”or Topic 350, we test goodwill and indefinite-lived intangible assets for potential impairment annually and between annual tests if an event occurs or circumstances change that would more likely than not reduce the fair value of a reporting unit below its carrying amount. Any excess in carrying value over the estimated fair value is charged to our results of operations. Our evaluation in 2009 produced no indication of impairment of our goodwill or indefinite-lived intangible assets. Based on the results of our evaluation in 2008, we recorded a non-cash impairment charge of $17.0 million related to the decline in fair value of our Mexico freight transportation reporting unit resulting from the deterioration in truckload industry conditions as compared with the estimates and assumptions used in our original valuation projections used at the time of the partial acquisition of Swift Transportation in 2007. Based on the results of our evaluation in the fourth quarter of 2007, we recorded a non-cash impairment charge of $238.0 million related to the decline in fair value of our U.S. freight transportation reporting unit resulting from the deterioration in truckload industry conditions as compared with the estimates and assumptions used in our original valuation projections used at the time of the partial acquisition of Swift Transportation. We may never realize the full value of our intangible assets. Any future determination requiring the write-off of a significant portion of intangible assets would have an adverse effect on our financial condition and results of operations.
As a public company, we will be required to meet periodic reporting requirements under the Securities and Exchange Commission, or the SEC, rules and regulations. Complying with federal securities laws as a public company is expensive, and we will incur significant time and expense enhancing, documenting, testing, and certifying our internal control over financial reporting. Any deficiencies in our financial reporting or internal controls could adversely affect our business and the trading price of our Class A common stock.
As a publicly traded company following completion of this offering, we will be required to file periodic reports containing our financial statements with the SEC within a specified time following the completion of quarterly and annual periods. Since our going-private transaction in 2007, we have not been required to comply with SEC requirements for large accelerated filers to have our financial statements completed and reviewed or audited within a shortened specified time, although we have been preparing such documents as part of our disclosure obligations to purchasers of our senior secured notes. We may experience difficulty in meeting the SEC’s reporting requirements. Any failure by us to file our periodic reports with the SEC in a timely manner could harm our reputation and reduce the trading price of our Class A common stock.
27
Table of Contents
As a public company, we will incur significant legal, accounting, insurance, and other expenses. Compliance with other rules of the SEC and the rules of the stock exchange on which the Class A common stock is listed will increase our legal and financial compliance costs and make some activities more time-consuming and costly. Furthermore, once we become a public company, SEC rules require that our Chief Executive Officer and Chief Financial Officer periodically certify the existence and effectiveness of our internal controls over financial reporting. Our independent registered public accounting firm will be required, beginning with our Annual Report onForm 10-K for our fiscal year ending on December 31, 2011, to attest to our assessment of our internal controls over financial reporting. This process will require significant documentation of policies, procedures, and systems, review of that documentation by our internal accounting staff and our outside auditors, and testing of our internal controls over financial reporting by our internal accounting staff and our outside independent registered public accounting firm. This process will involve considerable time and expense, may strain our internal resources, and have an adverse impact on our operating costs. We may experience higher than anticipated operating expenses and outside auditor fees during the implementation of these changes and thereafter.
During the course of our testing, we may identify deficiencies that would have to be remediated to satisfy the SEC rules for certification of our internal controls over financial reporting. As a consequence, we may have to disclose in periodic reports we file with the SEC material weaknesses in our system of internal controls. The existence of a material weakness would preclude management from concluding that our internal controls over financial reporting are effective and would preclude our independent auditors from issuing an unqualified opinion that our internal controls over financial reporting are effective. In addition, disclosures of this type in our SEC reports could cause investors to lose confidence in our financial reporting and may negatively affect the trading price of our Class A common stock. Moreover, effective internal controls are necessary to produce reliable financial reports and to prevent fraud. If we have deficiencies in our disclosure controls and procedures or internal controls over financial reporting, it may negatively impact our business, results of operations, and reputation.
We are subject to certain non-competition and non-solicitation restrictions in our non-asset based logistics business that could impair our growth opportunities in that operation.
In December 2009, we disposed of our note receivable and ownership interest in Transplace, Inc., or Transplace, a third-party logistics provider, for approximately $4 million. As part of the sale, we agreed not to solicit approximately thirty then-existing Transplace customers for certain single-source third-party logistics services or solicit business from any parties where a majority of the revenue expected from the business is from transportation management personnel and systems transaction fees, subject to certain exceptions. The term of thenon-competition clause runs until December 2011 or, with respect to Transplace’s then-existing customers, until the earlier of December 2011 or until Transplace’s contract with the customer expires. Further, we agreed not to purchase or license transportation management software for the purpose of competing with Transplace until December 2011, subject to certain exceptions. There also were mutual non-solicitation protections given with respect to Transplace and our employees as part of the transaction. The terms of these non-competition and non-solicitation restrictions vary, with the longest extending until December 2011. These restrictions could limit the growth opportunities of our non-asset based logistics operations.
Risks Related to this Offering
Our Class A common stock has no prior public market and could trade at prices below the initial public offering price.
There has not been a public trading market for shares of our Class A common stock prior to this offering. An active trading market may not develop or be sustained after this offering. The initial public offering price for our Class A common stock sold in this offering will be determined by negotiations among us and representatives of the underwriters. This price may not be indicative of the price at which our Class A common stock will trade after this offering, and our Class A common stock could trade below the initial public offering price.
28
Table of Contents
Our stock price may be volatile, and you may be unable to sell your shares at or above the initial public offering price.
The market price of our Class A common stock could be subject to wide fluctuations in response to, among other things, the factors described in this “Risk Factors” section or otherwise, and other factors beyond our control, such as fluctuations in the valuations of companies perceived by investors to be comparable to us.
Furthermore, the stock markets have experienced price and volume fluctuations that have affected and continue to affect the market prices of equity securities of many companies. These fluctuations often have been unrelated or disproportionate to the operating performance of those companies. These broad market fluctuations, as well as general economic, systemic, political, and market conditions, such as recessions, interest rate changes, or international currency fluctuations, may negatively affect the market price of our Class A common stock.
In the past, many companies that have experienced volatility in the market price of their stock have become subject to securities class action litigation. We may be the target of this type of litigation in the future. Securities litigation against us could result in substantial costs and divert our management’s attention from other business concerns, which could harm our business.
In addition, we expect that the trading price for our Class A common stock will be affected by research or reports that industry or financial analysts publish about us or our business.
Our stock price could decline due to the large number of outstanding shares of our common stock eligible for future sale.
Sales of substantial amounts of our common stock in the public market following this offering, or the perception that these sales could occur, could cause the market price of our Class A common stock to decline. These sales also could make it more difficult for us to sell equity or equity related securities in the future at a time and price that we deem appropriate.
Upon completion of this offering, we will have outstanding shares of Class A common stock, assuming no exercise of the underwriters’ over-allotment option and no exercise of options outstanding as of the date of this prospectus and 75,145,892 outstanding shares of Class B common stock, which are convertible into an equal number of Class A common stock. Of the outstanding shares, all of the shares sold in this offering, plus any additional shares sold upon exercise of the underwriters’ over-allotment option, will be freely tradable, except that any shares purchased by “affiliates” (as that term is defined in Rule 144 under the Securities Act), only may be sold in compliance with the limitations described in the section entitled “Shares Eligible For Future Sale — Rule 144.” Taking into consideration the effect of thelock-up agreements described below and the provisions of Rule 144 and Rule 701 under the Securities Act, the remaining shares of our common stock will be available for sale in the public market as follows:
| • | shares will be eligible for sale on the date of this prospectus; and | |
| • | shares will be eligible for sale upon the expiration of thelock-up agreements described below. |
We, our directors, executive officers, and the Moyes Affiliates have entered into lock-up agreements in connection with this offering. Thelock-up agreements expire 180 days after the date of this prospectus, subject to extension upon the occurrence of specified events. Morgan Stanley & Co. Incorporated, Merrill Lynch, Pierce, Fenner & Smith Incorporated and Wells Fargo Securities, LLC may in their sole discretion and at any time without notice, release all or any portion of the securities subject tolock-up agreements.
All of our outstanding common stock is currently held by Mr. Moyes and the Moyes Affiliates on an aggregate basis. If such holders cause a large number of securities to be sold in the public market, the sales could reduce the trading price of our Class A common stock. These sales also could impede our ability to raise future capital. Upon completion of this offering, Mr. Moyes and the Moyes Affiliates will be entitled to rights with respect to the registration of such shares under the Securities Act. See the information under the
29
Table of Contents
heading “Shares Eligible For Future Sale” for a more detailed description of the shares that will be available for future sales upon completion of this offering.
In addition, upon the closing of this offering, we will have an aggregate of up to 10,000,000 shares of Class A common stock reserved for future issuances under our equity incentive plan. Immediately following this offering, we intend to file a registration statement registering under the Securities Act with respect to the shares of Class A common stock reserved for issuance in respect of incentive awards to our officers and certain of our employees. Issuances of Class A common stock to our directors, executive officers, and employees pursuant to the exercise of stock options under our employee benefits arrangements will dilute your interest in us.
Because our estimated initial public offering price is substantially higher than the adjusted net tangible book value per share of our outstanding common stock following this offering, new investors will incur immediate and substantial dilution.
The assumed initial public offering price of $ , which is the midpoint of the price range set forth on the cover page of this prospectus, is substantially higher than the adjusted net tangible book value per share of our common stock based on the total value of our tangible assets less our total liabilities divided by our shares of common stock outstanding immediately following this offering. Therefore, if you purchase Class A common stock in this offering, you will experience immediate and substantial dilution of approximately $ per share, the difference between the price you pay for our Class A common stock and its adjusted net tangible book value after completion of the offering. To the extent outstanding options and warrants to purchase our capital stock are exercised, there will be further dilution.
We currently do not intend to pay dividends on our Class A common stock or Class B common stock.
We currently do not anticipate paying cash dividends on our Class A common stock or Class B common stock. We anticipate that we will retain all of our future earnings, if any, for use in the development and expansion of our business and for general corporate purposes. Any determination to pay dividends and other distributions in cash, stock, or property by Swift in the future will be at the discretion of our board of directors and will be dependent on then-existing conditions, including our financial condition and results of operations, contractual restrictions, including restrictive covenants contained in a new post-offering senior secured credit facility and the indentures governing our outstanding senior secured notes, capital requirements, and other factors.
Risks Related to Our Capital Structure
We have significant ongoing capital requirements that could harm our financial condition, results of operations, and cash flows if we are unable to generate sufficient cash from operations, or obtain financing on favorable terms.
The truckload industry is capital intensive. Historically, we have depended on cash from operations, borrowings from banks and finance companies, issuance of notes, and leases to expand the size of our terminal network and revenue equipment fleet and to upgrade our revenue equipment. We expect that capital expenditures to replace and upgrade our revenue equipment will increase from their low levels in 2009 to maintain or lower our current average company tractor age, to upgrade our trailer fleet that has increased in age over our historical average age, and as justified by increased freight volumes, to expand our company tractor fleet, tractors we lease to owner-operators, and our intermodal containers. See “Management’s Discussion and Analysis of Financial Condition and Results of Operations — Liquidity and Capital Resources.”
There continues to be concern over the stability of the credit markets. If the credit markets weaken, our business, financial results, and results of operations could be materially and adversely affected, especially if consumer confidence declines and domestic spending decreases. If the credit markets erode, we may not be able to access our current sources of credit and our lenders may not have the capital to fund those sources. We may need to incur additional indebtedness or issue debt or equity securities in the future to refinance existing
30
Table of Contents
debt, fund working capital requirements, make investments, or for general corporate purposes. As a result of contractions in the credit market, as well as other economic trends in the credit market, we may not be able to secure financing for future activities on satisfactory terms, or at all.
If we are unable to generate sufficient cash from operations, obtain sufficient financing on favorable terms in the future, or maintain compliance with financial and other covenants in our financing agreements in the future, we may face liquidity constraints or be forced to enter into less favorable financing arrangements or operate our revenue equipment for longer periods of time, any of which could reduce our profitability. Additionally, such events could impact our ability to provide services to our customers and may materially and adversely affect our business, financial results, current operations, results of operations, and potential investments.
Our substantial leverage could adversely affect our ability to raise additional capital to fund our operations, limit our ability to react to changes in the economy or our industry, and prevent us from meeting our obligations under our new senior secured credit facility and our senior secured notes.
As of March 31, 2010, on a pro forma basis after giving effect to the offering and use of proceeds, our total indebtedness outstanding would have been approximately $ and our total stockholders’ equity would have been $ . Our high degree of leverage could have important consequences, including:
| • | increasing our vulnerability to adverse economic, industry, or competitive developments; | |
| • | requiring a substantial portion of cash flow from operations to be dedicated to the payment of principal and interest on our indebtedness, therefore reducing our ability to use our cash flow to fund our operations, capital expenditures, and future business opportunities; | |
| • | exposing us to the risk of increased interest rates because certain of our borrowings, including borrowings under our new senior secured credit facility, are at variable rates of interest; | |
| • | making it more difficult for us to satisfy our obligations with respect to our indebtedness, and any failure to comply with the obligations of any of our debt instruments, including restrictive covenants and borrowing conditions, could result in an event of default under the agreements governing such indebtedness, including our new senior secured credit facility and the indentures governing our senior secured notes; | |
| • | restricting us from making strategic acquisitions or causing us to make non-strategic divestitures; | |
| • | limiting our ability to obtain additional financing for working capital, capital expenditures, product development, debt service requirements, acquisitions, and general corporate or other purposes; and | |
| • | limiting our flexibility in planning for, or reacting to, changes in our business, market conditions, or in the economy, and placing us at a competitive disadvantage compared with our competitors who are less highly leveraged and who, therefore, may be able to take advantage of opportunities that our leverage prevents us from exploiting. |
Our Chief Executive Officer and the Moyes Affiliates control a large portion of our stock and have substantial control over us, which could limit other stockholders’ ability to influence the outcome of key transactions, including changes of control.
Following this offering, our Chief Executive Officer, Mr. Moyes, and the Moyes Affiliates will beneficially own approximately %of our outstanding common stock including 100% of our Class B common stock. On all matters with respect to which our stockholders have a right to vote, including the election of directors, the holders of our Class A common stock are entitled to one vote per share, and the holders of our Class B common stock are entitled to two votes per share. All outstanding shares of Class B common stock are owned by Mr. Moyes and the Moyes Affiliates and are convertible to Class A common stock on aone-for-one basis at the election of the holders thereof or automatically upon transfer to someone other than a Permitted Holder, as defined in the section entitled “Certain Relationships and Related Party Transactions.” Giving effect to the completion of this offering, this voting structure will give Mr. Moyes and
31
Table of Contents
the Moyes Affiliates approximately %of the voting power of all of our outstanding stock. Furthermore, due to our dual class structure, Mr. Moyes and the Moyes Affiliates will continue to be able to control all matters submitted to our stockholders for approval even if they come to own less than 50% of the total outstanding shares of our common stock. This significant concentration of share ownership may adversely affect the trading price for our Class A common stock because investors may perceive disadvantages in owning stock in companies with controlling stockholders. Also, these stockholders will be able to exert significant influence over our management and affairs and matters requiring stockholder approval, including the election of directors and the approval of significant corporate transactions, such as mergers, consolidations, or the sale of substantially all of our assets. Consequently, this concentration of ownership may have the effect of delaying or preventing a change of control, including a merger, consolidation, or other business combination involving us, or discouraging a potential acquirer from making a tender offer or otherwise attempting to obtain control, even if that change of control would benefit our other stockholders.
Because Mr. Moyes and the Moyes Affiliates will control a majority of the voting power of our common stock, we qualify as a “controlled company” as defined by the exchange on which we intend to list the shares of Class A common stock, and, as such, we may elect not to comply with certain corporate governance requirements of such stock exchange. Following the completion of this offering, we do not intend to utilize these exemptions, but may choose to do so in the future.
The concentration of ownership of our capital stock with insiders upon the completion of this offering will limit your ability to influence corporate matters.
In addition to the significant ownership by Mr. Moyes and the Moyes Affiliates, we anticipate that our executive officers and directors together will beneficially own approximately %of our Class A common stock outstanding after this offering. This significant concentration of share ownership may adversely affect the trading price for our Class A common stock because investors may perceive disadvantages in owning stock in companies with controlling stockholders. Also, these stockholders, acting together, will be able to exert significant influence over our management and affairs and matters requiring stockholder approval, including the election of directors and the approval of significant corporate transactions, such as mergers, consolidations, or the sale of substantially all of our assets. Consequently, this concentration of ownership may have the effect of delaying or preventing a change of control, including a merger, consolidation, or other business combination involving us, or discouraging a potential acquirer from making a tender offer or otherwise attempting to obtain control, even if that change of control would benefit our other stockholders.
Our debt agreements contain restrictions that limit our flexibility in operating our business.
Our new senior secured credit facility and the indentures governing our outstanding senior secured notes contain various covenants that limit our ability to engage in specified types of transactions, which limit our and our subsidiaries’ ability to, among other things:
| • | incur additional indebtedness or issue certain preferred shares; | |
| • | pay dividends on, repurchase, or make distributions in respect of our capital stock or make other restricted payments; | |
| • | make certain investments; | |
| • | sell certain assets; | |
| • | create liens; | |
| • | enter into sale and leaseback transactions; | |
| • | make capital expenditures; | |
| • | prepay or defease specified debt; | |
| • | consolidate, merge, sell, or otherwise dispose of all or substantially all of our assets; and |
32
Table of Contents
| • | enter into certain transactions with our affiliates. |
A breach of any of these covenants could result in a default under one or more of these agreements, including as a result of cross default provisions, and, in the case of our $300.0 million revolving line of credit under our existing senior secured credit facility and our 2008 RSA, permit the lenders to cease making loans to us. Upon the occurrence of an event of default under our new senior secured credit facility, the lenders could elect to declare all amounts outstanding thereunder to be immediately due and payable and terminate all commitments to extend further credit. Such actions by those lenders could cause cross defaults under our other indebtedness. If we were unable to repay those amounts, the lenders under our new senior secured credit facility could proceed against the collateral granted to them to secure that indebtedness. If the lenders under our new senior secured credit facility were to accelerate the repayment of borrowings, we might not have sufficient assets to repay all amounts borrowed thereunder as well as our senior secured notes. In addition, our 2008 RSA includes certain restrictive covenants and cross default provisions with respect to our new senior secured credit facility and indentures governing our senior secured notes. Failure to comply with these covenants and provisions may jeopardize our ability to continue to sell receivables under the facility and could negatively impact our liquidity.
33
Table of Contents
Special Note Regarding Forward-Looking Statements
This prospectus contains “forward-looking statements” within the meaning of the federal securities laws that involve risks and uncertainties. Forward-looking statements include statements we make concerning our plans, objectives, goals, strategies, future events, future revenues or performance, capital expenditures, financing needs, and other information that is not historical information and, in particular, appear under the headings entitled “Prospectus Summary,” “Risk Factors,” “Management’s Discussion and Analysis of Financial Condition and Results of Operations,” “Business,” and “Executive Compensation — Compensation Discussion and Analysis.” When used in this prospectus, the words “estimates,” “expects,” “anticipates,” “projects,” “forecasts,” “plans,” “intends,” “believes,” “foresees,” “seeks,” “likely,” “may,” “will,” “should,” “goal,” “target,” and variations of these words or similar expressions (or the negative versions of any such words) are intended to identify forward-looking statements. In addition, we, through our senior management, from time to time make forward-looking public statements concerning our expected future operations and performance and other developments. These forward-looking statements are subject to risks and uncertainties that may change at any time, and, therefore, our actual results may differ materially from those that we expected. Accordingly, investors should not place undue reliance on our forward-looking statements. We derive many of our forward-looking statements from our operating budgets and forecasts, which are based upon many detailed assumptions. While we believe that our assumptions are reasonable, we caution that it is very difficult to predict the impact of known factors, and, of course, it is impossible for us to anticipate all factors that could affect our actual results. All forward-looking statements are based upon information available to us on the date of this prospectus. We undertake no obligation to publicly update or revise forward-looking statements to reflect events or circumstances after the date made or to reflect the occurrence of unanticipated events, except as required by law.
Important factors that could cause actual results to differ materially from our expectations (“cautionary statements”) are disclosed under “Risk Factors” and elsewhere in this prospectus. All forward-looking statements in this prospectus and subsequent written and oral forward-looking statements attributable to us, or persons acting on our behalf, are expressly qualified in their entirety by the cautionary statements. The factors that we believe could affect our results include, but are not limited to:
| • | any future recessionary economic cycles and downturns in customers’ business cycles, particularly in market segments and industries in which we have a significant concentration of customers; | |
| • | increasing competition from trucking, rail, intermodal, and brokerage competitors; | |
| • | a significant reduction in, or termination of, our trucking services by a key customer; | |
| • | our ability to sustain cost savings realized as part of our recent cost reduction initiatives; | |
| • | our ability to achieve our strategy of growing our revenue; | |
| • | volatility in the price or availability of fuel; | |
| • | increases in new equipment prices or replacement costs; | |
| • | the regulatory environment in which we operate, including existing regulations and changes in existing regulations, or violations by us of existing or future regulations; | |
| • | the costs of environmental complianceand/or the imposition of liabilities under environmental laws and regulations; | |
| • | difficulties in driver recruitment and retention; | |
| • | increases in driver compensation to the extent not offset by increases in freight rates; | |
| • | potential volatility or decrease in the amount of earnings as a result of our claims exposure through our wholly-owned captive insurance companies; | |
| • | uncertainties associated with our operations in Mexico; | |
| • | our ability to attract and maintain relationships with owner-operators; | |
| • | our ability to retain or replace key personnel; | |
| • | conflicts of interest or potential litigation that may arise from other businesses owned by Mr. Moyes; | |
| • | potential failure in computer or communications systems; |
34
Table of Contents
| • | our labor relations; | |
| • | our ability to execute or integrate any future acquisitions successfully; | |
| • | seasonal factors such as harsh weather conditions that increase operating costs; and | |
| • | our ability to service our outstanding indebtedness, including compliance with our indebtedness covenants, and the impact such indebtedness may have on the way we operate our business. |
35
Table of Contents
Reorganization
On May 20, 2010, in contemplation of our initial public offering, Swift Corporation formed Swift Holdings Corp., a Delaware corporation. Swift Holdings Corp. has not engaged in any business or other activities except in connection with its formation and this offering and holds no assets and has no subsidiaries.
Prior to the consummation of this offering, the stockholder loan agreement entered into on May 10, 2007, as subsequently amended, between us and Mr. Moyes and the Moyes Affiliates, all of which are stockholders of Swift Corporation, will be cancelled or retired. As of March 31, 2010, the balance of such stockholder loan was $240.0 million. See “Management’s Discussion and Analysis of Financial Condition and Results of Operations — Overview — Stockholder Loan” for further details of the stockholder loan. Subsequent to the cancellation or retirement of the stockholder loan and immediately prior to the consummation of this offering, Swift Corporation will merge with and into Swift Holdings Corp., the registrant, with Swift Holdings Corp. surviving as a Delaware corporation. In the merger, all of the outstanding common stock of Swift Corporation will be converted into shares of Swift Holdings Corp. Class B common stock on aone-for-one basis and all outstanding options to purchase common stock of Swift Corporation will be converted into options to purchase Class A common stock of Swift Holdings Corp. See “Description of Capital Stock.”
36
Table of Contents
Use of Proceeds
We estimate that the net proceeds from our sale of shares of Class A common stock in this offering at an assumed initial public offering price of $ per share, which is the midpoint of the price range set forth on the cover page of this prospectus, after deducting estimated underwriting discounts and commissions and estimated offering expenses payable by us, will be approximately $ million, or $ million if the underwriters’ option to purchase additional shares is exercised in full. A $1.00 increase or decrease in the assumed initial public offering price of $ per share would increase or decrease, as applicable, the net proceeds to us from this offering by approximately $ million, assuming the number of shares offered by us remains the same as set forth on the cover page of this prospectus and after deducting the estimated underwriting discounts and commissions and estimated offering expenses that we must pay.
We intend to use approximately $ million of the net proceeds from this offering to repay a portion of our existing senior secured credit facility. The balance of the existing senior secured credit facility will be refinanced by borrowings under our new senior secured credit facility, which we will enter into in connection with this offering. See “Prospectus Summary — Concurrent Transactions.” The remaining net proceeds will be used for general corporate purposes.
Our existing senior secured credit facility consists of a first lien term loan with an original aggregate principal amount of $1.72 billion due May 2014, a $300.0 million revolving line of credit due May 2012, and a $150.0 million synthetic letter of credit facility due May 2014. As of March 31, 2010, there was $1.51 billion outstanding under the first lien term loan. In April 2010, we made an $18.7 million payment on the first lien term loan out of excess cash flows for the prior fiscal year, as defined in our existing senior secured credit facility. For periods commencing on March 31, 2010, interest on our existing senior secured credit facility accrues at a rate equal to 8.25% per annum.
37
Table of Contents
Dividend Policy
We anticipate that we will retain all of our future earnings, if any, for use in the development and expansion of our business and for general corporate purposes. Any determination to pay dividends and other distributions in cash, stock, or property by Swift in the future will be at the discretion of our board of directors and will be dependent on then-existing conditions, including our financial condition and results of operations, contractual restrictions, including restrictive covenants contained in a new post-offering senior secured credit facility and the indentures governing our outstanding senior secured notes, capital requirements, and other factors.
During the period we were taxed as a subchapter S corporation, we paid dividends to our stockholders in amounts equal to the actual amount of interest due and payable under the stockholder loan. Distributions to our stockholders totaled $16.4 million, $33.8 million, and $29.7 million in 2009, 2008, and 2007, respectively. See “Certain Relationships and Related Party Transactions.”
38
Table of Contents
Capitalization
The following table sets forth our consolidated cash and cash equivalents and total capitalization as of March 31, 2010 on:
| • | an actual basis, without giving effect to the consummation of the merger and recapitalization as described under “Reorganization”; and | |
| • | an as adjusted basis to reflect: |
| • | the consummation of the merger and recapitalization; | |
| • | the sale by us of shares of Class A common stock in this offering at an assumed initial public offering price of $ per share, which is the midpoint of the price range set forth on the cover page of this prospectus, after deducting estimated underwriting discounts and commissions and estimated offering expenses payable by us; | |
| • | the application of net proceeds from this offering as described under “Use of Proceeds,” as if the offering and the application of net proceeds of this offering had occurred on March 31, 2010; | |
| • | the cancellation of the stockholder loan; and | |
| • | the refinancing of our existing senior secured credit facility. |
The information below is illustrative only and our capitalization following the completion of this offering will be adjusted based on the actual initial public offering price and other terms of this offering determined at pricing. You should read this table together with the section entitled “Management’s Discussion and Analysis of Financial Condition and Results of Operations” and our consolidated financial statements and the related notes appearing elsewhere in this prospectus.
| As of March 31, 2010 | ||||||||
| Actual | As Adjusted(1) | |||||||
| (In thousands, except share and per share data) | ||||||||
| Cash and cash equivalents(2) | $ | 87,327 | $ | |||||
| Total long-term debt and obligations under capital leases: | ||||||||
| Existing senior secured credit facility(3) | $ | 1,507,100 | $ | |||||
| New senior secured credit facility | — | |||||||
| Obligation relating to securitization of accounts receivable | 150,000 | |||||||
| Senior secured floating rate notes | 203,600 | |||||||
| Senior secured fixed rate notes | 505,648 | |||||||
| Other existing long-term debt and obligations under capital leases | 165,833 | |||||||
| Total debt | 2,532,181 | |||||||
| Stockholders’ equity: | ||||||||
| Preferred stock, $0.001 par value; 1,000,000 shares authorized, none issued or outstanding, actual; and shares authorized, no shares issued or outstanding, as adjusted | — | |||||||
| Pre-reorganization common stock, $0.001 par value; 200,000,000 shares authorized, 75,145,892 shares issued and outstanding, actual; and none issued and outstanding, as adjusted | 75 | |||||||
| Class A common stock, $0.001 par value; shares authorized, shares issued and outstanding, as adjusted | — | |||||||
| Class B common stock, $0.001 par value; shares authorized, 75,145,892 shares issued and outstanding, as adjusted | — | |||||||
39
Table of Contents
| As of March 31, 2010 | ||||||||
| Actual | As Adjusted(1) | |||||||
| (In thousands, except share and per share data) | ||||||||
| Additional paid-in capital | 279,136 | |||||||
| Accumulated deficit | (812,937 | ) | ||||||
| Stockholder loans receivable | (241,678 | ) | ||||||
| Accumulated other comprehensive loss | (43,052 | ) | ||||||
| Noncontrolling interest | 102 | |||||||
| Total stockholders’ deficit | (818,354 | ) | ||||||
| Total capitalization | $ | 1,713,827 | $ | |||||
| (1) | Each $1.00 increase or decrease in the assumed initial public offering price of $ per share would increase or decrease, as applicable, the amount of cash and cash equivalents, additional paid-in capital, total stockholders’ deficit, and total capitalization by approximately $ million, assuming the number of shares offered by us remains the same as set forth on the cover page of this prospectus and after deducting the estimated underwriting discounts and commissions and estimated offering expenses that we must pay. | |
| (2) | Excludes restricted cash of $48.9 million. | |
| (3) | Our existing senior secured credit facility also includes a $300.0 million revolving line of credit due May 2012 and a $150.0 million synthetic letter of credit facility due May 2014. As of March 31, 2010, we had outstanding letters of credit under the revolving line of credit primarily for workers’ compensation and self-insurance liability purposes totaling $64.4 million, and $235.6 million available for borrowings under the revolving line of credit. As of March 31, 2010, the synthetic letter of credit facility was fully utilized. |
40
Table of Contents
Dilution
As of March 31, 2010, we had negative net tangible book value of approximately $1.46 billion, or $19.37 per share of our common stock. Our net tangible book value per share represents our tangible assets less our liabilities, divided by our shares of common stock outstanding as of March 31, 2010.
After giving effect to our sale of shares of Class A common stock in this offering at the assumed initial public offering price of $ per share, which is the midpoint of the price range set forth on the cover page of this prospectus, and after deducting estimated underwriting discounts and commissions and estimated offering expenses payable by us, our as adjusted net tangible book value as of March 31, 2010 would have been $ , or $ per share. This represents an immediate increase in net tangible book value of $ per share to existing stockholders and an immediate dilution of $ per share to new investors.
The following table illustrates this dilution:
| Assumed initial public offering price per share | $ | |||||||
| Net tangible book value per share as of March 31, 2010 | $ | (19.37 | ) | |||||
| Increase per share attributable to this offering | ||||||||
| As adjusted net tangible book value per share after this offering | ||||||||
| Net tangible book value dilution per share to new investors in this offering | $ | |||||||
If all our outstanding options had been exercised, the negative net tangible book value as of March 31, 2010 would have been approximately $1.37 billion or $16.47 per share, and the as adjusted net tangible book value after this offering would have been $ million, or $ per share, causing dilution to new investors of $ per share.
A $1.00 increase or decrease in the assumed initial public offering price of $ per share, which is the midpoint of the price range set forth on the cover page of this prospectus, would increase or decrease, as applicable, our as adjusted net tangible book value per share by approximately $ , assuming the number of shares offered by us remains the same as set forth on the cover page of this prospectus and after deducting the estimated underwriting discounts and commissions and estimated offering expenses that we must pay.
If the underwriters’ over-allotment option to purchase additional shares from us is exercised in full, our as adjusted net tangible book value per share after this offering would be $ per share, the increase in pro forma as adjusted net tangible book value per share to existing stockholders would be $ per share, and the dilution to new investors purchasing shares in this offering would be $ per share.
The following table summarizes, on an as adjusted basis as of March 31, 2010, the total number of shares of common stock purchased from us, the total consideration paid to us, and the average price per share of Class B common stock paid to us by existing stockholders and by new investors purchasing shares of Class A common stock in this offering at the assumed initial public offering price of $ , the midpoint of the price range set forth on the cover page of this prospectus, before deducting estimated underwriting discounts and commissions and estimated offering expenses payable by us:
| Average | ||||||||||||||||||||
| Shares Purchased | Total Consideration | Price Per | ||||||||||||||||||
| Number | Percent | Amount | Percent | Share | ||||||||||||||||
| Existing stockholders | % | $ | % | $ | ||||||||||||||||
| New investors | ||||||||||||||||||||
| Total | 100 | % | $ | 100 | % | |||||||||||||||
A $1.00 increase or decrease in the assumed initial public offering price of $ per share, which is the midpoint of the price range set forth on the cover page of this prospectus, would increase or decrease, as applicable, total consideration paid to us by new investors and total consideration paid to us by all stockholders
41
Table of Contents
by approximately $ million, assuming the number of shares offered by us remains the same as set forth on the cover page of this prospectus and without deducting the estimated underwriting discounts and commissions and estimated offering expenses that we must pay.
If the underwriters’ over-allotment option to purchase additional shares from us is exercised in full, our existing stockholders would own % and our new investors would own % of the total number of shares of our common stock outstanding after this offering.
42
Table of Contents
Selected Historical Consolidated Financial and Other Data
The table below sets forth our selected consolidated financial and other data for the periods and as of the dates indicated. The selected historical consolidated financial and other data for the years ended December 31, 2009, 2008, and 2007 and the period from January 1, 2007 through May 10, 2007 are derived from our audited consolidated financial statements and those of our predecessor, which financial statements have been audited by KPMG LLP, an independent registered public accounting firm, included elsewhere in this prospectus and include, in the opinion of management, all adjustments that management considers necessary for the presentation of the information outlined in these financial statements. In addition, for comparative purposes, we have included a pro forma (provision) benefit for income taxes assuming we had been taxed as a subchapter C corporation in all periods when our subchapter S corporation election was in effect. The selected historical consolidated financial and other data for the years ended December 31, 2006 and 2005 are derived from the historical financial statements of our predecessor not included in this prospectus.
The selected consolidated financial and other data for the three months ended March 31, 2010 and 2009 are derived from our unaudited condensed consolidated interim financial statements included elsewhere in this prospectus. The results for any interim period are not necessarily indicative of the results that may be expected for a full year. Additionally, our historical results are not necessarily indicative of the results expected for any future period.
Swift Corporation acquired our predecessor on May 10, 2007 in conjunction with the 2007 Transactions. Thus, although our results for the year ended December 31, 2007 present results for a full year period, they only include the results of our predecessor after May 10, 2007. You should read the selected historical consolidated financial and other data together with the consolidated financial statements and related notes appearing elsewhere in this prospectus, as well as “Prospectus Summary — Summary Historical Consolidated Financial and Other Data,” “Capitalization,” and “Management’s Discussion and Analysis of Financial Condition and Results of Operations.”
| Successor | Predecessor | |||||||||||||||||||||||||||||||
| January 1, | ||||||||||||||||||||||||||||||||
| 2007 | ||||||||||||||||||||||||||||||||
| Three Months Ended | Year Ended | Year Ended | Through | Year Ended | ||||||||||||||||||||||||||||
| (Dollars in thousands, | March 31, | December 31, | December 31, | May 10, | December 31, | |||||||||||||||||||||||||||
| except per share data) | 2010 | 2009 | 2009 | 2008 | 2007(1) | 2007 | 2006 | 2005 | ||||||||||||||||||||||||
| (Unaudited) | ||||||||||||||||||||||||||||||||
Consolidated statement of operations data: | ||||||||||||||||||||||||||||||||
| Operating revenue: | ||||||||||||||||||||||||||||||||
| Trucking revenue | $ | 503,507 | $ | 509,320 | $ | 2,062,296 | $ | 2,443,271 | $ | 1,674,835 | $ | 876,042 | $ | 2,585,590 | $ | 2,722,648 | ||||||||||||||||
| Fuel surcharge revenue | 88,816 | 52,986 | 275,373 | 719,617 | 344,946 | 147,507 | 462,529 | 391,942 | ||||||||||||||||||||||||
| Other revenue | 62,507 | 52,450 | 233,684 | 236,922 | 160,512 | 51,174 | 124,671 | 82,865 | ||||||||||||||||||||||||
| Total operating revenue | 654,830 | 614,756 | 2,571,353 | 3,399,810 | 2,180,293 | 1,074,723 | 3,172,790 | 3,197,455 | ||||||||||||||||||||||||
43
Table of Contents
| Successor | Predecessor | |||||||||||||||||||||||||||||||
| January 1, | ||||||||||||||||||||||||||||||||
| 2007 | ||||||||||||||||||||||||||||||||
| Three Months Ended | Year Ended | Year Ended | Through | Year Ended | ||||||||||||||||||||||||||||
| (Dollars in thousands, | March 31, | December 31, | December 31, | May 10, | December 31, | |||||||||||||||||||||||||||
| except per share data) | 2010 | 2009 | 2009 | 2008 | 2007(1) | 2007 | 2006 | 2005 | ||||||||||||||||||||||||
| (Unaudited) | ||||||||||||||||||||||||||||||||
| Operating expenses: | ||||||||||||||||||||||||||||||||
| Salaries, wages, and employee benefits | 177,803 | 189,377 | 728,784 | 892,691 | 611,811 | 364,690 | 899,286 | 1,008,833 | ||||||||||||||||||||||||
| Operating supplies and expenses | 47,830 | 56,723 | 209,945 | 271,951 | 187,873 | 119,833 | 268,658 | 286,261 | ||||||||||||||||||||||||
| Fuel expense | 106,082 | 85,868 | 385,513 | 768,693 | 474,825 | 223,579 | 632,824 | 610,919 | ||||||||||||||||||||||||
| Purchased transportation | 175,702 | 135,753 | 620,312 | 741,240 | 435,421 | 196,258 | 586,252 | 583,380 | ||||||||||||||||||||||||
| Rental expense | 18,903 | 20,391 | 79,833 | 76,900 | 51,703 | 20,089 | 50,937 | 57,669 | ||||||||||||||||||||||||
| Insurance and claims | 20,207 | 25,481 | 81,332 | 141,949 | 69,699 | 58,358 | 153,728 | 156,525 | ||||||||||||||||||||||||
| Depreciation and amortization(2) | 65,497 | 66,956 | 253,531 | 275,832 | 187,043 | 82,949 | 222,376 | 199,777 | ||||||||||||||||||||||||
| Impairments(3) | 1,274 | 515 | 515 | 24,529 | 256,305 | — | 27,595 | 6,377 | ||||||||||||||||||||||||
| (Gain) loss on disposal of property and equipment | (1,448 | ) | (19 | ) | (2,244 | ) | (6,466 | ) | (397 | ) | 130 | (186 | ) | (942 | ) | |||||||||||||||||
| Communication and utilities | 6,422 | 7,091 | 24,595 | 29,644 | 18,625 | 10,473 | 28,579 | 30,920 | ||||||||||||||||||||||||
| Operating taxes and licenses | 13,365 | 14,381 | 57,236 | 67,911 | 42,076 | 24,021 | 59,010 | 69,676 | ||||||||||||||||||||||||
| Total operating expenses | 631,637 | 602,517 | 2,439,352 | 3,284,874 | 2,334,984 | 1,100,380 | 2,929,059 | 3,009,395 | ||||||||||||||||||||||||
| Operating income (loss) | 23,193 | 12,239 | 132,001 | 114,936 | (154,691 | ) | (25,657 | ) | 243,731 | 188,060 | ||||||||||||||||||||||
| Other (income) expenses: | ||||||||||||||||||||||||||||||||
| Interest expense(4) | 62,596 | 47,702 | 200,512 | 222,177 | 171,115 | 9,454 | 26,870 | 29,946 | ||||||||||||||||||||||||
| Derivative interest expense (income)(5) | 23,714 | 7,549 | 55,634 | 18,699 | 13,233 | (177 | ) | (1,134 | ) | (3,314 | ) | |||||||||||||||||||||
| Interest income | (220 | ) | (428 | ) | (1,814 | ) | (3,506 | ) | (6,602 | ) | (1,364 | ) | (2,007 | ) | (1,713 | ) | ||||||||||||||||
| Other(4) | (371 | ) | 675 | (13,336 | ) | 12,753 | (1,933 | ) | �� | 1,429 | (1,272 | ) | (1,209 | ) | ||||||||||||||||||
| Total other (income) expenses | 85,719 | 55,498 | 240,996 | 250,123 | 175,813 | 9,342 | 22,457 | 23,710 | ||||||||||||||||||||||||
| Income (loss) before income taxes | (62,526 | ) | (43,259 | ) | (108,995 | ) | (135,187 | ) | (330,504 | ) | (34,999 | ) | 221,274 | 164,350 | ||||||||||||||||||
| Income tax (benefit) expense | (9,525 | ) | 301 | 326,650 | 11,368 | (234,316 | ) | (4,577 | ) | 80,219 | 63,223 | |||||||||||||||||||||
| Net income (loss) | $ | (53,001 | ) | $ | (43,560 | ) | $ | (435,645 | ) | $ | (146,555 | ) | $ | (96,188 | ) | $ | (30,422 | ) | $ | 141,055 | $ | 101,127 | ||||||||||
| Basic income (loss) per common share | $ | (0.71 | ) | $ | (0.58 | ) | $ | (5.80 | ) | $ | (1.95 | ) | $ | (1.94 | ) | $ | (0.40 | ) | $ | 1.89 | $ | 1.39 | ||||||||||
| Diluted income (loss) per common share | $ | (0.71 | ) | $ | (0.58 | ) | $ | (5.80 | ) | $ | (1.95 | ) | $ | (1.94 | ) | $ | (0.40 | ) | $ | 1.86 | $ | 1.37 | ||||||||||
| Weighted average shares used in computing basic income (loss) per common share (in thousands) | 75,146 | 75,146 | 75,146 | 75,146 | 49,521 | 75,159 | 74,584 | 72,540 | ||||||||||||||||||||||||
| Weighted average shares used in computing diluted income (loss) per common share (in thousands) | 75,146 | 75,146 | 75,146 | 75,146 | 49,521 | 75,159 | 75,841 | 73,823 | ||||||||||||||||||||||||
Pro forma C corporation data (unaudited):(6) | ||||||||||||||||||||||||||||||||
| Historical loss before income taxes | N/A | $ | (43,259 | ) | $ | (108,995 | ) | $ | (135,187 | ) | $ | (330,504 | ) | N/A | N/A | N/A | ||||||||||||||||
| Pro forma provision (benefit) for income taxes | N/A | 2,259 | 5,693 | (26,573 | ) | (19,166 | ) | N/A | N/A | N/A | ||||||||||||||||||||||
44
Table of Contents
| Successor | Predecessor | |||||||||||||||||||||||||||||||
| January 1, | ||||||||||||||||||||||||||||||||
| 2007 | ||||||||||||||||||||||||||||||||
| Three Months Ended | Year Ended | Year Ended | Through | Year Ended | ||||||||||||||||||||||||||||
| (Dollars in thousands, | March 31, | December 31, | December 31, | May 10, | December 31, | |||||||||||||||||||||||||||
| except per share data) | 2010 | 2009 | 2009 | 2008 | 2007(1) | 2007 | 2006 | 2005 | ||||||||||||||||||||||||
| (Unaudited) | ||||||||||||||||||||||||||||||||
| Pro forma net loss | N/A | $ | (45,518 | ) | $ | (114,688 | ) | $ | (108,614 | ) | $ | (311,338 | ) | N/A | N/A | N/A | ||||||||||||||||
| Pro forma loss per share: | ||||||||||||||||||||||||||||||||
| Basic | N/A | $ | (0.61 | ) | $ | (1.53 | ) | $ | (1.45 | ) | $ | (6.29 | ) | N/A | N/A | N/A | ||||||||||||||||
| Diluted | N/A | $ | (0.61 | ) | $ | (1.53 | ) | $ | (1.45 | ) | $ | (6.29 | ) | N/A | N/A | N/A | ||||||||||||||||
Consolidated balance sheet data (at end of period): | ||||||||||||||||||||||||||||||||
| Cash and cash equivalents (excl. restricted cash) | 87,327 | 56,806 | 115,862 | 57,916 | 78,826 | 81,134 | 47,858 | 13,098 | ||||||||||||||||||||||||
| Net property and equipment | 1,327,210 | 1,516,994 | 1,364,545 | 1,583,296 | 1,588,102 | 1,478,808 | 1,513,592 | 1,630,469 | ||||||||||||||||||||||||
| Total assets | 2,638,739 | 2,594,965 | 2,513,874 | 2,648,507 | 2,928,632 | 2,124,293 | 2,110,648 | 2,218,530 | ||||||||||||||||||||||||
| Debt: | ||||||||||||||||||||||||||||||||
| Securitization of accounts receivable(4) | 150,000 | — | — | — | 200,000 | 160,000 | 180,000 | 245,000 | ||||||||||||||||||||||||
| Long-term debt and obligations under capital leases (incl. current)(4) | 2,382,181 | 2,515,335 | 2,466,934 | 2,494,455 | 2,427,253 | 200,000 | 200,000 | 365,786 | ||||||||||||||||||||||||
| Stockholders’ equity (deficit) | (818,354 | ) | (498,831 | ) | (865,781 | ) | (444,193 | ) | (297,547 | ) | 1,007,904 | 1,014,223 | 870,044 | |||||||||||||||||||
Consolidated statement of cash flows data: | ||||||||||||||||||||||||||||||||
| Net cash flows from operating activities | 15,107 | 7,376 | 115,335 | 119,740 | 128,646 | 85,149 | 365,430 | 362,548 | ||||||||||||||||||||||||
| Net cash flows used in investing activities | (35,131 | ) | (6,661 | ) | (1,127 | ) | (118,517 | ) | (1,612,314 | ) | (43,854 | ) | (114,203 | ) | (380,007 | ) | ||||||||||||||||
| Net cash flows from (used in) financing activities, net of the effect of exchange rate changes | (8,511 | ) | (1,825 | ) | (56,262 | ) | (22,133 | ) | 1,562,494 | (8,019 | ) | (216,467 | ) | 2,312 | ||||||||||||||||||
| (1) | Our audited results of operations include the full year presentation of Swift Corporation as of and for the year ended December 31, 2007. Swift Corporation was formed in 2006 for the purpose of acquiring Swift Transportation, but that acquisition was not completed until May 10, 2007 as part of the 2007 Transactions, and, as such, Swift Corporation had nominal activity from January 1, 2007 through May 10, 2007. The results of Swift Transportation from January 1, 2007 to May 10, 2007 and IEL from January 1, 2007 to April 7, 2007 are not reflected in the audited results of Swift Corporation for the year ended December 31, 2007. These financial results include the impact of the 2007 Transactions. | |
| (2) | During the three months ended March 31, 2010, we recorded $7.4 million of incremental depreciation expense related to our revised estimates regarding salvage value and useful lives for approximately 7,000 dry van trailers that we decided to scrap during the quarter. During the three months ended March 31, 2010 and 2009, we incurred non-cash amortization expense of $5.2 million and $5.7 million, respectively, relating to a step up in basis of certain intangible assets recognized in connection with the 2007 Transactions. For the years ended December 31, 2009, 2008, and 2007, we incurred amortization expense of $22.0 million, $24.2 million, and $16.8 million, respectively, relating to a step up in basis of certain intangible assets recognized in connection with the 2007 Transactions. | |
| (3) | During the three months ended March 31, 2010, revenue equipment with a carrying amount of $3.6 million was written down to its fair value of $2.3 million, resulting in an impairment charge of $1.3 million, which was included in impairments in the consolidated statement of operations for the three months ended March 31, 2010. During the three months ended March 31, 2009, non-operating real estate properties held and used with a carrying amount of $2.1 million were written down to their fair value of $1.6 million, resulting in an impairment charge of $0.5 million. For the year ended December 31, 2008, we incurred $24.5 million in pre-tax impairment charges comprised of a $17.0 million impairment of goodwill relating to our Mexico freight transportation reporting unit, and impairment charges totaling $7.5 million on tractors, trailers, and several non-operating real estate properties and other assets. For the year ended December 31, 2007, we recorded a goodwill impairment of $238.0 million pre-tax related to our U.S. freight transportation reporting unit and trailer impairment of $18.3 million pre-tax. The results for the year ended December 31, 2006 included pre-tax charges of $9.2 million related to the impairment of certain trailers, Mexico real property and equipment, and $18.4 million for the write-off of a note receivable and other outstanding amounts related to our sale of our auto haul business in April 2005. For the year ended December 31, 2005, we incurred a pre-tax impairment charge of $6.4 million related to certain trailers. |
45
Table of Contents
| (4) | Effective January 1, 2010, we adopted ASUNo. 2009-16 under which we were required to account for our 2008 RSA as a secured borrowing on our balance sheet as opposed to a sale, with our 2008 RSA program fees characterized as interest expense. From March 27, 2008 through December 31, 2009, our 2008 RSA has been accounted for as a true sale in accordance with GAAP. Therefore, as of December 31, 2009 and 2008, such accounts receivable and associated obligation are not reflected in our consolidated balance sheets. For periods prior to March 27, 2008, and again beginning January 1, 2010, accounts receivable and associated obligation are recorded on our balance sheet. Long-term debt excludes securitization amounts outstanding for each period. For the three months ended March 31, 2010, total program fees recorded as interest expense were $1.1 million. | |
| Prior to the change in GAAP, program fees were recorded under “Other income and expenses” under “Other.” For the three months ended March 31, 2009, total program fees included in “Other” were $1.1 million. For the years ended December 31, 2009 and 2008, program fees from our 2008 RSA totaling $5.0 million and $7.3 million, respectively, were recorded in “Other.” | ||
| (5) | Derivative interest expense for the three months ended March 31, 2010 and 2009 is related to our interest rate swaps with notional amounts of $1.14 billion and $1.20 billion, respectively. Derivative interest expense increased during the three months ended March 31, 2010 over the same period in 2009 as a result of the decrease in three month LIBOR, the underlying index for the swaps. Additionally, we de-designated the remaining swaps and discontinued hedge accounting effective October 1, 2009 as a result of the second amendment to our existing senior secured credit facility, after which the entiremark-to-market adjustment was recorded in our statement of operations as opposed to being recorded in equity as a component of other comprehensive income under the prior cash flow hedge accounting treatment. Derivative interest expense for the years ended December 31, 2009, 2008, and 2007 is related to our interest rate swaps with notional amounts of $1.14 billion, $1.22 billion, and $1.34 billion, respectively. | |
| (6) | From May 11, 2007 until October 10, 2009, we had elected to be taxed under the Internal Revenue Code as a subchapter S corporation. A subchapter S corporation passes through essentially all taxable earnings and losses to its stockholders and does not pay federal income taxes at the corporate level. Historical income taxes during this time consist mainly of state income taxes in certain states that do not recognize subchapter S corporations, and an income tax provision or benefit was recorded for certain of our subsidiaries, including our Mexican subsidiaries and our sole domestic captive insurance company at the time, which were not eligible to be treated as qualified subchapter S corporations. In October 2009, we elected to be taxed as a subchapter C corporation. For comparative purposes, we have included a pro forma (provision) benefit for income taxes assuming we had been taxed as a subchapter C corporation in all periods when our subchapter S corporation election was in effect. The pro forma effective tax rate for 2009 of 5.2% differs from the expected federal tax benefit of 35% primarily as a result of income recognized for tax purposes on the partial cancellation of the stockholder loan, which reduced the tax benefit rate by 32.6%. In 2008, the pro forma effective tax rate was reduced by 8.8% for stockholder distributions and 4.4% for non-deductible goodwill impairment charges, which resulted in a 19.7% effective tax rate. In 2007, the pro forma effective tax rate of 5.8% resulted primarily from a non-deductible goodwill impairment charge, which reduced the rate by 25.1%. |
46
Table of Contents
Management’s Discussion and Analysis of Financial Condition
and Results of Operations
and Results of Operations
The following discussion and analysis of our financial condition and results of operations should be read together with “Selected Historical Consolidated Financial and Other Data,” and the consolidated financial statements and the related notes included elsewhere in the prospectus. This discussion contains forward-looking statements as a result of many factors, including those set forth under “Risk Factors,” “Special Note Regarding Forward-Looking Statements,” and elsewhere in this prospectus. These statements are based on current expectations and assumptions that are subject to risks and uncertainties. Actual results could differ materially from those discussed in the forward-looking statements. Factors that could cause or contribute to these differences include those discussed below and elsewhere in this prospectus, particularly in “Risk Factors.”
Unless we state otherwise or the context otherwise requires, references in this prospectus to “Swift,” “we,” “our,” “us,” and the “Company” for all periods subsequent to the reorganization transactions described in the section entitled “Reorganization” (which will be completed in connection with this offering) refer to Swift Holdings Corp., a newly formed Delaware corporation, and its consolidated subsidiaries after giving effect to such reorganization transactions. For all periods from May 11, 2007 until the completion of such reorganization transactions, these terms refer to Swift Corporation, a Nevada corporation, which also is referred to herein as our “successor,” and its consolidated subsidiaries. For all periods prior to May 11, 2007, these terms refer to Swift Corporation’s predecessor, Swift Transportation Co., Inc., a Nevada corporation that has been converted to a Delaware limited liability company known as Swift Transportation Co., LLC, which also is referred to herein as Swift Transportation or our “predecessor,” and its consolidated subsidiaries. Our discussion of pro forma financial and operating results for 2007 refers to the combination of our predecessor’s results for the period January 1, 2007 through May 10, 2007, and our results for the year ended December 31, 2007.
Overview
Our Business
We are a multi-faceted transportation services company and the largest truckload carrier in North America. At March 31, 2010, we operated approximately 12,500 company-owned tractors, 3,700 owner-operator tractors, 49,400 trailers, and 4,300 intermodal containers from 35 major terminals strategically positioned throughout the United States and Mexico. Our extensive suite of services makes us an attractive choice for a broad array of customers. Our asset-based transportation services include dry van, dedicated, temperature controlled, cross border, and port drayage operations. Our complementary and more rapidly growing “asset-light” services include rail intermodal, freight brokerage, and third-party logistics operations. We use sophisticated technologies and systems that contribute to asset productivity, operating efficiency, customer satisfaction, and safety. We believe our fleet capacity, terminal network, customer service, and breadth of services provide significant advantages over many of our competitors. For the twelve months ended March 31, 2010, we generated operating revenue of approximately $2.6 billion.
We were founded by our Chief Executive Officer, Jerry Moyes, and his family in 1966. We became a public company in 1990, and our stock traded on NASDAQ under the symbol “SWFT” until May 10, 2007, when a company controlled by Mr. Moyes completed a merger that resulted in our becoming a private company. Between 1991 (our first full year as a public company) and 2006 (our last full year as a public company), we grew internally and through 10 acquisitions and our operating revenue grew to $3.2 billion and our Adjusted EBITDA grew to $498.6 million, which represented compounded annual growth rates of 21% and 22%, respectively.
During a challenging environment in 2009, when both loaded miles and rates were depressed across our industry, we instituted a number of cost savings measures that improved our Adjusted Operating Ratio and preserved our ability to generate Adjusted EBITDA at essentially the same level as 2008 and 2007, despite a $476.3 million, or 17.2%, decrease in revenue excluding fuel surcharges from 2007 to 2009. These actions
47
Table of Contents
improved Adjusted Operating Ratio by 60 basis points from fiscal year 2008 to fiscal year 2009 and by 330 basis points in the first three months ended March 31, 2010 compared with the same period of 2009. The main areas of savings included the following: reducing our tractor fleet by 17.2%, improving fuel efficiency, improving our tractor to non-driver ratio, suspending bonuses and401(k) matching, streamlining maintenance and administrative functions, improving safety and claims management, and limiting discretionary expenses. Some of these cost reductions, such as insurance and claims and maintenance expense, have a variable component that will increase or decrease with the miles we run. However, these expenses and others also have controllable components such as fleet size and age, staffing levels, safety, use of technology, and discipline in execution. Between 2008 and 2009, our cost control efforts overcame a 12.9% reduction in loaded miles as well as a 3.1% decrease in average trucking revenue per loaded mile excluding fuel surcharge. While our total costs will generally vary over time with our revenue, we believe a significant portion of the 2009 cost savings, and additional savings based on the same principles, will continue in future periods.
Adjusted EBITDA and Adjusted Operating Ratio are not recognized measures under GAAP and should not be considered alternatives to or superior to expense and profitability measures derived in accordance with GAAP. See “Prospectus Summary — Summary Historical Consolidated Financial and Other Data” for more information on our use of Adjusted EBITDA and Adjusted Operating Ratio, as well as a description of the computation and reconciliation of our net loss to Adjusted EBITDA and our operating ratio to our Adjusted Operating Ratio.
The following table reflects total operating revenue, net loss, revenue excluding fuel surcharges, Adjusted EBITDA, and Adjusted Operating Ratio for the indicated periods:
| Three Months Ended March 31, | Year Ended December 31, | |||||||||||||||||||
| 2010 | 2009 | 2009 | 2008 | 2007 | ||||||||||||||||
| (Unaudited) | (Unaudited) | (Audited) | (Audited) | Pro Forma | ||||||||||||||||
| (Unaudited) | ||||||||||||||||||||
| (Dollars in thousands) | ||||||||||||||||||||
| Total operating revenue | $ | 654,830 | $ | 614,756 | $ | 2,571,353 | $ | 3,399,810 | $ | 3,264,748 | ||||||||||
| Net loss | $ | (53,001) | $ | (43,560) | $ | (435,645) | $ | (146,555) | $ | (219,815) | ||||||||||
| Revenue (excl. fuel surcharge) | $ | 566,014 | $ | 561,770 | $ | 2,295,980 | $ | 2,680,193 | $ | 2,772,295 | ||||||||||
| Adjusted EBITDA | $ | 90,335 | $ | 79,035 | $ | 405,860 | $ | 409,598 | $ | 404,084 | ||||||||||
| Adjusted Operating Ratio | 94.4% | 97.7% | 93.9% | 94.5% | 95.7% | |||||||||||||||
Revenue and Expenses
We primarily generate revenue by transporting freight for our customers. Generally, we are paid a predetermined rate per mile for our services. We enhance our revenue by charging for fuel surcharges, stop-off pay, loading and unloading activities, tractor and trailer detention, and other ancillary services. The main factors that affect our revenue are the rate per mile we receive from our customers and the number of loaded miles we generate with our equipment, which in turn produce our weekly trucking revenue per tractor — one of our key performance indicators — and our total trucking revenue.
The most significant expenses in our business vary with miles traveled and include fuel, driver-related expenses (such as wages and benefits), and services purchased from owner-operators and other transportation providers, such as the railroads, drayage providers, and other trucking companies (which are recorded on the “Purchased transportation” line of our consolidated statements of operations). Expenses that have both fixed and variable components include maintenance and tire expense and our total cost of insurance and claims. These expenses generally vary with the miles we travel, but also have a controllable component based on safety, fleet age, efficiency, and other factors. Our main fixed costs are depreciation of long-term assets, such as tractors, trailers, containers, and terminals, interest expense, and the compensation of non-driver personnel.
Because a significant portion of our expenses are either fully or partially variable based on the number of miles traveled, changes in weekly trucking revenue per tractor caused by increases or decreases in deadhead
48
Table of Contents
miles percentage, rate per mile, and loaded miles have varying effects on our profitability. In general, changes in deadhead miles percentage have the largest proportionate effect on profitability because we still bear all of the expenses for each deadhead mile but do not earn any revenue to offset those expenses. Changes in rate per mile have the next largest proportionate effect on profitability because incremental improvements in rate per mile are not offset by any additional expenses. Changes in loaded miles generally have a smaller effect on profitability because variable expenses increase or decrease with changes in miles. However, items such as driver and owner-operator satisfaction and network efficiency are affected by changes in mileage and have significant indirect effects on expenses.
Due to our size and operating leverage, even small improvements in our asset productivity and yield can have a significant impact. The following table shows the effect on revenue and operating income of an increase of 25 miles per tractor per week, a one cent increase in rate per mile, and a one percentage point reduction in deadhead miles percentage (assuming elimination of empty miles but no increase in loaded miles) based on our 2009 variable and fixed cost structure, average trucking revenue per tractor per week, miles, rates, and deadhead miles percentage. In each column we assume all other variables remain constant.
| 25 Mile Increase in | 1% Reduction in | |||||||||||
| Miles Per Tractor | One Cent Increase | Deadhead Miles | ||||||||||
| Per Week | in Rate Per Mile | Percentage | ||||||||||
| (Dollars in thousands) | ||||||||||||
| Operating Revenue | $ | 35,613 | $ | 12,883 | $ | — | ||||||
| Operating Income | $ | 9,269 | $ | 12,883 | $ | 20,332 | ||||||
Income Taxes
From May 11, 2007 until October 10, 2009, we had elected to be taxed under the Internal Revenue Code as a subchapter S corporation. Such election followed the completion of the 2007 Transactions at the close of the market on May 10, 2007, which resulted in our becoming a private company. The election provided an income tax benefit of approximately $230 million associated with the partial reversal of previously recognized net deferred tax liabilities. Under subchapter S provisions, we did not pay corporate income taxes on our taxable income. Instead, our stockholders were liable for federal and state income taxes on their proportionate share of our taxable income. An income tax provision or benefit was recorded for certain of our subsidiaries, including our Mexican subsidiary and Mohave, our sole domestic captive insurance company at that time, which were not eligible to be treated as qualified subchapter S corporations. Additionally, we recorded a provision for state income taxes applicable to taxable income attributed to states that do not recognize the subchapter S corporation election.
In conjunction with the second amendment to our existing senior secured credit facility, we revoked our election to be taxed as a subchapter S corporation and, beginning October 10, 2009, we became taxed as a subchapter C corporation. Under subchapter C, we are liable for federal and state corporate income taxes on our taxable income. As a result of our subchapter S revocation, we recorded approximately $325 million of income tax expense on October 10, 2009, primarily in recognition of our deferred tax assets and liabilities as a subchapter C corporation.
See “Prospectus Summary — Summary Historical Consolidated Financial and Other Data” for a pro forma presentation of our net income as if we had been taxed as a subchapter C corporation in the periods presented therein.
Stockholder Loan
We have an outstanding stockholder loan agreement with Mr. Moyes and the Moyes Affiliates that had a $240.0 million balance due from them as of March 31, 2010. The stockholder loan bears interest at the rate of 2.66% per annum and matures in May 2018. Cash interest is due and payable only to the extent that we pay dividends or other cash distributions to Mr. Moyes and the Moyes Affiliates to fund such interest payments. During the years ended December 31, 2009, 2008, and 2007 and the three months ended March 31, 2010, we
49
Table of Contents
paid distributions on a quarterly basis totaling $16.4 million, $33.8 million, $29.7 million, and $0.0 million, respectively, to Mr. Moyes and the Moyes Affiliates, who then repaid the same amounts to us as interest. Interest is added to the principal for payment at maturity if not funded through a distribution.
We originally entered into the stockholder loan agreement in May 2007 at which time Mr. Moyes and the Moyes Affiliates borrowed from us an aggregate principal amount of $560 million. The terms of the stockholder loan agreement were negotiated with the lenders who provided the financing for the 2007 Transactions.
In connection with the second amendment to our existing senior secured credit facility, Mr. Moyes, at the request of our lenders, agreed to cancel $125.8 million of personally-held senior secured notes in return for a $325.0 million reduction of the stockholder loan. The senior secured floating rate notes held by Mr. Moyes, totaling $36.4 million in principal amount, were cancelled on October 13, 2009 and, correspondingly, the stockholder loan was reduced by $94.0 million. The senior secured fixed rate notes held by Mr. Moyes, totaling $89.4 million in principal amount, were cancelled in January 2010 and the stockholder loan was reduced by an additional $231.0 million. The amount of the stockholder loan cancelled in exchange for the contribution of senior secured notes was negotiated by Mr. Moyes with the steering committee of lenders, comprised of a number of the largest lenders (by holding size) and the administrative agent of our existing senior secured credit facility. Due to the classification of the stockholder loan as contra-equity, the reduction in the stockholder loan did not reduce our stockholders’ equity (deficit). The cancellation of senior secured notes by Mr. Moyes improved our stockholders’ deficit by $125.8 million. Furthermore, the cancellation of the remaining amount of the stockholder loan, which is contemplated to occur in connection with the closing of this offering, will not affect our stockholders’ deficit. Mr. Moyes and the Moyes Affiliates will recognize income with respect to the termination of the stockholder loan, and they will be solely responsible for the payment of taxes with respect to such income.
Key Performance Indicators
We use a number of primary indicators to monitor our revenue and expense performance and efficiency. Our main measure of productivity is weekly trucking revenue per tractor. Weekly trucking revenue per tractor is affected by our loaded miles, which only include the miles driven when hauling freight, the size of our fleet (because available loads may be spread over fewer or more tractors), and the rates received for our services. We strive to increase our revenue per tractor by improving freight rates with our customers and hauling more loads with our existing equipment, effectively moving freight within our network, keeping tractors maintained, and recruiting and retaining drivers and owner-operators.
We also strive to reduce our number of deadhead miles. We measure our performance in this area by monitoring our deadhead miles percentage, which is calculated by dividing the number of unpaid miles by the total number of miles driven. By planning consecutive loads with shorter distances between the drop-off andpick-up locations, we are able to reduce the percentage of deadhead miles driven to allow for more revenue-generating miles during our drivers’hours-of-service. This also enables us to reduce costs associated with deadhead miles, such as wages and fuel.
Average tractors available measures the number of tractors we have available for dispatch. This measure changes based on our ability to increase or decrease our fleet size to respond to changes in demand.
We consider our Adjusted Operating Ratio to be our most important measure of our operating profitability. We exclude fuel surcharge revenue and certain unusual or non-cash items in the calculation of our Adjusted Operating Ratio.
We monitor weekly trucking revenue per tractor, deadhead miles percentage, and average tractors available on a daily basis, and we measure Adjusted Operating Ratio on a monthly basis. For the three months
50
Table of Contents
ended March 31, 2010 and 2009, and the years ended December 31, 2009, 2008, and 2007, our actual and pro forma performance with respect to these indicators was as follows (unaudited):
| Three Months Ended | ||||||||||||||||||||
| March 31, | Years Ended December 31, | |||||||||||||||||||
| 2010 | 2009 | 2009 | 2008 | 2007 | ||||||||||||||||
| Actual | Actual | Pro Forma | ||||||||||||||||||
| Weekly trucking revenue per tractor | $ | 2,711 | $ | 2,541 | $ | 2,660 | $ | 2,916 | $ | 2,867 | ||||||||||
| Deadhead miles percentage | 12.2% | 13.6% | 13.2% | 13.6% | 13.0% | |||||||||||||||
| Average tractors available | 14,443 | 15,589 | 14,869 | 16,024 | 17,066 | |||||||||||||||
| Adjusted Operating Ratio | 94.4% | 97.7% | 93.9% | 94.5% | 95.7% | |||||||||||||||
Results of Operations
2007 Results of Operations
Our actual financial results presented in accordance with GAAP for the year ended December 31, 2007 include the impact of the following 2007 Transactions: (i) Jerry and Vickie Moyes’ April 7, 2007 contribution of 1,000 shares of common stock of IEL, constituting all issued and outstanding shares of IEL, to Swift Corporation, in exchange for 10,649,000 shares of Swift Corporation’s common stock, (ii) the May 9, 2007 contribution by Mr. Moyes and the Moyes Affiliates of 28,792,810 shares of Swift Transportation common stock, representing 38.3% of the then outstanding common stock of Swift Transportation, in exchange for 64,495,892 shares of Swift Corporation’s common stock, and (iii) Swift Corporation’s May 10, 2007 acquisition of Swift Transportation by a merger. Swift Corporation was formed in 2006 for the purpose of acquiring Swift Transportation, which did not occur until May 10, 2007. The results of Swift Transportation for the period from January 1, 2007 to May 10, 2007 and IEL from January 1, 2007 to April 7, 2007 are not included in our audited financial statements for the year ended December 31, 2007, included elsewhere in this prospectus. This lack of operational activity prior to May 11, 2007 impacts comparability between periods.
To facilitate comparability between periods, we utilize unaudited pro forma results of operations for 2007. The pro forma results of operations give effect to the 2007 Transactions, including our acquisition of Swift Transportation and the related financing, as if the 2007 Transactions had occurred on January 1, 2007. Accordingly, our pro forma results of operations reflect a full year of operational activity for IEL and Swift as well as a full year of interest expense associated with the acquisition financing.
The following is a summary of our actual and pro forma condensed consolidated results of operations for the year ended December 31, 2007:
| Pro Forma | ||||||||
| Actual | (Unaudited) | |||||||
| (Dollars in thousands) | ||||||||
| Operating revenue | $ | 2,180,293 | $ | 3,264,748 | ||||
| Operating loss | $ | (154,691 | ) | $ | (188,707 | ) | ||
| Interest expense | $ | 171,115 | $ | 265,745 | ||||
| Loss before income taxes | $ | (330,504 | ) | $ | (458,708 | ) | ||
The primary adjustments to our actual (audited) results of operations for 2007 in order to reflect our pro forma results of operations for 2007 were as follows:
| • | $1.1 billion increase in operating revenue and recording the associated expenses to reflect the results of Swift Transportation and IEL for periods prior to their contribution; | |
| • | $94.6 million increase in interest expense to reflect interest that would have been due on our acquisition financing during the period between January 1, 2007 and May 10, 2007; and |
51
Table of Contents
| • | $10.5 million increase in depreciation and amortization expense as if the 2007 Transactions occurred on January 1, 2007. |
Pro forma results should be considered in addition to, not as a substitute for, or superior to, measures of financial performance in accordance with GAAP. For a pro forma presentation of our pro forma condensed consolidated statement of operations (unaudited) for the year ended December 31, 2007, assuming the 2007 Transactions were effective January 1, 2007, see Annex A of this prospectus.
Factors Affecting Comparability Between Periods
Changes as a result of this offering
We expect the following items to affect comparability of our post-offering results to periods prior to the offering:
| • | $16.4 million in estimated non-cash equity compensation expense relating to the approximately 20% of our approximately 7.8 million outstanding stock options that will vest and be exercisable upon completion of this offering. Thereafter, quarterly non-cash equity compensation expense for existing grants is estimated to be approximately $1.8 million per quarter through 2012; and | |
| • | $ million estimated reduction in annual interest expense assuming the debt and capital lease balances at March 31, 2010, and the application of the estimated net proceeds of this offering as set forth in “Use of Proceeds.” |
Three months ended March 31, 2010 results of operations
Net loss for the three months ended March 31, 2010 was $53.0 million. Items impacting comparability between the three months ended March 31, 2010 and other periods include the following:
| • | $1.3 million of pre-tax impairment charge for trailers reclassified to assets held for sale; | |
| • | $7.4 million of incremental pre-tax depreciation expense reflecting management’s decision in the first quarter to scrap approximately 7,000 dry van trailers over the course of the next several years and the corresponding revision to estimates regarding salvage and useful lives of such trailers; and | |
| • | $9.5 million of income tax benefit as a result of recognition of subchapter C corporation tax benefits after our becoming a subchapter C corporation in the fourth quarter of 2009. |
2009 results of operations
Our net loss for the year ended December 31, 2009 was $435.6 million. Items impacting comparability between 2009 and other periods include the following:
| • | $0.5 million pre-tax impairment of three non-operating real estate properties in the first quarter of 2009; | |
| • | $4.2 million of pre-tax transaction costs incurred in the third and fourth quarters of 2009 related to an amendment to our existing senior secured credit facility and the concurrent senior secured notes amendments; | |
| • | $2.3 million of pre-tax transaction costs incurred during the third quarter related to our cancelled bond offering; | |
| • | $12.5 million pre-tax benefit in other income for net proceeds received during the third quarter pursuant to a litigation settlement entered into by us on September 25, 2009; | |
| • | $4.0 million pre-tax benefit in other income from the sale of our investment in Transplace in the fourth quarter of 2009, representing the recovery of a note receivable that had been previously written off; |
52
Table of Contents
| • | $324.8 million of non-cash income tax expense primarily in recognition of net deferred tax liabilities in the fourth quarter of 2009 reflecting our subchapter S revocation; and | |
| • | $29.2 million in additional interest expense and derivative interest expense related to higher interest rates and loss of hedge accounting for our interest rate swaps as a result of an amendment to our existing senior secured credit facility in the fourth quarter of 2009. |
2008 results of operations
Our net loss for the year ended December 31, 2008 was $146.6 million. Items impacting comparability between 2008 and other periods include the following:
| • | $17.0 million of pre-tax charges associated with impairment of goodwill relating to our Mexico freight transportation reporting unit; | |
| • | $7.5 million of pre-tax impairment charges for certain real property, tractors, trailers, and a note receivable; and | |
| • | $6.7 million in pre-tax expense associated with the closing of our 2008 RSA on July 30, 2008 and $0.3 million in financial advisory fees associated with an amendment to our existing senior secured credit facility. |
2007 pro forma (unaudited) results of operations
Our pro forma net loss for the year ended December 31, 2007 was $219.8 million. Items impacting comparability between our pro forma results for 2007 and our actual GAAP results for other periods include the following:
| • | $23.5 million in pretax transaction costs related to our going private transaction; | |
| • | $28.9 million in pretax change in control and stock incentive compensation, primarily relating to the going private transaction; | |
| • | $238.0 million in pretax goodwill impairment relating to our U.S. reporting unit; | |
| • | $2.4 million in pretax impairment of a note receivable, recorded, in non-operating other (income) expense; | |
| • | $18.3 million in pretax impairment of revenue equipment; and | |
| • | $230.2 million in income tax benefit associated with our election to become a subchapter S corporation. |
53
Table of Contents
Revenue
We record three types of revenue: trucking revenue, fuel surcharge revenue, and other revenue. A summary of revenue generated by type for 2009 and 2008 actual, 2007 pro forma, and for the three months ended March 31, 2010 and 2009 is as follows:
| Three Months Ended | ||||||||||||||||||||
| March 31, | Years Ended December 31, | |||||||||||||||||||
| 2010 | 2009 | 2009 | 2008 | 2007 | ||||||||||||||||
| Actual | Actual | Pro Forma | ||||||||||||||||||
| (Unaudited) | (Unaudited) | |||||||||||||||||||
| (Dollars in thousands) | ||||||||||||||||||||
| Trucking revenue | $ | 503,507 | $ | 509,320 | $ | 2,062,296 | $ | 2,443,271 | $ | 2,550,877 | ||||||||||
| Fuel surcharge revenue | 88,816 | 52,986 | 275,373 | 719,617 | 492,453 | |||||||||||||||
| Other revenue | 62,507 | 52,450 | 233,684 | 236,922 | 221,418 | |||||||||||||||
| Operating revenue | $ | 654,830 | $ | 614,756 | $ | 2,571,353 | $ | 3,399,810 | $ | 3,264,748 | ||||||||||
Trucking revenue
Trucking revenue is generated by hauling freight for our customers using our trucks or our owner-operators’ equipment. Trucking revenue includes all revenue we earn from our general truckload, dedicated, cross border, and drayage services. Generally, our customers pay for our services based on the number of miles in the most direct route betweenpick-up and delivery locations and other ancillary services we provide. Trucking revenue is the product of the number of revenue-generating miles driven and the rate per mile we receive from customers plus accessorial charges, such as loading and unloading freight for our customers or fees for detaining our equipment. The main factors that affect trucking revenue are our average tractors available and our weekly trucking revenue per tractor. Trucking revenue is affected by fluctuations in North American economic activity, as well as changes in inventory levels, changes in shipper packaging methods that reduce volumes, specific customer demand, the level of capacity in the truckload industry, driver availability, and modal shifts between truck and rail intermodal shipping (which we record in other revenue).
For the three months ended March 31, 2010, our trucking revenue decreased by $5.8 million, or 1.1%, compared with the same period in 2009. This decrease primarily resulted from a 1.7% decrease in average trucking revenue per loaded mile, which was partially offset by a 0.6% increase in loaded trucking miles. While trucking revenue decreased in total, our 7.4% decrease in average tractors available allowed us to achieve an 8.6% increase in average loaded miles per available tractor and a 6.7% increase in weekly trucking revenue per tractor. Trucking demand stabilized in late 2009 and began to increase in the first quarter of 2010. This allowed us to increase weekly trucking revenue per tractor as our reduced fleet size better matched the level of freight demand. Although shipping activity has strengthened, rate levels usually follow changes in utilization by several months as capacity tightens and contractual rate levels are adjusted.
For 2009, our trucking revenue decreased by $381.0 million, or 15.6%, compared with 2008. This decrease primarily resulted from a 12.9% reduction in loaded trucking miles and a 3.1% decrease in average trucking revenue per loaded mile. These reductions resulted in an 8.8% decrease in weekly trucking revenue per tractor and a 6.1% decrease in average loaded miles per available tractor despite our 7.2% reduction in average tractors available. This decline in trucking demand accelerated in the first half of 2009, and our fleet reductions were not as rapid as the decrease in freight volumes for two reasons. First, a depressed used equipment market made disposal of company tractors and owner-operator leased units unattractive. Second, we chose not to downsize our owner-operator fleet consistent with our longer term strategy of increasing our number of owner-operators. During 2009, excess capacity of tractors in our industry continued to place pressure on rates.
For 2008, our trucking revenue decreased by $107.6 million, or 4.2%, compared with pro forma trucking revenue for 2007. This decrease primarily resulted from a 5.3% decrease in loaded trucking miles, partially offset by a 1.2% increase in average trucking revenue per loaded mile. While trucking revenue decreased in
54
Table of Contents
total, our 6.1% reduction in average tractors available allowed us to achieve a 1.7% increase in weekly trucking revenue per tractor. During 2008, we downsized our tractor fleet as freight demand declined and were able to allocate our remaining fleet to the best available freight.
Fuel surcharge revenue
Fuel surcharges are designed to compensate us for fuel costs above a certain cost per gallon base. Generally, we receive fuel surcharges on the miles for which we are compensated by customers. However, we continue to have exposure to increasing fuel costs related to deadhead miles, fuel efficiency due to engine idle time, and other factors and to the extent the surcharge paid by the customer is insufficient. The main factors that affect fuel surcharge revenue are the price of diesel fuel and the number of loaded miles. Although our surcharge programs vary by customer, we endeavor to negotiate an additional penny per mile charge for every five cent increase in the Department of Energy’s national average diesel fuel index over an agreed baseline price. In some instances, customers choose to incorporate the additional charge by splitting the impact between the basic rate per mile and the surcharge fee. In addition, we have moved much of our West Coast customer activity to a surcharge program that is indexed to the Department of Energy’s West Coast average diesel fuel index as diesel fuel prices in the western United States generally are higher than the national average index. Our fuel surcharges are billed on a lagging basis, meaning we typically bill customers in the current week based on a previous week’s applicable index. Therefore, in times of increasing fuel prices, we do not recover as much as we are currently paying for fuel. In periods of declining prices, the opposite is true.
For the three months ended March 31, 2010, fuel surcharge revenue increased $35.8 million, or 67.6%, compared with the 2009 period. The Department of Energy’s national diesel price index increased 30.1% to an average of $2.85 per gallon in the 2010 period compared with $2.19 per gallon in the 2009 period. The 0.6% increase in total loaded miles in the 2010 period also increased fuel surcharge revenue slightly.
For 2009, fuel surcharge revenue decreased $444.2 million, or 61.7%, compared with 2008. The Department of Energy’s national diesel price index decreased 35.0%, to an average of $2.47 per gallon in 2009 compared with $3.80 per gallon in 2008. In addition, we operated 12.9% fewer loaded miles in 2009.
For 2008, fuel surcharge revenue increased $227.2 million, or 46.1%, compared with the pro forma fuel surcharge revenue for 2007. The Department of Energy’s national diesel index increased 31.5%, to an average of $3.80 per gallon in 2008 compared with $2.89 per gallon in 2007. This was offset by 5.3% fewer loaded miles in 2008.
Other revenue
Our other revenue is generated primarily by our rail intermodal business, non-asset based freight brokerage and logistics management service, tractor leasing revenue of IEL, premium revenue generated by our wholly-owned captive insurance companies, and other revenue generated by our shops. The main factors that affect other revenue are demand for our intermodal and brokerage and logistics services and the number of owner-operators leasing equipment from us.
For the three months ended March 31, 2010, other revenue increased by $10.1 million, or 19.2%, compared with the 2009 period. This resulted primarily from a 44.7% increase in intermodal miles as intermodal freight demand strengthened, partially offset by a $1.2 million decrease in tractor leasing revenue of IEL.
For 2009, other revenue decreased by $3.2 million, or 1.4%, compared with 2008. This resulted primarily from a 61% decrease in logistics revenue, partially offset by a $7.2 million increase in tractor leasing revenue of IEL, resulting from growth of our owner-operator fleet.
For 2008, other revenue increased by $15.5 million, or 7.0%, compared with pro forma results for 2007. This resulted primarily from growth of our owner-operator fleet and the related leasing revenue of IEL.
55
Table of Contents
Operating Expenses
Salaries, wages, and employee benefits
Salaries, wages, and employee benefits consist primarily of compensation for all employees. Salaries, wages, and employee benefits are primarily affected by the total number of miles driven by company drivers, the rate per mile we pay our company drivers, employee benefits including but not limited to health care and workers’ compensation, and to a lesser extent by the number of, and compensation and benefits paid to, non-driver employees.
The following is a summary of actual and pro forma salaries, wages, and employee benefits for the three months ended March 31, 2010 and 2009, and years ended December 31, 2009, 2008, and 2007:
| Three Months Ended | ||||||||||||||||||||
| March 31, | Years Ended December 31, | |||||||||||||||||||
| 2010 | 2009 | 2009 | 2008 | 2007 | ||||||||||||||||
| Actual | Actual | Pro Forma | ||||||||||||||||||
| (Unaudited) | (Unaudited) | |||||||||||||||||||
| (Dollars in thousands) | ||||||||||||||||||||
| Salaries, wages, and employee benefits | $ | 177,803 | $ | 189,377 | $ | 728,784 | $ | 892,691 | $ | 977,829 | ||||||||||
| % of revenue, excluding fuel surcharge revenue | 31.4% | 33.7% | 31.7% | 33.3% | 35.3% | |||||||||||||||
| % of operating revenue | 27.2% | 30.8% | 28.3% | 26.3% | 30.0% | |||||||||||||||
For the three months ended March 31, 2010, salaries, wages, and employee benefits decreased $11.6 million, or 6.1%, compared with the same period in 2009. As a percentage of revenue excluding fuel surcharge revenue, salaries, wages, and employee benefits decreased to 31.4%, compared with 33.7% for the 2009 period. This reduction was primarily the result of a 7.0% decrease in miles driven by company drivers and the corresponding reduction in wages and benefits. We also implemented non-driver headcount reductions in January and October of 2009. These decreases were partially offset by the accrual of bonuses and resuming our 401(k) match program, both of which were temporarily discontinued in 2009, and increased healthcare expenses. If we are successful in maintaining our improvement in tractors per non-driver and other efficiency measures and in continuing to increase the percentage of miles driven by owner-operators, we would expect corresponding decreases in our salaries, wages, and employee benefits as a percentage of revenue, which may be offset by increases in purchased transportation.
For 2009, salaries, wages, and employee benefits decreased $163.9 million, or 18.4%, compared with 2008. As a percentage of revenue excluding fuel surcharge revenue, salaries, wages, and employee benefits decreased to 31.7%, compared with 33.3% for 2008. This decline is primarily due to an overall decline in shipping volumes and associated miles as well as a mix shift between company drivers and owner-operators, which combined to result in an 18.3% reduction in the number of miles driven by company drivers. We also reduced our average, non-driving workforce in 2009 by 11.6% compared with the average for 2008 as a result of efficiency measures developed by our Lean Six Sigma initiatives, as well as reductions in force related to a smaller tractor fleet and revenue base. In addition, we reduced the rate of pay to drivers in 2009, eliminated bonuses and our 401(k) match, and imposed a one-week furlough for non-driving personnel in the second quarter.
For 2008, salaries, wages, and employee benefits decreased $85.1 million, or 8.7%, compared with pro forma results for 2007. As a percentage of revenue, excluding fuel surcharge revenue, salaries, wages and employee benefits decreased to 33.3%, compared with pro forma results of 35.3% for 2007. This decrease primarily related to a 9.2% decrease in miles driven by company drivers and the corresponding reduction in wages and benefits. In addition, pro forma salaries, wages, and employee benefits for the year ended December 31, 2007 included $16.4 million related tochange-in-control payments made to former executive officers, $11.1 million related to the acceleration of stock incentive awards under Topic 718,“Compensation-
56
Table of Contents
Stock Compensation,” or Topic 718, both of which resulted from the 2007 Transactions, and the $1.4 million in stock incentive expense recognized in accordance with Topic 718 from January 1, 2007 to May 10, 2007.
We currently have stock options outstanding, which lack exercisability pursuant to our 2007 equity incentive plan. Approximately 20% of these options vest and become exercisable simultaneously with the closing of an initial public offering. We expect that our salaries, wages, and employee benefits expense will increase for the quarter in which this offering becomes effective as a result of non-cash equity compensation expense for equity grants that vest and are then exercisable upon an initial public offering. Assuming the consummation of this offering, we anticipate that stock compensation expense immediately recognized will be approximately $16.4 million. Thereafter, quarterly non-cash equity compensation expense for existing grants is estimated to be approximately $1.8 million per quarter through 2012.
In future periods, the compensation paid to our drivers and other employees may need to increase if the economy strengthens and other employment alternatives become more available.
Operating supplies and expenses
Operating supplies and expenses consist primarily of ordinary vehicle repairs and maintenance, the physical damage repairs to our equipment resulting from accidents, costs associated with preparing tractors and trailers for sale or trade-in, driver expenses, driver recruiting costs, legal and professional services fees, general and administrative expenses, and other costs. Operating supplies and expenses are primarily affected by the age of our company-owned fleet of tractors and trailers, the number of miles driven in a period, driver turnover, and to a lesser extent by efficiency measures in our shop.
The following is a summary of actual and pro forma operating supplies and expenses for the three months ended March 31, 2010 and 2009, and years ended December 31, 2009, 2008, and 2007:
| Three Months Ended | ||||||||||||||||||||
| March 31, | Years Ended December 31, | |||||||||||||||||||
| 2010 | 2009 | 2009 | 2008 | 2007 | ||||||||||||||||
| Actual | Actual | Pro Forma | ||||||||||||||||||
| (Unaudited) | (Unaudited) | |||||||||||||||||||
| (Dollars in thousands) | ||||||||||||||||||||
| Operating supplies and expenses | $ | 47,830 | $ | 56,723 | $ | 209,945 | $ | 271,951 | $ | 307,901 | ||||||||||
| % of revenue, excluding fuel surcharge revenue | 8.5% | 10.1% | 9.1% | 10.1% | 11.1% | |||||||||||||||
| % of operating revenue | 7.3% | 9.2% | 8.2% | 8.0% | 9.4% | |||||||||||||||
For the three months ended March 31, 2010, operating supplies and expenses decreased $8.9 million, or 15.7%, compared with the same period in 2009. As a percentage of revenue excluding fuel surcharge revenue, operating supplies and expenses decreased to 8.5%, compared with 10.1% for the same period in 2009. This decrease was primarily due to the reduction in our company tractor fleet, improved driver turnover, and cost control and maintenance efficiency initiatives we implemented during 2009, resulting in lower equipment maintenance and other discretionary costs. If we are successful in increasing the percentage of miles driven by owner-operators, we would expect to see some decrease in operating supplies and expenses as owner-operators are responsible for the maintenance of their own equipment. However, to the extent that owner-operators use our shops for maintenance and repairs, operating supplies and expense could increase and we would record additional amounts in other revenue for the amounts that we charge for our services.
For 2009, operating supplies and expenses decreased $62.0 million, or 22.8%, compared with 2008. As a percentage of revenue, excluding fuel surcharge revenue, operating supplies and expenses decreased to 9.1%, compared with 10.1% for 2008. Thisyear-over-year decrease was primarily due to the reduction in our tractor fleet, improved driver turnover, and several cost control and maintenance efficiency initiatives we implemented during 2009, resulting in lower driver recruiting and training, equipment maintenance, and other discretionary costs. These decreases were partially offset by $6.5 million of expenses for transaction costs related to the
57
Table of Contents
amendments of our financing agreements and a cancelled bond offering during the third and fourth quarters of 2009, which we recorded in operating supplies and expenses.
For 2008, operating supplies and expenses decreased $36.0 million, or 11.7%, compared with pro forma results for 2007. As a percentage of revenue, excluding fuel surcharge revenue, operating supplies and expenses decreased to 10.1%, compared with 11.1% for pro forma results for 2007. This decrease primarily related to reductions in hiring and routine maintenance expense due to operating a smaller and newer company tractor fleet. These reductions were offset, in part, by higher maintenance expense during the first half of 2008 resulting from preparing an unusually large number of tractors for disposition associated with downsizing our fleet. Furthermore, pro forma operating supplies and expenses as shown above for the year ended December 31, 2007 include $22.0 million for financial, investment advisory, legal, and accounting fees associated with the 2007 Transactions.
Fuel expense
Fuel expense consists primarily of diesel fuel expense for our company-owned tractors and fuel taxes. The primary factors affecting our fuel expense are the cost of diesel fuel, the miles per gallon we realize with our equipment, and the number of miles driven by company drivers.
We believe the most effective protection against fuel cost increases is to maintain a fuel-efficient fleet by incorporating fuel efficiency measures, such as slower tractor speeds, engine idle limitations, and a reduction of deadhead miles into our business, and to implement an effective fuel surcharge program. To mitigate unrecovered fuel exposure, we have worked to negotiate more robust surcharge programs with customers identified as having inadequate programs. We generally have not used derivatives as a hedge against higher fuel costs in the past, but continue to evaluate this possibility. We have contracted with some of our fuel suppliers to buy a portion of our fuel at a fixed price or within banded pricing for a specific period, usually not exceeding twelve months, to mitigate the impact of rising fuel costs.
The following is a summary of actual and pro forma fuel expense for the three months ended March 31, 2010 and 2009, and years ended December 31, 2009, 2008, and 2007:
| Three Months Ended | ||||||||||||||||||||
| March 31, | Years Ended December 31, | |||||||||||||||||||
| 2010 | 2009 | 2009 | 2008 | 2007 | ||||||||||||||||
| Actual | Actual | Pro Forma | ||||||||||||||||||
| (Unaudited) | (Unaudited) | |||||||||||||||||||
| (Dollars in thousands) | ||||||||||||||||||||
| Fuel expense | $ | 106,082 | $ | 85,868 | $ | 385,513 | $ | 768,693 | $ | 699,302 | ||||||||||
| % of operating revenue | 16.2% | 14.0% | 15.0% | 22.6% | 21.4% | |||||||||||||||
To measure the effectiveness of our fuel surcharge program, we subtract fuel surcharge revenue (other than the fuel surcharge revenue we reimburse to owner-operators, the railroads, and other third parties which is included in purchased transportation) from our fuel expense. The result is referred to as net fuel expense. Our net fuel expense as a percentage of revenue excluding fuel surcharge revenue is affected by the cost of diesel fuel net of surcharge collection, the percentage of miles driven by company trucks, and our percentage of
58
Table of Contents
deadhead miles, for which we do not receive fuel surcharge revenues. Our net fuel expense as a percentage of revenue less fuel surcharge revenue is shown below:
| Three Months Ended | ||||||||||||||||||||
| March 31, | Years Ended December 31, | |||||||||||||||||||
| 2010 | 2009 | 2009 | 2008 | 2007 | ||||||||||||||||
| Actual | Actual | Pro Forma | ||||||||||||||||||
| (Unaudited) | (Unaudited) | |||||||||||||||||||
| (Dollars in thousands) | ||||||||||||||||||||
| Total fuel surcharge revenue | $ | 88,816 | $ | 52,986 | $ | 275,373 | $ | 719,617 | $ | 492,453 | ||||||||||
| Less: fuel surcharge revenue reimbursed to owner-operators and other third parties | 32,866 | 16,279 | 92,341 | 216,185 | 126,415 | |||||||||||||||
| Company fuel surcharge revenue | $ | 55,950 | $ | 36,707 | $ | 183,032 | $ | 503,432 | $ | 366,038 | ||||||||||
| Total fuel expense | $ | 106,082 | $ | 85,868 | $ | 385,513 | $ | 768,693 | $ | 699,302 | ||||||||||
| Less: company fuel surcharge revenue | 55,950 | 36,707 | 183,032 | 503,432 | 366,038 | |||||||||||||||
| Net fuel expense | $ | 50,132 | $ | 49,161 | $ | 202,481 | $ | 265,261 | $ | 333,264 | ||||||||||
| % of revenue, excluding fuel surcharge revenue | 8.9% | 8.8% | 8.8% | 9.9% | 12.0% | |||||||||||||||
For the three months ended March 31, 2010, net fuel expense increased $1.0 million, or 2.0%, compared with the same period in 2009. As a percentage of revenue excluding fuel surcharge revenue, net fuel expense was relatively consistent compared with the same period of 2009. However, given the shift in the mix of company drivers to owner-operators noted above, where the percentage of total miles driven by company tractors decreased, net fuel expense represents a 9.7% increase in net fuel expense per company mile. This was caused by higher diesel fuel prices and an increase in the unrecovered fuel expense per mile resulting from the lag effect of fuel surcharges as fuel prices rose in the first quarter of 2010, compared with declining prices in the 2009 period. If we are successful in increasing the percentage of miles driven by owner-operators and in expanding our asset-light services in brokerage and intermodal, we would expect corresponding decreases in our net fuel expense as a percentage of revenue, excluding fuel surcharge revenue.
For 2009, net fuel expense decreased by $62.8 million, or 23.7%, compared with 2008. As a percentage of revenue, excluding fuel surcharge revenue, net fuel expense decreased to 8.8%, compared with 9.9% for 2008. This decline was caused by an 18.3% decrease in miles driven by company tractors, lower diesel fuel prices, a slight improvement in fuel economy, and improvements in fuel procurement strategies.
For 2008, net fuel expense decreased $68.0 million, or 20.4%, compared with pro forma results for 2007. As a percentage of revenue, excluding fuel surcharge revenue, net fuel expense decreased to 9.9%, compared with 12.0% for the pro forma results for 2007. The decrease was caused by improved fuel efficiency resulting from the reduction of our self-imposed tractor highway speed limit from 65 to 62 miles per hour during the first quarter of 2008, the management of engine idle time, and the promotion of fuel efficient driving habits among our drivers. In addition, net fuel expense also decreased because of the decrease in the number of miles driven by company tractors.
59
Table of Contents
Purchased transportation
Purchased transportation consists of the payments we make to owner-operators, railroads, and third-party carriers that haul loads we broker to them, including fuel surcharge reimbursements paid to such parties.
The following is a summary of actual and pro forma purchased transportation expense for the three months ended March 31, 2010 and 2009, and years ended December 31, 2009, 2008, and 2007:
| Three Months Ended | ||||||||||||||||||||
| March 31, | Years Ended December 31, | |||||||||||||||||||
| 2010 | 2009 | 2009 | 2008 | 2007 | ||||||||||||||||
| Actual | Actual | Pro Forma | ||||||||||||||||||
| (Unaudited) | (Unaudited) | |||||||||||||||||||
| (Dollars in thousands) | ||||||||||||||||||||
| Purchased transportation expense | $ | 175,702 | $ | 135,753 | $ | 620,312 | $ | 741,240 | $ | 629,586 | ||||||||||
| % of operating revenue | 26.8% | 22.1% | 24.1% | 21.8% | 19.3% | |||||||||||||||
Because we reimburse owner-operators and other third parties for fuel surcharges we receive, we subtract fuel surcharge revenue reimbursed to third parties from our purchased transportation expense. The result, referred to as purchased transportation, net of fuel surcharge reimbursements, is evaluated as a percentage of revenue less fuel surcharge revenue, as shown below:
| Three Months Ended | ||||||||||||||||||||
| March 31, | Years Ended December 31, | |||||||||||||||||||
| 2010 | 2009 | 2009 | 2008 | 2007 | ||||||||||||||||
| Actual | Actual | Pro Forma | ||||||||||||||||||
| (Unaudited) | (Unaudited) | |||||||||||||||||||
| (Dollars in thousands) | ||||||||||||||||||||
| Purchased transportation | $ | 175,702 | $ | 135,753 | $ | 620,312 | $ | 741,240 | $ | 629,586 | ||||||||||
| Less: Fuel surcharge revenue reimbursed to owner-operators and other third parties | 32,866 | 16,279 | 92,341 | 216,185 | 126,415 | |||||||||||||||
| Purchased transportation, net of fuel surcharge reimbursement | $ | 142,836 | $ | 119,474 | $ | 527,971 | $ | 525,055 | $ | 503,171 | ||||||||||
| % of revenue, excluding fuel surcharge revenue | 25.2% | 21.3% | 23.0% | 19.6% | 18.2% | |||||||||||||||
For the three months ended March 31, 2010, purchased transportation, net of fuel surcharge reimbursements, increased $23.4 million, or 19.6%, compared with the same period in 2009. As a percentage of revenue, excluding fuel surcharge revenue, purchased transportation, net of fuel surcharge reimbursement, increased to 25.2%, compared with 21.3% for the same period in 2009. The increase in cost and percentage of revenue, excluding fuel surcharge revenue, results primarily from a 44.7% increase in intermodal miles and a 14.2% increase in owner-operator miles. The percentage of total miles driven by owner-operators increased by 300 basis points in the three months ended March 31, 2010 compared to the prior year quarter. If we are successful in growing the size of our fleet by adding additional owner-operators and are successful in expanding our asset-light brokerage and intermodal services, we would expect corresponding increases in purchased transportation as a percentage of revenue, excluding fuel surcharge revenue.
For 2009, purchased transportation, net of fuel surcharge reimbursements, was relatively flat in dollar amount, but as a percentage of revenue, excluding fuel surcharge, increased to 23.0%, compared with 19.6% for 2008. The percentage increase is primarily the result of the mix shift from company drivers to owner-operators, as noted above, which produced a 1.5% increase in loaded miles driven by owner-operators despite a 12.9% reduction in total loaded miles.
For 2008, purchased transportation, net of fuel surcharge reimbursements, increased $21.9 million, or 4.3%, compared with pro forma results for 2007. As a percentage of revenue, excluding fuel surcharge revenue, purchased transportation, net of fuel surcharge reimbursement, increased to 19.6%, compared with
60
Table of Contents
18.2% for pro forma results for 2007, primarily because of a 16.4% increase in the number of miles driven by owner-operatorsyear-over-year.
Insurance and claims
Insurance and claims expense consists of insurance premiums and the accruals we make for estimated payments and expenses for claims for bodily injury, property damage, cargo damage, and other casualty events. The primary factors affecting our insurance and claims are seasonality (we typically experience higher accident frequency in winter months), the frequency and severity of accidents, trends in the development factors used in our actuarial accruals, and developments in large, prior-year claims. Furthermore, our substantial, self-insured retention of $10.0 million per occurrence for accident claims can make this expense item volatile.
The following is a summary of our actual and pro forma insurance and claims expense for the three months ended March 31, 2010 and 2009, and years ended December 31, 2009, 2008, and 2007:
| Three Months Ended | ||||||||||||||||||||
| March 31, | Years Ended December 31, | |||||||||||||||||||
| 2010 | 2009 | 2009 | 2008 | 2007 | ||||||||||||||||
| Actual | Actual | Pro Forma | ||||||||||||||||||
| (Unaudited) | (Unaudited) | |||||||||||||||||||
| (Dollars in thousands) | ||||||||||||||||||||
| Insurance and claims | $ | 20,207 | $ | 25,481 | $ | 81,332 | $ | 141,949 | $ | 128,138 | ||||||||||
| % of revenue, excluding fuel surcharge revenue | 3.6% | 4.5% | 3.5% | 5.3% | 4.6% | |||||||||||||||
| % of operating revenue | 3.1% | 4.1% | 3.2% | 4.2% | 3.9% | |||||||||||||||
For the three months ended March 31, 2010, insurance and claims expense decreased by $5.3 million, or 20.7%, compared with the same period in 2009. As a percentage of revenue, excluding fuel surcharge revenue, insurance and claims expense decreased to 3.6%, compared with 4.5% for the same period in 2009. The decrease resulted from reductions in accident frequency and severity trends over the past two years and the refinement to our actuarial loss rates among quarters in our current year based on historical loss trends.
For 2009, insurance and claims expense decreased by $60.6 million, or 42.7%, compared with 2008. As a percentage of revenue, excluding fuel surcharge revenue, insurance and claims expense decreased to 3.5%, compared with 5.3% for 2008. The decrease partially reflected an increase in claims expense during the fourth quarter of 2008, as additional information regarding several large loss claims for accidents that had occurred in 2006 and 2007 resulted in an increase in reserves and additional expense during 2008. Insurance and claims expense also decreased in 2009 because of the decrease in total miles in 2009 versus 2008. Furthermore, our recent reductions in accident frequency and severity resulted in less expense as a percentage of revenue, excluding fuel surcharge.
For 2008, insurance and claims expense increased by $13.8 million, or 10.8%, compared with pro forma results for 2007. As a percentage of revenue, excluding fuel surcharge revenue, insurance and claims expense increased to 5.3%, compared with 4.6% for pro forma results for 2007. The increase is attributable to a few unfavorable settlements during 2008 on large claims incurred in prior years, partially offset by the decrease in miles driven and improvements in the frequency and severity of 2008 claims.
Rental expense, depreciation, and amortization
Rental expense consists primarily of payments for tractors and trailers financed with operating leases. Depreciation and amortization expense consists primarily of depreciation for owned tractors and trailers, but also includes the amortization of intangibles derived from previous acquisitions, discussed below. The primary factors affecting these expense items include the size and age of our tractor, trailer, and container fleet, the cost of new equipment, and the relative percentage of owned versus leased equipment. Because the mix of our
61
Table of Contents
leased versus owned tractors varies, we believe it is appropriate to combine our rental expense with our depreciation and amortization expense when comparingyear-over-year results for analysis purposes.
The following is a summary of actual and pro forma rental expense, depreciation, and amortization for the three months ended March 31, 2010 and 2009, and years ended December 31, 2009, 2008, and 2007:
| Three Months Ended | ||||||||||||||||||||
| March 31, | Years Ended December 31, | |||||||||||||||||||
| 2010 | 2009 | 2009 | 2008 | 2007 | ||||||||||||||||
| Actual | Actual | Pro Forma | ||||||||||||||||||
| (Unaudited) | (Unaudited) | |||||||||||||||||||
| (Dollars in thousands) | ||||||||||||||||||||
| Rental expense | $ | 18,903 | $ | 20,391 | $ | 79,833 | $ | 76,900 | $ | 78,256 | ||||||||||
| Depreciation and amortization expense | 65,497 | 66,956 | 253,531 | 275,832 | 281,181 | |||||||||||||||
| Rental expense, depreciation, and amortization expense | 84,400 | 87,347 | 333,364 | 352,732 | 359,437 | |||||||||||||||
| % of revenue, excluding fuel surcharge revenue | 14.9% | 15.5% | 14.5% | 13.2% | 13.0% | |||||||||||||||
| % of operating revenue | 12.9% | 14.2% | 13.0% | 10.4% | 11.0% | |||||||||||||||
Rental expense and depreciation were primarily driven by our fleet of tractors and trailers shown below:
| As of March 31, | As of December 31, | |||||||||||||||||||
| 2010 | 2009 | 2009 | 2008 | 2007 | ||||||||||||||||
| Actual | Actual | Pro Forma | ||||||||||||||||||
| (Unaudited) | (Unaudited) | |||||||||||||||||||
| Tractors: | ||||||||||||||||||||
| Company | ||||||||||||||||||||
| Owned | 7,657 | 9,280 | 7,881 | 9,811 | 13,017 | |||||||||||||||
| Leased — capital leases | 2,680 | 2,352 | 2,485 | 1,977 | 764 | |||||||||||||||
| Leased — operating leases | 2,152 | 2,063 | 2,074 | 1,998 | 2,236 | |||||||||||||||
| Total company tractors | 12,489 | 13,695 | 12,440 | 13,786 | 16,017 | |||||||||||||||
| Owner-operator | ||||||||||||||||||||
| Financed through the Company | 2,761 | 2,451 | 2,687 | 2,417 | 2,218 | |||||||||||||||
| Other | 970 | 1,124 | 898 | 1,143 | 1,003 | |||||||||||||||
| Total owner-operator tractors | 3,731 | 3,575 | 3,585 | 3,560 | 3,221 | |||||||||||||||
| Total tractors | 16,220 | 17,270 | 16,025 | 17,346 | 19,238 | |||||||||||||||
| Trailers | 49,436 | 49,284 | 49,215 | 49,695 | 49,879 | |||||||||||||||
| Containers | 4,262 | 5,755 | 4,262 | 5,726 | 5,776 | |||||||||||||||
For the three months ended March 31, 2010, rental expense, depreciation, and amortization decreased by $2.9 million, or 3.4%, compared with the same period in 2009. As a percentage of revenue, excluding fuel surcharge revenue, rental expense, depreciation, and amortization decreased to 14.9%, compared with 15.5% for the same period in 2009. This decrease was primarily associated with lower depreciation expense because of a smaller number of depreciable tractors in the first quarter of 2010 as compared with the first quarter of 2009, partially offset by $7.4 million of incremental depreciation expense during the 2010 quarter reflecting management’s revised estimates of salvage value and useful lives for approximately 7,000 dry van trailers, which management decided during the quarter to scrap. In addition, rental expense decreased because of the assignment of the leases to a third party for approximately 1,500 North American Container System (NACS) intermodal containers during the second and third quarter of 2009 and the termination of other miscellaneous
62
Table of Contents
trailer leases. Also, an increase in weekly trucking revenue per tractor more effectively covered these largely fixed costs.
For 2009, rental expense, depreciation, and amortization decreased $19.4 million, or 5.5%, compared with 2008. As a percentage of revenue, excluding fuel surcharge revenue, rental expense, depreciation, and amortization increased to 14.5%, compared with 13.2% for 2008. The dollar decrease was the result of lower depreciation expense because of a smaller number of depreciable tractors in 2009 as compared with 2008, as well as reductions in container and trailer leases. This decrease was partially offset by an increase in rental expense because of an increase in the number of company trucks financed with operating leases, including trucks we lease to owner-operators. The increase as a percentage of revenue, net of fuel surcharge revenue, was a result of lower revenue per tractor.
For 2008, rental expense, depreciation, and amortization decreased by $6.7 million, or 1.9%, compared with pro forma results for 2007. As a percentage of revenue, excluding fuel surcharge revenue, rental expense, depreciation, and amortization increased to 13.2%, compared with 13.0% for pro forma results for 2007. As we trade in older units, to the extent they are replaced with newer, more expensive units, depreciation and rental expense per unit will be higher. Additionally, in January 2008, we changed our estimate of residual values for certain trailers as a result of decreases in their salvage value. This change increased depreciation expense by $3.3 million for 2008.
Included in depreciation and amortization is amortization of certain identified intangible assets acquired pursuant to the 2007 Transactions. We estimate that our non-cash amortization expense associated with all of the intangibles will be approximately $20.5 million in 2010, $18.5 million in 2011, $18.4 million in 2012, $18.4 million in 2013, and $18.4 million in 2014.
Our rental expense, depreciation, and amortization may increase in future periods because of increased costs associated with newer tractors. Any engine manufactured on or after January 1, 2010 must comply with the new emissions regulations, and we anticipate higher costs associated with these engines will be reflected in increased depreciation and rental expense. We expect, as emissions requirements become stricter, that the price of equipment will continue to rise.
Impairments
The following is a summary of actual and pro forma impairment expense for the three months ended March 31, 2010 and 2009, and years ended December 31, 2009, 2008, and 2007:
| Three Months Ended | ||||||||||||||||||||
| March 31, | Years Ended December 31, | |||||||||||||||||||
| 2010 | 2009 | 2009 | 2008 | 2007 | ||||||||||||||||
| Actual | Actual | Pro Forma | ||||||||||||||||||
| (Unaudited) | (Unaudited) | |||||||||||||||||||
| (Dollars in thousands) | ||||||||||||||||||||
| Impairment expense | $ | 1,274 | $ | 515 | $ | 515 | $ | 24,529 | $ | 256,305 | ||||||||||
| % of revenue, excluding fuel surcharge revenue | 0.2% | 0.1% | 0.0% | 0.9% | 9.2% | |||||||||||||||
| % of operating revenue | 0.2% | 0.1% | 0.0% | 0.7% | 7.9% | |||||||||||||||
Results for the three months ended March 31, 2010 included a $1.3 million pre-tax impairment charge for trailers, while the first quarter of 2009 included a $0.5 million pre-tax charge for impairment of three non-operating real estate properties.
In 2008, we incurred $24.5 million in impairment charges comprised of (i) a $17.0 million impairment of goodwill relating to our Mexico freight transportation reporting unit, (ii) a pre-tax impairment charge of $0.3 million for the write-off of a note receivable related to the sale of our Volvo truck delivery business assets in 2006, and (iii) pre-tax impairment charges totaling $7.2 million on tractors, trailers, and several non-operating real estate properties. In the third and fourth quarters of 2008, we recorded impairment charges
63
Table of Contents
totaling $7.5 million before taxes related to real property, tractors, trailers, and a note receivable from the sale of our Volvo truck delivery business assets in 2006.
The pro forma results in 2007 include a goodwill impairment of $238.0 million related to our U.S. freight transportation reporting unit and impairment of certain trailers of $18.3 million.
Operating taxes and licenses
Operating taxes and licenses expense primarily represents the costs of taxes and licenses associated with our fleet of equipment and will vary according to the size of our equipment fleet in future periods. The following is a summary of actual and pro forma operating taxes and licenses expense for the three months ended March 31, 2010 and 2009, and years ended December 31, 2009, 2008, and 2007:
| Three Months Ended | ||||||||||||||||||||
| March 31, | Years Ended December 31, | |||||||||||||||||||
| 2010 | 2009 | 2009 | 2008 | 2007 | ||||||||||||||||
| Actual | Actual | Pro Forma | ||||||||||||||||||
| (Unaudited) | (Unaudited) | |||||||||||||||||||
| (Dollars in thousands) | ||||||||||||||||||||
| Operating taxes and licenses expense | $ | 13,365 | $ | 14,381 | $ | 57,236 | $ | 67,911 | $ | 66,108 | ||||||||||
| % of revenue, excluding fuel surcharge revenue | 2.4% | 2.6% | 2.5% | 2.5% | 2.4% | |||||||||||||||
| % of operating revenue | 2.0% | 2.3% | 2.2% | 2.0% | 2.0% | |||||||||||||||
For the three months ended March 31, 2010, operating taxes and licenses expense decreased $1.0 million, or 7.1%, compared with the same period in 2009. As a percentage of revenue, excluding fuel surcharge revenue, operating taxes and licenses expense decreased to 2.4%, compared with 2.6% for the same period in 2009, because of a reduction in the size of our tractor fleet and a corresponding decrease in vehicle registration costs.
For 2009, operating taxes and licenses expense decreased $10.7 million, or 15.7%, compared with 2008. The decrease resulted from the smaller size of our company tractor fleet. As a percentage of freight revenue, excluding fuel surcharge, operating taxes and licenses expense was relatively consistentyear-over-year.
For 2008, operating taxes and licenses expense increased $1.8 million, or 2.7%, compared with pro forma results for 2007. As a percentage of revenue, excluding fuel surcharge revenue, operating taxes and licenses expense was relatively consistent at 2.5% in 2008 and 2.4% in the 2007 pro forma period.
Interest
Interest expense consists of cash interest, and amortization of related issuance costs and fees, but excludes expenses related to our interest rate swaps.
The following is a summary of actual and pro forma interest expense for the three months ended March 31, 2010 and 2009, and years ended December 31, 2009, 2008, and 2007:
| Three Months Ended | ||||||||||||||||||||
| March 31, | Years Ended December 31, | |||||||||||||||||||
| 2010 | 2009 | 2009 | 2008 | 2007 | ||||||||||||||||
| Actual | Actual | Pro Forma | ||||||||||||||||||
| (Unaudited) | (Unaudited) | |||||||||||||||||||
| (Dollars in thousands) | ||||||||||||||||||||
| Interest expense | $ | 62,596 | $ | 47,702 | $ | 200,512 | $ | 222,177 | $ | 265,745 | ||||||||||
Interest expense for the three months ended March 31, 2010 is primarily based on the debt balance of $1.51 billion for the first lien term loan and $709 million for our senior secured notes, whereas interest in the prior year quarter is primarily based on the debt balance of $1.52 billion for the first lien term loan and $835 million for the senior secured notes. In addition, as of March 31, 2010, we had $162.7 million of capital leases compared with $157.5 million of capital leases at March 31, 2009. As a result of the second amendment
64
Table of Contents
to our existing senior secured credit facility, interest expense increased for the first quarter of 2010 as a result of the addition of a 2.25% LIBOR floor for our existing senior secured credit facility, a 275 basis point increase in applicable margin for our existing senior secured credit facility, and a 50 basis point increase in the unused commitment fee for our revolving line of credit.
Also included in interest expense during the first quarter of 2010 were the fees associated with our 2008 RSA totaling $1.1 million. In the first quarter of 2009, these fees of $1.1 million were included in “Other expense” consistent with the true sale accounting treatment previously applicable to our 2008 RSA. As discussed in Note 14 to the Consolidated Financial Statements, the accounting treatment for our 2008 RSA changed effective January 1, 2010, upon our adoption of Financial Accounting Standards Board Accounting Standards Codification Accounting Standards Update, or ASUNo. 2009-16,“Accounting for Transfers of Financial Assets (Topic 860),” after which we were required to account for our 2008 RSA as a secured borrowing as opposed to a sale, with our 2008 RSA program fees characterized as interest expense.
Interest expense for the year ended December 31, 2009 is primarily based on debt balances of $1.51 billion for the first lien term loan and $799 million for the senior secured notes. In addition, as of December 31, 2009, we had $152.9 million of capital leases. As noted above, as a result of the second amendment to our existing senior secured credit facility, interest expense increased during the fourth quarter of 2009 because of the addition of a 2.25% LIBOR floor for our existing senior secured credit facility, a 275 basis point increase in applicable margin for our existing senior secured credit facility, and a 50 basis point increase in the unused commitment fee for our revolving line of credit. The decrease in interest rates, specifically LIBOR, during 2009 partially offset this increase in interest expense for the year ended December 31, 2009, compared with 2008.
Interest expense for the year ended December 31, 2008 is primarily based on the debt balance of $1.52 billion for our first lien term loan, $835 million for our senior secured notes, and $136.4 million of our capital leases. Also included in interest expense through March 27, 2008 were the fees associated with our prior accounts receivable sale facility, or our 2007 RSA. Subsequent to this facility being amended on March 27, 2008, these fees were included in “Other expense” consistent with the true sale accounting treatment applicable to our amended 2007 RSA. The decrease in interest rates, specifically LIBOR, during 2008 resulted in interest expense decreasing by $43.6 million for the year ended December 31, 2008, when compared with pro forma amounts for 2007.
The pro forma results for the year ended December 31, 2007 represent $180.9 million of actual interest expense, excluding derivative interest expense for Swift Corporation, Swift Transportation, and IEL, plus $94.6 million of pro forma interest expense to reflect the debt related to the 2007 Transactions as if it had been outstanding since January 1, 2007. Also included in interest expense for 2007 were the fees associated with our 2007 RSA.
After this offering, we expect our interest expense to decrease substantially because of lower debt balances and lower applicable margins above LIBOR in our new senior secured credit facility.
Derivative interest
Derivative interest expense consists of expenses related to our interest rate swaps, including the income effect ofmark-to-market adjustments of interest rate swaps and current settlements. We de-designated the remaining swaps and discontinued hedge accounting effective October 1, 2009, as a result of the second amendment to our existing senior secured credit facility, after which the entiremark-to-market adjustment is charged to earnings rather than being recorded in equity as a component of other comprehensive income under previous cash flow hedge accounting treatment. Furthermore, the non-cash amortization of other comprehensive income previously recorded when hedge accounting was in effect is recorded in derivative interest
65
Table of Contents
expense. The following is a summary of actual and pro forma derivative interest expense for the three months ended March 31, 2010 and 2009, and years ended December 31, 2009, 2008, and 2007:
| Three Months Ended | ||||||||||||||||||||
| March 31, | Years Ended December 31, | |||||||||||||||||||
| 2010 | 2009 | 2009 | 2008 | 2007 | ||||||||||||||||
| Actual | Actual | Pro Forma | ||||||||||||||||||
| (Unaudited) | (Unaudited) | |||||||||||||||||||
| (Dollars in thousands) | ||||||||||||||||||||
| Derivative interest expense | $ | 23,714 | $ | 7,549 | $ | 55,634 | $ | 18,699 | $ | 13,056 | ||||||||||
Derivative interest expense for the three months ended March 31, 2010 and 2009 is related to our interest rate swaps with notional amounts of $1.14 billion and $1.20 billion, respectively. Derivative interest expense increased in the three months ended March 31, 2010, over the same period in 2009 as a result of the decrease in three month LIBOR, the underlying index for the swaps, and our cessation of hedge accounting in October 2009, as noted above.
Derivative interest expense for the years ended December 31, 2009, 2008, and 2007 is related to our interest rate swaps with notional amounts of $1.14 billion, $1.22 billion, and $1.34 billion, respectively.
Derivative interest expense increased in 2009 over 2008 as a result of the significant decrease in three month LIBOR.
Derivative interest expense increased in 2008 compared with pro forma derivative interest expense for 2007, as a result of the decrease in three month LIBOR. Pro forma derivative interest expense for 2007 includes the $13.1 million pre-tax charge associated with the change inmark-to-market of derivatives.
Other (income) expense
The following is a summary of actual and pro forma other (income) expense for the three months ended March 31, 2010 and 2009 and the years ended December 31, 2009, 2008, and 2007:
| Three Months Ended | ||||||||||||||||||||
| March 31, | Years Ended December 31, | |||||||||||||||||||
| 2010 | 2009 | 2009 | 2008 | 2007 | ||||||||||||||||
| Actual | Actual | Pro Forma | ||||||||||||||||||
| (Unaudited) | (Unaudited) | |||||||||||||||||||
| (Dollars in thousands) | ||||||||||||||||||||
| Other (income) expense | $ | (371 | ) | $ | 675 | $ | (13,336 | ) | $ | 12,753 | $ | (473 | ) | |||||||
Other (income) expenses were generally immaterial to our results in the three months ended March 31, 2010 and 2009 and are not quantifiable with respect to any major items.
Other (income) expenses improved in the year ended December 31, 2009, as a result of the $4.0 million gain from the sale of our investment in Transplace and $12.5 million in net settlement proceeds received in the third quarter of 2009.
Other (income) expenses for the year ended December 31, 2008 included $6.7 million of closing costs associated with our 2008 RSA, our current accounts receivable securitization facility that was put in place during the third quarter of 2008. Consistent with the true sale accounting treatment applied to our securitization under Topic 860, costs associated with the sale transaction were charged directly to earnings rather than being deferred as in a secured financing arrangement.
The pro forma results for 2007 include a $2.4 million pre-tax impairment of a note receivable recorded to other (income) expense.
66
Table of Contents
Income tax expense
From May 11, 2007 through October 10, 2009, we elected to be treated as a subchapter S corporation under the Internal Revenue Code. A subchapter S corporation passes essentially all taxable income and losses to its stockholders and does not pay federal income taxes at the corporate level. In October 2009, we revoked our subchapter S corporation election and elected to be taxed as a subchapter C corporation. Under subchapter C, we are liable for federal and state corporate income taxes on our taxable income.
The following is a summary of actual and pro forma income tax expense for the three months ended March 31, 2010 and 2009, and years ended December 31, 2009, 2008, and 2007:
| Three Months Ended | ||||||||||||||||||||
| March 31, | Years Ended December 31, | |||||||||||||||||||
| 2010 | 2009 | 2009 | 2008 | 2007 | ||||||||||||||||
| Actual | Actual | Pro Forma | ||||||||||||||||||
| (Unaudited) | (Unaudited) | |||||||||||||||||||
| (Dollars in thousands) | ||||||||||||||||||||
| Income tax expense (benefit) | $ | (9,525 | ) | $ | 301 | $ | 326,650 | $ | 11,368 | $ | (238,893 | ) | ||||||||
For the three months ended March 31, 2010, income tax expense decreased $9.8 million compared with the results for the three months ended March 31, 2009, primarily related to the full period tax treatment as a subchapter C corporation and the realization of a tax benefit for net operating loss carry-forwards to offset taxable income in future periods.
For the year ended December 31, 2009, income tax expense increased $315.3 million compared with 2008. As a result of our subchapter S revocation, we recorded approximately $325 million of income tax expense on October 10, 2009, primarily in recognition of our deferred tax assets and liabilities as a subchapter C corporation.
For the year ended December 31, 2008, income tax expense increased $250.3 million compared with the pro forma results for the year ended December 31, 2007. The pro forma results for the year ended December 31, 2007 include the impact associated with a $230.2 million benefit to eliminate deferred taxes upon our conversion to a subchapter S corporation on May 10, 2007.
Liquidity and Capital Resources
Overview
At March 31, 2010, we had the following sources of liquidity available to us:
| As of March 31, 2010 | ||||
| (Dollars in thousands) | ||||
| Cash and cash equivalents, excluding restricted cash | $ | 87,327 | ||
| Availability under revolving line of credit due 2012 | 235,600 | |||
| Total | $ | 322,927 | ||
Our business requires substantial amounts of cash to cover operating expenses as well as to fund items such as cash capital expenditures on our fleet and other assets, working capital changes, principal and interest payments on our obligations, letters of credit to support insurance requirements, and tax payments to fund our taxes in periods when we generate taxable income.
We also make substantial, net capital expenditures to maintain a modern company tractor fleet, refresh our trailer fleet, and potentially fund growth in our revenue equipment fleet if justified by customer demand and our ability to finance the equipment and generate acceptable returns. After March 31, 2010, we expect our net capital expenditures to be approximately $171 million for the remainder of 2010, assuming all revenue equipment additions are recorded as capital expenditures. However, we expect to continue to obtain a portion
67
Table of Contents
of our equipment under operating leases, which are not reflected as net capital expenditures. Beyond 2010, we expect our net capital expenditures to remain substantial.
We believe we can finance our expected cash needs, including debt repayment, in the short-term with cash flows from operations, borrowings available under our revolving line of credit, borrowings under our 2008 RSA, and lease financing believed to be available for at least the next twelve months. Over the long-term, we will continue to have significant capital requirements, which may require us to seek additional borrowings, lease financing, or equity capital. The availability of financing or equity capital will depend upon our financial condition and results of operations as well as prevailing market conditions. With the infusion of capital from this offering, and the consequent reduction of indebtedness, we will have greater flexibility to use our revolving line of credit to purchase equipment if it becomes economically advantageous to do so.
Cash Flows
Our summary statements of cash flows information for the three months ended March 31, 2010 and 2009 and the years ended December 31, 2009 and 2008 is set forth in the table below:
| Three Months Ended | ||||||||||||||||
| March 31, | Years Ended December 31, | |||||||||||||||
| 2010 | 2009 | 2009 | 2008 | |||||||||||||
| (Unaudited) | ||||||||||||||||
| (Dollars in thousands) | ||||||||||||||||
| Net cash provided by operating activities | $ | 15,107 | $ | 7,376 | $ | 115,335 | $ | 119,740 | ||||||||
| Net cash used in investing activities | $ | (35,131 | ) | $ | (6,661 | ) | $ | (1,127 | ) | $ | (118,517 | ) | ||||
| Net cash used in financing activities and effect of exchange rate changes | $ | (8,511 | ) | $ | (1,825 | ) | $ | (56,262 | ) | $ | (22,133 | ) | ||||
We do not discuss our statements of cash flows information for 2007 because the partial year of operations in 2007 and the approximately $1.4 billion and $2.2 billion, respectively, in cash flows used in investing and cash flows from financing activities relating to our going private transaction in May 2007 limit the usefulness of the comparison.
Operating activities
The $7.7 million increase in net cash provided by operating activities during the first three months ended March 31, 2010, compared with the same period in 2009, was primarily the result of the $11.0 million increase in operating income between the periods, a $20.3 million reduction in claims payments made over the same periods, and an increase in certain payables to third parties for purchased transportation reflecting timing differences in payments between the periods. These increases were partially offset by a $32.2 million increase in cash paid for interest and taxes between the periods, primarily as a result of the increase in coupon under our existing senior secured credit facility following the second amendment to our existing senior secured credit facility and our change in tax filing status during the fourth quarter of 2009.
The $4.4 million decrease in net cash provided by operating activities during the year ended December 31, 2009, compared with the year ended December 31, 2008, primarily was the result of a $17.6 million increase in net cash paid for income taxes and a $13.9 million greater reduction in accounts payable, accrued, and other liabilities during 2009 as compared to 2008. This includes a $5.8 million increase in claims payments made in 2009, reflecting recent settlements of several large automobile liability claims from prior years. These items were mostly offset by a reduction in cash interest payments as a result of the decline in LIBOR.
Investing activities
The $28.5 million increase in net cash used in investing activities during the three months ended March 31, 2010, compared with the three months ended March 31, 2009 results, was driven mainly by a $20.8 million increase in the restricted cash changes. The increase in restricted cash during the 2010 quarter
68
Table of Contents
reflects increased collateral requirements pertaining to our wholly-owned captive insurance subsidiaries, Mohave and Red Rock, both of which insure the first million dollars (per occurrence) of our automobile liability risk beginning on February 1, 2010. To comply with certain state insurance regulatory requirements, we will pay approximately $55 million in cash and cash equivalents to Red Rock and Mohave over the course of 2010, to be restricted as collateral for anticipated losses incurred in 2010. The restricted cash will be used to make payments to cover these losses as they are settled in 2010 and future periods.
The $117.4 million reduction in net cash used in investing activities during the year ended December 31, 2009, compared with the year ended December 31, 2008 results, was driven mainly by a $256.5 million decrease in capital expenditures as a result of our fleet reduction efforts in the face of softening demand, which was partially offset by a $121.4 million decrease in sales proceeds from equipment disposals, as shown in the table below. In addition, restricted cash increased by $6.4 million during the year ended December 31, 2009, after decreasing by $3.6 million in the year ended December 31, 2008. Further, payments received on assets held for sale and equipment sales receivable decreased $8.5 million for the year ended December 31, 2009 compared with the year ended December 31, 2008.
Total net capital expenditures for the three months ended March 31, 2010 and 2009 and for the years ended December 31, 2009 and 2008 are shown below:
| Three Months Ended | Years Ended | |||||||||||||||
| March 31, | December 31, | |||||||||||||||
| 2010 | 2009 | 2009 | 2008 | |||||||||||||
| (Dollars in thousands) | ||||||||||||||||
| Revenue equipment: | ||||||||||||||||
| Tractors | $ | 14,018 | $ | 10,105 | $ | 56,200 | $ | 221,731 | ||||||||
| Trailers | 446 | 1,360 | 8,393 | 93,006 | ||||||||||||
| Facilities | 2,394 | 1,012 | 6,152 | 12,121 | ||||||||||||
| Other | 297 | 74 | 520 | 867 | ||||||||||||
| Total cash capital expenditures | 17,155 | 12,551 | 71,265 | 327,725 | ||||||||||||
| Less: Proceeds from sales of equipment | 4,684 | 2,381 | 69,773 | 191,151 | ||||||||||||
| Net cash capital expenditures | $ | 12,471 | $ | 10,170 | $ | 1,492 | $ | 136,574 | ||||||||
Financing activities
Net cash used in financing activities increased by $6.7 million in the three months ended March 31, 2010, as compared with the three months ended March 31, 2009. This increase reflects a $3.8 million increase in payments on our short-term notes payable, long-term debt, and capital lease obligations, partially offset by a $2.0 million net increase in our borrowing under our accounts receivable securitization during the three months ended March 31, 2010, which is now reflected as a financing activity given the accounting treatment as a secured borrowing. Further, the three months ended March 31, 2009 included $4.9 million of proceeds received from capital leases that were funded to us on the last day of the quarter, but not yet remitted to the manufacturer for equipment purchases.
In the year ended December 31, 2009, cash used in financing activities increased by $34.0 million compared with the year ended December 31, 2008. This increased usage reflects an increase of $14.2 million in payments made on our long-term debt, notes payable, and capital leases, an increase of $11.0 million in payment of deferred loan costs resulting from the second amendment to our existing senior secured credit facility and indenture amendments, and $6.2 million of payments made in 2009 on short-term notes payable, which had financed a portion of our insurance premiums in 2009. In the year ended December 31, 2008, we had net repayments of $16.6 million on capital leases and long-term debt.
Capital and Operating Leases
In addition to the net cash capital expenditures discussed above, we also acquired revenue equipment with capital and operating leases. During the three months ended March 31, 2010, we acquired tractors through capital
69
Table of Contents
and operating leases with gross values of $15.2 million and $5.1 million, respectively, which were offset by operating lease terminations with originating values of $9.1 million for tractors in the first quarter of 2010. During the quarter ended March 31, 2009, we acquired tractors through capital and operating leases with gross values of $21.0 million and $7.4 million, respectively, which were offset by operating lease terminations with originating values of $7.4 million for tractors in the three months ended March 31, 2009. In addition, $22.5 million of trailer leases expired in the three months ended March 31, 2010, while no trailer leases expired in the three months ended March 31, 2009.
During the year ended December 31, 2009, we acquired tractors through capital and operating leases with gross values, net of down payments, of $36.8 million and $45.6 million, respectively, which were offset by operating lease terminations with original values of $50.9 million for tractors in 2009. During the year ended December 31, 2008, we acquired tractors through capital and operating leases with gross values of $81.3 million and $104.1 million, respectively, which were offset by operating lease terminations with originating values of $83.2 million for tractors in 2008.
Working Capital
As of March 31, 2010, we had a working capital surplus of $101.1 million, which was an increase of $117.6 million from December 31, 2009. The increase primarily resulted from the change in accounting treatment for our 2008 RSA. The accounting treatment for our 2008 RSA changed effective January 1, 2010, upon our adoption of ASUNo. 2009-16, at which time we were required to account for our 2008 RSA as a secured borrowing rather than a sale. As a result, the previously de-recognized accounts receivable were brought back onto our balance sheet as current assets and the related securitization proceeds were recognized as non-current debt because of the terms of our accounts receivable securitization facility.
As of December 31, 2009 and 2008, we had a working capital deficit of $16.5 million and $170.6 million, respectively. The deficit primarily resulted from our accounts receivable securitization program. In 2007, the initial securitization proceeds totaling $200 million were used to repay principal on the first lien term loan, the majority of which was applied to the non-current portion of the first lien term loan. The result was to reduce our current assets and a long-term liability, resulting in a reduction of working capital. In addition, the $154.1 million reduction in the working capital deficit during the year ended December 31, 2009 reflects a $64.4 million increase in cash and restricted cash primarily relating to cash provided by operations as discussed above, a $49.0 million increase in deferred tax assets reflecting our conversion to a subchapter C corporation in the fourth quarter of 2009, and a $95.0 million decrease in accounts payable, accrued claims, and other accrued liabilities. These improvements were offset, in part, by a $20.2 million increase in the current portion of the interest rate swap liability resulting from the decrease in LIBOR during 2009, as well as an $18.6 million increase in the current portion of long-term debt and capital lease obligations.
Material Debt Agreements
Overview
As of March 31, 2010, we had the following material debt agreements:
| • | existing senior secured credit facility consisting of a term loan due May 2014, a revolving line of credit due May 2012 (none drawn), and a synthetic letter of credit facility due May 2014; | |
| • | senior secured floating rate notes due May 2015; | |
| • | senior secured fixed rate notes due May 2017; | |
| • | 2008 RSA due July 2013; and | |
| • | other secured indebtedness and capital lease agreements. |
70
Table of Contents
The amounts outstanding under such agreements and other debt instruments were as follows as of March 31, 2010 and December 31, 2009:
| March 31, | December 31, | |||||||
| 2010 | 2009 | |||||||
| (In thousands) | ||||||||
| First lien term loan due May 2014 | $ | 1,507,100 | $ | 1,511,400 | ||||
| Senior secured floating rate notes due May 15, 2015 | 203,600 | 203,600 | ||||||
| Senior secured fixed rate notes due May 15, 2017 | 505,648 | 595,000 | ||||||
| 2008 RSA | 150,000 | — | ||||||
| Other secured debt and capital leases | 165,833 | 156,934 | ||||||
| Total long-term debt and capital leases | $ | 2,532,181 | $ | 2,466,934 | ||||
| Less: current portion | 56,369 | 46,754 | ||||||
| Long-term debt and capital leases, less current portion | $ | 2,475,812 | $ | 2,420,180 | ||||
Our existing senior secured credit facility and senior secured notes are secured by substantially all of our assets other than the stock of our captive insurance companies, bankruptcy-remote subsidiary used to conduct our accounts receivable securitization, our accounts receivable, and the stock of our foreign subsidiaries. All of these agreements contain financial and other covenants and cross-default provisions, such that a default under one agreement would create a default under the other agreements. We were in compliance with the covenants under all of such agreements at March 31, 2010 and December 31, 2009.
Existing senior secured credit facility
Our existing senior secured credit facility consists of a first lien term loan with an original aggregate principal amount of $1.72 billion due May 2014, a $300.0 million revolving line of credit due May 2012, and a $150.0 million synthetic letter of credit facility due May 2014. Principal payments on the first lien term loan are due quarterly in amounts equal to (i) 0.25% of the original aggregate principal outstanding beginning September 30, 2007 to September 30, 2013, and (ii) 23.5% of the original aggregate principal outstanding from December 31, 2013 through its maturity, with the balance due on the maturity date. In July 2007, we used $200.0 million of proceeds from our 2007 RSA to prepay the first eight principal payments, with the balance being applied to the last payment. This reduced the aggregate principal to $1.52 billion as of July 2007. As of March 31, 2010, there was $1.51 billion outstanding under the first lien term loan. In April 2010, we made an $18.7 million payment on the first lien term loan out of excess cash flows for the prior fiscal year. This payment was applied in full satisfaction of the next four scheduled principal payments and partial satisfaction of the fifth successive principal payment due June 30, 2011.
As of March 31, 2010, there were no borrowings under our $300.0 million revolving line of credit. The unused portion of our revolving line of credit is subject to a commitment fee of 1.00%. As of March 31, 2010, we had outstanding letters of credit under the revolving line of credit primarily for workers’ compensation and self-insurance liability purposes totaling $64.4 million, leaving $235.6 million available under the revolving line of credit. The revolving line of credit also includes capacity for letters of credit up to $175.0 million.
Similar to the letters of credit under our $300.0 million revolving line of credit, the outstanding letters of credit pursuant to the $150.0 million synthetic letter of credit facility are primarily for workers’ compensation and self-insurance liability purposes. As of March 31, 2010, the $150.0 million synthetic letter of credit facility was fully utilized.
Interest on the first lien term loan and the outstanding borrowings under our revolving line of credit are based upon one of two rate options plus an applicable margin. The base rate is equal to LIBOR, or the higher of the prime rate published in the Wall Street Journal and the Federal Funds Rate in effect plus 0.50% to 1.00%. Following the second amendment to our existing senior secured credit facility, LIBOR option loans are subject to the LIBOR floor at 2.25% and alternate base rate option loans are subject to a 3.25% minimum alternate base rate option. We may select the interest rate option at the time of borrowing. The applicable
71
Table of Contents
margins for the interest rate options range from 4.50% to 6.00%, depending on the credit rating assigned by S&P and Moody’s. Interest on the first lien term loan and outstanding borrowings under the revolving line of credit is payable on the stated maturity of each loan, on the date of principal prepayment, if any, with respect to base rate loans, on the last day of each calendar quarter, and with respect to LIBOR rate loans, on the last day of each interest period. As of March 31, 2010, interest accrues at the greater of LIBOR or the LIBOR floor plus 6.00% (8.25% at March 31, 2010).
Our existing senior secured credit facility contains various financial and other covenants, including but not limited to required minimum liquidity, limitations on indebtedness, liens, asset sales, transactions with affiliates, and required leverage and interest coverage ratios. In addition, our existing senior secured credit facility contains a cross default provision, which provides that a default under the indentures governing our senior secured notes and our 2008 RSA would trigger an event of default under our existing senior secured credit facility. As of March 31, 2010, we were in compliance with these covenants.
New senior secured credit facility
In connection with this offering, Swift Transportation intends to enter into a new senior secured credit facility consisting of a $ million senior secured revolving credit facility and a $ million senior secured term loan. The proceeds of the new term loan will be used to repay the portion of our existing senior secured credit facility that is not repaid with the proceeds of this offering. We expect the new senior secured credit facility to be completed substantially concurrently with the closing of this offering. Our entry into the new senior secured credit facility is conditioned on the completion of this offering.
Senior secured notes
On May 10, 2007, we completed a private placement of second-priority senior secured notes associated with the acquisition of Swift Transportation totaling $835.0 million, which consisted of: $240 million aggregate principal amount second-priority senior secured floating rate notes due May 15, 2015, and $595 million aggregate principal amount of 12.50% second-priority senior secured fixed rate notes due May 15, 2017.
Interest on the senior secured floating rate notes is payable on February 15, May 15, August 15, and November 15, accruing at three-month LIBOR plus 7.75% (8.00% at March 31, 2010). Once our existing senior secured credit facility is paid in full, we may redeem any of the senior secured floating rate notes on any interest payment date at a redemption price of 101% through 2010.
Interest on the 12.50% senior secured fixed rate notes is payable on May 15 and November 15. Once our existing senior secured credit facility is paid in full, on or after May 15, 2012, we may redeem the senior secured fixed rate notes at an initial redemption price of 106.25% of their principal amount and accrued interest.
During the year ended December 31, 2009, Mr. Moyes, our Chief Executive Officer and majority stockholder, purchased $36.4 million face value senior secured floating rate notes and $89.4 million face value senior secured fixed rate notes in open market transactions. In connection with the second amendment to our existing senior secured credit facility, Mr. Moyes agreed to cancel his personally held senior secured notes in return for a $325.0 million reduction of the stockholder loan due 2018 owed to us by Mr. Moyes and the Moyes Affiliates, each of whom is a stockholder of Swift. The senior secured floating rate notes held by Mr. Moyes, totaling $36.4 million in principal amount, were cancelled at closing of the second amendment to our existing senior secured credit facility on October 13, 2009, and, correspondingly, the stockholder loan was reduced by $94.0 million. The senior secured fixed rate notes held by Mr. Moyes, totaling $89.4 million in principal amount, were cancelled in January 2010 and the stockholder loan was reduced further by an additional $231.0 million. The amount of the stockholder loan cancelled in exchange for the contribution of senior secured notes was negotiated by Mr. Moyes with the steering committee of lenders, comprised of a number of the largest lenders (by holding size) and the administrative agent of our existing senior secured
72
Table of Contents
credit facility. The cancellation of the senior secured notes reduced stockholders’ deficit by $36.4 million in October 2009 and $89.4 million in January 2010.
The indentures governing the senior secured notes contain various financial and other covenants, including but not limited to limitations on asset sales, incurrence of indebtedness, and entering into sales and leaseback transactions. As of March 31, 2010, we were in compliance with these covenants. In addition, the indentures governing the senior secured notes contain a cross default provision which provides that a default under such indentures would trigger termination rights under our existing senior secured credit facility and the indenture governing our 2008 RSA. The indentures for the senior secured notes include a limit on future indebtedness if a minimum fixed charge coverage ratio, as defined therein, is not met. We currently do not meet that minimum requirement and cannot incur additional debt in excess of that specified in the indentures, including the limit for outstanding capital lease obligations of $212.5 million for 2010 and $250.0 million thereafter.
An intercreditor agreement among the first lien agent for our existing senior secured credit facility, the trustee of the senior secured notes, Swift Corporation, and certain of our subsidiaries establishes the second-priority status of the senior secured notes and contains restrictions and agreements with respect to the control of remedies, release of collateral, amendments to security documents, and the rights of holders of first priority lien obligations and holders of the senior secured notes.
Derivative Financial Instruments
We are exposed to certain risks relating to our ongoing business operations. The primary risk managed by using derivative instruments is interest rate risk. In 2007, we entered into several interest rate swap agreements for the purpose of hedging variability of interest expense and interest payments on long-term variable rate debt and our senior secured notes. Our strategy was to use pay-fixed/receive-variable interest rate swaps to reduce our aggregate exposure to interest rate risk. These derivative instruments were not entered into for speculative purposes, but were required by our senior secured credit facility lenders in connection with the 2007 Transactions.
In connection with our existing senior secured credit facility, we had four interest rate swap agreements in effect at March 31, 2010, with a total notional amount of $1.14 billion. Of this amount, $305.0 million mature in August 2010, with the remainder to mature in August 2012. At October 1, 2007, we designated and qualified these interest rate swaps as cash flow hedges. Subsequent to October 1, 2007, the effective portion of the changes in fair value of the designated swaps was recorded in accumulated other comprehensive income (loss) and is thereafter recognized to derivative interest expense as the interest on the hedged variable rate debt affects earnings. The ineffective portions of the changes in the fair value of designated interest rate swaps were recognized directly to earnings as derivative interest expense in our statements of operations. At March 31, 2010 and December 31, 2009, unrealized losses on changes in fair value of the designated interest rate swap agreements totaling $43.1 million and $54.1 million, after taxes, respectively, were reflected in accumulated other comprehensive income. As of March 31, 2010, we estimate that $27.7 million of unrealized losses included in accumulated other comprehensive income will be realized and reported in earnings within the next twelve months.
Prior to the second amendment to our existing senior secured credit facility, these interest rate swap agreements had been highly effective as a hedge of our variable rate debt. However, following the implementation of the 2.25% LIBOR floor for our existing senior secured credit facility pursuant to the second amendment to our existing senior secured credit facility, the interest rate swaps no longer qualify as highly effective in offsetting changes in the interest payments on long-term variable rate debt. Consequently, we removed the hedging designation and ceased cash flow hedge accounting treatment for the swaps effective October 1, 2009. As a result, all of the ongoing changes in fair value of the interest rate swaps are now recorded as derivative interest expense in earnings, whereas the majority of changes in fair value had previously been recorded in other comprehensive income under cash flow hedge accounting. The cumulative change in fair value of the swaps, which occurred prior to the cessation in hedge accounting, remains in accumulated other comprehensive income and is amortized to earnings as derivative interest expense in current and future periods as the interest payments on the first lien term loan affect earnings. In conjunction with the
73
Table of Contents
contemplated refinancing of our existing senior secured credit facility, we are evaluating various alternatives to terminate some or all of the remaining interest rate swap contracts as they are no longer expected to provide an economic hedge in the near term.
The fair value of the interest rate swap liability at March 31, 2010 and December 31, 2009, was $79.4 million and $80.3 million, respectively. The fair values of the interest rate swaps are based on valuations provided by third parties, derivative pricing models, and credit spreads derived from the trading levels of our first lien term loan.
2008 RSA
On July 30, 2008, through our wholly-owned bankruptcy-remote special purpose subsidiary, we entered into our 2008 RSA to replace our prior accounts receivable sale facility and to sell, on a revolving basis, undivided interests in our accounts receivable. The program limit under our 2008 RSA is $210.0 million and is subject to eligible receivables and reserve requirements. Outstanding balances under our 2008 RSA accrue interest at a yield of LIBOR plus 300 basis points or Prime plus 200 basis points, at our discretion. Our 2008 RSA terminates on July 30, 2013, and is subject to an unused commitment fee ranging from 25 to 50 basis points, depending on the aggregate unused commitment of our 2008 RSA.
As of January 1, 2010, our 2008 RSA no longer qualified for true sale accounting treatment and is now instead treated as a secured borrowing. As a result, the previously de-recognized accounts receivable were brought back onto our balance sheet and the related securitization proceeds were recognized as debt, while the program fees for the facility were reported as interest expense beginning January 1, 2010. The re-characterization of program fees from other expense to interest expense did not affect our interest coverage ratio calculation, and the change in accounting treatment for the securitization proceeds from sales proceeds to debt did not affect the leverage ratio calculation, as defined in our existing senior secured credit facility, as amended.
Our 2008 RSA contains certain restrictions and provisions (including cross-default provisions to our debt agreements) which, if not met, could restrict our ability to borrow against future eligible receivables. The inability to borrow against additional receivables would reduce liquidity as the daily proceeds from collections on the receivables levered prior to termination are remitted to the lenders, with no further reinvestment of these funds by our lenders into Swift. As of March 31, 2010, the amount outstanding under our 2008 RSA was $150.0 million.
Off-Balance Sheet Arrangements
Operating leases
We lease approximately 4,400 tractors under operating leases. Operating leases have been an important source of financing for our revenue equipment. Tractors held under operating leases are not carried on our consolidated balance sheets, and lease payments in respect of such tractors are reflected in our consolidated statements of operations in the line item “Rental expense.” Our revenue equipment rental expense was $18.9 million in the first quarter of 2010, compared with $20.4 million in the first quarter of 2009. The total amount of remaining payments under operating leases as of March 31, 2010, was approximately $130.1 million. In connection with various operating leases, we issued residual value guarantees, which provide that if we do not purchase the leased equipment from the lessor at the end of the lease term, we are liable to the lessor for an amount equal to the shortage (if any) between the proceeds from the sale of the equipment and an agreed value. As of December 31, 2009, the maximum amount of the residual value guarantees was approximately $18.7 million. To the extent the expected value at the lease termination date is lower than the residual value guarantee, we would accrue for the difference over the remaining lease term. We believe that proceeds from the sale of equipment under operating leases would exceed the payment obligation on substantially all operating leases.
74
Table of Contents
Accounts receivable sale facility
We securitize our accounts receivable through a special purpose subsidiary not carried on our balance sheet at December 31, 2009. We were required to cease the off-balance sheet accounting treatment for our 2008 RSA effective January 1, 2010, upon adoption of ASUNo. 2009-16, and have brought the previously de-recognized accounts receivable back onto our balance sheet, recognizing the related securitization proceeds as debt.
Contractual Obligations
The table below summarizes our contractual obligations as of December 31, 2009 (in thousands):
| Payments due by period(5) | ||||||||||||||||||||
| Less Than | More Than | |||||||||||||||||||
| 1 Year | 1-3 Years | 3-5 Years | 5 Years | Total | ||||||||||||||||
| Long-term debt obligations | $ | 19,054 | $ | 36,079 | $ | 1,460,316 | $ | 798,600 | $ | 2,314,049 | ||||||||||
| Capital lease obligations(1) | 27,700 | 91,136 | 34,049 | — | 152,885 | |||||||||||||||
| Operating lease obligations(2) | 64,724 | 61,263 | 6,426 | 1,154 | 133,567 | |||||||||||||||
| Purchase obligations(3) | 149,140 | — | — | — | 149,140 | |||||||||||||||
| Other long-term liabilities: | ||||||||||||||||||||
| Interest rate swaps(4) | 48,819 | 38,793 | — | — | 87,612 | |||||||||||||||
| Total contractual obligations | $ | 309,437 | $ | 227,271 | $ | 1,500,791 | $ | 799,754 | $ | 2,837,253 | ||||||||||
| (1) | Represents principal payments owed at December 31, 2009. The borrowing consists of capital leases with finance companies, with fixed borrowing amounts and fixed interest rates, as set forth on each applicable lease schedule. Accordingly, interest on each lease varies between schedules. | |
| (2) | Represents future monthly rental payment obligations under operating leases for tractors, trailers, chassis, and facilities. Substantially all lease agreements for revenue equipment have fixed payment terms based on the passage of time. The tractor lease agreements generally stipulate maximum miles and provide for mileage penalties for excess miles. These leases generally run for a period of three to five years for tractors and five to seven years for trailers. We also have guarantee obligations of residual values under certain operating leases, which obligations are not included in the amounts presented. Upon termination of these leases, we would be responsible for the excess of the guarantee amount above the fair market value of the equipment, if any. As of December 31, 2009, the maximum potential amount of future payments we could be required to make under these guarantees is $18.7 million. | |
| (3) | Represents purchase obligations for revenue equipment, fuel, and facilities. The portion associated with revenue equipment purchase obligations consists of $146.1 million. We generally have the option to cancel tractor purchase orders with 90 days’ notice. As of December 31, 2009, approximately one-third of this amount had become non-cancelable. | |
| (4) | Represents interest rate swap payments that are undiscounted and projected based on LIBOR forward rates as of December 31, 2009. | |
| (5) | Deferred taxes and long-term portion of claims accruals are excluded from other long-term liabilities in the table above. |
Inflation
Inflation can have an impact on our operating costs. A prolonged period of inflation could cause interest rates, fuel, wages, and other costs to increase, which would adversely affect our results of operations unless freight rates correspondingly increased. However, with the exception of fuel, the effect of inflation has been minor over the past three years. Our average fuel cost per gallon has increased 33.5% between the three months ended March 31, 2009 and 2010. Our average fuel cost per gallon decreased 37.9% between 2008 and
75
Table of Contents
2009 after increasing 26.8% between 2007 and 2008. Historically, the majority of the increase in fuel costs has been passed on to our customers through a corresponding increase in fuel surcharge revenue, making the impact of the increased fuel costs on our operating results less severe. If fuel costs escalate and we are unable to recover these costs timely with effective fuel surcharges, it would have an adverse effect on our operation and profitability.
Seasonality
In the transportation industry, results of operations generally show a seasonal pattern. As our customers ramp up for the holiday season at year-end, the late third and fourth quarters historically have been our strongest volume quarters. As our customers reduce shipments after the winter holiday season, the first quarter historically has been a lower volume quarter. In 2007 and 2008, the traditional surge in volume in the third and fourth quarters did not occur due to the economic recession, while the 2009 holiday season showed some improvement due largely to inventory replenishment by retailers. Additionally, our operating expenses tend to be higher in the winter months primarily due to colder weather, which causes higher fuel consumption from increased idle time.
Quantitative and Qualitative Disclosures About Market Risk
We have interest rate exposure arising from our existing senior secured credit facility, senior secured floating rate notes, 2008 RSA, and other financing agreements, which have variable interest rates. These variable interest rates are impacted by changes in short-term interest rates, although the volatility related to the first lien term loan and revolving line of credit is mitigated due to the implementation of a 2.25% LIBOR floor on our existing senior secured credit facility as a result of the second amendment to our existing senior secured credit facility. We manage interest rate exposure through a mix of variable rate debt, fixed rate lease financing, and a $1.14 billion notional amount of interest rate swaps (weighted average rate of 5.02% before the applicable margin). There are no leverage options or prepayment features for the interest rate swaps. Assuming the current level of borrowings, a hypothetical one-percentage point increase in interest rates would decrease our annual interest expense by $7.8 million, including interest rate swap settlements, as a result of the combined effect of the LIBOR floor and the interest rate swaps. At March 31, 2010, we had outstanding approximately $723.7 million of variable rate borrowings that were not subject to interest rate swaps, $370.1 million of which represents the term loan and is subject to the LIBOR floor. On a pro forma basis, assuming the repayment of $ in term loan debt with the proceeds of this offering, our outstanding variable rate borrowing would have been approximately $ as of March 31, 2010. Based on such pro forma amounts outstanding, a hypothetical one-percentage point increase in interest rates would increase our annual interest expense by $ million.
We have commodity exposure with respect to fuel used in company-owned tractors. Further increases in fuel prices will continue to raise our operating costs, even after applying fuel surcharge revenue. Historically, we have been able to recover a majority of fuel price increases from our customers in the form of fuel surcharges. The average diesel price per gallon in the United States, as reported by the Department of Energy, rose from an average of $2.19 per gallon for the three months ended March 31, 2009 to an average of $2.85 per gallon for the three months ended March 31, 2010. We cannot predict the extent or speed of potential changes in fuel price levels in the future, the degree to which the lag effect of our fuel surcharge programs will impact us as a result of the timing and magnitude of such changes, or the extent to which effective fuel surcharges can be maintained and collected to offset such increases. We generally have not used derivative financial instruments to hedge our fuel price exposure in the past, but continue to evaluate this possibility.
Critical Accounting Policies
The preparation of our consolidated financial statements in conformity with GAAP requires us to make estimates and assumptions that impact the amounts reported in our consolidated financial statements and accompanying notes. Therefore, the reported amounts of assets, liabilities, revenue, expenses, and associated disclosures of contingent assets and liabilities are affected by these estimates and assumptions. We evaluate
76
Table of Contents
these estimates and assumptions on an ongoing basis, utilizing historical experience, consultation with experts, and other methods considered reasonable in the particular circumstances. Nevertheless, actual results may differ significantly from our estimates and assumptions, and it is possible that materially different amounts will be reported using differing estimates or assumptions. We consider our critical accounting policies to be those that require us to make more significant judgments and estimates when we prepare our financial statements. Our critical accounting policies include the following:
Claims accruals
We are self-insured for a portion of our liability, workers’ compensation, property damage, cargo damage, and employee medical expense risk. This self-insurance results from buying insurance coverage that applies in excess of a retained portion of risk for each respective line of coverage. Each reporting period, we accrue the cost of the uninsured portion of pending claims. These accruals are estimated based on our evaluation of the nature and severity of individual claims and an estimate of future claims development based upon historical claims development trends. Insurance and claims expense will vary as a percentage of operating revenue from period to period based on the frequency and severity of claims incurred in a given period as well as changes in claims development trends. Actual settlement of the self-insured claim liabilities could differ from our estimates due to a number of uncertainties, including evaluation of severity, legal cost, and claims that have been incurred but not reported. If claims development factors that are based upon historical experience had increased by 10%, our claims accrual as of March 31, 2010 would have potentially increased by $13.1 million.
Goodwill
We have recorded goodwill, which primarily arose from the partial acquisition of Swift Transportation. Goodwill represents the excess of the purchase price over the fair value of net assets acquired. In accordance with Topic 350,“Intangibles — Goodwill and Other,” we test goodwill for potential impairment annually as of November 30 and between annual tests if an event occurs or circumstances change that would more likely than not reduce the fair value of a reporting unit below its carrying amount.
As of November 30, 2009, we evaluated goodwill for impairment using the two-step process prescribed in Topic 350. The first step is to identify potential impairment by comparing the fair value of a reporting unit with the book value, including goodwill. If the fair value of a reporting unit exceeds the book value, goodwill is not considered impaired. If the book value exceeds the fair value, the second step of the process is performed to measure the amount of impairment. Our test of goodwill and indefinite-lived intangible assets requires judgment, including the identification of reporting units, assigning assets (including goodwill) and liabilities to reporting units, and determining the fair value of each reporting unit. For determining fair value as of November 30, 2009, we used a combination of comparative valuation multiples of publicly traded companies and a discounted cash flow model. The discounted cash flow model included several significant assumptions, including estimating future cash flows and determining appropriate discount rates. Changes in these estimates and assumptions could materially affect the determination of fair valueand/or goodwill impairment for each reporting unit. Our evaluation as of November 30, 2009 produced no indication of impairment of goodwill or indefinite-lived intangible assets. Based on our analysis, none of our reporting units was at risk of failing step one of the test.
Based on the results of our evaluation as of November 30, 2008, we recorded a non-cash impairment charge of $17.0 million with no tax impact in the fourth quarter of 2008 related to the decline in fair value of our Mexico freight transportation reporting unit resulting from the deterioration in truckload industry conditions as compared with the estimates and assumptions used in our original valuation projections used at the time of the partial acquisition of Swift Transportation. This charge is included in impairments in the consolidated statements of operations for the year ended December 31, 2008. The annual impairment test performed as of November 30, 2008, indicated no additional impairments for goodwill or indefinite-lived intangible assets at our other reporting units.
Based on the results of our evaluation as of November 30, 2007, we recorded a non-cash impairment charge of $238 million with no tax impact in the fourth quarter of 2007 related to the decline in fair value of
77
Table of Contents
our U.S. freight transportation reporting unit resulting from the deterioration in truckload industry conditions as compared with the estimates and assumptions used in our original valuation projections used at the time of the partial acquisition of Swift Transportation. These charges are included in impairments in our consolidated statements of operations.
Revenue recognition
We recognize operating revenue and related direct costs to recognizing revenue as of the date the freight is delivered, which is consistent with Topic605-20-25-13,“Services forFreight-in-Transit at the End of a Reporting Period.”
We recognize revenue from leasing tractors and related equipment to owner-operators as operating leases. Therefore, revenue for rental operations are recognized on the straight-line basis as earned under the operating lease agreements. Losses from lease defaults are recognized as an offset to revenue in the amount of earned, but not collected, revenue.
Depreciation and amortization
Depreciation on property and equipment is calculated on the straight-line method over the estimated useful lives of 10 to 40 years for facilities and improvements, 3 to 15 years for revenue and service equipment, and 3 to 5 years for software, furniture, and office equipment.
Amortization of the customer relationships acquired in the acquisition of Swift Transportation is calculated on the 150% declining balance method over the estimated useful life of 15 years. The customer relationships contributed to us at May 9, 2007 are amortized using the straight-line method over 15 years. The owner-operator relationships are amortized using the straight-line method over three years. The trade name has an indefinite useful life and is not amortized, but rather is tested for impairment annually on November 30, unless events occur or circumstances change between annual tests that would more likely than not reduce the fair value.
Impairments of long-lived assets
We evaluate our long-lived assets, including property and equipment, and certain intangible assets subject to amortization for impairment whenever events or changes in circumstances indicate that the carrying amount of an asset may not be recoverable in accordance with Topic 360 and Topic 350, respectively. If circumstances require a long-lived asset be tested for possible impairment, we compare undiscounted cash flows expected to be generated by an asset to the carrying value of the asset. If the carrying value of the long-lived asset is not recoverable on an undiscounted cash flow basis, impairment is recognized to the extent that the carrying value exceeds its fair value. Fair value is determined through various valuation techniques including discounted cash flow models, quoted market values, and third-party independent appraisals, as necessary.
During the first quarter of 2010, revenue equipment with a carrying amount of $3.6 million was written down to its fair value of $2.3 million, resulting in an impairment charge of $1.3 million, which was included in impairments in the consolidated statement of operations for the three months ended March 31, 2010. The impairment of these assets was identified due to our decision to remove them from the operating fleet through sale or salvage.
In the first quarter of 2009, we recorded impairment charges related to real estate properties totaling $0.5 million before taxes. In the third and fourth quarter of 2008, we recorded impairment charges totaling $7.5 million, before taxes, related to real estate properties, tractors, trailers, and a note receivable from our sale of our Volvo truck delivery business assets in 2006. In the third and fourth quarters of 2007, we recorded impairment charges related to certain trailers totaling $18.3 million before taxes. These charges are included in impairments in the consolidated statements of operations.
Goodwill and indefinite-lived intangible assets are reviewed for impairment at least annually in accordance with the provisions of Topic 350 as noted under the heading “Goodwill” above.
78
Table of Contents
Taxes
Our deferred tax assets and liabilities represent items that will result in taxable income or a tax deduction in future years for which we have already recorded the related tax expense or benefit in our consolidated statements of operations. Deferred tax accounts arise as a result of timing differences between when items are recognized in our consolidated financial statements compared to when they are recognized in our tax returns. Significant management judgment is required in determining our provision for income taxes and in determining whether deferred tax assets will be realized in full or in part. Deferred tax assets and liabilities are measured using enacted tax rates expected to apply to taxable income in the years in which those temporary differences are expected to be recovered or settled. We periodically assess the likelihood that all or some portion of deferred tax assets will be recovered from future taxable income. To the extent we believe recovery is not probable, a valuation allowance is established for the amount determined not to be realizable. We have not recorded a valuation allowance at March 31, 2010, as all deferred tax assets are more likely than not to be realized as they are expected to be utilized by the reversal of the existing deferred tax liabilities in future periods.
We believe that we have adequately provided for our future tax consequences based upon current facts and circumstances and current tax law. However, should our tax positions be challenged, different outcomes could result and have a significant impact on the amounts reported through our consolidated statements of operations.
Lease accounting and off-balance sheet transactions
In accordance with Topic 840,“Leases,” property and equipment held under operating leases, and liabilities related thereto, are not reflected on our balance sheet. All expenses related to operating leases are reflected on our consolidated statements of operations in the line item entitled “Rental expense.”
We issue residual value guarantees in connection with certain of our operating leases of certain revenue equipment. If we do not purchase the leased equipment from the lessor at the end of the lease term, we are liable to the lessor for an amount equal to the shortage (if any) between the proceeds from the sale of the equipment and an agreed value up to a maximum shortfall per unit. For substantially all of these tractors, we have residual value agreements from manufacturers at amounts equal to our residual obligation to the lessors. For all other equipment (or to the extent we believe any manufacturer will refuse or be unable to meet its obligation), we are required to recognize additional rental expense to the extent we believe the fair market value at the lease termination will be less than our obligation to the lessor. We believe that proceeds from the sale of equipment under operating leases would exceed the payment obligation on substantially all operating leases. The estimated values at lease termination involve management judgments. As of March 31, 2010, the maximum potential amount of future payments we would be required to make under these guarantees is $17.8 million. In addition, as leases are entered into, determination as to the classification as an operating or capital lease involves management judgments on residual values and useful lives.
Stock-based employee compensation
We issue several types of share-based compensation, including awards that vest based on service and performance conditions or a combination of the conditions. Performance-based awards vest contingent upon meeting certain performance criteria established by our compensation committee. All awards require future service and thus forfeitures are estimated based on historical forfeitures and the remaining term until the related award vests. We adopted Topic 718,“Compensation — Stock Compensation,”using the modified prospective method. This Topic requires that all share-based payments to employees, including grants of employee stock options, be recognized in the financial statements based upon a grant-date fair value of an award. Determining the appropriate amount to expense in each period is based on likelihood and timing of achievement of the stated targets for performance-based awards, and requires judgment, including forecasting future financial results and market performance. The estimates are revised periodically based on the probability and timing of achieving the required performance targets, respectively, and adjustments are made as appropriate. Awards that only are subject to time-vesting provisions are amortized using the straight-line
79
Table of Contents
method. In the future, we may make market-based awards that will vest contingent upon meeting certain market criteria established by our compensation committee.
We currently have stock options outstanding that lack exercisability pursuant to our 2007 equity incentive plan. These options become exercisable simultaneously with the closing of the earlier of (i) an initial public offering, (ii) a sale, or (iii) a change in control of Swift. Included in these outstanding stock options are 1.8 million stock options we granted to certain employees on February 25, 2010 with an exercise price of $7.04 per share, which equaled the estimated fair value of our common stock as determined by an independent business valuation. We expect that our salaries, wages, and employee benefits expense will increase for the quarter in which this offering becomes effective as a result of non-cash equity compensation expense for equity grants that vest and are then exercisable upon an initial public offering. Assuming the consummation of this offering, we anticipate that stock compensation expense immediately recognized will be approximately $16.4 million.
Segment information
We have one reportable segment under the provisions of Topic 280,“Segment Reporting.” Each of our transportation service offerings and operations that meet the quantitative threshold requirements of Topic 280 provides truckload transportation services that have been aggregated as they have similar economic characteristics and meet the other aggregation criteria of Topic 280. Accordingly, we have not presented separate financial information for each of our service offerings and operations as the consolidated financial statements present our one reportable segment. We generate other revenue through operations that provide freight brokerage as well as intermodal services. These operations do not meet the quantitative threshold of Topic 280.
Recent Accounting Pronouncements
In January 2010, the Financial Accounting Standards Board issued Accounting Standards UpdateNo. 2010-06,“Fair Value Measurements and Disclosures (Topic 820) — Improving Disclosures about Fair Value Measurements,” or ASU No. 2010-06. This Accounting Standards Update amends the Financial Accounting Standards Board Accounting Standards Codification Topic 820 to require entities to provide new disclosures and clarify existing disclosures relating to fair-value measurements. New disclosures include requiring an entity to disclose separately the amounts of significant transfers in and out of Level 1 and 2 fair-value measurements and to describe the reasons for the transfers, as well as to disclose separately gross purchases, sales, issuances, and settlements in the roll-forward activity of Level 3 measurements. Clarifications of existing disclosures include requiring a greater level of disaggregation of fair-value measurements by class of assets and liabilities, in addition to enhanced disclosures concerning the inputs and valuation techniques used to determine Level 2 and Level 3 fair-value measurements. ASUNo. 2010-06 is effective for our interim and annual periods beginning January 1, 2010, except for the additional disclosure of purchases, sales, issuances, and settlements in Level 3 fair-value measurements, which is effective for our fiscal year beginning January 1, 2011. We do not expect the adoption of this statement to have a material impact on our consolidated financial statements.
80
Table of Contents
Our Industry and Competition
The U.S. trucking industry is large, fragmented, and highly competitive. The U.S. trucking industry was estimated by the ATA to have generated approximately $544.4 billion in revenue in 2009, of which approximately $259.6 billion was attributed to private fleets operated by shippers and approximately $246.2 billion was attributed tofor-hire truckload carriers like us. According to the ATA, approximately 68% of all freight transported in the United States (in millions of tons) in 2009 was transported by truck (truckload,less-than-truckload, and private carriers); this share is expected to increase to 70.7% by 2021. For-hire truckload carriers handled 33.1% of the nation’s freight tonnage and accounted for 37.0% of total domestic transportation revenue in 2009. The following chart demonstrates the expectation that trucking will remain the dominant form of freight transportation for at least the next decade:
Projected Growth in Freight Transportation Tonnage and Market Share
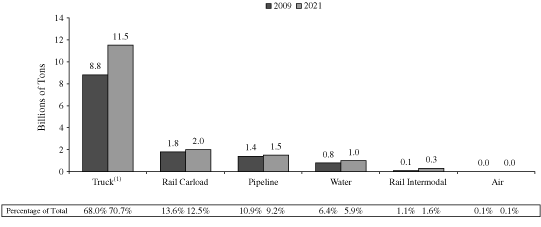
Source: ATA
| (1) | Truck tonnage was comprised of 48.8% truckload, 1.4%less-than-truckload, and 49.8% private fleet in 2009 and projected to be comprised of 49.8% truckload, 1.5%less-than-truckload, and 48.7% private fleet in 2021. |
Truckload carriers typically transport a full trailer (or container) of freight for a single customer from origin to destination without intermediate sorting and handling. Truckload carriers provide the largest part of the transportation supply chain for most retail and manufactured goods in North America.
We compete with thousands of other truckload carriers, most of which operate fewer than 100 trucks. To a lesser extent, we compete with railroads,less-than-truckload carriers, third-party logistics providers, and other transportation companies. The 25 largest for-hire truckload carriers are estimated to comprise approximately 7.5% of the total for-hire truckload market, according to 2008 data published by the ATA. The principal means of competition in our industry are service, the ability to provide capacity when and where needed, and price. In times of strong freight demand, service and capacity become increasingly important, and in times of weak freight demand pricing becomes increasingly important. Because most truckload contracts (other than dedicated contracts) do not guarantee truck availability or load levels, pricing is influenced by supply and demand.
Since 2000, we believe our industry has encountered three major economic cycles: (1) the period of industry over-capacity and depressed freight volumes from 2000 through 2001; (2) the economic expansion from 2002 through 2006; and (3) the freight slowdown, fuel price spike, economic recession, and credit crisis from 2007 through 2009. Although it is too early to be certain, we believe the industry is entering a new economic cycle marked by a return to economic growth as well as a tighter supply of available tractors.
During the period of economic expansion of 2002 through 2006, total tonnage transported by truck increased at a compounded rate of 1.5% per year, according to the ATA. Trucking companies invested in their
81
Table of Contents
fleets during this period, with new Class 8 truck manufactures averaging approximately 215,000 units annually, according to ACT Research.
A combination of reduced demand for freight and excess supply of tractors led to a difficult trucking environment from 2007 through 2009. Total tonnage, as measured by the ATA’s seasonally adjusted for-hire index, declined 9.9% between January 2007 and June 2009. Orders of new tractors also declined as many trucking companies reduced capital expenditures to conserve cash and respond to decreasing demand fundamentals. According to ACT Research, Class 8 truck manufactures fell to approximately 94,000 units in 2009, compared with approximately 296,000 units in 2006.
The following charts demonstrate supply and demand factors in our industry that contributed to the economic cycles described above:
| 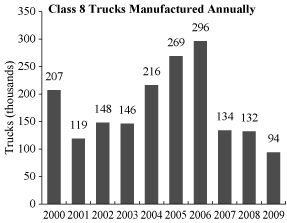 | |
| Source: ATA | Source: ACT Research |
In the fourth quarter of 2009 and into 2010, industry freight data began to show strong positive trends. The ATA seasonally adjusted for-hire truck tonnage index increased 7.2%year-over-year in May 2010, its sixth consecutive monthlyyear-over-year increase. Further evidence of a rebound in the domestic freight environment can be seen in the Cass Freight Shipments Index that showed a 24.9% increase in freight expenditures for the second quarter of 2010 versus the second quarter of 2009. Further, in June, freight expenditures increased on ayear-over-year basis by 28.9%. Key drivers for the positive trends were GDP growth and restocking of inventory levels.
In addition to improving freight demand, our industry is experiencing a drop in the supply of available trucks due to several years of below average truck builds and an increase in truckload fleet bankruptcies. The ATA estimated on June 25, 2010 that the total U.S. truck fleet has shrunk about 14% since hitting its peak in 2007.
For the remainder of 2010, the U.S. economy is expected to generate improvement in shipping volumes, while industry-wide new tractor orders remain depressed. The ATA expects truckload tonnage to expand 2.6% per year from 2010 through 2015 and 1.3% from 2016 through 2021, and industry-wide truckload carrier revenue is expected to expand over 5% per year from 2010 through 2021, indicating a positive rate and volume environment. Based on Class 8 truck orders, which remain depressed, we expect a more favorable relationship between freight demand and industry-wide trucking capacity than we have experienced over the past three years.
In addition to the economic cycles, our industry faces other challenges that we believe we are well-positioned to address. First, we believe that the new regulatory initiatives such ashours-of-service limitations, electric on-board recorders, and CSA 2010 may reduce the size of the driver pool. Moreover, new or changing regulatory constraints on drivers may further decrease the utilization of an already shrinking driver pool. As this occurs, we believe our driver development programs, including our driver training schools and nationwide recruiting, will become increasingly advantageous. In addition, we believe that the impact of such regulations
82
Table of Contents
will be partially mitigated by our average length of haul, regional terminal network, and less mileage-intensive operations, such as intermodal, dedicated, brokerage, and cross-border operations. Second, we believe that significant increases and rapid fluctuations in fuel prices will continue to be a challenge to the industry. We believe we can effectively address these issues through fuel surcharges, effective fuel procurement strategies and network management systems, and further developing our dedicated, intermodal, and brokerage operations. Third, the industry also faces increased prices for new revenue equipment, design changes of new engines, and volatility in the used equipment sales market. We believe that we are well-positioned to effectively address these issues because of our relatively new fleet, trade-back protections, buying power, and in-house nationwide maintenance facilities.
83
Table of Contents
Business
Our Business
We are a multi-faceted transportation services company and the largest truckload carrier in North America. At March 31, 2010, we operated approximately 12,500 company-owned tractors, 3,700 owner-operator tractors, 49,400 trailers, and 4,300 intermodal containers from 35 major terminals and multiple other locations strategically positioned throughout the United States and Mexico. During 2009, our tractors covered 1.5 billion miles and we transported or arranged approximately 3 million loads for shippers throughout North America. For the twelve months ended March 31, 2010, we generated operating revenue of approximately $2.6 billion. We believe our commitment to customer service and the size and scope of our operations provide a significant advantage over many of our competitors and make us a primary choice for major shippers. We offer customers the opportunity for “one-stop-shopping” for transporting full truckloads of product through a broad spectrum of services and equipment, including the following:
| • | general truckload service; | |
| • | dedicated truckload service; | |
| • | cross-border Mexico truckload service; | |
| • | rail intermodal service; and | |
| • | non-asset based freight brokerage and logistics management service. |
Our Competitive Strengths
We believe the following competitive strengths provide a solid platform for pursuing our goals and strategies:
| • | North American market leader with broad terminal network and a modern fleet. The size and scope of our operations afford us significant advantages in a fragmented truckload industry. We operate North America’s largest truckload fleet, have 35 major terminals and multiple other locations strategically positioned throughout the United States and Mexico, and offer customers “one-stop-shopping” for a broad spectrum of their truckload transportation needs. Our fleet size offers wide geographic coverage while maintaining the efficiencies associated with significant traffic density within our operating regions. Our terminals are strategically located near key population centers, driver recruiting areas, and cross-border hubs, often in close proximity to our customers. This broad network offers benefits such as in-house maintenance, more frequent equipment inspections, localized driver recruiting, rapid customer response, and personalized marketing efforts. Our size allows us to achieve substantial economies of scale in purchasing items such as tractors, trailers, containers, fuel, and tires where pricing is volume-sensitive. We believe our scale also offers additional benefits in brand awareness and access to capital. Additionally, our modern company tractor fleet, with an average age of 2.55 years for our approximately 9,000 linehaul sleeper units, lowers maintenance and repair expense, aids in driver recruitment, and increases asset utilization as compared with an older fleet. | |
| • | High quality customer service and extensive suite of services. Our intense focus on customer satisfaction contributed to 20 “carrier of the year” or similar awards in 2009 and has helped us establish a strong platform for cross-selling our other services. Our strong and diversified customer base, ranging from Fortune 500 companies to local shippers, has a wide variety of shipping needs, including general and specialized truckload, imports and exports, regional distribution, high-service dedicated operations, rail intermodal service, and surge capacity through fleet flexibility and brokerage and logistics operations. We believe customers continue to seek fewer transportation providers that offer a broader range of services to streamline their transportation management functions. For example, ten of our top fifteen customers used at least four of our services in the three months ended March 31, 2010. Our top fifteen customers by revenue in 2009 included Coors, Costco, Dollar Tree,Georgia-Pacific, Home Depot, Kimberly-Clark, Lowes, Menlo Logistics, Procter & Gamble, Quaker Oats, Ryder Logistics, Sears, Target, and Wal-Mart. We believe the breadth of our services helps diversify our customer base and provides us with a competitive advantage, especially for customers with multiple needs and international shipments. |
84
Table of Contents
| • | Strong and growing owner-operator business. We supplement our company tractors with tractors provided by owner-operators, who operate their own tractors and are responsible for most ownership and operating expenses. We believe that owner-operators provide significant advantages that primarily arise from the entrepreneurial motivation of business ownership. Our owner-operators tend to be more experienced, have lower turnover, have fewer accidents per million miles, and produce higher weekly trucking revenue per tractor than our average company drivers. In 2009, our owner-operator tractors drove on average 34% more miles per week than our company tractors. | |
| • | Leader in driver and owner-operator development. Driver recruiting and retention historically have been significant challenges for truckload carriers. To address these challenges, we employ nationwide recruiting efforts through our terminal network, operate five driver training schools, maintain an active and successful owner-operator development program, provide drivers modern tractors, and employ numerous driver satisfaction policies. We believe our extensive recruiting and training efforts will become increasingly advantageous to us in periods of economic growth when employment alternatives are more plentiful and also when new regulatory requirements begin to affect the size or effective capacity of the industry-wide driver pool. | |
| • | Experienced management aligned with corporate success. Our management team has a proven track record of growth and cost control. The improvements we have made to our operations since going private have positioned us to benefit from the expected improvement in the freight environment. Management focuses on disciplined execution and financial performance by measuring our progress through a combination of Adjusted EBITDA growth, revenue growth, Adjusted Operating Ratio, and return on capital. We align management’s priorities with our own through equity option awards and an annual senior management incentive program linked to Adjusted EBITDA. |
Our Growth Strategy
Based on our expectation of meaningful improvement in truckload volumes and pricing, our goals are to grow revenue in excess of 10% annually over the next several years, increase our profitability, and generate returns on capital in excess of our cost of capital. We believe our competitive strengths and an improving supply and demand environment in the truckload industry are aligned to support the achievement of our goals through the following strategies:
| • | Profitable revenue growth. To increase freight volumes and yield, we intend to further penetrate our existing customer base, cross-sell our services, and pursue new customer opportunities. Our superior customer service and extensive suite of truckload services continue to contribute to recent new business wins from customers such as Costco, Procter & Gamble, Caterpillar, and Home Depot. In addition, we are further enhancing our sophisticated freight selection management tools to allocate our equipment to more profitable loads and complementary lanes. As freight volumes increase, we intend to prioritize the following areas for growth: |
| — | Rail intermodal and port operations. Our growing rail intermodal presence allows us to better serve customers in longer haul lanes and reduce our investment in fixed assets. Since its inception in 2005, we have grown our rail intermodal business by adding approximately 4,300 containers, and we have ordered an additional 1,000 containers for delivery between August 2010 and June 2011. We have intermodal agreements with all major U.S. railroads and recently negotiated more favorable terms with our largest intermodal provider, which has helped increase our volumes through more competitive pricing. We also expanded our presence in the short-haul drayage business at the ports of Los Angeles and Long Beach in 2008 and are evaluating additional port opportunities. | |
| — | Dedicated services and private fleet outsourcing. The size and scale of our fleet and terminal network allow us to provide the equipment availability and high service levels required for dedicated contracts. Dedicated contracts often are used for high-service and high-priority freight, sometimes to replace private fleets previously operated by customers. Dedicated operations generally produce higher margins and lower driver turnover than our general truckload operations. We believe these opportunities will increase in times of scarce capacity in the truckload industry. |
85
Table of Contents
| — | Cross-border Mexico-U.S. freight. The combination of our U.S., cross-border, customs brokerage, and Mexican operations enables us to provide efficientdoor-to-door service between the United States and Mexico. We believe our sophisticated load security measures, as well as our DHS status as a C-TPAT carrier, allow us to offer more efficient service than most competitors and afford us substantial advantages with major international shippers. | |
| — | Freight brokerage and third-party logistics. We believe we have a substantial opportunity to continue to increase our non-asset based freight brokerage and third-party logistics services. We believe many customers increasingly seek transportation companies that offer both asset-based and non-asset based services to gain additional certainty that safe, secure, and timely truckload service will be available on demand and to reward asset-based carriers for investing in fleet assets. We intend to continue growing our transportation management and freight brokerage capability to build market share with customers, earn marginal revenue on more loads, and preserve our assets for the most attractive lanes and loads. |
| • | Increase asset productivity and return on capital. We believe we have a substantial opportunity to improve the productivity and yield of our existing assets through the following measures: |
| — | increasing the percentage of our fleet provided by owner-operators, who generally produce higher weekly trucking revenue per tractor than our company drivers; | |
| — | increasing company tractor utilization through measures such as equipment pools, relays, and team drivers; | |
| — | capitalizing on a stronger freight market to increase average trucking revenue per mile by using sophisticated freight selection and network management tools to upgrade our freight mix and reduce deadhead miles; | |
| — | maintaining discipline regarding the timing and extent of company tractor fleet growth based on availability of high-quality freight; and | |
| — | rationalizing unproductive assets as necessary, thereby improving our return on capital. |
Because of our size and operating leverage, even small improvements in our asset productivity and yield can have a significant impact on our operating results. For example, by maintaining our current fleet size and revenue per mile and simply regaining the miles per tractor we achieved in 2005 (including a 14.9% improvement in utilization with respect to active trucks and assuming a reinstatement of approximately 500 idle trucks that were parked in response to reduced freight volumes), operating revenue would increase by an estimated $425.0 million.
| • | Continue to focus on efficiency and cost control. We intend to continue to implement the Lean Six Sigma, accountability, and discipline measures that helped us improve our Adjusted Operating Ratio in 2009 and in the first quarter of 2010. We presently have ongoing efforts in the following areas that we expect will yield benefits in future periods: |
| — | managing the flow of our tractor capacity through our network to balance freight flows and reduce deadhead miles; | |
| — | improving processes and resource allocation throughout our customer-facing functions to increase operational efficiencies while endeavoring to improve customer service; | |
| — | streamlining driver recruiting and training procedures to reduce attrition costs; and | |
| — | reducing waste in shop methods and procedures and in other administrative processes. |
| • | Pursue selected acquisitions. In addition to expanding our company tractor fleet through organic growth, and to take advantage of opportunities to add complementary operations, we expect to pursue selected acquisitions. We operate in a highly fragmented and consolidating industry where we believe the size and scope of our operations afford us significant competitive advantages. Acquisitions can provide us an opportunity to expand our fleet with customer revenue and drivers already in place. In our history, we have completed twelve acquisitions, most of which were immediately integrated into our existing business. Given our size in relation to most competitors, we expect most future acquisitions |
86
Table of Contents
| to be integrated quickly. As with our prior acquisitions, our goal is for any future acquisitions to be accretive to our earnings within two full calendar quarters. |
Mission, Vision, and Most Important Goals
Since going private in 2007, our management team has instilled a culture of discipline and accountability throughout our organization. We accomplished this in several ways. First, we established our mission, vision, purpose, and values to give the organization guidance. Second, we identified our most important goals and trained our entire organization in the discipline of executing on these goals, including focusing on our priorities, breaking down each employee’s responsibilities to identify those which contribute to achieving our priorities, creating a scoreboard of daily results, and requiring weekly reporting of recent results and plans for the next week. Third, we established cross-functional business transformation teams utilizing Lean Six Sigma techniques to analyze and enhance value streams throughout Swift. Fourth, we enhanced our annual operating plan process to break down our financial plans into budgets, metrics, goals, and targets that each department can influence and control. And finally, we developed and implemented a strategic planning and deployment process to establish actionable plans to achieve best in class performance in key areas of our business.
Our mission is to attract and retain customers by providing best in class transportation solutions and fostering a profitable, disciplined culture of safety, service, and trust. At the beginning of 2009, we defined our vision, which consists of seven primary themes:
| • | we are an efficient and nimble world class service organization that is focused on the customer; | |
| • | we are aligned and working together at all levels to achieve our common goals; | |
| • | our team enjoys our work and co-workers and this enthusiasm resonates both internally and externally; | |
| • | we are on the leading edge of service, always innovating to add value to our customers; | |
| • | our information and resources can be easily adapted to analyze and monitor what is most important in a changing environment; | |
| • | our financial health is strong, generating excess cash flows and growing profitability year-after-year with a culture that is cost-and environmentally-conscious; and | |
| • | we train, build, and develop our employees through perpetual learning opportunities to enhance their skill sets, allowing us to maximize potential of our talented people. |
For 2010, in light of our mission and vision, we defined our most important goals as follows:
| • | Improving financial performance. To improve our financial performance, we have developed and deployed several strategies, including profitable, revenue growth, improved asset utilization and return on capital, and cost reductions. We measure our performance on these strategies by Adjusted EBITDA, Adjusted Operating Ratio, revenue growth, and return on capital. Our annual incentive plans are based on achieving an Adjusted EBITDA target. In this regard, we have identified numerous specific activities as outlined in “Our Growth Strategy” section above. We also engage all of our sales personnel in specific planning ofmonth-by-month volume and rate goals for each of their major customers and identify specific, controllable operating metrics for each of our terminal managers. | |
| • | Customer satisfaction. In our pursuit to be best in class, we surveyed our customers and identified areas where we can accelerate the capture of new freight opportunities, improve our customers’ experience, and profit from enhancing the value our customers receive. Based on the survey, focus areas of improvement include meeting customer commitments for on-timepick-up and delivery, improving billing accuracy, defining and documenting expectations of new customers, and enhancing responsiveness of our personnel. | |
| • | Employee development. We realize we are only as good as our people. We believe, by unleashing the talent of our people, we can meet and exceed our organizational goals while enabling our employees to increase their own potential. To facilitate personal and professional growth, we have implemented leadership training and other tools to enhance feedback, continual learning, and sharing of best practices. |
87
Table of Contents
Operations
We provide timely, efficient, safe, and cost effective transportation solutions for customers. We create value for our customers by providing a variety of transportation services that help our customers better manage their transportation needs. Our broad spectrum of services includes the following:
| • | General truckload service. Our general truckload service consists of one-way movements over irregular routes throughout the United States and in Canada through dry van, temperature controlled, flatbed, or specialized trailers, as well as drayage operations, using both company tractors and owner-operator tractors. Our regional terminal network and operating systems enable us to enhance driver recruitment and retention by maintaining open communication lines with our drivers and by planning loads and routes that will regularly return drivers to their homes. Our operating systems provide access to current information regarding driver and equipment status and location, special load and equipment instructions, routing, and dispatching. These systems enable our operations to match available equipment and drivers to available loads and plan future loads based on the intended destinations. Our operating systems also facilitate the scheduling of regular equipment maintenance and fueling at our terminals or other locations, as appropriate, which also enhance productivity and asset utilization while reducing empty miles and repair costs. | |
| • | Dedicated truckload service. Through our dedicated truckload service, we devote exclusive use of equipment and offer tailored solutions under long-term contracts, generally with higher operating margins and lower driver turnover. Dedicated truckload service allows us to provide tailored solutions to meet specific customer needs. Our dedicated operations use our terminal network, operating systems, and for-hire freight volumes to source backhaul opportunities to improve asset utilization and reduce deadhead miles. In our dedicated operations, we typically provide transportation professionalson-site at each customer’s facilities and have a centralized team of transportation engineers to design transportation solutions to support private fleet conversions and/or augment customers’ transportation requirements. | |
| • | Cross-border Mexico/U.S. truckload service. Our growing cross-border, Mexico truckload business includes service through Trans-Mex, our wholly-owned subsidiary, which is one of the largest trucking companies in Mexico. Our Mexican operations primarily haul through commercial border crossings from Laredo, Texas westward to California. Through Trans-Mex, we can move freight efficiently across theU.S.-Mexico border, and our integrated systems allow customers to track their goods from origin to destination. Our revenue from Mexican operations was approximately $18 million in the three months ended March 31, 2010 and approximately $61 million in 2009, in each case prior to intercompany eliminations. As of March 31, 2010 and December 31, 2009, respectively, the total U.S. dollar book value of our Mexico operations long-lived assets was $47.0 million and $46.9 million. | |
| • | Rail intermodal service. Our rail intermodal business involves arranging for rail service for primary freight movement and related drayage service and requires lower tractor investment than general truckload service, making it one of our less asset-intensive businesses. In 2008, we expanded our presence in the short-haul, intermodal drayage business at the ports of Los Angeles, California, and Long Beach, California. With the help of our tracking and operating systems, modern equipment, employee training systems, and existing drayage capabilities, we have achieved strong growth in our drayage business at these ports. We offer “Trailer-on-Flat-Car” through our approximately 49,400 trailers and “Container-on-Flat-Car” through a 4,300 dedicated 53-foot container fleet. We expect to expand our container fleet by 600 units in the third quarter of 2010, with an additional 400 units to be added thereafter. We offer these products to and from 82 active rail ramps located across the United States and Canada. We operate our own drayage fleet and have contracts with over 350 drayage operators across North America. In 2010, we expect to complete more than 100,000 intermodal loads, and our intermodal revenue has grown over 22% per year over the past five years. | |
| • | Non-asset based freight brokerage and logistics management services. Through our freight brokerage and logistics management services, we offer our transportation management expertise and/or arrange for other trucking companies to haul freight that does not fit our network, earning us a revenue share with |
88
Table of Contents
| little investment. Our freight brokerage and logistics management services enable us to offer capacity to meet seasonal demands and surges. |
| • | Other revenue generating services. In addition to the services referenced above, our services include providing tractor leasing arrangements through IEL to owner-operators, underwriting insurance through our wholly-owned captive insurance companies, and providing repair services through our maintenance and repair shops to owner-operators and other third parties. |
We offer our services on a local, regional, and transcontinental basis through an established network of 35 major regional terminals and facilities located near key population centers, often in close proximity to major customers. Our fleet size and terminal network allow us to commit significant capacity to major shippers in multiple markets, while still achieving efficiencies, such as rapid customer response and fewer deadhead miles, associated with traffic density in most of our regions.
The achievement of significant regular freight volumes on high-density routes and the ability to achieve better shipment scheduling over these routes are key elements of our operating strategy. We employ network management tools to manage the complexity of operating inshort-to-medium-haul traffic lanes throughout North America. Network management tools focus on four key elements:
| • | Velocity —how quickly freight moves through our network; | |
| • | Price —how the load is rated on a revenue per mile basis; | |
| • | Lane flow — how the lane fits in our network with backhauls or continuous moves; and | |
| • | Seasonality — how consistent the freight demand is throughout the year. |
We invest in sophisticated technologies and systems that allow us to increase the utilization of our assets and our operating efficiency, improve customer satisfaction, and communicate critical information to our drivers. In virtually all of our trucks, we have installed Qualcommtm onboard, two-way satellite communication systems. This communication system links drivers to regional terminals and corporate headquarters, allowing us to alter routes rapidly in response to customer requirements and weather conditions and to eliminate the need for driver detours to report problems or delays. This system allows drivers to inform dispatchers and driver managers of the status of routing, loading and unloading, or the need for emergency repairs. We believe our customers, our drivers, and we benefit from this investment through service-oriented items such as on-time deliveries, continuous tracking of loads, updating of customer commitments, rapid in-cab communication of routing, fueling, and delivery instructions, and our integrated service offerings that support a paperless, electronic environment from tender of loads to collection of accounts. We reduce costs through programs that manage equipment maintenance, select fuel purchasing locations in our nationwide network of terminals and approved truck stops, and inform us of inefficient or undesirable driving behaviors that are monitored and reported through electronic engine sensors. We believe our technologies and systems are superior to those employed by most of our smaller competitors.
Our trailers and containers are virtually all equipped with Qualcommtm trailer-tracking devices, which allow us, via satellite, to monitor locations of empty and loaded equipment, as well as to receive notification if a unit is moved outside of the electronic geofence encasing each piece of equipment. This enables us to more efficiently utilize equipment, by identifying unused units, and enhances our ability to charge for units detained by customers. This technology has enabled us to reduce theft as well as to locate units hijacked with merchandise on board.
Owner-Operators
In addition to the company drivers we employ, we enter into contracts with owner-operators. Owner-operators operate their own tractors (although some employ drivers they hire) and provide their services to us under contractual arrangements. They are responsible for most ownership and operating expenses and are compensated by us primarily on a rate per mile basis. By operating safely and productively, owner-operators can improve their own profitability and ours. We believe that our owner-operator fleet provides significant advantages that primarily arise from the motivation of business ownership. Owner-operators tend to be more experienced, produce more miles-per-truck per-week, and cause fewer accidents-per-million miles than average company drivers, thus providing better profitability and financial returns. As of March 31, 2010, owner-
89
Table of Contents
operators comprised approximately 23% of our total fleet, as measured by tractor count. If we are unable to continue to contract with a sufficient number of owner-operators or fleet operators, it could adversely affect our operations and profitability.
We provide tractor financing to independent owner-operators through our subsidiary, IEL. IEL generally leases premium equipment from the original equipment manufacturers and subleases the equipment to owner-operators. The owner-operators are qualified based on their driving and safety records. In our experience, we have lower turnover among owner-operators who obtain their financing through IEL than with our other owner-operators and our company drivers. In the event of default, IEL regains possession of the tractor and subleases it to a replacement owner-operator.
Additional services offered to owner-operators include insurance, maintenance, and fuel pass-throughs. Through ourwholly-owned insurance captive subsidiary, Mohave, we offerowner-operatorsoccupational-accident, physical damage, and other types of insurance.Owner-operators also are enabled to procure maintenance services at ourin-house shops and fuel at our terminals. We believe we provide these services at competitive and attractive prices to our owner-operators that also enable us to earn additional revenue and margin.
Customers and Marketing
Customer satisfaction is an important priority for us, which is demonstrated by the 20 “carrier of the year” or similar awards we have received from customers in 2009 and eight awards we have received to date in 2010. Such achievements have helped us maintain a large and stable customer base featuring Fortune 500 and other leading companies from a number of different industries. Our top fifteen customers by revenue in 2009 included Coors, Costco, Dollar Tree, Georgia-Pacific, Home Depot, Kimberly-Clark, Lowes, Menlo Logistics, Procter & Gamble, Quaker Oats, Ryder Logistics, Sears, Target, andWal-Mart. Our top fifteen customers have used our services for an average of over ten years. The principal types of freight we transport include discount and other retail merchandise, perishable and non-perishable food, beverages and beverage containers, paper and packaging products, consumer non-durable products, manufactured goods, automotive goods, and building materials. Consistent with industry practice, our typical customer contracts (other than dedicated contracts) do not guarantee shipment volumes by our customers or truck availability by us. This affords us and our customers some flexibility to negotiate rates up or down in response to changes in freight demand and industry-wide truck capacity. We believe our fleet capacity terminal network, customer service, and breadth of services offer a competitive advantage to major shippers, particularly in times of rising freight volumes when shippers must access capacity quickly across multiple facilities and regions.
We concentrate our marketing efforts on expanding the amount of service we provide to existing customers, as well as on establishing new customers with shipment needs that complement our terminal network and existing routes. At March 31, 2010, we had a sales staff of approximately 50 individuals across the United States and Mexico, who work closely with senior management to establish and expand accounts.
When soliciting new customers, we concentrate on attracting non-cyclical, financially stable organizations that regularly ship multiple loads from locations that complement traffic flows of our existing business. Customer shipping point locations are regularly monitored, and, as shipping patterns of existing customers expand or change, we attempt to obtain additional customers that will complement the new traffic flow. Through this strategy, we attempt to increase equipment utilization and reduce deadhead miles.
Our strategy of growing business with existing customers provides us with a significant base of revenue. For the three months ended March 31, 2010, and during 2009, respectively, our top 25 customers generated approximately 53% and 54% of our total revenue, and our top 200 customers accounted for approximately 89% and 89% of our total revenue.
Wal-Mart and its subsidiaries, our largest customer, and a customer we have had for over 19 years, accounted for approximately 10% of our operating revenue for both the three months ended March 31, 2010 and 2009, and approximately 10%, 11%, and 14% of our operating revenue for the years ended December 31, 2009, 2008, and pro forma 2007, respectively. No other customer accounted for more than 10% of our actual or pro forma operating revenue during any of the three years ended December 31, 2009, 2008, or 2007, nor for the three months ended March 31, 2010 and 2009.
90
Table of Contents
Revenue Equipment
We operate a modern company tractor fleet to help attract and retain drivers, promote safe operations, and reduce maintenance and repair costs. We believe our modern fleet offers at least four key advantages over competitors with older fleets. First, newer tractors typically have lower operating costs. Second, newer tractors require fewer repairs and are available for dispatch more of the time. Third, newer tractors typically are more attractive to drivers. Fourth, we believe many competitors that allowed their fleets to age excessively will face a deferred capital expenditure spike accompanied by difficulty in replacing their tractors because new tractor prices have increased, the value received for the old tractors will be low, and financing sources have diminished. The following table shows the type and age of our owned and leased tractors and trailers at March 31, 2010:
Model Year | Tractors(1) | Trailers | ||||||
| 2011 | 184 | 360 | ||||||
| 2010 | 623 | 110 | ||||||
| 2009 | 3,818 | 4,290 | ||||||
| 2008 | 3,386 | 1,814 | ||||||
| 2007 | 2,182 | 40 | ||||||
| 2006 | 502 | 5,454 | ||||||
| 2005 | 855 | 1,582 | ||||||
| 2004 | 281 | 1,093 | ||||||
| 2003 | 179 | 2,954 | ||||||
| 2002 and prior | 479 | 31,739 | ||||||
| Total | 12,489 | 49,436 | ||||||
| (1) | Excludes 3,731 owner-operator tractors. |
We typically purchase tractors and trailers manufactured to our specifications. We follow a comprehensive maintenance program designed to reduce downtime and enhance the resale value of our equipment. In addition to our major maintenance facilities in Phoenix, Arizona, Memphis, Tennessee, and Greer, South Carolina, we perform routine servicing and maintenance of our equipment at most of our regional terminal facilities, in an effort to avoid costly on-road repairs and deadhead miles. The contracts governing our equipment purchases typically contain specifications of equipment, projected delivery dates, warranty terms, and trade or return conditions, and are typically cancelable upon 90 days’ notice without penalty.
Our current tractor trade-in cycle ranges from approximately 36 months to 60 months, depending on equipment type and usage. Management believes this tractor trade cycle is appropriate based on current maintenance costs, capital requirements, prices of new and used tractors, and other factors, but we will continue to evaluate the appropriateness of our tractor trade cycle. We balance the lower maintenance costs of a shorter tractor trade cycle against the lower capital expenditure and financing costs of a longer tractor trade cycle.
In addition, we seek to improve asset utilization by matching available tractors with tendered freight and using untethered trailer tracking to identify the location, loaded status, and availability for dispatch of our approximately 49,400 trailers and 4,300 intermodal containers. We believe this information enables our planners to manage our equipment more efficiently by enabling drivers to quickly locate the assigned trailer, reduce unproductive time during available hours of service, and bill for detention charges when appropriate. It also allows us to reduce cargo losses through trailer theft prevention, and to mitigate cargo claims through recovery of stolen trailers.
Employees
Terminal staff
Our larger terminals are staffed with terminal managers, fleet managers, driver managers, and customer service representatives. Our terminal managers work with driver managers, customer service representatives,
91
Table of Contents
and other operations personnel to coordinate the needs of both our customers and our drivers. Terminal managers also are responsible for soliciting new customers and serving existing customers in their areas. Each fleet manager supervises approximately five driver managers at our larger terminals. Each driver manager is responsible for the general operation of approximately 40 trucks and their drivers, focusing on driver retention, productivity per truck, routing, fuel consumption and efficiency, safety, and scheduled maintenance. Customer service representatives are assigned specific customers to ensure specialized, high-quality service and frequent customer contact.
Company drivers
All of our drivers must meet or exceed specific guidelines relating primarily to safety records, driving experience, and personal evaluations, including a physical examination and mandatory drug and alcohol testing. Upon being hired, drivers are to be trained in our policies and operations, safety techniques, and fuel-efficient operation of the equipment. All new drivers must pass a safety test and have a current Commercial Drivers License, or CDL. In addition, we have ongoing driver efficiency and safety programs to ensure that our drivers comply with our safety procedures.
Senior management is actively involved in the development and retention of drivers. Recognizing the continuing need for qualified drivers, we have established five driver training academies across the country. Our academies are strategically located in areas where external driver-training organizations are lacking. In other areas of the country, we have contracted with driver-training schools, which are managed by outside organizations such as local community colleges. Candidates for the schools must be at least 23 years old with a minimum of a high school education or equivalent, pass a basic skills test, and pass the DOT physical examination, which includes drug and alcohol screening. Students are required to complete three weeks of classroom study and spend a minimum of 240 hours driving with an experienced trainer.
In order to attract and retain qualified drivers and promote safe operations, we purchase high quality tractors equipped with optional comfort and safety features, such as air ride suspension, air conditioning, high quality interiors, power steering, engine brakes, and raised-roof, double-sleeper cabs. We base our drivers at terminals and monitor each driver’s location on our computer system. We use this information to schedule the routing for our drivers so they can return home regularly. The majority of company drivers are compensated based on dispatched miles, loading/unloading, and number of stops or deliveries, plus bonuses. The driver’s base pay per mile increases with the driver’s length of experience, as augmented by the ranking system described below. Drivers employed by us are eligible to participate in company-sponsored health, life, and dental insurance plans and are eligible to participate in our 401(k) plan subject to customary enrollment terms.
We believe our driver-training programs, driver compensation, regionalized operations, trailer tracking, and late-model equipment provide important incentives to attract and retain qualified drivers. We have made a concerted effort to reduce the level of driver turnover and increase our driver satisfaction. We have recently implemented a driver ranking program that ranks drivers into five categories based on criteria for safety, legal operation, customer service, and number of miles driven. The higher rankings provide drivers with additional benefits and/or privileges, such as special recognition, the ability to self-select freight, and the opportunity for increased pay when pay raises are given. We monitor the effectiveness of our driver programs by measuring driver turnover and actively addressing issues that may cause driver turnover to increase. Given the recent recession and softness in the labor market since the beginning of 2008, voluntary driver turnover has been significantly lower than historical levels. We have taken advantage of this opportunity to upgrade our driving workforce, but no assurance can be given that a shortage of qualified drivers will not adversely affect us in the future.
Employment
As of March 31, 2010, we employed approximately 15,800 employees, of whom approximately 12,300 were drivers (including driver trainees), 1,200 were technicians and other equipment maintenance personnel, and the balance were support personnel, such as corporate managers and sales and administrative personnel. As of March 31, 2010, our 700 Trans-Mex drivers were our only employees represented by a union.
92
Table of Contents
Safety and Insurance
We take pride in our safety-oriented culture and maintain an active safety and loss-prevention program at each of our terminals. We have terminal and regional safety management personnel that focus on loss prevention for their designated facilities. We also equip our tractors with many safety features, such as roll-over stability devices and critical-event recorders, to help prevent, or reduce the severity of, accidents.
We self-insure for a significant portion of our claims exposure and related expenses. We currently carry six main types of insurance, which generally have the following self-insured retention amounts, maximum benefits per claim, and other limitations:
| • | automobile liability, general liability, and excess liability — $150.0 million of coverage per occurrence, subject to a $10.0 million per-occurrence, self-insured retention; | |
| • | cargo damage and loss — $2.0 million limit per truck or trailer with a $10.0 million limit per occurrence; provided that there is a $250,000 limit for tobacco loads and a $250,000 self-insured retention for all perils; | |
| • | property and catastrophic physical damage — $150.0 million limit for property and $100.0 million limit for vehicle damage, excluding over the road exposures, subject to a $1.0 million self-insured retention; | |
| • | workers’ compensation/employers liability — statutory coverage limits; employers liability of $1.0 million bodily injury by accident and disease, subject to a $5.0 million self-insured retention for each accident or disease; | |
| • | employment practices liability — primary policy with a $10.0 million limit subject to a $2.5 million self-insured retention; we also have an excess liability policy that provides coverage for the next $7.5 million of liability for a total coverage limit of $17.5 million; and | |
| • | health care — we self-insure for the first $400,000 of each employee health care claim and maintain commercial insurance for the balance. |
In June 2006, we started to insure certain casualty risks through our wholly-owned captive insurance company, Mohave. In addition to insuring a proportionate share of our corporate casualty risk, Mohave provides insurance coverage to certain of our and our affiliated companies’ owner-operators in exchange for insurance premiums paid to Mohave by the owner-operators. In February 2010, we initiated operations of a second wholly-owned captive insurance subsidiary, Red Rock. Beginning in 2010, Red Rock and Mohave will each insure a share of our automobile liability risk.
While under dispatch and furthering our business, our owner-operators are covered by our liability coverage and self-insurance retentions. However, each is responsible for physical damage to his or her own equipment, occupational accident coverage, liability exposure while the truck is used for non-company purposes, and, in the case of fleet operators, any applicable workers’ compensation requirements for their employees.
We regulate the speed of our company tractors to a maximum of 62 miles per hour and have adopted a speed limit of 68 miles per hour for owner-operator tractors through their contractual terms with us. These adopted speed limits are below the limits established by statute in many states. We believe our adopted speed limits reduce the frequency and severity of accidents, enhance fuel efficiency, and reduce maintenance expense, when compared to operating without our imposed speed limits. Substantially all of our company tractors are equipped with electronically-controlled engines that are set to limit the speed of the vehicle.
Fuel
We actively manage our fuel purchasing network in an effort to maintain adequate fuel supplies and reduce our fuel costs. In 2009, we purchased approximately 30% of our fuel in bulk at 37 Swift and dedicated customer locations across the United States and Mexico and substantially all of the rest of our fuel through a network of retail truck stops with which we have negotiated volume purchasing discounts. The volumes we purchase at terminals and through the fuel network vary based on procurement costs and other factors. We seek to reduce our fuel costs by routing our drivers to truck stops when fuel prices at such stops are cheaper than the bulk rate paid for fuel at our terminals. We store fuel in underground storage tanks at four of our bulk
93
Table of Contents
fueling terminals and in above-ground storage tanks at our other bulk fueling terminals. In addition, we store fuel for our use at the Salt Lake City, Utah and Houston, Texas terminal locations of Central Refrigerated Services, Inc. and Central Freight Lines, Inc., respectively, which are transportation companies controlled by Mr. Moyes. We believe that we are in substantial compliance with applicable environmental laws and regulations relating to the storage of fuel.
Shortages of fuel, increases in fuel prices, or rationing of petroleum products could have a material adverse effect on our operations and profitability. In response to increases in fuel costs, we utilize a fuel surcharge program to pass on the majority of the increases in fuel costs to our customers. We believe that our most effective protection against fuel cost increases is to maintain a fuel-efficient fleet and to continue our fuel surcharge program. However, there can be no assurance that fuel surcharges will adequately cover potential future increases in fuel prices. We generally have not used derivative instruments as a hedge against higher fuel costs in the past, but continue to evaluate this possibility. We have contracted with some of our fuel suppliers to buy limited quantities of fuel at a fixed price or within banded pricing for a specific period, usually not exceeding twelve months, to mitigate the impact of rising fuel costs on miles not covered by fuel surcharges.
Seasonality
In the transportation industry, results of operations generally show a seasonal pattern. As customers ramp up for the holiday season at year-end, the late third and fourth quarters have historically been our strongest volume quarters. As customers reduce shipments after the winter holiday season, the first quarter has historically been a lower volume quarter for us than the other three quarters. In 2007 and 2008, the traditional surge in volume in the third and fourth quarters did not occur due to the economic recession. In the eastern and midwestern United States, and to a lesser extent in the western United States, during the winter season, our equipment utilization typically declines and our operating expenses generally increase, with fuel efficiency declining because of engine idling and harsh weather sometimes creating higher accident frequency, increased claims, and more equipment repairs. Our revenue also may be affected by bad weather and holidays as a result of curtailed operations or vacation shutdowns, because our revenue is directly related to available working days of shippers. From time to time, we also suffer short-term impacts from weather-related events such as tornadoes, hurricanes, blizzards, ice storms, floods, fires, earthquakes, and explosions that could harm our results of operations or make our results of operations more volatile.
Regulation
Our operations are regulated and licensed by various government agencies in the United States, Mexico, and Canada. Our company drivers and owner-operators must comply with the safety and fitness regulations of the DOT, including those relating to drug- and alcohol-testing andhours-of-service. Weight and equipment dimensions also are subject to government regulations. We also may become subject to new or more restrictive regulations relating to fuel emissions, drivers’hours-of-service, driver eligibility requirements, on-board reporting of operations, collective bargaining, ergonomics, and other matters affecting safety or operating methods. Other agencies, such as the EPA and DHS, also regulate our equipment, operations, and drivers.
The DOT, through the FMCSA, imposes safety and fitness regulations on us and our drivers. Rules that limit driverhours-of-service were adopted by the FMCSA in 2004 and subsequently modified in 2005 before portions of the rules were vacated by a federal court in July 2007. Two of the key portions that were vacated include the expansion of the driving day from 10 hours to 11 hours, and the“34-hour restart,” which allowed drivers to restart calculations of the weekly on-time limits after the driver had at least 34 consecutive hours off duty. In November 2008, the FMCSA published its final rule, which retains the11-hour driving day and the34-hour restart. However, advocacy groups have continually challenged the final rule, and thehours-of-service rules are still under review by the FMCSA. In April 2010, the FMCSA issued a final rule applicable to carriers with a history of serioushours-of-service violations, which includes new performance standards for electronic, on-board recorders (which record information relating tohours-of-service, among other information) installed on or after June 4, 2012. We believe a decision to significantly change thehours-of-service final rule would decrease productivity and cause some loss of efficiency, as drivers and shippers may need to be retrained,
94
Table of Contents
computer programming may require modifications, additional drivers may need to be employed, additional equipment may need to be acquired, and some shipping lanes may need to be reconfigured.
CSA 2010 introduces a new enforcement and compliance model that will rank both fleets and individual drivers on seven categories of safety-related data and will eventually replace the current Safety Status measurement system, or SafeStat. The seven categories of safety-related data, known as Behavioral Analysis and Safety Improvement Categories, or BASICs, include Unsafe Driving, Fatigued Driving(Hours-of-Service), Driver Fitness, Controlled Substances/Alcohol, Vehicle Maintenance, Cargo-Related, and Crash Indicator. Under the new regulations, the methodology for determining a carrier’s DOT safety rating will be expanded to include the on-road safety performance of the carrier’s drivers. The new regulation will be implemented in the second half of 2010 and enforcement will begin in 2011. Delays already have taken place in the implementation and enforcement dates, and there is no assurance that these dates will not further change. As a result of these new regulations, including the expanded methodology for determining a carrier’s DOT safety rating, there may be an adverse effect on our DOT safety rating. We currently have a satisfactory DOT rating, which is the highest available rating. There are three safety ratings assigned to motor carriers: “satisfactory,” “conditional,” which means that there are deficiencies requiring correction, but not so significant to warrant loss of carrier authority, and “unsatisfactory,” which is the result of acute deficiencies and would lead to revocation of carrier authority. A conditional or unsatisfactory DOT safety rating could adversely affect our business because some of our customer contracts require a satisfactory DOT safety rating, and a conditional or unsatisfactory rating could negatively impact or restrict our operations. In addition, there is a possibility that a drop to conditional status could affect our ability to self-insure for personal injury and property damage relating to the transportation of freight, which could cause our insurance costs to increase. Finally, proposed FMCSA rules and practices followed by regulators may require us to install electronic, on-board recorders in our tractors if we receive an adverse change in our safety rating.
The TSA has adopted regulations that require a determination by the TSA that each driver who applies for or renews his or her license for carrying hazardous materials is not a security threat. This could reduce the pool of qualified drivers, which could require us to increase driver compensation, limit our fleet growth, or allow trucks to be idled. These regulations also could complicate the matching of available equipment with hazardous material shipments, thereby increasing our response time on customer orders and our deadhead miles. As a result, it is possible we may fail to meet the needs of our customers or may incur increased expenses to do so.
We are subject to various environmental laws and regulations dealing with the hauling and handling of hazardous materials, fuel storage tanks, emissions from our vehicles and facilities, engine-idling, discharge and retention of storm water, and other environmental matters that involve inherent environmental risks. We have instituted programs to monitor and control environmental risks and maintain compliance with applicable environmental laws. As part of our safety and risk management program, we periodically perform internal environmental reviews. We are a Charter Partner in the EPA’s SmartWay Transport Partnership, a voluntary program promoting energy efficiency and air quality. We believe that our operations are in substantial compliance with current laws and regulations and do not know of any existing environmental condition that would reasonably be expected to have a material adverse effect on our business or operating results. If we are found to be in violation of applicable laws or regulations, we could be subject to costs and liabilities, including substantial fines or penalties or civil and criminal liability, any of which could have a material adverse effect on our business and operating results.
We maintain bulk fuel storage and fuel islands at many of our terminals. We also have vehicle maintenance, repair, and washing operations at some of our facilities. Our operations involve the risks of fuel spillage or seepage, discharge of contaminants, environmental damage, and hazardous waste disposal, among others. Some of our operations are at facilities where soil and groundwater contamination have occurred, and we or our predecessors have been responsible for remediating environmental contamination at some locations.
We would be responsible for the cleanup of any releases caused by our operations or business, and in the past we have been responsible for the costs of clean up of cargo and diesel fuel spills caused by traffic accidents or other events. We transport a small amount of environmentally hazardous materials. We generally transport only hazardous material rated as low-to-medium-risk, and less than 1% of our total shipments contain
95
Table of Contents
any hazardous materials. If we are found to be in violation of applicable laws or regulations, we could be subject to liabilities, including substantial fines or penalties or civil and criminal liability. We have paid penalties for spills and violations in the past.
EPA regulations limiting exhaust emissions became effective in 2002 and became more restrictive for engines manufactured in 2007 and again for engines manufactured after January 1, 2010. On May 21, 2010, President Obama signed an executive memorandum directing the NHTSA and the EPA to develop new, stricter fuel-efficiency standards for heavy trucks, beginning in 2014. California adopted new performance requirements for diesel trucks, with targets to be met between 2011 and 2023. In December 2008, California also adopted new trailer regulations, which require all 53-foot or longer box-type trailers (dry vans and refrigerated vans) that operate at least some of the time in California (no matter where they are registered) to meet specific aerodynamic efficiency requirements when operating in California. California-based refrigerated trailers were required to register with California Air Regulations Board by July 31, 2009, and enforcement for those trailers began in August 2009. Beginning January 1, 2010, 2011 model year and newer 53-foot or longer box-type trailers subject to the California regulations were required to be either SmartWay certified or equipped with low-rolling, resistance tires and retrofitted with SmartWay-approved, aerodynamic technologies. Beginning December 31, 2012, pre-2011 model year 53-foot or longer box-type trailers (with the exception of certain 2003 to 2008 refrigerated van trailers) must meet the same requirements as 2011 model year and newer trailers or have prepared and submitted a compliance plan, based on fleet size, that allows them to phase in their compliance over time. Compliance requirements for 2003 to 2008 refrigerated van trailers will be phased in between 2017 and 2019. Federal and state lawmakers also have proposed potential limits on carbon emissions under a variety of climate-change proposals. Compliance with such regulations has increased the cost of our new tractors, may increase the cost of any new trailers that will operate in California, may require us to retrofit certain of our pre-2011 model year trailers that operate in California, and could impair equipment productivity and increase our operating expenses. These adverse effects, combined with the uncertainty as to the reliability of the newly-designed, diesel engines and the residual values of these vehicles, could materially increase our costs or otherwise adversely affect our business or operations.
Certain states and municipalities continue to restrict the locations and amount of time where diesel-powered tractors, such as ours, may idle, in order to reduce exhaust emissions. These restrictions could force us to alter our operations.
In addition, increasing efforts to control emissions of greenhouse gases are likely to have an impact on us. The EPA has announced a finding relating to greenhouse gas emissions that may result in promulgation of greenhouse gas air quality standards. Federal and state lawmakers are also considering a variety of climate-change proposals. New greenhouse gas regulations could increase the cost of new tractors, impair productivity, and increase our operating expenses.
Properties
Our headquarters is situated on approximately 118 acres in the southwestern part of Phoenix, Arizona. Our headquarters consists of a three story administration building with 126,000 square feet of office space; repair and maintenance buildings with 106,000 square feet; a 20,000 square-foot drivers’ center and restaurant; an 8,000 square-foot recruiting and training center; a 6,000 square foot warehouse; a 140,000 square-foot, three-level parking facility; a two-bay truck wash; and an eight-lane fueling facility.
We have terminals throughout the continental United States and Mexico. A terminal may include customer service, marketing, fuel, and repair facilities. We also operate driver training schools in Phoenix, Arizona and several other cities. We believe that substantially all of our property and equipment is in good condition, subject to normal wear and tear, and that our facilities have sufficient capacity to meet our current needs. From time to time, we may invest in additional facilities to meet the needs of our business as we
96
Table of Contents
pursue additional growth. The following table provides information regarding our 35 major terminals in the United States and Mexico, as well as our driving academies and certain other locations:
| Owned | ||||
Location | or Leased | Description of Activities at Location | ||
Western region | ||||
| Arizona — Phoenix | Owned | Customer Service, Marketing, Administration, Fuel, Repair, Driver Training School | ||
| California — Fontana | Owned | Customer Service, Marketing, Fuel, Repair | ||
| California — Lathrop | Owned | Customer Service, Marketing, Fuel, Repair | ||
| California — Mira Loma | Owned | Fuel, Repair | ||
| California — Otay Mesa | Owned | Customer Service | ||
| California — Wilmington | Owned | Customer Service, Fuel, Repair | ||
| California — Willows | Owned | Customer Service, Fuel, Repair | ||
| Colorado — Denver | Owned | Customer Service, Marketing, Fuel, Repair | ||
| Idaho — Lewiston | Owned/Leased | Customer Service, Marketing, Fuel, Repair, Driver Training School | ||
| Nevada — Sparks | Owned | Customer Service, Fuel, Repair | ||
| New Mexico — Albuquerque | Owned | Customer Service, Fuel, Repair | ||
| Oklahoma — Oklahoma City | Owned | Customer Service, Marketing, Fuel, Repair | ||
| Oregon — Troutdale | Owned | Customer Service, Marketing, Fuel, Repair | ||
| Texas — El Paso | Owned | Customer Service, Marketing, Fuel, Repair | ||
| Texas — Houston | Leased | Customer Service, Repair, Fuel | ||
| Texas — Lancaster | Owned | Customer Service, Marketing, Fuel, Repair | ||
| Texas — Laredo | Owned | Customer Service, Marketing, Fuel, Repair | ||
| Texas — San Antonio | Leased | Driver Training School, Fuel | ||
| Utah — Salt Lake City | Owned | Customer Service, Marketing, Fuel, Repair | ||
| Washington — Sumner | Owned | Customer Service, Marketing, Fuel, Repair | ||
Eastern region | ||||
| Florida — Ocala | Owned | Customer Service, Marketing, Fuel, Repair | ||
| Georgia — Decatur | Owned | Customer Service, Marketing, Fuel, Repair | ||
| Illinois — Manteno | Owned | Customer Service, Fuel, Repair | ||
| Indiana — Gary | Owned | Customer Service, Fuel, Repair | ||
| Kansas — Edwardsville | Owned | Customer Service, Marketing, Fuel, Repair | ||
| Michigan — New Boston | Owned | Customer Service, Marketing, Fuel, Repair | ||
| Minnesota — Inver Grove Heights | Owned | Customer Service, Marketing, Fuel, Repair | ||
| New Jersey — Avenel | Owned | Customer Service, Repair | ||
| New York — Syracuse | Owned | Customer Service, Marketing, Fuel, Repair | ||
| Ohio — Columbus | Owned | Customer Service, Marketing, Fuel, Repair | ||
| Pennsylvania — Jonestown | Owned | Customer Service, Fuel, Repair | ||
| South Carolina — Greer | Owned | Customer Service, Marketing, Fuel, Repair | ||
| Tennessee — Memphis | Owned | Customer Service, Marketing, Fuel, Repair | ||
| Tennessee — Millington | Leased | Driver Training School | ||
| Virginia — Richmond | Owned/Leased | Customer Service, Marketing, Fuel, Repair, Driver Training School | ||
| Wisconsin — Town of Menasha | Owned | Customer Service, Marketing, Fuel, Repair | ||
Mexico | ||||
| Tamaulipas — Nuevo Laredo | Owned | Customer Service, Marketing, Fuel, Repair | ||
| Sonora — Nogales | Leased | Customer Service, Repair | ||
| Nuevo Leon — Monterrey | Owned | Customer Service, Administration |
97
Table of Contents
In addition to the facilities listed above, we own parcels of vacant land as well as several non-operating facilities in various locations around the United States, and we maintain various drop yards throughout the United States and Mexico. As of March 31, 2010, our aggregate monthly rent for all leased properties was $192,807 with varying terms expiring through December 2013.
Legal Proceedings
We are involved in litigation and claims primarily arising in the normal course of business, which include claims for personal injury or property damage incurred in the transportation of freight. Our insurance program for liability, physical damage, and cargo damage involves self-insurance with varying risk retention levels. Claims in excess of these risk retention levels are covered by insurance in amounts that management considers to be adequate. Based on its knowledge of the facts and, in certain cases, advice of outside counsel, management believes the resolution of claims and pending litigation, taking into account existing reserves, will not have a material adverse effect on us. See “— Safety and Insurance.” In addition, we are involved in the following litigation:
2004 owner-operator class action litigation
On January 30, 2004, a class action lawsuit was filed by Leonel Garza on behalf of himself and all similarly situated persons against Swift Transportation:Garza vs. Swift Transportation Co., Inc., CaseNo. CV07-0472. The putative class involves certain owner-operators who contracted with us under a 2001 Contractor Agreement that was in place for one year. The putative class is alleging that we should have reimbursed owner-operators for actual miles driven rather than the contracted and industry standard remuneration based upon dispatched miles. The trial court denied plaintiff’s petition for class certification, the plaintiff appealed, and on August 6, 2008, the Arizona Court of Appeals issued an unpublished Memorandum Decision reversing the trial court’s denial of class certification and remanding the case back to the trial court. On November 14, 2008, we filed a petition for review to the Arizona Supreme Court regarding the issue of class certification as a consequence of the denial of the Motion for Reconsideration by the Court of Appeals. On March 17, 2009, the Arizona Supreme Court granted our petition for review, and on July 31, 2009, the Arizona Supreme Court vacated the decision of the Court of Appeals opining that the Court of Appeals had no authority to reverse the trial court’s original denial of class certification and remanded the matter back to the trial court for further evaluation and determination. The Court of Appeals’ decision pertains only to the issue of class certification, and we retain all of our defenses against liability and damages. Based on its knowledge of the facts and advice of outside counsel, management does not believe the outcome of this litigation is likely to have a material adverse effect on us. However, the final disposition of this case and the impact of such final disposition cannot be determined at this time.
Driving academy class action litigation
On March 11, 2009, a class action lawsuit was filed by Michael Ham, Jemonia Ham, Dennis Wolf, and Francis Wolf on behalf of themselves and all similarly situated persons against Swift Transportation:Michael Ham, Jemonia Ham, Dennis Wolf and Francis Wolf v. Swift Transportation Co., Inc.,CaseNo. 2:09-cv-02145-STA-dkv, or the Ham Complaint. The case was filed in the United States District Court for the Western Section of Tennessee Western Division. The putative class involves former students of our Tennessee driving academy who are seeking relief against us for the suspension of their CDLs and any CDL retesting that may be required of the former students by the relevant state department of motor vehicles. The allegations arise from the Tennessee Department of Safety, or TDOS, having released a general statement questioning the validity of CDLs issued by the State of Tennessee in connection with the Swift Driving Academy located in the State of Tennessee. We have filed an answer to the Ham Complaint. We also have filed a cross-claim against the Commissioner of the TDOS, or the Commissioner, for a judicial declaration and judgment that we did not engage in any wrongdoing as alleged in the complaint and a grant of injunctive relief to compel the Commissioner to redact any statements or publications that allege wrongdoing by us and to issue corrective statements to any recipients of any such publications. The issue of class certification must first be resolved before the court will address the merits of the case, and we retain all of our defenses against liability and damages pending a determination of class certification.
On or about April 23, 2009, two class action lawsuits were filed against us in New Jersey and Pennsylvania, respectively:Michael Pascarella, et al. v. Swift Transportation Co., Inc., Sharon A. Harrington,
98
Table of Contents
Chief Administrator of the New Jersey Motor Vehicle Commission, and David Mitchell, Commissioner of the Tennessee Department of Safety, CaseNo. 09-1921(JBS), in the United States District Court for the District of New Jersey, or the Pascarella Complaint; andShawn McAlarnen et al. v. Swift Transportation Co., Inc., Janet Dolan, Director of the Bureau of Driver Licensing of The Pennsylvania Department of Transportation, and David Mitchell, Commissioner of the Tennessee Department of Safety, CaseNo. 09-1737 (E.D. Pa.), in the United States District Court for the Eastern District of Pennsylvania, or the McAlarnen Complaint. Both putative class action complaints involve former students of our Tennessee driving academy who are seeking relief against us, the TDOS, and the state motor vehicle agencies for the threatened suspension of their CDLs and any CDL retesting that may be required of the former students by the relevant state department of motor vehicles. The potential suspension and CDL re-testing was initiated by certain states in response to a general statement by the TDOS questioning the validity of CDL licenses the State of Tennessee issued in connection with the Swift Driving Academy located in Tennessee. The Pascarella Complaint and the McAlarnen Complaint are both based upon substantially the same facts and circumstances as alleged in the Ham Complaint. The only notable difference among the three complaints is that both the Pascarella and McAlarnen Complaints name the local motor vehicles agency and the TDOS as defendants, whereas the Ham Complaint does not. We deny the allegations of any alleged wrongdoing and intend to vigorously defend our position. The McAlarnen Complaint has been dismissed without prejudice because the McAlarnen plaintiff has elected to pursue the Director of the Bureau of Driver Licensing of the Pennsylvania Department of Transportation for damages. We have filed an answer to the Pascarella Complaint. We also have filed a cross-claim against the Commissioner for a judicial declaration and judgment that we did not engage in any wrongdoing as alleged in the complaint and a request for injunctive relief to compel the Commissioner to redact any statements or publications that allege wrongdoing by us to issue corrective statements to any recipients of any such publications.
On May 29, 2009, we were served with two additional class action complaints involving the same alleged facts as set forth in the Ham Complaint and the Pascarella Complaint. The two matters are (i) Gerald L. Lott and Francisco Armenta on behalf of themselves and all others similarly situated v. Swift Transportation Co., Inc. and David Mitchell the Commissioner of the Tennessee Department of Safety, CaseNo. 2:09-cv-02287, filed on May 7, 2009 in the United States District Court for the Western District of Tennessee, or the Lott Complaint; and (ii) Marylene Broadnax on behalf of herself and all others similarly situated v. Swift Transportation Corporation, CaseNo. 09-cv-6486-7, filed on May 22, 2009 in the Superior Court of Dekalb County, State of Georgia, or the Broadnax Complaint. While the Ham Complaint, the Pascarella Complaint, and the Lott Complaint all were filed in federal district courts, the Broadnax Complaint was filed in state court. As with all of these related complaints, we have filed an answer to the Lott Complaint and the Broadnax Complaint. We also have filed a cross-claim against the Commissioner for a judicial declaration and judgment that we did not engage in any wrongdoing as alleged in the complaint and a request for injunctive relief to compel the Commissioner to redact any statements or publications that allege wrongdoing by us and to issue corrective statements to any recipients of any such publications.
The Pascarella Complaint, the Lott Complaint, and the Broadnax Complaint are consolidated with the Ham Complaint in the United States District Court for the Western District of Tennessee and discovery is ongoing.
In connection with the above referenced class action lawsuits, on June 21, 2009, we filed a Petition for Access to Public Records against the Commissioner. Since the inception of these class action lawsuits, we have made numerous requests to the TDOS for copies of any records that may have given rise to TDOS questioning the validity of CDLs issued by the State of Tennessee in connection with the Swift Driving Academy located in the State of Tennessee. As a consequence of TDOS’s failure to provide any such information, we filed a petition against TDOS for violation of Tennessee’s Public Records Act. In response to our petition for access to public records, TDOS delivered certain documents to us.
We intend to vigorously defend against certification of the class for all of the foregoing class action lawsuits as well as the allegations made by the plaintiffs should the class be certified. For the consolidated case described above, the issue of class certification must first be resolved before the court will address the merits of the case, and we retain all of our defenses against liability and damages pending a determination of class certification. Based on its knowledge of the facts and advice of outside counsel, management does not
99
Table of Contents
believe the outcome of this litigation is likely to have a material adverse effect on us; however, the final disposition of this case and the impact of such final disposition cannot be determined at this time.
Owner-operator misclassification class action litigation
On December 22, 2009, a class action lawsuit was filed against Swift Transportation and IEL:John Doe 1 and Joseph Sheer v. Swift Transportation Co., Inc., and Interstate Equipment Leasing, Inc.: CaseNo. 09-CIV-10376 filed in the United States District Court for the Southern District of New York, or the Sheer Complaint. The putative class involves owner-operators alleging that Swift Transportation misclassifies owner-operators as independent contractors in violation of the federal Fair Labor Standards Act, or FLSA, and various New York and California state laws and that such owner-operators should be considered employees. The lawsuit also raises certain related issues with respect to the lease agreements that certain owner-operators have entered into with IEL. At present, in addition to the named plaintiffs, 110 other current or former owner-operators have joined this lawsuit. Upon our motion, the matter has been transferred from the United States District Court for the Southern District of New York to the United States District Court in Arizona. On May 10, 2010, plaintiffs filed a motion to conditionally certify an FLSA collective action and authorize notice to the potential class members. On June 23, 2010, plaintiffs filed a motion for a preliminary injunction seeking to enjoin Swift and IEL from collecting payments from plaintiffs who are in default under their lease agreements and related relief. We intend to vigorously defend against the motion for preliminary injunctive relief and certification of the class as well as the allegations made by the plaintiffs should the class be certified. The final disposition of this case and the impact of such final disposition cannot be determined at this time.
Environmental notice
On April 17, 2009, we received a notice from the Lower Willamette Group, or LWG, advising that there are a total of 250 potentially responsible parties, or PRP, with respect to alleged environmental contamination of the Lower Willamette River in Portland, Oregon designated as the Portland Harbor Superfund site, or the Site, and that as a previous landowner at the Site we have been asked to join a group of 60 PRPs and proportionately contribute to (i) reimbursement of funds expended by LWG to investigate environmental contamination at the Site and (ii) remediation costs of the same, rather than be exposed to potential litigation. Although we do not believe we contributed any contaminants to the Site, we were at one time the owner of property at the Site and the Comprehensive Environmental Response, Compensation and Liability Act imposes a standard of strict liability on property owners with respect to environmental claims. Notwithstanding this standard of strict liability, we believe our potential proportionate exposure to be minimal and not material. No formal complaint has been filed in this matter. Our pollution liability insurer has been notified of this potential claim. We do not believe the outcome of this matter is likely to have a material adverse effect on us. However, the final disposition of this matter and the impact of such final disposition cannot be determined at this time.
California employee class action
On March 22, 2010, a class action lawsuit was filed by John Burnell, individually and on behalf of all other similarly situated persons against Swift Transportation:John Burnell and all others similarly situated v. Swift Transportation Co., Inc., Case No. CIVDS 1004377 filed in the Superior Court of the State of California, for the County of San Bernardino. The putative class includes drivers who worked for us during the four years preceding the date of filing alleging that we failed to pay the California minimum wage, failed to provide proper meal and rest periods, and failed to timely pay wages upon separation from employment. We intend to vigorously defend certification of the class as well as the merits of these matters should the class be certified. Based on our knowledge of the facts and advice of outside counsel, we do not believe the outcome of this litigation is likely to have a material adverse effect on us. However, the impact of the final disposition of this case cannot be determined at this time.
Organizational Structure and Corporate History
We are a corporation formed for the purpose of this offering and have not engaged in any business or other activities except in connection with our formation and the reorganization transactions described elsewhere in this prospectus. Immediately prior to the closing of this offering, Swift Corporation will merge
100
Table of Contents
with and into Swift Holdings Corp. Swift Corporation, a Nevada corporation formed in 2006, is the holding company for Swift Transportation Co. and its subsidiaries and IEL.
Swift’s predecessor was founded by Jerry Moyes, along with his father and brother, in 1966 and taken public on the NASDAQ stock market in 1990. In April 2007, Mr. Moyes and his wife contributed their ownership of all of the issued and outstanding shares of IEL to Swift Corporation in exchange for additional Swift Corporation shares. In May 2007, Mr. Moyes and the Moyes Affiliates contributed their shares of Swift Transportation common stock to Swift Corporation in exchange for additional Swift Corporation shares. Swift Corporation then completed its acquisition of Swift Transportation through a merger on May 10, 2007, thereby acquiring the remaining outstanding shares of Swift Transportation common stock. Upon completion of the 2007 Transactions, Swift Transportation became a wholly-owned subsidiary of Swift Corporation and at the close of the market on May 10, 2007, the common stock of Swift Transportation ceased trading on NASDAQ. Swift currently is controlled by Mr. Moyes and the Moyes Affiliates.
In April 2010, substantially all of our domestic subsidiaries were converted from corporations to limited liability companies. The subsidiaries not converted include our foreign subsidiaries, captive insurance companies, and certain dormant subsidiaries that were dissolved and liquidated.
101
Table of Contents
Management
Executive Officers and Directors
The following table sets forth the names, ages, and positions of our executive officers and directors as of July 21, 2010:
Name | Age | Position | ||||
| Jerry Moyes | 66 | Chief Executive Officer and Director | ||||
| Richard H. Dozer | 53 | Director | ||||
| David Vander Ploeg | 51 | Director | ||||
| Richard Stocking | 40 | President | ||||
| Virginia Henkels | 41 | Executive Vice President, Chief Financial Officer, and Treasurer | ||||
| James Fry | 48 | Executive Vice President, General Counsel, and Corporate Secretary | ||||
| Mark Young | 52 | Executive Vice President — Swift Transportation Co. of Arizona, LLC | ||||
| Kenneth C. Runnels | 45 | Executive Vice President, Eastern Region — Swift Transportation Co. of Arizona, LLC | ||||
| Rodney Sartor | 55 | Executive Vice President, Western Region — Swift Transportation Co. of Arizona, LLC | ||||
| Chad Killebrew | 35 | Executive Vice President, Business Transformation — Swift Transportation Co. of Arizona, LLC | ||||
Jerry Moyeshas been a director of Swift Corporation since its inception and Chief Executive Officer of Swift Corporation following the completion of the 2007 Transactions. In 1966, Mr. Moyes formed Common Market Distribution Corp., that was later merged with Swift Transportation, which his family purchased. In 1986, Mr. Moyes became Chairman of the board, President, and CEO of Swift Transportation, which positions he held until 2005. In October 2005, Mr. Moyes stepped down from his executive positions at Swift Transportation Co., although he continued to serve as a board member. Mr. Moyes has a history of leadership and involvement with the transportation and logistics industry, such as serving as past Chairman and President of the Arizona Trucking Association, board member and Vice President of the American Trucking Associations, Inc., and a board member of the Truckload Carriers Association. He has served as Chairman of the boards of directors and holds complete or significant ownership interest in Central Refrigerated Services, Inc., Central Freight Lines, Inc., SME Industries, Inc., Southwest Premier Properties, and various commercial and real estate interests with which he is affiliated.
Mr. Moyes was a member of the board of directors of the Phoenix Coyotes of the National Hockey League, or the NHL, from 2002 until 2009 and was the majority owner of the Phoenix Coyotes from September 2006 until November 2, 2009, when the team was purchased by the NHL out of a bankruptcy filed on May 5, 2009. On March 5, 2010, the NHL filed a complaint against Mr. Moyes in New York state court alleging breach of contract and breach of fiduciary duty claims for attempting to sell the Coyotes and for directing the Coyotes to file for bankruptcy, in each case without NHL consent, and seeking damages of at least approximately $60 million. The lawsuit has since been removed to federal court in Arizona, and Mr. Moyes has filed a motion to dismiss the NHL’s claims as preempted by federal bankruptcy law. Mr. Moyes also served from September 2000 until April 2002 as Chairman of the board of Simon Transportation Services Inc., a publicly traded trucking company providing nationwide, predominantly temperature-controlled, transportation services for major shippers. Simon Transportation Services Inc. filed for protection under Chapter 11 of the United States Bankruptcy Code on February 25, 2002, and was subsequently purchased from bankruptcy by Central Refrigerated Services, Inc.
In September 2005, the SEC filed a complaint in federal court in Arizona alleging that Mr. Moyes purchased an aggregate of 187,000 shares of Swift Transportation stock in May 2004 while he was aware of material non-public information. Mr. Moyes timely filed the required reports of such trades with the SEC, and
102
Table of Contents
voluntarily escrowed funds equal to his putative profits into a trust established by the company. After conducting an independent investigation of such purchases and certain other repurchases made by Swift Transportation that year at Mr. Moyes’ direction under its repurchase program, Swift instituted a stricter insider trading policy and a pre-clearance process for all trades made by insiders. Mr. Moyes stepped down as President in November 2004 and as Chief Executive Officer in October 2005. Mr. Moyes agreed, without admitting or denying any claims, to settle the SEC investigation and to the entry of a decree permanently enjoining him from violating securities laws, and paid approximately $1.5 million in disgorgement, prejudgment interest, and penalties.
Mr. Moyes graduated from Weber State University in 1966 with a bachelor of science degree in business administration. The Weber State College of Education is named after Mr. Moyes.
Richard H. Dozerhas served as a director of Swift Corporation since April 2008. Mr. Dozer is currently Chairman of GenSpring Family Office — Phoenix. Prior to this role, Mr. Dozer served as President of the Arizona Diamondbacks Major League Baseball team from its inception in 1995 until 2006, and Vice President and Chief Operating Officer of the Phoenix Suns National Basketball Association team from 1987 until 1995. Early in his career, he was an audit manager with Arthur Andersen and served as its Director of Recruiting for the Phoenix, Arizona office. Mr. Dozer holds a bachelor of science degree in business administration — accounting from the University of Arizona and is a former certified public accountant. Mr. Dozer currently serves on the boards of directors of Blue Cross Blue Shield of Arizona and Viad Corporation, a publicly traded company that provides exhibition, event, and retail marketing services, as well as travel and recreation services in North America, the United Kingdom, and the United Arab Emirates. Mr. Dozer is presently or has previously served on many boards, including Teach for America — Phoenix, Phoenix Valley of the Sun Convention and Visitor’s Bureau, Greater Phoenix Leadership, Greater Phoenix Economic Council, ASU-Board of the Dean’s Council of 100, Arizona State University MBA Advisory Council, Valley of the Sun YMCA, Nortust of Arizona, and others. Mr. Dozer’s qualifications to serve on our board of directors include his extensive experience serving as a director on the boards of public companies, including serving as the chair of the audit committee of Blue Cross Blue Shield of Arizona, as a member of the audit committee of Viad Corporation and as a director of Stratford American Corporation. Mr. Dozer also has financial experience from his audit manager position and other positions with Arthur Andersen from 1979 to 1987, during which time he held a certified public accountant license. In addition, Mr. Dozer has long-standing relationships within the business, political, and charitable communities in the State of Arizona.
David Vander Ploeghas served as a director of Swift Corporation since September 2009. Mr. Vander Ploeg has served as the Executive Vice President and Chief Financial Officer of School Specialty, Inc. since April 2008. Prior to this role, Mr. Vander Ploeg served as Chief Operating Officer of Dutchland Plastics Corp., from 2007 until April 2008. Prior to that role, Mr. Vander Ploeg spent 24 years at Schneider National, Inc., a provider of transportation and logistics services, and was Executive Vice President — Chief Financial Officer from 2004 until his departure in 2007. Prior to joining Schneider National, Inc., Mr. Vander Ploeg was a senior auditor for Arthur Andersen. Mr. Vander Ploeg holds a bachelor of science degree in accounting and a master’s degree in business administration from the University of Wisconsin-Oshkosh. He is a past board member at Dutchland Plastics and a member of the American Institute of Certified Public Accountants and the Wisconsin Institute of Certified Public Accountants. Mr. Vander Ploeg’s qualifications to serve on our board of directors include his24-year career at Schneider National, Inc., where he advanced through several positions of increasing responsibility and gained extensive experience in the transportation and logistics services industry.
Richard Stockinghas served as our President since July 2010 and as President and Chief Operating Officer of our trucking subsidiary, Swift Transportation Co. of Arizona, LLC, since January 2009. Mr. Stocking served as Executive Vice President, Sales of Swift from June 2007 until July 2010. Mr. Stocking previously served as Regional Vice President of Operations of the Central Region from October 2002 to March 2005, and as Executive Vice President of the Central Region from March 2005 to June 2007. Prior to these roles, Mr. Stocking held various operations and sales management positions with Swift over the preceding 11 years.
Virginia Henkelshas served as our Executive Vice President, Treasurer, and Chief Financial Officer since May 2008 and as our Corporate Secretary through May 2010. Ms. Henkels joined Swift in 2004 and, prior to her current position, was most recently the Assistant Treasurer and Investor Relations Officer. Prior to joining
103
Table of Contents
Swift, Ms. Henkels served in various finance and accounting leadership roles for Honeywell during a 12-year tenure. During her last six years at Honeywell, Ms. Henkels served as Director of Financial Planning and Reporting for its global industrial controls business segment, Finance Manager of its building controls segment in the United Kingdom, and Manager of External Corporate Reporting. Ms. Henkels completed her bachelor of science degree in finance and real estate at the University of Arizona, obtained her master’s degree in business administration from Arizona State University, and passed the May 1995 certified public accountant examination.
James Fryhas served as our Executive Vice President, General Counsel, and Corporate Secretary since May 2010. Mr. Fry joined Swift in January 2008 and prior to his current position he served as corporate counsel for us through August 2008 when he became General Counsel and Vice President. For the five-year period prior to joining us, Mr. Fry served as General Counsel for the publicly-traded company Global Aircraft Solutions, Inc. and its wholly-owned subsidiaries, Hamilton Aerospace and Worldjet Corporation. In addition to the foregoing General Counsel positions, Mr. Fry also served for eight years as in-house corporate counsel for both public and private aviation companies and worked in private practice in Pennsylvania for seven years prior to his in-house positions. Mr. Fry also served as a hearing officer for the county court in Pennsylvania. Mr. Fry received a bachelor’s degree with honors from the Pennsylvania State University and obtained his Juris Doctor from the Temple University School of Law. Mr. Fry is admitted to practice law in the State of Pennsylvania and is admitted as in-house counsel in the State of Arizona.
Mark Younghas served as Executive Vice President of Swift Transportation and President of our subsidiary, Swift Intermodal, LLC, since November 2005. Mr. Young joined us in 2004 and, prior to his current position, he served as Vice President of Swift Intermodal, LLC. Prior to joining us, Mr. Young worked in transportation logistics with Hub Group for five years as Vice President of National Sales, President of Hub Group in Texas, and President of Hub Group in Atlanta. Mr. Young was also employed by CSX Intermodal as Director of Sales for the southeast, southwest, and Mexico regions for eight years prior to his employment with Hub Group. Before joining CSX Intermodal, Mr. Young worked for ABF Freight System, Inc. where he held a variety of sales, operating, and management positions. Mr. Young received a bachelor of science in business administration from the University of Arkansas and is a graduate of the executive program, Darden School of Business, University of Virginia. Mr. Young is a member of the Intermodal Association of North America, National Freight Transportation Association, National Defense Transportation Association, and the Traffic Club of New York.
Kenneth C. Runnelshas served as Executive Vice President, Eastern Region Operations since November 2007. Mr. Runnels previously served as Vice President of Fleet Operations, Regional Vice President, and various operations management positions from 1983 to June 2006. From June 2006 until his return to Swift, Mr. Runnels was Vice President of Operations with U.S. Xpress Enterprises, Inc.
Rodney Sartorhas served as Executive Vice President, Western Region Operations since returning to Swift in May 2007. Mr. Sartor initially joined us in May 1979. He served as our Executive Vice President from May 1990 until November 2005, as Regional Vice President from August 1988 until May 1990, and as Director of Operations from May 1982 until August 1988. From November 2005 until May 2007, Mr. Sartor served as Vice President of Truckload Linehaul Operations for Central Freight Lines, Inc.
Chad Killebrewhas served as our Executive Vice President of Business Transformation since March 2008. Mr. Killebrew most recently served as President of IEL from 2005 to 2008, and as Vice President of our owner-operator division since 2007. He has held various positions in finance, operations, and recruiting with Swift and Central Refrigerated Services, Inc. from 1997 to 2005. Mr. Killebrew received a bachelor of science degree in finance from the University of Utah and a master’s degree in business administration from Westminster College. Mr. Killebrew is the nephew of Jerry Moyes.
Composition of Board
Our board of directors currently consists of three members, Messrs. Moyes, Dozer, and Vander Ploeg. Following the completion of this offering, we expect our board of directors to consist of five directors, four of whom we expect to qualify as independent directors under the corporate governance standards of the exchange on which we list our Class A common stock and the independence requirements ofRule 10A-3 of the
104
Table of Contents
Exchange Act. Our board of directors requires the separation of the offices of the Chairman of our board of directors and our Chief Executive Officer. Our board of directors will be free to choose the Chairman in any way that it deems best for us at any given point in time, provided that the Chairman not be our Chief Executive Officer or any other employee of our company, and a Chairman will be appointed prior to the consummation of this offering. If the Chairman of the board is not an independent director, our board’s independent directors will designate one of the independent directors on the board to serve as lead independent director. In addition, so long as our Chief Executive Officer is a permitted holder or an affiliated person under our certificate of incorporation, the Chairman of our board of directors must be an independent director. Conversely, so long as our Chairman is a permitted holder or an affiliated person under our certificate of incorporation, our Chief Executive Officer may not be a permitted holder or affiliated person thereunder. The duties of the Chairman, or the lead independent director if the Chairman is not independent, will include:
| • | presiding at all executive sessions of the independent directors; | |
| • | presiding at all meetings of our board of directors and the stockholders (in the case of the lead independent director, where the Chairman is not present); | |
| • | in the case of the lead independent director or the Chairman who is an independent director, coordinating the activities of the independent directors; | |
| • | preparing board meeting agendas in consultation with the CEO and lead independent director or Chairman, as the case may be, and coordinating board meeting schedules; | |
| • | authorizing the retention of outside advisors and consultants who report directly to the board; | |
| • | requesting the inclusion of certain materials for board meetings; | |
| • | consulting with respect to, and where practicable receiving in advance, information sent to the Board; | |
| • | collaborating with the CEO and lead independent director or Chairman, as the case may be, in determining the need for special meetings; | |
| • | in the case of the lead independent director, acting as liaison for stockholders between the independent directors and the Chairman, as appropriate; | |
| • | communicating to the CEO, together with the chairman of the compensation committee, the results of the board’s evaluation of the CEO’s performance; | |
| • | responding directly to stockholder and other stakeholder questions and comments that are directed to the Chairman of the board, or to the lead independent director or the independent directors as a group, as the case may be; and | |
| • | performing such other duties as our board of directors may delegate from time to time. |
In the absence or disability of the Chairman, the duties of the Chairman (including presiding at all meetings of our board of directors and the stockholders) shall be performed and the authority of the Chairman may be exercised by an independent director designated for this purpose by our board of directors. The Chairman of our board of directors (if he or she is an independent director) or the lead independent director, if any, may only be removed from such position with the affirmative vote of a majority of the independent directors, only for the reasons set forth in our bylaws, including a determination that the Chairman, or lead independent director, as the case may be, is not exercising his or her duties in the best interests of us and our stockholders.
Risk Management and Oversight
Our full board of directors oversees our risk management process. Our board of directors oversees a company-wide approach to risk management, carried out by our management. Our full board of directors determines the appropriate risk for us generally, assesses the specific risks faced by us, and reviews the steps taken by management to manage those risks.
While the full board of directors maintains the ultimate oversight responsibility for the risk management process, its committees oversee risk in certain specified areas. In particular, our compensation committee is responsible for overseeing the management of risks relating to our executive compensation plans and
105
Table of Contents
arrangements, and the incentives created by the compensation awards it administers. Our audit committee oversees management of enterprise risks as well as financial risks, and effective upon the consummation of this offering, will also be responsible for overseeing potential conflicts of interests. Effective upon the listing of our Class A common stock on an exchange, our nominating and corporate governance committee will be responsible for overseeing the management of risks associated with the independence of our board of directors. Pursuant to the board of directors’ instruction, management regularly reports on applicable risks to the relevant committee or the full board of directors, as appropriate, with additional review or reporting on risks conducted as needed or as requested by our board and its committees.
Board Committees
As a result of Mr. Moyes and the Moyes Affiliates controlling a majority of our voting common stock following consummation of this offering, we will qualify as a “controlled company” within the meaning of the corporate governance standards of the exchange on which we list our Class A common stock. As such, we will have the option to elect not to comply with certain of such listing standards. However, consistent with our plan to implement strong corporate governance standards, we do not intend to elect to be treated as a “controlled company.”
Our board of directors has an audit committee, compensation committee, and nominating and corporate governance committee, each of which has the composition and responsibilities described below. Members serve on these committees until their respective resignations or until otherwise determined by our board of directors. Our board of directors may from time to time establish other committees.
Audit committee
The audit committee:
| • | reviews the audit plans and findings of our independent registered public accounting firm and our internal audit and risk review staff, as well as the results of regulatory examinations, and tracks management’s corrective action plans where necessary; | |
| • | reviews our financial statements, including any significant financial itemsand/or changes in accounting policies, with our senior management and independent registered public accounting firm; | |
| • | reviews our financial risk and control procedures, compliance programs, and significant tax, legal, and regulatory matters; and | |
| • | has the sole discretion to appoint annually our independent registered public accounting firm, evaluate its independence and performance, and set clear hiring policies for employees or former employees of the independent registered public accounting firm. |
The audit committee currently consists of Messrs. Dozer (Chair) and Vander Ploeg, each of whom qualifies as an audit committee financial expert and as “independent” directors as defined under the rules of the exchange on which we list our Class A common stock andRule 10A-3 of the Exchange Act. Before the completion of this offering, we will appoint an additional director to the audit committee who will satisfy the same independence standards.
Compensation committee
The compensation committee:
| • | annually reviews corporate goals and objectives relevant to the compensation of our named executive officers and evaluates performance in light of those goals and objectives; | |
| • | approves base salary and other compensation of our named executive officers; | |
| • | oversees and periodically reviews the operation of all of Swift’s stock-based employee (including management and director) compensation plans; | |
| • | reviews and adopts all employee (including management and director) compensation plans, programs and arrangements, including stock option grants and other perquisites and fringe benefit arrangements; |
106
Table of Contents
| • | periodically reviews the outside directors’ compensation arrangements to ensure their competitiveness and compliance with applicable laws; and | |
| • | approves corporate goals and objectives and determines whether such goals are met. |
The compensation committee currently consists of Messrs. Dozer (Chair) and Vander Ploeg, each of whom is a “non-employee” director as defined inRule 16b-3(b)(3) under the Exchange Act, and an “outside” director within the meaning of Section 162(m)(4)(c)(i) of the Internal Revenue Code. Before the completion of this offering, we will appoint an additional director to the compensation committee who will satisfy the same independence standards.
Nominating and corporate governance committee
The nominating and corporate governance committee:
| • | is responsible for identifying, screening, and recommending candidates to the board for board membership; | |
| • | advises the board with respect to the corporate governance principles applicable to us; and | |
| • | oversees the evaluation of the board and management. |
Nominations of persons for election to the board of directors may be made by a stockholder of record on the date of the giving of notice as provided in our bylaws, and such nominees will be reviewed by our nominating and corporate governance committee.
The nominating and corporate governance committee currently consists of David Vander Ploeg (Chair) and Richard Dozer. Before the completion of this offering, we will appoint an additional director to the nominating and corporate governance committee who will satisfy the same independence standard.
Corporate Governance Policy
Our board of directors has adopted a corporate governance policy to assist the board in the exercise of its duties and responsibilities and to serve the best interests of us and our stockholders. A copy of this policy has been posted on our website. These guidelines, which provide a framework for the conduct of the board’s business, provide that:
| • | directors are responsible for attending board meetings and meetings of committees on which they serve and to review in advance of meetings material distributed for such meetings; | |
| • | the board’s principal responsibility is to oversee and direct our management in building long-term value for our stockholders and to assure the vitality of Swift for our customers, clients, employees, and the communities in which we operate; | |
| • | at least two-thirds of the board shall be independent directors, and other than our Chief Executive Officer and up to one additional non-independent director, all of the members of our board of directors shall be independent directors; | |
| • | our nominating and corporate governance committee is responsible for nominating members for election to our board of directors and will consider candidates submitted by stockholders; | |
| • | our board of directors believes that it is important for each director to have a financial stake in us to help align the director’s interests with those of our stockholders; | |
| • | although we do not impose a limit to the number of other public company boards on which a director serves, our board of directors expects that each member be fully committed to devoting adequate time to his or her duties to us; | |
| • | the independent directors meet in executive session on a regular basis, but not less than quarterly; | |
| • | each of our audit committee, compensation committee, and nominating and corporate governance committee must consist solely of independent directors; | |
| • | new directors participate in an orientation program and all directors are encouraged to attend, at our expense, continuing educational programs to further their understanding of our business and enhance their performance on our board; and |
107
Table of Contents
| • | our board of directors and its committees will sponsor annual self-evaluations to determine whether members of the board are functioning effectively. |
In addition, our governance policy includes a resignation policy requiring sitting directors to tender resignations if they fail to obtain a majority vote in uncontested elections.
Code of Ethics
The audit committee and our board of directors have adopted a code of ethics (within the meaning of Item 406(b) ofRegulation S-K) that will apply to our board of directors, Chief Executive Officer, Chief Financial Officer, Controller, and such other persons designated by our board of directors or an appropriate committee thereof. The board believes that these individuals must set an exemplary standard of conduct for us, particularly in the areas of accounting, internal accounting control, auditing, and finance. The code of ethics sets forth ethical standards the designated officers must adhere to. The code of ethics will be posted to our website.
Securities Trading Policy
Our securities trading policy prohibits officers, directors, employees, and key consultants from purchasing or selling any type of security, including derivative securities, whether issued by Swift or another company, while aware of material, non-public information relating to the issuer of the security or from providing such material, non-public information to any person who may trade while aware of such information. The policy may only be amended by an affirmative vote of a majority of our independent directors, including the affirmative vote of the Chairman of the board if the Chairman is an independent director, or the lead independent director if the Chairman is not an independent director. We restrict trading by our officers, directors, and certain employees and consultants designated by our board to quarterly trading windows that begin at the open of the market on the third full trading day following the date of public disclosure of our financial results for the prior fiscal quarter or year, and end on the earlier of 30 days thereafter and the last day of the month preceding the last month of the next quarter. For all other persons covered by our securities trading policy, the mandatory trading window will end two weeks prior to the end of the next quarter. The prohibition against trading while in possession of any material non-public information applies at all times, even during the trading windows described above. Our officers, directors, and certain employees and consultants may only engage in transactions designed to hedge the economic risk of stock ownership in our stock upon clearance from the General Counsel and Chief Financial Officer in consultation with the Chairman of our board of directors if the Chairman is an independent director, or the lead independent director if the Chairman is not an independent director. In addition, all persons covered by our securities trading policy are prohibited from speculating in our securities, through engaging in puts, calls, or short positions. Finally, all persons covered by our securities trading policy must obtain pre-clearance from the General Counsel and our Chief Financial Officer, regardless of whether in possession of material, non-public information, before purchasing securities of the company on margin or borrowing against an account in which the company’s securities are held. Any margin transaction or pledge arrangement proposed by a senior executive officer or director must also be pre-approved by the Chairman of our board of directors if the Chairman is an independent director, or the lead independent director if the Chairman is not an independent director, and may not represent (together with any of our securities already pledged by such person) greater than 20% of the total number of securities held by the person and affiliates of the person making such proposal.
Compensation Committee Interlocks and Insider Participation
During 2009, Mr. Moyes was a member of our compensation committee while also serving as our Chief Executive Officer and President. Mr. Moyes no longer serves as a member of our compensation committee and none of the members of our compensation committee is an officer or employee of Swift. None of our executive officers other than Mr. Moyes currently serves, or in the past year has served, as a member of the board of directors or compensation committee of any entity that has one or more executive officers serving on our board of directors or compensation committee.
108
Table of Contents
Director Compensation
We intend to pay an annual retainer fee to each non-employee director in an amount to be determined by our board of directors for participation in each in-person meeting and a fee in an amount to be determined by our board of directors for participation in each telephonic meeting. In addition, we intend to pay an annual fee in an amount to be determined by our board of directors to the chair of the nominating and governance committee, the chair of the compensation committee, and the chair of the audit committee.
Non-employee directors will receive, upon appointment to the board, a one-time grant of stock options for a number of shares of our common stock to be determined by our board of directors. These options vest upon the later of (i) the occurrence of an initial public offering of Swift or (ii) a five-year vesting period at a rate of 331/3% each year following the third anniversary date of the grant, subject to continued service. To the extent vested, these options will become exercisable simultaneously with the closing of this offering subject to a 180-day lock-up period beginning on the date of this prospectus. See “Underwriting.” Upon the closing of this offering, these options will convert into options to purchase shares of Class A common stock of Swift Holdings Corp.
There were no option grants made to non-employee directors in 2009. Mr. Vander Ploeg joined the board in September 2009 and did not receive any options in 2009. However, Mr. Vander Ploeg received a grant of options for 5,000 shares of our Class A common stock on February 25, 2010.
Our employees who serve as directors receive no additional compensation, although we may reimburse them for travel and other expenses. Mr. Moyes also serves as our Chief Executive Officer, and thus receives no additional compensation for serving as a director. Mr. Moyes’ compensation as Chief Executive Officer and President for 2009 is reported below under the heading “Executive Compensation — Summary Compensation Table.”
Following the offering, we may re-evaluate and, if appropriate, adjust the fees and stock options awarded to directors as compensation in order to ensure that our director compensation is commensurate with that of similarly situated public companies.
The following table provides information for the fiscal year ended December 31, 2009, regarding all plan and non-plan compensation awarded to, earned by, or paid to, each person who served as a director for some portion or all of 2009:
| Fees Earned | ||||||||
| or Paid | ||||||||
Name | in Cash | Total | ||||||
| Jerry Moyes(1) | $ | — | $ | — | ||||
| Earl Scudder(2) | $ | 30,500 | $ | 30,500 | ||||
| Jeff A. Shumway(3) | $ | 36,000 | $ | 36,000 | ||||
| Richard H. Dozer | $ | 53,000 | $ | 53,000 | ||||
| John Breslow(4) | $ | 10,000 | $ | 10,000 | ||||
| David Vander Ploeg | $ | 23,000 | $ | 23,000 | ||||
| (1) | Jerry Moyes also serves as our Chief Executive Officer and previously served as our President during 2009. Employees of Swift who serve as directors receive no additional compensation, although we may reimburse them for travel and other expenses. See below for disclosure of Mr. Moyes’ compensation as Chief Executive Officer and President for 2009. | |
| (2) | Earl Scudder resigned from our board of directors and all committees effective July 21, 2010. | |
| (3) | Jeff A. Shumway resigned from our board of directors and all committees effective July 21, 2010. | |
| (4) | John Breslow resigned from our board of directors and all committees effective May 5, 2009. |
As of December 31, 2009, each of our non-employee directors, except for Mr. Vander Ploeg, held options to acquire 5,000 shares of our common stock.
109
Table of Contents
Executive Compensation
Compensation Discussion and Analysis
Introduction
The purpose of this compensation discussion and analysis, or CD&A, is to provide information about the compensation earned by our named executive officers (as such term is defined in the “Summary Compensation Table” section below) and to explain our compensation process and philosophy and the policies and factors that underlie our decisions with respect to the named executive officers’ compensation. As we describe in more detail below, the principal objectives of our executive compensation strategy are to attract and retain talented executives, reward strong business results and performance, and align the interest of executives with our stockholders. In addition to rewarding business and individual performance, the compensation program is designed to promote both annual performance objectives and longer-term objectives.
What are our processes and procedures for considering and determining executive compensation?
Following the completion of this offering, our designated compensation committee of the board of directors will be responsible for reviewing and approving the compensation of the Chief Executive Officer and the other named executive officers. Compensation for our named executive officers is established based upon the scope of their responsibilities, experience, and individual and company performance, taking into account the compensation level from their recent prior employment, if applicable. In 2009, the compensation committee consisted of Messrs. Dozer (Chair), Vander Ploeg, and Shumway, and Mr. Moyes, our Chief Executive Officer. From July 21, 2010 and after the completion of the offering, the compensation committee will consist entirely of “non-employee directors” as defined inRule 16b-3(b)(3) under the Exchange Act, “outside” directors within the meaning of Section 162(m)(4)(c)(i) of the Internal Revenue Code, and “independent” directors as defined under the rules of the exchange on which we list our Class A common stock.
Following the completion of the offering, the compensation committee’s responsibilities will include, but not be limited to:
| • | administering all of Swift’s stock-based and other incentive compensation plans; | |
| • | annually reviewing corporate goals and objectives relevant to the compensation of our named executive officers and evaluating performance in light of those goals and objectives; | |
| • | approving base salary and other compensation of our named executive officers; | |
| • | overseeing and periodically reviewing the operation of all of Swift’s stock-based employee (including management and director) compensation plans; | |
| • | reviewing and adopting all employee (including management and director) compensation plans, programs, and arrangements, including stock option grants and other perquisites, and fringe benefit arrangements; | |
| • | periodically reviewing the outside directors’ compensation arrangements to ensure their competitiveness and compliance with applicable laws; and | |
| • | approving corporate goals and objectives and determining whether such goals have been met. |
Role of compensation consultants. The compensation committee has the authority to obtain advice and assistance from outside legal, accounting, or other advisors and consultants as deemed appropriate to assist in the continual development and evaluation of compensation policies and determination of compensation awards. We did not utilize outside consultants in evaluating our compensation policies and awards during 2009, 2008, or 2007.
Role of management in determining executive compensation. Our Chief Financial Officer and our President provide information to the compensation committee on our financial performance for consideration in determining the named executive officers’ compensation. Our Chief Financial Officer and our President also assist the compensation committee in recommending salary levels and the type and structure of other awards.
110
Table of Contents
What are the objectives of our compensation programs?
The principal objectives of our executive compensation programs are to attract, retain, and motivate talented executives, reward strong business results and performance, and align the executive’s interests with stockholder interests. The objectives are based on the following core principles, which we explain in greater detail below:
| • | Business performance accountability. Compensation should be tied to our performance in key areas so that executives are held accountable through their compensation for our performance. | |
| • | Individual performance accountability. Compensation should be tied to an individual’s performance so that individual contributions to our performance are rewarded. | |
| • | Alignment with stockholder interests. Compensation should be tied to our performance through stock incentives so that executives’ interests are aligned with those of our stockholders. | |
| • | Retention. Compensation should be designed to promote the retention of key employees. | |
| • | Competitiveness. Compensation should be designed to attract, retain, and reward key leaders critical to our success by providing competitive total compensation. |
What are the elements of our compensation program?
In general, our compensation program consists of three major elements: base salary, performance-based annual cash incentives, and long-term incentives designed to promote long-term performance and key employee retention. Our named executive officers are not employed pursuant to employment agreements.
Base salary. The compensation committee, with the assistance of our Chief Executive Officer with respect to the other named executive officers, annually reviews the base salary of each named executive officer. If appropriate, adjustments are made to base salaries as a result. Annual salaries are based on our performance for the fiscal year and subjective evaluation of each executive’s contribution to that performance.
The following base annual salaries were effective in 2009 for the named executive officers: Mr. Moyes — $500,000; Mr. Stocking — $400,000; Ms. Henkels — $275,000; Mr. Runnels — $218,000; and Mr. Sartor — $217,984.
Annual cash incentives. Annual incentives in our compensation program are cash-based. The compensation committee believes that annual cash incentives promote superior operational performance, disciplined cost management, and increased productivity and efficiency that contribute significantly to positive results for our stockholders. Our compensation structure provides for annual performance incentives that are linked to our earnings objectives for the year and intended to compensate our named executive officers (other than Mr. Moyes) for our overall financial performance. Mr. Moyes is not eligible for the annual performance incentives. The annual incentive process involves the following basic steps:
| • | establishing our overall performance goals; | |
| • | setting target incentives for each individual; and | |
| • | measuring our actual financial performance against the predetermined goals to determine incentive payouts. |
The steps for the 2009 annual bonus are described below:
(1) Establishing our performance goals. In March 2009, the compensation committee set our performance goals for establishing the company-wide bonus program for the 2009 fiscal year, which were approved by our board of directors on March 23, 2009. Such goals were set in order to incentivize management to improve profitability and thereby increase long-term stockholder value. For fiscal year 2009, the bonus percentages were determined based on us meeting specified full year adjusted earnings before interest, taxes, depreciation and amortization, or EBITDA, levels. Adjusted EBITDA for this purpose means the adjusted EBITDA for Swift for the 2009 fiscal year, adjusted to remove the impact of restructuring charges and severance charges, for gains and losses on divestitures, discontinued operations, impairments, cancellation of debt income, other unusual and non-recurring items, and unbudgeted
111
Table of Contents
material acquisitions and divestitures, at the discretion of the compensation committee. The 2009 bonus payout percentages upon attainment of certain levels of adjusted EBITDA were as follows:
Level of Attainment: | Threshold | Target | Stretch | Maximum | ||||||||||||
| (Dollars in thousands) | ||||||||||||||||
| Adjusted EBITDA | $ | 485,000 | $ | 495,000 | $ | 550,000 | $ | 600,000 | ||||||||
| Bonus Payout % | 50% | 100% | 150% | 200% | ||||||||||||
(2) Setting a target incentive. Target incentive amounts for each named executive officer other than the Chief Executive Officer, expressed as a percentage of the executive’s base salary, are based on job grade. The actual payments these named executive officers receive corresponds to the percentage of their individual target incentive multiplied by the percentage of the corresponding bonus payout, which may be adjusted based on overall team performance, terminal or department performance, and individual performance. The target incentive for each of the named executive officers other than the Chief Executive Officer for 2009 were the following: 70% for Mr. Stocking and 50% for Ms. Henkels and Messrs. Sartor and Runnels.
(3) Measuring performance. The compensation committee reviewed Swift’s actual performance against the established goals and determined that the performance targets to qualify for a 2009 bonus were not met and, accordingly, no bonuses were paid in 2009.
For the 2010 annual bonus, the compensation committee set company-wide performance goals for the 2010 fiscal year, which were approved by the board of directors on May 20, 2010. The bonus payout percentages are determined based on our meeting specified Adjusted EBITDA levels. Adjusted EBITDA for this purpose means net income or loss plus (i) depreciation and amortization, (ii) interest and derivative interest expense, including other fees and charges associated with indebtedness, net of interest income, (iii) income taxes, (iv) non-cash impairments, (v) non-cash equity compensation expense, (vi) other extraordinary or unusual non-cash items, and (vii) excludable transaction costs. The 2010 bonus payout percentages upon attainment of certain levels of Adjusted EBITDA are as follows:
Level of Attainment: | Threshold | Target | Stretch | Maximum | ||||||||||||
| (Dollars in thousands) | ||||||||||||||||
| Adjusted EBITDA | $ | 440,000 | $ | 450,000 | $ | 475,000 | $ | 500,000 | ||||||||
| Bonus Payout % | 50% | 100% | 150% | 200% | ||||||||||||
The 2010 target incentive amounts for each named executive officer (other than the Chief Executive Officer), expressed as a percentage of the executive’s base salary, are based on the executive’s job grade. The actual payments will be based on achievement of the incentives criteria and individual performance. The target incentive for each of the named executive officers (other than the Chief Executive Officer) for 2010 are the following: 70% for Mr. Stocking and 50% for Ms. Henkels and Messrs. Sartor and Runnels.
Long-term incentives. Long-term incentives in our compensation program are principally stock-based. Our stock-based incentives in 2009 consisted of stock options granted under our 2007 equity incentive plan and are designed to promote long-term performance and the retention of key employees. The board of directors grants stock options to individual employees and executives in the form of stock option grants, in amounts determined based on pay grade. The objective of the program is to align compensation over a multi-year period with the interests of our stockholders by motivating and rewarding the creation and preservation of long-term stockholder value. The level of long-term incentive compensation is determined based on an evaluation of competitive factors in conjunction with total compensation provided to the named executive officers and the goals of the compensation program described above.
The options granted to individuals having a salary grade of 31 or above (including all of our named executive officers, except Ms. Henkels who holds Tier II options granted in the past), or Tier I options, will vest (i) upon the occurrence of a sale or a change in control of Swift or, if earlier, (ii) over a five-year vesting period at a rate of 331/3% beginning with the third anniversary date of the grant, subject to continued employment. The options granted to individuals having a salary grade of 30 and below, or Tier II options, will vest upon (A) the later of (i) the occurrence of an initial public offering of Swift stock or (ii) a five-year vesting period at a rate of 331/3% beginning with the third anniversary date of the grant, or (B) immediately
112
Table of Contents
upon a change in control of Swift, in any case subject to continued employment. To the extent vested, both Tier I options and Tier II options will become exercisable simultaneously with the closing of the earlier of an initial public offering of Swift stock, a sale, or a change in control of Swift (subject to any applicable blackout period).
Under our 2007 equity incentive plan, our board of directors approved in October 2007 option awards to a group of employees based on salary grade. In August 2008 and December 2009, additional option awards were approved by our board of directors and granted to groups of employees based on salary grade that were hired or promoted subsequent to the 2007 grant, including a December 2009 grant of options for 50,000 shares of our common stock to Mr. Stocking in connection with his promotion to Chief Operating Officer. Effective February 25, 2010, the board of directors approved and granted options for 1.8 million shares of our common stock to certain employees at an exercise price of $7.04 per share, which equaled the fair value of the common stock on the date of grant. Fair market value was determined by a third-party valuation analysis performed within 90 days of the date of grant and considered a number of factors, including our discounted, projected cash flows, comparative multiples of similar companies, the lack of liquidity of our common stock, and certain risks we faced at the time of the valuation. The options granted on February 25, 2010 included options for the following number of shares of our common stock for our named executive officers: Mr. Moyes — 0; Mr. Stocking — 40,000; Ms. Henkels — 30,000; Mr. Sartor — 15,000; and Mr. Runnels — 30,000. Upon the closing of this offering, all outstanding options will convert into options to purchase shares of Class A common stock of Swift Holdings Corp. Future options may be approved and granted by the compensation committee and the board of directors.
What will the equity compensation arrangements be following the completion of this offering?
Following the completion of this offering, we will continue to grant awards under our 2007 equity incentive plan, the terms of which are described under the heading “2007 Equity Incentive Plan” below and which will remain materially the same. The purposes of our 2007 equity incentive plan are to provide incentives to certain of our employees, directors, and consultants in a manner designed to reinforce our performance goals, and to continue to attract, motivate, and retain key personnel on a competitive basis. To accomplish these purposes, our 2007 equity incentive plan provides for the issuance of stock options, stock appreciation rights, restricted and unrestricted stock, restricted stock units, performance units, and other incentive awards.
While we intend to issue stock options in the future to employees as a recruiting and retention tool, we have not established specific parameters regarding future grants. Our compensation committee will determine the specific criteria for future equity grants under our 2007 equity incentive plan.
Have we entered into individual agreements with our named executive officers?
We have not entered and do not anticipate entering into employment or change in control or severance agreements with any of our named executive officers in connection with this offering.
Do we provide any material perquisites to our named executive officers?
We do not offer any material perquisites.
How does each element of compensation and our decisions regarding that element fit into our overall compensation objectives and affect decisions regarding other elements?
Before establishing or recommending executive compensation payments or awards, the compensation committee considers all the components of such compensation, including current pay (salary and bonus), annual and long-term incentive awards, and prior grants. The compensation committee considers each element in relation to the others when setting total compensation, with a goal of setting overall compensation at levels that the compensation committee believes are appropriate.
113
Table of Contents
What impact do taxation and accounting considerations have on the decisions regarding executive compensation?
The compensation committee also takes into account tax and accounting consequences of the total compensation program and the individual components of compensation, and weighs these factors when setting total compensation and determining the individual elements of an officer’s compensation package. We do not believe that the compensation paid to our named executive officers is or will be subject to limits of deductibility under the Internal Revenue Code.
Summary Compensation Table
The following table provides information about compensation awarded and earned during 2009, 2008, and 2007 by our Chief Executive Officer, Chief Financial Officer, and the three most highly compensated executive officers (other than the Chief Executive Officer and Chief Financial Officer), or collectively, the named executive officers. The tables exclude compensation paid to the named executive officers prior to the 2007 Transactions.
| �� | Non-Equity | |||||||||||||||||||||||||||
| Option | Incentive Plan | All Other | ||||||||||||||||||||||||||
Name and Principal Position | Year | Salary | Bonus(1) | Awards(2) | Compensation(3) | Compensation(4) | Total | |||||||||||||||||||||
| Jerry Moyes, | 2009 | $ | 490,385 | $ | — | $ | — | $ | — | $ | 10,256 | $ | 500,641 | |||||||||||||||
| Chief Executive | 2008 | $ | 500,000 | $ | 87,500 | $ | — | $ | — | $ | 10,256 | $ | 597,756 | |||||||||||||||
| Officer | 2007 | $ | 311,538 | $ | — | $ | — | $ | 178,250 | $ | 6,644 | $ | 496,432 | |||||||||||||||
| Virginia Henkels | 2009 | $ | 269,711 | $ | — | $ | — | $ | — | $ | 10,256 | $ | 279,967 | |||||||||||||||
| Executive Vice President and Chief Financial Officer(5) | 2008 | $ | 235,385 | $ | 34,375 | $ | 776,250 | $ | — | $ | 14,751 | $ | 1,060,761 | |||||||||||||||
| Richard Stocking, | 2009 | $ | 386,707 | $ | — | $ | 169,500 | $ | — | $ | 11,447 | $ | 567,654 | |||||||||||||||
| President and Chief | 2008 | $ | 231,985 | $ | 27,248 | $ | — | $ | — | $ | 13,252 | $ | 272,485 | |||||||||||||||
| Operating Officer | 2007 | $ | 142,435 | $ | — | $ | 492,000 | $ | 110,413 | $ | 8,709 | $ | 753,557 | |||||||||||||||
| Rodney Sartor, | 2009 | $ | 213,792 | $ | — | $ | — | $ | — | $ | 10,256 | $ | 224,048 | |||||||||||||||
| Executive Vice President | 2008 | $ | 217,984 | $ | 27,248 | $ | — | $ | — | $ | 10,676 | $ | 255,908 | |||||||||||||||
| 2007 | $ | 134,144 | $ | — | $ | 492,000 | $ | 110,413 | $ | 5,957 | $ | 742,514 | ||||||||||||||||
| Kenneth Runnels, | 2009 | $ | 213,808 | $ | — | $ | — | $ | — | $ | 10,909 | $ | 224,717 | |||||||||||||||
| Executive Vice President(5) | 2008 | $ | 218,000 | $ | 27,250 | $ | 931,500 | $ | — | $ | 55,311 | $ | 1,232,061 | |||||||||||||||
| (1) | Amounts in this column represent discretionary cash bonuses paid in fiscal 2008 to the respective named executive officers as described in Note 3 below. | |
| (2) | This column represents the grant date fair value of stock options under Topic 718 granted to each of the named executive officers in 2009, 2008, and 2007. For additional information on the valuation assumptions with respect to the 2009, 2008, and 2007 grants, refer to Note 19 of Swift Corporation’s audited consolidated financial statements. See “—Grants of Plan-Based Awards in 2009” in this prospectus for information on options granted in 2009. | |
| (3) | This column represents the cash incentive compensation amounts approved by the compensation committee and Chief Executive Officer paid to the named executive officers. The amounts for a given year represent the amount of incentive compensation earned with respect to such year. The bonuses were calculated based on our actual financial performance for 2009 and 2008 and pro forma financial performance for 2007, as compared with established targets. The performance targets to qualify for a 2009 bonus were not met and, accordingly, no awards were paid in 2009. For the 2008 cash bonuses, the Chief Executive Officer determined in December 2008 that, even though we would not achieve the 2008 performance targets in order to qualify for payout under the 2008 bonus plan, Swift would make a discretionary payout in amounts generally equal to 25% of what each employee’s target bonus was under the 2008 bonus plan. These cash bonuses were paid to the named executive officers at the end of 2008 and are reflected in the “Bonus” column rather than the “Non-Equity Incentive Plan Compensation” column. For the 2007 cash bonuses, the Chief Executive Officer determined in December 2007 that the annual performance targets |
114
Table of Contents
| would be met and, consistent with our past practice of paying bonuses before Christmas, determined to make partial payments of the annual bonuses to the named executive officers and other of our employees. The final payment of bonuses was made in February 2008 after the Chief Executive Officer determined the unpaid amount owing to each employee upon Swift’s final determination of financial performance for 2007. | ||
| (4) | This column represents all other compensation paid to the named executive officers for employer 401(k) matches, executive disability insurance, car allowance, and other benefits, none of which individually exceeded $10,000. | |
| (5) | Ms. Henkels first became an executive officer on May 1, 2008, and Mr. Runnels was hired as an executive officer on November 28, 2007. |
Grants of Plan-Based Awards in 2009
The following table provides information about equity and non-equity plan-based awards granted to the named executive officers in 2009. No options were granted to Mr. Moyes, Ms. Henkels, Mr. Sartor, or Mr. Runnels in 2009.
| All Other | ||||||||||||||||||||||||||||
| Option | Exercise | |||||||||||||||||||||||||||
| Awards: | or Base | |||||||||||||||||||||||||||
| Number of | Price of | Grant Date | ||||||||||||||||||||||||||
| Board | Estimated Possible Payouts Under | Securities | Option | Fair Value of | ||||||||||||||||||||||||
| Grant | Approval | Non-Equity Incentive Plan Awards(1) | Underlying | Awards | Option | |||||||||||||||||||||||
Name | Date | Date | Threshold | Target | Maximum | Options (#)(2) | ($/SH)(3) | Awards | ||||||||||||||||||||
| Jerry Moyes | — | — | — | — | — | — | — | — | ||||||||||||||||||||
| Virginia Henkels | — | — | $ | 68,750 | $ | 137,500 | $ | 275,000 | — | — | — | |||||||||||||||||
| Richard Stocking | 12/31/2009 | 11/24/2009 | — | — | — | 50,000 | $ | 6.89 | $ | 169,500 | ||||||||||||||||||
| — | — | $ | 100,000 | $ | 200,000 | $ | 400,000 | — | — | — | ||||||||||||||||||
| Rodney Sartor | — | — | $ | 54,496 | $ | 108,992 | $ | 217,984 | — | — | — | |||||||||||||||||
| Kenneth Runnels | — | — | $ | 54,500 | $ | 109,000 | $ | 218,000 | — | — | — | |||||||||||||||||
| (1) | These columns represent the potential value of 2009 annual cash incentive payouts for each named executive officer, for which target amounts were approved by the compensation committee in March 2009. As discussed in Note 3 to the “Summary Compensation Table,” the 2009 performance targets to qualify for a payout under the 2009 plan were not met and, accordingly, no awards were paid under this plan. Mr. Moyes is not eligible for the annual cash incentive. | |
| (2) | This column shows the number of stock options granted in 2009 to the named executive officers. The options granted to Mr. Stocking are Tier I options and will vest (i) upon the occurrence of the earlier of a sale or a change in control of Swift or, if earlier (ii) a five-year vesting period at a rate of 331/3% beginning with the third anniversary date of the grant. To the extent vested, these options will become exercisable simultaneously with the closing of the earlier of (i) an initial public offering of Swift stock, (ii) a sale, or (iii) change in control of Swift. | |
| (3) | This column shows the exercise price for the stock options granted, as determined by our board of directors, which equaled the fair value of the common stock on the date of grant. |
115
Table of Contents
Outstanding Equity Awards at Fiscal Year-End 2009
The following table provides information on the current holdings of stock options of the named executive officers. This table includes unexercised and unvested options as of December 31, 2009. Each equity grant is shown separately for each named executive officer.
| Number of | Number of | |||||||||||||||
| Securities | Securities | |||||||||||||||
| Underlying | Underlying | |||||||||||||||
| Unexercised | Unexercised | Option | Option | |||||||||||||
| Options (#) | Options (#) | Exercise | Expiration | |||||||||||||
Name | Exercisable | Unexercisable | Price | Date | ||||||||||||
| Jerry Moyes | — | — | $ | — | — | |||||||||||
| Virginia Henkels | — | 25,000 | (1) | $ | 12.50 | 10/16/2017 | ||||||||||
| — | 125,000 | (1) | $ | 13.43 | 8/27/2018 | |||||||||||
| Richard Stocking | — | 150,000 | (2) | $ | 12.50 | 10/16/2017 | ||||||||||
| — | 50,000 | (2) | $ | 6.89 | 12/31/2019 | |||||||||||
| Rodney Sartor | — | 150,000 | (2) | $ | 12.50 | 10/16/2017 | ||||||||||
| Kenneth Runnels | — | 150,000 | (2) | $ | 13.43 | 8/27/2018 | ||||||||||
| (1) | The stock options are Tier II options and will vest upon (A) the later of (i) the occurrence of an initial public offering of Swift or (ii) a five-year vesting period at a rate of 331/3% beginning with the third anniversary date of the grant, or (B) immediately upon a change in control. The grant dates for Ms. Henkels’ awards of 25,000 stock options and 125,000 stock options were October 16, 2007 and August 27, 2008, respectively. To the extent vested, the options will become exercisable simultaneously with the closing of the earlier of (i) an initial public offering, (ii) a sale, or (iii) a change in control of Swift. | |
| (2) | The stock options are Tier I options and will vest upon the occurrence of the earliest of (i) a sale or a change in control of Swift or (ii) a five-year vesting period at a rate of 331/3% beginning with the third anniversary date of the grant. The grant dates for Mr. Stocking’s awards of 150,000 stock options and 50,000 stock options were October 16, 2007 and December 31, 2009, respectively. The grant date for Mr. Sartor’s award of 150,000 stock options was October 16, 2007. The grant date for Mr. Runnels’s award of 150,000 stock options was August 27, 2008. To the extent vested, the options will become exercisable simultaneously with the closing of the earlier of (i) an initial public offering, (ii) a sale, or (iii) a change in control of Swift. |
Option Exercises and Stock Vested in 2009, 2008, and 2007
No named executive officer exercised stock options in 2009, 2008, or 2007.
Potential Payments Upon Termination or Change in Control
We do not currently have employment, change in control, or severance agreements with any of our named executive officers.
As described above under the heading “What are the elements of our compensation program? — Long-term incentives,” pursuant to the named executive officers’ individual option award agreements, options held by the named executive officers all vest upon a change in control of Swift. However, based on the estimated fair value of a share of our common stock of $6.89 as of December 31, 2009, none of these outstanding options had any “spread value” as of that date.
Retirement
We do not provide any retirement benefits to our named executive officers other than our 401(k) plan, which is available to all employees meeting the plan’s basic eligibility requirements.
116
Table of Contents
2007 Equity Incentive Plan
The following description summarizes the features of our 2007 equity incentive plan:
A total of 10,000,000 shares of common stock have been reserved and are available for issuance under our 2007 equity incentive plan. Of these, 7,757,500 are subject to outstanding option grants and are not available for grant unless forfeited, expired, or cancelled prior to exercise. Our 2007 equity incentive plan is administered by the compensation committee or such other committee as our board of directors may designate, provided that following the offering the compensation committee will consist of two or more “non-employee directors” within the meaning of the applicable regulations under Section 162(m) of the Internal Revenue Code (to the extent this provision is applicable). The compensation committee interprets our plan and may prescribe, amend, and rescind rules and make all other determinations necessary or desirable for the administration of our 2007 equity incentive plan. Our 2007 equity incentive plan permits the compensation committee to select participants, to determine the terms and conditions of awards, including but not limited to acceleration of the vesting, exercise, or payment of an award, and the establishment of other types of awards besides those specifically enumerated in our 2007 equity incentive plan. Awards with respect to no more than 1,000,000 shares may be made to any recipient in any one calendar year.
The compensation committee may, in its sole discretion, grant performance awards in the form of stock awards, awards of performance units valued by reference to criteria established by the compensation committee,and/or cash awards. In the event that the compensation committee grants a performance award intended to constitute qualified performance-based compensation within the meaning of Section 162(m) of the Internal Revenue Code, the following rules will apply:
(1) The award will be distributed only to the extent that the applicable performance goals for the applicable performance period are achieved, and such achievement is certified in writing by the compensation committee following the completion of the performance period.
(2) The performance goals will be established in writing by the compensation committee not later than 90 days after the commencement of the period of service to which the award relates (but in no event after 25% of the period of service has elapsed).
(3) The performance goal(s) to which the award related may be based on one or more of the following business criteria applied to us:
| • | Operating revenue (including without limitation revenue per mile or revenue per tractor) or net operating revenue | |
| • | Fuel surcharges | |
| • | Accounts receivable collection or days sales outstanding | |
| • | Cost reductions and savings or limits on cost increases | |
| • | Safety and claims (including without limitation accidents per million miles and number of significant accidents) | |
| • | Operating income | |
| • | Operating ratio or Adjusted Operating Ratio | |
| • | EBITDA or Adjusted EBITDA, as applicable | |
| • | Income before taxes | |
| • | Net income or adjusted net income | |
| • | Earnings per share or adjusted earnings per share | |
| • | Stock price | |
| • | Working capital measures | |
| • | Return on assets or return on revenues | |
| • | Debt-to-equity ordebt-to-capitalization (with or without lease adjustment) |
117
Table of Contents
| • | Productivity and efficiency measures (including without limitation driver turnover,trailer-to-tractor ratio, andtractor-to-non-driver ratio) | |
| • | Cash position or cash flow measures (including without limitation free cash flow) | |
| • | Return on stockholders’ equity or return on invested capital | |
| • | Market share | |
| • | Economic value added | |
| • | Completion of acquisitions (either with or without specified size) | |
| • | Personal goals or objectives, as established by the compensation committee as it deems appropriate, including, without limitation, implementation of our policies, negotiation of significant corporate transactions, development of long-term business goals or strategic plans for us, and exercise of specific areas of managerial responsibility |
We may issue stock options under our 2007 equity incentive plan. These stock options may be “incentive stock options” intended to qualify as such under Section 422 of the Internal Revenue Code, or nonqualified stock options. The option exercise price of all stock options granted under our plan shall be no less than 100% of the fair market value of the common stock on the date of grant. The term of stock options granted under our 2007 equity incentive plan may not exceed ten years. Each stock option will be exercisable at such time and pursuant to such terms and conditions as determined by the compensation committee. Incentive stock options issued under our 2007 equity incentive plan must comply with Section 422 of the Internal Revenue Code, including the $100,000 limitation on the aggregate fair market value of incentive stock options first exercisable by a participant during a calendar year.
Stock appreciation rights may be granted under our 2007 equity incentive plan, either alone or in conjunction with all or part of any option granted under our 2007 equity incentive plan.
Restricted stock or other share-based awards may be granted under our 2007 equity incentive plan. Such stock awards may be subject to performance criteria, and the length of the applicable performance period, the applicable performance goals, and the measure of attainment will be determined by the compensation committee in its discretion.
We may issue restricted stock units, which are awards in the form of a right to receive shares of our Class A common stock on a future date. We also may grant performance units, which are units valued by reference to designated criteria established by the compensation committee, other than common stock.
Absent a provision in our 2007 equity incentive plan or the applicable award agreement to the contrary, payments of awards issued under our 2007 equity incentive plan may, at the discretion of the compensation committee, be made in cash, Class A common stock, a combination of cash and Class A common stock, or any other form of property as the compensation committee shall determine.
In the event of a stock dividend or split, reorganization, recapitalization, merger, consolidation, spin-off, combination, or transaction or exchange of common stock or other corporate exchange, or any similar transaction resulting in a change to our capital structure, the compensation committee shall make substitutions or adjustments to the maximum number of shares available for issuance under our 2007 equity incentive plan, the maximum award payable under our 2007 equity incentive plan, the number of shares to be issued pursuant to outstanding awards, the purchase or exercise prices of outstanding awards, and any other affected terms of an award of our 2007 equity incentive plan as the compensation committee in its sole discretion deems appropriate, subject to compliance with Section 162(m) of the Internal Revenue Code with respect to awards intended to qualify thereunder as “performance-based compensation.”
Our 2007 equity incentive plan provides the compensation committee with authority to amend or terminate our plan, but no such action may materially and adversely affect the rights of a participant with respect to previously-granted awards without the participant’s consent. Stockholder approval of any such action will be obtained if required to comply with applicable law.
We intend to file with the SEC a registration statement onForm S-8 covering the shares issuable under our 2007 equity incentive plan.
118
Table of Contents
Principal Stockholders
Prior to this offering, all of the ownership interests in Swift Corporation were owned by Mr. Moyes and the Moyes Affiliates.
The following table sets forth information with respect to the beneficial ownership of shares of our Class A common stock and Class B common stock, as adjusted to reflect the sale of shares of our Class A common stock in this offering, for:
| • | all of our executive officers and directors as a group; | |
| • | each of our named executive officers; | |
| • | each of our directors; and | |
| • | each beneficial owner of more than 5% of any class of our outstanding shares. |
The percentage of beneficial ownership of our common stock before this offering is based on 75,145,892 shares of common stock issued and outstanding as of July 21, 2010. The percentage of beneficial ownership of our common stock after this offering is based on shares of common stock to be issued and outstanding after giving effect to the shares of Class A common stock we are selling in this offering. The table assumes that the underwriters will not exercise their over-allotment option.
| Shares Beneficially Owned | Shares Beneficially Owned | |||||||||||||||||||||||||||
| Before the Offering | After the Offering | |||||||||||||||||||||||||||
| Percent | Percent | Percent | Percent | |||||||||||||||||||||||||
| of Total | of Total | Class of | of Total | of Total | ||||||||||||||||||||||||
| Common | Voting | Common | Common | Voting | ||||||||||||||||||||||||
Name and Address of Beneficial Owner(1)(2) | Number | Stock | Power | Stock | Number | Stock(3) | Power(4) | |||||||||||||||||||||
Named Executive Officers and Directors: | ||||||||||||||||||||||||||||
| Jerry Moyes(5) | 54,995,230 | 73.2 | % | 73.2 | % | B | % | % | ||||||||||||||||||||
| Virginia Henkels(6) | 25,000 | * | * | A | % | % | ||||||||||||||||||||||
| Richard Stocking(7) | 150,000 | * | * | A | % | % | ||||||||||||||||||||||
| Rodney Sartor(8) | 150,000 | * | * | A | % | % | ||||||||||||||||||||||
| Kenneth Runnels | — | — | — | A | % | % | ||||||||||||||||||||||
| Richard H. Dozer | — | — | — | A | % | % | ||||||||||||||||||||||
| David Vander Ploeg | — | — | — | A | % | % | ||||||||||||||||||||||
| All executive officers and directors as a group (10 persons) | 55,320,230 | 73.2 | % | 73.2 | % | — | % | % | ||||||||||||||||||||
Other 5% Stockholders: | ||||||||||||||||||||||||||||
| Various Moyes Children’s Trusts(9) | 20,150,662 | 26.8 | % | 26.8 | % | B | % | % | ||||||||||||||||||||
| * | Represents less than 1% of the outstanding shares of our common stock. | |
| (1) | Except as otherwise indicated, addresses arec/o Swift, 2200 South 75th Avenue, Phoenix, Arizona 85043. | |
| (2) | Beneficial ownership is determined in accordance with the rules of the SEC. In computing the number of shares beneficially owned by a person and the percentage ownership of that person, shares of our common stock subject to options or warrants held by that person that are currently exercisable or exercisable within 60 days of July 21, 2010 are deemed outstanding, but are not deemed outstanding for computing the percentage ownership of any other person. These rules generally attribute beneficial ownership of securities to persons who possess sole or shared voting power or investment power with respect to such securities. | |
| (3) | Percent of total common stock represents the percentage of total shares of outstanding Class A common stock and Class B common stock. | |
| (4) | Percent of total voting power represents voting power with respect to all shares of our Class A common stock and Class B common stock, as a single class. Each holder of Class A common stock is generally entitled to one vote per share of Class A common stock and each holder of Class B common stock is |
119
Table of Contents
| generally entitled to two votes per share of Class B common stock on all matters submitted to our stockholders for a vote. See “Description of Capital Stock — Common Stock.” | ||
| (5) | Consists of shares owned by Mr. Moyes, Mr. Moyes and Vickie Moyes, jointly, and the Jerry and Vickie Moyes Family Trust dated December 11, 1987, including 44,346,230 shares over which Mr. Moyes has sole voting and dispositive power and 10,649,000 shares over which Mr. Moyes has shared voting and dispositive power. Excludes 20,150,662 shares owned by the various Moyes children’s trusts. | |
| (6) | Consists of options to purchase 25,000 shares of our Class A common stock exercisable upon the completion of this offering. | |
| (7) | Consists of options to purchase 150,000 shares of our Class A common stock exercisable upon the completion of this offering. | |
| (8) | Consists of options to purchase 150,000 shares of our Class A common stock exercisable upon the completion of this offering. | |
| (9) | Consists of (x) 3,387,843 shares owned by the Todd Moyes Trust, 3,387,843 shares owned by the Hollie Moyes Trust, 3,387,843 shares owned by the Chris Moyes Trust, 3,287,045 shares owned by the Lyndee Moyes Nester Trust, and 3,312,245 shares owned by the Marti Lyn Moyes Trust, for each of which Michael J. Moyes is the trustee and for which he has sole voting and dispositive power and (y) 3,387,843 shares owned by the Michael J. Moyes Trust. Lyndee Moyes Nester is the trustee of the Michael J. Moyes Trust and has sole voting and dispositive power with respect to shares held by the trust. |
120
Table of Contents
Certain Relationships and Related Party Transactions
Statement of Policy Regarding Transactions with Related Persons
We have in place a written policy regarding the review and approval of all transactions between Swift and any of our executive officers, directors, and their affiliates. The policy may only be amended by an affirmative vote of a majority of our independent directors, including the affirmative vote of the Chairman of our board of directors if the Chairman is an independent director, or the lead independent director if the Chairman is not an independent director.
Prior to entering into the related person transaction, the related person must provide written notice to our legal department and our Chief Financial Officer describing the facts and circumstances of the proposed transaction.
If our legal department determines that the proposed transaction is permissible, unless such transaction is required to be approved by our board of directors under our certificate of incorporation or any indenture or other agreement, the proposed transaction will be submitted for consideration to our nominating and corporate governance committee (exclusive of any member related to the person effecting the transaction) at its next meeting or, if not practicable or desirable, to the chair of such committee.
Such committee or chair will consider the relevant facts and circumstances, including but not limited to: the benefits to us; the impact on a director’s independence; the availability of other sources for comparable products or services; the terms of the transaction; and arms’ length nature of the arrangement. The nominating and corporate governance committee or the chair will approve only those transactions that are in, or are not inconsistent with, the best interests of us and our stockholders.
In addition, our amended and restated certificate of incorporation provides that for so long as (1) Mr. Moyes, Vickie Moyes, and their respective estates, executors, and conservators, (2) any trust (including the trustee thereof) established for the benefit of Mr. Moyes, Vickie Moyes, or any children (including adopted children) thereof, (3) any such children upon transfer from Mr. Moyes or Vickie Moyes, or upon distribution from any such trust or from the estates of Mr. Moyes or Vickie Moyes, and (4) any corporation, limited liability company, or partnership, the sole stockholders, members, or partners of which are referred to in (1), (2), or (3) above, or collectively, the Permitted Holders, hold in excess of 20% of the voting power of Swift, Swift shall not enter into any contract or transaction with any Permitted Holder or any Moyes-affiliated entities unless such contract or transaction shall have been approved by either (i) at least 75% of the independent directors, including the affirmative vote of the Chairman of our board of directors if the Chairman is an independent director, or the lead independent director if the Chairman is not an independent director or (ii) the holders of a majority of the outstanding shares of Class A common stock held by persons other than Permitted Holders or any Moyes-affiliated entities. “Independent director” means a director who is not a Permitted Holder or a director, officer, or employee of any Moyes-affiliated entity and is “independent,” as that term is defined in the listing rules of the exchange on which we list our Class A common stock as such rules may be amended from time to time.
Transactions with Moyes-Affiliated Entities
We provide and receive freight services, facility leases, equipment leases, and other services, including repair and employee services to and from several companies controlled byand/or affiliated with Mr. Moyes. Competitive market rates based on local market conditions are used for facility leases.
The rates we charge for freight services to each of these companies for transportation services are market rates, which are comparable to what we charge third-party customers. The transportation services we provide to affiliated entities provide us with an additional source of operating revenue at our normal freight rates. Freight services received from affiliated entities are brokered out at rates lower than the rate charged to the customer, therefore allowing us to realize a profit. These brokered loads make it possible for us to provide freight services to customers even in areas that we do not serve, providing us with an additional source of income.
Other services that we provided to Moyes-affiliated entities included employee services provided by our personnel, including accounting-related services and negotiations for parts procurement, repair and other truck
121
Table of Contents
stop services, and other services. The daily rates we charge for employee-related services reflect market salaries for employees performing similar work functions. Other payments we make to and receive from Moyes-affiliated entities include fuel tank usage, employee expense reimbursement, executive air transport, and miscellaneous repair services.
Central Freight Lines, Inc.
Mr. Moyes and the Moyes Affiliates are the principal stockholders of Central Freight Lines, Inc., or Central Freight. For the year ended December 31, 2009, the services we provided to Central Freight included $3.9 million for freight services and $0.7 million for facility leases. For the same period, the services we received from Central Freight included $0.1 million for freight services and $0.4 million for facility leases. As of December 31, 2009, amounts owed to us by Central Freight totaled $1.2 million.
For the year ended December 31, 2008, the services we provided to Central Freight included $18.8 million for freight services and $0.8 million for facility leases. For the same period, the services received from Central Freight included $0.5 million for facility leases. As of December 31, 2008, amounts owed to us by Central Freight totaled $0.8 million.
For the year ended December 31, 2007, the services we provided to Central Freight included $8.0 million for freight services, $0.5 million for facility leases, and $0.2 million for equipment leases. For the same period, the services we received from Central Freight included $0.2 million for facility leases.
In 2006, IEL, which later became our wholly-owned subsidiary, leased 94 tractors financed by Daimler Chrysler to Central Freight. The total amount of the lease was $5.3 million, payable in 50 monthly installments. On May 4, 2007, the lease agreement was terminated and the related note payable was transferred to Central Freight to assume the remaining payments owed to Daimler Chrysler. However, according to the transfer contract, Swift remains liable for the note payable should Central Freight default on the agreement. In 2007, Swift received $0.2 million in connection with the lease. There were no amounts owed to us at December 31, 2009 and 2008 related to the lease.
Central Refrigerated Holdings, Inc.
Mr. Moyes and the Moyes Affiliates are the principal stockholders of Central Refrigerated Holdings, Inc., or Central Refrigerated. For the year ended December 31, 2009, the services we provided to Central Refrigerated included $0.2 million for freight services. For the same period, the services we received from Central Refrigerated included $1.9 million for freight services.
For the year ended December 31, 2008, the services we provided to Central Refrigerated included $0.3 million for freight services. For the same period, the services we received from Central Refrigerated included $0.6 million for freight services.
For the year ended December 31, 2007, the services we provided to Central Refrigerated included $0.7 million for freight services and $0.4 million for equipment leases discussed below.
IEL, which later became our wholly-owned subsidiary, entered into equipment lease agreements with Central Refrigerated in May 2002, and with Central Leasing, Inc., or Central Leasing, a subsidiary of Central Refrigerated, in February 2004. The leases were terminated on July 11, 2007. Upon termination, several tractors under the agreements were purchased by Central Refrigerated and Central Leasing, while the remaining tractors were returned to us. In 2007, we received $0.4 million in connection with these leases. No amounts were due to us as of December 31, 2009 and 2008 for the equipment lease or equipment purchase.
In addition, in the second quarter of 2009, we entered into a one-time agreement with Central Refrigerated to purchase 100 model year2001-2002 Utility refrigerated trailers. The purchase price paid for the trailers was comparable to the market price of similar model year utility trailers according to the most recent auction value guide at the time of the sale. The total amount that we paid to Central Refrigerated for the equipment was $1.2 million. There was no further amount due to Central Refrigerated for the purchase of the trailers as of December 31, 2009.
122
Table of Contents
Transpay
IEL contracts its employees from a third party, Transpay, Inc., or Transpay, which is partially owned by Mr. Moyes. Transpay is responsible for all payroll-related liabilities and employee benefits administration for IEL. For the years ended December 31, 2009, 2008, and 2007, we paid Transpay $1.0 million, $1.0 million, and $2.0 million, respectively, for the employee services and administration fees. As of December 31, 2009 and 2008, we had no outstanding balance owing to Transpay for these services.
Swift Motor Sports
Swift Motor Sports, a company affiliated with Mr. Moyes, is obligor on a $1.7 million note with our wholly-owned subsidiary, IEL, as of March 31, 2010. The note accrues interest at 7.0% per annum with monthly installments of principal and accrued interest equal to $38,000 through October 10, 2013 when the remaining balance is due. This note is guaranteed by Mr. Moyes. From January 1, 2009 through March 31, 2010, Swift Motor Sports paid Swift $570,000 in principal and interest related to the note receivable. Prior to the consummation of this offering, the note will be cancelled or retired.
Other affiliated entities
For the year ended December 31, 2009, the services provided by us to other affiliated entities of Mr. Moyes, including SME Industries, Inc. and Swift Air LLC, included $0.3 million for freight services. For the same period, the services received by Swift from these other affiliated entities included $0.1 million for other services.
For the year ended December 31, 2008, the services that we provided to these other affiliated entities included $0.5 million for freight services.
Stockholder Loan
On May 10, 2007, we entered into a stockholder loan agreement with Mr. Moyes and certain of the Moyes Affiliates under which they borrowed from us an aggregate principal amount of $560 million. The terms of the stockholder loan agreement were negotiated with the lenders who provided the financing for the 2007 Transactions. Prior to the consummation of this offering, the stockholder loan will be cancelled or retired. See “Reorganization.”
The stockholder loan agreement has a $240.0 million balance, $5.0 million of which is attributable to interest on the principal amount, due from Mr. Moyes and certain of the Moyes Affiliates as of March 31, 2010. The stockholder loan matures in May 2018. Cash interest is due and payable only to the extent we pay dividends or other cash distributions to the stockholders to fund such interest. During 2009, 2008, 2007, and the three months ended March 31, 2010, we paid distributions on a quarterly basis totaling $16.4 million, $33.8 million, $29.7 million, and $0.0 million, respectively, to the stockholders. Interest accrues at the rate of 2.66% and is added to the principal for payment at maturity if not paid through a distribution.
In connection with the second amendment to our existing senior secured credit facility, Mr. Moyes, at the request of our lenders, agreed to cancel $125.8 million of personally-held senior secured notes in return for a $325.0 million reduction of the stockholder loan as follows: (i) the senior secured floating-rate notes held by Mr. Moyes, totaling $36.4 million in principal amount, were cancelled on October 13, 2009 and, correspondingly, the stockholder loan was reduced by $94.0 million and (ii) the senior secured fixed rate notes held by Mr. Moyes, totaling $89.4 million in principal amount, were cancelled in January 2010 and the stockholder loan was reduced by an additional $231.0 million. The amount of the stockholder loan cancelled in exchange for the contribution of senior secured notes was negotiated by Mr. Moyes with the steering committee of lenders, comprised of a number of the largest lenders (by holding size) and the administrative agent of our existing senior secured credit facility. Due to the classification of the stockholder loan as contra-equity, the reduction in the stockholder loan did not increase our stockholders’ deficit. The cancellation of senior secured notes by Mr. Moyes reduced our stockholders’ deficit by $125.8 million. Furthermore, the cancellation of the remaining amount of the stockholder loan, which is contemplated to occur in connection with the closing of this offering, will not affect our stockholders’ deficit. Mr. Moyes and the Moyes Affiliates will recognize income with respect to the termination of the stockholder loan and they will be solely responsible for the payment of taxes with respect to such income.
123
Table of Contents
Stockholder Distributions
On May 7, 2007, the board of directors of Swift Corporation approved the distribution of personal vehicles valued at approximately $1.6 million owned by its wholly-owned subsidiary, IEL, to Swift Corporation’s stockholders, Jerry and Vickie Moyes.
Registration Rights
Upon completion of this offering, Mr. Moyes and the Moyes Affiliates, representing an aggregate of 75,145,892 shares of our Class B common stock, will be entitled to rights with respect to the registration of such shares under the Securities Act. For a further description of these rights, see the section entitled “Description of Capital Stock — Registration Rights.”
Scudder Law Firm, P.C., L.L.O.
We have obtained legal services from Scudder Law Firm, P.C., L.L.O., or Scudder Law Firm. Earl Scudder, a director of Swift until July 21, 2010, is a member of Scudder Law Firm. The rates charged to us for legal services reflect market rates charged by unrelated law firms for comparable services. For the years ended December 31, 2009, 2008, and 2007, we incurred fees for legal services from Scudder Law Firm, a portion of which was provided by Mr. Scudder, in the amount of $0.8 million, $0.4 million, and $1.2 million, respectively. As of December 31, 2009 and 2008, we had no outstanding balance owing to Scudder Law Firm for these services.
124
Table of Contents
Description of Capital Stock
General
The following is a summary of the material rights of our capital stock and related provisions of our amended and restated certificate of incorporation and amended and restated bylaws. The following description of our capital stock does not purport to be complete and is subject to, and qualified in its entirety by, our amended and restated certificate of incorporation and amended and restated bylaws, which we have included as exhibits to the registration statement of which this prospectus is a part.
Our amended and restated certificate of incorporation provides for two classes of common stock: Class A common stock, which has one vote per share, and Class B common stock, which has two votes per share.
Our authorized capital stock consists of shares, par value $0.001 per share, of which:
| • | shares are designated as Class A common stock; | |
| • | shares are designated as Class B common stock; and | |
| • | shares are designated as preferred stock. |
As of the date of this prospectus, we had shares of Class A common stock issued and outstanding and shares of Class B common stock issued and outstanding. As of the date of this prospectus, we had no shares of preferred stock issued and outstanding. As of the date of this prospectus, we also had outstanding stock options to purchase an aggregate of shares of our Class A common stock.
Common Stock
Voting
The holders of our Class A common stock are entitled to one vote per share and the holders of our Class B common stock are entitled to two votes per share on any matter to be voted upon by the stockholders. Holders of Class A common stock and Class B common stock vote together as a single class on all matters (including the election of directors) submitted to a vote of stockholders, unless otherwise required by law and except a separate vote of each class will be required for:
| • | any merger or consolidation in which holders of shares of Class A common stock receive consideration that is not identical to consideration received by holders of Class B common stock (provided that if such consideration includes shares of stock, then no separate class vote will be required if the shares to be received by holders of our Class B common stock have two times the voting power of the shares of our Class A common stock but are otherwise identical in their rights and preferences); | |
| • | any amendment of our amended and restated certificate of incorporation or amended and restated bylaws that alters relative rights of our common stockholders; and | |
| • | any increase in the authorized number of shares of our Class B common stock or the issuance of shares of our Class B common stock, other than such increase or issuance required of effect a stock split, stock dividend, or recapitalization pro rata with any increase or issuance of shares of our Class A common stock. |
In addition, a separate vote of the holders of Class A common stock will be required for any merger or consolidation or sale of substantially all of our assets to a Moyes-affiliated entity or group.
No holder of shares of any class of common stock, now or hereafter authorized, shall have the right to cumulate votes in the election of directors of Swift or for any other purpose.
Dividends
Except as otherwise provided by law or by the amended and restated certificate of incorporation, and subject to the express terms of any series of shares of preferred stock, the holders of shares of common stock
125
Table of Contents
shall be entitled, to the exclusion of the holders of shares of preferred stock of any and all series, to receive such dividends as from time to time may be declared by our board of directors. Dividends and distributions shall be made at the same time, in the same amount on shares of Class A and Class B common stock (except that a dividend paid in the form of shares of common stock or rights to purchase common stock will be paid in Class A shares to holders of Class A common stock and Class B shares to holders of Class B common stock). See “Dividend Policy.”
Liquidation
In the event of any liquidation, dissolution, or winding up of us, whether voluntary or involuntary, subject to the rights, if any, of the holders of any outstanding series of preferred stock, the holders of shares of common stock shall be entitled to share ratably according to the number of shares of common stock held by them in all remaining assets of us available for distribution to its stockholders.
Conversion
Our Class A common stock is not convertible into any other shares of our capital stock. Shares of Class B common stock may be converted at any time by the holder thereof into shares of Class A common stock on aone-for-one basis. The shares of Class B common stock will automatically convert into shares of Class A common stock on aone-for-one basis upon any transfer, whether or not for value, except for transfers to a Permitted Holder. Shares of Class B common stock that are converted into shares of Class A common stock will be retired and restored to the status of authorized but unissued shares of Class B common stock and be available for reissue by us to Permitted Holders in connection with any stock split, stock dividend or recapitalization pro rata, with any issuance of shares of Class A common stock, or otherwise only, subject to a vote by the holders of our Class A and Class B common stock, voting separately as a class. No class of common stock may be subdivided or combined unless the other class of common stock concurrently is subdivided or combined in the same proportion and in the same manner.
The Class B common stock is not and will not be listed for trading on any stock exchange. Therefore, no trading market is expected to develop in the Class B common stock.
Preemptive or similar rights
No holder of shares of our common stock of any class, now or hereafter authorized, shall have any preferential or preemptive right to subscribe for or purchase any shares of our common stock of any class, now or hereafter authorized, or any options or warrants for such shares, or any rights to subscribe to or purchase such shares, or any securities convertible into or exchangeable for such shares, which may at any time or from time to time be issued, sold, or offered for sale by us.
Fully paid and non-assessable
All the outstanding shares of Class A common stock and Class B common stock and the shares of Class A common stock offered by us in this offering will be fully paid and non-assessable.
Preferred Stock
The shares of preferred stock may be issued from time to time in one or more series of any number of shares; provided, that the aggregate number of shares of preferred stock authorized, and with such powers, including voting powers, if any, and the designations, preferences, and relative participating, optional, or other special rights, if any, and any qualifications, limitations, or restrictions thereof, all as shall hereafter be stated and expressed in the resolution or resolutions providing for the designation and issuance of such shares of preferred stock from time to time adopted by the board, pursuant to authority to do so that is vested expressly in the board. The powers, including voting powers, if any, preferences and relative participating, optional, and other special rights of each series of preferred stock, and the qualifications, limitations, or restrictions thereof, if any, may differ from those of any and all other series at any time outstanding.
126
Table of Contents
Registration Rights
Prior to the consummation of the offering, we will enter into a registration rights agreement with Mr. Moyes and the Moyes Affiliates with respect to shares of our Class B common stock outstanding held by such parties. The registration rights agreement will provide Mr. Moyes and the Moyes Affiliates with an unlimited number of “demand” registrations and customary “piggyback” registration rights. The registration rights agreement will also provide that we will pay certain expenses of Mr. Moyes and the Moyes Affiliates relating to such registrations and indemnify them against certain liabilities, which may arise under the Securities Act.
Certain Provisions of Delaware Law and Certain Charter and Bylaws Provisions
The following sets forth certain provisions of the Delaware General Corporation Law, or the DGCL, and our amended and restated certificate of incorporation and our amended and restated bylaws.
Requirements for advance notification of stockholder nominations and proposals
Our amended and restated certificate of incorporation and amended and restated bylaws establish advance notice procedures with respect to stockholder proposals and the nomination of candidates for election as directors, other than nominations made by or at the direction of the board or a committee of the board.
Stockholder meetings
Our amended and restated certificate of incorporation and amended and restated bylaws provide that special meetings of the stockholders may be called for any purpose or purposes at any time by a majority of the board or by the Chairman of our board of directors, our Chief Executive Officer or our lead independent director, if any. In addition, our amended and restated certificate of incorporation will provide that a holder, or a group of holders, of common stock holding more than 20% of the total voting power of the outstanding shares of Class A common stock and Class B common stock voting together as a single class may cause us to call a special meeting of the stockholders for any purpose or purposes at any time.
Action by stockholders without a meeting
The DGCL permits stockholder action by written consent unless otherwise provided by a corporation’s certificate of incorporation. Our amended and restated certificate of incorporation and amended and restated bylaws provide that, except as specifically required by our amended and restated certificate of incorporation and amended and restated bylaws or the DGCL, any action required or permitted to be taken at a meeting of the stockholders may be taken without a meeting, without prior notice, and without a vote, if a consent in writing, setting forth the action so taken, is signed by stockholders holding at least a majority of the voting power (except that if a different proportion of voting power is required for such an action at a meeting, then that proportion of written consents is required), and such consent is filed with the minutes of the proceedings of the stockholders.
No cumulative voting
The DGCL provides that stockholders are not entitled to the right to cumulate votes in the election of directors unless a corporation’s certificate of incorporation provides otherwise. Our amended and restated certificate of incorporation and amended and restated bylaws do not provide for cumulative voting in the election of directors.
Director removal
Except as may otherwise be required by the DGCL and except that the director serving as Chairman of our board of directors can only be removed as a director by the affirmative vote of a majority of Class A common stock excluding Permitted Holders and Moyes-affiliated entities, our amended and restated certificate of incorporation and amended and restated bylaws do not contain restrictions on the rights of stockholders to remove directors from the board.
127
Table of Contents
Exclusive jurisdiction
Our amended and restated certificate of incorporation provides that the Delaware Court of Chancery shall be the exclusive forum for any derivative action or proceeding brought on behalf of Swift Holdings Corp., any action asserting a claim of breach of fiduciary duty, and any action asserting a claim pursuant to the DGCL, our amended and restated certificate of incorporation, our amended and restated bylaws, or under the internal affairs doctrine.
Section 203
In addition, we will be subject to Section 203 of the DGCL, which prohibits a Delaware corporation from engaging in any business combination with any interested stockholder for a period of three years after the date that such stockholder became an interested stockholder, with the following exceptions:
| • | before such date, our board of directors approved either the business combination or the transaction that resulted in the stockholder becoming an interested holder; | |
| • | upon completion of the transaction that resulted in the stockholder becoming an interested stockholder, the interested stockholder owned at least 85% of the voting stock of the corporation outstanding at the time the transaction began, excluding for purposes of determining the voting stock outstanding (but not the outstanding voting stock owned by the interested stockholder) those shares owned (i) by persons who are directors and also officers and (ii) employee stock plans in which employee participants do not have the right to determine confidentially whether shares held subject to the plan will be tendered in a tender or exchange offer; or | |
| • | on or after such date, the business combination is approved by the board of directors and authorized at an annual or special meeting of the stockholders, and not by written consent, by the affirmative vote of the holders of at least 662/3% of the outstanding voting stock that is not owned by the interested stockholder. |
In general, Section 203 defines business combination to include the following:
| • | any merger or consolidation involving the corporation and the interested stockholder; | |
| • | any sale, transfer, pledge, or other disposition of 10% or more of the assets of the corporation involving the interested stockholder; | |
| • | subject to certain exceptions, any transaction that results in the issuance or transfer by the corporation of any stock of the corporation to the interested stockholder; | |
| • | any transaction involving the corporation that has the effect of increasing the proportionate share of the stock or any class or series of the corporation beneficially owned by the interested stockholder; or | |
| • | the receipt by the interested stockholder of the benefit of any loans, advances, guarantees, pledges, or other financial benefits by or through the corporation. |
In general, Section 203 defines an “interested stockholder” as an entity or person who, together with the person’s affiliates and associates, beneficially owns, or within three years prior to the time of determination of interested stockholder status did own, 15% or more of the outstanding voting stock of the corporation.
A Delaware corporation may “opt out” of Section 203 with an expressed provision in its original certificate of incorporation or an expressed provision in its certificate of incorporation or bylaws resulting from amendments approved by holders of at least a majority of the corporation’s outstanding voting shares. We intend not to elect to “opt out” of Section 203.
Affiliate Transactions
Our amended and restated certificate of incorporation provides that so long as Permitted Holders and any Moyes-affiliated entities hold in excess of 20% of the total voting power of our Class A common stock and Class B common stock, we shall not enter into any contract or transaction with any Permitted Holder or any
128
Table of Contents
Moyes-affiliated entities unless such contract or transaction shall have been approved by either (i) at least 75% of the Independent Directors including the Chairman of our board of directors, or (ii) the holders of a majority of the outstanding shares of Class A common stock held by persons other than Permitted Holders or any Moyes-affiliated entities. See “Certain Relationships and Related Party Transactions.”
Corporate Opportunity
In the event that any officer or director of Swift is also an officer or director or employee of an entity owned by or affiliated with any Permitted Holder and acquires knowledge of a potential transaction or matter that may provide an investment or business opportunity or prospective economic advantage not involving the truck transportation industry or involving refrigerated transportation orless-than-truckload transportation, each a corporate opportunity, or otherwise is then exploiting any corporate opportunity, then unless such corporate opportunity is expressly indicated in writing to be offered to such person solely in his capacity as an officer or director of Swift, we shall have no interest in such corporate opportunity and no expectancy that such corporate opportunity be offered to us, any such interest or expectancy being hereby renounced, so that, as a result of such renunciation, and for the avoidance of doubt, such officer or director (i) shall have no duty to communicate or present such corporate opportunity to us, (ii) shall have the right to hold any such corporate opportunity for its own account or to recommend, sell, assign, or transfer such corporate opportunity to an entity owned by or affiliated with any Permitted Holder other than us, and (iii) shall not breach any fiduciary duty to us by reason of the fact that such officer or director pursues or acquires such corporate opportunity for himself or herself, directs, sells, assigns, or transfers such corporate opportunity to an entity owned by or affiliated with any Permitted Holder, or does not communicate information regarding such corporate opportunity to us.
Limitation on Liability and Indemnification of Officers and Directors
Section 102(b)(7) of the DGCL provides that a corporation may eliminate or limit the personal liability of a director to the corporation or its stockholders for monetary damages for breach of fiduciary duty as a director, provided that such provision shall not eliminate or limit the liability of a director (i) for any breach of the director’s duty of loyalty to the corporation or its stockholders, (ii) for acts or omissions not in good faith or which involve intentional misconduct or a knowing violation of law, (iii) under Section 174 of the DGCL (regarding, among other things, the payment of unlawful dividends), or (iv) for any transaction from which the director derived an improper personal benefit. Our amended and restated certificate of incorporation includes a provision that eliminates the personal liability of directors for monetary damages for breach of fiduciary duty as a director to the fullest extent permitted by Delaware law.
In addition, our amended and restated certificate of incorporation also provides that we must indemnify our directors and officers to the fullest extent authorized by law. We also are expressly required to advance certain expenses to our directors and officers and to carry directors’ and officers’ insurance providing indemnification for our directors and officers for certain liabilities. We believe that these indemnification provisions and the directors’ and officers’ insurance are useful to attract and retain qualified directors and executive officers.
Section 145(a) of the DGCL empowers a corporation to indemnify any director, officer, employee, or agent, or former director, officer, employee, or agent, who was or is a party or is threatened to be made a party to any threatened, pending, or completed action, suit, or proceeding, whether civil, criminal, administrative, or investigative (other than an action by or in the right of the corporation), by reason of his or her service as a director, officer, employee, or agent of the corporation, or his or her service, at the corporation’s request, as a director, officer, employee, or agent of another corporation or enterprise, against expenses (including attorneys’ fees), judgments, fines, and amounts paid in settlement actually and reasonably incurred by such person in connection with such action, suit, or proceeding, provided that such director or officer acted in good faith and in a manner reasonably believed to be in, or not opposed to, the best interests of the corporation, and, with respect to any criminal action or proceeding, provided that such director or officer had no reasonable cause to believe his conduct was unlawful.
129
Table of Contents
Section 145(b) of the DGCL empowers a corporation to indemnify any person who was or is a party or is threatened to be made a party to any threatened, pending, or completed action or suit by or in the right of the corporation to procure a judgment in its favor by reason of the fact that such person is or was a director, officer, employee, or agent of the corporation, or is or was serving at the request of the corporation as a director, officer, employee, or agent of another enterprise, against expenses (including attorney fees) actually and reasonably incurred in connection with the defense or settlement of such action or suit provided that such director or officer acted in good faith and in a manner he or she reasonably believed to be in or not opposed to the best interests of the corporation, except that no indemnification may be made in respect of any claim, issue, or matter as to which such director or officer shall have been adjudged to be liable to the corporation unless and only to the extent that the Delaware Court of Chancery or the court in which such action or suit was brought shall determine, upon application, that, despite the adjudication of liability but in view of all the circumstances of the case, such director or officer is fairly and reasonably entitled to indemnity for such expenses that the court shall deem proper. Notwithstanding the preceding sentence, except as otherwise provided in the bylaws, we shall be required to indemnify any such person in connection with a proceeding (or part thereof) commenced by such person only if the commencement of such proceeding (or part thereof) by any such person was authorized by our board of directors.
Listing
We intend to apply to list our Class A common stock for trading on the under the symbol “SWFT”.
Transfer Agent and Registrar
The transfer agent and registrar for our Class A common stock is .
130
Table of Contents
Shares Eligible for Future Sale
Prior to this offering, there has not been any public market for our Class A common stock, and we make no prediction as to the effect, if any, that market sales of shares of Class A common stock or the availability of shares of Class A common stock for sale will have on the market price of Class A common stock prevailing from time to time. Nevertheless, sales of substantial amounts of Class A common stock in the public market, or the perception that such sales could occur, could adversely affect the market price of Class A common stock and could impair our future ability to raise capital through the sale of equity securities.
Upon the completion of this offering, we will have outstanding shares of Class A common stock, assuming no exercise of the underwriters’ over-allotment option and no exercise of options outstanding as of the date of this prospectus and 75,145,892 outstanding shares of Class B common stock, which are convertible to shares of Class A common stock on a one-for-one basis. Of the outstanding shares, all of the shares sold in this offering, plus any additional shares sold upon exercise of the underwriters’ over-allotment option, will be freely tradable, except that any shares purchased by “affiliates” (as that term is defined in Rule 144 under the Securities Act) may only be sold in compliance with the limitations described below. Taking into consideration the effect of thelock-up agreements described below and the provisions of Rule 144 and Rule 701 under the Securities Act, the remaining shares of our common stock will be available for sale in the public market as follows:
| • | shares will be eligible for sale on the date of this prospectus; and | |
| • | shares will be eligible for sale upon the expiration of thelock-up agreements described below. |
Lock-up Agreements
We, our directors, executive officers, and the Moyes Affiliates have entered intolock-up agreements in connection with this offering. For further details, see the section entitled “Underwriting.”
Rule 144
In general, under Rule 144, as currently in effect, once we have been subject to public company reporting requirements for at least 90 days, a person who is not deemed to have been one of our affiliates for purposes of the Securities Act at any time during 90 days preceding a sale and who has beneficially owned the shares proposed to be sold for at least six months, including the holding period of any prior owner other than our affiliates, is entitled to sell such shares without complying with the manner of sale, volume limitation, or notice provisions of Rule 144, subject to compliance with the public information requirements of Rule 144. If such a person has beneficially owned the shares proposed to be sold for at least one year, including the holding period of any prior owner other than our affiliates, then such person is entitled to sell such shares without complying with any of the requirements of Rule 144.
In general, under Rule 144, as currently in effect, our affiliates or persons selling shares on behalf of our affiliates are entitled to sell, upon expiration of thelock-up agreements described above, within any three-month period beginning 90 days after the date of this prospectus, a number of shares that does not exceed the greater of:
| • | 1% of the number of shares of Class A common stock then outstanding, which will equal approximately shares immediately after this offering; or | |
| • | the average weekly trading volume of the Class A common stock during the four calendar weeks preceding the filing of a notice on Form 144 with respect to such sale. |
Sales under Rule 144 by our affiliates or persons selling shares on behalf of our affiliates are also subject to certain manner of sale provisions and notice requirements and to the availability of current public information about us.
Rule 701
Rule 701 generally allows a stockholder who purchased shares of our Class A common stock pursuant to a written compensation plan or contract and who is not deemed to have been an affiliate of Swift during the
131
Table of Contents
immediately preceding 90 days to sell these shares in reliance upon Rule 144, but without being required to comply with the public information and holding period provisions of Rule 144. Rule 701 also permits affiliates of Swift to sell their Rule 701 shares under Rule 144 without complying with the holding period requirements of Rule 144. All holders of Rule 701 shares, however, are required to wait until 90 days after the date of this prospectus before selling such shares pursuant to Rule 701.
Stock Options
We intend to file a registration statement onForm S-8 under the Securities Act covering all of the shares of our Class A common stock subject to options outstanding or reserved for issuance under our stock plans and shares of our Class A common stock issued upon the exercise of options by employees. We expect to file this registration statement as soon as practicable after this offering. However, the shares registered onForm S-8 will be subject to volume limitations, manner of sale, notice, and public information requirements of Rule 144, in the case of our affiliates, and will not be eligible for resale until expiration of thelock-up agreements to which they are subject.
Registration Rights
Upon completion of this offering, Mr. Moyes and the Moyes Affiliates, representing an aggregate of 75,145,892 shares of our Class B common stock, will be entitled to rights with respect to the registration of such shares under the Securities Act. Registration of these shares under the Securities Act would result in these shares becoming freely tradeable without restriction immediately upon the effectiveness of such registration. For a further description of these rights, see the section entitled “Description of Capital Stock — Registration Rights.”
132
Table of Contents
Material United States Federal Income Tax Consequences
toNon-U.S. Holders
toNon-U.S. Holders
The following is a general discussion of the material U.S. federal income tax considerations with respect to the ownership and disposition of shares of our Class A common stock applicable tonon-U.S. Holders who acquire such shares in this offering and hold such shares as a capital asset (generally, property held for investment). For purposes of this discussion, anon-U.S. Holder generally means a beneficial owner of our Class A common stock that is not, for U.S. federal income tax purposes, a partnership and is not: (a) a citizen or individual resident of the United States, (b) a corporation created or organized in the United States or under the laws of the United States, any state thereof, or the District of Columbia, (c) an estate, the income of which is includible in gross income for U.S. federal income tax purposes regardless of its source, or (d) a trust if (i) a court within the United States is able to exercise primary supervision over the administration of the trust and one or more U.S. persons have the authority to control all substantial decisions of the trust or (ii) such trust has made a valid election to be treated as a U.S. person for U.S. federal income tax purposes.
This discussion is based on current provisions of the Internal Revenue Code, Treasury regulations promulgated thereunder, judicial opinions, published positions of the Internal Revenue Service, and other applicable authorities, all of which are subject to change (possibly with retroactive effect). This discussion does not address all aspects of U.S. federal income taxation that may be important to a particularnon-U.S. Holder in light of thatnon-U.S. Holder’s individual circumstances, nor does it address any aspects of U.S. federal estate and gift, state, local, ornon-U.S. taxes. This discussion may not apply, in whole or in part, to particularnon-U.S. Holders in light of their individual circumstances or to holders subject to special treatment under the U.S. federal income tax laws, such as insurance companies, tax-exempt organizations, financial institutions, brokers or dealers in securities, controlled foreign corporations, passive foreign investment companies,non-U.S. Holders that hold our Class A common stock as part of a straddle, hedge, conversion transaction, or other integrated investment, and certain U.S. expatriates. Each prospectivenon-U.S. Holder is urged to consult its tax advisor regarding the U.S. federal, state, local, and foreign income and other tax consequences of the ownership, sale, or other disposition of our Class A common stock.
If a partnership (or other entity or arrangement treated as a partnership for U.S. federal income tax purposes) holds our Class A common stock, the tax treatment of a partner will generally depend on the status of the partner and the activities of the partnership. Partners of a partnership holding our Class A common stock should consult their tax advisor as to the particular U.S. federal income tax consequences applicable to them.
Dividends
In general, any distributions that we make to anon-U.S. Holder with respect to its shares of our Class A common stock that constitutes a dividend for U.S. federal income tax purposes will be subject to U.S. withholding tax at a rate of 30% of the gross amount, unless thenon-U.S. Holder is eligible for a reduced rate of withholding tax under an applicable tax treaty and thenon-U.S. Holder provides proper certification of its eligibility for such reduced rate. A distribution will constitute a dividend for U.S. federal income tax purposes to the extent of our current or accumulated earnings and profits as determined for U.S. federal income tax purposes. Any distribution not constituting a dividend will be treated first as reducing the adjusted basis in thenon-U.S. Holder’s shares of our Class A common stock dollar for dollar and, to the extent that such distribution exceeds the adjusted basis in thenon-U.S. Holder’s shares of our Class A common stock, as capital gain from the sale or exchange of such shares. Any dividends that we pay to anon-U.S. Holder that are effectively connected with its conduct of a trade or business within the United States (and, if a tax treaty applies, are attributable to a permanent establishment or fixed base within the United States) generally will not be subject to U.S. withholding tax, as described above, if thenon-U.S. Holder complies with applicable certification and disclosure requirements. Instead, such dividends generally will be subject to U.S. federal income tax on a net income basis, in the same manner as if thenon-U.S. Holder were a resident of the United States. Dividends received by a foreign corporation that are effectively connected with its conduct of a trade or business within the United States may be subject to an additional branch profits tax at a rate of 30% (or such lower rate as may be specified by an applicable tax treaty).
133
Table of Contents
Gain on Sale or Other Disposition of Class A Common Stock
In general, anon-U.S. Holder will not be subject to U.S. federal income tax on any gain realized upon the sale or other disposition of thenon-U.S. Holder’s shares of our Class A common stock unless:
| • | the gain is effectively connected with a trade or business carried on by thenon-U.S. Holder within the United States (and, if required by an applicable tax treaty, is attributable to a U.S. permanent establishment or fixed base of suchnon-U.S. Holder); | |
| • | thenon-U.S. Holder is an individual and is present in the United States for 183 days or more in the taxable year of disposition and certain other conditions are satisfied; or | |
| • | we are or have been a U.S. real property holding corporation, or a USRPHC, for U.S. federal income tax purposes at any time within the shorter of the five-year period preceding such disposition or suchnon-U.S. Holder’s holding period of our Class A common stock. |
We do not believe that we have been or are likely to become a USRPHC. Even if we were or were to become a USRPHC, however, anon-U.S. Holder who at no time directly, indirectly, or constructively, owned more than 5% of the shares of our Class A common stock generally would not be subject to U.S. federal income tax on the disposition of such shares of Class A common stock, provided that our Class A common stock was regularly traded on an established securities market within the meaning of the applicable regulations.
Gain that is effectively connected with the conduct of a trade or business in the United States (or so treated) generally will be subject to U.S. federal income tax, net of certain deductions, at regular U.S. federal income tax rates. If thenon-U.S. Holder is a foreign corporation, the branch profits tax described above also may apply to such effectively connected gain. An individualnon-U.S. Holder who is subject to U.S. federal income tax because thenon-U.S. Holder was present in the United States for 183 days or more during the year of sale or other disposition of our Class A common stock will be subject to a flat 30% tax on the gain derived from such sale or other disposition, which gain may be offset by U.S. source capital losses of suchnon-U.S. Holder, if any.
Backup Withholding, Information Reporting, and Other Reporting Requirements
We must report annually to the Internal Revenue Service, and to eachnon-U.S. Holder, the amount of dividends paid to, and the tax withheld with respect to, eachnon-U.S. Holder. These reporting requirements apply regardless of whether withholding was reduced or eliminated by an applicable tax treaty. Copies of this information reporting may also be made available under the provisions of a specific tax treaty or agreement with the tax authorities in the country in which thenon-U.S. Holder resides or is established.
Anon-U.S. Holder will generally be subject to backup withholding for dividends on our Class A common stock paid to such holder, unless such holder certifies under penalties of perjury that, among other things, it is anon-U.S. Holder (and the payor does not have actual knowledge or reason to know that such holder is a U.S. person), or such holder otherwise establishes an exemption.
Information reporting and backup withholding generally are not required with respect to the amount of any proceeds from the sale or other disposition of our Class A common stock by anon-U.S. Holder outside the United States through a foreign office of a foreign broker that does not have certain specified connections to the United States. However, if anon-U.S. Holder sells or otherwise disposes its shares of our Class A common stock through a U.S. broker or the U.S. offices of a foreign broker, the broker will generally be required to report the amount of proceeds paid to thenon-U.S. Holder to the Internal Revenue Service and also backup withhold on that amount, unless suchnon-U.S. Holder provides appropriate certification to the broker of its status as anon-U.S. person or otherwise establishes an exemption (and the payor does not have actual knowledge or reason to know that such holder is a U.S. person). Information reporting (but generally not backup withholding) also will apply if anon-U.S. Holder sells its shares of our Class A common stock through a foreign broker deriving more than a specified percentage of its income from U.S. sources or having certain other connections to the United States, unless such broker has documentary evidence in its records that
134
Table of Contents
suchnon-U.S. Holder is anon-U.S. person and certain other conditions are satisfied, or suchnon-U.S. Holder otherwise establishes an exemption (and the payor does not have actual knowledge or reason to know that such holder is a U.S. person).
Backup withholding is not an additional tax. Any amounts withheld under the backup withholding rules from a payment to anon-U.S. Holder can be credited against thenon-U.S. Holder’s U.S. federal income tax liability, if any, or refunded, provided that the required information is furnished to the Internal Revenue Service in a timely manner.Non-U.S. Holders should consult their tax advisors regarding the application of the information reporting and backup withholding rules to them.
Additional Withholding Requirements
Recently enacted legislation will require, after December 31, 2012, withholding at a rate of 30% on dividends in respect of, and gross proceeds from the sale of, our Class A common stock held by or through certain foreign financial institutions (including investment funds), unless such institution enters into an agreement with the Secretary of the Treasury to report, on an annual basis, information with respect to shares in the institution held by certain U.S. persons and by certain non-U.S. entities that are wholly or partially owned by U.S. persons. Accordingly, the entity through which our Class A common stock is held will affect the determination of whether such withholding is required. Similarly, dividends in respect of, and gross proceeds from the sale of, our Class A common stock held by an investor that is a non-financial non-U.S. entity will be subject to withholding at a rate of 30 percent, unless such entity either (i) certifies to us that such entity does not have any “substantial United States owners” or (ii) provides certain information regarding the entity’s “substantial United States owners,” which we will in turn provide to the Secretary of the Treasury.Non-U.S. Holders stockholders are encouraged to consult with their tax advisors regarding the possible implications of the legislation on their investment in our Class A common stock.
135
Table of Contents
Certain ERISA Considerations
The following discussion is a summary of certain considerations associated with the purchase of our Class A common stock by (i) employee benefit plans that are subject to Title I of the Employee Retirement Income Security Act of 1974, as amended, or ERISA, (ii) plans, individual retirement accounts, and other arrangements that are subject to Section 4975 of the Internal Revenue Code or provisions under any other federal, state, local,non-U.S., or other laws or regulations that are similar to such provisions of the ERISA or the Internal Revenue Code, and (iii) entities whose underlying assets are considered to include “plan assets” of such plans, accounts, and arrangements, or an ERISA plan.
Section 406 of ERISA and Section 4975 of the Internal Revenue Code prohibit ERISA plans from engaging in specified transactions involving “plan assets” with persons or entities who are “parties in interest,” within the meaning of ERISA, or “disqualified persons,” within the meaning of Section 4975 of the Internal Revenue Code, unless an exemption is available. A party in interest or disqualified person who engaged in a non-exempt prohibited transaction may be subject to excise taxes and other penalties and liabilities under ERISA and the Internal Revenue Code. In addition, the fiduciary of the ERISA Plan that engaged in such a non-exempt prohibited transaction may be subject to penalties and liabilities under ERISA and the Internal Revenue Code.
Any ERISA Plan fiduciary that proposes to cause an ERISA plan to purchase the shares of Class A common stock should consult with its counsel regarding the applicability of the fiduciary responsibility and prohibited transaction provisions of Title I of ERISA and Section 4975 of the Internal Revenue Code to such an investment, and to confirm that such purchase will not constitute a non-exempt prohibited transaction under ERISA or Section 4975 of the Internal Revenue Code. Because of the nature of our business as an operating company, it is not likely that we would be considered a party in interest or a disqualified person with respect to any ERISA Plan. However, a prohibited transaction within the meaning of ERISA and the Internal Revenue Code may result if our Class A common stock is acquired by an ERISA Plan to which an underwriter is a party in interest and such acquisition is not entitled to an applicable exemption, of which there are many.
Governmental plans, certain church plans, and foreign plans, while not subject to the fiduciary responsibility or prohibited transaction provisions of Title I of ERISA or Section 4975 of the Internal Revenue Code, may nevertheless be subject to other federal, state,non-U.S., or other laws that are substantially similar to the foregoing provisions of Title I of ERISA or Section 4975 of the Internal Revenue Code, or Similar Laws. Fiduciaries of any such plans should consult with their counsel before purchasing our shares of Class A common stock.
The foregoing discussion is general in nature and is not intended to be all-inclusive. Due to the complexity of these rules and the penalties that may be imposed upon persons involved in non-exempt prohibited transactions, it is particularly important that fiduciaries, or other persons considering purchasing our shares of Class A common stock on behalf of, or with the assets of, any ERISA plan, or any plan subject to any Similar Law, consult with their counsel regarding the matters described herein.
136
Table of Contents
Underwriting
We are offering the shares of Class A common stock described in this prospectus through a number of underwriters. Morgan Stanley & Co. Incorporated, Merrill Lynch, Pierce, Fenner & Smith Incorporated, and Wells Fargo Securities, LLC are acting as joint book-running managers of the offering and as representatives of the underwriters. We have entered into an underwriting agreement with the underwriters. Subject to the terms and conditions of the underwriting agreement, we have agreed to sell to the underwriters, and each underwriter has severally agreed to purchase, at the public offering price less the underwriting discounts and commissions set forth on the cover page of this prospectus, the number of shares of Class A common stock listed next to its name in the following table:
| Number of | ||||
Name | Shares | |||
| Morgan Stanley & Co. Incorporated | ||||
| Merrill Lynch, Pierce, Fenner & Smith Incorporated | ||||
| Wells Fargo Securities, LLC | ||||
| Total | ||||
The underwriters are committed to purchase all the common shares offered by us if they purchase any shares, other than pursuant to the over-allotment option described below. The underwriting agreement also provides that if an underwriter defaults, the purchase commitments of non-defaulting underwriters may also be increased or the offering may be terminated.
The underwriters propose to offer the common shares directly to the public at the initial public offering price set forth on the cover page of this prospectus and to certain dealers at that price less a concession not in excess of $ per share. Any such dealers may resell shares to certain other brokers or dealers at a discount of up to $ per share from the initial public offering price. After the initial public offering of the shares, the offering price and other selling terms may be changed by the underwriters. Sales of shares made outside of the United States may be made by affiliates of the underwriters. The representatives have advised us that the underwriters do not intend to confirm discretionary sales in excess of 5% of the common shares offered in this offering.
The underwriters have an option to buy up to additional shares of Class A common stock from us to cover sales of shares by the underwriters that exceed the number of shares specified in the table above. The underwriters have 30 days from the date of this prospectus to exercise this over-allotment option. If any shares are purchased with this over-allotment option, the underwriters will purchase shares in approximately the same proportion as shown in the table above. If any additional shares of Class A common stock are purchased, the underwriters will offer the additional shares on the same terms as those on which the shares are being offered.
The underwriting fee is equal to the public offering price per share of Class A common stock less the amount paid by the underwriters to us per share of Class A common stock. The underwriting fee is $ per share. The following table shows the per-share and total underwriting discounts and commissions to be paid to the underwriters assuming both no exercise and full exercise of the underwriters’ option to purchase additional shares:
| Without | With Full | |||||||
| Over-Allotment | Over-Allotment | |||||||
| Exercise | Exercise | |||||||
| Per Share | $ | $ | ||||||
| Total | $ | $ | ||||||
We estimate that the total expenses of this offering, including registration, filing and listing fees, printing fees, and legal and accounting expenses, but excluding the underwriting discounts and commissions, will be approximately $ .
A prospectus in electronic format may be made available on the web sites maintained by one or more underwriters, or selling group members, if any, participating in the offering. The underwriters may agree to allocate a number of shares to underwriters and selling group members for sale to their online brokerage
137
Table of Contents
account holders. Internet distributions will be allocated by the representatives to underwriters and selling group members that may make Internet distributions on the same basis as other allocations.
We have agreed that we will not (i) offer, pledge, announce the intention to sell, sell, contract to sell, sell any option or contract to purchase, purchase any option or contract to sell, grant any option, right or warrant to purchase, or otherwise dispose of, directly or indirectly, or file with the SEC a registration statement under the Securities Act relating to, any shares of our Class A common stock or securities convertible into or exchangeable or exercisable for any shares of our Class A common stock, or publicly disclose the intention to make any offer, sale, pledge, disposition, or filing, or (ii) enter into any swap or other arrangement that transfers all or a portion of the economic consequences associated with the ownership of any shares of Class A common stock or any such other securities (regardless of whether any of these transactions are to be settled by the delivery of shares of Class A common stock or such other securities, in cash or otherwise), in each case without the prior written consent of Morgan Stanley & Co. Incorporated, Merrill Lynch, Pierce, Fenner & Smith Incorporated and Wells Fargo Securities, LLC for a period of 180 days after the date of this prospectus, other than the shares of our Class A common stock to be sold hereunder and any shares of our Class A common stock issued upon the exercise of options granted under our 2007 equity incentive plan. Notwithstanding the foregoing, if (1) during the last 17 days of the180-day restricted period, we issue an earnings release or material news or a material event relating to our company occurs; or (2) prior to the expiration of the180-day restricted period, we announce that we will release earnings results during the16-day period beginning on the last day of the180-day period, the restrictions described above shall continue to apply until the expiration of the18-day period beginning on the issuance of the earnings release or the occurrence of the material news or material event.
Our directors and executive officers and the Moyes Affiliates have entered intolock-up agreements with the underwriters prior to the commencement of this offering pursuant to which each of these persons or entities, with limited exceptions, for a period of 180 days after the date of this prospectus, may not, without the prior written consent of Morgan Stanley & Co. Incorporated, Merrill Lynch, Pierce, Fenner & Smith Incorporated, and Wells Fargo Securities, LLC (1) offer, pledge, announce the intention to sell, sell, contract to sell, sell any option or contract to purchase, purchase any option or contract to sell, grant any option, right or warrant to purchase, or otherwise transfer or dispose of, directly or indirectly, any shares of our Class A common stock or any securities convertible into or exercisable or exchangeable for our Class A common stock (including, without limitation, Class A common stock or such other securities that may be deemed to be beneficially owned by such directors, executive officers, managers, and members in accordance with the rules and regulations of the SEC and securities that may be issued upon exercise of a stock option or warrant) or (2) enter into any swap or other agreement that transfers, in whole or in part, any of the economic consequences of ownership of the Class A common stock or such other securities, whether any such transaction described in clause (1) or (2) above is to be settled by delivery of Class A common stock or such other securities, in cash or otherwise, or (3) make any demand for or exercise any right with respect to the registration of any shares of our Class A common stock or any security convertible into or exercisable or exchangeable for our Class A common stock. Notwithstanding the foregoing, if (1) during the last 17 days of the180-day restricted period, we issue an earnings release or material news or a material event relating to our company occurs; or (2) prior to the expiration of the180-day restricted period, we announce that we will release earnings results during the16-day period beginning on the last day of the180-day period, the restrictions described above shall continue to apply until the expiration of the18-day period beginning on the issuance of the earnings release or the occurrence of the material news or material event.
We have agreed to indemnify the underwriters against certain liabilities, including liabilities under the Securities Act.
We will apply to have our Class A common stock approved for trading on under the symbol ‘‘SWFT”.
In connection with this offering, the underwriters may engage in stabilizing transactions, which involves making bids for, purchasing, and selling shares of Class A common stock in the open market for the purpose of preventing or retarding a decline in the market price of the Class A common stock while this offering is in
138
Table of Contents
progress. These stabilizing transactions may include making short sales of the Class A common stock, which involve the sale by the underwriters of a greater number of shares of Class A common stock than they are required to purchase in this offering, and purchasing shares of Class A common stock on the open market to cover positions created by short sales. Short sales may be “covered” shorts, which are short positions in an amount not greater than the underwriters’ over-allotment option referred to above, or may be “naked” shorts, which are short positions in excess of that amount. The underwriters may close out any covered short position either by exercising their over-allotment option, in whole or in part, or by purchasing shares in the open market. In making this determination, the underwriters will consider, among other things, the price of shares available for purchase in the open market compared to the price at which the underwriters may purchase shares through the over-allotment option. A naked short position is more likely to be created if the underwriters are concerned that there may be downward pressure on the price of the Class A common stock in the open market that could adversely affect investors who purchase in this offering. To the extent that the underwriters create a naked short position, they will purchase shares in the open market to cover the position.
The underwriters have advised us that, pursuant to Regulation M of the Securities Act, they may also engage in other activities that stabilize, maintain, or otherwise affect the price of the Class A common stock, including the imposition of penalty bids. This means that if the representatives of the underwriters purchase Class A common stock in the open market in stabilizing transactions or to cover short sales, the representatives can require the underwriters that sold those shares as part of this offering to repay the underwriting discount received by them.
These activities may have the effect of raising or maintaining the market price of the Class A common stock or preventing or retarding a decline in the market price of the Class A common stock, and, as a result, the price of the Class A common stock may be higher than the price that otherwise might exist in the open market. If the underwriters commence these activities, they may discontinue them at any time. The underwriters may carry out these transactions on the stock exchange on which the Class A common stock is listed for trading, in theover-the-counter market or otherwise.
Prior to this offering, there has been no public market for our Class A common stock. The initial public offering price will be determined by negotiations between us and the representatives of the underwriters. In determining the initial public offering price, we and the representatives of the underwriters expect to consider a number of factors including:
| • | the information set forth in this prospectus and otherwise available to the representatives; | |
| • | our prospects and the history and prospects for the industry in which we compete; | |
| • | an assessment of our management; | |
| • | our prospects for future earnings; | |
| • | the general condition of the securities markets at the time of this offering; | |
| • | the recent market prices of, and demand for, publicly traded Class A common stock of generally comparable companies; and | |
| • | other factors deemed relevant by the underwriters and us. |
Neither we nor the underwriters can assure investors that an active trading market will develop for our common shares, or that the shares will trade in the public market at or above the initial public offering price.
Other than in the United States, no action has been taken by us or the underwriters that would permit a public offering of the securities offered by this prospectus in any jurisdiction where action for that purpose is required. The securities offered by this prospectus may not be offered or sold, directly or indirectly, nor may this prospectus or any other offering material or advertisements in connection with the offer and sale of any such securities be distributed or published in any jurisdiction, except under circumstances that will result in compliance with the applicable rules and regulations of that jurisdiction. Persons into whose possession this prospectus comes are advised to inform themselves about and to observe any restrictions relating to the offering and the distribution of this prospectus. This prospectus does not constitute an offer to sell or a
139
Table of Contents
solicitation of an offer to buy any securities offered by this prospectus in any jurisdiction in which such an offer or a solicitation is unlawful.
Each of the underwriters may arrange to sell common shares offered hereby in certain jurisdictions outside the United States, either directly or through affiliates, where they are permitted to do so. In that regard, Wells Fargo Securities, LLC may arrange to sell shares in certain jurisdictions through an affiliate, Wells Fargo Securities International Limited, or WFSIL. WFSIL is a wholly-owned indirect subsidiary of Wells Fargo & Company and an affiliate of Wells Fargo Securities, LLC. WFSIL is a U.K. incorporated investment firm regulated by the Financial Services Authority. Wells Fargo Securities is the trade name for certain corporate and investment banking services of Wells Fargo & Company and its affiliates, including Wells Fargo Securities, LLC and WFSIL.
This document is only being distributed to and is only directed at (i) persons who are outside the United Kingdom or (ii) to investment professionals falling within Article 19(5) of the Financial Services and Markets Act 2000 (Financial Promotion) Order 2005, or the Order, or (iii) high net worth entities, and other persons to whom it lawfully may be communicated, falling with Article 49(2)(a) to (d) of the Order (all such persons together being referred to as “relevant persons”). The securities are only available to, and any invitation, offer, or agreement to subscribe, purchase, or otherwise acquire such securities will be engaged in only with, relevant persons. Any person who is not a relevant person should not act or rely on this document or any of its contents.
In relation to each Member State of the European Economic Area that has implemented the Prospectus Directive (each, a “Relevant Member State”), from and including the date on which the European Union Prospectus Directive, or the EU Prospectus Directive, is implemented in that Relevant Member State, or the Relevant Implementation Date, an offer of securities described in this prospectus may not be made to the public in that Relevant Member State prior to the publication of a prospectus in relation to the shares, which has been approved by the competent authority in that Relevant Member State or, where appropriate, approved in another Relevant Member State and notified to the competent authority in that Relevant Member State, all in accordance with the EU Prospectus Directive, except that it may, with effect from and including the Relevant Implementation Date, make an offer of shares to the public in that Relevant Member State at any time:
| • | to legal entities which are authorized or regulated to operate in the financial markets or, if not so authorized or regulated, whose corporate purpose is solely to invest in securities; | |
| • | to any legal entity that has two or more of (1) an average of at least 250 employees during the last financial year; (2) a total balance sheet of more than €43,000,000; and (3) an annual net turnover of more than €50,000,000, as shown in its last annual or consolidated accounts; |
| • | to fewer than 100 natural or legal persons (other than qualified investors as defined in the EU Prospectus Directive) subject to obtaining the prior consent of the book-running managers for any such offer; or |
| • | in any other circumstances which do not require the publication by us of a prospectus pursuant to Article 3 of the Prospectus Directive. |
For the purposes of this provision, the expression an “offer of securities to the public” in relation to any securities in any Relevant Member State means the communication in any form and by any means of sufficient information on the terms of the offer and the securities to be offered so as to enable an investor to decide to purchase or subscribe for the securities, as the same may be varied in that Member State by any measure implementing the EU Prospectus Directive in that Member State and the expression EU Prospectus Directive means Directive 2003/71/EC and includes any relevant implementing measure in each Relevant Member State.
This document does not constitute a prospectus within the meaning of Art. 652a of the Swiss Code of Obligations. The shares of common stock may not be sold directly or indirectly in or into Switzerland except in a manner which will not result in a public offering within the meaning of the Swiss Code of Obligations. Neither this document nor any other offering materials relating to the shares of common stock may be distributed, published, or otherwise made available in Switzerland except in a manner which will not constitute a public offer of the shares of common stock in Switzerland.
140
Table of Contents
The offering of the securities has not been registered pursuant to the Italian securities legislation and, accordingly, we have not offered or sold, and will not offer or sell, any securities in the Republic of Italy in a solicitation to the public, and that sales of the securities in the Republic of Italy shall be effected in accordance with all Italian securities, tax, and exchange control and other applicable laws and regulations. In any case, the securities cannot be offered or sold to any individuals in the Republic of Italy either in the primary market or the secondary market.
We will not offer, sell, or deliver any securities or distribute copies of this prospectus or any other document relating to the securities in the Republic of Italy except to “Professional Investors”, as defined in Article 31.2 of CONSOB Regulation No. 11522 of 2 July 1998 as amended, or Regulation No. 11522, pursuant to Article 30.2 and 100 of Legislative Decree No. 58 of 24 February 1998 as amended, or Decree No. 58, or in any other circumstances where an expressed exemption to comply with the solicitation restrictions provided by Decree No. 58 or Regulation No. 11971 of 14 May 1999 as amended applies, provided, however, that any such offer, sale, or delivery of the securities or distribution of copies of the prospectus or any other document relating to the securities in the Republic of Italy must be:
| • | made by investment firms, banks, or financial intermediaries permitted to conduct such activities in the Republic of Italy in accordance with Legislative Decree No. 385 of 1 September 1993, as amended, or Decree No. 385, Decree No. 58, CONSOB Regulation No. 11522, and any other applicable laws and regulations; | |
| • | in compliance with Article 129 of Decree No. 385 and the implementing instructions of the Bank of Italy, pursuant to which the issue, trading, or placement of securities in Italy is subject to a prior notification to the Bank of Italy, unless an exemption, depending, inter alia, on the aggregate amount and the characteristics of the securities issued or offered in the Republic of Italy, applies; and | |
| • | in compliance with any other applicable notification requirement or limitation which may be imposed by CONSOB or the Bank of Italy. |
Certain of the underwriters and their affiliates have provided in the past to us and our affiliates and may provide from time to time in the future certain commercial banking, financial advisory, investment banking, and other services for us and such affiliates in the ordinary course of their business, for which they have received and may continue to receive customary fees and commissions. Morgan Stanley Senior Funding Inc., an affiliate of Morgan Stanley & Co. Incorporated, is the administrative agent under our existing senior secured credit facility and affiliates of each of the joint book-running managers are lenders thereunder and, consequently, will receive a portion of the net proceeds of this offering. In the future, affiliates of each joint book-running manager will be lenders under our new senior secured credit facility. In addition, from time to time, certain of the underwriters and their affiliates may effect transactions for their own account or the account of customers, and hold on behalf of themselves or their customers, long or short positions in our debt or equity securities or loans, and may do so in the future.
Certain of the underwriters and their affiliates have provided in the past to Mr. Moyes and his affiliates and may provide from time to time in the future certain commercial banking, financial advisory, investment banking, and other services for Mr. Moyes and other entities with which he is affiliated in the ordinary course of their business, for which they have received and may continue to receive customary fees and commissions. We are not a party to any of these transactions.
141
Table of Contents
Legal Matters
The validity of the shares of Class A common stock offered hereby will be passed upon for us by Skadden, Arps, Slate, Meagher & Flom LLP, New York, New York. Certain legal matters will be passed upon for us by Scudder Law Firm, Lincoln, Nebraska. The validity of the shares of Class A common stock offered hereby will be passed upon for the underwriters by Simpson Thacher & Bartlett LLP, New York, New York.
Experts
The consolidated financial statements of Swift Corporation and subsidiaries as of December 31, 2009 and 2008 and for each of the years in the three-year period ended December 31, 2009, the consolidated financial statements of Swift Transportation Co., Inc. and subsidiaries as of May 10, 2007 and December 31, 2006 and for the period from January 1, 2007 to May 10, 2007, and the financial statements of Swift Holdings Corp. as of July 2, 2010 have been included herein in reliance upon the reports of KPMG LLP, independent registered public accounting firm, appearing elsewhere herein upon the authority of said firm as experts in accounting and auditing.
The audit report covering the December 31, 2009 consolidated financial statements refers to the adoption of Statement of Financial Accounting Standards No. 157, Fair Value Measurements, included in Financial Accounting Standards Board Accounting Standards Codification Topic 820,Fair Value Measurements and Disclosures.
Where You Can Find More Information
We have filed with the SEC a registration statement onForm S-1 under the Securities Act with respect to the shares of Class A common stock we are offering. The registration statement, including the attached exhibits and schedules, contains additional relevant information about us and our Class A common stock. This prospectus does not contain all of the information set forth in the registration statement and the exhibits and schedules thereto. The rules and regulations of the SEC allow us to omit from this prospectus certain information included in the registration statement.
For further information about us and our Class A common stock, you may inspect a copy of the registration statement and the exhibits and schedules to the registration statement without charge at the offices of the SEC at 100 F Street, N.E., Washington, D.C. 20549. You may obtain copies of all or any part of the registration statement from the Public Reference Section of the SEC, 100 F Street, N.E., Washington, D.C. 20549 upon the payment of the prescribed fees. You may obtain information on the operation of the Public Reference Room by calling the SEC at1-800-SEC-0330. The SEC maintains a website at www.sec.gov that contains reports, proxy and information statements, and other information regarding registrants like us that file electronically with the SEC. You can also inspect our registration statement on this website.
Upon completion of this offering, we will become subject to the reporting and information requirements of the Exchange Act, and we will file reports, proxy statements, and other information with the SEC.
142
Table of Contents
Index to Consolidated Financial Statements
| Page | ||
Number | ||
Unaudited Financial Statements of Swift Corporation (successor) | ||
| F-2 | ||
| F-3 | ||
| F-4 | ||
| F-5 | ||
| F-6 | ||
| F-7 | ||
Audited Financial Statements of Swift Corporation (successor) | ||
| F-21 | ||
| F-22 | ||
| F-23 | ||
| F-24 | ||
| F-25 | ||
| F-26 | ||
| F-28 | ||
Audited Financial Statements of Swift Transportation Co., Inc. (predecessor) | ||
| F-62 | ||
| F-63 | ||
| F-64 | ||
| F-65 | ||
| F-66 | ||
| F-67 | ||
| F-68 | ||
Audited Financial Statements of Swift Holdings Corp. (registrant) | ||
| F-85 | ||
| F-86 | ||
| F-87 |
F-1
Table of Contents
Swift Corporation & Subsidiaries
Consolidated balance sheets
Consolidated balance sheets
| March 31, | December 31, | |||||||
| 2010 | 2009 | |||||||
| (Unaudited) | ||||||||
| (In thousands, except share data) | ||||||||
ASSETS | ||||||||
| Current assets: | ||||||||
| Cash and cash equivalents | $ | 87,327 | $ | 115,862 | ||||
| Restricted cash | 48,871 | 24,869 | ||||||
| Accounts receivable, net | 269,392 | 21,914 | ||||||
| Retained interest in accounts receivable | — | 79,907 | ||||||
| Income tax refund receivable | 1,843 | 1,436 | ||||||
| Equipment sales receivable | 2,498 | 208 | ||||||
| Inventories and supplies | 9,414 | 10,193 | ||||||
| Assets held for sale | 7,929 | 3,571 | ||||||
| Prepaid taxes, licenses, insurance and other | 46,349 | 42,365 | ||||||
| Deferred income taxes | 48,820 | 49,023 | ||||||
| Other current assets | 4,606 | 4,523 | ||||||
| Total current assets | 527,049 | 353,871 | ||||||
| Property and equipment, at cost: | ||||||||
| Revenue and service equipment | 1,494,107 | 1,488,953 | ||||||
| Land | 142,126 | 142,126 | ||||||
| Facilities and improvements | 224,541 | 222,751 | ||||||
| Furniture and office equipment | 33,092 | 32,726 | ||||||
| Total property and equipment | 1,893,866 | 1,886,556 | ||||||
| Less: accumulated depreciation and amortization | 566,656 | 522,011 | ||||||
| Net property and equipment | 1,327,210 | 1,364,545 | ||||||
| Insurance claims receivable | 40,775 | 45,775 | ||||||
| Other assets | 106,712 | 107,211 | ||||||
| Intangible assets, net | 383,737 | 389,216 | ||||||
| Goodwill | 253,256 | 253,256 | ||||||
| Total assets | $ | 2,638,739 | $ | 2,513,874 | ||||
| LIABILITIES AND STOCKHOLDERS’ DEFICIT | ||||||||
| Current liabilities: | ||||||||
| Accounts payable | $ | 85,359 | $ | 70,934 | ||||
| Accrued liabilities | 135,216 | 110,662 | ||||||
| Current portion of claims accruals | 101,380 | 92,280 | ||||||
| Current portion of long-term debt and obligations under capital leases | 56,369 | 46,754 | ||||||
| Fair value of guarantees | 2,886 | 2,519 | ||||||
| Current portion of fair value of interest rate swaps | 44,714 | 47,244 | ||||||
| Total current liabilities | 425,924 | 370,393 | ||||||
| Long-term debt and obligations under capital leases | 2,325,812 | 2,420,180 | ||||||
| Claims accruals, less current portion | 151,269 | 166,718 | ||||||
| Fair value of interest rate swaps, less current portion | 34,689 | 33,035 | ||||||
| Deferred income taxes | 360,333 | 383,795 | ||||||
| Securitization of accounts receivable | 150,000 | — | ||||||
| Other liabilities | 9,066 | 5,534 | ||||||
| Total liabilities | 3,457,093 | 3,379,655 | ||||||
| Commitments and contingencies (note 12) | ||||||||
| Stockholders’ deficit: | ||||||||
| Preferred stock, par value $.001 per share Authorized 1,000,000 shares; none issued | — | — | ||||||
| Common stock, par value $.001 per share Authorized 200,000,000 shares; 75,145,892 shares issued at March 31, 2010 and December 31, 2009 | 75 | 75 | ||||||
| Additional paid-in capital | 279,136 | 419,105 | ||||||
| Accumulated deficit | (812,937 | ) | (759,936 | ) | ||||
| Stockholder loans receivable | (241,678 | ) | (471,113 | ) | ||||
| Accumulated other comprehensive loss | (43,052 | ) | (54,014 | ) | ||||
| Noncontrolling interest | 102 | 102 | ||||||
| Total stockholders’ deficit | (818,354 | ) | (865,781 | ) | ||||
| Total liabilities and stockholders’ deficit | $ | 2,638,739 | $ | 2,513,874 | ||||
See accompanying notes to consolidated financial statements.
F-2
Table of Contents
Swift Corporation & Subsidiaries
Consolidated statements of operations
Consolidated statements of operations
| Three Months Ended March 31, | ||||||||
| 2010 | 2009 | |||||||
| (Unaudited) | ||||||||
| (In thousands, except per share data) | ||||||||
| Operating revenue | $ | 654,830 | $ | 614,756 | ||||
| Operating expenses: | ||||||||
| Salaries, wages and employee benefits | 177,803 | 189,377 | ||||||
| Operating supplies and expenses | 47,830 | 56,723 | ||||||
| Fuel | 106,082 | 85,868 | ||||||
| Purchased transportation | 175,702 | 135,753 | ||||||
| Rental expense | 18,903 | 20,391 | ||||||
| Insurance and claims | 20,207 | 25,481 | ||||||
| Depreciation, amortization and impairments | 66,771 | 67,471 | ||||||
| Gain on disposal of property and equipment | (1,448 | ) | (19 | ) | ||||
| Communication and utilities | 6,422 | 7,091 | ||||||
| Operating taxes and licenses | 13,365 | 14,381 | ||||||
| Total operating expenses | 631,637 | 602,517 | ||||||
| Operating income | 23,193 | 12,239 | ||||||
| Other (income) expenses: | ||||||||
| Interest expense | 62,596 | 47,702 | ||||||
| Derivative interest expense | 23,714 | 7,549 | ||||||
| Interest income | (220 | ) | (428 | ) | ||||
| Other | (371 | ) | 675 | |||||
| Total other (income) expenses, net | 85,719 | 55,498 | ||||||
| Loss before income taxes | (62,526 | ) | (43,259 | ) | ||||
| Income tax (benefit) expense | (9,525 | ) | 301 | |||||
| Net loss | $ | (53,001 | ) | $ | (43,560 | ) | ||
| Basic and diluted loss per share | $ | (0.71 | ) | $ | (0.58 | ) | ||
| Pro forma C corporation data: | ||||||||
| Historical loss before income taxes | N/A | $ | (43,259 | ) | ||||
| Pro forma provision for income taxes | N/A | 2,259 | ||||||
| Pro forma net loss | N/A | $ | (45,518 | ) | ||||
| Pro forma basic and diluted loss per share | N/A | $ | (0.61 | ) | ||||
See accompanying notes to consolidated financial statements.
F-3
Table of Contents
Swift Corporation & Subsidiaries
Consolidated statements of comprehensive loss
Consolidated statements of comprehensive loss
| Three Months Ended March 31, | ||||||||
| 2010 | 2009 | |||||||
| (Unaudited) | ||||||||
| (In thousands) | ||||||||
| Net loss | $ | (53,001 | ) | $ | (43,560 | ) | ||
| Other comprehensive income (loss): | ||||||||
| Change in unrealized losses on cash flow hedges | 10,962 | (11,180 | ) | |||||
| Comprehensive loss | $ | (42,039 | ) | $ | (54,740 | ) | ||
See accompanying notes to consolidated financial statements.
F-4
Table of Contents
Swift Corporation & Subsidiaries
Consolidated statement of stockholders’ deficit
Consolidated statement of stockholders’ deficit
| Accumulated | ||||||||||||||||||||||||||||||||
| Common Stock | Additional | Stockholder | Other | Total | ||||||||||||||||||||||||||||
| Par | Paid-In | Accumulated | Loans | Comprehensive | Noncontrolling | Stockholders’ | ||||||||||||||||||||||||||
| Shares | Value | Capital | Deficit | Receivable | Loss | Interest | Deficit | |||||||||||||||||||||||||
| (Unaudited) | ||||||||||||||||||||||||||||||||
| (In thousands, except share data) | ||||||||||||||||||||||||||||||||
| Balances, December 31, 2009 | 75,145,892 | $ | 75 | $ | 419,105 | $ | (759,936 | ) | $ | (471,113 | ) | $ | (54,014 | ) | $ | 102 | $ | (865,781 | ) | |||||||||||||
| Interest accrued on stockholder loan | 1,650 | (1,650 | ) | — | ||||||||||||||||||||||||||||
| Interest accrued and proceeds from repayment of related party note receivable | 29 | 85 | 114 | |||||||||||||||||||||||||||||
| Change in unrealized losses on cash flow hedges | 10,962 | 10,962 | ||||||||||||||||||||||||||||||
| Reduction of stockholder loan (see Note 11) | (231,000 | ) | 231,000 | — | ||||||||||||||||||||||||||||
| Cancellation of fixed rate notes (see Note 6) | 89,352 | 89,352 | ||||||||||||||||||||||||||||||
| Net loss | (53,001 | ) | (53,001 | ) | ||||||||||||||||||||||||||||
| Balances, March 31, 2010 | 75,145,892 | $ | 75 | $ | 279,136 | $ | (812,937 | ) | $ | (241,678 | ) | $ | (43,052 | ) | $ | 102 | $ | (818,354 | ) | |||||||||||||
See accompanying notes to consolidated financial statements.
F-5
Table of Contents
Swift Corporation & Subsidiaries
Consolidated statements of cash flows
Consolidated statements of cash flows
| Three Months Ended | ||||||||
| March 31, | ||||||||
| 2010 | 2009 | |||||||
| (Unaudited) | ||||||||
| (In thousands) | ||||||||
| Cash flows from operating activities: | ||||||||
| Net loss | $ | (53,001 | ) | $ | (43,560 | ) | ||
| Adjustments to reconcile net loss to net cash provided by operating activities: | ||||||||
| Depreciation and amortization | 68,754 | 68,965 | ||||||
| (Gain) loss on disposal of property and equipment less write-off of totaled tractors | (1,261 | ) | 447 | |||||
| Impairment of property and equipment | 1,274 | 515 | ||||||
| Gain on securitization | — | (562 | ) | |||||
| Deferred income taxes | (23,259 | ) | (168 | ) | ||||
| Provision for losses on accounts receivable | (1,171 | ) | 435 | |||||
Income effect ofmark-to-market adjustment of interest rate swaps | 11,127 | (2,062 | ) | |||||
| Increase (decrease) in cash resulting from changes in: | ||||||||
| Accounts receivable | (18,400 | ) | 3,847 | |||||
| Inventories and supplies | 778 | 920 | ||||||
| Prepaid expenses and other current assets | (4,391 | ) | (7,286 | ) | ||||
| Other assets | 2,699 | (13,050 | ) | |||||
| Accounts payable, accrued and other liabilities | 31,958 | (1,065 | ) | |||||
| Net cash provided by operating activities | 15,107 | 7,376 | ||||||
| Cash flows from investing activities: | ||||||||
| Increase in restricted cash | (24,002 | ) | (3,249 | ) | ||||
| Proceeds from sale of property and equipment | 4,684 | 2,381 | ||||||
| Capital expenditures | (17,155 | ) | (12,551 | ) | ||||
| Payments received on notes receivable | 1,345 | 1,188 | ||||||
| Expenditures on assets held for sale | (574 | ) | (1,509 | ) | ||||
| Payments received on assets held for sale | 363 | 2,149 | ||||||
| Payments received on equipment sale receivables | 208 | 4,930 | ||||||
| Net cash used in investing activities | (35,131 | ) | (6,661 | ) | ||||
| Cash flows from financing activities: | ||||||||
| Repayment of long-term debt and capital leases | (10,625 | ) | (4,846 | ) | ||||
| Repayment of short-term notes payable | — | (1,978 | ) | |||||
| Proceeds from long-term debt and capital leases | — | 4,897 | ||||||
| Borrowings under accounts receivable securitization | 40,000 | — | ||||||
| Repayment of accounts receivable securitization | (38,000 | ) | — | |||||
| Distributions to stockholders | — | (6,204 | ) | |||||
| Interest payments received on stockholder loan receivable | — | 6,204 | ||||||
| Payments received on stockholder loan from affiliate | 114 | 102 | ||||||
| Net cash used in financing activities | (8,511 | ) | (1,825 | ) | ||||
| Net decrease in cash and cash equivalents | (28,535 | ) | (1,110 | ) | ||||
| Cash and cash equivalents at beginning of period | 115,862 | 57,916 | ||||||
| Cash and cash equivalents at end of period | $ | 87,327 | $ | 56,806 | ||||
| Supplemental disclosure of cash flow information: | ||||||||
| Cash paid during the period for: | ||||||||
| Interest | $ | 58,748 | $ | 38,679 | ||||
| Income taxes | $ | 13,214 | $ | 1,059 | ||||
| Supplemental schedule of: | ||||||||
| Non-cash investing activities: | ||||||||
| Equipment sales receivables | $ | 2,498 | $ | 2,649 | ||||
| Equipment purchase accrual | $ | 17,120 | $ | 1,257 | ||||
| Notes receivable from sale of assets | $ | 1,792 | $ | 1,129 | ||||
| Non-cash financing activities: | ||||||||
| Re-recognition of securitized accounts receivable | $ | 148,000 | $ | — | ||||
| Capital lease additions | $ | 15,236 | $ | 20,980 | ||||
| Insurance premium notes payable | $ | — | $ | 6,205 | ||||
| Cancellation of senior notes | $ | 89,352 | $ | — | ||||
| Reduction in stockholder loan | $ | 231,000 | $ | — | ||||
Paid-in-kind interest on stockholder loan | $ | 1,650 | $ | — | ||||
See accompanying notes to consolidated financial statements.
F-6
Table of Contents
Swift Corporation and Subsidiaries
Note 1. Basis of presentation
Swift Corporation is the holding company for Swift Transportation Co., LLC (a Delaware limited liability company, formerly Swift Transportation Co., Inc., a Nevada corporation) and its subsidiaries (collectively, “Swift Transportation Co.”), a truckload carrier headquartered in Phoenix, Arizona which was acquired by Swift Corporation on May 10, 2007, and Interstate Equipment Leasing LLC (a Delaware limited liability company, formerly Interstate Equipment Leasing, Inc., an Arizona corporation, “IEL”), of which the shares of capital stock were contributed to Swift Corporation on April 7, 2007 (all the foregoing being, collectively, “Swift” or the “Company”).
The Company operates predominantly in one industry, road transportation, throughout the continental United States and Mexico and thus has only one reportable segment. The Company operates a national terminal network and a fleet of approximately 16,200 tractors, 49,400 trailers and 4,300 intermodal containers.
In the opinion of management, the accompanying financial statements include all adjustments necessary for the fair presentation of the interim periods presented. These interim financial statements should be read in conjunction with the Company’s annual financial statements for the year ended December 31, 2009. Management has evaluated the effect on the Company’s reported financial condition and results of operations of events subsequent to March 31, 2010 through the issuance of the financial statements on April 30, 2010, and has updated their evaluation of subsequent events through the filing date on July 21, 2010.
Note 2. New accounting standards
In January 2010, the Financial Accounting Standards Board (“FASB”) issued Accounting Standards Update (“ASU”)No. 2010-06,“Fair Value Measurements and Disclosures (Topic 820) — Improving Disclosures about Fair Value Measurements.”This ASU amends the FASB Accounting Standards Codification Topic (“Topic”) 820 to require entities to provide new disclosures and clarify existing disclosures relating to fair value measurements. New disclosures include requiring an entity to disclose separately the amounts of significant transfers in and out of Level 1 and 2 fair value measurements and to describe the reasons for the transfers, as well as to disclose separately gross purchases, sales, issuances and settlements in the roll forward activity of Level 3 measurements. Clarifications of existing disclosures include requiring a greater level of disaggregation of fair value measurements by class of assets and liabilities, in addition to enhanced disclosures concerning the inputs and valuation techniques used to determine Level 2 and Level 3 fair value measurements. ASUNo. 2010-06 is effective for the Company’s interim and annual periods beginning January 1, 2010, except for the additional disclosure of purchases, sales, issuances, and settlements in Level 3 fair value measurements, which is effective for the Company’s fiscal year beginning January 1, 2011. The adaption of the portions of this statement effective for the Company on January 1, 2010 did not have a material impact on the Company’s consolidated financial statements. Further, the Company does not expect the adoption in January 2011 of the remaining portion of this statement to have a material impact on its consolidated financial statements.
| Note 3. | Income taxes |
Until October 10, 2009, the Company had elected to be taxed under the Internal Revenue Code as a subchapter S Corporation. Under subchapter S provisions, the Company did not pay corporate income taxes on its taxable income. Instead, the stockholders were liable for federal and state income taxes on the taxable income of the Company, and the Company was permitted to distribute 39% of its taxable income to the stockholders to fund such tax obligations. An income tax provision or benefit was recorded for certain of the Company’s subsidiaries, including its Mexico subsidiaries and its domestic captive insurance company, which were not eligible to be treated as qualified subchapter S corporations. Additionally, the Company recorded a provision for state income taxes applicable to taxable income attributed to states that do not recognize the S corporation election.
F-7
Table of Contents
Swift Corporation and Subsidiaries
Notes to consolidated financial statements — (Continued)
In conjunction with Consent and Amendment No. 2 to Credit Agreement, dated October 7, 2009 (the “Second Amendment”), the Company revoked its election to be taxed as a subchapter S corporation and, beginning October 10, 2009, is being taxed as a subchapter C corporation. Under subchapter C, the Company is liable for federal and state corporate income taxes on its taxable income.
In April 2010, substantially all of the Company’s domestic subsidiaries were converted from corporations to limited liability companies. The subsidiaries not converted include the Company’s foreign subsidiaries, captive insurance companies and certain dormant subsidiaries that are being dissolved and liquidated.
As of March 31, 2010, the Company had unrecognized tax benefits totaling approximately $3.6 million, all of which would favorably impact its effective tax rate if subsequently recognized. The Company recognizes potential accrued interest and penalties related to unrecognized tax benefits as a component of income tax expense. Accrued interest and penalties as of March 31, 2010 were approximately $1.3 million. To the extent interest and penalties are not assessed with respect to uncertain tax positions, amounts accrued will be reduced and reflected as a reduction of the overall income tax provision. The Company anticipates that the total amount of unrecognized tax benefits may decrease by approximately $2.0 million during the next twelve months, which should not have a material impact on the Company’s financial statements.
Certain of the Company’s subsidiaries are currently under examination by Federal and various state jurisdictions for years ranging from 1997 to 2007. At the completion of these examinations, management does not expect any adjustments that would have a material impact on the Company’s effective tax rate. Periods subsequent to 2007 remain subject to examination.
Pro forma information (unaudited)
As discussed above, the Company was taxed under the Internal Revenue Code as a subchapter S corporation until its conversion to a subchapter C corporation effective October 10, 2009. Under subchapter S, the Company did not pay corporate income taxes on its taxable income. Instead, its stockholders were liable for federal and state income taxes on the taxable income of the Company. The Company has filed a registration statement in connection with a proposed initial public offering of its common stock (“IPO”). Assuming completion of the IPO, the Company will continue to report earnings (loss) and earnings (loss) per share as a subchapter C corporation. For comparative purposes, a pro forma income tax provision for corporate income taxes has been calculated as if the Company had been taxed as a subchapter C corporation in the three months ended March 31, 2009 when the Company’s subchapter S election was in effect.
| Note 4. | Intangible assets |
Intangible assets as of March 31, 2010 and December 31, 2009 were (in thousands):
| March 31, | December 31, | |||||||
| 2010 | 2009 | |||||||
| Customer Relationship: | ||||||||
| Gross carrying value | $ | 275,324 | $ | 275,324 | ||||
| Accumulated amortization | (72,749 | ) | (67,553 | ) | ||||
| Owner-Operator Relationship: | ||||||||
| Gross carrying value | 3,396 | 3,396 | ||||||
| Accumulated amortization | (3,271 | ) | (2,988 | ) | ||||
| Trade Name: | ||||||||
| Gross carrying value | 181,037 | 181,037 | ||||||
| Intangible assets, net | $ | 383,737 | $ | 389,216 | ||||
F-8
Table of Contents
Swift Corporation and Subsidiaries
Notes to consolidated financial statements — (Continued)
Intangible assets acquired as a result of the Swift Transportation Co. acquisition include trade name, customer relationships, and owner-operator relationships. Amortization of the customer relationship acquired in the acquisition is calculated on the 150% declining balance method over the estimated useful life of 15 years. The customer relationship contributed to the Company at May 9, 2007 is amortized using the straight-line method over 15 years. The owner-operator relationship is amortized using the straight-line method over three years. The trade name has an indefinite useful life and is not amortized, but rather is tested for impairment at least annually, unless events occur or circumstances change between annual tests that would more likely than not reduce the fair value.
| Note 5. | Assets held for sale |
Assets held for sale as of March 31, 2010 and December 31, 2009 were (in thousands):
| March 31, | December 31, | |||||||
| 2010 | 2009 | |||||||
| Land and facilities | $ | 2,737 | $ | 2,737 | ||||
| Revenue equipment | 5,192 | 834 | ||||||
| Assets held for sale | $ | 7,929 | $ | 3,571 | ||||
As of March 31, 2010 and December 31, 2009, assets held for sale are stated at the lower of depreciated cost or fair value less estimated selling expenses. The Company expects to sell these assets within the next twelve months.
During the three months ended March 31, 2010, management undertook an evaluation of the Company’s revenue equipment and concluded that it would be more cost effective to dispose of approximately 2,500 trailers through scrap or sale rather than to maintain them in the operating fleet. These trailers met the requirements for assets held for sale treatment and were reclassified as such, with a related $1.3 million pre-tax impairment charge being recorded during the period as discussed in Note 10.
| Note 6. | Debt and financing transactions |
At March 31, 2010, the Company had approximately $2.22 billion in debt outstanding primarily associated with the acquisition of Swift Transportation Co. The debt consists of proceeds from a credit facility comprised of a first lien term loan and revolving line of credit pursuant to a credit agreement dated May 10, 2007, as amended (the “Credit Agreement”), with a group of lenders and proceeds from the offering of fixed and floating rate senior notes. The use of the proceeds included the cash consideration paid for the purchase price of Swift Transportation Co. of $1.52 billion, repayment of approximately $376.5 million of indebtedness of Swift Transportation Co. and IEL, $560 million advanced pursuant to the stockholder loan receivable (refer to Note 11) and debt issuance costs of $56.8 million. The remaining proceeds were used by the Company for payment of transaction-related expenses. The credit facility and senior notes are secured by substantially all of the assets of the Company and are guaranteed by Swift Corporation, IEL, Swift Transportation Co. and its domestic subsidiaries other than its captive insurance subsidiaries and its bankruptcy-remote special purpose subsidiaries.
Credit facility
The credit facility consists of a first lien term loan with an original aggregate principal amount of $1.72 billion due May 2014, a $300 million revolving line of credit due May 2012 and a $150 million synthetic letter of credit facility due May 2014. Principal payments on the first lien term loan are due quarterly in amounts equal to (i) 0.25% of the original aggregate principal outstanding beginning September 30, 2007 to September 30, 2013 and (ii) 23.5% of the original aggregate principal outstanding from December 31, 2013 through its maturity. As of March 31, 2010, there is $1.51 billion outstanding under the first lien term loan.
F-9
Table of Contents
Swift Corporation and Subsidiaries
Notes to consolidated financial statements — (Continued)
In April 2010, the Company made an $18.7 million payment on the first lien term loan out of excess cash flows for the prior fiscal year, as defined in the Credit Agreement. This payment was applied in full satisfaction of the next four scheduled principal payments and partial satisfaction of the fifth successive principal payment which is due June 30, 2011.
As of March 31, 2010, there were no borrowings under the revolving line of credit. The unused portion of the revolving line of credit is subject to a commitment fee of 1.00%. The revolving line of credit also includes capacity for letters of credit up to $175 million. As of March 31, 2010, the Company had outstanding letters of credit under the revolving line of credit primarily for workers’ compensation and self-insurance liability purposes totaling $64.4 million, leaving $235.6 million available under the revolving line of credit.
Similar to the letters of credit under the revolving line of credit, the outstanding letters of credit pursuant to the $150 million synthetic letter of credit facility are primarily for workers’ compensation and self-insurance liability purposes. At March 31, 2010, the synthetic letter of credit facility was fully utilized.
Interest on the first lien term loan and the outstanding borrowings under the revolving credit facility are based upon one of two rate options plus an applicable margin. The base rate is equal to the London Interbank Offered Rate (“LIBOR”) or the higher of the prime rate published in the Wall Street Journal and the Federal Funds Rate in effect plus 0.50% to 1%. Following the Second Amendment, effective October 13, 2009 LIBOR option loans are subject to a 2.25% minimum LIBOR rate option (the “LIBOR floor”) and alternate base rate option loans are subject to a 3.25% minimum alternate base rate option. The Company may select the interest rate option at the time of borrowing. The applicable margins for the interest rate options range from 4.50% to 6.00%, depending on the credit rating assigned by Standards and Poor’s Rating Services (“S&P”) and Moody’s Investor Services (“Moody’s”). Interest on the first lien term loan and outstanding borrowing under the revolving line of credit is payable on the stated maturity of each loan, on the date of principal prepayment, if any, with respect to base rate loans, on the last day of each calendar quarter, and with respect to LIBOR rate loans, on the last day of each interest period. As of March 31, 2010, interest accrues at the greater of LIBOR or the LIBOR floor plus 6.00% (8.25% at March 31, 2010).
Senior notes
On May 10, 2007, the Company completed a private placement of second-priority senior notes associated with the acquisition of Swift Transportation Co. totaling $835 million, which consisted of: $240 million aggregate principal amount second-priority senior secured floating rate notes due May 15, 2015 (“senior floating rate notes”) and $595 million aggregate principal amount of 12.50% second-priority senior secured fixed rate notes due May 15, 2017 (“senior fixed rate notes” and, together with the senior floating rate notes, the “senior notes”).
Interest on the senior floating rate notes is payable on February 15, May 15, August 15, and November 15, accruing at three-month LIBOR plus 7.75% (8.00% at March 31, 2010). Once the credit facility is paid in full, the Company may redeem any of the senior floating rate notes on any interest payment date at an initial redemption price of 102%.
Interest on the 12.50% senior fixed rate notes is payable on May 15 and November 15. Once the credit facility is paid in full, on or after May 15, 2012, the Company may redeem the fixed rate notes at an initial redemption price of 106.25% of their principal amount and accrued interest.
During the year ended December 31, 2009, Jerry Moyes, the Company’s President, Chief Executive Officer and majority stockholder purchased $36.4 million face value senior floating rate notes and $89.4 million face value senior fixed rate notes in open market transactions. In connection with the Second Amendment, Mr. Moyes agreed to cancel his personally held senior notes in return for a $325.0 million reduction of the stockholder loan due 2018 owed to the Company by the Jerry and Vickie Moyes Family Trust dated12/11/87 and various Moyes children’s trusts (collectively, “Moyes affiliates”), each of which is a stockholder of the
F-10
Table of Contents
Swift Corporation and Subsidiaries
Notes to consolidated financial statements — (Continued)
Company. The floating rate notes held by Mr. Moyes, totaling $36.4 million in principal amount, were cancelled at closing of the Second Amendment on October 13, 2009 and, correspondingly, the stockholder loan was reduced by $94.0 million. The fixed rate notes held by Mr. Moyes, totaling $89.4 million in principal amount, were cancelled in January 2010 and the stockholder loan was reduced further by an additional $231.0 million. The amount of the stockholder loan cancelled in exchange for the contribution of notes was negotiated by Mr. Moyes with the steering committee of lenders, comprised of a number of the largest lenders (by holding size) and the Administrative Agent of the Credit Agreement. The cancellation of the notes increased stockholders’ equity by $36.4 million in October 2009 and $89.4 million in January 2010.
An intercreditor agreement among the first lien agent for the senior secured credit facility, the trustee of the senior notes, Swift Corporation and certain of its subsidiaries establishes the second priority status of the senior notes and contains restrictions and agreements with respect to the control of remedies, release of collateral, amendments to security documents, and the rights of holders of first priority lien obligations and holders of the senior notes.
Debt covenants
The credit facility contains certain covenants, including but not limited to required minimum liquidity, limitations on indebtedness, liens, asset sales, transactions with affiliates, and required leverage and interest coverage ratios. As of March 31, 2010, the Company was in compliance with these covenants. The indentures governing the senior notes contain covenants relating to limitations on asset sales, incurrence of indebtedness, and entering into sales and leaseback transactions. As of March 31, 2010, the Company was in compliance with these covenants. The indentures for the senior notes include a limit on future indebtedness if a minimum fixed charge coverage ratio, as defined, is not met. The Company currently does not meet that minimum requirement and cannot incur additional debt in excess of that specified in the agreement, including the limit for outstanding capital lease obligations of $212.5 million for 2010 and $250 million thereafter.
As permitted by the terms of the Credit Agreement, as amended, securitization proceeds under the accounts receivable securitization facility up to $210 million are not included as debt in the leverage ratio calculation, without regard to whether on or off-balance sheet accounting treatment applies to the accounts receivable securitization program. Although the Company met the leverage ratio, interest coverage ratio, and minimum liquidity requirements as of March 31, 2010 and is projecting to be in compliance in the future, the Company is subject to risks and uncertainties that the transportation industry will remain depressed and that the Company may not be successful in executing its business strategies. In the event current trucking industry conditions worsen or persist for an extended period of time, the Company has plans to implement certain actions that could assist in maintaining compliance with the debt covenants, including reducing capital expenditures, improving working capital, and reducing expenses in targeted areas of operations.
F-11
Table of Contents
Swift Corporation and Subsidiaries
Notes to consolidated financial statements — (Continued)
As of March 31, 2010 and December 31, 2009, long-term debt was (in thousands):
| March 31, | December 31, | |||||||
| 2010 | 2009 | |||||||
| First lien term loan due May 2014 | $ | 1,507,100 | $ | 1,511,400 | ||||
| Second-priority senior secured floating rate notes due May 15, 2015 | 203,600 | 203,600 | ||||||
| 12.50% second-priority senior secured fixed rate notes due May 15, 2017 | 505,648 | 595,000 | ||||||
| Note payable, with principal and interest payable in five annual payments of $514 plus interest at a fixed rate of 7.00% through August 2013 secured by real property | 1,542 | 2,056 | ||||||
| Notes payable, with principal and interest payable in 24 monthly payments of $130 including interest at a fixed rate of 7.5% through May 2011 | 1,617 | 1,993 | ||||||
| Total long-term debt | 2,219,507 | 2,314,049 | ||||||
| Less: current portion | 19,074 | 19,054 | ||||||
| Long-term debt, less current portion | $ | 2,200,433 | $ | 2,294,995 | ||||
| Note 7. | Accounts receivable securitization |
On July 30, 2008, the Company, through Swift Receivables Company II, LLC, a Delaware limited liability company, formerly Swift Receivables Corporation II, a Delaware corporation (“SRCII”), a wholly owned bankruptcy-remote special purpose subsidiary, entered into a new receivable sale agreement with unrelated financial entities (the “Purchasers”) to replace the Company’s prior accounts receivable sale facility (the “2007 RSA”) and to sell, on a revolving basis, undivided interests in the Company’s accounts receivable (the “2008 RSA”). The program limit under the 2008 RSA is $210 million and is subject to eligible receivables and reserve requirements. Outstanding balances under the 2008 RSA accrue interest at a yield of LIBOR plus 300 basis points or Prime plus 200 basis points, at the Company’s discretion. The 2008 RSA terminates on July 30, 2013 and is subject to an unused commitment fee ranging from 25 to 50 basis points, depending on the aggregate unused commitment of the 2008 RSA. The Company paid $6.7 million in closing fees, which were expensed at the time of sale consistent with the true sale accounting treatment applicable to the 2008 RSA at closing.
Following the adoption of ASUNo. 2009-16,“Accounting for Transfers of Financial Assets (Topic 860),”which was effective for the Company on January 1, 2010, the Company’s accounts receivable securitization facility no longer qualified for true sale accounting treatment and is now instead treated as a secured borrowing. As a result, the previously de-recognized accounts receivable were brought back onto the Company’s balance sheet and the related securitization proceeds were recognized as debt, while the program fees for the facility were reported as interest expense beginning January 1, 2010. The re-characterization of program fees from other expense to interest expense did not affect our interest coverage ratio calculation, and the change in accounting treatment for the securitization proceeds from sales proceeds to debt did not affect the leverage ratio calculation, as defined in the Credit Agreement, as amended.
For the three months ended March 31, 2010 and 2009, the Company incurred program fee expense of $1.1 million in each quarter associated with the 2008 RSA which was recorded in interest expense and other expense, respectively.
Pursuant to the 2008 RSA, collections under the receivables by the Company are held for the benefit of SRCII and the lenders in the facility and are unavailable to satisfy claims of the Company and its subsidiaries. The 2008 RSA contains certain restrictions and provisions (including cross-default provisions to our debt
F-12
Table of Contents
Swift Corporation and Subsidiaries
Notes to consolidated financial statements — (Continued)
agreements) which, if not met, could restrict the Company’s ability to borrow against future eligible receivables. The inability to borrow against additional receivables would reduce liquidity as the daily proceeds from collections on the receivables levered prior to termination are remitted to the lenders, with no further reinvestment of these funds by the lenders into the Company.
As of March 31, 2010, the outstanding borrowing under the accounts receivable securitization facility was $150 million.
| Note 8. | Capital leases |
The Company leases certain revenue equipment under capital leases. The Company’s capital leases are typically structured with balloon payments at the end of the lease term equal to the residual value the Company is contracted to receive from certain equipment manufacturers upon sale or trade back to the manufacturers. The Company is obligated to pay the balloon payments at the end of the leased term whether or not it receives the proceeds of the contracted residual values from the respective manufacturers. Certain leases contain renewal or fixed price purchase options. Obligations under capital leases total $162.7 million at March 31, 2010, the current portion of which is $37.3 million. The leases are collateralized by revenue equipment with a cost of $272.7 million and accumulated amortization of $63.7 million at March 31, 2010. The amortization of the equipment under capital leases is included in depreciation and amortization expense.
| Note 9. | Derivative financial instruments |
The Company is exposed to certain risks relating to its ongoing business operations. The primary risk managed by using derivative instruments is interest rate risk. In 2007, the Company entered into several interest rate swap agreements for the purpose of hedging variability of interest expense and interest payments on long-term variable rate debt and senior notes. The strategy was to use pay-fixed/receive-variable interest rate swaps to reduce the Company’s aggregate exposure to interest rate risk. These derivative instruments were not entered into for speculative purposes.
In connection with the credit facility, the Company has four interest rate swap agreements in effect at March 31, 2010 with a total notional amount of $1.14 billion, $305 million of which mature in August 2010, with the remainder maturing in August 2012. At October 1, 2007 (“designation date”), the Company designated and qualified these interest rate swaps as cash flow hedges. Subsequent to the October 1, 2007 designation date, the effective portion of the changes in fair value of the designated swaps was recorded in accumulated other comprehensive income (loss) (“OCI”) and is thereafter recognized to derivative interest expense as the interest on the hedged variable rate debt affects earnings. The ineffective portions of the changes in the fair value of designated interest rate swaps were recognized directly to earnings as derivative interest expense in the Company’s statements of operations. At March 31, 2010 and December 31, 2009, unrealized losses on changes in fair value of the designated interest rate swap agreements totaling $43.1 million and $54.1 million after taxes, respectively, were reflected in accumulated OCI. As of March 31, 2010, the Company estimates that $27.7 million of unrealized losses included in accumulated OCI will be realized and reported in earnings within the next twelve months.
Prior to the Second Amendment in October 2009, these interest rate swap agreements had been highly effective as a hedge of the Company’s variable rate debt. However, the implementation of the 2.25% LIBOR floor for the credit facility pursuant to the Second Amendment effective October 13, 2009, as discussed in Note 6, impacted the ongoing accounting treatment for the Company’s remaining interest rate swaps under Topic 815, “Derivatives and Hedging”. The interest rate swaps no longer qualify as highly effective in offsetting changes in the interest payments on long-term variable rate debt. Consequently, the Company removed the hedging designation and ceased cash flow hedge accounting treatment under Topic 815 for the swaps effective October 1, 2009. As a result, following this date, all of the ongoing changes in fair value of the interest rate swaps are recorded as derivative interest expense in earnings whereas the majority of changes
F-13
Table of Contents
Swift Corporation and Subsidiaries
Notes to consolidated financial statements — (Continued)
in fair value had previously been recorded in OCI under cash flow hedge accounting. The cumulative change in fair value of the swaps which occurred prior to the cessation in hedge accounting remains in accumulated OCI and is amortized to earnings as derivative interest expense in current and future periods as the interest payments on the first lien term loan affect earnings. The Company is evaluating various alternatives for potentially terminating some or all of the remaining interest rate swap contracts as they are no longer expected to provide an economic hedge in the near term.
The fair value of the interest rate swap liability at March 31, 2010 and December 31, 2009 was $79.4 million and $80.3 million, respectively. The fair values of the interest rate swaps are based on valuations provided by third parties, derivative pricing models, and credit spreads derived from the trading levels of the Company’s first lien term loan. Refer to Note 10 for further discussion of the Company’s fair value methodology.
As of March 31, 2010 and December 31, 2009, information about classification of fair value of the Company’s interest rate derivative contracts, including those that are designated as hedging instruments under Topic 815, and those that are not so designated, is as follows (in thousands):
| Fair Value | ||||||||||
| March 31, | December 31, | |||||||||
Derivative Liabilities Description | Balance Sheet Location | 2010 | 2009 | |||||||
| Interest rate derivative contracts designated as hedging instruments under Topic 815: | Fair value of interest rate swaps | $ | — | $ | — | |||||
| Interest rate derivative contracts not designated as hedging instruments under Topic 815: | Fair value of interest rate swaps | $ | 79,403 | $ | 80,279 | |||||
| Total derivatives | $ | 79,403 | $ | 80,279 | ||||||
For the three months ended March 31, 2010 and 2009, information about amounts and classification of gains and losses on the Company’s interest rate derivative contracts that were designated as hedging instruments under Topic 815 is as follows (in thousands):
| Three Months Ended March 31, | ||||||||
| 2010 | 2009 | |||||||
| Amount of loss recognized in OCI on derivative (effective portion) | $ | — | $ | (20,536 | ) | |||
| Amount of loss reclassified from accumulated OCI into Income as “Derivative interest expense” (effective portion) | $ | (10,962 | ) | $ | (9,356 | ) | ||
| Amount of gain recognized in income on derivative as “Derivative interest expense” (ineffective portion) | $ | — | $ | 1,807 | ||||
For the three months ended March 31, 2010 and 2009, information about amounts and classification of gains and losses on the Company’s interest rate derivative contracts that are not designated as hedging instruments under Topic 815 is as follows (in thousands):
| Three Months Ended March 31, | ||||||||
| 2010 | 2009 | |||||||
| Amount of gain (loss) recognized in income on derivative as “Derivative interest expense” | $ | (12,752 | ) | $ | — | |||
F-14
Table of Contents
Swift Corporation and Subsidiaries
Notes to consolidated financial statements — (Continued)
| Note 10. | Fair value measurement |
Topic 820, “Fair Value Measurements and Disclosures,”requires that the Company disclose estimated fair values for its financial instruments. The fair value of a financial instrument is the amount that would be received to sell an asset or paid to transfer a liability in an orderly transaction between market participants at the measurement date in the principal or most advantageous market for the asset or liability. Fair value estimates are made at a specific point in time and are based on relevant market information and information about the financial instrument. These estimates do not reflect any premium or discount that could result from offering for sale at one time the Company’s entire holdings of a particular financial instrument. Changes in assumptions could significantly affect these estimates. Because the fair value is estimated as of March 31, 2010 and December 31, 2009, the amounts that will actually be realized or paid at settlement or maturity of the instruments in the future could be significantly different. Further, as a result of current economic and credit market conditions, estimated fair values of financial instruments are subject to a greater degree of uncertainty and it is reasonably possible that an estimate will change in the near term.
The following table presents the carrying amounts and estimated fair values of the Company’s financial instruments at March 31, 2010 and December 31, 2009 (in thousands):
| March 31, 2010 | December 31, 2009 | |||||||||||||||
| Carrying | Fair | Carrying | Fair | |||||||||||||
| Value | Value | Value | Value | |||||||||||||
| Financial Assets: | ||||||||||||||||
| Retained interest in receivables | $ | N/A | $ | N/A | $ | 79,907 | $ | 79,907 | ||||||||
| Financial Liabilities: | ||||||||||||||||
| Interest rate swaps | $ | 79,403 | $ | 79,403 | $ | 80,279 | $ | 80,279 | ||||||||
| First lien term loan | 1,507,100 | 1,441,164 | 1,511,400 | 1,374,618 | ||||||||||||
| Senior fixed rate notes | 505,648 | 475,309 | 595,000 | 500,544 | ||||||||||||
| Senior floating rate notes | 203,600 | 184,513 | 203,600 | 152,955 | ||||||||||||
| Securitization of accounts receivable | 150,000 | 145,336 | N/A | N/A | ||||||||||||
The carrying amounts shown in the table are included in the consolidated balance sheets under the indicated captions except for the first lien term loan and the senior fixed and floating rate notes, which are included in long term debt and obligations under capital leases. The fair values of the financial instruments shown in the above table as of March 31, 2010 and December 31, 2009 represent management’s best estimates of the amounts that would be received to sell those assets or that would be paid to transfer those liabilities in an orderly transaction between market participants at that date. Those fair value measurements maximize the use of observable inputs. However, in situations where there is little, if any, market activity for the asset or liability at the measurement date, the fair value measurement reflects the Company’s own judgments about the assumptions that market participants would use in pricing the asset or liability. Those judgments are developed by the Company based on the best information available in the circumstances.
The following summary presents a description of the methods and assumptions used to estimate the fair value of each class of financial instrument.
Retained interest in receivables
The Company’s retained interest in receivables was carried on the balance sheet at fair value at December 31, 2009 and consisted of trade receivables recorded through the normal course of business. The retained interest was valued using the Company’s own assumptions about the inputs market participants would use in determining the present value of expected future cash flows taking into account anticipated credit losses, the speed of the payments and a discount rate commensurate with the uncertainty involved. Upon adoption of ASU No.2009-16 on January 1, 2010 as discussed in Note 7, the Company’s retained interest in
F-15
Table of Contents
Swift Corporation and Subsidiaries
Notes to consolidated financial statements — (Continued)
receivables was de-recognized upon recording the previously transferred receivables and recognizing the securitization proceeds as a secured borrowing on the Company’s balance sheet.
Interest rate swaps
The Company’s interest rate swap agreements are carried on the balance sheet at fair value at March 31, 2010 and December 31, 2009 and consist of four interest rate swaps as of March 31, 2010 and December 31, 2009. These swaps were entered into for the purpose of hedging the variability of interest expense and interest payments on our long-term variable rate debt. Because the Company’s interest rate swaps are not actively traded, they are valued using valuation models. Interest rate yield curves and credit spreads derived from trading levels of the Company’s first lien term loan are the significant inputs into these valuation models. These inputs are observable in active markets over the terms of the instruments the Company holds. The Company considers the effect of its own credit standing and that of its counterparties in the valuations of its derivative financial instruments. As of March 31, 2010 and December 31, 2009, the Company has recorded a credit valuation adjustment of $5.9 million and $6.5 million, respectively, based on the credit spreads derived from trading levels of the Company’s first lien term loan to reduce the interest rate swap liability to its fair value.
First lien term loan and second-priority senior secured fixed and floating rate notes
The fair values of the first lien term loan, the senior fixed rate notes, and the senior floating rate notes were determined by bid prices in trading between qualified institutional buyers.
Securitization of accounts receivable
The Company’s securitization of accounts receivable consists of borrowings outstanding pursuant to the Company’s 2008 RSA, as discussed in Note 7. Its fair value is estimated by discounting future cash flows using a discount rate commensurate with the uncertainty involved.
Fair value hierarchy
Topic 820 establishes a framework for measuring fair value in accordance with generally accepted accounting principles in the United States of America (“GAAP”) and expands financial statement disclosure requirements for fair value measurements. Topic 820 further specifies a hierarchy of valuation techniques, which is based on whether the inputs into the valuation technique are observable or unobservable. The hierarchy is as follows:
| • | Level 1 — Valuation techniques in which all significant inputs are quoted prices from active markets for assets or liabilities that are identical to the assets or liabilities being measured. | |
| • | Level 2 — Valuation techniques in which significant inputs include quoted prices from active markets for assets or liabilities that are similar to the assets or liabilities being measuredand/or quoted prices from markets that are not active for assets or liabilities that are identical or similar to the assets or liabilities being measured. Also, model-derived valuations in which all significant inputs and significant value drivers are observable in active markets are Level 2 valuation techniques. | |
| • | Level 3 — Valuation techniques in which one or more significant inputs or significant value drivers are unobservable. Unobservable inputs are valuation technique inputs that reflect the Company’s own assumptions about the assumptions that market participants would use in pricing an asset or liability. |
When available, the Company uses quoted market prices to determine the fair value of an asset or liability. If quoted market prices are not available, the Company will measure fair value using valuation techniques that use, when possible, current market-based or independently-sourced market parameters, such as
F-16
Table of Contents
Swift Corporation and Subsidiaries
Notes to consolidated financial statements — (Continued)
interest rates and currency rates. The level in the fair value hierarchy within which a fair measurement in its entirety falls is based on the lowest level input that is significant to the fair value measurement in its entirety. Following is a brief summary of the Company’s classification within the fair value hierarchy of each major category of assets and liabilities that it measures and reports on its balance sheet at fair value on a recurring basis as of March 31, 2010:
| • | Interest rate swaps. The Company’s interest rate swaps are not actively traded but are valued using valuation models and credit valuation adjustments, both of which use significant inputs that are observable in active markets over the terms of the instruments the Company holds, and accordingly, the Company classifies these valuation techniques as Level 2 in the hierarchy. |
For the periods ended March 31, 2010 and December 31, 2009, information about classification of fair value measurements of each class of the Company’s assets and liabilities that are measured at fair value on a recurring basis in periods subsequent to their initial recognition is as follows (in thousands):
| Fair Value Measurements at Reporting Date Using | ||||||||||||||||
| Total Fair Value | Quoted Prices in | Significant | ||||||||||||||
| and Carrying | Active Markets | Significant Other | Unobservable | |||||||||||||
| Value on Balance | for Identical Assets | Observable Inputs | Inputs | |||||||||||||
Description | Sheet | (Level 1) | (Level 2) | (Level 3) | ||||||||||||
As of March 31, 2010: | ||||||||||||||||
| Liabilities: | ||||||||||||||||
| Interest rate swaps | $ | 79,403 | $ | — | $ | 79,403 | $ | — | ||||||||
As of December 31, 2009: | ||||||||||||||||
| Assets: | ||||||||||||||||
| Retained interest in receivables | $ | 79,907 | $ | — | $ | — | $ | 79,907 | ||||||||
| Liabilities: | ||||||||||||||||
| Interest rate swaps | $ | 80,279 | $ | — | $ | 80,279 | $ | — | ||||||||
The following table sets forth a reconciliation of the changes in fair value during the three month periods ended March 31, 2010 and 2009 of the Company’s Level 3 retained interest in receivables that was measured at fair value on a recurring basis prior to the Company’s adoption of ASU2009-16 on January 1, 2010 as discussed in Note 7 (in thousands):
| Fair Value at | Sales, Collections | Transfers in | Fair Value | |||||||||||||||||
| Beginning of | and | Total Realized | and/or out of | at End of | ||||||||||||||||
| Period | Settlements, Net | Gains (Losses) | Level 3 | Period | ||||||||||||||||
| Three Months Ended March 31, 2010 | $ | 79,907 | $ | — | $ | — | $ | (79,907 | )(1) | $ | — | |||||||||
| Three Months Ended March 31, 2009 | $ | 80,401 | $ | 11,910 | $ | 562 | $ | — | $ | 92,873 | ||||||||||
| (1) | Upon adoption of ASU No.2009-16 on January 1, 2010 as discussed in Note 7, the Company’s retained interest in receivables was de-recognized upon recording the previously transferred receivables and recognizing the securitization proceeds as a secured borrowing on the Company’s balance sheet. Thus the removal of the retained interest balance is reflected here as a transfer out of Level 3. |
Realized gains and losses related to the retained interest were included in earnings in the 2009 period and reported in other expenses.
F-17
Table of Contents
Swift Corporation and Subsidiaries
Notes to consolidated financial statements — (Continued)
For the three month periods ended March 31, 2010 and 2009, information about inputs into the fair value measurements of the Company’s assets that were measured at fair value on a nonrecurring basis in the period is as follows (in thousands):
| Fair Value Measurements at Reporting Date Using | ||||||||||||||||||||
| Quoted Prices | Significant | |||||||||||||||||||
| in Active | Other | Significant | ||||||||||||||||||
| Markets for | Observable | Unobservable | ||||||||||||||||||
| Fair Value at | Identical Assets | Inputs | Inputs | Total Gains | ||||||||||||||||
Description | End of Period | (Level 1) | (Level 2) | (Level 3) | (Losses) | |||||||||||||||
| Three Months Ended March 31, 2010 | ||||||||||||||||||||
| Long-lived assets held for sale | $ | 2,277 | $ | — | $ | — | $ | 2,277 | $ | (1,274 | ) | |||||||||
| Total | $ | 2,277 | $ | — | $ | — | $ | 2,277 | $ | (1,274 | ) | |||||||||
| Three Months Ended March 31, 2009 | ||||||||||||||||||||
| Long-lived assets held and used | $ | 1,600 | $ | — | $ | — | $ | 1,600 | $ | (475 | ) | |||||||||
| Long-lived assets held for sale | 100 | — | — | 100 | (40 | ) | ||||||||||||||
| Total | $ | 1,700 | $ | — | $ | — | $ | 1,700 | $ | (515 | ) | |||||||||
In accordance with the provisions of Topic 360, “Property, Plant and Equipment”,trailers with a carrying amount of $3.6 million were written down to their fair value of $2.3 million during the first quarter of 2010, resulting in an impairment charge of $1.3 million, which was included in impairments in the consolidated statement of operations for the three months ended March 31, 2010. The impairment of these assets was identified due to the Company’s decision to remove them from the operating fleet through sale or salvage. For these assets valued using significant unobservable inputs, inputs utilized included the Company’s estimates and recent auction prices for similar equipment and commodity prices for units expected to be salvaged.
In accordance with the provisions of Topic 360, non-operating real estate properties held and used with a carrying amount of $2.1 million were written down to their fair value of $1.6 million during the first quarter of 2009, resulting in an impairment charge of $475 thousand, which was included in impairments in the consolidated statement of operations for the three months ended March 31, 2009. Additionally, real estate properties held for sale, with a carrying amount of $140 thousand were written down to their fair value of $100 thousand, resulting in an impairment charge of $40 thousand during the first quarter of 2009, which was also included in impairments in the consolidated statement of operations for the three months ended March 31, 2009. The impairments of these long-lived assets were identified due to the Company’s failure to receive any reasonable offers, due in part to reduced liquidity in the credit market and the weak economic environment during the period. For these long-lived assets valued using significant unobservable inputs, inputs utilized included the Company’s estimates and listing prices due to the lack of sales for similar properties.
| Note 11. | Stockholder loans receivable |
On May 10, 2007, the Company entered into a Stockholder Loan Agreement with its stockholders. Under the agreement, the Company loaned the stockholders $560 million to be used to satisfy their indebtedness owed to Morgan Stanley Senior Funding, Inc. (“Morgan Stanley”). The proceeds of the Morgan Stanley loan had been used to repay all indebtedness of the stockholders secured by the common stock of Swift Transportation Co. owned by the Moyes affiliates prior to the contribution by them of that common stock to Swift Corporation on May 9, 2007 in contemplation of the acquisition of Swift Transportation Co. by Swift Corporation on May 10, 2007. The principal and accrued interest is due on May 10, 2018. The balance of the loan at March 31, 2010, includingpaid-in-kind interest, is $240.0 million.
F-18
Table of Contents
Swift Corporation and Subsidiaries
Notes to consolidated financial statements — (Continued)
The stockholders are required to make interest payments on the stockholder loan in cash only to the extent that the stockholders receive a corresponding dividend from the Company. As of March 31, 2010 and December 31, 2009, this stockholder loan receivable is recorded as contra-equity within stockholders’ equity. Interest accrued under the stockholder loan receivable is recorded as an increase to additional paid-in capital with a corresponding increase to the stockholder loan receivable contra-equity balance. Any related dividends distributed to fund such interest payments are recorded as a reduction in retained earnings with a corresponding reduction in the stockholder loan receivable. For the three months ended March 31, 2010, interest accrued on the stockholder loan of $1.7��million was added to the loan balance aspaid-in-kind interest.
In connection with the Second Amendment and as discussed in Note 6, Mr. Moyes agreed to cancel $125.8 million of personally held senior notes in return for a $325.0 million reduction of the stockholder loan. The floating rate notes held by Mr. Moyes, totaling $36.4 million in principal amount, were cancelled at closing on October 13, 2009 and, correspondingly, the stockholder loan was reduced by $94.0 million. The fixed rate notes held by Mr. Moyes, totaling $89.4 million in principal amount, were cancelled in January 2010 and the stockholder loan was reduced further by an additional $231.0 million. The amount of the stockholder loan cancelled in exchange for the contribution of notes was negotiated by Mr. Moyes with the steering committee of lenders, comprised of a number of the largest lenders (by holding size) and the Administrative Agent of the Credit Agreement. Due to the classification of the stockholder loan as contra-equity, the reduction in the stockholder loan did not reduce the Company’s stockholders’ equity.
Pursuant to an amended and restated note agreement dated October 10, 2006, between IEL and an entity affiliated with the Moyes affiliates, IEL has a note receivable of $1.7 million at March 31, 2010 due from the affiliated party. The note is guaranteed by Jerry Moyes. The note accrues interest at 7.0% per annum with monthly installments of principal and accrued interest equal to $38 thousand through October 10, 2013 when the remaining balance is due. As of March 31, 2010 and December 31, 2009, because of the affiliated status of the payor, this note receivable is recorded as contra-equity within stockholders’ equity.
| Note 12. | Contingencies |
The Company is involved in certain claims and pending litigation primarily arising in the normal course of business. A significant number of these claims relate to workers’ compensation, auto collision and liability, and physical damage and cargo damage. We accrue for the portion of the Company’s uninsured estimated liability of these and other pending claims. Based on the knowledge of the facts and, in certain cases, opinions of outside counsel, management believes the resolution of claims and pending litigation, taking into account existing reserves, will not have a material adverse effect on the Company.
| Note 13. | Stock-based compensation |
On February 25, 2010, pursuant to the 2007 equity incentive plan (the “Plan”), the Company granted 1.8 million stock options to certain employees at an exercise price of $7.04 per share, which equaled the estimated fair value of the common stock on the date of grant.
| Note 14. | Change in estimate |
During the three months ended March 31, 2010, management undertook an evaluation of the Company’s revenue equipment and concluded that it would be more cost effective to scrap approximately 7,000 trailers rather than to maintain them in the operating fleet and is now in the process of scrapping them. These trailers do not qualify for assets held for sale treatment and are thus considered long lived assets held and used at March 31, 2010. As a result, management revised its previous estimates regarding remaining useful lives and estimated residual values for these trailers, resulting in incremental depreciation expense during the three months ended March 31, 2010 of $7.4 million. These trailers are in addition to the approximately 2,500 trailers reclassified to assets held for sale, as discussed in Note 5.
F-19
Table of Contents
Swift Corporation and Subsidiaries
Notes to consolidated financial statements — (Continued)
| Note 15. | Loss per share |
The computation of basic and diluted loss per share is as follows:
| Three Months ending March 31, | ||||||||
| 2010 | 2009 | |||||||
| (In thousands, except | ||||||||
| per share amounts) | ||||||||
| Net loss | $ | (53,001 | ) | $ | (43,560 | ) | ||
| Weighted average shares: | ||||||||
| Common shares outstanding for basic and diluted loss per share | 75,146 | 75,146 | ||||||
| Basic and diluted loss per share | $ | (0.71 | ) | $ | (0.58 | ) | ||
Potential common shares issuable upon exercise of outstanding stock options are excluded from diluted shares outstanding as their effect is antidilutive. As of March 31, 2010 and 2009, there were 7,935,500 and 6,119,500 options outstanding, respectively.
F-20
Table of Contents
Report of Independent Registered Public Accounting Firm
The Board of Directors and Stockholders
Swift Corporation:
We have audited the accompanying consolidated balance sheets of Swift Corporation and subsidiaries (the Company) as of December 31, 2009 and 2008, and the related consolidated statements of operations, stockholders’ deficit, comprehensive loss, and cash flows for each of the years in the three-year period ended December 31, 2009. These consolidated financial statements are the responsibility of the Company’s management. Our responsibility is to express an opinion on these consolidated financial statements based on our audits.
We conducted our audits in accordance with the standards of the Public Company Accounting Oversight Board (United States). Those standards require that we plan and perform the audit to obtain reasonable assurance about whether the financial statements are free of material misstatement. An audit includes examining, on a test basis, evidence supporting the amounts and disclosures in the financial statements. An audit also includes assessing the accounting principles used and significant estimates made by management, as well as evaluating the overall financial statement presentation. We believe that our audits provide a reasonable basis for our opinion.
In our opinion, the consolidated financial statements referred to above present fairly, in all material respects, the financial position of Swift Corporation and subsidiaries as of December 31, 2009 and 2008, and the results of their operations and their cash flows for each of the years in the three-year period ended December 31, 2009 in conformity with U.S. generally accepted accounting principles.
As discussed in Note 1 to the consolidated financial statements, the Company has adopted the provisions of Statement of Financial Accounting Standards No. 157, Fair Value Measurements, included in FASB ASC Topic 820, Fair Value Measurements and Disclosures.
/s/ KPMG LLP
Phoenix, Arizona
March 25, 2010, except for note 28
which is as of July 21, 2010
March 25, 2010, except for note 28
which is as of July 21, 2010
F-21
Table of Contents
FINANCIAL STATEMENTS
Swift Corporation and Subsidiaries
| December 31, | ||||||||
| 2009 | 2008 | |||||||
| (In thousands, except share data) | ||||||||
ASSETS | ||||||||
| Current assets: | ||||||||
| Cash and cash equivalents | $ | 115,862 | $ | 57,916 | ||||
| Restricted cash | 24,869 | 18,439 | ||||||
| Accounts receivable, net | 21,914 | 32,991 | ||||||
| Retained interest in accounts receivable | 79,907 | 80,401 | ||||||
| Income tax refund receivable | 1,436 | 2,036 | ||||||
| Equipment sales receivable | 208 | 4,951 | ||||||
| Inventories and supplies | 10,193 | 10,167 | ||||||
| Assets held for sale | 3,571 | 3,920 | ||||||
| Prepaid taxes, licenses, insurance and other | 42,365 | 40,988 | ||||||
| Deferred income taxes | 49,023 | 24 | ||||||
| Other current assets | 4,523 | 4,224 | ||||||
| Total current assets | 353,871 | 256,057 | ||||||
| Property and equipment, at cost: | ||||||||
| Revenue and service equipment | 1,488,953 | 1,536,325 | ||||||
| Land | 142,126 | 144,753 | ||||||
| Facilities and improvements | 222,751 | 222,023 | ||||||
| Furniture and office equipment | 32,726 | 28,678 | ||||||
| Total property and equipment | 1,886,556 | 1,931,779 | ||||||
| Less: accumulated depreciation and amortization | 522,011 | 348,483 | ||||||
| Net property and equipment | 1,364,545 | 1,583,296 | ||||||
| Insurance claims receivable | 45,775 | 42,925 | ||||||
| Other assets | 107,211 | 100,565 | ||||||
| Intangible assets, net | 389,216 | 412,408 | ||||||
| Goodwill | 253,256 | 253,256 | ||||||
| Total assets | $ | 2,513,874 | $ | 2,648,507 | ||||
| LIABILITIES AND STOCKHOLDERS’ DEFICIT | ||||||||
| Current liabilities: | ||||||||
| Accounts payable | $ | 70,934 | $ | 118,850 | ||||
| Accrued liabilities | 110,662 | 94,250 | ||||||
| Current portion of claims accruals | 92,280 | 155,769 | ||||||
| Current portion of long-term debt and obligations under capital leases | 46,754 | 28,105 | ||||||
| Fair value of guarantees | 2,519 | 2,572 | ||||||
| Current portion of fair value of interest rate swaps | 47,244 | 27,064 | ||||||
| Total current liabilities | 370,393 | 426,610 | ||||||
| Long-term debt and obligations under capital leases | 2,420,180 | 2,466,350 | ||||||
| Claims accruals, less current portion | 166,718 | 157,296 | ||||||
| Fair value of interest rate swaps, less current portion | 33,035 | 17,323 | ||||||
| Deferred income taxes | 383,795 | 24,567 | ||||||
| Other liabilities | 5,534 | 554 | ||||||
| Total liabilities | 3,379,655 | 3,092,700 | ||||||
| Commitments and contingencies (notes 15 and 16) | ||||||||
| Stockholders’ deficit: | ||||||||
| Preferred stock, par value $.001 per share Authorized 1,000,000 shares; none issued | — | — | ||||||
| Common stock, par value $.001 per share Authorized 200,000,000 shares; 75,145,892 shares issued at December 31, 2009 and December 31, 2008 | 75 | 75 | ||||||
| Additional paid-in capital | 419,105 | 456,807 | ||||||
| Accumulated deficit | (759,936 | ) | (307,908 | ) | ||||
| Stockholder loans receivable | (471,113 | ) | (562,054 | ) | ||||
| Accumulated other comprehensive loss | (54,014 | ) | (31,215 | ) | ||||
| Noncontrolling interest | 102 | 102 | ||||||
| Total stockholders’ deficit | (865,781 | ) | (444,193 | ) | ||||
| Total liabilities and stockholders’ deficit | $ | 2,513,874 | $ | 2,648,507 | ||||
See accompanying notes to consolidated financial statements.
F-22
Table of Contents
Swift Corporation and Subsidiaries
| Years Ended December 31, | ||||||||||||
| 2009 | 2008 | 2007 | ||||||||||
| (In thousands, except per share data) | ||||||||||||
| Operating revenue | $ | 2,571,353 | $ | 3,399,810 | $ | 2,180,293 | ||||||
| Operating expenses: | ||||||||||||
| Salaries, wages and employee benefits | 728,784 | 892,691 | 611,811 | |||||||||
| Operating supplies and expenses | 209,945 | 271,951 | 187,873 | |||||||||
| Fuel | 385,513 | 768,693 | 474,825 | |||||||||
| Purchased transportation | 620,312 | 741,240 | 435,421 | |||||||||
| Rental expense | 79,833 | 76,900 | 51,703 | |||||||||
| Insurance and claims | 81,332 | 141,949 | 69,699 | |||||||||
| Depreciation and amortization | 253,531 | 275,832 | 187,043 | |||||||||
| Impairments | 515 | 24,529 | 256,305 | |||||||||
| Gain on disposal of property and equipment | (2,244 | ) | (6,466 | ) | (397 | ) | ||||||
| Communication and utilities | 24,595 | 29,644 | 18,625 | |||||||||
| Operating taxes and licenses | 57,236 | 67,911 | 42,076 | |||||||||
| Total operating expenses | 2,439,352 | 3,284,874 | 2,334,984 | |||||||||
| Operating income (loss) | 132,001 | 114,936 | (154,691 | ) | ||||||||
| Other (income) expenses: | ||||||||||||
| Interest expense | 200,512 | 222,177 | 171,115 | |||||||||
| Derivative interest expense | 55,634 | 18,699 | 13,233 | |||||||||
| Interest income | (1,814 | ) | (3,506 | ) | (6,602 | ) | ||||||
| Other | (13,336 | ) | 12,753 | (1,933 | ) | |||||||
| Total other (income) expenses, net | 240,996 | 250,123 | 175,813 | |||||||||
| Loss before income taxes | (108,995 | ) | (135,187 | ) | (330,504 | ) | ||||||
| Income tax expense (benefit) | 326,650 | 11,368 | (234,316 | ) | ||||||||
| Net loss | $ | (435,645 | ) | $ | (146,555 | ) | $ | (96,188 | ) | |||
| Basic and diluted loss per share | $ | (5.80 | ) | $ | (1.95 | ) | $ | (1.94 | ) | |||
| Pro forma C corporation data: | ||||||||||||
| Historical loss before income taxes | $ | (108,995 | ) | $ | (135,187 | ) | $ | (330,504 | ) | |||
| Pro forma provision (benefit) for income taxes (unaudited) | 5,693 | (26,573 | ) | (19,166 | ) | |||||||
| Pro forma net loss (unaudited) | $ | (114,688 | ) | $ | (108,614 | ) | $ | (311,338 | ) | |||
| Pro forma basic and diluted loss per share (unaudited) | $ | (1.53 | ) | $ | (1.45 | ) | $ | (6.29 | ) | |||
See accompanying notes to consolidated financial statements.
F-23
Table of Contents
Swift Corporation and Subsidiaries
| Years Ended December 31, | ||||||||||||
| 2009 | 2008 | 2007 | ||||||||||
| (In thousands) | ||||||||||||
| Net loss | $ | (435,645 | ) | $ | (146,555 | ) | $ | (96,188 | ) | |||
| Other comprehensive income (loss): | ||||||||||||
| Foreign currency translation adjustment | — | 149 | (68 | ) | ||||||||
| Change in fair value of interest rate swaps | (22,799 | ) | (744 | ) | (30,552 | ) | ||||||
| Comprehensive loss | $ | (458,444 | ) | $ | (147,150 | ) | $ | (126,808 | ) | |||
See accompanying notes to consolidated financial statements.
F-24
Table of Contents
Swift Corporation and Subsidiaries
| Accumulated | ||||||||||||||||||||||||||||||||
| Common Stock | Additional | Stockholder | Other | Total | ||||||||||||||||||||||||||||
| Par | Paid-in | Accumulated | Loans | Comprehensive | Noncontrolling | Stockholders’ | ||||||||||||||||||||||||||
| Shares | Value | Capital | Deficit | Receivable | Loss | Interest | Deficit | |||||||||||||||||||||||||
| (in thousands, except share data) | ||||||||||||||||||||||||||||||||
| Balances, December 31, 2006 | 1,000 | $ | — | $ | 328 | $ | — | $ | — | $ | — | $ | — | $ | 328 | |||||||||||||||||
| Acquisition transaction costs paid in cash by stockholders | 1,903 | 1,903 | ||||||||||||||||||||||||||||||
| Contribution of 100% of Interstate Equipment Leasing | 10,649,000 | 11 | 5,275 | (2,393 | ) | 2,893 | ||||||||||||||||||||||||||
| Distribution of non-revenue equipment to stockholders | (1,594 | ) | (1,594 | ) | ||||||||||||||||||||||||||||
| Contribution of 38.259% of Swift Transportation Co. | 64,495,892 | 64 | 385,550 | 385,614 | ||||||||||||||||||||||||||||
| Issuance of stockholder loan | (560,000 | ) | (560,000 | ) | ||||||||||||||||||||||||||||
| Interest accrued on stockholder loan and dividends distributed | 29,740 | (29,740 | ) | — | ||||||||||||||||||||||||||||
| Proceeds from repayment of related party note receivable | 50 | 50 | ||||||||||||||||||||||||||||||
| Foreign currency translation | (68 | ) | (68 | ) | ||||||||||||||||||||||||||||
| Change in fair value of interest rate swaps | (30,552 | ) | (30,552 | ) | ||||||||||||||||||||||||||||
| Other | 67 | 67 | ||||||||||||||||||||||||||||||
| Net loss | (96,188 | ) | (96,188 | ) | ||||||||||||||||||||||||||||
| Balances, December 31, 2007 | 75,145,892 | 75 | 422,863 | (127,522 | ) | (562,343 | ) | (30,620 | ) | — | (297,547 | ) | ||||||||||||||||||||
| Interest accrued on stockholder loan and dividends distributed | 33,831 | (33,831 | ) | — | ||||||||||||||||||||||||||||
| Interest accrued and proceeds from repayment of related party note receivable | 153 | 289 | 442 | |||||||||||||||||||||||||||||
| Foreign currency translation | 149 | 149 | ||||||||||||||||||||||||||||||
| Change in fair value of interest rate swaps | (744 | ) | (744 | ) | ||||||||||||||||||||||||||||
| Entry into joint venture | 102 | 102 | ||||||||||||||||||||||||||||||
| Other | (40 | ) | �� | (40 | ) | |||||||||||||||||||||||||||
| Net loss | (146,555 | ) | (146,555 | ) | ||||||||||||||||||||||||||||
| Balances, December 31, 2008 | 75,145,892 | 75 | 456,807 | (307,908 | ) | (562,054 | ) | (31,215 | ) | 102 | (444,193 | ) | ||||||||||||||||||||
| Interest accrued on stockholder loan and dividends distributed | 19,768 | (16,383 | ) | (3,385 | ) | — | ||||||||||||||||||||||||||
| Interest accrued and proceeds from repayment of related party note receivable | 130 | 326 | 456 | |||||||||||||||||||||||||||||
| Change in fair value of interest rate swaps | (22,799 | ) | (22,799 | ) | ||||||||||||||||||||||||||||
| Reduction of stockholder loan (see Note 17) | (94,000 | ) | 94,000 | — | ||||||||||||||||||||||||||||
| Cancellation of floating rate notes (see Note 12) | 36,400 | 36,400 | ||||||||||||||||||||||||||||||
| Net loss | (435,645 | ) | (435,645 | ) | ||||||||||||||||||||||||||||
| Balances, December 31, 2009 | $ | 75,145,892 | $ | 75 | $ | 419,105 | $ | (759,936 | ) | $ | (471,113 | ) | $ | (54,014 | ) | $ | 102 | $ | (865,781 | ) | ||||||||||||
See accompanying notes to consolidated financial statements.
F-25
Table of Contents
Swift Corporation and Subsidiaries
Consolidated statements of cash flows
Consolidated statements of cash flows
| Years Ended December 31, | ||||||||||||
| 2009 | 2008 | 2007 | ||||||||||
| (In thousands) | ||||||||||||
| Cash flows from operating activities: | ||||||||||||
| Net loss | $ | (435,645 | ) | $ | (146,555 | ) | $ | (96,188 | ) | |||
| Adjustments to reconcile net loss to net cash provided by operating activities: | ||||||||||||
| Depreciation and amortization | 263,611 | 281,591 | 190,975 | |||||||||
| Gain on disposal of property and equipment less write-off of totaled tractors | (728 | ) | (2,956 | ) | (1,754 | ) | ||||||
| Impairment of goodwill, property and equipment and note receivable and write-off of investment | 515 | 24,776 | 256,305 | |||||||||
| (Gain) loss on securitization | (507 | ) | 1,137 | — | ||||||||
| Deferred income taxes | 310,269 | 2,919 | (233,559 | ) | ||||||||
| Provision for losses on accounts receivable | 4,477 | 1,065 | (1,350 | ) | ||||||||
Income effect ofmark-to-market adjustment of interest rate swaps | 7,933 | (5,487 | ) | 14,509 | ||||||||
| Increase (decrease) in cash resulting from changes in: | ||||||||||||
| Accounts receivable | 6,599 | (6,401 | ) | (24,277 | ) | |||||||
| Inventories and supplies | (26 | ) | 1,370 | (2,360 | ) | |||||||
| Prepaid expenses and other current assets | 5,429 | 22,920 | (2,176 | ) | ||||||||
| Other assets | 1,400 | (20,540 | ) | (35,883 | ) | |||||||
| Accounts payable, accrued and other liabilities | (47,992 | ) | (34,099 | ) | 64,404 | |||||||
| Net cash provided by operating activities | 115,335 | 119,740 | 128,646 | |||||||||
| Cash flows from investing activities: | ||||||||||||
| Acquisition of 61.741% of Swift Transportation Co., net of cash acquired (see Note 3) | — | — | (1,470,389 | ) | ||||||||
| (Increase) decrease in restricted cash | (6,430 | ) | 3,588 | (22,028 | ) | |||||||
| Proceeds from sale of property and equipment | 69,773 | 191,151 | 39,808 | |||||||||
| Capital expenditures | (71,265 | ) | (327,725 | ) | (215,159 | ) | ||||||
| Payments received on notes receivable | 6,462 | 5,648 | 15,034 | |||||||||
| Cash and cash equivalents received from contribution of 38.3% of Swift Transportation Co. (see Note 2) | — | — | 31,312 | |||||||||
| Cash and cash equivalents received from contribution of Interstate Equipment Leasing, Inc. (see Note 2) | — | — | 2,539 | |||||||||
| Expenditures on assets held for sale | (9,060 | ) | (10,089 | ) | (3,481 | ) | ||||||
| Payments received on assets held for sale | 4,442 | 16,391 | 7,657 | |||||||||
| Payments received on equipment sale receivables | 4,951 | 2,519 | 2,393 | |||||||||
| Net cash used in investing activities | (1,127 | ) | (118,517 | ) | (1,612,314 | ) | ||||||
| Cash flows from financing activities: | ||||||||||||
| Repayment of long-term debt and capital leases | (30,820 | ) | (16,625 | ) | (202,366 | ) | ||||||
| Repayment of short-term notes payable | (6,204 | ) | — | — | ||||||||
| Proceeds from issuance of senior notes | — | — | 835,000 | |||||||||
| Issuance of stockholder loan receivable, net of repayments | — | — | (559,950 | ) | ||||||||
| Payments received on stockholder loan from affiliate | 456 | 442 | — | |||||||||
| Proceeds from long-term debt | — | 2,570 | 1,720,000 | |||||||||
| Payment of deferred loan costs | (19,694 | ) | (8,669 | ) | (57,010 | ) | ||||||
| Repayment of existing debt of Swift Transportation Co. and Interstate Equipment Leasing, Inc. | — | — | (376,200 | ) | ||||||||
| Borrowings of other long-term debt | — | — | 1,185 | |||||||||
| Proceeds from accounts receivable securitization | — | — | 200,000 | |||||||||
| Stockholder contributions | — | — | 1,903 | |||||||||
| Distributions to stockholders | (16,383 | ) | (33,831 | ) | (29,740 | ) | ||||||
F-26
Table of Contents
Swift corporation and subsidiaries
Consolidated statements of cash flows — (Continued)
| Years Ended December 31, | ||||||||||||
| 2009 | 2008 | 2007 | ||||||||||
| (In thousands) | ||||||||||||
| Interest payments received on stockholder loan receivable | 16,383 | 33,831 | 29,740 | |||||||||
| Net cash (used in) provided by financing activities | (56,262 | ) | (22,282 | ) | 1,562,562 | |||||||
| Effect of exchange rate changes on cash and cash equivalents | — | 149 | (68 | ) | ||||||||
| Net increase (decrease) in cash and cash equivalents | 57,946 | (20,910 | ) | 78,826 | ||||||||
| Cash and cash equivalents at beginning of period | 57,916 | 78,826 | — | |||||||||
| Cash and cash equivalents at end of period | $ | 115,862 | $ | 57,916 | $ | 78,826 | ||||||
| Supplemental disclosure of cash flow information: | ||||||||||||
| Cash paid (refunded) during the period for: | ||||||||||||
| Interest | $ | 216,248 | $ | 248,179 | $ | 131,560 | ||||||
| Income taxes | $ | 6,001 | $ | (11,593 | ) | $ | 4,406 | |||||
| Supplemental schedule of: | ||||||||||||
| Non-cash investing activities: | ||||||||||||
| Non-cash contribution of 38.3% of Swift Transportation Co. (see Note 2) | $ | — | $ | — | $ | 354,302 | ||||||
| Non-cash contribution of Interstate Equipment Leasing, Inc. (see Note 2) | $ | — | $ | — | $ | 2,005 | ||||||
| Equipment sales receivables | $ | 208 | $ | 2,515 | $ | 4,955 | ||||||
| Equipment purchase accrual | $ | 7,963 | $ | 37,844 | $ | 1,894 | ||||||
| Notes receivable from sale of assets | $ | 6,230 | $ | 8,396 | $ | 4,214 | ||||||
| Non-cash financing activities: | ||||||||||||
| Payment on note payable with non-cash assets | $ | — | $ | — | $ | 5,077 | ||||||
| Distribution of Interstate Equipment Leasing non-revenue equipment to stockholders | $ | — | $ | — | $ | 1,594 | ||||||
| Sale of accounts receivable securitization facility, net of retained interest in receivables | $ | — | $ | 200,000 | $ | — | ||||||
| Capital lease additions | $ | 36,819 | $ | 81,256 | $ | 75,078 | ||||||
| Insurance premium notes payable | $ | 6,205 | $ | — | $ | — | ||||||
| Deferred operating lease payment notes payable | $ | 2,877 | $ | — | $ | — | ||||||
| Cancellation of senior notes | $ | 36,400 | $ | — | $ | — | ||||||
| Reduction in stockholder loan | $ | 94,000 | $ | — | $ | — | ||||||
Paid-in-kind interest on stockholder loan | $ | 3,385 | $ | — | $ | — | ||||||
See accompanying notes to consolidated financial statements.
F-27
Table of Contents
Swift Corporation and Subsidiaries
| (1) | Summary of significant accounting policies |
Description of business
Swift Corporation is the holding company for Swift Transportation Co., LLC (a Delaware limited liability company formerly Swift Transportation Co., Inc., a Nevada corporation) and its subsidiaries (collectively, “Swift Transportation Co.”), a truckload carrier headquartered in Phoenix, Arizona, and Interstate Equipment Leasing, Inc. (“IEL”) (all the foregoing being, collectively, “Swift” or the “Company”). The Company operates predominantly in one industry, road transportation, throughout the continental United States and Mexico and thus has only one reportable segment. At the end of 2009, the Company operated a national terminal network and a fleet of approximately 16,000 tractors, 49,200 trailers, and 4,300 intermodal containers.
In the opinion of management, the accompanying financial statements prepared in accordance with generally accepted accounting principles in the United States of America (“GAAP”) include all adjustments necessary for the fair presentation of the periods presented. Management has evaluated the effect on the Company’s reported financial condition and results of operations of events subsequent to December 31, 2009 through the issuance of the financial statements on March 25, 2010, and has updated their evaluation of subsequent events through the filing date on July 21, 2010.
Basis of presentation
The accompanying consolidated financial statements include the accounts of Swift Corporation and its wholly owned subsidiaries. All significant intercompany balances and transactions have been eliminated in consolidation. When the Company does not have a controlling interest in an entity, but exerts significant influence over the entity, the Company applies the equity method of accounting.
The presentation of the GAAP consolidated statements of operations and cash flows for the years ended December 31, 2009, 2008, and 2007 for Swift Corporation include the results of Swift Transportation Co., LLC (formerly Swift Transportation Co., Inc.) following its acquisition on May 10, 2007 and Interstate Equipment Leasing, Inc. following the contribution of all of its shares to Swift Corporation on April 7, 2007.
Special purpose entities are accounted for using the criteria of Financial Accounting Standards Board (“FASB”) Accounting Standards Codification Topic (“Topic”) 860, “Transfers and Servicing.” This Statement provides consistent accounting standards for distinguishing transfers of financial assets that are sales from transfers that are secured borrowings.
Cash and cash equivalents
The Company considers all highly liquid debt instruments purchased with original maturities of three months or less to be cash equivalents.
Restricted cash
The Company’s wholly owned captive insurance company, Mohave Transportation Insurance Company (“Mohave”), maintains certain working trust accounts. The cash and cash equivalents within the trusts will be used to reimburse the insurance claim losses paid by the captive insurance company and therefore have been classified as restricted cash. As of December 31, 2009 and 2008, cash and cash equivalents held within the trust accounts was $24.9 million and $18.4 million, respectively.
Inventories and supplies
Inventories and supplies consist primarily of spare parts, tires, fuel and supplies and are stated at lower of cost or market. Cost is determined using thefirst-in, first-out (“FIFO”) method.
F-28
Table of Contents
Swift Corporation and Subsidiaries
Notes to consolidated financial statements — (Continued)
Property and equipment
Property and equipment are stated at cost. Costs to construct significant assets include capitalized interest incurred during the construction and development period. Expenditures for replacements and betterments are capitalized; maintenance and repair expenditures are charged to expense as incurred. Depreciation on property and equipment is calculated on the straight-line method over the estimated useful lives of 5 to 40 years for facilities and improvements, 3 to 15 years for revenue and service equipment and 3 to 5 years for furniture and office equipment. For the year ended December 31, 2009, net gains on the disposal of property and equipment were $2.2 million and interest capitalized related to self-constructed assets was $76 thousand.
Tires on revenue equipment purchased are capitalized as a component of the related equipment cost when the vehicle is placed in service and depreciated over the life of the vehicle. Replacement tires are classified as inventory and charged to expense when placed in service.
Goodwill
Goodwill represents the excess of the aggregate purchase price over the fair value of the net assets acquired in a purchase business combination. Goodwill is reviewed for impairment at least annually on November 30 in accordance with the provisions of Topic 350, “Intangibles — Goodwill and Other.” The goodwill impairment test is a two-step process. Under the first step, the fair value of the reporting unit is compared with its carrying value (including goodwill). If the fair value of the reporting unit is less than its carrying value, an indication of goodwill impairment exists for the reporting unit and the enterprise must perform step two of the impairment test (measurement). Under step two, an impairment loss is recognized for any excess of the carrying value amount of the reporting unit’s goodwill over the implied fair value of that goodwill. The implied fair value of goodwill is determined by allocating the fair value of the reporting unit in a manner similar to a purchase price allocation, in accordance with Topic 805, “Business Combinations.”The residual fair value after this allocation is the implied fair value of the reporting unit goodwill. The test of goodwill and indefinite-lived intangible assets requires judgment, including the identification of reporting units, assigning assets (including goodwill) and liabilities to reporting units and determining the fair value of each reporting unit. Fair value of the reporting unit is determined using a combination of comparative valuation multiples of publicly traded companies, internal transaction methods, and discounted cash flow models to estimate the fair value of reporting units, which included several significant assumptions, including estimating future cash flows, determining appropriate discount rates, and other assumptions the Company believed reasonable under the circumstances. Changes in these estimates and assumptions could materially affect the determination of fair valueand/or goodwill impairment for each reporting unit. If the fair value of the reporting unit exceeds its carrying value, step two does not need to be performed. Refer to Note 26 for a discussion of the results of our annual evaluations as of November 30, 2009, 2008 and 2007.
Claims accruals
The Company is self-insured for a portion of its auto liability, workers’ compensation, property damage, cargo damage, and employee medical expense risk. This self-insurance results from buying insurance coverage that applies in excess of a retained portion of risk for each respective line of coverage. The Company accrues for the cost of the uninsured portion of pending claims by evaluating the nature and severity of individual claims and by estimating future claims development based upon historical claims development trends. Actual settlement of the self-insured claim liabilities could differ from management’s estimates due to a number of uncertainties, including evaluation of severity, legal costs, and claims that have been incurred but not reported.
Fair value measurements
On January 1, 2008, the Company adopted the provisions of Topic 820, “Fair Value Measurements and Disclosures,” for fair value measurements of financial assets and financial liabilities and for fair value
F-29
Table of Contents
Swift Corporation and Subsidiaries
Notes to consolidated financial statements — (Continued)
measurements of nonfinancial items that are recognized or disclosed at fair value in the financial statements on a recurring basis. Topic 820 defines fair value as the price that would be received to sell an asset or paid to transfer a liability in an orderly transaction between market participants at the measurement date. Topic 820 also establishes a framework for measuring fair value and expands disclosures about fair value measurements (Note 24). Topic 820 was not effective until fiscal years beginning after November 15, 2008 for all nonfinancial assets and nonfinancial liabilities that are recognized or disclosed at fair value in the financial statements on a nonrecurring basis. In accordance with Topic 820, the Company has not applied the provisions of Topic 820 to the following assets and liabilities that have been recognized or disclosed at fair value on a nonrecurring basis for the year ended December 31, 2008:
| • | Measurement of long-lived assets held for sale upon recognition of an impairment charge during 2008. See Note 5. | |
| • | Measurement of the Company’s reporting units (Step 1 of goodwill impairment tests performed under Topic 350) and nonfinancial assets and nonfinancial liabilities measured at fair value to determine the amount of goodwill impairment (Step 2 of goodwill impairment tests performed under Topic 350). See Note 26. |
On January 1, 2009, the Company applied the provisions of Topic 820 to fair value measurements of nonfinancial assets and nonfinancial liabilities that are recognized or disclosed at fair value in the financial statements on a nonrecurring basis.
Revenue recognition
The Company recognizes operating revenues and related direct costs to recognizing revenue as of the date the freight is delivered, in accordance with Topic605-20-25-13,“Services forFreight-in-Transit at the End of a Reporting Period.”
The Company recognizes revenue from leasing tractors and related equipment to owner-operators as operating leases. Therefore, revenues from rental operations are recognized on the straight-line basis as earned under the operating lease agreements. Losses from lease defaults are recognized as an offset to revenue in the amount of earned, but not collected revenue.
Stock compensation plans
The Company adopted Topic 718,“Compensation — Stock Compensation,”using the modified prospective method. This Topic requires that all share-based payments to employees, including grants of employee stock options, be recognized in the financial statements upon a grant-date fair value of an award. See Note 19 for additional information relating to the Company’s stock compensation plan.
Income taxes
Prior to its acquisition of Swift Transportation Co. on May 10, 2007, Swift Corporation had elected to be taxed under the Internal Revenue Code as a subchapter S corporation. Under subchapter S, the Company did not pay corporate income taxes on its taxable income. Instead, its stockholders were liable for federal and state income taxes on the taxable income of the Company. Pursuant to the Company’s policy and subject to the terms of the credit facility, the Company had been allowed to make distributions to its stockholders in amounts equal to 39% of the Company’s taxable income. An income tax provision or benefit was recorded for certain subsidiaries not eligible to be treated as an S corporation. Additionally, the Company recorded a provision for state income taxes applicable to taxable income allocated to states that do not recognize the S corporation election.
F-30
Table of Contents
Swift Corporation and Subsidiaries
Notes to consolidated financial statements — (Continued)
Following the completion of the acquisition on May 10, 2007, the Company’s wholly owned subsidiary, Swift Transportation Co., elected to be treated as an S corporation, which resulted in an income tax benefit of approximately $230 million associated with the partial reversal of previously recognized net deferred tax liabilities.
As discussed in Note 20, in conjunction with Consent and Amendment No. 2 to Credit Agreement, dated October 7, 2009 (the “Second Amendment”), the Company revoked its election to be taxed as a subchapter S corporation and, beginning October 10, 2009, is being taxed as a subchapter C corporation. Under subchapter C, the Company is liable for federal and state corporate income taxes on its taxable income. As a result of this conversion, the Company recorded approximately $325 million of income tax expense on October 10, 2009, primarily in recognition of its deferred tax assets and liabilities as a subchapter C corporation.
Pro forma information (unaudited)
As discussed above, the Company was taxed under the Internal Revenue Code as a subchapter S corporation until its conversion to a subchapter C corporation effective October 10, 2009. Under subchapter S, the Company did not pay corporate income taxes on its taxable income. Instead, its stockholders were liable for federal and state income taxes on the taxable income of the Company. The Company has filed a registration statement in connection with a proposed initial public offering of its common stock (“IPO”). Assuming completion of the IPO, the Company will continue to report earnings (loss) and earnings (loss) per share as a subchapter C corporation. For comparative purposes, a pro forma income tax provision for corporate income taxes has been calculated as if the Company had been taxed as a subchapter C corporation for all periods presented when the Company’s subchapter S election was in effect, which is reflected on the accompanying consolidated statement of operations for the years ended December 31, 2009, 2008, and 2007.
Impairments
The Company evaluates its long-lived assets, including property and equipment, and certain intangible assets subject to amortization for impairment whenever events or changes in circumstances indicate that the carrying amount of an asset may not be recoverable in accordance with Topic 360,“Property, Plant and Equipment”and Topic 350, respectively. If circumstances required a long-lived asset be tested for possible impairment, the Company compares undiscounted cash flows expected to be generated by an asset to the carrying value of the asset. If the carrying value of the long-lived asset is not recoverable on an undiscounted cash flow basis, impairment is recognized to the extent that the carrying value exceeds its fair value. Fair value is determined through various valuation techniques including discounted cash flow models, quoted market values and third-party independent appraisals, as considered necessary.
Goodwill and indefinite-lived intangible assets are reviewed for impairment at least annually in accordance with the provisions of Topic 350.
Use of estimates
The preparation of the consolidated financial statements, in accordance with accounting principles generally accepted in the United States of America, requires management to make estimates and assumptions about future events that affect the amounts reported in the consolidated financial statements and accompanying notes. Significant items subject to such estimates and assumptions include the carrying amount of property and equipment, intangibles, and goodwill; valuation allowances for receivables, inventories, and deferred income tax assets; valuation of financial instruments; valuation of share-based compensation; estimates of claims accruals; and contingent obligations. Management evaluates its estimates and assumptions on an ongoing basis using historical experience and other factors, including but not limited to the current economic environment, which management believes to be reasonable under the circumstances. Management adjusts such estimates and
F-31
Table of Contents
Swift Corporation and Subsidiaries
Notes to consolidated financial statements — (Continued)
assumptions when facts and circumstances dictate. Illiquid credit markets, volatile energy markets, and declines in consumer spending have combined to increase the uncertainty inherent in such estimates and assumptions. As future events and their effects cannot be determined with precision, actual results could differ significantly from these estimates.
Recent accounting pronouncements
In December 2009, the FASB issued ASUNo. 2009-16,“Accounting for Transfers of Financial Assets (Topic 860).”This ASU amends Topic 860 and will require entities to provide more information about sales of securitized financial assets and similar transactions, particularly if the seller retains some risk to the assets and eliminates the concept of Qualified Special Purpose Entity and changes the criteria for the sale accounting treatment. This ASU is effective for the Company’s fiscal year beginning January 1, 2010. The Company anticipates that the adoption of ASUNo. 2009-16 will be material because it will result in the previously de-recognized accounts receivable under our current securitization program, as described in Note 10, being brought back onto the balance sheet, with the related securitization proceeds being recognized as debt.
In December 2009, the FASB issued ASUNo. 2009-17, “Improvements to Financial Reporting by Enterprises Involved with Variable Interest Entities (Topic 810).”This ASU amends Topic 810 by altering how a company determines when an entity that is insufficiently capitalized or not controlled through voting should be consolidated. This ASU is effective for the Company’s fiscal year beginning January 1, 2010. The Company does not anticipate that ASUNo. 2009-17 will have a material impact on its financial statements.
In January 2010, the FASB issued ASUNo. 2010-06,“Fair Value Measurements and Disclosures (Topic 820) — Improving Disclosures about Fair Value Measurements.”This ASU amends the Topic 820 to require entities to provide new disclosures and clarify existing disclosures relating to fair value measurements. New disclosures include requiring an entity to disclose separately the amounts of significant transfers in and out of Level 1 and 2 fair value measurements and to describe the reasons for the transfers, as well as to disclose separately gross purchases, sales, issuances and settlements in the roll forward activity of Level 3 measurements. Clarifications of existing disclosures include requiring a greater level of disaggregation of fair value measurements by class of assets and liabilities, in addition to enhanced disclosures concerning the inputs and valuation techniques used to determine Level 2 and Level 3 fair value measurements. ASUNo. 2010-06 is effective for the Company’s interim and annual periods beginning January 1, 2010, except for the additional disclosure of purchases, sales, issuances, and settlements in Level 3 fair value measurements, which is effective for the Company’s fiscal year beginning January 1, 2011. The Company does not expect the adoption of this statement to have a material impact on its consolidated financial statements.
| (2) | Contribution of Interstate Equipment Leasing, Inc. and Swift Transportation Co. |
On April 7, 2007, Jerry and Vickie Moyes (collectively “Moyes”) contributed their ownership of 1,000 shares of the common stock of IEL, which constitute all of the issued and outstanding shares of IEL, to Swift Corporation. Under the IEL “Contribution and Exchange Agreement,” Moyes received 10,649,000 shares of Swift Corporation’s common stock in the exchange.
Pursuant to the separate Swift Transportation Co. “Contribution and Exchange Agreement,” Jerry Moyes, The Jerry and Vickie Moyes Family Trust dated12/11/87 and various Moyes children’s trusts (collectively “Moyes affiliates”) contributed 28,792,810 shares of Swift Transportation Co. common stock, which represented 38.259% of the then outstanding common stock of Swift Transportation Co. to Swift Corporation on May 9, 2007. In exchange for the contributed Swift Transportation Co. common stock, the Moyes affiliates received a total of 64,495,892 shares of Swift Corporation’s common stock.
The assets and liabilities of IEL and the 38.259% of Swift Transportation Co. contributed to the Company were recorded at their historical cost basis.
F-32
Table of Contents
Swift Corporation and Subsidiaries
Notes to consolidated financial statements — (Continued)
| (3) | Acquisition of Swift Transportation Co. |
On May 10, 2007, through a wholly owned subsidiary formed for that purpose, Swift Corporation completed its acquisition of Swift Transportation Co. by a merger (the “Merger”) pursuant to the Agreement and Plan of Merger (the “Merger Agreement”), dated January 19, 2007, thereby acquiring the remaining 61.741% of the outstanding shares of Swift Transportation Co. common stock. Upon completion of the Merger, Swift Transportation Co. became a wholly owned subsidiary of Swift Corporation. In connection with the completion of the Merger, at the close of the market on May 10, 2007, the common stock of Swift Transportation Co. ceased trading on NASDAQ.
The fair value of assets acquired and liabilities assumed and the results of Swift Transportation Co.’s operations are included in Swift Corporation’s consolidated financial statements beginning May 11, 2007. Pursuant to the Merger Agreement, each share of Swift Transportation Co.’s common stock issued and outstanding immediately prior to the effective time of the Merger was canceled and converted into the right to receive $31.55 per share in cash, without interest. As a result, Swift Corporation paid $1.52 billion in cash to acquire the remaining interest of Swift Transportation Co.
The acquisition has been accounted for under the partial purchase method as required by Topic 805. The following is a summary of the $1.52 billion purchase price, which was funded through borrowing under a $1.72 billion senior credit facility, proceeds from the offering of $835 million of senior notes and available cash. See Note 12 for a summary of the use of proceeds from the credit facility and senior notes.
| (In thousands) | ||||
| Cash consideration of $31.55 per share for non-Moyes affiliates Swift Transportation Co. common stock outstanding | $ | 1,465,941 | ||
| Cash consideration to holders of stock incentive awards | 39,348 | |||
| Transaction and change in control costs | 15,192 | |||
| Total purchase price | $ | 1,520,481 | ||
The purchase price paid has been allocated to the assets acquired and liabilities assumed based upon the fair values as of the closing date of May 10, 2007. In valuing acquired assets and assumed liabilities, fair values were based on, but not limited to quoted market prices, where available; the intent of the Company with respect to whether the assets purchased are to be held, sold or abandoned; expected future cash flows; current replacement cost for similar capacity for certain fixed assets; market rate assumptions for contractual obligations; and appropriate discount rates and growth rates. The excess of the purchase price over the estimated fair value of the net assets acquired has been recorded as goodwill.
A summary of the final purchase price allocation follows (in thousands):
| Cash and cash equivalents | $ | 50,093 | ||
| Accounts receivable | 179,776 | |||
| Property and equipment | 950,927 | |||
| Other assets | 107,434 | |||
| Intangible assets | 442,263 | |||
| Goodwill | 486,758 | |||
| Deferred income taxes (current and long-term) | (194,544 | ) | ||
| Other liabilities | (502,226 | ) | ||
| $ | 1,520,481 | |||
F-33
Table of Contents
Swift Corporation and Subsidiaries
Notes to consolidated financial statements — (Continued)
See Note 26 for a discussion of the Company’s annual impairment assessment of goodwill and the resulting impairment charges taken in the fourth quarters of 2008 and 2007.
| (4) | Accounts receivable |
Accounts receivable as of December 31, 2009 and 2008 were (in thousands):
| 2009 | 2008 | |||||||
| Trade customers | $ | 9,338 | $ | 17,032 | ||||
| Equipment manufacturers | 6,167 | 6,604 | ||||||
| Other | 6,958 | 10,011 | ||||||
| 22,463 | 33,647 | |||||||
| Less allowance for doubtful accounts | 549 | 656 | ||||||
| Accounts receivable, net | $ | 21,914 | $ | 32,991 | ||||
The schedule of allowance for doubtful accounts for the years ended December 31, 2009, 2008 and 2007 was as follows (in thousands):
| 2009 | 2008 | 2007 | ||||||||||
| Beginning balance | $ | 656 | $ | 10,180 | $ | — | ||||||
| Contributed at May 9, 2007 | — | — | 5,554 | |||||||||
| Acquired at May 10, 2007 | — | — | 8,964 | |||||||||
| Provision (Reversal) | 4,477 | 1,065 | (1,350 | ) | ||||||||
| Recoveries | 11 | 39 | 202 | |||||||||
| Write-offs | (4,464 | ) | (223 | ) | (3,190 | ) | ||||||
| Retained interest adjustment | (131 | ) | (10,405 | ) | — | |||||||
| Ending balance | $ | 549 | $ | 656 | $ | 10,180 | ||||||
See Note 10 for a discussion of the Company’s accounts receivable securitization program and the related accounting treatment.
| (5) | Assets held for sale |
Assets held for sale as of December 31, 2009 and 2008 were (in thousands):
| 2009 | 2008 | |||||||
| Land and facilities | $ | 2,737 | $ | 448 | ||||
| Revenue equipment | 834 | 3,472 | ||||||
| Assets held for sale | $ | 3,571 | $ | 3,920 | ||||
As of December 31, 2009 and 2008, assets held for sale are stated at the lower of depreciated cost or fair value less estimated cost to sell. The Company expects to sell these assets within the next twelve months. During the year ended December 31, 2008, the Company identified and recorded an impairment of $5.4 million associated with real estate properties, tractors and trailers held for sale. The impairments were the result of the Company’s decisions to sell the respective assets and the prices offered by potential buyers, if any, which reflect the decline in the market values of the respective assets as well as the deteriorating economic and credit environment.
F-34
Table of Contents
Swift Corporation and Subsidiaries
Notes to consolidated financial statements — (Continued)
| (6) | Equity investment — Transplace |
In 2000, the Company contributed $10.0 million in cash to Transplace, Inc. (“Transplace”), a provider of transportation management services. The Company’s 29% interest in Transplace was accounted for using the equity method. In addition, during 2005 the Company loaned Transplace $6.3 million pursuant to a note receivable bearing interest at 6% per annum, due August 2011. As a result of accumulated equity losses and purchase accounting valuation adjustments, both the investment in Transplace and note receivable were $0 at December 31, 2008. The Company’s equity in the net assets of Transplace exceeded its investment account by approximately $20.5 million as of December 31, 2008. The Company sold its entire investment in Transplace in December 2009 and recorded a gain of $4.0 million before taxes in other income representing the recovery of the note receivable from Transplace which the Company had previously written off. During the years ended December 31, 2009, 2008 and 2007, the Company earned $34.5 million, $26.9 million and $7.1 million, respectively, in operating revenue from business brokered by Transplace. At December 31, 2009 and 2008, $4.3 million and $4.0 million, respectively, was owed to the Company for these services. The Company incurred no purchased transportation expense from Transplace for the years ended December 31, 2009, 2008 and 2007. The Company recorded equity losses of $0, $152 thousand and $111 thousand, respectively, in other expense during the years ended December 31, 2009, 2008 and 2007 for Transplace.
| (7) | Notes receivable |
Notes receivable are included in other current assets and other assets in the accompanying consolidated balance sheets and were comprised of the following as of December 31, 2009 and 2008 (in thousands):
| 2009 | 2008 | |||||||
| Notes receivable due from owner-operators, with interest rates at 15%, secured by revenue equipment. Terms range from several months to three years. | $ | 5,568 | $ | 5,800 | ||||
| Note receivable for the credit of development fees from the City of Lancaster, Texas payable May 2014. | 2,523 | 2,523 | ||||||
| Other | 102 | 102 | ||||||
| 8,193 | 8,425 | |||||||
| Less current portion | (4,523 | ) | (4,224 | ) | ||||
| Notes receivable, less current portion | $ | 3,670 | $ | 4,201 | ||||
| (8) | Accrued liabilities |
Accrued liabilities as of December 31, 2009 and 2008 were (in thousands):
| 2009 | 2008 | |||||||
| Employee compensation | $ | 25,262 | $ | 34,000 | ||||
| Accrued interest expense | 40,693 | 23,128 | ||||||
| Accrued owner-operator expenses | 5,587 | 5,568 | ||||||
| Owner-operator lease purchase reserve | 5,817 | 5,851 | ||||||
| Fuel, mileage and property taxes | 6,851 | 7,430 | ||||||
| Income taxes accrual | 16,742 | 6,119 | ||||||
| Other | 9,710 | 12,154 | ||||||
| Accrued liabilities | $ | 110,662 | $ | 94,250 | ||||
F-35
Table of Contents
Swift Corporation and Subsidiaries
Notes to consolidated financial statements — (Continued)
| (9) | Claims accruals |
Claims accruals represent accruals for the uninsured portion of pending claims at year end. The current portion reflects the amounts of claims expected to be paid in the following year. These accruals are estimated based on management’s evaluation of the nature and severity of individual claims and an estimate of future claims development based on the Company’s historical claims development experience. The Company’s insurance program for workers’ compensation, group medical liability, auto and collision liability, physical damage and cargo damage involves self-insurance with varying risk retention levels.
As of December 31, 2009 and 2008, claims accruals were (in thousands):
| 2009 | 2008 | |||||||
| Auto and collision liability | $ | 156,651 | $ | 202,934 | ||||
| Workers’ compensation liability | 76,522 | 85,026 | ||||||
| Owner-operator claims liability | 15,185 | 13,480 | ||||||
| Group medical liability | 9,896 | 10,743 | ||||||
| Cargo damage liability | 744 | 882 | ||||||
| 258,998 | 313,065 | |||||||
| Less: current portion of claims accrual | 92,280 | 155,769 | ||||||
| Claim accruals, less current portion | $ | 166,718 | $ | 157,296 | ||||
As of December 31, 2009 and 2008, the Company recorded current claims receivable of $25 thousand and $4.4 million, respectively, which is included in accounts receivable, and the Company recorded noncurrent claims receivable of $45.8 million and $42.9 million, respectively, which is reported as insurance claims receivable in the accompanying consolidated balance sheet, representing amounts due from insurance companies for coverage in excess of the Company’s self-insured liabilities. The Company has recorded a corresponding claim liability as of December 31, 2009 and 2008 of $42.9 million and $47.3 million, respectively, related to these same claims, which is included in amounts reported in the table above.
| (10) | Accounts receivable securitization |
On July 6, 2007, the Company, through Swift Receivables Corporation (“SRC”), a wholly owned bankruptcy-remote special purpose subsidiary, entered into a receivable sale agreement in order to sell, on a revolving basis, undivided interests in its accounts receivable to an unrelated financial entity (the “2007 RSA”). Under the 2007 RSA, the Company could receive up to $200 million of proceeds, subject to eligible receivables and reserve requirements, and paid a program fee as interest expense. The Company paid commercial paper interest rates on the proceeds received. On July 6, 2007, the Company received $200 million of proceeds under the 2007 RSA, which was used to pay down principal of the first lien term loan. The committed term of the 2007 RSA was through July 5, 2008. On March 27, 2008, the Company amended the 2007 RSA to meet the conditions for true sale accounting under Topic 860. Thereafter, such accounts receivable and the associated obligation were no longer reflected in the consolidated balance sheet and, correspondingly, were not included as debt in the leverage ratio calculation, and the program fees were included with other expenses on the consolidated statement of operations.
On July 30, 2008, the Company, through Swift Receivables Corporation II (“SRCII”), a wholly owned bankruptcy-remote special purpose subsidiary, entered into a new receivable sale agreement with unrelated financial entities (the “Purchasers”) to replace the Company’s 2007 RSA and to sell, on a revolving basis, undivided interests in the Company’s accounts receivable (the “2008 RSA”). The program limit under the 2008 RSA is $210 million and is subject to eligible receivables and reserve requirements. Outstanding balances under the 2008 RSA accrue program fees at a yield of LIBOR plus 300 basis points or Prime plus
F-36
Table of Contents
Swift Corporation and Subsidiaries
Notes to consolidated financial statements — (Continued)
200 basis points, at the Company’s discretion. The 2008 RSA terminates on July 30, 2013 and is subject to an unused commitment fee ranging from 25 to 50 basis points, depending on the aggregate unused commitment of the 2008 RSA. The Company paid $6.7 million in closing fees, which were expensed at the time of sale consistent with true sale accounting treatment and are recorded in other expense.
Pursuant to the 2008 RSA, collections under the receivables by the Company are held for the benefit of SRCII and the Purchasers of the undivided percentage interests in the receivables and are unavailable to satisfy claims of the Company and its subsidiaries. The 2008 RSA contains certain restrictions and provisions (including cross-default provisions to our debt agreements) which, if not met, could restrict the Company’s ability to sell future eligible receivables. The inability to sell additional receivables would reduce liquidity as the daily proceeds from collections on the receivables sold prior to termination are remitted to the Purchasers, with no further reinvestment of these funds by the Purchasers to purchase additional receivables from the Company.
The Company continues to hold an interest in the sold receivables. As of December 31, 2009 and 2008, the Company’s retained interest in receivables is carried at its fair value of $79.9 million and $80.4 million, respectively. Any gain or loss on the sale is determined based on the previous carrying value amounts of the transferred assets allocated at fair value between the receivables sold and the interests that continue to be held. Fair value is determined based on the present value of expected future cash flows taking into account the key assumptions of anticipated credit losses, the speed of payments, and the discount rate commensurate with the uncertainty involved. For the year ended December 31, 2009 and 2008, the Company incurred program fee expense of $5.0 million and $7.3 million, respectively, and recognized a gain of $0.5 million and a loss of $1.1 million, respectively, excluding the closing fees paid on the 2008 RSA, associated with the sale of trade receivables through the above-described programs, all of which was recorded in other expenses.
As of December 31, 2009, the amount of receivables sold through the accounts receivable securitization facility was $148.4 million. This amount excludes delinquencies, as defined in the 2008 RSA, which total $15.2 million at December 31, 2009, and the related allowance for doubtful accounts, both of which are included in the Company’s retained interest in receivables. During the year ended December 31, 2009, credit losses were $4.5 million, which were charged against the allowance for doubtful accounts included in the Company’s retained interest in receivables.
As discussed in Note 1, ASUNo. 2009-16 is effective for the Company on January 1, 2010. Following adoption of ASUNo. 2009-16, the Company’s accounts receivable securitization facility will no longer qualify for true sale accounting treatment but will instead be treated as a secured borrowing. As a result, the previously de-recognized accounts receivable will be brought back onto the Company’s balance sheet and the related securitization proceeds will be recognized as debt, while the program fees for the facility will be reported as interest expense beginning January 1, 2010. The re-characterization of program fees from other expense to interest expense will not affect our interest coverage ratio calculation, and the change in accounting treatment for the securitization proceeds from sales proceeds to debt will not affect the leverage ratio calculation, as defined in the Credit Agreement, as amended.
| (11) | Fair value of operating lease guarantees |
The Company guarantees certain residual values under its operating lease agreements for revenue equipment. At the termination of these operating leases, the Company would be responsible for the excess of the guarantee amount above the fair market value, if any. As of December 31, 2009 and 2008, the Company has recorded a liability for the estimated fair value of the guarantees, entered into subsequent to January 1, 2003, in the amount of $2.5 million and $2.6 million, respectively. The maximum potential amount of future payments the Company would be required to make under all of these guarantees as of December 31, 2009 is $18.7 million.
F-37
Table of Contents
Swift Corporation and Subsidiaries
Notes to consolidated financial statements — (Continued)
| (12) | Debt and financing transactions |
At December 31, 2009, the Company had approximately $2.31 billion in debt outstanding primarily associated with the Merger. The debt consists of proceeds from a first lien term loan pursuant to a credit facility with a group of lenders totaling $1.51 billion at December 31, 2009 and proceeds from the offering of senior notes, $798.6 million of which are outstanding at December 31, 2009. The use of the proceeds included the cash consideration paid for the purchase price of Swift Transportation Co. of $1.52 billion (refer to Note 3), repayment of approximately $376.5 million of indebtedness of Swift Transportation Co. and IEL, $560 million advanced pursuant to the stockholder loan receivable (refer to Note 17) and debt issuance costs of $56.8 million. The remaining proceeds were used by the Company for payment of transaction-related expenses. The credit facility and senior notes are secured by substantially all of the assets of the Company and are guaranteed by Swift Corporation, IEL, Swift Transportation Co. and its domestic subsidiaries other than its captive insurance subsidiaries and its bankruptcy-remote special purpose subsidiaries.
Credit facility
The credit facility consists of a first lien term loan with an original aggregate principal amount of $1.72 billion due May 2014, a $300 million revolving line of credit due May 2012 and a $150 million synthetic letter of credit facility due May 2014. Principal payments on the first lien term loan are due quarterly in amounts equal to (i) 0.25% of the original aggregate principal outstanding beginning September 30, 2007 to June 30, 2013 and (ii) 23.5% of the original aggregate principal outstanding from September 30, 2013 through its maturity. On July 6, 2007, the Company received $200 million of proceeds under the 2007 RSA, which was used to pay down the principal of the first lien term loan. In accordance with the terms of the Credit Agreement, the principal repayment was applied to the first eight quarterly payments and the remaining repayment was applied to the last principal payment due May 2014. Therefore, the first scheduled payment of 0.25% was due September 30, 2009. As of December 31, 2009, there is $1.51 billion outstanding under the first lien term loan.
As of December 31, 2009, there were no borrowings under the revolving line of credit. The unused portion of the revolving line of credit is subject to a commitment fee of 1.00%. The revolving line of credit also includes capacity for letters of credit up to $175 million. As of December 31, 2009, the Company had outstanding letters of credit under the revolving line of credit primarily for workers’ compensation and self-insurance liability purposes totaling $79.2 million, leaving $220.8 million available under the revolving line of credit.
The credit facility includes a $150 million synthetic letter of credit facility. Similar to the letters of credit under the revolving line of credit, the outstanding letters of credit pursuant to the synthetic facility are primarily for workers’ compensation and self-insurance liability purposes. At December 31, 2009, synthetic letters of credit totaling $147.8 million were issued and outstanding.
Interest on the first lien term loan and the outstanding borrowings under the revolving credit facility are based upon one of two rate options plus an applicable margin. The base rate is equal to the higher of the prime rate published in the Wall Street Journal and the Federal Funds Rate in effect plus 0.50% to 1%, or the LIBOR. The Company may select the interest rate option at the time of borrowing. As of December 31, 2009, the applicable margins for the interest rate options have been increased 275 basis points as a result of the Second Amendment as discussed below and now range from 4.50% to 6.00%, depending on the credit rating assigned by S&P and Moody’s. Interest on the first lien term loan and outstanding borrowing under the revolving line of credit is payable on the stated maturity of each loan, on the date of principal prepayment, if any, with respect to base rate loans, on the last day of each calendar quarter, and with respect to LIBOR rate loans, on the last day of each interest period. As of December 31, 2009, interest accrues at the greater of LIBOR or LIBOR floor implemented as part of the Second Amendment discussed below, plus 6.00% (8.25% at December 31, 2009).
F-38
Table of Contents
Swift Corporation and Subsidiaries
Notes to consolidated financial statements — (Continued)
On July 29, 2008, the Company entered into Amendment No. 1 to its credit facility (the “First Amendment”). The First Amendment made certain technical clarifications to the credit facility including, but not limited to, the definition of, and the application of, proceeds relating to Qualified Receivables Transactions (as defined in the credit agreement). In addition, the First Amendment provides: i) that any future increases under the Company’s accounts receivable securitization program in excess of $210 million will be included as a component of Total Debt (as defined in the credit agreement) for purposes of calculating the Leverage Ratio under the credit agreement; ii) that fees, expensesand/or yield incurred in connection with Qualified Receivables Transactions with respect to proceeds in excess of $210 million will be treated as Interest Expense under the credit agreement; and iii) for a $5 million increase to the permitted dispositions basket (from $25 million to $30 million). The Company paid $8.5 million in consent fees to consenting lenders in consideration for the First Amendment and $0.2 million in other fees, all of which was recorded as deferred loan costs to be amortized to interest expense over the remaining life of the credit facility.
On October 13, 2009, the Company entered into the Second Amendment, the material terms of which are summarized below, each effective October 13, 2009 unless otherwise noted:
a. Covenants and Liquidity: The maximum leverage ratio and minimum interest coverage ratio were amended, effective commencing with the quarter ended September 30, 2009, to be less restrictive in light of the current economic environment which the original covenant levels did not anticipate. The Second Amendment also included a partial waiver of the mandatory excess cash flow sweep for 2009 and 2010, permitting excess cash flow (as defined in the Credit Agreement) up to $75.0 million in 2009 and $40.0 million in 2010 to be retained by the Company. In addition, a minimum liquidity covenant was added, commencing with the quarter ended September 30, 2009, to require that the Company maintain a minimum cash and revolver availability (as defined) of not less than $65.0 million as of the last day of each fiscal quarter. Further, anti-hoarding provisions were added to prevent the Company from accessing the revolving line of credit if cash (as defined) exceeds $50.0 million, with certain exceptions. A revolving line of credit cash sweep provision was also added such that the Company will be required to repay outstanding balances on the revolving line of credit if the cash balance (as defined) at quarter end exceeds $50.0 million, with certain exceptions. Maximum capital expenditure levels were also adjusted downward. Additionally, certain definitions were clarified, added and adjusted in order to, among other things, adjust the manner of calculating the financial covenants and permit an increased level of asset dispositions. As a result of the Second Amendment, for the purposes of calculating the leverage ratio, any liability associated with revolving line of credit borrowings will be calculated using the quarter-end balance, instead of the average balance during the quarter.
b. Interest Costs: The applicable margin on the credit facility was increased by 275 basis points (resulting in interest rate options ranging from 4.50% to 6.00%), the unused commitment fee under the revolving line of credit was increased by 50 basis points (to 1.00%), a LIBOR floor was added to the credit facility such that the interest rate on LIBOR option loans will be no less than 2.25%, and a minimum alternate base rate option was added to the credit facility such that the interest rate on prime rate option loans will be no less than 3.25%.
c. Separation from Stockholders and Stockholder Loan Modifications: In order to reduce risk to the Company associated with its stockholders, certain definitions (including those used in certain default provisions) were modified to exclude the stockholders.
d. Other Amendments: In addition, various other administrative items and definitions were clarified, added and adjusted in order to, among other things, conform to the changes stated above, allow for future implementation of certain hedging strategies, modify the change in control definition to provide the stockholders additional flexibility to potentially raise equity capital in the future, and exclude Red Rock Risk Retention Group, Inc. (a captive insurance subsidiary of the Company) from being a subsidiary guarantor.
F-39
Table of Contents
Swift Corporation and Subsidiaries
Notes to consolidated financial statements — (Continued)
Senior notes
On May 10, 2007, the Company completed a private placement of second-priority senior notes associated with the acquisition of Swift Transportation Co. totaling $835 million, which consisted of: $240 million aggregate principal amount second-priority senior secured floating rate notes due May 15, 2015 (“senior floating rate notes”) and $595 million aggregate principal amount of 12.50% second-priority senior secured fixed rate notes due May 15, 2017 (“senior fixed rate notes” and, together with the senior floating rate notes, the “senior notes”).
Interest on the senior floating rate notes is payable on February 15, May 15, August 15, and November 15, beginning August 15, 2007, accruing at three-month LIBOR plus 7.75% (8.02% at December 31, 2009). Once the credit facility is paid in full, the Company may redeem any of the senior floating rate notes on any interest payment date on or after May 15, 2009 at an initial redemption price of 102%.
Interest on the 12.50% senior fixed rate notes is payable on May 15 and November 15, beginning November 15, 2007. Once the credit facility is paid in full, on or after May 15, 2012, the Company may redeem the fixed rate notes at an initial redemption price of 106.25% of their principal amount and accrued interest.
During the year ended December 31, 2009, Jerry Moyes, the Company’s Chief Executive Officer and majority stockholder purchased $36.4 million face value senior floating rate notes and $89.4 million face value senior fixed rate notes in open market transactions and received $7.2 million in interest payments with respect to these notes. As discussed below, these notes were forgiven by Mr. Moyes in connection with the Second Amendment.
An intercreditor agreement among the first lien agent for the senior secured credit facility, the trustee of the senior notes, Swift Corporation and certain of its subsidiaries establishes the second priority status of the senior notes and contains restrictions and agreements with respect to the control of remedies, release of collateral, amendments to security documents, and the rights of holders of first priority lien obligations and holders of the senior notes.
In connection with the Second Amendment discussed above, certain changes to the intercreditor agreement and the indentures governing the senior notes were required to facilitateand/or conform to the changes contained in the Second Amendment noted above, including that any future increases of the coupon applicable to the credit facility in excess of 0.50% will now require consent of the holders of the senior notes. Further, the indentures governing the senior notes were amended to increase the $175.0 million limit for capital lease obligations to $212.5 million for 2010 and to $250.0 million thereafter. To effect these changes, on October 13, 2009, the Company entered into an intercreditor agreement amendment, a fixed rate note supplemental indenture, and a floating rate note supplemental indenture (the “indenture amendments”).
The Company incurred $23.9 million of transaction costs related to the Second Amendment and indenture amendments, $19.7 million of which was capitalized as deferred loan costs and $4.2 million of which was expensed to operating supplies and expenses. The determination of the portions capitalized and expensed was based upon the nature of the payment, such as lender costs or third party advisor fees, and the accounting classification for the modification of each agreement under Topic470-50, “Debt — Modifications and Extinguishments.” As of December 31, 2009 and 2008 the balance of deferred loan costs was $65.1 million and $54.7 million, respectively, and is reported in other assets in the consolidated balance sheets.
In connection with the Second Amendment, Mr. Moyes agreed to cancel his personally held senior notes in return for a $325.0 million reduction of the stockholder loan due 2018 owed to the Company by the Moyes affiliates, each of which is a stockholder of the Company. The floating rate notes held by Mr. Moyes, totaling $36.4 million in principal amount, were cancelled at closing on October 13, 2009 and, correspondingly, the stockholder loan was reduced by $94.0 million. The fixed rate notes held by Mr. Moyes, totaling $89.4 million
F-40
Table of Contents
Swift Corporation and Subsidiaries
Notes to consolidated financial statements — (Continued)
in principal amount, were cancelled in January 2010 and the stockholder loan was reduced further by an additional $231.0 million. The amount of the stockholder loan cancelled in exchange for the contribution of notes was negotiated by Mr. Moyes with the steering committee of lenders, comprised of a number of the largest lenders (by holding size) and the Administrative Agent of the Credit Agreement. Various changes to the Credit Agreement were required to facilitate this transaction. The cancellation of the notes increased stockholders’ equity by $36.4 million in October 2009 and by $89.4 million in January 2010. Further, the note cancellation improves the Company’s leverage position and partially offsets the increase in interest on the credit facility discussed above. Due to the classification of the stockholder loan as contra-equity, the reduction in the stockholder loan did not reduce the Company’s stockholders’ equity.
During the third quarter of 2009, the Company began making preparations for an additional senior note offering in anticipation of paying down a portion of the outstanding principal under the first lien term loan. This note offering was cancelled prior to entering into the Second Amendment and indenture amendments discussed above. The Company incurred $2.3 million of legal and advisory costs related to this cancelled note offering, which was expensed to operating supplies and expenses during the third quarter of 2009.
Debt covenants
The credit facility contains certain covenants, including but not limited to required minimum liquidity, limitations on indebtedness, liens, asset sales, transactions with affiliates, and required leverage and interest coverage ratios, which ratios were amended by the Second Amendment effective commencing with the quarter ended September 30, 2009. As of December 31, 2009, the Company was in compliance with these covenants. The indentures governing the senior notes contain covenants relating to limitations on asset sales, incurrence of indebtedness and entering into sales and leaseback transactions. As of December 31, 2009, the Company was in compliance with these covenants. The indentures for the senior notes include a limit on future indebtedness, with specified exceptions, if a minimum fixed charge coverage ratio, as defined, is not met. The Company currently does not meet that minimum requirement and cannot incur additional debt in excess of that specified in the agreement, including the $175 million limit for outstanding capital lease obligations. As noted above, this limit for capital lease obligations increases to $212.5 million for 2010 and $250 million thereafter as a result of the indenture amendments.
As permitted by the terms of the Credit Agreement, as amended, securitization proceeds under the 2008 RSA up to $210 million are not included as debt in the leverage ratio calculation, without regard to whether on or off-balance sheet accounting treatment applies to the accounts receivable securitization program. Although the Company met the leverage ratio, interest coverage ratio and minimum liquidity requirements as of December 31, 2009 and is projecting to be in compliance in the future, the Company is subject to risks and uncertainties that the transportation industry will remain depressed and that the Company may not be successful in executing its business strategies. In the event current trucking industry conditions worsen or persist for an extended period of time, the Company has plans to implement certain actions that could assist in maintaining compliance with the debt covenants, including reducing capital expenditures, improving working capital, and reducing expenses in targeted areas of operations.
F-41
Table of Contents
Swift Corporation and Subsidiaries
Notes to consolidated financial statements — (Continued)
As of December 31, 2009 and 2008, long-term debt was (in thousands):
| 2009 | 2008 | |||||||
| First lien term loan due May 2014 | $ | 1,511,400 | $ | 1,520,000 | ||||
| Second-priority senior secured floating rate notes due May 15, 2015 | 203,600 | 240,000 | ||||||
| 12.50% second-priority senior secured fixed rate notes due May 15, 2017 | 595,000 | 595,000 | ||||||
| Note payable, with principal and interest payable in five annual payments of $514 plus interest at a fixed rate of 7.00% through August 2013 secured by real property | 2,056 | 2,570 | ||||||
| Note payable, with principal and interest payable in 24 monthly payments of $52 including interest at a fixed rate of 4.64% through August 2009 secured by information technology hardware and software | — | 457 | ||||||
| Notes payable, with principal and interest payable in 24 monthly payments of $130 including interest at a fixed rate of 7.5% through May 2011 | 1,993 | — | ||||||
| Total long-term debt | 2,314,049 | 2,358,027 | ||||||
| Less: current portion | 19,054 | 9,571 | ||||||
| Long-term debt, less current portion | $ | 2,294,995 | $ | 2,348,456 | ||||
The aggregate annual maturities of long-term debt as of December 31, 2009 were (in thousands):
| Years Ending December 31, | ||||
| 2010 | $ | 19,054 | ||
| 2011 | 18,359 | |||
| 2012 | 17,720 | |||
| 2013 | 417,616 | |||
| 2014 | 1,042,700 | |||
| Thereafter | 798,600 | |||
| Long-term debt | $ | 2,314,049 | ||
| (13) | Capital leases |
The Company leases certain revenue equipment under capital leases. The Company’s capital leases are typically structured with balloon payments at the end of the lease term equal to the residual value the Company is contracted to receive from certain equipment manufacturers upon sale or trade back to the manufacturers. The Company is obligated to pay the balloon payments at the end of the leased term whether or not it receives the proceeds of the contracted residual values from the respective manufacturers. Certain leases contain renewal or fixed price purchase options. The leases are collateralized by revenue equipment with a cost of $276.4 million and accumulated amortization of $53.6 million at December 31, 2009. The amortization of the revenue equipment under capital leases is included in depreciation and amortization expense.
F-42
Table of Contents
Swift Corporation and Subsidiaries
Notes to consolidated financial statements — (Continued)
The following is a schedule of the future minimum lease payments under capital leases together with the present value of the net minimum lease payments as of December 31, 2009 (in thousands):
| Years Ending December 31, | ||||
| 2010 | $ | 38,019 | ||
| 2011 | 53,180 | |||
| 2012 | 50,271 | |||
| 2013 | 27,781 | |||
| 2014 | 7,260 | |||
| Total minimum lease payments | 176,511 | |||
| Less: amount representing interest | 23,626 | |||
| Present value of minimum lease payments | 152,885 | |||
| Less: current portion | 27,700 | |||
| Capital lease obligations, long-term | $ | 125,185 | ||
| (14) | Derivative financial instruments |
The Company is exposed to certain risks relating to its ongoing business operations. The primary risk managed by using derivative instruments is interest rate risk. In 2007, the Company entered into several interest rate swap agreements for the purpose of hedging variability of interest expense and interest payments on long-term variable rate debt and senior notes. The strategy is to use pay-fixed/receive-variable interest rate swaps to reduce the Company’s aggregate exposure to interest rate risk. These derivative instruments are not entered into for speculative purposes.
In connection with the credit facility, the Company has four interest rate swap agreements in effect at December 31, 2009 with a total notional amount of $1.14 billion. These interest rate swaps have varying maturity dates through August 2012. At October 1, 2007 (“designation date”), the Company designated and qualified these interest rate swaps as cash flow hedges. Subsequent to the October 1, 2007 designation date, the effective portion of the changes in fair value of the designated swaps was recorded in accumulated OCI and is thereafter recognized to derivative interest expense as the interest on the variable debt affects earnings. The ineffective portions of the changes in the fair value of designated interest rate swaps were recognized directly to earnings as derivative interest expense in the Company’s statements of operations. At December 31, 2009 and 2008, unrealized losses on changes in fair value of the designated interest rate swap agreements totaling $54.1 million and $31.3 million after taxes, respectively, were reflected in accumulated OCI. As of December 31, 2009, the Company estimates that $33.9 million of unrealized losses included in accumulated OCI will be realized and reported in earnings within the next twelve months.
Prior to the Second Amendment in October 2009, these interest rate swap agreements had been highly effective as a hedge of the Company’s variable rate debt. However, the implementation of the 2.25% LIBOR floor for the credit facility pursuant to the Second Amendment effective October 13, 2009, as discussed in Note 12, impacted the ongoing accounting treatment for the Company’s remaining interest rate swaps under Topic 815. The interest rate swaps no longer qualify as highly effective in offsetting changes in the interest payments on long-term variable rate debt. Consequently, the Company removed the hedging designation and ceased cash flow hedge accounting treatment under Topic 815 for the swaps effective October 1, 2009. As a result, all of the ongoing changes in fair value of the interest rate swaps are recorded as derivative interest expense in earnings following this date whereas the majority of changes in fair value had been recorded in OCI under cash flow hedge accounting. The cumulative change in fair value of the swaps which occurred prior to the cessation in hedge accounting remains in accumulated OCI and is amortized to earnings as derivative interest expense in current and future periods as the interest payments on the first lien term loan affect earnings. The
F-43
Table of Contents
Swift Corporation and Subsidiaries
Notes to consolidated financial statements — (Continued)
Company is evaluating various alternatives for potentially terminating some or all of the remaining interest rate swap contracts as they are no longer expected to provide an economic hedge in the near term.
The Company also assumed three interest rate swap agreements in the acquisition of Swift Transportation Co., the last of which expired in March 2009. These instruments were not designated and did not qualify for cash flow hedge accounting. The changes in the fair value of these interest rate swap agreements were recognized in net earnings as derivative interest expense in the periods they occurred.
The fair value of the interest rate swap liability at December 31, 2009 and 2008 was $80.3 million and $44.4 million, respectively. The fair values of the interest rate swaps are based on valuations provided by third parties, derivative pricing models, and credit spreads derived from the trading levels of the Company’s first lien term loan and senior fixed rate notes as of December 31, 2009 and 2008, respectively. Refer to Note 24 for further discussion of the Company’s fair value methodology.
As of December 31, 2009, information about classification of fair value of the Company’s interest rate derivative contracts, including those that are designated as hedging instruments under Topic 815, “Derivatives and Hedging,”and those that are not so designated, is as follows (in thousands):
| Fair Value at | ||||||
Derivative Liabilities Description | Balance Sheet Classification | December 31, 2009 | ||||
| Interest rate derivative contracts designated as hedging instruments under Topic 815: | Fair value of interest rate swaps (current and non-current) | $ | — | |||
| Interest rate derivative contracts not designated as hedging instruments under Topic 815: | Fair value of interest rate swaps (current and non-current) | $ | 80,279 | |||
| Total derivatives | $ | 80,279 | ||||
For the year ended December 31, 2009, information about amounts and classification of gains and losses on the Company’s interest rate derivative contracts that were designated as hedging instruments under Topic 815 is as follows (in thousands):
| Year Ended | ||||
| December 31, 2009 | ||||
| Amount of loss recognized in OCI on derivatives (effective portion) | $ | (70,500 | ) | |
| Amount of loss reclassified from accumulated OCI into income as “Derivative interest expense” (effective portion) | $ | (47,701 | ) | |
| Amount of gain recognized in income on derivatives as “Derivative interest expense” (ineffective portion) | $ | 3,437 | ||
For the year ended December 31, 2009, information about amounts and classification of gains and losses on the Company’s interest rate derivative contracts that are not designated as hedging instruments under Topic 815 is as follows (in thousands):
| Year Ended | ||||
| December 31, 2009 | ||||
| Amount of loss recognized in income on derivatives as “Derivative interest expense” | $ | (11,370 | ) | |
F-44
Table of Contents
Swift Corporation and Subsidiaries
Notes to consolidated financial statements — (Continued)
| (15) | Commitments |
Operating leases (as lessee)
The Company leases various revenue equipment and terminal facilities under operating leases. At December 31, 2009, the future minimum lease payments under noncancelable operating leases were as follows (in thousands):
| Revenue | ||||||||||||
| Equipment | Facilities | Total | ||||||||||
| Years Ending December 31, | ||||||||||||
| 2010 | $ | 63,942 | $ | 782 | $ | 64,724 | ||||||
| 2011 | 40,007 | 405 | 40,412 | |||||||||
| 2012 | 20,626 | 225 | 20,851 | |||||||||
| 2013 | 5,419 | 83 | 5,502 | |||||||||
| 2014 | 924 | — | 924 | |||||||||
| Thereafter | 1,154 | — | 1,154 | |||||||||
| Total minimum lease payments | $ | 132,072 | $ | 1,495 | $ | 133,567 | ||||||
The revenue equipment leases generally include purchase options exercisable at the completion of the lease. For the years ended December 31, 2009, 2008 and 2007, total rental expense was $79.8 million, $76.9 million and $51.7 million, respectively.
Operating leases (as lessor)
The Company’s wholly owned subsidiary, IEL, leases revenue equipment to the Company’s owner-operators under operating leases. As of December 31, 2009, the annual future minimum lease payments receivable under operating leases were as follows (in thousands):
| Years Ending December 31, | ||||
| 2010 | $ | 61,995 | ||
| 2011 | 49,325 | |||
| 2012 | 32,379 | |||
| 2013 | 12,289 | |||
| 2014 | 981 | |||
| Total minimum lease payments | $ | 156,969 | ||
In the normal course of business, owner-operators default on their leases with the Company. The Company normally re-leases the equipment to other owner-operators, shortly thereafter. As a result, the future lease payments are reflective of payments from original leases as well as the subsequent re-leases.
Purchase commitments
The Company had commitments outstanding to acquire revenue equipment in 2010 for approximately $146.1 million as of December 31, 2009. The Company generally has the option to cancel tractor purchase orders with 90 days notice, although the notice period has lapsed for approximately one-third of the commitments outstanding at December 31, 2009. These purchases are expected to be financed by the combination of operating leases, capital leases, debt, proceeds from sales of existing equipment and cash flows from operations.
F-45
Table of Contents
Swift Corporation and Subsidiaries
Notes to consolidated financial statements — (Continued)
The Company has also entered into purchase agreements for a portion of its diesel fuel requirements for 2010 and has a commitment of $2.1 million remaining as of December 31, 2009.
In addition, the Company had remaining commitments of $1.0 million as of December 31, 2009 under contracts relating to acquisition, development and improvement of facilities.
| (16) | Contingencies |
The Company is involved in certain claims and pending litigation primarily arising in the normal course of business. Based on the knowledge of the facts and, in certain cases, advice of outside counsel, management believes the resolution of claims and pending litigation will not have a material adverse effect on the Company’s financial position.
| (17) | Stockholder loans receivable |
On May 10, 2007, the Company entered into a Stockholder Loan Agreement with its stockholders. Under the agreement, the Company loaned the stockholders $560 million to be used to satisfy their indebtedness owed to Morgan Stanley Senior Funding, Inc. (“Morgan Stanley”). The proceeds of the Morgan Stanley loan had been used to repay all indebtedness of the stockholders secured by the common stock of Swift Transportation Co. owned by the Moyes affiliates prior to the contribution by them of that common stock to Swift Corporation on May 9, 2007 (refer to Note 2). The principal and accrued interest is due on May 10, 2018. The balance of the loan at December 31, 2009 is $469.4 million.
The stockholders are required to make interest payments on the stockholder loan in cash only to the extent that the stockholders receive a corresponding dividend from the Company. As of December 31, 2009 and 2008, this stockholder loan receivable is recorded as contra-equity within stockholders’ equity. Interest accrued under the stockholder loan receivable is recorded as an increase to additional paid-in capital with a corresponding reduction in retained earnings for the related dividend. For the years ended December 31, 2009, 2008 and 2007, the total dividend paid to the stockholders and the corresponding interest payment received from the stockholders under the agreement was $16.4 million, $33.8 million and $29.7 million, respectively. Additionally, during the fourth quarter of 2009, interest of $3.4 million was accrued and added to the stockholder loan balance aspaid-in-kind interest as the stockholders did not elect to receive dividends to fund the interest payments following the Company’s change in tax status to a subchapter C corporation effective October 10, 2009 as discussed in Note 20.
In connection with the Second Amendment as discussed in Note 12, the Company and the Moyes affiliates entered into Consent and Amendment No. 1 to the Stockholder Loan Agreement (the “First Stockholder Loan Amendment”) effective October 13, 2009. Following this amendment, the stockholder loan accrues interest at 2.66%, the mid-term Applicable Federal Rate as published by the Internal Revenue Service on the amendment effective date, instead of the rate applicable to the Company’s first lien term loan as previously provided for under the initial loan terms. Further, the stockholders can elect to make each payment in cash orpayment-in-kind by being added to the principal balance of the loan. The stockholders may elect to continue receiving dividends from the Company to fund interest payments on the stockholder loan, but the entire amount distributed as dividends must be repaid to the Company as interest, with the stockholders responsible for any tax liability on such dividends as a result of the Company’s new subchapter C Corporation tax status, as noted above.
Also in connection with the Second Amendment and as discussed in Note 12, Mr. Moyes agreed to cancel $125.8 million of personally held senior notes in return for a $325.0 million reduction of the stockholder loan. The floating rate notes held by Mr. Moyes, totaling $36.4 million in principal amount, were cancelled at closing on October 13, 2009 and, correspondingly, the stockholder loan was reduced by $94.0 million. The fixed rate notes held by Mr. Moyes, totaling $89.4 million in principal amount, were
F-46
Table of Contents
Swift Corporation and Subsidiaries
Notes to consolidated financial statements — (Continued)
cancelled in January 2010 and the stockholder loan was reduced further by an additional $231.0 million. The amount of the stockholder loan cancelled in exchange for the contribution of notes was negotiated by Mr. Moyes with the steering committee of lenders, comprised of a number of the largest lenders (by holding size) and the Administrative Agent of the Credit Agreement. Due to the classification of the stockholder loan as contra-equity, the reduction in the stockholder loan will not reduce the Company’s stockholders’ equity.
Pursuant to an amended and restated note agreement dated October 10, 2006 between IEL and an entity affiliated with the Moyes affiliates, IEL has a note receivable of $1.7 million at December 31, 2009 due from the affiliated party. The note is guaranteed by Jerry Moyes. The note accrues interest at 7.0% per annum with monthly installments of principal and accrued interest equal to $38 thousand through October 10, 2013 when the remaining balance is due. As of December 31, 2009 and 2008, because of the affiliated status of the payor, this note receivable is recorded as contra-equity within stockholders’ equity.
| (18) | Stockholder distributions |
On May 7, 2007, the Board of Directors of the Company approved the distribution of certain IEL non-revenue equipment, consisting primarily of personal vehicles, to the stockholders of the Company. The net book value of the equipment distributed was approximately $1.6 million.
| (19) | Stock option plan |
On October 10, 2007, the Board of Directors and stockholders of the Company approved and adopted the Plan. On October 16, 2007, the Company granted 7.4 million stock options to employees at an exercise price of $12.50 per share, which exceeded the estimated fair value of the common stock on the date of grant. Additionally, on August 27, 2008, the Company granted 1.0 million stock options to employees and nonemployee directors at an exercise price of $13.43 per share, which equaled the estimated fair value of the common stock on the date of grant. On December 31, 2009, the Company granted 0.6 million stock options to employees at an exercise price of $6.89, which equaled the estimated fair value on the date of grant. The estimated fair value in each case was determined by a third party valuation analysis and considered a number of factors, including the Company’s discounted projected cash flows, comparative multiples of similar companies, the lack of liquidity of the Company’s common stock and certain risks the Company faced at the time of the valuation.
The options were granted to two categories of employees. The options granted to the first category of employees will vest upon the occurrence of the earliest of (i) a sale or a change in control of the Company or, (ii) a five-year vesting period at a rate of 331/3% following the third anniversary date of the grant. The options granted to the second category of employees will vest upon the later of (i) the occurrence of an initial public offering of the Company or (ii) a five-year vesting period at a rate of 331/3% following the third anniversary date of the grant. To the extent vested, both types of options will become exercisable simultaneous with the closing of the earlier of (i) an initial public offering, (ii) a sale, or (iii) a change in control of the Company. As of December 31, 2009, the Company is authorized to grant an additional 3.8 million options.
As a result of the lack of exercisability, the stock options outstanding are considered to be variable awards and the measurement date will only occur when the exercise of the options becomes probable. At December 31, 2009, the exercisability of the Company’s stock options had not yet been deemed probable and as a result no compensation expense has been recorded. Additionally, there was no unrecognized compensation expense resulting from the Company’s outstanding stock options as of December 31, 2009.
F-47
Table of Contents
Swift Corporation and Subsidiaries
Notes to consolidated financial statements — (Continued)
A summary of the Company’s stock option plan activity as of and for the years ended December 31, 2009, 2008 and 2007 is as follows:
| 2009 | 2008 | 2007 | ||||||||||||||||||||||
| Weighted | Weighted | Weighted | ||||||||||||||||||||||
| Average | Average | Average | ||||||||||||||||||||||
| Shares | Exercise Price | Shares | Exercise Price | Shares | Exercise Price | |||||||||||||||||||
| Outstanding at beginning of year | 6,292,500 | $ | 12.64 | 6,740,000 | $ | 12.50 | — | $ | ||||||||||||||||
| Granted | 564,500 | 6.89 | 981,000 | 13.43 | 7,359,000 | 12.50 | ||||||||||||||||||
| Exercised | — | — | — | |||||||||||||||||||||
| Forfeited | (644,000 | ) | 12.55 | (1,428,500 | ) | 12.50 | (619,000 | ) | 12.50 | |||||||||||||||
| Outstanding at end of year | 6,213,000 | $ | 12.13 | 6,292,500 | $ | 12.64 | 6,740,000 | $ | 12.50 | |||||||||||||||
The options outstanding at December 31, 2009 had a weighted average remaining contractual life of 8.1 years. As of December 31, 2009 and 2008, no options outstanding were exercisable.
The fair value of each option award is estimated on the date of grant using the Black-Scholes-Merton option-pricing model, which uses a number of assumptions to determine the fair value of the options on the date of grant. The weighted-average grant date fair value of options granted at or above market value during the years ended December 31, 2009, 2008 and 2007 was $3.39 per share, $6.21 per share and $3.28 per share, respectively.
The following weighted-average assumptions were used to determine the weighted-average grant date fair value of the stock options granted during the years ended December 31, 2009, 2008 and 2007:
| 2009 | 2008 | 2007 | ||||||||||
| Dividend yield | 0% | 0% | 0% | |||||||||
| Expected volatility | 45% | 41% | 46% | |||||||||
| Risk free interest rate | 3.39% | 3.34% | 4.47% | |||||||||
| Expected lives (in years) | 6.5 | 6.5 | 6.5 | |||||||||
The expected volatility of the options are based on the daily closing values of the similar market capitalized trucking group participants within theDow Jones Total U.S. Market Indexover the expected term of the options. As a result of the inability to predict the expected future employee exercise behavior, the Company estimated the expected lives of the options using the simplified method based on the contractual and vesting terms of the options. The risk-free interest rate is based upon the U.S. Treasury yield curve at the date of grant with maturity dates approximately equal to the expected life at the grant date.
The following table summarizes information about stock options outstanding at December 31, 2009:
| Shares | Contractual Years | Number Vested | ||||||||||
Exercise Price | Outstanding | Remaining | and Exercisable | |||||||||
| $12.50 | 4,708,500 | 7.8 | — | |||||||||
| $13.43 | 940,000 | 8.7 | — | |||||||||
| $6.89 | 564,500 | 10.0 | — | |||||||||
F-48
Table of Contents
Swift Corporation and Subsidiaries
Notes to consolidated financial statements — (Continued)
| (20) | Income taxes |
Income tax expense (benefit) was (in thousands):
| 2009 | 2008 | 2007 | ||||||||||
| Current expense (benefit): | ||||||||||||
| Federal | $ | 11,509 | $ | 5,790 | $ | 230 | ||||||
| State | 1,170 | 631 | 683 | |||||||||
| Foreign | 3,311 | 1,230 | (1,670 | ) | ||||||||
| 15,990 | 7,651 | (757 | ) | |||||||||
| Deferred expense (benefit): | ||||||||||||
| Federal | 292,113 | 1,035 | (220,211 | ) | ||||||||
| State | 19,137 | 2,904 | (12,195 | ) | ||||||||
| Foreign | (590 | ) | (222 | ) | (1,153 | ) | ||||||
| $ | 310,660 | $ | 3,717 | $ | (233,559 | ) | ||||||
| Income tax expense (benefit) | $ | 326,650 | $ | 11,368 | $ | (234,316 | ) | |||||
Until October 10, 2009, the Company had elected to be taxed under the Internal Revenue Code as a subchapter S Corporation. Under subchapter S provisions, the Company did not pay corporate income taxes on its taxable income. Instead, the stockholders were liable for federal and state income taxes on the taxable income of the Company. An income tax provision or benefit was recorded for certain of the Company’s subsidiaries, including its Mexico subsidiaries and its domestic captive insurance company, which are not eligible to be treated as a qualified subchapter S Corporation. Additionally, the Company recorded a provision for state income taxes applicable to taxable income attributed to states that do not recognize the S Corporation election.
The financial impacts of the amendments and related events completed during the fourth quarter of 2009, as discussed in Note 12, are expected to be considered a Significant Modification for tax purposes and hence trigger aDebt-for-Debt Deemed Exchange. To protect against possible splitting of the Cancellation of Debt (“COD”) income and Original Issue Discount (“OID”) deductions in the future between the S-Corp stockholders and the Company, the Company elected to revoke its previous election to be taxed under the Internal Revenue Code as a subchapter S Corporation and is now being taxed as a subchapter C Corporation beginning October 10, 2009. Under subchapter C, the Company is liable for federal and state corporate income taxes on its taxable income.
The Company’s effective tax rate was 298.9% in 2009, 8.5% in 2008 and was a benefit of 70.9%, in 2007. From January 1st through October 9, 2009, as well as during all of 2008 and 2007, actual tax expense differs from the “expected” tax expense (computed by applying the U.S. Federal corporate income tax rate for subchapter S Corporations of 0% to earnings before income taxes) as noted in the following table. Following the Company’s revocation of its subchapter S corporation election as noted above, from October 10, 2009 through December 31, 2009 actual tax expense differs from the “expected” tax expense (computed by applying
F-49
Table of Contents
Swift Corporation and Subsidiaries
Notes to consolidated financial statements — (Continued)
the U.S. Federal corporate income tax rate for subchapter C corporations of 35% to earnings before income taxes) as follows (in thousands):
| 2009 | 2008 | 2007 | ||||||||||
| Computed “expected” tax expense (benefit) | $ | (12,846 | ) | $ | — | $ | — | |||||
| Increase (decrease) in income taxes resulting from: | ||||||||||||
| State income taxes, net of federal income tax benefit | 1,659 | 3,535 | (465 | ) | ||||||||
| Conversion to an S Corporation for income tax purposes | — | — | (230,180 | ) | ||||||||
| Conversion to a C Corporation for income tax purposes | 324,829 | — | — | |||||||||
| Effect of tax rates different than statutory (Domestic) | 2,816 | 4,181 | 2,794 | |||||||||
| Effect of tax rates different than statutory (Foreign) | 1,418 | 326 | 289 | |||||||||
Effect of providing additionalBuilt-In-Gains deferred taxes | 684 | 1,411 | — | |||||||||
Effect of providing deferred taxes onmark-to-market adjustment of derivatives recorded in accumulated OCI | 6,294 | — | — | |||||||||
| Other | 1,796 | 1,915 | (6,754 | ) | ||||||||
| $ | 326,650 | $ | 11,368 | $ | (234,316 | ) | ||||||
The components of the net deferred tax asset (liability) as of December 31, 2009 and 2008 were (in thousands):
| 2009 | 2008 | |||||||
| Deferred tax assets: | ||||||||
| Claims accruals | $ | 67,249 | $ | 2,390 | ||||
| Allowance for doubtful accounts | 4,559 | 49 | ||||||
| Derivative financial instruments | 29,885 | 295 | ||||||
| Vacation accrual | 3,546 | 38 | ||||||
| Original issue discount | 69,312 | — | ||||||
| Equity investments | 554 | 5,543 | ||||||
| Net operating loss | 5,777 | 2,134 | ||||||
| Other | 5,680 | 983 | ||||||
| Total deferred tax assets | 186,562 | 11,432 | ||||||
| Valuation allowance | (2,043 | ) | (1,582 | ) | ||||
| Total deferred tax assets, net | 184,519 | 9,850 | ||||||
| Deferred tax liabilities: | ||||||||
| Property and equipment, principally due to differences in depreciation | (343,778 | ) | (30,467 | ) | ||||
| Prepaid taxes, licenses and permits deducted for tax purposes | (8,898 | ) | (98 | ) | ||||
| Cancellation of debt | (14,212 | ) | — | |||||
| Intangible assets | (139,749 | ) | (4,244 | ) | ||||
| Debt financing costs | (8,529 | ) | (2 | ) | ||||
| Other | (5,301 | ) | (381 | ) | ||||
| Total deferred tax liabilities | (520,467 | ) | (35,192 | ) | ||||
| Net deferred tax liability | $ | (335,948 | ) | $ | (25,342 | ) | ||
F-50
Table of Contents
Swift Corporation and Subsidiaries
Notes to consolidated financial statements — (Continued)
These amounts are presented in the accompanying consolidated balance sheets at December 31, 2009 and 2008 as follows (in thousands):
| 2009 | 2008 | |||||||
| Current deferred tax asset | $ | 49,023 | $ | 24 | ||||
| Current deferred tax liability | (1,176 | ) | (799 | ) | ||||
| Noncurrent deferred tax liability | (383,795 | ) | (24,567 | ) | ||||
| Net deferred tax liability | $ | (335,948 | ) | $ | (25,342 | ) | ||
As of December 31, 2009, the Company had a federal net operating loss carryforward of $2.0 million and a federal capital loss carryforward of $1.5 million. Additionally, the Company has state net operating loss carryforwards, with an estimated tax effect of $4.7 million, available at December 31, 2009. The state net operating losses will expire at various times between 2010 and 2028. The Company has established a valuation allowance of $2.0 million and $1.6 million as of December 31, 2009 and 2008, respectively, for the state loss carryforwards that are unlikely to be used prior to expiration. The net $0.5 million increase in the valuation allowance in 2009 is due to additional current year losses that are unlikely to be used prior to expiration.
U.S. income and foreign withholding taxes have not been provided on approximately $31 million of cumulative undistributed earnings of foreign subsidiaries. The earnings are considered to be permanently reinvested outside the U.S. As the Company intends to reinvest these earnings indefinitely outside the U.S., it is not required to provide U.S. income taxes on them until they are repatriated in the form of dividends or otherwise.
The reconciliation of our unrecognized tax benefits for the years ending December 31, 2009 and 2008 is as follows (in thousands):
| 2009 | 2008 | |||||||
| Unrecognized tax benefits at beginning of year | $ | 3,423 | $ | 4,154 | ||||
| Increases for tax positions taken prior to beginning of year | 610 | — | ||||||
| Decreases for tax positions taken prior to beginning of year | (257 | ) | — | |||||
| Increases for tax positions taken during the year | 154 | — | ||||||
| Settlements | (243 | ) | (532 | ) | ||||
| Lapse of statute of limitations | (156 | ) | (199 | ) | ||||
| Unrecognized tax benefits at end of year | $ | 3,531 | $ | 3,423 | ||||
Prior to the Company’s merger with Swift Transportation Co., the Company did not have any unrecognized tax benefits. As of December 31, 2009, we had unrecognized tax benefits totaling approximately $3.5 million, all of which would favorably impact our effective tax rate if subsequently recognized.
During the years ended December 31, 2009, 2008 and 2007, the Company concluded examinations with federal and various state jurisdictions for certain of its subsidiaries resulting in additional tax payments of approximately $0.5 million in each year. The Company concluded its federal examination of the 2003 to 2005 tax years during 2007 resulting in additional tax payments of $7.5 million. Certain of the Company’s subsidiaries are currently under examination by federal and various state jurisdictions for years ranging from 1997 to 2007. At the completion of these examinations, management does not expect any adjustments that would have a material impact on the Company’s effective tax rate. Years subsequent to 2007 remain subject to examination.
The Company recognizes potential accrued interest and penalties related to unrecognized tax benefits as a component of income tax expense. Accrued interest and penalties as of December 31, 2009 and 2008 were
F-51
Table of Contents
Swift Corporation and Subsidiaries
Notes to consolidated financial statements — (Continued)
approximately $1.2 million and $1.5 million, respectively. To the extent interest and penalties are not assessed with respect to uncertain tax positions, amounts accrued will be reduced and reflected as a reduction of the overall income tax provision.
The Company anticipates that the total amount of unrecognized tax benefits may decrease by approximately $1.9 million during the next twelve months, which will not have a material impact on the financial statements.
| (21) | Employee benefit plan |
The Company maintains a 401(k) benefit plan available to all employees who are 19 years of age or older and have completed six months of service. Under the plan, the Company has the option to match employee discretionary contributions up to 3% of an employee’s compensation. Employees’ rights to employer contributions vest after five years from their date of employment.
For the years ended December 31, 2008 and 2007, the Company’s expense totaled approximately $7.1 million and $2.6 million, respectively. For the year ended December 31, 2009, the Company decided not to match employee contributions and as such no expense was recognized.
| (22) | Key customer |
Services provided to the Company’s largest customer, Wal-Mart and its subsidiaries, generated 10.2%, 11.5% and 14.0% of operating revenue in 2009, 2008 and 2007, respectively. No other customer accounted for 10% or more of operating revenue in the reporting period.
| (23) | Related party transactions |
The Company provided and received freight services, facility leases, equipment leases and other services, including repair and employee services to several companies controlled byand/or affiliated with Jerry Moyes, as follows (in thousands):
| For the Year Ended December 31, 2009 | ||||||||||||||||
| Central | Central | Other | ||||||||||||||
| Freight Lines, | Refrigerated | Affiliated | ||||||||||||||
| Inc. | Services, Inc. | Entities | Total | |||||||||||||
| Services Provided by Swift: | ||||||||||||||||
| Freight Services(1) | $ | 3,943 | $ | 152 | $ | 328 | $ | 4,423 | ||||||||
| Facility Leases | $ | 661 | $ | — | $ | 20 | $ | 681 | ||||||||
| Other Services(2) | $ | — | $ | — | $ | 7 | $ | 7 | ||||||||
| Services Received by Swift: | ||||||||||||||||
| Freight Services(3) | $ | 117 | $ | 1,920 | $ | — | $ | 2,037 | ||||||||
| Facility Leases | $ | 423 | $ | 41 | $ | 41 | $ | 505 | ||||||||
| Other Services(4) | $ | 10 | $ | 22 | $ | 138 | $ | 170 | ||||||||
| As of December 31, 2009 | ||||||||||||||||
| Receivable | $ | 1,206 | $ | 7 | $ | 12 | $ | 1,225 | ||||||||
| Payable | $ | 4 | $ | 14 | $ | — | $ | 18 | ||||||||
F-52
Table of Contents
Swift Corporation and Subsidiaries
Notes to consolidated financial statements — (Continued)
| For the Year Ended December 31, 2008 | ||||||||||||||||
| Central | Central | Other | ||||||||||||||
| Freight Lines, | Refrigerated | Affiliated | ||||||||||||||
| Inc. | Services, Inc. | Entities | Total | |||||||||||||
| Services Provided by Swift: | ||||||||||||||||
| Freight Services(1) | $ | 18,766 | $ | 307 | $ | 481 | $ | 19,554 | ||||||||
| Facility Leases | $ | 761 | $ | — | $ | 20 | $ | 781 | ||||||||
| Other Services(2) | $ | — | $ | — | $ | 16 | $ | 16 | ||||||||
| Services Received by Swift: | ||||||||||||||||
| Freight Services(3) | $ | 80 | $ | 644 | $ | — | $ | 724 | ||||||||
| Facility Leases | $ | 479 | $ | — | $ | — | $ | 479 | ||||||||
| Other Services(4) | $ | 22 | $ | 14 | $ | 3 | $ | 39 | ||||||||
| As of December 31, 2008 | ||||||||||||||||
| Receivable | $ | 834 | $ | 14 | $ | 68 | $ | 916 | ||||||||
| Payable | $ | 13 | $ | 27 | $ | 1 | $ | 41 | ||||||||
| For the Year Ended December 31, 2007 | ||||||||||||||||
| Services Provided by Swift: | ||||||||||||||||
| Freight Services(1) | $ | 8,053 | $ | 674 | $ | 78 | $ | 8,805 | ||||||||
| Facility Leases | $ | 533 | $ | — | $ | 5 | $ | 538 | ||||||||
| Other Services(2) | $ | 34 | $ | 22 | $ | 34 | $ | 90 | ||||||||
| Equipment Leases(5) | $ | 218 | $ | 404 | $ | 13 | $ | 635 | ||||||||
| Services Received by Swift: | ||||||||||||||||
| Freight Services(3) | $ | 4 | $ | 18 | $ | — | $ | 22 | ||||||||
| Facility Leases | $ | 247 | $ | — | $ | — | $ | 247 | ||||||||
| Other Services(4) | $ | 11 | $ | 7 | $ | 6 | $ | 24 | ||||||||
| (1) | The rates the Company charges for freight services to each of these companies for transportation services are market rates, which are comparable to what it charges third-party customers. These transportation services provided to affiliated entities provide the Company with an additional source of operating revenue at its normal freight rates. | |
| (2) | Other services provided by the Company to the identified related parties included accounting related employee services provided by Company personnel. The daily rates the Company charged for employee related services reflect market salaries for employees performing similar work functions. In 2007, services provided to related parties also included repair and other truck stop services and employee services provided by Company personnel, including accounting related services, negotiations for parts procurement, and other services. | |
| (3) | Transportation services received from affiliated entities represents brokered freight. The loads are brokered out to the third party provider at rates lower than the rate charged to the customer, therefore allowing the Company to realize a profit. These brokered loads make it possible for the Company to provide freight services to customers even in areas that the Company does not serve, providing the Company with an additional source of income. | |
| (4) | Other services received by the Company from the identified related parties included: insurance claim liability; fuel tank usage; employee expense reimbursement, executive air transport; service truck purchase; freight services refund; and miscellaneous repair services. |
F-53
Table of Contents
Swift Corporation and Subsidiaries
Notes to consolidated financial statements — (Continued)
| (5) | All of the equipment lease transactions through the Company’s wholly owned subsidiary IEL and the identified affiliated companies were accounted for as a lease similar to the Company’s normal business operations and revenue was recognized on a straight-line basis. Specifically, the Company had the following equipment lease transactions: |
| a. | The Company leased 94 tractors financed by Daimler Chrysler to Central Freight Lines, Inc. (“Central Freight”) under a lease agreement dated April 15, 2006. The total amount of the lease was $5,329,987, payable in 50 monthly installments of $108,749. On May 4, 2007, the lease agreement was terminated and the related note payable was transferred to Central Freight to assume the remaining payments owed to Daimler Chrysler. However, according to the transfer contract, the Company remains liable for the note payable should Central Freight default on the agreement. There were no amounts owed to the Company at December 31, 2009 and 2008 related to this lease. | |
| b. | The Company had equipment lease agreements with Central Refrigerated Services, Inc. (“Central Refrigerated”) dated May 2002 and with Central Leasing dated February 2004. The leases were terminated on July 11, 2007. Upon termination, several tractors under the agreements were purchased by Central Refrigerated and Central Leasing, while the remaining tractors were returned to the Company. No amounts were due to the Company as of December 31, 2009 and 2008 for the equipment lease or equipment purchase. |
In addition to the transactions identified above, the Company had the following related party activity as of and for the years ended December 31, 2009, 2008 and 2007:
The Company has obtained legal services from Scudder Law Firm. Earl Scudder, a former member of the board of directors, is a member of Scudder Law Firm. The rates charged to the Company for legal services reflect market rates charged by unrelated law firms for comparable services. For the years ended December 31, 2009, 2008 and 2007, Swift incurred fees for legal services from Scudder Law Firm, a portion of which were provided by Mr. Scudder, in the amount of $786 thousand, $361 thousand and $1.2 million, respectively. As of December 31, 2009 and 2008, the Company had no outstanding balance owing to Scudder Law Firm for these services.
IEL contracts its personnel from a third party, Transpay, Inc. (“Transpay”), which is partially owned by Mr. Moyes. Transpay is responsible for all payroll related liabilities and employee benefits administration. For the years ended December 31, 2009, 2008 and 2007, the Company paid Transpay $1.0 million, $1.0 million and $2.0 million, respectively, for the employee services and administration fees. As of December 31, 2009 and 2008, the Company had no outstanding balance owing to Transpay for these services.
In the second quarter of 2009, the Company entered into a one-time agreement with Central Refrigerated to purchase one hundred2001-2002 Utility refrigerated trailers. Mr. Moyes is the principal stockholder of Central Refrigerated. The purchase price paid for the trailers was comparable to the market price of similar model year Utility trailers according the most recent auction value guide at the time of the sale. The total amount paid to Central Refrigerated for the equipment was $1.2 million. There was no further amount due to Central Refrigerated for this transaction as of December 31, 2009.
IEL had an equipment lease dated May 14, 2003 with Roosevelt Marina (“RM”), of which Jerry Moyes is the majority owner. The lease included monthly payments of $655 per month for sixty months. At the time the lease was terminated on October 22, 2007, the total due to IEL from RM was $23,000, which represented payments outstanding since January 2005. The remaining receivable balance on the lease was deemed uncollectible and was written off as of October 30, 2007.
IEL had a note agreement dated April 1, 2007 with Antelope Point Marina (“APM”), of which Jerry Moyes is the majority owner. The agreement was secured by an automobile and was paid in full on September 21,
F-54
Table of Contents
Swift Corporation and Subsidiaries
Notes to consolidated financial statements — (Continued)
2007. Total payments received by the Company from APM from April 7, 2007 through December 31, 2007 were $15,000. There was no remaining outstanding receivable balance as of December 31, 2007.
In September 2007, IEL paid 2005 taxes on behalf of Swift Aviation, an entity wholly owned by Mr. Moyes. The resulting $57,000 receivable due from Swift Aviation was paid in full on October 19, 2007. There was no further amount due to IEL for this transaction as of December 31, 2007.
| (24) | Fair value measurements |
Topic 820, “Fair Value Measurements and Disclosures,”requires that the Company disclose estimated fair values for its financial instruments. The fair value of a financial instrument is the amount that would be received to sell an asset or paid to transfer a liability in an orderly transaction between market participants at the measurement date in the principal or most advantageous market for the asset or liability. Fair value estimates are made at a specific point in time and are based on relevant market information and information about the financial instrument. These estimates do not reflect any premium or discount that could result from offering for sale at one time the Company’s entire holdings of a particular financial instrument. Changes in assumptions could significantly affect these estimates. Because the fair value is estimated as of December 31, 2009 and 2008, the amounts that will actually be realized or paid at settlement or maturity of the instruments in the future could be significantly different. Further, as a result of current economic and credit market conditions, estimated fair values of financial instruments are subject to a greater degree of uncertainty and it is reasonably possible that an estimate will change in the near term.
The following table presents the carrying amounts and estimated fair values of the Company’s financial instruments at December 31, 2009 and 2008 (in thousands):
| 2009 | 2008 | |||||||||||||||
| Carrying | Fair | Carrying | Fair | |||||||||||||
| Value | Value | Value | Value | |||||||||||||
| Financial Assets: | ||||||||||||||||
| Retained interest in receivables | $ | 79,907 | $ | 79,907 | $ | 80,401 | $ | 80,401 | ||||||||
| Financial Liabilities: | ||||||||||||||||
| Interest rate swaps | $ | 80,279 | $ | 80,279 | $ | 44,387 | $ | 44,387 | ||||||||
| First lien term loan | 1,511,400 | 1,374,618 | 1,520,000 | 534,858 | ||||||||||||
| Senior fixed rate notes | 595,000 | 500,544 | 595,000 | 52,063 | ||||||||||||
| Senior floating rate notes | 203,600 | 152,955 | 240,000 | 18,600 | ||||||||||||
The carrying amounts shown in the table are included in the consolidated balance sheets under the indicated captions except for the first lien term loan and the senior fixed and floating rate notes, which are included in long term debt and obligations under capital leases. The fair values of the financial instruments shown in the above table as of December 31, 2009 and 2008 represent management’s best estimates of the amounts that would be received to sell those assets or that would be paid to transfer those liabilities in an orderly transaction between market participants at that date. Those fair value measurements maximize the use of observable inputs. However, in situations where there is little, if any, market activity for the asset or liability at the measurement date, the fair value measurement reflects the Company’s own judgments about the assumptions that market participants would use in pricing the asset or liability. Those judgments are developed by the Company based on the best information available in the circumstances.
The following summary presents a description of the methods and assumptions used to estimate the fair value of each class of financial instrument.
F-55
Table of Contents
Swift Corporation and Subsidiaries
Notes to consolidated financial statements — (Continued)
Retained interest in receivables
The Company’s retained interest in receivables is carried on the balance sheet at fair value at December 31, 2009 and 2008 and consists of trade receivables recorded through the normal course of business. The retained interest is valued using the Company’s own assumptions about the inputs market participants would use, as discussed in Note 10.
Interest rate swaps
The Company’s interest rate swap agreements are carried on the balance sheet at fair value at December 31, 2009 and 2008 and consist of four interest rate swaps as of December 31, 2009 and six swaps as of December 31, 2008. These swaps were entered into for the purpose of hedging the variability of interest expense and interest payments on the Company’s long-term variable rate debt. Because the Company’s interest rate swaps are not actively traded, they are valued using valuation models. Interest rate yield curves and credit spreads derived from trading levels of the Company’s first lien term loan and senior fixed rate notes as of December 31, 2009 and 2008, respectively, are the significant inputs into these valuation models. These inputs are observable in active markets over the terms of the instruments the Company holds. The Company considers the effect of its own credit standing and that of its counterparties in the valuations of its derivative financial instruments. As of December 31, 2009 and 2008, the Company has recorded a credit valuation adjustment of $6.5 million and $69.6 million, respectively, based on the credit spreads derived from trading levels of the Company’s first lien term loan and senior fixed rate notes, respectively, to reduce the interest rate swap liability to its fair value. The change in the debt instrument used as a basis for the credit spreads occurred in the fourth quarter of 2009 as a result of the Second Amendment.
First lien term loan and second-priority senior secured fixed and floating rate notes
The fair values of the first lien term loan, the senior fixed rate notes, and the senior floating rate notes were determined by bid prices in trading between qualified institutional buyers.
Fair value hierarchy
Topic 820 establishes a framework for measuring fair value in accordance with GAAP and expands financial statement disclosure requirements for fair value measurements. Topic 820 further specifies a hierarchy of valuation techniques, which is based on whether the inputs into the valuation technique are observable or unobservable. The hierarchy is as follows:
| • | Level 1 — Valuation techniques in which all significant inputs are quoted prices from active markets for assets or liabilities that are identical to the assets or liabilities being measured. | |
| • | Level 2 — Valuation techniques in which significant inputs include quoted prices from active markets for assets or liabilities that are similar to the assets or liabilities being measuredand/or quoted prices from markets that are not active for assets or liabilities that are identical or similar to the assets or liabilities being measured. Also, model-derived valuations in which all significant inputs and significant value drivers are observable in active markets are Level 2 valuation techniques. | |
| • | Level 3 — Valuation techniques in which one or more significant inputs or significant value drivers are unobservable. Unobservable inputs are valuation technique inputs that reflect the Company’s own assumptions about the assumptions that market participants would use in pricing an asset or liability. |
When available, the Company uses quoted market prices to determine the fair value of an asset or liability. If quoted market prices are not available, the Company will measure fair value using valuation techniques that use, when possible, current market-based or independently-sourced market parameters, such as interest rates and currency rates. The level in the fair value hierarchy within which a fair measurement in its
F-56
Table of Contents
Swift Corporation and Subsidiaries
Notes to consolidated financial statements — (Continued)
entirety falls is based on the lowest level input that is significant to the fair value measurement in its entirety. Following is a brief summary of the Company’s classification within the fair value hierarchy of each major category of assets and liabilities that it measures and reports on its balance sheet at fair value on a recurring basis:
| • | Retained interest in receivables. The Company’s retained interest is valued using the Company’s own assumptions as discussed in Note 10, and accordingly, the Company classifies the valuation techniques that use these inputs as Level 3 in the hierarchy. | |
| • | Interest rate swaps. The Company’s interest rate swaps are not actively traded but are valued using valuation models and credit valuation adjustments, both of which use significant inputs that are observable in active markets over the terms of the instruments the Company holds, and accordingly, the Company classifies these valuation techniques as Level 2 in the hierarchy. |
As of December 31, 2009 and 2008, information about inputs into the fair value measurements of each major category of the Company’s assets and liabilities that are measured at fair value on a recurring basis in periods subsequent to their initial recognition is as follows (in thousands):
| Fair Value Measurements at Reporting Date Using | ||||||||||||||||
| Quoted | ||||||||||||||||
| Prices in | ||||||||||||||||
| Active | Significant | |||||||||||||||
| Total Fair | Markets for | Other | Significant | |||||||||||||
| Value and | Identical | Observable | Unobservable | |||||||||||||
| Carrying Value | Assets | Inputs | Inputs | |||||||||||||
Description | on Balance Sheet | (Level 1) | (Level 2) | (Level 3) | ||||||||||||
As of December 31, 2009: | ||||||||||||||||
| Assets: | ||||||||||||||||
| Retained interest in receivables | $ | 79,907 | $ | — | $ | — | $ | 79,907 | ||||||||
| Liabilities: | ||||||||||||||||
| Interest rate swaps | $ | 80,279 | $ | — | $ | 80,279 | $ | — | ||||||||
As of December 31, 2008: | ||||||||||||||||
| Assets: | ||||||||||||||||
| Retained interest in receivables | $ | 80,401 | $ | — | $ | — | $ | 80,401 | ||||||||
| Liabilities: | ||||||||||||||||
| Interest rate swaps | $ | 44,387 | $ | — | $ | 44,387 | $ | — | ||||||||
The following table sets forth a reconciliation of the changes in fair value during the years ended December 31, 2009 and 2008 of our Level 3 retained interest in accounts receivable that is measured at fair value on a recurring basis (in thousands):
| Fair Value at | Sales, Collections | Transfers in | ||||||||||||||||||
| Beginning of | and | Total Realized | and/or Out of | Fair Value at | ||||||||||||||||
| Period | Settlements, Net | Gains (Losses) | Level 3 | End of Period | ||||||||||||||||
Years Ended: | ||||||||||||||||||||
| December 31, 2009 | $ | 80,401 | $ | (1,001 | ) | $ | 507 | $ | — | $ | 79,907 | |||||||||
| December 31, 2008 | $ | — | $ | 81,538 | $ | (1,137 | ) | $ | — | $ | 80,401 | |||||||||
Realized losses related to the retained interest are included in earnings and are reported in other expenses.
F-57
Table of Contents
Swift Corporation and Subsidiaries
Notes to consolidated financial statements — (Continued)
For the year ended December 31, 2009, information about inputs into the fair value measurements of the Company’s assets that were measured at fair value on a nonrecurring basis in this period is as follows (in thousands):
| Fair Value Measurements Using | ||||||||||||||||||||
| Quoted Prices in | Significant | |||||||||||||||||||
| Year Ended | Active Markets | Significant Other | Unobservable | |||||||||||||||||
| December 31, | for Identical | Observable Inputs | Inputs | Total Gains | ||||||||||||||||
Description | 2009 | Assets (Level 1) | (Level 2) | (Level 3) | (Losses) | |||||||||||||||
| Long-lived assets held and used | $ | 1,600 | $ | — | $ | — | $ | 1,600 | $ | (475 | ) | |||||||||
| Long-lived assets held for sale | 100 | — | — | 100 | (40 | ) | ||||||||||||||
| Total | $ | 1,700 | $ | — | $ | — | $ | 1,700 | $ | (515 | ) | |||||||||
In accordance with the provisions of Topic 360, real estate properties held and used with a carrying amount of $2.1 million were written down to their fair value of $1.6 million during the first quarter of 2009, resulting in an impairment charge of $475 thousand, which was included in impairments in the consolidated statement of operations for the year ended December 31, 2009. Additionally, real estate properties held for sale, with a carrying amount of $140 thousand were written down to their fair value of $100 thousand, resulting in an impairment charge of $40 thousand during the first quarter of 2009, which was also included in impairments in the consolidated statement of operations for the year ended December 31, 2009. The impairments of these long-lived assets were identified due to the Company’s failure to receive any reasonable offers, due in part to reduced liquidity in the credit market and the weak economic environment during the period. For these long-lived assets valued using significant unobservable inputs, inputs utilized included the Company’s estimates and listing prices due to the lack of sales for similar properties.
| (25) | Intangible assets |
Intangible assets as of December 31, 2009 and 2008 were (in thousands):
| 2009 | 2008 | |||||||
| Customer Relationship: | ||||||||
| Gross carrying value | $ | 275,324 | $ | 275,324 | ||||
| Accumulated amortization | (67,553 | ) | (45,493 | ) | ||||
| Owner-Operator Relationship: | ||||||||
| Gross carrying value | 3,396 | 3,396 | ||||||
| Accumulated amortization | (2,988 | ) | (1,856 | ) | ||||
| Trade Name: | ||||||||
| Gross carrying value | 181,037 | 181,037 | ||||||
| Intangible assets, net | $ | 389,216 | $ | 412,408 | ||||
F-58
Table of Contents
Swift Corporation and Subsidiaries
Notes to consolidated financial statements — (Continued)
The changes in the gross carrying value of intangible assets in the year ended December 31, 2007 were as follows (in thousands):
| Customer | Owner-Operator | Trade | ||||||||||
| Relationship | Relationship | Name | ||||||||||
| Beginning balance | $ | — | $ | — | $ | — | ||||||
| Contributed on May 9, 2007 | 17,494 | — | — | |||||||||
| Acquired on May 10, 2007 | 257,830 | 3,396 | 181,037 | |||||||||
| Ending balance | $ | 275,324 | $ | 3,396 | $ | 181,037 | ||||||
Intangible assets acquired as a result of the Swift Transportation Co. acquisition include trade name, customer relationships, and owner-operator relationships. Amortization of the customer relationship acquired in the acquisition is calculated on the 150% declining balance method over the estimated useful life of 15 years. The customer relationship contributed to the Company at May 9, 2007 is amortized using the straight-line method over 15 years. The owner-operator relationship is amortized using the straight-line method over three years. The trade name has an indefinite useful life and is not amortized, but rather is tested for impairment at least annually, unless events occur or circumstances change between annual tests that would more likely than not reduce the fair value. Total amortization expense for the amortizable intangible assets was $23.2 million, $25.4 million and $17.6 million for the years ended December 31, 2009, 2008 and 2007, respectively. Estimated amortization expense for the next five years is: $20.5 million in 2010, $18.5 million in 2011, $18.4 million in 2012, $18.4 million in 2013 and $18.4 million in 2014.
| (26) | Goodwill |
The changes in the carrying amount of goodwill for the years ended December 31, 2009, 2008 and 2007 were (in thousands):
| Balance as of January 1, 2007 | $ | — | ||
| Contributed at May 9, 2007 | 21,498 | |||
| Acquired at May 10, 2007 | 486,758 | |||
| Impairment loss | (238,000 | ) | ||
| December 31, 2007 | 270,256 | |||
| Impairment loss | (17,000 | ) | ||
| December 31, 2008 and 2009 | $ | 253,256 | ||
Based on the results of our annual evaluation as of November 30, 2009, there was no indication of impairment of goodwill and indefinite-lived intangible assets. Based on the results of our evaluation as of November 30, 2008, we recorded a non-cash impairment charge of $17.0 million with no tax impact in the fourth quarter of 2008 related to the decline in fair value of our Mexico freight transportation reporting unit resulting from the deterioration in truckload industry conditions as compared with the estimates and assumptions used in our original valuation projections at the time of the partial acquisition of Swift Transportation Co. The annual impairment test performed as of November 30, 2008 indicated no additional impairments for goodwill and indefinite-lived intangible assets at our other reporting units. Additionally, based on the results of our evaluation as of November 30, 2007, we recorded a non-cash impairment charge of $238.0 million with no tax impact in the fourth quarter of 2007 related to the decline in fair value of our U.S. freight transportation reporting unit resulting from the deterioration in truckload industry conditions as compared with the estimates and assumptions used in our original valuation projections at the time of the partial acquisition of Swift Transportation Co., Inc. The annual impairment test performed as of November 30,
F-59
Table of Contents
Swift Corporation and Subsidiaries
Notes to consolidated financial statements — (Continued)
2007 indicated no additional impairments for goodwill and indefinite-lived intangible assets at our other reporting units.
| (27) | Subsequent events |
On January 4, 2010, Jerry Moyes cancelled the $89.4 million face value of the Company’s second priority senior secured fixed rate notes that he held in exchange for a $231.0 million reduction of the stockholder loan due 2018 owed to the Company by the Moyes affiliates, each of which is a stockholder of the Company (refer to Note 12).
Effective February 25, 2010, the Company granted 1.8 million stock options to certain employees at an exercise price of $7.04 per share, which equaled the estimated fair value of the common stock on the date of grant.
Effective February 1, 2010, the Company withdrew its application for qualified self insured status with the Federal Motor Carrier Safety Administration and obtained insurance through its wholly owned captive insurance subsidiaries, Red Rock Risk Retention Group, Inc. (“Red Rock”) and Mohave, which will insure a proportionate share of Swift’s motor vehicle liability risk. To comply with certain state insurance regulatory requirements, approximately $55 million in cash and cash equivalents will be paid to Red Rock and Mohave over the course of 2010 to be restricted as collateral for anticipated losses incurred in 2010. The restricted cash will be used to offset payments on these anticipated losses. It is expected that approximately half of the initial funding will remain as restricted cash as of December 31, 2010, such amount being in addition to amounts recorded as restricted cash at December 31, 2009.
| (28) | Loss per share |
The computation of basic and diluted loss per share is as follows:
| Year ending December 31, | ||||||||||||
| 2009 | 2008 | 2007 | ||||||||||
| (In thousands, except per share amounts) | ||||||||||||
| Net loss | $ | (435,645 | ) | $ | (146,555 | ) | $ | (96,188 | ) | |||
| Weighted average shares: | ||||||||||||
| Common shares outstanding for basic and diluted loss per share | 75,146 | 75,146 | 49,521 | |||||||||
| Basic and diluted loss per share | $ | (5.80 | ) | $ | (1.95 | ) | $ | (1.94 | ) | |||
Potential common shares issuable upon exercise of outstanding stock options are excluded from diluted shares outstanding as their effect is antidilutive. As of December 31, 2009, 2008, and 2007, there were 6,213,000, 6,292,500, and 6,740,000 options outstanding, respectively.
F-60
Table of Contents
Swift Corporation and Subsidiaries
Notes to consolidated financial statements — (Continued)
| (29) | Quarterly results of operations (unaudited) |
| First | Second | Third | Fourth | |||||||||||||
| Quarter | Quarter | Quarter | Quarter | |||||||||||||
| (In thousands, except per share data) | ||||||||||||||||
Year Ended December 31, 2009 | ||||||||||||||||
| Operating revenue | $ | 614,756 | $ | 628,572 | $ | 659,723 | $ | 668,302 | ||||||||
| Operating income | $ | 12,239 | $ | 27,109 | $ | 45,759 | $ | 46,894 | ||||||||
| Net loss | $ | (43,560 | ) | $ | (30,926 | ) | $ | (4,028 | ) | $ | (357,131 | ) | ||||
| Basic and diluted loss per share | $ | (0.58 | ) | $ | (0.41 | ) | $ | (0.05 | ) | $ | (4.75 | ) | ||||
Year Ended December 31, 2008 | ||||||||||||||||
| Operating revenue | $ | 816,341 | $ | 913,299 | $ | 900,591 | $ | 769,579 | ||||||||
| Operating (loss) income | $ | (15,589 | ) | $ | 35,523 | $ | 58,901 | $ | 36,101 | |||||||
| Net loss | $ | (81,444 | ) | $ | (26,576 | ) | $ | (10,865 | ) | $ | (27,670 | ) | ||||
| Basic and diluted loss per share | $ | (1.08 | ) | $ | (0.35 | ) | $ | (0.14 | ) | $ | (0.37 | ) | ||||
F-61
Table of Contents
Report of Independent Registered Public Accounting Firm
The Board of Directors and Stockholders
Swift Corporation:
We have audited the accompanying consolidated balance sheets of Swift Transportation Co., Inc. and subsidiaries (the Company) as of May 10, 2007 and December 31, 2006, and the related consolidated statements of operations, comprehensive loss, stockholders’ equity, and cash flows for the period January 1, 2007 to May 10, 2007. These consolidated financial statements are the responsibility of the Company’s management. Our responsibility is to express an opinion on these consolidated financial statements based on our audits.
We conducted our audits in accordance with the standards of the Public Company Accounting Oversight Board (United States). Those standards require that we plan and perform the audit to obtain reasonable assurance about whether the financial statements are free of material misstatement. An audit includes examining, on a test basis, evidence supporting the amounts and disclosures in the financial statements. An audit also includes assessing the accounting principles used and significant estimates made by management, as well as evaluating the overall financial statement presentation. We believe that our audits provide a reasonable basis for our opinion.
In our opinion, the consolidated financial statements referred to above present fairly, in all material respects, the financial position of Swift Transportation Co., Inc. and subsidiaries as of May 10, 2007 and December 31, 2006, and the results of their operations and their cash flows for the period January 1, 2007 to May 10, 2007 in conformity with U.S. generally accepted accounting principles.
/s/ KPMG LLP
Phoenix, Arizona
March 28, 2008, except as to
note 24 which is as of
July 21, 2010
March 28, 2008, except as to
note 24 which is as of
July 21, 2010
F-62
Table of Contents
Swift Transportation Co., Inc. and Subsidiaries
| May 10, | December 31, | |||||||
| 2007 | 2006 | |||||||
| (In thousands, | ||||||||
| except share data) | ||||||||
ASSETS | ||||||||
| Current assets: | ||||||||
| Cash and cash equivalents | $ | 81,134 | $ | 47,858 | ||||
| Accounts receivable, net | 322,995 | 308,018 | ||||||
| Equipment sales receivables | 2,393 | 2,422 | ||||||
| Inventories and supplies | 9,178 | 11,621 | ||||||
| Prepaid taxes, licenses and insurance | 42,273 | 37,865 | ||||||
| Assets held for sale | 22,870 | 35,377 | ||||||
| Deferred income taxes | 53,615 | 43,695 | ||||||
| Total current assets | 534,458 | 486,856 | ||||||
| Property and equipment, at cost: | ||||||||
| Revenue and service equipment | 1,860,880 | 1,846,618 | ||||||
| Land | 104,565 | 85,883 | ||||||
| Facilities and improvements | 292,363 | 303,282 | ||||||
| Furniture and office equipment | 86,640 | 85,544 | ||||||
| Total property and equipment | 2,344,448 | 2,321,327 | ||||||
| Less accumulated depreciation and amortization | 865,640 | 807,735 | ||||||
| Net property and equipment | 1,478,808 | 1,513,592 | ||||||
| Notes receivable, less current portion | 263 | 2,752 | ||||||
| Other assets | 20,451 | 16,037 | ||||||
| Customer relationship intangibles, net | 34,125 | 35,223 | ||||||
| Goodwill | 56,188 | 56,188 | ||||||
| Total assets | $ | 2,124,293 | $ | 2,110,648 | ||||
| LIABILITIES AND STOCKHOLDERS’ EQUITY | ||||||||
| Current liabilities: | ||||||||
| Accounts payable | $ | 87,782 | $ | 100,424 | ||||
| Accrued liabilities | 93,640 | 63,360 | ||||||
| Current portion of claims accruals | 155,273 | 139,112 | ||||||
| Fair value of guarantees | 491 | 674 | ||||||
| Securitization of accounts receivable | 160,000 | 180,000 | ||||||
| Fair value of interest rate swaps | 608 | — | ||||||
| Total current liabilities | 497,794 | 483,570 | ||||||
| Senior notes | 200,000 | 200,000 | ||||||
| Claims accruals, less current portion | 106,461 | 108,606 | ||||||
| Deferred income taxes | 312,134 | 303,464 | ||||||
| Fair value of interest rate swaps | — | 785 | ||||||
| Total liabilities | 1,116,389 | 1,096,425 | ||||||
| Commitments and contingencies | ||||||||
| Stockholders’ equity: | ||||||||
| Preferred stock, par value $.001 per share. Authorized 1,000,000 shares; none issued | — | — | ||||||
| Common stock, par value $.001 per share. Authorized 200,000,000 shares; issued 101,179,174 and 100,864,952 on May 10, 2007 and December 31, 2006, respectively | 101 | 101 | ||||||
| Additional paid-in capital | 509,931 | 482,050 | ||||||
| Retained earnings | 962,463 | 992,885 | ||||||
| Treasury stock, at cost (25,922,320 and 25,776,359 shares on May 10, 2007 and December 31, 2006, respectively) | (464,508 | ) | (460,271 | ) | ||||
| Accumulated other comprehensive loss | (83 | ) | (542 | ) | ||||
| Total stockholders’ equity | 1,007,904 | 1,014,223 | ||||||
| Total liabilities and stockholders’ equity | $ | 2,124,293 | $ | 2,110,648 | ||||
See accompanying notes to consolidated financial statements.
F-63
Table of Contents
Swift Transportation Co., Inc. and Subsidiaries
Four months and ten days ended May 10, 2007
| (In thousands, | ||||
| except per share data) | ||||
| Operating revenue | $ | 1,074,723 | ||
| Operating expenses: | ||||
| Salaries, wages and employee benefits | 364,690 | |||
| Operating supplies and expenses | 119,833 | |||
| Fuel | 223,579 | |||
| Purchased transportation | 196,258 | |||
| Rental expense | 20,089 | |||
| Insurance and claims | 58,358 | |||
| Depreciation, amortization and impairments | 82,949 | |||
| Loss on disposal of property and equipment | 130 | |||
| Communication and utilities | 10,473 | |||
| Operating taxes and licenses | 24,021 | |||
| Total operating expenses | 1,100,380 | |||
| Operating loss | (25,657 | ) | ||
| Other (income) expenses: | ||||
| Interest expense | 9,277 | |||
| Interest income | (1,364 | ) | ||
| Other | 1,429 | |||
| Other (income) expenses, net | 9,342 | |||
| Loss before income taxes | (34,999 | ) | ||
| Income tax benefit | (4,577 | ) | ||
| Net loss | $ | (30,422 | ) | |
| Basic and diluted loss per share | $ | (0.40 | ) | |
See accompanying notes to consolidated financial statements.
F-64
Table of Contents
Swift Transportation Co., Inc. and Subsidiaries
Four months and ten days ended May 10, 2007
| (In thousands) | ||||
| Net loss | $ | (30,422 | ) | |
| Other comprehensive income (loss): | ||||
| Foreign currency translation | 81 | |||
| Reclassification of realized derivative loss on cash flow hedge into net earnings, net of tax effect of $148 | 378 | |||
| Comprehensive loss | $ | (29,963 | ) | |
See accompanying notes to consolidated financial statements.
F-65
Table of Contents
Swift Transportation Co., Inc. and Subsidiaries
Four months and ten days ended May 10, 2007
| Accumulated | ||||||||||||||||||||||||||||
| Common Stock | Additional | Other | Total | |||||||||||||||||||||||||
| Par | Paid-In | Retained | Treasury | Comprehensive | Stockholders’ | |||||||||||||||||||||||
| Shares | Value | Capital | Earnings | Stock | Loss | Equity | ||||||||||||||||||||||
| (In thousands, except share data) | ||||||||||||||||||||||||||||
| Balances, December 31, 2006 | 100,864,952 | $ | 101 | $ | 482,050 | $ | 992,885 | $ | (460,271 | ) | $ | (542 | ) | $ | 1,014,223 | |||||||||||||
| Issuance of common stock under stock option and employee stock purchase plans | 314,222 | — | 5,895 | — | — | — | 5,895 | |||||||||||||||||||||
| Income tax benefit arising from the exercise of stock options | — | — | 9,485 | — | — | — | 9,485 | |||||||||||||||||||||
| Amortization of deferred compensation | — | — | 12,501 | — | — | — | 12,501 | |||||||||||||||||||||
| Purchase of shares of 145,961 treasury stock | — | — | — | — | (4,237 | ) | — | (4,237 | ) | |||||||||||||||||||
| Reclassification of realized derivative loss on cash flow hedge | — | — | — | — | — | 378 | 378 | |||||||||||||||||||||
| Foreign currency translation adjustment | — | — | — | — | — | 81 | 81 | |||||||||||||||||||||
| Net loss | — | — | — | (30,422 | ) | — | — | (30,422 | ) | |||||||||||||||||||
| Balances, May 10, 2007 | 101,179,174 | $ | 101 | $ | 509,931 | $ | 962,463 | $ | (464,508 | ) | $ | (83 | ) | $ | 1,007,904 | |||||||||||||
See accompanying notes to consolidated financial statements.
F-66
Table of Contents
Swift Transportation Co., Inc. and Subsidiaries
Four months and ten days ended May 10, 2007
| (In thousands) | ||||
| Cash flows from operating activities: | ||||
| Net loss | $ | (30,422 | ) | |
| Adjustments to reconcile net loss to net cash provided by operating activities: | ||||
| Depreciation, amortization and impairments | 85,087 | |||
| Deferred income taxes | (1,250 | ) | ||
| Provision for losses on accounts receivable | (1,277 | ) | ||
| Equity losses | 71 | |||
| Amortization of deferred compensation | 12,501 | |||
| Change in market value of interest rate swaps | (177 | ) | ||
| Net loss on sale of revenue equipment | 91 | |||
| Net gain on sale of nonrevenue equipment | (87 | ) | ||
| Impairment of note receivable | 2,418 | |||
| Increase (decrease) in cash resulting from changes in: | ||||
| Accounts receivable | (14,080 | ) | ||
| Inventories and supplies | 2,444 | |||
| Prepaid taxes, licenses and insurance | (4,408 | ) | ||
| Other assets | (6,365 | ) | ||
| Accounts payable, accrued and other liabilities | 40,603 | |||
| Net cash provided by operating activities | 85,149 | |||
| Cash flows from investing activities: | ||||
| Proceeds from sale of property and equipment | 27,841 | |||
| Capital expenditures | (80,517 | ) | ||
| Proceeds from sale of assets held for sale | 6,400 | |||
| Payments received on equipment sales receivables | 2,422 | |||
| Net cash used in investing activities | (43,854 | ) | ||
| Cash flows from financing activities: | ||||
| Income tax benefit from exercise of stock options | 9,485 | |||
| Repayment of borrowings under accounts receivable securitization | (20,000 | ) | ||
| Proceeds from sale of common stock | 6,274 | |||
| Reclassification of realized derivative loss on cash flow hedge | 378 | |||
| Purchase of treasury stock | (4,237 | ) | ||
| Net cash used in financing activities | (8,100 | ) | ||
| Effect of exchange rate changes on cash | 81 | |||
| Net increase in cash | 33,276 | |||
| Cash and cash equivalents at beginning of year | 47,858 | |||
| Cash and cash equivalents at end of year | $ | 81,134 | ||
| Supplemental disclosure of cash flow information: | ||||
| Cash paid during the year for: | ||||
| Interest | $ | 6,719 | ||
| Income tax paid (refunded) | (9,978 | ) | ||
| Supplemental schedule of noncash investing and financing activities: | ||||
| Equipment sales receivables | $ | 2,393 | ||
| Equipment purchase accrual | (9,131 | ) | ||
See accompanying notes to consolidated financial statements.
F-67
Table of Contents
Swift Transportation Co., Inc. and Subsidiaries
May 10, 2007 and December 31, 2006
| (1) | Summary of significant accounting policies |
| (a) | Description of business |
Swift Transportation Co., Inc., a Nevada holding company, together with its wholly owned subsidiaries (the Company), is a national truckload carrier operating predominantly in one industry, road transportation, throughout the continental United States and Mexico and thus has only one reportable segment. The Company operates a national terminal network and a fleet of approximately 18,000 tractors, at May 10, 2007, from its headquarters in Phoenix, Arizona.
| (b) | Description of merger |
On January 19, 2007, the Company entered into a definitive merger agreement with Saint Acquisition Corporation, a wholly owned subsidiary of Swift Corporation (formerly known as Saint Corporation), an entity formed by Jerry Moyes, the Company’s founder, a director and former Chairman of the Board and CEO. On April 27, 2007, at a special meeting held in Phoenix, Arizona, the stockholders of the Company approved the merger agreement providing for the merger of the Company with Saint Acquisition Corporation.
Pursuant to the separate Swift Transportation Co., Inc. “Contribution and Exchange Agreement,” Jerry Moyes, The Jerry and Vickie Moyes Family Trust dated12/11/87 and various Moyes’ children trusts (collectively “Moyes affiliates”) contributed 28,792,810 shares of Swift Transportation Co., Inc. common stock, which represented 38.259% of the then outstanding common stock of Swift Transportation Co., Inc. to Swift Corporation on May 9, 2007. In exchange for the contributed Swift Transportation Co., Inc. common stock, the Moyes affiliates received a total of 64,495,892 shares of Swift Corporation’s common stock
On May 10, 2007, the Moyes affiliates acquired all the remaining 61.741% of the outstanding shares of the Company’s common stock for $31.55 per share (the Merger) pursuant to the merger agreement. Following the Merger, the Company’s shares ceased to be quoted on NASDAQ, the Company ceased to file reports with the Securities and Exchange Commission (the SEC) and the Company became owned by Swift Corporation, which is owned by Jerry Moyes, who prior to the Merger was the Company’s largest stockholder, and certain of his affiliates.
| (c) | Principles of consolidation |
The accompanying consolidated financial statements include the accounts of Swift Transportation Co., Inc. and its wholly owned subsidiaries. All significant intercompany balances and transactions have been eliminated in consolidation. When the Company does not have a controlling interest in an entity, but exerts significant influence over the entity, the Company applies the equity method of accounting. Special purpose entities are accounted for using the criteria of Statement of Financial Accounting Standard (FAS) No. 140,Accounting for Transfers and Servicing of Financial Assets and Extinguishment of Liabilities (a replacement of FASB No. 125). This Statement provides consistent accounting standards for distinguishing transfers of financial assets that are sales from transfers that are secured borrowings.
| (d) | Cash and cash equivalents |
The Company considers all highly liquid debt instruments purchased with original maturities of three months or less to be cash equivalents.
The Company’s wholly owned captive insurance company, Mohave Transportation Insurance Company, an Arizona corporation, maintains certain working trust accounts. The cash and cash equivalents within the trusts will be used to reimburse the insurance claim losses paid by the captive insurance company. As of
F-68
Table of Contents
Swift Transportation Co., Inc. and Subsidiaries
Notes to consolidated financial statements — (Continued)
May 10, 2007 and December 31, 2006, cash and cash equivalents held within the trust accounts were $12.4 million and $10.2 million, respectively.
| (e) | Inventories and supplies |
Inventories and supplies consist primarily of spare parts, tires, fuel and supplies and are stated at lower of cost or market. Cost is determined using thefirst-in, first-out (FIFO) method.
| (f) | Property and equipment |
Property and equipment are stated at cost. Costs to construct significant assets include capitalized interest incurred during the construction and development period. For the four months and ten days ended May 10, 2007, the Company capitalized interest related to self-constructed assets totaling $55,000. Expenditures for replacements and betterments are capitalized; maintenance and repair expenditures are charged to expense as incurred. Depreciation on property and equipment is calculated on the straight-line method over the estimated useful lives of 5 to 40 years for facilities and improvements, 3 to 12 years for revenue and service equipment and 3 to 5 years for furniture and office equipment.
Tires on revenue equipment purchased are capitalized as a component of the related equipment cost when the vehicle is placed in service and depreciated over the life of the vehicle. Replacement tires are charged to expense when placed in service.
| (g) | Goodwill |
The Company has $56.2 million of goodwill at May 10, 2007 and December 31, 2006. Goodwill represents the excess of the aggregate purchase price over the fair value of the net assets acquired in a purchase business combination. Goodwill is reviewed for impairment at least annually in accordance with the provisions of FAS No. 142,Goodwill and Other Intangible Assets.
| (h) | Impairments |
The Company evaluates its long-lived assets, including equity investments, property and equipment, and certain intangible assets subject to amortization for impairment whenever events or changes in circumstances indicate that the carrying amount of an asset may not be recoverable in accordance with FAS No. 144,Accounting for the Impairment or Disposal of Long-Lived Assets. If circumstance requires a long-lived asset be tested for possible impairment, the Company compares undiscounted cash flows expected to be generated by an asset to the carrying value of the asset. If the carrying value of the long-lived asset is not recoverable on an undiscounted cash flow basis, impairment is recognized to the extent that the carrying value exceeds its fair value. Fair value is determined through various valuation techniques including discounted cash flow models, quoted market values and third-party independent appraisals, as considered necessary.
Goodwill and indefinite lived intangible assets are reviewed for impairment at least annually in accordance with the provisions of FAS No. 142,Goodwill and Other Intangible Assets.
| (i) | Revenue recognition |
The Company recognizes operating revenues and related direct costs to recognizing revenue as of the date the freight is delivered, which is consistent with method three underEITF 91-9,Revenue and Expense Recognition for Freight Services in Process.
F-69
Table of Contents
Swift Transportation Co., Inc. and Subsidiaries
Notes to consolidated financial statements — (Continued)
| (j) | Stock compensation plans |
On January 1, 2006, the Company adopted FAS No. 123(R),Share-Based Payment(FAS 123(R)), using the modified prospective method. This Statement requires that all share-based payments to employees, including grants of employee stock options, be recognized in the financial statements upon a grant-date fair value of an award as opposed to the intrinsic value method of accounting for stock-based employee compensation under Accounting Principles Board Opinion No. 25 (APB No. 25), which the Company used for the preceding years.
In November 2005, the Financial Accounting Standards Board (FASB) issued FASB Staff Position (FSP) No. FAS 123(R)-3,Transition Election Related to Accounting for Tax Effects of Share-Based Payment Awards(FSP 123(R)-3). The Company has elected to adopt the alternative transition (short-cut) method provided in the FSP 123(R)-3 for calculating the tax effects of stock-based compensation pursuant to FAS No. 123(R). The alternative transition method includes simplified methods to establish the beginning balance of the additional paid-in capital pool (APIC pool) related to the tax effects of employee stock-based compensation and to determine the subsequent impact on the APIC pool of the tax effects of employee stock-based compensation awards that are outstanding upon adoption of FAS No. 123(R). See note 15 for additional information relating to the Company’s stock compensation plans and the adoption of FAS No. 123(R).
Pursuant to the merger agreement, all outstanding stock options and performance shares, vested or unvested as of May 10, 2007, were canceled and fully settled. Holders of stock options received an amount in cash equal to the excess of the Merger consideration over the exercise price per share of the options multiplied by the number of options outstanding. Holders of performance shares received cash equal to the merger consideration. Following the effective time of the merger, the holders of the options had no further rights in the options or performance shares.
The Company’s net loss for the four months and ten days ended May 10, 2007 includes $12.5 million of compensation costs related to the Company’s share-based compensation arrangements, of which $11.1 million was associated with the acceleration of options and performance shares related to the Merger.
| (k) | Income taxes |
In addition to charging income for taxes actually paid or payable, the Company provides for deferred income taxes using the asset and liability method. Deferred tax assets and liabilities are recognized for the future tax consequences attributable to differences between the financial statement carrying amount of existing assets and liabilities and their respective tax basis. Deferred tax assets and liabilities are measured using enacted tax rates expected to apply to taxable income in the years in which those temporary differences are expected to be recovered or settled. The effect on deferred tax assets and liabilities of a change in tax rates is recognized in the period that includes the enactment date.
| (l) | Use of estimates |
The preparation of the consolidated financial statements, in accordance with generally accepted principles in the United States of America, requires management to make estimates and assumptions that affect the amounts reported in the consolidated financial statements and accompanying notes. Significant items subject to such estimates and assumptions include the carrying amount of property and equipment, intangibles and goodwill; valuation allowances for receivables, inventories and deferred income tax assets; valuation of financial instruments; valuation of share-based compensation; and estimates of claims accruals and contingent obligations. Actual results could differ from those estimates.
F-70
Table of Contents
Swift Transportation Co., Inc. and Subsidiaries
Notes to consolidated financial statements — (Continued)
| (m) | Recent accounting pronouncements |
In February 2007, the FASB issued FAS No. 159,“The Fair Value Option for Financial Assets and Financial Liabilities”. FAS No. 159 allows entities the option to measure eligible financial instruments at fair value as of specified dates. Such election, which may be applied on an instrument by instrument basis, is typically irrevocable once elected. FAS No. 159 is effective for fiscal years beginning after November 15, 2007, and early application is allowed under certain circumstances. Management is currently evaluating the requirements of FAS No. 159 and has not yet determined the impact, if any, on the Company’s consolidated financial statements.
In September 2006, the Financial Accounting Standards Board (FASB) issued FAS No. 157,Fair Value Measurements. FAS No. 157 defines fair value, establishes a framework for measuring fair value in generally accepted accounting principles, and expands disclosures about fair value measurements. This Statement does not require any new fair value measurements, however, for some entities, the application of this Statement will change current practice. FAS No. 157 is effective for fiscal years beginning after November 15, 2007. In February 2008, the FASB issued a Staff PositionNo. 157-2, which delays the effective date of FAS No. 157 for non financial assets and non financial liabilities that are not currently recognized or disclosed at fair value on a recurring basis until fiscal years beginning after November 15, 2008. The Company is currently evaluating the impact, if any, of FAS No. 157 on its consolidated financial statements.
In June 2006, the FASB issued FASB Interpretation (FIN) No. 48,Accounting for Uncertainty in Income Taxes — an Interpretation of FASB Statement No. 109. FIN 48 clarifies the accounting for uncertainty in income taxes recognized in an enterprise’s financial statements in accordance with FAS No. 109,Accounting for Income Taxes. FIN 48 prescribes a recognition threshold and measurement attribute for the financial statement recognition and measurement of a company’s tax position taken or expected to be taken in a tax return. FIN 48 also provides guidance on derecognition, classification, interest and penalties, accounting in interim periods, disclosure and transition.
In May 2007, the FASB issued FSPNo. FIN 48-1,Definition of Settlement in FASB Interpretation No. 48. The FSP provides guidance about how an enterprise should determine whether a tax position is effectively settled for the purpose of recognizing previously unrecognized tax benefits. Under the FSP, a tax position could be effectively settled on completion of examination by a taxing authority if the entity does not intend to appeal or litigate the result and it is remote that the taxing authority would examine or re-examine the tax position. Application of the FSP shall be upon the initial adoption date of FIN 48. The FSP did not have a material impact on the Company’s consolidated financial statements.
The Company adopted the provisions of FIN 48 as of January 1, 2007 with no cumulative effect adjustment recorded at adoption. As of the date of adoption, the Company’s unrecognized tax benefits totaled approximately $8.3 million, $2.1 million of which would favorably impact our effective tax rate if subsequently recognized. As of May 10, 2007, we had unrecognized tax benefits totaling approximately $9.9 million, $1.8 million of which would favorably impact our effective tax rate if subsequently recognized.
The Company recognizes potential accrued interest and penalties related to unrecognized tax benefits as a component of income tax expense. Accrued interest and penalties as of January 1, 2007 and May 10, 2007 were approximately $0.8 million and $2.0 million, respectively. To the extent interest and penalties are not assessed with respect to uncertain tax positions, amounts accrued will be reduced and reflected as a reduction of the overall income tax provision.
The Company and its subsidiaries are currently under examination by federal taxing authorities for years 2003 through 2005 and various state jurisdictions for years ranging from 1997 to 2005. At the completion of these examinations, management does not expect any adjustments that would have a material impact on the Company’s effective tax rate. Years subsequent to 2005 remain subject to examination.
F-71
Table of Contents
Swift Transportation Co., Inc. and Subsidiaries
Notes to consolidated financial statements — (Continued)
The Company anticipates that the total amount of unrecognized tax benefits may decrease by approximately $8.6 million during the next twelve months, which it believes will not have a material impact on the financial statements.
| (2) | Accounts receivable |
Accounts receivable were:
| May 10, | December 31, | |||||||
| 2007 | 2006 | |||||||
| (In thousands) | ||||||||
| Trade customers | $ | 294,853 | $ | 290,985 | ||||
| Equipment manufacturers | 6,773 | 7,092 | ||||||
| Tax receivable | 31,817 | 21,788 | ||||||
| Other | 4,070 | 5,458 | ||||||
| 337,513 | 325,323 | |||||||
| Less allowance for doubtful accounts | 14,518 | 17,305 | ||||||
| $ | 322,995 | $ | 308,018 | |||||
The schedule of allowance for doubtful accounts was as follows:
| May 10, | December 31, | |||||||
| 2007 | 2006 | |||||||
| (In thousands) | ||||||||
| Beginning balance | $ | 17,305 | $ | 14,352 | ||||
| Additions (reversals) | (1,277 | ) | 6,808 | |||||
| Recoveries | 413 | 412 | ||||||
| Write-offs | (1,923 | ) | (4,267 | ) | ||||
| Ending balance | $ | 14,518 | $ | 17,305 | ||||
| (3) | Assets held for sale |
Assets held for sale were:
| May 10, | December 31, | |||||||
| 2007 | 2006 | |||||||
| (In thousands) | ||||||||
| Land and facilities | $ | 800 | $ | 7,511 | ||||
| Revenue equipment | 22,070 | 27,866 | ||||||
| Assets held for sale | $ | 22,870 | $ | 35,377 | ||||
As of May 10, 2007, assets held for sale were stated at the lower of depreciated cost or fair value less estimated selling expenses. The Company expects to sell these assets within the next twelve months. During the four months and ten days ended May 10, 2007, the Company transferred its New Jersey terminal back into operations, reclassifying the facility from assets held for sale to property and equipment.
| (4) | Equity investment — Transplace, Inc. |
In 2000, the Company contributed $10.0 million in cash to Transplace, Inc. (Transplace), a provider of transportation management services. The Company’s 29% interest in Transplace is accounted for using the equity method. As a result of accumulated equity losses, the investment in Transplace was $0 at May 10, 2007
F-72
Table of Contents
Swift Transportation Co., Inc. and Subsidiaries
Notes to consolidated financial statements — (Continued)
and December 31, 2006, respectively. The Company’s equity in the net assets of Transplace exceeds its investment account by approximately $24 million as of May 10, 2007. As Transplace records amortization or impairment of goodwill and intangibles, the Company accretes an equal amount of basis difference to offset such amortization or impairment. The Company received $4.5 million in operating revenue during the four months and ten days ended May 10, 2007 for transportation services provided to Transplace. At May 10, 2007 and December 31, 2006, $2.1 million and $2.0 million, respectively, were owed to the Company for these services. The Company recorded equity losses of $71,000 in other (income) expense during the four months and ten days ended May 10, 2007 for Transplace, which reduced the note receivable described in Note 5.
| (5) | Notes receivable |
In January 2005, the Company loaned $6.3 million to Transplace Texas, LP, a subsidiary of Transplace. This note receivable is being reduced as the Company records its portion of the losses incurred by Transplace. As of May 10, 2007, this note has been reduced by approximately $5.7 million in accumulated losses and a principal payment of approximately $340,000 received in 2006. At such time as the note is repaid in full, the amount of losses previously recorded as a reduction of the note receivable will be recognized as a gain. Effective January 7, 2007, the note receivable was amended to extend the maturity date to January 7, 2009.
In the course of the preparation and review of consolidated financial statements as of and for the four months and ten days ended May 10, 2007, the Company determined that the underlying collateral of the note receivable from Transportes EASO, a third party Mexican trucking company, was impaired and recorded a pre-tax impairment of $2.4 million related to the write-off of the note receivable.
Notes receivable were the following:
| May 10, | December 31, | |||||||
| 2007 | 2006 | |||||||
| (In thousands) | ||||||||
| Note receivable of $6,331 from Transplace, net of accumulated equity losses and principal payments, bearing interest of 6% per annum and principal due and payable on January 7, 2009 | $ | 263 | $ | 334 | ||||
| Note receivable from Transportes EASO, payable on demand | — | 2,418 | ||||||
| 263 | 2,752 | |||||||
| Less current portion | — | — | ||||||
| Notes receivable, less current portion | $ | 263 | $ | 2,752 | ||||
| (6) | Accrued liabilities |
Accrued liabilities were:
| May 10, | December 31, | |||||||
| 2007 | 2006 | |||||||
| (In thousands) | ||||||||
| Employee compensation | $ | 67,424 | $ | 37,980 | ||||
| Fuel, mileage and property taxes | 4,563 | 5,339 | ||||||
| Income taxes payable | 3,840 | 2,973 | ||||||
| Other | 17,813 | 17,068 | ||||||
| $ | 93,640 | $ | 63,360 | |||||
F-73
Table of Contents
Swift Transportation Co., Inc. and Subsidiaries
Notes to consolidated financial statements — (Continued)
| (7) | Claims accruals |
Claims accruals represent accruals for the uninsured portion of pending claims at May 10, 2007 and December 31, 2006. The current portion reflects the amounts of claims expected to be paid in the following year. These accruals are estimated based on management’s evaluation of the nature and severity of individual claims and an estimate of future claims development based on the Company’s past claims experience. The Company’s insurance program for workers’ compensation, group medical liability, liability, physical damage and cargo damage involves self-insurance, with varying risk retention levels. Claims in excess of these risk retention levels are insured up to certain limits which management believes is adequate.
Claims accruals were (in thousands):
| May 10, | December 31, | |||||||
| 2007 | 2006 | |||||||
| (In thousands) | ||||||||
| Auto and collision liability | $ | 160,361 | $ | 160,660 | ||||
| Workers’ compensation liability | 77,780 | 69,490 | ||||||
| Owner-operator claims liability | 9,129 | 4,014 | ||||||
| Group medical liability | 12,255 | 10,962 | ||||||
| Cargo damage liability | 2,209 | 2,592 | ||||||
| 261,734 | 247,718 | |||||||
| Less current portion of claims accrual | 155,273 | 139,112 | ||||||
| Claim accruals, less current portion | $ | 106,461 | $ | 108,606 | ||||
| (8) | Securitization of accounts receivable |
In December 1999, the Company (through a wholly owned bankruptcy-remote special purpose subsidiary) entered into an agreement to sell, on a revolving basis, interests in its accounts receivable to two unrelated financial entities. The bankruptcy-remote subsidiary has the right to repurchase the receivables from the unrelated entities. Therefore, the transaction does not meet the criteria for sale treatment in accordance with FAS No. 140 and is reflected as a secured borrowing in the financial statements.
Under the agreement amended in the fourth quarter of 2005, the Company can receive up to a maximum of $300 million of proceeds, subject to eligible receivables and will pay a program fee recorded as interest expense, as defined in the agreement. On December 20, 2006, the committed term was extended to December 19, 2007. The Company will pay commercial paper interest rates on the proceeds received (approximately 5.3% at May 10, 2007). The proceeds received are reflected as current liabilities on the consolidated financial statements because the committed term, subject to annual renewals, is 364 days. As of May 10, 2007 and December 31, 2006 there were $160 million and $180 million, respectively, of proceeds received.
Following the completion of the Merger, the agreement was terminated and the proceeds outstanding under the securitization of accounts receivable were paid in full through the proceeds of the merger consideration.
| (9) | Fair value of operating lease guarantees |
The Company guarantees certain residual values under its operating lease agreements for revenue equipment. At the termination of these operating leases, the Company would be responsible for the excess of the guarantee amount above the fair market value, if any. As of May 10, 2007 and December 31, 2006, the Company has recorded a liability for the estimated fair value of the guarantees, entered into subsequent to
F-74
Table of Contents
Swift Transportation Co., Inc. and Subsidiaries
Notes to consolidated financial statements — (Continued)
January 1, 2003, in the amount of $491,000 and $674,000, respectively. The maximum potential amount of future payments the Company would be required to make under all of these guarantees is $21.8 million.
| (10) | Borrowings under revolving credit agreement |
Pursuant to the amended credit facility with a group of lenders, as of May 10, 2007, the Company had a $550 million revolving credit agreement, maturing December 2010 (the Credit Agreement). Interest on outstanding borrowings was based upon one of two options, which the Company may select at the time of borrowing: the bank’s prime rate or the London Interbank Offered Rate (LIBOR) plus applicable margins ranging from 40 to 100 basis points, as defined in the Credit Agreement (50 basis points at May 10, 2007). The unused portion of the line of credit is subject to a commitment fee ranging from 8 to 17.5 basis points (10 basis points at May 10, 2007). As of May 10, 2007 and December 31, 2006, there were no amounts outstanding under the line of credit. The total commitment fee expensed for the four months and ten days ended May 10, 2007 was $129,000.
The Credit Agreement included financing for letters of credit. As of May 10, 2007, the Company had outstanding letters of credit primarily for workers’ compensation and liability self-insurance purposes totaling $187.2 million, leaving $362.8 million available under the Credit Agreement.
The Credit Agreement requires the Company to meet certain covenants with respect to leverage and fixed charge coverage ratios and tangible net worth. As of May 10, 2007 the Company was in compliance with these debt covenants.
Following the completion of the Merger, the Credit Agreement was canceled and all accrued commitment fees paid.
| (11) | Senior notes |
In June 2003, the Company completed a private placement of senior notes. The notes were issued in two series of $100 million each with an interest rate of 3.73% for those notes maturing on June 27, 2008 and 4.33% for those notes maturing on June 27, 2010 with interest payable on each semiannually in June and December. The notes contain financial covenants relating to leverage, fixed charge coverage and tangible net worth. As of May 10, 2007, the Company was in compliance with these debt covenants.
Following the completion of the Merger, the outstanding principal and accrued interest on the senior notes were redeemed and paid in full through the proceeds of the merger consideration.
| (12) | Derivative financial instruments |
The Company was a party to swap agreements that were used to manage exposure to interest rate movement by effectively changing the variable rate to a fixed rate. Since these instruments did not qualify for hedge accounting, the changes in the fair value of the interest rate swap agreements will be recognized in net earnings until they mature through March 2009.
For the four months and ten days ended May 10, 2007, the Company recognized a gain for the change in fair market value of the interest rate swap agreements of $177,000. The changes in fair market value of the interest rate swap agreements are recorded as interest expense.
F-75
Table of Contents
Swift Transportation Co., Inc. and Subsidiaries
Notes to consolidated financial statements — (Continued)
| (13) | Commitments |
Operating leases
The Company leases various revenue equipment and terminal facilities under operating leases. At May 10, 2007, the future minimum lease payments under noncancelable operating leases were:
| Revenue | ||||||||||||
| Equipment | Facilities | Total | ||||||||||
| (In thousands) | ||||||||||||
| Years Ending May 10, | ||||||||||||
| 2008 | $ | 29,965 | $ | 897 | $ | 30,862 | ||||||
| 2009 | 12,526 | 435 | 12,961 | |||||||||
| 2010 | 12,034 | 167 | 12,201 | |||||||||
| 2011 | 6,078 | 51 | 6,129 | |||||||||
| 2012 | — | 43 | 43 | |||||||||
| Total minimum lease payments | $ | 60,603 | $ | 1,593 | $ | 62,196 | ||||||
The revenue equipment leases generally include purchase options exercisable at the completion of the lease. For the four months and ten days, total rental expense was $20.1 million.
Purchase commitments
The Company had commitments outstanding to acquire revenue equipment for approximately $252.6 million as of May 10, 2007. These purchases are expected to be financed by the combination of operating leases, debt, proceeds from sales of existing equipment and cash flows from operations. The Company has the option to cancel such commitments with 90 days notice.
In addition, the Company had remaining commitments of $326,000 as of May 10, 2007 under contracts relating to acquisition, development and improvement of facilities.
| (14) | Contingencies |
The Company is involved in certain claims and pending litigation primarily arising in the normal course of business. Based on the knowledge of the facts and, in certain cases, opinions of outside counsel, management believes the resolution of claims and pending litigation will not have a material adverse effect on the Company.
| (15) | Stockholders’ equity |
| (a) | Treasury stock |
Pursuant to the Company’s repurchase program, the Company may acquire its common stock using the proceeds received from the exercise of stock options to minimize the dilution from the exercise of stock options. The purchases are made in accordance with SEC rules 10b5-1 and10b-18, which limit the amount and timing of repurchases and removes any discretion with respect to purchases on the part of the Company. The timing and amount of shares repurchased is dependent upon the timing and amount of employee stock option exercises.
The Company purchased 145,961 shares of its common stock for a total cost of $4.2 million during the four months and ten days ended May 10, 2007. All of the shares purchased are being held as treasury stock and may be used for issuances under the Company’s employee stock option and purchase plans or for other general corporate purposes.
F-76
Table of Contents
Swift Transportation Co., Inc. and Subsidiaries
Notes to consolidated financial statements — (Continued)
| (b) | Stock option plans |
The Company has granted a number of stock options under various plans. Beginning in April 2006, the Company granted options to employees, which vest pro-rata over a five year period and have exercise prices equal to 100% of the market price on the date of grant. The options expire seven years following the grant date. Prior to April 2006, options granted by the Company to employees generally vested 20% per year beginning on the fifth anniversary of the grant date or pro-rata over a nine-year period. The option awards expire ten years following the date of grant. The exercise prices of the options with nine year vesting periods were generally granted equal to 85 to 100% of the market price on the grant date. Options granted to the Company’s nonemployee directors have been granted with an exercise price equal to 85% or 100% of the market price on the grant date, vest over four years and expire on the sixth anniversary of the grant date.
Pursuant to the merger agreement (Merger), as of May 10, 2007, all outstanding vested or unvested fixed stock options were canceled and fully settled. Holders of stock options received from Jerry Moyes and certain of his affiliates an amount in cash equal to the excess of the merger consideration over the exercise price per share of the options multiplied by the number of options outstanding.
A summary of the activity of the Company’s fixed stock option plans as of May 10, 2007 and December 31, 2006, and changes during the periods then ended on those dates were:
| May 10, 2007 | December 31, 2006 | |||||||||||||||
| Weighted- | Weighted- | |||||||||||||||
| Average | Average | |||||||||||||||
| Shares | Exercise Price | Shares | Exercise Price | |||||||||||||
| Outstanding at beginning of period | 3,422,386 | $ | 19.78 | 6,467,398 | $ | 18.05 | ||||||||||
| Granted at market value | 374,250 | 30.52 | 575,400 | 23.53 | ||||||||||||
| Exercised | (221,860 | ) | 17.50 | (3,425,553 | ) | 17.15 | ||||||||||
| Cancelled and settled | (3,520,400 | ) | 21.09 | — | — | |||||||||||
| Forfeited | (54,376 | ) | 17.34 | (194,859 | ) | 19.85 | ||||||||||
| Outstanding at end of period | — | $ | — | 3,422,386 | $ | 19.78 | ||||||||||
| Options exercisable at end of period | — | 2,160,154 | ||||||||||||||
The total intrinsic value of options exercised during the four months and ten days ended May 10, 2007, was $2.1 million. For the stock options canceled and settled at May 10, 2007 associated with the merger, the total intrinsic value was $36.8 million, with no cash proceeds received by the Company.
The fair value of each option award is estimated on the date of grant using the Black-Scholes-Merton option-pricing model, which uses a number of assumptions to determine the fair value of the options on the date of grant. The weighted average grant date fair value of options granted at market value during the four months ended May 10, 2007 was $13.26. The following weighted average assumptions were used to determine the weighted average grant date fair value of the stock options granted during the four months and ten days ended May 10, 2007:
| May 10, | ||||
| 2007 | ||||
| Dividend yield | —% | |||
| Expected volatility | 41% | |||
| Risk free interest rate | 4.86% | |||
| Expected lives (in years) | 5.0 | |||
F-77
Table of Contents
Swift Transportation Co., Inc. and Subsidiaries
Notes to consolidated financial statements — (Continued)
The expected lives of the options are based on the historical and expected future employee exercise behavior. Expected volatility is based upon the historical volatility of the Company’s common stock. The risk-free interest rate is based upon the U.S. Treasury yield curve at the date of grant with maturity dates approximately equal to the expected life at the grant date.
| (c) | Employee stock purchase plan |
Under the Employee Stock Purchase Plan (ESPP), the Company is authorized to issue up to 6.5 million shares of common stock to full-time employees, nearly all of whom are eligible to participate. Under the terms of the ESPP, employees can choose each year to have up to 15% of their annual base earnings withheld to purchase the Company’s common stock. The purchase price of the stock is 85% of the lower of thebeginning-of-period orend-of-period (each period being the first and second six calendar months) market price. Each employee is restricted to purchasing during each period a maximum of $12,500 of stock determined by using thebeginning-of-period price.
On March 22, 2007, the Compensation Committee of the Board of Directors of the Company approved and adopted an amendment to the ESPP. The ESPP was amended to reflect the provision contained in that certain Agreement and Plan of Merger, dated as of January 19, 2007, by and among Saint Corporation, Saint Acquisition Corporation and the Company. The amendment provided that the then current offering period under the Plan would end the last trading date prior to the effective time of the merger and that no additional offering periods will occur thereafter. During the four months and ten days ended May 10, 2007, the Company issued approximately 71,000 shares at an average price per share of $22.87, under the employee stock purchase plan.
As a result of the adoption of FAS 123(R) in January 2006, total compensation expense related to the ESPP was approximately $523,000 for the four months and ten days ended May 10, 2007. Compensation expense is calculated as the fair value of the employees’ purchase rights, which was estimated using the Black-Scholes-Merton model with the following assumptions:
| May 10, | ||||
| 2007 | ||||
| Dividend yield | — | % | ||
| Expected volatility | 48 | % | ||
| Risk free interest rate | 5.11 | % | ||
The weighted average fair value of those purchase rights granted during the four months and ten days ended May 10, 2007 was $7.40 per share.
| (d) | Performance share awards |
In 2006, the Company communicated to employees a plan that would include the award of performance shares to eligible employees to be issued in 2007 pursuant to the 2006 Long-Term Incentive Compensation Plan. The actual number of awards was based on the Company meeting or achieving certain performance targets in 2006. In January 2007, approximately 84,000 performance share awards were issued under the Company’s 2003 Stock Incentive Plan. The performance share awards vest over two years at a rate of 50% per year beginning on the first anniversary following the date the awards were issued. The weighted average fair value of these performance shares in 2006 was $22.65 per share.
Pursuant to the merger agreement, as of May 10, 2007, all outstanding vested or unvested performance shares were canceled and fully settled. Holders of performance shares received cash equal to the merger consideration.
F-78
Table of Contents
Swift Transportation Co., Inc. and Subsidiaries
Notes to consolidated financial statements — (Continued)
| (e) | Stockholders protection rights agreement |
On July 18, 2006, the Board of Directors of the Company declared a dividend payable July 31, 2006 of one right (a “Right) for each outstanding share of common stock of the Company held of record at the close of business on July 31, 2006 and for each share issued thereafter. The Rights were issued pursuant to a Stockholders Protection Rights Agreement (the Rights Agreement), which governs the terms of the Rights. The Rights Agreement is designed to protect the Company’s stockholders against coercive tender offers, inadequate offers, and abusive or coercive takeover tactics and ensure all the Company’s stockholders receive fair and equal treatment in the event of any unsolicited attempts to take over the Company. Following a triggering event (as described in the Rights Agreement), each Right entitles its registered holder, other than an acquiring person that causes the triggering event, to purchase from the Company, one one-hundredth of a share of Participating Preferred Stock, $0.001 par value, for $150, subject to adjustment. The Rights will not become exercisable until, among other things, the business day following the tenth business day after either any person commences a tender or exchange offer which, if consummated, would result in such person acquiring beneficial ownership of 20% or more of the Company’s outstanding common stock or a person or group has acquired 20% or more of the Company’s outstanding common stock (or, in the case of an existing holder of more than 20%, such person or group has acquired an additional 0.01% of the outstanding common stock, subject to certain exceptions). The Rights will expire on the close of business on July 18, 2009 or on the date on which the Rights are redeemed by the Board of Directors.
Immediately prior to the execution of the merger agreement, the Company amended the Rights Agreement. The Rights Agreement amendment provides that, among other things, neither the execution of the merger agreement nor the consummation of the Merger or the other transactions contemplated by the merger agreement will trigger the separation or exercise of the stockholder rights or any adverse event under the Rights Agreement. In particular, none of Swift Corporation, its wholly owned subsidiary, Saint Acquisition Corporation, or any of their respective affiliates or associates will be deemed to be an Acquiring Person (as defined in the Rights Agreement) solely by virtue of the approval, execution, delivery, adoption or performance of the merger agreement or the consummation of the Merger or any other transactions contemplated by the merger agreement.
| (16) | Income Taxes |
Income tax expense (benefit) for the four months and ten days ended May 10, 2007 was (in thousands):
| Current expense (benefit): | ||||
| Federal | $ | (6,124 | ) | |
| State | 708 | |||
| Foreign | 33 | |||
| (5,383 | ) | |||
| Deferred expense (benefit): | ||||
| Federal | 1,742 | |||
| State | (1,992 | ) | ||
| Foreign | 1,056 | |||
| 806 | ||||
| Net income tax benefit | $ | (4,577 | ) | |
F-79
Table of Contents
Swift Transportation Co., Inc. and Subsidiaries
Notes to consolidated financial statements — (Continued)
The Company’s effective tax rate was 14% for the four months and ten days ended May 10, 2007. The actual tax benefit differs from the “expected” tax benefit (computed by applying the U.S. Federal corporate income tax rate of 35% to earnings (losses) before income taxes) for the four months and ten days ended May 10, 2007 (in thousands):
| Computed “expected” tax benefit | $ | (12,250 | ) | |
| Increase (decrease) in income taxes resulting from: | ||||
| State income taxes, net of federal income tax benefit | 183 | |||
| Per diem allowances | 627 | |||
| Acquisition related expenses | 8,144 | |||
| State tax rate change and other adjustments in deferred items | (1,551 | ) | ||
| Other, net of tax credits | 270 | |||
| Net income tax benefit | $ | (4,577 | ) | |
The net effects of temporary differences that give rise to significant portions of the deferred tax assets and deferred tax liabilities:
| May 10, | December 31, | |||||||
| 2007 | 2006 | |||||||
| (In thousands) | ||||||||
| Deferred tax assets: | ||||||||
| Claims accruals | $ | 88,877 | $ | 85,287 | ||||
| Allowance for doubtful accounts | 6,747 | 6,425 | ||||||
| Accrued liabilities | 1,057 | 1,179 | ||||||
| Derivative financial instruments | 229 | 297 | ||||||
| Equity investments | 5,664 | 5,464 | ||||||
| Amortization of discount on stock options | — | 1,980 | ||||||
| Other | 8,531 | 7,821 | ||||||
| Total deferred tax assets | 111,105 | 108,453 | ||||||
| Valuation allowances | (1,697 | ) | (1,616 | ) | ||||
| Total deferred tax assets, net | 109,408 | 106,837 | ||||||
| Deferred tax liabilities: | ||||||||
| Property and equipment, principally due to differences in depreciation | (341,909 | ) | (336,671 | ) | ||||
| Prepaid taxes, licenses and permits deducted for tax purposes | (14,017 | ) | (14,495 | ) | ||||
| Contractual commitments deducted for tax purposes | (4,644 | ) | (8,412 | ) | ||||
| Other | (7,357 | ) | (7,028 | ) | ||||
| Total deferred tax liabilities | (367,927 | ) | (366,606 | ) | ||||
| Net deferred tax liability | $ | (258,519 | ) | $ | (259,769 | ) | ||
F-80
Table of Contents
Swift Transportation Co., Inc. and Subsidiaries
Notes to consolidated financial statements — (Continued)
These amounts are presented in the accompanying consolidated balance sheets as follows:
| May 10, | December 31, | |||||||
| 2007 | 2006 | |||||||
| (In thousands) | ||||||||
| Current deferred tax asset | $ | 53,615 | $ | 43,695 | ||||
| Noncurrent deferred tax liability | (312,134 | ) | (303,464 | ) | ||||
| Net deferred tax liability | $ | (258,519 | ) | $ | (259,769 | ) | ||
U.S. income and foreign withholding taxes have not been provided on approximately $45 million of cumulative undistributed earnings of foreign subsidiaries. The earnings are considered to be permanently reinvested outside the U.S. As the Company intends to reinvest these earnings indefinitely outside the U.S., it is not required to provide U.S. income taxes on them until they are repatriated in the form of dividends or otherwise.
The Company has state net operating loss carryforwards available at May 10, 2007 that it expects will generate future tax savings of approximately $4 million. The state net operating losses will expire at various times between 2007 and 2026 if not used. The Company has established a valuation allowance of $1.7 million for the possibility that some of these state carryforwards may not be used.
| (17) | Accumulated other comprehensive loss |
In conjunction with the June 2003 private placement of senior notes, the Company entered into a cash flow hedge to lock the benchmark interest rate used to set the coupon rate for $50 million of the notes. The Company terminated the hedge when the coupon rate was set and paid $1.1 million, which is recorded as accumulated other comprehensive loss in stockholders’ equity. This amount will be amortized as a yield adjustment of the interest rate on the seven-year series of notes. The Company amortized $378,000 into interest expense during four months and ten days ended May 10, 2007.
| (18) | Employee benefit plans |
The Company maintains a 401(k) profit sharing plan for all employees who are 19 years of age or older and have completed six months of service. In 2006, the Company amended the Plan to allow matching of contributions up to 3% of an employee’s compensation. Employees’ rights to employer contributions vest after five years from their date of employment.
For the four months and ten days ended May 10, 2007, the Company’s expense associated with the 401(k) plan was approximately $919,000.
| (19) | Key customer |
Services provided to the Company’s largest customer, Wal-Mart, generated 15% of operating revenue during the four months and ten days ended May 10, 2007. No other customer accounted for 10% or more of operating revenue.
| (20) | Related party transactions |
The Company obtains drivers for the owner-operator portion of its fleet by entering into contractual arrangements either with individual owner-operators or with fleet operators. Fleet operators maintain a fleet of tractors and directly negotiate with a pool of owner-operators and employees whose services the fleet operator then offers to the Company. One of the largest fleet operators with whom the Company does business is Interstate Equipment Leasing, Inc. (IEL), a corporation wholly owned by Jerry Moyes, a member of the Company’s Board of Directors. The Company pays the same or comparable rate per mile for purchased
F-81
Table of Contents
Swift Transportation Co., Inc. and Subsidiaries
Notes to consolidated financial statements — (Continued)
transportation services to IEL that it pays to independent owner-operators and other fleet operators. For the period January 1, 2007 through May 10, 2007, the Company paid $3.1 million to IEL for purchased transportation services. The Company owed $94,000 and $140,000 for these purchased transportation services at May 10, 2007 and December 31, 2006, respectively.
The Company also provides repair and maintenance services to IEL trucks totaling $1.1 million for the period January 1, 2007 through May 10, 2007. At May 10, 2007 and December 31, 2006, the Company was owed $17,000 and $108,000, respectively, for these services. The Company paid IEL $79,000 during the same period of 2007 for various other services (including insurance claims payments and reimbursement to IEL for Prepass usage by their drivers on the Company loads). There were no amounts payable to IEL for these services at May 10, 2007 or December 31, 2006.
The Company provides transportation, repair, facilities leases and other services to several trucking companies affiliated with Jerry Moyes as follows:
Two trucking companies affiliated with Jerry Moyes hires the Company for truckload hauls for their customers: Central Freight Lines, Inc. (Central Freight), a publicly traded less-than-truckload carrier, and Central Refrigerated Service, Inc. (Central Refrigerated), a privately held refrigerated truckload carrier. Jerry Moyes owns Southwest Premier Properties which bought out Central Freight in 2005 and Mr. Moyes is the principal stockholder of Central Refrigerated. The Company also provides repair, facilities leases and other truck stop services to Central Freight and Central Refrigerated. The Company recognized $2.0 million in operating revenue for January 1, 2007 through May 10, 2007 for these services to Central Freight and Central Refrigerated. At May 10, 2007 and December 31, 2006, $977,000 and $31,000, respectively, was owed to the Company for these services.
The rates that the Company charges each of these companies for transportation services, in the case of truckload hauls, are market rates comparable to what it charges its regular customers, thus providing the Company with an additional source of operating revenue at its normal freight rates. The rates charged for repair and other truck stop services is comparable to what the Company charges its owner-operators, which is at a mark up over the Company’s cost. In addition, The Company leases facilities from Central Freight and paid $101,000 to the carrier for facilities rents from January 1, 2007 through May 10, 2007. There were no amounts owed to Central Freight at May 10, 2007 or December 31, 2006.
The Company purchased $165,000 of refrigeration units and parts from January 1, 2007 through May 10, 2007 from Thermo King West, a Thermo King dealership owned by William F. Riley III, an executive officer of the Company until July 2005, who is also the father of Jeff Riley, an executive officer of the Company until the closing of the merger on May 10, 2007. The Company owed $41,000 and $3,000 to Thermo King West at May 10, 2007 and December 31, 2006, respectively. Thermo King Corporation, a unit of Ingersoll-Rand Company limited, requires that all purchases of refrigeration units be made through one of its dealers. Thermo King West is the exclusive dealer in the southwest. Pricing terms are negotiated directly with Thermo King Corporation, with additional discounts negotiated between the Company and Thermo King West once pricing terms are fixed with Thermo King Corporation. Thermo King Corporation is one of only two companies that supplies refrigeration units that are suitable for the Company’s needs. In addition to Thermo King West, Bill Riley owns Trucks West, an operating franchised service and parts facilities for Volvo tractors. The Company purchased $1.1 million in parts and services from Trucks West from January 1, 2007 through May 10, 2007. The Company owed $255,000 and $637,000 for these parts and services at May 10, 2007 and December 31, 2006, respectively.
All of the above related party arrangements were approved by the independent members of the Company’s Board of Directors.
F-82
Table of Contents
Swift Transportation Co., Inc. and Subsidiaries
Notes to consolidated financial statements — (Continued)
| (21) | Fair value of financial instruments |
Statement of Financial Accounting Standards No. 107,Disclosures about Fair Value of Financial Instruments, requires that the Company disclose estimated fair values for its financial instruments. Fair value estimates are made at a specific point in time and are based on relevant market information and information about the financial instrument. These estimates do not reflect any premium or discount that could result from offering for sale at one time the Company’s entire holdings of a particular financial instrument. Changes in assumptions could significantly affect these estimates. Since the fair value is estimated as of May 10, 2007, the amounts that will actually be realized or paid at settlement or maturity of the instruments could be significantly different.
The following summary presents a description of the methodologies and assumptions used to determine such amounts.
| (a) | Accounts receivable and payable |
Fair value is considered to be equal to the carrying value of the accounts receivable, accounts payable and accrued liabilities, as they are generally short-term in nature and the related amounts approximate fair value or are receivable or payable on demand.
(b) Long-term debt, borrowings under revolving credit agreement and accounts receivable securitization
The fair value of all of these instruments was assumed to approximate their respective carrying values given the duration of the notes, their interest rates and underlying collateral.
| (c) | Senior notes |
The fair value of the senior notes, measured as the present value of the future cash flows using the current borrowing rate for comparable maturity notes, was estimated to be $190.2 million as of May 10, 2007.
| (22) | Customer relationship intangible asset |
Information related to the acquired customer relationship intangible asset was:
| May 10, | December 31, | |||||||
| 2007 | 2006 | |||||||
| (In thousands) | ||||||||
| Customer relationship intangible asset: | ||||||||
| Gross carrying amount | $ | 45,726 | $ | 45,726 | ||||
| Accumulated amortization | (11,601 | ) | (10,503 | ) | ||||
| $ | 34,125 | $ | 35,223 | |||||
The aggregate amortization expense related to the acquired customer relationship intangible asset was $1.1 million for the four months and ten days ended May 10, 2007. The estimated amortization expense for each of the next five years is approximately $3 million. Amortization on the customer relationship intangible asset is calculated on the straight-line method over the estimated useful life of 15 years.
| (23) | Subsequent events |
At the close of the Merger, Swift Corporation incurred approximately $2.56 billion in debt primarily associated with the acquisition of Swift Transportation Co., Inc. The debt consists of proceeds from a first lien term loan pursuant to a credit facility with a group of lenders totaling $1.72 billion and proceeds from the offering of $835 million in senior notes. The use of the proceeds included the cash consideration paid for the purchase price of Swift Transportation Co., Inc. of $1.52 billion, repayment of approximately $376.5 million of indebtedness of the Company and Interstate Equipment Leasing, Inc., a entity with common ownership,
F-83
Table of Contents
Swift Transportation Co., Inc. and Subsidiaries
Notes to consolidated financial statements — (Continued)
$560 million representing the issuance of a stockholder loan receivable to the Moyes affiliates and debt issuance costs of $56.8 million. The remaining proceeds were used by Swift Corporation for payment of transaction-related expenses.
In connection with the Merger, Jock Patton, Robert W. Cunningham, Karl Eller, Alphonse E. Frei, David Goldman, Paul M. Mecray III, Jerry Moyes, Karen E. Rasmussen and Samuel C. Cowley resigned from his or her respective position as a member of the Board of Directors, and any committee thereof, of Swift Transportation Co., Inc. and from any other position he or she held with the Company or any of its subsidiaries. Mr. Cunningham and Glynis A. Bryan, the Chief Executive Officer and Chief Financial Officer of the Company, respectively, have also resigned from such positions in connection with the Merger. Pursuant to the Change in Control Agreements with certain executives, the Company recognized compensation expense of $16.4 million associated with the change in control during the four months and ten days ended May 10, 2007.
Following the completion of the Merger, the Company elected to be treated as an S Corporation, which resulted in an income tax benefit of $230.2 million associated with the partial reversal of previously recognized net deferred tax liabilities for the period after May 10, 2007.
| (24) | Loss per share |
The computation of basic and diluted loss per share is as follows:
| Four months and ten days | ||||
| ended May 10, 2007 | ||||
| (In thousands, except | ||||
| per share data) | ||||
| Net loss | $ | (30,422 | ) | |
| Weighted average shares: | ||||
| Common shares outstanding for basic and diluted loss per share | 75,159 | |||
| Basic and diluted loss per share | $ | (0.40 | ) | |
Potential common shares issuable upon exercise of outstanding stock options are excluded from diluted shares outstanding as their effect is antidilutive. All options outstanding at May 10, 2007 were cancelled and settled in conjunction with the Merger, as discussed in Note 15.
F-84
Table of Contents
Report of Independent Registered Public Accounting Firm
The Board of Directors
Swift Holdings Corp.:
We have audited the accompanying balance sheet of Swift Holdings Corp. (the Company), a wholly-owned subsidiary of Swift Corporation as of July 2, 2010. This financial statement is the responsibility of the Company’s management. Our responsibility is to express an opinion on this financial statement based on our audit.
We conducted our audit in accordance with the standards of the Public Company Accounting Oversight Board (United States). Those standards require that we plan and perform the audit to obtain reasonable assurance about whether the financial statements are free of material misstatement. An audit also includes examining, on a test basis, evidence supporting the amounts and disclosures in the financial statements. An audit also includes assessing the accounting principles used and significant estimates made by management, as well as evaluating the overall financial statement presentation. We believe that our audit provides a reasonable basis for our opinion.
In our opinion, the financial statement referred to above presents fairly, in all material respects, the financial position of Swift Holdings Corp. as of July 2, 2010 in conformity with U.S. generally accepted accounting principles.
/S/ KPMG LLP
Phoenix, Arizona
July 21, 2010
F-85
Table of Contents
| July 2, 2010 | ||||
ASSETS | ||||
| Cash | $ | 100 | ||
| Total assets | $ | 100 | ||
| LIABILITIES AND STOCKHOLDER’S EQUITY | ||||
| Stockholder’s equity: | ||||
| Common stock, par value $.01 per share | ||||
| Authorized 1,000 shares; 1,000 shares issued at July 2, 2010 | $ | 10 | ||
| Additional paid-in capital | 90 | |||
| Total stockholder’s equity | 100 | |||
| Total liabilities and stockholder’s equity | $ | 100 | ||
F-86
Table of Contents
Nature of business and basis of presentation
Swift Holdings Corp. (the “Company”), a wholly-owned subsidiary of Swift Corporation, was incorporated on May 20, 2010 (inception) with the authority to issue 1,000 shares of common stock, each having a par value of $0.01 in contemplation of an initial public offering. Swift Corporation is the holding company for Swift Transportation Co., LLC (a Delaware limited liability company, formerly Swift Transportation Co., Inc., a Nevada corporation) and its subsidiaries, a truckload carrier headquartered in Phoenix, Arizona, and Interstate Equipment Leasing, LLC. The Company has not engaged in any business or other activities, except in connection with its formation, and holds no assets and has no subsidiaries. The accompanying balance sheet has been prepared in accordance with U.S. generally accepted accounting principles (“GAAP”).
To fund the initial capitalization of Swift Holdings Corp., on July 2, 2010, Swift Holdings Corp. issued 1,000 shares of its common stock to Swift Corporation in consideration for $100 of initial capitalization proceeds received from Swift Corporation.
Management of the Company intends to merge Swift Corporation with and into the Company, with the Company surviving. In the merger, all of the outstanding common stock of Swift Corporation will be converted into shares of Swift Holdings Corp. common stock on a one-for-one basis.
Management has evaluated the effect on the Company’s reported financial condition of events subsequent to July 2, 2010 through the issuance of the financial statement on July 21, 2010.
F-87
Table of Contents
PRO FORMA CONDENSED CONSOLIDATED STATEMENT OF OPERATIONS (UNAUDITED)
FOR THE YEAR ENDED DECEMBER 31, 2007
FOR THE YEAR ENDED DECEMBER 31, 2007
| Swift | Interstate | Pro Forma | ||||||||||||||||||
| Swift | Transportation | Equipment | Adjustments | |||||||||||||||||
| Corporation(1) | Co., Inc.(2) | Leasing(3) | (4) | Pro Forma | ||||||||||||||||
| (In thousands) | ||||||||||||||||||||
| Operating revenue | $ | 2,180,293 | $ | 1,074,723 | $ | 12,394 | $ | (2,662 | )(a)(b) | $ | 3,264,748 | |||||||||
| Operating expenses: | ||||||||||||||||||||
| Salaries, wages and benefits | 611,811 | 364,690 | 1,328 | — | 977,829 | |||||||||||||||
| Operating supplies and expenses | 187,873 | 119,833 | 764 | (569 | )(a) | 307,901 | ||||||||||||||
| Fuel | 474,825 | 223,579 | 898 | — | 699,302 | |||||||||||||||
| Purchased transportation | 435,421 | 196,258 | — | (2,093 | )(b) | 629,586 | ||||||||||||||
| Rental expense | 51,703 | 20,089 | 7,016 | (552 | )(c) | 78,256 | ||||||||||||||
| Insurance and claims | 69,699 | 58,358 | 81 | — | 128,138 | |||||||||||||||
| Depreciation and amortization | 187,043 | 82,949 | 700 | 819 | (c) | |||||||||||||||
| 7,969 | (d) | |||||||||||||||||||
| 1,701 | (e) | 281,181 | ||||||||||||||||||
| Impairments | 256,305 | — | — | — | 256,305 | |||||||||||||||
| (Gain) loss on equipment disposal | (397 | ) | 130 | — | — | (267 | ) | |||||||||||||
| Communication and utilities | 18,625 | 10,473 | 18 | — | 29,116 | |||||||||||||||
| Operating taxes and licenses | 42,076 | 24,021 | 11 | — | 66,108 | |||||||||||||||
| Total operating expenses | 2,334,984 | 1,100,380 | 10,816 | 7,275 | 3,453,455 | |||||||||||||||
| Operating income (loss) | (154,691 | ) | (25,657 | ) | 1,578 | (7,275 | ) | (188,707 | ) | |||||||||||
| Interest expense | 171,115 | 9,454 | 348 | 92,268 | (f) | |||||||||||||||
| 2,185 | (f) | |||||||||||||||||||
| (9,625 | )(f) | 265,745 | ||||||||||||||||||
| Derivative interest expense (income) | 13,233 | (177 | ) | — | — | 13,056 | ||||||||||||||
| Interest income | (6,602 | ) | (1,364 | ) | (361 | ) | — | (8,327 | ) | |||||||||||
| Other (income) expenses | (1,933 | ) | 1,429 | 31 | — | (473 | ) | |||||||||||||
| Earnings (losses) before income taxes | (330,504 | ) | (34,999 | ) | 1,560 | (92,103 | ) | (458,708 | ) | |||||||||||
| Income tax (benefit) expense | (234,316 | ) | (4,577 | ) | — | — | (238,893 | ) | ||||||||||||
| Net earnings (loss) | $ | (96,188 | ) | $ | (30,422 | ) | $ | 1,560 | $ | (92,103 | ) | $ | (219,815 | ) | ||||||
2007 Results of Operations
Our actual financial results presented in accordance with GAAP for the year ended December 31, 2007 include the impact of the following transactions, referred to as the 2007 Transactions: (i) Jerry and Vickie Moyes’ April 7, 2007 contribution of 1,000 shares of common stock of Interstate Equipment Leasing, Inc. (now Interstate Equipment Leasing, LLC), or IEL, constituting all issued and outstanding shares of IEL to Swift Corporation, in exchange for 10,649,000 shares of Swift Corporation’s common stock, (ii) the May 9, 2007 contribution by Jerry Moyes and by Jerry and Vickie Moyes, jointly, the Jerry and Vickie Moyes Family Trust dated 12/11/87, and various Moyes children’s trusts of 28,792,810 shares of Swift Transportation Co., Inc. (now Swift Transportation Co., LLC), or Swift Transportation common stock, representing 38.3% of the then outstanding common stock of Swift Transportation, in exchange for 64,495,892 shares of Swift Corporation’s common stock, and (iii) Swift Corporation’s May 10, 2007 acquisition of Swift Transportation by a merger. Swift Corporation was formed in 2006 for the purpose of acquiring Swift Transportation. The results of Swift Transportation for the period from January 1, 2007 to May 10, 2007 are not included in our audited financial statements for the year ended December 31, 2007, included elsewhere in this prospectus. This lack of operational activity prior to May 11, 2007 impacts comparability between periods.
To facilitate comparability between periods, we utilize pro forma results of operations for 2007. The pro forma results of operations give effect to our acquisition of Swift Transportation and the related financing as if the transactions had occurred on January 1, 2007. Accordingly, our pro forma results of operations reflect a full year of operational activity for IEL and Swift Transportation as well as a full year of interest expense associated with the acquisition financing.
A-1
Table of Contents
Notes to Pro Forma Condensed Consolidated Statement of Operations (Unaudited):
| (1) | Reflects the GAAP consolidated statement of operations of Swift Corporation for the twelve months ended December 31, 2007, including Swift Transportation from May 11, 2007 to December 31, 2007 and IEL from April 7, 2007 to December 31, 2007. | |
| (2) | Reflects the consolidated GAAP statement of operations (loss) of Swift Transportation from January 1, 2007 to May 10, 2007, prior to its acquisition by Swift Corporation. | |
| (3) | Reflects the GAAP statement of operations for IEL from January 1, 2007 to April 6, 2007, prior to the contribution of its shares of capital stock to Swift Corporation. | |
| (4) | The pro forma adjustments to the consolidated statement of operations reflect the 2007 Transactions as if they occurred on January 1, 2007, including the following: | |
| (a) As of April 6, 2007, IEL operated a fleet of approximately 80 trucks for Swift Transportation Co. The adjustment reflects the elimination of 100% of IEL’s revenue and associated expenses from operating these trucks. | ||
| (b) Swift Transportation performs repair and maintenance on IEL-owned equipment and recognizes revenue for the total amount billed to IEL. The adjustment reflects the elimination of 100% of Swift Transportation revenue and associated expenses from these repairs. | ||
| (c) The $552 thousand reduction in rental expense and the $819 thousand increase in depreciation expense for certain operating leases in which the lessor did not consent to the transfer of the underlying lease to the surviving entity as if the 2007 Transactions occurred on January 1, 2007. | ||
| (d) The additional amortization of intangible assets of $8.0 million based on the allocation of a portion of the purchase price to intangible assets, including customer and owner-operator relationships as if the 2007 Transactions occurred on January 1, 2007. The customer relationship intangible is being amortized over fifteen years using the 150% declining balance method and the owner-operator relationship is being amortized using the straight-line method over three years. | ||
| (e) The $1.7 million of additional depreciation expense based on the increase in the estimated fair value of property and equipment associated with the preliminary allocation of the purchase price as if the 2007 Transactions occurred on January 1, 2007. | ||
| (f) The additional interest expense of $84.8 million as a result of (i) the $92.3 million increase in annual interest expense associated with the debt issued in connection with the 2007 Transactions, (ii) the $2.2 million increase in the interest expense associated with the amortization of deferred financing costs incurred with the issuance of the indebtedness and (iii) the $9.6 million elimination of annual interest expense associated with the repayment of Swift Transportation and IEL debt existing prior to the 2007 Transactions, along with the write-off of deferred financing costs associated with this debt as if the 2007 Transactions occurred on January 1, 2007. |
A-2
Table of Contents
shares
Swift Holdings Corp.
Class A common stock
PROSPECTUS
| Morgan Stanley | BofA Merrill Lynch | Wells Fargo Securities |
Until , 2010, all dealers that buy, sell, or trade in our Class A common stock, whether or not participating in this offering, may be required to deliver a prospectus. This is in addition to the dealers’ obligation to deliver a prospectus when acting as underwriters and with respect to their unsold allotments or subscriptions.
, 2010
Table of Contents
PART II
Information Not Required in Prospectus
| Item 13. | Other expenses of issuance and distribution. |
The following table sets forth the costs and expenses, other than underwriting discounts and commissions, to be paid by the Registrant in connection with the sale of the shares of Class A common stock being registered hereby. All amounts are estimates except for the SEC registration fee and the FINRA filing fee.
| Amount Paid or | ||||
to be Paid | ||||
| SEC registration fee | $ | 49,910 | ||
| FINRA filing fee | 75,500 | |||
| Stock exchange listing fees | * | |||
| Printing and engraving | * | |||
| Legal fees and expenses | * | |||
| Accounting fees and expenses | * | |||
| Blue sky fees and expenses | * | |||
| Transfer agent and registrar fees and expenses | * | |||
| Miscellaneous | * | |||
| Total | $ | * | ||
| * | To be filed by amendment. |
| Item 14. | Indemnification of directors and officers. |
Section 102(b)(7) of the Delaware General Corporation Law, or the DGCL, provides that a corporation may eliminate or limit the personal liability of a director to the corporation or its stockholders for monetary damages for breach of fiduciary duty as a director; provided that such provision shall not eliminate or limit the liability of a director (i) for any breach of the director’s duty of loyalty to the corporation or its stockholders, (ii) for acts or omissions not in good faith or which involve intentional misconduct or a knowing violation of law, (iii) under Section 174 of the DGCL (regarding, among other things, the payment of unlawful dividends), or (iv) for any transaction from which the director derived an improper personal benefit. The Registrant’s amended and restated certificate of incorporation includes a provision that eliminates the personal liability of directors for monetary damages for breach of fiduciary duty as a director to the fullest extent permitted by Delaware law.
In addition, the Registrant’s amended and restated certificate of incorporation also provides that the Registrant must indemnify its directors and officers to the fullest extent authorized by law. The Registrant is also expressly required to advance certain expenses to its directors and officers and to carry directors’ and officers’ insurance providing indemnification for its directors and officers for certain liabilities. The Registrant believes that these indemnification provisions and the directors’ and officers’ insurance are useful to attract and retain qualified directors and executive officers.
Section 145(a) of the DGCL empowers a corporation to indemnify any director, officer, employee, or agent, or former director, officer, employee, or agent, who was or is a party or is threatened to be made a party to any threatened, pending, or completed action, suit, or proceeding, whether civil, criminal, administrative, or investigative (other than an action by or in the right of the corporation) by reason of his service as a director, officer, employee, or agent of the corporation, or his service, at the corporation’s request, as a director, officer, employee, or agent of another corporation or enterprise, against expenses (including attorneys’ fees), judgments, fines, and amounts paid in settlement actually and reasonably incurred by such person in connection with such action, suit, or proceeding, provided that such director or officer acted in good faith and in a manner reasonably believed to be in or not opposed to the best interests of the corporation, and, with
II-1
Table of Contents
respect to any criminal action or proceeding; provided that such director or officer had no reasonable cause to believe his conduct was unlawful.
Section 145(b) of the DGCL empowers a corporation to indemnify any person who was or is a party or is threatened to be made a party to any threatened, pending, or completed action or suit by or in the right of the corporation to procure a judgment in its favor by reason of the fact that such person is or was a director, officer, employee, or agent of the corporation, or is or was serving at the request of the corporation as a director, officer, employee, or agent of another enterprise, against expenses (including attorneys’ fees) actually and reasonably incurred in connection with the defense or settlement of such action or suit; provided that such director or officer acted in good faith and in a manner he reasonably believed to be in or not opposed to the best interests of the corporation, except that no indemnification may be made in respect of any claim, issue, or matter as to which such director or officer shall have been adjudged to be liable to the corporation unless and only to the extent that the Delaware Court of Chancery or the court in which such action or suit was brought shall determine upon application that, despite the adjudication of liability but in view of all the circumstances of the case, such director or officer is fairly and reasonably entitled to indemnity for such expenses which the court shall deem proper. Notwithstanding the preceding sentence, except as otherwise provided in the bylaws, the Registrant is required to indemnify any such person in connection with a proceeding (or part thereof) commenced by such person only if the commencement of such proceeding (or part thereof) by any such person was authorized by the Registrant’s board of directors.
| Item 15. | Recent sales of unregistered securities. |
The Registrant is a Delaware corporation formed for the purpose of this offering and has not engaged in any business or other activities except in connection with its formation and the reorganization transactions described elsewhere in the prospectus that forms a part of this registration statement. In the three years preceding the filing of this registration statement, Swift Corporation issued the following securities that were not registered under the Securities Act of 1933, or the Securities Act.
On October 16, 2007, Swift Corporation granted 7.4 million stock options to employees at an exercise price of $12.50 per share. On August 27, 2008, Swift Corporation granted 1.0 million stock options to employees and nonemployee directors at an exercise price of $13.43 per share. On December 31, 2009, Swift Corporation granted 0.6 million stock options to employees at an exercise price of $6.89. Additionally, on February 25, 2010, Swift Corporation granted 1.8 million stock options to certain employees at an exercise price of $7.04 per share. The stock options described above were made under written compensatory plans or agreements in reliance on the exemption from registration pursuant to Rule 701 under the Securities Act or pursuant to Section 4(2) under the Securities Act.
| Item 16. | Exhibits and financial statement schedules. |
| (a) | Exhibits. |
| Exhibit | ||||
Number | Exhibit Title | |||
| 1 | .1 | Form of Underwriting Agreement* | ||
| 2 | .1 | Certificate of Merger by and between Swift Corporation and Swift Holdings Corp.* | ||
| 3 | .1 | Amended and Restated Certificate of Incorporation of Swift Holdings Corp.* | ||
| 3 | .2 | Amended and Restated Bylaws of Swift Holdings Corp.* | ||
| 4 | .1 | Specimen Class A Common Stock Certificate of Swift Holdings Corp.* | ||
| 5 | .1 | Opinion of Skadden, Arps, Slate, Meagher & Flom LLP* | ||
| 10 | .1 | Form of Swift Holdings Corp. Senior Secured Credit Facility* | ||
| 10 | .2 | Form of Registration Rights Agreement* | ||
| 10 | .3 | Purchase and Sale Agreement, dated July 30, 2008, among Swift Receivables Corporation II, Swift Transportation Corporation, Swift Intermodal Ltd., Swift Leasing Co., Inc. and Swift Receivables Corporation II | ||
II-2
Table of Contents
| Exhibit | ||||
Number | Exhibit Title | |||
| 10 | .4 | Receivables Sales Agreement, dated July 30, 2008 and as amended on November 6, 2009, among Swift Receivables Corporation II, Swift Transportation Corporation, Morgan Stanley Senior Funding, Inc., Wells Fargo Foothill, LLC and General Electric Capital Corporation | ||
| 10 | .5 | 2007 Swift Corporation Omnibus Incentive Plan, effective October 10, 2007 | ||
| 10 | .6 | Form of Option Award Notice | ||
| 10 | .7 | Swift Corporation Retirement Plan, effective January 1, 1992 | ||
| 10 | .8 | Swift Corporation Amended and Restated Deferred Compensation Plan, effective January 1, 2008 | ||
| 10 | .9 | Swift Corporation 2010 Performance Bonus Plan, effective January 1, 2010 | ||
| 21 | .1 | Subsidiaries of Swift Corporation | ||
| 23 | .1 | Consent of KPMG LLP | ||
| 23 | .2 | Consent of Skadden, Arps, Slate, Meagher & Flom LLP (included in Exhibit 5.1)* | ||
| 24 | .1 | Powers of Attorney (included on signature page) | ||
| * | To be filed by amendment |
(b) Financial statement schedules.
None.
| Item 17. | Undertakings. |
(1) Insofar as indemnification for liabilities arising under the Securities Act may be permitted to directors, officers, and controlling persons of the Registrant pursuant to the foregoing provisions, or otherwise, the Registrant has been advised that in the opinion of the Securities and Exchange Commission such indemnification is against public policy as expressed in the Act and is, therefore, unenforceable. In the event that a claim for indemnification against such liabilities (other than the payment by the Registrant of expenses incurred or paid by a director, officer, or controlling person of the Registrant in the successful defense of any action, suit, or proceeding) is asserted by such director, officer, or controlling person in connection with the securities being registered, the Registrant will, unless in the opinion of its counsel the matter has been settled by controlling precedent, submit to a court of appropriate jurisdiction the question whether such indemnification by it is against public policy as expressed in the Act and will be governed by the final adjudication of such issue.
(2) The undersigned registrant hereby undertakes that:
(a) For purposes of determining any liability under the Securities Act, the information omitted from the form of prospectus filed as part of this registration statement in reliance upon Rule 430A and contained in a form of prospectus filed by the Registrant pursuant to Rule 424(b)(1) or (4) or 497(h) under the Securities Act shall be deemed to be part of this registration statement as of the time it was declared effective.
(b) For the purpose of determining any liability under the Securities Act, each post effective amendment that contains a form of prospectus shall be deemed to be a new registration statement relating to the securities offered therein, and the offering of such securities at that time shall be deemed to be the initial bona fide offering thereof.
(3) The undersigned registrant hereby undertakes to provide to the underwriters at the closing specified in the underwriting agreement certificates in such denominations and registered in such names as required by the underwriters to permit prompt delivery to each purchaser.
II-3
Table of Contents
SIGNATURES
Pursuant to the requirements of the Securities Act of 1933, as amended, the registrant has duly caused this registration statement to be signed on its behalf by the undersigned, thereunto duly authorized, in the City of Phoenix, State of Arizona, on the 21st day of July, 2010.
SWIFT HOLDINGS CORP.
| By: | /s/ Jerry Moyes |
Jerry Moyes
Chief Executive Officer
Power of Attorney
KNOW ALL MEN BY THESE PRESENTS, that each person whose signature appears below hereby constitutes and appoints Jerry Moyes, Virginia Henkels and James Fry, and each of them, the true and lawful attorneys-in-fact and agents of the undersigned, with full power of substitution and resubstitution, for and in the name, place, and stead of the undersigned, to sign in any and all capacities (including, without limitation, the capacities listed below), the registration statement, any and all amendments (including post-effective amendments) to the registration statement and any and all successor registration statements of Swift Holdings Corp., including any filings pursuant to Rule 462(b) under the Securities Act of 1933 (the “Securities Act”), and to file the same, with all exhibits thereto, and all other documents in connection therewith, with the Securities and Exchange Commission (the “SEC”), and hereby grants to such attorneys-in-fact and agents full power and authority to do and perform each and every act and anything necessary to be done to enable Swift Holdings Corp. to comply with the provisions of the Securities Act and all the requirements of the SEC as fully to all intents and purposes as the undersigned might or could do in person, hereby ratifying and confirming all that said attorneys-in-fact and agents or his or her substitute or substitutes may lawfully do or cause to be done by virtue hereof.
Pursuant to the requirements of the Securities Act of 1933, this registration statement has been signed below by the following persons in the capacities and on the dates indicated.
Signature and Title | Date | |||
/s/ Jerry Moyes Jerry Moyes Chief Executive Officer and Director (Principal executive officer) | July 21, 2010 | |||
/s/ Virginia Henkels Virginia Henkels Executive Vice President and Chief Financial Officer (Principal financial officer) | July 21, 2010 | |||
/s/ Cary M. Flanagan Cary M. Flanagan Vice President and Corporate Controller (Principal accounting officer) | July 21, 2010 | |||
/s/ Richard H. Dozer Richard H. Dozer Director | July 21, 2010 | |||
/s/ David Vander Ploeg David Vander Ploeg Director | July 21, 2010 | |||
II-4
Table of Contents
EXHIBIT INDEX
| Exhibit | ||||
Number | Exhibit Title | |||
| 1 | .1 | Form of Underwriting Agreement* | ||
| 2 | .1 | Certificate of Merger by and between Swift Corporation and Swift Holdings Corp.* | ||
| 3 | .1 | Amended and Restated Certificate of Incorporation of Swift Holdings Corp.* | ||
| 3 | .2 | Amended and Restated Bylaws of Swift Holdings Corp.* | ||
| 4 | .1 | Specimen Class A Common Stock Certificate of Swift Holdings Corp.* | ||
| 5 | .1 | Opinion of Skadden, Arps, Slate, Meagher & Flom LLP* | ||
| 10 | .1 | Form of Swift Holdings Corp. Senior Secured Credit Facility* | ||
| 10 | .2 | Form of Registration Rights Agreement* | ||
| 10 | .3 | Purchase and Sale Agreement, dated July 30, 2008, among Swift Receivables Corporation II, Swift Transportation Corporation, Swift Intermodal Ltd., Swift Leasing Co., Inc. and Swift Receivables Corporation II | ||
| 10 | .4 | Receivables Sales Agreement, dated July 30, 2008 and as amended on November 6, 2009, among Swift Receivables Corporation II, Swift Transportation Corporation, Morgan Stanley Senior Funding, Inc., Wells Fargo Foothill, LLC and General Electric Capital Corporation | ||
| 10 | .5 | 2007 Swift Corporation Omnibus Incentive Plan, effective October 10, 2007 | ||
| 10 | .6 | Form of Option Award Notice | ||
| 10 | .7 | Swift Corporation Retirement Plan, effective January 1, 1992 | ||
| 10 | .8 | Swift Corporation Amended and Restated Deferred Compensation Plan, effective January 1, 2008 | ||
| 10 | .9 | Swift Corporation 2010 Performance Bonus Plan, effective January 1, 2010 | ||
| 21 | .1 | Subsidiaries of Swift Corporation | ||
| 23 | .1 | Consent of KPMG LLP | ||
| 23 | .2 | Consent of Skadden, Arps, Slate, Meagher & Flom LLP (included in Exhibit 5.1)* | ||
| 24 | .1 | Powers of Attorney (included on signature page) | ||
| * | To be filed by amendment |