Exhibit 99

April 22, 2013
Dear Fellow Stockholders of Swift Transportation Company (NYSE: SWFT),
A summary of our key results for the three months ended March 31 is shown below:
| | | | | | | | | | | | |
| | | Three Months Ended March 31, | |
| | | 2013 | | | 2012 | | | 2011 | |
| | | | | | Unaudited | | | | |
| | | ($ in millions, except per share data) | |
Operating Revenue | | $ | 856.8 | | | $ | 826.9 | | | $ | 758.9 | |
Revenue x FSR(1) | | $ | 686.5 | | | $ | 664.2 | | | $ | 621.1 | |
Operating Ratio | | | 92.8 | % | | | 93.0 | % | | | 93.8 | % |
Adjusted Operating Ratio(2) | | | 90.4 | % | | | 90.5 | % | | | 91.8 | % |
EBITDA | | $ | 118.1 | | | $ | 92.3 | | | $ | 102.3 | |
Adjusted EBITDA(2) | | $ | 123.6 | | | $ | 115.5 | | | $ | 104.7 | |
Diluted EPS(3) | | $ | 0.17 | | | $ | 0.04 | | | $ | 0.02 | |
Adjusted EPS(2)(3) | | $ | 0.21 | | | $ | 0.14 | | | $ | 0.06 | |
| 1 | Revenue xFSR is Operating Revenue, excluding fuel surcharge revenue |
| 2 | See GAAP to Non-GAAP reconciliation in the schedules following this letter |
| 3 | During the first quarter of 2013, we disposed of two non-operating real properties that resulted in a gain of $6.1 million, increasing both Adjusted and Diluted EPS by $0.03 |
Quarterly Highlights (discussed in more detail below, including GAAP to non-GAAP reconciliations):
| | • | First quarter 2013 Adjusted EPS increased to $0.21 versus $0.14 in the first quarter of 2012 and includes $0.03 related to gains on the sale of real property |
| | • | Truckload utilization improvements continue with weekly revenue xFSR per tractor improving 5.1% year over year |
| | • | Dedicated Adjusted Operating Ratio improved 280 basis points year over year resulting from business mix changes and operational improvements |
| | • | Intermodal Container on Flat Car volumes increased 20.8% in the first quarter of 2013 compared to the first quarter of 2012 |
| | • | Continued reduction in leverage ratio to 2.64 as of March 31, 2013 driven by reduction in Net Debt of $56.3 million during the quarter |
| | • | Completed amendment to Credit Agreement on March 7, 2013 reducing weighted average cost of debt |
| | | | |

| | 1 | | |
First Quarter Overview
For the quarter ended March 31, 2013, we generated record first quarter Operating Revenue of $856.8 million compared to $826.9 million in the same quarter of 2012. Our Revenue xFSR grew 3.4% to $686.5 million. Diluted earnings per share, in accordance with GAAP, increased to $0.17 in the first quarter of 2013 from $0.04 in the first quarter of 2012. In the first quarter of 2013 and 2012, Diluted earnings per share, in accordance with GAAP, included a pre-tax loss on debt extinguishment of $0.04 and $0.15 per share, respectively, associated with the refinancing of our senior secured credit facility. Adjusted diluted earnings per share, or Adjusted EPS, increased to $0.21 compared to $0.14 in the same quarter of 2012. Adjusted EPS in the first quarter of 2013 includes a $6.1 million pre-tax gain on the sale of real property, or $0.03 per share after-tax, consistent with our definition of Adjusted EPS. A reconciliation of GAAP results to non-GAAP results, as adjusted to exclude certain non-cash or special items per our definition of Adjusted EPS, is provided in the schedules following this letter.
We are pleased with our team’s ability to once again achieve positive year over year trends in our operational metrics this quarter. In the first quarter of 2013, our loaded miles per truck per week in our Truckload segment increased by 3.2% when compared to the first quarter of 2012. Additionally, we increased the combined total loaded miles for our Truckload and Dedicated segments by approximately 1.0% year over year in the first quarter, notwithstanding a 130 truck decrease in our average operational fleet. Both of these operational improvements were achieved notwithstanding a difficult year over year weather comparison, and less business days in the quarter due to the 2012 leap year and Easter falling in the first quarter of 2013 compared to being in the second quarter of 2012. We believe these operational improvements further demonstrate our organizational commitment to continue to improve our asset utilization and Return on Net Assets (RONA) metrics. In our Dedicated segment, we achieved a 280 basis point year over year improvement in our Adjusted Operating Ratio, driven by enhancements in business mix and a reduction in deadhead miles. We continued to focus on expanding our Intermodal segment, realizing a 20.8% increase in our Container on Flat Car (COFC) volumes, when compared to the first quarter of 2012. Fuel trends were volatile throughout the quarter, with January and February’s rising prices causing early quarter concerns throughout the industry; however, the benefit from falling fuel prices in the month of March mostly offset these early quarter challenges. Finally, our commitment to reduce our leverage remains a focus throughout the organization, demonstrated by our continual progress in reducing our leverage ratio. As of March 31, 2013, our leverage ratio was down to 2.64, largely driven by a reduction in Net Debt of $56.3 million during the quarter.
First Quarter Results by Reportable Segment
A summary of our year over year first quarter revenue trends and key metrics for our reportable segments are as follows:
Truckload Segment:
Our Truckload segment consists of one-way movements over irregular routes throughout the United States, Mexico, and Canada. This service uses both company and owner-operator tractors with dry van, flatbed, and other specialized trailing equipment.
Although we averaged 252 fewer trucks in the first quarter of 2013, as noted in the chart below, when compared to the first quarter of 2012, we were able to generate a 1.6% increase in Revenue xFSR for our Truckload segment by delivering more with less as we continue to focus on our asset utilization. Our Weekly Revenue xFSR per Tractor increased 5.1% year over year, reflecting a 3.2% increase in our utilization, as measured by loaded miles per truck per week and a 1.9% increase in our Revenue xFSR per loaded mile.
| | | | |
| | 2 | | |
| | | | | | | | | | | | |
| | | Three Months Ended March 31, | |
| | | 2013 | | | 2012 | | | 2011 | |
Operating Revenue(1) | | $ | 559.6 | | | $ | 551.2 | | | $ | 543.9 | |
Revenue xFSR(1)(2) | | $ | 441.3 | | | $ | 434.4 | | | $ | 437.2 | |
Operating Ratio | | | 92.4 | % | | | 91.6 | % | | | 94.7 | % |
Adjusted Operating Ratio(3) | | | 90.4 | % | | | 89.3 | % | | | 93.4 | % |
Weekly Revenue xFSR per Tractor | | $ | 3,182 | | | $ | 3,028 | | | $ | 2,798 | |
Average Operational Truck Count | | | 10,785 | | | | 11,037 | | | | 12,153 | |
Deadhead Percentage | | | 11.2 | % | | | 11.3 | % | | | 11.6 | % |
| 2 | Revenue xFSR is operating revenue, excluding fuel surcharge revenue |
| 3 | See GAAP to Non-GAAP reconciliation in the schedules following this letter |
The Adjusted Operating Ratio in our Truckload segment increased 110 basis points over the first quarter of 2012. This increase was driven primarily by a $5.2 million benefit from the favorable contract resolution with the Port of Los Angeles in the first quarter of 2012. Excluding this item, the margin improvement associated with the increase in Revenue xFSR per loaded mile and utilization mentioned above, combined with a slight reduction in deadhead offset the negative impact from the driver and owner operator pay changes we implemented during the second half of 2012, higher equipment costs, and increased expenses related to inclement weather.
Consistent with previous guidance, our average operational truck count was relatively flat in the first quarter 2013 when compared to the fourth quarter of 2012. For full year 2013, we expect fleet growth of approximately 200 to 300 trucks in our Truckload segment, but may adjust those figures based on freight volumes and overall economic conditions.
Dedicated Segment:
Through our Dedicated segment, we devote equipment and offer tailored solutions under long-term contracts. This dedicated business utilizes refrigerated, dry van, flatbed and other specialized trailing equipment.
| | | | | | | | | | | | |
| | | Three Months Ended March 31, | |
| | | 2013 | | | 2012 | | | 2011 | |
Operating Revenue(1) | | $ | 179.2 | | | $ | 171.5 | | | $ | 137.5 | |
Revenue xFSR(1)(2) | | $ | 144.8 | | | $ | 140.4 | | | $ | 115.8 | |
Operating Ratio | | | 89.4 | % | | | 91.5 | % | | | 90.2 | % |
Adjusted Operating Ratio(3) | | | 86.9 | % | | | 89.7 | % | | | 88.4 | % |
Weekly Revenue xFSR per Tractor | | $ | 3,385 | | | $ | 3,370 | | | $ | 3,310 | |
Average Operational Truck Count | | | 3,327 | | | | 3,205 | | | | 2,721 | |
| 2 | Revenue xFSR is operating revenue, excluding fuel surcharge revenue |
| 3 | See GAAP to Non-GAAP reconciliation in the schedules following this letter |
| | | | |
| | 3 | | |
Revenue xFSR for our Dedicated segment increased 3.1% during the first quarter of 2013, largely due to growth with our existing customers and the addition of new customer accounts, partially offset by the termination of a few underperforming customer contracts during the latter half of 2012 and the first quarter of 2013. As a result of this change in business mix and improvements in operational efficiencies, our Adjusted Operating Ratio in our Dedicated segment improved to 86.9% in the first quarter of 2013 from 89.7% in the first quarter of 2012.
Intermodal Segment:
Our Intermodal segment includes revenue generated by freight moving over the rail in our containers and other trailing equipment, combined with revenue for drayage to transport loads between the railheads and customer locations.
| | | | | | | | | | | | |
| | | Three Months Ended March 31, | |
| | | 2013 | | | 2012 | | | 2011 | |
Operating Revenue(1) | | $ | 77.3 | | | $ | 69.0 | | | $ | 47.5 | |
Revenue xFSR(1)(2) | | $ | 60.6 | | | $ | 54.6 | | | $ | 38.1 | |
Operating Ratio(4) | | | 102.3 | % | | | 105.8 | % | | | 98.5 | % |
Adjusted Operating Ratio(3)(4) | | | 103.0 | % | | | 107.4 | % | | | 98.1 | % |
Load Counts | | | 33,695 | | | | 30,710 | | | | 22,785 | |
Average Container Counts | | | 8,717 | | | | 6,317 | | | | 4,942 | |
| 2 | Revenue xFSR is operating revenue, excluding fuel surcharge revenue |
| 3 | See GAAP to Non-GAAP reconciliation in the schedules following this letter |
| 4 | During the first quarter of 2012, our Intermodal reportable segment incurred an increase in its insurance and claims expense associated with a drayage accident, which increased the Intermodal Operating Ratio by approximately 450 to 480 basis points, and increased the Adjusted Operating Ratio by approximately 570 to 600 basis points basis points for the three months ended March 31, 2012 as compared to the first quarters of 2011 and 2013 |
During the first quarter of 2013 our Intermodal segment continued its expansion with Revenue xFSR growth of 11.0% over the first quarter of 2012. This increase in Revenue xFSR was driven by a 9.7% increase in the number of loads hauled, combined with a 1.2% increase in Revenue xFSR per load. Loads in our Container on Flat Car (COFC) business grew 20.8% and our COFC Revenue xFSR per load grew 1.8%. This growth in COFC was partially offset by a 65.5% reduction in Trailer on Flat Car revenue (TOFC).
Our average container count grew by 38.0% to 8,717 in the first quarter of 2013 when compared to the same period in 2012, but remained unchanged from our container count at December 31, 2012. As stated in our prior quarter earnings call, during 2013 we expect to grow revenue by increasing the utilization of our current fleet before adding containers.
For the first quarter, the Intermodal Adjusted Operating Ratio improved to 103.0% in 2013 from 107.4% in 2012 due primarily to elevated insurance and claims expense resulting from one claim associated with a dray truck accident in the first quarter of 2012. This claim increased the Intermodal Operating Ratio by approximately 450 to 480 basis points, and the Adjusted Operating Ratio by approximately 570 to 600 basis points in the first quarter of 2012 compared to the first quarters of 2011 and 2013. The reduction in our Adjusted Operating Ratio associated with improved insurance and claims expense in the first quarter of 2013 was partially offset by higher expenses resulting from the larger container fleet and related chassis expenses compared to the first quarter of 2012.
| | | | |
| | 4 | | |
Other Revenue
Other Revenue includes revenue generated by our logistics and brokerage services as well as revenue generated by our subsidiaries offering support services to customers and owner-operators, including shop maintenance, equipment leasing, and insurance. In the first quarter of 2013, combined revenue from these services increased 5.7% compared to the same quarter in 2012, driven primarily by an increase in the services provided to owner-operators.
First Quarter Consolidated Operating Expenses
The table below highlights some of our cost categories for the first quarter of 2013, compared to the first quarter of 2012 and the fourth quarter of 2012, showing each as a percent of Revenue xFSR. Fuel surcharge revenue can be volatile and is primarily dependent upon the cost of fuel and not specifically related to our non-fuel operational expenses. Therefore, we believe that Revenue xFSR is a better measure for analyzing our expenses and operating metrics.
| | | | | | | | | | | | | | | | | | | | | | | | |
| | | | | | | YOY | | | | | | | | | | | QOQ | |
| Q1’ 13 | | | Q1’12 | | | Variance1 | | | ($ in millions) | | Q1’13 | | | Q4’12 | | | Variance1 | |
| $ | 856.8 | | | $ | 826.9 | | | | 3.6 | % | | Total Revenue | | $ | 856.8 | | | $ | 922.6 | | | | -7.1 | % |
| $ | (170.3 | ) | | $ | (162.7 | ) | | | 4.7 | % | | Less: Fuel Surcharge Revenue | | $ | (170.3 | ) | | $ | (182.7 | ) | | | -6.8 | % |
| | | | | | | | | | | | | | | | | | | | | | | | |
| $ | 686.5 | | | $ | 664.2 | | | | 3.4 | % | | Revenue x FSR | | $ | 686.5 | | | $ | 739.9 | | | | -7.2 | % |
| | | | | | | | | | | | | | | | | | | | | | | | |
| $ | 206.6 | | | $ | 200.1 | | | | -3.2 | % | | Salaries, Wages & Benefits | | $ | 206.6 | | | $ | 205.3 | | | | -0.6 | % |
| | 30.1 | % | | | 30.1 | % | | | 0 | bps | | % of Revenue xFSR | | | 30.1 | % | | | 27.7 | % | | | -240 | bps |
| $ | 60.7 | | | $ | 55.0 | | | | -10.2 | % | | Operating Supplies & Expenses | | $ | 60.7 | | | $ | 62.9 | | | | 3.6 | % |
| | 8.8 | % | | | 8.3 | % | | | -50 | bps | | % of Revenue xFSR | | | 8.8 | % | | | 8.5 | % | | | -30 | bps |
| $ | 27.8 | | | $ | 30.6 | | | | 9.2 | % | | Insurance & Claims | | $ | 27.8 | | | $ | 25.0 | | | | -11.2 | % |
| | 4.0 | % | | | 4.6 | % | | | 60 | bps | | % of Revenue xFSR | | | 4.0 | % | | | 3.4 | % | | | -60 | bps |
| $ | 6.1 | | | $ | 6.2 | | | | 2.5 | % | | Communications & Utilities | | $ | 6.1 | | | $ | 6.2 | | | | 2.1 | % |
| | 0.9 | % | | | 0.9 | % | | | 0 | bps | | % of Revenue xFSR | | | 0.9 | % | | | 0.8 | % | | | -10 | bps |
| $ | 15.5 | | | $ | 15.9 | | | | 2.3 | % | | Operating Taxes & Licenses | | $ | 15.5 | | | $ | 15.8 | | | | 1.7 | % |
| | 2.3 | % | | | 2.4 | % | | | 10 | bps | | % of Revenue xFSR | | | 2.3 | % | | | 2.1 | % | | | -20 | bps |
| 1 | Positive numbers represent favorable variances, negative numbers represent unfavorable variances |
Salaries wages and benefits increased $6.5 million to $206.6 million during the first quarter of 2013 compared to $200.1 million for the first quarter of 2012. This year over year increase resulted from the driver incentive pay implemented in the third quarter of 2012, growth in the number of non-driving employees, and additional workers compensation expense, resulting from an increase in reserves associated with unfavorable developments on our prior year loss layers. As a percent of Revenue xFSR, salaries, wages and benefits increased 240 basis points sequentially, primarily due to increased workers compensation expense and a decrease in freight revenue during the first quarter of 2013 consistent with historical seasonality experienced in the industry.
Operating supplies and expenses increased $5.7 million to $60.7 million during the first quarter of 2013 compared to $55.0 million for the first quarter of 2012. This year over year increase was primarily due to the $5.2 million favorable contract resolution with the Port of Los Angeles discussed in the first quarter of 2012.
| | | | |
| | 5 | | |
Insurance and claims expense decreased to $27.8 million for the first quarter of 2013 compared to $30.6 million in the first quarter of 2012. As a percent of Revenue xFSR, insurance and claims decreased to 4.0% in the first quarter of 2013 from 4.6% in the prior year. As we discussed previously, during the first quarter of 2012, we saw an increase in reserves associated with unfavorable development on our prior year loss layers, the majority of which related to two claims from 2006 and 2007. In addition, we typically see higher insurance costs as a percent of Revenues xFSR in the first half of the year and then lower in the second half as the actuarial models are refined for our current year experience. For full year 2013, we expect insurance and claims expense to be in the range of 3.6% to 3.8% of Revenue xFSR, which is consistent with previous guidance provided.
Fuel Expense
Fuel expense for the first quarter of 2013, noted in the chart below, was $151.9 million, representing a slight decrease from the first quarter of 2012. We collect fuel surcharge revenue from our customers to help mitigate increases in fuel prices. The surcharges are primarily based on the Department of Energy (D.O.E.) Diesel Fuel Index, which is set each week based on retail prices at various truck stops around the country. We utilize a portion of our fuel surcharge revenue to reimburse owner-operators and other third parties, such as the railroads, who also must pay for fuel. To evaluate the effectiveness of our fuel surcharges, we deduct the portion of the revenue we pay to third parties, and then subtract the remaining company-related fuel surcharge revenue from our fuel expense. This calculation of Net Fuel Expense is shown below.
| | | | | | | | | | | | | | | | |
| Q1’13 | | | Q1’12 | | | ($ in millions, except D.O.E Diesel Fuel Index) | | Q1’13 | | | Q4’12 | |
| $ | 151.9 | | | $ | 153.0 | | | Fuel Expense | | $ | 151.9 | | | $ | 152.1 | |
| | 17.7 | % | | | 18.5 | % | | % of Total Revenue | | | 17.7 | % | | | 16.5 | % |
| $ | 170.3 | | | $ | 162.7 | | | Fuel Surcharge Revenue (FSR) | | $ | 170.3 | | | $ | 182.7 | |
| $ | (71.5 | ) | | $ | (67.1 | ) | | Less: FSR Reimbursed to Third Parties | | $ | (71.5 | ) | | $ | (77.6 | ) |
| | | | | | | | | | | | | | | | |
| $ | 98.8 | | | $ | 95.6 | | | Company FSR | | $ | 98.8 | | | $ | 105.1 | |
| | | | | | | | | | | | | | | | |
| $ | 151.9 | | | $ | 153.0 | | | Fuel Expense | | $ | 151.9 | | | $ | 152.1 | |
| $ | (98.8 | ) | | $ | (95.6 | ) | | Less: Company FSR | | $ | (98.8 | ) | | $ | (105.1 | ) |
| | | | | | | | | | | | | | | | |
| $ | 53.1 | | | $ | 57.4 | | | Net Fuel Expense | | $ | 53.1 | | | $ | 47.0 | |
| | | | | | | | | | | | | | | | |
| | 7.7 | % | | | 8.6 | % | | % of Revenue xFSR | | | 7.7 | % | | | 6.3 | % |
| $ | 4.026 | | | $ | 3.960 | | | Average D.O.E Diesel Fuel Index | | $ | 4.026 | | | $ | 4.020 | |
| | 1.7 | % | | | 9.8 | % | | Year over Year % Change | | | 1.7 | % | | | 3.9 | % |
Net Fuel Expense decreased to $53.1 million in the first quarter of 2013 compared to $57.4 million in the same period in 2012. This decrease was primarily due to rapidly rising fuel prices throughout the first quarter of 2012 and the associated fuel surcharge lag. As we have stated previously, in periods of rising fuel prices, we are negatively impacted due to the structural lag in billing fuel surcharges. We bill based on the DOE average for the prior week but we pay on current day prices. The opposite is true during periods of fuel price declines. Through the first two months of 2013, the DOE average increased approximately $0.25 per gallon, similar to the negative trend we experienced in 2012, however, fuel prices declined during March of 2013, unlike March of 2012. This combined with improved fuel efficiency and fewer deadhead miles, partially offset by increased idle due to inclement weather, resulted in Net Fuel Expense as a percent of Revenue xFSR decreasing to 7.7% in the first quarter of 2013 from 8.6% in the prior year.
Sequentially, Net Fuel Expense increased $6.2 million for the first quarter of 2013 compared with the fourth quarter of 2012. This increase can be attributed to increased fuel usage due to inclement weather in the first quarter of 2013, the increase in fuel prices in the first quarter and the associated fuel surcharge recovery lag discussed above, compared with decreasing fuel costs in the fourth quarter of 2012.
| | | | |
| | 6 | | |
Purchased Transportation
Purchased transportation includes payments to owner-operators, railroads and other third parties we use for intermodal drayage and other brokered business.
| | | | | | | | | | | | | | | | |
| Q1’ 13 | | | Q1’ 12 | | | ($ in millions) | | Q1’ 13 | | | Q4’ 12 | |
| $ | 244.8 | | | $ | 233.2 | | | Purchased Transportation | | $ | 244.8 | | | $ | 265.4 | |
| | 28.6 | % | | | 28.2 | % | | % of Total Revenue | | | 28.6 | % | | | 28.8 | % |
| $ | (71.5 | ) | | $ | (67.1 | ) | | Less: FSR Reimbursed to Third Parties | | $ | (71.5 | ) | | $ | (77.6 | ) |
| | | | | | | | | | | | | | | | |
| $ | 173.3 | | | $ | 166.1 | | | Net Purchased Transportation | | $ | 173.3 | | | $ | 187.8 | |
| | 25.2 | % | | | 25.0 | % | | % of Revenue xFSR | | | 25.2 | % | | | 25.4 | % |
As noted in the table above, in the first quarter of 2013, purchased transportation increased $11.6 million over the first quarter of 2012. A portion of the payments made to our partners is for fuel reimbursements. Fuel reimbursements increased $4.4 million year over year, primarily associated with the growth in our intermodal business and an increase in reimbursements to owner-operators due to higher diesel prices.
During the first quarter of 2013, excluding fuel reimbursements, Net Purchased Transportation increased $7.2 million year over year due primarily to increased intermodal volumes. Sequentially, Net Purchased Transportation decreased $14.5 million due to lower seasonal freight volumes in the first quarter compared with the fourth quarter. As a percent of Revenue xFSR, Net Purchased Transportation was relatively consistent year over year and sequentially.
Rental Expense and Depreciation & Amortization of Property and Equipment
Due to fluctuations in the amount of tractors leased versus owned, we combine our rental expense with depreciation and amortization of property and equipment for analytical purposes as shown in the table below:
| | | | | | | | | | | | | | | | |
| Q1’13 | | | Q1’12 | | | ($ in millions) | | Q1’13 | | | Q4’12 | |
| $ | 29.3 | | | $ | 23.5 | | | Rental Expense | | $ | 29.3 | | | $ | 30.0 | |
| | 4.3 | % | | | 3.5 | % | | % of Revenue x FSR | | | 4.3 | % | | | 4.1 | % |
| $ | 50.3 | | | $ | 50.4 | | | Depreciation & Amortization of Property and Equipment | | $ | 50.3 | | | $ | 49.8 | |
| | 7.3 | % | | | 7.6 | % | | % of Revenue xFSR | | | 7.3 | % | | | 6.7 | % |
| | | | | | | | | | | | | | | | |
| $ | 79.6 | | | $ | 73.9 | | | Combined Rental Expense and Depreciation | | $ | 79.6 | | | $ | 79.7 | |
| | 11.6 | % | | | 11.1 | % | | % of Revenue xFSR | | | 11.6 | % | | | 10.8 | % |
Combined rental and depreciation expense in the first quarter of 2013 increased $5.7 million to $79.6 million from the first quarter of 2012. This increase is due to the rising costs of new equipment, growth in the number of trailers and intermodal containers and a higher percentage of leased assets which drives rent expense higher due to the inclusion of financing costs. Sequentially, the combined rental and depreciation expense in the first quarter of 2013 was consistent with the fourth quarter of 2012.
| | | | |
| | 7 | | |
Gain on Disposal of Property and Equipment
Gain on disposal of property and equipment decreased to $2.4 million in the first quarter of 2013 compared to $4.4 million in the first quarter of 2012 primarily due to a reduction in the amount of equipment disposed of during the quarter.
Gain on Sale of Real Property
During the first quarter of 2013, we disposed of two non-operating properties in Wilmington, CA and Phoenix, AZ, resulting in a gain of $6.1 million.
Loss on Debt Extinguishment
On March 7, 2013, we entered into the Second Amended and Restated Credit Agreement (“2013 Agreement”). The 2013 Agreement replaced the then-existing first lien term loan B-1 and B-2 tranches under the Amended and Restated Credit Agreement (“2012 Agreement”) entered into on March 6, 2012 with outstanding principal balances of $152.0 million and $508.0 million, respectively, with new first lien term loan B-1 and B-2 tranches with face values of $250.0 million and $410.0 million, respectively. The replacement of the 2012 Agreement resulted in a loss on debt extinguishment of $5.0 million in the first quarter of 2013, representing the write-off of the unamortized original issue discount and deferred financing fees associated with the 2012 Agreement. In the first quarter of 2012, we entered into the 2012 Agreement which replaced the then-existing, remaining $874 million face value first lien term loan, resulting in a loss on debt extinguishment of $20.9 million in the first quarter of 2012, representing the write-off of the unamortized original issue discount and deferred financing fees associated with the original term loan.
Income Taxes
The income tax provision in accordance with GAAP for the first quarter of 2013 was $14.6 million, resulting in an effective tax rate of 38.5%, which is in line with the guidance provided in our fourth quarter letter to stockholders. As stated previously, for all periods through 2012 and prior, we used a normalized tax rate of 39.0% in our Adjusted EPS calculation due to the amortization of deferred tax assets related to our pre-IPO interest rate swap amortization and other items that we knew would cause fluctuations in our GAAP effective tax rate. In 2013, we expect these items to no longer cause large variations, therefore beginning with the first quarter and going forward we will be using our GAAP effective tax rate for our Adjusted EPS calculation. We expect our 2013 full year effective tax rate, in accordance with GAAP, to be approximately 38.5%.
Interest Expense and Debt Balances
Interest expense, comprised of debt interest expense, the amortization of deferred financing costs and original issue discount, and excluding amortization of previous losses on our terminated interest rate swaps, decreased by $7.2 million in the first quarter of 2013 to $25.6 million, compared with $32.8 for the first quarter of 2012. The decrease was largely due to lower interest rates from refinancing our senior credit facility in March of 2012 and 2013 as well as the continued reduction of our debt balances, which has been an area of focus since our initial public offering in December 2010.
During the first quarter of 2013, we made voluntary payments of $5.5 million on our Term Loan B-1 and $69.0 million on our Term Loan B-2, as noted in the chart below. Additionally, as discussed above, on March 7, 2013, we entered into a Second Amended and Restated Credit Agreement (the “2013 Agreement”). In addition to the changes in face value between the first lien term loan B-1 and B-2 tranches, the 2013 Agreement reduces the interest rate applicable to the first lien term loan B-1 tranche to the LIBOR rate plus 2.75% with no LIBOR floor, down from the LIBOR rate plus 3.75% with no LIBOR floor, and reduces the interest rate applicable to the first lien term loan B-2 tranche to the LIBOR rate plus 3.00% with a 1.00% LIBOR floor, down from the LIBOR rate plus 3.75% with a 1.25% LIBOR floor.
| | | | |
| | 8 | | |
| | | | | | | | | | | | | | | | | | | | |
| | | Dec 31,
2012 | | | Q1 2013 | | | Balance Prior
to | | | Q1 | | | Mar 31,
2013 | |
| ($ in millions) | | Actuals | | | Changes | | | 2013 Agreement | | | 2013 Agreement | | | Actuals | |
Unrestricted Cash | | $ | 53.6 | | | $ | (14.9 | ) | | $ | 38.7 | | | | | | | $ | 38.7 | |
A/R Securitization | | $ | 204.0 | | | | | | | $ | 204.0 | | | | | | | $ | 204.0 | |
Revolver ($400mm) | | $ | — | | | | | | | $ | — | | | | | | | $ | — | |
Term Loan B-1(a) | | $ | 157.5 | | | $ | (5.5 | ) | | $ | 152.0 | | | $ | 98.0 | | | $ | 250.0 | |
Term Loan B-2(a) | | $ | 577.0 | | | $ | (69.0 | ) | | $ | 508.0 | | | $ | (98.0 | ) | | $ | 410.0 | |
Senior Secured 2nd Lien Notes(a) | | $ | 500.0 | | | | | | | $ | 500.0 | | | | | | | $ | 500.0 | |
Capital Leases & Other Debt | | $ | 145.8 | | | $ | 3.3 | | | $ | 149.1 | | | | | | | $ | 149.1 | |
| | | | | | | | | | | | | | | | | | | | |
Total Debt | | $ | 1,584.3 | | | $ | (71.2 | ) | | $ | 1,513.1 | | | $ | — | | | $ | 1,513.1 | |
| | | | | | | | | | | | | | | | | | | | |
Net Debt | | $ | 1,530.7 | | | $ | (56.3 | ) | | $ | 1,474.4 | | | $ | — | | | $ | 1,474.4 | |
| | | | | | | | | | | | | | | | | | | | |
| (a) | Amounts presented represent face value |
As we have stated previously, our goal is to continue to reduce our leverage ratio through EBITDA growth and debt repayments. The first quarter prepayments of $74.5 million discussed above, partially offset by a decrease in our unrestricted cash and other changes, resulted in a reduction of Net Debt by $56.3 million in the first quarter of 2013. Additionally, we made a $12.0 million prepayment on the term loan B-1 tranche on April 10, 2013 keeping us on track to achieve the upper end of our stated goal of $50—$100 million of Net Debt reduction per year. From the end of 2010 through the first quarter of 2013, our total reduction in Net Debt has been approximately $445 million. As a result of our various voluntary prepayments, our next required principal payment on our Term Loan B-1 is December 31, 2014, and we have no additional required principal payments on our Term Loan B-2 until its maturity in December of 2017.
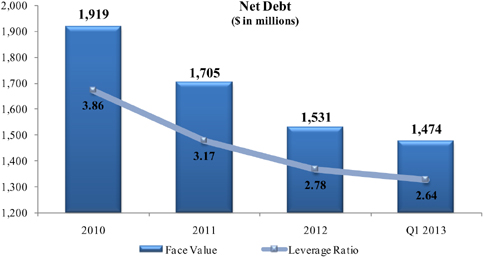
The debt repayments, combined with the improvement in earnings in the first quarter, enabled us to reduce our leverage ratio to 2.64:1.00 as of March 31, 2013. This ratio triggers a step down in the interest rates applicable to our revolving credit facility from LIBOR plus 3.25% to LIBOR plus 3.00% effective with the submission of our first quarter 2013 compliance certificate to the banks.
| | | | |
| | 9 | | |
Cash Flow and Capital Expenditures
We continue to generate positive cash flows from operations. For the first quarter of 2013, we generated $96.9 million of cash from operations compared with $70.2 million in the first quarter of 2012. Our 2013 Net Cash Capital Expenditures were $47.6 million. Cash used in financing activities through March 31, 2013 was $85.8 million, primarily driven by the voluntary repayments of our debt. For the full year of 2013, we are still expecting our net cash capital expenditures to be approximately $250 million which includes growth in the tractor fleet of 300 to 500 units.
| | | | | | | | |
| ($ in millions) | | Q1
2013 | | | Q1
2012 | |
Net Cash Capital Expenditures | | $ | 47.6 | | | $ | 10.4 | |
Addback: Proceeds from Sales | | | 10.0 | | | | 33.9 | |
| | | | | | | | |
Gross Cash Capital Expenditures | | $ | 57.6 | | | $ | 44.3 | |
Capital Leases | | $ | 13.8 | | | $ | 17.1 | |
Operating Leases | | | 17.9 | | | | 58.1 | |
| | | | | | | | |
Capital & Operating Lease Total | | $ | 31.7 | | | $ | 75.2 | |
| | | | | | | | |
Gross Investment in Equipment & Facilities | | $ | 89.3 | | | $ | 119.5 | |
| | | | | | | | |
Original Value of Expired Leases
| | | | | | | | |
| | |
| ($ Millions) | | Q1
2013 | | | Q1
2012 | |
Capital Leases | | $ | 10.7 | | | $ | 0.2 | |
Operating Leases | | | 7.9 | | | | 10.6 | |
| | | | | | | | |
Total | | $ | 18.6 | | | $ | 10.8 | |
| | | | | | | | |
Liquidity Summary
Our liquidity position, at March 31, 2013, remains strong with total available liquidity of $423.8 million available, including $38.7 million of unrestricted cash and $74.8 million of restricted cash and investments in our captive insurance companies that are reserved for the future payment of outstanding claims. Our $400.0 million revolving credit facility remains undrawn, although we had $148.1 million of letters of credit outstanding primarily for insurance collateral purposes, leaving $251.9 million available. We also had $58.4 million available on our accounts receivable securitization facility.
| | | | |
| | 10 | | |
Summary
Despite the typical seasonal patterns in the first quarter, combined with a difficult year over year weather comparison and a reduction in business days, we are pleased with the results our organization has been able to deliver this quarter. Our key trucking metrics are trending favorably, and we have seen revenue growth in each of our operating segments. We again delivered on our commitment to pay down our debt, with a $56.3 million Net Debt reduction this quarter. Consistent with our previous guidance, we expect our growth in Adjusted EPS to be in the range of 10% -15% for the full year 2013 as compared to 2012. We continue to believe that our near and long term goals for improving Adjusted EPS, return on net assets, and leverage ratio, combined with our ongoing focus of exercising discipline in all aspects of our business, should enable us to generate returns for you, our stockholders.
Sincerely,
| | | | |
 | |  | |  |
Jerry Moyes Chief Executive Officer | | Richard Stocking Chief Operating Officer | | Ginnie Henkels Chief Financial Officer |
Guidance Contained in the Letter
| | • | Full year 2013 Net Cash Capital Expenditures expected to be approximately $250 million |
| | • | Growth of 300 – 500 tractors expected for the full year 2013 with 200 – 300 in Truckload and 100 – 200 in Dedicated |
| | • | Adjusted EPS growth of 10%—15% for the full year 2013 |
| | • | Insurance and claims expense expected to be between 3.6%—3.8% of Revenue xFSR |
| | • | Targeting high end of the range previously communicated of $50 to $100 million Net Debt reduction for the full year 2013 |
Swift 2013 Investor / Analyst Day at the NYSE
We invite you to join us on May 10, 2013 for our annual Investor / Analyst day. This year’s event will be held at the New York Stock Exchange from 9:00am to 11:00am, with refreshments and coffee provided beginning at 8:30am. We encourage you to join us for an opportunity to hear presentations from, as well as ask questions of, various members of Swift’s executive management team. Space is limited, so please be sure to RSVP by sending an email with your full name, title, and company name toInvestorDay2013@swifttrans.com.
| | | | |
| | 11 | | |
Conference Call Q&A Session
Swift Transportation management will host a Q&A session at 11:00 a.m. Eastern Daylight Time on Tuesday, April 23rd to answer questions about the Company’s financial results. Please email your questions toInvestor_Relations@swifttrans.com prior to 7:00 p.m. Eastern Daylight Time on Monday, April 22nd.
Participants may access the call using the following dial-in numbers:
U.S./Canada: (877) 897-8479
International/Local: (706) 501-7951
Conference ID: 30435498
The live webcast, letter to stockholders, transcript of the Q&A, and the replay of the earnings Q&A session can be accessed via our investor relations website atir.swifttrans.com.
IR Contact:
Jason Bates
Vice President of Finance &
Investor Relations Officer
623.907.7335
Forward Looking Statements & Use of Non-GAAP Measures
This letter contains statements that may constitute forward-looking statements, which are based on information currently available, usually identified by words such as “anticipates,” “believes,” “estimates”, “plans,” “projects,” “expects,” “hopes,” “intends,” “will,” “could,” “should,” “may,” or similar expressions which speak only as of the date the statement was made. Such forward-looking statements are made pursuant to the safe harbor provisions of the Private Securities Litigation Reform Act of 1995. Such statements include, but are not limited to, statements concerning: trends relating to our operations, growth in current customer base, addition of new customer accounts, freight volumes, leverage, utilization, revenue, expenses, seasonal freight fluctuations and demand patterns, fleet size and composition between company and owner-operator trucks, profitability and related metrics; the timing and level of fleet size and equipment and container count; growth in Truckload and Dedicated tractor count; expected insurance claims expense as a percentage of Revenue xFSR; our expected effective tax rate; growth in dedicated segment revenue in 2013; estimated net cash capital expenditures for 2013; our expectations of intermodal growth; our intentions to use excess cash flows to repay debt; increasing returns on net assets; expected earnings per share growth in 2013; and the impact of operating initiatives we have undertaken and the ability to generate returns for shareholders. Such forward-looking statements are inherently uncertain, and are based upon the current beliefs, assumptions and expectations of Company management and current market conditions, which are subject to significant risks and uncertainties as set forth in the Risk Factor Section of our Annual Report Form 10-K for the year ended December 31, 2012. As to the Company’s business and financial performance, the following factors, among others, could cause actual results to differ materially from those in forward-looking statements: any future recessionary economic cycles and downturns in customers’ business cycles, particularly in market segments and industries in which we have a significant concentration of customers; increasing competition from trucking, rail, intermodal, and brokerage competitors; a significant reduction in, or termination of, our trucking services by a key customer; a significant reduction in, or termination of, our trucking services by a key customer; the amount and velocity of changes in fuel prices and our ability to recover fuel prices through our fuel surcharge program; volatility in the price or availability of fuel; increases in new equipment prices or replacement costs; the regulatory environment in which we operate, including existing regulations and changes in existing regulations, or violations by us of existing or future regulations; our Compliance Safety Accountability safety rating; increases in driver compensation to the extent not offset by increases in freight rates and difficulties in driver recruitment and retention; changes in rules or legislation by the National Labor Relations Board or Congress and/or union organizing efforts; potential volatility or decrease in the amount of earnings as a result of our claims exposure through our wholly-owned captive insurance companies; risks relating to our captive insurance companies; uncertainties associated with our operations in Mexico; our ability to attract and maintain relationships with owner-operators; the possible re-classification of our owner-operators as employees; our ability to retain or replace key personnel; conflicts of interest or potential litigation that may arise from other businesses owned by Jerry Moyes, including pledges of Swift stock and guarantees related to other businesses by Jerry Moyes; our dependence on fourth parties for intermodal and brokerage business; our ability to sustain cost savings realized as part of recent cost reduction initiatives; potential failure in computer or communications systems; our ability to execute or integrate any future acquisitions successfully; seasonal factors such as harsh weather conditions that increase operating costs; goodwill impairment; the potential impact of the significant number of shares of our common stock that is outstanding; our intention to not pay dividends; demand ; our significant ongoing capital requirements; our level of indebtedness and our ability to service our outstanding indebtedness, including compliance with our indebtedness covenants, and the impact such indebtedness may have on the way we operate our business; the significant amount of our stock and related control over the Company by Jerry Moyes; and restrictions contained in our debt agreements. You should understand that many important factors, in addition to those listed above and in our filings with the SEC, could impact us financially. As a result of these and other factors, actual results may differ from those set forth in the forward-looking statements and the prices of the Company’s securities may fluctuate dramatically. The Company makes no commitment, and disclaims any duty, to update or revise any forward-looking statements to reflect future events, new information or changes in these expectations. In addition to our GAAP results, this Letter to Stockholders also includes certain non-GAAP financial measures as defined by the SEC. The calculation of each measure, including a reconciliation to the most closely related GAAP measure and the reasons management believes each non-GAAP measure is useful, are included in the attached schedules.
| | | | |
| | 12 | | |
CONSOLIDATED STATEMENTS OF OPERATIONS (UNAUDITED)
THREE MONTHS ENDED MARCH 31, 2013 AND 2012
| | | | | | | | |
| | | Three Months Ended
March 31, | |
| | | 2013 | | | 2012 | |
| | | (Amounts in thousands,
except per share data) | |
Operating revenue | | $ | 856,794 | | | $ | 826,885 | |
| | | | | | | | |
Operating expenses: | | | | | | | | |
Salaries, wages and employee benefits | | | 206,607 | | | | 200,135 | |
Operating supplies and expenses | | | 60,665 | | | | 55,042 | |
Fuel | | | 151,882 | | | | 153,003 | |
Purchased transportation | | | 244,817 | | | | 233,202 | |
Rental expense | | | 29,251 | | | | 23,499 | |
Insurance and claims | | | 27,771 | | | | 30,580 | |
Depreciation and amortization of property and equipment | | | 50,332 | | | | 50,394 | |
Amortization of intangibles | | | 4,204 | | | | 4,303 | |
Impairments | | | — | | | | 1,065 | |
Gain on disposal of property and equipment | | | (2,354 | ) | | | (4,390 | ) |
Communication and utilities | | | 6,092 | | | | 6,246 | |
Operating taxes and licenses | | | 15,540 | | | | 15,904 | |
| | | | | | | | |
Total operating expenses | | | 794,807 | | | | 768,983 | |
| | | | | | | | |
Operating income | | | 61,987 | | | | 57,902 | |
| | | | | | | | |
Other (income) expenses: | | | | | | | | |
Interest expense | | | 25,574 | | | | 32,776 | |
Derivative interest expense | | | 562 | | | | 2,545 | |
Interest income | | | (573 | ) | | | (397 | ) |
Loss on debt extinguishment | | | 5,044 | | | | 20,940 | |
Gain on sale of real property | | | (6,078 | ) | | | — | |
Other | | | (496 | ) | | | (602 | ) |
| | | | | | | | |
Total other (income) expenses, net | | | 24,033 | | | | 55,262 | |
| | | | | | | | |
Income before income taxes | | | 37,954 | | | | 2,640 | |
Income tax expense (benefit) | | | 14,613 | | | | (3,548 | ) |
| | | | | | | | |
Net income | | $ | 23,341 | | | $ | 6,188 | |
| | | | | | | | |
Basic earnings per share | | $ | 0.17 | | | $ | 0.04 | |
| | | | | | | | |
Diluted earnings per share | | $ | 0.17 | | | $ | 0.04 | |
| | | | | | | | |
Shares used in per share calculations | | | | | | | | |
Basic | | | 139,686 | | | | 139,509 | |
| | | | | | | | |
Diluted | | | 141,259 | | | | 140,392 | |
| | | | | | | | |
| | | | |
| | 13 | | |
ADJUSTED EPS RECONCILIATION (UNAUDITED) (a)
THREE MONTHS ENDED MARCH 31, 2013, 2012 AND 2011
| | | | | | | | | | | | |
| | | Three Months Ended
March 31, | |
| | | 2013 | | | 2012 | | | 2011 | |
Diluted earnings per share | | $ | 0.17 | | | $ | 0.04 | | | $ | 0.02 | |
Adjusted for: | | | | | | | | | | | | |
Income tax expense (benefit) | | | 0.10 | | | | (0.03 | ) | | | 0.02 | |
| | | | | | | | | | | | |
Income before income taxes | | | 0.27 | | | | 0.02 | | | | 0.04 | |
| | | | | | | | | | | | |
Non-cash impairments (b) | | | — | | | | 0.01 | | | | — | |
Loss on debt extinguishment (c) | | | 0.04 | | | | 0.15 | | | | — | |
Amortization of certain intangibles (d) | | | 0.03 | | | | 0.03 | | | | 0.03 | |
Amortization of unrealized losses on interest rate swaps (e) | | | — | | | | 0.02 | | | | 0.03 | |
| | | | | | | | | | | | |
Adjusted income before income taxes | | | 0.33 | | | | 0.22 | | | | 0.10 | |
Provision for income tax expense at normalized effective rate | | | 0.13 | | | | 0.09 | | | | 0.04 | |
| | | | | | | | | | | | |
Adjusted EPS | | $ | 0.21 | | | $ | 0.14 | | | $ | 0.06 | |
| | | | | | | | | | | | |
| (a) | We define Adjusted EPS as (1) income (loss) before income taxes plus (i) amortization of the intangibles from our 2007 going-private transaction, (ii) non-cash impairments, (iii) other special non-cash items, (iv) excludable transaction costs, (v) the mark-to-market adjustment on our interest rate swaps that is recognized in the statement of operations in a given period, and (vi) the amortization of previous losses recorded in accumulated other comprehensive income (loss) (“OCI”) related to the interest rate swaps we terminated upon our IPO and refinancing transactions in December 2010; (2) reduced by income taxes; (3) divided by weighted average diluted shares outstanding. For all periods through 2012, we used a normalized tax rate of 39% in our Adjusted EPS calculation due to the amortization of deferred tax assets related to our pre-IPO interest rate swap amortization and other items that we knew would cause fluctuations in our GAAP effective tax rate. Beginning in 2013, we no longer expect these items to result in large variations. Therefore, we will use our GAAP effective tax rate for our Adjusted EPS calculation beginning in 2013. We believe the presentation of financial results excluding the impact of the items noted above provides a consistent basis for comparing our results from period to period and to those of our peers due to the non-comparable nature of the intangibles from our going-private transaction, the historical volatility of the interest rate derivative agreements and the non-operating nature of the impairment charges, transaction costs and other adjustment items. Adjusted EPS is not presented in accordance with GAAP and should be considered in addition to, not as a substitute for, or superior to, measures of financial performance in accordance with GAAP. The numbers reflected in the above table are calculated on a per share basis and may not foot due to rounding. |
| (b) | Real property with a carrying amount of $1.7 million was written down to its fair value of $0.6 million, resulting in a pre-tax impairment charge of $1.1 million in the first quarter of 2012. |
| (c) | On March 7, 2013, the Company entered into a Second Amended and Restated Credit Agreement (“2013 Agreement”). The 2013 Agreement replaced the then-existing first lien term loan B-1 and B-2 tranches under the Amended and Restated Credit Agreement (“2012 Agreement”) entered into on March 6, 2012 with outstanding principal balances of $152.0 million and $508.0 million, respectively, with new first lien term loan B-1 and B-2 tranches with face values of $250.0 million and $410.0 million, respectively. The replacement of the 2012 Agreement resulted in a loss on debt extinguishment of $5.0 million in the first quarter of 2013, representing the write-off of the unamortized original issue discount and deferred financing fees associated with the 2012 Agreement. The Company entered into the 2012 Agreement on March 6, 2012, which replaced the then-existing, remaining $874 million face value first lien term loan, maturing in December 2016, resulting in a loss on debt extinguishment of $20.9 million in the first quarter of 2012 representing the write-off of the unamortized original issue discount and deferred financing fees associated with the original term loan. |
| (d) | Amortization of certain intangibles reflects the non-cash amortization expense of $3.9 million, $4.0 million, and $4.4 million for the three months ended March 31, 2013, 2012 and 2011, respectively, relating to intangible assets identified in the 2007 going-private transaction through which Swift Corporation acquired Swift Transportation Co. |
| (e) | Amortization of unrealized losses on interest rate swaps reflects the non-cash amortization expense of $2.5 million and $4.7 million for the three months ended March 31, 2012 and 2011, respectively, included in derivative interest expense in the consolidated statements of operations and is comprised of previous losses recorded in accumulated other comprehensive income related to the interest rate swaps we terminated upon our IPO and concurrent refinancing transactions in December 2010. Such losses were incurred in prior periods when hedge accounting applied to the swaps and were expensed in relation to the hedged interest payments through the original maturity of the swaps in August 2012. |
| | | | |
| | 14 | | |
ADJUSTED OPERATING INCOME AND OPERATING RATIO RECONCILIATION (UNAUDITED) (a)
THREE MONTHS ENDED MARCH 31, 2013, 2012 AND 2011
| | | | | | | | | | | | |
| | | Three Months Ended
March 31, | |
| | | 2013 | | | 2012 | | | 2011 | |
| | | (Amounts in thousands) | |
Operating revenue | | $ | 856,794 | | | $ | 826,885 | | | $ | 758,889 | |
Less: Fuel surcharge revenue | | | 170,286 | | | | 162,714 | | | | 137,817 | |
| | | | | | | | | | | | |
Revenue xFSR | | | 686,508 | | | | 664,171 | | | | 621,072 | |
| | | | | | | | | | | | |
Operating expense | | | 794,807 | | | | 768,983 | | | | 712,160 | |
Adjusted for: | | | | | | | | | | | | |
Fuel surcharge revenue | | | (170,286 | ) | | | (162,714 | ) | | | (137,817 | ) |
Amortization of certain intangibles (b) | | | (3,912 | ) | | | (4,011 | ) | | | (4,435 | ) |
Non-cash impairments (c) | | | — | | | | (1,065 | ) | | | — | |
| | | | | | | | | | | | |
Adjusted operating expense | | | 620,609 | | | | 601,193 | | | | 569,908 | |
| | | | | | | | | | | | |
Adjusted operating income | | $ | 65,899 | | | $ | 62,978 | | | $ | 51,164 | |
| | | | | | | | | | | | |
Adjusted Operating Ratio | | | 90.4 | % | | | 90.5 | % | | | 91.8 | % |
Operating Ratio | | | 92.8 | % | | | 93.0 | % | | | 93.8 | % |
| (a) | We define Adjusted Operating Ratio as (a) total operating expenses, less (i) fuel surcharges, (ii) amortization of the intangibles from our 2007 going-private transaction, (iii) non-cash impairment charges, (iv) other special non-cash items, and (v) excludable transaction costs, as a percentage of (b) total revenue excluding fuel surcharge revenue. We believe fuel surcharge is sometimes volatile and eliminating the impact of this source of revenue (by netting fuel surcharge revenue against fuel expense) affords a more consistent basis for comparing our results of operations. We also believe excluding impairments, non-comparable nature of the intangibles from our going-private transaction and other special items enhances the comparability of our performance from period to period. Adjusted Operating Ratio is not a recognized measure under GAAP. Adjusted Operating Ratio should be considered in addition to, not as a substitute for, or superior to, measures of financial performance in accordance with GAAP. |
| (b) | Amortization of certain intangibles reflects the non-cash amortization expense of $3.9 million, $4.0 million, and $4.4 million for the three months ended March 31, 2013, 2012 and 2011, respectively, relating to intangible assets identified in the 2007 going-private transaction through which Swift Corporation acquired Swift Transportation Co. |
| (c) | Real property with a carrying amount of $1.7 million was written down to its fair value of $0.6 million, resulting in a pre-tax impairment charge of $1.1 million in the first quarter of 2012. |
| | | | |
| | 15 | | |
ADJUSTED EARNINGS BEFORE INTEREST, TAXES, DEPRECIATION AND AMORTIZATION (UNAUDITED) (a)
THREE MONTHS MARCH 31, 2013, 2012 AND 2011
| | | | | | | | | | | | |
| | | Three Months Ended
March 31, | |
| | | 2013 | | | 2012 | | | 2011 | |
| | | (Amounts in thousands) | |
Net income | | $ | 23,341 | | | $ | 6,188 | | | $ | 3,205 | |
Adjusted for: | | | | | | | | | | | | |
Depreciation and amortization of property and equipment | | | 50,332 | | | | 50,394 | | | | 50,358 | |
Amortization of intangibles | | | 4,204 | | | | 4,303 | | | | 4,727 | |
Interest expense | | | 25,574 | | | | 32,776 | | | | 37,501 | |
Derivative interest expense | | | 562 | | | | 2,545 | | | | 4,680 | |
Interest income | | | (573 | ) | | | (397 | ) | | | (467 | ) |
Income tax expense (benefit) | | | 14,613 | | | | (3,548 | ) | | | 2,321 | |
| | | | | | | | | | | | |
Earnings before interest, taxes, depreciation and amortization (EBITDA) | | $ | 118,053 | | | $ | 92,261 | | | $ | 102,325 | |
| | | | | | | | | | | | |
Non-cash equity compensation (b) | | | 545 | | | | 1,267 | | | | 2,424 | |
Loss on debt extinguishment (c) | | | 5,044 | | | | 20,940 | | | | — | |
Non-cash impairments (d) | | | — | | | | 1,065 | | | | — | |
| | | | | | | | | | | | |
Adjusted earnings before interest, taxes, depreciation and amortization (Adjusted EBITDA) | | $ | 123,642 | | | $ | 115,533 | | | $ | 104,749 | |
| | | | | | | | | | | | |
| (a) | We define Adjusted EBITDA as net income (loss) plus (i) depreciation and amortization, (ii) interest and derivative interest expense, including other fees and charges associated with indebtedness, net of interest income, (iii) income taxes, (iv) non-cash equity compensation expense, (v) non-cash impairments, (vi) other special non-cash items, and (vii) excludable transaction costs. We believe that Adjusted EBITDA is a relevant measure for estimating the cash generated by our operations that would be available to cover capital expenditures, taxes, interest and other investments and that it enhances an investor’s understanding of our financial performance. We use Adjusted EBITDA for business planning purposes and in measuring our performance relative to that of our competitors. Our method of computing Adjusted EBITDA is consistent with that used in our senior secured credit agreement for covenant compliance purposes and may differ from similarly titled measures of other companies. Adjusted EBITDA is not a recognized measure under GAAP. Adjusted EBITDA should be considered in addition to, not as a substitute for or superior to, net income, cash flow from operations, operating income or any other performance measures derived in accordance with GAAP as measures of operating performance or operating cash flows as a measure of liquidity. |
| (b) | Represents recurring non-cash equity compensation expense, on a pre-tax basis. In accordance with the terms of our senior credit agreement, this expense is added back in the calculation of Adjusted EBITDA for covenant compliance purposes. |
| (c) | On March 7, 2013, the Company entered into a Second Amended and Restated Credit Agreement (“2013 Agreement”). The 2013 Agreement replaced the then-existing first lien term loan B-1 and B-2 tranches under the Amended and Restated Credit Agreement (“2012 Agreement”) entered into on March 6, 2012 with outstanding principal balances of $152.0 million and $508.0 million, respectively, with new first lien term loan B-1 and B-2 tranches with face values of $250.0 million and $410.0 million, respectively. The replacement of the 2012 Agreement resulted in a loss on debt extinguishment of $5.0 million in the first quarter of 2013, representing the write-off of the unamortized original issue discount and deferred financing fees associated with the 2012 Agreement. The Company entered into the 2012 Agreement on March 6, 2012, which replaced the then-existing, remaining $874 million face value first lien term loan, maturing in December 2016, resulting in a loss on debt extinguishment of $20.9 million in the first quarter of 2012 representing the write-off of the unamortized original issue discount and deferred financing fees associated with the original term loan. |
| (d) | Real property with a carrying amount of $1.7 million was written down to its fair value of $0.6 million, resulting in a pre-tax impairment charge of $1.1 million in the first quarter of 2012. |
| | | | |
| | 16 | | |
FINANCIAL INFORMATION BY SEGMENT (UNAUDITED)
THREE MONTHS ENDED MARCH 31, 2013, 2012 AND 2011
| | | | | | | | | | | | |
| | | Three Months Ended,
March 31, | |
| | | 2013 | | | 2012 | | | 2011 | |
| | | (Amounts in thousands) | |
Operating revenue: | | | | | | | | | | | | |
Truckload | | $ | 559,595 | | | $ | 551,247 | | | $ | 543,883 | |
Dedicated | | | 179,226 | | | | 171,539 | | | | 137,485 | |
Intermodal | | | 77,325 | | | | 69,045 | | | | 47,525 | |
| | | | | | | | | | | | |
Subtotal | | | 816,146 | | | | 791,831 | | | | 728,893 | |
Nonreportable segments (a) | | | 55,292 | | | | 52,331 | | | | 43,798 | |
Intersegment eliminations | | | (14,644 | ) | | | (17,277 | ) | | | (13,802 | ) |
| | | | | | | | | | | | |
Consolidated operating revenue | | $ | 856,794 | | | $ | 826,885 | | | $ | 758,889 | |
| | | | | | | | | | | | |
Operating income (loss): | | | | | | | | | | | | |
Truckload | | $ | 42,403 | | | $ | 46,554 | | | $ | 28,831 | |
Dedicated | | | 18,954 | | | | 14,507 | | | | 13,430 | |
Intermodal | | | (1,798 | ) | | | (4,027 | ) (b) | | | 734 | |
| | | | | | | | | | | | |
Subtotal | | | 59,559 | | | | 57,034 | | | | 42,995 | |
Nonreportable segments (a) | | | 2,428 | | | | 868 | | | | 3,734 | |
Intersegment eliminations | | | — | | | | — | | | | — | |
| | | | | | | | | | | | |
Consolidated operating income | | $ | 61,987 | | | $ | 57,902 | | | $ | 46,729 | |
| | | | | | | | | | | | |
Operating Ratio: | | | | | | | | | | | | |
Truckload | | | 92.4 | % | | | 91.6 | % | | | 94.7 | % |
| | | | | | | | | | | | |
Dedicated | | | 89.4 | % | | | 91.5 | % | | | 90.2 | % |
| | | | | | | | | | | | |
Intermodal | | | 102.3 | % | | | 105.8 | %(b) | | | 98.5 | % |
| | | | | | | | | | | | |
Adjusted Operating Ratio (c): | | | | | | | | | | | | |
Truckload | | | 90.4 | % | | | 89.3 | % | | | 93.4 | % |
| | | | | | | | | | | | |
Dedicated | | | 86.9 | % | | | 89.7 | % | | | 88.4 | % |
| | | | | | | | | | | | |
Intermodal | | | 103.0 | % | | | 107.4 | %(b) | | | 98.1 | % |
| | | | | | | | | | | | |
| (a) | Our nonreportable segments are comprised of our freight brokerage and logistics management services, Interstate Equipment Leasing (“IEL”), insurance and shop activities. |
| (b) | During the first quarter of 2012, our Intermodal reportable segment incurred an increase in its insurance and claims expense primarily related to one claim associated with a drayage accident, which increased the Intermodal Operating Ratio by approximately 450 to 480 basis points for the three months ended March 31, 2012, and increased the Intermodal Adjusted Operating Ratio by approximately 570 to 600 basis points for the three months ended March 31, 2012 respectively, as compared to the first quarters of 2011 and 2013. |
| (c) | See our reconciliation of Adjusted Operating Ratio by Segment at the schedule titled “Adjusted Operating Income and Operating Ratio Reconciliation by Segment”. |
| | | | |
| | 17 | | |
OPERATING STATISTICS (UNAUDITED)
THREE MONTHS ENDED MARCH 31, 2013, 2012 AND 2011
| | | | | | | | | | | | |
| | | Three Months Ended,
March 31, | |
| | | 2013 | | | 2012 | | | 2011 | |
Operating Statistics by Segment: | | | | | | | | | | | | |
Truckload: | | | | | | | | | | | | |
Weekly revenue xFSR per tractor | | $ | 3,182 | | | $ | 3,028 | | | $ | 2,798 | |
Total loaded miles (a) | | | 261,850 | | | | 262,549 | | | | 274,612 | |
Deadhead miles percentage | | | 11.2 | % | | | 11.3 | % | | | 11.6 | % |
Average tractors available for dispatch: | | | | | | | | | | | | |
Company | | | 7,494 | | | | 7,683 | | | | 8,680 | |
Owner-Operator | | | 3,291 | | | | 3,354 | | | | 3,473 | |
| | | | | | | | | | | | |
Total | | | 10,785 | | | | 11,037 | | | | 12,153 | |
| | | | | | | | | | | | |
Dedicated: | | | | | | | | | | | | |
Weekly revenue xFSR per tractor | | $ | 3,385 | | | $ | 3,370 | | | $ | 3,310 | |
Average tractors available for dispatch: | | | | | | | | | | | | |
Company | | | 2,684 | | | | 2,537 | | | | 2,221 | |
Owner-Operator | | | 643 | | | | 668 | | | | 500 | |
| | | | | | | | | | | | |
Total | | | 3,327 | | | | 3,205 | | | | 2,721 | |
| | | | | | | | | | | | |
Intermodal: | | | | | | | | | | | | |
Average tractors available for dispatch: | | | | | | | | | | | | |
Company | | | 263 | | | | 271 | | | | 194 | |
Owner-Operator | | | 18 | | | | — | | | | — | |
| | | | | | | | | | | | |
Total | | | 281 | | | | 271 | | | | 194 | |
| | | | | | | | | | | | |
Load Count | | | 33,695 | | | | 30,710 | | | | 22,785 | |
Average Container Count | | | 8,717 | | | | 6,317 | | | | 4,942 | |
| (a) | Total loaded miles presented in thousands. |
| | | | | | | | | | | | |
| | | As of | |
| | | March 31,
2013 | | | December 31,
2012 | | | March 31,
2012 | |
Consolidated Total Equipment: | | | | | | | | | | | | |
Tractors: | | | | | | | | | | | | |
Company | | | | | | | | | | | | |
Owned | | | 5,794 | | | | 5,431 | | | | 6,198 | |
Leased – capital leases | | | 2,368 | | | | 2,328 | | | | 2,582 | |
Leased – operating leases | | | 3,498 | | | | 3,516 | | | | 2,890 | |
| | | | | | | | | | | | |
Total company tractors | | | 11,660 | | | | 11,275 | | | | 11,670 | |
| | | | | | | | | | | | |
Owner-operator | | | | | | | | | | | | |
Financed through the Company | | | 2,964 | | | | 3,020 | | | | 2,939 | |
Other | | | 1,024 | | | | 936 | | | | 1,027 | |
| | | | | | | | | | | | |
Total owner-operator tractors | | | 3,988 | | | | 3,956 | | | | 3,966 | |
| | | | | | | | | | | | |
Total tractors | | | 15,648 | | | | 15,231 | | | | 15,636 | |
| | | | | | | | | | | | |
Trailers | | | 52,679 | | | | 52,841 | | | | 51,031 | |
| | | | | | | | | | | | |
Containers | | | 8,718 | | | | 8,717 | | | | 6,424 | |
| | | | | | | | | | | | |
| | | | |
| | 18 | | |
ADJUSTED OPERATING INCOME AND OPERATING RATIORECONCILIATION BY SEGMENT (UNAUDITED) (a)
THREE MONTHS ENDED MARCH 31, 2013, 2012 AND 2011
| | | | | | | | | | | | |
| | | Three Months Ended,
March 31, | |
| | | 2013 | | | 2012 | | | 2011 | |
| | | (Amounts in thousands) | |
Truckload: | | | | | | | | | | | | |
Operating revenue | | $ | 559,595 | | | $ | 551,247 | | | $ | 543,883 | |
Less: Fuel surcharge revenue | | | 118,339 | | | | 116,866 | | | | 106,643 | |
| | | | | | | | | | | | |
Revenue xFSR | | | 441,256 | | | | 434,381 | | | | 437,240 | |
| | | | | | | | | | | | |
Operating expense | | | 517,192 | | | | 504,693 | | | | 515,052 | |
Adjusted for: | | | | | | | | | | | | |
Fuel surcharge revenue | | | (118,339 | ) | | | (116,866 | ) | | | (106,643 | ) |
| | | | | | | | | | | | |
Adjusted operating expense | | | 398,853 | | | | 387,827 | | | | 408,409 | |
| | | | | | | | | | | | |
Adjusted operating income | | $ | 42,403 | | | $ | 46,554 | | | $ | 28,831 | |
| | | | | | | | | | | | |
Adjusted Operating Ratio | | | 90.4 | % | | | 89.3 | % | | | 93.4 | % |
Operating Ratio | | | 92.4 | % | | | 91.6 | % | | | 94.7 | % |
Dedicated: | | | | | | | | | | | | |
Operating revenue | | $ | 179,226 | | | $ | 171,539 | | | $ | 137,485 | |
Less: Fuel surcharge revenue | | | 34,433 | | | | 31,131 | | | | 21,709 | |
| | | | | | | | | | | | |
Revenue xFSR | | | 144,793 | | | | 140,408 | | | | 115,776 | |
| | | | | | | | | | | | |
Operating expense | | | 160,272 | | | | 157,032 | | | | 124,055 | |
Adjusted for: | | | | | | | | | | | | |
Fuel surcharge revenue | | | (34,433 | ) | | | (31,131 | ) | | | (21,709 | ) |
| | | | | | | | | | | | |
Adjusted operating expense | | | 125,839 | | | | 125,901 | | | | 102,346 | |
| | | | | | | | | | | | |
Adjusted operating income | | $ | 18,954 | | | $ | 14,507 | | | $ | 13,430 | |
| | | | | | | | | | | | |
Adjusted Operating Ratio | | | 86.9 | % | | | 89.7 | % | | | 88.4 | % |
Operating Ratio | | | 89.4 | % | | | 91.5 | % | | | 90.2 | % |
Intermodal: | | | | | | | | | | | | |
Operating revenue | | $ | 77,325 | | | $ | 69,045 | | | $ | 47,525 | |
Less: Fuel surcharge revenue | | | 16,740 | | | | 14,467 | | | | 9,400 | |
| | | | | | | | | | | | |
Revenue xFSR | | | 60,585 | | | | 54,578 | | | | 38,125 | |
| | | | | | | | | | | | |
Operating expense | | | 79,123 | | | | 73,072 | | | | 46,791 | |
Adjusted for: | | | | | | | | | | | | |
Fuel surcharge revenue | | | (16,740 | ) | | | (14,467 | ) | | | (9,400 | ) |
| | | | | | | | | | | | |
Adjusted operating expense | | | 62,383 | | | | 58,605 | | | | 37,391 | |
| | | | | | | | | | | | |
Adjusted operating (loss) income | | $ | (1,798 | ) | | $ | (4,027 | ) | | $ | 734 | |
| | | | | | | | | | | | |
Adjusted Operating Ratio | | | 103.0 | % | | | 107.4 | % | | | 98.1 | % |
Operating Ratio | | | 102.3 | % | | | 105.8 | % | | | 98.5 | % |
| | | | |
| | 19 | | |
CONSOLIDATED BALANCE SHEET
AS OF MARCH 31, 2013 AND DECEMBER 31, 2012
(In thousands, except share data)
| | | | | | | | |
| | | March 31, | | | December 31, | |
| | | 2013 | | | 2012 | |
| | | (Unaudited) | | | | |
| ASSETS | |
Current assets: | | | | | | | | |
Cash and cash equivalents | | $ | 38,746 | | | $ | 53,596 | |
Restricted cash | | | 45,467 | | | | 51,678 | |
Restricted investments, held to maturity, amortized cost | | | 29,328 | | | | 22,275 | |
Accounts receivable, net | | | 358,306 | | | | 338,724 | |
Equipment sales receivable | | | 2,629 | | | | 563 | |
Income tax refund receivable | | | 12,258 | | | | 10,046 | |
Inventories and supplies | | | 16,095 | | | | 15,678 | |
Assets held for sale | | | 16,011 | | | | 31,544 | |
Prepaid taxes, licenses, insurance and other | | | 49,034 | | | | 47,241 | |
Deferred income taxes | | | 94,101 | | | | 98,235 | |
Current portion of notes receivable | | | 4,926 | | | | 4,957 | |
| | | | | | | | |
Total current assets | | | 666,901 | | | | 674,537 | |
| | | | | | | | |
Property and equipment, at cost: | | | | | | | | |
Revenue and service equipment | | | 1,794,258 | | | | 1,740,456 | |
Land | | | 112,587 | | | | 112,587 | |
Facilities and improvements | | | 235,620 | | | | 234,996 | |
Furniture and office equipment | | | 46,766 | | | | 43,578 | |
| | | | | | | | |
Total property and equipment | | | 2,189,231 | | | | 2,131,617 | |
Less: accumulated depreciation and amortization | | | 851,026 | | | | 819,803 | |
| | | | | | | | |
Net property and equipment | | | 1,338,205 | | | | 1,311,814 | |
Other assets | | | 52,188 | | | | 59,010 | |
Intangible assets, net | | | 329,357 | | | | 333,561 | |
Goodwill | | | 253,256 | | | | 253,256 | |
| | | | | | | | |
Total assets | | $ | 2,639,907 | | | $ | 2,632,178 | |
| | | | | | | | |
| LIABILITIES AND STOCKHOLDERS’ EQUITY | | | | | | | | |
Current liabilities: | | | | | | | | |
Accounts payable | | $ | 123,738 | | | $ | 103,070 | |
Accrued liabilities | | | 105,022 | | | | 96,439 | |
Current portion of claims accruals | | | 79,725 | | | | 74,070 | |
Current portion of long-term debt and obligations under capital leases (1) | | | 59,182 | | | | 47,495 | |
Fair value of guarantees | | | 366 | | | | 366 | |
Current portion of fair value of interest rate swaps | | | 2,637 | | | | 1,853 | |
| | | | | | | | |
Total current liabilities | | | 370,670 | | | | 323,293 | |
| | | | | | | | |
Long-term debt and obligations under capital leases (1) | | | 1,242,832 | | | | 1,323,539 | |
Claims accruals, less current portion | | | 103,647 | | | | 98,919 | |
Fair value of interest rate swaps, less current portion | | | 10,637 | | | | 11,159 | |
Deferred income taxes | | | 451,411 | | | | 441,157 | |
Securitization of accounts receivable | | | 204,000 | | | | 204,000 | |
| | | | | | | | |
Total liabilities | | | 2,383,197 | | | | 2,402,067 | |
| | | | | | | | |
Stockholders’ equity: | | | | | | | | |
Class A common stock | | | 873 | | | | 871 | |
Class B common stock | | | 525 | | | | 525 | |
Additional paid-in capital | | | 899,503 | | | | 896,575 | |
Accumulated deficit | | | (636,827 | ) | | | (660,168 | ) |
Accumulated other comprehensive loss | | | (7,566 | ) | | | (7,894 | ) |
Noncontrolling interests | | | 202 | | | | 202 | |
| | | | | | | | |
Total stockholders’ equity | | | 256,710 | | | | 230,111 | |
| | | | | | | | |
| Total liabilities and stockholders’ equity | | $ | 2,639,907 | | | $ | 2,632,178 | |
| | | | | | | | |
| | | | |
| | 20 | | |
Notes to Selected Consolidated Balance Sheet Data:
| (1) | On March 7, 2013, the Company entered into a Second Amended and Restated Credit Agreement (the “2013 Agreement”) replacing our previous Amended and Restated Credit Agreement dated March 6, 2012 (the “2012 Agreement”). The 2013 Agreement replaced the previous first lien term loan B-1 and B-2 tranches with outstanding principal balances of $152.0 million and $508.0 million, respectively, with new first lien term B-1 and B-2 tranches with face values of $250.0 million and $410.0 million, respectively. In addition, the 2013 Agreement reduced the interest rate applicable to the first lien term loan B-1 tranche to the LIBOR rate plus 2.75% with no LIBOR floor, down from LIBOR plus 3.75% with no LIBOR floor, and reduced the interest rate applicable to the first lien term loan B-2 tranche to the LIBOR rate plus 3.00% with a 1.00% LIBOR floor, down from LIBOR plus 3.75% with a 1.25% LIBOR floor. The replacement of the 2012 Agreement resulted in a loss on debt extinguishment of $5.0 million in the first quarter of 2013, representing the write-off of the unamortized original issue discount and deferred financing fees associated with the then-existing first lien term loan B-1 and B-2 tranches. |
Total debt and capital lease obligations as of March 31, 2013 includes $250.0 million net carrying value of first lien term loan B-1 tranche, $410.0 million net carrying value of the first lien term loan B-2 tranche, $492.9 million net carrying value of senior second priority secured notes, and $149.1 million of other secured indebtedness and capital lease obligations. Total debt and capital lease obligations as of December 31, 2012 includes $157.1 million net carrying value of the first lien term loan B-1 tranche, $575.6 million net carrying value of the first lien term loan B-2 tranche, $492.6 million net carrying value of senior second priority secured notes, and $145.7 million of other secured indebtedness and capital lease obligations.
| | | | |
| | 21 | | |
CONSOLIDATED STATEMENTS OF CASH FLOWS (UNAUDITED)
THREE MONTHS ENDED MARCH 31, 2013 AND 2012
| | | | | | | | |
| | | Three Months Ended
March 31, | |
| | | 2013 | | | 2012 | |
Cash flows from operating activities: | | | | | | | | |
Net income | | $ | 23,341 | | | $ | 6,188 | |
Adjustments to reconcile net income to net cash provided by operating activities: | | | | | | | | |
Depreciation and amortization of property, equipment and intangibles | | | 54,536 | | | | 54,697 | |
Amortization of debt issuance costs, original issue discount, and losses on terminated swaps | | | 1,228 | | | | 4,260 | |
Gain on disposal of property and equipment less write-off of totaled tractors | | | (2,253 | ) | | | (4,280 | ) |
Gain on sale of real property | | | (6,078 | ) | | | | |
Impairment of property and equipment, notes receivable and other assets | | | — | | | | 1,065 | |
Equity losses of investee | | | 200 | | | | 78 | |
Deferred income taxes | | | 14,417 | | | | (5,712 | ) |
Provision for (reduction of) allowance for losses on accounts receivable | | | (193 | ) | | | 138 | |
Non-cash equity compensation | | | 545 | | | | 1,267 | |
Loss on debt extinguishment | | | 5,044 | | | | 20,940 | |
Income effect of mark-to-market adjustment of interest rate swaps | | | 189 | | | | — | |
Increase (decrease) in cash resulting from changes in: | | | | | | | | |
Accounts receivable | | | (19,389 | ) | | | (15,293 | ) |
Inventories and supplies | | | (417 | ) | | | (5,000 | ) |
Prepaid expenses and other current assets | | | (2,061 | ) | | | (3,322 | ) |
Other assets | | | 4,018 | | | | 123 | |
Accounts payable, accrued and other liabilities | | | 23,762 | | | | 15,023 | |
| | | | | | | | |
Net cash provided by operating activities | | | 96,889 | | | | 70,172 | |
| | | | | | | | |
Cash flows from investing activities: | | | | | | | | |
Decrease in restricted cash | | | 6,211 | | | | 10,718 | |
Change in restricted investment | | | (7,073 | ) | | | (11,086 | ) |
Funding of note receivable | | | — | | | | (7,500 | ) |
Proceeds from sale of property and equipment | | | 9,939 | | | | 33,858 | |
Capital expenditures | | | (57,636 | ) | | | (44,246 | ) |
Payments received on notes receivable | | | 1,034 | | | | 1,980 | |
Expenditures on assets held for sale | | | (833 | ) | | | (1,719 | ) |
Payments received on assets held for sale | | | 21,828 | | | | 1,760 | |
Payments received on equipment sale receivables | | | 596 | | | | 5,466 | |
Other investing activities | | | — | | | | (500 | ) |
| | | | | | | | |
Net cash used in investing activities | | | (25,934 | ) | | | (11,269 | ) |
| | | | | | | | |
Cash flows from financing activities: | | | | | | | | |
Repayment of long-term debt and capital leases | | | (90,133 | ) | | | (70,523 | ) |
Proceeds from long-term debt | | | 3,200 | | | | — | |
Borrowings under accounts receivable securitization | | | 56,000 | | | | 89,000 | |
Repayment of accounts receivable securitization | | | (56,000 | ) | | | (106,000 | ) |
Payment of deferred loan costs | | | (1,257 | ) | | | (5,932 | ) |
Other financing activities | | | 2,385 | | | | 152 | |
| | | | | | | | |
Net cash used in financing activities | | | (85,805 | ) | | | (93,303 | ) |
| | | | | | | | |
Net decrease in cash and cash equivalents | | | (14,850 | ) | | | (34,400 | ) |
| | | | | | | | |
Cash and cash equivalents at beginning of period | | | 53,596 | | | | 82,084 | |
Cash and cash equivalents at end of period | | $ | 38,746 | | | $ | 47,684 | |
| | | | | | | | |
Supplemental disclosure of cash flow information: | | | | | | | | |
Cash paid during the period for: | | | | | | | | |
Interest | | $ | 14,915 | | | $ | 27,557 | |
| | | | | | | | |
Income taxes | | $ | 2,908 | | | $ | 2,220 | |
| | | | | | | | |
Supplemental schedule of: | | | | | | | | |
Non-cash investing activities: | | | | | | | | |
Equipment sales receivables | | $ | 2,661 | | | $ | 700 | |
| | | | | | | | |
Equipment purchase accrual | | $ | 32,705 | | | $ | 18,870 | |
| | | | | | | | |
Notes receivable from sale of assets | | $ | 1,148 | | | $ | 685 | |
| | | | | | | | |
Non-cash financing activities: | | | | | | | | |
Capital lease additions | | $ | 13,808 | | | $ | 17,099 | |
| | | | | | | | |
Accrued deferred loan costs | | $ | 75 | | | $ | 120 | |
| | | | | | | | |
| | | | |
| | 22 | | |