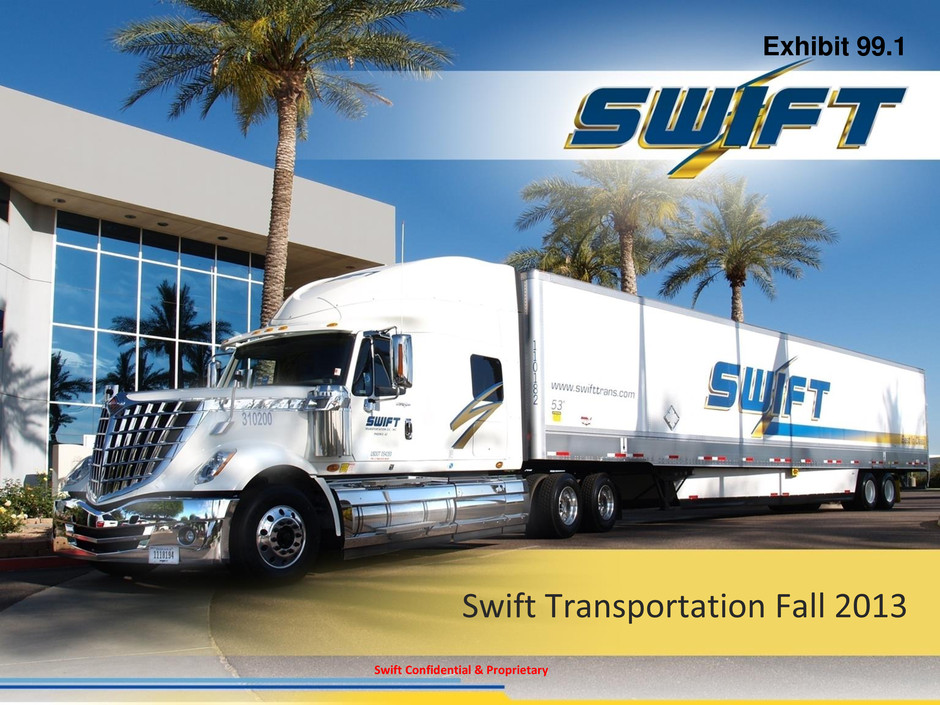
Swift Confidential & Proprietary Swift Transportation Fall 2013 Exhibit 99.1
Swift Confidential & Proprietary Forward Looking Statements Disclaimer 2 This presentation, including documents which are incorporated by reference and accompanying comments, may contain forward-looking statements within the meaning of the Private Securities Litigation Reform Act of 1995. Such forward-looking statements include, but are not limited to: “anticipates,” “believes,” “estimates,” “plans,” “projects,” “expects,” “intends,” “will,” “could,” “may”, “optimism for strengthening demand,” or similar expressions which speak only as of the date the statement was made. Such forward-looking statements are inherently uncertain, are based upon the current beliefs, assumptions and expectations of Company management and current market conditions, which are subject to significant risks and uncertainties as set forth in the Risk Factor Section of our 10K. You should understand that many important factors, in addition to those listed above and in our filings with the SEC, could impact us financially. As a result of these and other factors, actual results may differ from those set forth in the forward-looking statements and the prices of the Company's securities may fluctuate dramatically. The Company makes no commitment, and disclaims any duty, to update or revise any forward-looking statements to reflect future events, new information or changes in these expectations. The resentation also includes certain non-GAAP financial measures as defined by the SEC. To comply with SEC rules, we have provided a reconciliation of these non-GAAP measures.
Swift Confidential & Proprietary 3 Transportation Industry & Swift
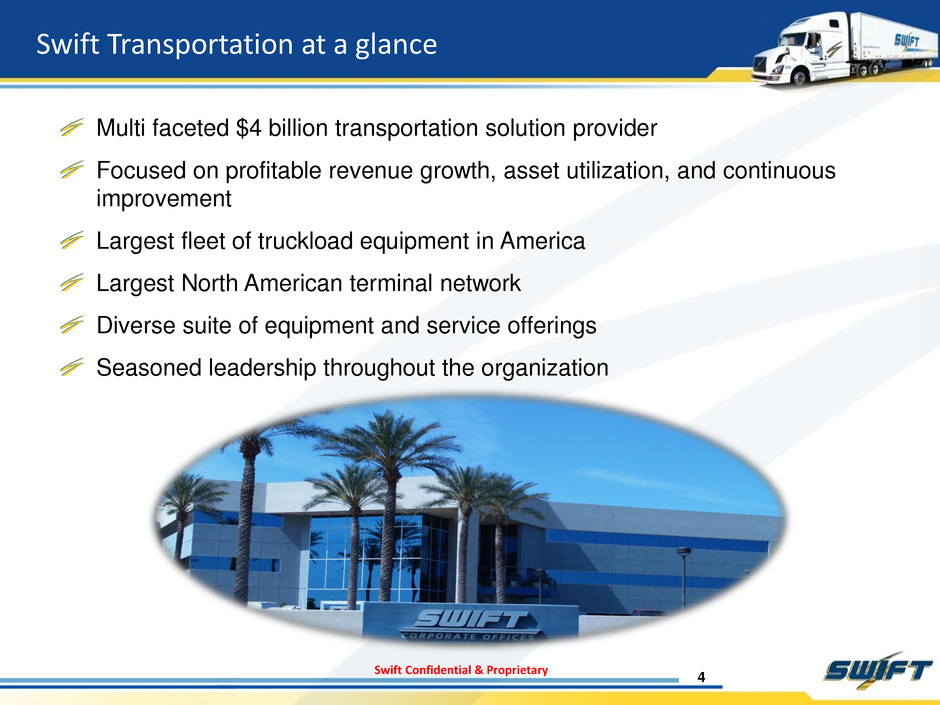
Swift Confidential & Proprietary 4 Multi faceted $4 billion transportation solution provider Focused on profitable revenue growth, asset utilization, and continuous improvement Largest fleet of truckload equipment in America Largest North American terminal network Diverse suite of equipment and service offerings Seasoned leadership throughout the organization Swift Transportation at a glance
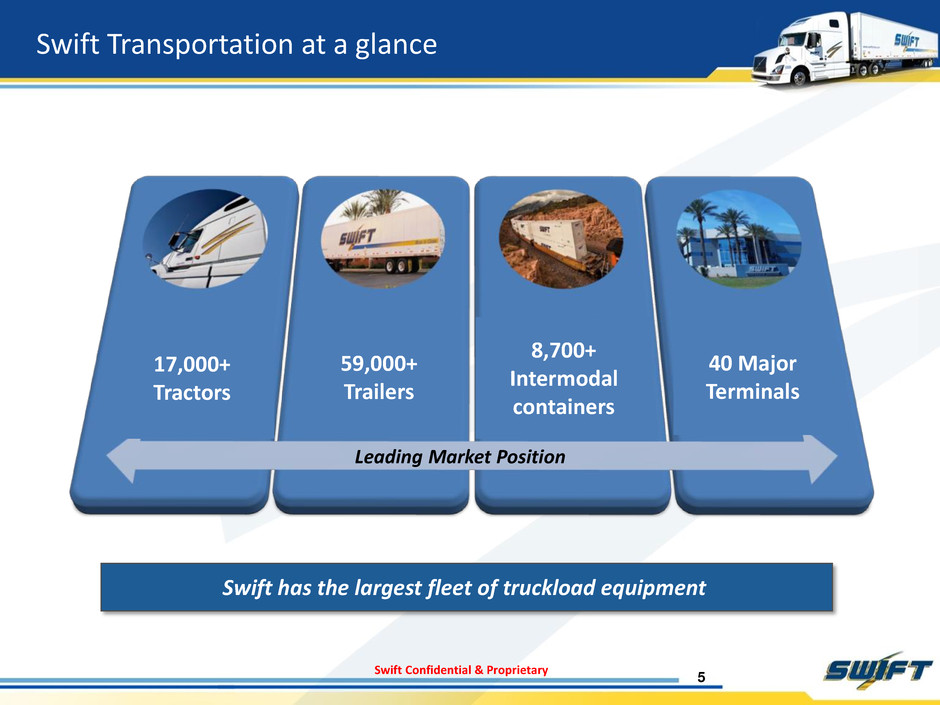
Swift Confidential & Proprietary 5 Swift Transportation at a glance 17,000+ Tractors 59,000+ Trailers 40 Major Terminals 8,700+ Intermodal containers Leading Market Position Swift has the largest fleet of truckload equipment
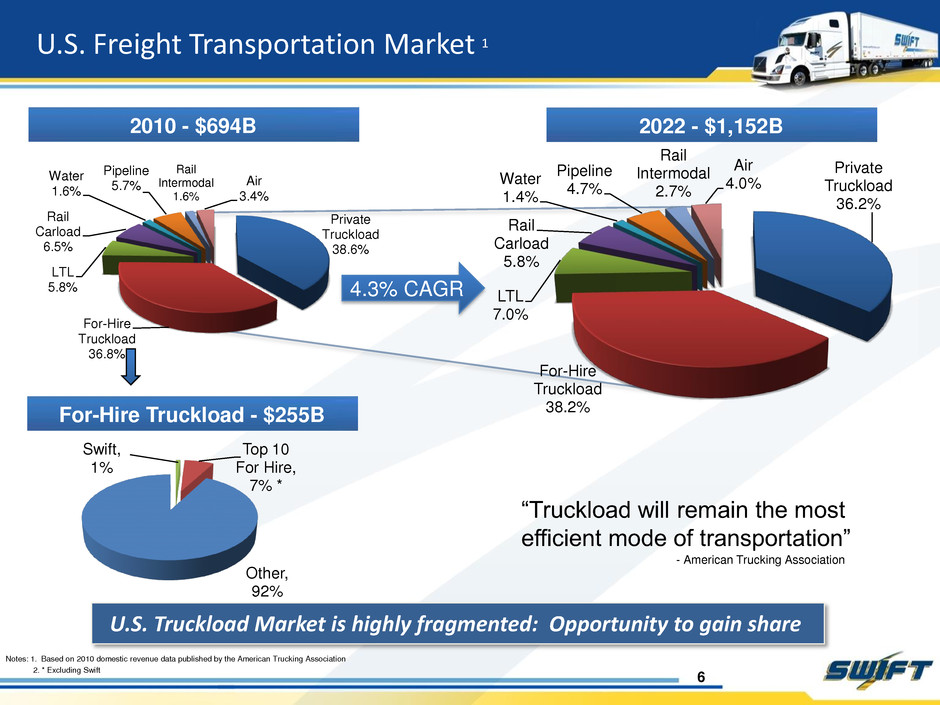
Swift, 1% Top 10 For Hire, 7% * Other, 92% Private Truckload 36.2% For-Hire Truckload 38.2% LTL 7.0% Rail Carload 5.8% Water 1.4% Pipeline 4.7% Rail Intermodal 2.7% Air 4.0% Private Truckload 38.6% For-Hire Truckload 36.8% LTL 5.8% Rail Carload 6.5% Water 1.6% Pipeline 5.7% Rail Intermodal 1.6% Air 3.4% 4.3% CAGR “Truckload will remain the most efficient mode of transportation” - American Trucking Association 2010 - $694B 2022 - $1,152B For-Hire Truckload - $255B U.S. Truckload Market is highly fragmented: Opportunity to gain share Notes: 1. Based on 2010 domestic revenue data published by the American Trucking Association 2. * Excluding Swift 6 U.S. Freight Transportation Market 1
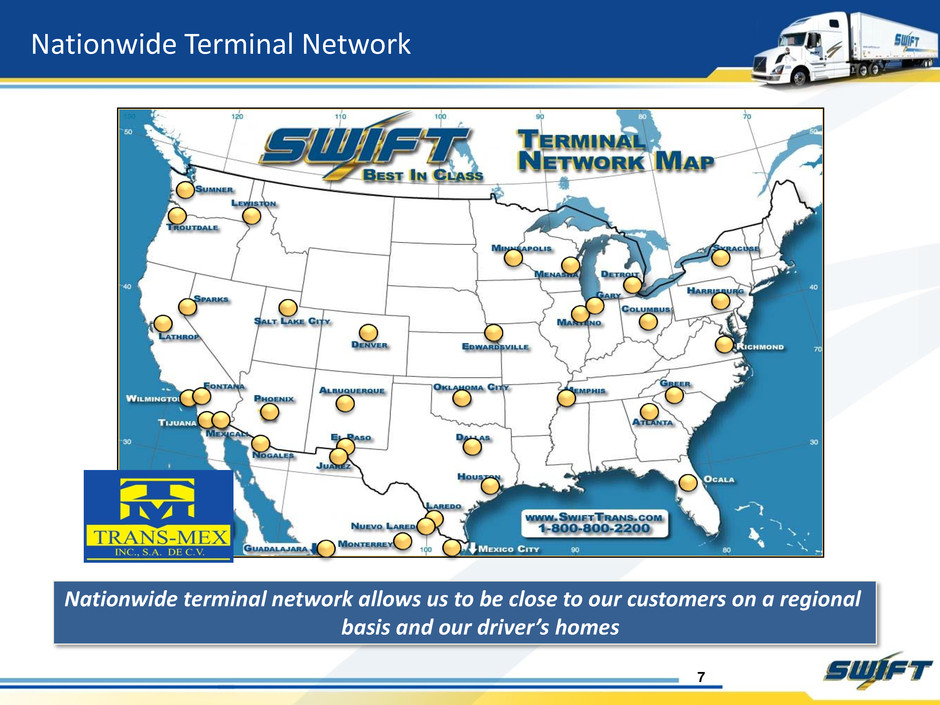
7 Nationwide Terminal Network (3) (2) Nationwide terminal network allows us to be close to our customers on a regional basis and our driver’s homes
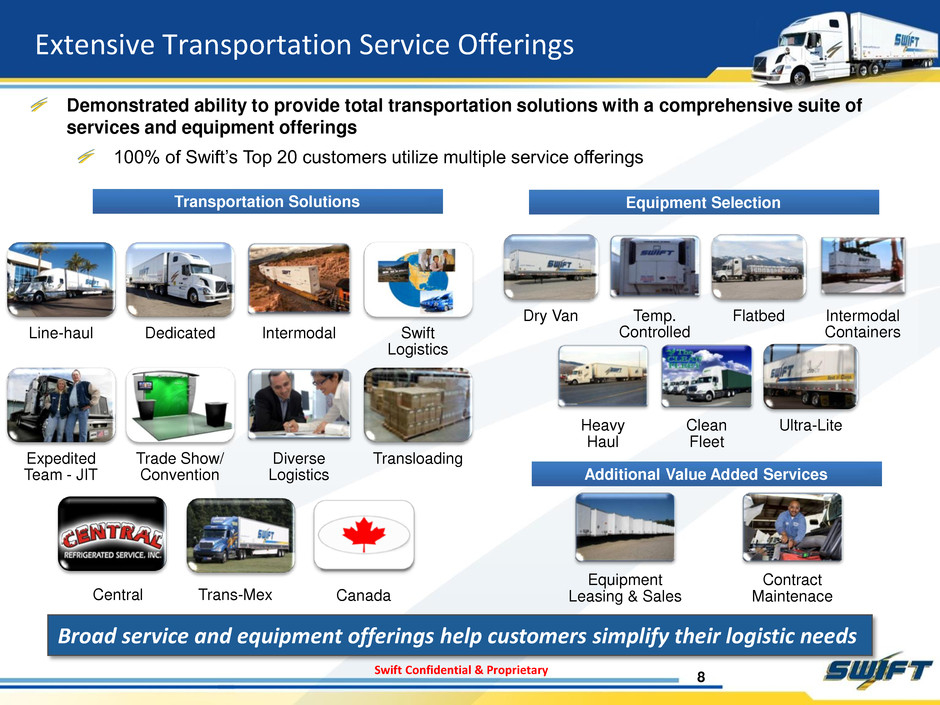
Swift Confidential & Proprietary 8 Extensive Transportation Service Offerings Demonstrated ability to provide total transportation solutions with a comprehensive suite of services and equipment offerings 100% of Swift’s Top 20 customers utilize multiple service offerings Transportation Solutions Equipment Selection Additional Value Added Services Broad service and equipment offerings help customers simplify their logistic needs Line-haul Dedicated Intermodal Swift Logistics Expedited Team - JIT Trade Show/ Convention Diverse Logistics Transloading Trans-Mex Canada Central Dry Van Temp. Controlled Flatbed Intermodal Containers Heavy Haul Clean Fleet Ultra-Lite Equipment Leasing & Sales Contract Maintenace
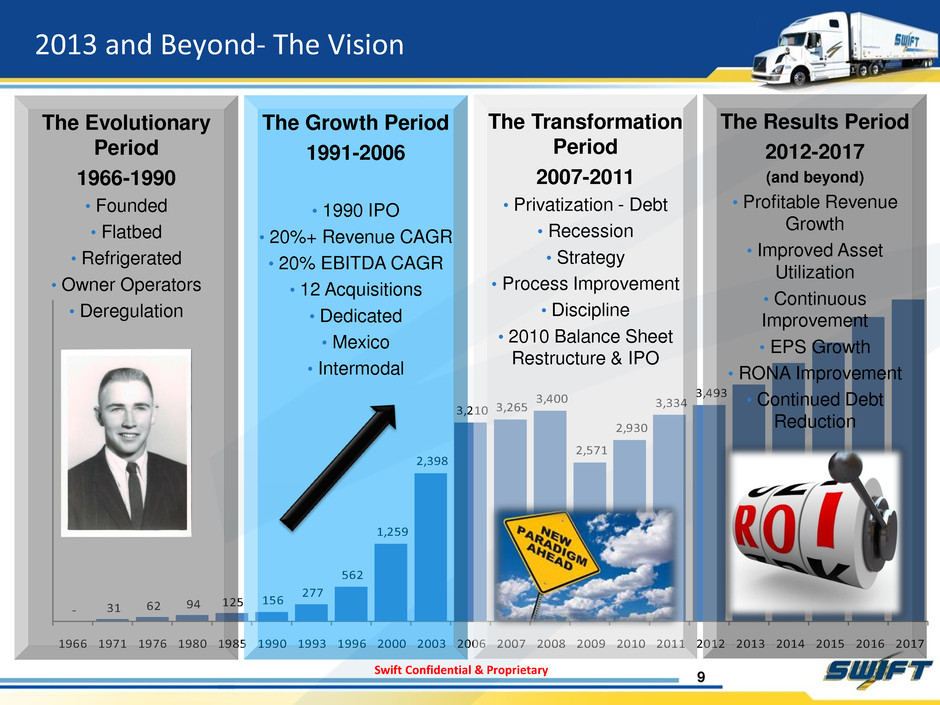
Swift Confidential & Proprietary - 31 62 94 125 156 277 562 1,259 2,398 3,210 3,265 3,400 2,571 2,930 3,334 3,493 1966 1971 1976 1980 1985 1990 1993 1996 2000 2003 2006 2007 2008 2009 2010 2011 2012 2013 2014 2015 2016 2017 The Evolutionary Period 1966-1990 • Founded • Flatbed • Refrigerated • Owner Operators • Deregulation The Growth Period 1991-2006 • 1990 IPO • 20%+ Revenue CAGR • 20% EBITDA CAGR • 12 Acquisitions • Dedicated • Mexico • Intermodal The Transformation Period 2007-2011 • Privatization - Debt • Recession • Strategy • Process Improvement • Discipline • 2010 Balance Sheet Restructure & IPO The Results Period 2012-2017 (and beyond) • Profitable Revenue Growth • Improved Asset Utilization • Continuous Improvement • EPS Growth • RONA Improvement • Continued Debt Reduction 2013 and Beyond- The Vision 9
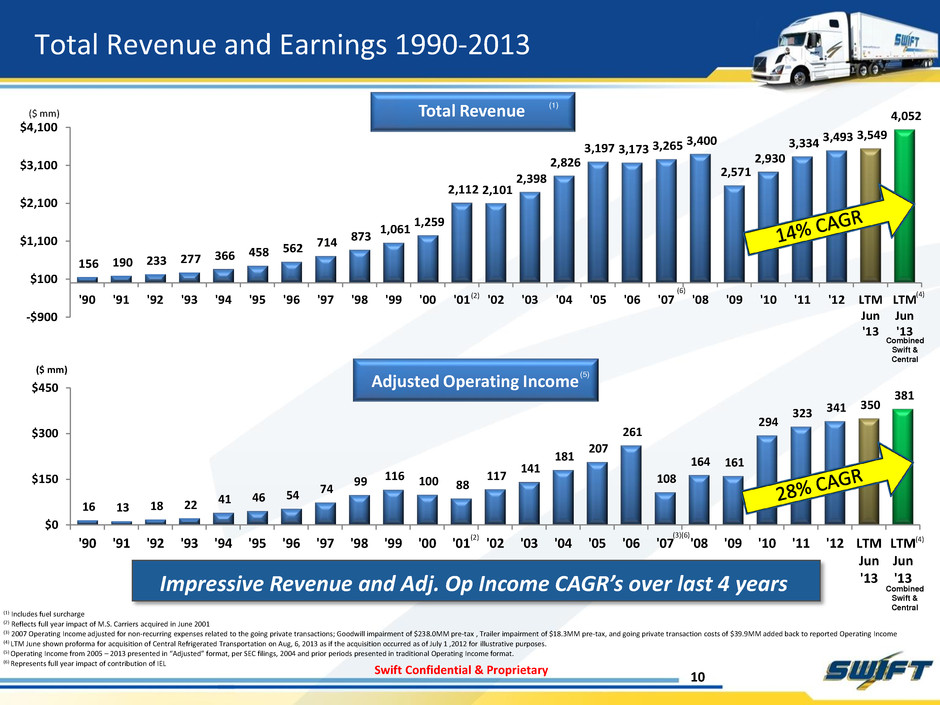
Swift Confidential & Proprietary 156 190 233 277 366 458 562 714 873 1,061 1,259 2,112 2,101 2,398 2,826 3,197 3,173 3,265 3,400 2,571 2,930 3,334 3,493 3,549 4,052 -$900 $100 $1,100 $2,100 $3,100 $4,100 '90 '91 '92 '93 '94 '95 '96 '97 '98 '99 '00 '01 '02 '03 '04 '05 '06 '07 '08 '09 '10 '11 '12 LTM Jun '13 LTM Jun '13 S/C ($ mm) 16 13 18 22 41 46 54 74 99 116 100 88 117 141 181 207 261 108 164 161 294 323 341 350 381 $0 $150 $300 $450 '90 '91 '92 '93 '94 '95 '96 '97 '98 '99 '00 '01 '02 '03 '04 '05 '06 '07 '08 '09 '10 '11 '12 LTM Jun '13 LTM Jun '13 S/C ($ mm) 10 (1) Includes fuel surcharge (2) Reflects full year impact of M.S. Carriers acquired in June 2001 (3) 2007 Operating Income adjusted for non-recurring expenses related to the going private transactions; Goodwill impairment of $238.0MM pre-tax , Trailer impairment of $18.3MM pre-tax, and going private transaction costs of $39.9MM added back to reported Operating Income (4) LTM June shown proforma for acquisition of Central Refrigerated Transportation on Aug, 6, 2013 as if the acquisition occurred as of July 1 ,2012 for illustrative purposes. (5) Operating Income from 2005 – 2013 presented in “Adjusted” format, per SEC filings, 2004 and prior periods presented in traditional Operating Income format. (6) Represents full year impact of contribution of IEL (2) (3)(6) Total Revenue and Earnings 1990-2013 Impressive Revenue and Adj. Op Income CAGR’s over last 4 years (4) Total Revenue Adjusted Operating Income (1) (2) (4) (5) Combined Swift & Central ($ mm) Combined Swift & Central (6)
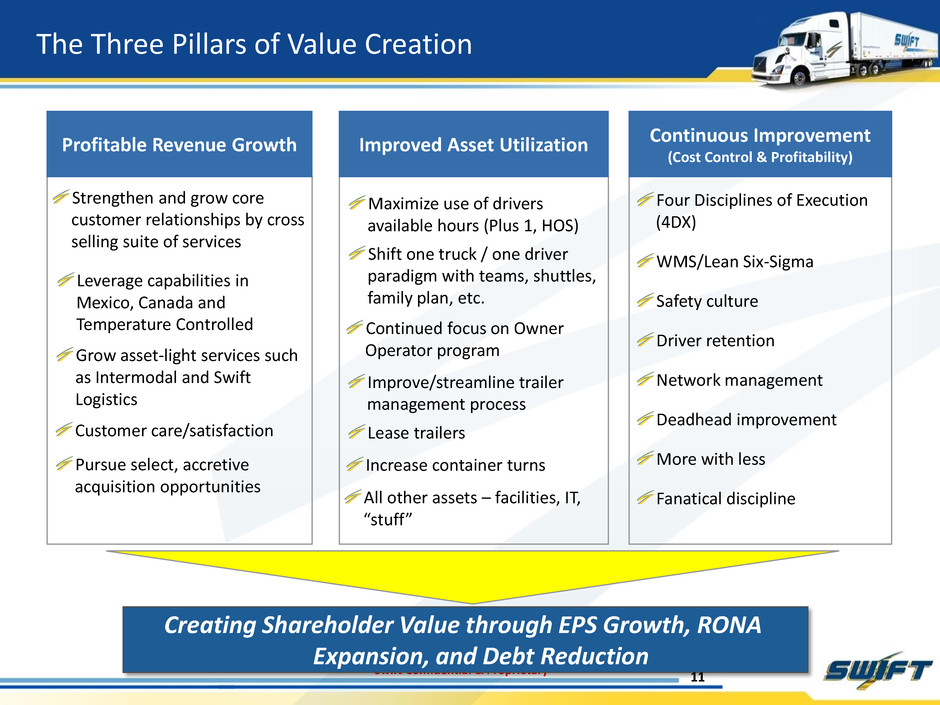
Swift Confidential & Proprietary The Three Pillars of Value Creation Strengthen and grow core customer relationships by cross selling suite of services Creating Shareholder Value through EPS Growth, RONA Expansion, and Debt Reduction Profitable Revenue Growth Improved Asset Utilization Continuous Improvement (Cost Control & Profitability) 11 Leverage capabilities in Mexico, Canada and Temperature Controlled Grow asset-light services such as Intermodal and Swift Logistics Customer care/satisfaction Pursue select, accretive acquisition opportunities Maximize use of drivers available hours (Plus 1, HOS) Shift one truck / one driver paradigm with teams, shuttles, family plan, etc. Continued focus on Owner Operator program Improve/streamline trailer management process Lease trailers Increase container turns All other assets – facilities, IT, “stuff” Four Disciplines of Execution (4DX) WMS/Lean Six-Sigma Safety culture Driver retention Network management Deadhead improvement More with less Fanatical discipline
Swift Confidential & Proprietary 12 Central Refrigerated Acquisition
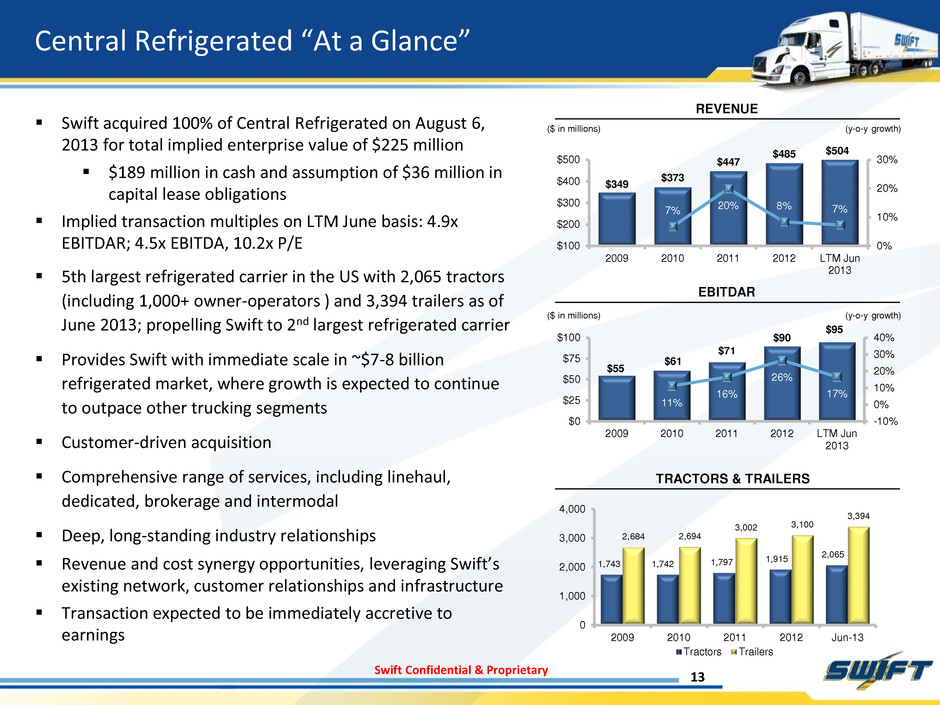
Swift Confidential & Proprietary Central Refrigerated “At a Glance” Swift acquired 100% of Central Refrigerated on August 6, 2013 for total implied enterprise value of $225 million $189 million in cash and assumption of $36 million in capital lease obligations Implied transaction multiples on LTM June basis: 4.9x EBITDAR; 4.5x EBITDA, 10.2x P/E 5th largest refrigerated carrier in the US with 2,065 tractors (including 1,000+ owner-operators ) and 3,394 trailers as of June 2013; propelling Swift to 2nd largest refrigerated carrier Provides Swift with immediate scale in ~$7-8 billion refrigerated market, where growth is expected to continue to outpace other trucking segments Customer-driven acquisition Comprehensive range of services, including linehaul, dedicated, brokerage and intermodal Deep, long-standing industry relationships Revenue and cost synergy opportunities, leveraging Swift’s existing network, customer relationships and infrastructure Transaction expected to be immediately accretive to earnings REVENUE EBITDAR TRACTORS & TRAILERS ($ in millions) (y-o-y growth) ($ in millions) (y-o-y growth) 1,743 1,742 1,797 1,915 2,065 2,684 2,694 3,002 3,100 3,394 0 1,000 2,000 3,000 4,000 2009 2010 2011 2012 Jun-13 Tractors Trailers $349 $373 $447 $485 $504 7% 20% 8% 7% 0% 10% 20% 30% $100 $200 $300 $400 $500 2009 2010 2011 2012 LTM Jun 2013 $55 $61 $71 $90 $95 11% 16% 26% 17% -10% 0% 10% 20% 30% 40% $0 $25 $50 $75 $100 2009 2010 2011 2012 LTM Jun 2013 13
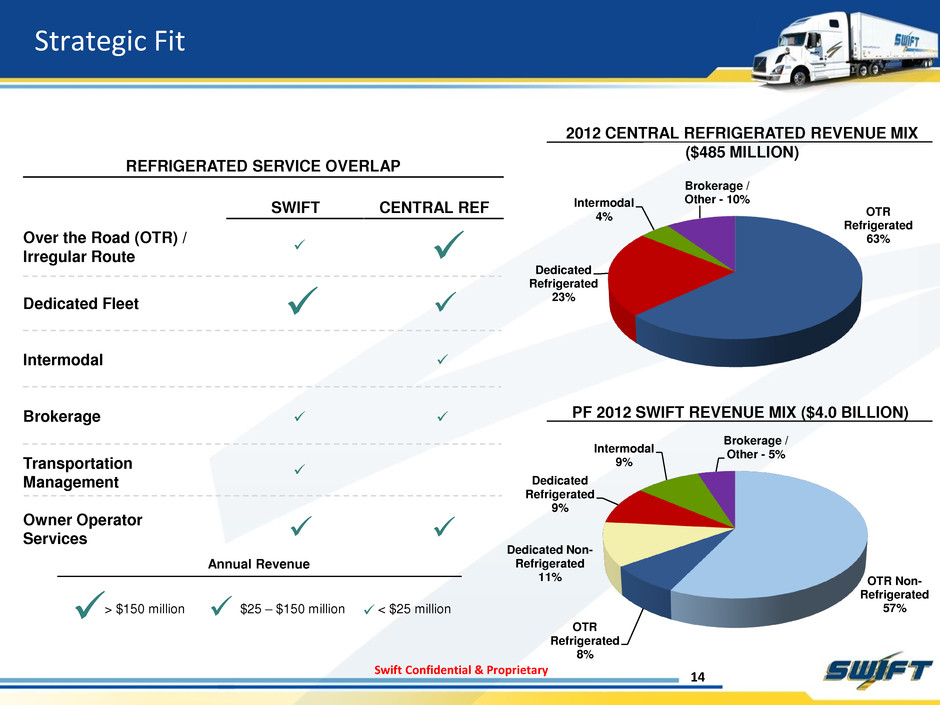
Swift Confidential & Proprietary OTR Refrigerated 63% Dedicated Refrigerated 23% Intermodal 4% Brokerage / Other - 10% Strategic Fit 2012 CENTRAL REFRIGERATED REVENUE MIX ($485 MILLION) REFRIGERATED SERVICE OVERLAP SWIFT CENTRAL REF Over the Road (OTR) / Irregular Route Dedicated Fleet Intermodal Brokerage Transportation Management Owner Operator Services OTR Non- Refrigerated 57% OTR Refrigerated 8% Dedicated Non- Refrigerated 11% Dedicated Refrigerated 9% Intermodal 9% Brokerage / Other - 5% PF 2012 SWIFT REVENUE MIX ($4.0 BILLION) $25 – $150 million > $150 million < $25 million Annual Revenue 14
Swift Confidential & Proprietary 15 Financial Summary
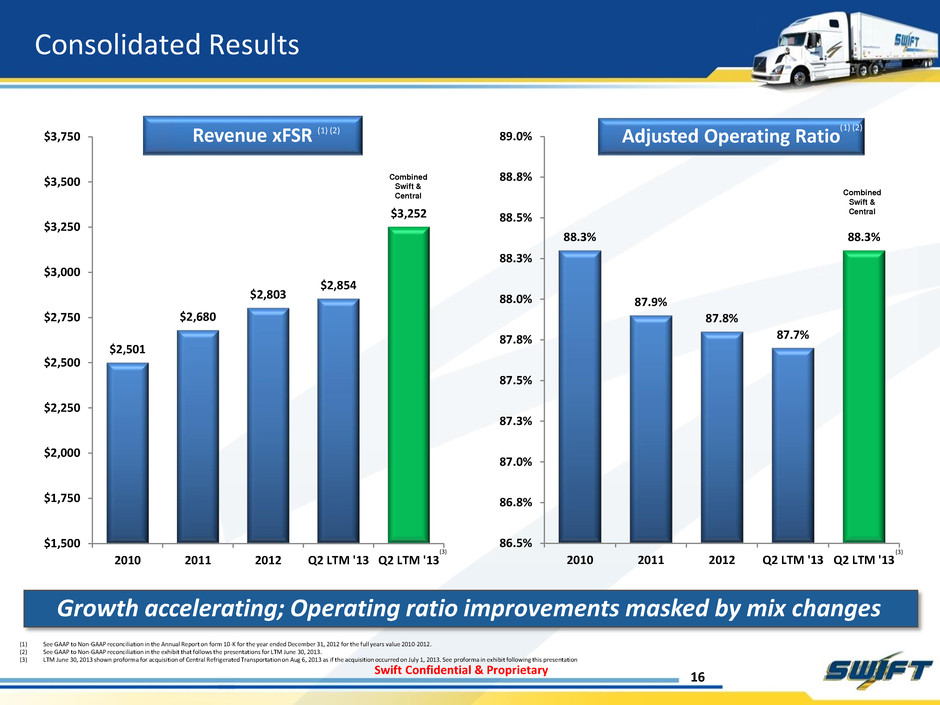
Swift Confidential & Proprietary 88.3% 87.9% 87.8% 87.7% 88.3% 86.5% 86.8% 87.0% 87.3% 87.5% 87.8% 88.0% 88.3% 88.5% 88.8% 89.0% 2010 2011 2012 Q2 LTM '13 Q2 LTM '13 S/C Consolidated Results 16 Growth accelerating; Operating ratio improvements masked by mix changes Revenue xFSR Adjusted Operating Ratio (1) See GAAP to Non-GAAP reconciliation in the Annual Report on form 10-K for the year ended December 31, 2012 for the full years value 2010-2012. (2) See GAAP to Non-GAAP reconciliation in the exhibit that follows the presentations for LTM June 30, 2013. (3) LTM June 30, 2013 shown proforma for acquisition of Central Refrigerated Transportation on Aug 6, 2013 as if the acquisition occurred on July 1, 2013. See proforma in exhibit following this presentation (1) (2) (3) (3) $2,501 $2,680 $2,803 $2,854 $3,252 $1,500 $1,750 $2,000 $2,250 $2,500 $2,750 $3,000 $3,250 $3,500 $3,750 2010 2011 2012 Q2 LTM '13 Q2 LTM '13 S/C Combined Swift & Central Combined Swift & Central (1) (2)
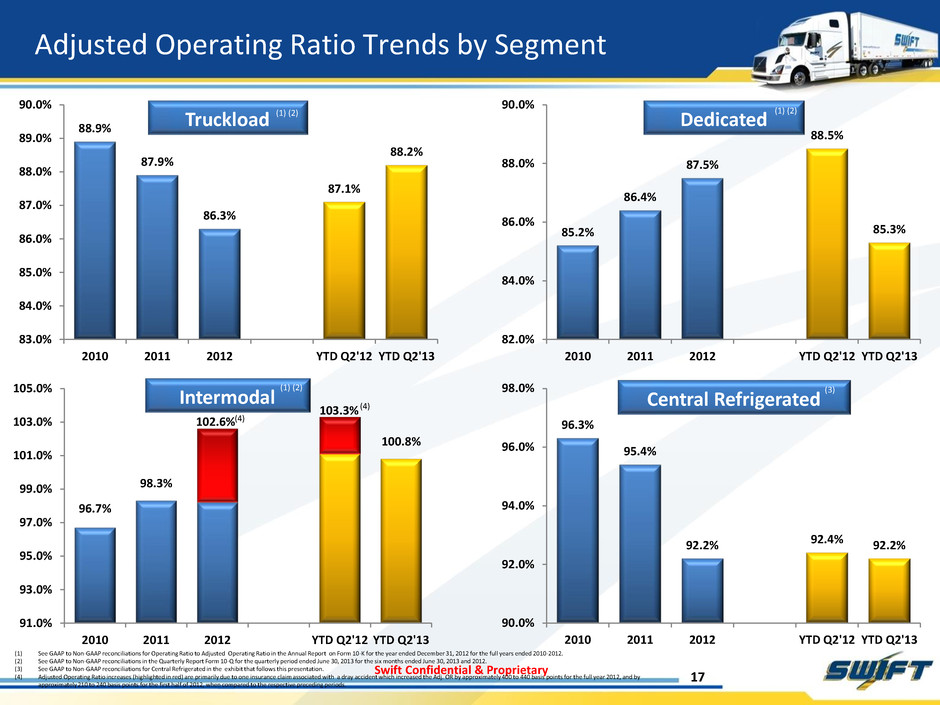
Swift Confidential & Proprietary Adjusted Operating Ratio Trends by Segment 17 Truckload Dedicated Intermodal Central Refrigerated (1) See GAAP to Non-GAAP reconciliations for Operating Ratio to Adjusted Operating Ratio in the Annual Report on Form 10-K for the year ended December 31, 2012 for the full years ended 2010-2012. (2) See GAAP to Non-GAAP reconciliations in the Quarterly Report Form 10-Q for the quarterly period ended June 30, 2013 for the six months ended June 30, 2013 and 2012. (3) See GAAP to Non-GAAP reconciliations for Central Refrigerated in the exhibit that follows this presentation. (4) Adjusted Operating Ratio increases (highlighted in red) are primarily due to one insurance claim associated with a dray accident which increased the Adj. OR by approximately 400 to 440 basis points for the full year 2012, and by approximately 210 to 240 basis points for the first half of 2012, when compared to the respective preceding periods. (1) (2) (1) (2) (1) (2) (3) 88.9% 87.9% 86.3% 87.1% 88.2% 83.0% 84.0% 85.0% 86.0% 87.0% 88.0% 89.0% 90.0% 2010 2011 2012 YTD Q2'12 YTD Q2'13 85.2% 86.4% 87.5% 88.5% 85.3% 82.0% 84.0% 86.0% 88.0% 90.0% 2010 2011 2012 YTD Q2'12 YTD Q2'13 96.7% 98.3% 100.8% 91.0% 93.0% 95.0% 97.0% 99.0% 101.0% 103.0% 105.0% 2010 2011 2012 YTD Q2'12 YTD Q2'13 102.6% 103.3% (4) (4) 96.3 95.4% 92.2% 92.4% 92.2% 90.0% 92.0% 94.0% 96.0% 98.0% 2010 2011 2012 YTD Q2'12 YTD Q2'13
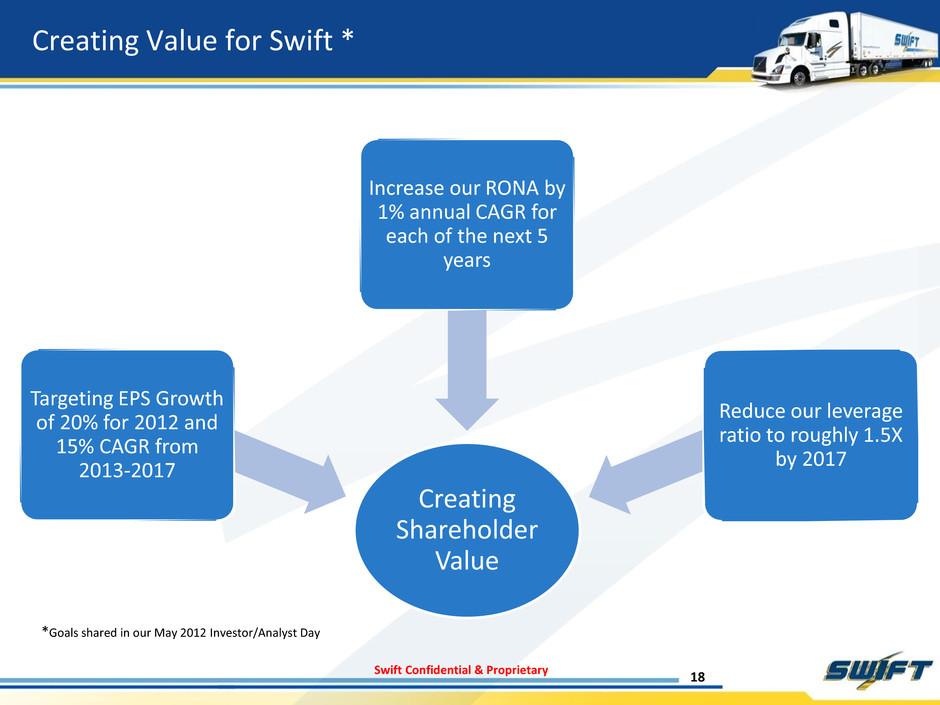
Swift Confidential & Proprietary Creating Value for Swift * Creating Shareholder Value Increase our RONA by 1% annual CAGR for each of the next 5 years Targeting EPS Growth of 20% for 2012 and 15% CAGR from 2013-2017 18 Reduce our leverage ratio to roughly 1.5X by 2017 *Goals shared in our May 2012 Investor/Analyst Day
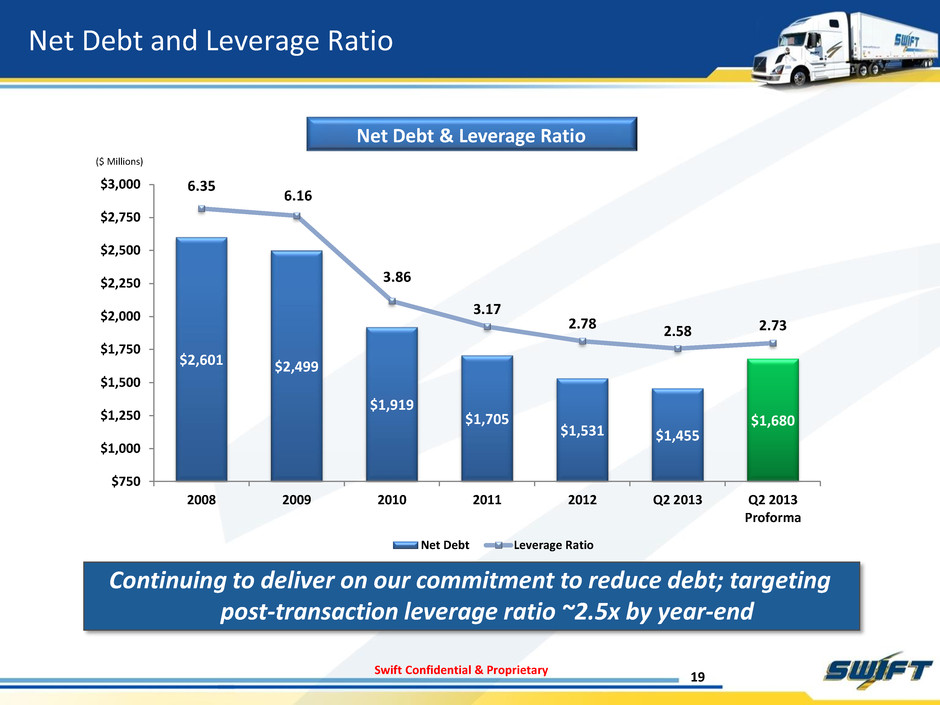
Swift Confidential & Proprietary Net Debt and Leverage Ratio 19 Continuing to deliver on our commitment to reduce debt; targeting post-transaction leverage ratio ~2.5x by year-end Net Debt & Leverage Ratio $2,601 $2,499 $1,919 $1,705 $1,531 $1,455 $1,680 6.35 6.16 3.86 3.17 2.78 2.58 2.73 $750 $1,000 $1,250 $1,500 $1,750 $2,000 $2,250 $2,500 $2,750 $3,000 2008 2009 2010 2011 2012 Q2 2013 Q2 2013 Proforma ($ Millions) Net Debt Leverage Ratio
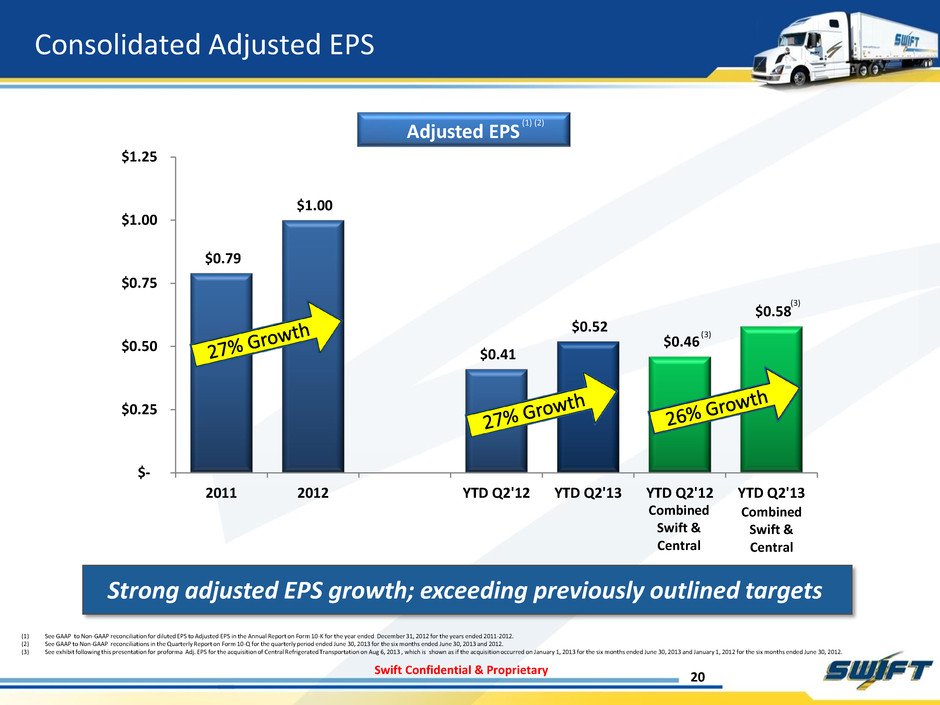
Swift Confidential & Proprietary $0.79 $1.00 $0.41 $0.52 $0.46 $0.58 $- $0.25 $0.50 $0.75 $1.00 $1.25 2011 2012 YTD Q2'12 YTD Q2'13 YTD Q2'12 YTD Q2'13 Combined Swift & Central Combined Swift & Central Consolidated Adjusted EPS 20 Strong adjusted EPS growth; exceeding previously outlined targets Adjusted EPS (1) (2) (3) (3) (1) See GAAP to Non-GAAP reconciliation for diluted EPS to Adjusted EPS in the Annual Report on Form 10-K for the year ended December 31, 2012 for the years ended 2011-2012. (2) See GAAP to Non-GAAP reconciliations in the Quarterly Report on Form 10-Q for the quarterly period ended June 30, 2013 for the six months ended June 30, 2013 and 2012. (3) See exhibit following this presentation for proforma Adj. EPS for the acquisition of Central Refrigerated Transportation on Aug 6, 2013 , which is shown as if the acquisition occurred on January 1, 2013 for the six months ended June 30, 2013 and January 1, 2012 for the six months ended June 30, 2012.
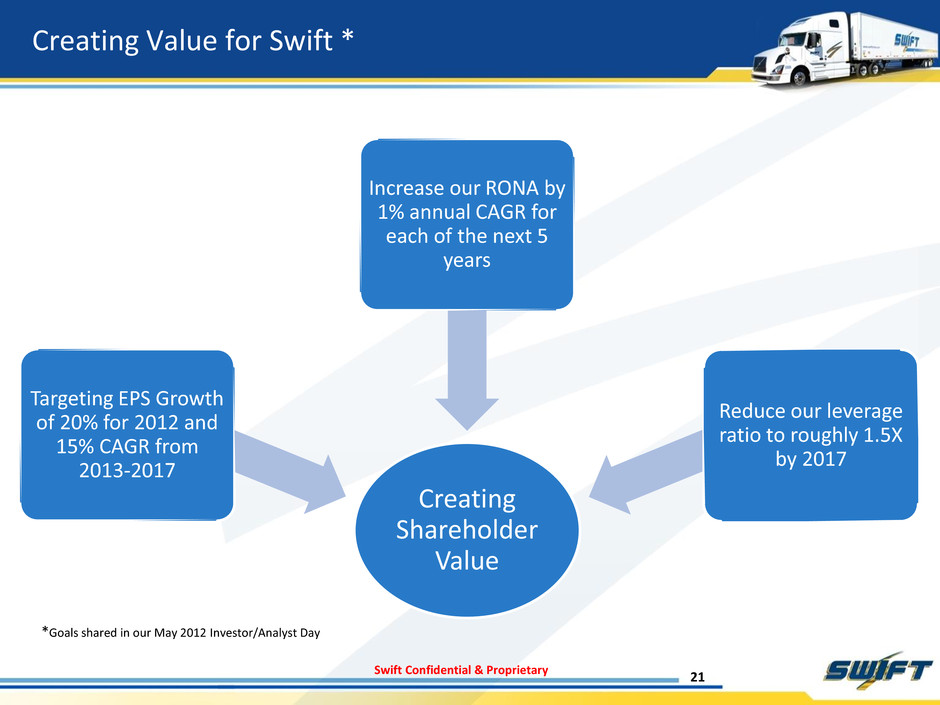
Swift Confidential & Proprietary Creating Value for Swift * Creating Shareholder Value Increase our RONA by 1% annual CAGR for each of the next 5 years Targeting EPS Growth of 20% for 2012 and 15% CAGR from 2013-2017 21 Reduce our leverage ratio to roughly 1.5X by 2017 *Goals shared in our May 2012 Investor/Analyst Day
Swift Confidential & Proprietary 22 Appendix
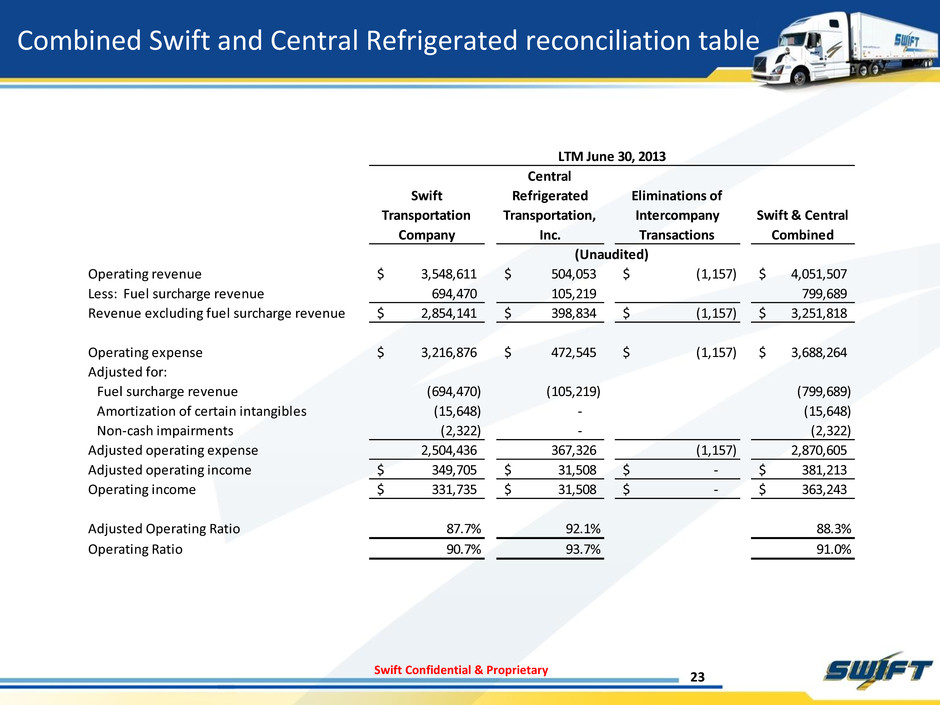
Swift Confidential & Proprietary Combined Swift and Central Refrigerated reconciliation table 23 Swift Transportation Company Central Refrigerated Transportation, Inc. Eliminations of Intercompany Transactions Swift & Central Combined Operating revenue 3,548,611$ 504,053$ (1,157)$ 4,051,507$ Less: Fuel surcharge revenue 694,470 105,219 799,689 Revenue excluding fuel surcharge revenue 2,854,141$ 398,834$ (1,157)$ 3,251,818$ Operating expense 3,216,876$ 472,545$ (1,157)$ 3,688,264$ Adjusted for: Fuel surcharge revenue (694,470) (105,219) (799,689) Amortization of certain intangibles (15,648) - (15,648) Non-cash impairments (2,322) - (2,322) Adjusted operating expense 2,504,436 367,326 (1,157) 2,870,605 Adjusted operating income 349,705$ 31,508$ -$ 381,213$ Operating income 331,735$ 31,508$ -$ 363,243$ Adjusted Operating Ratio 87.7% 92.1% 88.3% Operating Ratio 90.7% 93.7% 91.0% LTM June 30, 2013 (Unaudited)
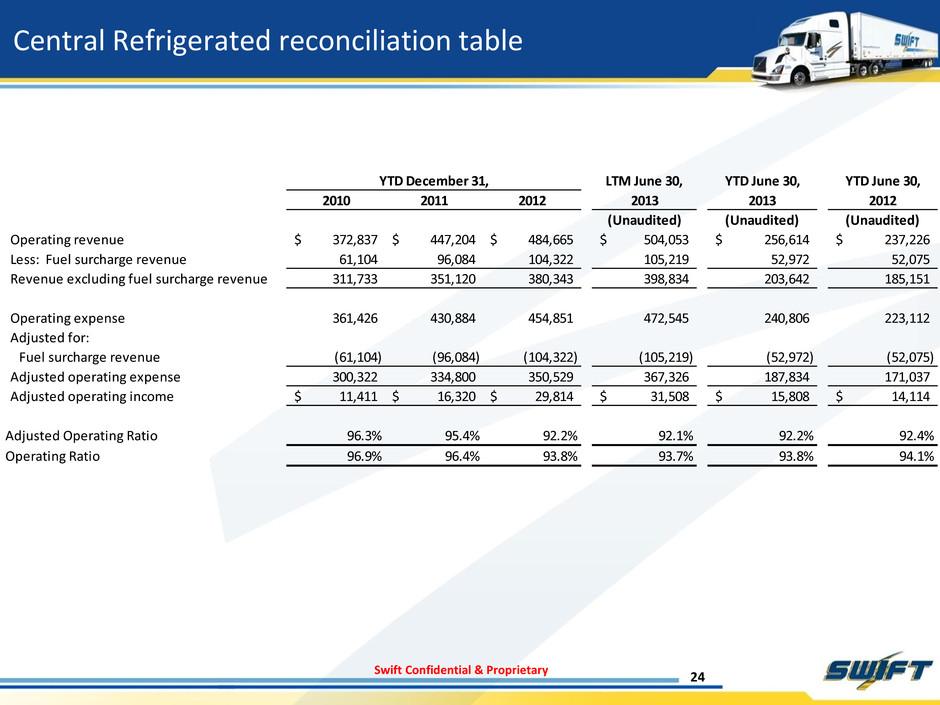
Swift Confidential & Proprietary Central Refrigerated reconciliation table 24 LTM June 30, YTD June 30, YTD June 30, 2010 2011 2012 2013 2013 2012 (Unaudited) (Unaudited) (Unaudited) Operating revenue 372,837$ 447,204$ 484,665$ 504,053$ 256,614$ 237,226$ Less: Fuel surcharge revenue 61,104 96,084 104,322 105,219 52,972 52,075 Revenue excluding fuel surcharge revenue 311,733 351,120 380,343 398,834 203,642 185,151 Operating expense 361,426 430,884 454,851 472,545 240,806 223,112 Adjusted for: Fuel surcharge revenue (61,104) (96,084) (104,322) (105,219) (52,972) (52,075) Adjusted operating expense 300,322 334,800 350,529 367,326 187,834 171,037 Adjusted operating income 11,411$ 16,320$ 29,814$ 31,508$ 15,808$ 14,114$ Adjusted Operating Ratio 96.3% 95.4% 92.2% 92.1% 92.2% 92.4% Operating Ratio 96.9% 96.4% 93.8% 93.7% 93.8% 94.1% YTD December 31,
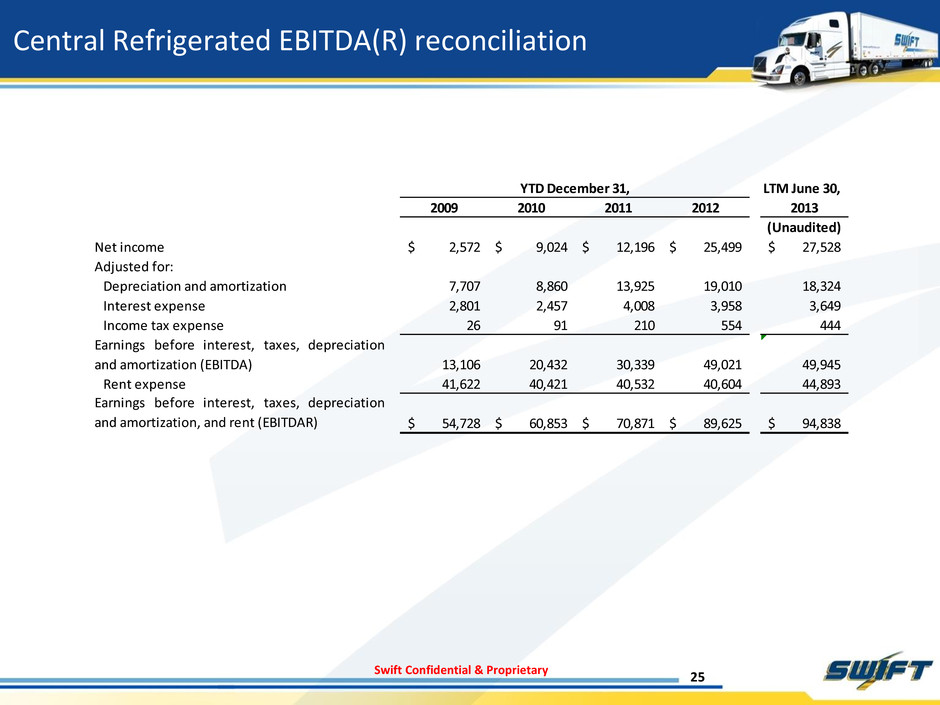
Swift Confidential & Proprietary Central Refrigerated EBITDA(R) reconciliation 25 LTM June 30, 2009 2010 2011 2012 2013 (Unaudited) Net income 2,572$ 9,024$ 12,196$ 25,499$ 27,528$ Adjusted for: Depr ciation and amortization 7,707 8,860 13,925 19,010 18,324 Interest expense 2,801 2,457 4,008 3,958 3,649 Income tax expense 26 91 210 554 444 Earnings before interest, taxes, depreciation and amortization (EBITDA) 13,106 20,432 30,339 49,021 49,945 Rent expense 41,622 40,421 40,532 40,604 44,893 Earnings before interest, taxes, depreciation and amortization, and rent (EBITDAR) 54,728$ 60,853$ 70,871$ 89,625$ 94,838$ YTD December 31,
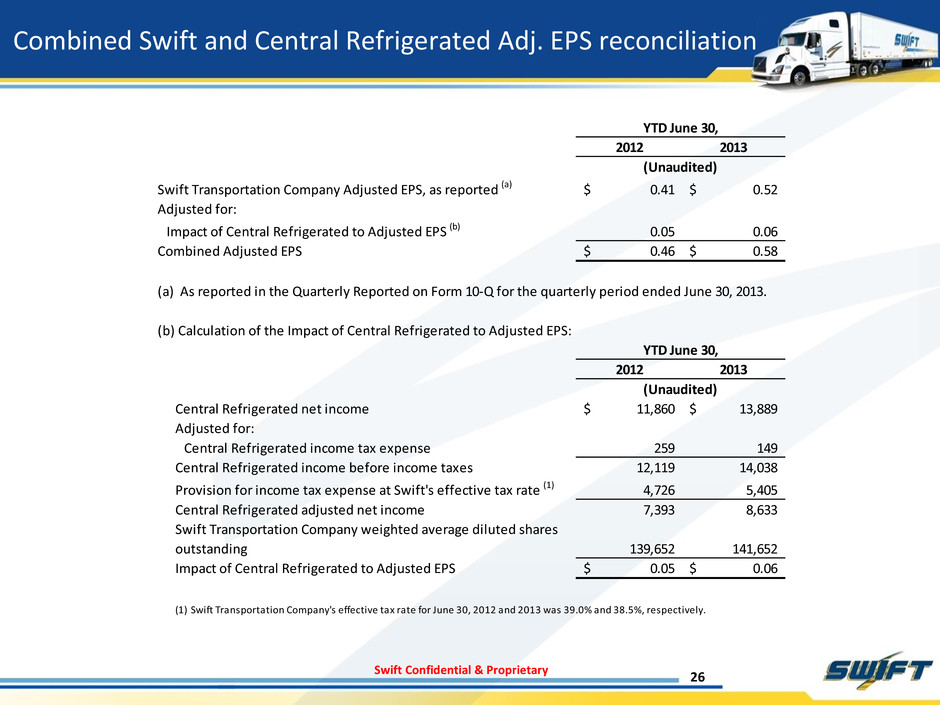
Swift Confidential & Proprietary Combined Swift and Central Refrigerated Adj. EPS reconciliation 26 2012 2013 Swift Transportation Company Adjusted EPS, as reported (a) 0.41$ 0.52$ Adjusted for: Impact of Central Refrigerated to Adjusted EPS (b) 0.05 0.06 Combined Adjusted EPS 0.46$ 0.58$ (a) As reported in the Quarterly Reported on Form 10-Q for the quarterly period ended June 30, 2013. (b) Calculation of the Impact of Central Refrigerated to Adjusted EPS: 2012 2013 Central Refrigerated net income 11,860$ 13,889$ Adjusted for: Central Refrigerated income tax expense 259 149 Central Refrigerated income before income taxes 12,119 14,038 Provision for income tax expense at Swift's effective tax rate (1) 4,726 5,405 Central Refrigerated adjusted net income 7,393 8,633 Swift Transportation Company weighted average diluted shares outstanding 139,652 141,652 Impact of Central Refrigerated to Adjusted EPS 0.05$ 0.06$ (1) Swift Transportation Company's effective tax rate for June 30, 2012 and 2013 was 39.0% and 38.5%, respectively. (Unaudited) YTD June 30, YTD June 30, (Unaudited)


