October 23, 2013
Dear Fellow Stockholders of Swift Transportation Company (NYSE: SWFT),
As we announced on August 6, 2013, we acquired Central Refrigerated Transportation ("Central Refrigerated"), an entity controlled by Mr. Jerry Moyes, our Chief Executive Officer and controlling stockholder. As a result of Mr. Moyes' controlling interest in both Central Refrigerated and us, we have used the common control accounting method to account for the acquisition, which is similar to the pooling of interests method. Under common control accounting, the historical results of Central Refrigerated have been combined with our results. As such, unless otherwise noted, all of the historical financial results have been recast to include the results of Central Refrigerated.
A summary of our key results for the three and nine months ended September 30,th is shown below:
|
| | | | | | | | | | | | | | | | | | | | | | | |
| | Three Months Ended September 30, | | Nine Months Ended September 30, |
| | 2013 | | 2012 | | 2011 | | 2013 | | 2012 | | 2011 |
| | Unaudited |
| | ($ in millions, except per share data) |
| Operating Revenue | $ | 1,032.1 |
| | $ | 992.6 |
| | $ | 977.5 |
| | $ | 3,042.8 |
| | $ | 2,928.5 |
| | $ | 2,800.1 |
|
Revenue xFSR1 | $ | 833.4 |
| | $ | 798.2 |
| | $ | 780.4 |
| | $ | 2,448.1 |
| | $ | 2,343.3 |
| | $ | 2,240.5 |
|
| | | | | | | | | | | | |
| Operating Ratio | 91.8 | % | | 92.2 | % | | 90.6 | % | | 91.6 | % | | 91.9 | % | | 92.2 | % |
Adjusted Operating Ratio2 | 89.3 | % | | 89.8 | % | | 87.6 | % | | 89.1 | % | | 89.4 | % | | 89.7 | % |
| | | | | | | | | | | | |
| EBITDA | $ | 144.0 |
| | $ | 135.8 |
| | $ | 152.0 |
| | $ | 437.1 |
| | $ | 393.1 |
| | $ | 396.2 |
|
Adjusted EBITDA2 | $ | 150.8 |
| | $ | 137.3 |
| | $ | 152.8 |
| | $ | 450.4 |
| | $ | 420.7 |
| | $ | 401.9 |
|
| | | | | | | | | | | | |
| Diluted EPS | $ | 0.21 |
| | $ | 0.24 |
| | $ | 0.23 |
| | $ | 0.78 |
| | $ | 0.61 |
| | $ | 0.43 |
|
Adjusted EPS2 | $ | 0.29 |
| | $ | 0.23 |
| | $ | 0.26 |
| | $ | 0.87 |
| | $ | 0.70 |
| | $ | 0.53 |
|
| | | | | | | | | | | | |
1Revenue xFSR is operating revenue, excluding fuel surcharge revenue |
2 See GAAP to Non-GAAP reconciliation in the schedules following this letter |
Quarterly Highlights (discussed in more detail below, including GAAP to non-GAAP reconciliations):
| |
• | Third quarter 2013 Adjusted EPS increased 26.1% to $0.29 versus $0.23 in the third quarter of 2012; Year to date September 30, 2013 Adjusted EPS increased to $0.87 from $0.70 in 2012 |
| |
• | Truckload Adjusted Operating Ratio improved 60 basis points year over year driven by a 2.4% increase in Revenue xFSR per loaded mile |
| |
• | Dedicated Adjusted Operating Ratio improved 230 basis points year over year resulting from business mix changes, operational improvements, and improved fuel surcharge recovery |
| |
• | Intermodal Adjusted Operating Ratio improved 650 basis points year over year and Container on Flat Car volumes increased 10.6% |
| |
| • | Central Refrigerated Revenue xFSR grew 15.1% year over year |
| |
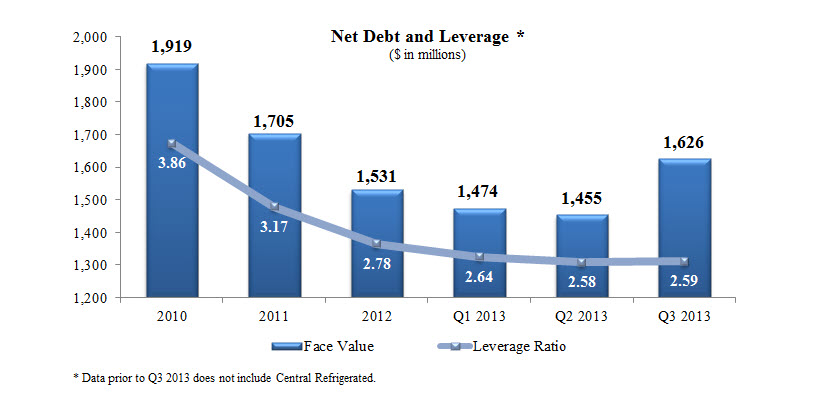
• | Net debt reductions of $55 million in the third quarter largely offset the impact of financing the Central Refrigerated acquisition, resulting in a leverage ratio of 2.59 at September 30, 2013, which is consistent with the June 30, 2013 ratio of 2.58. |
Third Quarter Overview
For the quarter ended September 30, 2013, we generated Operating Revenue of $1,032.1 million compared to $992.6 million in the same quarter of 2012. Our Revenue xFSR grew 4.4% to $833.4 million. Diluted earnings per share, in accordance with GAAP, was $0.21 in the third quarter of 2013 compared to $0.24 in the third quarter of 2012. Adjusted diluted earnings per share, or Adjusted EPS, increased 26.1% to $0.29 compared to $0.23 in the same quarter of 2012. A reconciliation of GAAP results to non-GAAP results, as adjusted to exclude certain non-cash or special items per our definition of Adjusted EPS, is provided in the schedules following this letter.
This quarter's results continue to demonstrate our team's ability to improve while facing less than ideal market conditions. Our industry is experiencing substantial headwinds including higher equipment and maintenance costs, an increasingly constrained driver market, challenging new hours of service regulations, and a lackluster freight environment. Despite these obstacles, we are pleased with our team's ability to improve in several key areas. Our Adjusted Operating Ratio improved in our Truckload, Dedicated and Intermodal segments. Our Intermodal segment was profitable through the first nine months of the year as we have grown revenue and increased the utilization of our equipment and we expect this trend to continue into the fourth quarter. We are in the process of adding several new dedicated accounts which should add positive growth in the fourth quarter and into 2014. The integration of recently acquired Central Refrigerated is progressing on schedule. For the quarter, Revenue xFSR for Central Refrigerated grew over 15% year over year with the addition of several customers including a large new dedicated account. Swift and Central Refrigerated teams are working together to integrate and maximize our operational efficiencies and we are optimistic about the future. Above all, our focus is to both deliver an exceptional customer experience and generate higher returns for our shareholders through increasing our Return on Net Assets and growing our earnings per share. Although productivity improvements in our Truckload segment slowed, primarily due to the new hours of service regulations, we were still able to improve our Weekly Revenue xFSR per tractor 1.2% over the prior year comparable quarter, while our Dedicated segment was relatively flat and our new Central Refrigerated segment improved 4.3% over the same time period. Our Adjusted EPS for the first nine months grew over 24% compared to the same period in 2012, which places us well ahead of our stated goal of 15% Adjusted EPS growth for 2013.
Third Quarter Results by Reportable Segment
Truckload Segment
Our Truckload segment consists of one-way movements over irregular routes throughout the United States, Mexico and Canada. This service uses both company and owner-operator tractors with dry van, flatbed and other specialized trailing equipment.
Revenue xFSR for the third quarter of 2013 increased 2.9% to $460.4 million compared with $447.5 million for the same quarter in 2012. This increase in Revenue xFSR was driven by a 2.4% increase in Revenue xFSR per loaded mile and an increase in loaded miles of 0.5%. Weekly Revenue xFSR per Tractor increased 1.2% to $3,212 driven by a 2.4% increase in Revenue xFSR per loaded mile partially offset by a 1.2% decrease in loaded miles per tractor per week due primarily to the new hours of service rules implemented early in the third quarter of 2013.
The Adjusted Operating Ratio in our Truckload segment improved 60 basis points over the third quarter of 2012. The year over year improvement was driven primarily by an increase in revenue per loaded mile, improved fuel surcharge recovery and improved fuel efficiency in the third quarter of 2013 as compared to the prior year. These improvements were partially offset by increased deadhead caused by the repositioning of equipment to service overbooked markets, higher overall insurance costs, higher equipment maintenance costs and increased equipment costs due to the higher costs of new equipment.
|
| | | | | | | | | | | |
| | Three Months Ended September 30, |
| 2013 |
| 2012 |
| 2011 |
Operating Revenue (1) | $ | 579.5 |
|
| $ | 564.8 |
|
| $ | 607.0 |
|
Revenue xFSR(1)(2) | $ | 460.4 |
|
| $ | 447.5 |
|
| $ | 477.2 |
|
|
|
|
|
|
|
| Operating Ratio | 90.0 | % |
| 90.5 | % |
| 88.7 | % |
Adjusted Operating Ratio(3) | 87.4 | % |
| 88.0 | % |
| 85.6 | % |
|
|
|
|
|
|
| Weekly Revenue xFSR per Tractor | $ | 3,212 |
|
| $ | 3,174 |
|
| $ | 3,056 |
|
| Average Operational Truck Count | 10,907 |
| 10,726 |
| 11,883 |
| Deadhead Percentage | 11.5 | % |
| 10.9 | % |
| 10.5 | % |
| | | | | | |
1 In millions |
2 Revenue xFSR is operating revenue, excluding fuel surcharge revenue |
3 See GAAP to Non-GAAP reconciliation in the schedules following this letter |
During the third quarter, we grew our Truckload segment Average Operational Truck Count by 181 trucks year over year but reduced our fleet by 114 trucks sequentially due to the transition of equipment to our Dedicated segment. For the fourth quarter, we expect our Truckload segment truck count to drop approximately 150 to 200 trucks as we shift additional resources to support revenue growth in our Dedicated segment.
Dedicated Segment
Through our Dedicated segment, we devote equipment and offer tailored solutions under long-term contracts with customers. This dedicated business utilizes refrigerated, dry van, flatbed and other specialized trailing equipment.
Our Adjusted Operating Ratio in our Dedicated segment improved 230 basis points to 86.3% in the third quarter of 2013 compared to 88.6% in the third quarter of the prior year. This improvement was primarily due to the improved fuel surcharge recovery arising from more stable fuel prices in the third quarter of 2013 versus the prior year and the termination of certain underperforming contracts in the second half of 2012 that we discussed in previous quarters. Revenue xFSR for our Dedicated segment was consistent with the prior year reflecting the addition of new customer accounts, which offset the termination of the underperforming contracts.
|
| | | | | | | | | | | |
| | Three Months Ended September 30, |
| | 2013 | | 2012 | | 2011 |
Operating Revenue (1) | $ | 184.6 |
| | $ | 182.8 |
| | $ | 158.9 |
|
Revenue xFSR(1)(2) | $ | 150.1 |
| | $ | 149.9 |
| | $ | 130.0 |
|
| | | | | | |
| Operating Ratio | 88.9 | % | | 90.7 | % | | 88.6 | % |
Adjusted Operating Ratio(3) | 86.3 | % | | 88.6 | % | | 86.0 | % |
| | | | | | |
| Weekly Revenue xFSR per Tractor | $ | 3,326 |
| | $ | 3,336 |
| | $ | 3,281 |
|
| Average Operational Truck Count | 3,434 |
| | 3,419 |
| | 3,015 |
|
| | | | | | |
1 In millions |
2 Revenue xFSR is operating revenue, excluding fuel surcharge revenue |
3 See GAAP to Non-GAAP reconciliation in the schedules following this letter |
Sequentially, we grew our Dedicated truck count 67 trucks from 3,367 for the second quarter of 2013 to 3,434 for the third quarter of 2013. We currently have several opportunities that have recently been awarded and/or are expected to close shortly and as a result we expect to grow our average operational truck count for the fourth quarter approximately 200 trucks from the third quarter average.
Central Refrigerated Segment (CRS)
Our CRS segment is primarily shipments for customers that require temperature-controlled trailers and represents the core operations of Central Refrigerated. These shipments include one-way movements over irregular routes, dedicated truck operations, as well as a small number of Intermodal Trailer of Flat Car (TOFC) and Third Party Logistics loads.
|
| | | | | | | | | | | |
| | Three Months Ended September 30, |
| | 2013 | | 2012 | | 2011 |
Operating Revenue (1) | $ | 136.5 |
| | $ | 122.0 |
| | $ | 114.2 |
|
Revenue xFSR(1)(2) | $ | 110.8 |
| | $ | 96.3 |
| | $ | 89.6 |
|
| | | | | | |
| Operating Ratio | 96.9 | % | | 94.4 | % | | 97.7 | % |
Adjusted Operating Ratio(3) | 95.4 | % | | 92.9 | % | | 97.0 | % |
| | | | | | |
| Weekly Revenue xFSR per Tractor | $ | 3,471 |
| | $ | 3,327 |
| | $ | 3,274 |
|
| Average Operational Truck Count | 2,017 |
| | 1,846 |
| | 1,760 |
|
| Deadhead Percentage | 13.6 | % | | 12.6 | % | | 12.5 | % |
| | | | | | |
1 In millions |
2 Revenue xFSR is operating revenue, excluding fuel surcharge revenue |
3 See GAAP to Non-GAAP reconciliation in the schedules following this letter |
Revenue xFSR for the third quarter of 2013 increased 15.1% to $110.8 million compared to $96.3 million for the same quarter in 2012. This increase in Revenue xFSR was driven by growth in volume and pricing with our existing customers and the addition of several new customers including a significant new dedicated customer added during the second quarter of 2013. This new dedicated business has a much lower average length of haul, higher deadhead and a much higher Revenue xFSR per loaded mile. This new business combined with the other revenue growth caused our Weekly Revenue xFSR per Tractor to improve 4.3% over the prior year.
The Adjusted Operating Ratio in our CRS segment increased 250 basis points over the third quarter of 2012. The year over year increase was driven primarily by new dedicated start up costs, higher group health expenses and higher insurance costs.
Intermodal Segment
Our Intermodal segment includes revenue generated by freight moving over the rail in our containers and other trailing equipment, combined with revenue for drayage to transport loads between the railheads and customer locations.
|
| | | | | | | | | | | |
| | Three Months Ended September 30, |
| 2013 |
| 2012 |
| 2011 |
Operating Revenue (1) | $ | 89.8 |
|
| $ | 86.1 |
|
| $ | 63.2 |
|
Revenue xFSR(1)(2) | $ | 71.2 |
|
| $ | 67.9 |
|
| $ | 49.5 |
|
|
|
|
|
|
|
Operating Ratio (4) | 97.8 | % |
| 102.9 | % |
| 99.5 | % |
Adjusted Operating Ratio(3)(4) | 97.2 | % |
| 103.7 | % |
| 99.3 | % |
|
|
|
|
|
|
| Load Counts | 39,392 |
| 37,878 |
| 27,879 |
| Average Container Counts | 8,717 |
| 7,403 |
| 5,820 |
| | | | | | |
1 In millions |
2 Revenue xFSR is operating revenue, excluding fuel surcharge revenue |
3 See GAAP to Non-GAAP reconciliation in the schedules following this letter |
4 During 2012, our Intermodal reportable segment incurred an increase in its insurance and claims expense primarily related to one claim associated with a drayage accident, which increased the Intermodal Operating Ratio by approximately 310 to 340 basis points and the Intermodal Adjusted Operating Ratio by approximately 390 to 430 basis points for the three months ended September 30, 2012, as compared to the corresponding periods in 2011 and 2013. |
During the third quarter of 2013, Revenue xFSR in our Intermodal segment grew 4.9% over the third quarter of 2012. This increase in Revenue xFSR was driven by a 0.8% increase in the Revenue xFSR per load and a 10.6% increase in Container on Flat Car (COFC) loads partially offset by a 37.8% reduction in Trailer on Flat Car (TOFC) loads.
Our average container count grew by 17.7% to 8,717 in the third quarter of 2013 when compared to the same period in 2012, but remained unchanged from our container count at December 31, 2012. As stated in prior communications, we expect to achieve 2013 intermodal revenue growth by increasing the utilization of our container fleet and do not expect to purchase additional containers in 2013.
For the third quarter, the Intermodal Adjusted Operating Ratio improved 650 basis points to 97.2% in 2013 from 103.7% in 2012 due primarily to lower insurance costs in the third quarter of 2013 versus the prior year, higher
revenue per load, and improved utilization of our equipment. As discussed previously, our Intermodal segment had higher insurance costs in the third quarter of 2012 primarily driven by one significant dray accident in 2012. This increased the Intermodal Operating Ratio by approximately 310 to 340 basis points, and Adjusted Operating Ratio by approximately 390 to 430 basis points, compared to the third quarters of 2011 and 2013. The current quarter improvements were partially offset by increased equipment costs resulting from the larger container fleet and related chassis expenses as compared to the third quarter of 2012.
Other Revenue
Other Revenue includes revenue generated by our logistics and brokerage services as well as revenue generated by our subsidiaries offering support services to customers and owner-operators, including shop maintenance, equipment leasing and insurance. In the third quarter of 2013, combined revenue from these services decreased 3.5% compared to the same quarter in 2012, driven primarily by a decrease in the number of wholesale loads brokered to balance our Truckload segment network, partially offset by an increase in revenue from services provided to owner-operators.
Third Quarter Consolidated Operating Expenses
The table below highlights some of our cost categories for the third quarter of 2013, compared to the third quarter of 2012 and the second quarter of 2013, showing each as a percent of Revenue xFSR. Fuel surcharge revenue can be volatile and is primarily dependent upon the cost of fuel and not specifically related to our non-fuel operational expenses. Therefore, we believe that Revenue xFSR is a better measure for analyzing our expenses and operating metrics.
|
| | | | | | | | | | | | | | | | | | | | |
| | | | | YOY | | | | | | QOQ |
| Q3'13 | | Q3'12 | | Variance1 | ($ in millions) | Q3'13 | | Q2'13 | | Variance1 |
| | | (recast) | | | | | | (recast) | | |
| $ | 1,032.1 |
| | $ | 992.6 |
| | 4.0 | % | Total Revenue | $ | 1,032.1 |
| | $ | 1,029.1 |
| | 0.3 | % |
| $ | (198.7 | ) | | $ | (194.5 | ) | | 2.2 | % | Less: Fuel Surcharge Revenue | $ | (198.7 | ) | | $ | (198.9 | ) | | -0.1 | % |
| $ | 833.4 |
| | $ | 798.2 |
| | 4.4 | % | Revenue xFSR | $ | 833.4 |
| | $ | 830.2 |
| | 0.4 | % |
| | | | | | | | | | | |
| $ | 220.2 |
| | $ | 218.6 |
| | -0.7 | % | Salaries, Wages & Benefits | $ | 220.2 |
| | $ | 223.9 |
| | 1.7 | % |
| 26.4 | % | | 27.4 | % | | 100 bps |
| % of Revenue xFSR | 26.4 | % | | 27.0 | % | | 60 bps |
|
| | | | | | | | | | | |
| $ | 85.2 |
| | $ | 75.3 |
| | -13.1 | % | Operating Supplies & Expenses | $ | 85.2 |
| | $ | 79.0 |
| | -7.8 | % |
| 10.2 | % | | 9.4 | % | | -80 bps |
| % of Revenue xFSR | 10.2 | % | | 9.5 | % | | -70 bps |
|
| | | | | | | | | | | |
| $ | 35.1 |
| | $ | 29.5 |
| | -19.0 | % | Insurance & Claims | $ | 35.1 |
| | $ | 33.6 |
| | -4.5 | % |
| 4.2 | % | | 3.7 | % | | -50 bps |
| % of Revenue xFSR | 4.2 | % | | 4.0 | % | | -20 bps |
|
| | | | | | | | | | | |
| $ | 6.7 |
| | $ | 6.7 |
| | — | % | Communications & Utilities | $ | 6.7 |
| | $ | 5.9 |
| | -13.6 | % |
| 0.8 | % | | 0.8 | % | | 0 bps |
| % of Revenue xFSR | 0.8 | % | | 0.7 | % | | -10 bps |
|
| | | | | | | | | | | |
| $ | 18.6 |
| | $ | 17.3 |
| | -7.5 | % | Operating Taxes & Licenses | $ | 18.6 |
| | $ | 18.5 |
| | -0.5 | % |
| 2.2 | % | | 2.2 | % | | 0 bps |
| % of Revenue xFSR | 2.2 | % | | 2.2 | % | | 0 bps |
|
| | | | | | | | | | | |
1 Positive numbers represent favorable variances, negative numbers represent unfavorable variances |
Salaries, wages and benefits increased $1.6 million to $220.2 million during the third quarter of 2013, compared to $218.6 million for the third quarter of 2012. This year over year increase is primarily due to an increase in non-driving employees and an increase in the number of miles driven by company drivers, partially offset by a reduction in health insurance costs. Sequentially, salaries, wages and benefits decreased by $3.7 million to $220.2 million during the third quarter of 2013 compared to $223.9 million in the second quarter of 2013 due primarily to a decrease in the number of miles driven by company drivers.
Operating supplies and expenses increased $9.9 million to $85.2 million during the third quarter of 2013, compared to $75.3 million for the third quarter of 2012, due primarily to increases in equipment maintenance primarily associated with tires, trailers and increased services to owner-operators.
Insurance and claims expense increased to $35.1 million for the third quarter of 2013, compared to $29.5 million in the third quarter of 2012. As a percent of Revenue xFSR, insurance and claims expense increased to 4.2% in the third quarter of 2013 from 3.7% in the prior year. During the third quarter of 2013, we experienced unfavorable claims development on our prior year loss layers resulting in a negative impact to our expected insurance and claims expense during the quarter. Previously, we estimated that insurance and claims expense as a percentage of Revenue xFSR for the full year 2013 would be in the range of 3.7% to 4.0%. As a result of the unfavorable development in our prior year loss layers recorded in the third quarter, we now expect the full year 2013 insurance and claims expense as a percentage of Revenue xFSR to be approximately 4.0%.
Fuel Expense
|
| | | | | | | | | | | | | | |
| Q3'13 | | Q3'12 | ($ in millions, except D.O.E. Diesel Fuel Index) | Q3'13 | | Q2'13 |
| | | (recast) | | | | (recast) |
| $ | 160.6 |
| | $ | 169.0 |
| Fuel Expense | $ | 160.6 |
| | $ | 160.9 |
|
| 15.6 | % | | 17.0 | % | % of Total Revenue | 15.6 | % | | 15.6 | % |
| | | | | | | |
| $ | 198.7 |
| | $ | 194.5 |
| Fuel Surcharge Revenue (FSR) | $ | 198.7 |
| | $ | 198.9 |
|
| $ | (85.5 | ) | | $ | (84.2 | ) | Less: FSR Reimbursed to Third Parties | $ | (85.5 | ) | | $ | (82.7 | ) |
| $ | 113.2 |
| | $ | 110.3 |
| Company FSR | $ | 113.2 |
| | $ | 116.2 |
|
| | | | | | | |
| $ | 160.6 |
| | $ | 169.0 |
| Fuel Expense | $ | 160.6 |
| | $ | 160.9 |
|
| $ | (113.2 | ) | | $ | (110.3 | ) | Less: Company FSR | $ | (113.2 | ) | | $ | (116.2 | ) |
| $ | 47.4 |
| | $ | 58.7 |
| Net Fuel Expense | $ | 47.4 |
| | $ | 44.6 |
|
| 5.7 | % | | 7.4 | % | % of Revenue xFSR | 5.7 | % | | 5.4 | % |
| | | | | | | |
| $ | 3.918 |
| | $ | 3.924 |
| Average D.O.E. Diesel Fuel Index | $ | 3.918 |
| | $ | 3.873 |
|
| -0.2 | % | | 1.5 | % | Year over Year % Change | -0.2 | % | | -2.3 | % |
Fuel expense for the third quarter of 2013, noted in the chart above, was $160.6 million, representing a decrease of $8.4 million from the third quarter of 2012. We collect fuel surcharge revenue from our customers to help mitigate increases in fuel prices. The surcharges are primarily based on the Department of Energy (D.O.E.) Diesel Fuel Index, which is set on Monday each week based on retail prices at various truck stops around the country. We utilize a portion of our fuel surcharge revenue to reimburse owner-operators and other third parties, such as the railroads, who also must pay for fuel. To evaluate the effectiveness of our fuel surcharges, we deduct the portion of the revenue
we pay to third parties and then subtract the remaining company-related fuel surcharge revenue from our fuel expense. This calculation of Net Fuel Expense is shown above.
During the third quarter of 2013 Net Fuel Expense was $47.4 million compared to $58.7 million in 2012. As discussed previously, we bill fuel surcharges based on a historical D.O.E. Diesel Fuel Index per our customer contracts, which is generally the prior week’s Index, but we pay for fuel based on current day prices. Therefore, in periods of rising fuel prices, we are negatively impacted due to the structural lag in billing fuel surcharges. The opposite is true during periods of declining fuel prices. During the third quarter of 2013, fuel price, based on the Average D.O.E. Diesel Fuel Index, increased 2.4% whereas during the third quarter of 2012, fuel prices increased 12.0%. As we discussed previously, this sharp increase in fuel prices and the associated fuel surcharge lag impacted our third quarter 2012 results by roughly $0.035 to $0.040 per share. Fuel prices were also relatively flat in the second quarter of 2013. As a result, our Net Fuel Expense as a percent of Revenue xFSR was consistent with the second quarter of 2013.
Purchased Transportation
Purchased transportation includes payments to owner-operators, railroads and other third parties we use for intermodal drayage and other brokered business.
|
| | | | | | | | | | | | | | | | |
| Q3'13 | | Q3'12 | | ($ in millions) | Q3'13 | | Q2'13 | |
| | | (recast) | | | | | (recast) | |
| $ | 318.3 |
| | $ | 306.0 |
| | Purchased Transportation | $ | 318.3 |
| | $ | 308.1 |
| |
| 30.8 | % | | 30.8 | % | | % of Total Revenue | 30.8 | % | | 29.9 | % | |
| | | | | | | | | |
| $ | (85.5 | ) | | $ | (84.2 | ) | | Less: FSR Reimbursed to Third Parties | $ | (85.5 | ) | | $ | (82.7 | ) | |
| | | | | | | | | |
| $ | 232.8 |
| | $ | 221.8 |
| | Net Purchased Transportation | $ | 232.8 |
| | $ | 225.4 |
| |
| 27.9 | % | | 27.8 | % | | % of Revenue xFSR | 27.9 | % | | 27.2 | % | |
As noted in the table above, during the third quarter of 2013, excluding fuel reimbursements, Net Purchased Transportation increased $11.0 million year over year due primarily to increased intermodal volume as well as an increase in the number of miles driven by owner-operators. As a percent of Revenue xFSR, Net Purchased Transportation was relatively consistent year over year.
Sequentially, Net Purchased Transportation increased $7.4 million due to higher seasonal freight volumes in the third quarter compared to the second quarter. As a percent of Revenue xFSR, Net Purchased Transportation increased slightly to 27.9% due to a higher percentage of miles being driven by owner-operators.
Rental Expense and Depreciation & Amortization of Property and Equipment
Due to fluctuations in the amount of tractors leased versus owned, we combine our rental expense with depreciation and amortization of property and equipment for analytical purposes as shown in the table below.
Combined rental and depreciation expense in the third quarter of 2013 increased $11.3 million to $104.5 million from the third quarter of 2012. This increase is due to the rising costs of new equipment, growth in the number of trailers and intermodal containers and a higher percentage of leased assets, which drives rent expense higher due to the inclusion of financing costs.
|
| | | | | | | | | | | | | | |
| Q3'13 | | Q3'12 | ($ in millions) | Q3'13 | | Q2'13 |
| | | (recast) | | | | (recast) |
| $ | 46.3 |
| | $ | 39.2 |
| Rental Expense | $ | 46.3 |
| | $ | 43.0 |
|
| 5.6 | % | | 4.9 | % | % of Revenue xFSR | 5.6 | % | | 5.2 | % |
| | | | | | | |
| $ | 58.3 |
| | $ | 54.0 |
| Depreciation & Amortization of Property and Equipment | $ | 58.3 |
| | $ | 56.9 |
|
| 7.0 | % | | 6.8 | % | % of Revenue xFSR | 7.0 | % | | 6.9 | % |
| | | | | | | |
| $ | 104.5 |
| | $ | 93.2 |
| Combined Rental Expense and Depreciation | $ | 104.5 |
| | $ | 99.9 |
|
| 12.5 | % | | 11.7 | % | % of Revenue xFSR | 12.5 | % | | 12.0 | % |
Sequentially, the combined rental and depreciation expense in the third quarter of 2013 increased $4.6 million primarily due to the previously discussed increase in the number of tractors in the third quarter when compared with the second quarter.
Gain on Disposal of Property and Equipment
Gain on disposal of property and equipment increased $1.3 million in the third quarter of 2013 due primarily to an increase in the number of trucks sold on the open market rather than returned to the original manufacturer per trade agreements as well as an increase in the amount of trailer equipment disposed of during the quarter.
Income Taxes
The income tax provision in accordance with GAAP for the third quarter of 2013 was $26.2 million, resulting in an effective tax rate of 46.6%, which is higher than expected. This increase is primarily due to Central Refrigerated acquisition related costs and deferred taxes for Central Refrigerated’s conversion to a C-Corporation from an S-Corporation, as well as fixed asset basis differences and state taxes, which are all discrete items in the third quarter. Additionally, the effective tax rate was lower in prior periods due to Central Refrigerated's designation as an S-Corporation. Consistent with prior periods, we will use a normalized tax rate of 38.5% for Adjusted EPS.
Interest Expense
Interest expense, comprised of debt interest expense, the amortization of deferred financing costs and original issue discount and excluding derivative interest expense on our interest rate swaps, decreased by $4.5 million in the third quarter of 2013 to $24.6 million, compared with $29.1 million for the third quarter of 2012. The decrease was largely due to lower interest rates from refinancing our senior credit facility in March of 2013, as well as the continued reduction of our debt balances, which has been an area of focus since our initial public offering in December 2010.
Debt Balances
On August 6, 2013, we entered into a Stock Purchase Agreement with the shareholders of Central Refrigerated Transportation, Inc. to acquire the company for an enterprise value of $225 million consisting of $189 million of cash and the assumption of $36 million in capital leases and other debt. Cash consideration was primarily funded from borrowings on our existing credit facilities. As of September 30, 2013, we have repaid approximately $33 million of these borrowings. In addition, we made an additional $9.6 million in payments on other debt and increased our unrestricted cash by $12.6 million. As a result of our prior voluntary prepayments, our next required principal
payment on our Term Loan B-1 is December 31, 2014, and we have no additional required principal payments on our Term Loan B-2 until its maturity in December of 2017.
|
| | | | | | | | | | | | | | | | |
| | | June 30, 2013 | | Central Acquisition | | Q3 2013 | | September 30, 2013 |
| ($ in millions) | | Actuals | | Changes | | Changes | | Actuals |
| Unrestricted Cash | | $ | 43.5 |
| | $ | (4.7 | ) | | $ | 12.6 |
| | $ | 51.4 |
|
| | | | | | | | | |
| A/R Securitization | | $ | 165.0 |
| | $ | 100.0 |
| | $ | (5.0 | ) | | $ | 260.0 |
|
| Revolver ($400mm) | | $ | — |
| | $ | 85.0 |
| | $ | (23.0 | ) | | $ | 62.0 |
|
Term Loan B-1(a) | | $ | 238.0 |
| | | | | | $ | 238.0 |
|
Term Loan B-2(a) | | $ | 410.0 |
| | | | | | $ | 410.0 |
|
Senior Secured 2nd Lien Notes (a) | | $ | 500.0 |
| | | | | | $ | 500.0 |
|
| Capital Leases & Other Debt | | $ | 185.3 |
| | $ | 36.1 |
| | $ | (14.3 | ) | | $ | 207.1 |
|
| Total Debt | | $ | 1,498.3 |
| | $ | 221.1 |
| | $ | (42.3 | ) |
| $ | 1,677.1 |
|
| | | | | | | | | |
| Net Debt | | $ | 1,454.8 |
| | $ | 225.8 |
| | (54.9 | ) |
| $ | 1,625.7 |
|
| | | | | | | | | |
(a) Amounts presented represent face value | |
As we have stated previously, our goal is to continue to reduce our leverage ratio through EBITDA growth and debt repayments. The impact of the Central Refrigerated acquisition, partially offset by subsequent debt repayments, resulted in an increase in net debt of approximately $171 million in the third quarter. However, as a result of the improvement in earnings in the third quarter and the inclusion of Central Refrigerated's EBITDA, our leverage ratio of 2.59 remained consistent with the previous quarter as noted in the chart below. We expect to continue to improve upon our leverage ratio as we expect to reduce our net debt by approximately $50 million during the fourth quarter of 2013.
Cash Flow and Capital Expenditures
We continue to generate positive cash flows from operations. During the first nine months of 2013, we generated $355.9 million of cash from operations compared with $284.6 million during the same period of 2012. For the nine months ended September 30, 2013 our Net Cash Capital Expenditures were $161.2 million. Cash used in financing activities through September 30, 2013 was $82.4 million, primarily driven by the voluntary repayments of our debt.
|
| | | | | | | | | | | | |
| ($ millions) | Q3 2013 | Q3 2012 | YTD 2013 | YTD 2012 |
| | | (recast) | (recast) | (recast) |
| Net Cash Capital Expenditures | $ | 44.1 |
| $ | 39.3 |
| $ | 161.2 |
| $ | 114.8 |
|
| Addback: Proceeds from Sales | 28.6 |
| 43.1 |
| 75.8 |
| 106.2 |
|
| Gross Cash Capital Expenditures | $ | 72.7 |
| $ | 82.4 |
| $ | 237.0 |
| $ | 221.0 |
|
| | | | | |
| Capital Leases | $ | 25.0 |
| $ | 19.1 |
| $ | 85.1 |
| $ | 38.5 |
|
| Operating Leases | 112.6 |
| 85.0 |
| 254.7 |
| 302.6 |
|
| Capital & Operating Lease Total | $ | 137.6 |
| $ | 104.1 |
| $ | 339.8 |
| $ | 341.1 |
|
| | | | | |
| Gross Investment in Equipment & Facilities | $ | 210.3 |
| $ | 186.5 |
| $ | 576.8 |
| $ | 562.1 |
|
| | | | | |
| Original Value of Expired Leases | | | | |
| ($ millions) | Q3 2013 | Q3 2012 | YTD 2013 | YTD 2012 |
| Capital Leases | $ | 95.7 |
| $ | 108.0 |
| $ | 106.4 |
| $ | 30.4 |
|
| Operating Leases | 39.0 |
| 82.8 |
| 73.6 |
| 142.5 |
|
| Total | $ | 134.7 |
| $ | 190.8 |
| $ | 180.0 |
| $ | 172.9 |
|
For the full year of 2013, we expect our net cash capital expenditures to be closer to the low end of our previous guidance of $225 to $250 million.
Liquidity Summary
Our liquidity position at September 30, 2013 remains strong with total available liquidity of $390.0 million available, including $51.4 million of unrestricted cash and $74.6 million of restricted cash and investments in our captive insurance companies that are reserved for the future payment of outstanding claims.
Summary
As you can see, we continue to deliver on our objectives despite an environment that is more difficult than we had anticipated. By focusing on our area of influence, rather than what we cannot control, we have been able to make progress in a less than ideal situation. We are proud of our progress and we are excited about the future, and in particular, the fourth quarter. Freight in our Truckload segment has been strong in October, we are starting up several new Dedicated accounts, we have strong seasonal project business similar to previous years, and our Intermodal and Central Refrigerated segments continue to exhibit strong growth. Overall, we believe we have the people, the processes, and services in place to deliver for our customers and on our objectives.
Conference Call Q&A Session
Swift Transportation management will host a Q&A session at 11:00 a.m. Eastern Daylight Time on Thursday, October 24th to answer questions about the Company’s second quarter financial results. Please email your questions to Investor_Relations@swifttrans.com prior to 7:00 p.m. Eastern Daylight Time on Wednesday, October 23rd.
Participants may access the call using the following dial-in numbers:
U.S./Canada: (877) 897-8479
International/Local: (706) 501-7951
Conference ID: 77204959
The live webcast, letter to stockholders, transcript of the Q&A, and the replay of the earnings Q&A session can be accessed via our investor relations website at ir.swifttrans.com.
IR Contact:
Jason Bates
Vice President of Finance &
Investor Relations Officer
623.907.7335
Forward Looking Statements & Use of Non-GAAP Measures
This letter contains statements that may constitute forward-looking statements, which are based on information currently available, usually identified by words such as "anticipates," "believes," "estimates", "plans,” "projects," "expects," “hopes,” “intends,” “will,” “could,” “should,” “may,” or similar expressions which speak only as of the date the statement was made. Such forward-looking statements are made pursuant to the safe harbor provisions of the Private Securities Litigation Reform Act of 1995. Such statements include, but are not limited to, statements concerning: trends and expectations relating to our operations, growth in current customer base, addition of new customer accounts, freight volumes, leverage, utilization, revenue, expenses, profitability and related metrics; expected reduction in Net Debt in 2013; projected EPS growth; the timing and level of fleet size and equipment and container count; changes in Truckload and Dedicated tractor count; expected insurance claims expense as a percentage of Revenue xFSR; our expected effective tax rate; estimated capital expenditures for 2013; our expectations of intermodal growth in revenue and utilization; and our intentions to use excess cash flows to repay debt. Such forward-looking statements are inherently uncertain, and are based upon the current beliefs, assumptions and expectations of Company management and current market conditions, which are subject to significant risks and uncertainties as set forth in the Risk Factor Section of our Annual Report Form 10-K for the year ended December 31, 2012. As to the Company’s business and financial performance, the following factors, among others, could cause actual results to differ materially from those in forward-looking statements: any future recessionary economic cycles and downturns in customers' business cycles, particularly in market segments and industries in which we have a significant concentration of customers; increasing competition from trucking, rail, intermodal, and brokerage competitors; a significant reduction in, or termination of, our trucking services by a key customer; a significant reduction in, or termination of, our trucking services by a key customer; the amount and velocity of changes in fuel prices and our ability to recover fuel prices through our fuel surcharge program; volatility in the price or availability of fuel; increases in new equipment prices or replacement costs; the regulatory environment in which we operate, including
existing regulations and changes in existing regulations, or violations by us of existing or future regulations; our Compliance Safety Accountability safety rating; increases in driver compensation to the extent not offset by increases in freight rates and difficulties in driver recruitment and retention; changes in rules or legislation by the National Labor Relations Board or Congress and/or union organizing efforts; potential volatility or decrease in the amount of earnings as a result of our claims exposure through our wholly-owned captive insurance companies; risks relating to our captive insurance companies; uncertainties associated with our operations in Mexico; our ability to attract and maintain relationships with owner-operators; the possible re-classification of our owner-operators as employees; our ability to retain or replace key personnel; conflicts of interest or potential litigation that may arise from other businesses owned by Jerry Moyes, including pledges of Swift stock and guarantees related to other businesses by Jerry Moyes; our dependence on third parties for intermodal and brokerage business; our ability to sustain cost savings realized as part of recent cost reduction initiatives; potential failure in computer or communications systems; our ability to execute or integrate any future acquisitions successfully; seasonal factors such as harsh weather conditions that increase operating costs; goodwill impairment; the potential impact of the significant number of shares of our common stock that is outstanding; our intention to not pay dividends; demand ; our significant ongoing capital requirements; our level of indebtedness and our ability to service our outstanding indebtedness, including compliance with our indebtedness covenants, and the impact such indebtedness may have on the way we operate our business; the significant amount of our stock and related control over the Company by Jerry Moyes; and restrictions contained in our debt agreements. You should understand that many important factors, in addition to those listed above and in our filings with the SEC, could impact us financially. As a result of these and other factors, actual results may differ from those set forth in the forward-looking statements and the prices of the Company's securities may fluctuate dramatically. The Company makes no commitment, and disclaims any duty, to update or revise any forward-looking statements to reflect future events, new information or changes in these expectations. In addition to our GAAP results, this Letter to Stockholders also includes certain non-GAAP financial measures as defined by the SEC. The calculation of each measure, including reconciliation to the most closely related GAAP measure and the reasons management believes each non-GAAP measure is useful, are included in the attached schedules.
CONSOLIDATED STATEMENTS OF OPERATIONS (UNAUDITED) (a)
THREE AND NINE MONTHS ENDED SEPTEMBER 30, 2013 AND 2012
|
| | | | | | | | | | | | | | | |
| | Three Months Ended September 30, | | Nine Months Ended September 30, |
| | 2013 | | 2012 | | 2013 | | 2012 |
| | | | (recast) | | | | (recast) |
| | (Unaudited) |
| | (Amounts in thousands, except per share data) |
| Operating revenue | $ | 1,032,127 |
| | $ | 992,624 |
| | $ | 3,042,806 |
| | $ | 2,928,525 |
|
| Operating expenses: | | | | | | | |
| Salaries, wages and employee benefits | 220,156 |
| | 218,607 |
| | 670,493 |
| | 655,300 |
|
| Operating supplies and expenses | 85,204 |
| | 75,337 |
| | 236,267 |
| | 215,777 |
|
| Fuel | 160,561 |
| | 168,956 |
| | 489,563 |
| | 500,589 |
|
| Purchased transportation | 318,321 |
| | 306,028 |
| | 918,594 |
| | 881,414 |
|
| Rental expense | 46,262 |
| | 39,168 |
| | 129,881 |
| | 108,772 |
|
| Insurance and claims | 35,110 |
| | 29,475 |
| | 100,245 |
| | 92,992 |
|
| Depreciation and amortization of property and equipment | 58,254 |
| | 53,994 |
| | 170,004 |
| | 164,354 |
|
| Amortization of intangibles | 4,204 |
| | 4,203 |
| | 12,611 |
| | 12,721 |
|
| Impairments | — |
| | — |
| | — |
| | 1,065 |
|
| Gain on disposal of property and equipment | (5,619 | ) | | (4,343 | ) | | (13,610 | ) | | (13,887 | ) |
| Communication and utilities | 6,679 |
| | 6,699 |
| | 19,145 |
| | 19,998 |
|
| Operating taxes and licenses | 18,575 |
| | 17,310 |
| | 55,209 |
| | 53,618 |
|
| Total operating expenses | 947,707 |
| | 915,434 |
| | 2,788,402 |
| | 2,692,713 |
|
| Operating income | 84,420 |
| | 77,190 |
| | 254,404 |
| | 235,812 |
|
| Other (income) expenses: | | | | | | | |
| Interest expense | 24,595 |
| | 29,102 |
| | 75,719 |
| | 93,530 |
|
| Derivative interest expense | 1,465 |
| | 448 |
| | 2,559 |
| | 5,101 |
|
| Interest income | (604 | ) | | (679 | ) | | (1,741 | ) | | (1,548 | ) |
| Merger and acquisition expense | 4,331 |
| | — |
| | 4,331 |
| | — |
|
| Loss on debt extinguishment | 496 |
| | — |
| | 5,540 |
| | 22,219 |
|
| Gain on sale of real property | (798 | ) | | — |
| | (6,876 | ) | | — |
|
| Other | (1,174 | ) | | (423 | ) | | (3,058 | ) | | (2,466 | ) |
| Total other (income) expenses, net | 28,311 |
| | 28,448 |
| | 76,474 |
| | 116,836 |
|
| Income before income taxes | 56,109 |
| | 48,742 |
| | 177,930 |
| | 118,976 |
|
| Income tax expense | 26,156 |
| | 15,086 |
| | 67,806 |
| | 33,573 |
|
| Net income | $ | 29,953 |
| | $ | 33,656 |
| | $ | 110,124 |
| | $ | 85,403 |
|
| Basic earnings per share | $ | 0.21 |
| | $ | 0.24 |
| | $ | 0.79 |
| | $ | 0.61 |
|
| Diluted earnings per share | $ | 0.21 |
| | $ | 0.24 |
| | $ | 0.78 |
| | $ | 0.61 |
|
| Shares used in per share calculations | | | | | | | |
| Basic | 140,327 |
| | 139,535 |
| | 140,004 |
| | 139,526 |
|
| Diluted | 142,315 |
| | 139,546 |
| | 141,942 |
| | 139,631 |
|
(a) On August 6, 2013, Swift Transportation Company ("Swift") acquired all the outstanding capital stock of Central Refrigerated Transportation (the "Acquisition") in a cash transaction valued at $225 million. Jerry Moyes, the Chief Executive Officer and controlling stockholder of Swift, was the majority shareholder of Central. Given Mr. Moyes' majority ownership in both Swift and Central, the Acquisition is accounted for as a combination of entities under common control which is similar to the pooling of interest method. Under common control accounting, the historical results of Central have been combined with Swift's. The above consolidated statement of operations for the three months and nine months ended September 30, 2013 and 2012 reflects the combination of the entities as if the Acquisition was effective January 1, 2012.
ADJUSTED EPS RECONCILIATION (UNAUDITED) (a)(b)
THREE AND NINE MONTHS ENDED SEPTEMBER 30, 2013, 2012 AND 2011
|
| | | | | | | | | | | | | | | | | | | | | | | |
| | Three Months Ended September 30, | | Nine Months Ended September 30, |
| | 2013 | | 2012 | | 2011 | | 2013 | | 2012 | | 2011 |
| | | | (recast) | | (recast) | | | | (recast) | | (recast) |
| Diluted earnings per share | $ | 0.21 |
| | $ | 0.24 |
| | $ | 0.23 |
| | $ | 0.78 |
| | $ | 0.61 |
| | $ | 0.43 |
|
| Adjusted for: | | | | | | | | | | | |
| Income tax expense | 0.18 |
| | 0.11 |
| | 0.14 |
| | 0.48 |
| | 0.24 |
| | 0.25 |
|
| Income before income taxes | 0.39 |
| | 0.35 |
| | 0.37 |
| | 1.25 |
| | 0.85 |
| | 0.69 |
|
| Non-cash impairments (c) | — |
| | — |
| | — |
| | — |
| | 0.01 |
| | — |
|
| Loss on debt extinguishment (d) | — |
| | — |
| | — |
| | 0.04 |
| | 0.16 |
| | — |
|
| Amortization of certain intangibles (e) | 0.03 |
| | 0.03 |
| | 0.03 |
| | 0.08 |
| | 0.08 |
| | 0.09 |
|
Amortization of unrealized losses on
interest rate swaps (f) | — |
| | — |
| | 0.02 |
| | — |
| | 0.04 |
| | 0.09 |
|
| Acceleration of non-cash equity compensation (g) | 0.01 |
| | — |
| | — |
| | 0.01 |
| | — |
| | — |
|
| Excludable transaction costs (h) | 0.03 |
| | — |
| | — |
| | 0.03 |
| | — |
| | — |
|
| Adjusted income before income taxes | 0.47 |
| | 0.38 |
| | 0.43 |
| | 1.42 |
| | 1.14 |
| | 0.86 |
|
Provision for income tax expense at effective rate | 0.18 |
| | 0.15 |
| | 0.17 |
| | 0.55 |
| | 0.44 |
| | 0.34 |
|
| Adjusted EPS | $ | 0.29 |
| | $ | 0.23 |
| | $ | 0.26 |
| | $ | 0.87 |
| | $ | 0.70 |
| | $ | 0.53 |
|
| |
| (a) | We define Adjusted EPS as (1) income (loss) before income taxes plus (i) amortization of the intangibles from our 2007 going-private transaction, (ii) non-cash impairments, (iii) other special non-cash items, (iv) excludable transaction costs, (v) the mark-to-market adjustment on our interest rate swaps that is recognized in the statement of operations in a given period, and (vi) the amortization of previous losses recorded in accumulated other comprehensive income (loss) (“OCI”) related to the interest rate swaps we terminated upon our IPO and refinancing transactions in December 2010; (2) reduced by income taxes; (3) divided by weighted average diluted shares outstanding. For all periods through 2012, we used a normalized tax rate of 39% in our Adjusted EPS calculation due to the amortization of deferred tax assets related to our pre-IPO interest rate swap amortization and other items that we knew would cause fluctuations in our GAAP effective tax rate. Beginning in 2013, these items should no longer result in large variations. Therefore, we began using our GAAP effective tax rate for our Adjusted EPS calculation beginning in 2013. We believe the presentation of financial results excluding the impact of the items noted above provides a consistent basis for comparing our results from period to period and to those of our peers due to the non-comparable nature of the intangibles from our going-private transaction, the historical volatility of the interest rate derivative agreements and the non-operating nature of the impairment charges, transaction costs and other adjustment items. Adjusted EPS is not presented in accordance with GAAP and should be considered in addition to, not as a substitute for, or superior to, measures of financial performance in accordance with GAAP. The numbers reflected in the above table are calculated on a per share basis and may not foot due to rounding. |
| |
| (b) | As a result of the Acquisition described in footnote (a) within the schedule Consolidated Statements of Operations (Unaudited) for the three and nine months ended September 30, 2013, 2012 and 2011, the above Adjusted EPS Reconciliation for the three and nine months ended September 30, 2013, 2012 and 2011 reflects the combination of the entities as if the Acquisition was effective on January 1, 2011. |
| |
| (c) | Real property with a carrying amount of $1.7 million was written down to its fair value of $0.6 million, resulting in a pre-tax impairment charge of $1.1 million in the first quarter of 2012. |
| |
| (d) | On March 7, 2013, the Company entered into a Second Amended and Restated Credit Agreement (“2013 Agreement”). The 2013 Agreement replaced the then-existing first lien term loan B-1 and B-2 tranches under the Amended and Restated Credit Agreement (“2012 Agreement”) entered into on March 6, 2012 with outstanding principal balances of $152.0 million and $508.0 million, respectively, with new first lien term loan B-1 and B-2 tranches with face values of $250.0 million and $410.0 million, respectively. The replacement of the 2012 Agreement resulted in a loss on debt extinguishment of $5.0 million in the first quarter of 2013, representing the write-off of the unamortized original issue discount and deferred financing fees associated with the 2012 Agreement. On May 21, 2012, the Company completed the call of its remaining $15.2 million face value 12.50% fixed rate notes due May 15, 2017, at a price of 106.25% resulting in a loss on debt extinguishment of $1.3 million, representing the call premium and write-off of the remaining unamortized deferred financing fees. The Company entered into the 2012 Agreement on March 6, 2012, which replaced the then-existing, remaining $874 million face value first lien term loan, maturing in December 2016, resulting in a loss on debt extinguishment of $20.9 million in the first quarter of 2012 representing the write-off of the unamortized original issue discount and deferred financing fees associated with the original term loan. |
| |
| (e) | Amortization of certain intangibles reflects the non-cash amortization expense of $3.9 million, $3.9 million and $4.2 million for the three months ended September 30, 2013, 2012 and 2011, respectively, and $11.7 million, $11.8 million and $13.0 million for the nine months ended September 30, 2013, 2012 and 2011, respectively, relating to certain intangible assets identified in the 2007 going-private transaction through which Swift Corporation acquired Swift Transportation Co. |
| |
| (f) | Amortization of unrealized losses on interest rate swaps reflects the non-cash amortization expense of $0.4 million and $3.4 million for the three months ended September 30, 2012 and 2011, respectively and $5.1 million and $12.1 million for the nine months ended September 30, 2012 and 2011, respectively, included in derivative interest expense in the consolidated statements of operations and is comprised of previous losses recorded in accumulated OCI related to the interest |
rate swaps we terminated upon our IPO and concurrent refinancing transactions in December 2010. Such losses were incurred in prior periods when hedge accounting applied to the swaps and are being expensed in relation to the hedged interest payments through the original maturity of the swaps in August 2012.
| |
| (g) | In the third quarter of 2013, Central incurred a $0.9 million one-time non-cash equity compensation charge for certain stock options that accelerated upon the closing of the Acquisition noted above in footnote (b). |
| |
| (h) | As a result of the Acquisition of Central noted above in footnote (b), both Swift and Central incurred certain transactional related expenses, including financial advisory and other professional fees, related to the Acquisition totaling approximately $4.3 million for the three and nine months ended September 30, 2013. |
ADJUSTED OPERATING INCOME AND OPERATING RATIO RECONCILIATION (UNAUDITED) (a)(b)
THREE AND NINE MONTHS ENDED SEPTEMBER 30, 2013, 2012 AND 2011
|
| | | | | | | | | | | | | | | | | | | | | | | |
| | Three Months Ended September 30, | | Nine Months Ended September 30, |
| | 2013 | | 2012 | | 2011 | | 2013 | | 2012 | | 2011 |
| | | | (recast) | | (recast) | | | | (recast) | | (recast) |
| | (Amounts in thousands) |
| Operating revenue | $ | 1,032,127 |
| | $ | 992,624 |
| | $ | 977,494 |
| | $ | 3,042,806 |
| | $ | 2,928,525 |
| | $ | 2,800,074 |
|
| Less: Fuel surcharge revenue | 198,746 |
| | 194,459 |
| | 197,059 |
| | 594,727 |
| | 585,265 |
| | 559,576 |
|
| Revenue xFSR | 833,381 |
| | 798,165 |
| | 780,435 |
| | 2,448,079 |
| | 2,343,260 |
| | 2,240,498 |
|
| Operating expense | 947,707 |
| | 915,434 |
| | 885,147 |
| | 2,788,402 |
| | 2,692,713 |
| | 2,581,995 |
|
| Adjusted for: | | | | | | | | | | | |
| Fuel surcharge revenue | (198,746 | ) | | (194,459 | ) | | (197,059 | ) | | (594,727 | ) | | (585,265 | ) | | (559,576 | ) |
| Amortization of certain intangibles (c) | (3,912 | ) | | (3,912 | ) | | (4,218 | ) | | (11,736 | ) | | (11,846 | ) | | (12,979 | ) |
| Non-cash impairments (d) | — |
| | — |
| | — |
| | — |
| | (1,065 | ) | | — |
|
| Acceleration of non-cash equity compensation (e) | (887 | ) | | — |
| | — |
| | (887 | ) | | — |
| | — |
|
| Adjusted operating expense | 744,162 |
| | 717,063 |
| | 683,870 |
| | 2,181,052 |
| | 2,094,537 |
| | 2,009,440 |
|
| Adjusted operating income | $ | 89,219 |
| | $ | 81,102 |
| | $ | 96,565 |
| | $ | 267,027 |
| | $ | 248,723 |
| | $ | 231,058 |
|
| Adjusted Operating Ratio | 89.3 | % | | 89.8 | % | | 87.6 | % | | 89.1 | % | | 89.4 | % | | 89.7 | % |
| Operating Ratio | 91.8 | % | | 92.2 | % | | 90.6 | % | | 91.6 | % | | 91.9 | % | | 92.2 | % |
| |
| (a) | We define Adjusted Operating Ratio as (a) total operating expenses, less (i) fuel surcharges, (ii) amortization of the intangibles from our 2007 going-private transaction, (iii) non-cash impairment charges, (iv) other special non-cash items, and (v) excludable transaction costs, as a percentage of (b) total revenue excluding fuel surcharge revenue (revenue xFSR). We believe fuel surcharge is sometimes volatile and eliminating the impact of this source of revenue (by netting fuel surcharge revenue against fuel expense) affords a more consistent basis for comparing our results of operations. We also believe excluding impairments, non-comparable nature of the intangibles from our going-private transaction and other special items enhances the comparability of our performance from period to period. Adjusted Operating Ratio is not a recognized measure under GAAP. Adjusted Operating Ratio should be considered in addition to, not as a substitute for, or superior to, measures of financial performance in accordance with GAAP. |
| |
| (b) | As a result of the Acquisition described in footnote (a) within the schedule Consolidated Statements of Operations (Unaudited) for the three and nine months ended September 30, 2013, 2012 and 2011, the above Adjusted Operating Income and Operating Ratio reconciliation for the three and nine months ended September 30, 2013, 2012 and 2011 reflects the combination of the entities as if the Acquisition was effective January 1, 2011. |
| |
| (c) | Amortization of certain intangibles reflects the non-cash amortization expense relating to certain intangible assets identified in the 2007 going-private transaction through which Swift Corporation acquired Swift Transportation Co. |
| |
| (d) | Real property with a carrying amount of $1.7 million was written down to its fair value of $0.6 million, resulting in a pre-tax impairment charge of $1.1 million in the first quarter of 2012. |
| |
| (e) | In the third quarter of 2013, Central incurred a $0.9 million one-time non-cash-equity compensation charge for certain stock options that accelerated upon the closing of the Acquisition noted above in footnote (b). |
ADJUSTED EARNINGS BEFORE INTEREST, TAXES, DEPRECIATION
AND AMORTIZATION (UNAUDITED) (a)(b)
THREE MONTHS AND NINE MONTHS ENDED SEPTEMBER 30, 2013, 2012 AND 2011
|
| | | | | | | | | | | | | | | | | | | | | | | |
| | Three Months Ended September 30, | | Nine Months Ended September 30, |
| | 2013 | | 2012 | | 2011 | | 2013 | | 2012 | | 2011 |
| | | | (recast) | | (recast) | | | | (recast) | | (recast) |
| | (Amounts in thousands) |
| Net income | $ | 29,953 |
| | $ | 33,656 |
| | $ | 32,391 |
| | $ | 110,124 |
| | $ | 85,403 |
| | $ | 60,108 |
|
| Adjusted for: | | | | | | | | | | | |
| Depreciation and amortization of property and equipment | 58,254 |
| | 53,994 |
| | 54,758 |
| | 170,004 |
| | 164,354 |
| | 162,579 |
|
| Amortization of intangibles | 4,204 |
| | 4,203 |
| | 4,509 |
| | 12,611 |
| | 12,721 |
| | 13,853 |
|
| Interest expense | 24,595 |
| | 29,102 |
| | 37,808 |
| | 75,719 |
| | 93,530 |
| | 113,598 |
|
| Derivative interest expense | 1,465 |
| | 448 |
| | 3,384 |
| | 2,559 |
| | 5,101 |
| | 12,067 |
|
| Interest income | (604 | ) | | (679 | ) | | (593 | ) | | (1,741 | ) | | (1,548 | ) | | (1,569 | ) |
| Income tax expense | 26,156 |
| | 15,086 |
| | 19,703 |
| | 67,806 |
| | 33,573 |
| | 35,597 |
|
| Earnings before interest, taxes, depreciation and amortization (EBITDA) | $ | 144,023 |
| | $ | 135,810 |
| | $ | 151,960 |
| | $ | 437,082 |
| �� | $ | 393,134 |
| | $ | 396,233 |
|
| Non-cash equity compensation (c) | 1,967 |
| | 1,459 |
| | 844 |
| | 3,465 |
| | 4,315 |
| | 5,675 |
|
| Loss on debt extinguishment (d) | 496 |
| | — |
| | — |
| | 5,540 |
| | 22,219 |
| | — |
|
| Non-cash impairments (e) | — |
| | — |
| | — |
| | — |
| | 1,065 |
| | — |
|
| Excludable transaction costs (f) | 4,331 |
| | — |
| | — |
| | 4,331 |
| | — |
| | — |
|
| Adjusted earnings before interest, taxes, depreciation and amortization (Adjusted EBITDA) | $ | 150,817 |
| | $ | 137,269 |
| | $ | 152,804 |
| | $ | 450,418 |
| | $ | 420,733 |
| | $ | 401,908 |
|
| |
| (a) | We define Adjusted EBITDA as net income (loss) plus (i) depreciation and amortization, (ii) interest and derivative interest expense, including other fees and charges associated with indebtedness, net of interest income, (iii) income taxes, (iv) non-cash equity compensation expense, (v) non-cash impairments, (vi) other special non-cash items, and (vii) excludable transaction costs. We believe that Adjusted EBITDA is a relevant measure for estimating the cash generated by our operations that would be available to cover capital expenditures, taxes, interest and other investments and that it enhances an investor’s understanding of our financial performance. We use Adjusted EBITDA for business planning purposes and in measuring our performance relative to that of our competitors. Our method of computing Adjusted EBITDA is consistent with that used in our senior secured credit agreement for covenant compliance purposes and may differ from similarly titled measures of other companies. Adjusted EBITDA is not a recognized measure under GAAP. Adjusted EBITDA should be considered in addition to, not as a substitute for or superior to, net income, cash flow from operations, operating income or any other performance measures derived in accordance with GAAP as measures of operating performance or operating cash flows as a measure of liquidity. |
| |
| (b) | As a result of the Acquisition described in footnote (a) within the schedule Consolidated Statement of Operations (Unaudited) for the three and nine months ended September 30, 2013, 2012 and 2011, the above Adjusted Earnings Before Interest, Taxes, Depreciation and Amortization reconciliation for the three and nine months ended September 30, 2013, 2012 and 2011 reflects the combination of the entities as if the Acquisition was effective January 1, 2011. |
| |
| (c) | Represents recurring non-cash equity compensation expense following our IPO, on a pre-tax basis. In addition to the recurring non-cash equity compensation expense, in the third quarter of 2013, Central incurred a $0.9 million one-time non-cash equity compensation charge for certain options that accelerated upon the closing of the Acquisition noted above in footnote (b). In accordance with the terms of our senior credit agreement, this expense is added back in the calculation of Adjusted EBITDA for covenant compliance purposes. |
| |
| (d) | In association with the Acquisition of Central noted in footnote (b) above, on August 6, 2013, certain debt outstanding under Central was paid-in full and extinguished, resulting in a loss on debt extinguishment of $0.5 million, representing the write-off of the remaining unamortized deferred financing fees. Additionally, on March 7, 2013, the Company entered into a Second Amended and Restated Credit Agreement (“2013 Agreement”). The 2013 Agreement replaced the then-existing first lien term loan B-1 and B-2 tranches under the Amended and Restated Credit Agreement (“2012 Agreement”) entered into on March 6, 2012 with outstanding principal balances of $152.0 million and $508.0 million, respectively, with new first lien term loan B-1 and B-2 tranches with face values of $250.0 million and $410.0 million, respectively. The replacement of the 2012 Agreement resulted in a loss on debt extinguishment of $5.0 million in the first quarter of 2013, representing the write-off of the unamortized original issue discount and deferred financing fees associated with the 2012 Agreement. On May 21, 2012, the Company completed the call of its remaining $15.2 million face value 12.50% fixed rate notes due May 15, 2017, at a price of 106.25% of face value pursuant to the terms of the indenture governing the notes, resulting in a loss on debt extinguishment of $1.3 million, representing the call premium and write-off of the remaining unamortized deferred financing fees. The Company entered into the 2012 Agreement on March 6, 2012, which replaced the then-existing, remaining $874 million face value first lien term loan, maturing in December 2016, resulting in a loss on debt extinguishment of $20.9 million in the first quarter of 2012 representing the write-off of the unamortized original issue discount and deferred financing fees associated with the original term loan. |
| |
| (e) | Real property with a carrying amount of $1.7 million was written down to its fair value of $0.6 million, resulting in a pre-tax impairment charge of $1.1 million in the first quarter of 2012. |
| |
| (f) | As a result of the Acquisition of Central noted above in footnote (b), both Swift and Central incurred transaction related expenses, including financial advisory and other professional fees, related to the Acquisition. |
FINANCIAL INFORMATION BY SEGMENT (UNAUDITED) (a)
THREE AND NINE MONTHS ENDED SEPTEMBER 30, 2013, 2012 AND 2011
|
| | | | | | | | | | | | | | | | | | | | | | | |
| | Three Months Ended September 30, | | Nine Months Ended September 30, |
| | 2013 | | 2012 | | 2011 | | 2013 | | 2012 | | 2011 |
| | | | (recast) | | (recast) | | | | (recast) | | (recast) |
| | (Amounts in thousands) |
Operating revenue: | | | | | | | | | | | |
| Truckload | $ | 579,494 |
| | $ | 564,802 |
| | $ | 606,990 |
| | $ | 1,727,813 |
| | $ | 1,691,242 |
| | $ | 1,762,858 |
|
| Dedicated | 184,550 |
| | 182,843 |
| | 158,922 |
| | 546,427 |
| | 536,255 |
| | 450,632 |
|
| Central Refrigerated | 136,484 |
| | 121,990 |
| | 114,170 |
| | 393,094 |
| | 359,213 |
| | 328,559 |
|
| Intermodal | 89,759 |
| | 86,063 |
| | 63,176 |
| | 251,459 |
| | 236,228 |
| | 165,045 |
|
| Subtotal | 990,287 |
| | 955,698 |
| | 943,258 |
| | 2,918,793 |
| | 2,822,938 |
| | 2,707,094 |
|
| Nonreportable segments (b) | 49,038 |
| | 50,828 |
| | 49,232 |
| | 159,461 |
| | 152,321 |
| | 139,385 |
|
| Intersegment eliminations | (7,198 | ) | | (13,902 | ) | | (14,996 | ) | | (35,448 | ) | | (46,734 | ) | | (46,405 | ) |
Consolidated operating revenue | $ | 1,032,127 |
| | $ | 992,624 |
| | $ | 977,494 |
| | $ | 3,042,806 |
| | $ | 2,928,525 |
| | $ | 2,800,074 |
|
| | | | | | | | | | | | |
Operating income (loss): | | | | | | | | | | | |
| Truckload | $ | 58,053 |
| | $ | 53,818 |
| | $ | 68,506 |
| | $ | 165,070 |
| | $ | 168,366 |
| | $ | 154,659 |
|
| Dedicated | 20,508 |
| | 17,082 |
| | 18,140 |
| | 63,725 |
| | 50,104 |
| | 48,461 |
|
| Central Refrigerated | 4,165 |
| | 6,833 |
| | 2,650 |
| | 19,881 |
| | 20,876 |
| | 9,086 |
|
| Intermodal | 1,979 |
| | (2,505 | ) | (c) | 339 |
| | 934 |
| | (6,409 | ) | (c) | 269 |
|
| Subtotal | 84,705 |
| | 75,228 |
| | 89,635 |
| | 249,610 |
| | 232,937 |
| | 212,475 |
|
| Nonreportable segments (b) | (285 | ) | | 1,962 |
| | 2,712 |
| | 4,794 |
| | 2,875 |
| | 5,604 |
|
Consolidated operating income | $ | 84,420 |
| | $ | 77,190 |
| | $ | 92,347 |
| | $ | 254,404 |
| | $ | 235,812 |
| | $ | 218,079 |
|
| | | | | | | | | | | | |
Operating Ratio: | | | | | | | | | | | |
| Truckload | 90.0 | % | | 90.5 | % | | 88.7 | % | | 90.4 | % | | 90.0 | % | | 91.2 | % |
| Dedicated | 88.9 | % | | 90.7 | % | | 88.6 | % | | 88.3 | % | | 90.7 | % | | 89.2 | % |
| Central Refrigerated | 96.9 | % | | 94.4 | % | | 97.7 | % | | 94.9 | % | | 94.2 | % | | 97.2 | % |
| Intermodal | 97.8 | % | | 102.9 | % | (c) | 99.5 | % | | 99.6 | % | | 102.7 | % | (c) | 99.8 | % |
| | | | | | | | | | | | |
| Adjusted Operating Ratio (d): | | | | | | | | | | | |
| Truckload | 87.4 | % | | 88.0 | % | | 85.6 | % | | 88.0 | % | | 87.4 | % | | 88.9 | % |
| Dedicated | 86.3 | % | | 88.6 | % | | 86.0 | % | | 85.6 | % | | 88.6 | % | | 86.9 | % |
| Central Refrigerated | 95.4 | % | | 92.9 | % | | 97.0 | % | | 93.4 | % | | 92.6 | % | | 96.5 | % |
| Intermodal | 97.2 | % | | 103.7 | % | (c) | 99.3 | % | | 99.5 | % | | 103.4 | % | (c) | 99.8 | % |
| | | | | | | | | | | | |
| |
| (a) | As a result of the Acquisition of Central described in footnote (a) within the schedule Consolidated Statement of Operations (Unaudited) for the three and nine months ended September 30, 2013, 2012 and 2011, the above Financial Information by Segment schedule for the three and nine months ended September 30, 2013, 2012 and 2011 reflects the combination of the entities as if the Acquisition was effective January 1, 2011. |
| |
| (b) | Our nonreportable segments are comprised of our freight brokerage and logistics management services, Interstate Equipment Leasing (“IEL”), insurance and shop activities. |
| |
| (c) | During 2012, our Intermodal reportable segment incurred an increase in its insurance and claims expense primarily related to one claim associated with a drayage accident, which increased the Intermodal Operating Ratio by approximately 310 to 340 basis points and 250 to 270 basis points for the three and nine months ended September 30, 2012, respectively, and increased the Intermodal Adjusted Operating Ratio by approximately 390 to 430 basis points and 310 to 340 basis points for the three and nine months ended September 30, 2012 respectively, as compared to the corresponding periods in 2011 and 2013. |
| |
| (d) | See our reconciliation of Adjusted Operating Ratio by Segment at the schedule titled “Adjusted Operating Income and Operating Ratio Reconciliation by Segment”. |
OPERATING STATISTICS (UNAUDITED)
THREE AND NINE MONTHS ENDED SEPTEMBER 30, 2013, 2012 AND 2011
|
| | | | | | | | | | | | | | | | | | | | | | | |
| | Three Months Ended September 30, | | Nine Months Ended September 30, |
| | 2013 | | 2012 | | 2011 | | 2013 | | 2012 | | 2011 |
| | | | (recast) | | (recast) | | | | (recast) | | (recast) |
| Operating Statistics by Segment: | | | | | | | | | | | |
Truckload: | | | | | | | | | | | |
| Weekly revenue xFSR per tractor | $ | 3,212 |
| | $ | 3,174 |
| | $ | 3,056 |
| | $ | 3,222 |
| | $ | 3,124 |
| | $ | 2,959 |
|
| Total loaded miles (a) | 267,607 |
| | 266,328 |
| | 289,487 |
| | 804,287 |
| | 797,783 |
| | 856,058 |
|
| Deadhead miles percentage | 11.5 | % | | 10.9 | % | | 10.5 | % | | 11.3 | % | | 11.0 | % | | 11.0 | % |
| Average tractors available for dispatch: | | | | | | | | | | | |
| Company | 7,552 |
| | 7,327 |
| | 8,249 |
| | 7,593 |
| | 7,536 |
| | 8,506 |
|
| Owner-Operator | 3,355 |
| | 3,399 |
| | 3,634 |
| | 3,311 |
| | 3,368 |
| | 3,543 |
|
| Total | 10,907 |
| | 10,726 |
| | 11,883 |
| | 10,904 |
| | 10,904 |
| | 12,049 |
|
| | | | | | | | | | | | |
Dedicated: | | | | | | | | | | | |
| Weekly revenue xFSR per tractor | $ | 3,326 |
| | $ | 3,336 |
| | $ | 3,281 |
| | $ | 3,369 |
| | $ | 3,354 |
| | $ | 3,322 |
|
| Average tractors available for dispatch: | | | | | | | | | | | |
| Company | 2,771 |
| | 2,773 |
| | 2,451 |
| | 2,730 |
| | 2,676 |
| | 2,333 |
|
| Owner-Operator | 663 |
| | 646 |
| | 564 |
| | 646 |
| | 660 |
| | 525 |
|
| Total | 3,434 |
| | 3,419 |
| | 3,015 |
| | 3,376 |
| | 3,335 |
| | 2,858 |
|
| | | | | | | | | | | | |
| Central Refrigerated | | | | | | | | | | | |
| Weekly revenue xFSR per tractor | $ | 3,471 |
| | $ | 3,327 |
| | $ | 3,274 |
| | $ | 3,371 |
| | $ | 3,329 |
| | $ | 3,207 |
|
| Total loaded miles (a) | 48,291 |
| | 46,619 |
| | 44,841 |
| | 145,112 |
| | 139,864 |
| | 133,418 |
|
| Deadhead miles percentage | 13.6 | % | | 12.6 | % | | 12.5 | % | | 12.9 | % | | 12.4 | % | | 12.2 | % |
| Average tractors available for dispatch: | | | | | | | | | | | |
| Company | 1,053 |
| | 961 |
| | 937 |
| | 1,053 |
| | 968 |
| | 963 |
|
| Owner-Operator | 964 |
| | 885 |
| | 823 |
| | 939 |
| | 857 |
| | 794 |
|
| Total | 2,017 |
| | 1,846 |
| | 1,760 |
| | 1,992 |
| | 1,825 |
| | 1,757 |
|
| | | | | | | | | | | | |
Intermodal: | | | | | | | | | | | |
| Average tractors available for dispatch: | | | | | | | | | | | |
| Company | 288 |
| | 276 |
| | 272 |
| | 273 |
| | 277 |
| | 231 |
|
| Owner-Operator | 48 |
| | 1 |
| | 1 |
| | 32 |
| | — |
| | — |
|
| Total | 336 |
| | 277 |
| | 273 |
| | 305 |
| | 277 |
| | 231 |
|
| Load Count | 39,392 |
| | 37,878 |
| | 27,879 |
| | 109,999 |
| | 104,282 |
| | 74,967 |
|
| Average Container Count | 8,717 |
| | 7,403 |
| | 5,820 |
| | 8,717 |
| | 6,736 |
| | 5,385 |
|
| | | | | | | | | | | | |
| (a) Total loaded miles presented in thousands. | | | | | | | | | | |
| | | | | | | | | | | | |
|
| | | | | | |
| | As of |
| | September 30, 2013 | | December 31, 2012 | | September 30, 2012 |
| Consolidated Total Equipment: | | | (recast) | | (recast) |
| Tractors: | | | | | |
| Company | | | | | |
| Owned | 6,609 | | 5,504 | | 5,657 |
|
| Leased – capital leases | 2,143 | | 2,658 | | 2,741 |
|
| Leased – operating leases | 4,589 | | 4,139 | | 4,174 |
|
| Total company tractors | 13,341 | | 12,301 | | 12,572 |
|
| Owner-operator | | | | | |
| Financed through the Company | 4,144 | | 3,885 | | 3,916 |
|
| Other | 896 | | 960 | | 1,038 |
|
| Total owner-operator tractors | 5,040 | | 4,845 | | 4,954 |
|
| Total tractors | 18,381 | | 17,146 | | 17,526 |
|
| Trailers | 57,467 | | 55,947 | | 55,091 |
|
| Containers | 8,717 | | 8,717 | | 8,290 |
|
ADJUSTED OPERATING INCOME AND OPERATING RATIO
RECONCILIATION BY SEGMENT (UNAUDITED) (a)
THREE AND NINE MONTHS ENDED SEPTEMBER 30, 2013, 2012 AND 2011
|
| | | | | | | | | | | | | | | | | | | | | | | |
| | Three Months Ended September 30, | | Nine Months Ended September 30, |
| | 2013 | | 2012 | | 2011 | | 2013 | | 2012 | | 2011 |
| | | | (recast) | | (recast) | | | | (recast) | | (recast) |
| Truckload: | | | | | | | | | | | |
| Operating revenue | $ | 579,494 |
| | $ | 564,802 |
| | $ | 606,990 |
| | $ | 1,727,813 |
| | $ | 1,691,242 |
| | $ | 1,762,858 |
|
| Less: Fuel surcharge revenue | 119,088 |
| | 117,344 |
| | 129,742 |
| | 357,571 |
| | 358,269 |
| | 372,439 |
|
| Revenue xFSR | 460,406 |
| | 447,458 |
| | 477,248 |
| | 1,370,242 |
| | 1,332,973 |
| | 1,390,419 |
|
| Operating expense | 521,441 |
| | 510,984 |
| | 538,484 |
| | 1,562,743 |
| | 1,522,876 |
| | 1,608,199 |
|
| Adjusted for: | | | | | | | | | | | |
| Fuel surcharge revenue | (119,088 | ) | | (117,344 | ) | | (129,742 | ) | | (357,571 | ) | | (358,269 | ) | | (372,439 | ) |
| Adjusted operating expense | 402,353 |
| | 393,640 |
| | 408,742 |
| | 1,205,172 |
| | 1,164,607 |
| | 1,235,760 |
|
| Adjusted operating income | $ | 58,053 |
| | $ | 53,818 |
| | $ | 68,506 |
| | $ | 165,070 |
| | $ | 168,366 |
| | $ | 154,659 |
|
| Adjusted Operating Ratio | 87.4 | % | | 88.0 | % | | 85.6 | % | | 88.0 | % | | 87.4 | % | | 88.9 | % |
| Operating Ratio | 90.0 | % | | 90.5 | % | | 88.7 | % | | 90.4 | % | | 90.0 | % | | 91.2 | % |
| | | | | | | | | | | | |
| Dedicated: | | | | | | | | | | | |
| Operating revenue | $ | 184,550 |
| | $ | 182,843 |
| | $ | 158,922 |
| | $ | 546,427 |
| | $ | 536,255 |
| | $ | 450,632 |
|
| Less: Fuel surcharge revenue | 34,424 |
| | 32,953 |
| | 28,911 |
| | 102,855 |
| | 98,499 |
| | 80,299 |
|
| Revenue xFSR | 150,126 |
| | 149,890 |
| | 130,011 |
| | 443,572 |
| | 437,756 |
| | 370,333 |
|
| Operating expense | 164,042 |
| | 165,761 |
| | 140,782 |
| | 482,702 |
| | 486,151 |
| | 402,171 |
|
| Adjusted for: | | | | | | | | | | | |
| Fuel surcharge revenue | (34,424 | ) | | (32,953 | ) | | (28,911 | ) | | (102,855 | ) | | (98,499 | ) | | (80,299 | ) |
| Adjusted operating expense | 129,618 |
| | 132,808 |
| | 111,871 |
| | 379,847 |
| | 387,652 |
| | 321,872 |
|
| Adjusted operating income | $ | 20,508 |
| | $ | 17,082 |
| | $ | 18,140 |
| | $ | 63,725 |
| | $ | 50,104 |
| | $ | 48,461 |
|
| Adjusted Operating Ratio | 86.3 | % | | 88.6 | % | | 86.0 | % | | 85.6 | % | | 88.6 | % | | 86.9 | % |
| Operating Ratio | 88.9 | % | | 90.7 | % | | 88.6 | % | | 88.3 | % | | 90.7 | % | | 89.2 | % |
| | | | | | | | | | | | |
| Central Refrigerated | | | | | | | | | | | |
| Operating revenue | $ | 136,484 |
| | $ | 121,990 |
| | $ | 114,170 |
| | $ | 393,094 |
| | $ | 359,213 |
| | $ | 328,559 |
|
| Less: Fuel surcharge revenue | 25,698 |
| | 25,721 |
| | 24,522 |
| | 78,670 |
| | 77,796 |
| | 70,906 |
|
| Revenue xFSR | 110,786 |
| | 96,269 |
| | 89,648 |
| | 314,424 |
| | 281,417 |
| | 257,653 |
|
| Operating expense | 132,319 |
| | 115,157 |
| | 111,520 |
| | 373,213 |
| | 338,337 |
| | 319,473 |
|
| Adjusted for: | | | | | | | | | | | |
| Fuel surcharge revenue | (25,698 | ) | | (25,721 | ) | | (24,522 | ) | | (78,670 | ) | | (77,796 | ) | | (70,906 | ) |
| Acceleration of non-cash equity compensation (b) | (887 | ) | | — |
| | — |
| | (887 | ) | | — |
| | — |
|
| Adjusted operating expense | 105,734 |
| | 89,436 |
| | 86,998 |
| | 293,656 |
| | 260,541 |
| | 248,567 |
|
| Adjusted operating income | $ | 5,052 |
| | $ | 6,833 |
| | $ | 2,650 |
| | $ | 20,768 |
| | $ | 20,876 |
| | $ | 9,086 |
|
| Adjusted Operating Ratio | 95.4 | % | | 92.9 | % | | 97.0 | % | | 93.4 | % | | 92.6 | % | | 96.5 | % |
| Operating Ratio | 96.9 | % | | 94.4 | % | | 97.7 | % | | 94.9 | % | | 94.2 | % | | 97.2 | % |
| | | | | | | | | | | | |
| Intermodal: | | | | | | | | | | | |
| Operating revenue | $ | 89,759 |
| | $ | 86,063 |
| | $ | 63,176 |
| | $ | 251,459 |
| | $ | 236,228 |
| | $ | 165,045 |
|
| Less: Fuel surcharge revenue | 18,523 |
| | 18,139 |
| | 13,677 |
| | 52,788 |
| | 49,884 |
| | 35,397 |
|
| Revenue xFSR | 71,236 |
| | 67,924 |
| | 49,499 |
| | 198,671 |
| | 186,344 |
| | 129,648 |
|
| Operating expense | 87,780 |
| | 88,568 |
| | 62,837 |
| | 250,525 |
| | 242,637 |
| | 164,776 |
|
| Adjusted for: | | | | | | | | | | | |
| Fuel surcharge revenue | (18,523 | ) | | (18,139 | ) | | (13,677 | ) | | (52,788 | ) | | (49,884 | ) | | (35,397 | ) |
| Adjusted operating expense | 69,257 |
| | 70,429 |
| | 49,160 |
| | 197,737 |
| | 192,753 |
| | 129,379 |
|
| Adjusted operating (loss) income | $ | 1,979 |
| | $ | (2,505 | ) | | $ | 339 |
| | $ | 934 |
| | $ | (6,409 | ) | | $ | 269 |
|
| Adjusted Operating Ratio | 97.2 | % | | 103.7 | % | | 99.3 | % | | 99.5 | % | | 103.4 | % | | 99.8 | % |
| Operating Ratio | 97.8 | % | | 102.9 | % | | 99.5 | % | | 99.6 | % | | 102.7 | % | | 99.8 | % |
| |
(a) | As a result of the Acquisition of Central described in footnote (a) within the schedule Consolidated Statement of Operations (Unaudited) for the three and nine months ended September 30, 2013, 2012 and 2011, the above Adjusted Operating Income schedule for the three and nine months ended September 30, 2013, 2012 and 2011 reflect the combination of the entities as if the Acquisition was effective January 1, 2011. |
(b) In the third quarter of 2013, Central incurred a $0.9 million one-time non-cash-equity compensation charge for certain stock options that accelerated upon the closing of the Acquisition.
CONSOLIDATED BALANCE SHEET (UNAUDITED) (a)
AS OF SEPTEMBER 30, 2013 AND DECEMBER 31, 2012
(In thousands, except share data)
|
| | | | | | | |
| | September 30, 2013 | | December 31, 2012 |
| | (Unaudited) | | (recast) |
| ASSETS | | | |
| Current assets: | | | |
| Cash and cash equivalents | $ | 51,429 |
| | $ | 53,596 |
|
| Restricted cash | 50,376 |
| | 51,678 |
|
| Restricted investments, held to maturity, amortized cost | 24,175 |
| | 22,275 |
|
| Accounts receivable, net | 413,077 |
| | 392,770 |
|
| Equipment sales receivable | — |
| | 563 |
|
| Income tax refund receivable | 25,754 |
| | 10,046 |
|
| Inventories and supplies | 18,149 |
| | 17,524 |
|
| Assets held for sale | 9,897 |
| | 31,544 |
|
| Prepaid taxes, licenses, insurance and other | 65,106 |
| | 58,903 |
|
| Deferred income taxes | 63,749 |
| | 98,235 |
|
| Current portion of notes receivable | 6,389 |
| | 4,957 |
|
| Total current assets | 728,101 |
| | 742,091 |
|
| Property and equipment, at cost: | | | |
| Revenue and service equipment | 2,008,793 |
| | 1,863,634 |
|
| Land | 124,971 |
| | 120,442 |
|
| Facilities and improvements | 254,933 |
| | 250,816 |
|
| Furniture and office equipment | 59,036 |
| | 51,340 |
|
| Total property and equipment | 2,447,733 |
| | 2,286,232 |
|
| Less: accumulated depreciation and amortization | 942,646 |
| | 888,696 |
|
| Net property and equipment | 1,505,087 |
| | 1,397,536 |
|
| Other assets | 57,031 |
| | 65,537 |
|
| Intangible assets, net | 320,950 |
| | 333,561 |
|
| Goodwill | 253,256 |
| | 253,256 |
|
| Total assets | $ | 2,864,425 |
| | $ | 2,791,981 |
|
| LIABILITIES AND STOCKHOLDERS’ EQUITY | | | |
| Current liabilities: | | | |
| Accounts payable | $ | 152,475 |
| | $ | 113,374 |
|
| Accrued liabilities | 123,985 |
| | 107,772 |
|
| Current portion of claims accruals | 88,843 |
| | 86,587 |
|
| Current portion of long-term debt and obligations under capital leases (b) | 62,273 |
| | 73,497 |
|
| Fair value of guarantees | 366 |
| | 366 |
|
| Current portion of fair value of interest rate swaps | 4,921 |
| | 1,853 |
|
| Total current liabilities | 432,863 |
| | 383,449 |
|
| Revolving line of credit | 62,000 |
| | 2,531 |
|
| Long-term debt and obligations under capital leases (b) | 1,286,307 |
| | 1,357,101 |
|
| Claims accruals, less current portion | 105,492 |
| | 98,919 |
|
| Fair value of interest rate swaps, less current portion | 7,532 |
| | 11,497 |
|
| Deferred income taxes | 472,264 |
| | 441,381 |
|
| Securitization of accounts receivable | 260,000 |
| | 204,000 |
|
| Other liabilities | 3,133 |
| | 2,899 |
|
| Total liabilities | 2,629,591 |
| | 2,501,777 |
|
| Stockholders' equity: | | | |
| Class A common stock | 880 |
| | 871 |
|
| Class B common stock | 525 |
| | 525 |
|
| Additional paid-in capital | 756,620 |
| | 920,827 |
|
| Accumulated deficit | (516,467 | ) | | (601,777 | ) |
| Central Refrigerated stockholders' loans receivable, pre-acquisition | — |
| | (22,142 | ) |
| Accumulated other comprehensive loss | (6,826 | ) | | (8,202 | ) |
| Noncontrolling interests | 102 |
| | 102 |
|
| Total stockholders' equity | 234,834 |
| | 290,204 |
|
| Total liabilities and stockholders' equity | $ | 2,864,425 |
| | $ | 2,791,981 |
|
Notes to Selected Consolidated Balance Sheet Data:
| |
| (a) | As a result of the Acquisition described in footnote (a) within the schedule Consolidated Statements of Operations (Unaudited) for the three and nine months ended September 30, 2013 and 2012, the above Consolidated Balance Sheet as of September 30, 2013 and December 31, 2012 reflects the combination of the entities as if the Acquisition was effective January 1, 2012. |
| |
| (b) | On March 7, 2013, the Company entered into a Second Amended and Restated Credit Agreement (the “2013 Agreement”) replacing our previous Amended and Restated Credit Agreement dated March 6, 2012 (the “2012 Agreement”). The 2013 Agreement replaced the previous first lien term loan B-1 and B-2 tranches with outstanding principal balances of $152.0 million and $508.0 million, respectively, with new first lien term B-1 and B-2 tranches with face values of $250.0 million and $410.0 million, respectively. In addition, the 2013 Agreement reduced the interest rate applicable to the first lien term loan B-1 tranche to the LIBOR rate plus 2.75% with no LIBOR floor, down from LIBOR plus 3.75% with no LIBOR floor, and reduced the interest rate applicable to the first lien term loan B-2 tranche to the LIBOR rate plus 3.00% with a 1.00% LIBOR floor, down from LIBOR plus 3.75% with a 1.25% LIBOR floor. The replacement of the 2012 Agreement resulted in a loss on debt extinguishment of $5.0 million in the first quarter of 2013, representing the write-off of the unamortized original issue discount and deferred financing fees associated with the then-existing first lien term loan B-1 and B-2 tranches. |
Total debt and capital lease obligations as of September 30, 2013 includes $238.0 million net carrying value of first lien term loan B-1 tranche, $410.0 million net carrying value of the first lien term loan B-2 tranche, $493.5 million net carrying value of senior second priority secured notes, and $207.1 million of other secured indebtedness and capital lease obligations. Total debt and capital lease obligations as of December 31, 2012 includes $157.1 million net carrying value of the first lien term loan B-1 tranche, $575.6 million net carrying value of the first lien term loan B-2 tranche, $492.6 million net carrying value of senior second priority secured notes, and $205.3 million of other secured indebtedness and capital lease obligations.
CONSOLIDATED STATEMENTS OF CASH FLOWS (UNAUDITED) (a)
NINE MONTHS ENDED SEPTEMBER 30, 2013 AND 2012
(In thousands)
|
| | | | | | | |
| | Nine Months Ended September 30, |
| | 2013 | | 2012 |
| Cash flows from operating activities: | | | (recast) |
| Net income | $ | 110,124 |
| | $ | 85,403 |
|
| Adjustments to reconcile net income to net cash provided by operating activities: | | | |
| Depreciation and amortization of property, equipment and intangibles | 182,615 |
| | 177,075 |
|
| Amortization of debt issuance costs, original issue discount, and losses on terminated swaps | 5,107 |
| | 9,368 |
|
| Gain on disposal of property and equipment less write-off of totaled tractors | (12,902 | ) | | (12,560 | ) |
| Gain on sale of real property | (6,876 | ) | | — |
|
| Impairments | — |
| | 1,065 |
|
| Equity losses of investee | 228 |
| | 889 |
|
| Deferred income taxes | 64,695 |
| | 25,997 |
|
| Provision for allowance for losses on accounts receivable | 872 |
| | 1,139 |
|
| Non-cash equity compensation | 3,465 |
| | 4,315 |
|
| Loss on debt extinguishment | 5,540 |
| | 22,219 |
|
| Income effect of mark-to-market adjustment of interest rate swaps | 654 |
| | — |
|
| Interest on shareholder loan | (53 | ) | | (44 | ) |
| Increase (decrease) in cash resulting from changes in: | | | |
| Accounts receivable | (18,939 | ) | | (41,534 | ) |
| Inventories and supplies | (629 | ) | | (1,299 | ) |
| Prepaid expenses and other current assets | (23,946 | ) | | (19,696 | ) |
| Other assets | 6,976 |
| | (17 | ) |
| Accounts payable, accrued and other liabilities | 38,932 |
| | 32,262 |
|
| Net cash provided by operating activities | 355,863 |
| | 284,582 |
|
| Cash flows from investing activities: | | | |
| Decrease in restricted cash | 1,302 |
| | 16,892 |
|
| Change in restricted investments | (1,900 | ) | | (18,216 | ) |
| Funding of note receivable | — |
| | (7,500 | ) |
| Proceeds from sale of property and equipment | 75,812 |
| | 106,333 |
|
| Capital expenditures | (236,990 | ) | | (221,034 | ) |
| Payments received on notes receivable | 2,775 |
| | 4,357 |
|
| Expenditures on assets held for sale | (17,442 | ) | | (5,935 | ) |
| Payments received on assets held for sale | 47,365 |
| | 11,337 |
|
| Payments received on equipment sale receivables | 1,266 |
| | 5,580 |
|
| Acquisition of Central Refrigerated, net of debt repayment | (147,822 | ) | | — |
|
| Other investing activities | — |
| | (500 | ) |
| Net cash used in investing activities | (275,634 | ) | | (108,686 | ) |
| Cash flows from financing activities: | | | |
| Repayment of long-term debt and capital leases | (199,490 | ) | | (233,353 | ) |
| Net borrowings on revolving line of credit | 59,469 |
| | 4,834 |
|
| Borrowings under accounts receivable securitization | 180,000 |
| | 211,000 |
|
| Repayment of accounts receivable securitization | (124,000 | ) | | (187,000 | ) |
| Proceeds from long-term debt | 26,268 |
| | 10,000 |
|
| Payment of deferred loan costs | (2,183 | ) | | (9,023 | ) |
| Distribution to Central Refrigerated stockholders, pre-acquisition | (2,499 | ) | | (10,111 | ) |
| Issuance of Central Refrigerated stockholders' loan receivable, pre-acquisition | (30,000 | ) | | — |
|
| Proceeds from exercise of stock options | 10,422 |
| | 268 |
|
| Income tax benefit from exercise of stock options | (383 | ) | | (322 | ) |
| Other financing activities | — |
| | (952 | ) |
| Net cash used in financing activities | (82,396 | ) | | (214,659 | ) |
| Decrease in cash and cash equivalents | (2,167 | ) | | (38,763 | ) |
| Cash and cash equivalents at beginning of period | 53,596 |
| | 82,084 |
|
| Cash and cash equivalents at end of period | $ | 51,429 |
| | $ | 43,321 |
|
| | | | |
| | | | |
|
| | | | | | | |
| Supplemental disclosure of cash flow information: | | | |
| Cash paid during the period for: | | | |
| Interest | $ | 67,833 |
| | $ | 82,175 |
|
| Income taxes | $ | 20,602 |
| | $ | 19,442 |
|
| | | | |
| Supplemental schedule of: | | | |
| Non-cash investing activities: | | | |
| Equipment sales receivables | $ | 696 |
| | $ | 4,724 |
|
| Equipment purchase accrual | $ | 39,369 |
| | $ | 19,310 |
|
| Notes receivable from sale of assets | $ | 5,855 |
| | $ | 3,353 |
|
| Non-cash financing activities: | | | |
| Capital lease additions | $ | 85,094 |
| | $ | 38,453 |
|
| Accrued deferred loan costs | $ | — |
| | $ | 228 |
|
| Insurance premium and software notes payable | $ | 3,324 |
| | $ | — |
|
| Non-cash distribution to Central Refrigerated stockholders in satisfaction of stockholders' loans receivable, pre-acquisition | $ | 22,315 |
| | $ | — |
|
| Non-cash exercise of Central Refrigerated stock options in exchange for stockholders' loans receivable, pre-acquisition | $ | 3,415 |
| | $ | — |
|
| Cancellation of Central Refrigerated stockholders' loans receivable at closing of acquisition | $ | 33,295 |
| | $ | — |
|
(a) As a result of the Acquisition described in footnote (a) within the schedule Consolidated Statements of Operations (Unaudited) for the three and nine months ended September 30, 2013 and 2012, the above Consolidated Statements of Cash Flows for the nine months ended September 30, 2013 and 2012 reflects the combination of the entities as if the Acquisition was effective January 1, 2012.