April 24, 2014
Dear Fellow Stockholders of Swift Transportation Company (NYSE: SWFT),
A summary of our key results for the three months ended March 31, is shown below:
|
| | | | | | | | | | | |
| | Three Months Ended March 31, |
| | 2014 | | 2013 | | 2012 |
| | Unaudited |
| | ($ in millions, except per share data) |
| Operating Revenue | $ | 1,008.4 |
| | $ | 981.6 |
| | $ | 943.8 |
|
Revenue xFSR1 | $ | 817.0 |
| | $ | 784.6 |
| | $ | 755.4 |
|
| | | | | | |
| Operating Ratio | 95.4 | % | | 92.9 | % | | 93.3 | % |
Adjusted Operating Ratio2 | 93.9 | % | | 90.6 | % | | 90.9 | % |
| | | | | | |
| EBITDA | $ | 104.5 |
| | $ | 130.4 |
| | $ | 102.9 |
|
Adjusted EBITDA2 | $ | 108.5 |
| | $ | 136.0 |
| | $ | 126.2 |
|
| | | | | | |
| Diluted EPS | $ | 0.09 |
| | $ | 0.21 |
| | $ | 0.08 |
|
Adjusted EPS2 | $ | 0.12 |
| | $ | 0.24 |
| | $ | 0.16 |
|
| | | | | | |
1Revenue xFSR is Operating Revenue, excluding fuel surcharge revenue |
2 See GAAP to Non-GAAP reconciliation in the schedules following this letter |
Quarterly Highlights (discussed in more detail below, including GAAP to non-GAAP reconciliations):
| |
• | First quarter 2014 Adjusted EPS decreased to $0.12, versus $0.24 in the first quarter of 2013 which included a gain on sale of property of $0.03 |
| |
| • | Severe winter weather, and its associated impact on freight volumes, fuel, insurance costs and maintenance expense had a negative impact of approximately $15 million on operating income in the first quarter of 2014, excluding Central Refrigerated Services ("CRS") |
| |
| • | CRS was impacted negatively by $2 - $3 million due to weather and the February 1, 2014 system integration, which resulted in lost volume as drivers and loads were transitioned to the new system |
| |
| • | Despite headwinds in the first quarter, Revenue xFSR grew 4.1% year over year |
| |
| • | Dedicated Revenue xFSR grew 8.5% year over year, with the addition of 550 operational trucks over the course of the first quarter. We expect to add approximately 150 additional trucks over the course of the second quarter of 2014, which will increase the average operational truck count by approximately 400 trucks from the first quarter to the second quarter of 2014. |
| |
| • | Revenue xFSR per loaded mile in our Truckload segment increased 3.0% year over year |
| |
| • | Utilization, as measured by loaded miles per truck per week, in our Truckload segment improved throughout the quarter and into April with March increasing 1% year over year |
| |
| • | Revenue xFSR in our Intermodal segment grew 11.8% compared to the first quarter of 2013 |
| |
• | Intermodal Adjusted Operating Ratio improved 120 basis points year over year |
| |
| • | Net Debt was reduced by $55.4 million during the quarter and included the repurchase and subsequent cancellation of $23.8 million of our 10% Senior Secured Notes within the quarter. An additional $15.4 million were purchased/canceled in April. |
Segment Reporting
During the first quarter of 2014, we completed the process of migrating CRS onto Swift's systems. As a result of this process, combined with a restructuring of responsibilities within the consolidated Company, we made some minor changes to our segment reporting structure. CRS's Trailer on Flat Car ("TOFC") business will now be reported in our Intermodal segment. CRS's logistics business, third-party leasing, and other services provided to owner-operators will now be combined with Swift's other non-reportable segments. All historical segment information for the three months ended March 31, 2013 and 2012 has been recast to reflect these changes within the exhibits attached to the letter. Additionally, we have recast all historical segment information for the 2013 and 2012 periods and have provided this recast segment information in a separate Current Report on Form 8-K dated April 24, 2014.
First Quarter Overview
For the quarter ended March 31, 2014, we generated Operating Revenue of $1,008.4 million compared to $981.6 million in the same quarter of 2013. Our Revenue xFSR grew 4.1% to $817.0 million. Diluted earnings per share, in accordance with GAAP, was $0.09 in the first quarter of 2014 compared to $0.21 in the first quarter of 2013. Adjusted diluted earnings per share, or Adjusted EPS, decreased to $0.12 compared to $0.24 in the same quarter of 2013, which included a pre-tax gain on sale of property of $6.1 million, or $0.03 of Adjusted EPS. A reconciliation of GAAP results to non-GAAP results, as adjusted to exclude certain non-cash or special items per our definition of Adjusted EPS, is provided in the schedules following this letter.
In the first quarter of 2014, we experienced severe winter weather in various markets throughout our network. These adverse conditions impacted our operational efficiency and profitability, specifically as it relates to overall freight volumes, fuel costs, insurance costs and maintenance expense. We estimate that the combined negative impact of the severe weather conditions on operating income was approximately $15 million in the first quarter of 2014, excluding CRS. Additionally, as previously disclosed, CRS operational and financial systems were converted to Swift's systems in February 2014. The integration process for these new systems, which impacted all CRS office employees and drivers, combined with the poor weather, had a $2 -$3 million negative impact on operating income in the quarter, primarily driven from a short-term deterioration in volume and operational metrics. Finally, insurance and claims expense proved to be a headwind for the quarter. In addition to the weather impact, insurance and claims expense was adversely impacted by two claims which occurred late in December 2013. These claims negatively impacted operating income in the quarter by $5.5 million combined.
In spite of the headwinds previously discussed, we are optimistic about several operational trends we have experienced over the past several weeks. Demand continues to increase and capacity remains tight, which has led to improvement in our utilization and rate per mile, and has increased shippers' desire to lock-in capacity. Over the past several weeks, we have also experienced improvement in our accident frequency, moving miles per gallon, and engine idle metrics. However, with the economy improving, our industry's driver market is becoming increasingly challenging.
While we have several unique programs and processes in place that differentiate us from our peers, driver availability will need to be carefully and continually monitored in the coming quarters.
Although the first quarter was difficult, we are encouraged by the trends we are currently experiencing. Given the challenging first quarter and changing market dynamics, we have worked with each of our business unit leaders over the past several weeks, to update our earnings expectations. Based on this analysis, we believe that our second quarter 2014 Adjusted EPS will be in the range of $0.30-$0.35. Furthermore, although there remains inherent uncertainty in the overall economy, and specifically the truckload industry between now and year end, we currently expect our Adjusted EPS for the full year of 2014 to be in the range of $1.31-$1.41.
First Quarter Results by Reportable Segment
Truckload Segment
Our Truckload segment consists of one-way movements over irregular routes throughout the United States, Mexico and Canada. This service uses both company and owner-operator tractors with dry van, flatbed and other specialized trailing equipment.
|
| | | | | | | | | | | |
| | Three Months Ended March 31, |
| | 2014 | | 2013 | | 2012 |
Operating Revenue (1) | $ | 553.1 |
| | $ | 559.6 |
| | $ | 551.2 |
|
Revenue xFSR(1)(2) | $ | 441.4 |
| | $ | 441.3 |
| | $ | 434.4 |
|
| | | | | | |
| Operating Ratio | 94.2 | % | | 92.4 | % | | 91.6 | % |
Adjusted Operating Ratio(3) | 92.8 | % | | 90.4 | % | | 89.3 | % |
| | | | | | |
| Weekly Revenue xFSR per Tractor | $ | 3,225 |
| | $ | 3,182 |
| | $ | 3,028 |
|
Total Loaded Miles(4) | 254,426 |
| | 261,850 |
| | 262,549 |
|
| | | | | | |
| Average Operational Truck Count | 10,635 |
| | 10,785 |
| | 11,037 |
|
| Deadhead Percentage | 11.7 | % | | 11.2 | % | | 11.3 | % |
| | | | | | |
1 In millions |
2 Revenue xFSR is operating revenue, excluding fuel surcharge revenue |
3 See GAAP to Non-GAAP reconciliation in the schedules following this letter |
4 Total Loaded Miles presented in thousands |
As discussed above, we experienced significant headwinds during the first quarter of 2014, primarily in the form of severe weather, which negatively impacted our overall miles, as well as various cost categories, including fuel, insurance, and maintenance expense. Despite these headwinds, which led to a 2.8% year over year decrease in loaded miles, our Revenue xFSR for the first quarter of 2014 increased slightly to $441.4 million compared with $441.3 million for the same quarter in 2013. Our Revenue xFSR per loaded mile increased 3.0% driven primarily by contractual rate increases, freight mix, and an increase in paid repositioning. The increase in tractor repositioning drove an increase in our deadhead or empty mile percentage, although our unpaid miles were relatively consistent year over year. Weekly Revenue xFSR per Tractor increased 1.4% to $3,225.
The Adjusted Operating Ratio in our Truckload segment increased 240 basis points over the first quarter of 2013. The year over year increase was driven primarily by an increase in insurance expense, other weather related items and higher equipment costs.
During the first quarter, the Average Operational Truck Count grew slightly when compared to the fourth quarter of 2013, but it decreased by 150 trucks year over year. This year over year reduction was due to the transition of equipment to our Dedicated segment through the latter half of 2013 and the first quarter of 2014. For the second quarter, we expect our Truckload segment's average operational truck count to be reduced by 100 to 200 trucks as we have already shifted, and may continue to shift additional resources to support revenue growth in our Dedicated segment. As new dedicated business is won, we shift resources from Truckload into Dedicated to facilitate the start-ups. Assuming we are able to recruit additional drivers, we anticipate growing our truck count in the Truckload segment during the second half of 2014.
Dedicated Segment
Through our Dedicated segment, we devote equipment and offer tailored solutions under long-term contracts with customers. This dedicated business utilizes refrigerated, dry van, flatbed and other specialized trailing equipment.
Revenue xFSR grew 8.5% to $157.1 million in the first quarter of 2014 from $144.8 million during the first quarter of 2013. This growth is driven by numerous new accounts that started in the latter half of 2013 and the first quarter of 2014.
Our Adjusted Operating Ratio in our Dedicated segment increased 580 basis points to 92.7% in the first quarter of 2014 driven by increased insurance and claims expense, higher cost of equipment, and the start-up costs associated with new accounts in the first quarter of 2014. Additionally, the winter weather combined with the staging of equipment to service new customer accounts caused our Weekly Revenue xFSR per Tractor to decrease 6.3% to $3,173 in the first quarter of 2014 compared to $3,385 in the first quarter of 2013. We expect our Weekly Revenue xFSR per Tractor to improve but remain somewhat constrained in the second quarter as we onboard a large number of new customers before returning to prior year levels later in the year.
|
| | | | | | | | | | | |
| | Three Months Ended March 31, |
| | 2014 | | 2013 | | 2012 |
Operating Revenue (1) | $ | 193.7 |
| | $ | 179.2 |
| | $ | 171.5 |
|
Revenue xFSR(1)(2) | $ | 157.1 |
| | $ | 144.8 |
| | $ | 140.4 |
|
| | | | | | |
| Operating Ratio | 94.0 | % | | 89.4 | % | | 91.5 | % |
Adjusted Operating Ratio(3) | 92.7 | % | | 86.9 | % | | 89.7 | % |
| | | | | | |
| Weekly Revenue xFSR per Tractor | $ | 3,173 |
| | $ | 3,385 |
| | $ | 3,370 |
|
| Average Operational Truck Count | 3,852 |
| | 3,327 |
| | 3,205 |
|
| | | | | | |
1 In millions |
2 Revenue xFSR is operating revenue, excluding fuel surcharge revenue |
3 See GAAP to Non-GAAP reconciliation in the schedules following this letter |
Over the course of the first quarter 2014, we added 550 operational trucks to our Dedicated segment causing our average Dedicated truck count to increase 177 units from 3,675 for the fourth quarter of 2013 to 3,852 for the first quarter of 2014 . We currently have several growth opportunities in the pipeline; either those that have already been
awarded but not yet implemented, and/or those which we expect to be awarded shortly. As a result, we expect to increase our second quarter 2014 average operational truck count by approximately 400 trucks over the first quarter average.
Central Refrigerated Segment
Our CRS segment represents shipments for customers that require temperature-controlled trailers and represents the core operations of Central Refrigerated. These shipments include one-way movements over irregular routes and dedicated truck operations. As discussed above, the historical results for the Central Refrigerated segment have been recast to reflect the organizational changes implemented in the first quarter of 2014. As discussed, CRS's Trailer on Flat Car ("TOFC") business is now be reported in our Intermodal segment and CRS's logistics business, third-party leasing, and other services provided to owner-operators is now combined with Swift's other non-reportable segments.
|
| | | | | | | | | | | |
| | Three Months Ended March 31, |
| | 2014 | | 2013 | | 2012 |
| | | | (recast) | | (recast) |
Operating Revenue (1) | $ | 106.8 |
| | $ | 106.4 |
| | $ | 101.4 |
|
Revenue xFSR(1)(2) | $ | 83.6 |
| | $ | 81.6 |
| | $ | 77.2 |
|
| | | | | | |
| Operating Ratio | 97.7 | % | | 95.6 | % | | 96.3 | % |
Adjusted Operating Ratio(3) | 97.1 | % | | 94.2 | % | | 95.2 | % |
| | | | | | |
| Weekly Revenue xFSR per Tractor | $ | 3,235 |
| | $ | 3,330 |
| | $ | 3,345 |
|
| Average Operational Truck Count | 2,012 |
| | 1,905 |
| | 1,775 |
|
| Deadhead Percentage | 14.0 | % | | 12.1 | % | | 12.0 | % |
| | | | | | |
1 In millions |
2 Revenue xFSR is operating revenue, excluding fuel surcharge revenue |
3 See GAAP to Non-GAAP reconciliation in the schedules following this letter |
Revenue xFSR for the first quarter of 2014 increased 2.5% to $83.6 million compared to $81.6 million for the same quarter in 2013. This increase in Revenue xFSR was driven primarily by a significant new dedicated customer added in June 2013 which has a much lower average length of haul, higher deadhead, and a much higher Revenue xFSR per loaded mile. This increased business was partially offset by lower volumes primarily in the over the road business driven by adverse weather conditions and the systems conversion in February of 2014.
The Adjusted Operating Ratio in our CRS segment increased 290 basis points over the first quarter of 2013, driven by poor weather, higher equipment costs, an increase in unmanned equipment, higher deadhead, and the challenges associated with the February system conversion.
The systems conversion is now complete. We are currently in the process of consolidating and selling three redundant facilities and assimilating the back office functions. This is expected to be mostly completed in the second quarter of 2014.
Intermodal Segment
Our Intermodal segment includes revenue generated by freight moving over the rail in our containers and other trailing equipment, combined with revenue for drayage to transport loads between the railheads and customer locations.
|
| | | | | | | | | | | |
| | Three Months Ended March 31, |
| | 2014 | | 2013 | | 2012 |
| | | | (recast) | | (recast) |
Operating Revenue (1) | $ | 91.3 |
| | $ | 83.3 |
| | $ | 73.6 |
|
Revenue xFSR(1)(2) | $ | 72.9 |
| | $ | 65.3 |
| | $ | 58.2 |
|
| | | | | | |
Operating Ratio (4) | 101.0 | % | | 101.9 | % | | 105.2 | % |
Adjusted Operating Ratio(3)(4) | 101.3 | % | | 102.5 | % | | 106.5 | % |
| | | | | | |
| Load Counts | 38,603 | | 35,639 | | 32,276 |
| Average Container Counts | 8,717 | | 8,717 | | 6,317 |
| | | | | | |
1 In millions |
2 Revenue xFSR is operating revenue, excluding fuel surcharge revenue |
3 See GAAP to Non-GAAP reconciliation in the schedules following this letter |
4 During 2012, our Intermodal reportable segment incurred an increase in its insurance and claims expense primarily related to one claim associated with a drayage accident, which increased the Intermodal Operating Ratio and Adjusted Operating Ratio by approximately 420 basis points and 530 basis points, respectively, for three months ended March 31, 2012.
|
We continue to make positive improvements in our Intermodal segment. During the first quarter of 2014, Revenue xFSR in our Intermodal segment grew 11.8% over the first quarter of 2013. This increase in Revenue xFSR was driven by a 8.3% increase in loads and a 3.2% increase in Revenue xFSR per load.
Our Adjusted Operating Ratio improved 120 basis points year over year as we continue to improve the utilization of our equipment, improve our network, and better manage our dray costs. Although these results were positive, the significant weather and rail network disruptions negatively impacted both volumes and operational costs for a major portion of the first quarter.
Our average container count remained flat at 8,717 containers as we continue to focus on increasing the utilization of our existing equipment. We expect our container count to remain flat through the second quarter but plan to add 500 containers in the second half of 2014 given the additional awards we have recently won and the pipeline of new bids.
Other Non-Reportable Segments
Our other non-reportable segments include our logistics and brokerage services as well as our subsidiaries offering support services to customers and owner-operators, including shop maintenance, equipment leasing and insurance. In the first quarter of 2014, combined revenue from these services increased 5.0% compared to the same quarter in 2013, driven primarily by an increase in the services provided to owner-operators.
First Quarter Consolidated Operating Expenses
The table below highlights some of our cost categories for the first quarter of 2014, compared to the first quarter of 2013 and the fourth quarter of 2013, showing each as a percent of Revenue xFSR. Fuel surcharge revenue can be volatile and is primarily dependent upon the cost of fuel and not specifically related to our non-fuel operational expenses. Therefore, we believe that Revenue xFSR is a better measure for analyzing our expenses and operating metrics.
|
| | | | | | | | | | | | | | | | | | | | |
| | | | | YOY | | | | | | QOQ |
| Q1'14 | | Q1'13 | | Variance1 | ($ in millions) | Q1'14 | | Q4'13 | | Variance1 |
| $ | 1,008.4 |
| | $ | 981.6 |
| | 2.7 | % | Total Revenue | $ | 1,008.4 |
| | $ | 1,075.4 |
| | -6.2 | % |
| $ | (191.4 | ) | | $ | (197.0 | ) | | -2.8 | % | Less: Fuel Surcharge Revenue | $ | (191.4 | ) | | $ | (196.8 | ) | | -2.7 | % |
| $ | 817.0 |
| | $ | 784.6 |
| | 4.1 | % | Revenue xFSR | $ | 817.0 |
| | $ | 878.6 |
| | -7.0 | % |
| | | | | | | | | | | |
| $ | 229.4 |
| | $ | 226.5 |
| | -1.3 | % | Salaries, Wages & Benefits | $ | 229.4 |
| | $ | 233.5 |
| | 1.8 | % |
| 28.1 | % | | 28.9 | % | | 80 bps |
| % of Revenue xFSR | 28.1 | % | | 26.6 | % | | -150 bps |
|
| | | | | | | | | | | |
| $ | 80.8 |
| | $ | 72.1 |
| | -12.1 | % | Operating Supplies & Expenses | $ | 80.8 |
| | $ | 82.8 |
| | 2.4 | % |
| 9.9 | % | | 9.2 | % | | -70 bps |
| % of Revenue xFSR | 9.9 | % | | 9.4 | % | | -50 bps |
|
| | | | | | | | | | | |
| $ | 42.4 |
| | $ | 31.5 |
| | -34.6 | % | Insurance & Claims | $ | 42.4 |
| | $ | 41.9 |
| | -1.2 | % |
| 5.2 | % | | 4.0 | % | | -120 bps |
| % of Revenue xFSR | 5.2 | % | | 4.8 | % | | -40 bps |
|
| | | | | | | | | | | |
| $ | 7.2 |
| | $ | 6.6 |
| | -9.1 | % | Communications & Utilities | $ | 7.2 |
| | $ | 6.4 |
| | -12.5 | % |
| 0.9 | % | | 0.8 | % | | -10 bps |
| % of Revenue xFSR | 0.9 | % | | 0.7 | % | | -20 bps |
|
| | | | | | | | | | | |
| $ | 18.3 |
| | $ | 18.1 |
| | -1.1 | % | Operating Taxes & Licenses | $ | 18.3 |
| | $ | 19.1 |
| | 4.2 | % |
| 2.2 | % | | 2.3 | % | | 10 bps |
| % of Revenue xFSR | 2.2 | % | | 2.2 | % | | — |
|
| | | | | | | | | | | |
1 Positive numbers represent favorable variances, negative numbers represent unfavorable variances |
Salaries, wages and benefits increased $2.9 million to $229.4 million during the first quarter of 2014, compared to $226.5 million for the first quarter of 2013 due primarily to an increase non-driving employees and an increase in driver wages per mile, primarily driven by a change in driver mix across our various segments. Specifically, we experienced growth in our dedicated business, which typically has a shorter length of haul and a higher driver wage per mile. These increases are partially offset by a decrease in the number of miles driven by company drivers. Sequentially, salaries, wages and benefits decreased by $4.1 million to $229.4 million during the first quarter of 2014 compared to $233.5 million in the fourth quarter of 2013 due primarily to a decrease in the number of miles driven by company drivers in the first quarter of 2014 combined with a decrease in the employee bonus accrual, partially offset by an increase in workers compensation expense.
Operating supplies and expenses increased $8.7 million to $80.8 million during the first quarter of 2014, compared to $72.1 million for the first quarter of 2013, due primarily to increased hiring costs, increased legal expenses, and increases in equipment maintenance.
Insurance and claims expense increased to $42.4 million for the first quarter of 2014, compared to $31.5 million in the first quarter of 2013. As a percent of Revenue xFSR, insurance and claims expense increased to 5.2% in the first
quarter of 2014 from 4.0% in the prior year. During the first quarter of 2014, we reserved $5.5 million related to two accidents that occurred in December of 2013. Additionally, the severe winter weather in December of 2013 and throughout the first quarter of 2014, contributed to a higher accident frequency year over year thus causing our incurred but not reported reserves to increase in the quarter. In lieu of the higher accident frequency due to the severe weather in the first quarter, and the anticipated effect it will have on the actuarial models, we expect our full year insurance and claims expense as a percent of Revenue xFSR to be approximately 4.3% which is consistent with the full year 2013.
Fuel Expense
|
| | | | | | | | | | | | | | |
| Q1'14 | | Q1'13 | ($ in millions, except D.O.E. Diesel Fuel Index) | Q1'14 | | Q4'13 |
| $ | 156.0 |
| | $ | 168.1 |
| Fuel Expense | $ | 156.0 |
| | $ | 150.4 |
|
| 15.5 | % | | 17.1 | % | % of Total Revenue | 15.5 | % | | 14.0 | % |
| | | | | | | |
| $ | 191.4 |
| | $ | 197.1 |
| Fuel Surcharge Revenue (FSR) | $ | 191.4 |
| | $ | 196.8 |
|
| $ | (86.3 | ) | | $ | (84.0 | ) | Less: FSR Reimbursed to Third Parties | $ | (86.3 | ) | | $ | (87.1 | ) |
| $ | 105.1 |
| | $ | 113.1 |
| Company FSR | $ | 105.1 |
| | $ | 109.7 |
|
| | | | | | | |
| $ | 156.0 |
| | $ | 168.1 |
| Fuel Expense | $ | 156.0 |
| | $ | 150.4 |
|
| $ | (105.1 | ) | | $ | (113.1 | ) | Less: Company FSR | $ | (105.1 | ) | | $ | (109.7 | ) |
| $ | 50.9 |
| | $ | 55.0 |
| Net Fuel Expense | $ | 50.9 |
| | $ | 40.7 |
|
| 6.2 | % | | 7.0 | % | % of Revenue xFSR | 6.2 | % | | 4.6 | % |
| | | | | | | |
| $ | 3.962 |
| | $ | 4.026 |
| Average D.O.E. Diesel Fuel Index | $ | 3.962 |
| | $ | 3.869 |
|
| -1.6 | % | | 1.7 | % | Year over Year % Change | -1.6 | % | | -3.8 | % |
Fuel expense for the first quarter of 2014, noted in the chart above, was $156.0 million, representing a decrease of $12.1 million from the first quarter of 2013. We collect fuel surcharge revenue from our customers to help mitigate increases in fuel prices. The surcharges are primarily based on the Department of Energy (D.O.E.) Diesel Fuel Index, which is set on Monday each week based on retail prices at various truck stops around the country. We utilize a portion of our fuel surcharge revenue to reimburse owner-operators and other third parties, such as the railroads, who also must pay for fuel. To evaluate the effectiveness of our fuel surcharges, we deduct the portion of the revenue we pay to third parties and then subtract the remaining company-related fuel surcharge revenue from our fuel expense. This calculation of Net Fuel Expense is shown above.
During the first quarter of 2014, Net Fuel Expense was $50.9 million compared to $55.0 million in the first quarter of 2013. The decrease in Net Fuel Expense is due primarily to a reduction in the number of miles driven by company drivers partially offset by an increase in idle fuel costs and lower miles per gallon resulting from the severe winter weather in the first quarter of 2014 as compared to the first quarter of 2013.
Sequentially, Net Fuel increased from $40.7 million to $50.9 million, despite a 4.1% reduction in miles driven by company trucks, due to increased idle and lower miles per gallon resulting from the severe winter weather in the first quarter of 2014 discussed above, as well as an increase in fuel costs through the first quarter of 2014. As discussed previously, we bill fuel surcharges based on a historical D.O.E. Diesel Fuel Index per our customer contracts, which is generally the prior week’s Index, but we pay for fuel based on current day prices. Therefore, in periods of rising fuel prices, we are negatively impacted due to the structural lag in billing fuel surcharges. The opposite is true
during periods of declining fuel prices. During the fourth quarter of 2013, fuel price, based on the Average D.O.E. Diesel Fuel Index, decreased 1.2% whereas during the first quarter of 2014, fuel prices increased 1.7%.
Purchased Transportation
Purchased transportation includes payments to owner-operators, railroads and other third parties we use for intermodal drayage and other brokered business.
|
| | | | | | | | | | | | | | | | |
| Q1'14 | | Q1'13 | | ($ in millions) | Q1'14 | | Q4'13 | |
| $ | 319.2 |
| | $ | 292.2 |
| | Purchased Transportation | $ | 319.2 |
| | $ | 337.1 |
| |
| 31.6 | % | | 29.8 | % | | % of Total Revenue | 31.6 | % | | 31.3 | % | |
| | | | | | | | | |
| $ | (86.3 | ) | | $ | (84.0 | ) | | Less: FSR Reimbursed to Third Parties | $ | (86.3 | ) | | $ | (87.1 | ) | |
| | | | | | | | | |
| $ | 232.9 |
| | $ | 208.2 |
| | Net Purchased Transportation | $ | 232.9 |
| | $ | 250.0 |
| |
| 28.5 | % | | 26.5 | % | | % of Revenue xFSR | 28.5 | % | | 28.5 | % | |
As noted in the table above, during the first quarter of 2014, excluding fuel reimbursements, Net Purchased Transportation increased $24.7 million year over year due primarily to an increase in the number of owner-operators, an increase in intermodal volume, and an increase in third party logistics volume. As a percent of Revenue xFSR, Net Purchased Transportation increased from 26.5% in the first quarter of 2013 to 28.5% in the first quarter of 2014 due to an increased in the percent of miles driven by owner-operators compared to company drivers and the higher revenue growth of both our intermodal and logistics businesses.
Sequentially, Net Purchased Transportation decreased $17.1 million due to lower seasonal freight volumes in the first quarter compared to the fourth quarter. As a percent of Revenue xFSR, Net Purchased Transportation was flat from the fourth quarter of 2013 to the first quarter of 2014.
Rental Expense and Depreciation & Amortization of Property and Equipment
Due to fluctuations in the number of tractors leased versus owned, we combine our rental expense with depreciation and amortization of property and equipment for analytical purposes.
As noted in the table below, combined rental, depreciation, and amortization expense in the first quarter of 2014 increased $12.4 million to $107.9 million from the first quarter of 2013. This increase is primarily due to an increase in the number of tractors, an increase in the number of owner-operator tractors financed through the company, and higher equipment replacement costs.
|
| | | | | | | | | | | | | | |
| Q1'14 | | Q1'13 | ($ in millions) | Q1'14 | | Q4'13 |
| $ | 51.7 |
| | $ | 40.6 |
| Rental Expense | $ | 51.7 |
| | $ | 50.4 |
|
| 6.3 | % | | 5.2 | % | % of Revenue xFSR | 6.3 | % | | 5.7 | % |
| | | | | | | |
| $ | 56.2 |
| | $ | 54.9 |
| Depreciation & Amortization of Property and Equipment | $ | 56.2 |
| | $ | 56.0 |
|
| 6.9 | % | | 7.0 | % | % of Revenue xFSR | 6.9 | % | | 6.4 | % |
| | | | | | | |
| $ | 107.9 |
| | $ | 95.5 |
| Combined Rental Expense and Depreciation | $ | 107.9 |
| | $ | 106.4 |
|
| 13.2 | % | | 12.2 | % | % of Revenue xFSR | 13.2 | % | | 12.1 | % |
Gain on Disposal of Property and Equipment
Gain on disposal of property and equipment in the first quarter of 2014 of $3.2 million was relatively consistent with the prior year amount of $2.8 million, but slightly better than our previous estimate of $2.0 million. For the full year 2014, we expect the total gain on disposal of property and equipment to be approximately $8-$9 million.
Income Taxes
The income tax provision in accordance with GAAP for the first quarter of 2014 was $7.7 million, resulting in an effective tax rate of 38.5%, which is in line with our expectations given previously. In the first quarter of 2013, our income tax provision was $14.7 million, resulting in an effective tax rate of 32.7%, which is 5.8% lower than the current year due to Central Refrigerated's pre-affiliated earnings that were taxed as an S-Corporation prior to being acquired by Swift.
Interest Expense
Interest expense, comprised of debt interest expense, the amortization of deferred financing costs and original issue discount and excluding derivative interest expense on our interest rate swaps, decreased by $3.1 million in the first quarter of 2014 to $23.2 million, compared with $26.4 million for the first quarter of 2013. The decrease was largely due to lower interest rates from refinancing our senior credit facility in March of 2013, as well as the continued reduction of our debt balances, which has been an area of focus since our initial public offering in December 2010.
Debt Balances
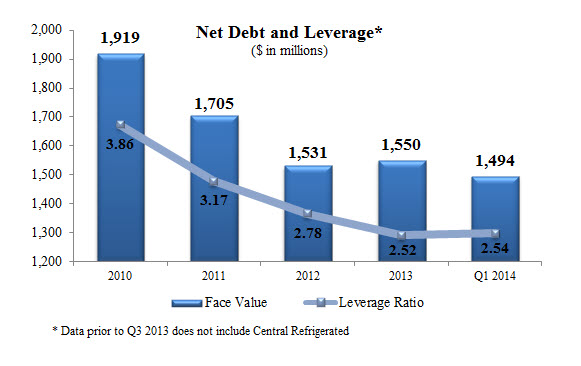
During the first quarter of 2014, we made payments of $10.0 million on our Term Loan B-2, $17.0 million on our revolver, $5.0 million on our A/R Securitization, and we reduced our Capital Leases & Other Debt by $12.7 million, as noted in the table below. We also repurchased and canceled $23.8 million of our Senior Secured 2nd Lien Notes in the open market. These reductions in our debt balances were partially offset by a $13.1 million decrease in unrestricted cash. Combined, these activities resulted in Net Debt of $1,494.4 million as of March 31, 2014 which reflects a reduction of $55.4 during the first quarter. As a result of our prior voluntary prepayments, our next required principal payment on our Term Loan B-1 is March 31, 2015, and we have no additional required principal payments on our Term Loan B-2 until its maturity in December of 2017.
|
| | | | | | | | | | | | |
| | | December 31, 2013 | | Q1 2014 | | March 31, 2014 |
| ($ in millions) | | Actuals | | Changes | | Actuals |
| Unrestricted Cash | | $ | 59.2 |
| | $ | (13.1 | ) | | $ | 46.1 |
|
| | | | | | | |
| A/R Securitization | | $ | 264.0 |
| | $ | (5.0 | ) | | $ | 259.0 |
|
| Revolver ($400mm) | | $ | 17.0 |
| | $ | (17.0 | ) | | $ | — |
|
Term Loan B-1(a) | | $ | 229.0 |
| | — |
| | $ | 229.0 |
|
Term Loan B-2(a) | | $ | 410.0 |
| | (10.0 | ) | | $ | 400.0 |
|
Senior Secured 2nd Lien Notes (a) | | $ | 500.0 |
| | (23.8 | ) | | $ | 476.2 |
|
| Capital Leases & Other Debt | | $ | 189.0 |
| | $ | (12.7 | ) | | $ | 176.3 |
|
| Total Debt | | $ | 1,609.0 |
| | $ | (68.5 | ) |
| $ | 1,540.5 |
|
| | | | | | | |
| Net Debt | | $ | 1,549.8 |
| | (55.4 | ) |
| $ | 1,494.4 |
|
| | | | | | | |
(a) Amounts presented represent face value | |
Our leverage ratio as of March 31, 2014 was 2.54 which was relatively flat as compared to the year end. Since the leverage ratio is based on a trailing twelve months EBITDA, the debt reduction discussed above was offset by a lower EBITDA in the first quarter of 2014 compared to the first quarter of 2013.
Cash Flow and Capital Expenditures
We continue to generate positive cash flows from operations. During the first quarter of 2014, we generated $76.2 million of cash from operations compared with $110.8 million during the same period of 2013. For the three months ended March 31, 2014 our Net Cash Capital Expenditures were $31.6 million. Cash used in financing activities for the quarter ending March 31, 2014 was $64.0 million, primarily driven by the voluntary repayments of our debt.
For the full year of 2014, we expect our net cash capital expenditures to be approximately $220 to $250 million which is consistent with the guidance given previously.
Summary
Weather in the first quarter was relentless. We, as many of you in the East and Midwest, are glad it is now behind us. The systems consolidation and reorganization of Central was complex but necessary as we build a solid foundation to capture all the long term synergies and growth potential. Although challenging, these types of situations can make an organization stronger. We learned from this experience and are able to take those lessons and move the company forward. Utilization in our Truckload segment improved throughout the quarter and is continuing through April. The growth in our Dedicated segment remains robust and our Intermodal segment is continuing to execute on its plans. We believe in our team and are optimistic about our future and our ability to deliver on our long-term goals.
Conference Call Q&A Session
Swift Transportation's management team will host a Q&A session at 11:00 a.m. Eastern Daylight Time on Friday, April 25th to answer questions about the Company’s first quarter financial results. Please email your questions to Investor_Relations@swifttrans.com prior to 7:00 p.m. Eastern Daylight Time on Thursday, April 24th.
Participants may access the call using the following dial-in numbers:
U.S./Canada: (877) 897-8479
International/Local: (706) 501-7951
Conference ID: 20466821
The live webcast, letter to stockholders, transcript of the Q&A, and the replay of the earnings Q&A session can be accessed via our investor relations website at ir.swifttrans.com.
IR Contact:
Jason Bates
Vice President of Finance &
Investor Relations Officer
623.907.7335
Forward Looking Statements & Use of Non-GAAP Measures
This letter contains statements that may constitute forward-looking statements, which are based on information currently available, usually identified by words such as "anticipates," "believes," "estimates", "plans,” "projects," "expects," “hopes,” “intends,” “will,” “could,” “should,” “may,” or similar expressions which speak only as of the date the statement was made. Such forward-looking statements are made pursuant to the safe harbor provisions of the Private Securities Litigation Reform Act of 1995. Such statements include, but are not limited to, statements concerning: trends and expectations relating to our operations, addition and growth of new customer accounts, freight volumes, leverage, utilization, Revenue xFSR, driver availability, expenses, profitability and related metrics; expected reduction in Net Debt in 2014; projected EPS growth; the timing and level of fleet size and equipment and container count; changes in Truckload and Dedicated tractor count; expected insurance claims expense as a percentage of Revenue xFSR; expected gains from the disposition of property and equipment in 2014; estimated capital expenditures for 2014; expectations in cost containment; the timing of, and expected synergies from, the integration of CRS; and our intentions to use excess cash flows to repay debt. Such forward-looking statements are inherently uncertain, and are based upon the current beliefs, assumptions and expectations of Company management and current market conditions, which are subject to significant risks and uncertainties as set forth in the Risk Factor Section of our Annual Report Form 10-K for the year ended December 31, 2013. As to the Company’s business and financial performance, the following factors, among others, could cause actual results to differ materially from those in forward-looking statements: general business cycles, particularly in market segments and industries in which we have a significant concentration of customers; competition, downward rate pricing and increasing competition from trucking, rail, intermodal, and brokerage competitors; a significant reduction in, or termination of, our trucking services by a key customer; a significant reduction in, or termination of, our trucking services by a key customer; the amount and velocity of changes in fuel prices and our ability to recover fuel prices through our fuel surcharge program; volatility in the price or availability of fuel; increases in new equipment prices or replacement costs, including prices in the used equipment market; the regulatory environment in which we operate, including existing regulations and changes in existing regulations, or violations by us of existing or future regulations; our Compliance Safety Accountability safety rating and changes in how the rating is calculated; increases in driver compensation to the extent not offset by increases in freight rates and difficulties in driver recruitment and retention; changes in rules or legislation by the National Labor Relations Board or Congress and/or union organizing efforts; potential volatility or decrease in the amount of earnings as a result of our claims exposure through our wholly-owned captive insurance companies; risks relating to our captive insurance companies, including regulatory risks; uncertainties associated with our operations in Mexico; our ability to attract and maintain relationships with owner-operators and our exposure to fuel reimbursement obligations to our owner-operations as well as risks and regulations relating to our lease contracts with our owner-operators; the possible re-classification of our owner-operators as employees; our
ability to retain or replace key personnel; conflicts of interest or potential litigation that may arise from other businesses owned by Jerry Moyes, including pledges of Swift stock and guarantees related to other businesses by Jerry Moyes; our dependence on third parties for intermodal and brokerage business; potential failure in computer or communications systems; our ability to execute or integrate any future acquisitions successfully; possible legal challenges to our acquisition of Central Refrigerated; seasonal factors such as harsh weather conditions that increase operating costs; goodwill impairment; the potential impact of the significant number of shares of our common stock that is outstanding; our intention to not pay dividends; our significant ongoing capital requirements; our level of indebtedness and our ability to service our outstanding indebtedness, including compliance with our indebtedness covenants, and the impact such indebtedness may have on the way we operate our business; the significant amount of our stock and related control over the Company by Jerry Moyes; and restrictions contained in our debt agreements. You should understand that many important factors, in addition to those listed above and in our filings with the SEC, could impact us financially. As a result of these and other factors, actual results may differ from those set forth in the forward-looking statements and the prices of the Company's securities may fluctuate dramatically. The Company makes no commitment, and disclaims any duty, to update or revise any forward-looking statements to reflect future events, new information or changes in these expectations. In addition to our GAAP results, this Letter to Stockholders also includes certain non-GAAP financial measures as defined by the SEC. The calculation of each measure, including reconciliation to the most closely related GAAP measure and the reasons management believes each non-GAAP measure is useful, are included in the attached schedules.
CONSOLIDATED STATEMENTS OF OPERATIONS (UNAUDITED)
THREE MONTHS ENDED MARCH 31, 2014 AND 2013
|
| | | | | | | |
| | Three Months Ended March 31, |
| | 2014 | | 2013 |
| | (Unaudited) |
| | (Amounts in thousands, except per share data) |
| Operating revenue | $ | 1,008,446 |
| | $ | 981,608 |
|
| Operating expenses: | | | |
| Salaries, wages and employee benefits | 229,366 |
| | 226,485 |
|
| Operating supplies and expenses | 80,825 |
| | 72,067 |
|
| Fuel | 156,022 |
| | 168,116 |
|
| Purchased transportation | 319,169 |
| | 292,156 |
|
| Rental expense | 51,719 |
| | 40,623 |
|
| Insurance and claims | 42,448 |
| | 31,538 |
|
| Depreciation and amortization of property and equipment | 56,175 |
| | 54,870 |
|
| Amortization of intangibles | 4,204 |
| | 4,204 |
|
| Gain on disposal of property and equipment | (3,159 | ) | | (2,848 | ) |
| Communication and utilities | 7,170 |
| | 6,565 |
|
| Operating taxes and licenses | 18,337 |
| | 18,114 |
|
| Total operating expenses | 962,276 |
| | 911,890 |
|
| Operating income | 46,170 |
| | 69,718 |
|
| Other (income) expenses: | | | |
| Interest expense | 23,225 |
| | 26,362 |
|
| Derivative interest expense | 1,653 |
| | 562 |
|
| Interest income | (766 | ) | | (591 | ) |
| Loss on debt extinguishment | 2,913 |
| | 5,044 |
|
| Gain on sale of real property | — |
| | (6,078 | ) |
| Other | (864 | ) | | (560 | ) |
| Total other (income) expenses, net | 26,161 |
| | 24,739 |
|
| Income before income taxes | 20,009 |
| | 44,979 |
|
| Income tax expense | 7,704 |
| | 14,687 |
|
| Net income | $ | 12,305 |
| | $ | 30,292 |
|
| Basic earnings per share | $ | 0.09 |
| | $ | 0.22 |
|
| Diluted earnings per share | $ | 0.09 |
| | $ | 0.21 |
|
| Shares used in per share calculations | | | |
| Basic | 140,981 |
| | 139,686 |
|
| Diluted | 143,018 |
| | 141,259 |
|
ADJUSTED EPS RECONCILIATION (UNAUDITED) (a)
THREE MONTHS ENDED MARCH 31, 2014, 2013 AND 2012
|
| | | | | | | | | | | |
| | Three Months Ended March 31, |
| | 2014 | | 2013 | | 2012 |
| Diluted earnings per share | $ | 0.09 |
| | $ | 0.21 |
| | $ | 0.08 |
|
| Adjusted for: | | | | | |
| Income tax expense | 0.05 |
| | 0.10 |
| | (0.02 | ) |
| Income before income taxes | 0.14 |
| | 0.32 |
| | 0.05 |
|
| Non-cash impairments (b) | — |
| | — |
| | 0.01 |
|
| Loss on debt extinguishment (c) | 0.02 |
| | 0.04 |
| | 0.15 |
|
| Amortization of certain intangibles (d) | 0.03 |
| | 0.03 |
| | 0.03 |
|
| Amortization of unrealized losses on interest rate swaps (e) | — |
| | — |
| | 0.02 |
|
| Adjusted income before income taxes | 0.19 |
| | 0.38 |
| | 0.26 |
|
| Provision for income tax expense at effective rate | 0.07 |
| | 0.15 |
| | 0.10 |
|
| Adjusted EPS | $ | 0.12 |
| | $ | 0.24 |
| | $ | 0.16 |
|
| |
| (a) | We define Adjusted EPS as (1) income (loss) before income taxes plus (i) amortization of the intangibles from our 2007 going-private transaction, (ii) non-cash impairments, (iii) other special non-cash items, (iv) excludable transaction costs, (v) the mark-to-market adjustment on our interest rate swaps that is recognized in the statement of operations in a given period, and (vi) the amortization of previous losses recorded in accumulated other comprehensive income (loss) (“OCI”) related to the interest rate swaps we terminated upon our IPO and refinancing transactions in December 2010; (2) reduced by income taxes; (3) divided by weighted average diluted shares outstanding. For all periods through 2012, we used a normalized tax rate of 39% in our Adjusted EPS calculation due to the amortization of deferred tax assets related to our pre-IPO interest rate swap amortization and other items that we knew would cause fluctuations in our GAAP effective tax rate. Beginning in 2013, these items no longer result in large variations. Therefore, we began using our GAAP effective tax rate for our Adjusted EPS calculation beginning in 2013. We believe the presentation of financial results excluding the impact of the items noted above provides a consistent basis for comparing our results from period to period and to those of our peers due to the non-comparable nature of the intangibles from our going-private transaction, the historical volatility of the interest rate derivative agreements and the non-operating nature of the impairment charges, transaction costs and other adjustment items. Adjusted EPS is not presented in accordance with GAAP and should be considered in addition to, not as a substitute for, or superior to, measures of financial performance in accordance with GAAP. The numbers reflected in the above table are calculated on a per share basis and may not foot due to rounding. |
| |
| (b) | Real property with a carrying amount of $1.7 million was written down to its fair value of $0.6 million, resulting in a pre-tax impairment charge of $1.1 million in the first quarter of 2012. |
| |
| (c) | In March 2014, the Company repurchased in an open market transaction at a price of 110.70%, $23.8 million principal amount of its Senior Second Priority Secured Notes with cash on hand. The Company paid total proceeds of $27.1 million, which included the principal amount, the premium and the accrued interest. These amounts and the related write-off of the unamortized original issue discount resulted in a loss on debt extinguishment of $2.9 million. On March 7, 2013, the Company entered into a Second Amended and Restated Credit Agreement (“2013 Agreement”). The 2013 Agreement replaced the then-existing first lien term loan B-1 and B-2 tranches under the Amended and Restated Credit Agreement (“2012 Agreement”) entered into on March 6, 2012, with outstanding principal balances of $152.0 million and $508.0 million, respectively, with new first lien term loan B-1 and B-2 tranches with face values of $250.0 million and $410.0 million, respectively. The replacement of the 2012 Agreement resulted in a loss on debt extinguishment of $5.0 million in the first quarter of 2013, representing the write-off of the unamortized original issue discount and deferred financing fees associated with the 2012 Agreement. The Company entered into the 2012 Agreement on March 6, 2012, which replaced the then-existing, remaining $874 million face value first lien term loan, maturing in December 2016, resulting in a loss on debt extinguishment of $20.9 million in the first quarter of 2012 representing the write-off of the unamortized original issue discount and deferred financing fees associated with the original term loan. |
| |
| (d) | Amortization of certain intangibles reflects the non-cash amortization expense of $3.9 million, $3.9 million and $4.0 million for the three months ended March 31, 2014, 2013 and 2012, respectively, relating to certain intangible assets identified in the 2007 going-private transaction through which Swift Corporation acquired Swift Transportation Co. |
| |
| (e) | Amortization of unrealized losses on interest rate swaps reflects the non-cash amortization expense of $2.5 million for the three months ended March 31, 2012 included in derivative interest expense in the consolidated statements of operations and is comprised of previous losses recorded in accumulated OCI related to the interest rate swaps we terminated upon our IPO and concurrent refinancing transactions in December 2010. Such losses were incurred in prior periods when hedge accounting applied to the swaps and were expensed in relation to the hedged interest payments through the original maturity of the swaps in August 2012. |
ADJUSTED OPERATING INCOME AND OPERATING RATIO RECONCILIATION (UNAUDITED) (a)
THREE MONTHS ENDED MARCH 31, 2014, 2013 AND 2012
|
| | | | | | | | | | | |
| | Three Months Ended March 31, |
| | 2014 | | 2013 | | 2012 |
| | (Amounts in thousands) |
| Operating revenue | $ | 1,008,446 |
| | $ | 981,608 |
| | $ | 943,818 |
|
| Less: Fuel surcharge revenue | 191,447 |
| | 197,057 |
| | 188,396 |
|
| Revenue xFSR | 816,999 |
| | 784,551 |
| | 755,422 |
|
| Operating expense | 962,276 |
| | 911,890 |
| | 880,245 |
|
| Adjusted for: | | | | | |
| Fuel surcharge revenue | (191,447 | ) | | (197,057 | ) | | (188,396 | ) |
| Amortization of certain intangibles (b) | (3,912 | ) | | (3,912 | ) | | (4,011 | ) |
| Non-cash impairments (c) | — |
| | — |
| | (1,065 | ) |
| Adjusted operating expense | 766,917 |
| | 710,921 |
| | 686,773 |
|
| Adjusted operating income | $ | 50,082 |
| | $ | 73,630 |
| | $ | 68,649 |
|
| Operating Ratio | 95.4 | % | | 92.9 | % | | 93.3 | % |
| Adjusted Operating Ratio | 93.9 | % | | 90.6 | % | | 90.9 | % |
| |
| (a) | We define Adjusted Operating Ratio as (a) total operating expenses, less (i) fuel surcharges, (ii) amortization of the intangibles from our 2007 going-private transaction, (iii) non-cash impairment charges, (iv) other special non-cash items, and (v) excludable transaction costs, as a percentage of (b) total revenue excluding fuel surcharge revenue (Revenue xFSR). We believe fuel surcharge is sometimes volatile and eliminating the impact of this source of revenue (by netting fuel surcharge revenue against fuel expense) affords a more consistent basis for comparing our results of operations. We also believe excluding impairments, non-comparable nature of the intangibles from our going-private transaction and other special items enhances the comparability of our performance from period to period. Adjusted Operating Ratio is not a recognized measure under GAAP. Adjusted Operating Ratio should be considered in addition to, not as a substitute for, or superior to, measures of financial performance in accordance with GAAP. |
| |
| (b) | Amortization of certain intangibles reflects the non-cash amortization expense relating to certain intangible assets identified in the 2007 going-private transaction through which Swift Corporation acquired Swift Transportation Co. |
| |
| (c) | Real property with a carrying amount of $1.7 million was written down to its fair value of $0.6 million, resulting in a pre-tax impairment charge of $1.1 million in the first quarter of 2012. |
ADJUSTED EARNINGS BEFORE INTEREST, TAXES, DEPRECIATION
AND AMORTIZATION (UNAUDITED) (a)
THREE MONTHS ENDED MARCH 31, 2014, 2013 AND 2012
|
| | | | | | | | | | | |
| | Three Months Ended March 31, |
| | 2014 | | 2013 | | 2012 |
| | (Amounts in thousands) |
| Net income | $ | 12,305 |
| | $ | 30,292 |
| | $ | 10,827 |
|
| Adjusted for: | | | | | |
| Depreciation and amortization of property and equipment | 56,175 |
| | 54,870 |
| | 55,192 |
|
| Amortization of intangibles | 4,204 |
| | 4,204 |
| | 4,303 |
|
| Interest expense | 23,225 |
| | 26,362 |
| | 33,853 |
|
| Derivative interest expense | 1,653 |
| | 562 |
| | 2,545 |
|
| Interest income | (766 | ) | | (591 | ) | | (418 | ) |
| Income tax expense | 7,704 |
| | 14,687 |
| | (3,445 | ) |
| Earnings before interest, taxes, depreciation and amortization (EBITDA) | $ | 104,500 |
| | $ | 130,386 |
| | $ | 102,857 |
|
| Non-cash equity compensation (b) | 1,061 |
| | 605 |
| | 1,328 |
|
| Loss on debt extinguishment (c) | 2,913 |
| | 5,044 |
| | 20,940 |
|
| Non-cash impairments (d) | — |
| | — |
| | 1,065 |
|
| Adjusted earnings before interest, taxes, depreciation and amortization (Adjusted EBITDA) | $ | 108,474 |
| | $ | 136,035 |
| | $ | 126,190 |
|
| |
| (a) | We define Adjusted EBITDA as net income (loss) plus (i) depreciation and amortization, (ii) interest and derivative interest expense, including other fees and charges associated with indebtedness, net of interest income, (iii) income taxes, (iv) non-cash equity compensation expense, (v) non-cash impairments, (vi) other special non-cash items, and (vii) excludable transaction costs. We believe that Adjusted EBITDA is a relevant measure for estimating the cash generated by our operations that would be available to cover capital expenditures, taxes, interest and other investments and that it enhances an investor’s understanding of our financial performance. We use Adjusted EBITDA for business planning purposes and in measuring our performance relative to that of our competitors. Our method of computing Adjusted EBITDA is consistent with that used in our senior secured credit agreement for covenant compliance purposes and may differ from similarly titled measures of other companies. Adjusted EBITDA is not a recognized measure under GAAP. Adjusted EBITDA should be considered in addition to, not as a substitute for or superior to, net income, cash flow from operations, operating income or any other performance measures derived in accordance with GAAP as measures of operating performance or operating cash flows as a measure of liquidity. |
| |
| (b) | Represents recurring non-cash equity compensation expense, on a pre-tax basis. In accordance with the terms of our senior credit agreement, this expense is added back in the calculation of Adjusted EBITDA for covenant compliance purposes. |
| |
| (c) | In March 2014, the Company repurchased in an open market transaction at a price of 110.70%, $23.8 million principal amount of its Senior Second Priority Secured Notes with cash on hand. The Company paid total proceeds of $27.1 million, which included the principal amount, the premium and the accrued interest. These amounts and the related write-off of the unamortized original issue discount resulted in a loss on debt extinguishment of $2.9 million. On March 7, 2013, the Company entered into a Second Amended and Restated Credit Agreement (“2013 Agreement”). The 2013 Agreement replaced the then-existing first lien term loan B-1 and B-2 tranches under the Amended and Restated Credit Agreement (“2012 Agreement”) entered into on March 6, 2012, with outstanding principal balances of $152.0 million and $508.0 million, respectively, with new first lien term loan B-1 and B-2 tranches with face values of $250.0 million and $410.0 million, respectively. The replacement of the 2012 Agreement resulted in a loss on debt extinguishment of $5.0 million in the first quarter of 2013, representing the write-off of the unamortized original issue discount and deferred financing fees associated with the 2012 Agreement. The Company entered into the 2012 Agreement on March 6, 2012, which replaced the then-existing, remaining $874 million face value first lien term loan, maturing in December 2016, resulting in a loss on debt extinguishment of $20.9 million in the first quarter of 2012 representing the write-off of the unamortized original issue discount and deferred financing fees associated with the original term loan. |
| |
| (d) | Real property with a carrying amount of $1.7 million was written down to its fair value of $0.6 million, resulting in a pre-tax impairment charge of $1.1 million in the first quarter of 2012. |
FINANCIAL INFORMATION BY SEGMENT (UNAUDITED) (a)
THREE MONTHS ENDED MARCH 31, 2014, 2013 AND 2012
|
| | | | | | | | | | | | |
| | Three Months Ended March 31, |
| | 2014 | | 2013 | | 2012 | |
| | (Amounts in thousands) |
Operating revenue: | | | | | | |
| Truckload | $ | 553,057 |
| | $ | 559,595 |
| | $ | 551,247 |
| |
| Dedicated | 193,653 |
| | 179,226 |
| | 171,539 |
| |
| Central Refrigerated | 106,763 |
| | 106,402 |
| | 101,389 |
| |
| Intermodal | 91,313 |
| | 83,264 |
| | 73,647 |
| |
| Subtotal | 944,786 |
| | 928,487 |
| | 897,822 |
| |
| Nonreportable segments (b) | 75,666 |
| | 72,057 |
| | 66,908 |
| |
| Intersegment eliminations | (12,006 | ) | | (18,936 | ) | | (20,912 | ) | |
| Consolidated operating revenue | $ | 1,008,446 |
| | $ | 981,608 |
| | $ | 943,818 |
| |
| | | | | | | |
Operating income (loss): | | | | | | |
| Truckload | $ | 31,907 |
| | $ | 42,403 |
| | $ | 46,554 |
| |
| Dedicated | 11,530 |
| | 18,954 |
| | 14,507 |
| |
| Central Refrigerated | 2,420 |
| | 4,721 |
| | 3,710 |
| |
| Intermodal | (926 | ) | | (1,604 | ) | | (3,806 | ) | (c) |
| Subtotal | 44,931 |
| | 64,474 |
| | 60,965 |
| |
| Nonreportable segments (b) | 1,239 |
| | 5,244 |
| | 2,608 |
| |
Consolidated operating income | $ | 46,170 |
| | $ | 69,718 |
| | $ | 63,573 |
| |
| | | | | | | |
Operating Ratio: | | | | | | |
| Truckload | 94.2 | % | | 92.4 | % | | 91.6 | % | |
| Dedicated | 94.0 | % | | 89.4 | % | | 91.5 | % | |
| Central Refrigerated | 97.7 | % | | 95.6 | % | | 96.3 | % | |
| Intermodal | 101.0 | % | | 101.9 | % | | 105.2 | % | (c) |
| | | | | | | |
| Adjusted Operating Ratio (d): | | | | | | |
| Truckload | 92.8 | % | | 90.4 | % | | 89.3 | % | |
| Dedicated | 92.7 | % | | 86.9 | % | | 89.7 | % | |
| Central Refrigerated | 97.1 | % | | 94.2 | % | | 95.2 | % | |
| Intermodal | 101.3 | % | | 102.5 | % | | 106.5 | % | (c) |
| | | | | | | |
| |
| (a) | In the first quarter of 2014, the Company reorganized its reportable segments to reflect management’s revised reporting structure of its lines of businesses following the integration of Central Refrigerated. In association with the operational reorganization, the operations of Central Refrigerated's Trailer on Flat Car ("TOFC") business will be reported within the Company's Intermodal segment, and the operations of Central Refrigerated's logistics business, third-party leasing, and other services provided to owner-operators will be reported in the Company's other non-reportable segment. All prior period historical results related to the above noted segment reorganization have been retrospectively recast. |
| |
| (b) | Our nonreportable segments are comprised of our freight brokerage and logistics management services, Interstate Equipment Leasing (“IEL”), insurance and shop activities. |
| |
| (c) | During 2012, our Intermodal reportable segment incurred an increase in its insurance and claims expense primarily related to one claim associated with a drayage accident, which increased the Intermodal Operating Ratio and Adjusted Operating Ratio by approximately 420 basis points and 530 basis points, respectively, for three months ended March 31, 2012. |
| |
| (d) | See our reconciliation of Adjusted Operating Ratio by Segment at the schedule titled “Adjusted Operating Income and Operating Ratio Reconciliation by Segment”. |
OPERATING STATISTICS (UNAUDITED) (a)
THREE MONTHS ENDED MARCH 31, 2014, 2013 AND 2012
|
| | | | | | | | | | | |
| | Three Months Ended March 31, |
| | 2014 | | 2013 | | 2012 |
| Operating Statistics by Segment: | | | | | |
Truckload: | | | | | |
| Weekly revenue xFSR per tractor | $ | 3,225 |
| | $ | 3,182 |
| | $ | 3,028 |
|
| Total loaded miles (b) | 254,426 |
| | 261,850 |
| | 262,549 |
|
| Deadhead miles percentage | 11.7 | % | | 11.2 | % | | 11.3 | % |
| Average tractors available for dispatch: | | | | | |
| Company | 7,151 |
| | 7,494 |
| | 7,683 |
|
| Owner-Operator | 3,484 |
| | 3,291 |
| | 3,354 |
|
| Total | 10,635 |
| | 10,785 |
| | 11,037 |
|
| | | | | | |
Dedicated: | | | | | |
| Weekly revenue xFSR per tractor | $ | 3,173 |
| | $ | 3,385 |
| | $ | 3,370 |
|
| Average tractors available for dispatch: | | | | | |
| Company | 3,161 |
| | 2,684 |
| | 2,537 |
|
| Owner-Operator | 691 |
| | 643 |
| | 668 |
|
| Total | 3,852 |
| | 3,327 |
| | 3,205 |
|
| | | | | | |
| Central Refrigerated: | | | | | |
| Weekly revenue xFSR per tractor | $ | 3,235 |
| | $ | 3,330 |
| | $ | 3,345 |
|
| Total loaded miles (b) | 42,757 |
| | 47,100 |
| | 46,292 |
|
| Deadhead miles percentage | 14.0 | % | | 12.1 | % | | 12.0 | % |
| Average tractors available for dispatch: | | | | | |
| Company | 1,057 |
| | 998 |
| | 938 |
|
| Owner-Operator | 955 |
| | 907 |
| | 837 |
|
| Total | 2,012 |
| | 1,905 |
| | 1,775 |
|
| | | | | | |
Intermodal: | | | | | |
| Average tractors available for dispatch: | | | | | |
| Company | 378 |
| | 295 |
| | 295 |
|
| Owner-Operator | 73 |
| | 18 |
| | — |
|
| Total | 451 |
| | 313 |
| | 295 |
|
| Load Count | 38,603 |
| | 35,639 |
| | 32,276 |
|
| Average Container Count | 8,717 |
| | 8,717 |
| | 6,317 |
|
| | | | | | |
| |
| (a) | In the first quarter of 2014, the Company reorganized its reportable segments to reflect management’s revised reporting structure of its lines of businesses following the integration of Central Refrigerated. In association with the operational reorganization, the operations of Central Refrigerated's Trailer on Flat Car ("TOFC") business will be reported within the Company's Intermodal segment, and the operations of Central Refrigerated's logistics business, third-party leasing, and other services provided to owner-operators will be reported in the Company's other non-reportable segment. All prior period historical results related to the above noted segment reorganization have been retrospectively recast. |
| |
| (b) | Total loaded miles presented in thousands. |
|
| | | | | | |
| | As of |
| | March 31, 2014 | | December 31, 2013 | | March 31, 2013 |
| Consolidated Total Equipment: | | | | | |
| Tractors: | | | | | |
| Company | | | | | |
| Owned | 6,464 | | 6,081 | | 5,838 |
|
| Leased – capital leases | 1,791 | | 1,851 | | 2,692 |
|
| Leased – operating leases | 5,017 | | 4,834 | | 4,211 |
|
| Total company tractors | 13,272 | | 12,766 | | 12,741 |
|
| Owner-operator | | | | | |
| Financed through the Company | 4,526 | | 4,473 | | 3,885 |
|
| Other | 572 | | 722 | | 1,049 |
|
| Total owner-operator tractors | 5,098 | | 5,195 | | 4,934 |
|
| Total tractors | 18,370 | | 17,961 | | 17,675 |
|
| Trailers | 58,074 | | 57,310 | | 55,841 |
|
| Containers | 8,717 | | 8,717 | | 8,717 |
|
ADJUSTED OPERATING INCOME AND OPERATING RATIO
RECONCILIATION BY SEGMENT (UNAUDITED) (a)
THREE MONTHS ENDED MARCH 31, 2014, 2013 AND 2012
|
| | | | | | | | | | | |
| | Three Months Ended March 31, |
| | 2014 | | 2013 | | 2012 |
| | (Amounts in thousands) |
| Truckload: | | | | | |
| Operating revenue | $ | 553,057 |
| | $ | 559,595 |
| | $ | 551,247 |
|
| Less: Fuel surcharge revenue | 111,648 |
| | 118,339 |
| | 116,866 |
|
| Revenue xFSR | 441,409 |
| | 441,256 |
| | 434,381 |
|
| Operating expense | 521,150 |
| | 517,192 |
| | 504,693 |
|
| Adjusted for: | | | | | |
| Fuel surcharge revenue | (111,648 | ) | | (118,339 | ) | | (116,866 | ) |
| Adjusted operating expense | 409,502 |
| | 398,853 |
| | 387,827 |
|
| Adjusted operating income | $ | 31,907 |
| | $ | 42,403 |
| | $ | 46,554 |
|
| Adjusted Operating Ratio | 92.8 | % | | 90.4 | % | | 89.3 | % |
| Operating Ratio | 94.2 | % | | 92.4 | % | | 91.6 | % |
| | | | | | |
| Dedicated: | | | | | |
| Operating revenue | $ | 193,653 |
| | $ | 179,226 |
| | $ | 171,539 |
|
| Less: Fuel surcharge revenue | 36,534 |
| | 34,433 |
| | 31,131 |
|
| Revenue xFSR | 157,119 |
| | 144,793 |
| | 140,408 |
|
| Operating expense | 182,123 |
| | 160,272 |
| | 157,032 |
|
| Adjusted for: | | | | | |
| Fuel surcharge revenue | (36,534 | ) | | (34,433 | ) | | (31,131 | ) |
| Adjusted operating expense | 145,589 |
| | 125,839 |
| | 125,901 |
|
| Adjusted operating income | $ | 11,530 |
| | $ | 18,954 |
| | $ | 14,507 |
|
| Adjusted Operating Ratio | 92.7 | % | | 86.9 | % | | 89.7 | % |
| Operating Ratio | 94.0 | % | | 89.4 | % | | 91.5 | % |
| | | | | | |
| Central Refrigerated: | | | | | |
| Operating revenue | $ | 106,763 |
| | $ | 106,402 |
| | $ | 101,389 |
|
| Less: Fuel surcharge revenue | 23,177 |
| | 24,850 |
| | 24,197 |
|
| Revenue xFSR | 83,586 |
| | 81,552 |
| | 77,192 |
|
| Operating expense | 104,343 |
| | 101,681 |
| | 97,679 |
|
| Adjusted for: | | | | | |
| Fuel surcharge revenue | (23,177 | ) | | (24,850 | ) | | (24,197 | ) |
| Adjusted operating expense | 81,166 |
| | 76,831 |
| | 73,482 |
|
| Adjusted operating income | $ | 2,420 |
| | $ | 4,721 |
| | $ | 3,710 |
|
| Adjusted Operating Ratio | 97.1 | % | | 94.2 | % | | 95.2 | % |
| Operating Ratio | 97.7 | % | | 95.6 | % | | 96.3 | % |
| | | | | | |
| Intermodal: | | | | | |
| Operating revenue | $ | 91,313 |
| | $ | 83,264 |
| | $ | 73,647 |
|
| Less: Fuel surcharge revenue | 18,364 |
| | 18,011 |
| | 15,481 |
|
| Revenue xFSR | 72,949 |
| | 65,253 |
| | 58,166 |
|
| Operating expense | 92,239 |
| | 84,868 |
| | 77,453 |
|
| Adjusted for: | | | | | |
| Fuel surcharge revenue | (18,364 | ) | | (18,011 | ) | | (15,481 | ) |
| Adjusted operating expense | 73,875 |
| | 66,857 |
| | 61,972 |
|
| Adjusted operating loss | $ | (926 | ) | | $ | (1,604 | ) | | $ | (3,806 | ) |
| Adjusted Operating Ratio | 101.3 | % | | 102.5 | % | | 106.5 | % |
| Operating Ratio | 101.0 | % | | 101.9 | % | | 105.2 | % |
| |
(a) | In the first quarter of 2014, the Company reorganized its reportable segments to reflect management’s revised reporting structure of its lines of businesses following the integration of Central Refrigerated. In association with the operational reorganization, the operations of Central Refrigerated's Trailer on Flat Car ("TOFC") business will be reported within the Company's Intermodal segment, and the operations of Central Refrigerated's logistics business, third-party leasing, and other services provided to owner-operators will be reported in the Company's other non-reportable segment. All prior period historical results related to the above noted segment reorganization have been retrospectively recast. |
CONSOLIDATED BALANCE SHEET (UNAUDITED)
AS OF MARCH 31, 2014 AND DECEMBER 31, 2013
(In thousands, except share data)
|
| | | | | | | |
| | March 31, 2014 | | December 31, 2013 |
| | (Unaudited) | | |
| ASSETS | | | |
| Current assets: | | | |
| Cash and cash equivalents | $ | 46,098 |
| | $ | 59,178 |
|
| Restricted cash | 47,012 |
| | 50,833 |
|
| Restricted investments, held to maturity, amortized cost | 25,832 |
| | 25,814 |
|
| Accounts receivable, net | 454,709 |
| | 418,436 |
|
| Equipment sales receivable | 7,276 |
| | 368 |
|
| Income tax refund receivable | 11,854 |
| | 23,704 |
|
| Inventories and supplies | 17,776 |
| | 18,430 |
|
| Assets held for sale | 18,389 |
| | 19,268 |
|
| Prepaid taxes, licenses, insurance and other | 57,397 |
| | 63,958 |
|
| Deferred income taxes | 39,758 |
| | 46,833 |
|
| Current portion of notes receivable | 8,419 |
| | 7,210 |
|
| Total current assets | 734,520 |
| | 734,032 |
|
| Property and equipment, at cost: | | | |
| Revenue and service equipment | 1,983,607 |
| | 1,942,423 |
|
| Land | 116,973 |
| | 117,929 |
|
| Facilities and improvements | 256,719 |
| | 248,724 |
|
| Furniture and office equipment | 62,993 |
| | 61,396 |
|
| Total property and equipment | 2,420,292 |
| | 2,370,472 |
|
| Less: accumulated depreciation and amortization | 951,521 |
| | 922,665 |
|
| Net property and equipment | 1,468,771 |
| | 1,447,807 |
|
| Other assets | 50,926 |
| | 57,166 |
|
| Intangible assets, net | 312,543 |
| | 316,747 |
|
| Goodwill | 253,256 |
| | 253,256 |
|
| Total assets | $ | 2,820,016 |
| | $ | 2,809,008 |
|
| LIABILITIES AND STOCKHOLDERS’ EQUITY | | | |
| Current liabilities: | | | |
| Accounts payable | $ | 174,397 |
| | $ | 118,014 |
|
| Accrued liabilities | 119,053 |
| | 110,745 |
|
| Current portion of claims accruals | 80,645 |
| | 75,469 |
|
| Current portion of long-term debt and obligations under capital leases (a) | 80,619 |
| | 75,056 |
|
| Fair value of guarantees | — |
| | 366 |
|
| Current portion of fair value of interest rate swaps | 5,225 |
| | 4,718 |
|
| Total current liabilities | 459,939 |
| | 384,368 |
|
| Revolving line of credit | — |
| | 17,000 |
|
| Long-term debt and obligations under capital leases (a) | 1,195,305 |
| | 1,246,764 |
|
| Claims accruals, less current portion | 125,729 |
| | 118,582 |
|
| Fair value of interest rate swaps, less current portion | 5,435 |
| | 7,050 |
|
| Deferred income taxes | 469,690 |
| | 484,200 |
|
| Securitization of accounts receivable | 259,000 |
| | 264,000 |
|
| Other liabilities | 2,665 |
| | 3,457 |
|
| Total liabilities | 2,517,763 |
| | 2,525,421 |
|
| Stockholders' equity: | | | |
| Class A common stock | 886 |
| | 883 |
|
| Class B common stock | 525 |
| | 525 |
|
| Additional paid-in capital | 764,958 |
| | 759,408 |
|
| Accumulated deficit | (458,864 | ) | | (471,169 | ) |
| Accumulated other comprehensive loss | (5,354 | ) | | (6,162 | ) |
| Noncontrolling interests | 102 |
| | 102 |
|
| Total stockholders' equity | 302,253 |
| | 283,587 |
|
| Total liabilities and stockholders' equity | $ | 2,820,016 |
| | $ | 2,809,008 |
|
Notes to Selected Consolidated Balance Sheet Data:
| |
| (a) | In March 2014, the Company repurchased in an open market transaction at a price of 110.70%, $23.8 million principal amount of its Senior Second Priority Secured Notes with cash on hand. The Company paid total proceeds of $27.1 million, which included the principal amount, the premium and the accrued interest. These amounts and the related write-off of the unamortized original issue discount resulted in a loss on debt extinguishment of $2.9 million. On March 7, 2013, the Company entered into a Second Amended and Restated Credit Agreement (the “2013 Agreement”) replacing our previous Amended and Restated Credit Agreement dated March 6, 2012 (the “2012 Agreement”). The 2013 Agreement replaced the previous first lien term loan B-1 and B-2 tranches with outstanding principal balances of $152.0 million and $508.0 million, respectively, with new first lien term B-1 and B-2 tranches with face values of $250.0 million and $410.0 million, respectively. In addition, the 2013 Agreement reduced the interest rate applicable to the first lien term loan B-1 tranche to the LIBOR rate plus 2.75% with no LIBOR floor, down from LIBOR plus 3.75% with no LIBOR floor, and reduced the interest rate applicable to the first lien term loan B-2 tranche to the LIBOR rate plus 3.00% with a 1.00% LIBOR floor, down from LIBOR plus 3.75% with a 1.25% LIBOR floor. The replacement of the 2012 Agreement resulted in a loss on debt extinguishment of $5.0 million in the first quarter of 2013, representing the write-off of the unamortized original issue discount and deferred financing fees associated with the then-existing first lien term loan B-1 and B-2 tranches. |
Total debt and capital lease obligations as of March 31, 2014 includes $229.0 million net carrying value of first lien term loan B-1 tranche, $400.0 million net carrying value of the first lien term loan B-2 tranche, $470.7 million net carrying value of senior second priority secured notes, and $176.3 million of other secured indebtedness and capital lease obligations. Total debt and capital lease obligations as of December 31, 2013 includes $229.0 million net carrying value of the first lien term loan B-1 tranche, $410.0 million net carrying value of the first lien term loan B-2 tranche, $493.8 million net carrying value of senior second priority secured notes, and $189.1 million of other secured indebtedness and capital lease obligations.
CONSOLIDATED STATEMENTS OF CASH FLOWS (UNAUDITED)
THREE MONTHS ENDED MARCH 31, 2014 AND 2013
(In thousands)
|
| | | | | | | |
| | Three Months Ended March 31, |
| | 2014 | | 2013 |
| Cash flows from operating activities: | | | |
| Net income | $ | 12,305 |
| | $ | 30,292 |
|
| Adjustments to reconcile net income to net cash provided by operating activities: | | | |
| Depreciation and amortization of property, equipment and intangibles | 60,379 |
| | 59,074 |
|
| Amortization of debt issuance costs, original issue discount, and losses on terminated swaps | 2,515 |
| | 1,228 |
|
| Gain on disposal of property and equipment less write-off of totaled tractors | (2,958 | ) | | (2,747 | ) |
| Gain on sale of real property | — |
| | (6,078 | ) |
| Equity losses of investee | — |
| | 186 |
|
| Deferred income taxes | (7,942 | ) | | 14,417 |
|
| Provision for allowance for losses on accounts receivable | 792 |
| | (164 | ) |
| Non-cash equity compensation | 1,061 |
| | 605 |
|
| Loss on debt extinguishment | 2,913 |
| | 5,044 |
|
| Income effect of mark-to-market adjustment of interest rate swaps | (32 | ) | | 189 |
|
| Interest on shareholder loan | — |
| | (16 | ) |
| Increase (decrease) in cash resulting from changes in: | | | |
| Accounts receivable | (37,064 | ) | | (22,067 | ) |
| Inventories and supplies | 653 |
| | (122 | ) |
| Prepaid expenses and other current assets | 18,446 |
| | (1,229 | ) |
| Other assets | 2,871 |
| | 4,028 |
|
| Accounts payable, accrued and other liabilities | 22,218 |
| | 28,162 |
|
| Net cash provided by operating activities | 76,157 |
| | 110,802 |
|
| Cash flows from investing activities: | | | |
| Decrease in restricted cash | 3,821 |
| | 6,211 |
|
| Change in restricted investments | (164 | ) | | (7,073 | ) |
| Proceeds from sale of property and equipment | 28,428 |
| | 14,326 |
|
| Capital expenditures | (60,058 | ) | | (61,795 | ) |
| Payments received on notes receivable | 1,553 |
| | 1,034 |
|
| Expenditures on assets held for sale | (1,521 | ) | | (833 | ) |
| Payments received on assets held for sale | 2,269 |
| | 21,828 |
|
| Payments received on equipment sale receivables | 469 |
| | 596 |
|
| Net cash used in investing activities | (25,203 | ) | | (25,706 | ) |
| Cash flows from financing activities: | | | |
| Repayment of long-term debt and capital leases | (46,526 | ) | | (97,295 | ) |
| Net (repayments) borrowings on revolving line of credit | (17,000 | ) | | 7,407 |
|
| Borrowings under accounts receivable securitization | — |
| | 56,000 |
|
| Repayment of accounts receivable securitization | (5,000 | ) | | (56,000 | ) |
| Proceeds from long-term debt | — |
| | 19,200 |
|
| Payment of deferred loan costs | — |
| | (1,257 | ) |
| Distribution to Central Refrigerated stockholders, pre-acquisition | — |
| | (386 | ) |
| Issuance of Central Refrigerated stockholders' loan receivable, pre-acquisition | — |
| | (30,000 | ) |
| Proceeds from exercise of stock options | 3,414 |
| | 2,875 |
|
| Income tax benefit from exercise of stock options | 1,078 |
| | (490 | ) |
| Net cash used in financing activities | (64,034 | ) | | (99,946 | ) |
| Decrease in cash and cash equivalents | (13,080 | ) | | (14,850 | ) |
| Cash and cash equivalents at beginning of period | 59,178 |
| | 53,596 |
|
| Cash and cash equivalents at end of period | $ | 46,098 |
| | $ | 38,746 |
|
| | | | |
| | | | |
|
| | | | | | | |
| | | | |
| Supplemental disclosure of cash flow information: | | | |
| Cash paid during the period for: | | | |
| Interest | $ | 11,854 |
| | $ | 14,915 |
|
| Income taxes | $ | 3,463 |
| | $ | 2,908 |
|
| | | | |
| Supplemental schedule of: | | | |
| Non-cash investing activities: | | | |
| Equipment sales receivables | $ | 7,376 |
| | $ | 2,661 |
|
| Equipment purchase accrual | $ | 59,867 |
| | $ | 32,705 |
|
| Notes receivable from sale of assets | $ | 2,762 |
| | $ | 1,148 |
|
| Non-cash financing activities: | | | |
| Capital lease additions | $ | — |
| | $ | 13,808 |
|
| Accrued deferred loan costs | $ | — |
| | $ | 75 |
|
| Insurance premium note payable | $ | 37 |
| | $ | — |
|