January 28, 2015
Dear Fellow Stockholders of Swift Transportation Company (NYSE: SWFT),
A summary of our key results for the three months and years ended December 31st is shown below:
|
| | | | | | | | | | | | | | | | | | | | | | | |
| | Three Months Ended December 31, | | Year Ended December 31, |
| | 2014 |
| 2013 |
| 2012 | | 2014 | | 2013 | | 2012 |
| | Unaudited |
| | ($ in millions, except per share data) |
| Operating Revenue | $ | 1,139.5 |
| | $ | 1,075.4 |
| | $ | 1,047.6 |
| | $ | 4,298.7 |
| | $ | 4,118.2 |
| | $ | 3,976.1 |
|
Revenue xFSR1 | $ | 960.2 |
| | $ | 878.6 |
| | $ | 838.3 |
| | $ | 3,535.4 |
| | $ | 3,326.7 |
| | $ | 3,181.6 |
|
| | | | | | | | | | | | |
| Operating Ratio | 88.4 | % | | 90.5 | % | | 88.9 | % | | 91.4 | % | | 91.3 | % | | 91.2 | % |
Adjusted Operating Ratio2 | 85.8 | % | | 87.9 | % | | 85.4 | % | | 89.0 | % | | 88.8 | % | | 88.3 | % |
| | | | | | | | | | | | |
| EBITDA | $ | 167.0 |
| | $ | 163.1 |
| | $ | 169.3 |
| | $ | 572.2 |
| | $ | 600.1 |
| | $ | 562.5 |
|
Adjusted EBITDA2 | $ | 195.7 |
| | $ | 164.8 |
| | $ | 178.2 |
| | $ | 619.8 |
| | $ | 615.2 |
| | $ | 598.9 |
|
| | | | | | | | | | | | |
| Diluted EPS | $ | 0.41 |
| | $ | 0.32 |
| | $ | 0.39 |
| | $ | 1.12 |
| | $ | 1.09 |
| | $ | 1.00 |
|
Adjusted EPS2 | $ | 0.55 |
| | $ | 0.36 |
| | $ | 0.41 |
| | $ | 1.38 |
| | $ | 1.23 |
| | $ | 1.11 |
|
| | | | | | | | | | | | |
1Revenue xFSR is operating revenue, excluding fuel surcharge revenue |
2 See GAAP to Non-GAAP reconciliation in the schedules following this letter |
Key Highlights for the Fourth Quarter 2014 as compared to the Fourth Quarter 2013:
(discussed in more detail below, including GAAP to non-GAAP reconciliations)
Consolidated
| |
• | Adjusted EPS increased 52.8% to $0.55, compared to $0.36 |
| |
| • | Adjusted EPS exceeded our guidance range of $0.45-$0.49 assisted by a decline in fuel prices and a reduced tax rate, partially offset by an increase in insurance and claims expense primarily in our Dedicated segment |
| |
| • | Diluted EPS in accordance with GAAP of $0.41 for the fourth quarter of 2014 included a loss on debt extinguishment of $27.2 million ($0.12 of EPS) associated with the redemption of our 10.0% Senior Notes in November |
| |
| • | Consolidated Revenue xFSR grew 9.3% |
| |
| • | Consolidated Average Operational Truck Count increased 767 trucks, or 4.6% |
| |
| • | The effective tax rate in the fourth quarter of 2014 was 35.9%, lower than the 38.5% expected rate due to the realization of certain federal employment tax credits resulting from the enactment of the Tax Extenders Bill late in the year |
| |
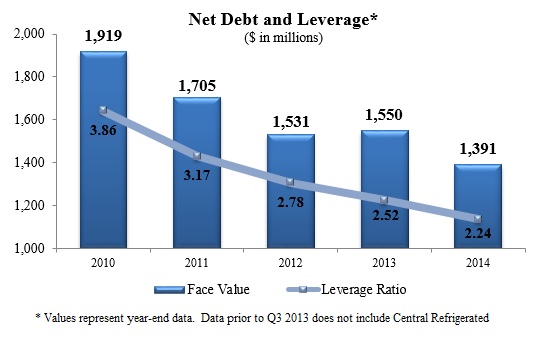
| • | Net Debt declined $6.1 million to $1,391 million during the quarter as we reduced our net leverage ratio to 2.24 as of December 31, 2014 |
Truckload
| |
| • | Truckload Adjusted Operating Ratio improved 410 basis points to 82.9% |
| |
| • | Truckload utilization, as measured by loaded miles per tractor per week, improved 2.5% |
| |
| • | Truckload pricing increases and charges for repositioning continued to gain momentum, resulting in a 6.4% increase in Truckload Revenue xFSR per loaded mile |
Dedicated
| |
| • | Dedicated Revenue xFSR grew 28.8%; driven by the addition of multiple new customer contracts over the past 12 months |
| |
| • | Dedicated Adjusted Operating Ratio increased 300 basis points to 90.4% driven by an increase in driver wages and insurance and claims expense |
Central Refrigerated Services ("CRS")
| |
| • | CRS added 178 operational trucks during the fourth quarter of 2014, as we continue to see positive results of our driver-based initiatives and structure changes |
| |
| • | CRS Adjusted Operating Ratio improved 160 basis points, both sequentially and year over year, to 94.4% |
Intermodal
| |
| • | Intermodal Revenue xFSR grew 6.3%. Container on Flat Car (COFC) loads increased 9.6%, partially offset by a 33.4% reduction in Trailer on Flat Car (TOFC) loads |
| |
| • | Intermodal Adjusted Operating Ratio improved 290 basis points to 91.3% in the quarter compared to 94.2% during the same period last year, and improved sequentially 630 basis points compared to the third quarter of 2014 |
In summary, we are very pleased with the time, energy, focus and effort displayed this past quarter by each member of the Swift family. Together, in the fourth quarter of 2014, we were able to achieve record levels of quarterly revenue and operating income, as well as the largest quarterly Adjusted EPS since returning to the public markets in December 2010. This quarter we continued to benefit from the strategic driver-friendly initiatives implemented earlier in the year. Our driver turnover continues to be lower than the industry average, our unmanned truck count remains low, and our academies remain full. We are also encouraged by the positive trends, both financial and operational, generated by most of our reportable segments this quarter, specifically Truckload, Intermodal and CRS.
Fourth Quarter Results by Reportable Segment
Truckload Segment
Our Truckload segment consists of one-way movements over irregular routes throughout the United States, Mexico and Canada. This service uses both company and owner-operator tractors with dry van, flatbed and other specialized trailing equipment.
|
| | | | | | | | | | | |
| | Three Months Ended December 31, |
| | 2014 | | 2013 | | 2012 |
Operating Revenue (1) | $ | 601.5 |
| | $ | 585.2 |
| | $ | 591.1 |
|
Revenue xFSR(1)(2)(3) | $ | 498.5 |
| | $ | 469.7 |
| | $ | 465.7 |
|
| | | | | | |
| Operating Ratio | 85.8 | % | | 89.6 | % | | 86.9 | % |
Adjusted Operating Ratio(3) | 82.9 | % | | 87.0 | % | | 83.3 | % |
| | | | | | |
| Weekly Revenue xFSR per Tractor | $ | 3,671 |
| | $ | 3,366 |
| | $ | 3,292 |
|
Total Loaded Miles(4) | 262,114 |
| | 262,854 |
| | 267,557 |
|
| | | | | | |
| Average Operational Truck Count | 10,333 |
| | 10,618 |
| | 10,765 |
|
| Deadhead Percentage | 12.3 | % | | 12.4 | % | | 11.3 | % |
1 In millions |
2 Revenue xFSR is operating revenue, excluding fuel surcharge revenue |
3 See GAAP to Non-GAAP reconciliation in the schedules following this letter |
4 Total Loaded Miles presented in thousands |
Our Truckload Revenue xFSR for the fourth quarter of 2014 increased $28.8 million, or 6.1%, over the same quarter in 2013, despite a 2.7% reduction in our Average Operational Truck Count year over year. This revenue growth was the result of a 6.4% year over year increase in Revenue xFSR per loaded mile and a 2.5% increase in loaded miles per tractor per week.
The fourth quarter Average Operational Truck Count increased 186 trucks sequentially when compared to the third quarter of 2014. This increase was in line with our previously disclosed estimate of 200 tractors. Improvements in both driver retention and recruiting facilitated this growth, which we believe to be a direct result of the driver friendly initiatives and pay increases we implemented during the year.
Our Adjusted Operating Ratio improved 410 basis points to 82.9% compared to 87.0% from the prior year. This improvement was driven by the increases in pricing and utilization discussed above, as well as a reduction in fuel expense reflecting a combination of declining diesel prices, better fuel efficiency, and reduced engine idle time; partially offset by increased driver wages.
Dedicated Segment
Through our Dedicated segment, we devote equipment and offer tailored solutions under long-term contracts with customers. This dedicated business utilizes refrigerated, dry van, flatbed and other specialized trailing equipment.
Dedicated Revenue xFSR grew a notable 28.8% to $202.5 million in the fourth quarter of 2014 from the fourth quarter of 2013. This growth was driven by multiple new contracts that started over the last twelve months which led to a 30.7% increase in our Average Operational Truck Count year over year. Weekly Revenue xFSR per Tractor decreased 1.4% to $3,210 due to the varying operational requirements of these new contracts.
|
| | | | | | | | | | | |
| | Three Months Ended December 31, |
| | 2014 | | 2013 | | 2012 |
Operating Revenue (1) | $ | 237.3 |
| | $ | 192.5 |
| | $ | 188.2 |
|
Revenue xFSR(1)(2)(3) | $ | 202.5 |
| | $ | 157.3 |
| | $ | 152.2 |
|
| | | | | | |
| Operating Ratio | 91.8 | % | | 89.7 | % | | 87.3 | % |
Adjusted Operating Ratio(3) | 90.4 | % | | 87.4 | % | | 84.3 | % |
| | | | | | |
| Weekly Revenue xFSR per Tractor | $ | 3,210 |
| | $ | 3,256 |
| | $ | 3,366 |
|
| Average Operational Truck Count | 4,802 |
| | 3,675 |
| | 3,439 |
|
| | | | | | |
1 In millions |
2 Revenue xFSR is operating revenue, excluding fuel surcharge revenue |
3 See GAAP to Non-GAAP reconciliation in the schedules following this letter |
For the fourth quarter of 2014, the Adjusted Operating Ratio in our Dedicated segment increased 300 basis points over the fourth quarter 2013 to 90.4%. This increase was driven by an increase in driver wages, an increase in insurance and claims expense and a reduction in gain on sale on equipment, partially offset by a minimal benefit in fuel costs. With the significant growth, we have also experienced a recent increase in auto liability claims in the Dedicated segment, resulting in an increase in insurance and claims expense. Management has implemented various countermeasures designed to further stress the importance of safety in our organization. While we expect these countermeasures to drive an improvement in our safety trends as we move forward, we also anticipate insurance and claims expense to remain elevated in the Dedicated segment in 2015, as the expense will reflect the recent experience. With regard to fuel, many of our Dedicated contracts have unique fuel recovery characteristics which drives more consistent net fuel expense compared to our over-the-road Truckload contracts. Therefore, the fuel benefit from declining fuel prices in Dedicated was limited.
Central Refrigerated (CRS) Segment
Our CRS segment represents shipments for customers that require temperature-controlled trailers. These shipments include one-way movements over irregular routes and dedicated truck operations.
CRS Revenue xFSR for the fourth quarter of 2014 decreased 12.8% to $84.2 million compared to the same quarter in 2013, primarily driven by a 10.4% reduction in our Average Operational Truck Count year over year. However, CRS truck count grew 178, or roughly 10.0% from the beginning to the end of the quarter, as the driver-based initiatives and other structural changes we discussed last quarter continue to gain momentum. We achieved this fleet growth through both incremental truck additions and a significant reduction in driver turnover for the quarter. We expect these trends to extend into the coming year, and we remain focused on continuing to drive year over year operational and financial improvement each quarter in our CRS segment.
Weekly Revenue xFSR per Tractor decreased 2.7% to $3,558, primarily due to freight mix changes and the on-boarding of the 10.0% fleet growth discussed above. This decrease in Weekly Revenue xFSR per Tractor was the net result of a 7.4% reduction in loaded miles per truck per week offset by a 5.1% increase in Revenue xFSR per loaded mile. CRS added several new dedicated locations which operate with a lower average length of haul, higher deadhead and a higher Revenue xFSR per loaded mile.
|
| | | | | | | | | | | |
| | Three Months Ended December 31, |
| | 2014 | | 2013 | | 2012 |
| | | | | | |
Operating Revenue (1) | $ | 103.9 |
| | $ | 119.6 |
| | $ | 106.5 |
|
Revenue xFSR(1)(2)(3) | $ | 84.2 |
| | $ | 96.6 |
| | $ | 82.0 |
|
| | | | | | |
| Operating Ratio | 95.5 | % | | 96.8 | % | | 93.7 | % |
Adjusted Operating Ratio(3) | 94.4 | % | | 96.0 | % | | 91.9 | % |
| | | | | | |
| Weekly Revenue xFSR per Tractor | $ | 3,558 |
| | $ | 3,656 |
| | $ | 3,373 |
|
| Average Operational Truck Count | 1,800 |
| | 2,010 |
| | 1,849 |
|
| Deadhead Percentage | 15.6 | % | | 13.4 | % | | 12.8 | % |
| | | | | | |
1 In millions |
2 Revenue xFSR is operating revenue, excluding fuel surcharge revenue |
3 See GAAP to Non-GAAP reconciliation in the schedules following this letter |
Our Adjusted Operating Ratio in our CRS segment improved 160 basis points to 94.4% in the fourth quarter 2014 from the fourth quarter 2013. This improvement was driven by higher Revenue xFSR per loaded mile, lower fuel prices and better fuel efficiencies, partially offset by higher driver wages, increased deadhead percentage and fewer loaded miles per truck per week.
Intermodal Segment
Our Intermodal segment includes revenue generated by freight moving over the rail in our containers and other trailing equipment, combined with revenue for drayage to transport loads between the railheads and customer locations.
|
| | | | | | | | | | | |
| | Three Months Ended December 31, |
| | 2014 | | 2013 | | 2012 |
| | | | | | |
Operating Revenue (1) | $ | 109.4 |
| | $ | 105.3 |
| | $ | 104.0 |
|
Revenue xFSR(1)(2)(3) | $ | 89.7 |
| | $ | 84.4 |
| | $ | 81.7 |
|
| | | | | | |
| Operating Ratio | 92.9 | % | | 95.3 | % | | 100.6 | % |
Adjusted Operating Ratio(3) | 91.3 | % | | 94.2 | % | | 100.7 | % |
| | | | | | |
| Load Counts | 46,182 | | 44,132 | | 42,840 |
| Average Container Counts | 9,150 | | 8,717 | | 8,628 |
| | | | | | |
1 In millions |
2 Revenue xFSR is operating revenue, excluding fuel surcharge revenue |
3 See GAAP to Non-GAAP reconciliation in the schedules following this letter |
Intermodal Revenue xFSR grew 6.3% in the fourth quarter of 2014 compared to the same period in the prior year driven by an increase of 1.6% in our Revenue xFSR per load and a 4.6% increase in load count. The growth in total
loads was the result of COFC load growth of 9.6% partially offset by a reduction in TOFC loads of 33.4%. As discussed in previous quarters, we strategically reduced the Central Refrigerated TOFC business earlier this year as it was not meeting profitability expectations.
Intermodal Adjusted Operating Ratio, improved 290 points to 91.3% in the fourth quarter of 2014 compared to 94.2% during the same period last year. Business mix, seasonal project business, improved container turns, dray efficiencies and improved safety trends drove the year over year improvement in margins.
Other Non-Reportable Segments
Our other non-reportable segments include our logistics and brokerage services, and our subsidiaries offering support services to customers and owner-operators, including shop maintenance, equipment leasing and insurance. Also captured here is the intangible amortization related to the 2007 going-private transaction.
In the fourth quarter of 2014, combined revenues and operating income from the aforementioned services increased $23.8 million and $2.0 million, respectively, compared to the same period in 2013, primarily due to growth in our logistics business and an increase in seasonal fourth quarter project business.
Fourth Quarter Consolidated Operating Expenses
|
| | | | | | | | | | | | | | | | | | | | |
| | | | | YOY | | | | | | QOQ |
| Q4'14 | | Q4'13 | | Variance1 | ($ in millions) | Q4'14 | | Q3'14 | | Variance1 |
| $ | 1,139.5 |
| | $ | 1,075.4 |
| | 6.0 | % | Total Revenue | $ | 1,139.5 |
| | $ | 1,074.9 |
| | 6.0 | % |
| $ | (179.3 | ) | | $ | (196.8 | ) | | -8.9 | % | Less: Fuel Surcharge Revenue | $ | (179.3 | ) | | $ | (193.1 | ) | | -7.1 | % |
| $ | 960.2 |
| | $ | 878.6 |
| | 9.3 | % | Revenue xFSR | $ | 960.2 |
| | $ | 881.8 |
| | 8.9 | % |
| | | | | | | | | | | |
| $ | 263.2 |
| | $ | 233.5 |
| | -12.7 | % | Salaries, Wages & Benefits | $ | 263.2 |
| | $ | 240.0 |
| | -9.7 | % |
| 27.4 | % | | 26.6 | % | | -80 bps |
| % of Revenue xFSR | 27.4 | % | | 27.2 | % | | -20 bps |
|
| | | | | | | | | | | |
| $ | 88.7 |
| | $ | 82.8 |
| | -7.1 | % | Operating Supplies & Expenses | $ | 88.7 |
| | $ | 88.5 |
| | -0.2 | % |
| 9.2 | % | | 9.4 | % | | 20 bps |
| % of Revenue xFSR | 9.2 | % | | 10.0 | % | | 80 bps |
|
| | | | | | | | | | | |
| $ | 45.8 |
| | $ | 41.9 |
| | -9.3 | % | Insurance & Claims | $ | 45.8 |
| | $ | 37.7 |
| | -21.5 | % |
| 4.8 | % | | 4.8 | % | | 0 bps |
| % of Revenue xFSR | 4.8 | % | | 4.3 | % | | -50 bps |
|
| | | | | | | | | | | |
| $ | 7.7 |
| | $ | 6.4 |
| | -20.3 | % | Communications & Utilities | $ | 7.7 |
| | $ | 7.3 |
| | -5.5 | % |
| 0.8 | % | | 0.7 | % | | -10 bps |
| % of Revenue xFSR | 0.8 | % | | 0.8 | % | | 0 bps |
|
| | | | | | | | | | | |
| $ | 17.7 |
| | $ | 19.1 |
| | 7.3 | % | Operating Taxes & Licenses | $ | 17.7 |
| | $ | 17.9 |
| | 1.1 | % |
| 1.8 | % | | 2.2 | % | | 40 bps |
| % of Revenue xFSR | 1.8 | % | | 2.0 | % | | 20 bps |
|
| | | | | | | | | | | |
1 Positive numbers represent favorable variances, negative numbers represent unfavorable variances |
The table above highlights some of our cost categories for the fourth quarter of 2014, compared to the fourth quarter of 2013 and the third quarter of 2014, showing each as a percent of Revenue xFSR. Fuel surcharge revenue can be volatile and is primarily dependent upon the cost of fuel and not specifically related to our non-fuel operational expenses. Therefore, we believe that Revenue xFSR is a better measure for analyzing our expenses and operating metrics.
Salaries, wages and benefits increased $29.7 million to $263.2 million during the fourth quarter of 2014, compared to the fourth quarter of 2013, due primarily to an increase in driver pay, an increase in miles driven by company drivers and an increase in the number of non-driving employees. Sequentially, salaries, wages and benefits increased $23.2 million during the fourth quarter of 2014 compared to the third quarter of 2014, but remained relatively consistent as a percentage of Revenue xFSR. The sequential increase is driven by growth in the number of miles driven by company drivers in the fourth quarter and the seasonal and year end bonuses for drivers and non-drivers.
Fourth quarter year over year operating supplies and expenses increased $6.0 million due primarily to increased equipment maintenance and higher driver recruiting costs. Sequentially, operating supplies and expenses as a percentage of Revenue xFSR decreased from 10.0% of Revenue xFSR in the third quarter of 2014 to 9.2% in the fourth quarter of 2014 due to higher seasonal revenue in the fourth quarter.
Insurance and claims expense increased $3.9 million to $45.8 million during the fourth quarter of 2014, but remained consistent year over year as a percentage of Revenue xFSR. Sequentially, insurance and claims expense increased $8.1 million during the fourth quarter of 2014, compared to $37.7 million in the third quarter of 2014. As a percent of Revenue xFSR, insurance and claims expense increased to 4.8% in the fourth quarter of 2014 compared to 4.3% in the third quarter of 2014. This expense was higher than anticipated in our original earnings guidance, and was driven by an increase in frequency and severity of auto liability claims within our Dedicated segment.
Fuel Expense
|
| | | | | | | | | | | | | | |
| Q4'14 | | Q4'13 | ($ in millions) | Q4'14 | | Q3'14 |
| $ | 133.1 |
| | $ | 150.4 |
| Fuel Expense | $ | 133.1 |
| | $ | 149.1 |
|
| 11.7 | % | | 14.0 | % | % of Total Revenue | 11.7 | % | | 13.9 | % |
Fuel expense for the fourth quarter of 2014 was $133.1 million, representing a decrease of $17.4 million from the fourth quarter of 2013. The decrease was a result of lower fuel prices, and improved fuel efficiency partially offset by an increase in the number of miles driven by company drivers. Sequentially, fuel expense decreased $16.0 million during the fourth quarter of 2014 compared to the third quarter of 2014.
Purchased Transportation
Purchased transportation includes payments to owner-operators, railroads and other third parties we use for intermodal drayage and other brokered business.
|
| | | | | | | | | | | | | | | |
| Q4'14 | | Q4'13 | | ($ in millions) | Q4'14 | | Q3'14 |
| $ | 333.7 |
| | $ | 337.1 |
| | Purchased Transportation | $ | 333.7 |
| | $ | 328.1 |
|
| 29.3 | % | | 31.3 | % | | % of Total Revenue | 29.3 | % | | 30.5 | % |
Purchased transportation decreased $3.3 million year over year primarily due to fewer miles driven by owner-operators and a reduction in fuel reimbursed to owner-operators and other third parties due to declining fuel prices. These reductions were partially offset by an increase in owner-operator rates and growth in our logistics and intermodal businesses.
Sequentially, purchased transportation increased $5.6 million in the fourth quarter 2014 primarily due to increased load volume in both our intermodal and logistics lines of business, partially offset by a reduction in miles driven by owner-operators and a reduction in fuel reimbursements due to the lower cost of fuel in the fourth quarter of 2014.
Rental Expense and Depreciation & Amortization of Property and Equipment
Due to fluctuations in the number of tractors leased versus owned, we combine our rental expense with depreciation and amortization of property and equipment for analytical purposes.
|
| | | | | | | | | | | | | | |
| Q4'14 | | Q4'13 | ($ in millions) | Q4'14 | | Q3'14 |
| $ | 61.8 |
| | $ | 50.4 |
| Rental Expense | $ | 61.8 |
| | $ | 59.7 |
|
| 6.4 | % | | 5.7 | % | % of Revenue xFSR | 6.4 | % | | 6.8 | % |
| | | | | | | |
| $ | 55.8 |
| | $ | 56.0 |
| Depreciation & Amortization of Property and Equipment | $ | 55.8 |
| | $ | 54.4 |
|
| 5.8 | % | | 6.4 | % | % of Revenue xFSR | 5.8 | % | | 6.2 | % |
| | | | | | | |
| $ | 117.6 |
| | $ | 106.4 |
| Combined Rental Expense and Depreciation | $ | 117.6 |
| | $ | 114.0 |
|
| 12.2 | % | | 12.1 | % | % of Revenue xFSR | 12.2 | % | | 12.9 | % |
As noted in the table above, combined rental and depreciation expense in the fourth quarter of 2014 increased $11.2 million to $117.6 million compared to the fourth quarter of 2013. This increase is primarily due to an increase in the number of tractors and trailers in the fleet, higher equipment replacement costs, and an increase in the amount of leased equipment. Sequentially, combined rental and depreciation expense increased $3.6 million during the fourth quarter of 2014 compared to the third quarter of 2014.
Gain on Disposal of Property and Equipment
The gain on disposal of property and equipment in the fourth quarter of 2014 was $4.6 million, which was slightly higher than our previously disclosed estimate of $2-4 million, due primarily to a stronger than anticipated used truck resale market.
Income Taxes
Income tax in accordance with GAAP for the fourth quarter 2014 was a provision of $32.7 million, reflecting an effective tax rate of 35.9%. The lower effective tax rate, as compared to our expected tax rate, in the fourth quarter was primarily due to federal employment income tax credits realized in the quarter as a result of the tax legislation changes made at the end of 2014. For the full year, the effective tax rate of 35.7% reflects reduced taxes primarily due to the benefit of prior year federal income tax credits realized in the third quarter of 2014 and federal employment income tax credits realized in the fourth quarter of 2014. We expect the 2015 full year effective tax rate, in accordance with GAAP, to be approximately 38.5%.
Interest Expense
Interest expense, comprised of debt interest expense, the amortization of deferred financing costs and original issue discount and excluding derivative interest expense on our interest rate swaps, decreased by $8.8 million in the fourth quarter of 2014 to $15.0 million, compared with $23.8 million for the fourth quarter of 2013. The decrease was largely due to our call of our remaining 10.0% Senior Secured 2nd Lien Notes in November 2014, lower debt balances, and our amended and restated credit facility, which we entered into in June 2014 that contains more favorable interest rates and terms.
Debt Balances
|
| | | | | | | | | | | | | | | | |
| ($ in millions) | | September 30, 2014 | | Call of 10.0% Senior Notes | | Other Q4 2014 Changes | | December 31, 2014 |
| Unrestricted Cash | | $ | 70.3 |
| | $ | (1.9 | ) | | $ | 36.7 |
| | $ | 105.1 |
|
| | | | | | | | | |
| A/R Securitization ($375 mm) | | 315.0 |
| | 19.0 |
| | — |
| | 334.0 |
|
| Revolver ($450mm) | | 82.0 |
| | — |
| | (25.0 | ) | | 57.0 |
|
| Term Loan A | | 50.0 |
| | 450.0 |
| | — |
| | 500.0 |
|
Term Loan B (a) | | 398.0 |
| | — |
| | (1.0 | ) | | 397.0 |
|
Senior Secured 2nd Lien Notes (a) | | 428.1 |
| | (428.1 | ) | | — |
| | — |
|
| Capital Leases & Other Debt | | 194.2 |
| | — |
| | 13.8 |
| | 208.0 |
|
| Total Debt | | $ | 1,467.3 |
| | $ | 40.9 |
| | $ | (12.2 | ) | | $ | 1,496.0 |
|
| | | | | | | | | |
| Net Debt | | $ | 1,397.0 |
| | $ | 42.8 |
| | $ | (48.9 | ) | | $ | 1,390.9 |
|
| | | | | | | | | |
| (a) Amounts presented represent face value |
During the fourth quarter of 2014, we made net payments of $25.0 million on our revolver and $1.0 million on our Term Loan B. We also called the remaining $428.1 million of our 10% Senior Secured 2nd Lien Notes due 2018 at a redemption price of 105% of face value, resulting in a premium of $21.4 million. Payment of the face amount, premium, and accrued interest through the call date totaled $470.9 million and was funded through borrowing the remaining $450.0 million under our delayed-draw Term Loan A, a net $19.0 million borrowing under our A/R Securitization and cash on hand. We recorded a loss on extinguishment of $27.2 million upon the redemption, comprised of the $21.4 million premium paid and $5.8 million to write-off the remaining unamortized debt issuance costs related to the Notes. Additionally, we increased our capital leases and other debt by net $12.9 million and increased our unrestricted cash by $34.8 million during the quarter.
We had previously expected our Net Debt to increase slightly during the fourth quarter as a result of paying the premium and related expenses of calling the Senior Notes. However, our improved earnings for the quarter
allowed us to achieve approximately $6.1 million reduction in Net Debt for the fourth quarter of 2014. Our leverage ratio as of December 31, 2014 improved to 2.24 compared to 2.37 as of September 30, 2014. This improvement was primarily the result of year over year Adjusted EBITDA growth and the modest sequential net debt reduction during the fourth quarter of 2014.
Cash Flow and Capital Expenditures
During the year ended December 31, 2014, we generated $395.8 million of cash flows from operating activities compared with $473.5 million during the same period of 2013. The decrease in cash flows from operations was primarily related to an increase in cash tax payments of $62.2 million as we have now utilized the majority of the net operating losses from prior periods. Cash used in investing activities was $139.8 million, of which capital expenditures were $306.0 million, partially offset by proceeds from the sale of property and equipment of $133.0 million. Cash used in financing activities for the year ended December 31, 2014 was $210.1 million, compared to $156.2 million for the same period in 2013, primarily driven by the voluntary prepayments of our debt.
2014 Summary and 2015 Expectations
As we discussed at our Investor Day in May, our purpose is to "Deliver a Better LifeSM" to our employees, customers, stockholders, and our communities. We believe we can do this by becoming the employer of choice of our employees, who in turn will provide the services and solutions our customers desire to drive revenue growth, which will enable us to improve our asset utilization all while maintaining a disciplined focus on cost control. Achieving these directives should help us reach our financial objectives of growth in earnings per share, improvement in our return on net assets and cash flow generation to repay debt and reinvest in our business. We are pleased with the progress our team has made on these goals and objectives in 2014. Some of the key highlights for the full year 2014 compared to the full year 2013 include:
| |
| • | Record Revenue and Operating Income |
| |
| • | Reduction in Net Debt of $158.9 million and Leverage Ratio to 2.24 |
| |
| • | Consolidated Revenue xFSR growth of 6.3% year over year |
| |
| • | Consolidated Average Operational Truck Count growth of 548 units or 3.3% |
| |
| • | Adjusted EPS of $1.38, an increase of 12.2% year over year |
| |
| • | 5.9% increase in Truckload Weekly Revenue xFSR per Tractor driven by a 4.6% increase in Revenue xFSR per loaded mile and a 1.2% increase in utilization as measured by loaded miles per tractor per week |
| |
| • | 160 basis point reduction in Truckload Adjusted Operating Ratio to 86.1% |
| |
| • | Dedicated Revenue xFSR growth of 23.3% driven by the addition of over 1,000 tractors on average |
| |
| • | Completion of the Central Refrigerated systems and facilities integration |
| |
| • | Intermodal Revenue xFSR growth of 8.4% driven by 11.6% growth in COFC loads |
| |
| • | Intermodal Adjusted Operating Ratio improvement of 70 basis points |
| |
| • | Completion of several refinancing activities including an amended and restated credit facility and the redemption of the 10% Senior Notes |
| |
| • | Completion of several tax initiatives reducing our effective tax rate to 35.7% |
Despite these many accomplishments, we did experience some disappointments in 2014, including severe winter weather throughout the first quarter, a challenging driver market and our slow reaction to address driver pay, underestimating the cultural and operational differences between Swift and Central Refrigerated and the disruption caused by the systems integration, growing pains and start-up costs in our Dedicated segment, and discouraging claims trends. As discussed previously, we are not sitting idly by and letting these disappointments continue without action. We have implemented plans to improve these situations and will continue to do so in 2015.
Our outlook for 2015 is bright. With continued capacity constraints in the industry and the U.S. economy continuing to emerge, we anticipate demand for our services to be strong. Our ability to win business will depend on our ability to execute on becoming the employer of choice, enabling attraction and retention of drivers. Our strategic teams focused on driver success will continue to a be a priority in 2015, as will our focus on utilization. By eliminating process inefficiencies that create barriers which keep our drivers from driving, we will not only improve the return on our assets, but our drivers will improve their bottom lines by taking home more money to their families. Utilization, recruitment and retention are the keys to our success and could provide us with an opportunity to grow organically at a more rapid pace as the industry consolidates. Safety, as always, must be first on everyone's mind, and we are kicking off the year with a new safety campaign to reach every driver. In addition, we have changed the specifications for our new tractors to include enhanced safety features. We believe this new equipment will bring us meaningful long-term benefits, not only with safety, but with recruiting, driver retention, maintenance, and fuel efficiency. Because of these anticipated benefits, we intend to accelerate our trade cycle for tractors by an average of six months. This is expected to increase our net cash capital expenditures in 2015 to a range of $300-$350 million depending on the growth we are able to achieve. If circumstances warrant, we are targeting total fleet growth of 700-1,100 tractors in 2015. Although some operational benefit is expected in 2015 from the new equipment, since trucks will be incorporated into the fleet throughout the year and will only make up a small portion of our total fleet, the majority of the benefits should be realized in 2016 and beyond. Interest expense savings are now projected to be slightly less in 2015, at $0.16-$0.17 of Adjusted EPS versus the previous estimate of $0.18-$0.19, due to the increase in capital expenditures; however, operational improvements are expected to be larger given the estimated benefits of the new equipment, offsetting the interest change. Taxes and fuel are likely to be a year over year headwind in 2015, given the significant declines experienced in 2014, and the lag effect associated with fuel surcharges. Given these various pluses and minuses, we now expect a range of $1.64-$1.74 for Adjusted EPS in 2015. In addition, with EBITDA growth we expect our leverage ratio to continue to decline in 2015 to end the year closer to 2.0.
We do not intend to give quarterly guidance, as insurance and claims and other items cause quarterly fluctuations, but will work relentlessly to deliver on our full year expectations. We do expect our typical seasonal patterns to continue to hold (i.e. the first quarter should be seasonally soft, with the second through fourth quarters developing similar to the trend experienced in 2014).
We are encouraged by the strong results our team was able to deliver, both for the fourth quarter and full year 2014, in spite of various headwinds throughout the year. We remain cautiously optimistic about the prospects for 2015 and beyond. We would like to thank each of the hardworking members of our Swift family for their contributions in 2014, as well as the support we receive from our stockholders.
Conference Call Q&A Session
Swift Transportation's management team will host a Q&A session at 10:00 a.m. Eastern Standard Time on Thursday, January 29th to answer questions about the Company’s fourth quarter financial results. Please email your questions to Investor_Relations@swifttrans.com prior to 7:00 p.m. Eastern Standard Time on Wednesday, January 28th.
Participants may access the call using the following dial-in numbers:
U.S./Canada: (800) 480-8614
International/Local: (706) 501-7951
Conference ID: 62172967
The live webcast, letter to stockholders, transcript of the Q&A, and the replay of the earnings Q&A session can be accessed via our investor relations website at investor.swifttrans.com.
IR Contact:
Jason Bates
Vice President of Finance &
Investor Relations Officer
623.907.7335
Forward Looking Statements & Use of Non-GAAP Measures
This letter contains statements that may constitute forward-looking statements, which are based on information currently available, usually identified by words such as "anticipates," "believes," "estimates," "plans,” "projects," "expects," “hopes,” “intends,” “will,” “could,” “should,” “may,” or similar expressions which speak only as of the date the statement was made. Such forward-looking statements are made pursuant to the safe harbor provisions of the Private Securities Litigation Reform Act of 1995. Such statements include, but are not limited to, statements concerning: trends and expectations relating to our operations, Revenue xFSR, expenses, other revenue, pricing, our effective tax rate, return on net assets, cash flow, debt repayment, profitability and related metrics; demand, organic growth, and EBITDA growth; seasonal freight patterns; the anticipated benefits of truck count and driver turnover initiatives we continue to implement; trends in Adjusted Operating Ratio in the Central Refrigerated segment; expected decline in our leverage ratio and projections for interest expense for 2015; projected Adjusted EPS for 2015, including components thereof; expected benefits resulting from new equipment specifications; expected level of capital expenditures in 2015; the timing and level of fleet size and equipment and container count; expected insurance claims expense trends in Dedicated and as a percentage of Revenue xFSR; and expected benefits of our new safety programs. Such forward-looking statements are inherently uncertain, and are based upon the current beliefs, assumptions and expectations of Company management and current market conditions, which are subject to significant risks and uncertainties as set forth in the Risk Factor section of our Annual Report Form 10-K for the year ended December 31, 2013. As to the Company’s business and financial performance, the following factors, among others, could cause actual results to differ materially from those in forward-looking statements: any future recessionary economic cycles and downturns in customers’ business cycles, particularly in market segments and industries in which we have a significant concentration of customers; increasing competition from trucking, rail, intermodal, and brokerage competitors; a significant reduction in, or termination of, our trucking services by a key customer; the amount and velocity of changes in fuel prices and our ability to recover fuel prices through our fuel surcharge program; volatility in the price or availability of fuel; increases in new equipment prices or replacement costs; the regulatory environment in which we operate, including existing regulations and changes in existing regulations, or violations by us of existing or future regulations; our Compliance Safety Accountability safety rating; increases in driver compensation to the extent not offset by increases in freight rates and difficulties in driver recruitment and retention; changes in rules or legislation by the National Labor Relations Board or Congress and/or union organizing efforts; potential volatility or decrease in the amount of earnings as a result of our claims exposure through our captive insurance companies; risks relating to our captive insurance companies; uncertainties associated with our operations in Mexico; our ability to attract and maintain relationships with owner-operators; the possible re-classification of our owner-operators as employees; our ability to retain or replace key personnel; conflicts of interest or potential litigation that may arise from other businesses owned by Jerry Moyes, including pledges of
Swift stock and guarantees related to other businesses by Jerry Moyes; our dependence on third parties for intermodal and brokerage business; our ability to sustain cost savings realized as part of recent cost reduction initiatives; potential failure in computer or communications systems; our ability to execute or integrate any future acquisitions successfully; seasonal factors such as harsh weather conditions that increase operating costs; goodwill impairment; the potential impact of the significant number of shares of our common stock that is outstanding; our intention to not pay dividends; our significant ongoing capital requirements; our level of indebtedness and our ability to service our outstanding indebtedness, including compliance with our indebtedness covenants, and the impact such indebtedness may have on the way we operate our business; the significant amount of our stock and related control over the Company by Jerry Moyes; and restrictions contained in our debt agreements. You should understand that many important factors, in addition to those listed above and in our filings with the SEC, could impact us financially. As a result of these and other factors, actual results may differ from those set forth in the forward-looking statements and the prices of the Company's securities may fluctuate dramatically. The Company makes no commitment, and disclaims any duty, to update or revise any forward-looking statements to reflect future events, new information or changes in these expectations. In addition to our GAAP results, this Letter to Stockholders also includes certain non-GAAP financial measures as defined by the SEC. The calculation of each measure, including reconciliation to the most closely related GAAP measure and the reasons management believes each non-GAAP measure is useful, are included in the attached schedules.
CONSOLIDATED INCOME STATEMENTS (UNAUDITED)
THREE MONTHS AND YEARS ENDED DECEMBER 31, 2014, 2013 AND 2012
|
| | | | | | | | | | | | | | | | | | | | | | | |
| | Three Months Ended December 31, | | Year Ended December 31, |
| | 2014 | | 2013 | | 2012 | | 2014 | | 2013 | | 2012 |
| | (Unaudited) |
| | (Amounts in thousands, except per share data) |
| Operating revenue | $ | 1,139,500 |
| | $ | 1,075,389 |
| | $ | 1,047,560 |
| | $ | 4,298,724 |
| | $ | 4,118,195 |
| | $ | 3,976,085 |
|
| Operating expenses: | | | | | | | | | | | |
| Salaries, wages and employee benefits | 263,219 |
| | 233,497 |
| | 224,556 |
| | 970,683 |
| | 903,990 |
| | 879,856 |
|
| Operating supplies and expenses | 88,712 |
| | 82,756 |
| | 74,695 |
| | 342,073 |
| | 319,023 |
| | 290,472 |
|
| Fuel | 133,057 |
| | 150,437 |
| | 168,118 |
| | 591,855 |
| | 640,000 |
| | 668,707 |
|
| Purchased transportation | 333,738 |
| | 337,052 |
| | 313,619 |
| | 1,321,268 |
| | 1,255,646 |
| | 1,195,033 |
|
| Rental expense | 61,781 |
| | 50,447 |
| | 40,661 |
| | 229,290 |
| | 180,328 |
| | 149,433 |
|
| Insurance and claims | 45,804 |
| | 41,934 |
| | 28,663 |
| | 159,246 |
| | 142,179 |
| | 121,655 |
|
| Depreciation and amortization of property and equipment | 55,787 |
| | 56,004 |
| | 54,485 |
| | 221,122 |
| | 226,008 |
| | 218,839 |
|
| Amortization of Intangibles | 4,203 |
| | 4,203 |
| | 4,204 |
| | 16,814 |
| | 16,814 |
| | 16,925 |
|
| Impairments | — |
| | — |
| | 2,322 |
| | 2,308 |
| | — |
| | 3,387 |
|
| Gain on disposal of property and equipment | (4,583 | ) | | (9,054 | ) | | (4,464 | ) | | (27,682 | ) | | (22,664 | ) | | (18,351 | ) |
| Communication and utilities | 7,664 |
| | 6,448 |
| | 6,466 |
| | 29,871 |
| | 25,593 |
| | 26,464 |
|
| Operating taxes and licenses | 17,651 |
| | 19,110 |
| | 18,231 |
| | 71,806 |
| | 74,319 |
| | 71,849 |
|
| Total operating expenses | 1,007,033 |
| | 972,834 |
| | 931,556 |
| | 3,928,654 |
| | 3,761,236 |
| | 3,624,269 |
|
| Operating income | 132,467 |
| | 102,555 |
| | 116,004 |
| | 370,070 |
| | 356,959 |
| | 351,816 |
|
| Other (income) expenses: | | | | | | | | | | | |
| Interest expense | 15,014 |
| | 23,815 |
| | 28,519 |
| | 80,064 |
| | 99,534 |
| | 122,049 |
|
| Derivative interest expense | 1,468 |
| | 1,293 |
| | — |
| | 6,495 |
| | 3,852 |
| | 5,101 |
|
| Interest income | (674 | ) | | (733 | ) | | (608 | ) | | (2,909 | ) | | (2,474 | ) | | (2,156 | ) |
| Merger and acquisition expense | — |
| | 582 |
| | — |
| | — |
| | 4,913 |
| | — |
|
| Loss on debt extinguishment | 27,152 |
| | — |
| | — |
| | 39,909 |
| | 5,540 |
| | 22,219 |
|
| Impairments of non-operating assets | — |
| | — |
| | 5,979 |
| | — |
| | — |
| | 5,979 |
|
| Gain on sale of real property | — |
| | — |
| | — |
| | — |
| | (6,876 | ) | | — |
|
| Other | (1,699 | ) | | (876 | ) | | (611 | ) | | (4,115 | ) | | (3,934 | ) | | (3,077 | ) |
| Total other (income) expenses, net | 41,261 |
| | 24,081 |
| | 33,279 |
| | 119,444 |
| | 100,555 |
| | 150,115 |
|
| Income before income taxes | 91,206 |
| | 78,474 |
| | 82,725 |
| | 250,626 |
| | 256,404 |
| | 201,701 |
|
| Income tax expense | 32,715 |
| | 33,176 |
| | 28,041 |
| | 89,474 |
| | 100,982 |
| | 61,614 |
|
| Net income | $ | 58,491 |
| | $ | 45,298 |
| | $ | 54,684 |
| | $ | 161,152 |
| | $ | 155,422 |
| | $ | 140,087 |
|
| Basic earnings per share | $ | 0.41 |
| | $ | 0.32 |
| | $ | 0.39 |
| | $ | 1.14 |
| | $ | 1.11 |
| | $ | 1.00 |
|
| Diluted earnings per share | $ | 0.41 |
| | $ | 0.32 |
| | $ | 0.39 |
| | $ | 1.12 |
| | $ | 1.09 |
| | $ | 1.00 |
|
| Shares used in per share calculations | | | | | | | | | | | |
| Basic | 141,869 |
| | 140,698 |
| | 139,551 |
| | 141,431 |
| | 140,179 |
| | 139,532 |
|
| Diluted | 143,695 |
| | 142,748 |
| | 139,618 |
| | 143,475 |
| | 142,221 |
| | 139,619 |
|
ADJUSTED EPS RECONCILIATION (UNAUDITED) (a)
THREE MONTHS AND YEARS ENDED DECEMBER 31, 2014, 2013 AND 2012
|
| | | | | | | | | | | | | | | | | | | | | | | |
| | Three Months Ended December 31, | | Year Ended December 31, |
| | 2014 | | 2013 | | 2012 | | 2014 | | 2013 | | 2012 |
| Diluted earnings per share | $ | 0.41 |
| | $ | 0.32 |
| | $ | 0.39 |
| | $ | 1.12 |
| | $ | 1.09 |
| | $ | 1.00 |
|
| Adjusted for: | | | | | | | | | | | |
| Income tax expense | 0.23 |
| | 0.23 |
| | 0.20 |
| | 0.62 |
| | 0.71 |
| | 0.44 |
|
| Income before income taxes | 0.63 |
| | 0.55 |
| | 0.59 |
| | 1.75 |
| | 1.80 |
| | 1.44 |
|
| Non-cash impairments (b) | — |
| | — |
| | 0.02 |
| | 0.02 |
| | — |
| | 0.02 |
|
| Non-cash impairments of non-operating assets (c) | — |
| | — |
| | 0.04 |
| | — |
| | — |
| | 0.04 |
|
| Loss on debt extinguishment (d) | 0.19 |
| | — |
| | — |
| | 0.28 |
| | 0.04 |
| | 0.16 |
|
| Amortization of certain intangibles (e) | 0.03 |
| | 0.03 |
| | 0.03 |
| | 0.11 |
| | 0.11 |
| | 0.11 |
|
| Amortization of unrealized losses on interest rate swaps (f) | — |
| | — |
| | — |
| | — |
| | — |
| | 0.04 |
|
| Acceleration of non-cash equity compensation (g) | — |
| | — |
| | — |
| | — |
| | 0.01 |
| | — |
|
| Excludable transaction costs (h) | — |
| | — |
| | — |
| | — |
| | 0.03 |
| | — |
|
| Mark-to-market adjustment of interest rate swaps (i) | — |
| | — |
| | — |
| | — |
| | 0.01 |
| | — |
|
| Adjusted income before income taxes | 0.85 |
| | 0.58 |
| | 0.68 |
| | 2.15 |
| | 2.00 |
| | 1.82 |
|
| Provision for income tax expense at effective rate | 0.30 |
| | 0.22 |
| | 0.27 |
| | 0.77 |
| | 0.77 |
| | 0.71 |
|
| Adjusted EPS | $ | 0.55 |
| | $ | 0.36 |
| | $ | 0.41 |
| | $ | 1.38 |
| | $ | 1.23 |
| | $ | 1.11 |
|
| |
| (a) | We define Adjusted EPS as (1) income (loss) before income taxes plus (i) amortization of the intangibles from our 2007 going-private transaction, (ii) non-cash impairments, (iii) other special non-cash items, (iv) excludable transaction costs, (v) the mark-to-market adjustment on our interest rate swaps that is recognized in the statement of income in a given period, and (vi) the amortization of previous losses recorded in accumulated other comprehensive income (loss) (“OCI”) related to the interest rate swaps we terminated upon our IPO and refinancing transactions in December 2010; (2) reduced by income taxes; (3) divided by weighted average diluted shares outstanding. For all periods through 2012, we used a normalized tax rate of 39% in our Adjusted EPS calculation due to the amortization of deferred tax assets related to our pre-IPO interest rate swap amortization and other items that we knew would cause fluctuations in our GAAP effective tax rate. Beginning in 2013, these items no longer result in large variations. Therefore, we began using our GAAP effective tax rate for our Adjusted EPS calculation in 2013. We believe the presentation of financial results excluding the impact of the items noted above provides a consistent basis for comparing our results from period to period and to those of our peers due to the non-comparable nature of the intangibles from our going-private transaction, the historical volatility of the interest rate derivative agreements and the non-operating nature of the impairment charges, transaction costs and other adjustment items. Adjusted EPS is not presented in accordance with GAAP and should be considered in addition to, not as a substitute for, or superior to, measures of financial performance in accordance with GAAP. The numbers reflected in the above table are calculated on a per share basis and may not foot due to rounding. |
| |
| (b) | During the third quarter of 2014, certain operational software with a carrying amount of $2.3 million was replaced and written off, resulting in a pre-tax impairment charge of $2.3 million. In the fourth quarter of 2012, a deposit related to the purchase of certain fuel technology equipment and a related asset were written off as the supplier ceased operations, resulting in a pre-tax impairment of $2.3 million. In the first quarter of 2012, real property with a carrying amount of $1.7 million was written down to its fair value of $0.6 million, resulting in a pre-tax impairment charge of $1.1 million. |
| |
| (c) | Swift Power Services, LLC ("SPS"), an entity in which we own a minority interest and hold a secured promissory note, failed to make its first scheduled principal payment and quarterly interest payment to us on December 31, 2012 due to a decline in its financial performance resulting from a legal dispute with the former owners and its primary customer. This caused us to evaluate the secured promissory note due from SPS for impairment, which resulted in a $6.0 million pre-tax adjustment that was recorded in Impairments of non-operational assets in the fourth quarter of 2012. |
| |
| (d) | In November 2014, the Company redeemed, in full, the remaining $428.1 million face value of its Senior Secured Second Priority Notes due 2018(“Senior Notes”). This was primarily funded with the proceeds from the Company’s First Lien Term Loan A (“Term Loan A”). The Company paid 105% of face value, plus accrued and unpaid interest, to call the Senior Notes. While the redeemed Senior Notes incurred interest at 10%, the source of funds from the Term Loan A incurs interest at LIBOR + 2.00%. The November 2014 redemption followed a series of refinancing transactions that occurred in the first nine months of 2014, in which the Company used cash on hand to repurchase $71.9 million in principal of the Senior Notes. Including the November 2014 redemption, the Company repurchased $500.0 million in principal of the Senior Notes during 2014, averaging 105.58% of the face value. In connection with these transactions, the Company incurred a loss on debt extinguishment of $27.2 million and $34.7 million during the three months and year ended December 31, 2014. The loss on debt extinguishment reflects the cost of the premium paid, as well as write-offs of original issue discount and deferred financing costs. These transactions significantly reduced Swift’s average cost of debt, as compared to the beginning of the year. |
On June 9, 2014, the Company entered into a Third Amended and Restated Credit Agreement ("2014 Agreement"). The 2014 Agreement replaced the then-existing first lien term loan B-1 and B-2 tranches, which had outstanding principal balances at closing of $229.0 million and $370.9 million, respectively. The B-1 and B-2 tranches were under the Second Amended and Restated Credit Agreement ("2013 Agreement"), which had a $500.0 million face value delayed-draw first lien term loan A tranche, maturing June 2019, and a $400.0 million face value first lien term loan B tranche, maturing June 2021. The Company drew $50.0 million of the first lien term loan A tranche upon closing of the 2014 Agreement. The 2014 Agreement also included a $450.0 million revolving credit line, maturing June 2019, of which the Company drew $164 million upon closing. This revolving credit line replaced the previous $400.0 million revolving credit line, maturing September
2016. The replacement of the 2013 Agreement resulted in a loss on debt extinguishment of $5.2 million in the second quarter of 2014, which reflects the write-off of the unamortized original issue discount and deferred financing fees related to the 2013 Agreement and the previous revolving credit line.
In association with the acquisition of Central, on August 6, 2013, certain outstanding Central debt was paid-in full and extinguished, resulting in a loss on debt extinguishment of $0.5 million in the third quarter of 2013, representing the write-off of the remaining unamortized deferred financing fees.
On May 21, 2012, the Company completed the call of its remaining $15.2 million face value 12.50% fixed rate notes due May 15, 2017, at 106.25% of face value. This resulted in a loss on debt extinguishment of $1.3 million, representing the call premium and write-off of the remaining unamortized deferred financing fees. The Company entered into the 2012 Agreement on March 6, 2012, which replaced the then-existing, remaining $874 million face value first lien term loan, maturing in December 2016. This resulted in a loss on debt extinguishment of $20.9 million in the first quarter of 2012, representing the write-off of the unamortized original issue discount and deferred financing fees associated with the original term loan.
| |
| (e) | Amortization of certain intangibles reflects the non-cash amortization expense relating to certain intangible assets identified in the 2007 going-private transaction through which Swift Corporation acquired Swift Transportation Co. |
| |
| (f) | Amortization of unrealized losses on interest rate swaps reflects the non-cash amortization expense of $5.1 million for the year ended December 31, 2012 included in derivative interest expense in the consolidated statements of income and is comprised of previous losses recorded in accumulated OCI related to the interest rate swaps we terminated upon our IPO and concurrent refinancing transactions in December 2010. Such losses were incurred in prior periods when hedge accounting applied to the swaps and were expensed in relation to the hedged interest payments through the original maturity of the swaps in August 2012. |
| |
| (g) | In the third quarter of 2013, Central incurred a $0.9 million one-time non-cash equity compensation expense for certain stock options that accelerated upon the closing of the acquisition of Central. |
| |
| (h) | As a result of the acquisition of Central, both Swift and Central incurred certain transactional related expenses, including financial advisory and other professional fees related to the Acquisition, totaling approximately $4.9 million for the year ended December 31, 2013. |
| |
| (i) | Mark-to-market adjustment of interest rate swaps reflects the portion of the change in fair value of these financial instruments that was recorded in earnings in each period indicated and excludes the portion recorded in accumulated OCI under cash flow hedge accounting. |
ADJUSTED OPERATING INCOME AND OPERATING RATIO RECONCILIATION (UNAUDITED) (a)
THREE MONTHS AND YEARS ENDED DECEMBER 31, 2014, 2013 AND 2012
|
| | | | | | | | | | | | | | | | | | | | | | | |
| | Three Months Ended December 31, | | Year Ended December 31, |
| | 2014 | | 2013 | | 2012 | | 2014 | | 2013 | | 2012 |
| | (Dollar amounts in thousands) |
| Operating revenue | $ | 1,139,500 |
| | $ | 1,075,389 |
| | $ | 1,047,560 |
| | $ | 4,298,724 |
| | $ | 4,118,195 |
| | $ | 3,976,085 |
|
| Less: Fuel surcharge revenue | 179,274 |
| | 196,754 |
| | 209,249 |
| | 763,333 |
| | 791,481 |
| | 794,514 |
|
| Revenue xFSR | 960,226 |
| | 878,635 |
| | 838,311 |
| | 3,535,391 |
| | 3,326,714 |
| | 3,181,571 |
|
| Operating expense | 1,007,033 |
| | 972,834 |
| | 931,556 |
| | 3,928,654 |
| | 3,761,236 |
| | 3,624,269 |
|
| Adjusted for: | | | | | | | | | | | |
| Fuel surcharge revenue | (179,274 | ) | | (196,754 | ) | | (209,249 | ) | | (763,333 | ) | | (791,481 | ) | | (794,514 | ) |
| Amortization of certain intangibles (b) | (3,912 | ) | | (3,912 | ) | | (3,912 | ) | | (15,648 | ) | | (15,648 | ) | | (15,758 | ) |
| Non-cash impairments (c) | — |
| | — |
| | (2,322 | ) | | (2,308 | ) | | — |
| | (3,387 | ) |
| Acceleration of non-cash equity compensation (d) | — |
| | — |
| | — |
| | — |
| | (887 | ) | | — |
|
| Adjusted operating expense | 823,847 |
| | 772,168 |
| | 716,073 |
| | 3,147,365 |
| | 2,953,220 |
| | 2,810,610 |
|
| Adjusted operating income | $ | 136,379 |
| | $ | 106,467 |
| | $ | 122,238 |
| | $ | 388,026 |
| | $ | 373,494 |
| | $ | 370,961 |
|
| Operating Ratio | 88.4 | % | | 90.5 | % | | 88.9 | % | | 91.4 | % | | 91.3 | % | | 91.2 | % |
| Adjusted Operating Ratio | 85.8 | % | | 87.9 | % | | 85.4 | % | | 89.0 | % | | 88.8 | % | | 88.3 | % |
| |
| (a) | We define Adjusted Operating Ratio as (a) total operating expenses, less (i) fuel surcharges, (ii) amortization of the intangibles from our 2007 going-private transaction, (iii) non-cash impairment charges, (iv) other special non-cash items, and (v) excludable transaction costs, as a percentage of (b) total revenue excluding fuel surcharge revenue (Revenue xFSR). We believe fuel surcharge is sometimes volatile and eliminating the impact of this source of revenue (by netting fuel surcharge revenue against fuel expense) affords a more consistent basis for comparing our results of operations. We also believe excluding impairments, non-comparable nature of the intangibles from our going-private transaction and other special items enhances the comparability of our performance from period to period. Adjusted Operating Ratio is not a recognized measure under GAAP. Adjusted Operating Ratio should be considered in addition to, not as a substitute for, or superior to, measures of financial performance in accordance with GAAP. |
| |
| (b) | Includes the items discussed in note (e) to the Adjusted EPS Reconciliation schedule. |
| |
| (c) | Includes the items discussed in note (b) to the Adjusted EPS Reconciliation schedule. |
| |
| (d) | Includes the items discussed in note (g) to the Adjusted EPS Reconciliation schedule. |
ADJUSTED EARNINGS BEFORE INTEREST, TAXES, DEPRECIATION
AND AMORTIZATION (UNAUDITED) (a)
THREE MONTHS AND YEARS ENDED DECEMBER 31, 2014, 2013 AND 2012
|
| | | | | | | | | | | | | | | | | | | | | | | |
| | Three Months Ended December 31, | | Year Ended December 31, |
| | 2014 | | 2013 | | 2012 | | 2014 | | 2013 | | 2012 |
| | (Dollar amounts in thousands) |
| Net income | $ | 58,491 |
| | $ | 45,298 |
| | $ | 54,684 |
| | $ | 161,152 |
| | $ | 155,422 |
| | $ | 140,087 |
|
| Adjusted for: | | | | | | | | | | | |
| Depreciation and amortization of property and equipment | 55,787 |
| | 56,004 |
| | 54,485 |
| | 221,122 |
| | 226,008 |
| | 218,839 |
|
| Amortization of intangibles | 4,203 |
| | 4,203 |
| | 4,204 |
| | 16,814 |
| | 16,814 |
| | 16,925 |
|
| Interest expense | 15,014 |
| | 23,815 |
| | 28,519 |
| | 80,064 |
| | 99,534 |
| | 122,049 |
|
| Derivative interest expense | 1,468 |
| | 1,293 |
| | — |
| | 6,495 |
| | 3,852 |
| | 5,101 |
|
| Interest income | (674 | ) | | (733 | ) | | (608 | ) | | (2,909 | ) | | (2,474 | ) | | (2,156 | ) |
| Income tax expense | 32,715 |
| | 33,176 |
| | 28,041 |
| | 89,474 |
| | 100,982 |
| | 61,614 |
|
| Earnings before interest, taxes, depreciation and amortization (EBITDA) | $ | 167,004 |
| | $ | 163,056 |
| | $ | 169,325 |
| | $ | 572,212 |
| | $ | 600,138 |
| | $ | 562,459 |
|
| Non-cash equity compensation (b) | 1,504 |
| | 1,180 |
| | 575 |
| | 5,396 |
| | 4,645 |
| | 4,890 |
|
| Loss on debt extinguishment (c) | 27,152 |
| | — |
| | — |
| | 39,909 |
| | 5,540 |
| | 22,219 |
|
| Non-cash impairments (d) | — |
| | — |
| | 2,322 |
| | 2,308 |
| | — |
| | 3,387 |
|
| Excludable transaction costs (e) | — |
| | 582 |
| | — |
| | — |
| | 4,913 |
| | — |
|
| Non-cash impairments of non-operating assets (f) | — |
| | — |
| | 5,979 |
| | — |
| | — |
| | 5,979 |
|
| Adjusted earnings before interest, taxes, depreciation and amortization (Adjusted EBITDA) | $ | 195,660 |
| | $ | 164,818 |
| | $ | 178,201 |
| | $ | 619,825 |
| | $ | 615,236 |
| | $ | 598,934 |
|
| |
| (a) | We define Adjusted EBITDA as net income (loss) plus (i) depreciation and amortization, (ii) interest and derivative interest expense, including other fees and charges associated with indebtedness, net of interest income, (iii) income taxes, (iv) non-cash equity compensation expense, (v) non-cash impairments, (vi) other special non-cash items, and (vii) excludable transaction costs. We believe that Adjusted EBITDA is a relevant measure for estimating the cash generated by our operations that would be available to cover capital expenditures, taxes, interest and other investments and that it enhances an investor’s understanding of our financial performance. We use Adjusted EBITDA for business planning purposes and in measuring our performance relative to that of our competitors. Our method of computing Adjusted EBITDA is consistent with that used in our senior secured credit agreement for covenant compliance purposes and may differ from similarly titled measures of other companies. Adjusted EBITDA is not a recognized measure under GAAP. Adjusted EBITDA should be considered in addition to, not as a substitute for or superior to, net income, cash flow from operations, operating income or any other performance measures derived in accordance with GAAP as measures of operating performance or operating cash flows as a measure of liquidity. |
| |
| (b) | Represents recurring non-cash equity compensation expense, on a pre-tax basis. In accordance with the terms of our senior credit agreement, this expense is added back in the calculation of Adjusted EBITDA for covenant compliance purposes. |
| |
| (c) | Includes the items discussed in note (d) to the Adjusted EPS Reconciliation schedule. |
| |
| (d) | Includes the items discussed in note (b) to the Adjusted EPS Reconciliation schedule. |
| |
| (e) | Includes the items discussed in note (h) to the Adjusted EPS Reconciliation schedule. |
| |
| (f) | Includes the items discussed in note (c) to the Adjusted EPS Reconciliation schedule. |
FINANCIAL INFORMATION BY SEGMENT (UNAUDITED) (a)
THREE MONTHS AND YEARS ENDED DECEMBER 31, 2014, 2013 AND 2012
|
| | | | | | | | | | | | | | | | | | | | | | | | |
| | Three Months Ended December 31, | | Year Ended December 31, | |
| | 2014 | | 2013 | | 2012 | | 2014 | | 2013 | | 2012 | |
| | (Dollar amounts in thousands) | |
Operating revenue: | | | | | | | | | | | | |
| Truckload | $ | 601,541 |
| | $ | 585,222 |
| | $ | 591,100 |
| | $ | 2,301,010 |
| | $ | 2,313,035 |
| | $ | 2,282,342 |
| |
| Dedicated | 237,302 |
| | 192,502 |
| | 188,150 |
| | 892,078 |
| | 738,929 |
| | 724,405 |
| |
| Central Refrigerated | 103,858 |
| | 119,552 |
| | 106,530 |
| | 417,980 |
| | 452,531 |
| | 415,733 |
| |
| Intermodal | 109,391 |
| | 105,339 |
| | 103,957 |
| | 401,577 |
| | 376,075 |
| | 355,494 |
| |
| Subtotal | 1,052,092 |
| | 1,002,615 |
| | 989,737 |
| | 4,012,645 |
| | 3,880,570 |
| | 3,777,974 |
| |
| Nonreportable segments (b) | 103,690 |
| | 79,899 |
| | 74,450 |
| | 342,969 |
| | 287,853 |
| | 268,821 |
| |
| Intersegment eliminations | (16,282 | ) | | (7,125 | ) | | (16,627 | ) | | (56,890 | ) | | (50,228 | ) | | (70,710 | ) | |
| Consolidated operating revenue | $ | 1,139,500 |
| | $ | 1,075,389 |
| | $ | 1,047,560 |
| | $ | 4,298,724 |
| | $ | 4,118,195 |
| | $ | 3,976,085 |
| |
| | | | | | | | | | | | | |
Operating income (loss): | | | | | | | | | | | | |
| Truckload | $ | 85,383 |
| | $ | 60,893 |
| | $ | 77,639 |
| | $ | 258,072 |
| | $ | 225,963 |
| | $ | 246,005 |
| |
| Dedicated | 19,460 |
| | 19,795 |
| | 23,922 |
| | 75,794 |
| | 83,520 |
| | 74,026 |
| |
| Central Refrigerated | 4,715 |
| | 3,879 |
| | 6,663 |
| | 14,035 |
| | 17,682 |
| | 21,334 |
| |
| Intermodal (c) | 7,785 |
| | 4,904 |
| | (583 | ) | | 8,298 |
| | 5,619 |
| | (6,486 | ) | |
| Subtotal | 117,343 |
| | 89,471 |
| | 107,641 |
| | 356,199 |
| | 332,784 |
| | 334,879 |
| |
| Nonreportable segments (b) | 15,124 |
| | 13,084 |
| | 8,363 |
| | 13,871 |
| | 24,175 |
| | 16,937 |
| |
Consolidated operating income | $ | 132,467 |
| | $ | 102,555 |
| | $ | 116,004 |
| | $ | 370,070 |
| | $ | 356,959 |
| | $ | 351,816 |
| |
| | | | | | | | | | | | | |
Operating Ratio: | | | | | | | | | | | | |
| Truckload | 85.8 | % | | 89.6 | % | | 86.9 | % | | 88.8 | % | | 90.2 | % | | 89.2 | % | |
| Dedicated | 91.8 | % | | 89.7 | % | | 87.3 | % | | 91.5 | % | | 88.7 | % | | 89.8 | % | |
| Central Refrigerated | 95.5 | % | | 96.8 | % | | 93.7 | % | | 96.6 | % | | 96.1 | % | | 94.9 | % | |
| Intermodal (c) | 92.9 | % | | 95.3 | % | | 100.6 | % | | 97.9 | % | | 98.5 | % | | 101.8 | % | |
| | | | | | | | | | | | | |
| Adjusted Operating Ratio (d): | | | | | | | | | | | | |
| Truckload | 82.9 | % | | 87.0 | % | | 83.3 | % | | 86.1 | % | | 87.7 | % | | 86.3 | % | |
| Dedicated | 90.4 | % | | 87.4 | % | | 84.3 | % | | 89.8 | % | | 86.1 | % | | 87.5 | % | |
| Central Refrigerated | 94.4 | % | | 96.0 | % | | 91.9 | % | | 95.8 | % | | 95.1 | % | | 93.3 | % | |
| Intermodal (c) | 91.3 | % | | 94.2 | % | | 100.7 | % | | 97.4 | % | | 98.1 | % | | 102.3 | % | |
| | | | | | | | | | | | | |
| |
| (a) | In the first quarter of 2014, the Company reorganized its reportable segments to reflect management’s revised reporting structure of its lines of businesses following the integration of Central Refrigerated. In association with the operational reorganization, the operations of Central Refrigerated's Trailer on Flat Car ("TOFC") business are reported within the Company's Intermodal segment, and the operations of Central Refrigerated's logistics business, third-party leasing, and other services provided to owner-operators are reported in the Company's other non-reportable segment. All prior period historical results related to the above noted segment reorganization have been retrospectively recast. |
| |
| (b) | Our nonreportable segments are comprised of our freight brokerage and logistics management services, financing subsidiaries, insurance and shop activities. Intangible amortization related to the 2007 going private transaction is also included in this segment. |
| |
| (c) | During 2012, our Intermodal reportable segment incurred an increase in its insurance and claims expense primarily related to one claim associated with a drayage accident, which increased the Intermodal Operating Ratio and Adjusted Operating Ratio by approximately 450 basis points and 570 basis points, respectively, for the three months ended December 31, 2012 and 300 basis points and 380 basis points, respectively, for the year ended December 31, 2012. |
| |
| (d) | See our reconciliation of Adjusted Operating Ratio by Segment at the schedule titled “Adjusted Operating Income and Operating Ratio Reconciliation by Segment." |
OPERATING STATISTICS (UNAUDITED) (a)
THREE MONTHS AND YEARS ENDED DECEMBER 31, 2014, 2013 AND 2012
|
| | | | | | | | | | | | | | | | | | | | | | | |
| | Three Months Ended December 31, | | Year Ended December 31, |
| | 2014 | | 2013 | | 2012 | | 2014 | | 2013 | | 2012 |
| Operating Statistics by Segment: | | | | | | | | | | | |
| Truckload: | | | | | | | | | | | |
| Weekly revenue xFSR per tractor | $ | 3,671 |
| | $ | 3,366 |
| | $ | 3,292 |
| | $ | 3,450 |
| | $ | 3,257 |
| | $ | 3,165 |
|
| Total loaded miles (b) | 262,114 |
| | 262,854 |
| | 267,557 |
| | 1,030,443 |
| | 1,067,141 |
| | 1,065,339 |
|
| Deadhead miles percentage | 12.3 | % | | 12.4 | % | | 11.3 | % | | 11.9 | % | | 11.6 | % | | 11.1 | % |
| Average tractors available for dispatch: | | | | | | | | | | | |
| Company | 7,114 |
| | 7,220 |
| | 7,425 |
| | 6,975 |
| | 7,500 |
| | 7,508 |
|
| Owner-Operator | 3,219 |
| | 3,398 |
| | 3,340 |
| | 3,361 |
| | 3,333 |
| | 3,361 |
|
| Total | 10,333 |
| | 10,618 |
| | 10,765 |
| | 10,336 |
| | 10,833 |
| | 10,869 |
|
| | | | | | | | | | | | |
| Dedicated: | | | | | | | | | | | |
| Weekly revenue xFSR per tractor | $ | 3,210 |
| | $ | 3,256 |
| | $ | 3,366 |
| | $ | 3,182 |
| | $ | 3,339 |
| | $ | 3,357 |
|
| Average tractors available for dispatch: | | | | | | | | | | | |
| Company | 3,838 |
| | 2,975 |
| | 2,768 |
| | 3,609 |
| | 2,791 |
| | 2,698 |
|
| Owner-Operator | 964 |
| | 700 |
| | 671 |
| | 852 |
| | 660 |
| | 663 |
|
| Total | 4,802 |
| | 3,675 |
| | 3,439 |
| | 4,461 |
| | 3,451 |
| | 3,361 |
|
| | | | | | | | | | | | |
| Central Refrigerated: | | | | | | | | | | | |
| Weekly revenue xFSR per tractor | $ | 3,558 |
| | $ | 3,656 |
| | $ | 3,373 |
| | $ | 3,461 |
| | $ | 3,474 |
| | $ | 3,360 |
|
| Total loaded miles (b) | 40,838 |
| | 49,217 |
| | 46,625 |
| | 166,637 |
| | 193,559 |
| | 185,984 |
|
| Deadhead miles percentage | 15.6 | % | | 13.4 | % | | 12.8 | % | | 15.2 | % | | 12.8 | % | | 12.4 | % |
| Average tractors available for dispatch: | | | | | | | | | | | |
| Company | 1,221 |
| | 1,022 |
| | 960 |
| | 1,102 |
| | 1,018 |
| | 947 |
|
| Owner-Operator | 579 |
| | 988 |
| | 889 |
| | 755 |
| | 951 |
| | 865 |
|
| Total | 1,800 |
| | 2,010 |
| | 1,849 |
| | 1,857 |
| | 1,970 |
| | 1,812 |
|
| | | | | | | | | | | | |
| Intermodal: | | | | | | | | | | | |
| Average tractors available for dispatch: | | | | | | | | | | | |
| Company | 456 |
| | 354 |
| | 300 |
| | 426 |
| | 321 |
| | 302 |
|
| Owner-Operator | 86 |
| | 69 |
| | 7 |
| | 77 |
| | 41 |
| | 2 |
|
| Total | 542 |
| | 423 |
| | 307 |
| | 503 |
| | 362 |
| | 304 |
|
| Load Count | 46,182 |
| | 44,132 |
| | 42,840 |
| | 172,464 |
| | 160,642 |
| | 152,237 |
|
| Average Container Count | 9,150 |
| | 8,717 |
| | 8,628 |
| | 8,841 |
| | 8,717 |
| | 7,209 |
|
| | | | | | | | | | | | |
| |
| (a) | See note (a) to the Financial Information by Segment schedule, regarding the operational reorganization in the first quarter of 2014. |
| |
| (b) | Total loaded miles presented in thousands. |
CONSOLIDATED TOTAL EQUIPMENT (UNAUDITED)
AS OF DECEMBER 31, 2014, 2013 AND 2012
|
| | | | | | |
| | As of December 31, |
| | 2014 | | 2013 | | 2012 |
| | | | | | |
| Tractors: | | | | | |
| Company | | | | | |
| Owned | 6,083 | | 6,081 | | 5,504 |
|
| Leased – capital leases | 1,700 | | 1,851 | | 2,658 |
|
| Leased – operating leases | 6,099 | | 4,834 | | 4,139 |
|
| Total company tractors | 13,882 | | 12,766 | | 12,301 |
|
| Owner-operator | | | | | |
| Financed through the Company | 4,204 | | 4,473 | | 3,885 |
|
| Other | 750 | | 722 | | 960 |
|
| Total owner-operator tractors | 4,954 | | 5,195 | | 4,845 |
|
| Total tractors | 18,836 | �� | 17,961 | | 17,146 |
|
| Trailers | 61,652 | | 57,310 | | 55,947 |
|
| Containers | 9,150 | | 8,717 | | 8,717 |
|
ADJUSTED OPERATING INCOME AND OPERATING RATIO
RECONCILIATION BY SEGMENT (UNAUDITED) (a)
THREE MONTHS AND YEARS ENDED DECEMBER 31, 2014, 2013 AND 2012
|
| | | | | | | | | | | | | | | | | | | | | | | |
| | Three Months Ended December 31, | | Year Ended December 31, |
| | 2014 | | 2013 | | 2012 | | 2014 | | 2013 | | 2012 |
| | (Dollar amounts in thousands) |
| Truckload: | | | | | | | | | | | |
| Operating revenue | $ | 601,541 |
| | $ | 585,222 |
| | $ | 591,100 |
| | $ | 2,301,010 |
| | $ | 2,313,035 |
| | $ | 2,282,342 |
|
| Less: Fuel surcharge revenue | 103,044 |
| | 115,568 |
| | 125,354 |
| | 442,023 |
| | 473,139 |
| | 483,623 |
|
| Revenue xFSR | 498,497 |
| | 469,654 |
| | 465,746 |
| | 1,858,987 |
| | 1,839,896 |
| | 1,798,719 |
|
| Operating expense | 516,158 |
| | 524,329 |
| | 513,461 |
| | 2,042,938 |
| | 2,087,072 |
| | 2,036,337 |
|
| Adjusted for: | | | | | | | | | | | |
| Fuel surcharge revenue | (103,044 | ) | | (115,568 | ) | | (125,354 | ) | | (442,023 | ) | | (473,139 | ) | | (483,623 | ) |
| Adjusted operating expense | 413,114 |
| | 408,761 |
| | 388,107 |
| | 1,600,915 |
| | 1,613,933 |
| | 1,552,714 |
|
| Adjusted operating income | $ | 85,383 |
| | $ | 60,893 |
| | $ | 77,639 |
| | $ | 258,072 |
| | $ | 225,963 |
| | $ | 246,005 |
|
| Adjusted Operating Ratio | 82.9 | % | | 87.0 | % | | 83.3 | % | | 86.1 | % | | 87.7 | % | | 86.3 | % |
| Operating Ratio | 85.8 | % | | 89.6 | % | | 86.9 | % | | 88.8 | % | | 90.2 | % | | 89.2 | % |
| | | | | | | | | | | | |
| Dedicated: | | | | | | | | | | | |
| Operating revenue | $ | 237,302 |
| | $ | 192,502 |
| | $ | 188,150 |
| | $ | 892,078 |
| | $ | 738,929 |
| | $ | 724,405 |
|
| Less: Fuel surcharge revenue | 34,764 |
| | 35,208 |
| | 35,999 |
| | 151,399 |
| | 138,063 |
| | 134,498 |
|
| Revenue xFSR | 202,538 |
| | 157,294 |
| | 152,151 |
| | 740,679 |
| | 600,866 |
| | 589,907 |
|
| Operating expense | 217,842 |
| | 172,707 |
| | 164,228 |
| | 816,284 |
| | 655,409 |
| | 650,379 |
|
| Adjusted for: | | | | | | | | | | | |
| Fuel surcharge revenue | (34,764 | ) | | (35,208 | ) | | (35,999 | ) | | (151,399 | ) | | (138,063 | ) | | (134,498 | ) |
| Adjusted operating expense | 183,078 |
| | 137,499 |
| | 128,229 |
| | 664,885 |
| | 517,346 |
| | 515,881 |
|
| Adjusted operating income | $ | 19,460 |
| | $ | 19,795 |
| | $ | 23,922 |
| | $ | 75,794 |
| | $ | 83,520 |
| | $ | 74,026 |
|
| Adjusted Operating Ratio | 90.4 | % | | 87.4 | % | | 84.3 | % | | 89.8 | % | | 86.1 | % | | 87.5 | % |
| Operating Ratio | 91.8 | % | | 89.7 | % | | 87.3 | % | | 91.5 | % | | 88.7 | % | | 89.8 | % |
| | | | | | | | | | | | |
| Central Refrigerated: | | | | | | | | | | | |
| Operating revenue | $ | 103,858 |
| | $ | 119,552 |
| | $ | 106,530 |
| | $ | 417,980 |
| | $ | 452,531 |
| | $ | 415,733 |
|
| Less: Fuel surcharge revenue | 19,670 |
| | 23,000 |
| | 24,567 |
| | 83,660 |
| | 95,312 |
| | 97,341 |
|
| Revenue xFSR | 84,188 |
| | 96,552 |
| | 81,963 |
| | 334,320 |
| | 357,219 |
| | 318,392 |
|
| Operating expense | 99,143 |
| | 115,673 |
| | 99,867 |
| | 403,945 |
| | 434,849 |
| | 394,399 |
|
| Adjusted for: | | | | | | | | | | | |
| Fuel surcharge revenue | (19,670 | ) | | (23,000 | ) | | (24,567 | ) | | (83,660 | ) | | (95,312 | ) | | (97,341 | ) |
| Adjusted operating expense | 79,473 |
| | 92,673 |
| | 75,300 |
| | 320,285 |
| | 339,537 |
| | 297,058 |
|
| Adjusted operating income | $ | 4,715 |
| | $ | 3,879 |
| | $ | 6,663 |
| | $ | 14,035 |
| | $ | 17,682 |
| | $ | 21,334 |
|
| Adjusted Operating Ratio | 94.4 | % | | 96.0 | % | | 91.9 | % | | 95.8 | % | | 95.1 | % | | 93.3 | % |
| Operating Ratio | 95.5 | % | | 96.8 | % | | 93.7 | % | | 96.6 | % | | 96.1 | % | | 94.9 | % |
| | | | | | | | | | | | |
| Intermodal: | | | | | | | | | | | |
| Operating revenue | $ | 109,391 |
| | $ | 105,339 |
| | $ | 103,957 |
| | $ | 401,577 |
| | $ | 376,075 |
| | $ | 355,494 |
|
| Less: Fuel surcharge revenue | 19,646 |
| | 20,944 |
| | 22,279 |
| | 77,947 |
| | 77,594 |
| | 75,571 |
|
| Revenue xFSR | 89,745 |
| | 84,395 |
| | 81,678 |
| | 323,630 |
| | 298,481 |
| | 279,923 |
|
| Operating expense | 101,606 |
| | 100,435 |
| | 104,540 |
| | 393,279 |
| | 370,456 |
| | 361,980 |
|
| Adjusted for: | | | | | | | | | | | |
| Fuel surcharge revenue | (19,646 | ) | | (20,944 | ) | | (22,279 | ) | | (77,947 | ) | | (77,594 | ) | | (75,571 | ) |
| Adjusted operating expense | 81,960 |
| | 79,491 |
| | 82,261 |
| | 315,332 |
| | 292,862 |
| | 286,409 |
|
| Adjusted operating income (loss) | $ | 7,785 |
| | $ | 4,904 |
| | $ | (583 | ) | | $ | 8,298 |
| | $ | 5,619 |
| | $ | (6,486 | ) |
| Adjusted Operating Ratio (b) | 91.3 | % | | 94.2 | % | | 100.7 | % | | 97.4 | % | | 98.1 | % | | 102.3 | % |
| Operating Ratio (b) | 92.9 | % | | 95.3 | % | | 100.6 | % | | 97.9 | % | | 98.5 | % | | 101.8 | % |
| |
(a) | See note (a) to the Financial Information by Segment schedule, regarding the operational reorganization in the first quarter of 2014. |
| |
| (b) | See note (c) to the Financial Information by Segment schedule, regarding insurance and claims impact on Operating Ratio and Adjusted Operating Ratio for the Company's Intermodal segment. |
CONDENSED CONSOLIDATED BALANCE SHEETS (UNAUDITED)
AS OF DECEMBER 31, 2014 AND 2013
(In thousands)
|
| | | | | | | |
| | December 31, |
| | 2014 | | 2013 |
| ASSETS | | | |
| Current assets: | | | |
| Cash and cash equivalents | $ | 105,132 |
| | $ | 59,178 |
|
| Restricted cash | 45,621 |
| | 50,833 |
|
| Restricted investments, held to maturity, amortized cost | 24,510 |
| | 25,814 |
|
| Accounts receivable, net | 478,999 |
| | 418,436 |
|
| Equipment sales receivable | 288 |
| | 368 |
|
| Income tax refund receivable | 18,455 |
| | 23,704 |
|
| Inventories and supplies | 18,992 |
| | 18,430 |
|
| Assets held for sale | 2,907 |
| | 19,268 |
|
| Prepaid taxes, licenses, insurance and other | 51,441 |
| | 63,958 |
|
| Deferred income taxes | 44,861 |
| | 46,833 |
|
| Current portion of notes receivable | 9,202 |
| | 7,210 |
|
| Total current assets | 800,408 |
| | 734,032 |
|
| Property and equipment, at cost: | | | |
| Revenue and service equipment | 2,061,835 |
| | 1,942,423 |
|
| Land | 122,835 |
| | 117,929 |
|
| Facilities and improvements | 268,025 |
| | 248,724 |
|
| Furniture and office equipment | 67,740 |
| | 61,396 |
|
| Total property and equipment | 2,520,435 |
| | 2,370,472 |
|
| Less: accumulated depreciation and amortization | 978,305 |
| | 922,665 |
|
| Net property and equipment | 1,542,130 |
| | 1,447,807 |
|
| Other assets | 41,855 |
| | 57,166 |
|
| Intangible assets, net | 299,933 |
| | 316,747 |
|
| Goodwill | 253,256 |
| | 253,256 |
|
| Total assets | $ | 2,937,582 |
| | $ | 2,809,008 |
|
| LIABILITIES AND STOCKHOLDERS’ EQUITY | | | |
| Current liabilities: | | | |
| Accounts payable | $ | 160,186 |
| | $ | 118,014 |
|
| Accrued liabilities | 100,329 |
| | 110,745 |
|
| Current portion of claims accruals | 81,251 |
| | 75,469 |
|
| Current portion of long-term debt and obligations under capital leases (a) | 74,347 |
| | 75,056 |
|
| Fair value of guarantees | — |
| | 366 |
|
| Current portion of fair value of interest rate swaps | 6,109 |
| | 4,718 |
|
| Total current liabilities | 422,222 |
| | 384,368 |
|
| Revolving line of credit | 57,000 |
| | 17,000 |
|
| Long-term debt and obligations under capital leases, less current portion (a) | 1,029,719 |
| | 1,246,764 |
|
| Claims accruals, less current portion | 143,693 |
| | 118,582 |
|
| Fair value of interest rate swaps, less current portion | — |
| | 7,050 |
|
| Deferred income taxes | 480,640 |
| | 484,200 |
|
| Securitization of accounts receivable | 334,000 |
| | 264,000 |
|
| Other liabilities | 14 |
| | 3,457 |
|
| Total liabilities | 2,467,288 |
| | 2,525,421 |
|
| Stockholders' equity: | | | |
| Class A common stock | 911 |
| | 883 |
|
| Class B common stock | 510 |
| | 525 |
|
| Additional paid-in capital | 781,124 |
| | 759,408 |
|
| Accumulated deficit | (310,017 | ) | | (471,169 | ) |
| Accumulated other comprehensive loss | (2,336 | ) | | (6,162 | ) |
| Noncontrolling interest | 102 |
| | 102 |
|
| Total stockholders' equity | 470,294 |
| | 283,587 |
|
| Total liabilities and stockholders' equity | $ | 2,937,582 |
| | $ | 2,809,008 |
|
Note to Condensed Consolidated Balance Sheets:
| |
| (a) | Total debt and capital lease obligations as of December 31, 2014 includes $500.0 million net carrying value of first lien term loan A tranche, $396.1 million net carrying value of the first lien term loan B tranche and $208.0 million of other secured indebtedness and capital lease obligations. Total debt and capital lease obligations as of December 31, 2013 includes $229.0 million net carrying value of the first lien term loan B-1 tranche, $410.0 million net carrying value of the first lien term loan B-2 tranche, $493.8 million net carrying value of senior second priority secured notes, and $189.1 million of other secured indebtedness and capital lease obligations. See note (d) to the Adjusted EPS Reconciliation for further discussion related to long-term debt balances and transactions. |
CONSOLIDATED STATEMENTS OF CASH FLOWS (UNAUDITED)
YEARS ENDED DECEMBER 31, 2014 AND 2013
(In thousands)
|
| | | | | | | |
| | Year Ended December 31, |
| | 2014 | | 2013 |
| Cash flows from operating activities: | | | |
| Net income | $ | 161,152 |
| | $ | 155,422 |
|
| Adjustments to reconcile net income to net cash provided by operating activities: | | | |
| Depreciation and amortization of property, equipment and intangibles | 237,936 |
| | 242,822 |
|
| Amortization of debt issuance costs, original issue discount, and losses on terminated swaps | 10,407 |
| | 7,247 |
|
| Gain on disposal of property and equipment, less write-off of totaled tractors | (23,236 | ) | | (21,574 | ) |
| Gain on sale of real property | (3,018 | ) | | (6,876 | ) |
| Impairments | 2,308 |
| | — |
|
| Equity losses of investee | — |
| | 537 |
|
| Deferred income taxes | (3,980 | ) | | 102,290 |
|
| Provision for losses on accounts receivable | 2,844 |
| | 1,370 |
|
| Non-cash equity compensation | 5,396 |
| | 4,645 |
|
| Non-cash loss on debt extinguishment and write-offs of deferred financing costs and original issue discount | 11,994 |
| | 5,540 |
|
| Income effect of mark-to-market adjustment of interest rate swaps | (155 | ) | | 805 |
|
| Interest on Central stockholders loan receivable, pre-acquisition | — |
| | (53 | ) |
| Increase (decrease) in cash resulting from changes in: | | | |
| Accounts receivable | (63,407 | ) | | (16,613 | ) |
| Inventories and supplies | (562 | ) | | (912 | ) |
| Prepaid expenses and other current assets | 17,802 |
| | (12,013 | ) |
| Other assets | 14,745 |
| | 6,296 |
|
| Accounts payable, accrued and other liabilities | 25,555 |
| | 4,571 |
|
| Net cash provided by operating activities | 395,781 |
| | 473,504 |
|
| Cash flows from investing activities: | | | |
| Decrease in restricted cash | 5,212 |
| | 845 |
|
| Change in restricted investments | 862 |
| | (3,539 | ) |
| Proceeds from sale of property and equipment | 133,020 |
| | 119,158 |
|
| Capital expenditures | (305,966 | ) | | (318,271 | ) |
| Payments received on notes receivable | 5,481 |
| | 3,868 |
|
| Expenditures on assets held for sale | (4,053 | ) | | (18,415 | ) |
| Payments received on assets held for sale | 25,326 |
| | 53,486 |
|
| Payments received on equipment sale receivables | 368 |
| | 1,450 |
|
| Acquisition of Central, net of debt repayment | — |
| | (150,302 | ) |
| Net cash used in investing activities | (139,750 | ) | | (311,720 | ) |
| Cash flows from financing activities: | | | |
| Repayment of long-term debt and capital leases | (1,224,628 | ) | | (236,388 | ) |
| Proceeds from long-term debt | 900,000 |
| | 26,267 |
|
| Payment of deferred loan costs | (11,783 | ) | | (2,183 | ) |
| Net borrowings on revolving line of credit | 40,000 |
| | 14,469 |
|
| Borrowings under accounts receivable securitization | 119,000 |
| | 184,000 |
|
| Repayment of accounts receivable securitization | (49,000 | ) | | (124,000 | ) |
| Distribution to Central stockholders, pre-acquisition | — |
| | (2,499 | ) |
| Issuance of Central stockholders' loan receivable, pre-acquisition | — |
| | (30,000 | ) |
| Proceeds from exercise of stock options and issuance of employee stock purchase plan shares | 12,604 |
| | 13,945 |
|
| Income tax benefit from exercise of stock options | 3,730 |
| | 187 |
|
| Net cash used in financing activities | (210,077 | ) | | (156,202 | ) |
| Increase in cash and cash equivalents | 45,954 |
| | 5,582 |
|
| Cash and cash equivalents at beginning of period | 59,178 |
| | 53,596 |
|
| Cash and cash equivalents at end of period | $ | 105,132 |
| | $ | 59,178 |
|
| | | | |
|
| | | | | | | |
| | | | |
| | | | |
| Supplemental disclosures of cash flow information: | | | |
| Cash paid during the period for: | | | |
| Interest | $ | 89,341 |
| | $ | 103,238 |
|
| Income taxes | $ | 82,776 |
| | $ | 20,625 |
|
| | | | |
| Non-cash investing activities: | | | |
| Equipment purchase accrual | $ | 35,831 |
| | $ | 7,710 |
|
| Notes receivable from sale of assets | $ | 5,431 |
| | $ | 8,089 |
|
| Equipment sales receivables | $ | 288 |
| | $ | 1,252 |
|
| | | | |
| Non-cash financing activities: | | | |
| Capital lease additions | $ | 101,581 |
| | $ | 85,094 |
|
| Accrued deferred loan costs | $ | 177 |
| | $ | — |
|
| Insurance premium and software notes payable | $ | 37 |
| | $ | 9,189 |
|
| Non-cash distribution to Central stockholders in satisfaction of stockholders' loans receivable, pre-acquisition | $ | — |
| | $ | 22,315 |
|
| Non-cash exercise of Central stock options in exchange for stockholders' loans receivable, pre-acquisition | $ | — |
| | $ | 3,415 |
|
| Cancellation of Central stockholders' loans receivable at closing of acquisition | $ | — |
| | $ | 33,295 |
|