|
| | |
| | |
| | P.O. Box 29243 - Phoenix, Arizona 85038-9243 |
| | 2200 S. 75th Avenue - Phoenix, Arizona 85043 |
| | (602) 269-9700 |
| | |
October 24, 2016
Dear Fellow Stockholders of Swift Transportation Company (NYSE: SWFT),
A summary of our key results for the three and nine months ended September 30th is shown below:
|
| | | | | | | | | | | | | | | | | | | | | | | |
| | Three Months Ended September 30, | | Nine Months Ended September 30, |
| | 2016 | | 2015 | | 2014 | | 2016 | | 2015 | | 2014 |
| | Unaudited |
| | (Dollars in millions, except per share data) |
| Operating Revenue | $ | 1,013.2 |
| | $ | 1,065.0 |
| | $ | 1,074.9 |
| | $ | 2,992.9 |
| | $ | 3,139.5 |
| | $ | 3,159.2 |
|
Revenue xFSR (1)(2) | $ | 929.7 |
| | $ | 955.0 |
| | $ | 881.8 |
| | $ | 2,772.1 |
| | $ | 2,785.7 |
| | $ | 2,575.2 |
|
| | | | | | | | | | | | |
| Operating Ratio | 93.9 | % | | 93.0 | % | | 90.9 | % | | 93.7 | % | | 92.1 | % | | 92.5 | % |
Adjusted Operating Ratio (2) | 92.2 | % | | 91.7 | % | | 88.2 | % | | 92.5 | % | | 90.7 | % | | 90.2 | % |
| | | | | | | | | | | | |
| Diluted EPS | $ | 0.28 |
| | $ | 0.25 |
| | $ | 0.35 |
| | $ | 0.83 |
| | $ | 0.87 |
| | $ | 0.72 |
|
Adjusted EPS (2) | $ | 0.34 |
| | $ | 0.31 |
| | $ | 0.39 |
| | $ | 0.92 |
| | $ | 0.96 |
| | $ | 0.84 |
|
| | | | | | | | | | | | |
1 Revenue xFSR is operating revenue, excluding fuel surcharge revenue |
2 See GAAP to non-GAAP reconciliation in the schedules following this letter |
Key Highlights for the Third Quarter 2016:
(discussed in more detail below, including GAAP to non-GAAP reconciliations)
Consolidated
| |
| • | Diluted EPS and Adjusted EPS each increased by $0.03 year over year |
| |
| • | We repurchased $25.0 million, or 1.3 million shares, of our Class A common stock in the third quarter |
| |
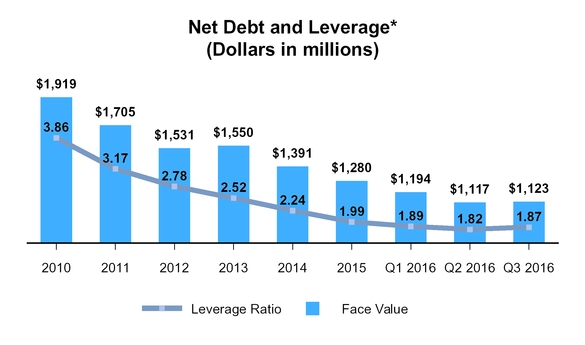
| • | Net Debt and Net Leverage Ratio were $1,123.1 million and 1.87, respectively, as of September 30, 2016 |
| |
| • | Consolidated Average Operational Truck Count declined by 110 trucks from the second quarter of 2016, and 581 trucks year over year in the third quarter, to drive improvements in asset utilization as the truckload market continued to be challenging throughout the third quarter |
| |
| • | Jerry Moyes, Swift's Founder and Chief Executive Officer, announced his retirement at the end of 2016. Richard Stocking, Swift’s President and Chief Operating Officer, was unanimously appointed by the Board of Directors to serve with Mr. Moyes as Co-Chief Executive Officer until December 31, 2016, and to replace Mr. Moyes as President and Chief Executive Officer effective January 1, 2017. |
| |
| • | Mr. Moyes' retirement package resulted in a one-time $7.1 million charge, comprised of consulting fees to be paid in cash and modified equity awards, which was recorded in September |
| |
| • | Favorable discrete tax items resulted in an effective tax rate of 32.5% |
Truckload
| |
| • | Truckload Revenue xFSR for the third quarter of 2016 was $469.1 million, compared to $489.5 million in the third quarter of 2015 |
| |
| • | Excess carrier capacity and pricing pressure continue to challenge the marketplace |
| |
| • | Total loaded miles driven within the period decreased 1.8% year over year, primarily due to a 3.2% reduction in Average Operational Truck Count, partially offset by a 1.4% increase in loaded miles per tractor per week |
| |
| • | Deadhead Percentage improved 50 basis points year over year, and 20 basis points sequentially |
| |
| • | Operating Ratio and Adjusted Operating Ratio for the third quarter of 2016 were 90.8% and 89.8%, respectively |
Dedicated
| |
| • | Dedicated Revenue xFSR grew 8.9% year over year to $234.4 million |
| |
| • | Weekly Revenue xFSR per Tractor improved 8.1% year over year, due to improvements in pricing and freight mix |
| |
| • | Average Operational Truck Count increased 130 trucks sequentially, due to growth with our existing dedicated customer base |
| |
| • | Operating Ratio and Adjusted Operating Ratio for the third quarter of 2016 were 87.8% and 87.1%, respectively |
Swift Refrigerated
| |
| • | Swift Refrigerated Revenue xFSR for the third quarter of 2016 was $75.1 million, compared to $81.0 million in the third quarter of 2015 |
| |
| • | Weekly Revenue xFSR per Tractor increased 2.9% year over year, due to a significant increase in asset utilization |
| |
| • | Deadhead Percentage improved 40 basis points year over year, through a refinement and re-engineering of our network |
| |
| • | Operating Ratio and Adjusted Operating Ratio for the third quarter of 2016 were 97.9% and 97.7%, respectively |
Intermodal
| |
| • | Intermodal Revenue xFSR for the third quarter of 2016 was $83.0 million, compared to $88.1 million in the third quarter of 2015 |
| |
| • | Revenue xFSR per load increased 1.4% year over year, even though the collective intermodal market experienced pricing deterioration |
| |
| • | Load Counts were inconsistent and pressured throughout the quarter |
| |
| • | Maintaining a proper cost infrastructure, while also improving operational efficiencies continues to remain our primary focus |
| |
| • | Operating Ratio and Adjusted Operating Ratio for the third quarter of 2016 were both 99.6% |
As we have discussed several times throughout this year, the truckload market has been very challenged thus far in 2016. Many of the same headwinds we have previously disclosed remained throughout the third quarter, as the presence of excess industry capacity, excess customer inventories, and sluggish demand have combined to cause persistent pressure on freight volumes and pricing.
In response to these pressures, last quarter we outlined three main initiatives to help offset some of the negative impact of these challenging market dynamics. These initiatives were: 1) closely monitoring and adjusting our truckload fleet size, to ensure our fleet's assets maintain proper utilization levels, 2) increasing our participation in the spot market, to improve network balance and help offset the lack of available freight in certain markets, and 3) a total commitment and resolve to control costs and eliminate all unnecessary spending. We are proud of our organization's
dedication to these countermeasures, and are pleased with the efforts and results they have helped generate in the third quarter.
We reduced our Consolidated Average Operational Truck Count year over year in the third quarter by 581 trucks, and 110 trucks when compared to the second quarter of 2016. Our Truckload and Swift Refrigerated segments experienced the majority of this reduction, which helped drive year over year improvements in our loaded miles per tractor per week in each segment. Truckload's third quarter loaded miles per tractor per week also increased 0.9% sequentially when compared to the second quarter. Through responsible spot market participation and network engineering, we experienced success in partially offsetting the lack of available freight in select markets. The benefits of these efforts are evident in the 50 basis point and 40 basis point year over year Deadhead Percentage improvements produced in our Truckload and Swift Refrigerated segments, respectively. We also believe these efforts have helped improve driver retention and satisfaction. We continue to closely monitor our spot market activity and expect to reduce this participation in the coming months, as our sales team remains heavily focused on increasing freight levels with new and existing contractual customers.
Cost control remains a key focus. As we mentioned last quarter, these endeavors include: streamlining processes, headcount reductions, postponement of non-critical system implementations, and reducing expenditures. Our resolved commitment to cost reduction within our Intermodal segment has allowed the segment to produce similar year over year operating ratio results while year over year Load Counts decreased by approximately 3,300 loads. We remain confident that as the Electronic Logging Device (ELD) mandate draws closer, our improved cost structure will allow us to be well-positioned to take full advantage. Our Dedicated segment has also seen great benefits from these initiatives as we continue to grow our dedicated fleet while also expanding the segment's margins. We are also pleased to report our continued success with strengthening our balance sheet and returning cash to shareholders as we repurchased $25.0 million of our outstanding Class A common stock in the third quarter, funded through cash flows from operations, while also keeping our Net Debt and Net Leverage Ratio at healthy levels at $1,123.1 million and 1.87, respectively.
On September 8, 2016, we announced the retirement of our Founder and Chief Executive Officer, Jerry Moyes effective December 31,2016. The entire Swift organization is grateful and appreciative of Jerry and the Moyes family for the incredible opportunity they have created for countless employees, customers, and suppliers to Swift during his tenure. Jerry's contribution has been immense and his influence will be forever felt. Over the last several years, Jerry and the Board of Directors have thoughtfully prepared for this leadership succession and have unanimously appointed Richard Stocking as his successor. Richard has held a variety of significant positions at Swift over the course of his 25 year tenure with the company, and the transition is expected to be seamless.
Third Quarter Results by Reportable Segment
Truckload Segment
Our Truckload segment consists of one-way movements over irregular routes throughout the United States, Mexico, and Canada. This service uses both company and owner-operator tractors with dry van, flatbed, and other specialized trailing equipment.
|
| | | | | | | | | | | |
| | Three Months Ended September 30, |
| | 2016 | | 2015 | | 2014 |
| | Unaudited |
Operating Revenue (1) | $ | 516.7 |
| | $ | 552.8 |
| | $ | 570.9 |
|
Revenue xFSR (1)(2)(3) | $ | 469.1 |
| | $ | 489.5 |
| | $ | 460.0 |
|
| | | | | | |
| Operating Ratio | 90.8 | % | | 89.7 | % | | 87.5 | % |
Adjusted Operating Ratio (3) | 89.8 | % | | 88.4 | % | | 84.5 | % |
| | | | | | |
| Weekly Revenue xFSR per Tractor | $ | 3,460 |
| | $ | 3,493 |
| | $ | 3,449 |
|
Total Loaded Miles (4) | 256,532 |
| | 261,339 |
| | 254,320 |
|
| | | | | | |
| Average Operational Truck Count | 10,317 |
| | 10,662 |
| | 10,147 |
|
| Deadhead Percentage | 11.7 | % | | 12.2 | % | | 11.7 | % |
| | | | | | |
1 In millions |
2 Revenue xFSR is operating revenue, excluding fuel surcharge revenue |
3 See GAAP to non-GAAP reconciliation in the schedules following this letter |
4 Total Loaded Miles presented in thousands |
Our Truckload Revenue xFSR for the third quarter of 2016 was $469.1 million, compared to $489.5 million in the third quarter of 2015. This change was primarily driven by a 2.3% year over year decrease in Revenue xFSR per loaded mile and a 1.8% reduction in loaded miles driven within the period. Weekly Revenue xFSR per Tractor decreased 0.9% to $3,460 driven by the aforementioned 2.3% decrease in Revenue xFSR per loaded mile, partially offset by a 1.4% increase in loaded miles per tractor per week.
For the third quarter of 2016, the Operating Ratio in our Truckload segment was 90.8% compared to 89.7% for the third quarter of 2015, while the Adjusted Operating Ratio was 89.8% and 88.4%, respectively, for the same periods. The change in Operating Ratio metrics was primarily driven by the excess carrier capacity and corresponding lackluster pricing environment that continued to burden the market throughout the quarter, combined with the weakening of the used truck market, which resulted in an increase in depreciation expense due to a change in the projected residual values of certain trucks and a decrease in gain on disposal of property and equipment.
To help combat these difficult market headwinds, we continued to implement several cost control and efficiency-improving countermeasures. We are confident these efforts have lessened the negative financial impact caused by the market headwinds discussed above. Examples of these countermeasures include: right-sizing the fleet to drive both year over year and sequential improvements in asset utilization, improving freight and equipment network balance resulting in reductions in Deadhead Percentage on both a year over year and sequential basis, continued focus on driver safety and satisfaction, as well as several cost control initiatives. We will remain committed to these initiatives as we work closely with our customer base to increase the freight levels we are tendered.
Dedicated Segment
Through our Dedicated segment, we devote equipment and offer tailored solutions under long-term contracts with customers. This dedicated business utilizes refrigerated, dry van, flatbed, and other specialized trailing equipment.
|
| | | | | | | | | | | |
| | Three Months Ended September 30, |
| | 2016 | | 2015 | | 2014 |
| | Unaudited |
Operating Revenue (1) | $ | 248.8 |
| | $ | 234.5 |
| | $ | 238.0 |
|
Revenue xFSR (1)(2)(3) | $ | 234.4 |
| | $ | 215.2 |
| | $ | 197.7 |
|
| | | | | | |
| Operating Ratio | 87.8 | % | | 92.5 | % | | 90.0 | % |
Adjusted Operating Ratio (3) | 87.1 | % | | 91.8 | % | | 88.0 | % |
| | | | | | |
| Weekly Revenue xFSR per Tractor | $ | 3,603 |
| | $ | 3,333 |
| | $ | 3,154 |
|
| Average Operational Truck Count | 4,951 |
| | 4,913 |
| | 4,769 |
|
| | | | | | |
1 In millions |
2 Revenue xFSR is operating revenue, excluding fuel surcharge revenue |
3 See GAAP to non-GAAP reconciliation in the schedules following this letter |
Dedicated Revenue xFSR grew 8.9% to $234.4 million in the third quarter of 2016 compared to the third quarter of 2015. This growth was driven by an 8.1% increase in Weekly Revenue xFSR per Tractor and a 0.8% year over year increase in our Average Operational Truck Count. The third quarter's Weekly Revenue xFSR per Tractor results illustrate our dedicated leadership team's collective efforts to improve pricing, freight mix, and underperforming accounts. These efforts, along with several safety and cost control initiatives, have helped enable this segment to increase fleet count while also expanding margins to produce some of the strongest results for this segment.
As we disclosed last quarter, we were recently awarded several growth opportunities with our existing dedicated customer base and have since begun implementing this business. As a result, our third quarter Average Operational Truck Count increased 130 trucks sequentially when compared to the second quarter of 2016. As expected, this growth has been accretive to the financial results of the Dedicated segment. We expect further truck count growth in the fourth quarter, excluding seasonal surge support from Truckload, of approximately 20-30 trucks.
For the third quarter of 2016, the Operating Ratio and Adjusted Operating Ratio in our Dedicated segment each improved 470 basis points to 87.8% compared to 92.5% from the prior year, and 87.1% compared to 91.8%, respectively. The improvement in Operating Ratio metrics was primarily driven by the growth, pricing and safety improvements mentioned above.
Swift Refrigerated Segment
Our Swift Refrigerated segment represents shipments for customers that require temperature-controlled trailers. These shipments include one-way movements over irregular routes and dedicated truck operations.
|
| | | | | | | | | | | |
| | Three Months Ended September 30, |
| | 2016 | | 2015 | | 2014 |
| | Unaudited |
Operating Revenue (1) | $ | 85.0 |
| | $ | 93.0 |
| | $ | 100.4 |
|
Revenue xFSR (1)(2)(3) | $ | 75.1 |
| | $ | 81.0 |
| | $ | 80.6 |
|
| | | | | | |
| Operating Ratio | 97.9 | % | | 97.2 | % | | 96.8 | % |
Adjusted Operating Ratio (3) | 97.7 | % | | 96.8 | % | | 96.0 | % |
| | | | | | |
| Weekly Revenue xFSR per Tractor | $ | 3,568 |
| | $ | 3,466 |
| | $ | 3,510 |
|
| Average Operational Truck Count | 1,602 |
| | 1,778 |
| | 1,747 |
|
| Deadhead Percentage | 14.0 | % | | 14.4 | % | | 15.9 | % |
| | | | | | |
1 In millions |
2 Revenue xFSR is operating revenue, excluding fuel surcharge revenue |
3 See GAAP to non-GAAP reconciliation in the schedules following this letter |
Our Swift Refrigerated Revenue xFSR for the third quarter of 2016 was $75.1 million, versus $81.0 million in the third quarter of 2015. This change was primarily driven by a 4.1% reduction in loaded miles driven within the period, and a 3.2% decrease in Revenue xFSR per loaded mile. As we mentioned during our mid-third quarter conference call, this year over year decrease in Revenue xFSR per loaded mile was expected, as refrigerated shippers took advantage of the spot market, causing sustained pricing pressure.
In an effort to offset these market dynamics, our sales and operations teams continue to work diligently to secure quality freight, improve asset utilization, and eliminate unnecessary costs. These collective efforts have helped offset a portion of these market challenges as the refrigerated segment's Weekly Revenue xFSR per Tractor has increased 2.9% year over year to $3,568, primarily due to a 6.5% year over year increase in the number of loaded miles per tractor per week. We continued to refine and engineer our refrigerated network throughout the third quarter, allowing for trucks and freight to be more efficiently matched. As a result, our third quarter Deadhead Percentage improved 40 basis points year over year, which resulted in reduced expense while also improving driver satisfaction and retention.
For the third quarter of 2016, the Operating Ratio in our Swift Refrigerated segment was 97.9% compared to 97.2% for the third quarter of 2015, while the Adjusted Operating Ratio was 97.7% and 96.8%, respectively, for the same periods. The increase in the Operating Ratio metrics was primarily driven by the reduction in Revenue xFSR per loaded mile combined with increased insurance and claims expense, partially offset by the operational and cost control initiatives mentioned above.
Intermodal Segment
Our Intermodal segment includes revenue generated by freight moving over the rail in our containers and other trailing equipment, combined with revenue for drayage to transport loads between the railheads and customer locations.
|
| | | | | | | | | | | |
| | Three Months Ended September 30, |
| | 2016 | | 2015 | | 2014 |
| | Unaudited |
Operating Revenue (1) | $ | 92.3 |
| | $ | 101.0 |
| | $ | 100.0 |
|
Revenue xFSR (1)(2)(3) | $ | 83.0 |
| | $ | 88.1 |
| | $ | 80.1 |
|
| | | | | | |
| Operating Ratio | 99.6 | % | | 99.3 | % | | 98.1 | % |
Adjusted Operating Ratio (3) | 99.6 | % | | 99.2 | % | | 97.6 | % |
| | | | | | |
| Load Counts | 43,787 |
| | 47,107 |
| | 44,275 |
|
| Average Container Counts | 9,138 |
| | 9,150 |
| | 8,778 |
|
| | | | | | |
1 In millions |
2 Revenue xFSR is operating revenue, excluding fuel surcharge revenue |
3 See GAAP to non-GAAP reconciliation in the schedules following this letter |
Intermodal Revenue xFSR was $83.0 million in the third quarter of 2016 compared to $88.1 million in the third quarter of 2015. This change was primarily driven by a 7.0% decrease in Load Counts, partially offset by a 1.4% increase in Revenue xFSR per load. Securing intermodal freight that met our internal pricing requirements continued to be a challenge during the third quarter. As we discussed on our mid-third quarter conference call, the intermodal freight market showed some signs of strengthening in August, but this momentum unfortunately slowed in September, as overall U.S intermodal rail traffic decreased on a year over year basis in September. This reduction resulted in inconsistent load volumes within our network, particularly in many of our interior markets, causing container and freight imbalances, and further exacerbating pricing pressures as an increased number of intermodal providers continued with their attempts to balance their networks and gain volumes through aggressive pricing. Our Container-on-Flat-Car (COFC) load count reductions of 4.4% closely mirrored that of the industry as a whole. We are pleased to be maintaining our market share while also remaining disciplined to our pricing approach, which enabled us to realize a 1.4% increase in Revenue xFSR per load, compared to the pricing decline experienced within the collective market.
For the third quarter of 2016, the Operating Ratio in our Intermodal segment was 99.6% compared to 99.3% for the third quarter of 2015, while the Adjusted Operating Ratio was 99.6% compared to 99.2% for the same periods. Although we are not satisfied with these results, we are confident our improved cost infrastructure and operational efficiencies are helping to offset the impact of the increasingly challenging market environment to produce similar year over year operating ratio results. We remain confident that as the ELD mandate draws closer, we will be well-positioned to take full advantage, as we expect this mandate to tighten capacity and improve pricing economics.
Other Non-Reportable Segments
Our other non-reportable segments include our logistics and brokerage services, as well as support services that our subsidiaries provide to customers and owner-operators, including repair and maintenance shop services, equipment leasing, and insurance. Also captured here is the intangible asset amortization related to the 2007 going-private transaction.
In the third quarter of 2016, combined revenues from the aforementioned services, before eliminations, decreased $14.4 million compared to the same period of 2015, primarily due to reductions in logistics freight volumes and services provided to owner-operators. The operating loss in the other non-reportable segment increased $15.2 million to $18.3 million during the third quarter of 2016, compared to the third quarter of 2015, primarily due the reductions in logistics freight volumes, and services provided to owner-operators mentioned above, and also includes
the $7.1 million one-time charge associated with the retirement of Swift's Founder and Chief Executive Officer Jerry Moyes.
Third Quarter Consolidated Operating and Other Expenses
The table below highlights some of our cost categories for the third quarter of 2016, compared to the third quarter of 2015 and the second quarter of 2016, showing each as a percent of Revenue xFSR. Fuel surcharge revenue can be volatile and is primarily dependent upon the cost of fuel and not specifically related to our non-fuel operational expenses. Therefore, we believe that Revenue xFSR is a better measure for analyzing our expenses and operating metrics.
|
| | | | | | | | | | | | | | | | | | | | |
| | | | | YOY | | | | | | QOQ |
| Q3'16 | | Q3'15 | | Variance 1 | (Dollars in millions) | Q3'16 | | Q2'16 | | Variance 1 |
| Unaudited | | Unaudited |
| $ | 1,013.2 |
| | $ | 1,065.0 |
| | -4.9 | % | Operating Revenue | $ | 1,013.2 |
| | $ | 1,011.9 |
| | 0.1 | % |
| $ | (83.5 | ) | | $ | (110.0 | ) | | -24.1 | % | Less: Fuel Surcharge Revenue | $ | (83.5 | ) | | $ | (76.4 | ) | | 9.2 | % |
| $ | 929.7 |
| | $ | 955.0 |
| | -2.6 | % | Revenue xFSR | $ | 929.7 |
| | $ | 935.4 |
| | -0.6 | % |
| | | | | | | | | | | |
| $ | 293.1 |
| | $ | 283.8 |
| | -3.3 | % | Salaries, Wages, & Benefits | $ | 293.1 |
| | $ | 287.1 |
| | -2.1 | % |
| 31.5 | % | | 29.7 | % | | -180bps |
| % of Revenue xFSR | 31.5 | % | | 30.7 | % | | -80bps |
|
| | | | | | | | | | | |
| $ | 91.8 |
| | $ | 102.7 |
| | 10.7 | % | Operating Supplies & Expenses | $ | 91.8 |
| | $ | 87.2 |
| | -5.2 | % |
| 9.9 | % | | 10.8 | % | | 90 | bps | % of Revenue xFSR | 9.9 | % | | 9.3 | % | | -60bps |
|
| | | | | | | | | | | |
| $ | 47.4 |
| | $ | 52.9 |
| | 10.4 | % | Insurance & Claims | $ | 47.4 |
| | $ | 45.8 |
| | -3.4 | % |
| 5.1 | % | | 5.5 | % | | 40 | bps | % of Revenue xFSR | 5.1 | % | | 4.9 | % | | -20bps |
|
| | | | | | | | | | | |
| $ | 7.1 |
| | $ | 8.2 |
| | 13.4 | % | Communication & Utilities | $ | 7.1 |
| | $ | 6.9 |
| | -2.6 | % |
| 0.8 | % | | 0.9 | % | | 10 | bps | % of Revenue xFSR | 0.8 | % | | 0.7 | % | | -10bps |
|
| | | | | | | | | | | |
| $ | 18.7 |
| | $ | 19.2 |
| | 2.9 | % | Operating Taxes & Licenses | $ | 18.7 |
| | $ | 18.6 |
| | -0.4 | % |
| 2.0 | % | | 2.0 | % | | — |
| % of Revenue xFSR | 2.0 | % | | 2.0 | % | | — |
|
| | | | | | | | | | | |
1 Positive numbers represent favorable variances. Negative numbers represent unfavorable variances. Variances are calculated based on the precision of the consolidated income statement, presented in thousands, included in the schedules following this letter. |
Salaries, wages, and benefits increased $9.3 million to $293.1 million during the third quarter of 2016, compared to the third quarter of 2015, primarily due to the one-time charge associated with the retirement of Swift's Founder and Chief Executive Officer Jerry Moyes, a year over year increase in driver pay rates and an increase in total miles driven by company drivers within the period, partially offset by a reduction in workers' compensation expense. Sequentially, salaries, wages, and benefits increased $6.0 million primarily due to the one-time retirement charge and increased driver pay rates mentioned above, partially offset by a reduction in employee benefits and workers' compensation expense.
Third quarter operating supplies and expenses decreased $11.0 million year over year, while also improving 90 basis points as a percentage of Revenue xFSR compared to the third quarter of 2015. These improvements were primarily due to decreases in legal settlement expenses, equipment maintenance expense, and driver hiring-related expenses.
Sequentially, operating supplies and expenses increased $4.5 million, during the third quarter of 2016 compared to the second quarter of 2016, primarily due to increases in equipment maintenance expense.
Insurance and claims expense decreased $5.5 million year over year, while also improving 40 basis points as a percentage of Revenue xFSR compared to the third quarter of 2015. Sequentially, insurance and claims expense increased $1.6 million during the third quarter of 2016, a 20 basis point increase expressed as a percentage of Revenue xFSR.
Fuel Expense
Fuel expense for the third quarter of 2016 was $90.5 million, a decrease of $12.6 million from the third quarter of 2015. The decrease was the result of lower fuel prices and improved fuel efficiency, partially offset by an increase in the number of miles driven by company drivers.
Sequentially, fuel expense increased $3.1 million during the third quarter of 2016 compared to the second quarter of 2016 primarily due to higher fuel prices, partially offset by improved fuel efficiency.
|
| | | | | | | | | | | | | | |
| Q3'16 | | Q3'15 | (Dollars in millions) | Q3'16 | | Q2'16 |
| Unaudited | | Unaudited |
| $ | 90.5 |
| | $ | 103.0 |
| Fuel Expense | $ | 90.5 |
| | $ | 87.4 |
|
| 8.9 | % | | 9.7 | % | % of Operating Revenue | 8.9 | % | | 8.6 | % |
Purchased Transportation
Purchased transportation includes payments to owner-operators, railroads, and other third parties we use for intermodal drayage and other brokered business.
|
| | | | | | | | | | | | | | |
| Q3'16 | | Q3'15 | (Dollars in millions) | Q3'16 | | Q2'16 |
| Unaudited | | Unaudited |
| $ | 280.0 |
| | $ | 299.9 |
| Purchased Transportation | $ | 280.0 |
| | $ | 283.6 |
|
| 27.6 | % | | 28.2 | % | % of Operating Revenue | 27.6 | % | | 28.0 | % |
Purchased transportation decreased $19.8 million year over year, primarily due to the decreases in intermodal and logistics volumes discussed above and the resulting reduction in payments to the rails and third party carriers, as well as a reduction in fuel reimbursements to owner-operators and other third parties resulting from lower fuel prices and fewer miles driven by owner-operators.
Sequentially, purchased transportation decreased $3.6 million during the third quarter of 2016 compared to the second quarter of 2016, primarily due to decreased logistics freight volumes, partially offset by an increase in fuel reimbursements to owner-operators and other third parties as a result of higher fuel prices.
Rental Expense and Depreciation & Amortization of Property and Equipment
Due to fluctuations in the number of tractors leased versus owned, we combine our rental expense with depreciation and amortization of property and equipment for analytical purposes.
|
| | | | | | | | | | | | | | |
| Q3'16 | | Q3'15 | (Dollars in millions) | Q3'16 | | Q2'16 |
| Unaudited | | Unaudited |
| $ | 57.0 |
| | $ | 59.1 |
| Rental Expense | $ | 57.0 |
| | $ | 57.1 |
|
| 6.1 | % | | 6.2 | % | % of Revenue xFSR | 6.1 | % | | 6.1 | % |
| | | | | | | |
| $ | 67.2 |
| | $ | 66.9 |
| Depreciation & Amortization of Property and Equipment | $ | 67.2 |
| | $ | 64.7 |
|
| 7.2 | % | | 7.0 | % | % of Revenue xFSR | 7.2 | % | | 6.9 | % |
| | | | | | | |
| $ | 124.2 |
| | $ | 126.0 |
| Combined Rental Expense and Depreciation | $ | 124.2 |
| | $ | 121.8 |
|
| 13.4 | % | | 13.2 | % | % of Revenue xFSR | 13.4 | % | | 13.0 | % |
Combined rental and depreciation expense in the third quarter of 2016 decreased $1.8 million to $124.2 million while increasing 20 basis points as percentage of Revenue xFSR from the third quarter of 2015.
Sequentially, combined rental and depreciation expense increased $2.4 million while also increasing 40 basis points as a percentage of Revenue xFSR from the second quarter of 2016. These increases were primarily due to a change made to the projected residual values of a particular group of trucks in August given the recent trends in the used truck market. This change resulted in an approximate $3.6 million increase in depreciation expense in the third quarter of 2016, which was partially offset by the sequential reduction in the average operational truck count of 110 trucks.
Gain or Loss on Disposal of Property and Equipment
The gain on disposal of property and equipment in the third quarter of 2016 was $5.6 million, compared to $9.8 million in the third quarter of 2015 and $5.0 million in the second quarter of 2016. For the fourth quarter of 2016, we expect gain on disposal of property and equipment to be approximately $3-$4 million.
Income Tax Expense
GAAP income tax expense for the third quarter of 2016 was $18.3 million, resulting in an effective tax rate of 32.5%, which is 400 basis points lower than anticipated primarily due to additional Federal income tax deductions realized as discrete items in the quarter. In the third quarter of 2015, our income tax provision was $21.3 million resulting in an effective tax rate of 37.0%, which was 150 basis points lower than anticipated primarily due to additional Federal employment tax credits realized as discrete items during the quarter.
During the third quarter, we completed a project relating to a Federal income tax deduction for the 2015 tax year as mentioned above. We anticipate securing additional Federal income tax deductions for other tax years in the fourth quarter of 2016 which is expected to result in a favorable tax rate for the period, but the exact amount is not yet known.
Interest Expense
Interest expense, which includes debt related interest expense, the amortization of deferred financing costs, and (for the third quarter of 2015) original issue discount, but excludes derivative interest expense on our interest rate swaps, decreased by $1.7 million in the third quarter of 2016 to $7.4 million, compared with $9.1 million for the third quarter of 2015. The decrease was due to our lower debt balances and our July 2015 amended and restated credit facility which contains more favorable interest rates and terms.
Debt Balances and Stock Repurchase
|
| | | | | | | | | | | |
| | June 30,
2016 | | Q3 2016 Changes | | September 30,
2016 |
| | Unaudited |
| | (In millions) |
| Unrestricted Cash | $ | 118.1 |
| | $ | (46.8 | ) | | $ | 71.3 |
|
| | | | | | |
A/R Securitization ($400mm) (1) | 300.0 |
| | — |
| | 300.0 |
|
| Revolver ($600mm) | 85.0 |
| | (35.0 | ) | | 50.0 |
|
Term Loan A (1) | 594.3 |
| | — |
| | 594.3 |
|
| Capital Leases & Other Debt | 255.8 |
| | (5.7 | ) | | 250.1 |
|
| Total Debt | $ | 1,235.1 |
| | $ | (40.7 | ) | | $ | 1,194.4 |
|
| | | | | | |
| Net Debt | $ | 1,117.0 |
| | $ | 6.1 |
| | $ | 1,123.1 |
|
| | | | | | |
| (1) Amounts presented represent face value | | | | | |
Our leverage ratio as of September 30, 2016 increased slightly to 1.87 compared to 1.82 as of June 30, 2016. This increase was primarily the result of the timing of lease financing versus cash capital expenditures thus far in 2016. As mentioned in the previous quarter, we expected our Net Debt balance to increase in the second half of the year as we expected our net cash capital expenditures to increase in the last six months of the year. We continue to expect our leverage ratio to stay below the December 31, 2015 level of 1.99. Further, this slight increase in Net Debt also included a $25.0 million repurchase of the Company’s outstanding shares of Class A common stock during the quarter.
* Data prior to Q3 2013 has not been recast for acquisitions
Cash Flow and Capital Expenditures
We continue to generate positive cash flows from operations. During the nine months ended September 30, 2016, we generated $328.8 million of cash flows from operating activities compared with $357.2 million during the same period of 2015. Cash used in investing activities was $50.7 million, of which capital expenditures were $141.3 million, partially offset by proceeds from the sale of property and equipment of $96.2 million. Cash used in financing activities for the nine months ended September 30, 2016 was $314.4 million including $131.1 million in repayment of long-term debt and capital leases, as well as the repurchase of $115.0 million of the Company’s outstanding Class A common stock during the period.
For the full year, we are expecting our net cash capital expenditures to be in the range of $125-$135 million. This range is lower than previously projected primarily because we have further reduced the amount of new tractors we are accepting for the balance of the year as we continue to manage the size of our fleet and utilization levels given prevailing market conditions. We have experienced production delays on a portion of our new trailer deliveries.
Summary
Despite the challenging freight environment that persisted throughout the third quarter of 2016, we remain committed to the key initiatives and countermeasures we believe are helping offset some of the financial impact of these market conditions. We are confident that our continued discipline and resolve will further enable us to be well-positioned within the market as the capacity / demand equation tightens throughout 2017. At this time we reconfirm our anticipated full year 2016 GAAP Diluted EPS to be within the range of $1.19-$1.29, and our Adjusted EPS to be within the range of $1.30-$1.40.
Once again, we would like to thank all of our hard-working employees and the professional owner-operators who have contracted with us, as well as our loyal customers and stockholders, for their continued support of Swift as we strive towards Delivering a Better LifeSM to our drivers, customers, and stockholders.
Conference Call Q&A Session
Swift Transportation's management team will host a Q&A session at 12:00 p.m. Eastern Time on Tuesday, October 25, 2016 to answer questions about the Company’s third quarter financial results. Please email your questions to Investor_Relations@swifttrans.com prior to 7:00 p.m. Eastern Time on Monday, October 24, 2016.
Participants may access the call using the following dial-in numbers:
U.S./Canada: (877) 897-8479
International/Local: (706) 501-7951
Conference ID: 91219916
The live webcast, letter to stockholders, transcript of the Q&A, and the replay of the earnings Q&A session can be accessed via our investor relations website at investor.swifttrans.com.
IR Contact:
Jason Bates
Vice President of Finance &
Investor Relations Officer
(623) 907-7335
Forward Looking Statements
This letter contains statements that may constitute forward-looking statements, which are based on information currently available, usually identified by words such as "anticipates," "believes," "estimates," "plans,'' "projects," "expects," "hopes," "intends," "will," "could," "should," "may," or similar expressions which speak only as of the date the statement was made. Such forward-looking statements are made pursuant to the safe harbor provisions of the Private Securities Litigation Reform Act of 1995. Such statements include, but are not limited to, statements concerning:
| |
| • | trends and expectations relating to our operations, expenses, other revenue, pricing, utilization, profitability, net debt, and related metrics; |
| |
| • | industry freight trends and the impact of new regulations; |
| |
| • | the future impact of recently awarded business in the Swift Refrigerated segment; |
| |
| • | our strategy and expected results relating to reducing expenses and improving our fleet utilization and Adjusted Operating Ratio; |
| |
| • | our plans with respect to our stock repurchase program; |
| |
| • | our participation in the spot market; |
| |
| • | our anticipated income tax deductions; |
| |
| • | our estimated capital expenditures, gains on dispositions, EPS, and Adjusted EPS for 2016; |
| |
| • | our expected 2016 effective tax rate before discrete items; and |
| |
| • | the timing and level of fleet size changes and equipment and container count; and the related impact on gains from disposals. |
Such forward-looking statements are inherently uncertain, and are based upon the current beliefs, assumptions, and expectations of Company management and current market conditions, which are subject to significant risks and uncertainties as set forth in the Risk Factors section of our Annual Report on Form 10-K for the year ended December 31, 2015. As to the Company’s business and financial performance, the following factors, among others, could cause actual results to differ materially from those in forward-looking statements:
| |
| • | economic conditions, including future recessionary economic cycles and downturns in customers’ business cycles, particularly in market segments and industries in which we have a significant concentration of customers; |
| |
| • | increasing competition from trucking, rail, intermodal, and brokerage competitors; |
| |
| • | our ability to execute or integrate any future acquisitions successfully; |
| |
| • | increases in driver compensation to the extent not offset by increases in freight rates and difficulties in driver recruitment and retention; |
| |
| • | additional risks arising from our contractual arrangements with owner-operators that do not exist with Company drivers; |
| |
| • | our ability to retain or replace key personnel; |
| |
| • | our dependence on third parties for intermodal and brokerage business; |
| |
| • | potential failure in computer or communications systems; |
| |
| • | seasonal factors such as severe weather conditions that increase operating costs; |
| |
| • | the regulatory environment in which we operate, including existing regulations and changes in existing regulations, or violations by us of existing or future regulations; |
| |
| • | the possible re-classification of owner-operators as employees; |
| |
| • | changes in rules or legislation by the National Labor Relations Board or Congress and/or union organizing efforts; |
| |
| • | our Compliance Safety Accountability safety rating; |
| |
| • | government regulations with respect to our captive insurance companies; |
| |
| • | uncertainties and risks associated with our operations in Mexico; |
| |
| • | a significant reduction in, or termination of, our trucking services by a key customer; |
| |
| • | our significant ongoing capital requirements; |
| |
| • | volatility in the price or availability of fuel, as well as our ability to recover fuel prices through our fuel surcharge program; |
| |
| • | fluctuations in new equipment prices or replacement costs, and the potential failure of manufacturers to meet their sale and trade-back obligations; |
| |
| • | the impact that our substantial leverage may have on the way we operate our business and our ability to service our outstanding debt, including compliance with our debt covenants; |
| |
| • | restrictions contained in our debt agreements; |
| |
| • | adverse impacts of insuring risk through our captive insurance companies, including our need to provide restricted cash and similar collateral for anticipated losses; |
| |
| • | potential volatility or decrease in the amount of earnings as a result of our claims exposure through our captive insurance companies; |
| |
| • | the potential impact of the significant number of shares of our common stock that is eligible for future sale; |
| |
| • | our intention to not pay dividends; |
| |
| • | conflicts of interest or potential litigation that may arise from other businesses owned by Jerry Moyes, including pledges of Swift stock and guarantees by Jerry Moyes related to other businesses; |
| |
| • | the significant amount of our stock and related control over the Company by Jerry Moyes; and |
| |
| • | related-party transactions between the Company and Jerry Moyes. |
You should understand that many important factors, in addition to those listed above and in our filings with the SEC, could impact us financially. As a result of these and other factors, actual results may differ from those set forth in the forward-looking statements and the prices of the Company's securities may fluctuate dramatically. The Company makes no commitment, and disclaims any duty, to update or revise any forward-looking statements to reflect future events, new information or changes in these expectations.
Use of Non-GAAP Measures
In addition to our GAAP results, this Letter to Stockholders also includes certain non-GAAP financial measures, as defined by the SEC. The terms "Adjusted EPS," "Adjusted Operating Ratio," and "Adjusted EBITDA," as we define them, are not presented in accordance with GAAP. These financial measures supplement our GAAP results in evaluating certain aspects of our business. We believe that using these measures improves comparability in analyzing our performance because they remove the impact of items from our operating results that, in our opinion, do not reflect our core operating performance. Management and the board of directors focus on Adjusted EPS, Adjusted Operating Ratio and Adjusted EBITDA as key measures of our performance, all of which are reconciled to the most comparable GAAP financial measures and further discussed below. We believe our presentation of these non-GAAP financial measures is useful because it provides investors and securities analysts the same information that we use internally for purposes of assessing our core operating performance and compliance with debt covenants.
Adjusted EPS, Adjusted Operating Ratio, and Adjusted EBITDA are not substitutes for their comparable GAAP financial measures, such as net income, cash flows from operating activities, operating margin, or other measures prescribed by GAAP. There are limitations to using non-GAAP financial measures. Although we believe that they improve comparability in analyzing our period to period performance, they could limit comparability to other companies in our industry if those companies define these measures differently. Because of these limitations, our non-GAAP financial measures should not be considered measures of income generated by our business or discretionary cash available to us to invest in the growth of our business. Management compensates for these limitations by primarily relying on GAAP results and using non-GAAP financial measures on a supplemental basis.
CONSOLIDATED INCOME STATEMENTS (UNAUDITED)
THREE AND NINE MONTHS ENDED SEPTEMBER 30, 2016 AND 2015
|
| | | | | | | | | | | | | | | |
| | Three Months Ended September 30, | | Nine Months Ended September 30, |
| | 2016 | | 2015 | | 2016 | | 2015 |
| | (In thousands, except per share data) |
| Operating revenue: | | | | | | | |
| Revenue, excluding fuel surcharge revenue | $ | 929,732 |
| | $ | 954,974 |
| | $ | 2,772,054 |
| | $ | 2,785,737 |
|
| Fuel surcharge revenue | 83,494 |
| | 109,999 |
| | 220,849 |
| | 353,784 |
|
| Operating revenue | 1,013,226 |
| | 1,064,973 |
| | 2,992,903 |
| | 3,139,521 |
|
| Operating expenses: | | | | | | | |
| Salaries, wages, and employee benefits | 293,098 |
| | 283,767 |
| | 868,831 |
| | 821,747 |
|
| Operating supplies and expenses | 91,750 |
| | 102,719 |
| | 269,185 |
| | 288,070 |
|
| Fuel | 90,464 |
| | 103,023 |
| | 252,822 |
| | 326,598 |
|
| Purchased transportation | 280,041 |
| | 299,866 |
| | 830,952 |
| | 883,354 |
|
| Rental expense | 57,004 |
| | 59,088 |
| | 170,326 |
| | 180,909 |
|
| Insurance and claims | 47,372 |
| | 52,877 |
| | 140,888 |
| | 139,390 |
|
| Depreciation and amortization of property and equipment | 67,245 |
| | 66,852 |
| | 198,884 |
| | 184,194 |
|
| Amortization of intangibles | 4,204 |
| | 4,204 |
| | 12,611 |
| | 12,611 |
|
| Gain on disposal of property and equipment | (5,620 | ) | | (9,825 | ) | | (16,909 | ) | | (23,987 | ) |
| Communication and utilities | 7,130 |
| | 8,236 |
| | 20,977 |
| | 23,134 |
|
| Operating taxes and licenses | 18,685 |
| | 19,245 |
| | 55,795 |
| | 55,104 |
|
| Total operating expenses | 951,373 |
| | 990,052 |
| | 2,804,362 |
| | 2,891,124 |
|
| Operating income | 61,853 |
| | 74,921 |
| | 188,541 |
| | 248,397 |
|
| Other expenses (income): | | | | | | | |
| Interest expense | 7,384 |
| | 9,130 |
| | 23,545 |
| | 29,627 |
|
| Derivative interest expense | — |
| | 68 |
| | — |
| | 3,972 |
|
| Interest income | (624 | ) | | (647 | ) | | (2,011 | ) | | (1,825 | ) |
| Loss on debt extinguishment | — |
| | 9,567 |
| | — |
| | 9,567 |
|
| Non-cash impairments of non-operating assets | — |
| | — |
| | — |
| | 1,480 |
|
| Legal settlements and reserves | — |
| | — |
| | 3,000 |
| | 6,000 |
|
| Other income, net | (1,223 | ) | | (752 | ) | | (3,093 | ) | | (2,341 | ) |
| Total other expenses (income), net | 5,537 |
| | 17,366 |
| | 21,441 |
| | 46,480 |
|
| Income before income taxes | 56,316 |
| | 57,555 |
| | 167,100 |
| | 201,917 |
|
| Income tax expense | 18,322 |
| | 21,274 |
| | 54,305 |
| | 76,842 |
|
| Net income | $ | 37,994 |
| | $ | 36,281 |
| | $ | 112,795 |
| | $ | 125,075 |
|
| Basic earnings per share | $ | 0.29 |
| | $ | 0.25 |
| | $ | 0.84 |
| | $ | 0.88 |
|
| Diluted earnings per share | $ | 0.28 |
| | $ | 0.25 |
| | $ | 0.83 |
| | $ | 0.87 |
|
| Shares used in per share calculations: | | | | | | | |
| Basic | 132,930 |
| | 142,801 |
| | 134,622 |
| | 142,535 |
|
| Diluted | 134,462 |
| | 144,132 |
| | 136,227 |
| | 144,238 |
|
NON-GAAP RECONCILIATION:
ADJUSTED EPS (UNAUDITED) (1)
THREE AND NINE MONTHS ENDED SEPTEMBER 30, 2016, 2015, AND 2014
Note: Since the numbers reflected in the table below are calculated on a per share basis, they may not foot due to rounding.
|
| | | | | | | | | | | | | | | | | | | | | | | |
| | Three Months Ended September 30, | | Nine Months Ended September 30, |
| | 2016 | | 2015 | | 2014 | | 2016 | | 2015 | | 2014 |
| Diluted earnings per share | $ | 0.28 |
| | $ | 0.25 |
| | $ | 0.35 |
| | $ | 0.83 |
| | $ | 0.87 |
| | $ | 0.72 |
|
| Adjusted for: | | | | | | | | | | | |
| Income tax expense | 0.14 |
| | 0.15 |
| | 0.17 |
| | 0.40 |
| | 0.53 |
| | 0.40 |
|
| Income before income taxes | 0.42 |
| | 0.40 |
| | 0.52 |
| | 1.23 |
| | 1.40 |
| | 1.11 |
|
Non-cash impairments (2) | — |
| | — |
| | 0.02 |
| | — |
| | — |
| | 0.02 |
|
Non-cash impairments of non-operating assets (3) | — |
| | — |
| | — |
| | — |
| | 0.01 |
| | — |
|
Loss on debt extinguishment (4) | — |
| | 0.07 |
| | 0.02 |
| | — |
| | 0.07 |
| | 0.09 |
|
Amortization of certain
intangibles (5) | 0.03 |
| | 0.03 |
| | 0.03 |
| | 0.09 |
| | 0.08 |
| | 0.08 |
|
Moyes retirement package (6) | 0.05 |
| | — |
| | — |
| | 0.05 |
| | — |
| | — |
|
| Adjusted income before income taxes | 0.50 |
| | 0.49 |
| | 0.58 |
| | 1.36 |
| | 1.56 |
| | 1.30 |
|
| Provision for income tax expense at effective rate | 0.16 |
| | 0.18 |
| | 0.19 |
| | 0.44 |
| | 0.59 |
| | 0.46 |
|
| Adjusted EPS | $ | 0.34 |
| | $ | 0.31 |
| | $ | 0.39 |
| | $ | 0.92 |
| | $ | 0.96 |
| | $ | 0.84 |
|
| |
| (1) | Our definition of the non-GAAP measure, Adjusted EPS, starts with (a) income (loss) before income taxes, the most comparable GAAP measure. We add the following items back to (a) to arrive at (b) adjusted income (loss) before income taxes: |
| |
| (i) | amortization of the intangibles from our 2007 going-private transaction, |
| |
| (ii) | non-cash impairments, |
| |
| (iii) | other special non-cash items, |
| |
| (iv) | excludable transaction costs, |
| |
| (v) | mark-to-market adjustments on our interest rate swaps, recognized in the income statement, |
| |
| (vi) | amortization of previous losses recorded in accumulated other comprehensive income (loss) ("AOCI") related to the interest rate swaps we terminated upon our IPO and refinancing transactions in December 2010, and |
| |
| (vii) | severance expense, including cash and equity award impact, related to the departure of certain executive leadership. |
We subtract income taxes, at the GAAP effective tax rate, from (b) to arrive at (c) adjusted earnings. Adjusted EPS is equal to (c) divided by weighted average diluted shares outstanding.
We believe that excluding the impact of derivatives provides for more transparency and comparability since these transactions have historically been volatile. Additionally, we believe that comparability of our performance is improved by excluding impairments that are unrelated to our core operations, as well as intangibles from the 2007 going-private transactions and other special items that are non-comparable in nature.
| |
| (2) | During the three months ended September 30, 2014, certain operations software was replaced and determined to be fully impaired. This resulted in a pre-tax impairment loss of $2.3 million. |
| |
| (3) | During the three months ended March 31, 2015, Swift Transportation Company ("the Company") recorded an impairment loss related to an uncollectible note receivable. In September 2013, the Company agreed to advance up to $2.3 million, pursuant to an unsecured promissory note, to an independent fleet contractor that transported freight on Swift's behalf. In March 2015, management became aware that the independent contractor violated various covenants outlined in the unsecured promissory note, which created an event of default that made the principal and accrued interest immediately due and payable. As a result of this event of default, as well as an overall decline in the independent contractor's financial condition, management re-evaluated the fair value of the unsecured promissory note. At March 31, 2015, management determined that the remaining balance due from the independent contractor to the Company was not collectible, which resulted in a $1.5 million pre-tax impairment that was recorded in "Non-cash impairments of non-operating assets" in the Company's consolidated income statements. |
| |
| (4) | In July 2015, the Company entered into a Fourth Amended and Restated Credit Agreement ("2015 Agreement"), which included a $680.0 million first lien Term Loan A tranche and a $600.0 million revolving credit line. The 2015 Agreement replaced the then-existing $450.0 million revolving credit line, as well as the first lien Term Loan A and Term Loan B tranches of the Third Amended and Restated Credit Agreement ("2014 Agreement"), which had outstanding principal balances at closing of $485.0 million and $395.0 million, respectively. The replacement of the 2014 Agreement resulted in a loss on debt extinguishment of $9.6 million, reflecting the write-off of the unamortized original issue discount and deferred financing fees related to the 2014 Agreement and the previous revolving credit line. |
NON-GAAP RECONCILIATION:
ADJUSTED EPS (UNAUDITED) (1) — CONTINUED
THREE AND NINE MONTHS ENDED SEPTEMBER 30, 2016, 2015, AND 2014
In June 2014, the Company entered into the 2014 Agreement, which included a $500.0 million delayed draw first lien Term Loan A tranche, a $400.0 million first lien Term Loan B tranche, and a $450.0 million revolving credit line. The 2014 Agreement replaced the then-existing $400.0 million revolving credit line, as well as the first lien Term Loan B-1 and B-2 tranches of the Second Amended and Restated Credit Agreement ("2013 Agreement"), which had outstanding principal balances at closing of $229.0 million and $370.9 million, respectively. The replacement of the 2013 Agreement resulted in a loss on debt extinguishment of $5.2 million, reflecting the write-off of the unamortized original issue discount and deferred financing fees related to the 2013 Agreement and the previous revolving credit line.
During the nine months ended September 30, 2014, the Company used cash on hand to repurchase $71.9 million in principal of its Senior Secured Second Priority Notes, with an average price of 109.05%, in the form of open market transactions. Including principal, premium, and accrued interest, the Company paid $80.5 million. The repurchase of the Senior Secured Second Priority Notes resulted in a loss on debt extinguishment of $2.9 million and $7.6 million during the three and nine months ended September 30, 2014, respectively, representing the write-off of the unamortized original issue discount.
| |
| (5) | Amortization of certain intangibles reflects the non-cash amortization expense relating to certain intangible assets identified in the 2007 going-private transaction through which Swift Corporation acquired Swift Transportation Co. |
| |
| (6) | In conjunction with the Company's September 8, 2016 announcement that Jerry Moyes would retire from his position as Chief Executive Officer effective December 31, 2016, the Company entered into an agreement with Mr. Moyes to memorialize the terms of his retirement. The Company has contracted with Mr. Moyes to serve as a non-employee consultant from January 1, 2017 through December 31, 2019, during which time the Company will pay Mr. Moyes a monthly consulting fee of $0.2 million in cash. Additionally, the Company modified the vesting terms and forfeiture conditions of Mr. Moyes' previously-granted equity awards. As a result of the terms of the agreement, the Company incurred a one-time expense in September 2016 totaling $7.1 million, consisting of $6.8 million in accrued consulting fees and $0.3 million for the impact of the equity award modifications. The amounts are included in "Salaries, wages, and employee benefits" within the non-reportable segments' income statement. |
NON-GAAP RECONCILIATION:
ADJUSTED OPERATING RATIO (UNAUDITED) (1)
THREE AND NINE MONTHS ENDED SEPTEMBER 30, 2016, 2015, AND 2014
|
| | | | | | | | | | | | | | | | | | | | | | | |
| | Three Months Ended September 30, | | Nine Months Ended September 30, |
| | 2016 | | 2015 | | 2014 | | 2016 | | 2015 | | 2014 |
| | (Dollars in thousands) |
| Operating revenue | $ | 1,013,226 |
| | $ | 1,064,973 |
| | $ | 1,074,880 |
| | $ | 2,992,903 |
| | $ | 3,139,521 |
| | $ | 3,159,224 |
|
| Less: Fuel surcharge revenue | (83,494 | ) | | (109,999 | ) | | (193,051 | ) | | (220,849 | ) | | (353,784 | ) | | (584,059 | ) |
| Revenue, excluding fuel surcharge revenue | $ | 929,732 |
| | $ | 954,974 |
| | $ | 881,829 |
| | $ | 2,772,054 |
| | $ | 2,785,737 |
| | $ | 2,575,165 |
|
| | | | | | | | | | | | |
| Operating expense | $ | 951,373 |
| | $ | 990,052 |
| | $ | 977,469 |
| | $ | 2,804,362 |
| | $ | 2,891,124 |
| | $ | 2,921,621 |
|
| Adjusted for: | | | | | | | | | | | |
| Fuel surcharge revenue | (83,494 | ) | | (109,999 | ) | | (193,051 | ) | | (220,849 | ) | | (353,784 | ) | | (584,059 | ) |
Amortization of certain
intangibles (2) | (3,912 | ) | | (3,912 | ) | | (3,912 | ) | | (11,736 | ) | | (11,736 | ) | | (11,736 | ) |
Non-cash impairments (3) | — |
| | — |
| | (2,308 | ) | | — |
| | — |
| | (2,308 | ) |
Moyes retirement package (4) | (7,079 | ) | | — |
| | — |
| | (7,079 | ) | | — |
| | — |
|
| Adjusted operating expense | $ | 856,888 |
| | $ | 876,141 |
| | $ | 778,198 |
| | $ | 2,564,698 |
| | $ | 2,525,604 |
| | $ | 2,323,518 |
|
| Operating Ratio | 93.9 | % | | 93.0 | % | | 90.9 | % | | 93.7 | % | | 92.1 | % | | 92.5 | % |
| Adjusted Operating Ratio | 92.2 | % | | 91.7 | % | | 88.2 | % | | 92.5 | % | | 90.7 | % | | 90.2 | % |
| |
| (1) | Our definition of the non-GAAP measure, Adjusted Operating Ratio, starts with (a) operating expense and (b) operating revenue, which are GAAP financial measures. We subtract the following items from (a) to arrive at (c) adjusted operating expense: |
| |
| (i) | fuel surcharge revenue, |
| |
| (ii) | amortization of the intangibles from our 2007 going-private transaction, |
| |
| (iii) | non-cash operating impairment charges, |
| |
| (iv) | other special non-cash items, |
| |
| (v) | excludable transaction costs, and |
| |
| (vi) | severance expense, including cash and equity award impact, related to the departure of certain executive leadership. |
We then subtract fuel surcharge revenue from (b) to arrive at (d) Revenue xFSR. Adjusted Operating Ratio is equal to (c) adjusted operating expense as a percentage of (d) Revenue xFSR.
We net fuel surcharge revenue against fuel expense in the calculation of our Adjusted Operating Ratio, thereby excluding fuel surcharge revenue from operating revenue in the denominator. Because fuel surcharge revenue is so volatile, we believe excluding it provides for more transparency and comparability. Additionally, we believe that comparability of our performance is improved by excluding impairments, non-comparable intangibles from our 2007 going-private transaction, and other special items.
| |
| (2) | Includes the items discussed in note (5) to the Non-GAAP Reconciliation: Adjusted EPS. |
| |
| (3) | Includes the item discussed in note (2) to the Non-GAAP Reconciliation: Adjusted EPS. |
| |
| (4) | Includes the item discussed in note (6) to the Non-GAAP Reconciliation: Adjusted EPS. |
NON-GAAP RECONCILIATION:
ADJUSTED EARNINGS BEFORE INTEREST, TAXES, DEPRECIATION
AND AMORTIZATION (UNAUDITED) (1)
THREE AND NINE MONTHS ENDED SEPTEMBER 30, 2016, 2015, AND 2014
|
| | | | | | | | | | | | | | | | | | | | | | | |
| | Three Months Ended September 30, | | Nine Months Ended September 30, |
| | 2016 | | 2015 | | 2014 | | 2016 | | 2015 | | 2014 |
| | (In thousands) |
| Net income | $ | 37,994 |
| | $ | 36,281 |
| | $ | 50,158 |
| | $ | 112,795 |
| | $ | 125,075 |
| | $ | 102,661 |
|
| Adjusted for: | | | | | | | | | | | |
| Depreciation and amortization of property and equipment | 67,245 |
| | 66,852 |
| | 54,369 |
| | 198,884 |
| | 184,194 |
| | 165,335 |
|
| Amortization of intangibles | 4,204 |
| | 4,204 |
| | 4,204 |
| | 12,611 |
| | 12,611 |
| | 12,611 |
|
| Interest expense | 7,384 |
| | 9,130 |
| | 20,372 |
| | 23,545 |
| | 29,627 |
| | 65,050 |
|
| Derivative interest expense | — |
| | 68 |
| | 1,756 |
| | — |
| | 3,972 |
| | 5,027 |
|
| Interest income | (624 | ) | | (647 | ) | | (777 | ) | | (2,011 | ) | | (1,825 | ) | | (2,235 | ) |
| Income tax expense | 18,322 |
| | 21,274 |
| | 23,890 |
| | 54,305 |
| | 76,842 |
| | 56,759 |
|
| Earnings before interest, taxes, depreciation and amortization (EBITDA) | $ | 134,525 |
| | $ | 137,162 |
| | $ | 153,972 |
| | $ | 400,129 |
| | $ | 430,496 |
| | $ | 405,208 |
|
Non-cash impairments (2) | — |
| | — |
| | 2,308 |
| | — |
| | — |
| | 2,308 |
|
Non-cash equity compensation (3) | 1,150 |
| | 1,735 |
| | 1,539 |
| | 4,691 |
| | 4,618 |
| | 3,892 |
|
Loss on debt extinguishment (4) | — |
| | 9,567 |
| | 2,854 |
| | — |
| | 9,567 |
| | 12,757 |
|
Non-cash impairments of non-operating assets (5) | — |
| | — |
| | — |
| | — |
| | 1,480 |
| | — |
|
| Adjusted earnings before interest, taxes, depreciation and amortization (Adjusted EBITDA) | $ | 135,675 |
| | $ | 148,464 |
| | $ | 160,673 |
| | $ | 404,820 |
| | $ | 446,161 |
| | $ | 424,165 |
|
| |
| (1) | Our definition of the non-GAAP measure, Adjusted EBITDA, starts with (a) net income (loss), the most comparable GAAP measure. We add the following items back to (a) to arrive at Adjusted EBITDA: |
| |
| (i) | depreciation and amortization, |
| |
| (ii) | interest and derivative interest expense, including fees and charges associated with indebtedness, net of interest income, |
| |
| (iv) | non-cash equity compensation expense, |
| |
| (vi) | other special non-cash items, and |
| |
| (vii) | excludable transaction costs. |
We believe that Adjusted EBITDA is a relevant measure for estimating the cash generated by our operations that would be available to cover capital expenditures, taxes, interest, and other investments and that it enhances an investor’s understanding of our financial performance. We use Adjusted EBITDA for business planning purposes and in measuring our performance. Our method of computing Adjusted EBITDA is consistent with that used in our debt covenants, specifically our leverage ratio, and is also routinely reviewed by management for that purpose.
| |
| (2) | Includes the item discussed in note (2) to the Non-GAAP Reconciliation: Adjusted EPS. |
| |
| (3) | Represents recurring non-cash equity compensation expense, on a pre-tax basis. In accordance with the terms of our senior credit agreement, this expense is added back in the calculation of Adjusted EBITDA for covenant compliance purposes. |
| |
| (4) | Includes the items discussed in note (4) to the Non-GAAP Reconciliation: Adjusted EPS. |
| |
| (5) | Includes the item discussed in note (3) to the Non-GAAP Reconciliation: Adjusted EPS. |
FINANCIAL INFORMATION BY SEGMENT (UNAUDITED)
THREE AND NINE MONTHS ENDED SEPTEMBER 30, 2016, 2015, AND 2014
|
| | | | | | | | | | | | | | | | | | | | | | | |
| | Three Months Ended September 30, | | Nine Months Ended September 30, |
| | 2016 | | 2015 | | 2014 | | 2016 | | 2015 | | 2014 |
| | (Dollars in thousands) |
| Operating Revenue: | | | | | | | | | | | |
| Truckload | $ | 516,692 |
| | $ | 552,816 |
| | $ | 570,931 |
| | $ | 1,526,807 |
| | $ | 1,646,872 |
| | $ | 1,699,469 |
|
| Dedicated | 248,798 |
| | 234,517 |
| | 238,025 |
| | 713,923 |
| | 686,505 |
| | 654,776 |
|
| Swift Refrigerated | 85,019 |
| | 93,045 |
| | 100,448 |
| | 256,774 |
| | 286,301 |
| | 314,122 |
|
| Intermodal | 92,260 |
| | 100,966 |
| | 99,962 |
| | 264,874 |
| | 289,827 |
| | 292,186 |
|
| Subtotal | 942,769 |
| | 981,344 |
| | 1,009,366 |
| | 2,762,378 |
| | 2,909,505 |
| | 2,960,553 |
|
Non-reportable segments (1) | 89,740 |
| | 104,176 |
| | 80,122 |
| | 288,303 |
| | 289,667 |
| | 239,279 |
|
| Intersegment eliminations | (19,283 | ) | | (20,547 | ) | | (14,608 | ) | | (57,778 | ) | | (59,651 | ) | | (40,608 | ) |
| Consolidated operating revenue | $ | 1,013,226 |
| | $ | 1,064,973 |
| | $ | 1,074,880 |
| | $ | 2,992,903 |
| | $ | 3,139,521 |
| | $ | 3,159,224 |
|
| | | | | | | | | | | | |
| Operating Income (Loss): | | | | | | | | | | | |
| Truckload | $ | 47,670 |
| | $ | 57,012 |
| | $ | 71,186 |
| | $ | 134,432 |
| | $ | 181,810 |
| | $ | 172,689 |
|
| Dedicated | 30,333 |
| | 17,573 |
| | 23,692 |
| | 82,640 |
| | 54,885 |
| | 56,334 |
|
| Swift Refrigerated | 1,750 |
| | 2,622 |
| | 3,238 |
| | 6,222 |
| | 13,538 |
| | 9,320 |
|
| Intermodal | 358 |
| | 723 |
| | 1,934 |
| | (1,647 | ) | | 1,081 |
| | 513 |
|
| Subtotal | 80,111 |
| | 77,930 |
| | 100,050 |
| | 221,647 |
| | 251,314 |
| | 238,856 |
|
Non-reportable segments (1) | (18,258 | ) | | (3,009 | ) | | (2,639 | ) | | (33,106 | ) | | (2,917 | ) | | (1,253 | ) |
| Consolidated operating income | $ | 61,853 |
| | $ | 74,921 |
| | $ | 97,411 |
| | $ | 188,541 |
| | $ | 248,397 |
| | $ | 237,603 |
|
| | | | | | | | | | | | |
| Operating Ratio: | | | | | | | | | | | |
| Truckload | 90.8 | % | | 89.7 | % | | 87.5 | % | | 91.2 | % | | 89.0 | % | | 89.8 | % |
| Dedicated | 87.8 | % | | 92.5 | % | | 90.0 | % | | 88.4 | % | | 92.0 | % | | 91.4 | % |
| Swift Refrigerated | 97.9 | % | | 97.2 | % | | 96.8 | % | | 97.6 | % | | 95.3 | % | | 97.0 | % |
| Intermodal | 99.6 | % | | 99.3 | % | | 98.1 | % | | 100.6 | % | | 99.6 | % | | 99.8 | % |
| | | | | | | | | | | | |
Adjusted Operating
Ratio (2): | | | | | | | | | | | |
| Truckload | 89.8 | % | | 88.4 | % | | 84.5 | % | | 90.4 | % | | 87.4 | % | | 87.3 | % |
| Dedicated | 87.1 | % | | 91.8 | % | | 88.0 | % | | 87.8 | % | | 91.2 | % | | 89.5 | % |
| Swift Refrigerated | 97.7 | % | | 96.8 | % | | 96.0 | % | | 97.3 | % | | 94.5 | % | | 96.3 | % |
| Intermodal | 99.6 | % | | 99.2 | % | | 97.6 | % | | 100.7 | % | | 99.6 | % | | 99.8 | % |
| |
| (1) | The non-reportable segments include the Company's logistics and freight brokerage services, as well as support services that its subsidiaries provide to customers and owner-operators, including repair and maintenance shop services, equipment leasing, and insurance. Intangible asset amortization related to the 2007 going-private transaction is also included in the other non-reportable segments. |
| |
| (2) | For more details, refer to the Non-GAAP Reconciliation: Adjusted Operating Ratio by Segment. |
OPERATING STATISTICS BY SEGMENT (UNAUDITED)
THREE AND NINE MONTHS ENDED SEPTEMBER 30, 2016, 2015, AND 2014
|
| | | | | | | | | | | | | | | | | | | | | | | |
| | Three Months Ended September 30, | | Nine Months Ended September 30, |
| | 2016 | | 2015 | | 2014 | | 2016 | | 2015 | | 2014 |
| Truckload: | | | | | | | | | | | |
| Weekly Revenue xFSR per tractor | $ | 3,460 |
| | $ | 3,493 |
| | $ | 3,449 |
| | $ | 3,399 |
| | $ | 3,508 |
| | $ | 3,376 |
|
Total loaded miles (1) | 256,532 |
| | 261,339 |
| | 254,320 |
| | 760,293 |
| | 777,874 |
| | 768,329 |
|
| Average operational truck count: | | | | | | | | | | | |
| Company | 7,448 |
| | 7,663 |
| | 6,811 |
| | 7,576 |
| | 7,488 |
| | 6,928 |
|
| Owner-operator | 2,869 |
| | 2,999 |
| | 3,336 |
| | 2,936 |
| | 3,063 |
| | 3,409 |
|
| Total | 10,317 |
| | 10,662 |
| | 10,147 |
| | 10,512 |
| | 10,551 |
| | 10,337 |
|
| Deadhead miles percentage | 11.7 | % | | 12.2 | % | | 11.7 | % | | 12.0 | % | | 11.9 | % | | 11.7 | % |
| | | | | | | | | | | | |
| Dedicated: | | | | | | | | | | | |
| Weekly Revenue xFSR per tractor | $ | 3,603 |
| | $ | 3,333 |
| | $ | 3,154 |
| | $ | 3,563 |
| | $ | 3,294 |
| | $ | 3,173 |
|
| Average operational truck count: | | | | | | | | | | | |
| Company | 4,106 |
| | 4,020 |
| | 3,786 |
| | 4,032 |
| | 3,963 |
| | 3,532 |
|
| Owner-operator | 845 |
| | 893 |
| | 983 |
| | 835 |
| | 881 |
| | 815 |
|
| Total | 4,951 |
| | 4,913 |
| | 4,769 |
| | 4,867 |
| | 4,844 |
| | 4,347 |
|
| | | | | | | | | | | | |
| Swift Refrigerated: | | | | | | | | | | | |
| Weekly Revenue xFSR per tractor | $ | 3,568 |
| | $ | 3,466 |
| | $ | 3,510 |
| | $ | 3,518 |
| | $ | 3,429 |
| | $ | 3,429 |
|
Total loaded miles (1) | 40,701 |
| | 42,431 |
| | 40,105 |
| | 124,289 |
| | 127,525 |
| | 125,799 |
|
| Average operational truck count: | | | | | | | | | | | |
| Company | 1,009 |
| | 1,191 |
| | 1,071 |
| | 1,068 |
| | 1,246 |
| | 1,062 |
|
| Owner-operator | 593 |
| | 587 |
| | 676 |
| | 598 |
| | 589 |
| | 814 |
|
| Total | 1,602 |
| | 1,778 |
| | 1,747 |
| | 1,666 |
| | 1,835 |
| | 1,876 |
|
| Deadhead miles percentage | 14.0 | % | | 14.4 | % | | 15.9 | % | | 13.9 | % | | 14.1 | % | | 15.0 | % |
| | | | | | | | | | | | |
| Intermodal: | | | | | | | | | | | |
| Average operational truck count: | | | | | | | | | | | |
| Company | 426 |
| | 546 |
| | 461 |
| | 441 |
| | 516 |
| | 416 |
|
| Owner-operator | 84 |
| | 111 |
| | 79 |
| | 90 |
| | 98 |
| | 73 |
|
| Total | 510 |
| | 657 |
| | 540 |
| | 531 |
| | 614 |
| | 489 |
|
| Load Count | 43,787 |
| | 47,107 |
| | 44,275 |
| | 128,166 |
| | 135,564 |
| | 126,282 |
|
| Average Container Count | 9,138 |
| | 9,150 |
| | 8,778 |
| | 9,146 |
| | 9,150 |
| | 8,737 |
|
| |
| (1) | Total loaded miles presented in thousands. |
NON-GAAP RECONCILIATION:
ADJUSTED OPERATING RATIO BY SEGMENT (UNAUDITED)
THREE AND NINE MONTHS ENDED SEPTEMBER 30, 2016, 2015, AND 2014
|
| | | | | | | | | | | | | | | | | | | | | | | |
| | Three Months Ended September 30, | | Nine Months Ended September 30, |
| | 2016 | | 2015 | | 2014 | | 2016 | | 2015 | | 2014 |
| | (Dollars in thousands) |
| Truckload: | | | | | | | | | | | |
| Operating revenue | $ | 516,692 |
| | $ | 552,816 |
| | $ | 570,931 |
| | $ | 1,526,807 |
| | $ | 1,646,872 |
| | $ | 1,699,469 |
|
| Less: Fuel surcharge revenue | (47,549 | ) | | (63,363 | ) | | (110,917 | ) | | (128,101 | ) | | (203,205 | ) | | (338,979 | ) |
| Revenue xFSR | $ | 469,143 |
| | $ | 489,453 |
| | $ | 460,014 |
| | $ | 1,398,706 |
| | $ | 1,443,667 |
| | $ | 1,360,490 |
|
| | | | | | | | | | | | |
| Operating expense | $ | 469,022 |
| | $ | 495,804 |
| | $ | 499,745 |
| | $ | 1,392,375 |
| | $ | 1,465,062 |
| | $ | 1,526,780 |
|
| Adjusted for: Fuel surcharge revenue | (47,549 | ) | | (63,363 | ) | | (110,917 | ) | | (128,101 | ) | | (203,205 | ) | | (338,979 | ) |
| Adjusted operating expense | $ | 421,473 |
| | $ | 432,441 |
| | $ | 388,828 |
| | $ | 1,264,274 |
| | $ | 1,261,857 |
| | $ | 1,187,801 |
|
| Operating Ratio | 90.8 | % | | 89.7 | % | | 87.5 | % | | 91.2 | % | | 89.0 | % | | 89.8 | % |
| Adjusted Operating Ratio | 89.8 | % | | 88.4 | % | | 84.5 | % | | 90.4 | % | | 87.4 | % | | 87.3 | % |
| | | | | | | | | | | | |
| Dedicated: | | | | | | | | | | | |
| Operating revenue | $ | 248,798 |
| | $ | 234,517 |
| | $ | 238,025 |
| | $ | 713,923 |
| | $ | 686,505 |
| | $ | 654,776 |
|
| Less: Fuel surcharge revenue | (14,401 | ) | | (19,271 | ) | | (40,326 | ) | | (35,021 | ) | | (64,169 | ) | | (116,635 | ) |
| Revenue xFSR | $ | 234,397 |
| | $ | 215,246 |
| | $ | 197,699 |
| | $ | 678,902 |
| | $ | 622,336 |
| | $ | 538,141 |
|
| | | | | | | | | | | | |
| Operating expense | $ | 218,465 |
| | $ | 216,944 |
| | $ | 214,333 |
| | $ | 631,283 |
| | $ | 631,620 |
| | $ | 598,442 |
|
| Adjusted for: Fuel surcharge revenue | (14,401 | ) | | (19,271 | ) | | (40,326 | ) | | (35,021 | ) | | (64,169 | ) | | (116,635 | ) |
| Adjusted operating expense | $ | 204,064 |
| | $ | 197,673 |
| | $ | 174,007 |
| | $ | 596,262 |
| | $ | 567,451 |
| | $ | 481,807 |
|
| Operating Ratio | 87.8 | % | | 92.5 | % | | 90.0 | % | | 88.4 | % | | 92.0 | % | | 91.4 | % |
| Adjusted Operating Ratio | 87.1 | % | | 91.8 | % | | 88.0 | % | | 87.8 | % | | 91.2 | % | | 89.5 | % |
| | | | | | | | | | | | |
| Swift Refrigerated: | | | | | | | | | | | |
| Operating revenue | $ | 85,019 |
| | $ | 93,045 |
| | $ | 100,448 |
| | $ | 256,774 |
| | $ | 286,301 |
| | $ | 314,122 |
|
| Less: Fuel surcharge revenue | (9,920 | ) | | (12,055 | ) | | (19,872 | ) | | (27,373 | ) | | (40,933 | ) | | (63,990 | ) |
| Revenue xFSR | $ | 75,099 |
| | $ | 80,990 |
| | $ | 80,576 |
| | $ | 229,401 |
| | $ | 245,368 |
| | $ | 250,132 |
|
| | | | | | | | | | | | |
| Operating expense | $ | 83,269 |
| | $ | 90,423 |
| | $ | 97,210 |
| | $ | 250,552 |
| | $ | 272,763 |
| | $ | 304,802 |
|
| Adjusted for: Fuel surcharge revenue | (9,920 | ) | | (12,055 | ) | | (19,872 | ) | | (27,373 | ) | | (40,933 | ) | | (63,990 | ) |
| Adjusted operating expense | $ | 73,349 |
| | $ | 78,368 |
| | $ | 77,338 |
| | $ | 223,179 |
| | $ | 231,830 |
| | $ | 240,812 |
|
| Operating Ratio | 97.9 | % | | 97.2 | % | | 96.8 | % | | 97.6 | % | | 95.3 | % | | 97.0 | % |
| Adjusted Operating Ratio | 97.7 | % | | 96.8 | % | | 96.0 | % | | 97.3 | % | | 94.5 | % | | 96.3 | % |
| | | | | | | | | | | | |
| Intermodal: | | | | | | | | | | | |
| Operating revenue | $ | 92,260 |
| | $ | 100,966 |
| | $ | 99,962 |
| | $ | 264,874 |
| | $ | 289,827 |
| | $ | 292,186 |
|
| Less: Fuel surcharge revenue | (9,294 | ) | | (12,903 | ) | | (19,833 | ) | | (24,291 | ) | | (39,657 | ) | | (58,301 | ) |
| Revenue xFSR | $ | 82,966 |
| | $ | 88,063 |
| | $ | 80,129 |
| | $ | 240,583 |
| | $ | 250,170 |
| | $ | 233,885 |
|
| | | | | | | | | | | | |
| Operating expense | $ | 91,902 |
| | $ | 100,243 |
| | $ | 98,028 |
| | $ | 266,521 |
| | $ | 288,746 |
| | $ | 291,673 |
|
| Adjusted for: Fuel surcharge revenue | (9,294 | ) | | (12,903 | ) | | (19,833 | ) | | (24,291 | ) | | (39,657 | ) | | (58,301 | ) |
| Adjusted operating expense | $ | 82,608 |
| | $ | 87,340 |
| | $ | 78,195 |
| | $ | 242,230 |
| | $ | 249,089 |
| | $ | 233,372 |
|
| Operating Ratio | 99.6 | % | | 99.3 | % | | 98.1 | % | | 100.6 | % | | 99.6 | % | | 99.8 | % |
| Adjusted Operating Ratio | 99.6 | % | | 99.2 | % | | 97.6 | % | | 100.7 | % | | 99.6 | % | | 99.8 | % |
CONSOLIDATED EQUIPMENT (UNAUDITED)
AS OF SEPTEMBER 30, 2016, DECEMBER 31, 2015, AND SEPTEMBER 30, 2015
AND
AVERAGE OPERATIONAL TRUCK COUNT (UNAUDITED)
THREE AND NINE MONTHS ENDED SEPTEMBER 30, 2016, 2015, AND 2014
|
| | | | | | | | |
| | September 30,
2016 | | December 31, 2015 | | September 30,
2015 |
| Tractors | | | | | |
| Company: | | | | | |
| Owned | 6,838 |
| | 7,442 |
| | 7,334 |
|
| Leased – capital leases | 2,098 |
| | 2,170 |
| | 2,296 |
|
| Leased – operating leases | 5,444 |
| | 5,599 |
| | 6,194 |
|
| Total company tractors | 14,380 |
| | 15,211 |
| | 15,824 |
|
| Owner-operator: | | | | | |
| Financed through the Company | 3,348 |
| | 3,767 |
| | 3,891 |
|
| Other | 1,429 |
| | 886 |
| | 1,121 |
|
| Total owner-operator tractors | 4,777 |
| | 4,653 |
| | 5,012 |
|
| Total tractors | 19,157 |
| | 19,864 |
| | 20,836 |
|
| Trailers | 62,727 |
| | 65,233 |
| | 64,528 |
|
| Containers | 9,131 |
| | 9,150 |
| | 9,150 |
|
|
| | | | | | | | | | | | | | | | | | |
| | | Three Months Ended September 30, | | Nine Months Ended September 30, |
| | | 2016 | | 2015 | | 2014 | | 2016 | | 2015 | | 2014 |
Average operational truck count (1) : | | | | | | | | | | | | |
| Company | | 13,089 |
| | 13,469 |
| | 12,156 |
| | 13,183 |
| | 13,249 |
| | 11,966 |
|
| Owner-operator | | 4,391 |
| | 4,592 |
| | 5,074 |
| | 4,459 |
| | 4,632 |
| | 5,109 |
|
| Total | | 17,480 |
| | 18,061 |
| | 17,230 |
| | 17,642 |
| | 17,881 |
| | 17,075 |
|
| |
| (1) | Includes trucks within our non-reportable segments. |
CONDENSED CONSOLIDATED BALANCE SHEETS (UNAUDITED)
AS OF SEPTEMBER 30, 2016 AND DECEMBER 31, 2015
|
| | | | | | | |
| | September 30,
2016 | | December 31, 2015 |
| | (In thousands) |
| ASSETS | | | |
| Current assets: | | | |
| Cash and cash equivalents | $ | 71,258 |
| | $ | 107,590 |
|
| Cash and cash equivalents – restricted | 59,487 |
| | 55,241 |
|
| Restricted investments, held to maturity, amortized cost | 22,864 |
| | 23,215 |
|
| Accounts receivable, net | 403,895 |
| | 422,421 |
|
| Income tax refund receivable | 9,987 |
| | 11,664 |
|
| Inventories and supplies | 16,264 |
| | 18,426 |
|
| Assets held for sale | 11,830 |
| | 9,084 |
|
| Prepaid taxes, licenses, insurance, and other | 50,669 |
| | 48,149 |
|
| Current portion of notes receivable | 7,668 |
| | 9,817 |
|
| Total current assets | 653,922 |
| | 705,607 |
|
| Property and equipment, at cost: | | | |
| Revenue and service equipment | 2,233,507 |
| | 2,278,618 |
|
| Land | 131,693 |
| | 131,693 |
|
| Facilities and improvements | 278,291 |
| | 269,769 |
|
| Furniture and office equipment | 110,996 |
| | 99,519 |
|
| Total property and equipment | 2,754,487 |
| | 2,779,599 |
|
| Less: accumulated depreciation and amortization | (1,200,613 | ) | | (1,128,499 | ) |
| Net property and equipment | 1,553,874 |
| | 1,651,100 |
|
Other assets (2) | 22,664 |
| | 26,585 |
|
| Intangible assets, net | 270,508 |
| | 283,119 |
|
| Goodwill | 253,256 |
| | 253,256 |
|
| Total assets | $ | 2,754,224 |
| | $ | 2,919,667 |
|
| LIABILITIES AND STOCKHOLDERS’ EQUITY | | | |
| Current liabilities: | | | |
| Accounts payable | $ | 138,087 |
| | $ | 121,827 |
|
| Accrued liabilities | 110,918 |
| | 97,313 |
|
| Current portion of claims accruals | 78,478 |
| | 84,429 |
|
Current portion of long-term debt (1)(2) | 799 |
| | 35,514 |
|
| Current portion of capital lease obligations | 71,988 |
| | 59,794 |
|
| Total current liabilities | 400,270 |
| | 398,877 |
|
| Revolving line of credit | 50,000 |
| | 200,000 |
|
Long-term debt, less current portion (1)(2) | 593,263 |
| | 643,663 |
|
| Capital lease obligations, less current portion | 176,871 |
| | 222,001 |
|
| Claims accruals, less current portion | 155,317 |
| | 149,281 |
|
| Deferred income taxes | 446,399 |
| | 463,832 |
|
Accounts receivable securitization (2) | 299,196 |
| | 223,927 |
|
| Other liabilities | 6,699 |
| | 959 |
|
| Total liabilities | 2,128,015 |
| | 2,302,540 |
|
| Stockholders’ equity: | | | |
| Preferred stock | — |
| | — |
|
| Class A common stock | 826 |
| | 878 |
|
| Class B common stock | 497 |
| | 510 |
|
Additional paid-in capital (3) | 690,317 |
| | 754,589 |
|
Accumulated deficit (3) | (65,533 | ) | | (139,033 | ) |
| Accumulated other comprehensive income | — |
| | 81 |
|
| Noncontrolling interest | 102 |
| | 102 |
|
| Total stockholders’ equity | 626,209 |
| | 617,127 |
|
| Total liabilities and stockholders’ equity | $ | 2,754,224 |
| | $ | 2,919,667 |
|
CONDENSED CONSOLIDATED BALANCE SHEETS (UNAUDITED) — CONTINUED
AS OF SEPTEMBER 30, 2016 AND DECEMBER 31, 2015
Notes to Condensed Consolidated Balance Sheets:
| |
| (1) | As of September 30, 2016, the Company's total long-term debt had a carrying value of $594.1 million, comprised of: |
•$592.8 million: Term Loan A, due July 2020, net of $1.4 million deferred loan costs
•$1.2 million: Other
As of December 31, 2015, the Company's total long-term debt had a carrying value of $679.2 million, comprised of:
•$668.1 million: Term Loan A, due July 2020, net of $1.7 million deferred loan costs
•$11.1 million: Other
| |
| (2) | In 2016, the Company adopted Accounting Standards Update 2015-03, Simplifying the Presentation of Debt Issuance Costs, which was issued by the Financial Accounting Standards Board in April 2015. Accordingly, debt issuance costs associated with the Company’s Term Loan A and accounts receivable securitization are now presented within liabilities as direct deductions from the face amount of the related debt, rather than within other assets as deferred charges. The Company retrospectively adjusted the December 31, 2015 consolidated balance sheet to align with the current period presentation by reclassifying $1.6 million, $0.1 million and $1.1 million of debt issuance costs out of "Other assets" and into "Long-term debt, less current portion," "Current portion of long-term debt" and "Accounts receivable securitization," respectively. |
| |
| (3) | The line items "Additional paid-in capital" and "Accumulated deficit" include allocation of purchase price related to the Company's repurchase and cancellation of its Class A common stock, as follows: |
| |
| • | During the nine months ended September 30, 2016, the Company repurchased and canceled 7.3 million shares of its Class A common stock for $115.0 million. The excess of the repurchase price over par value was allocated $75.6 million to "Additional paid-in capital" and $39.3 million to "Accumulated deficit." |
| |
| • | During the three months ended December 31, 2015, the Company repurchased and canceled 4.2 million shares of its Class A common stock for $70.0 million. The excess of the repurchase price over par value was allocated $43.4 million to "Additional paid-in capital" and $26.6 million to "Accumulated deficit." |
CONSOLIDATED STATEMENTS OF CASH FLOWS (UNAUDITED)
NINE MONTHS ENDED SEPTEMBER 30, 2016 AND 2015
|
| | | | | | | |
| | Nine Months Ended September 30, |
| | 2016 | | 2015 |
| | (In thousands) |
| Cash flows from operating activities: | |
| Net income | $ | 112,795 |
| | $ | 125,075 |
|
| Adjustments to reconcile net income to net cash provided by operating activities: | | | |
| Depreciation and amortization of property, equipment, and intangibles | 211,495 |
| | 196,805 |
|
| Amortization of debt issuance costs, original issue discount, and other | 996 |
| | 5,574 |
|
| Gain on disposal of property and equipment, less write-off of totaled tractors | (14,797 | ) | | (21,974 | ) |
| Impairments | — |
| | 1,480 |
|
| Deferred income taxes | (17,640 | ) | | (8,106 | ) |
| Provision for (reduction of) losses on accounts receivable | (2,626 | ) | | 5,348 |
|
| Non-cash loss on debt extinguishment and write-offs of deferred financing costs and original issue discount | — |
| | 9,567 |
|
| Stock-based compensation expense | 4,691 |
| | 4,618 |
|
| Excess tax benefit from stock-based compensation | (547 | ) | | (2,200 | ) |
| Income effect of mark-to-market adjustment of interest rate swaps | — |
| | 87 |
|
| Increase (decrease) in cash resulting from changes in: | | | |
| Accounts receivable | 21,152 |
| | 25,328 |
|
| Inventories and supplies | 2,162 |
| | (102 | ) |
| Prepaid expenses and other current assets | (843 | ) | | (1,197 | ) |
| Other assets | 2,682 |
| | 6,583 |
|
| Accounts payable, and accrued and other liabilities | 9,313 |
| | 10,336 |
|
| Net cash provided by operating activities | 328,833 |
| | 357,222 |
|
| Cash flows from investing activities: | | | |
| Increase in cash and cash equivalents – restricted | (4,246 | ) | | (12,832 | ) |
| Proceeds from maturities of investments | 23,869 |
| | 23,965 |
|
| Purchases of investments | (23,737 | ) | | (22,710 | ) |
| Proceeds from sale of property and equipment | 96,228 |
| | 76,545 |
|
| Capital expenditures | (141,269 | ) | | (260,858 | ) |
| Payments received on notes receivable | 4,763 |
| | 3,137 |
|
| Expenditures on assets held for sale | (24,784 | ) | | (19,777 | ) |
| Payments received on assets held for sale | 18,459 |
| | 8,019 |
|
| Payments received on equipment sale receivables | — |
| | 293 |
|
| Net cash used in investing activities | (50,717 | ) | | (204,218 | ) |
| Cash flows from financing activities: | | | |
| Repayment of long-term debt and capital leases | (131,125 | ) | | (954,561 | ) |
| Proceeds from long-term debt | — |
| | 684,504 |
|
| Net (repayments) borrowings on revolving line of credit | (150,000 | ) | | 143,000 |
|
| Borrowings under accounts receivable securitization | 100,000 |
| | 65,000 |
|
| Repayment of accounts receivable securitization | (25,000 | ) | | (149,000 | ) |
| Payment of deferred loan costs | — |
| | (3,240 | ) |
| Proceeds from common stock issued | 6,130 |
| | 7,667 |
|
Repurchases of Class A common stock (1) | (115,000 | ) | | — |
|
| Excess tax benefit from stock-based compensation | 547 |
| | 2,200 |
|
| Net cash used in financing activities | (314,448 | ) | | (204,430 | ) |
| Net decrease in cash and cash equivalents | (36,332 | ) | | (51,426 | ) |
| Cash and cash equivalents at beginning of period | 107,590 |
| | 105,132 |
|
| Cash and cash equivalents at end of period | $ | 71,258 |
| | $ | 53,706 |
|
Note to Consolidated Statements of Cash Flows:
| |
| (1) | Refer to Note (3) to the Condensed Consolidated Balance Sheets. |
CONSOLIDATED STATEMENTS OF CASH FLOWS (UNAUDITED) — CONTINUED
NINE MONTHS ENDED SEPTEMBER 30, 2016 AND 2015
|
| | | | | | | |
| | Nine Months Ended September 30, |
| | 2016 | | 2015 |
| | (In thousands) |
| Supplemental disclosures of cash flow information: | | | |
| Cash paid during the period for: | | | |
| Interest | $ | 22,818 |
| | $ | 37,254 |
|
| Income taxes | 67,058 |
| | 77,335 |
|
| Non-cash investing activities: | | | |
| Equipment purchase accrual | $ | 29,813 |
| | $ | 11,801 |
|
| Notes receivable from sale of assets | 1,416 |
| | 5,618 |
|
| Equipment sales receivables | — |
| | 5 |
|
| Non-cash financing activities: | | | |
| Capital lease additions | $ | 12,811 |
| | $ | 142,937 |
|
| Accrued deferred loan costs | — |
| | 250 |
|