|
| | |
| | |
| | P.O. Box 29243 - Phoenix, Arizona 85038-9243 |
| | 2200 S. 75th Avenue - Phoenix, Arizona 85043 |
| | (602) 269-9700 |
| | |
April 24, 2017
Dear Fellow Stockholders of Swift Transportation Company (NYSE: SWFT),
On April 13, 2017, we proposed a tentative settlement arrangement with regard to certain previously disclosed litigation in the Refrigerated Segment, which was originally scheduled to commence arbitration trial the week of April 24, 2017. As a result, in accordance with GAAP, we increased our legal reserves by $11.7 million, or $0.06 per share as of March 31, 2017. This increase was not known and, therefore, not incorporated in the anticipated earnings range we released on April 10, 2017 of Diluted EPS of $0.09-$0.10 and Adjusted EPS of $0.11-$0.12 for first quarter 2017. The reserve increase is incorporated into the results below.
A summary of our key results for the quarter ended March 31st is shown below:
|
| | | | | | | | | | | |
| | Quarter Ended March 31, |
| | 2017 | | 2016 | | 2015 |
| | Unaudited |
| | (Dollars in millions, except per share data) |
| Operating Revenue | $ | 963.8 |
| | $ | 967.8 |
| | $ | 1,015.1 |
|
Revenue xFSR (1)(2) | $ | 871.1 |
| | $ | 906.9 |
| | $ | 894.9 |
|
| | | | | | |
| Operating Ratio | 98.4 | % | | 94.6 | % | | 92.6 | % |
Adjusted Operating Ratio (2) | 97.8 | % | | 93.8 | % | | 91.2 | % |
| | | | | | |
| Diluted EPS | $ | 0.04 |
| | $ | 0.23 |
| | $ | 0.26 |
|
Adjusted EPS (2) | $ | 0.07 |
| | $ | 0.25 |
| | $ | 0.29 |
|
| | | | | | |
(1) Revenue xFSR is operating revenue, excluding fuel surcharge revenue |
(2) See GAAP to non-GAAP reconciliation in the schedules following this letter |
Key Highlights for the First Quarter 2017:
(discussed in more detail below, including GAAP to non-GAAP reconciliations)
Consolidated
| |
| • | Diluted EPS was $0.04 and Adjusted EPS was $0.07 |
| |
| • | Settlement of certain litigation negatively impacted Diluted EPS and Adjusted EPS by $0.06 and Operating Ratio and Adjusted Operating Ratio by 120 and 140 basis points, respectively |
| |
| • | Consolidated Average Operational Truck Count declined by 225 trucks from the fourth quarter of 2016, and 812 trucks year over year in the first quarter, in a continued effort to drive improvements in asset utilization |
| |
| • | Favorable discrete tax items resulted in an effective tax rate of 31.3% |
| |
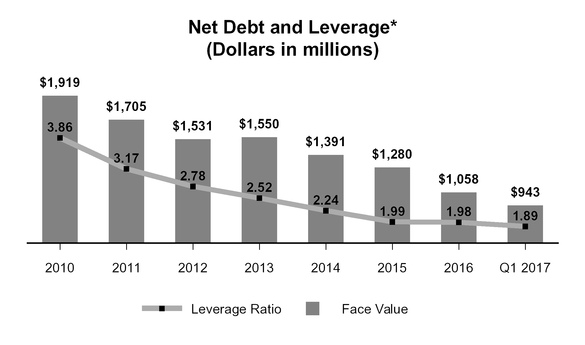
| • | Net Debt and Net Leverage Ratio were $942.9 million and 1.89, respectively, as of March 31, 2017 |
| |
| • | On April 10, 2017, Swift and Knight Transportation (KNX) announced the Board approval of a merger in an all-stock transaction to create Knight-Swift Transportation Holdings Inc. This transaction is expected to close in the third quarter of 2017, and will result in the industry's largest full truckload company. |
| |
| • | As announced on our mid-first quarter conference call, we reorganized our reportable segments to reflect management's revised reporting structure. Our dedicated grocery line of business, which previously reported within our Dedicated segment, is now reported within our Refrigerated segment, resulting in all of our temperature-controlled lines of business reporting under the Refrigerated segment. |
Truckload
| |
| • | Truckload Revenue xFSR for the first quarter of 2017 was $429.6 million, compared to $455.8 million in the first quarter of 2016 |
| |
| • | Revenue xFSR per loaded mile declined 2.6% year over year |
| |
| • | Total loaded miles decreased 3.2% year over year, primarily due to a 6.0% reduction in Average Operational Truck Count and one less calendar day in the first quarter of 2017 compared to the first quarter of 2016, partially offset by a 4.0% increase in loaded miles per tractor per week |
| |
| • | Deadhead Percentage improved 90 basis points year over year, and 80 basis points sequentially |
| |
| • | Operating Ratio and Adjusted Operating Ratio for the first quarter of 2017 were 96.7% and 96.3%, respectively |
Dedicated
| |
| • | Dedicated Revenue xFSR grew 2.3% year over year to $136.8 million |
| |
| • | Weekly Revenue xFSR per Tractor improved 3.7% year over year, due to improvements in both asset utilization and pricing |
| |
| • | Dedicated sales pipeline is strengthening, resulting in an increase in the number of pending bids for new business opportunities |
| |
| • | Operating Ratio and Adjusted Operating Ratio for the first quarter of 2017 were 92.3% and 91.5%, respectively. Increases in insurance and claims expense, depreciation expense, and equipment maintenance expense partially driven by weather related issues negatively affected Operating Ratio and Adjusted Operating Ratio. |
Refrigerated
| |
| • | Refrigerated Revenue xFSR for the first quarter of 2017 was $161.8 million, compared to $163.0 million in the first quarter of 2016 |
| |
| • | Weekly Revenue xFSR per Tractor increased 3.2% year over year, due to increases in both asset utilization and Revenue xFSR per loaded mile |
| |
| • | Safety and operational initiatives remain a key focus as insurance and claims, workers' compensation expense and Deadhead Percentage, improved year over year |
| |
| • | Operating Ratio and Adjusted Operating Ratio for the first quarter of 2017 were 103.6% and 103.9%, respectively, which were negatively impacted by 660 and 720 basis points, respectively, due to the increase in legal reserves for certain litigation noted above |
Intermodal
| |
| • | Intermodal Revenue xFSR for the first quarter of 2017 was $76.1 million, compared to $75.9 million in the first quarter of 2016 |
| |
| • | Revenue xFSR per load increased 1.1% year over year, despite continued pressure in the intermodal pricing market |
| |
| • | Container-on-Flat-Car (COFC) load counts strengthened throughout the first quarter, resulting in year over year growth in COFC volumes |
| |
| • | Operating Ratio and Adjusted Operating Ratio for the first quarter of 2017 were both 100.1%, a year over year improvement of over 300 basis points |
As we discussed on our mid-first quarter conference call, the truckload industry continues to be plagued with excess carrier capacity for the current demand environment prolonging the competitive pricing situation that existed throughout 2016. This challenging pricing environment, the impact of the more severe winter weather on maintenance and claims expense early in the quarter, the $11.7 million increase in legal reserves and the known headwinds of increased depreciation expense and lower gain on sale of equipment due to the soft used truck market all served as headwinds to our quarterly results. In an effort to offset these headwinds, our team remained committed to executing on our initiatives of increasing asset utilization, disciplined cost control, and improving the quality of freight within our network. We are proud of our team's efforts as we drove improvements in
our loaded miles per tractor per week and our Deadhead Percentage in each of our Truckload, Dedicated, and Refrigerated segments, and achieved a 300+ basis point improvement in the Intermodal operating ratio metrics.
We are proud of this progress, especially in this less than ideal marketplace, and believe we are positioning ourselves to rebound when the market dynamics improve. We anticipate that the difficult operating environment will persist into the second quarter, and as such, expect our Diluted EPS to be in the range of $0.16 - $0.21 and Adjusted EPS to be in the range of $0.18 - $0.23 (reflecting the after tax impact of adding back intangible amortization expense of $0.02 per share). We are cautiously optimistic about the back half of 2017, and look forward to a stronger operating environment in 2018 and beyond.
On April 10, 2017, we announced that we agreed to merge with Knight Transportation (NYSE:KNX) in an all-stock transaction to create Knight-Swift Transportation Holdings Inc. This transaction is expected to close in the third quarter of 2017 and will combine two long-standing industry leaders, creating North America's premier truckload transportation company. The holding company structure will enable the Knight and Swift businesses to operate under common ownership and share best practices, while maintaining distinct brands and operations. We are excited for the opportunity this transformative event will provide to our shareholders as we believe we can capitalize on best practices and economies of scale to drive value.
First Quarter Results by Segment
Truckload Segment
Our Truckload segment consists of one-way movements over irregular routes throughout the United States, Mexico, and Canada. This service uses both company and owner-operator tractors with dry van, flatbed, and other specialized trailing equipment.
|
| | | | | | | | | | | |
| | Quarter Ended March 31, |
| | 2017 | | 2016 | | 2015 |
| | Unaudited |
Operating Revenue (1) | $ | 481.5 |
| | $ | 492.5 |
| | $ | 538.3 |
|
Revenue xFSR (1)(2)(3) | $ | 429.6 |
| | $ | 455.8 |
| | $ | 468.8 |
|
| | | | | | |
| Operating Ratio | 96.7 | % | | 92.6 | % | | 89.4 | % |
Adjusted Operating Ratio (3) | 96.3 | % | | 92.0 | % | | 87.9 | % |
| | | | | | |
| Weekly Revenue xFSR per Tractor | $ | 3,339 |
| | $ | 3,292 |
| | $ | 3,461 |
|
Total Loaded Miles (4) | 238,218 |
| | 246,137 |
| | 254,926 |
|
| | | | | | |
| Average Operational Truck Count | 10,006 |
| | 10,650 |
| | 10,535 |
|
| Deadhead Percentage | 11.6 | % | | 12.5 | % | | 11.8 | % |
| | | | | | |
(1) In millions |
(2) Revenue xFSR is operating revenue, excluding fuel surcharge revenue |
(3) See GAAP to non-GAAP reconciliation in the schedules following this letter |
(4) Total Loaded Miles presented in thousands |
Our Truckload Revenue xFSR for the first quarter of 2017 decreased 5.8% compared to the first quarter of 2016 due to a 2.6% decrease in Revenue xFSR per loaded mile and a 3.2% reduction in loaded miles. A 6.0% reduction in the Average Operational Truck Count and one less business day in the period drove the year over year reduction in loaded miles, partially offset by a 4.0% increase in loaded miles per tractor per week (utilization). This increase in utilization offset the decline in Revenue xFSR per loaded mile, helping to drive a 1.4% increase in Weekly Revenue xFSR per Tractor. The pricing environment remained challenging throughout the first quarter as carrier capacity continued to exceed current demand levels. To help combat the pricing environment, we remained focused on our cost control and asset utilization as evidenced by the 4.0% increase in utilization mentioned above. Efforts to improve freight selection and network balance resulted in both year over year and sequential Deadhead Percentage decreases of 90 and 80 basis points, respectively.
For the first quarter of 2017, the Operating Ratio in our Truckload segment was 96.7% compared to 92.6% for the first quarter of 2016, while the Adjusted Operating Ratio was 96.3% and 92.0%, respectively, for the same periods. The change in the Operating Ratio metrics was primarily driven by the decrease in Revenue xFSR per loaded mile mentioned above, increases in insurance and claims expense, and tractor depreciation expense related to the change in residual values on certain trucks as discussed in the third quarter of 2016, as well as a decrease in the gain on sale of equipment caused by the weak used truck market. These headwinds were partially offset by the improvements in utilization and deadhead mentioned above.
Dedicated Segment
Through our Dedicated segment, we devote equipment and offer tailored solutions under long-term contracts with customers. This dedicated business utilizes dry van, flatbed, and other specialized trailing equipment.
|
| | | | | | | | | | | |
| | Quarter Ended March 31, |
| | 2017 | | 2016 (recast) (4) | | 2015 (recast) (4) |
| | Unaudited |
Operating Revenue (1) | $ | 150.8 |
| | $ | 142.9 |
| | $ | 135.9 |
|
Revenue xFSR (1)(2)(3) | $ | 136.8 |
| | $ | 133.7 |
| | $ | 118.7 |
|
| | | | | | |
| Operating Ratio | 92.3 | % | | 86.9 | % | | 91.9 | % |
Adjusted Operating Ratio (3) | 91.5 | % | | 86.0 | % | | 90.7 | % |
| | | | | | |
| Weekly Revenue xFSR per Tractor | $ | 3,461 |
| | $ | 3,339 |
| | $ | 3,107 |
|
| Average Operational Truck Count | 3,074 |
| | 3,079 |
| | 2,969 |
|
| | | | | | |
(1) In millions |
(2) Revenue xFSR is operating revenue, excluding fuel surcharge revenue |
(3) See GAAP to non-GAAP reconciliation in the schedules following this letter |
(4) During the first quarter, the Company reorganized its reportable segments to reflect management's revised reporting structure of its Dedicated and Refrigerated reportable segments. In association with the reorganization, the operations of our dedicated grocery line of business, which was previously reported within the Company's Dedicated segment, is now reported within the Company's Refrigerated segment. This reorganization results in all of our temperature-controlled lines of business reporting under the Refrigerated segment. |
Dedicated Revenue xFSR grew 2.3% to $136.8 million in the first quarter of 2017 compared to the first quarter of 2016. This growth was driven by a 3.7% increase in Weekly Revenue xFSR per Tractor, partially offset by one less calendar day in the first quarter of 2017. The year over year increase in Weekly Revenue xFSR per Tractor was the result of improvements in both asset utilization and pricing. We are pleased with our team's ability to produce improvement in both of these areas, despite facing the soft market conditions prevalent throughout the first quarter of this year.
For the first quarter of 2017, the Operating Ratio in our Dedicated segment was 92.3% compared to 86.9% from the prior year, while the Adjusted Operating Ratio was 91.5% and 86.0%, respectively, for the same periods. The change in the Operating Ratio metrics was primarily driven by increases in insurance and claims expense, depreciation expense, and equipment maintenance expense partially resulting from the severe winter weather experienced throughout our dedicated network in the first quarter. Although we had a challenging first quarter, our sales pipeline has strengthened over the last several weeks, resulting in an increase in the number of pending bids for new business opportunities. We are encouraged by these developments and when combined with our continued focus on cost control and operational efficiencies, we believe we will be able to make further improvements in this segment on both its top and bottom line.
Refrigerated Segment
Our Refrigerated segment represents shipments for customers that require temperature-controlled trailers. These shipments include one-way movements over irregular routes and dedicated truck operations.
|
| | | | | | | | | | | |
| | Quarter Ended March 31, |
| | 2017 | | 2016 (recast) (4) | | 2015 (recast) (4) |
| | Unaudited |
Operating Revenue (1) | $ | 177.5 |
| | $ | 169.7 |
| | $ | 177.4 |
|
Revenue xFSR (1)(2)(3) | $ | 161.8 |
| | $ | 163.0 |
| | $ | 158.6 |
|
| | | | | | |
| Operating Ratio | 103.6 | % | | 97.2 | % | | 95.5 | % |
Adjusted Operating Ratio (3) | 103.9 | % | | 97.1 | % | | 94.9 | % |
| | | | | | |
| Weekly Revenue xFSR per Tractor | $ | 3,690 |
| | $ | 3,574 |
| | $ | 3,384 |
|
| Average Operational Truck Count | 3,411 |
| | 3,509 |
| | 3,644 |
|
| Deadhead Percentage | 7.4 | % | | 7.8 | % | | 7.9 | % |
| | | | | | |
(1) In millions |
(2) Revenue xFSR is operating revenue, excluding fuel surcharge revenue |
(3) See GAAP to non-GAAP reconciliation in the schedules following this letter; includes $11.65 million increase in legal reserves in 2017 |
(4) During the first quarter, the Company reorganized its reportable segments to reflect management's revised reporting structure of its Dedicated and Refrigerated reportable segments. In association with the reorganization, the operations of our dedicated grocery line of business, which was previously reported within the Company's Dedicated segment, is now reported within the Company's Refrigerated segment. This reorganization results in all of our temperature-controlled lines of business reporting under the Refrigerated segment. |
Our Refrigerated Revenue xFSR for the first quarter of 2017 declined 0.7% from the first quarter of 2016 due to a 1.0% reduction in loaded miles offset by a 0.3% increase in Revenue xFSR per loaded mile. As we mentioned during our mid-first quarter conference call, our sales and operations teams continue to work closely with shippers to ensure the freight we haul is appropriately priced and accretive to our fleet's efficiency. As a result of these efforts, our first quarter's Weekly Revenue xFSR per Tractor increased 3.2% on a year-over-year basis to $3,690, due to both a 2.9% increase in our loaded miles per tractor per week, as well as the 0.3% increase in Revenue xFSR per loaded mile, mentioned above.
For the first quarter of 2017, the Operating Ratio in our Refrigerated segment increased 640 basis points compared to the first quarter of 2016, while the Adjusted Operating Ratio increased 680 basis points. The tentative settlement agreement related to certain previously disclosed litigation reached on April 13, 2017 resulted in an $11.7 million increase in legal reserves during the first quarter of 2017. This caused a 660 and 720 basis point increase in the Operating Ratio and Adjusted Operating Ratio, respectively. Year over year operational improvements within this segment included: increases in asset utilization and pricing, reduced empty miles, and improved insurance and claims and workers’ compensation expense.
Intermodal Segment
Our Intermodal segment includes revenue generated by freight moving over the rail in our containers and other trailing equipment, combined with revenue for drayage to transport loads between the railheads and customer locations.
|
| | | | | | | | | | | |
| | Quarter Ended March 31, |
| | 2017 | | 2016 | | 2015 |
| | Unaudited |
Operating Revenue (1) | $ | 86.2 |
| | $ | 82.5 |
| | $ | 90.4 |
|
Revenue xFSR (1)(2)(3) | $ | 76.1 |
| | $ | 75.9 |
| | $ | 77.3 |
|
| | | | | | |
| Operating Ratio | 100.1 | % | | 103.5 | % | | 101.4 | % |
Adjusted Operating Ratio (3) | 100.1 | % | | 103.8 | % | | 101.6 | % |
| | | | | | |
| Load Counts | 40,666 |
| | 40,997 |
| | 41,940 |
|
| Average Container Counts | 9,130 |
| | 9,150 |
| | 9,150 |
|
| | | | | | |
(1) In millions |
(2) Revenue xFSR is operating revenue, excluding fuel surcharge revenue |
(3) See GAAP to non-GAAP reconciliation in the schedules following this letter |
Intermodal Revenue xFSR was $76.1 million in the first quarter of 2017 compared to $75.9 million in the first quarter of 2016. This change was primarily driven by a 1.1% increase in Revenue xFSR per load, partially offset by a 0.8% decrease in Load Counts due to the discontinuation of our Trailer-on-Flat-Car (TOFC) service in February of 2016.
For the first quarter of 2017, the Operating Ratio in our Intermodal segment was 100.1% compared to 103.5% for the first quarter of 2016, while the Adjusted Operating Ratio was 100.1% compared to 103.8% for the same periods. The over-300 basis point improvement in each of our operating ratio metrics resulted from our continued efforts to control costs, improve dray efficiencies and optimize the network. We will continue to focus on these strategic objectives and believe we will continue to deliver year over year improvements in our Intermodal Operating Ratio metrics each quarter throughout 2017.
Other Non-Reportable Segments
Our other non-reportable segments include our logistics and brokerage services, as well as support services that our subsidiaries provide to customers and owner-operators, including repair and maintenance shop services, equipment leasing, and insurance. Intangible asset amortization related to the 2007 going-private transaction, certain legal settlements and reserves, and certain other corporate expenses are also included in the non-reportable segments.
In the first quarter of 2017, combined operating revenues from the aforementioned services, before eliminations, decreased $16.5 million compared to the same period of 2016, primarily due to reductions in logistics freight volumes and services provided to owner-operators. The operating loss in the other non-reportable segments increased $1.1 million to $5.5 million during the first quarter of 2017, compared to the first quarter of 2016, primarily due to the reductions in logistics freight volumes mentioned above.
First Quarter Consolidated Operating and Other Expenses
The table below highlights some of our cost categories for the first quarter of 2017, compared to the first quarter of 2016 and the fourth quarter of 2016, showing each as a percent of Revenue xFSR. Fuel surcharge revenue can be volatile and is primarily dependent upon the cost of fuel and not specifically related to our non-fuel operational expenses. Therefore, we believe that Revenue xFSR is a better measure for analyzing our expenses and operating metrics.
|
| | | | | | | | | | | | | | | | | | | | |
| | | | | YOY | | | | | | QOQ |
| Q1'17 | | Q1'16 | | Variance (1) | (Dollars in millions) | Q1'17 | | Q4'16 | | Variance (1) |
| Unaudited | | Unaudited |
| $ | 963.8 |
| | $ | 967.8 |
| | -0.4 | % | Operating Revenue | $ | 963.8 |
| | $ | 1,038.6 |
| | -7.2 | % |
| $ | (92.7 | ) | | $ | (60.9 | ) | | 52.3 | % | Less: Fuel Surcharge Revenue | $ | (92.7 | ) | | $ | (87.8 | ) | | 5.6 | % |
| $ | 871.1 |
| | $ | 906.9 |
| | -3.9 | % | Revenue xFSR | $ | 871.1 |
| | $ | 950.8 |
| | -8.4 | % |
| | | | | | | | | | | |
| $ | 283.3 |
| | $ | 288.6 |
| | 1.8 | % | Salaries, Wages, & Benefits | $ | 283.3 |
| | $ | 279.8 |
| | -1.3 | % |
| 32.5 | % | | 31.8 | % | | -70 bps |
| % of Revenue xFSR | 32.5 | % | | 29.4 | % | | -310 bps |
|
| | | | | | | | | | | |
| $ | 104.1 |
| | $ | 90.2 |
| | -15.4 | % | Operating Supplies & Expenses | $ | 104.1 |
| | $ | 98.8 |
| | -5.4 | % |
| 12.0 | % | | 9.9 | % | | -210 bps |
| % of Revenue xFSR | 12.0 | % | | 10.4 | % | | -160 bps |
|
| | | | | | | | | | | |
| $ | 50.2 |
| | $ | 47.7 |
| | -5.2 | % | Insurance & Claims | $ | 50.2 |
| | $ | 51.8 |
| | 3.2 | % |
| 5.8 | % | | 5.3 | % | | -50 bps |
| % of Revenue xFSR | 5.8 | % | | 5.5 | % | | -30 bps |
|
| | | | | | | | | | | |
| $ | 8.5 |
| | $ | 6.9 |
| | -23.2 | % | Communication & Utilities | $ | 8.5 |
| | $ | 7.7 |
| | -9.8 | % |
| 1.0 | % | | 0.8 | % | | -20 bps |
| % of Revenue xFSR | 1.0 | % | | 0.8 | % | | -20 bps |
|
| | | | | | | | | | | |
| $ | 18.2 |
| | $ | 18.5 |
| | 1.8 | % | Operating Taxes & Licenses | $ | 18.2 |
| | $ | 19.0 |
| | 4.2 | % |
| 2.1 | % | | 2.0 | % | | -10 bps |
| % of Revenue xFSR | 2.1 | % | | 2.0 | % | | -10 bps |
|
| |
(1) Positive numbers represent favorable variances. Negative numbers represent unfavorable variances. Variances are calculated based on the precision of the consolidated income statement, presented in thousands, included in the schedules following this letter. |
Salaries, wages, and benefits decreased $5.3 million to $283.3 million during the first quarter of 2017, compared to the first quarter of 2016, primarily due to a decrease in total miles driven by company drivers within the period and a reduction in workers' compensation and employee benefits expense, partially offset by a year over year increase in driver pay rates. Sequentially, salaries, wages, and benefits increased $3.6 million primarily due to an increase in employee benefits and workers' compensation expense, partially offset by a decrease in total miles driven by company drivers within the period.
First quarter operating supplies and expenses increased $13.9 million year over year. This increase was primarily due to an increase in legal reserves primarily associated with certain litigation within our Refrigerated segment. Sequentially, operating supplies and expenses increased $5.3 million during the first quarter of 2017 compared to the fourth quarter of 2016, primarily due to the increase in the legal reserves noted above, partially offset by reductions in numerous expense categories.
Insurance and claims expense increased $2.5 million year over year, representing 5.8% of Revenue xFSR in the first quarter of 2017, compared to 5.3% of Revenue xFSR in the first quarter of 2016. As we previously disclosed on our mid-first quarter conference call, this increase in claims expense was primarily driven by the harsh winter weather experienced throughout January and February of 2017. Sequentially, insurance and claims expense decreased $1.7 million during the first quarter of 2017. However, expressed as a percentage of Revenue xFSR, insurance and claims expense increased 30 basis points due to the seasonal revenue decline in the first quarter.
Fuel Expense
Fuel expense for the first quarter of 2017 was $95.0 million, an increase of $20.0 million from the first quarter of 2016. The increase was the result of higher fuel prices, partially offset by a decrease in the number of miles driven by company drivers and a slight improvement in fuel efficiency.
Sequentially, fuel expense increased $2.5 million during the first quarter of 2017 compared to the fourth quarter of 2016 primarily due to higher fuel prices, partially offset by a decrease in the number of miles driven by company drivers.
|
| | | | | | | | | | | | | | |
| Q1'17 | | Q1'16 | (Dollars in millions) | Q1'17 | | Q4'16 |
| Unaudited | | Unaudited |
| $ | 95.0 |
| | $ | 75.0 |
| Fuel Expense | $ | 95.0 |
| | $ | 92.5 |
|
| 9.9 | % | | 7.7 | % | % of Operating Revenue | 9.9 | % | | 8.9 | % |
Purchased Transportation
Purchased transportation includes payments to owner-operators, railroads, and other third parties we use for intermodal drayage and other brokered business.
|
| | | | | | | | | | | | | | |
| Q1'17 | | Q1'16 | (Dollars in millions) | Q1'17 | | Q4'16 |
| Unaudited | | Unaudited |
| $ | 265.5 |
| | $ | 267.3 |
| Purchased Transportation | $ | 265.5 |
| | $ | 285.8 |
|
| 27.5 | % | | 27.6 | % | % of Operating Revenue | 27.5 | % | | 27.5 | % |
Purchased transportation decreased $1.8 million year over year, primarily due to a decrease in logistics volumes and fewer miles driven by owner-operators, partially offset by an increase in fuel reimbursements to owner-operators and other third parties due to higher fuel prices.
Sequentially, purchased transportation decreased $20.2 million during the first quarter of 2017 compared to the fourth quarter of 2016, primarily due to fewer miles driven by owner-operators as well as reduced seasonal freight volumes in the first quarter compared to the fourth quarter, partially offset by an increase in fuel reimbursements to owner-operators and other third parties resulting from higher fuel prices.
Rental Expense and Depreciation & Amortization of Property and Equipment
Due to fluctuations in the number of tractors leased versus owned, we combine our rental expense with depreciation and amortization of property and equipment for analytical purposes.
|
| | | | | | | | | | | | | | |
| Q1'17 | | Q1'16 | (Dollars in millions) | Q1'17 | | Q4'16 |
| Unaudited | | Unaudited |
| $ | 55.7 |
| | $ | 56.3 |
| Rental Expense | $ | 55.7 |
| | $ | 55.9 |
|
| 6.4 | % | | 6.2 | % | % of Revenue xFSR | 6.4 | % | | 5.9 | % |
| | | | | | | |
| $ | 67.8 |
| | $ | 67.0 |
| Depreciation & Amortization of Property and Equipment | $ | 67.8 |
| | $ | 68.3 |
|
| 7.8 | % | | 7.4 | % | % of Revenue xFSR | 7.8 | % | | 7.2 | % |
| | | | | | | |
| $ | 123.5 |
| | $ | 123.3 |
| Combined Rental Expense and Depreciation | $ | 123.5 |
| | $ | 124.2 |
|
| 14.2 | % | | 13.6 | % | % of Revenue xFSR | 14.2 | % | | 13.1 | % |
Combined rental and depreciation expense in the first quarter of 2017 was relatively flat at $123.5 million while increasing 60 basis points as a percentage of Revenue xFSR from the first quarter of 2016. As previously discussed, we lowered the residual values on a certain number of tractors in August 2016 causing an on-going increase to depreciation expense. This increase was partially offset by a reduction in the total number of tractors and trailers in the fleet.
Sequentially, combined rental and depreciation expense decreased $0.7 million from the fourth quarter of 2016, due to a reduction in the total number of tractors and trailers in the fleet. Expressed as a percentage of Revenue xFSR, combined rental and depreciation expense increased 110 basis points compared to the fourth quarter of 2016, due to the seasonal decline in revenue experienced in the first quarter.
Gain or Loss on Disposal of Property and Equipment
The gain on disposal of property and equipment in the first quarter of 2017 was $4.2 million, compared to $6.3 million in the first quarter of 2016 and $1.4 million in the fourth quarter of 2016. Our first quarter gain on disposal of property and equipment was higher than our previously disclosed range due to an increase in the amount of equipment sold. For the second quarter of 2017, we expect gain on disposal of property and equipment to be in the $1-$2 million range.
Income Tax Expense
GAAP income tax expense for the first quarter of 2017 was $2.4 million, resulting in an effective tax rate of 31.3%, which was 470 basis points lower than anticipated primarily due to certain benefits relating to stock compensation deductions partially offset by capitalized transaction costs regarding the merger recognized as discrete items in the quarter. In the first quarter of 2016, our income tax provision was $13.5 million, resulting in an effective tax rate of 29.8%, which was 820 basis points lower than anticipated primarily due to certain income tax credits received by our foreign subsidiary and a reduction in our uncertain tax position reserve as discrete items in the quarter.
We expect the remaining 2017 quarterly GAAP effective tax rate to be approximately 36.0% before discrete items.
Interest Expense
Interest expense, which includes debt related interest expense and the amortization of deferred financing costs, but excludes derivative interest expense, decreased by $1.1 million in the first quarter of 2017 to $7.5 million, compared with $8.6 million for the first quarter of 2016. The decrease was due to our lower debt balances.
Debt Balances |
| | | | | | | | | | | |
| | December 31, 2016 | | Q1 2017 Changes | | March 31,
2017 |
| | Unaudited |
| | (In millions) |
| Unrestricted Cash | $ | 89.4 |
| | $ | (27.6 | ) | | $ | 61.8 |
|
| | | | | | |
A/R Securitization ($400 million) (1) | 280.0 |
| | 25.0 |
| | 305.0 |
|
| Revolver ($600 million) | 130.0 |
| | (120.0 | ) | | 10.0 |
|
Term Loan A (1) | 494.3 |
| | (22.5 | ) | | 471.8 |
|
| Capital Leases & Other Debt | 242.8 |
| | (24.9 | ) | | 217.9 |
|
| Total Debt | $ | 1,147.1 |
| | $ | (142.4 | ) | | $ | 1,004.7 |
|
| | | | | | |
| Net Debt | $ | 1,057.7 |
| | $ | (114.8 | ) | | $ | 942.9 |
|
| |
(1) Amounts presented represent face value | | | | | |
Our leverage ratio as of March 31, 2017 decreased to 1.89 compared to 1.98 as of December 31, 2016. This decrease was primarily the result of the timing of capital expenditures thus far in 2017. Similar to 2016, we expect our Net Debt balance to increase for the remainder of the year as our net cash capital expenditures are expected to increase compared to the modest amount incurred in the first quarter of 2017.
During the first quarter of 2017, we repaid $120.0 million on our revolving credit line and prepaid $22.5 million of our Term Loan A, funded from operating cash flows. Following the $22.5 million Term Loan A prepayment in January 2017, all remaining scheduled payments on our Term Loan A have now been prepaid through its maturity in July 2020.
* Data prior to Q3 2013 has not been recast for acquisitions
Cash Flow and Capital Expenditures
We continue to generate positive cash flows from operations. During the quarter ended March 31, 2017, we generated $118.9 million of cash flows from operating activities compared with $132.1 million during the same period of 2016. Cash used in investing activities was $5.2 million, of which capital expenditures were $35.6 million, offset by proceeds from the sale of property and equipment of $27.1 million. Cash used in financing activities for the quarter ended March 31, 2017 was $141.4 million including $120.0 million of net repayments on our revolving line of credit, as well as $47.4 million in repayment of long-term debt and capital leases, partially offset by $25.0 million of borrowings under our accounts receivable securitization.
Summary
The industry headwinds and market environment in the first quarter have been tough on all carriers. However, our entire organization remains committed to controlling costs, increasing our asset utilization, and seeking opportunities to improve pricing and grow revenue. Our strategy remains to position ourselves with our customers and suppliers to benefit from the anticipated capacity contraction, which we believe is inevitable over the next 12 months. In addition, we will work diligently to bring the merger with Knight Transportation to a close, which we expect to occur in the third quarter of 2017.
Once again, we would like to thank all of our hard-working employees and the professional owner-operators who have contracted with us, as well as our loyal customers and stockholders, for their continued support of Swift as we strive towards Delivering a Better LifeSM to our drivers, customers, and stockholders.
Conference Call Q&A Session
Swift Transportation's management team will host a Q&A session at 11:00 a.m. Eastern Time on Tuesday, April 25, 2017 to answer questions about the Company’s first quarter financial results. Please email your questions to Investor_Relations@swifttrans.com prior to 7:00 p.m. Eastern Time on Monday, April 24, 2017.
Participants may access the call using the following dial-in numbers:
U.S./Canada: (877) 897-8479
International/Local: (706) 501-7951
Conference ID: 7771720
The live webcast, letter to stockholders, transcript of the Q&A, and the replay of the earnings Q&A session can be accessed via our investor relations website at investor.swifttrans.com.
IR Contacts:
|
| | |
| Ginnie Henkels | | Taylor Varley |
| Executive Vice President & | | Director of Finance & |
| Chief Financial Officer | | Investor Relations |
| (602) 269-9700 | | (602) 477-7052 |
Forward Looking Statements
This letter contains statements that may constitute forward-looking statements, which are based on information currently available, usually identified by words such as "anticipates," "believes," "estimates," "plans,'' "projects," "expects," "hopes," "intends," "will," "could," "should," "may," or similar expressions which speak only as of the date the statement was made. Such forward-looking statements are made pursuant to the safe harbor provisions of the Private Securities Litigation Reform Act of 1995. Such statements include, but are not limited to, statements concerning:
| |
| • | trends and expectations relating to our operations, expenses, other revenue, pricing, utilization, profitability, net debt, and related metrics; |
| |
| • | our estimated capital expenditures, gains on dispositions, EPS, and Adjusted EPS for 2017; |
| |
| • | our expected 2017 effective tax rate before discrete items; |
| |
| • | our beliefs regarding industry trends, including a difficult operating environment in Q2 2017, that capacity contracture is inevitable in the next 12 months, and that we are positioning ourselves to rebound when market dynamics improve; |
| |
| • | that we can make further improvements in Dedicated and Intermodal segment results; and |
| |
| • | our expectations regarding the timing and impact of our merger with Knight Transportation. |
Such forward-looking statements are inherently uncertain, and are based upon the current beliefs, assumptions, and expectations of Company management and current market conditions, which are subject to significant risks and uncertainties as set forth in the Risk Factors section of our Annual Report on Form 10-K for the year ended December 31, 2016. As to the Company’s business and financial performance, the following factors, among others, could cause actual results to differ materially from those in forward-looking statements:
| |
| • | economic conditions, including future recessionary economic cycles and downturns in customers’ business cycles, particularly in market segments and industries in which we have a significant concentration of customers; |
| |
| • | increasing competition from trucking, rail, intermodal, and brokerage competitors; |
| |
| • | our ability to execute or integrate any future acquisitions successfully; |
| |
| • | increases in driver compensation to the extent not offset by increases in freight rates and difficulties in driver recruitment and retention; |
| |
| • | additional risks arising from our contractual arrangements with owner-operators that do not exist with Company drivers; |
| |
| • | our ability to retain or replace key personnel; |
| |
| • | our dependence on third parties for intermodal and brokerage business; |
| |
| • | potential failure in computer or communications systems; |
| |
| • | seasonal factors such as severe weather conditions that increase operating costs; |
| |
| • | the regulatory environment in which we operate, including existing regulations and changes in existing regulations, or violations by us of existing or future regulations; |
| |
| • | the possible re-classification of owner-operators as employees; |
| |
| • | changes in rules or legislation by the National Labor Relations Board, Congress or states, and/or union organizing efforts; |
| |
| • | our Compliance Safety Accountability safety rating; |
| |
| • | government regulations with respect to our captive insurance companies; |
| |
| • | uncertainties and risks associated with our operations in Mexico; |
| |
| • | a significant reduction in, or termination of, our trucking services by a key customer; |
| |
| • | our significant ongoing capital requirements; |
| |
| • | volatility in the price or availability of fuel, as well as our ability to recover fuel prices through our fuel surcharge program; |
| |
| • | fluctuations in new and used equipment prices or replacement costs, and the potential failure of manufacturers to meet their sale and trade-back obligations; |
| |
| • | the impact that our leverage may have on the way we operate our business and our ability to service our debt, including compliance with our debt covenants; |
| |
| • | restrictions contained in our debt agreements; |
| |
| • | adverse impacts of insuring risk through our captive insurance companies, including our need to provide restricted cash and similar collateral for anticipated losses; |
| |
| • | potential volatility or decrease in the amount of earnings as a result of our claims exposure through our captive insurance companies and third-party insurance; |
| |
| • | the potential impact of the significant number of shares of our common stock that is eligible for future sale; |
| |
| • | that we currently do not pay dividends; |
| |
| • | the significant amount of our stock owned by controlling shareholder and board member Jerry Moyes and the related control over the company; |
| |
| • | related-party transactions between the Company and Jerry Moyes; and |
| |
| • | conflicts of interest or potential litigation that may arise from other businesses owned by Jerry Moyes, including pledges of Swift stock and guarantees by Jerry Moyes related to other businesses. |
You should understand that many important factors, in addition to those listed above and in our filings with the SEC, could impact us financially. As a result of these and other factors, actual results may differ from those set forth in the forward-looking statements and the prices of the Company's securities may dramatically fluctuate. The Company makes no commitment, and disclaims any duty, to update or revise any forward-looking statements to reflect future events, new information or changes in these expectations, except as required by law.
Use of Non-GAAP Measures
In addition to our GAAP results, this Letter to Stockholders also includes certain non-GAAP financial measures, as defined by the SEC. The terms "Adjusted EPS," "Adjusted Operating Ratio," and "Adjusted EBITDA," as we define them, are not presented in accordance with GAAP. These financial measures supplement our GAAP results in evaluating certain aspects of our business. We believe that using these measures improves comparability in analyzing our performance because they remove the impact of items from our operating results that, in our opinion, do not reflect our core operating performance. Management and the board of directors focus on Adjusted EPS, Adjusted Operating Ratio and Adjusted EBITDA as key measures of our performance, all of which are reconciled to the most comparable GAAP financial measures and further discussed below. We believe our presentation of these non-GAAP financial measures is useful because it provides investors and securities analysts the same information that we use internally for purposes of assessing our core operating performance and compliance with debt covenants.
Adjusted EPS, Adjusted Operating Ratio, and Adjusted EBITDA are not substitutes for their comparable GAAP financial measures, such as net income, cash flows from operating activities, operating margin, or other measures prescribed by GAAP. There are limitations to using non-GAAP financial measures. Although we believe that they improve comparability in analyzing our period to period performance, they could limit comparability to other companies in our industry if those companies define these measures differently. Because of these limitations, our non-GAAP financial measures should not be considered measures of income generated by our business or discretionary cash available to us to invest in the growth of our business. Management compensates for these limitations by primarily relying on GAAP results and using non-GAAP financial measures on a supplemental basis.
CONSOLIDATED INCOME STATEMENTS (UNAUDITED)
QUARTER ENDED MARCH 31, 2017 AND 2016
|
| | | | | | | |
| | Quarter Ended March 31, |
| | 2017 | | 2016 |
| | (In thousands, except per share data) |
| Operating revenue: | | | |
| Revenue, excluding fuel surcharge revenue | $ | 871,090 |
| | $ | 906,913 |
|
| Fuel surcharge revenue | 92,741 |
| | 60,910 |
|
| Operating revenue | 963,831 |
| | 967,823 |
|
| Operating expenses: | | | |
| Salaries, wages, and employee benefits | 283,338 |
| | 288,633 |
|
| Operating supplies and expenses | 104,119 |
| | 90,215 |
|
| Fuel | 94,961 |
| | 74,987 |
|
| Purchased transportation | 265,511 |
| | 267,309 |
|
| Rental expense | 55,694 |
| | 56,252 |
|
| Insurance and claims | 50,176 |
| | 47,710 |
|
| Depreciation and amortization of property and equipment | 67,769 |
| | 66,951 |
|
| Amortization of intangibles | 4,204 |
| | 4,204 |
|
| Gain on disposal of property and equipment | (4,195 | ) | | (6,326 | ) |
| Communication and utilities | 8,503 |
| | 6,900 |
|
| Operating taxes and licenses | 18,166 |
| | 18,505 |
|
| Total operating expenses | 948,246 |
| | 915,340 |
|
| Operating income | 15,585 |
| | 52,483 |
|
| Other expenses (income): | | | |
| Interest expense | 7,521 |
| | 8,594 |
|
| Interest income | (488 | ) | | (751 | ) |
| Merger transaction costs | 2,157 |
| | — |
|
| Other income, net | (1,183 | ) | | (776 | ) |
| Total other expenses (income), net | 8,007 |
| | 7,067 |
|
| Income before income taxes | 7,578 |
| | 45,416 |
|
| Income tax expense | 2,371 |
| | 13,511 |
|
| Net income | $ | 5,207 |
| | $ | 31,905 |
|
| Basic earnings per share | $ | 0.04 |
| | $ | 0.23 |
|
| Diluted earnings per share | $ | 0.04 |
| | $ | 0.23 |
|
| Shares used in per share calculations: | | | |
| Basic | 133,147 |
| | 136,519 |
|
| Diluted | 134,089 |
| | 137,655 |
|
NON-GAAP RECONCILIATION:
ADJUSTED EPS (UNAUDITED) (1)
QUARTER ENDED MARCH 31, 2017, 2016, AND 2015
Note: Since the numbers reflected in the table below are calculated on a per share basis, they may not foot due to rounding.
|
| | | | | | | | | | | |
| | Quarter Ended March 31, |
| | 2017 | | 2016 | | 2015 |
| Diluted earnings per share | $ | 0.04 |
| | $ | 0.23 |
| | $ | 0.26 |
|
| Adjusted for: | | | | | |
| Income tax expense | 0.02 |
| | 0.10 |
| | 0.16 |
|
| Income before income taxes | 0.06 |
| | 0.33 |
| | 0.43 |
|
Non-cash impairments of non-operating assets (2) | — |
| | — |
| | 0.01 |
|
Amortization of certain intangibles (3) | 0.03 |
| | 0.03 |
| | 0.03 |
|
Excludable transaction costs – merger (4) | 0.02 |
| | — |
| | — |
|
| Adjusted income before income taxes | 0.10 |
| | 0.36 |
| | 0.46 |
|
| Provision for income tax expense at effective rate | (0.03 | ) | | (0.11 | ) | | (0.18 | ) |
| Adjusted EPS | $ | 0.07 |
| | $ | 0.25 |
| | $ | 0.29 |
|
| |
| (1) | Our definition of the non-GAAP measure, Adjusted EPS, starts with (a) income (loss) before income taxes, the most comparable GAAP measure. We add the following items back to (a) to arrive at (b) adjusted income (loss) before income taxes: |
| |
| (i) | amortization of the intangibles from our 2007 going-private transaction, |
| |
| (ii) | non-cash impairments, |
| |
| (iii) | other special non-cash items, |
| |
| (iv) | excludable transaction costs, |
| |
| (v) | mark-to-market adjustments on our interest rate swaps, recognized in the income statement, |
| |
| (vi) | amortization of previous losses recorded in accumulated other comprehensive income (loss) ("AOCI") related to the interest rate swaps we terminated upon our IPO and refinancing transactions in December 2010, and |
| |
| (vii) | severance expense, including cash and equity award impact, related to the departure of certain executive leadership. |
We subtract income taxes, at the GAAP effective tax rate, as applied to adjusted income before income taxes, from (b) to arrive at (c) adjusted earnings. Adjusted EPS is equal to (c) divided by weighted average diluted shares outstanding.
We believe that excluding the impact of derivatives provides for more transparency and comparability since these transactions have historically been volatile. Additionally, we believe that comparability of our performance is improved by excluding impairments that are unrelated to our core operations, as well as intangibles from the 2007 going-private transactions and other special items that are non-comparable in nature.
| |
| (2) | During the three months ended March 31, 2015, Swift Transportation Company ("the Company") recorded an impairment loss related to an uncollectible note receivable. In September 2013, the Company agreed to advance up to $2.3 million, pursuant to an unsecured promissory note, to an independent fleet contractor that transported freight on Swift's behalf. In March 2015, management became aware that the independent contractor violated various covenants outlined in the unsecured promissory note, which created an event of default that made the principal and accrued interest immediately due and payable. As a result of this event of default, as well as an overall decline in the independent contractor's financial condition, management re-evaluated the fair value of the unsecured promissory note. At March 31, 2015, management determined that the remaining balance due from the independent contractor to the Company was not collectible, which resulted in a $1.5 million pre-tax impairment that was recorded in "Non-cash impairments of non-operating assets" in the Company's consolidated income statements. |
| |
| (3) | Amortization of certain intangibles reflects the non-cash amortization expense relating to certain intangible assets identified in the 2007 going-private transaction through which Swift Corporation acquired Swift Transportation Co. |
| |
| (4) | On April 10, 2017, Swift Transportation Company ("Swift") and Knight Transportation, Inc. ("Knight") announced the Board approval of a merger of Knight and Swift in an all-stock transaction. The combined company will be named Knight-Swift Transportation Holdings Inc. ("Knight-Swift"). Swift incurred certain transactional expenses associated with the planned merger, which are added back for Adjusted EPS purposes. |
NON-GAAP RECONCILIATION:
ADJUSTED OPERATING RATIO (UNAUDITED) (1)
QUARTER ENDED MARCH 31, 2017, 2016, AND 2015
|
| | | | | | | | | | | |
| | Quarter Ended March 31, |
| | 2017 | | 2016 | | 2015 |
| | (Dollars in thousands) |
| Operating revenue | $ | 963,831 |
| | $ | 967,823 |
| | $ | 1,015,144 |
|
| Less: Fuel surcharge revenue | (92,741 | ) | | (60,910 | ) | | (120,280 | ) |
| Revenue, excluding fuel surcharge revenue | $ | 871,090 |
| | $ | 906,913 |
| | $ | 894,864 |
|
| | | | | | |
| Operating expense | $ | 948,246 |
| | $ | 915,340 |
| | $ | 940,144 |
|
| Adjusted for: | | | | | |
| Fuel surcharge revenue | (92,741 | ) | | (60,910 | ) | | (120,280 | ) |
Amortization of certain intangibles (2) | (3,912 | ) | | (3,912 | ) | | (3,912 | ) |
| Adjusted operating expense | $ | 851,593 |
| | $ | 850,518 |
| | $ | 815,952 |
|
| Operating Ratio | 98.4 | % | | 94.6 | % | | 92.6 | % |
| Adjusted Operating Ratio | 97.8 | % | | 93.8 | % | | 91.2 | % |
| |
| (1) | Our definition of the non-GAAP measure, Adjusted Operating Ratio, starts with (a) operating expense and (b) operating revenue, which are GAAP financial measures. We subtract the following items from (a) to arrive at (c) adjusted operating expense: |
| |
| (i) | fuel surcharge revenue, |
| |
| (ii) | amortization of the intangibles from our 2007 going-private transaction, |
| |
| (iii) | non-cash operating impairment charges, |
| |
| (iv) | other special non-cash items, |
| |
| (v) | excludable transaction costs, and |
| |
| (vi) | severance expense, including cash and equity award impact, related to the departure of certain executive leadership. |
We then subtract fuel surcharge revenue from (b) to arrive at (d) Revenue xFSR. Adjusted Operating Ratio is equal to (c) adjusted operating expense as a percentage of (d) Revenue xFSR.
We net fuel surcharge revenue against fuel expense in the calculation of our Adjusted Operating Ratio, thereby excluding fuel surcharge revenue from operating revenue in the denominator. Because fuel surcharge revenue is so volatile, we believe excluding it provides for more transparency and comparability. Additionally, we believe that comparability of our performance is improved by excluding impairments, non-comparable intangibles from our 2007 going-private transaction, and other special items.
| |
| (2) | Includes the items discussed in note (3) to the Non-GAAP Reconciliation: Adjusted EPS. |
NON-GAAP RECONCILIATION:
ADJUSTED EARNINGS BEFORE INTEREST, TAXES, DEPRECIATION, AND AMORTIZATION (UNAUDITED) (1)
QUARTER ENDED MARCH 31, 2017, 2016, AND 2015
|
| | | | | | | | | | | |
| | Quarter Ended March 31, |
| | 2017 | | 2016 | | 2015 |
| | (In thousands) |
| Net income | $ | 5,207 |
| | $ | 31,905 |
| | $ | 37,840 |
|
| Adjusted for: | | | | | |
| Depreciation and amortization of property and equipment | 67,769 |
| | 66,951 |
| | 56,927 |
|
| Amortization of intangibles | 4,204 |
| | 4,204 |
| | 4,204 |
|
| Interest expense | 7,521 |
| | 8,594 |
| | 10,388 |
|
| Derivative interest expense | — |
| | — |
| | 2,793 |
|
| Interest income | (488 | ) | | (751 | ) | | (587 | ) |
| Income tax expense | 2,371 |
| | 13,511 |
| | 23,691 |
|
| Earnings before interest, taxes, depreciation and amortization (EBITDA) | 86,584 |
| | 124,414 |
| | 135,256 |
|
Non-cash equity compensation (2) | 2,673 |
| | 1,417 |
| | 1,483 |
|
Excludable transaction costs – merger (3) | 2,157 |
| | — |
| | — |
|
Non-cash impairments of non-operating assets (4) | — |
| | — |
| | 1,480 |
|
| Adjusted earnings before interest, taxes, depreciation and amortization (Adjusted EBITDA) | $ | 91,414 |
| | $ | 125,831 |
| | $ | 138,219 |
|
| |
| (1) | Our definition of the non-GAAP measure, Adjusted EBITDA, starts with (a) net income (loss), the most comparable GAAP measure. We add the following items back to (a) to arrive at Adjusted EBITDA: |
| |
| (i) | depreciation and amortization, |
| |
| (ii) | interest and derivative interest expense, including fees and charges associated with indebtedness, net of interest income, |
| |
| (iv) | non-cash equity compensation expense, |
| |
| (vi) | other special non-cash items, and |
| |
| (vii) | excludable transaction costs. |
We believe that Adjusted EBITDA is a relevant measure for estimating the cash generated by our operations that would be available to cover capital expenditures, taxes, interest, and other investments and that it enhances an investor’s understanding of our financial performance. We use Adjusted EBITDA for business planning purposes and in measuring our performance. Our method of computing Adjusted EBITDA is consistent with that used in our debt covenants, specifically our leverage ratio, and is also routinely reviewed by management for that purpose.
| |
| (2) | Represents recurring non-cash equity compensation expense, on a pre-tax basis. In accordance with the terms of our senior credit agreement, this expense is added back in the calculation of Adjusted EBITDA for covenant compliance purposes. |
| |
| (3) | Includes the item discussed in note (4) to the Non-GAAP Reconciliation: Adjusted EPS. |
| |
| (4) | Includes the item discussed in note (2) to the Non-GAAP Reconciliation: Adjusted EPS. |
FINANCIAL INFORMATION BY SEGMENT (UNAUDITED (RECAST))
QUARTER ENDED MARCH 31, 2017, 2016, AND 2015
|
| | | | | | | | | | | |
| | Quarter Ended March 31, |
| | 2017 | | 2016 (recast) (3) | | 2015 (recast) (3) |
| | (Dollars in thousands) |
| Operating revenue: | | | | | |
| Truckload | $ | 481,546 |
| | $ | 492,522 |
| | $ | 538,341 |
|
| Dedicated | 150,836 |
| | 142,911 |
| | 135,929 |
|
| Refrigerated | 177,491 |
| | 169,688 |
| | 177,414 |
|
| Intermodal | 86,233 |
| | 82,548 |
| | 90,354 |
|
| Subtotal | 896,106 |
| | 887,669 |
| | 942,038 |
|
Non-reportable segments (1) | 82,714 |
| | 99,248 |
| | 91,622 |
|
| Intersegment eliminations | (14,989 | ) | | (19,094 | ) | | (18,516 | ) |
| Consolidated operating revenue | $ | 963,831 |
| | $ | 967,823 |
| | $ | 1,015,144 |
|
| | | | | | |
| Operating income (loss): | | | | | |
| Truckload | $ | 15,917 |
| | $ | 36,287 |
| | $ | 56,854 |
|
| Dedicated | 11,613 |
| | 18,741 |
| | 11,073 |
|
| Refrigerated | (6,335 | ) | | 4,785 |
| | 8,071 |
|
| Intermodal | (109 | ) | | (2,908 | ) | | (1,243 | ) |
| Subtotal | 21,086 |
| | 56,905 |
| | 74,755 |
|
Non-reportable segments (1) | (5,501 | ) | | (4,422 | ) | | 245 |
|
| Consolidated operating income | $ | 15,585 |
| | $ | 52,483 |
| | $ | 75,000 |
|
| | | | | | |
| Operating ratio: | | | | | |
| Truckload | 96.7 | % | | 92.6 | % | | 89.4 | % |
| Dedicated | 92.3 | % | | 86.9 | % | | 91.9 | % |
| Refrigerated | 103.6 | % | | 97.2 | % | | 95.5 | % |
| Intermodal | 100.1 | % | | 103.5 | % | | 101.4 | % |
| | | | | | |
Adjusted Operating Ratio (2): | | | | | |
| Truckload | 96.3 | % | | 92.0 | % | | 87.9 | % |
| Dedicated | 91.5 | % | | 86.0 | % | | 90.7 | % |
| Refrigerated | 103.9 | % | | 97.1 | % | | 94.9 | % |
| Intermodal | 100.1 | % | | 103.8 | % | | 101.6 | % |
| |
| (1) | The non-reportable segments include the Company's logistics and freight brokerage services, as well as support services that its subsidiaries provide to customers and owner-operators, including repair and maintenance shop services, equipment leasing, and insurance. Intangible asset amortization related to the 2007 going-private transaction, certain legal settlements and reserves, and certain other corporate expenses are also included in the non-reportable segments. |
| |
| (2) | For more details, refer to the Non-GAAP Reconciliation: Adjusted Operating Ratio by Segment. |
| |
| (3) | During the quarter ended March 31, 2017, the Company reorganized its reportable segments to reflect management’s revised reporting structure of its Dedicated and Refrigerated (formerly “Swift Refrigerated”) reportable segments. In association with the reorganization, the operations of the Company's dedicated grocery line of business, which were previously reported within the Company’s Dedicated segment, are now reported within the Company's Refrigerated segment. This resulted in all temperature-controlled lines of business reporting under the Refrigerated segment. Prior periods have been retrospectively adjusted to align with the current period presentation. |
OPERATING STATISTICS BY SEGMENT (UNAUDITED (RECAST))
QUARTER ENDED MARCH 31, 2017, 2016, AND 2015
|
| | | | | | | | | | | |
| | Quarter Ended March 31, |
| | 2017 | | 2016 (recast) (2) | | 2015 (recast) (2) |
| Truckload: | | | | | |
| Weekly Revenue xFSR per tractor | $ | 3,339 |
| | $ | 3,292 |
| | $ | 3,461 |
|
Total loaded miles (1) | 238,218 |
| | 246,137 |
| | 254,926 |
|
| Average operational truck count: | | | | | |
| Company | 7,173 |
| | 7,673 |
| | 7,334 |
|
| Owner-operator | 2,833 |
| | 2,977 |
| | 3,201 |
|
| Total | 10,006 |
| | 10,650 |
| | 10,535 |
|
| Deadhead miles percentage | 11.6 | % | | 12.5 | % | | 11.8 | % |
| | | | | | |
| Dedicated: | | | | | |
| Weekly Revenue xFSR per tractor | $ | 3,461 |
| | $ | 3,339 |
| | $ | 3,107 |
|
| Average operational truck count: | | | | | |
| Company | 2,651 |
| | 2,711 |
| | 2,575 |
|
| Owner-operator | 423 |
| | 368 |
| | 394 |
|
| Total | 3,074 |
| | 3,079 |
| | 2,969 |
|
| | | | | | |
| Refrigerated: | | | | | |
| Weekly Revenue xFSR per tractor | $ | 3,690 |
| | $ | 3,574 |
| | $ | 3,384 |
|
Total loaded miles (1) | 88,235 |
| | 89,134 |
| | 86,481 |
|
| Average operational truck count: | | | | | |
| Company | 2,388 |
| | 2,457 |
| | 2,570 |
|
| Owner-operator | 1,023 |
| | 1,052 |
| | 1,074 |
|
| Total | 3,411 |
| | 3,509 |
| | 3,644 |
|
| Deadhead miles percentage | 7.4 | % | | 7.8 | % | | 7.9 | % |
| | | | | | |
| Intermodal: | | | | | |
| Average operational truck count: | | | | | |
| Company | 413 |
| | 474 |
| | 481 |
|
| Owner-operator | 85 |
| | 96 |
| | 87 |
|
| Total | 498 |
| | 570 |
| | 568 |
|
| Load Count | 40,666 |
| | 40,997 |
| | 41,940 |
|
| Average Container Count | 9,130 |
| | 9,150 |
| | 9,150 |
|
| |
| (1) | Total loaded miles presented in thousands. |
| |
| (2) | During the quarter ended March 31, 2017, the Company reorganized its reportable segments to reflect management’s revised reporting structure of its Dedicated and Refrigerated (formerly “Swift Refrigerated”) reportable segments. In association with the reorganization, the operations of the Company's dedicated grocery line of business, which were previously reported within the Company’s Dedicated segment, are now reported within the Company's Refrigerated segment. This resulted in all temperature-controlled lines of business reporting under the Refrigerated segment. Prior periods have been retrospectively adjusted to align with the current period presentation. |
NON-GAAP RECONCILIATION:
ADJUSTED OPERATING RATIO BY SEGMENT (UNAUDITED (RECAST))
QUARTER ENDED MARCH 31, 2017, 2016, AND 2015
|
| | | | | | | | | | | |
| | Quarter Ended March 31, |
| | 2017 | | 2016 (recast) (1) | | 2015 (recast) (1) |
| | (Dollars in thousands) |
| Truckload: | | | | | |
| Operating revenue | $ | 481,546 |
| | $ | 492,522 |
| | $ | 538,341 |
|
| Less: Fuel surcharge revenue | (51,941 | ) | | (36,705 | ) | | (69,561 | ) |
| Revenue xFSR | $ | 429,605 |
| | $ | 455,817 |
| | $ | 468,780 |
|
| | | | | | |
| Operating expense | $ | 465,629 |
| | $ | 456,235 |
| | $ | 481,487 |
|
| Adjusted for: Fuel surcharge revenue | (51,941 | ) | | (36,705 | ) | | (69,561 | ) |
| Adjusted operating expense | $ | 413,688 |
| | $ | 419,530 |
| | $ | 411,926 |
|
| Operating Ratio | 96.7 | % | | 92.6 | % | | 89.4 | % |
| Adjusted Operating Ratio | 96.3 | % | | 92.0 | % | | 87.9 | % |
| | | | | | |
| Dedicated: | | | | | |
| Operating revenue | $ | 150,836 |
| | $ | 142,911 |
| | $ | 135,929 |
|
| Less: Fuel surcharge revenue | (14,011 | ) | | (9,222 | ) | | (17,276 | ) |
| Revenue xFSR | $ | 136,825 |
| | $ | 133,689 |
| | $ | 118,653 |
|
| | | | | | |
| Operating expense | $ | 139,223 |
| | $ | 124,170 |
| | $ | 124,856 |
|
| Adjusted for: Fuel surcharge revenue | (14,011 | ) | | (9,222 | ) | | (17,276 | ) |
| Adjusted operating expense | $ | 125,212 |
| | $ | 114,948 |
| | $ | 107,580 |
|
| Operating Ratio | 92.3 | % | | 86.9 | % | | 91.9 | % |
| Adjusted Operating Ratio | 91.5 | % | | 86.0 | % | | 90.7 | % |
| | | | | | |
| Refrigerated: | | | | | |
| Operating revenue | $ | 177,491 |
| | $ | 169,688 |
| | $ | 177,414 |
|
| Less: Fuel surcharge revenue | (15,648 | ) | | (6,699 | ) | | (18,834 | ) |
| Revenue xFSR | $ | 161,843 |
| | $ | 162,989 |
| | $ | 158,580 |
|
| | | | | | |
| Operating expense | $ | 183,826 |
| | $ | 164,903 |
| | $ | 169,343 |
|
| Adjusted for: Fuel surcharge revenue | (15,648 | ) | | (6,699 | ) | | (18,834 | ) |
| Adjusted operating expense | $ | 168,178 |
| | $ | 158,204 |
| | $ | 150,509 |
|
| Operating Ratio | 103.6 | % | | 97.2 | % | | 95.5 | % |
| Adjusted Operating Ratio | 103.9 | % | | 97.1 | % | | 94.9 | % |
| | | | | | |
| Intermodal: | | | | | |
| Operating revenue | $ | 86,233 |
| | $ | 82,548 |
| | $ | 90,354 |
|
| Less: Fuel surcharge revenue | (10,151 | ) | | (6,692 | ) | | (13,090 | ) |
| Revenue xFSR | $ | 76,082 |
| | $ | 75,856 |
| | $ | 77,264 |
|
| | | | | | |
| Operating expense | $ | 86,342 |
| | $ | 85,456 |
| | $ | 91,597 |
|
| Adjusted for: Fuel surcharge revenue | (10,151 | ) | | (6,692 | ) | | (13,090 | ) |
| Adjusted operating expense | $ | 76,191 |
| | $ | 78,764 |
| | $ | 78,507 |
|
| Operating Ratio | 100.1 | % | | 103.5 | % | | 101.4 | % |
| Adjusted Operating Ratio | 100.1 | % | | 103.8 | % | | 101.6 | % |
| | | | | | |
| |
| (1) | During the quarter ended March 31, 2017, the Company reorganized its reportable segments to reflect management’s revised reporting structure of its Dedicated and Refrigerated (formerly “Swift Refrigerated”) reportable segments. In association with the reorganization, the operations of the Company's dedicated grocery line of business, which were previously reported within the Company’s Dedicated segment, are now reported within the Company's Refrigerated segment. This resulted in all temperature-controlled lines of business reporting under the Refrigerated segment. Prior periods have been retrospectively adjusted to align with the current period presentation. |
CONSOLIDATED EQUIPMENT (UNAUDITED)
AS OF MARCH 31, 2017, DECEMBER 31, 2016, AND MARCH 31, 2016
AND
AVERAGE OPERATIONAL TRUCK COUNT (UNAUDITED)
QUARTER ENDED MARCH 31, 2017, 2016, AND 2015
|
| | | | | | | | |
| | March 31,
2017 | | December 31, 2016 | | March 31,
2016 |
| Tractors | | | | | |
| Company: | | | | | |
| Owned | 6,604 |
| | 6,735 |
| | 7,122 |
|
| Leased – capital leases | 1,775 |
| | 1,968 |
| | 2,009 |
|
| Leased – operating leases | 5,638 |
| | 5,234 |
| | 5,855 |
|
| Total company tractors | 14,017 |
| | 13,937 |
| | 14,986 |
|
| Owner-operator: | | | | | |
| Financed through the Company | 3,134 |
| | 3,272 |
| | 3,598 |
|
| Other | 1,505 |
| | 1,157 |
| | 1,274 |
|
| Total owner-operator tractors | 4,639 |
| | 4,429 |
| | 4,872 |
|
| Total tractors | 18,656 |
| | 18,366 |
| | 19,858 |
|
| Trailers | 63,207 |
| | 64,066 |
| | 63,891 |
|
| Containers | 9,130 |
| | 9,131 |
| | 9,150 |
|
|
| | | | | | | | |
| | Quarter Ended March 31, |
| | 2017 | | 2016 | | 2015 |
Average operational truck count (1) : | | | | | |
| Company | 12,681 |
| | 13,364 |
| | 12,988 |
|
| Owner-operator | 4,364 |
| | 4,493 |
| | 4,756 |
|
| Total | 17,045 |
| | 17,857 |
| | 17,744 |
|
| |
| (1) | Includes trucks within our non-reportable segments. |
CONDENSED CONSOLIDATED BALANCE SHEETS (UNAUDITED)
AS OF MARCH 31, 2017 AND DECEMBER 31, 2016
|
| | | | | | | |
| | March 31,
2017 | | December 31, 2016 |
| ASSETS | (In thousands) |
| Current assets: | | | |
| Cash and cash equivalents | $ | 61,770 |
| | $ | 89,391 |
|
| Cash and cash equivalents – restricted | 54,945 |
| | 57,046 |
|
| Restricted investments, held to maturity, amortized cost | 22,859 |
| | 22,717 |
|
| Accounts receivable, net | 396,251 |
| | 408,593 |
|
| Equipment sales receivable | 2,243 |
| | — |
|
| Income tax refund receivable | 272 |
| | 206 |
|
| Inventories and supplies | 16,663 |
| | 16,630 |
|
| Assets held for sale | 5,333 |
| | 6,969 |
|
| Prepaid taxes, licenses, insurance, and other | 48,557 |
| | 47,038 |
|
| Current portion of notes receivable | 6,414 |
| | 6,961 |
|
| Total current assets | 615,307 |
| | 655,551 |
|
| Property and equipment, at cost: | | | |
| Revenue and service equipment | 2,229,531 |
| | 2,266,137 |
|
| Land | 132,335 |
| | 132,084 |
|
| Facilities and improvements | 283,949 |
| | 281,390 |
|
| Furniture and office equipment | 109,189 |
| | 113,880 |
|
| Total property and equipment | 2,755,004 |
| | 2,793,491 |
|
| Less: accumulated depreciation and amortization | (1,271,973 | ) | | (1,244,890 | ) |
| Net property and equipment | 1,483,031 |
| | 1,548,601 |
|
| Other assets | 23,511 |
| | 21,953 |
|
| Intangible assets, net | 262,101 |
| | 266,305 |
|
| Goodwill | 253,256 |
| | 253,256 |
|
| Total assets | $ | 2,637,206 |
| | $ | 2,745,666 |
|
| LIABILITIES AND STOCKHOLDERS’ EQUITY | | | |
| Current liabilities: | | | |
| Accounts payable | $ | 114,147 |
| | $ | 115,063 |
|
| Accrued liabilities | 163,033 |
| | 132,712 |
|
| Current portion of claims accruals | 86,191 |
| | 80,866 |
|
Current portion of long-term debt (1) | 5,946 |
| | 8,459 |
|
| Current portion of capital lease obligations | 60,060 |
| | 72,473 |
|
| Total current liabilities | 429,377 |
| | 409,573 |
|
| Revolving line of credit | 10,000 |
| | 130,000 |
|
Long-term debt, less current portion (1) | 470,932 |
| | 493,346 |
|
| Capital lease obligations, less current portion | 151,468 |
| | 161,463 |
|
| Claims accruals, less current portion | 174,662 |
| | 165,726 |
|
| Deferred income taxes | 408,795 |
| | 427,722 |
|
| Accounts receivable securitization | 304,374 |
| | 279,285 |
|
| Other liabilities | 5,804 |
| | 6,296 |
|
| Total liabilities | 1,955,412 |
| | 2,073,411 |
|
| Stockholders’ equity: | | | |
| Preferred stock | — |
| | — |
|
| Class A common stock | 835 |
| | 833 |
|
| Class B common stock | 497 |
| | 497 |
|
Additional paid-in capital (2)(3) | 688,234 |
| | 701,065 |
|
Accumulated deficit (2)(3) | (7,874 | ) | | (30,242 | ) |
| Noncontrolling interest | 102 |
| | 102 |
|
| Total stockholders’ equity | 681,794 |
| | 672,255 |
|
| Total liabilities and stockholders’ equity | $ | 2,637,206 |
| | $ | 2,745,666 |
|
CONDENSED CONSOLIDATED BALANCE SHEETS (UNAUDITED) — CONTINUED
AS OF MARCH 31, 2017 AND DECEMBER 31, 2016
Notes to Condensed Consolidated Balance Sheets:
| |
| (1) | As of March 31, 2017, the Company's total long-term debt had a carrying value of $476.9 million, comprised of: |
•$470.5 million: Term Loan A, due July 2020, net of $1.2 million deferred loan costs
•$6.4 million: Other
As of December 31, 2016, the Company's total long-term debt had a carrying value of $501.8 million, comprised of:
•$492.9 million: Term Loan A, due July 2020, net of $1.7 million deferred loan costs
•$8.9 million: Other
| |
| (2) | The line items "Additional paid-in capital" and "Accumulated deficit" include allocation of purchase price related to the Company's repurchase and cancellation of its Class A common stock from shares repurchased in 2015 and 2016. The Company did not repurchase any shares of its Class A common stock during the quarter ended March 31, 2017. |
| |
| (3) | During the quarter ended March 31, 2017, the Company adopted the amendments to the Financial Accounting Standards Board's Accounting Standards Codification Topic 718, "Compensation – Stock Compensation," which were previously communicated via Accounting Standards Update 2016-09, "Improvements to Employee Share-based Payment Accounting." The amended guidance requires that all excess tax benefits and tax deficiencies (including tax benefits of dividends on share-based payment awards) should be recognized as income tax expense or benefit in the income statement. Modified retrospective application is required, by means of a cumulative-effect adjustment to equity. Accordingly, upon adoption, the Company reclassified approximately $16.8 million in historical net tax benefit/deficiency amounts previously recorded within "Additional paid-in capital" into "Accumulated deficit." Starting January 1, 2017, tax benefit/deficiency amounts are recorded in net income. |
CONSOLIDATED STATEMENTS OF CASH FLOWS (UNAUDITED)
QUARTER ENDED MARCH 31, 2017 AND 2016
|
| | | | | | | |
| | Quarter Ended March 31, |
| | 2017 | | 2016 |
| | (In thousands) |
| Cash flows from operating activities: | | | |
| Net income | $ | 5,207 |
| | $ | 31,905 |
|
| Adjustments to reconcile net income to net cash provided by operating activities: | | | |
| Depreciation and amortization of property, equipment, and intangibles | 71,973 |
| | 71,155 |
|
| Amortization of debt issuance costs, and other | 336 |
| | 351 |
|
| Gain on disposal of property and equipment, less write-off of totaled tractors | (2,969 | ) | | (5,763 | ) |
| Deferred income taxes | (19,196 | ) | | (4,473 | ) |
| Reduction of losses on accounts receivable | (540 | ) | | (1,233 | ) |
| Stock-based compensation expense | 2,673 |
| | 1,417 |
|
| Increase (decrease) in cash resulting from changes in: | | | |
| Accounts receivable | 12,882 |
| | 14,885 |
|
| Inventories and supplies | (33 | ) | | (52 | ) |
| Prepaid expenses and other current assets | (1,585 | ) | | 8,226 |
|
| Other assets | (797 | ) | | 2,332 |
|
Accounts payable, and accrued and other liabilities (2) | 50,947 |
| | 13,365 |
|
Net cash provided by operating activities (3) | 118,898 |
| | 132,115 |
|
| Cash flows from investing activities: | | | |
| Decrease (increase) in cash and cash equivalents – restricted | 2,101 |
| | (2,115 | ) |
| Proceeds from maturities of investments | 4,790 |
| | 6,386 |
|
| Purchases of investments | (5,003 | ) | | (6,429 | ) |
| Proceeds from sale of property and equipment | 27,124 |
| | 34,271 |
|
| Capital expenditures | (35,566 | ) | | (34,450 | ) |
| Payments received on notes receivable | 663 |
| | 1,127 |
|
| Expenditures on assets held for sale | (4,355 | ) | | (6,960 | ) |
| Payments received on assets held for sale | 5,092 |
| | 5,620 |
|
| Net cash used in investing activities | (5,154 | ) | | (2,550 | ) |
| Cash flows from financing activities: | | | |
| Repayment of long-term debt and capital leases | (47,427 | ) | | (50,535 | ) |
| Net repayments on revolving line of credit | (120,000 | ) | | — |
|
| Borrowings under accounts receivable securitization | 25,000 |
| | — |
|
| Proceeds from common stock issued | 1,888 |
| | 1,411 |
|
Repurchases of Class A common stock (1) | — |
| | (45,000 | ) |
Share withholding for taxes due on equity awards (2) | (826 | ) | | (307 | ) |
Net cash used in financing activities (3) | (141,365 | ) | | (94,431 | ) |
| Net (decrease) increase in cash and cash equivalents | (27,621 | ) | | 35,134 |
|
| Cash and cash equivalents at beginning of period | 89,391 |
| | 107,590 |
|
| Cash and cash equivalents at end of period | $ | 61,770 |
| | $ | 142,724 |
|
CONSOLIDATED STATEMENTS OF CASH FLOWS (UNAUDITED) — CONTINUED
QUARTER ENDED MARCH 31, 2017 AND 2016
|
| | | | | | | |
| | Quarter Ended March 31, |
| | 2017 | | 2016 |
| | (In thousands) |
| Supplemental disclosures of cash flow information: | | | |
| Cash paid during the period for: | | | |
| Interest | $ | 7,346 |
| | $ | 8,081 |
|
| Income taxes | 136 |
| | 944 |
|
| Non-cash investing activities: | | | |
| Equipment purchase accrual | $ | 4,543 |
| | $ | 593 |
|
| Notes receivable from sale of assets | 919 |
| | 520 |
|
| Equipment sales receivables | 2,261 |
| | 6,710 |
|
Notes to Consolidated Statements of Cash Flows:
| |
| (1) | During the quarter ended March 31, 2017, the Company did not repurchase any shares of its Class A common stock. |
During the quarter ended March 31, 2016, the Company repurchased and canceled 3.1 million shares of its Class A common stock for $45.0 million. The excess of the repurchase price over par value was allocated $32.4 million to "Additional paid-in capital" and $12.5 million to "Accumulated deficit."
| |
| (2) | During the quarter ended March 31, 2017, the Company adopted the amendments to the Financial Accounting Standards Board's Accounting Standards Codification Topic 718, "Compensation – Stock Compensation," which were previously communicated via Accounting Standards Update 2016-09, "Improvements to Employee Share-based Payment Accounting." The amended guidance requires that cash paid by an employer when directly withholding shares for tax-withholding purposes should be classified as a financing activity. Retrospective application is required. |
In 2016, the Company began allowing certain members of management to have shares withheld for taxes when their equity awards vest. As such, upon adoption, the Company reclassified the amounts out of cash flows from operating activities and into cash flows from financing activities for the quarter ended March 31, 2016 to align with the current period presentation.
| |
| (3) | During the quarter ended March 31, 2017, the Company adopted the amendments to the Financial Accounting Standards Board's Accounting Standards Codification Topic 718, "Compensation – Stock Compensation," which were previously communicated via Accounting Standards Update 2016-09, "Improvements to Employee Share-based Payment Accounting." The amended guidance requires that excess tax benefits be included in cash flows from operating activities and excluded from cash flows from financing activities in the statement of cash flows. The Company retrospectively adjusted the statement of cash flows for the quarter ended March 31, 2016 to align with the current period presentation by increasing cash flows from operating activities by $0.1 million and correspondingly decreasing cash flows from financing activities by $0.1 million, reflecting the amount of excess tax benefits previously presented for that period. |